Embed Size (px)
Citation preview

DEVELOPMENT OF AIR DATA COMPUTATION FUNCTION OF A COMBINED AIRDATA AND AOA COMPUTER
A THESIS SUBMITTED TOTHE GRADUATE SCHOOL OF NATURAL AND APPLIED SCIENCES OF ÇANKAYA
UNIVERSITY
BY
RAFET IL IN
IN PARTIAL FULLFILLMENT OF THE REQUIREMENTSFOR
THE DEGREE OF MASTER OF SCIENCEIN
ELECTRONICS AND COMMUNICATIONS ENGINEERING
SEPTEMBER, 2011


iv
ACKNOWLEDGEMENTS
The author wishes to express his deepest gratitude to his supervisor Prof. Dr. Celal
for his guidance, advice, criticism, encouragements and insight throughout
the research.
The author would also like to thank Mehmet Mustafa KARABULUT for his
suggestions and comments

v
ABSTRACT
DEVELOPMENT OF AIR DATA COMPUTATION FUNCTION OF A COMBINED AIR DATA AND AOA COMPUTER
, Rafet M.Sc., Department of Electronics and Communication Engineering
September 2011, 51 Pages
In this thesis, Air Data Computer part of a Combined Air Data System (CADS) and
the simulator environment to test the developed CADS are developed on standard
personal computers. Normally, a CADS system on an aircraft is composed of two
separate equipments, the Air Data Computer (ADC) and the Angle of Attack (AOA)
system. Therefore the developed CADS system combines both functionalities in an
integral manner on a card. This approach not only reduces the volume but the total
cost of the CADS system as well.
Keywords: Avionic, System Integration, Flight Simulation, Software, Air Data Calculation,
Sensor Simulation

vi
HESAPLAMALARI E
, Rafet
51 Sayfa
T Hava Veri Sistemi ve bunu test edecek simulator
Normalde, h
bir tanesi d Tasarlanan
Bu nedenle,
tasarlanan
Anahtar Kelimeler: Aviyonik, Sistem Entegrasyonu, U S Y Hava Veri
H

vii
TABLE OF CONTENTS
STATEMENT OF NON-PLAGIARISM ......................................................................... iii
ACKNOWLEDGEMENTS ............................................................................................iv
ABSTRACT ................................................................................................................. v
.............................................................................................................................vi
TABLE OF CONTENTS ...............................................................................................vii
LIST OF TABLES .........................................................................................................ix
LIST OF FIGURES ....................................................................................................... x
LIST OF ABBREVIATIONS ...........................................................................................xi
CHAPTERS:
1. INTRODUCTION .................................................................................................... 1
2. THE FUNCTION OF THE ADC IN THE COMBINED SYSTEM .................................... 5
2.1. Pressure Altitude ................................................................................ 12
2.1.1. Derivation of pressure altitude ................................................. 12
2.2. Baro Corrected Altitude ..................................................................... 14
2.3. Indicated Airspeed: ............................................................................ 15
2.4. True Airspeed ..................................................................................... 15
2.4.1. Derivation of true airspeed ....................................................... 15
2.5. Mach Number ..................................................................................... 17
2.5.1. Derivation of mach number ...................................................... 17
2.5.1.1. Derivation for subsonic speeds: .......................................... 17
2.5.1.2. Derivation for supersonic speeds: ..................................... 20
2.6. Temperature Parameters ................................................................... 21
2.6.1. Derivation of SAT ...................................................................... 22
3. DETAILED DESCRIPTION OF THE SYSTEM DEVELOPED ....................................... 24
3.1. Properties of the SC ............................................................................ 25

viii
4. CADS VERSUS REAL EQUIPMENT ........................................................................ 28
4.1. Real ADC ............................................................................................. 28
4.1.1. Functionality and performance standards................................ 30
4.1.2. Environmental standards .......................................................... 32
4.1.3. Communication standards ........................................................ 33
4.1.4. Software standards ................................................................... 34
5. GENERAL VIEW OF THE SC SYSTEM SOFTWARE DESIGN ................................... 37
6. CONFIGURATION ITEMS ..................................................................................... 40
6.1. Hardware Configuration Items: .......................................................... 40
6.2. The Software Configuration Items: .................................................... 41
7. TEST AND VERIFICATION OF THE SYSTEM DEVELOPED ..................................... 42
8. CONCLUSION ...................................................................................................... 50
REFERENCES ........................................................................................................... R1
APPENDICES:
A. MICROSOFT FSX ................................................................................................. A1
B. SOURCE CODE OF SIMULATION SYSTEM ........................................................... A2
C. CURRICULUM VITAE ......................................................................................... A14

ix
LIST OF TABLES
TABLES
Table 1 Aircraft Environment Data ............................................................................ 26
Table 2 Aircraft Landing Gear Data ............................................................................ 26
Table 3 Some of the Criteria Included in DO 160 [5] ................................................. 32
Table 4 DO 178B Software Levels .............................................................................. 36
Table 5 List of the Inputs of the CADS ....................................................................... 49

x
LIST OF FIGURES
FIGURES
Figure 1 ADC in Avionics Architecture ......................................................................... 7
Figure 2 Pitot and Static Ports [6] ................................................................................ 9
Figure 3 Pitot and Static Ports Installation [7] ........................................................... 10
Figure 4 TAT Probe Installation on the A/C [8] .......................................................... 11
Figure 5 Pressure Measurement System [14] ............................................................ 17
Figure 6 Demonstration of the System Architecture ................................................. 24
Figure 7 GUI of the SC ................................................................................................ 27
Figure 8 An example ADC Internal Architecture [16] ................................................ 28
Figure 9 Typical Architecture of ADC Given by Manufacturer [16] ........................... 29
Figure 10 ARINC 429 Message Structure [18] ............................................................ 33
Figure 11 The SWCI of the Developed System .......................................................... 41
Figure 12 CADS System Verification of the System Developed ................................. 43
Figure 13 TAS Calculated By CADS vs. FSX ................................................................. 44
Figure 14 IAS Calculated By CADS vs. FSX .................................................................. 45
Figure 15 Mach Number Calculated By CADS vs. FSX ................................................ 46
Figure 16 Pressure Altitude Calculated By CADS vs. FSX ........................................... 47
Figure 17 TAT Calculated By CADS vs. FSX ................................................................. 48

xi
LIST OF ABBREVIATIONS
ADC - air data computer
ARINC - aeronautical radio incorporated
AS - aerospace standard
A/C - aircraft
CADS - combined air data system
CAS - calibrated air speed
CP - constant pressure
CV - constant volume
DAL - design assurance level
EUROCAE - european organization for civil aviation equipment
FAA - federal aviation agency
FAR - federal aviation regulations
FSX - flight simulator x
ft - feet
GHz - giga hertz
HMI - human machine interface
HWCI - hardware configuration item

xii
IAS - indicated airspeed
IFF - identification friend or foe
IMA - integrated modular avionics
INS - inertial navigation system
kbps kilo bits per second
LCD liquid cyristal display
LRU - line replaceable unit
m - meters
NATO - north atlantic treaty organization
OS -
PC - personal computer
RAM random access memory
RF radio frequency
RTCA - radio technical commission for aeronautics
SAE - society of automotive engineers
SAP - static air pressure
SC - simulation computer
SDK - software Development Kit
SSA - system safety assessments

xiii
SSEC static source error correction
SSR - second surveillance radar
SWCI - software configuration items
TACAN - tactical air navigation
TAP - total air pressure
TAS - true airspeed
TAT - total air temperature
TSO - technical standard order
V - volume
VHF - very high frequency
1
CHAPTER 1
INTRODUCTION
The term arose in 18th century from the combination of the two words :
avionics and electronics. It quickly became one of the most frequently used words
in the aviation sector in the 20 century.. This revealed the amount of the scientific
research and technology development which have resulted in a huge growth in
avionics during the next years. Today, avionics systems are the most important
components of manned and unmanned air platforms.
In early times of the first quarter of the 20 th century it was very difficult to make
air travel in foggy, dark, rainy or snowy weather. These weather conditions were
causing fatal air crashes. Ceasing of military operations because of harsh weather
conditions was the main concern of the armies. Thus, the investigation about the
basic information for a safe flight in any weather conditions has started. Altitude
was the first parameter investigated. Altimeter accuracy was crucial for a pilot to
avoid crashes that occur mostly in landing and taking off. In the foggy, cloudy or
dark weather conditions, it was sometimes getting nearly impossible for a pilot to
decide about the attitude of the aircraft with respect to a reference system, such as
horizon. Therefore, the subject that was researched heavily next was the natural
horizon. Voice communication was the next important subject, important for a safe
flight. The communication between the pilot and the air control station was very
crucial.
After resolving these basic issues for a safe flight the avionics sector succeded to
make a major development. The first application of electronics in aviation occurred
in the first quarter of the h century. Non-directional beacons, ground-based

2
surveillance radar, and the single-axis autopilot were the first electronic aids
introduced. Next, i gyro compass, attitude
and heading reference systems, airborne intercept radar, early electronic warfare
systems, VHF communications, identification friend or foe (IFF), military long-range
precision radio navigation aids and the two-axes autopilot were among the most
fundamental applications developed. The third quarter of the h century is
considered the golden Terrain-following
radar, Mission Computers (MCs) and inertial navigation systems (INSs), integrated
electronic warfare systems, tactical air navigation (TACAN), Doppler radar were the
innovations brought to the flight sector in the third quarter of h century. [1]
The flying platforms developed initially include mostly avionics of point-to-point
architectures. In this kind of architecture all of the data communications between
the control unit or indicator and the sensor were made between the destination
and the source equipment. There was not any network structure. Point-to-point
architectures had major disadvantages like power consumption, space
consumption, cabling and weight. Moreover, they were difficult to modify. Another
disadvantage of this architecture was that each system on the flying platform has its
dedicated subsystems, such as power supplies, control panels and displays etc.
These dedicated subsystems, displays and control panels were electromechanical;
therefore they were generally not very reliable at that time and were rather
frequently breaking down. Also they were mostly analog devices, and therefore, the
accuracy and stability of the computed data from them werenot satisfactory as they
are in digital systems.
After the development of digital computing devices avionics architectures became
distributed. This development has eliminated complex error detection methods
which were used in the analog architectures. Digital avionics architecture became
easy to maintain and handle. However, after became digitized the improvement in

3
the avionic architectures did not stop but continued. For example, in the distributed
digital avionics architecture, each black box used to have its own computation unit.
There used to be dedicated displays as it was in the analog architecture. Later on,
the displays changed from electromechanical devices to multifunctional and
multicolored electronic ones. Furthermore network structures like
was introduced Aeronautical Radio
Incorporated (ARINC) bus, for instance, was introduced at these times.
Flexibility in signal transmission and reduction in wiring, which caused reduction in
power consumption, weight, harness and cost are the results of the network
implementation in avionics architecture.
The next generation in avionics architecture was federated digital architecture. This
type of architecture entailed the need for a bus controller. This development
yielded a safer and more upgradeable architecture. With these developments,
military standards for data bus applications in avionic architectures also came into
world. The most well-known military standard for a data bus on flying platforms is
MIL-STD-1553 today. MIL-STD-1553 data bus was applied across all North Atlantic
Treaty Organization (NATO) member countries. Dedicated 1553B-interfaced
equipment line replaceable units (LRUs) and subsystems were generally used by
federated architectures. MIL-STD-1553 provided the federated architectures with a
more reliable and robust structure when compared with the previous architectures.
New world conditions yielded new types of aircraft such as unmanned, small
platforms etc. Research and development of Integrated Modular Avionics (IMA) has
been originated from these requirements. The size of components and the size of
avionic equipments should become smaller. IMA aims to replace more than one
equipment into one black box. These brought power saving, ruggedness, harness
reduction, reliability, weigth reduction, and most importantly, a much more flexible
architecture.

4
The purpose of this thesis is to design and develop the air data computer part of a
CADS, which is the result of IMA in aircraft (A/C). ADC is one of the necessary
equipments in the avionics architecture. The basic and necessary flight parameters
are calculated by the ADC. The calculated parameters are used in a lot of systems
such as engine control units, cockpit displays etc.
The ADC provides accurate information about pressure altitude, vertical speed
(altitude rate), airspeed, and air temperature. To calculate the parameters listed
above, the ADC has three inputs. These are static air pressure, total air pressure and
total air temperature. The source of these parameters is the static port, the pitot
tube and the total air temperature. The information calculated by the ADC is
essential for the pilot to fly the aircraft safely, and is also required by a lot of
number of key subsystems in the aircraft such as landing gear system, air
conditioning system, transponder, inertial navigation system etc.
In this thesis, research of ADC functionality and derivation of required parameters
for this functionality of a CADS is performed. Then, an emulator/simulator
environment (the Simulation Computer-SC) for testing the CADS System is designed
and developed to provide to the CADS
in accordance with a flight scenario using a generic flying platform that can fly over
a terrain and subject to weather conditions as well. The SC is used to test the
developed CADS software and verify if it confirms the requirements for the CADS.
The real sensors are not used on the emulation, as it is impossible since the system
is not flying. Instead, the data is calculated and produced in accordance with a flight
scenario on a generic platform, as if it was provided by the real sensors based on a
certain flight scenario. The human machine interface (HMI) is generated on the
personal computer (PC) screen in order to mimic the displays for a real CADS drives
on an aircraft.

5
CHAPTER 2
THE FUNCTION OF THE ADC IN THE COMBINED SYSTEM
The ADC is one of the necessary equipment in avionics architecture. There are some
mandatory standarts for this equipment to be installed on aircraft. These are
basically:
Federal Aviation Agency (FAA) Technical Standard Order (TSO) C106 for
[2]
TSO C106 is a minimum performance standard. This TSO prescribes the minimum
performance standard that air data computers must meet in order to be identified
that are manufactured on or after the date of this TSO must meet the standard set
forth in the Society Of Automotive Engineers (SAE), Aerospace Standard (AS) 8002,
-
SAE 8002 defines the performance of the designed equipment. It also specifies the
mandatory and optional parameters which will be given by the designed equipment
and their accuracies.
[3]
TSO C88a is a minimum performance standard. This TSO prescribes the minimum
performance standard that automatic pressure altitude reporting code generating
equipment must meet in order to be identified with the applicable TSO marking.

6
This TSO has been prepared in accordance with the procedural rules set forth in
Subpart of the Federal Aviation Regulations (FAR) Part 21. New models of
automatic pressure altitude reporting code generating equipment that are to be so
identified and that are manufactured on or after the date of this TSO must meet the
standards set forth in the SAE AS 80
1974.
Radio Technical Commission For Aeronautics (RTCA)/DO-178B for
software
DO-178B, Software Considerations in Airborne Systems and Equipment Certification
is the title of a document published by RTCA. Development was a joint effort with
European Organization for Civil Aviation Equipment (EUROCAE) who published the
document as ED-12B. When specified by the TSO for which certification is sought,
the FAA applies DO-178B as the document it uses for guidance to determine if the
software will perform reliably in an airborne environment. DO-178B has levels like
Level A, Level B and these levels are determined according to safety assessments
made for related equipment. In the safety assessment workout, each output
parameter of the equipment is investigated. The criticality of loss of each parameter
(i.e. if this parameter has been lost, then the effect of this situation results in a
catastrophic failure) determines the level of software. [4]
RTCA/DO-160
DO- Environmental Conditions and Test Procedures for Airborne
Equipment standard and it is for environmental test of avionics hardware
published by RTCA, Incorporated.

7
This document outlines a set of minimal standard environmental test conditions
(categories) and corresponding test procedures for airborne equipment. The
purpose of these tests is to provide a controlled (laboratory) means of assuring the
performance characteristics of airborne equipment in environmental conditions
similar of those which may be encountered in airborne operation of the equipment.
The standard environmental test conditions and test procedures contained within
the standard may be used in conjunction with applicable equipment performance
standards, as a minimum specification under environmental conditions, which can
ensure an adequate degree of confidence in performance during use aboard an air
vehicle. [5]
The basic and necessary flight parameters are calculated by the ADC. The calculated
parameters are used in a lot of systems such as engine control units, cockpit
displays etc. The relation between ADC and the peripheral systems are given in
Figure 1.
Figure 1 ADC in Avionics Architecture

8
There are three (3) basic parameters calculated by the ADC, which are:
Altitude
Airspeed
Air Temperature.
Altitude is basically the height above the sea level. Airspeed is the speed of the A/C
with respect to air surrounding it. Air temperature is the temperature of the air
surrounding the A/C.
For these three parameters to be calculated, the ADC needs the following three (3)
inputs:
Static Air Pressure
Total Air Pressure
Total Air Temperature
The static air pressure (SAP) is the pressure of the air in which the A/C is cruising. Or
the static pressure can be defined the static pressure as the atmosphere weight
over a particular area in a given location. The higher the altitude, the less
atmosphere above it, which means the lower the measured pressure. At sea level,
the static air pressure raises the mercury in a barometer 29.92 inches. However, at
18,000 feet above sea level the pressure is only half as great-raising the mercury
only 15 inches. In this way, static pressure measurements can give an indication of
altitude.
The total air pressure (TAP) is the pressure of the air towards which the aircraft is
included in the TAP.

9
The total air temperature (TAT) is the temperature of the air surrounding the A/C.
Sensed TAT includes the friction between the A/C and the air surrounding it.
The SAP is sensed via two parallel connected static ports per requester equipment
in order to make an average calculation and to obtain a reliable system. Static ports
are installed such that effect of the relative motion of the A/C with respect to air
mass is excluded. Generally, these ports are installed on the side surfaces of the
A/C.
The TAP is sensed via one pitot port per requester equipment. As can be seen from
Figure 2, pitot ports are installed such that effect of the relative motion of the A/C
with respect to air mass is included. Generally, these ports are installed on the front
surfaces of the A/C, an example installation can be observed from Figure 3. [6]
Figure 2 Pitot and Static Ports [6]

10
Figure 3 Pitot and Static Ports Installation [7]
The TAT probes are installed such that the temperature of surrounding air mass is
sensed excluding the effect of propeller, if present. Figure 4 shows a typical TAT
probe installation on an business jet A/C.
Pitot Port
Static Port

11
Figure 4 TAT Probe Installation on the A/C [8]
When the ADC gets the accurate parameters listed above, it becomes ready to
calculate the required parameters. These are:
TAT Probe

12
2.1.Pressure Altitude
The pressure altitude is the height above the sea level. It is determined by
measuring the atmospheric pressure.
(2.1)
h is the pressure altitude in feet, Ps is the static pressure in inches Hg sensed by
static ports.
This formula is for low altitude, which is defined as h < 36,089 feet (ft), Ps >
6.6832426 inches Hg [9]. When pressure altitude falls below 100 feet altitude low
warning will be generated.
2.1.1. Derivation of pressure altitude
In hydrostatic equilibrium, the change in pressure over an infinitesimal change in
altitude must oppose the gravitational force on the air in that infinitesimal layer,
that is
(2.2)
P is pressure, z is altitude, is air density, and g is the gravitational acceleration. In
this equation and the equations below, double equal mark is used since the ideal
environment assumption has been made. Ideal environment means the air is
composed of nearly 78 % Nitrogen, about 21 % Oxygen and about 1 % of all other
gases, such as Ozone, Neon, Carbon Dioxide to name a few.
The ideal gas law states
(2.3)
13
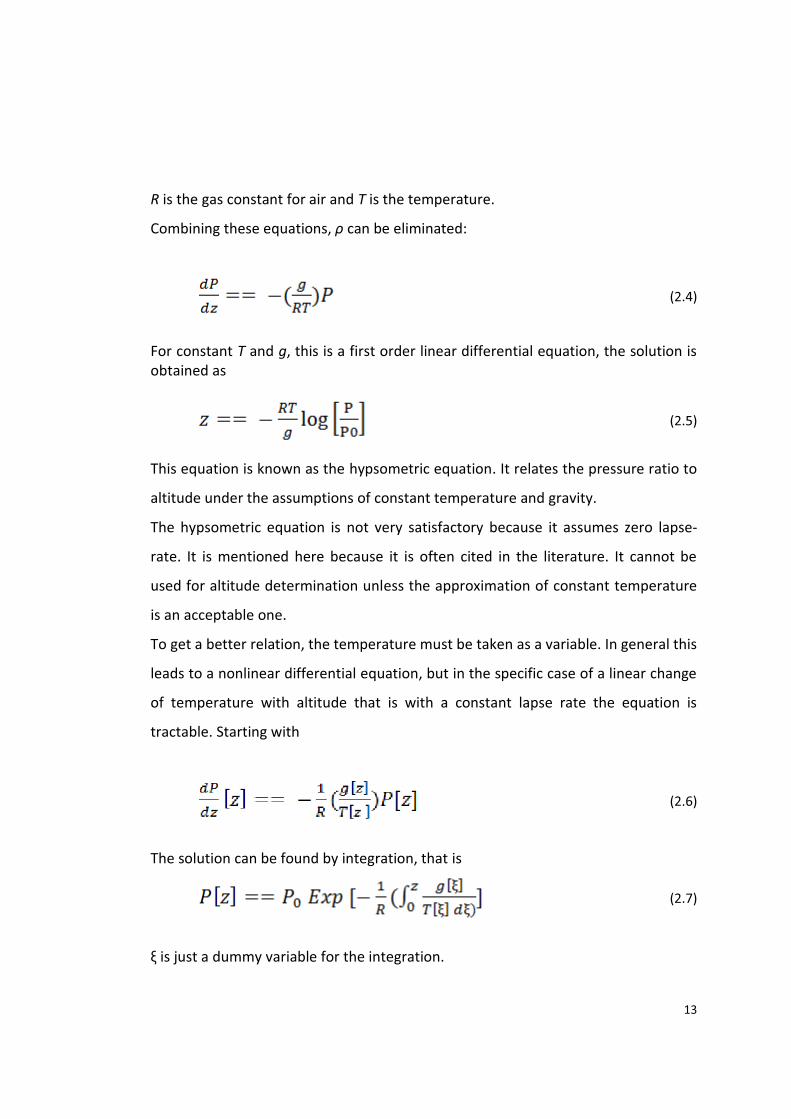
R is the gas constant for air and T is the temperature.
Combining these equations, can be eliminated:
(2.4)
For constant T and g, this is a first order linear differential equation, the solution is obtained as
(2.5)
This equation is known as the hypsometric equation. It relates the pressure ratio to
altitude under the assumptions of constant temperature and gravity.
The hypsometric equation is not very satisfactory because it assumes zero lapse-
rate. It is mentioned here because it is often cited in the literature. It cannot be
used for altitude determination unless the approximation of constant temperature
is an acceptable one.
To get a better relation, the temperature must be taken as a variable. In general this
leads to a nonlinear differential equation, but in the specific case of a linear change
of temperature with altitude that is with a constant lapse rate the equation is
tractable. Starting with
(2.6)
The solution can be found by integration, that is
(2.7)
is just a dummy variable for the integration.

14
Assuming g is constant with respect to altitude and introducing the linearized
temperature profile via the lapse rate, the integral becomes
(2.8)
L is the lapse rate.
Substituting this into the expression for P[z] (2.7) and solving for z gives
(2.9)
P0 is pressure at zero altitude (29.92 in Hg), L is lapse rate
(-6.5 x 10⁻³ K/m), R is gas constant for air (287.053 J/(kg*K)), g is acceleration due to
gravity (9.80665 m/s2), and T0 is temperature at zero altitude (288.15 K).
This is the final, simplified, expression for altitude in terms of atmospheric pressure.
L near the ground is a negative number should be remembered when using this
expression. [10]
2.2. Baro Corrected Altitude
The baro corrected altitude is the height above a reference level which is entered by
Pressure altitude assumes that the aircraft is on the sea level.
In real life, it is not always true and therefore the pilot enters the Ps for the airway
that he is about to take-off. In other words, baro corrected altitude is determined
with respect to the reference level by measuring the atmospheric pressure.
Baro corrected altitude is calculated for the low altitude condition, which is defined
as h < 36,089 ft, Ps > 6.6832426 inches Hg:
(2.10)

15
h is the pressure altitude in feet, Ps is the static pressure in inches Hg sensed by
static ports, and baro correction is the reference value entered from pilots control
panel.
2.3. Indicated Airspeed (IAS)
The IAS is defined as the speed of the aircraft with respect to air surrounding it. It is
the function of total pressure and static pressure only:
(2.11)
Pt is the total pressure in inches Hg sensed from pitot port, and Ps is the Static
pressure in inches Hg sensed from Static port. [9] When the IAS exceeds 350 knots,
overspeed warning will be generated.
2.4. True Airspeed (TAS)
The TAS is defined as the speed of the aircraft relative to air surrounding it including
the temperature effects, and it is calculated by [11]
(2.12)
qc is impact pressure, asl is the standard speed o T is
the static air temperature in Kelvin, Tsl is the standard sea level temperature (288.15
K) [9].
2.4.1. Derivation of true airspeed
The computation of the temperature of the free airstream, Tsl, enables the local
speed of sound, A, to be established as

16
(2.13)
is the heat capacity ratio or adiabatic index or ratio of specific heats, the ratio of
the heat capacity at constant pressure (CP) to heat capacity at constant volume (CV).
It is sometimes also known as the isentropic expansion factor and is denoted by
and its value is 1.4 for air.
Note, in thermodynamics, an adiabatic process is a thermodynamic process in
which the net heat transfer to or from the working fluid is zero. [12]
Ra
M is the Mach number.
(2.14)
Tsl is the static air temperature at the sea level. The derivation of Tsl can be found in
the derivation of SAT data.
Hence,
(2.15)
(2.16)
This can be readily converted to knots using the conversion factor 1m/s = 1.9425
knots. Then the formula becomes [13, 14]:
(2.17)
17
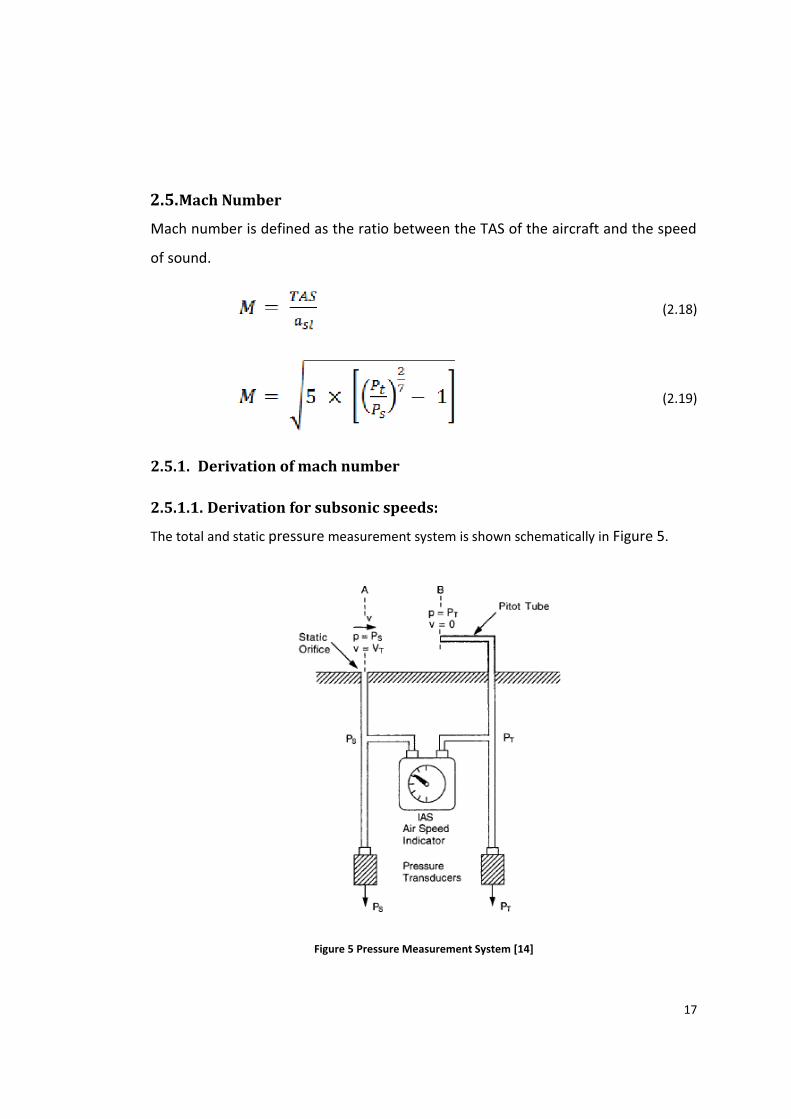
2.5.Mach Number
Mach number is defined as the ratio between the TAS of the aircraft and the speed
of sound.
(2.18)
(2.19)
2.5.1. Derivation of mach number
2.5.1.1. Derivation for subsonic speeds:
The total and static pressure measurement system is shown schematically in Figure 5.
Figure 5 Pressure Measurement System [14]

18
Consider the first case of low airspeed below M = 0.3, where air can be considered
to be incompressible and the density, therefore, is constant.
The momentum equation for the airflow is:
(2.20)
In the free airstream, , and at the probe face .
Integrating the momentum equation between these limits:
(2.21)
Hence, from the ;
(2.22)
(2.23)
It is observed at lower speeds.
However, air is a compressible fluid and its density is not constant. The change in
the density due to the high impact pressures resulting from high airspeeds must
therefore be taken into account. Assuming adiabatic flow, the relationship between
pressure and density is [14]:
(2.24)

19
From which derived is:
(2.25)
Substituting for in the momentum equation:
(2.26)
(2.27)
In free airstream p = Ps and V = VT, and at the probe face, p = PT and V = 0.
Rearranging the equation (2.27) and integrating it between limits given in (2.21), it
becomes:
(2.28)
(2.29)

20
From equation (2.25), substituting for in equation (2.30) and rearranging gives:
(2.30)
and taking in (2.28) gives:
(2.31)
and
(2.32)
Qc is Pt-Ps, which is known as impact pressure.
2.5.1.2. Derivation for supersonic speeds:
The aerodynamic theory involved in deriving the relationship between and Mach
Number at supersonic speeds (M > 1) is beyond the scope of this thesis.
The formula relating pressure ratio and Mach number derived by Rayleigh is
therefore set out below without further explanation. This can be found suitable in
aerodynamics books.
(2.33)

21
Substituting for in equation (2.34) and rearranging gives:
(2.34)
(2.35)
Now, Mach Number can be derived from formulas (2.36a) and (2.36b):
(2.36a) and (2.36b)
Substituting for subsonic speeds:
(2.37)
and for supersonic speeds it becomes [14]:
(2.38)
2.6. Temperature Parameters
There are two temperature parameters calculated. These are namely TAT and SAT.
TAT is defined as temperature sensed by the total air temperature sensor. SAT is
defined as temperature of the static air:
(2.39)

22
M stands for Mach number, Ts stands for SAT and Tt stands for temperature sensed
by the TAT Sensor.
2.6.1. Derivation of SAT
The temperature sensed by the temperature probe in the air stream is the free
airstream temperature plus the kinetic rise in temperature due to the air being
brought partly or wholly to rest relative to the sensing probe.
The kinetic ri
equation to compressible flow and assuming the pressure changes are adiabatic.
For unit mass of air
(2.40)
P1 1, V1, E1 and P2 2, V2, E2 represent pressure, density, velocity and internal
energy at two points in a streamline flow, namely in the free airstream and at the
probe.
By the gas law
(2.41a) and (2.41b)
In the free airstream, V1 = VT and T1 = TS, and at a stagnation point at the probe V2 =
0 and T2 = TT.
Substituting these values in (2.40), this equation (2.41a) and (2.41b) becomes
(2.42)
The change in internal energy is converted into heat and is given by

23
(2.43)
v is the specific heat of
air at constant volume. Hence,
(2.44)
From thermodynamic theory,
(2.45)
Cp is the specific heat of air at a constant pressure. Combining equations will
provide
(2.46)
Rearranging and substituting , (2.44) becomes
(2.47)
It is known that
(2.48)
Substituting for and using in yields for the SAT as
(2.49)

24
CHAPTER 3
DETAILED DESCRIPTION OF THE SYSTEM DEVELOPED
In this thesis a CADS on a card is developed. This CADS combines the ADC and AOA
computers on a card. This way of combining these two subsystems on a card is the
improvement that is introduced. First development is the CADS on the card. Then,
in order to test and verify the system developed, a test environment had to be
developed, which is called the SC. SC provides the necessary inputs, simulated in
accordance with a flight scenario for a certain generic platform, to the CADS.
Figure 6 Demonstration of the System Architecture

25
3.1. Properties of the SC
The SC, developed within the framework of this thesis, will communicate with the
CADS, also developed on a card within the framework of this thesis. The SC will send
the simulated input parameters to the CADS. The calculated parameters will be
monitored on the liquid cyristal display (LCD) panel which is connected to the CADS.
The SC has a core 2 duo Intel based 64 bit processor, 4 GB of random access
memory (RAM), 1 GB video card. The SC will communicate with the CADS via RS 232
serial communication protocol. The operating system (OS) that is chosen for the SC
is Windows XP. The simulation software running on the SC has been developed with
C# programming language.
Microsoft Flight Simulator X is used on the SC to get required inputs, which are
listed in Tables 1 and 2, from running simulation. The SC has the Microsoft Flight
Simulator X with software development kit (SDK) and Microsoft Visual Studio 2010
Ultimate edition installed on. The reason for installing Microsoft Flight Simulator is
that it enables the retrieval of aircraft data like the real environment. Flight
Simulator X (FSX) is the latest version of Microsoft Flight Simulator after Microsoft
development, history and etc. one can refer to the Appendix A1. On the software
side of the flight simulator, the program running on the SC system gets the real time
simulation environment data from the flight simulator via using the flight
m or
setting data to it. There are two different types of SDK available, namely Microsoft
ESP and Microsoft Flight Simulator X SDK. Both SDKs have the same properties
except for the licensing. For having the right of a developed system and in order to
sell it as if it was your product you need to use Microsoft ESP and write your
program using its software development kit. However for personal use and if one
does not aim for profitting FSX software development kit is eligible with its lower

26
cost. The details of FSX can be found in the Appendix A1. All of the sensor data will
be flowing to the system on-time from the simulator. The simulation parameters
are given in Table 1 and Table 2 [15]:
Table 1 Aircraft Environment Data
Simulation Variable
Description Units Settable
Ambient Temperature
Ambient temperature Celsius No
Ambient Pressure
Ambient pressure Inches of mercury, inHg No
Barometer Pressure
Barometric pressure Millibars No
Sea Level Pressure
Barometric pressure at sea level
Millibars No
TAT
Total air temperature is the air temperature at the front of the aircraft sensed from the
TAT Probe
Degree of Celsius No
Table 2 Aircraft Landing Gear Data
Simulation Variable
Description Units Settable
GEAR POSITION:
index
Position of landing gear:
Enum Yes 0 = unknown
1 = up
2 = down
In the Figure 7 the SC software user interface can be seen. When its exe is run
window in Figure 7 is opened. But before running the program in Figure 7 it
would be better to start Microsoft Flight Simulator X. After opening FSX run the
SC software and see the opened user interface. Later when the button Connect

27
SDK commands explained befo
simconnect object. As the connection established it is ready to get the desired
simulation variables data from FSX and on the SC software user interface
becomes
dimmed while Disconnect button becomes undimmed. Before starting a flight
the operator should also press the Request button in order to start desired data
acquisition. When Request button is pressed a continuous data request,
gathering the requested data, sending it over serial port and another request
session starts. This continues repeatedly until the program is terminated.
Moreover, Request button becomes inactive (dimmed) after it is pressed and
Stop button becomes active (undimmed). By the end of this process simulated
environment data is continuously supplied to the CADS over the RS-232 serial
port. If data request is to be stopped, Stop button should be pressed, which
enables Request button. Lastly in order to disconnect from SimConnect object,
Disconnect button should be pressed.
ure, see
the code in the Appendix A2.
Figure 7 GUI of the SC

28
CHAPTER 4
CADS VERSUS REAL EQUIPMENT
4.1. Real ADC
An example of a real ADC internal architecture is given in Figure 8:
Figure 8 An example ADC Internal Architecture [16]

29
The example avionics architecture around the example equipment is shown in
Figure 9:
Figure 9 Typical Architecture of ADC Given by Manufacturer [16]
The example ADC has ARINC 429 interface for other avionics equipment and RS 232
interface for the maintenance mode.
As mentioned in the previous chapters, there are some standards to be obeyed
when designing the equipment. These standards can be grouped as:
Functionality and Performance Standards (TSO C106, SAE AS 8002, FAA TSO
C88a, SAE AS 8003)
Environmental Standards (RTCA/DO-160)
Communication Standards (ARINC 429, RS 232)
Software Standards (RTCA/DO-178B).

30
4.1.1. Functionality and performance standards
Equipment manufacturers are trying to comply with TSOs and SAEs related with the
ADC. Since TSOs are giving reference to SAE AS, it is important to understand what
SAE AS 8002 and 8003 specify.
SAE AS 8002 covers ADC - Minimum
. It states the mandatory and optional parameters which will
be given by the ADC when connected to sources of aircraft electrical power, static
pressure, total pressure, outside air temperature, and others specified by the
equipment manufacturer. The mandatory parameters are:
Pressure Altitude
Pressure Altitude, Baro-Corrected
Vertical Speed
Calibrated Airspeed
Mach Number
Maximum Allowable Airspeed
Overspeed Warning
Total Air Temperature.
In addition, the computer may supply one or more of the following signals:
Pressure Altitude, Digitized
Equivalent Airspeed
True Airspeed
Static Air Temperature
Altitude Hold
Airspeed Hold
31
Mach Hold
Angle of Attack
Flight Control Gain Scheduling
Others [17].
In addition to these parameter lists, SAE AS 8002 states the required accuracy in
calculated parameters:
Tolerance in Pressure Altitude is +/-25 feet (+/- 8 meters) up to 5000 feet,
+/-30 feet (+/- 9 meters) from 5000 feet up to 8000 feet. The AS specifies
the allowable tolerances up to 50000 feet.
Tolerance in Baro-Corrected Pressure Altitude is +/-40 feet (+/- 12 meters) if
the Barometric Setting Scale is 22.00 inch Hg, +/-35 feet (+/- 11 meters) if
the Barometric Setting Scale is 23.27 inch Hg. The AS specifies the allowable
relation between barometric setting and altitude up to the Barometric
Setting of 30.98 inch Hg.
Tolerance in Calibrated Airspeed (CAS) is +/-5 knots (+/- 9.3 km/hour) up to
50 knots, +/-3 knots (+/- 6.5 km/hour) from 50 knots up to 80 knots. The AS
specifies the allowable tolerances up to 450 knots.
Tolerance in TAT is +/-1.5 -
AS 8002 gives a relation between calculated Mach Number, the tolerance in
this calculated Mach Number and altitude. Tolarance in Mach Number is
0.012 for altitudes up to 10000 feet and for Mach Numbers up to 0.4. The AS
specifies the allowable tolerances up to 1 Mach and up to 50000 feet.
SAE AS 8003 establishes the minimum safe performance requirements for 100 feet
(30.48 meters), incremental automatic pressure altitude code generating
equipment. It is intended that the code generator be operated by a pressure
altitude device which may also operate the pressure altitude indicator normally

32
used to maintain flight altitude. If there is a Second Surveillance Radar (SSR)
Transponder equipment in the avionics architecture of A/C, then there should be a
pressure altitude data flow from the ADC to SSR Transponder. For that reason AS
8003 becomes a critical requirement document for the ADC. [17]
4.1.2. Environmental standards
Functionality and performance standards define the minimum performance under
environmental conditions and when defining the performance it references RTCA
DO 160. Table 3 shows some of the criteria included in DO 160:
Table 3 Some of the Criteria Included in DO 160 [5]
Name Description
Shock & Crash Safety
This aircraft type dependent test checks the effects of mechanical shock. Crash safety test insures the item does not become a projectile in a crash. The norm describes the test procedure for airborne equipment.
Temperature This checks the effects of temperature on the system. Condensation also can be a factor coming from cold temperatures.
Altitude
These tests check the effects (in terms of performance) of altitude, including loss of cabin pressure on the device/system/equipment. Factors tested include dielectric strength, cooling under low pressure, and resilience to rapid change in air pressure. The norm defines the different temperature profiles under which the equipment must be tested. Due to the variety of aircraft, the equipment are classified in categories
Humidity These tests under humidity check the effects of water dripping / splashing on the unit (corrosion).
Power input
Input power conducted emissions and susceptibility, transients, drop-outs and hold-up. The power input tests simulate conditions of aircraft power from before engine start to after landing including emergencies.
Vibration Aircraft type dependent test checks the effects of vibration.
RF Emission and Susceptibility
Radio frequency energy: - radiated emissions and radiated susceptibility via an (Electromagnetic reverberation chamber).

33
4.1.3. Communication standards
Today most of the modern avionics ADCs use ARINC 429 serial communication
protocol to make interface with the other equipment. ADCs have also RS 232 or RS
422 serial communication protocol for maintenance purposes. RS 232 and RS 422
are well known serial communication protocols. ARINC 429 is more specific to
aviation but it is also simple like RS 232 and RS 422.
ARINC 429 is a very simple, point-to-point protocol. There can be only one
transmitter on a wire pair. The transmitter is always transmitting either 32-bit data
words or the NULL state. There is at least one receiver on a wire pair; there may be
up to 20. ARINC 429 communication protocol message structure is given in the
Figure 10.
Figure 10 ARINC 429 Message Structure [18]
The details of ARINC 429 can be achieved from internet. [19]
ADCs have two types of ARINC 429 communications in terms of speed of data. One
is 12.5 kilobits per second (kbps) which is called as low speed and the other is 100
kbps which is called as high speed. Whole modern ADCs have a speed selection pin
which determines the speed of the ARINC 429 channels (low or high). Another
important point is refresh/update rates of the ARINC 429 messages. According to
ARINC 429 standard, the altitude related messages are updated 16 times in a
second, the temperature related messages are updated 2 times in a second and the
other messages are updated in 8 times in a second.

34
4.1.4. Software standards
As mentioned in previous chapters, DO-178B, Software Considerations in Airborne
Systems and Equipment Certification is the title of a document published by RTCA,
Incorporated.
From the beginning of the system design, safety assessment process and hazard
analysis are made by examining the effects of a failure condition in the system. The
failure conditions are categorized by their effects on the aircraft, crew, and
passengers.
Catastrophic - Failure may cause a crash. Error or loss of critical function
required to safely fly and land aircraft.
Hazardous - Failure has a large negative impact on safety or performance, or
reduces the ability of the crew to operate the aircraft due to physical
distress or a higher workload, or causes serious or fatal injuries among the
passengers. (Safety-significant)
Major - Failure is significant, but has a lesser impact than a Hazardous failure
(for example, leads to passenger discomfort rather than injuries)or
significantly increases crew workload (safety related)
Minor - Failure is noticeable, but has a lesser impact than a Major failure (for
example, causing passenger inconvenience or a routine flight plan change)
No Effect - Failure has no impact on safety, aircraft operation, or crew
workload.
According to results of the safety assessment, the Design Assurance Level (DAL) is
determined.
DO-178B alone is not intended to guarantee software safety aspects. Safety
attributes in the design and as implemented as functionality must receive additional
mandatory system safety tasks to drive and show objective evidence of meeting

35
explicit safety requirements. Typically IEEE STD-1228-1994 Software Safety Plans
are allocated and software safety analyses tasks are accomplished in sequential
steps (requirements analysis, top level design analysis, detailed design analysis,
code level analysis, test analysis and change analysis). These software safety tasks
and artifacts are integral supporting parts of the process for hazard severity and
DAL determination to be documented in system safety assessments (SSA). The
certification authorities require and DO-178B specifies the correct DAL be
established using these comprehensive analyses methods to establish the software
level A-E. Any software that commands, controls, and monitors safety-critical
functions should receive the highest DAL - Level A. It is the software safety analyses
that drive the system safety assessments that determine the DAL that drives the
appropriate level of rigor in DO-178B. The system safety assessments combined
with methods such as SAE ARP 4754A determine the after mitigation DAL and may
allow reduction of the DO-178B software level objectives to be satisfied if
redundancy, design safety features and other architectural forms of hazard
mitigation are in requirements driven by the safety analyses. Therefore, DO-178B
central theme is design assurance and verification after the prerequisite safety
requirements has been established.
The number of objectives to be satisfied (eventually with independence) is
determined by the software level A-E. The phrase "with independence" refers to a
separation of responsibilities where the objectivity of the verification and validation
processes is ensured by virtue of their "independence" from the software
development team. In some cases, an automated tool may be equivalent to
independence.

36
Table 4 DO 178B Software Levels
According to the information given in Table 4, most of the ADCs are designed at DO
178B Software Level A since erroneous data given by ADC will lead to catastrophic
failures.

37
CHAPTER 5
GENERAL VIEW OF THE SC SYSTEM SOFTWARE DESIGN
In this system C# (Microsoft .NET Language) is used. First of all in order to do
programming using C# it is needed to add Microsoft.FlightSimulator.SimConnect as
a new reference to the project. Besides adding
Microsoft.FlightSimulator.SimConnect, System.Runtime.InteropServices should be
added. Below code snippet shows how to add the two references.
using Microsoft.FlightSimulator.SimConnect
using System.Runtime.InteropServices.
Then list of C# methods used in the SC system and their functionality are explained.
private void InitializeSerial(): Initializes the serial port. This method creates the
serial port object with the desired settings and opens the serial port for connection.
protected override void DefWndProc(ref Message m): This method makes
simconnect client send a win32 message when there is a packet to process.
ReceiveMessage must be called to trigger the events. This model keeps simconnect
processing on the main thread.
private void setButtons(bool bConnect, bool bGet, bool bStop, bool bDisconnect):
This method makes the buttons on the user interface dimmed or undimmed with
respect to given inputs to the method.

38
private void closeConnection(): This method closes the connection to the
simconnect object, discards the object and writes a connection closed message on
the user interface.
private void initDataRequest(): This method sets up all the SimConnect related data
definitions and event handlers.
void simconnect_OnRecvOpen(SimConnect sender, SIMCONNECT_RECV_OPEN
data): When connection to simconnect object is established this method displays
the text indicating connection established message. This is an event handler.
void simconnect_OnRecvQuit(SimConnect sender, SIMCONNECT_RECV data):
When FSX is closed this method calls the closeConnection() method and displays the
text indicating the connection closure.
Void simconnect_OnRecvException(SimConnect sender,
SIMCONNECT_RECV_EXCEPTION data): This method displays the received exception
private void Form1_FormClosed(object sender, FormClosedEventArgs e): This
method is another method which calls the closeConnection() method. This calls
closeConnection() method when user interface is closed.
void simconnect_OnRecvSimobjectDataBytype(SimConnect sender,
SIMCONNECT_RECV_SIMOBJECT_DATA_BYTYPE data): This method continuously
requests desired data from the simconnect object. After each request and data
collection method converts the data structure to byte array and sends it over the
serial port. This method is some like callback which is called when an action occurs.
This is an event handler.

39
byte[] ToByteArrayConverter(object anything): This method converts the data
structure gathered from simconnect object to byte array which is an eligible type to
send over serial port. This method is used by the previous method.
static void ByteArrayToStructureConverter(byte[] Array, ref object anything): This
method does the reverse operation of the previous method. This method converts
the byte array to the data structure.
private void MyConnect(): Creates the new simconnect object and calls the method
initDataRequest().
private void buttonConnect_Click(object sender, EventArgs e): Initializes the serial
port by the method call InitializeSerial() and after that calls the method
MyConnect() for data request.
private void buttonDisconnect_Click(object sender, EventArgs e): Closes the
connection bu calling closeConnection().
private void buttonRequestData_Click(object sender, EventArgs e): This method
requests the first data and makes it recall continuously itself.
private void MyRequestData(): The method directly requests data from FSX SDK.
This is used by the buttonRequestData_Click method and
simconnect_OnRecvSimobjectDataBytype method.
private void buttonStopRequest_Click(object sender, EventArgs e): This stops the
request operation when Stop Request button is clicked.
void displayText(string s): This method displays the desired string on the user
interface textbox.
Operating system is the last general issue in SC software architecture. In this thesis,
software platform for SC is based on Microsoft Windows operating systems.

40
CHAPTER 6
CONFIGURATION ITEMS
For a general system structure of a system developed, there exist two types of
configuration items to be listed. These are hardware configuration items (HWCIs)
and software configuration items (SWCIs).
6.1.Hardware Configuration Items:
The SC is the simulation computer which sends the simulated environment data to
the CADS over serial port. For environment simulation the SC runs some special
programs. To run these simulation programs, to gather data and to send gathered
data over serial port together much more performance is needed. For meeting this
high performance a powerful hardware configuration is used. The hardware
specifications for the SC are listed below:
Intel Core 2 Duo 2.13 giga hertz (GHz) Processor
USB-to-Serial Converter
Hard disk
4 GB RAM
Motherboard
DVD Writer.

41
6.2. The Software Configuration Items:
As one can observe from Figure 11 shows the SC system SWCIs, which contain the
items of Platform, Development Environment, and Software.
Figure 11 The SWCI of the Developed System
The SC Software Configuration Item parts are listed below:
Microsoft Windows7 (Platform)
Microsoft Visual Studio 2010 (Development Environment)
Microsoft Flight Simulator X SimConnect Integrated Development Environment
SC System Software Developed in C# (Software)
Microsoft Flight Simulator X (Software)
42
CHAPTER 7
TEST AND VERIFICATION OF THE SYSTEM DEVELOPED
In real life, the CADS system should have static and total pressure ports. The
equipment should directly get the pressure and then convert the pressure into
electrical signal inside. TAT sensors are potentiometers actually. Therefore, there
should be a mechanism to measure the voltage drop o
Real system should be verified in a lab environment with real sensors. There are
static and total pressure sources for the ADC equipment development purposes.
Test team of the equipment uses the pressure sources. They enter pre-defined
static and total pressure values. They also know the corresponding airspeed and
altitude values by theory. Therefore by means of these setups, the test crew makes
the verification. The temperature verification is made also in the same manner. The
TAT sensor should be warmed up and the verification should be made via
controlling the output of the CADS.
Since there is no budget to use real sensors in this project, Microsoft FSX is used to
get the simulated sensors data. The block diagram of SC system which sends
simulated variables is given in Figure 12.

43
Figure 12 CADS System Verification of the System Developed
The comparison graphs of the calculated parameters are given in figures. Note that
the horizontal axes show the number of samples used when this graph is plotted.

44
Figure 13 TAS Calculated By CADS vs. FSX
According to SAE AS 8002A, minimum allowable tolerance in airspeed calculation is
+/- 2 knots and maximum allowable tolerance is +/- 5 knots. The details of these
tolerances could be reached from the standard. 1079 sample data has been used to
plot Figure 13. The maximum difference between TAS parameter calculated by
CADS and FSX is 0.98 knots which satisfies the standard used for ADC design.
45
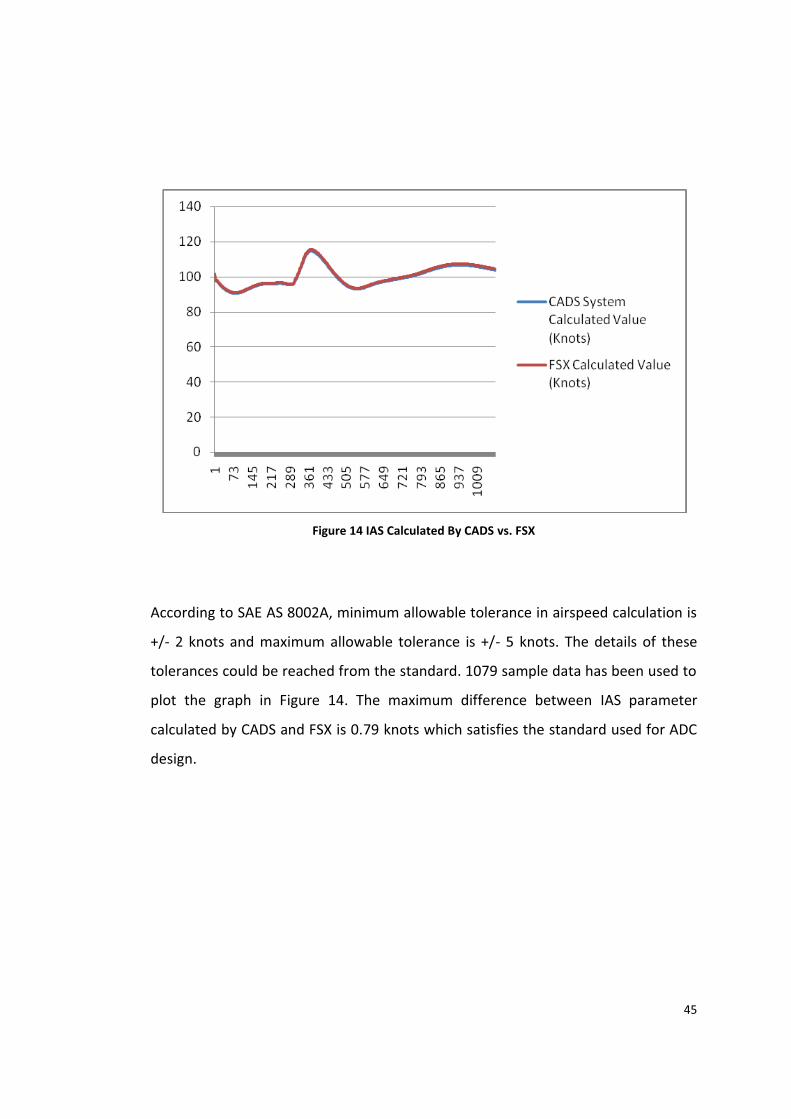
Figure 14 IAS Calculated By CADS vs. FSX
According to SAE AS 8002A, minimum allowable tolerance in airspeed calculation is
+/- 2 knots and maximum allowable tolerance is +/- 5 knots. The details of these
tolerances could be reached from the standard. 1079 sample data has been used to
plot the graph in Figure 14. The maximum difference between IAS parameter
calculated by CADS and FSX is 0.79 knots which satisfies the standard used for ADC
design.

46
Figure 15 Mach Number Calculated By CADS vs. FSX
According to SAE AS 8002A, minimum allowable tolerance in Mach Number
calculation is +/- 0.0075 and maximum allowable tolerance is +/- 0.015. The details
of these tolerances could be reached from the standard. 1079 sample data has been
used to plot the graph in Figure 15. The maximum difference between Mach
Number calculated by CADS and FSX is 0.001 knots which satisfies the standard
used for ADC design.

47
Figure 16 Pressure Altitude Calculated By CADS vs. FSX
According to SAE AS 8002A, minimum allowable tolerance in Pressure Altitude
calculation is +/- 25 feet and maximum allowable tolerance is +/- 125. The details of
these tolerances could be reached from the standard. 1079 sample data has been
used to plot the graph in Figure 16. The maximum difference between Pressure
Altitude parameter calculated by CADS and FSX is 44 knots which satisfies the
standard used for ADC design.

48
Figure 17 TAT Calculated By CADS vs. FSX
According to SAE AS 8002A, allowable tolerance in TAT calculation is +/-
details of these tolerances could be reached from the standard. 1079 sample data
has been used to plot the graph in Figure 17. The maximum difference between TAT
parameter calculated by CADS and FSX is which satisfies the standard used for
ADC design.
49
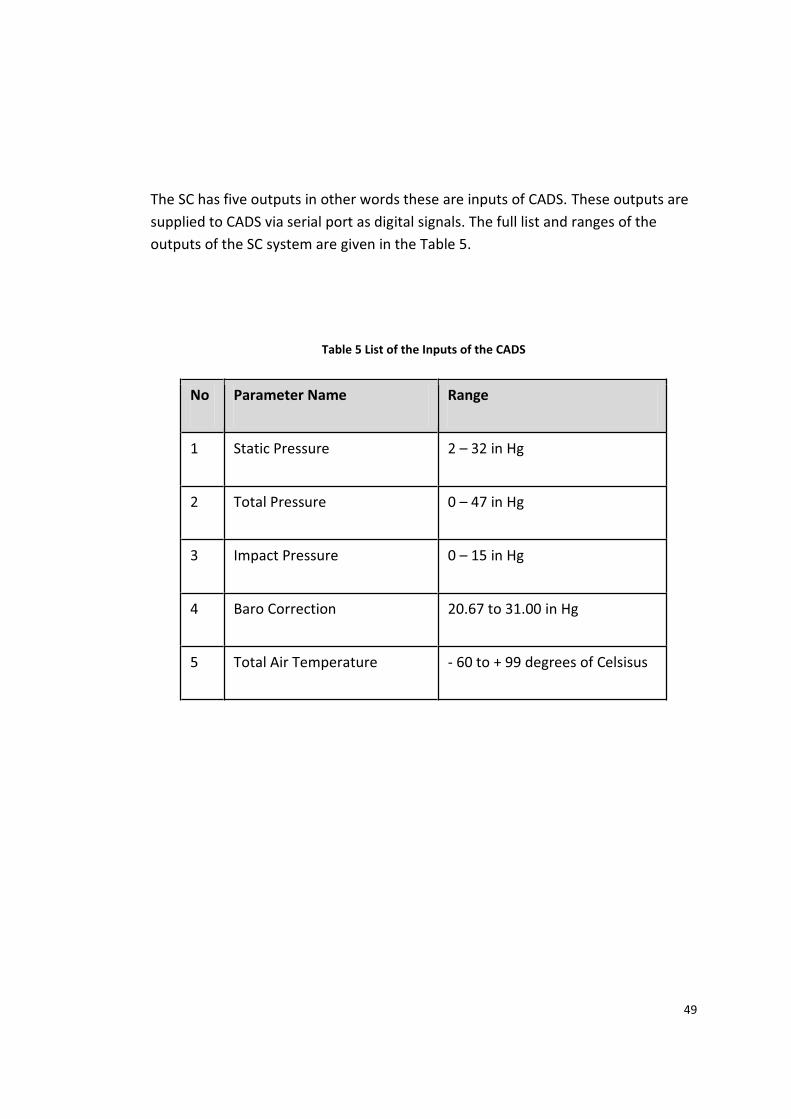
The SC has five outputs in other words these are inputs of CADS. These outputs are supplied to CADS via serial port as digital signals. The full list and ranges of the outputs of the SC system are given in the Table 5.
Table 5 List of the Inputs of the CADS
No Parameter Name Range
1 Static Pressure 2 32 in Hg
2 Total Pressure 0 47 in Hg
3 Impact Pressure 0 15 in Hg
4 Baro Correction 20.67 to 31.00 in Hg
5 Total Air Temperature - 60 to + 99 degrees of Celsisus

50
CHAPTER 8
CONCLUSION
In this thesis the ADC functionalities of a CADS is developed and the developed
CADS is tested by a SC on a PC, which is also developed within the framework of this
thesis.
The ADC is among the most safety critical and basic equipment for a flying system.
Therefore, the validity and correctness of the calculated parameters are very
important. For the output of the ADC to be correct and valid, it should be supplied
with necessary inputs. It needs pressure inputs at a rate of 16 times in a second, and
at a rate of temperature parameters 2 times in a second. Therefore, the SC software
should obey these restrictions. In real world, equipment developers and system
integrators use environmental data simulations as in SC software. Thus SC software
has also an industrial validation which means aircraft manufacturers and integrators
use this kind of implementation in early phases of their design.. It is important to
note that the environmental data generation software does not run on real time
operating system. This is also an important detail supporting the validity of the SC
ustry. A commercial software product of Microsoft
FSX, from which SC software get required data for its environmental data
generation, is widely used in avionics firms for their laboratory works and
demonstrations. After laboratory tests of the ADC with data provided by the SC or
the SC-like generator software, the A/C integrators or equipment manufacturers go

51
one step further and perform their tests with real environmental equipment. After
passing the tests done on the ground with real environmental equipment, real flight
tests start. Finally the A/C is proven to be flyable.
As it is mentioned in the details of the thesis, the SC software make its
communication via RS 232 serial communication protocol. In avionics industry,
ARINC 429 or MIL-STD 1553 serial communication protocols are widely used.
Therefore using this kind of serial modules in SC could be a one step further from
this thesis.
Since the entire ADC calculated parameters have been derived in detail, the
required behavior of the ADC with respect to incoming sensor data is obvious.
Therefore blocking the pitot port, blocking the static port and the challenging
properties like those could be added to the SC software as a future work. The leads
and lags in the corresponding sensor data could also be implemented.
There are some parameters which could not be calculated without A/C specific
parameters such as the CAS. For the CAS to be calculated the static source error
correction (SSEC) table which contains some corrections about the lags and leads
caused by installation place of pitot and static pressure ports is needed. This SSEC
table can only be prepared and supplied by the A/C integrator or manufacturer.
With such a cooperation arranged with anA/C integrator or manufacturer, this
parameter calculation can also be achieved.

R1
REFERENCES
[1] KARABULUT, M.M., 2011, Development of Angle of Attack (AOA) / Stall Warning
Computer Functions of a Combined Air Data and Angle of Attack Computer,
[2].http://rgl.faa.gov/Regulatory_and_Guidance_Library%5Crgtso.nsf/0/FDC3133EE
D60BDB986256DC600696543?OpenDocument
[3].http://rgl.faa.gov/Regulatory_and_Guidance_Library%5CrgTSO.nsf/0/7F3CE81A
FC742A4B86256DC70067B087?OpenDocument
[4] http://en.wikipedia.org/wiki/DO-178B
[5] http://en.wikipedia.org/wiki/DO-160

R2
[6].http://content.answcdn.com/main/content/img/McGrawHill/Aviation/f0609-
05.gif
[7].http://www.acig.org/exclusives/aero/acig_aero05_attackers.htm
[8] http://blog.silive.com/sinotebook/2008/08/tat.jpg
[9] http://www.goodrich.com/gr-ext-
templating/images/Goodrich%20Content/Business%20Content/Sensors%20and
%20Integrated%20Systems/Products/Literature%20Listing/4081%20Air%20Data
%20Handbook.pdf
[10] http://psas.pdx.edu/RocketScience/PressureAltitude_Derived.pdf
[11] http://en.wikipedia.org/wiki/True_airspeed
R3
[12] http://en.wikipedia.org/wiki/Adiabatic_process
[13] http://en.wikipedia.org/wiki/Heat_capacity_ratio
[14] R. P. G. Collinson, Chapman & Hall.(1998), Introduction to Avionics. 2 6
Boundary Row, London, SE1 8HN, UK in the Microwave Technology Series.
[15] http://msdn.microsoft.com/en-us/library/cc526981.aspx
[16].http://www.thommenag.ch/standard.cfm?ID_n=81&unter=36&haupt=26&lang
uage=1
[17] http://standards.sae.org/as8002a/

R4
[18] http://www.actel.com/ipdocs/CoreARINC429_DS.pdf
[19] http://en.wikipedia.org/wiki/ARINC_429
[20] http://blackiceair.net/SDK/sdk%20overview.html


![Chapter IR:V - uni- · PDF file4.Computation method for hidden variables. 5.Computation method of the relevance function ˆ(q;d). ... BM25] [ESA] [:::: LM] Document representations](https://img.pdfslide.us/doc/110x75/5a9e222d7f8b9a420a8e117f/chapter-irv-uni-method-for-hidden-variables-5computation-method-of-the-relevance.jpg)