Embed Size (px)
Citation preview
Development of agro-envi indicators based on land use/land cover changes for assessment of rural
landscape changes
Lukáš Brodský, Tomáš SoukupGISAT
Geographical information in support of the CAP, Toulouse 27 – 29 Nov. 2006

Goals and motivations
• development of a methodology • testing usage of agro-environmental indicators based on land use/land cover
changes• assessment of temporal development of environment and rural landscape in
context of agricultural policy
Motivation:Agro-environmental policy and landscape – to have a feedback
Associated regulations• the Act on Nature and Landscape Conservation• GAP (not to convert grassland into arable land, wide-space crops on slope …)• GAEC (not to disturb the landscape features)• AP in NVZs (not to disturb stream-side vegetation, to avoid a cultivation of selected
crops on slopes...)• … etc.
Geographical information in support of the CAP, Toulouse 27 – 29 Nov. 2006
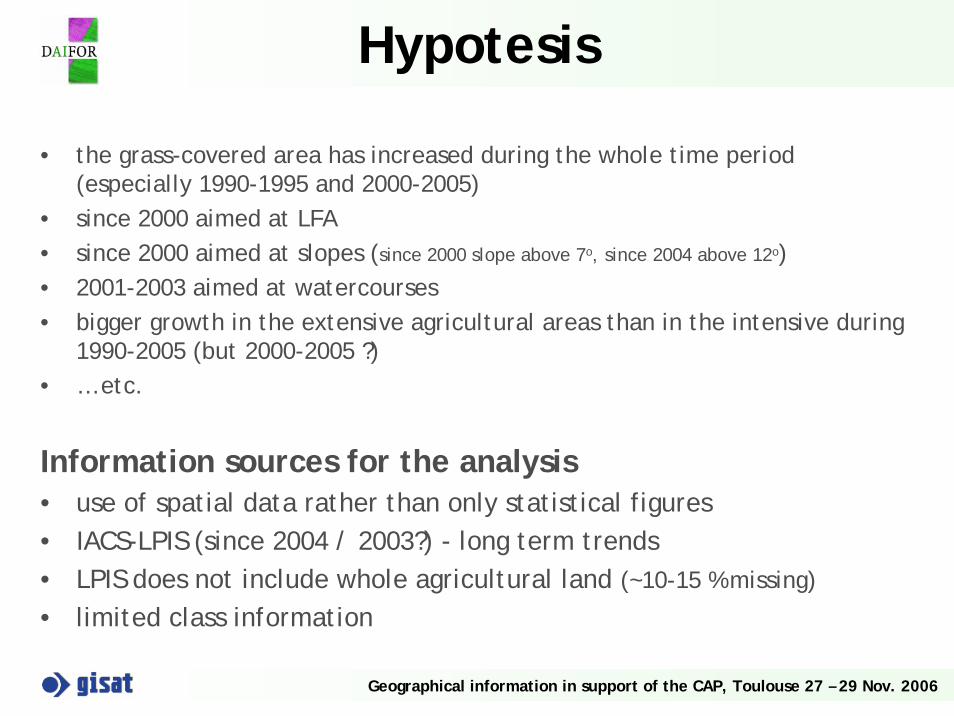
Hypotesis
• the grass-covered area has increased during the whole time period (especially 1990-1995 and 2000-2005)
• since 2000 aimed at LFA• since 2000 aimed at slopes (since 2000 slope above 7o, since 2004 above 12o)• 2001-2003 aimed at watercourses• bigger growth in the extensive agricultural areas than in the intensive during
1990-2005 (but 2000-2005 ?)• … etc.
Information sources for the analysis• use of spatial data rather than only statistical figures• IACS-LPIS (since 2004 / 2003?) - long term trends• LPIS does not include whole agricultural land (~10-15 % missing)
• limited class information
Geographical information in support of the CAP, Toulouse 27 – 29 Nov. 2006

Agro-Envi Indicators
The use of AEI– understanding of relationship between agriculture x environment– identification of risks– providing information about trends and changes in the system– help for policy-makers by their decision-making– simplification of communication between participants who take
part in the decision-making process
• Remarks– great share of land on farms is leased (willingness to make
changes on agricultural land) – cca 88%– obligations for the future – hardly possibility to plough the
grassland
Geographical information in support of the CAP, Toulouse 27 – 29 Nov. 2006
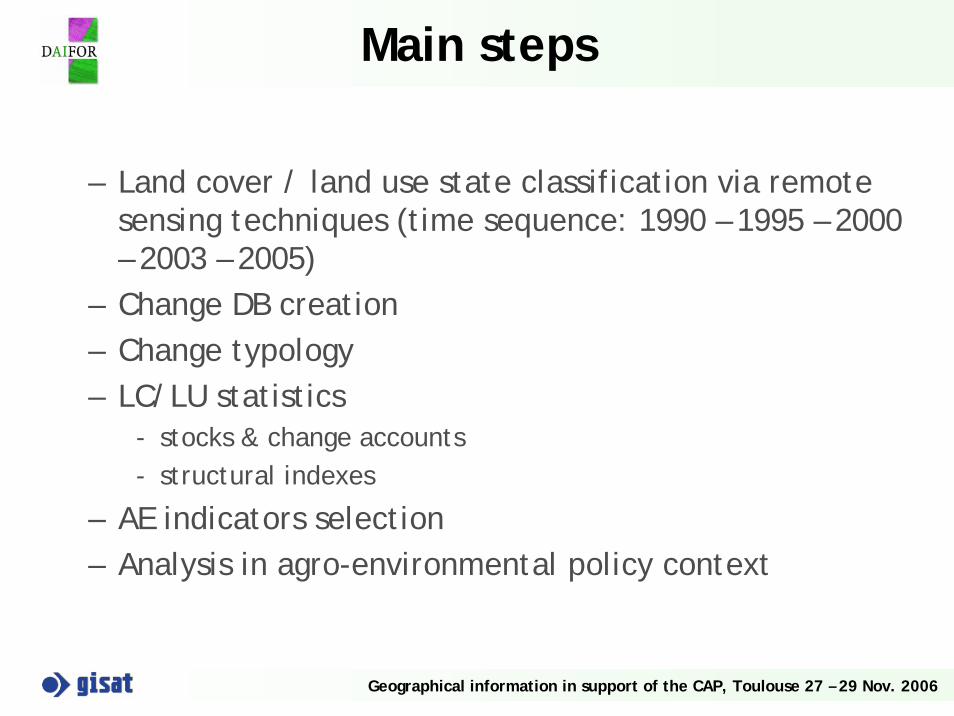
Main steps
– Land cover / land use state classification via remote sensing techniques (time sequence: 1990 – 1995 – 2000 – 2003 – 2005)
– Change DB creation– Change typology– LC/LU statistics
- stocks & change accounts- structural indexes
– AE indicators selection– Analysis in agro-environmental policy context
Geographical information in support of the CAP, Toulouse 27 – 29 Nov. 2006

Methodology
• Land cover / land use state classification – Multi-temporal HR data (e.g. LANDSAT) for each year
– Auxiliary data (LPIS) MMU: 1 ha
Geographical information in support of the CAP, Toulouse 27 – 29 Nov. 2006

Methodology
• Nomenclature– Artificial surfaces– Forest areas– Water– Agricultural areas
• arable land– 2.1.1.1 Spring Cereals– 2.1.1.2 Winter Cerelas– 2.1.1.3 Forage Crops (Clover and Lucerne only)– 2.1.1.4 Summer Crops (Maize, Sugar beet, Sunflower, etc.)– 2.1.1.5 Oilseed Rape (only)
• permanent crops• pasturess /grassland fields
Geographical information in support of the CAP, Toulouse 27 – 29 Nov. 2006

Classification
Classification results 1990 - 2005
Geographical information in support of the CAP, Toulouse 27 – 29 Nov. 2006
1990 1995
2000 2005
1000 Urban2111 Spring Cereal2112 Winter Cereal2113 Fodder Crops2114 Summer Crops2115 Oilseed Rape2200 Permanent crops2310 Pastures/Grassland3000 Forest5100 Water

Classification
• Abandoned land mapping– VHR data– visual interpretation 2003– automatic classification:
grassland– share of agri.: 1,98 %
Geographical information in support of the CAP, Toulouse 27 – 29 Nov. 2006

Classification
Automated extraction of SLU (Small LandscapeUnits / Landscape features) from satellite images – on VHR data (IKONOS)– Main classes include (hedgerow, solitary trees, groups of trees) = focus
lies on vegetation units– Object oriented image processing– Auxiliary data (LPIS, forest mask)
Geographical information in support of the CAP, Toulouse 27 – 29 Nov. 2006

Classification
• Extraction of SLUOBIAIn eCognition
Geographical information in support of the CAP, Toulouse 27 – 29 Nov. 2006

Analysis
• Land Cover Flows = classification of identified changes– Urban sprawl– Agricultural rotation and intensification– Conversions (grassland vs. arable land)– Forest creation and management– Change of lc due to natural and multiple causes
• lc/lu data - link with socio-economic statistical data or policy data
– administrative regions– natural areas (e.g. LFA, HNV areas, designated areas, elevation zones)
• insight into processes in zoning context relevant to particular AE policy targets (e.g. water protection, soil erosion, improvement of landscape ecological stability etc.)
Geographical information in support of the CAP, Toulouse 27 – 29 Nov. 2006
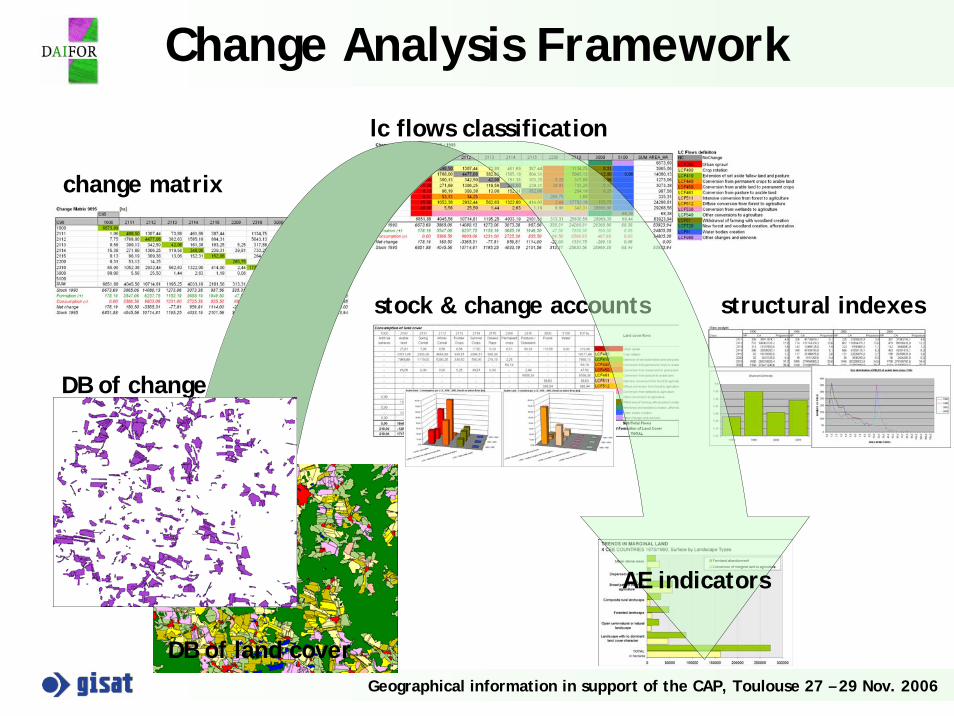
Change Analysis Framework
Geographical information in support of the CAP, Toulouse 27 – 29 Nov. 2006
stock & change accounts structural indexes
change matrix
DB of change
lc flows classification
DB of land cover
AE indicators

Change Database Creation
Geographical information in support of the CAP, Toulouse 27 – 29 Nov. 2006
• short time changes
• long time changes
• time sequences (sequence typology -> e.g. for land abandonment)

Land Cover Flows Definition (theory)
Geographical information in support of the CAP, Toulouse 27 – 29 Nov. 2006
• Land Cover Flows = classification of identified changes
• change typology based on change matrix• different typologies can be applied - simple /
mature • [e.g. EUROSTAT LEAC project (2002) – 44x44
changes into ~50 LCF]
Aim• reduce complexity, but still keep detailed insight• group changes of the same type / cause / level• by this to help in change assessment

Land Cover Flows Definition (application)
Geographical information in support of the CAP, Toulouse 27 – 29 Nov. 2006
• 14 LC hierarchical flows defined relevant to DAIFOR classes
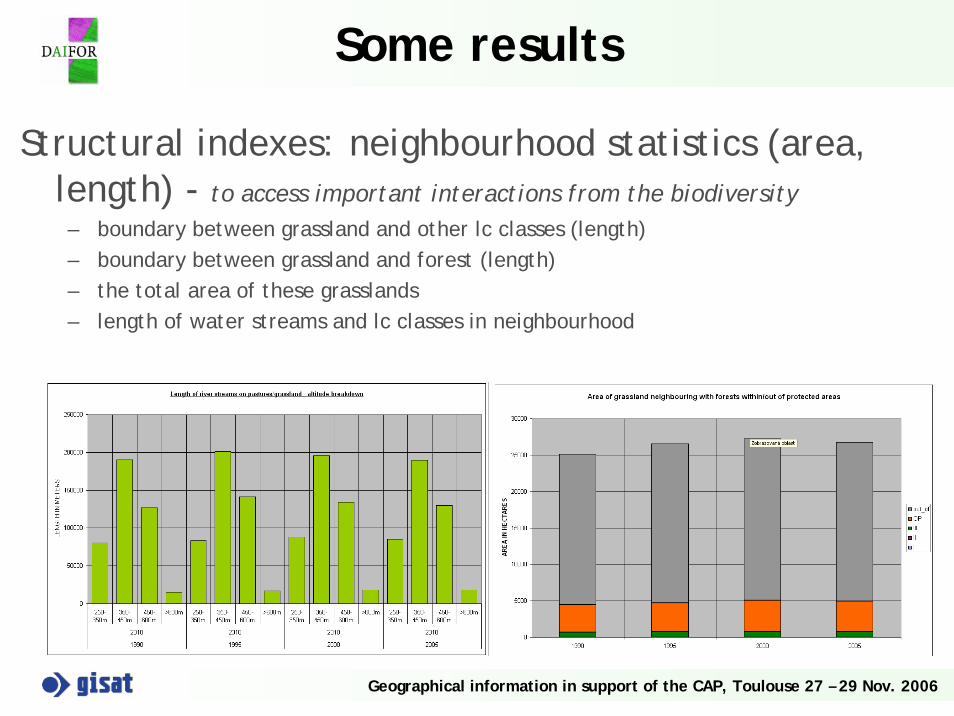
Some results
Structural indexes: neighbourhood statistics (area, length) - to access important interactions from the biodiversity– boundary between grassland and other lc classes (length)– boundary between grassland and forest (length)– the total area of these grasslands– length of water streams and lc classes in neighbourhood
Geographical information in support of the CAP, Toulouse 27 – 29 Nov. 2006

Some results
LU changes:* permanent pastures (extensive agri. area)
Changes: 1990 – 2000 % increase
2000 – 2005 % decrease (temporal?) Rate of grassing higher in 450 – 600 m altitudeAbove 600 m 93.5 % of grasslandSlope: up to 7deg. = 46.2 % grassed
7 – 12 deg. = 61.9 % above 12 deg. = 69.8 %
LFA: 62 % of the agri. land is grasslandGrassland along water courses: 3 % increase
Geographical information in support of the CAP, Toulouse 27 – 29 Nov. 2006

Some results
Spatial distribution of identified processes can be easily presented
Changes:• to grassland 14 % • to arable land 10 %
Problems encountered:Lucerne-grass mix classified as grassland= higher rate of changes
Geographical information in support of the CAP, Toulouse 27 – 29 Nov. 2006

Some results
SLU distributionand basic statisticsINT: 112 ha; EXT: 203 ha
SLU according to agriculturalland in neigbor
Geographical information in support of the CAP, Toulouse 27 – 29 Nov. 2006
category % of SLU area % of agr. land
SLU: grass-arable 17%
13%
70%
SLU: arable land 44,6 %
SLU: grassland 55,4 %

Some results
SLU breakdown according LPIS
Inside / outside of LPIS ?
Geographical information in support of the CAP, Toulouse 27 – 29 Nov. 2006
Inside LPIS (%) More than 10m inside(%)
Intensivearea
18,58 0.55
Extensivearea
23,50 1.81

Acknowledgements
Geographical information in support of the CAP, Toulouse 27 – 29 Nov. 2006
• The project was financialy supported by the Government of Flandersunder the Co-Operation Programme between Flanders and theCandidate Member States in Central and Eastern Europe.
• The data used in the study were partly obtained from CwRS campaign [1]. The authors are grateful to JRC-Ispra and Czech Paying Agency for the support in the research programe.
REFERENCES:• [1]: European Commission - Technical recommendations 1 (§ 5.6), REMOTE-
SENSING CONTROL OF AREA-BASED SUBSIDIES, JRC – Ispra 2006, MARS Ref. JRC IPSC/G03/P/PAR/par D(2006)(5608)Available on-line:http://agrifish.jrc.it/marspac/CwRS/default.htm

Acknowledgements
Geographical information in support of the CAP, Toulouse 27 – 29 Nov. 2006
Thank you for your attention!


![Dbpl Land Business Agro Farms Proposal [Compatibility Mode]](https://img.pdfslide.us/doc/110x75/577d37a41a28ab3a6b9611c3/dbpl-land-business-agro-farms-proposal-compatibility-mode.jpg)