Embed Size (px)
Citation preview

Development of Accelerated Solvent Extraction - Solid Phase Microextraction Method
for the Analysis of Brevetoxins in Sediment Samples
Amanda Joanne Gabriel
A Thesis
in
The Department
of
Chemistry and Biochemistry
Presented in Partial Fulfillment of the Requirements
for the Degree of Master of Science (Chemistry) at
Concordia University
Montreal, Quebec, Canada
April 2016
© Amanda Joanne Gabriel, 2016
CONCORDIA UNIVERSITY
School of graduate studies
This is to certify that the thesis prepared
By: Amanda Joanne Gabriel
Entitled: Development of Accelerated Solvent Extraction - Solid Phase Microextraction
Method for the Analysis of Brevetoxins in Sediment Samples
and submitted in partial fulfillment of the requirements for the degree of
Master of Science (Chemistry)
complies with the regulations of the University and meets the accepted standards with respect to
originality and quality.
Signed by the final Examining Committee:
___________________________ Chair
Dr. Christopher Wilds
___________________________ Examiner
Dr. Cameron Skinner
___________________________ Examiner
Dr. Dajana Vuckovic
___________________________ Supervisor
Dr. Yves Gélinas
Approved by _______________________________________________________
Chair of Department or Graduate Program Director
________________________2016 _______________________________
Dean of Faculty

iii
Abstract
Development of Accelerated Solvent Extraction - Solid Phase Microextraction Method
for the Analysis of Brevetoxins in Sediment Samples
Amanda Joanne Gabriel
The inability of modern harmful algal bloom detection techniques to identify past K.
brevis events has left the field without access to almost 300 years of historical data essential to
the assessment of their apparent increase in frequency and intensity. As such, the marine
sediments underlying K. brevis affected areas, and the final sink of the brevetoxins they produce
when in bloom, represent the only means of establishing the spatial and temporal history of past
occurrences.
In this work, a novel accelerated solvent extraction - solid phase microextraction method
has been developed and optimized for the extraction and quantification of brevetoxins from
marine sediments. Although the extraction method requires further optimization to improve its
extraction efficiency and robustness, the method provides an effective means of recovering
brevetoxins from most normal marine sediments, with total recoveries of spiked sediments as
high as 62.0 ± 9.5% for brevetoxin-2 and 61.6 ± 6.5% for brevetoxin-3. The development of the
method has allowed for several procedural pitfalls to be identified, including the potential
presence of several contaminants and interferences detrimental to the precise and accurate
quantification of brevetoxin using mass spectrometry. The most important among these limiting
factors is the presence of high concentrations of co-extracted hydrophobic organic carbon, which
affects the extraction efficiency of brevetoxins through the entrainment and sedimentation of
extracted brevetoxins from the sediment extract by the formation of organic matter-rich
flocculates. A strong relationship exists between organic carbon concentration and brevetoxin
recoveries, which allows correcting for the effect of flocculation.

iv
Acknowledgements
This work is dedicated to my mother, Margaret Hemmings, for her steadfast belief in my
abilities and for providing me with an example of what hard work and dedication can achieve. I
am the person I am today thanks to her tireless efforts and dedication and am proud to have her
as a role model. I would like to thank my family for their love, support, and encouragement
throughout this long and trying process and my husband Christopher Gallinger for being my
inspiration to succeed.
I would like to express my gratitude to my supervisor, Dr. Yves Gélinas, for his guidance,
patience, and generosity throughout my time as his student and for challenging me to better
myself as a chemist. I would also like to thank Alain Tessier for his counsel, kindness, and
eternal optimism as well as my committee members Dr. Cameron Skinner and Dr. Dajana
Vuckovic for their advice and direction throughout my project.
Finally, I would like to thank my lab members, especially Azadeh Joshani and Andrew
Barber, for being a sounding board throughout my master’s research and take the time to
acknowledge Concordia University and the GEOTOP Research Center in Geochemistry and
Geodynamics.

v
Contribution of Authors
All analyses were carried out by A. Gabriel under the supervision of Y. Gélinas. A.
Gabriel wrote the first draft of the article reporting this work (Chapter 2), with inputs from Y.
Gélinas. The analyses (elemental analysis and triple quadrupole mass spectrometry
measurements) were completed at the Concordia University Centre for Biological Applications
of Mass Spectrometry (CBAMS) and PERFORM Centre - Clinical Analysis Suite facilities. A.
Tessier provided guidance throughout the HPLC-MS method development as well as maintained
the instrumentation at both facilities. A. Leri performed preliminary extraction method
assessments and undergraduate student J. Shapiro occasionally helped with the weighing and
extraction of samples.

vi
Table of Contents
List of figures………………………………………………………………………...…...…... viii
List of tables……………………………………………………………………………………. ix
List of acronyms………………………………………………………………………………... x
1. General Introduction…………………………………………………………………….….1
1.1. Harmful Algal Blooms…………………………………………………..……………... .1
1.1.1. Karenia Brevis Red Tides……………………………………………………....... 2
1.1.1.1. Karenia Brevis Red Tide Initiation and Apparent Long Term Increase.. 3
1.1.1.2. Brevetoxins…………………………………………………….…….…... 7
1.1.2. Karenia brevis Sedimentary Record……………………………………….……. 9
1.2. Brevetoxin Recovery………………………………………………………...……….... 10
1.2.1. Soxhlet………………………………………………………………………….. 10
1.2.2. Sonication………………………………………………………………………. 11
1.3. Accelerated Solvent Extraction - Solid Phase Microextraction: A Novel Brevetoxin
Extraction Method……………………………………............................................….. 12
1.3.1. Accelerated Solvent Extraction……………………………………………....… 12
1.3.2. Solid Phase Microextraction……………………………………………...……. 13
1.4. Scope of Thesis………………………………………………………………….…….. 15
2. Development of Accelerated Solvent Extraction - Solid Phase Microextraction Method
for the Analysis of Brevetoxins in Sediment Samples…………………………...…….... 16
2.1. Introduction………………………………………………………………………....…. 17
2.2. Materials and Methods………………………………………………………………… 20
2.2.1. Method Development, Test Sediment Samples…….……………….…………. 20
2.2.2. Sediment Sample Collection…………………………………………………….20
2.2.3. Chemicals………………………………………………………………...…….. 21
2.2.4. Accelerated Solvent Extraction…………………………………………...……. 21
2.2.5. Solid Phase Microextraction…………………………………………….……… 22
2.2.6. High Performance Liquid Chromatography-Mass Spectrometry Analysis…….. 22
2.3. Results and Discussion…………………………………………………………...……. 23
2.3.1. Method Optimization…………………………………………………………… 23

vii
2.3.2. Finalized Accelerated Solvent Extraction-Solid Phase Microextraction
Brevetoxin Recovery Method……………………………………………..……. 29
2.4. Conclusion……………………………………………………………………………... 31
3. General Conclusion…………………………………………………………………..………32
References……………………………………………………………………………………… 35
Appendix A…………………………………………………………………………….………..40
Appendix B………………………………………………………………………………...……40
Appendix C……………………………………………………………………………..……….43

viii
List of Figures
Figure 1-1: K. Brevis marine dinoflagellate responsible for toxic red tide HABs. Modified from
ref. [9]……………………………………………………………………………………………. 2
Figure 1-2. The Loop Current enters the GOM as the Yucatán Current, passing between the
Yucatán peninsula and Cuba, and exits as the Florida Current, passing between the Dry Tortugas
and Cuba. It then meets with the Gulf Stream along the U.S. South Atlantic Bight.…………… 5
Figure 1-3: Schematic of ASE process. See text for description…..………………………….. 13
Figure 2-1: Brevetoxin backbone and derivative structures. Modified from ref. [25]……….... 17
Figure 2-2. Variations in recovery of 30 ng/ml spiked PbTx-2 (black) and PbTx-3 (white)
depending on spike location when using the ASE extraction method without sample pre-
treatment, See text for details. Replicates agree within the error of the method (n=2)...………. 24
Figure 2-3. Recovery of PbTx-2 (black) and PbTx-3 (white), spiked at 30 ng/ml, for different
SPME absorption solution compositions in a solvent-only and sediment extract matrix.
Replicates agree within the error of the method (n=2).………………………..…………….…. 26
Figure 2-4: Variation in the recovery of PbTx-2 (black) and PbTx-3 (white), spiked at 30 ng/ml,
in a solvent only matrix for 20 SPME fiber probes. Each measurement is based on an n of 2,
where the instrument precision is 6.3% for PbTx-2 and 7.3% for PbTx-3……………….…...... 27
Figure 2-5: Recovery of PbTx-2 (black) and PbTx-3 (white), spiked at 30 ng/ml, from a
sediment extract matrix as a function of multiple extractions performed using a single SPME
fiber in a sediment extract matrix (n=3).…………………………………………………….…. 28
Figure 2-6: Inverse relationship between sediment OC concentration and PbTx-2 (black) and
PbTx-3 (white) recovery (n=3)………………………………………………………….……… 29
Figure B-1: Chromatogram of PbTx-2 (Panel A) and PbTx-3 (Panel B) as well as mass spectra
of PEG contaminated sediment extract at the time of elution time of each analyte (PbTx-2 in
Panel C and PbTx-3 in Panel D)……..……………………………………………………….… 42
Figure C-1: Effect of 5-min contact of brevetoxins with 300-µL PP micro vials on calibration
curves…………………………………………………………………………………………… 45

ix
List of Tables
Table 2-1: Location and depth of sediment samples analyzed…………………………..…….. 21
Table 2-2: Corrected, measured brevetoxin concentration of Laguna Mecoacán sediment
samples (n=4)……………………………………………………………………………….….. 30
Table C-1: Effect of 5-min contact of brevetoxins with 300-µL PP micro vials on LC-MS
quantification…………………………………………………………………………………… 44

x
List of Acronyms
ASE Accelerated Solvent Extractor
ESI Electrospray Ionization
GOM Gulf of Mexico
HAB Harmful Algal Bloom
HPLC High Performance Liquid Chromatography
MIP Molecularly Imprinted Polymers
MI-SPME Molecularly Imprinted Solid-Phase Microextraction
MRM Multiple Reaction Monitoring
MS Mass Spectrometry
MSPD Matrix Solid Phase Dispersion
NOAA National Oceanic and Atmospheric Administration
NSP Neurotoxic Shellfish Poisoning
PbTx-2 Brevetoxin-2
PbTx-3 Brevetoxin-3
PEG Polyethylene Glycol
PP Polypropylene
SON Sonication
SOX Soxhlet
SPE Solid Phase Extraction
SPME Solid Phase Microextraction
VGSC Voltage Gated-Sodium Channel
WFS West Florida Shelf
OC Organic Carbon

1
1. General Introduction
1.1. Harmful Algal Blooms
Harmful algal blooms (HAB), commonly referred to as red tides, are caused by the
accumulation of one or more rapidly proliferating species of phytoplankton or algae in surface
waters. Their occurrence is a worldwide phenomenon and affects the coastal waters of all
continents as well as freshwater lakes and rivers.1 This domination of an ecosystem by
aggregations of these organisms often results in visible water discoloration, turning waterways
shades of red, brown, green, or yellow depending on the pigmentation of the prevalent algae
species.2
Although stunning in appearance, these colorful displays result in a myriad of adverse
effects to the surrounding environment and ecosystem that are long lived and far reaching. The
high concentrations of algae associated with HABs result in increased competition for available
nutrients, the impedance of sunlight to photosynthetic and marine plant life, the displacement
indigenous wildlife and contribute to the formation of hypoxic or anoxic dead zones in affected
waterways.2,3 One example is the blue-green algae HAB that took place in Lake Erie in the
summer of 2015 where the bloom manifested itself as a dense, bright green scum that at its peak
covered over 775 km2 of the lake’s surface.4 This HAB resulted in a severely hypoxic “dead
zone” within the lake’s central basin where dissolved oxygen remained undetectable for a
month-long period.5,6
In addition to their negative environmental impacts, HABs result in the annual
expenditure of millions of dollars in an effort to mitigate harm to affected human populations
and to fund growth within this field of research. The occurrence of HABs have resulted in
economic losses estimated at 82 million dollars per year in the United States due to the
implementation of environmental monitoring programs, public advisory services, and losses in
revenue to recreation, tourism, and commercial fishery industries.7 While many of the harmful
effects of HABs are due to non-toxic ecological and economical effects, certain HABs owe their
destructiveness to the synthesis and dispersal of toxins that alter cellular processes in affected
organisms and are responsible for a series of debilitating shellfish poisoning syndromes in
humans.1

2
1.1.1. Karenia Brevis Red Tides
One type of HAB is caused by the brevetoxin producing, photosynthetic marine
dinoflagellate Karenia Brevis.8 K. brevis is an unarmored, non-cyst producing, positively
phototactic vegetative plankton that measures between 18 and 45 µm in diameter and is
differentiated from other Karenia species by its bulbous apical protrusion and spherical nucleus,
as seen in Figure 1-1.8,9 These coastal, salt-water blooms are characterized by above-background
cellular concentrations of 103 cells L-1 or more and commonly reach levels considered “high” in
status, according to the National Oceanic and Atmospheric Administration (NOAA), when these
levels exceed 106 cells L-1.8,10
Figure 1-1. K. Brevis marine dinoflagellate responsible for toxic red tide HABs. Modified from
ref. [9].
Although K. brevis born red tides are known to occur in the coastal waters of New
Zealand, Japan, and South Africa,11 nowhere else in the world are blooms as frequent and long
lasting as those that occur annually within the Gulf of Mexico (GOM) and along the West
Florida Shelf (WFS).8 Here, K. brevis HABs are an almost yearly event which occur most
frequently in the late summer to early fall and have been known to last anywhere from a few
weeks to over a year in duration, covering areas of over to 25000 km2.8,12 The developmental
stages of a K. brevis HAB are heavily dependent upon the seafloor topography specific to the
continental shelves within the GOM.8 For this reason, HABs of this type have the ability to
develop fully offshore, without ever impacting the coastline and its inhabitants, as well as
migrate inshore and cause great economic and health concerns for affected populations.8 The

3
developmental stages of a of K. brevis HAB most commonly involve its offshore, mid-shelf,
initiation from a live seed stock of K. brevis cells present at background concentrations; inner
shelf growth in population and increase in biomass as cells adapt to their environment;
advancement and maintenance along the coast by winds and currents; followed by the least
understood, and least studied, termination of the bloom.8
There are several monitoring programs in place for the detection of K. brevis red tides
which range from visual detection by pilots used to search for water discoloration or patches of
dead fish, to satellite imagery and spectral or pigment sensor technology.8 Sampling efforts are
also being made in the form of water samples at fixed and offshore stations collected on a
monthly basis, as well as samples obtained whenever possible by volunteer fishermen, ships of
opportunity and others with an interest in contributing.8 While these monitoring efforts make it
possible for the public to remain advised of current HAB status, early detection or predictive
systems are still largely unavailable. Bloom confirmation often comes too late as satellite
imagery can only detect surface blooms classified as medium by the NOAA, at levels of 105
cells L-1,8 which are reached 2 to 8 weeks after cell growth begins.13 Even non-scheduled water
sampling occurs only as a response triggered by water discoloration, fish kills, and negative
health effects in humans once high cellular concentrations of 106 cells L-1 are reached.8
1.1.1.1. Karenia Brevis Red Tide Initiation and Apparent Long-Term Increase
A significant portion of the research performed on K. brevis red tides is focused on
determining the chemical, biological, and physical environments that allow for their initiation,
though much remains unknown and several hypotheses are still under debate.14 Commonly
attributed to a dynamic balance of natural growth prompters, wind and ocean circulation
patterns, as well as anthropogenic influences leading to eutrophication, the triggers of K. brevis
HABs are diverse and in constant evolution as local, and global, climate as well as industrial and
agricultural practices change.1,2 Although occurrences of K.brevis HABs have been recorded all
over the world, the high incidence and apparent increase of deadly and long lasting blooms
within the GOM has made it the focal point of the search for an understanding of these initiation
mechanisms.

4
The initiation of K. brevis blooms is known to be a naturally occurring process where a
combination of data collected using cultured cells in artificially defined growth media and in the
field have been used in its assessment. This has allowed for the evaluation of the necessary
climate, basic nutritive requirements and growth prompters that contribute to the increase from
background cellular concentrations to hazardous bloom levels.2,8 These studies revealed that both
temperature and salinity play significant roles in the geographic distribution and occurrences of
K. brevis red tides. Both cultured and field data demonstrated optimal growth conditions are
seasonally characteristic of commonly affected waters throughout the GOM.8 In addition to these
sea-surface parameter findings, the effect of nutrient availability has been widely assessed and
studies have revealed that terrestrial sources of both organic and inorganic phosphorous and
nitrogen as well as trace metals, chelators, and vitamins promote K. brevis growth and increases
in cell biomass. 8,13
While the knowledge of what environmental conditions and nutrient supplies allow for K.
brevis bloom initiation are important, even more critical are the physical processes that control
their supply. The GOM is characterized by a series of interconnected surface ocean currents that
cumulatively compose a large-scale circulation feature known as the Loop Current, seen in
Figure 1-2.8,13
5
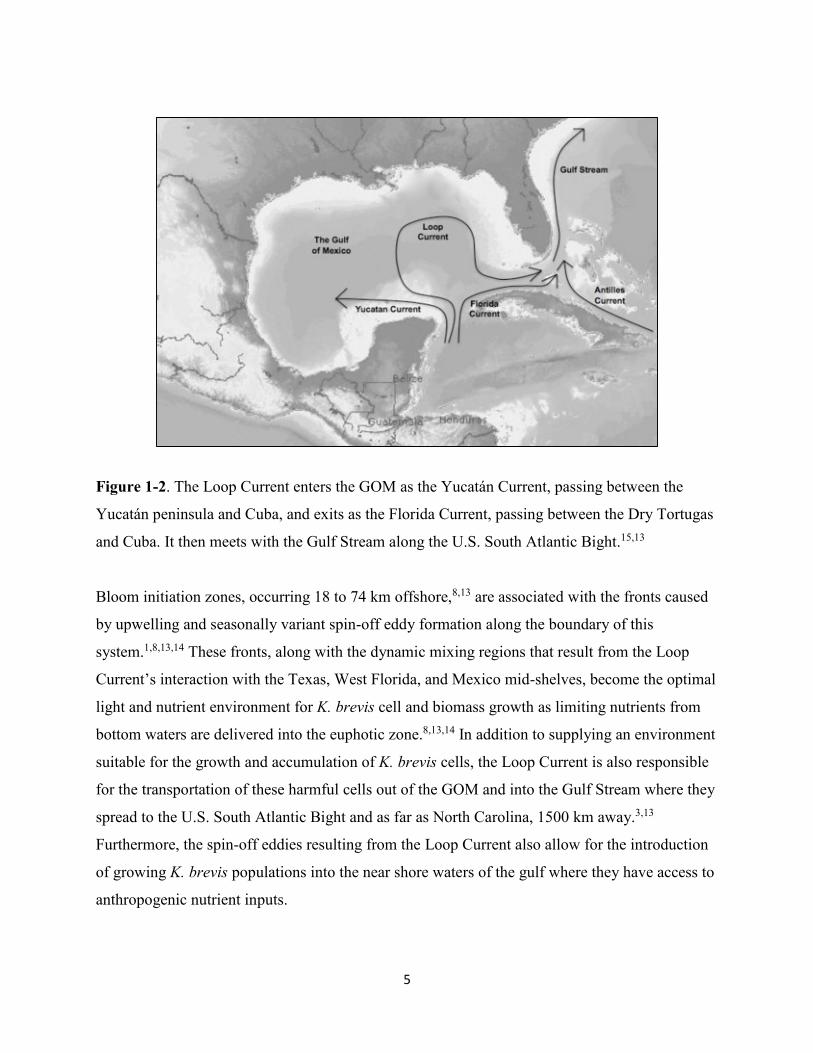
Figure 1-2. The Loop Current enters the GOM as the Yucatán Current, passing between the
Yucatán peninsula and Cuba, and exits as the Florida Current, passing between the Dry Tortugas
and Cuba. It then meets with the Gulf Stream along the U.S. South Atlantic Bight.15,13
Bloom initiation zones, occurring 18 to 74 km offshore,8,13 are associated with the fronts caused
by upwelling and seasonally variant spin-off eddy formation along the boundary of this
system.1,8,13,14 These fronts, along with the dynamic mixing regions that result from the Loop
Current’s interaction with the Texas, West Florida, and Mexico mid-shelves, become the optimal
light and nutrient environment for K. brevis cell and biomass growth as limiting nutrients from
bottom waters are delivered into the euphotic zone.8,13,14 In addition to supplying an environment
suitable for the growth and accumulation of K. brevis cells, the Loop Current is also responsible
for the transportation of these harmful cells out of the GOM and into the Gulf Stream where they
spread to the U.S. South Atlantic Bight and as far as North Carolina, 1500 km away.3,13
Furthermore, the spin-off eddies resulting from the Loop Current also allow for the introduction
of growing K. brevis populations into the near shore waters of the gulf where they have access to
anthropogenic nutrient inputs.
6
Although climate controls many of the fundamental parameters responsible for K. brevis
bloom initiation and though these blooms have been occurring long before the settlement of man
in affected regions, the effect of anthropogenic influences on these blooms in near-shore waters
cannot be ignored. These anthropogenic inputs have resulted in the widespread eutrophication of
coastal waters and changed the supply and composition of the nutrient pool available for algae
proliferation, particularly in the case of nitrates and phosphates.1,2,3,8,12,14 The resulting
favourable nutrient conditions not only increase the intensity and maintenance of K. brevis
blooms but also have the ability to artificially initiate blooms in these near-shore waters.14
Industrial and agricultural effects in urbanized coastal regions include pollutants like mariculture
born waste, agricultural and phosphate mining runoff, sewage effluents, atmospheric inputs of
NOx emissions, and changes to local food chains through the aquaculture of primary K. brevis
grazers.1,2,3,8,12
Due to increases in initiation, growth, and maintenance parameters, the occurrence of K.
brevis red tides within the GOM has increased in frequency, geographic distribution, and
duration, with an increase of 13- to 18-fold in cell concentration over a 50-year period.12,16 Since
both climate driven processes and artificial nutrient loading have the ability to promote K. brevis
cell growth and increases in biomass, there is an ongoing debate as to whether the apparent
increase in these HABs is due to natural or anthropogenic causes.17 While certain expansions in
K. brevis affected areas can be attributed to phenomena such as climate change and its effect on
seasonal sea-surface temperature, storms, and currents, they can also result from changing
human activities and increases in anthropogenic eutrophication of coastal waters.2,3 An
investigation of the long-term increase of K. brevis HAB events in the GOM by Brand and
Compton compared occurrences from the years 1954-1963 to those in the 1994-2002 period.12
The study demonstrated increases in the occurrence, duration, seasonality, maximum intensity,
cellular abundance, as well as on and offshore geographic distribution of blooms within the
1994-2002 period.12 These changes were attributed to increased nutrient abundance due to
greater inputs born of human activity though this hypothesis is not agreed upon by the entire
scientific community. Some attribute the apparent increase in K. brevis red tides to a raised
awareness of the scope of the issue, sampling biases, and the improvement of the tools and
techniques used for bloom detection and tracking.2,12 In order to assess the long-term changes in

7
the occurrence, and the conditions prompting them, the research field requires a proxy to identify
and determine the intensity of historical K. brevis events.
1.1.1.2. Brevetoxins
The most dangerous and damaging attribute of K. brevis red tides is its production of a
suite of neurotoxins known as brevetoxins (PbTx).12 These lipid soluble, polycyclic, methylated
polyether compounds, with molecular weights that range from 867 to 953 g/mol, exist as a group
of derivatives of two structural backbones, A (PbTx-1) and B (PbTx-2) as seen in Figure 2-1.18,19
The most prevalent brevetoxin species observed during a K. brevis red tide event are PbTx-1,
PbTx-2, and PbTx-3, where PbTx-2 and PbTx-3 represent the most abundant intra- and extra-
cellular brevetoxin species, respectively.20 In addition to PbTx-2 and PbTx-3 acting as the
primary indicators of K. brevis as the culprit organism of a given HAB occurrence, the relative
amounts of these brevetoxins offer insight into the relative age of these blooms as a general
increase in the abundance of PbTx-3 relative to that of PbTx-2 is observed as the bloom ages.20
While the reason for this shift in the relative amounts of PbTx-2 and PbTx-3 is not fully
understood, the process is commonly attributed to the enzymatic activity driven reduction of the
K-ring aldehyde of PbTx-2 into the K-ring reduced aldehyde found in PbTx-3.20,21 As such, the
ratio of PbTx-2 and PbTx-3 species reflect the developmental stage or age of a K. brevis HAB
where high ratios of PbTx-2:PbTx-3 are observed throughout the growth phase of the bloom
while high ratios of PbTx-3:PbTx-2 are observed when the bloom has matured and cell death
begins to occur.20
Extracellular brevetoxins contaminate waterways, spread as aerosols in sea spray, and
enter the food chain of affected areas through the ingestion of K. brevis cells by filter feeding
bivalves, fish, and other marine organisms.22 The resulting bioaccumulation and upward transfer
of brevetoxins throughout the food chain act as a route of exposure to higher order organisms
and human beings, meaning that even minor red tides can be dangerously toxic events. These
toxins are responsible for large-scale mortalities of wildlife in affected areas. They are also
responsible for a syndrome called neurotoxic shellfish poisoning (NSP) in humans when people
contact brevetoxins through ingestion of contaminated seafood8 or the inhalation of
contaminated aerosols.23 Brevetoxins induce NSP by binding to receptor Site 5 of the voltage

8
gated-sodium channel (VGSC), which normally mediates the transfer of sodium ions across the
cell membrane and causes an influx of sodium ions.24 The high-affinity binding of brevetoxins
keeps the channel continually open and the nerve membrane, and in some reported cases the
entire muscle, depolarized, resulting in neuro-excitation.24 Although no fatalities due to NPS
have been reported, there is no known antidote and the symptoms can be severe and include
gastrointestinal and neurological effects ranging from mild cases of nausea and vomiting to
hospitalization due to respiratory distress and partial limb paralysis.24
Just as the waterways, atmosphere, food chains, and human populations are infiltrated
with brevetoxins released during a K. brevis HAB event, so too are the sediments underlying
affected areas. Once released into the environment, sediments become contaminated through the
death and decomposition of K. brevis cells and contaminated marine wildlife, as well as the
entrainment and settling of extra- and intracellular brevetoxins through the flocculation and
sedimentation of organic and clay matter.3,25–31 The flocculation of K. brevis cells and
extracellular brevetoxins with clays and organic flocculants has been well documented and
explored as a means of mitigating the spread and severity of HABs.3,25,27,28 While the algae cell
and toxin removal varies with bloom cell concentration, water mixing, and salinity, clay
flocculation has been shown to remove more than 80% of K. brevis cells and up to 70% of
extracellular brevetoxins with the use of clay-rich sediments.27 The interaction between these
flocculants and brevetoxins has been purposefully exploited to mechanically control blooms3, but
the process also occurs naturally.
This mechanism acts not only as a means of introduction of lipophilic marine toxins to
underlying sediments, making them the final sink for brevetoxins, but also suggests that
brevetoxins sorb directly onto the sediment matrix.25,26,31 Although PbTx-2 and PbTx-3 have the
ability to persist within the sediments of a K. brevis HAB area up to 8 months after the
termination of a bloom,32 the timeframe for the long-term persistence of brevetoxins in sediments
has not been definitively constrained. The potential for their direct sorption and long-term
persistence within the sediment matrix points strongly towards the possibility of these toxins
acting as a proxy for historical K. brevis events.
9
1.1.2. Karenia Brevis Sedimentary Record
Historically, reports of HABs and the massive fish kills associated to K. Brevis HAB
events are commonplace and have been occurring in the GOM since the seventeenth century and
as early as 1648 in Yucatan, Mexico.8,33 While many of the characteristics and negative effects
of these blooms reflect those of K. Brevis red tides, the earliest identification of K. brevis as the
causative organism of HAB wildlife mortalities in the GOM was reported by Davis in 1947.8,18
This identification was made following one of the worst HAB occurrences, in terms of duration
and fish kills, occurring in 1946, with cell concentrations of 5.6 x 10⁷ cells L-1.7 Earlier red tides
have also been attributed to K. brevis owing to their geographic location in the GOM, the scale
of marine wildlife mortalities and reports of NPS symptoms by nearby communities,8 but they
are not officially confirmed. Current water sampling, satellite monitoring programs, and cyst
palynological analyses offer nothing in the way of retroactively identifying, localizing, and
measuring HABs caused by the unarmored K. brevis dinoflagellate, another source of the
information must be established.
The sequestration and persistence of brevetoxins in sediments underlying K. brevis HAB
affected areas result in these toxins being a valuable molecular probe for evaluating past bloom
occurrences. With the temporally-stratified deposition of material and the millions of square
kilometers of sediments covering the Earth’s surface, this sedimentary record accounts for the
only historical account of the spatial and temporal evolution of past K. brevis events. The
extraction and quantification of brevetoxins from sediment samples collected from various
locations and depths allow for the determination of the frequency, intensity, dynamics, and
geographic distribution of K. brevis HABs after their termination. Further, this information
allows retrospectively assessing the impacts of climate change and anthropogenic activity on the
occurrence and apparent increase of these blooms in the GOM.
The coupling of this historical reconstruction with sediment dating and palynological
analyses also allows improving our understanding of the environmental conditions that lead to
the initiation of K. brevis blooms. Paleo-environmental reconstruction databases, where dinocyst
identification and counting allow for the determination of sea-surface parameters like
temperature, salinity, and primary production, have become more widely available for the GOM
research area34. These databases present an opportunity, along with the historical reconstruction,

10
to evaluate the key parameters controlling the occurrence of K. brevis HABs beyond the 69 years
since the species was identified. A prognostic tool of this nature would ultimately allow for the
prediction and control of these HABs through preemptive, rather than reactionary, responses to
natural and anthropogenic environmental conditions favorable to their occurrence. These
preventative measures, and potentially the prevention of these blooms, would be invaluable to
preserve the health of coastal ecosystems, the populations in proximity to HAB hot zones, and
the economic interests of affected industries and conservation authorities.
1.2. Brevetoxin Recovery
Given the widespread benefits gained from the interpretation of the sedimentary record of
past K. brevis red tides occurrences, efforts towards developing a robust determination method
for sedimentary brevetoxins are underway. While several approaches have been developed for
the analysis of brevetoxins in water, aerosols, vegetation, tissue, and cells, none have been
successfully applied routinely to marine sediments. In addition to the challenge of fully
extracting the brevetoxins from the sediment matrix, such a method also has to be robust enough
to overcome the limitations stemming from variations in the composition and complexity of the
sediment matrix as K. brevis blooms occur worldwide above highly contrasting sedimentary
environments. Only a few studies reporting the development of a brevetoxin extraction method
from marine sediments are available in the literature until now.26,32
1.2.1. Soxhlet
Soxhlet (SOX) is an extraction method allowing the recovery of an analyte from a solid
sample matrix insoluble in common solvents.35 The extraction takes place in a SOX apparatus
where constantly refluxing solvent flows through a porous thimble containing the sample,
dissolving and collecting the analyte through continuous extraction.35Although the extraction
takes place unattended and SOX is traditionally viewed as the high recovery standard method to
which other solid extraction methods are compared, disadvantages of the extraction method
include the need for hundreds of millilitres of high purity solvent and long extraction times of 12
to 24 hours.36,35

11
The high thermal stability of brevetoxins makes SOX a common extraction method for
the recovery of brevetoxins from filtration material used on water samples and aerosol
samples.37,38,39 To the best of our knowledge, no literature exists on the SOX extraction of
brevetoxins from sediment samples but, it has been used successfully in the extraction of a vast
array of lipophilic biomarkers from sediment samples.31,40,41
1.2.2. Sonication
Sonication (SON) is an extraction method also used in the extraction of an analyte from a
solid sample matrix, but does so through physical disruption of the sample and dissolution of the
analyte using ultrasonic radiation.35 SON extraction involves the placement of the finely divided
sample in an extraction solvent, where the solution is either submerged in an ultrasonic bath or
exposed to an ultrasonic probe for repeated static cycles. The solvent from each cycle is then
separated from the solid sample via centrifugation, and pooled in order to maximize analyte
recovery. While the SON extraction method is less time consuming and requires less solvent
than the SOX method, SON is still a long and high solvent consumption method where the
repeated cycles and solvent pooling involve increased sample manipulation and opportunity for
experimenter error, as these steps cannot be automated or proceed without supervision.36
Widely used in the assessment of lipophilic molecular markers in sediment samples,31,42
SON is the most commonly used brevetoxin extraction method for solid samples, and is
employed in the recovery of aerosolized brevetoxins accumulated on filters as well as
brevetoxins from K. brevis cell cultures, tissue, vegetation, and sediments samples.26,32,38,43,44 The
implementation of the SON extraction method to recover brevetoxins from GOM mairne
sediments detected brevetoxin concentrations ranging from 0.81 and 89.0 ng/g sediment 26,32 and
demonstrated recovery efficiencies of only about 40% of brevetoxin spikes.26 To the best of our
knowledge, this is the highest recovery reported for any method for brevetoxins in a marine
sediment matrix. The low brevetoxin recovery was attributed to the binding of brevetoxins to the
sediment particles, as the extraction efficiency was independent of sonication time.26

12
1.3. Accelerated Solvent Extraction - Solid Phase Microextraction: A Novel Brevetoxin
Extraction Method
The need for a high efficiency method for the total recovery of brevetoxins from the
sediments has prompted the evaluation of new extraction methods, used until now only for lipid
and lipophilic analytes extracted from solid samples.
1.3.1. Accelerated Solvent Extraction
Unlike the extraction methods discussed above, accelerated solvent extraction (ASE)
utilizes high temperature and pressure conditions to improve the extraction of the analyte from
the solid sample.31,35,36 These conditions allow for the facilitated diffusion of the extraction
solvent throughout the sample matrix and result in the more complete dissolution and recovery of
the analyte.31,35,36 The sample to be extracted is placed in a sealed metal cell that is then placed
into a heated oven chamber and filled with the extraction solvent, as shown in the extraction
process scheme in Figure 1-3. The extraction cell is then pressurized, allowing for an increase in
the boiling point of the extraction solvent, and for the solubilisation of the analyte at a
temperature higher than would be possible at atmospheric pressure. The sample is then extracted
and collected by the automated filling and voiding of the cell through repeated static cycles.
Compared to other solid sample extraction techniques, ASE requires less time, consumes less
solvent during the extraction and with the added benefit of automation, it has proven effective for
several environmental solid samples.31
ASE has never been exploited for the analysis of brevetoxins in marine sediments, but
has demonstrated its effectiveness in the extraction of other hydrophobic, lipophilic marine
sediment contaminants, like polycyclic aromatic hydrocarbons,36 and marine toxins including
yessotoxins, pectenotoxins and okadaic acid.31 ASE is thus a promising approach to improve the
recovery of brevetoxins from marine sediments.

13
Figure 1-3. Schematic of ASE process. See text for description.45
1.3.2. Solid Phase Microextraction
As the recovery of brevetoxins from tissue samples is improved by the implementation of
sample preparation methods,43,44 a solid phase microextraction (SPME) treatment of the ASE
sediment extracts was performed. This SPME sample preparation step could lead to an
improvement in brevetoxin recoveries through the exclusion of interferences from the final
sample matrix, thereby reducing the potential for ionization suppression and improving the
accuracy of analyte peak area integration during LC-MS analysis. Although SPME products are
typically designed for thermal desorption and gas chromatographic analysis of volatile and semi-
volatile compounds, a SPME fiber coating suitable for solvent desorption and liquid
chromatographic analysis of a wide range of polar and nonpolar analytes has recently been
developed.35,46 These SPME products are available in both multi-use fiber assemblages and
single-use fiber probe formats, which consist of a fused silica, stainless steel, or titanium-nickel
metal alloy fiber core coated in a thin polymeric stationary phase.35,46 The SPME preparation of
a liquid sample consists of the partitioning of the analyte between the fiber coating and an
aqueous sample matrix. Extraction is a function of the analyte distribution coefficient and
exposure to the sample matrix.35,46 Given the small mass of the SPME material, this results in the

14
non-exhaustive recovery of the analyte. Extraction is considered complete when the
concentration of the analyte between the sample matrix and fiber coating has reached distribution
equilibrium.46,47
The equilibrium condition is described by the equation:
Co Vs = C∞s Vs + C∞
f Vf
where Co is the initial concentration of the analyte in the sample, Vs and Vf are the volume of the
sample and fiber coating, respectively, and C∞f and C∞
s are the equilibrium concentrations of the
analyte on the fiber and in the sample matrix, respectively. The distribution constant of the
analyte between the two phases is described by the equation:
Kfs = C∞f Vf / C
∞s Vs
Once the absorption of the analyte onto the fiber is complete, the fiber is removed from the
sample and the analyte is desorbed from the fiber coating using strong solvent through either the
use of an online SPME/HPLC interface or offline into a desorption solvent.35,46
SPME boasts the advantages of reduced sample manipulation, a final analyte matrix that
is HPLC ready, and targeted analyte selectivity based on sorbent material choice. An additional
advantage, specific to the extraction of brevetoxins from marine sediments, comes from the fiber
format of this single-step, solid-liquid extraction, sample preparation method. This SPME fiber
probe format, and the desorption of the analyte into a vial containing clean solvent, eliminates
the physical particulate filtration that result from chromatographic sample preparation methods,
such as solid phase extraction (SPE) discs or cartridges. This is an important consideration for
the recovery of brevetoxins from marine sediments owing to the ability of organic and clay
matter flocculates within the sediment extract matrix to entrain and settle brevetoxins out of
solution, making their physical exclusion from the sample matrix detrimental to the recovery of
brevetoxins. To this day, the implementation of SPME for the sample preparation of sediment
extracts in the recovery of brevetoxins has yet to be reported.

15
1.4. Scope of Thesis
As the brevetoxin sedimentary record represents the single greatest source of information
on the spatial and temporal history of K. brevis blooms, a robust extraction method for
brevetoxins in marine sediments is required. This extraction method would not only allow for the
paleo-reconstruction of past K. brevis events, but would also aid in the development of a
prognostic tool for prediction and mitigation of these harmful blooms through the correlation of
past occurrences to the sea-surface parameters and anthropogenic influences that contributed to
their initiation.
This thesis will report on the development and optimization of a protocol for the
extraction and quantitative measurement of brevetoxins from marine sediments using a novel
ASE-SPME-HPLC-MS method for implementation within the GOM and other K. brevis blooms
affected areas. The high pressure and temperature extraction conditions of the ASE will be
exploited in combination with the SPME sample preparation method to improve upon the low
brevetoxin recovery reported for the SON extraction method currently in use. The developed
ASE-SPME-HPLC-MS method will then be applied to a series of marine sediment samples
obtained from the Laguna Mecoacán in the GOM in order to assess the effectiveness of the
developed method on brevetoxins preserved in marine sediments.

16
2. Development of Accelerated Solvent Extraction - Solid Phase
Microextraction Method for the Analysis of Brevetoxins in Sediment
Samples
Amanda Gabriel1,2, Alain Tessier1, Alessandra Leri3, Jaclyn Shapiro1 and Yves Gélinas1,2*
1Department of Chemistry and Biochemistry, Concordia University, 7141 Sherbrooke West,
Montreal, QC, Canada, H4B 1R6
2GEOTOP - UQAM - McGill, C.P. 8888, Succursale Centre-Ville, Montréal, QC, Canada, H3C
3P8
3Department of Natural Sciences, Marymount Manhattan College, 221 E 71st St, New York, NY
10021, United States
* Corresponding author:
Yves Gélinas
Department of Chemistry and Biochemistry
Concordia University
7141 Sherbrooke West
Montreal, QC, H4B 1R6
Canada
Tel.: 514 848 2424 ext. 3337
Email: [email protected]
17
2.1. Introduction
Harmful algal blooms (HAB), caused by the rapid proliferation and accumulation of one
or more dominating species of algae, are a common phenomenon in aquatic environments and
occur worldwide.1 Aggregations of the organisms often cause visible water discoloration, turning
waterways shades of red, brown, green, or yellow depending on the pigmentation of the
prevalent algae species, and result in a myriad of adverse effects to the surrounding ecosystem.2
In addition to their many negative environmental and economic effects, such as the formation of
hypoxic or anoxic zones in waterways and the annual expenditure of millions of dollars towards
environmental monitoring programs, certain HABs owe their harmfulness to the synthesis and
dispersal of biotoxins when in bloom.1,2,17
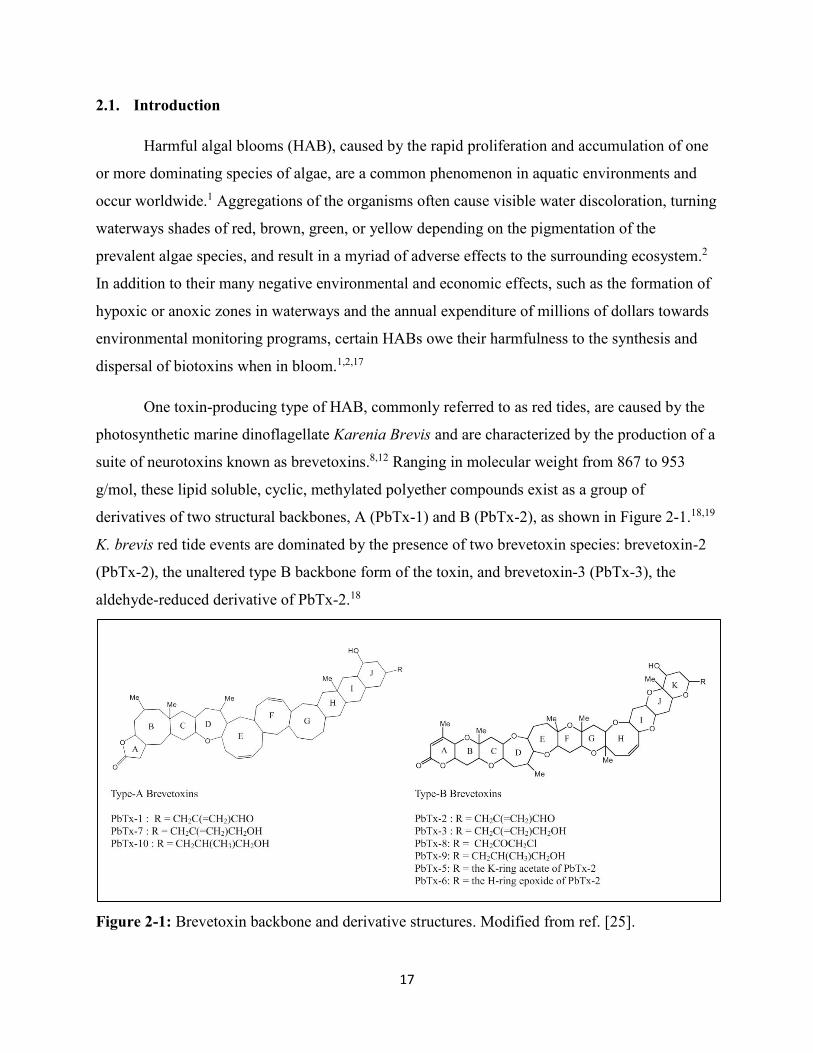
One toxin-producing type of HAB, commonly referred to as red tides, are caused by the
photosynthetic marine dinoflagellate Karenia Brevis and are characterized by the production of a
suite of neurotoxins known as brevetoxins.8,12 Ranging in molecular weight from 867 to 953
g/mol, these lipid soluble, cyclic, methylated polyether compounds exist as a group of
derivatives of two structural backbones, A (PbTx-1) and B (PbTx-2), as shown in Figure 2-1.18,19
K. brevis red tide events are dominated by the presence of two brevetoxin species: brevetoxin-2
(PbTx-2), the unaltered type B backbone form of the toxin, and brevetoxin-3 (PbTx-3), the
aldehyde-reduced derivative of PbTx-2.18
Figure 2-1: Brevetoxin backbone and derivative structures. Modified from ref. [25].

18
Brevetoxins contaminate waterways, spread as aerosols in sea spray, and bioaccumulate
in marine organisms, allowing for their introduction and upward transfer throughout the food
chains of affected areas. Not only do these brevetoxin dispersal mechanisms result in the large-
scale mortalities of wildlife within red tide events, but they also act as routes of exposure to
human beings where the inhalation of contaminated aerosols or ingestion of contaminated
seafood results in a syndrome called neurotoxic shellfish poisoning (NSP). Although K. brevis
red tides occur in coastal waters all over the world,11 nowhere are blooms as frequent and long
lasting as those that take place annually within the Gulf of Mexico (GOM) and along the West
Florida Shelf (WFS),8 where increases in the occurrence, duration, seasonality, maximum
intensity, cellular abundance, as well as on and off-shore geographic distribution of blooms have
been recorded over a 50-year period.12
Though references to many of the health and ecological effects that characterize K. brevis
red tides have been recorded as early as 1648 in the GOM, its identification as the causative
organism for these toxic HABs only occurred in 1947.8,18 Because modern-day water sampling,
satellite monitoring programs, and cyst palynological analyses offer nothing in the way of
retroactively identifying, localizing, and measuring past K. brevis HABs, the sediments
underlying bloom affected areas are being assessed as a potential historical record of these
events. The brevetoxins produced by K. brevis blooms become incorporated into marine
sediments through their entrainment and sedimentation from the water column by the
flocculation of organic and clay matter, making them the final sink for the bloom born toxins.3,25–
31 The temporally-stratified deposition and possible long-term persistence of brevetoxins within
marine sediments demonstrate their potential to act as molecular probe for evaluating the spatial
and temporal evolution of past K. brevis events.
While several approaches have been developed for the analysis of brevetoxins in water,
aerosols, vegetation, tissue, and cells, the need for an extraction method that can be routinely
applied for the recovery of brevetoxins from marine sediments still exists. This extraction
method must not only allow for high efficiency recovery of the analyte from the complex
sediment matrix, but must also be robust enough for its implementation on marine sediments
from a wide range of geographic settings and with highly contrasting sedimentary compositions.
The currently used sonication extraction method, which utilizes ultrasonic radiation to physically
19
disrupt the sample and facilitate dissolution of the analyte, results in the recovery of
approximately 40% of spiked brevetoxins and, to the best of our knowledge, is the highest
reported recovery of brevetoxins from a marine sediment matrix.26
An extraction method that has yet to be implemented in the recovery of brevetoxins from
marine sediments, but has demonstrated its effectiveness in the extraction of other lipophilic,
marine sediment contaminants, is accelerated solvent extraction (ASE).31,36 ASE allows for the
automated extraction and recovery of an analyte through repeated static extraction cycles at high
temperature and pressure, in order to facilitate the diffusion of the extraction solvent throughout
the sample matrix and allow the more complete dissolution and recovery of the analyte.31,35,36
The high temperature and pressure conditions of the ASE allow for improved recoveries of
analytes from marine sediments and should provide a means to assess the K. brevis bloom
history from the sedimentary record. Due to the complexity of the marine sediment matrix and
potential for the unintended co-extraction of non-analyte, hydrophobic compounds by the ASE, a
sample preparation step was implemented in order to clean-up the ASE extracts. Not only would
the introduction of a sample preparation step improve the robustness of the extraction method,
but the use of these techniques, like that of solid phase extraction (SPE) in the recovery of
brevetoxins from tissue samples, improves recovery efficiencies.43 As such, the partition based,
solid phase microextraction (SPME) treatment of the ASE extracts was performed before LC-MS
analysis.
In this work, a method for the quantitative measurement of brevetoxins from marine
sediments, based on a novel ASE-SPME-HPLC-MS approach, was developed and optimized. It
was applied to sediments of the GOM and other areas affected by K. brevis blooms. This
extraction method will allow assessment of the long-term persistence of brevetoxin in sediments,
as well as deciphering the spatial and temporal sedimentary record of past K. brevis red tide
occurrences.
20
2.2. Materials and Methods
2.2.1. Method Development, Test Sediment
Several sediment samples were used during the development and optimization of the
extraction method due to the limited amount of GOM sediment available. These test sediments
were chosen from geographic regions known to be unaffected by K. brevis HAB events and the
lack of naturally contained brevetoxins, as confirmed in this work by the analysis of blank
sediment extractions. The sediments were obtained from the Saguenay Fjord, Canada (Station
30, 48°18.28 N, 70°15.44 W), the Franklin Bay, Canada (70°02.73 N, 126°18.06 W), and the
Argentina Esperanza Station in Antarctica (62°14.80 S, 58°40. 05 W). The organic carbon (OC)
concentration varied between 0.38 and 2.30% in these samples. The OC concentration was
determined for each freeze-dried sample using elemental analysis (see Appendix A for details of
elemental analysis, OC concentration analysis).
2.2.2. Sediment Sample Collection
Sediment samples were collected from the Laguna Mecoacán (18.42°N - 93.15°W)
saltwater lagoon in south-western GOM during the R/V El Puma cruise of November 2011.34
This lagoon was chosen because of its central location along the Tabasco Coast, a region known
to be cyclically affected by K. brevis born HABs,22 with June to September bloom peak
concentrations reaching 106 cells L-1.1 This cell abundance is high enough to cause water
discoloration and to produce brevetoxins, which remain at the surface of underlying sediments
for up to eight months after an HAB event,3 at concentrations high enough to force the closure of
shellfish harvesting, result in fish kills and to cause respiratory distress.2
The samples were taken from the surface (0-1 cm) of sediment collected using box cores,
which were subsampled with pushcores, sliced onboard and transported back to the lab. The wet
sediments were then stored at 4°C and freeze-dried before being ground and homogenized using
a mortar and pestle.

21
Table 2-1. Location and depth of sediment samples analyzed.
Lagoon Sample
Number Site
Depth
(cm)
Latitude
N
Longitude
W
Laguna Mecoacán
1 MEX-11-12 0-1 18° 26' 01.7" 93° 07' 44.0"
2 MEX-11-13 0-1 18° 25' 46.2" 93° 08' 55.3"
3 MEX-11-14 0-1 18° 25' 22.8" 93° 08' 49.2"
2.2.3. Chemicals
Brevetoxin standards of PbTx-2 and PbTx-3 were purchased from MARBIONC
(Wilmington, USA). Acetonitrile (HPLC grade) was purchased from VWR (Montreal, Canada),
while formic acid (Optima LC/MS grade) and methanol (Optima grade) came from Fisher
Scientific (Ottawa, Canada). Nanopure, 18 MOhm water was used throughout this work.
2.2.4. Accelerated Solvent Extraction
The extraction of brevetoxins from the sediment samples was performed using an ASE
(Model ASE 150, Thermo Scientific Dionex) in a 66-mL cell, at 103.5 bar (1500 PSI) and 100
°C, using 3 extraction cycles of optima grade methanol, 5 min each. About 1.5 g of precisely
weighed sediment was loaded into the cell and the remaining void volume was filled with pre-
combusted Ottawa Sand (20-30 mesh, Fisher Scientific) to minimize solvent volume. During
method development, test sediment samples were spiked with 30 µL of a 1 ng/µL methanolic
solution of PbTx-2 and PbTx-3 prior to extraction. The resulting ASE sediment extract was then
concentrated using a rotary evaporator, transferred to a 2mL sample vial, and evaporated to
dryness while in a sand bath heated to 80°C, under a gentle stream of N2 gas. The dried residue
was re-solubilized in 1800 µL of a 25% (v/v) methanolic solution in water by sonication and
vortex mixing in preparation for the solid phase microextraction sample preparation step. The
use of polypropylene vials should be avoided throughout all steps of the extraction method as
decreases in brevetoxin recovery efficiency have been observed resulting from sediment extract
solution contact with the material (data not shown, see Appendix C for additional details on
effect of polypropylene vials on brevetoxin recovery).

22
2.2.5. Solid Phase Microextraction
Determination of SPME fiber probe recovery - The ASE sediment extracts were cleaned
by SPME using C-18 coated SPME-LC fiber probes (film thickness (df) 45 µm, reversed-phase,
Sigma-Aldrich). Before SPME fibers were introduced to sediment extracts, analyte recoveries
for each fiber was determined using a solvent matrix spiked with known amounts of standard
PbTx-2 and PbTx-3. The SPME fibers were conditioned in a 50% (v/v) methanolic solution in
water for 30 minutes before use. The conditioned fibers were then introduced to 1800 µL of a
brevetoxin spike, 25% (v/v) methanolic solution in water for 12-hr with orbital shaking to ensure
equilibrium conditions. The SPME fibers were then rinsed with Milli-Q water and introduced to
vials containing 300 µL of 100% methanol for offline brevetoxin desorption for 1-hr with orbital
shaking. The desorption solution was then evaporated to dryness in a sand bath heated to 80°C
under a gentle stream of N2 gas and stored at 4°C until analysis. Before HPLC-MS analysis, the
dried spiked residues were re-solubilized in 100 µL of a 70% (v/v) methanolic solution by
sonication and vortex mixing. The recovery efficiency (in percent) of each fiber was then used to
calculate the total brevetoxin content of the test and sediment extracts. Variations in recovery
efficiency between individual fibers arise from variations in the coating of the fibers with sorbent
material.
SPME fiber probe sample recovery - Once the recovery efficiency for each fiber was
measured, the conditioning, absorption, desorption, drying, and resolubilization sequence was
repeated with the re-dissolved ASE extracts obtained from sediment samples. The concentration
of the brevetoxins in the extracts was obtained using Multiple Reaction Monitoring, High
Performance Liquid Chromatography-Mass Spectrometry (HPLC-MRM) Analysis.
2.2.6. High Performance Liquid Chromatography-Mass Spectrometry Analysis
The HPLC-MS setup consisted of an Agilent Technologies, model 1200 series liquid
chromatographic system and a Waters Micromass, Quattro triple quadrupole mass analyzer. The
reversed-phase separations were performed on a 30 mm x 2.1 mm x 1.7 µm Kinatex C18
column, with a 2 µm SecurityGuard ULTRA C18 guard column (both from Phenomex Inc., CA,
USA) at room temperature. The separation was carried out under gradient conditions, with an
injection volume of 10 µL and a flow rate of 300 µL/min. The mobile phase consisted of (A)

23
water containing 0.1% formic acid and (B) acetonitrile containing 0.1 % formic acid where the
mobile phase composition was immediately increased from 30 to 45% B, then to 95% B over the
next 4 min, maintained at 95% B for 1 min to wash the column, then reduced to the initial
conditions of 30% B over the next 3 min with each injection made 15 min after the previous one.
Mass spectra data were acquired in positive electrospray ionization mode (ESI+) using a
z-spray source at a block temperature of 80°C. The analyte identities and retention times were
confirmed with analytical standards of PbTx-2 and PbTx-3 using daughter ion spectrum scan
mode from m/z 100 to 900. Nitrogen gas was used as both the drying and nebulizing gas, with
flow rates of 90 and 350 L/hr, respectively, and a nebulizing gas temperature of 350°C. The
optimized instrument parameters include the use of nitrogen as the collision gas at a pressure of
3.6 x 10⁻⁶ bar, cone voltages of 30V used for both brevetoxins, and collision energies of 20 and
25V were used for PbTx-2 and PbTx-3, respectively. The multiple reaction monitoring (MRM)
of brevetoxins occurred with dwell times of 0.5 s and transitions set to 895.5 m/z to 877.5 m/z
and 897.5 m/z and 725.5 m/z for PbTx-2 and PbTx-3 respectively. Brevetoxin quantification was
performed using an 8-point external calibration curve with solutions of 0.5, 1, 2, 4, 8, 16, 32, and
64 ng/mL made by serial dilution with analytical standards of PbTx-2 and PbTx-3 and duplicate
measurements made for each standard. The LC-MS method within-run precision, based on 14
measurements of the same standard solution throughout a 15.5 hour period, was 6.3% for PbTx-2
and 7.3% for PbTx-3, while the limits of detection (3σ) were 1.0 ng/mL for PbTx-2 and 0.5
ng/mL for PbTx-3 and limits of quantification (10σ) were 2 ng/mL for both PbTx-2 and PbTx-3.
2.3. Results and Discussion
2.3.1. Method Optimization
Preliminary ASE Brevetoxin Extraction Method – A preliminary assessment of the ASE
method to evaluate the recovery of brevetoxins from marine sediments. The parameters and
solvent used for the development of the ASE brevetoxin extraction method were selected based
on similar methods developed for the extraction of lipophilic analytes from marine sediments.31
The ASE method framework mirrored the only other method used for brevetoxins, which
consists of the SON extraction, evaporation, resolubilization and LC-MS analysis, where the
SON extraction step was replaced by ASE. The preliminary extractions consisted of three sets of

24
samples that were spiked with the two brevetoxins (i) before the ASE extraction, (ii) before the
evaporation, and (iii) before the analysis. The extractions resulted in recoveries of 1.9% for
PbTx-2, 3.1% for PbTx-3 for the pre-ASE spike, 3.3% for PbTx-2, 0.6% for PbTx-3 for the pre-
evaporation spike, and 51.4% for PbTx-2, 53.7% for PbTx-3 for the pre-analysis spike. The pre-
evaporation brevetoxin recovery, when determined in a solvent-only rather than sediment extract
matrix, resulted in the recovery 97.3% for PbTx-2 and 99.3% for PbTx-3 of the spiked
brevetoxins.
Figure 2-2. Variations in recovery of 30 ng/ml spiked PbTx-2 (black) and PbTx-3 (white)
depending on spike location when using the ASE extraction method without sample pre-
treatment, See text for details. Replicates agree within the error of the method (n=2).
The data indicates that independent of the efficiency of the ASE to extract the PbTx-2 and PbTx-
3 brevetoxins from the sediment matrix, less than 55% of the spiked brevetoxins are quantifiable
when the ASE-extracted solution is analyzed without sample pre-treatment. The solvent-only
spiked sample, which underwent the same procedural manipulations, shows that the loss of
brevetoxins is not a result of the handling of the sample and that the sediment extract matrix
likely is responsible for the low brevetoxin recoveries. The high temperature and pressure
conditions used during the ASE extraction results not only in the solubilization of the target
analytes, but also in the co-extraction of interfering organic compounds with chemical
0
20
40
60
80
100
Pre-ASE Pre-Evaporation Pre-Analysis Pre-Evaporation
Sediment Extract Matrix Solvent Only-
Matrix
Bre
vet
oxin
Rec
over
y (
%)
Spike Location Within Method

25
characteristics similar to those of brevetoxins. The presence of organic matter interferences in the
sediment extract leads to the formation of flocculates that accumulate and increase in size with
time. These flocculates may trap the extracted brevetoxins and remove them from solution,
making them unavailable for detection. This hypothesis is supported by the observation that the
spikes added at the beginning of the extraction sequence, with a longer contact time with the
sediment extract matrix, show greater brevetoxin losses upon analysis. An additional sample pre-
treatment step designed to reduce the effect of these interferences on recoveries, and to assess the
link between organic carbon and recovery efficiency was thus developed.
Solid Phase Microextraction Sample Pre-Treatment - SPME is a selective and rapid sample
pre-treatment method in which the targeted analytes are recovered in an HPLC-compatible final
solution. In addition, the single use C-18 SPME fiber probes used in this work allow for high
throughput treatment of multiple samples simultaneously while keeping the cost of each analysis
reasonable.
Influence of Solvent Composition on SPME Extraction Recovery - Although the composition of
typical SPME absorption solution range from 1 to 5% (v/v) organic phase in water, the solubility
of brevetoxins increases with increases in the proportion of methanol in solution. For this reason,
SPME absorption solutions with organic compositions of 1, 5, 25, 40, 55, and 70% (v/v)
methanol were evaluated in order to determine the composition that allowed for the optimal
balance between favorable sample – C18 sorbent material partitioning of brevetoxins and their
solubility in the absorption solution. The evaluation was carried out in both a solvent-only and
ASE extract of the Argentina Esperanza Station in Antarctica, a sediment sample with a low OC
concentration, to allow determination of SPME recovery efficiency in samples with low
concentrations of interfering compounds. The best results were obtained for an absorption
solution composition of 25% (v/v), with spike recoveries varying between 66.7 and 71.1% for
PbTx-2 and PbTx-3 (Figure 2-3).

26
Figure 2-3. Recovery of PbTx-2 (black) and PbTx-3 (white), spiked at 30 ng/ml, for different
SPME absorption solution compositions in a solvent-only and sediment extract matrix.
Replicates agree within the error of the method (n=2).
These findings suggest that an absorption solution of less than 25% (v/v) of methanol in water
leads to the incomplete solubilization of brevetoxins, making them unavailable for absorption
onto the SPME fiber. On the other hand, a solution above 40% (v/v) results in a low solid-liquid
partitioning of brevetoxin and thus on a low recovery of the analytes through absorption on the
solid C-18 fiber. In addition to allowing for optimal analyte partitioning and recovery, the 25%
(v/v) absorption solution composition also leads to statistically similar recoveries of brevetoxins
for the sediment extract and solvent-only matrices (95% confidence interval). All further method
optimizations and sample analyses were performed using these SPME absorption conditions.
SPME Brevetoxin Partitioning Coefficient - The SPME brevetoxin partitioning coefficient and
equilibrium conditions of the extraction, which are dependent on the nature of the analyte, its
concentration in solution, and the volume of sorbent material available, were determined through
the replicate, solvent-only matrix brevetoxin recovery of 20 SPME fibers (Figure 2-4). These
SPME extractions resulted in brevetoxin recoveries of 68.9 ± 10.7% for PbTx-2 and 66.0 ± 8.9%
for PbTx-3. The recoveries ranged from as low as 48.5% for PbTx-2, 49.1% for PbTx-3 to as
high as 86.0% for PbTx-2, for 78.4% PbTx-3, suggesting large fiber-to-fiber variations in
0
20
40
60
80
100
1% 5% 25% 40% 55% 70% 25% 40%
Solvent Only-Matrix Sediment Extract
Matrix
Bre
vet
oxin
Rec
over
y (
%)
SPME Absorption Solution Composition (% v/v Organic)

27
sorbent material volume or accessibility to sorbent absorption sites. As all SPME fibers were
obtained from the same production lot, the high fiber-to-fiber variability in brevetoxin recovery
suggests that large variations exist in the SPME fiber probe manufacturing process. The
extraction efficiency for each fiber must thus be assessed separately prior to its application to
real samples in order to correct for this potential bias. Such assessment and corrections were
applied throughout this work.
Figure 2-4. Variation in the recovery of PbTx-2 (black) and PbTx-3 (white), spiked at 30 ng/ml,
in a solvent only matrix for 20 SPME fiber probes. Each measurement is based on an n of 2,
where the instrument precision is 6.3% for PbTx-2 and 7.3% for PbTx-3.
It is important to note that the contamination of samples by polyethylene glycol (PEG) results in
a decrease in the recovery efficiency of the SPME fibers through the partially irreversible
absorption of the contaminant to the SPME fiber (data not shown). The introduction of PEG at
any point in the ASE-SPME-HPLC-MS method should be avoided at all costs to maximize the
recovery of brevetoxins and accurately quantify their concentration (see Appendix B for
additional details on PEG contamination).
SPME Fiber Re-Use - The extraction of several spiked sediment extracts, using a single SPME
fiber, was performed in order to determine whether individual fibers could be used more than
0
20
40
60
80
100
1 2 3 4 5 6 7 8 9 10 11 12 13 14 15 16 17 18 19 20
Bre
vet
oxin
Rec
over
y (
%)
Fiber Number

28
only once. The assessment revealed that the recovery efficiencies of individual SPME fibers
diminished by 3.1 ± 2.9% for PbTx-2 and 1.9 ± 1.6% for PbTx-3 upon its second use and by 30.0
± 8.7% for PbTx-2 and 13.0 ± 9.9% for PbTx-3 upon its third use.
Figure 2-5. Recovery of PbTx-2 (black) and PbTx-3 (white), spiked at 30 ng/ml, from a
sediment extract matrix as a function of multiple extractions performed using a single SPME
fiber in a sediment extract matrix (n=3).
Since the re-use of SPME fibers and the brevetoxin recovery in both the sediment extract and
solvent-only matrices are not significantly different (95% confidence interval), the extraction
efficiency of each SPME fiber can be determined through a solvent-only matrix test extraction
before its use with a real sample. The carry over after the 1st and 2nd use of SPME fibers,
determined by repeating the desorption procedure after the initial desorption of the sample,
resulted in recoveries of no more than 0.41% for PbTx-2 and 0.52% for PbTx-3, which is much
less than the precision of the LC-MS method used.
0
20
40
60
80
100
1st Use 2nd Use 3rd Use
Bre
vet
oxin
Rec
over
y (
%)
SPME Fiber Use

29
2.3.2. Final Accelerated Solvent Extraction- Solid Phase Microextraction Brevetoxin
Recovery Method
Effect of Sample Organic Carbon Concentration - The effect of organic matter on the recovery
of brevetoxins was assessed as the flocculation of organic matter has been used to mitigate the
spread and impact of K. brevis blooms through the entrainment and sedimentation of brevetoxins
from the water column to the underlying sediments. While this mechanism is one of the possible
explanations for the preservation of brevetoxins in the marine sediments underlying K. brevis
HAB affected areas, the other being the direct sedimentation of the source organism, K. brevis, it
could also lead to a loss of brevetoxins from the extraction solution as flocculates form and
sequester other lipophilic organic compounds. The effect of organic matter content was
evaluated through the analysis of three sediment samples of varying OC concentrations using the
finalized ASE-SPME-HPLC-MS method. The recovery efficiencies shown in Figure 2-6 for
sediment samples with low (0.38 wt%), mid-range (1.01 wt%), and high (2.30 wt%) OC
concentrations result in brevetoxin recoveries of 62.0 ± 9.5% (PbTx-2) and 61.6 ± 6.5% (PbTx-
3), 20.4 ± 3.0% (PbTx-2) and 20.3 ± 3.8% (PbTx-3), and 10.7 ± 2.5% (PbTx-2) and 10.0 ± 2.3%
(PbTx-3), respectively.
Figure 2-6. Relationship between sediment OC concentration and PbTx-2 (black) and PbTx-3
(white) recovery (n=3).
y = 22.87x-0.983
R² = 0.99
0
25
50
75
0 1 2 3
Bre
vet
oxin
Rec
over
y (
%)
OC Concentration (wt%)
Brevetoxin-2
y = 22.28x-1.011
R² = 0.99
0
25
50
75
0 1 2 3
Bre
vet
oxin
Rec
over
y (
%)
OC Concentration (wt%)
Brevetoxin-3

30
This trend in brevetoxin recovery supports the hypothesis that the co-extracted organic matter
from the sediment matrix interferes with the absorption of brevetoxins on the SPME fiber
through the flocculation and sequestering of the brevetoxins from solution. While these results
reveal an inverse relationship between OC concentration and brevetoxin recovery, additional
data points are needed to confirm the accuracy of the mathematical relationship. It is important to
note that the majority of sediments around the globe have organic carbon concentrations around
1 wt%,48 a level at which the interferences are less problematic. The recovery-OC concentration
relationship should however be better defined before applying this approach on sediments with
OC concentrations above this threshold and for correcting brevetoxin concentration data for the
effect of OC flocculation.
Brevetoxin Quantification in GOM Sediment Samples - The ASE-SPME-HPLC-MS extraction
and quantification of three samples obtained from the GOM resulted brevetoxin concentrations
shown in Table 2-2.
Table 2-2. Corrected, measured brevetoxin concentration of Laguna Mecoacán sediment
samples (n=4).
Lagoon Sample
Number Site
PbTx-2
(ng/g sediment)
PbTx-3
(ng/g sediment)
Organic Carbon
Conc. (%)
Laguna
Mecoacán
1 MEX-11-12 1.39 ± 0.38 0.876 ± 0.15 1.54
2 MEX-11-13 0.612 ± 0.092 0.450 ± 0.059 0.87
3 MEX-11-14 0.428 ± 0.033 0.298 ± 0.052 0.67
This data shows that the ASE-SPME-HPLC-MS method is suitable for the extraction, recovery,
and quantification of brevetoxins from marine sediment samples with relative standard
deviations (RSD) better than 17%. The only exception is for PbTx-2 in the MEX-11-12 sample
for which the RSD is 27%. Although the recoveries appear low for samples with OC
concentrations above 1 wt%, it is worth noting that the overwhelming majority of sediments
from the world ocean have OC concentrations ranging between 0.5 and 1.5%,48 and that the
maximum values found in low dissolved oxygen environments is about 8 wt%. At such high OC
levels, the brevetoxin recoveries would be slightly less than 5%, and while the measured
31
brevetoxin concentrations would be less precise, the data would still be informative if replicate
analyses were run. Further efforts into improving this method should be devoted to the
understanding and, if possible, the mitigation of the effect of organic matter flocculation on
brevetoxin recoveries. The data obtained for the GOM samples shows that brevetoxins from a
past K. brevis HAB in the sample region are preserved in sediments, and that they can vary by
almost two-fold between samples. The fact that the highest brevetoxin concentrations are found
in the sample with the highest OC content agrees with the hypothesis of a strong interaction
between brevetoxins and sedimentary organic matter, providing clues on a potential mechanism
explaining their preservation in sediments.
2.4. Conclusion
The recovery efficiency of the ASE-SPME-HPLC-MS method for the extraction of
brevetoxins from marine sediment samples is dependent upon the complexity of the sample and
the effect of co-extracted organic matter from the sediment matrix. While the ASE was expected
to more effectively extract brevetoxins from the sediment matrix and result in a more complete
recovery of the analyte, the formation of organic flocculate in the extract solution reduced
analyte recovery. Flocculate formation proved unavoidable throughout the extraction and sample
preparation steps and reduced brevetoxin recovery even after short periods of contact with the
sediment extract. Although a SPME sample pre-treatment step was introduced to mitigate the
effect of these interferences, the recovery efficiency of the extraction method remains dependent
on the OC concentration of the sediment sample. However, the strong inverse relationship
between OC concentrations and brevetoxin recovery allows correcting for the effect of
flocculation and allows quantifying with confidence PbTx-2 and PbTx-3 in sediments. The ASE-
SPME-HPLC-MS method will prove very useful for deciphering spatial and temporal variations
in K. brevis HAB, which in turn could be instrumental in understanding the causes for the recent
expansion of affected areas.

32
3. General Conclusion
Although more work is needed to make the ASE-SPME-HPLC-MS method of extraction
of brevetoxins from marine sediments as robust as needed for optimally deciphering the
sedimentary record of past K. brevis HABs, what was learned through its development and
optimization is invaluable to future attempts to improve brevetoxin recoveries. The most
important problem to overcome is the effect of OC content on brevetoxin recovery efficiency as
the analytes are entrained and sediment out of solution through organic matter flocculation.
The inverse relationship between OC concentration and brevetoxin recovery suggests
that the short and long-term interaction between brevetoxins and hydrophobic organic matter
should be investigated in an effort to understand whether this interaction leads to enhanced
persistence of brevetoxins in marine sediments and provide clues on the best approaches to
eliminate their effect on the recovery of brevetoxins from the sediment matrix. The presence of
hydrophobic organic matter in the sediment extract is due to its co-extraction at the high
temperature and pressure used during the ASE treatment and likely is unavoidable. Further
optimization of the ASE extraction parameters, with the dual purpose of optimizing brevetoxin
extraction and minimizing the recovery of organic matter interferences, to reduce flocculation
and improve brevetoxin recovery may prove difficult as brevetoxins constitute a class of
hydrophobic species similar in composition to the co-extracted organic matter; any improvement
in the extraction of the former would lead to an improvement in the extraction of the latter, and
vice versa. The addition of a SPME sample preparation step post-extraction, although successful
for the recovery of brevetoxins from solvent-only and low OC concentration samples, did not
allow efficiently overcoming the low brevetoxin recoveries induced by organic matter
flocculation or competitive absorption of other hydrophobic compounds on the SPME fibers low
recoveries in organic-rich sediments. More work should be done to reduce the effect of
flocculation and competitive absorption on brevetoxin recoveries, or alternative sample clean-up
methods should be explored.
In addition to the effect of the sample OC concentration on the extraction efficiency of
brevetoxins from the sediment matrix, several other conclusions were derived from the
development and optimization of the ASE-SPME-HPLC-MS method. While the primary source
of organic matter responsible for the decreases in brevetoxin recovery originates directly from

33
the sediment sample, our findings also demonstrate the importance of avoiding contamination
from external sources of organic compounds through the pre-combustion of glassware or base
rinsing of heat sensitive materials used throughout the extraction method. An example of a
contaminant that is problematic is polyethyleneglycol (PEG), owing to its competitive absorption
on the SPME fibers, thus decreasing brevetoxin recovery and the number of extractions for
which a single fiber can be used. As this contaminant has many laboratory and everyday sources
and is at least in part irreversibly absorbed by the SPME fiber sorbent material, extra care must
be taken and periodic verifications made to ensure that the contaminant is not present.
The ASE-SPME-HPLC-MS method presented here is well suited for the recovery of
brevetoxins from sediment matrices. Additionally, it may serve as a framework in the
development of extraction methods for analytes unaffected by sample organic matter
flocculation, including the more than 200 other HAB marine toxins and their derivatives.31 As
more than 90% of these biological toxins are lipophilic in nature and are found in highly diverse
sedimentary environments worldwide, the trends and relationships established throughout this
work will provide a promising starting point for future sediment ASE extractions as well as serve
as a cautionary tale of the pitfalls faced when recovering such analytes from sediments.
Future Work
The data and observations presented within this work have identified several aspects of
the extraction of brevetoxins from marine sediments that require further investigation in order to
better understand the interactions at play. In addition to the need for more data points to validate
the brevetoxin recovery-OC concentration relationship and its implementation as a correction to
account for the effect of OC flocculation, the effect of the variation in the chemical composition
and complexity of the organic matter of the sample should also be assessed. This would be best
performed through the extraction of sediment samples bearing similar OC concentrations but
originating from varying geographic locations and environments as well as the extraction of
sediment samples devoid of background organic matter content that have been spiked with
organic matter of varying types.
Another aspect of the developed method that merits further examination is that of
ionization suppression due to the sediment extract sample matrix. As ionization suppression
34
results in a change in the efficiency with which the spray droplet forms or evaporates, thus
affecting the mass to charge ratio of the ion that reaches the detector, the quantification of the
brevetoxin analytes can be greatly affected by the coelution of interferences, cross-talk, or the
sample matrix.49 The ionization suppression of the brevetoxin analytes would be identified by
comparing the instrument response for the analyte when: 1) injected within a solvent-only matrix
to obtain its relative 100% response, 2) injected within a pre-extracted sediment extract matrix to
determine the effect of the sample matrix, and 3) injected as part of a sediment sample having
undergone the complete extraction method to determine whether any signal loss is attributable to
the extraction process.49 Any ionization suppression identified can then be addressed by
adjusting the sample preparation protocol, altering the HPLC method, or corrected for by use of
a co-eluting, isotopically labeled or structural analog internal standard.49 Note that in addition to
the benefit aiding in the identification of and correction for ionization efficiency issues during
LC-MS analysis, the incorporation of an internal standard to the SPME portion of the extraction
method would also allow for the correction of the fiber to fiber variability observed throughout
the method optimization.
The recovery efficiency and robustness of the extraction method may also be improved
through the use of alternative sample preparation techniques that offer greater analyte selectivity,
the exhaustive recovery of the analyte, or are better suited to the non-homogeneous, flocculate
bearing sediment extract matrix. One sample preparation method that allows for the complete
recovery of the analyte and allows for the mixing of bulk amounts of sorbent material throughout
the sample extract, is the use of the “QuEChERS” (the quick, easy, cheap, effective, rugged, and
safe) method, dispersive SPE.50 The most promising of sample preparation techniques involves
the use of molecularly imprinted polymers (MIPs) to increase analyte selectivity through the
artificial generation of recognition sites complimentary to the shape, size, and functionality of
the target molecule.51 Several modes of MIP sample preparation techniques, including
molecularly imprinted solid-phase microextraction (MI-SPME) and matrix solid phase
dispersion (MSPD), are well suited to the clean-up of brevetoxin containing sediment extracts
and warrant the development of brevetoxin template based sorbent materials.51

35
References
1. Sellner, K. G., Doucette, G. J. & Kirkpatrick, G. J. Harmful Algal Blooms: Causes,
Impacts and Detection. J. Ind. Microbiol. Biotechnol. 30, 383–406 (2003).
2. Gilbert, P. M., Anderson, D. M., Gentien, P., Granéli, E., Sellner, K. G. The Global,
Complex Phenomena of Harmful Algal Blooms. Oceanography 18, 130–141 (2005).
3. Anderson, D. M. The Ecology and Oceanography of Harmful Algal Blooms:
Multidisciplinary Approaches to Research and Management. Multidisciplinary
Approaches to Research and Management 1–30 (2005).
4. Experimental Lake Erie Harmful Algal Bloom Bulletin 10. (2015).
5. NOAA - Great Lakes Environmental Research Laboratory. Hypoxia Warning System -
Lake Erie at Cleveland, OH. Available at:
http://www.glerl.noaa.gov/res/HABs_and_Hypoxia/hypoxiaWarningSystem.html.
(Accessed: 1st March 2016)
6. Great Lakes Observing System. Great Lakes Buoys. Available at:
http://greatlakesbuoys.org/show_pic.php?station=45164&meas=DOSAT&uom=E&time_
diff=-4&time_label=EDT. (Accessed: 1st March 2016)
7. Hoagland, P. & Scatasta, S. in Ecology of Harmful Algae (eds. Granéli, E. & Jefferson, T.)
189, 391–402 (Springer Berlin Heidelberg, 2006).
8. Steidinger, K. a. Historical Perspective on Karenia Brevis Red Tide Research in the Gulf
of Mexico. Harmful Algae 8, 549–561 (2009).
9. Smithsonian Marine Station. Karenia Brevis. Available at:
http://www.sms.si.edu/irlspec/Kareni_brevis.htm. (Accessed: 1st March 2016)
10. NOAA - National Oceanic and Atmospheric Administration. Harmful Algal Bloom
Observing System. Available at:
http://service.ncddc.noaa.gov/website/AGSViewers/HABSOS/maps.htm. (Accessed: 1st
March 2016)
11. Carder, K. L. et al. Red Tides in the Gulf of Mexico: Where, When, and Why? J.
Geophys. Res. 111, 1–46 (2010).
12. Brand, L. E. & Compton, A. Long-Term Increase in Karenia Brevis Abundance Along the
Southwest Florida Coast. Harmful Algae 6, 232–252 (2007).

36
13. Tester, P. A. & Steidinger, K. A. Gymnodinium Breve Red Tide Blooms : Initiation ,
Transport , and Consequences of Surface Circulation. Limnol. Oceanogr. 42, 1039–1051
(1997).
14. Roelke, D. & Buyukates, Y. The Diversity of Harmful Algal Bloom-Triggering
Mechanisms and the Complexity of Bloom Initiation. Hum. Ecol. Risk Assess. An Int. J. 7,
1347–1362 (2001).
15. Sanibel Sea School. Currents in the Gulf of Mexico. Available at:
http://classroom.sanibelseaschool.org/currents-in-the-gulf-of-mexico. (Accessed: 1st
March 2016)
16. Kirkpatrick, B. et al. Literature Review of Florida Red Tide: Implications for Human
Health Effects. Harmful Algae 3, 99–115 (2004).
17. Anderson, D. M., Hoagland, P., Kaoru, Y. & White, A. W. Estimated Annual Economic
Impacts from Harmful Algal Blooms (HABs) in the United States. (2000).
18. Baden, G. Brevetoxins: Unique Polyether Dinoflagellate Toxins. Fed. Am. Soc. Exp. Biol.
1807–1817 (1989).
19. Baden, D. G., Bourdelais, A. J., Jacocks, H., Michelliza, S. & Naar, J. Natural and
Derivative Brevetoxins: Historical Background, Multiplicity, and Effects. Environ. Health
Perspect. 113, 621–625 (2005).
20. Pierce, R., Henry, M. & Blum, P. Brevetoxin Abundance and Composition During
ECOHAB-Florida Field Monitoring Cruises in the Gulf of Mexico. Cont. Shelf Res. 28,
45–58 (2008).
21. Tester, P. A. et al. Relationships Among Water Column Toxins , Cell Abundance and
Chlorophyll Concentrations during Karenia Brevis Blooms. Cont. Shelf Res. 28, 59–72
(2008).
22. Gerssen, A. et al. Marine Toxins: Chemistry, Toxicity, Occurrence and Detection, with
Special Reference to the Dutch Situation. Toxins (Basel). 2, 878–904 (2010).
23. Cheng, Y. S. et al. Characterization of Marine Aerosol for Assessment of Human
Exposure to Brevetoxins. Environ. Health Perspect. 113, 638–643 (2005).
24. Watkins, S. M. Neurotoxic Shellfish Poisoning. Mar. Drugs 6, 430–455 (2008).
25. Pierce, R. H. et al. Removal of Harmful Algal Cells (Karenia Brevis) and Toxins from
Seawater Culture by Clay Flocculation. Harmful Algae 3, 141–148 (2004).

37
26. Mendoza, W. G., Mead, R. N., Brand, L. E. & Shea, D. Determination of Brevetoxin in
Recent Marine Sediments. Chemosphere 73, 1373–7 (2008).
27. Hole, W. & Hole, W. Controlling Harmful Algal Blooms Through Clay Flocculation. J.
Eukaryot. Microbiol. 51, 169–172 (2004).
28. Beaulieu, S. E., Sengco, M. R. & Anderson, D. M. Using Clay to Control Harmful Algal
Blooms : Deposition and Resuspension of Clay / Algal Flocs. Harmful Algae 4, 123–138
(2005).
29. Burns, J. M., Hall, S. & Ferry, J. L. The Absorption of Saxitoxin to Clays and Sediments
in Fresh and Saline Waters. Water Res. 43, 1899–1904 (2009).
30. Peter H. Santschi, Laodong Guo, Jay C. Means, and M. R. in Biogeochemistry of Gulf of
Mexico Estuaries 347–380 (John Wiley & Sons, Inc., 1999).
31. Wang, Y. et al. Determination of Typical Lipophilic Marine Toxins in Marine Sediments
from Three Coastal Bays of China Using Liquid Chromatography – Tandem Mass
Spectrometry after Accelerated Solvent Extraction. Mar. Pollut. Bull. 101, 954–960
(2015).
32. Hitchcock, G. L., Fourqurean, J. W., Drake, J. L., Mead, R. N. & Heil, C. a. Brevetoxin
Persistence in Sediments and Seagrass Epiphytes of East Florida Coastal Waters. Harmful
Algae 13, 89–94 (2012).
33. Magaña, H. a., Contreras, C. & Villareal, T. a. A historical Assessment of Karenia Brevis
in the Western Gulf of Mexico. Harmful Algae 2, 163–171 (2003).
34. Limoges, A., Londeix, L. & de Vernal, A. Organic-Walled Dinoflagellate Cyst
Distribution in the Gulf of Mexico. Mar. Micropaleontol. 102, 51–68 (2013).
35. Lloyd R. Snyder, Joseph J. Kirkland, J. L. G. Practical HPLC Method Development, 100-
173 (John Wiley & Sons, Inc., 1997).
36. Heemken, O. P., Theobald, N. & Wenclawiak, B. W. Comparison of ASE and SFE with
Soxhlet, Sonication, and Methanolic Saponification Extractions for the Determination of
Organic Micropollutants in Marine Particulate Matter. Anal. Chem. 69, 2171–80 (1997).
37. Pierce, R. H. et al. Brevetoxin Composition in Water and Marine Aerosol Along a Florida
Beach: Assessing Potential Human Exposure to Marine Biotoxins. Harmful Algae 4, 965–
972 (2005).
38. Mcdonald, J. D. et al. Concentration and Particle Size of Airborne Toxic Algae (

38
Brevetoxin ) Derived from Ocean Red Tide Events. 39, 3443–3449 (2005).
39. Pierce, R. H., Henry, M. S., Blum, P. C., Lyons, J., Cheng, Y. S., Yazzie, D., and Zhou, Y.
Brevetoxin Concentrations in Marine Aerosol: Human Exposure Levels During a Karenia
brevis Harmful Algal Bloom. Bull. Environ. Contam. Toxicol. 70, 161–165 (2003).
40. Sauer, P. E., Eglinton, T. I., Hayes, J. M., Schimmelmann, A., and Session, A. L.
Compound-Specific D / H Ratios of Lipid Biomarkers from Sediments as a Proxy for
Environmental and Climatic Conditions. Geochim. Cosmochim. Acta 65, 213–222 (2001).
41. Dodder, N. G., Strandberg, B., Augspurger, T. & Hites, R. A. Lipophilic Organic
Compounds in Lake Sediment and American Coot ( Fulica Americana ) Tissues , Both
Affected and Unaffected by Avian Vacuolar Myelinopathy. Sci. Total Environ. 311, 81–
89 (2003).
42. Mead, R. & Gon, M. A. A Lipid Molecular Marker Assessment of Sediments from the
Northern Gulf of Mexico Before and After the Passage of Hurricane Lili. Org. Geochem.
37, 1115–1129 (2006).
43. Plakas, S. M. et al. Confirmation of Brevetoxin Metabolism in the Eastern Oyster (
Crassostrea Virginica ) by Controlled Exposures to Pure Toxins and to Karenia Brevis
Cultures. Toxicon 40, (2002).
44. Twiner, M. J. et al. Extraction and Analysis of Lipophilic Brevetoxins from the Red Tide
Dinoflagellate Karenia Brevis. Anal. Biochem. 369, 128–35 (2007).
45. Scientific, T. F. Dionex ASE 150 Accelerated Solvent Extractor Operator’s Manual.
(2011).
46. Pawliszyn, J. Solid Phase Microextraction: Theory and Practice, 11-38, 153-158 (John
Wiley & Sons, 1997).
47. Pawliszyn, J. in Comprehensive Analytical Chemistry (eds. Forbes, P. B. C.) 824
(Elsevier Ltd, 2002).
48. Hedges, J. I. & Keil, R. G. Sedimentary Organic Matter Preservation: An Assessment and
Speculative Synthesis. Mar. Chem. 49, 81–115 (1995).
49. Annesley, T. M. Ion Suppression in Mass Spectrometry. Clin. Chem. 49, 1041–1044
(2003).
50. Lehotay, S. J. et al. Comparison of QuEChERS Sample Preparation Methods for the
Analysis of Pesticide Residues in Fruits and Vegetables. J. Chromatogr. A 1217, 2548–

39
2560 (2010).
51. Antonio Martín-Esteban, E. T. Molecularly Imprinted Polymers for Sample Preparation:
A Review. Anal. Chim. Acta 668, 87–99 (2010).
52. Controlling Contamination in UltraPerformance LC®/MS and HPLC/MS Systems.
53. Trace, E., Keep, G. & Either, G. Minimizing Contamination in Mass Spectrometry and
Proteomic Experiments.

40
Appendix A: Elemental Analysis OC Concentration Analysis
The OC concentration of the GOM and method development test sediments were
measured using an elemental analyzer (EuroVector). Each sediment sample, after having been
freeze-dried, ground, and homogenized, was weighed into open silver capsules and exposed to
12 N HCl vapor for a 12-hour period in order to remove all inorganic carbon. Following the
removal of residual water and acid by a 1-hour period at 50°C, the silver boats were sealed,
wrapped in a tin capsule, and stored in a desiccator until ready for elemental analysis. Instrument
calibration and OC concentration determination was performed in-house using a pre-calibrated
β-alanine standard while instrument stability was monitored using interspersed standard
measurements.
Appendix B: Polyethylene Glycol Contamination
Throughout the method development and optimization, a polyethylene glycol (PEG)
contaminant was discovered. Polyethylene glycols, a family of synthetic polymers that exist in a
wide range of molecular weights, are a common LC-MS system contaminant with several
potential sources, such as ESI organic solvents and glassware detergents, as well as everyday
sources external to the laboratory environment like hand creams.52 PEGs have the ability to
contaminate not only samples but also the MS instruments used for their analysis, resulting in a
loss in signal of the analyte of interest.53
The PEG contamination of the sediment extracts was detected as high intensity signals
repeating every 44 Da of the PbTx-2 and 3 mass spectra acquired for the samples, as seen in
Figure B-1. This spectral pattern, which is characteristic of PEG contamination, was observed in
several sediment extract solutions undergoing the ASE-SPME-HPLC-MS extraction method,
independent of the sediment geographic origin. As the PEG contaminant was not observed
throughout the preliminary assessment and early optimization tests of the extraction method, we
assume that it was introduced through a change in the method designed to increase brevetoxin
recovery and remove other interferences. In order to pinpoint where the introduction of PEGs
into the sample was occurring, an MS evaluation of sediment extract solutions from various steps
of the sample extraction and treatment was performed.

41
PEG contamination of the samples was found to originate from the PTFE lined vial caps
used to store samples throughout the extraction process. Although no further investigation to
pinpoint the direct source of the PEG was made, we believe that trace amounts of an ethelyne
oxide containing glass cleaning product named SparkleenTM remained trapped underneath the
PTFE liner of the caps and was introduced into the vials as they were base and solvent rinsed in
preparation for use.
Once the PEG contaminant was eliminated, the brevetoxin recovery efficiency of the
SPME sample preparation step in a solvent-only matrix increased by 13.8% and 12.8% for PbTx-
2 and 3, respectively. This increase in brevetoxin recovery suggests that the PEGs present in
solution were acting as a competitor to the brevetoxins for the fiber coating of the SPME fiber
probe. The decrease in fiber coating absorption site density available solely for the recovery of
brevetoxins in solution, as well as potential decreases in the ionization efficiency of the MS
quantification of the samples, resulted in the apparent low recovery yield of the SPME.
A large increase in the recovery efficiency upon elimination of the PEG contamination
was also observed for repeat uses of the SPME fibers. The initial assessment suggested that
SPME fibers could only be used once as the recovery efficiencies of individual SPME fibers
diminished by 45.8 ± 7.8% for PbTx-2 and 38.9 ± 1.6% for PbTx-3 upon their second use. These
recovery efficiencies were dramatically improved, with differences of only 3.11 ± 2.90% for
PbTx-2 and 1.94 ± 1.65% for PbTx-3 following the elimination of PEG contaminants, suggesting
that PEG was not only competing with the brevetoxins for absorption sites on the SPME fiber
but also that it was at least partially irreversibly retained on the fiber coating. The introduction of
PEGs to any part of the ASE-SPME-HPLC-MS extraction of brevetoxins from sediment samples
should be avoided at all costs to maximize brevetoxin recoveries and accurately quantify them in
sediment extract solutions.

42
Figure B-1: Chromatogram of PbTx-2 (Panel A) and PbTx-3 (Panel B) as well as mass spectra
of PEG contaminated sediment extract at the time of elution time of each analyte (PbTx-2 in
Panel C and PbTx-3 in Panel D).
Panel C: PbTx-2
PEG Contamination
Panel D: PbTx-3
PEG Contamination
Panel A: PbTx-2
Panel B: PbTx-3

43
Appendix C: Polypropylene Vial Use
Throughout the development of the ASE-SPME-HPLC-MS method, several vials and
vessels were used to contain and prepare the sediment extracts for final analysis, including the
stainless steel ASE extraction cell, and borosilicate glass vials among others. The choice of one
vial type in particular, the 300-µL polypropylene (PP) micro vials used for the desorption of the
SPME fiber probes, was made in an effort to minimize solvent use and ensure a high MS signal
by limiting sample dilution. An unexpected side effect of using these polypropylene vials was
the immediate decrease in the peak areas associated with PbTx-2 and PbTx-3 upon contact of
solvent-only matrix brevetoxin standard solutions. This decrease in signal occurred uniformly at
any brevetoxin concentration and took place after only 2-3 minutes of contact with the
polypropylene vials. Table C-1 shows the change in peak area associated with a brevetoxin
standard solution made in a glass vial, quantified using the HPLC-MS portion of the developed
extraction method, then transferred to a 300-µL PP vial with a burnt Pasteur pipet, and re-
analyzed. No standard solution analyzed after its contact with the PP vial resulted in peak areas
higher than 21.4 ± 0.03% for PbTx-2 and 23.3 ± 0.05% for PbTx-3 of the original peak areas
determined when the standards were contained in a glass vessel.
It is unclear what attributes of the PP micro vial are responsible for the decrease in
brevetoxin signal upon contact with standard solutions and why the phenomenon is not observed
with the use other PP materials, such as the autosampler vial inserts used. The MS scan of the
standard solution in contact with the PP micro vials revealed two high intensity peaks at 918.5
m/z for PbTx-2 and 920.5 m/z for PbTx-3, indicative of the sodiated adduct of each brevetoxin
present. An examination of solvent-only and sediment extract matrix samples having gone
through the SPME sample preparation method, where the desorption of brevetoxins from the
SPME fiber took place in the PP vials, showed no sign of these sodiated adduct signals. This
result suggests that an equilibrium based or time sensitive mechanism for the sodium adduct
formation may be taking place.
Any potential loss in signal attributed to the SPME desorption in PP vials was integrated into the
brevetoxin recoveries calculated for each individual SPME fiber during the fiber test stage, as all
fiber tests and sample SPMEs were performed with the same PP micro vials and as recoveries

44
were not significantly different for the solvent-only and sediment extract matrices. The
interaction of brevetoxins with PP materials in reference to sodium adduct formation as well as
the effect of the length of the exposure to this material require further investigation. Its effect on
the recovery efficiency of the ASE-SPME-HPLC-MS has been accounted for in this work and is
not a detriment to the ability of the method to recover and quantify brevetoxins from sediment
samples except at low brevetoxin abundances. Standard solutions analyzed after being
transferred from one glass vial to another, or after contact with the PP vial inserts and pipet tips
used throughout the method, resulted in changes in peak area of no more than 3.08% for PbTx-2
and 6.99% for PbTx-3, which is much less than the precision of the LC-MS method used.
Table C-1. Effect of 5-min contact of brevetoxins with 300-µL PP micro vials on LC-MS
quantification
Standard
Solution
Concentration
(ng/mL)
Glass Vial PP Vial PP Vial / Glass Vial
PbTx-2
Peak Area
PbTx-3
Peak Area
PbTx-2
Peak Area
PbTx-3
Peak Area
PbTx-2
Peak Area
PbTx-3
Peak Area
0.5 9.4 4.0 N/A N/A N/A N/A
1 15.3 8.5 N/A N/A N/A N/A
2 30.3 17.4 N/A N/A N/A N/A
4 67.1 36.4 11.8 5.4 0.175 0.147
8 137.2 66.8 28.9 17.0 0.211 0.254
16 249.2 139.4 63.3 38.4 0.254 0.276
32 516.7 277.9 121.6 72.3 0.235 0.260
64 1152.3 595.9 227.0 137.0 0.197 0.230
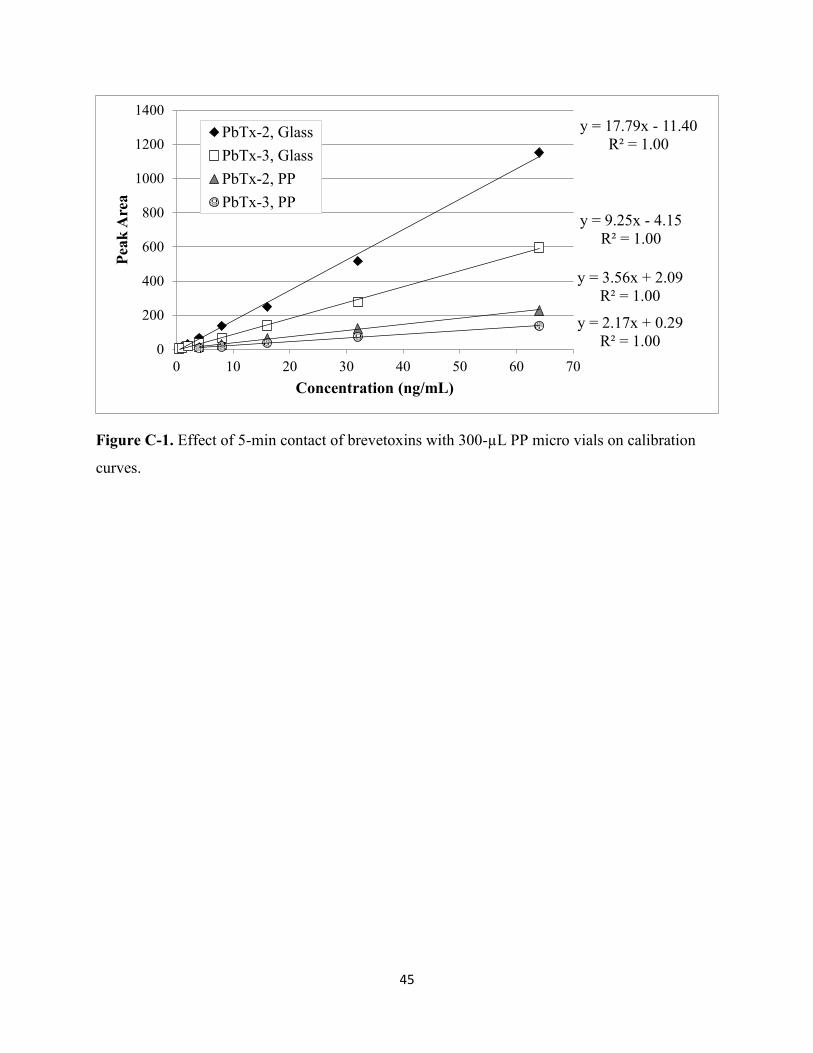
45
Figure C-1. Effect of 5-min contact of brevetoxins with 300-µL PP micro vials on calibration
curves.
y = 17.79x - 11.40
R² = 1.00
y = 9.25x - 4.15
R² = 1.00
y = 3.56x + 2.09
R² = 1.00
y = 2.17x + 0.29
R² = 1.000
200
400
600
800
1000
1200
1400
0 10 20 30 40 50 60 70
Pea
k A
rea
Concentration (ng/mL)
PbTx-2, Glass
PbTx-3, Glass
PbTx-2, PP
PbTx-3, PP