Embed Size (px)
Citation preview

RESEARCH Open Access
Development of a tool to measure person-centered maternity care in developingsettings: validation in a rural and urbanKenyan populationPatience A. Afulani1*, Nadia Diamond-Smith1, Ginger Golub2 and May Sudhinaraset1,3
Abstract
Background: Person-centered reproductive health care is recognized as critical to improving reproductive healthoutcomes. Yet, little research exists on how to operationalize it. We extend the literature in this area by developing andvalidating a tool to measure person-centered maternity care. We describe the process of developing the tool andpresent the results of psychometric analyses to assess its validity and reliability in a rural and urban setting in Kenya.
Methods: We followed standard procedures for scale development. First, we reviewed the literature to define ourconstruct and identify domains, and developed items to measure each domain. Next, we conducted expert reviews toassess content validity; and cognitive interviews with potential respondents to assess clarity, appropriateness, andrelevance of the questions. The questions were then refined and administered in surveys; and survey results used toassess construct and criterion validity and reliability.
Results: The exploratory factor analysis yielded one dominant factor in both the rural and urban settings. Three factorswith eigenvalues greater than one were identified for the rural sample and four factors identified for the urban sample.Thirty of the 38 items administered in the survey were retained based on the factors loadings and correlation betweenthe items. Twenty-five items load very well onto a single factor in both the rural and urban sample, with five itemsloading well in either the rural or urban sample, but not in both samples. These 30 items also load on three sub-scalesthat we created to measure dignified and respectful care, communication and autonomy, and supportive care. TheChronbach alpha for the main scale is greater than 0.8 in both samples, and that for the sub-scales are between 0.6and 0.8. The main scale and sub-scales are correlated with global measures of satisfaction with maternity services,suggesting criterion validity.
Conclusions: We present a 30-item scale with three sub-scales to measure person-centered maternity care. This scalehas high validity and reliability in a rural and urban setting in Kenya. Validation in additional settings is howeverneeded. This scale will facilitate measurement to improve person-centered maternity care, and subsequently improvereproductive outcomes.
Keywords: Person-centered care, Maternity care, Measurement, Validation, Developing settings, Sub-Saharan Africa, Kenya
* Correspondence: [email protected] of Medicine, University of California, San Francisco, USAFull list of author information is available at the end of the article
© The Author(s). 2017 Open Access This article is distributed under the terms of the Creative Commons Attribution 4.0International License (http://creativecommons.org/licenses/by/4.0/), which permits unrestricted use, distribution, andreproduction in any medium, provided you give appropriate credit to the original author(s) and the source, provide a link tothe Creative Commons license, and indicate if changes were made. The Creative Commons Public Domain Dedication waiver(http://creativecommons.org/publicdomain/zero/1.0/) applies to the data made available in this article, unless otherwise stated.
Afulani et al. Reproductive Health (2017) 14:118 DOI 10.1186/s12978-017-0381-7

Plain English summaryHigh maternal mortality remains a pressing problem indeveloping settings. Poor person-centered maternity carecontributes both directly and indirectly to this problem.Person-centered maternity care refers to care duringchildbirth that is respectful and responsive to individualwomen and their families’ preferences, needs, andvalues. Person-centered maternity care emphasizes thequality of patient experience. Although experts in mater-nal health recognize the importance of person-centeredmaternity care, a consistent way to measure this con-struct has not yet been developed. We hope to addressthis problem by presenting a tool to measure person-centered maternity care. In this paper, we describe theprocess of developing the tool, and the analysis to testwhether the tool measures what it is intended to meas-ure consistently. Our analysis shows that the tool thatwe developed—comprised of 30 questions—is an effect-ive tool to measure person-centered maternity care inboth rural and urban settings in Kenya. The tool in-cludes questions to measure dignity and respect, com-munication and autonomy, and supportive care. Thistool is likely useful in other developing settings, althoughmore testing is required in additional settings. The toolcan be used for research to identify the factors thataffect person-centered maternity care, as well as its con-sequences. Program planners may also use this tool toidentify which aspects of person-centered maternity careneed attention, and to assess if interventions lead to im-provements in women’s experiences during childbirth.
BackgroundDespite progress in reducing maternal mortality, devel-oping regions still account for approximately 99% of glo-bal maternal deaths, with sub-Saharan Africa accountingfor roughly 66% of these deaths [1]. Historically, limitedaccess to maternal health services has contributed sig-nificantly to adverse maternal outcomes [2–4]. However,increases in use of maternal health services over the pastdecade has not been matched with reductions in mater-nal mortality, exposing a crucial gap in quality of care[5–7]. This has increased the momentum for improvingquality of maternal and reproductive health care in thelast few years, with calls for a more comprehensive focuson quality of care—beyond provision of essential servicessolely [8–10].Recent evidence of poor treatment of women during
childbirth and related calls to action have increased at-tention on poor person-centered care during childbirthin developing settings [5, 10]. Although these calls to ac-tion utilize positive terminology such as respectful anddignified maternity care [11, 12], the terminology usedto describe the growing body of research on this topichas largely been negative, with terms like “disrespect and
abuse” [13–17], “obstetric violence” [18, 19], “dehuma-nized care” [20, 21], and “mistreatment of women” [22,23]. A landscape analysis by Bowser and Hill in 2010 de-scribed seven manifestations of disrespect and abuse ofwomen during childbirth. These included physical abuse,non-dignified care, non-consented care, non-confidentialcare, discrimination, abandonment, and detainment [14].In a mixed methods systematic review, Bohren et al.(2015) also identified seven domains of mistreatmentcommonly described in the qualitative literature, includ-ing physical abuse, sexual abuse, verbal abuse, stigmaand discrimination, failure to meet professional stan-dards of care, poor rapport between women and pro-viders, and health system conditions and constraints[22]. This review also highlighted the lack of standard-ized quantitative measures to evaluate women’s experi-ence during childbirth [22].Person-Centered Maternity Care (PCMC) highlights
respectful maternity care as part of the broader interestin person-centered care. PCMC expands the discussionbeyond poor treatment to emphasize holistic, responsive,and dignified maternity care. PCMC emphasizes experi-ence of care, and includes dimensions such as communi-cation, respect and dignity, and emotional support,which are highlighted in the World Health Organization(WHO) quality of care framework for maternal andnewborn health [24]. It is these person-centered dimen-sions that most often influence patients’ perceptions ofquality of care and satisfaction with services [25–30].Moreover, patients’ perceptions of quality of care indi-cate how well health systems meet patients’ expecta-tions, as well as their trust in the system [30, 31]. Theseperson-centered dimensions also affect clinical outcomes[32]. A recent systematic review found that patient ex-perience was positively associated with clinical effective-ness and safety in more than 75% of published studies[33]. Additionally, person-centered care affects demandfor services [34–36].There is increasing evidence of poor PCMC in Ken-
ya—potentially contributing to low facility delivery ratesand a high maternal mortality rate. In 2015, the maternalmortality ratio for Kenya was estimated to be 510 deathsper 100,000 live births [1]. The most recent KenyanDemographic and Health Survey (2014) found that 62%of women who had a baby in the previous 5 years deliv-ered in a health facility, although wide disparities exists,especially as related to socioeconomic status [37]. Forexample, approximately 25% of women with no educa-tion and 31% of women in the lowest wealth quintile de-livered in health facilities, compared to 85% of womenwith secondary or higher education and 93% amongthose in the highest wealth quintile respectively) [37].Disparities in PCMC likely contribute to these disparitiesin facility deliveries [38]. Past research in Kenya has
Afulani et al. Reproductive Health (2017) 14:118 Page 2 of 18

found that fear of receiving undignified care was one ofthe primary reasons for women choosing not to deliverin a facility [39]. Given the introduction of free mater-nity services in Kenya that reduce financial barriers toaccessing care [40], perceptions of poor PCMC may beaccounting for a larger proportion of the disparities infacility deliveries. A recent survey of women leavingpostnatal wards in Kenya found that 20% of women re-ported some form of mistreatment, primarily non-dignified care, neglect or abandonment, non-confidentialcare, and detainment for not paying fees [13]. Anotherrecent study in Kenya showed poor quality of antenataland delivery care in many facilities in Kenya, with poorwomen being more likely to receive poor quality care:only 17% of all women and 8% of poor women had ac-cess to minimally adequate delivery care [41].Poor PCMC has multiplicative effects, as it can dir-
ectly lead to poor pregnancy outcomes, in addition todecreased demand for services [5, 10, 42]. It results indelayed, inadequate, unnecessary, or harmful care, min-imizing the opportunity for health gains for bothmothers and babies [10]. PCMC therefore needs moreemphasis as a valued quality domain, as well as an indi-cator of human rights [5, 12, 11]. Despite growing evi-dence of its importance, there is a lack of consensus onhow to operationalize PCMC. Most studies on mistreat-ment of women have been qualitative [22], and the fewquantitative studies use binary measures [13, 43]. To ourknowledge, only one published study has validated a toolto measure perceptions of respectful maternity care in adeveloping setting using standard procedures for scaledevelopment including psychometric analysis [44]. With-out standardized and validated tools, the momentum be-hind measuring and improving PCMC could stagnatedue to lack of clarity in what constitutes PCMC, andhow best to target focused intervention efforts. There istherefore an urgent need to develop and validate toolsto assess PCMC that can be used across multiple de-veloping contexts. We aim to extend the literature bydeveloping and validating a person-centered maternitycare scale. This tool will have both research and pro-grammatic utility. It will be useful for research tounderstand the determinants and consequences ofpoor PCMC, and will help health programs and pro-viders to develop and target interventions. Inaddition, the tool has the potential to be used for fu-ture needs assessments, as well as monitoring andevaluation of interventions to improve PCMC.
MethodsHere we discuss the scale development and validationprocess used in this study, which took place in bothKenya and India. We focus on the Kenyan data in thispaper and where relevant, the components of the
process that took place in India are mentioned. The re-sults of the development and validation process in Indiawill be presented in a separate analysis. We used the fol-lowing standard procedures for scale development andvalidation [45, 46].
Defining the construct of person-centered maternity careand identifying domainsAs PCMC is a relatively new concept in developing set-tings, we examined bodies of work that discuss overlap-ping issues related to PCMC, though do not necessarilyuse terms such as PCMC. This includes literature fromhealth system responsiveness [47–49], perceived qualityof care [50, 51], mistreatment of women during child-birth [13, 14, 22], and the general literature on quality ofcare for maternal health [24, 28, 52–54]. In addition, weexamined the general literature on person-centered care,which is mostly from developed settings [55–58]. Al-though framed differently, these separate bodies of workinclude important aspects of PCMC.Following this review, we adopted the following defin-
ition of person-centered maternity care: “Providing ma-ternity care that is respectful and responsive toindividual women and their families’ preferences, needs,and values, and ensuring that their values guide all clin-ical decisions,” a definition from the Institute of Medi-cine [57]. PCMC includes timely and equitable care. Weidentified 10 domains of PCMC, namely:
1. Dignity and Respect2. Autonomy3. Privacy and Confidentiality4. Communication5. Social Support6. Supportive Care7. Predictability and Transparency of Payments8. Trust9. Stigma and Discrimination10.Health Facility environment
Item generationFollowing the identification of these domains, we devel-oped an item pool with questions capturing each of thedomains. Many of the questions were based on ques-tions used in existing tools addressing one or more ofthe domains of interest [13, 44, 49–51]. The first draft ofour tool contained approximately 40 items, which werestatements with 5-point response options ranging from1: “strongly agree” to 5: “strongly disagree”.
Expert reviewsThe domains and items were then evaluated through ex-pert reviews. Our internal team initially reviewed theitems individually and in several group discussions. We
Afulani et al. Reproductive Health (2017) 14:118 Page 3 of 18

then sent revised versions to other maternal health aca-demic experts to review. We received individual inputsfrom six maternal health experts outside our core team.A formal expert review was then conducted by bringingtogether eight Maternal and Child Health experts inKenya to review the items in a focus group discussionformat. These experts included academic researchers, aswell as public health and clinical practitioners with sev-eral years of experience. The meeting was held in a con-ference room at the Kenya Medical Research Institute.The expert reviews yielded suggestions for rewordingmany questions, as well as inclusion of additional ques-tions for some of the domains. Following expert review,the number of items had increased to approximately70 questions, and included multiple ways of askingthe same questions. Some expert reviewers alsostrongly recommended against using the “stronglyagree” to “strongly disagree” response format, whichhas been shown to have high acquiescence bias [59].Thus, we framed the questions in two ways for test-ing following expert reviews. An initial set had thestatements with response options in the form of“strongly disagree,” “disagree,” “neither disagree noragree,” “agree,” or “strongly agree;” while the second-ary set contained questions with frequency responsesin the form of “never”, “a few times”, “sometimes”,“most of the time”, and “all the time”.
Cognitive interviewsCognitive interviews are an integral component of scaleconstruction [60]. Cognitive interviews were conductedto improve our understanding of how participants inter-nalized the questions; assess if the questions were beinginterpreted as intended; evaluate problems with thewording of questions; evaluate whether questions werecontext appropriate and salient; and finally, to assess ap-propriate length of the tool [60–62].The initial cognitive interviews for this project were
conducted in India. Six cognitive interviews were con-ducted with women post-delivery in two government fa-cilities in Uttar Pradesh in March, 2016. Interviews wereconducted by two teams of two interviewers each, withone acting as a note taker. Respondents were eligible ifthey were between 18 and 49 years, had just delivered inthe postpartum ward, had not had a cesarean section,and felt well enough to be interviewed. Recruitment andinformed consent took place in the labor ward. Inter-views were conducted in Hindi and detailed notes weretaken by one of the research team members and thentranslated into English.Through review of the initial Indian interviews, the re-
search team learned that respondents struggled whenprovided with statements and asked to state if they“strongly disagreed,” “disagreed,” “neither disagreed nor
agreed,” “agreed”, or “strongly agreed”; a proportion ofthe respondents simply replied “sometimes” to a major-ity of the questions. Thus, all questions were changed toutilize the frequency format as suggested by our expertreviewers in Kenya. In addition, the middle response op-tion (“sometimes”) was dropped, as the majority of re-spondents frequently gravitated towards this response.While translating interviews into Swahili and Luo, theresearch team learned that the distinction between a“few times” and “sometimes” was not clear in the trans-lated versions, further supporting the need to drop themiddle category. Questions were revised following theinitial cognitive interviews to a set of approximately 60questions, and a subsequent round of cognitive inter-views were conducted with women in Kenya.The cognitive interviews in Kenya were conducted be-
tween May and June 2016 at three government healthfacilities in Kiambu County, by three female interviewerstrained in cognitive interviewing. Working closely withfacility staff, interviewers purposively identified tenwomen for the interviews. Respondents were eligible ifthey were aged 18-49 years, delivered in the preceding 7days at one of the study facilities, and felt well enoughto participate. Recruitment and written informed con-sent took place in a private space within facility groundsto ensure confidentiality. Respondents were also asked ifthe interview could be audio-recorded during the con-senting process, though this did not constitute an eligi-bility criterion. At the time of consent, respondents weregiven the option of continuing with the cognitive inter-view in a private space at the facility or having the inter-view conducted at their home within the next few days.All but one of the interviews occurred at a private spacein the health facility, and all gave consent for audio re-cording. Cognitive interviews were conducted in Englishand/or Swahili based on the respondent’s language pref-erence. Mobile phone airtime credit in the amount ofapproximately $1.50 was provided to respondents tothank them for their participation in the study. Audiorecordings were transcribed verbatim and concurrentlytranslated to English, if necessary, by independent con-sultants. Quality assurance checks were performed on alltranscripts by comparing them to the audio recordings.A cognitive interview guide developed by the research
team directed interviewers to ask how frequently aperson-centered care indicator occurred, followed by arating of the importance of the indicator, with probes tounderstand why/why not, and/or in which circumstanceeach item would be appropriate/inappropriate (e.g. beingcalled by name, being shouted at or scolded by a pro-vider, etc.).Respondents were also asked if they found the ques-
tions difficult to understand, and if so, how they thoughtthe question could be improved. Probes included: How
Afulani et al. Reproductive Health (2017) 14:118 Page 4 of 18

did you arrive at that answer? Was this question difficultfor you to answer? How would you rephrase this ques-tion to make it better? When a question was framed inmultiple ways, respondents were asked which of thequestions they preferred with regard to ease ofunderstanding.The research team then examined the distribution of
responses as well as the ratings of their importance.Transcripts were reviewed to identify ambiguous or con-fusing questions, and responses to as to why respon-dents answered the way they did. Following theseanalyses, questions that did not work well in the cogni-tive interviews were removed and those that seemed un-clear revised. This exercise reduced the number of itemsto 38, with each question containing a 4-point responsescale: “no, never”, “yes, a few times”, “yes, most of thetime” and “yes, all the time.” In addition, responses fortwo questions on verbal and physical abuse were chan-ged to (“no never”, “yes, once,” “yes, a few times”, and“yes, many times”) to account for the low prevalence ofovert abuse, while retaining the same scale as the otherresponses options. A “not applicable” response optionwas added to questions where the cognitive interviewsrevealed that the question might not be relevant to allrespondents. Revised items were then pretested with thefull questionnaire among a convenience sample of about39 women in the participating facilities. Final revisionswere then made, although minor at this point in the re-finement process.
TranslationThe translation of the tool was an iterative process,starting before the cognitive interviews and continuinguntil the version used in the survey was finalized. Werecognized that nuances in language could affect themeaning of the questions, and some of the words in theEnglish version may not have words in the local lan-guages that directly translated to how they were used inEnglish. To handle this, we spent a substantial amountof time during training of field officers to ensure thatquestions had the same meaning, even if the words usedwere a bit more colloquial. The tool was first translatedinto Swahili by someone who could speak both Englishand Swahili. During training of the field officers for thecognitive interviews, additional changes were made tothe translated versions based on input from the field of-ficers who spoke both English and Swahili. An exampleis the use the slang phrase, “kitu kidogo”, directly trans-lating to something small, instead of bribe which we ori-ginally used. Field officers suggested we use this phrasefor bribe as this is how it was best understood by Ken-yans. The Luo translation went through a similar processof discussing the questions with the field officers duringtheir training for the surveys. The final translated
versions were based on consensus with the field team.Given the group input of multiple local languagespeakers to the tool, we believe the questions in the dif-ferent languages were similar in meaning.
SurveyThe final set of items was administered as part of twoseparate surveys in Kenya: in a rural setting and anurban setting.
Rural sampleIn Migori County, a predominantly rural county in west-ern Kenya, a survey was conducted in August and Sep-tember 2016. The sample was comprised of women whodelivered in the 9 weeks preceding the survey in theCounty. Women were recruited at health facilities (inthe delivery wards and postnatal clinics), and in theirhomes. A multistage sampling approach was used to se-lect women. First, the county was divided into 8 stratabased on the 8 sub-counties in the county. All healthunits in each stratum were then identified and10 healthunits randomly selected. Within each selected healthunit, women who delivered in the preceding 9 weekswere identified with the help of the Community HealthVolunteer assigned to that health unit. The target was toconduct approximately 200 interviews in each sub-county. The first 20 eligible women in each health unitwho were available were interviewed. If the target wasnot met after interviews in all the selected health unitswere completed, more health units in that sub-countywere sampled. Twelve trained data collectors conductedthe interviews, with one interviewer from each sub-county and an additional interviewer in the four largersub-counties. The interviews were conducted in English,Swahili, and Luo in private spaces in health facilities orin the homes of the respondents. All participants pro-vided written informed consent after receiving informa-tion about the research. They were given a gift of 200Kenyan shillings (~$2). The majority of data was col-lected using the RedCap application, with data uploadeddirectly online. In instances where the Internet connec-tion was poor, the interviews were entered on paper andtransferred to RedCap when the data collector reached aplace with better connectivity. Quality assurance checkswere performed throughout the data collection. A totalof 1052 women were interviewed, with a response rateabove 98%. We performed psychometric analysis usingdata from women who delivered in a health facility (877)and who had complete information on all the items(N = 857).
Urban sampleA second survey was conducted from August throughDecember 2016 at seven government health facilities in
Afulani et al. Reproductive Health (2017) 14:118 Page 5 of 18

Nairobi and Kiambu Counties using the same PCMCtool. Nairobi is the National capital of Kenya and is100% urban. Kiambu County is 60% urban, but our sam-ple was drawn from the urban portions of the county[63]. The sample was comprised of women who deliv-ered within a week of the survey in any of the seven par-ticipating health facilities. The post-partum length isshorter here because this was the target group for thisproject, and we did not have the flexibility of changingthis sample. Six trained interviewers conducted the in-terviews. Respondents were identified with the help ofhealth of facility staff and invited to participate in thesurvey. Recruitment and consenting took place in a pri-vate space within facility grounds, and respondents weregiven the option of continuing with the interview in aprivate space at the facility or having the interview attheir home within the next few days. All but three of theinterviews occurred at a private space in the health facil-ity. Interviews were conducted in English and/or Swahili.All participants provided written informed consent afterreceiving information about the research. Respondentswere given mobile phone airtime worth approximately$1.50 in appreciation of their participation. Interviewswere conducted using the SurveyCTO platform, withdata uploaded to the server at the end of each day. Qual-ity assurance checks were performed throughout thedata collection. A total of 531 women were interviewed.We performed the psychometric analysis using datafrom women who had complete information on all theitems (N = 530).
Psychometric analysesWe first examined the distributions of all the items,comparing the two samples. In instances where ques-tions had responses in the “not applicable” category, wedecided to convert the “not applicable” category into thehighest category to obtain a uniform scale for the psy-chometric analysis. This approach is conservative as itassumes the highest quality rating for each “not applic-able” response. For example, for the question on laborsupport, we assume that someone who said “they didnot want a support person” would have been allowedone if they so desired. We reverse coded negative itemsin order for responses to reflect a scale of 0 as the lowestlevel to 3 as the highest level. We then constructed acorrelation matrix to examine the correlations amongthe items.We conducted the psychometric analysis to assess the
validity and reliability of the tool. Validity is the degreeto which the items in a survey tool measure thephenomenon or construct it is intended to measure [64].Common types of validity that need to be considered inscale development are content, construct, and criterionrelated validity [46]. Content validity assesses whether
the items represent all possible indicators relevant to theconstruct [46]. We assured content validity through acomprehensive literature search to develop a definitionfor the construct, to identify related domains based onempirical research and theory, and then developingitems that represent each domain identified. The expertreviews were also used to optimize content validity.Construct validity is the degree to which a measure re-
lates to other measures in theoretically predictable ways,or how well the items represent the underlying concep-tual structure [46, 64]. Factor analysis is an importantstep in psychometric analysis. It is used to examine theinterrelationships among a set of variables, thus, can beused to assess construct validity. Factor analysis is also adata reduction method used to re-express data on mul-tiple variables with fewer dimensions and to reduce a setof observed variables to a smaller, more parsimoniousset of variables [45, 46, 65]. We conducted exploratoryfactor analysis using principal factoring. We used theKaiser-Meyer-Olkin (KMO) measure of sampling ad-equacy to assess if the variables were suitable for factoranalysis. The KMO measure has values between 0 and 1,with small values indicating that overall, the variableshave little in common to warrant a principal compo-nents analysis. Values above 0.5 are considered satisfac-tory for factor analysis [66]. We used a KMO value of0.5 as the criterion for sampling adequacy.The factor analysis was an iterative process. First, we
conducted the factor analysis for the rural and urbansamples separately, and also with the combined sample.We then examined the Eigenvalues (the amount of infor-mation captured by a factor) and scree plots (plots of Ei-genvalues) to determine the number of factors toextract. We used both Kaiser’s rule of retaining only fac-tors with eigenvalues exceeding unity and the “break” inthe scree plot to decide on how many factors to retain[45, 46, 65]. We then conducted subsequent factor ana-lysis and examined the item loadings to determine whichitems to retain or delete. Item loading is the degrees towhich the original item scores correlate with the compo-nents. We used a cut off of 0.3 at the initial stage [67].Items that did not have a loading of 0.3 or higher on anyof the extracted factors in the 3 samples were thusdropped after the first set of factor analysis. Furtherrounds of factor analysis were conducted to decide onthe final set of items and sub-scales. In these subsequentstages, the cut off for deletion was varied based on thetheoretical importance of the item.Factor rotations are used to simplify the interoperabil-
ity of factor solutions and to facilitate the interpretationof the results [66]. Orthogonal rotation preserves theperpendicularity of the rotated components and assumesthe factors are uncorrelated. Oblique rotation, however,allows for correlation between the rotated factors and
Afulani et al. Reproductive Health (2017) 14:118 Page 6 of 18
aligns the factor axes as closely as possible to the groupsof the original variables [45, 60, 66]. As the PCMC do-mains were theoretically related and the extracted compo-nents were correlated, we used oblique rotation. Wetested our final factor structure in confirmatory factoranalysis with various samples stratified by setting, locationof interview, postpartum length, age of respondent, andeducational level of respondent. We also examined thePearson correlation coefficient between the componentsidentified by factor analysis to assess construct validity.Criterion-related validity refers to whether the meas-
ure is related to other measures or outcomes in theoret-ically predictable ways [46, 64]. One approach todetermining criterion validity is through hypothesis test-ing [67]. Consistent with other work we hypothesizedthat the PCMC scale would be correlated with globalmeasures of satisfaction with care and quality of care[28, 44]. We tested this by regressing the main scale andsub-scales on women’s ratings of their satisfaction withthe services, the quality of care they received during de-livery, and whether she would deliver in the same facilityif she were to have another baby.Reliability refers to the degree to which a measure-
ment tool produces stable and consistent results [46].For a measure to be valid, it must also be reliable, but areliable measure may not necessarily be valid [64]. Weassessed the internal consistency reliability using Cron-bach’s alpha. Cronbach’s alpha ranges from 0 to 1.Higher score imply greater reliability; with 0.7 or highergenerally considered sufficient evidence of reliability[45]. An extremely high alpha (>0.95) might howeversuggest redundancy among some indicators [46]. Reli-ability across settings was also examined by testing forthe difference between scores in the rural and urbansample. We used STATA version 14 to perform the stat-istical analyses.
ResultsTable 1 shows the demographic characteristics of re-spondents for the urban and rural samples. The averageage is about 25 years for the rural sample, and 26 yearsfor the urban sample. Approximately 79% of the womenin the rural sample are married, compared to 72% forthe urban sample. Women in the urban sample areslightly more educated than those in the rural sample.Close to 40% of the interviews in the rural sample oc-curred at a health facility, as compared to all the inter-views in the urban sample. The postpartum length forwomen interviewed in the rural sample is distributed be-tween zero and 9 weeks. Only women less than a weekpostpartum were interviewed in the urban sample.Table 2 shows the original domains, the questions for
each domain, and comments on decisions taken relatedto that item. The distributions for the items are shown
in Additional file 1: Appendix 1. With few exceptions,the responses generally ranged between 0 and 3. Not-ably, the responses for the labor and delivery supportquestions in the urban sample had a large proportion ofresponses in the “not applicable” category. Over 40% ofrespondents in the urban sample did not want a supportperson during labor or delivery. This category wasrecoded into the “all the time” category for the psycho-metric analysis and likely has implications for the factorstructure obtained for the urban sample.There is good correlation among the majority of items,
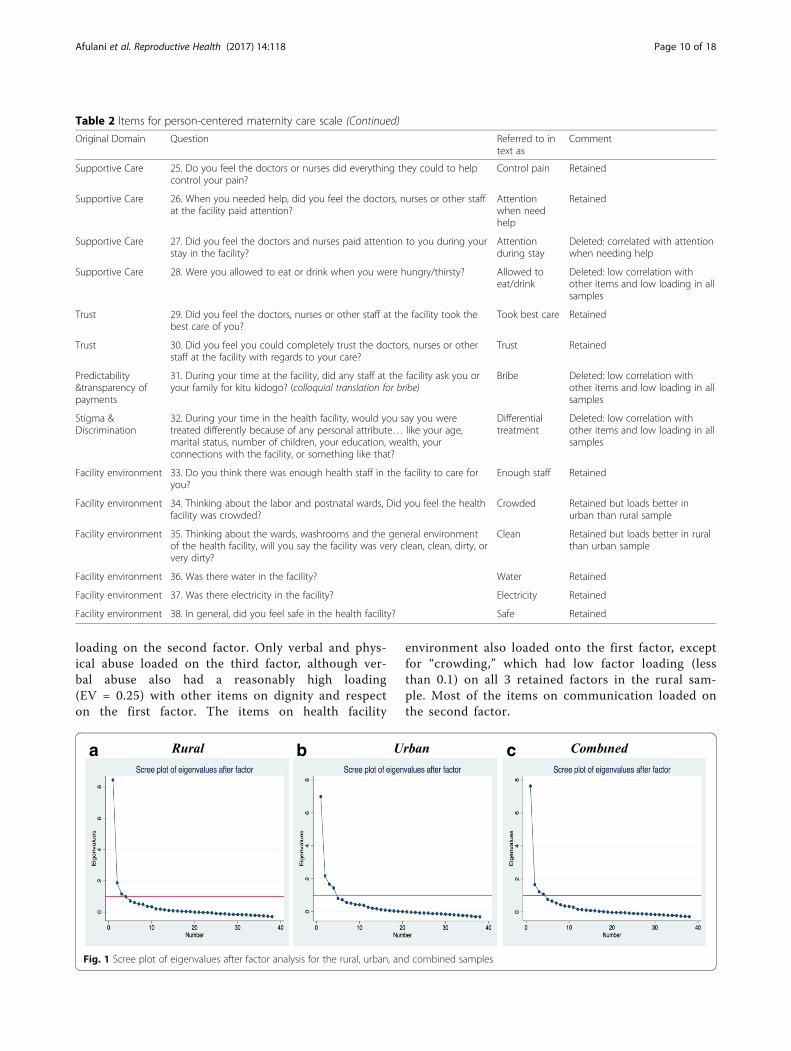
with correlations between 0.2 and 0.8. None of the itemshad correlations >0.8. Five items had correlations of <0.2with all other items. The KMO measure of sampling ad-equacy for all items are greater than 0.5, with an overallKMO of 0.91, indicating that overall the variables aresatisfactory for factor analysis. The initial exploratoryfactor analysis yielded 3 factors with eigenvalues ofgreater than one for the rural sample, accounting for84% of the variance among the items. For the urbansample, the exploratory factor analysis yielded four fac-tors with eigenvalues of greater than one accounting for86% of the variance. When the two samples were com-bined, we had four factors with eigenvalues of greaterthan one, accounting for 91% of the variance. When weexamine the difference in eigenvalues between the fac-tors and scree plots (Fig. 1a, b and c) for each sample,we find that even though there are three or four factorswith eigenvalues of more than one, there is one domin-ant factor in all samples. This means that depending onwhich criteria we use for factor extraction, we couldhave three or four sub-scales or just one unified scale.In the next stage of the analysis we retained only items
that had factor loadings of greater than 0.3 on the fac-tors with eigenvalues >1 (in any of the 3 samples). Wedropped 5 items (see Table 2) based on this criterion.These items also had low correlations with the rest ofthe items in the correlation matrix. To further reducethe number of items, we again examined the correlationsamong the remaining items to identify items that wereconceptually very similar (but only reasonably correlated(i.e. r > 0.6) and so not excluded based purely on theircorrelation). Three more items were dropped, with a de-cision made on which of the correlated items to dropbased on theoretical considerations. For example, theitem on whether providers “showed they cared” was cor-related with both “treated with respect” and “treated in afriendly manner,” thus was dropped. “Being asked aboutpain” was correlated with “control of pain” and “beingasked about feelings”, thus “being asked about pain” wasdropped and “control of pain” and “being asked aboutfeelings” were retained, as these items were moreencompassing. Additionally, “paid attention during stay”and “paid attention when they needed help” were
Afulani et al. Reproductive Health (2017) 14:118 Page 7 of 18

correlated; therefore “paid attention during stay” was de-leted, as it was less specific. Items deleted and the ratio-nales for deletion are shown in Table 2. Thirty itemsremained after this process, including items from all ofthe original domains, with the exception of discrimin-ation and transparency and predictability of payments.Another round of factor analysis with the 30 items
yielded two factors with eigenvalues greater than 1 forthe rural sample and four factors for the urban sample.When the point of the “break” in the scree plot was usedas the criteria for factor extraction, it suggested one sin-gle underlying factor structure for both samples. Thus,we ran another set of factor analysis retaining only onefactor for all the samples with the remaining 30 items.Loadings of the items onto this factor were each >0.2,with the exception of the following: “Physical abuse”loaded at less than 0.2 on both samples; “position ofchoice”, “delivery support”, and “crowding” loaded at lessthan 0.2 in the rural sample; and “provider introduceself” and “called by name” loaded at less than 0.2 in the
urban sample (shown on Table 3). In the combined sam-ple, the items with low loadings on the single factor were“provider introduce self”, “physical abuse”, “position ofchoice”, “delivery support”, and “crowding.” This sug-gests that one unified person-centered maternity carescale could be constructed, with between 24 and 30items, depending on whether we used a purely statisticalcriterion and dropped all items with low loadings or in-cluded with low loadings based on theoretical relevance.On the other hand, if we used Kaiser’s rule of retaining
factors with eigenvalues exceeding unity, then we wouldhave had between 2 and 4 factors (or sub-scales) makingup our PCMC scale. To assess this, we conducted an-other set of factor analysis with the 30 items, retaining 3factors for each sample. In the rural sample, all items ex-cept those on verbal and physical abuse load onto to thefirst two factors, with the more subjective measures (e.g.“treated with respect”, “treated in friendly manner”)tending to load on the first factor and the less subjective(e.g. “providers introduce themselves”, “called by name”)
Table 1 Distribution of selected demographic variables
Rural Urban Total
No. % No. % No. %
Age: Mean (SD) 857 25.0 (5.9) 530 25.6 (4.8) 1387 25.2 (5.5)
Parity: Mean (SD) 856 2.8 (2.0) 530 2.1 (1.1) 1386 2.5 (1.7)
Marital status
Single 136 16 61 12 197 14
Partnered/Cohabiting 3 0 75 14 78 6
Married 676 79 382 72 1058 76
Widowed 32 4 1 0 33 2
Divorced/Separated 10 1 11 2 21 2
Highest grade completed
Primary or less 483 56 204 39 687 50
Post-primary/Vocational/Secondary 265 31 241 46 506 37
College or above 109 13 85 16 194 14
Literacy: reading
No, cannot read 36 4 2 0 38 3
Yes, but with some difficulty 127 15 33 6 160 12
Yes, Very well 694 81 495 93 1189 86
Literacy: writing
No, cannot write 30 4 3 1 33 2
Yes, but with some difficulty 140 16 29 6 169 12
Yes, Very well 687 80 498 94 1185 85
Interview language a
English 108 13 257 48 365 26
Swahili 254 30 274 52 529 38
Luo 495 58 495 36
Total 857 100 530 100 1387 100a For the urban sample this is the language the consent was completed in. The interview language was not specified
Afulani et al. Reproductive Health (2017) 14:118 Page 8 of 18

Table 2 Items for person-centered maternity care scale
Original Domain Question Referred to intext as
Comment
Dignity/Respect 1. How did you feel about the amount of time you waited? Would yousay it was very short, just a little long, somewhat long, or very long?
Time to care Retained
Dignity/Respect 2. During your time in the health facility did the doctors, nurses, or otherhealth care providers introduce themselves to you when they first cameto see you?
Introduce self Retained but loads better in ruralthan urban sample
Dignity/Respect 3. Did the doctors, nurses, or other health care providers call you by yourname?
Called byname
Retained but loads better in ruralthan urban sample
Dignity/Respect 4. Did the doctors, nurses, or other staff at the facility treat you withrespect?
Treated withrespect
Retained
Dignity/Respect 5. Did the doctors, nurses, and other staff at the facility treat you in afriendly manner?
Friendly Retained
Dignity/Respect 6. Did the doctors, nurses, and other staff at the facility show they caredfor you?
Show cared Deleted: correlated with friendlyand respect
Dignity/Respect 7. Did you feel the doctors, nurses, or other health providers shouted atyou, scolded, insulted, threatened, or talked to you rudely?
Verbal abuse Retained
Dignity/Respect 8. Did you feel like you were treated roughly like pushed, beaten, slapped,pinched, physically restrained, or gagged?
Physical abuse Retained but loads better in ruralthan urban sample
Dignity/Respect 9. Did you feel like you were forced to stay at the health facility againstyour will because you could not pay your bill?
Stay againstwill
Deleted: low correlation withother items and low loading in allsamples
Privacy/Confidentiality
10. When you were speaking to the doctors, nurses or other staff at thefacility, did you feel other people not involved in your care could hearwhat you were discussing?
Auditoryprivacy
Deleted: low correlation withother items and low loading in allsamples
Privacy/Confidentiality
11. During examinations in the labor room, were you covered up with acloth or blanket or screened with a curtain so that you did not feelexposed?
Visual privacy Retained
Privacy/Confidentiality
12. Do you feel like your health information was or will be keptconfidential at this facility?
Recordconfidentiality
Retained
Autonomy 13. Did you feel like the doctors, nurses or other staff at the facilityinvolved you in decisions about your care?
Involvement incare
Retained
Autonomy 14. Did the doctors, nurses or other staff at the facility ask yourpermission/consent before doing procedures and examinations on you?
Consent toprocedures/exams
Retained
Autonomy 15. During the delivery, do you feel like you were able to be in theposition of your choice?
Deliverypositionchoice
Retained but loads better inurban than rural sample
Communication 16. Did the doctors, nurses or other staff at the facility speak to you in alanguage you could understand?
Language Retained
Communication 17. Did the doctors and nurses explain to you why they were doingexaminations or procedures on you?
Explain exams/procedures
Retained
Communication 18. Did the doctors and nurses explain to you why they were giving youany medicine?
Explainmedicines
Retained
Communication 19. Did you feel you could ask the doctors, nurses or other staff at thefacility any questions you had?
Able to askquestions
Retained
Social Support 20. Were you allowed to have someone you wanted (outside of staff atthe facility, such as family or friends) to stay with you during labor?
Labor support Retained
Social Support 21. Were you allowed to have someone you wanted to stay with youduring delivery?
Deliverysupport
Retained but loads better inurban than rural sample
Supportive Care 22. Did the doctors and nurses at the facility talk to you about how youwere feeling?
Talk aboutfeeling
Retained
Supportive Care 23. Did the doctors, nurses or other staff at the facility support youranxieties and fears?
Supportanxiety
Retained
Supportive Care 24. Did the doctors and nurses ask how much pain you were in? Ask about pain Deleted: correlated with controlpain and ask about feeling
Afulani et al. Reproductive Health (2017) 14:118 Page 9 of 18
loading on the second factor. Only verbal and phys-ical abuse loaded on the third factor, although ver-bal abuse also had a reasonably high loading(EV = 0.25) with other items on dignity and respecton the first factor. The items on health facility
environment also loaded onto the first factor, exceptfor “crowding,” which had low factor loading (lessthan 0.1) on all 3 retained factors in the rural sam-ple. Most of the items on communication loaded onthe second factor.
Table 2 Items for person-centered maternity care scale (Continued)
Original Domain Question Referred to intext as
Comment
Supportive Care 25. Do you feel the doctors or nurses did everything they could to helpcontrol your pain?
Control pain Retained
Supportive Care 26. When you needed help, did you feel the doctors, nurses or other staffat the facility paid attention?
Attentionwhen needhelp
Retained
Supportive Care 27. Did you feel the doctors and nurses paid attention to you during yourstay in the facility?
Attentionduring stay
Deleted: correlated with attentionwhen needing help
Supportive Care 28. Were you allowed to eat or drink when you were hungry/thirsty? Allowed toeat/drink
Deleted: low correlation withother items and low loading in allsamples
Trust 29. Did you feel the doctors, nurses or other staff at the facility took thebest care of you?
Took best care Retained
Trust 30. Did you feel you could completely trust the doctors, nurses or otherstaff at the facility with regards to your care?
Trust Retained
Predictability&transparency ofpayments
31. During your time at the facility, did any staff at the facility ask you oryour family for kitu kidogo? (colloquial translation for bribe)
Bribe Deleted: low correlation withother items and low loading in allsamples
Stigma &Discrimination
32. During your time in the health facility, would you say you weretreated differently because of any personal attribute… like your age,marital status, number of children, your education, wealth, yourconnections with the facility, or something like that?
Differentialtreatment
Deleted: low correlation withother items and low loading in allsamples
Facility environment 33. Do you think there was enough health staff in the facility to care foryou?
Enough staff Retained
Facility environment 34. Thinking about the labor and postnatal wards, Did you feel the healthfacility was crowded?
Crowded Retained but loads better inurban than rural sample
Facility environment 35. Thinking about the wards, washrooms and the general environmentof the health facility, will you say the facility was very clean, clean, dirty, orvery dirty?
Clean Retained but loads better in ruralthan urban sample
Facility environment 36. Was there water in the facility? Water Retained
Facility environment 37. Was there electricity in the facility? Electricity Retained
Facility environment 38. In general, did you feel safe in the health facility? Safe Retained
a b c
Fig. 1 Scree plot of eigenvalues after factor analysis for the rural, urban, and combined samples
Afulani et al. Reproductive Health (2017) 14:118 Page 10 of 18

For the urban sample, however, only “labor and deliv-ery support” and “position of choice” questions loadedonto the third factor, with most of the communicationand autonomy related items loading on first factor andthe rest on the second factor. Verbal abuse loaded onthe first factor with the other items on dignity and re-spect, and physical abuse did not load on any of theretained factors in the urban sample. “Crowding” loadedwith the other health facility environment items in theurban sample. A few items also loaded on more thanone factor. We decided not to use cross loading as a solecriterion for item deletion at this stage. Instead, the dis-tribution of the items, theoretical rationale, and the
judgment of the study team was used [44]. If an itemcross-loaded on more than one factor, the item wasretained in the factor it loaded highest on. The differ-ence in factor loadings was greater than 0.1 in mostcases, which was judged sufficient to warrant thisapproach.The factor analysis thus suggested a unified scale with
possibility of 3 sub-scales based on the factors extracted.However, because the factors extracted included a mixof items from each of the original domains, it was diffi-cult to ascertain what each factor represented conceptu-ally. We therefore decided to regroup the retained itemsinto 3 sub-scales based on the factor loadings and con-ceptual domains drawn from the experience of care cat-egories in the WHO quality of care framework formaternal and newborn care. We created sub-scales for:Dignity and Respect (DR), Communication and Auton-omy (CA), and Supportive Care (SC). We then con-ducted factor analysis with the items in each of thesegroups, in an iterative process, moving items that didnot load in their assigned group until each loaded wellwith a group. We considered having a separate sub-scalefor the items related to health facility environment(HFE), as they seemed conceptually distinct from theother items focused on interpersonal interactions. Butwe decided against a separate HFE sub-scale because ithad low reliability as a subscale. We decided to retainthese items in the SC sub-scale because they are neededto provide supportive care, and most of them loadedwell with other items in that group. Each sub-scaleyielded one factor, with most items loading reasonablewell onto the extracted factor.As shown in Table 4, the factor loadings were at least
0.2, with most greater than 0.40. The exceptions were“physical abuse,” “called by name,” “delivery support,”“crowding,” and “cleanliness,” which had loadings of lessthan 0.2 on their sub-scales. Of note, “cleanliness” had anegative loading on the SC sub-scale in the urban sam-ple. We considered cleanliness might be more represen-tative of dignity and respect, thus, we run the factoranalysis retaining this item in the DR sub-scale. But itloaded negatively on the DR sub-scale for the urbansample. Factor loadings for cleanliness on the SC sub-scale were slightly higher than that on DR sub-scale inthe rural and combined samples. Furthermore, with theconfirmatory factor analysis utilizing the combined sam-ple, the coefficient for cleanliness was significant(p < 0.05) in the SC sub-scale, but not in the DR sub-scale. Therefore, we maintained cleanliness in the SCsub-scale. The coefficients for all the other items weresignificant in the confirmatory factor analysis.The factor analysis using the full sample, as well as for
samples stratified by setting, place of interview, postpar-tum length, age, and education, yielded similar results
Table 3 Rotated factor loadings of items on dominant factorfor main scale
Rural Urban Combined
Variable Rotated factor loading
1. Time to care 0.39 0.26 0.32
2. Introduce self 0.21 0.12 0.19
3. Called by name 0.59 0.17 0.44
4. Treated with respect 0.70 0.67 0.69
5. Friendly 0.65 0.68 0.66
6. Verbal abuse 0.18 0.39 0.26
7. Physical abuse 0.11 0.06 0.10
8. Visual privacy 0.49 0.36 0.43
9. Record confidentiality 0.53 0.52 0.52
10. Involvement in care 0.59 0.44 0.52
11. Consent to procedures/exams 0.61 0.49 0.56
12. Delivery position choice 0.06 0.35 0.15
13. Language 0.46 0.35 0.42
14. Explain exams/procedures 0.66 0.53 0.61
15. Explain medicines 0.49 0.34 0.43
16. Able to ask questions 0.58 0.48 0.54
17. Labor support 0.33 0.35 0.31
18. Delivery support 0.05 0.34 0.14
19. Talk about feeling 0.59 0.47 0.55
20. Support anxiety 0.45 0.30 0.39
21. Attention when need help 0.66 0.64 0.65
22. Took best care 0.67 0.66 0.67
23. Control pain 0.38 0.40 0.39
24. Trust 0.65 0.63 0.64
25. Clean 0.25 0.36 0.28
26. Safe 0.55 0.59 0.56
27. Enough staff 0.55 0.42 0.51
28. Crowded 0.06 0.21 0.11
29. Water 0.45 0.28 0.39
30. Electricity 0.40 0.32 0.36
Afulani et al. Reproductive Health (2017) 14:118 Page 11 of 18

(results not shown) with “physical abuse,” “delivery pos-ition choice,” “delivery support person,” “crowding,” and“cleanliness” being the only items that did not consist-ently have factor loadings of >0.2 in all the samples.Therefore, as with the main scale, if we were to decideon the scale based purely on the statistical analysis, these5 items would be dropped to have 25-items that workreasonably well in both rural and urban settings. How-ever, given the theoretical significance of these items andthat some loaded relatively well in one sample but not
the other, we have decided to retain them in the currentversion of the scale to be tested in future validationstudies. The sub-scales are strongly correlated with eachother, with correlation coefficients (r) ranging from 0.53to 0.63, and with the main scale (r = 0.75, 0.86, and 0.9for DR, CA, and SC respectively).The full 30-item PCMC scale has good internal
consistency reliability, with Cronbach’s alpha of 0.88 forthe rural sample, 0.83 for the urban sample, and 0.86 forthe combined sample. Dropping “physical abuse,” “deliv-ery position choice,” “delivery support person,” and“crowding” only marginally increased the alphas to 0.89and 0.87 for the rural and combined samples respect-ively. The alpha for the urban sample does not changedue to dropping these items. The Cronbach’s alphas forthe sub-scales for Dignity and Respect, Communicationand Autonomy, and Supportive Care for both the ruralsample and urban samples are within acceptable rangesfrom 0.6 to 0.8 (Table 5). Dropping “physical abuse”marginally increases the alpha for the DR sub-scale to0.67 for the rural sample and to 0.64 for the urban scale.Dropping “delivery position choice” increases the alphafor CA sub-scale for the rural sample to 0.80 and mar-ginally decreases that for the urban sample to 0.61.Dropping “delivery support,” “crowding,” and “cleanli-ness” increases the alpha for SC sub-scale for the ruralsample to 0.79 and decreases that for the urban sampleto 0.69. Thus, improving reliability is not a compellingreason for dropping these items.The mean PCMC score (based on the sum of all the
items in the scale) for the rural sample is 59.5 (SD = 13.6)with a range of 21 to 90, and that for the urban sample
Table 4 Rotated factor loadings on dominant factor for sub-scales
Rural Urban Combined
Sub-scale Item Rotated factor loading
Dignity and respect
Treated with respect 0.79 0.77 0.78
Friendly 0.79 0.80 0.80
Verbal abuse 0.34 0.44 0.39
Physical abuse 0.22 0.10 0.18
Visual privacy 0.42 0.30 0.36
Record confidentiality 0.47 0.48 0.45
Communication and autonomy
Introduce self 0.24 0.20 0.23
Called by name 0.59 0.17 0.43
Involvement in care 0.66 0.39 0.58
Consent to procedures 0.75 0.61 0.67
Delivery position choice 0.13 0.38 0.22
Language 0.37 0.32 0.36
Explain exams/ procedures 0.77 0.67 0.73
Explain medicines 0.57 0.42 0.51
Able to ask questions 0.59 0.40 0.53
Supportive Care
Time to care 0.38 0.28 0.31
Labor support 0.28 0.43 0.29
Delivery support 0.01 0.42 0.12
Talk about feeling 0.54 0.41 0.50
Support anxiety 0.40 0.32 0.35
Attention when need help 0.67 0.61 0.65
Took best care 0.74 0.68 0.73
Control pain 0.39 0.35 0.39
Trust 0.72 0.66 0.70
Enough staff 0.59 0.44 0.53
Crowded 0.05 0.26 0.12
Clean 0.27 −0.36 0.07
Water 0.51 0.32 0.45
Electricity 0.43 0.30 0.38
Safe 0.62 0.62 0.63
Table 5 Reliability and distribution of Full PCMC scale and sub-scales
Alpha Mean SD Min Max
Rural
Full PCMC Scale 0.88 59.5 13.6 21.0 90.0
Dignity and respect 0.66 15.1 2.9 3.0 18.0
Communication and autonomy 0.78 13.9 5.9 1.0 27.0
Supportive Care 0.75 30.5 6.8 8.0 45.0
Urban
Full PCMC Scale 0.83 60.2 12.3 22.0 86.0
Dignity and respect 0.61 14.4 2.9 3.0 18.0
Communication and autonomy 0.62 15.1 4.7 3.0 26.0
Supportive Care 0.72 30.4 6.5 10.0 44.0
Combined
Full PCMC Scale 0.86 59.8 13.1 21.0 90.0
Dignity and respect 0.63 14.8 2.9 3.0 18.0
Communication and autonomy 0.73 14.4 5.5 1.0 27.0
Supportive Care 0.72 30.5 6.7 8.0 45.0
Afulani et al. Reproductive Health (2017) 14:118 Page 12 of 18

is 60.2 (SD = 12.3), with a range of 22 to 86. The differ-ence is not significant (p = 0.85). The means for the sub-scales are also shown in Table 5. The differences be-tween the means for the rural and urban samples aresignificant (p < 0.001) for DR and CA, although not forSC.The regression of each of the sub-scales and the full
scale on patients’ ratings of satisfaction with services,general quality ratings, and whether the woman woulddeliver in the same facility if she were to have anotherbaby shows the sub-scales are individually and collect-ively correlated with the global measures of satisfactionand quality of care, which suggests high criterion valid-ity. Table 6 shows the bivariate linear regressions forthese global measures on the PCMC scale (reversed forease of interpretation and to show graded increase inglobal measures with increasing PCMC scores).
DiscussionThe World Health Organization includes women’s expe-riences of care and person-centered outcomes as pri-mary components in their quality of care framework formaternal and newborn health [24]. There is however noconsensus on how to measure these constructs. We de-scribe the process of developing and validating a scale tomeasure person-centered maternity care. We present a30-item scale that can be used to measure women’s per-ceptions of person-centered care during labor and
delivery, and show that it is has high validity and reliabil-ity in both rural and urban settings in Kenya. The scalehas high content validity based on our extensive litera-ture and expert reviews. The exploratory factor analysissuggests high construct validity—the items measure anunderlying construct, which we believe to be PCMCbased on the content validity. It also has high criterionvalidity, being strongly correlated with global measuresof satisfaction and quality of maternity care. In addition,it has high internal reliability, with an alpha well abovethe recommended level of 0.7. There currently is nogold-standard tool in this area of work, hence we are un-able to test the performance of the PCMC tool against agold standard. We present the 30-item scale with threesub-scales for “Dignity and respect,” “Communicationand autonomy,” and “Supportive care.” These sub-scalesalso have good content, construct, and criterion validity,with reliability within acceptable ranges of 0.6 to 0.8.We used DeVellis’ guidelines in scale development,
which include use of theory, specificity of measures, andchoosing items that reflect the purpose of the scale toguide items to include [46, 68]. As our goal was to de-velop a theory based but practical PCMC scale that canbe easily administered in various contexts, we decided toinclude five items that differed in factor loadings acrossurban and rural contexts to be conservative and over in-clusive, rather than over exclusive. Redundancy is rec-ommended in early stages of scale development toachieve inclusiveness [68]. We retained “physical abuse”it has been shown to be important to PCMC in extantliterature and is common in many global contexts [13,14, 22]. Similarly, we retained the items on “deliverysupport,” “delivery position choice,” “crowding,” and“cleanliness,” as these are salient aspects of PCMC [22,28, 34, 69–71]. Such inclusiveness is necessary to con-struct a measure that will be valid across multiple set-tings and countries. If these items do not work well inother settings, it may then be appropriate to consider ex-cluding them in future validations. On the other hand,we dropped items like differential treatment, stay againstwill, and auditory privacy that are important to respect-ful maternity care and PCMC because they had low fac-tor loadings in both samples in the initial analysis perthe criteria we used. The distribution of these itemslikely contributed to the low loadings. Thus, eventhough these did not make it into the current version ofthe PCMC scale, they are still important to consider po-tentially as stand-alone questions in PCMC research asthey may be more important in other settings.We started off with several domains, which we knew
to be closely interrelated, to ensure that we developed acomprehensive set of items. Thus, we expected that ouritems would represent a smaller number of factors thanour original domains. While our factor analysis
Table 6 Bivariate linear regression of person-centered maternitycare score on global measures of satisfaction with maternityservices
Coef. P-value 95% Conf. Interval
Level of Satisfaction
Dissatisfied (ref)
Neither satisfied nor dissatisfied 0.66 0.80 −4.33 5.66
Satisfied 10.83 0.00 6.84 14.82
Very satisfied 17.44 0.00 13.28 21.60
Constant 48.26 0.00 44.34 52.17
Rating of quality of care
Poor (ref)
Fair 3.00 0.28 −2.48 8.47
Good 12.67 0.00 7.76 17.57
Very good 16.46 0.00 11.47 21.46
Excellent 20.64 0.00 14.37 26.91
Constant 46.73 0.00 41.90 51.56
Will deliver in same place again
No (ref)
Yes, somewhat 0.07 0.97 −3.77 3.92
Yes, definitely 7.64 0.00 4.24 11.04
Constant 53.84 0.00 50.60 57.08
Afulani et al. Reproductive Health (2017) 14:118 Page 13 of 18

suggested a possibility of 2 to 4 sub-scales, the items didnot load systematically into clean conceptual categories.This is expected given the correlation between thePCMC domains and related items. Also, the domainsare overlapping rather than discrete. Thus whether “oneis asked permission before procedures” is grouped underdignity and respect, communication, or autonomy is asubjective decision. This can be said of several of theitems in the tool, although it is expected that there willbe less disagreement as to whether these items consti-tute PCMC. Thus, to provide sub-scales that are prac-tical and theory driven, we came up with the threecomponents drawing on the experience of care domainsin the WHO quality of care framework for maternal andnewborn health [24]. We then examined these sub-scales in further factor analysis to ensure that only itemscorrelated with that component were included in thesub-scale. With few exceptions, the suggested items foreach sub-scale load relatively well onto the sub-scales.These sub-scales however have lower reliability (alphabetween 0.6 and 0.8) than the overall 30-item scale(alpha greater than 0.8). Thus the analysis providesstronger support for a unified PCMC scale. For practicalpurposes, however, the sub-scales may be more usefulfor identifying aspects of PCMC to target for qualityimprovement.We examined the PCMC scale in both a rural and
urban setting to assess differences in the two contexts. Itis important to note that the majority of items havestrong factor loadings (>0.3) in both rural and urban set-tings, suggesting that this 30-item scale works relativelywell in multiple contexts. Some of the items, however,work better in the rural sample, while others work betterin the urban sample. One potential reason for these dif-ferences is the distribution of the variables in the differ-ent settings. For example, very few respondents in theurban reported physical abuse during their childbirth(approximately 2% said they experienced physical abuse),which could account for the poor loading with the otheritems. The distribution for the rural sample is slightlybetter, although still low; approximately 5% of respon-dents said they experienced physical abuse.Another potential reason for the rural/urban differ-
ence is the differences in the sampling approaches. First,the eligibility criteria for the urban sample included onlywomen who delivered in the preceding week, while thatfor rural sample included women who delivered in thepreceding 9 weeks. The mean PCMC score for womenwho were less than 1 week postpartum is higher thanthat of those greater than 1 week postpartum (67 com-pared to 59, p < 0.0001). This is consistent with studiesthat suggest that women are less likely to report negativeexperiences when interviewed immediately following de-livery, compared to when interviewed 5 to 10 weeks
postpartum [72]. This is potentially due to social desirabil-ity bias and the joy of having just delivered a baby. Second,all interviews for the urban sample were conducted in ahealth facility, whereas only about 40% of the rural inter-views were in a facility. The mean PCMC score for womenwho were interviewed in a health facility is slightly higherthan that of those interviewed in the community (62 com-pared to 58, p = 0.0003). This is also unsurprising aswomen may not be willing to express their dissatisfactionwith the care received while they are still within the healthfacility; they will be more comfortable talking about theirexperiences in their own home as opposed to a facility set-ting. Notwithstanding these differences in the sampling,the mean PCMC scores for the rural and urban samplewas not significantly different (59 compared to 60,p = 0.85). This suggests that this scale may be used tomeasure PCMC in facility-based samples as well ascommunity-based samples of recently delivered womenup to 9 weeks postpartum, and potentially beyond.Aside from the differences in sampling, the findings
may also reflect characteristics of respondents andbroader social norms in rural versus urban settings.There were small but significant differences in age, edu-cation, and marital status, with the rural women morelikely to be younger, married, and with less education.These are characteristics that could affect participant re-sponses. Moreover, expectations of care, which in turnaffects satisfaction with care, [25, 28, 73] may differ be-tween urban and rural women. In addition, the healthfacilities from which women were recruited in the twosettings may have contributed to the findings. For ex-ample, urban facilities are typically more crowded com-pared to rural settings. Therefore, policies and normsaround support persons in urban settings may reflectthe higher volume of patients and limited space in thesefacilities, reflecting that a larger proportion of urbanwomen do not want a labor and delivery support person.That the scale worked reasonably well in these differentsituations suggests its potential applicability in otherparts of Kenya, Africa, and potentially other developingcountries and regions.Another source of heterogeneity is the different lan-
guages used in the survey. Although we took measuresto ensure the meaning of the questions were similar inthe different languages, nuances in language may haveaffected the distribution of the items. For example, theaverage PCMC score for Luo respondents in the ruralsample is 57, compared to 62 and 63 for English andSwahili respectively. This however did not significantlyaffect the factor structure. Factor analysis by language ofsurvey for the rural sample yielded 3 factors for the Eng-lish and Swahili respondents and 4 factors for the Luorespondents, but in all cases, it was one dominant factoras in the main analysis.
Afulani et al. Reproductive Health (2017) 14:118 Page 14 of 18

As in any research, there are a number of limitationsto this study. First, our respondents are not generalizableto all women in Kenya, and the health facilities fromwhich women were recruited are not nationally repre-sentative. In our urban sample for example, some inter-vention facilities were chosen based on their willingnessto participate in future quality improvement interven-tions. This willingness may indicate organizational readi-ness to change and therefore may represent higherquality facilities. Other facilities were nominated by theCounty, which might indicate facilities identified to haveproblems that could benefit from quality improvement.Additionally, all facilities in the urban area were higher-level public facilities. This was a selection criterion forthe facilities to ensure delivery volumes were highenough to achieve our sample size targets. We do notknow how the PCMC measures will work in smallerhealth centers, clinics, or private health facilities inurban Kenya. While there was no restriction for the typeof delivery facility in the rural sample, interviews thatoccurred in health facilities were conducted in facilitiesselected for an intervention to improve prematurity out-comes, which included quality improvement activities.These included both hospitals and health centers, butcomprised specifically of high delivery volume facilities.Thus, women who delivered in these facilities, whichhave been primed for quality improvement, are overrep-resented in our sample. Validation of the PCMC scale inother contexts will help to assess its portability acrosssettings.Second, there are a number of items that have a “not
applicable” response option. We included these itemsbecause they were conceptually very relevant to PCMCeven if they did not apply to all respondents. Coding thenot applicable category into the highest category (“allthe time”) biases our results towards reporting higherlevels of person-centered care. There is however no rightor wrong way of addressing this challenge. If all “not ap-plicable” responses had been coded as “missing”, ap-proximately half of the urban sample would have beenlost. Coding this category as missing on the “labor anddelivery support” questions that had the largest propor-tion of respondents in the “not applicable” category(about 20% of combined sample), however, does not sig-nificantly change the findings. We avoided using imputa-tions to maintain the ease of interpreting our findings,and to provide a simple roadmap for others using thescale to deal with the “not applicable” categories.In addition, 30 items could be considered too many
items in a scale. While redundancy is recommended inearly stages of scale development to be inclusive, itmight be possible to develop a shorter version of thescale as it is used over time across settings, and re-searchers are able to identify which items perform best
across settings. For example, 44.7% of women in theurban setting did not want a support person duringlabor and 48.7% did not want a support person duringdelivery. While labor and delivery support is an import-ant issue in many settings, it may not be desired by allwomen for a variety of reasons [69–71, 74]. Further-more, during site visits to the facilities in urban settings,the study team became aware that labor and deliveryrooms are oftentimes too crowded for women to havesupport persons other than facility staff in the room. Wehave retained delivery support, as well as crowding, inthe current version of the tool, as we believe it is import-ant for women to have a support person if so desired.With more evidence from other settings, we couldshorten the scale to include only items that are relevantto the majority of women in different settings.Moreover, while our sub-scales were both theoretically
and data-driven, theory sometimes weighed more. Fu-ture validations might therefore reconsider which itemsfit into which sub-scale. For example, we decided to re-tain the health facility environment items in the SC sub-scale because the separate HFE sub-scale had low reli-ability, and we reasoned the HFE items are needed toprovide supportive care. Most of the HFE items loadedwell with other items in the SC sub-scale. There werehowever some items like “crowding” and “cleanliness,”which did not load well on the SC sub-scale across thesettings: crowding loaded well in the urban sample, butnot the rural sample, while cleanliness loaded well in therural sample, but not urban sample. We have retainedthese items on the SC sub-scale as they are conceptuallyand empirically very relevant [75]. Future studies willhelp provide more empirical support for these sub-scales.
ConclusionsThis paper presents a tool for measuring PCMC in de-veloping settings. Future studies can validate this tool toassess its appropriateness for the setting it is to be used.Where there is no capacity for validation, we believe thisscale can be used to validly and reliably assess the levelsof PCMC across various domains. The scale can be ad-ministered to women who have recently delivered up to9 weeks post-partum. It can be administered throughexit interviews as well as through community interviews.Ideally, people who are not considered health providersin the particular setting should conduct the interviewsto reduce bias in responses. In literate populations, thereis a possibility of the survey being self-administered.This scale will allow researchers to quantitatively meas-ure women’s experiences during childbirth. In turn, thiswill allow comparisons across settings and time, andstatistical analysis to examine the determinants and con-sequences of perceptions of care during childbirth. This
Afulani et al. Reproductive Health (2017) 14:118 Page 15 of 18

scale can also be administered before and after interven-tions to improve women’s experiences during child-birth—for needs assessments as well as for monitoringand evaluation of the interventions. Facility heads andhealth management teams could support periodic admin-istration of this tool to women receiving care in their facil-ities to assess the level of PCMC in their facilities and toidentify aspects of PCMC to target for quality improve-ment. Developing complementary person-centered scalesfor other reproductive health services, such as antenatalcare and family planning, will help drive the agenda to im-prove person-centered reproductive health care as ameans of improving reproductive health outcomes.
Additional file.
Additional file 1: Appendix 1. Distribution of person-centered mater-nity care variables. (DOCX 126 kb)
AbbreviationsCA: Communication and autonomy; DR: Dignity and respect; HFE: Healthfacility environment; KMO: Kaiser-Meyer-Olkin; PCMC: Person-centeredmaternity care; SC: Supportive care; WHO: World Health Organization
AcknowledgmentsWe will like to thank all the people who reviewed the items in the tool atvarious stages in its development and gave us feedback, including SanghitaBhattacharyya, Aradhana Srivastava, Leah Kirumbi, Linet Ouma, Ruth Muia,Nerea Ojanga, Lucy Kanja, Nancy Mugosi, Linner Koech, Rahel Muchwana,Craig Cohen, Dilys Walker, Miriam Kupperman, Paula Tavrow, Beryl AkinyiOgola, and Kajal Nitin. We are also grateful to all the members of the SPARQ,PTBI, and PQCC study teams, and especially Dominic Montagu for reviewingand giving us feedback on this manuscript and Katie Giessler for editorialreview. Finally, we like to express our gratitude to all our data collectors andstudy participants in Kenya.
FundingThis work was a collaboration between the Perceived Quality of Care duringChildbirth (PQCC) Study nested within the Kenya arm of the Preterm BirthInitiative (PTBi) Program, and the Strengthening People-centered Accessibil-ity, Respect, and Quality (SPARQ) project. The PQCC study is funded by theUniversity of California, San Francisco PTBi transdisciplinary post-doctoral fel-lowship, which is in turn funded by the Bill and Melinda Gates Foundation[OPP1107312]; and Marc and Lynne Benioff. The SPARQ project is funded bythe Bill and Melinda Gates Foundation [OPP1127467] and the David andLucile Packard Foundation. The funders had no role in the study design, datacollection and analysis, decision to publish, or preparation of the manuscript.
Availability of data and materialsThe datasets analyzed for this manuscript are available from thecorresponding author on reasonable request.
Authors’ contributionsPA led the development of the tool, conceived the manuscript, conductedthe analysis, and led the writing. ND, GG, and MS supported thedevelopment of the tool and the writing of the manuscript. All authors readand approved the final manuscript.
Ethics approval and consent to participateThe proposal and study materials for the two projects that provide data forthis manuscript were reviewed and approved by the UCSF Committee forHuman Subjects research (IRB numbers 15-18,458 and 15-18,008) and theKenya Medical Research Institute Scientific and Ethics Review Unit (protocolIDs KEMRI/SERU/CCR/039/3286 and non-KEMRI 526). All participants providedwritten informed consent prior to participation.
Consent for publicationNot applicable.
Competing interestsThe authors declare that they have no competing interests.
Publisher’s NoteSpringer Nature remains neutral with regard to jurisdictional claims inpublished maps and institutional affiliations.
Author details1School of Medicine, University of California, San Francisco, USA. 2Innovationsfor Poverty Action, Nairobi, Kenya. 3Fielding School of Public Health,University of California, Los Angeles, USA.
Received: 3 May 2017 Accepted: 8 September 2017
References1. Alkema L, Chou D, Hogan D, Zhang S, Moller A-B, Gemmill A, et al. Global,
regional, and national levels and trends in maternal mortality between 1990and 2015, with scenario-based projections to 2030: a systematic analysis bythe UN Maternal Mortality Estimation Inter-Agency Group. Lancet. 2016;387:462–74.
2. WHO. Making pregnancy safer: the critical role of the skilled attendant. Jt.Statement. Geneva: WHO ICM FIGO; 2004.
3. Kinney MV, Kerber KJ, Black RE, Cohen B, Nkrumah F, Coovadia H, et al. Sub-Saharan Africa’s Mothers, Newborns, and Children: Where and Why Do TheyDie? PLoS Med. 2010;7:e1000294.
4. Friberg IK, Kinney MV, Lawn JE, Kerber KJ, Odubanjo MO, Bergh A-M, et al.Sub-Saharan Africa’s mothers, newborns, and children: how many livescould be saved with targeted health interventions? PLoS Med. 2010;7:e1000295.
5. Koblinsky M, Moyer CA, Calvert C, Campbell J, Campbell OMR, Feigl AB, etal. Quality maternity care for every woman, everywhere: a call to action. TheLancet [Internet]. 2016 [cited 2016 Sep 24]; Available from: http://linkinghub.elsevier.com/retrieve/pii/S0140673616313332
6. van den Broek NR, Graham WJ. Quality of care for maternal and newbornhealth: the neglected agenda. BJOG Int J Obstet Gynaecol. 2009;116(Suppl1):18–21.
7. Graham WJ, Varghese B. Quality, quality, quality: gaps in the continuum ofcare. Lancet. 2012;379:e5–6.
8. Ceschia A, Horton R. Maternal health: time for a radical reappraisal. TheLancet [Internet]. 2016 [cited 2016 Sep 24]; Available from: http://linkinghub.elsevier.com/retrieve/pii/S0140673616315343
9. Souza JP, Gülmezoglu AM, Vogel J, Carroli G, Lumbiganon P, Qureshi Z, etal. Moving beyond essential interventions for reduction of maternalmortality (the WHO Multicountry Survey on Maternal and Newborn Health):a cross-sectional study. Lancet. 2013;381:1747–55.
10. Miller S, Abalos E, Chamillard M, Ciapponi A, Colaci D, Comandé D, et al.Beyond too little, too late and too much, too soon: a pathway towardsevidence-based, respectful maternity care worldwide. The Lancet [Internet].2016 [cited 2016 Sep 24]; Available from: http://linkinghub.elsevier.com/retrieve/pii/S0140673616314726
11. The White Ribbon Alliance. Respectful Maternity Care: The Universal Rightsof Childbearing Women (Full charter) [Internet]. [cited 2017 Mar 28].Available from: http://www.healthpolicyproject.com/index.cfm?ID=publications&get=pubID&pubID=46
12. Kinney MV, Boldosser-Boesch A, McCallon B. Quality, equity, and dignity forwomen and babies. The Lancet [Internet]. 2016 [cited 2016 Sep 24];Available from: http://linkinghub.elsevier.com/retrieve/pii/S0140673616315252
13. Abuya T, Warren CE, Miller N, Njuki R, Ndwiga C, Maranga A, et al. Exploringthe Prevalence of Disrespect and Abuse during Childbirth in Kenya. PLoSONE [Internet]. 2015 [cited 2015 Aug 31];10. Available from: http://www.ncbi.nlm.nih.gov/pmc/articles/PMC4401776/
14. Bowser D, Hill K. Exploring Evidence for Disrespect and Abuse in Facility-Based Childbirth: Report of a Landscape Analysis | Traction Project [Internet].2010 [cited 2015 Aug 31]. Available from: http://www.tractionproject.org/resources/access-skilled-care-respectful-maternal-care/exploring-evidence-disrespect-and-abuse
Afulani et al. Reproductive Health (2017) 14:118 Page 16 of 18

15. Freedman LP, Ramsey K, Abuya T, Bellows B, Ndwiga C, Warren CE, et al.Defining disrespect and abuse of women in childbirth: a research, policyand rights agenda. Bull World Health Organ. 2014;92:915–7.
16. Freedman LP, Kruk ME. Disrespect and abuse of women in childbirth: challengingthe global quality and accountability agendas. Lancet. 2014;384:e42–4.
17. Okafor II, Ugwu EO, Obi SN. Disrespect and abuse during facility-basedchildbirth in a low-income country. Int J Gynaecol Obstet. 2015;128:110–3.
18. Pérez D’GR. Obstetric violence: a new legal term introduced in Venezuela.Int J Gynaecol Obstet. 2010;111:201–2.
19. Zacher DL. Obstetrics in a Time of Violence: Mexican Midwives CritiqueRoutine Hospital Practices. Med Anthropol Q. 2015;29:437–54.
20. Hatamleh R, Shaban IA, Homer C. Evaluating the experience of Jordanianwomen with maternity care services. Health Care Women Int. 2013;34:499–512.
21. Miller S, Cordero M, Coleman AL, Figueroa J, Brito-Anderson S, Dabagh R, etal. Quality of care in institutionalized deliveries: the paradox of theDominican Republic. Int J Gynaecol Obstet. 2003;82:89-103-88.
22. Bohren MA, Vogel JP, Hunter EC, Lutsiv O, Makh SK, Souza JP, et al. TheMistreatment of Women during Childbirth in Health Facilities Globally: AMixed-Methods Systematic Review. PLoS Med. 2015;12:e1001847.
23. Bohren MA, Vogel JP, Tunçalp Ö, Fawole B, Titiloye MA, Olutayo AO, et al.Mistreatment of women during childbirth in Abuja, Nigeria: a qualitativestudy on perceptions and experiences of women and healthcare providers.Reprod Health. 2017;14:9.
24. Tunçalp Ӧ, Were W, MacLennan C, Oladapo O, Gülmezoglu A, Bahl R, et al.Quality of care for pregnant women and newborns—the WHO vision. BJOGInt J Obstet Gynaecol. 2015;122:1045–9.
25. Sixma HJ, Kerssens JJ, van Campen C, Peters L. Quality of care from thepatients’ perspective: from theoretical concept to a new measuringinstrument. Health Expect. 1998;1:82–95.
26. Groene O. Patient centredness and quality improvement efforts in hospitals:rationale, measurement, implementation. Int J Qual Health Care. 2011;23:531–7.
27. Sun BC, Adams J, Orav EJ, Rucker DW, Brennan TA, Burstin HR. Determinantsof patient satisfaction and willingness to return with emergency care. AnnEmerg Med. 2000;35:426–34.
28. Srivastava A, Avan BI, Rajbangshi P, Bhattacharyya S. Determinants ofwomen’s satisfaction with maternal health care: a review of literature fromdeveloping countries. BMC Pregnancy Childbirth. 2015;15:97.
29. Kruk ME, Vail D, Austin-Evelyn K, Atuyambe L, Greeson D, Grépin KA, et al.Evaluation Of A Maternal Health Program In Uganda And Zambia FindsMixed Results On Quality Of Care And Satisfaction. Health Aff (Millwood).2016;35:510–9.
30. Larson E, Hermosilla S, Kimweri A, Mbaruku GM, Kruk ME. Determinants ofperceived quality of obstetric care in rural Tanzania: a cross-sectional study.BMC Health Serv. Res. [Internet]. 2014 [cited 2015 Oct 29];14. Available from:http://www.ncbi.nlm.nih.gov/pmc/articles/PMC4283093/
31. Gilson L. Trust and the development of health care as a social institution.Soc Sci Med 1982. 2003;56:1453–68.
32. Isaac T, Zaslavsky AM, Cleary PD, Landon BE. The Relationship betweenPatients’ Perception of Care and Measures of Hospital Quality and Safety.Health Serv Res. 2010;45:1024–40.
33. Doyle C, Lennox L, Bell D. A systematic review of evidence on the linksbetween patient experience and clinical safety and effectiveness. BMJ Open[Internet]. 2013 [cited 2013 Jul 30];3. Available from: http://bmjopen.bmj.com/content/3/1/e001570
34. Bohren MA, Hunter EC, Munthe-Kaas HM, Souza JP, Vogel JP, Gülmezoglu AM.Facilitators and barriers to facility-based delivery in low- and middle-incomecountries: a qualitative evidence synthesis. Reprod Health. 2014;11:71.
35. Kruk ME, Mbaruku G, McCord CW, Moran M, Rockers PC, Galea S. Bypassingprimary care facilities for childbirth: a population-based study in ruralTanzania. Health Policy Plan. 2009;24:279–88.
36. Larson E, Vail D, Mbaruku GM, Kimweri A, Freedman LP, Kruk ME. Moving TowardPatient-Centered Care in Africa: A Discrete Choice Experiment of Preferences forDelivery Care among 3,003 Tanzanian Women. PLoS One. 2015;10:e0135621.
37. Kenya National Bureau of Statistics, Ministry of Health, National AIDS ControlCouncil, Kenya Medical Research Institute, National Council for Populationand Development, Nairobi, Kenya, and The DHS Program, ICF International,Rockville, Maryland, USA. The DHS Program - Kenya: DHS, 2014 - FinalReport (English) [Internet]. [cited 2016 Feb 18]. Available from: http://dhsprogram.com/publications/publication-FR308-DHS-Final-Reports.cfm
38. Afulani PA, Moyer C. Explaining Disparities in Use of Skilled Birth Attendants inDeveloping Countries: A Conceptual Framework. PLoS One. 2016;11:e0154110.
39. Liambila WN, Kuria SN. Birth attendance and magnitude of obstetriccomplications in Western Kenya: a retrospective case–control study. BMCPregnancy Childbirth. 2014;14:311.
40. Wamalwa EW. Implementation challenges of free maternity services policyin Kenya: the health workers’ perspective. Pan Afr. Med. J. [Internet]. 2015[cited 2017 Apr 3];22. Available from: http://www.panafrican-med-journal.com/content/article/22/375/full/#.WOKhrD8_oeI
41. Sharma J, Leslie HH, Kundu F, Kruk ME. Poor Quality for Poor Women?Inequities in the Quality of Antenatal and Delivery Care in Kenya. PLOS ONE.2017;12:e0171236.
42. Shaw D, Guise J-M, Shah N, Gemzell-Danielsson K, Joseph K, Levy B, et al.Drivers of maternity care in high-income countries: can health systems supportwoman-centred care? The Lancet [Internet]. 2016 [cited 2016 Sep 24]; Availablefrom: http://linkinghub.elsevier.com/retrieve/pii/S0140673616315276
43. Sando D, Ratcliffe H, McDonald K, Spiegelman D, Lyatuu G, Mwanyika-Sando M, et al. The prevalence of disrespect and abuse during facility-basedchildbirth in urban Tanzania. BMC Pregnancy Childbirth. 2016;16:236.
44. Sheferaw ED, Mengesha TZ, Wase SB. Development of a tool to measurewomen’s perception of respectful maternity care in public health facilities.BMC Pregnancy Childbirth. 2016;16:67.
45. Hinkin T, Tracey J, Enz C. Scale Construction: Developing Reliable and ValidMeasurement Instruments. Artic. Chapters [Internet]. 1997; Available from:http://scholarship.sha.cornell.edu/articles/613
46. DeVellis RF. Scale Development: Theory and Applications. 4th ed. LosAngeles: SAGE Publications, Inc; 2016.
47. Rice N, Robone S, Smith PC. The measurement and comparison of healthsystem responsiveness [Internet]. HEDG, c/o Department of Economics,University of York; 2008. Report No.: 08/05. Available from: http://ideas.repec.org/p/yor/hectdg/08-05.html.
48. Robone S, Rice N, Smith PC. Health Systems’ Responsiveness and ItsCharacteristics: A Cross-Country Comparative Analysis. Health Serv Res. 2011;46:2079–100.
49. WHO. The Health Systems Responsiveness Analytical Guidelines for Surveysin the MCSS [Internet]. WHO; 2005 [cited 2013 Jun 20]. Available from:http://www.who.int/responsiveness/mcss/en/.
50. D van D, Binns CW, Lee AH, Hipgrave DB. Measuring client-perceived qualityof maternity services in rural Vietnam. Int J Qual Health Care. 2004;16:447–52.
51. Haddad S, Fournier P, Potvin L. Measuring lay people’s perceptions of thequality of primary health care services in developing countries. Validation ofa 20-item scale. Int. J Qual Health Care. 1998;10:93–104.
52. Donabedian A. The quality of care. How can it be assessed? JAMA J. Am.Med. Assoc. 1988;260:1743–8.
53. Hulton LA, Matthew Z, Stones RW. A framework for the evaluation of qualitycare in maternity services. [Internet]. University of Southampton; 2000 [cited2013 Aug 1]. Available from: http://r4d.dfid.gov.uk/Output/65139/Default.aspx
54. Lawrence HC, Copel JA, O’Keeffe DF, Bradford WC, Scarrow PK, Kennedy HP,et al. Quality patient care in labor and delivery: a call to action. Am J ObstetGynecol. 2012;207:147–8.
55. Bechtel C, Ness DL. If You Build It, Will They Come? Designing Truly Patient-Centered Health Care. Health Aff. (Millwood). 2010;29:914–20.
56. Berwick DM. What “Patient-Centered” Should Mean: Confessions Of AnExtremist. Health Aff (Millwood). 2009;28:w555–65.
57. Institute of Medicine. Crossing the Quality Chasm: A New Health System forthe 21st Century [Internet]. 2001. Available from: https://www.nap.edu/catalog/10027/crossing-the-quality-chasm-a-new-health-system-for-the.
58. Jenkinson C, Coulter A, Bruster S. The Picker Patient ExperienceQuestionnaire: development and validation using data from in-patientsurveys in five countries. Int J Qual Health Care. 2002;14:353–8.
59. Saris W, Revilla M, Krosnick JA, Shaeffer EM. Comparing Questions withAgree/Disagree Response Options to Questions with Item-Specific ResponseOptions. Surv Res Methods. 2010;4:61–79.
60. Collins D. Pretesting survey instruments: an overview of cognitive methods.Qual. Life Res. Int. J. Qual. Life Asp. Treat. Care Rehabil. 2003;12:229–38.
61. Jobe JB, Mingay DJ. Cognitive research improves questionnaires. Am JPublic Health. 1989;79:1053–5.
62. Nápoles-Springer AM, Santoyo-Olsson J, O’Brien H, Stewart AL. Usingcognitive interviews to develop surveys in diverse populations. Med Care.2006;44:S21–30.
63. Population and Household Characteristics of Kenya, 2009 - Kenya DataPortal [Internet]. Knoema. [cited 2017 Apr 4]. Available from: http://kenya.
Afulani et al. Reproductive Health (2017) 14:118 Page 17 of 18

opendataforafrica.org//KEPHC2009/population-and-household-characteristics-of-kenya-2009?indicator=1000010
64. Crosby RA. DiClemente, Salazar LF. Research methods in health promotion.San Francisco, CA: Jossey-Bass; 2006.
65. Afifi AA, Clark V, May S. Computer-aided Multivariate Analysis. 4th ed. CRCPress; 2004.
66. Katchova A. Principal Component Analysis - Econometrics Academy[Internet]. [cited 2017 Mar 14]. Available from: https://sites.google.com/site/econometricsacademy/econometrics-models/principal-component-analysis
67. Spector PE. Summated Rating Scale Construction: An Introduction. 1st ed.Newbury Park: SAGE Publications, Inc; 1991.
68. DeVellis RF. Scale Development: Theory and Applications. 4 edition. LosAngeles: SAGE Publications, Inc; 2016.
69. Diamond-Smith N, Sudhinaraset M, Melo J, Murthy N. The relationshipbetween women’s experiences of mistreatment at facilities duringchildbirth, types of support received and person providing the support inLucknow. India Midwifery. 2016;40:114–23.
70. Alexander A, Mustafa A, Emil SAV, Amekah E, Engmann C, Adanu R, et al.Social support during delivery in rural central Ghana: a mixed methodsstudy of women’s preferences for and against inclusion of a lay companionin the delivery room. J Biosoc Sci. 2013:1–17.
71. Hodnett ED, Gates S, Hofmeyr GJ, Sakala C. Continuous support for womenduring childbirth. In: The Cochrane Collaboration, Hodnett ED, editors.Cochrane Database Syst. Rev. [Internet]. Chichester: John Wiley & Sons, Ltd;2013 [cited 2013 Aug 6]. Available from: http://doi.wiley.com/10.1002/14651858.CD003766.pub5.
72. Kruk ME, Kujawski S, Mbaruku G, Ramsey K, Moyo W, Freedman LP.Disrespectful and abusive treatment during facility delivery in Tanzania: afacility and community survey. Health Policy Plan. [Internet]. [cited 2017 Sep20]. Available from: https://academic.oup.com/heapol/article/doi/10.1093/heapol/czu079/2907853/Disrespectful-and-abusive-treatment-during.
73. Omar MA, Schiffman RF, Bingham CR. Development and testing of thepatient expectations and satisfaction with prenatal care instrument. ResNurs Health. 2001;24:218–29.
74. Byrne A, Caulfield T, Onyo P, Nyagero J, Morgan A, Nduba J, et al.Community and provider perceptions of traditional and skilled birthattendants providing maternal health care for pastoralist communities inKenya: a qualitative study. BMC Pregnancy Childbirth. 2016;16:43.
75. Benova L, Cumming O, Campbell OMR. Systematic review and meta-analysis: association between water and sanitation environment andmaternal mortality. Tropical Med Int Health. 2014;19:368–87.
• We accept pre-submission inquiries
• Our selector tool helps you to find the most relevant journal
• We provide round the clock customer support
• Convenient online submission
• Thorough peer review
• Inclusion in PubMed and all major indexing services
• Maximum visibility for your research
Submit your manuscript atwww.biomedcentral.com/submit
Submit your next manuscript to BioMed Central and we will help you at every step:
Afulani et al. Reproductive Health (2017) 14:118 Page 18 of 18