Embed Size (px)
Citation preview
NOTA TÉCNICA
Vol. 34, No. 2, Agosto 2013, pp. 175-191
Development of a Software to Determine Disturbancesin the Acid-Base Balance in Human Blood
A. Reyes-Lazalde∗M. Reyes-Monreal∗∗M.E. Pérez-Bonilla∗
R. Reyes-Luna∗
∗Laboratorio de BiologíaInteractiva, Escuela deBiología, BUAP. Blvd.
Valsequillo y Av. San Claudio,Edificio 112-A, Col. Jardinesde San Manuel. CP. 72570,
Puebla, Pue.∗∗Dirección General de
Innovación Educativa, BUAP.Blvd. Valsequillo y Av. San
Claudio, Edificio 1AUB, Col.Jardines de San Manuel. CP.
72570, Puebla, Pue.
ABSTRACTIn intensive care units, one of the most frequent emergencies occurringin patients in critical condition is acid-base imbalance. The abilityto proficiently manage such patients is achieved through many yearsof hospital practice. The correct quantification of such imbalancesallows for the detection of complex alterations. Although this areais fundamental for the clinical management of many patients, non-specialist doctors rarely receive the appropriate training. In addition,the learning required to master this area is difficult for doctors dueto the level of mathematics involved. There are two online supportprograms available on the internet for determining blood pH based onthe Stewart Model, along with a spreadsheet for the patient’s collecteddata. Generally, the calculation of hydrogen ion concentration [H+]uses a table of equivalences between pH y [H+] for discontinuous valuesof pH, with the Davenport diagram used manually. However, noneof these programs unite the methods of classic calculus, chemistryand physicochemistry. This study develops software for the teachingand calculation of acid-base imbalance that combines all the relevantmethods, such as the Henderson-Hasselbalch equation, the Siggard-Anderson modified excess base equation, the anion gap calculation,the computational implementation of the Davenport diagram, thecalculus of [H+] for any value of pH, the calculus for the compensatoryprocess, and the Stewart Model. The combined use of these methodsis complementary, synergic and permits a preliminary diagnosis thatinterprets and understands both respiratory alterations and minisculemetabolic or mixed alterations. With this software, a doctor canidentify acid-base imbalances and the occurrence of compensatoryprocesses, such as the concentration of acid or base, in order to restorepH, while many simulations of clinical cases can be carried out in theclassroom for medical training purposes.
Keywords: acid-base, base excess, Stewart model, anion gap,medical education.
176 Revista Mexicana de Ingeniería Biomédica · volumen 34 · número 2 · Agosto, 2013
Correspondencia:Arturo Reyes Lazalde
15 Pte. No. 1102-A, Col. ÁlvaroObregón, Atlixco, Puebla, CP:74260. Tel. (01 222) 2295500
Ext. 7072Correo electrónico:
Fecha de recepción:23 de Noviembre de 2012
Fecha de aceptación:11 de Junio de 2013
RESUMEN
En las unidades de cuidados intensivos, una de las emergencias másfrecuentes de los pacientes en estado crítico es el trastorno del equilibrioácido-base sanguíneo. El manejo adecuado de estos pacientes se alcanzaen la práctica hospitalaria después de varios años. La cuantificacióncorrecta de estos desequilibrios permite detectar alteraciones complejas.No obstante que el tema es fundamental para el manejo clínico demuchos pacientes, los médicos no especializados pocas veces cuentancon este tipo de entrenamiento. Por otro lado, el aprendizaje deltema resulta difícil para los médicos debido a las matemáticas queestán involucradas. En Internet existen dos programas online de apoyopara determinar el pH sanguíneo basados en el modelo de Stewarty una hoja de cálculo para el concentrado de datos del paciente.Generalmente, para el cálculo de hidrogeniones [H+] se utiliza una tablade correspondencia entre el pH y [H+] para valores de pH discontinuosy el diagrama de Davenport es utilizado de manera manual. Sinembargo, ninguno de estos programas reúne los métodos de cálculoclásico, químico y fisicoquímico. En este trabajo se desarrolló unsoftware para la enseñanza y el cálculo de las alteraciones ácido-base queconjunta todos los métodos como la ecuación de Henderson-Hasselbalch,la ecuación modificada de exceso de base de Siggard-Andersen, elcálculo de la brecha aniónica, la implementación en la computadora deldiagrama de Davenport, el cálculo de [H+] para cualquier valor de pH,el cálculo de los procesos de compensación y el modelo de Steward. Eluso conjunto de estos métodos es complementario, sinérgico y permiteun diagnóstico preliminar que comprende alteraciones respiratorias y demanera minuciosa alteraciones metabólicas o mixtas, Con este software,el médico puede determinar desordenes del equilibrio ácido-base, laexistencia de procesos compensatorios así como la concentración deácido o de base para restaurar el pH y en el módulo de enseñanzase pueden realizar numerosas simulaciones de casos clínicos para elentrenamiento médico.
Palabras clave: ácido-base, exceso de base, modelo de Stewart,brecha aniónica, educación médica.
INTRODUCTIONAcid-base alterations commonly present inpatients found in intensive care units [1]. Variousorgans are involved in the regulation of acid-baseand for this reason intensivist doctors are expertsin the diagnosis and management of complicatedalterations in acid-base balance [2]. In clinicalpractice, when the acid-base imbalances in thepatient are severe, inappropriate and not rapidlycorrected, they can lead to the death of thepatient.
Compensatory physiological processes andmixed acid-base imbalances may complicatediagnosis and, consequently, the patient’streatment [3]. For this reason, the correctquantification of this imbalance, which permitsthe detection of complex metabolic alterations,is very important [4,5]. Consequently, the abilityto diagnose and manage acid-base alterationsrapidly and effectively is fundamental for thetreatment of seriously ill patients. Thedoctor relies on laboratory data such as pH

Reyes-Lazalde et al. Development of a Software to Determine Disturbances in the Acid-Base Balance in Human Blood 177
and blood gases (various apparatus measurethe concentration of bicarbonate [HCO−3 ]), ionconcentration, glucose and routine tests suchas blood chemistry and complete blood count,amongst others.
If the doctor needs to carry out moreadvanced studies with this data in order todetermine a complex metabolic alteration ora compensatory process, it is important thatit is processed by a program designed tocalculate this data. Otherwise, it is necessaryto use a scientific calculator and record thecorresponding mathematical operations. Inthese conditions, the simultaneous solution ofvarious equations could become impossible.There is a vacuum of software for both thequantification of acid-base alterations and theteaching of it. In 1990, Siggaard-Andersen ySiggaard-Andersen [6] reported a program forPC that is executable using DOS version 2.11.This program determined the partial oxygenpressure (PaO2), which is the concentrationof O2 and acid-base state. However, this isnot currently available and there exists noupdate. There are only two programs forthe calculation of blood acid-base availableon the internet, both of which correspondto the Stewart Model: (1) The programdeveloped by Figge y Fencl (www.figgefencl.org),which has a teaching application and whosecomputer process 3.0 can be found on theirwebpage, which, to be used, requires the editorVisual Basic, which is associated with Excel.To achieve this requires both computationalknowledge, 2) the program developed by Watsonto which, however, access is not always available(www.med.sc.edu:96/watson/Acidbase/Acidbase.htm).
Huerta-Torrijos et al., developed an Excelspreadsheet that permits the annotation ofthe patient’s clinical data and the systematicanalysis of the blood acid-base evolution inthe patient, and, to determine [H+], uses atable of equivalence between pH and [H+]for discontinuous pH values. It does not,however, carry out other calculations [7]. Inthese circumstances, it is important to usesoftware to determine acid-base imbalances
that is executable, easy to use, does notrequire an internet connection or another typeof software, and includes all the availablecalculation methods.
There are three specific methods for thequantification of acid-base distortions: (1)the classic, (2) the chemical, and (3) thephysicochemical [2,8]. The first is based in theconcentration of bicarbonate [HCO−3 ], the secondin base excess (BE)[9], and the third in strong iondifference (SID)[10,11,12,13].
The classic method uses the Henderson-Hasselbalch (H-H) equation; which has a clinicalvalue in two senses: (1) it determines whetherthe laboratory results are correct, and (2) if thelaboratory data are incomplete, this equationmales it possible to obtain the missing data- for example if the pH value and arterialpressure of carbon dioxide (PaCO2) are known,it is possible to calculate [HCO−3 ][14]. However,with this method, it is not possible to preciselymeasure metabolic imbalances. To resolvethis restriction, chemical and physicochemicalmethods have been used and, in this sense, arecomplementary. The former uses the standardbase excess equation (SBE)[15], while the seconduses the Stewart Model[16].
The chemical method uses the SBE andorients the doctor in their administration ofdoses of acids or bases, depending on the case,to restore the blood pH. The physicochemicalmethod uses the Stewart Model and permitsthe identification of respiratory and metabolicalterations (specifically metabolic alterationscaused by illnesses of the liver, digestive systemor kidney). On the other hand, the classicmethod is not able to specify the cause of ametabolic alteration. Stewart proposed a systemformed of three independent variables: SID,PaCO2, and the concentration of weak or non-volatile anions (AT OT )[16]. The changes in thesevariables affect the concentration of hydrogen ionand bicarbonate. This method has been modifiedin order to be more practical and is from wherethe Figge Model (which includes an albuminand phosphoric acid system) and the WatsonModel (which uses an algorithm to simplify bothmodels) [17,18,19].

178 Revista Mexicana de Ingeniería Biomédica · volumen 34 · número 2 · Agosto, 2013
It is clear that all the methods are usefulin the diagnosis of acid-base imbalances. Eachone of the methods contributes importantcharacteristics: the H-H equation is simpleto implement and allows differentiation if thealteration is respiratory or metabolic; the SBEequation is oriented around therapeutic aspects;the Stewart equation allows the differentiation ofproblems of a metabolic nature.
The issue of acid-base balance does, however,become complicated for both medical studentsand doctors in general, principally due to thelevel of mathematics involved. For example, theStewart Model is formed by non-linear equationsthat must resolve themselves simultaneously. Asmentioned, although this model better permitsthe differentiation of metabolic alternationsthan the Henderson-Hasselbalch (H-H) equation,it is not commonly used and is omittedfrom the relevant courses. This situation isexplained by the fact that when the StewartModel was published, personal computers werevery expensive and it was necessary to havecomputational knowledge and the ability tooperate MSDOS. These conditions have changed,where graphic platforms such as Windows R©
greatly facilitate the use of the computer and,therefore, make the omission of this model fromcourses on acid-base imbalance unjustified. It is,however, necessary to implement software thatmakes it easier for the doctor to use. Accordingto Kellum [20], it is possible and desirable touse all of the methods. Consequently, this studydevelops a computer program to calculate acid-base state that combines all the methods in sucha way that they can be used separately or incombination, which in itself would have great usefor teaching in this area.
A program that integrates the calculationtools for the study of blood acid-base alterationsmust be able to carry out the following actions:diagnose respiratory or metabolic acidosis andalkalosis and distinguish whether they stemfrom an acute or chronic condition. Such aprogram must also be able to determine whethera compensatory process exists, appropriate [H+]concentration values for any pH value with
greater precision than the tables commonly used,determine which organs are involved in metabolicacid-base imbalances, and determine the acid orbase deficit, depending on the case, necessary torestore blood pH.
PROGRAM DESCRIPTION
The program comprises three principal modules:(1) the physiological approach, (2) the chemicalapproach, and (3) the physicochemical approach.Figure 1 depicts an operational diagram of theprogram, showing the different calculations thatcan be carried out.
The physiological approach module has amenu with the following options:
1. Calculation of [H+], in which Equation 2 isused.
2. Calculation of pH, PaCO2, or [HCO−3 ].When two of these variables are known,Equation 1 is used to obtain the third.
3. A table of equivalence between pH and[H+]. From here it is possible to comparethe values of [H+] in the table with thevalues determined by Equation 2.
4. Davenport diagram. Using the H-Hequation, a point is obtained and thenis placed on the Davenport diagram,which produces a preliminary diagnostic ofthe corresponding acid-base alteration, inaccordance with the classification used byDi lorio et al. [21]. From this, chronicor acute respiratory acidosis or alkalosisand chronic or acute metabolic acidosis oralkalosis can be determined.
5. Anion gap in accordance with Emmettand Narins [22] and Kraut and Medias[23], which allows a diagnostic of metabolicalterations.
6. Compensatory processes. It becomesimportant for the doctor to knowwhether the acid-base imbalance is alreadypresenting a compensatory process.

R e y e s -L a z a l d e e t a l . D e v e l o p m e n t o f a S o f t w a r e t o D e t e r m i n e D i s t u r b a n c e s i n t h e A c i d -B a s e B a l a n c e i n H u m a n B l o o d 179
Fig. 1. Diagr am of t he calcu lat ions it is p os s ible t o condu ct w it h t he Eq u ilibr ar p r ogr am. In eachmodu le, it is p os s ible t o car r y ou t t he s p ecifi ed calcu lat ions in t he box , accor ding t o t he dir ect ion oft he ar r ow s .
The chemical ap p r oach modu le cons is t sof t hr ee s econdar y modu les : ex ces s bas ecalcu lat ion, s t andar d bas e ex ces s calcu lat ion,and cor r ect ed ex ces s bas e calcu lat ion.
The t hir d modu le cor r es p onds t o St ew ar t ’ sp hy s icochemical ap p r oach. Her e, it is p os s iblet o calcu lat e p H, [H+], SID, t he ap p ar ent s t r ongion di� er ence (SIDa), t he s t r ong ion gap (SIG),[HCO−3 ], t he anion gap (AG), t he anion gapcor r ect ed (AGc), and t he s t andar d bas e ex ces s .For t hes e calcu lat ions , it is neces s ar y t o knowt he concent r at ions of Na+, K+, Mg2+, Ca2+,Cl−, albu min, p hos p hat e, PaCO2, and t he s t r ongu nmeas u r ed anions t hat cou ld be obt ainedindir ect ly fr om t he calcu lat ion of t he anion
gap cor r ect ed (AGc) w it h t he concent r at ion ofalbu min.
Each modu le is bas ed on t he eq u at ions t hatcor r es p ond t o t he p hy s iological, chemical, andp hy s icochemical ap p r oaches .
Module I: Physiological approach
The p hy s iological ap p r oach is bas ed on t heclas s ic t heor y of acid-bas e balance t hat r eq u ir est he u s e of t he H-H eq u at ion, w her e t helabor at or y v alu es [HCO−3 ] y PaCO2 ar e u s ed t ocalcu lat e blood p H. The H-H eq u at ion is u s ed in

180 Revista Mexicana de Ingeniería Biomédica · volumen 34 · número 2 · Agosto, 2013
the following manner:
pH = pK · log(
HCO−30.03 · PCO2
)(1)
The program determines the concentration of[H+] from any value of blood pH. In order toreport the concentration of [H+] with maximumprecision, greater than that provided by thecalculation tables, a non-lineal mathematicaladjustment was carried out on the data reportedin the literature with the program EureqaFormulize 0.96 beta, from which the bestadjustment obtained was the following (r2=0.99):
H = 78.10.848 + sen(5.34 + pH) (2)
− sen(11.5sen(5.34 + pH))
cos(
3.44 + 1700.848 + sen(5.34 + pH)
)− 40.3sen(pH)
Using this equation it is possible to calculate[H+] from any value of pH at an interval of 6.8 to7.8. In this way, it is not necessary to use a tableof equivalent values or record conversion values.
The Davenport Diagram was loaded ontothe computer (see Figure 6). A preliminarydiagnostic can be obtained from this diagram formetabolic or respiratory acid-base imbalances,which can also distinguish whether the conditionis acute or chronic.
To determine the compensatory processes,the empirical equations were integrated on thebasis of the medical experience reported in theliterature.
• In metabolic acidosis, the compensatoryresponse is a respiratory alkalosis withan expected reduction in PaCO2, with aresponse time of between 12 and 24 hours.The equation used for the calculation was:
PaCO2 = 1.5 · [HCO−3 ] + 8± 2 (3)
• In metabolic alkalosis, the compensatoryresponse is a respiratory acidosis withan expected increase in PaCO2, with anirregular response time. The equation used
for the calculation was:
PaCO2 = 0.9 · [HCO−3 ] + 16 (4)
• In respiratory acidosis, the compensatoryresponse is a metabolic alkalosis with anexpected increase in bicarbonate, witha response time expected according tothe details of the case: in an acutecondition, the response appears withinminutes, while in a chronic condition, theresponse appears within two to four days.The equations used in this calculationwere:Acute condition:
[HCO−3 ] = ((PaCO2 − 40)/10) + 24 (5)
Chronic condition:
[HCO−3 ] = ((PaCO2 − 40)/3) + 24 (6)
• In respiratory alkalosis, the compensatoryresponse is a metabolic acidosis with anexpected reduction in bicarbonate, with aresponse time expected in the accordingto the details of the case: in an acutecondition, the response appears withinminutes, while in a chronic condition, theresponse appears within two to four days.The equations used in this calculationwere:Acute condition:
[HCO−3 ] = ((40− PaCO2)/5) + 24 (7)
Chronic condition:
[HCO−3 ] = ((40− PaCO2)/2) + 24 (8)
Module II: Chemical approach
With this module it was possible to determinethe quantity of acid or base necessary to correctthe blood pH. The module corresponds to thecalculation of base excess. It is based on the VanSlyke equation and allows for the calculation ofbase excess, standard base excess and correctedbase excess with the concentration of albuminand phosphate [9] in accordance with equations
Reyes-Lazalde et al. Development of a Software to Determine Disturbances in the Acid-Base Balance in Human Blood 181
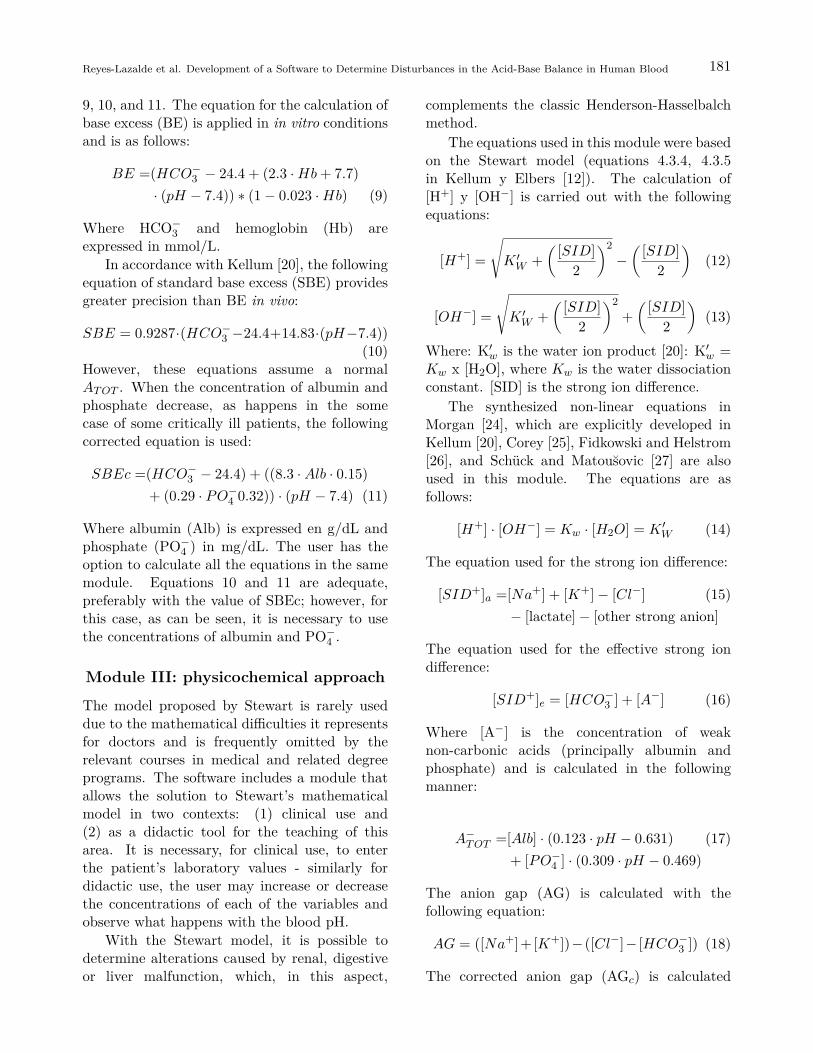
9, 10, and 11. The equation for the calculation ofbase excess (BE) is applied in in vitro conditionsand is as follows:
BE =(HCO−3 − 24.4 + (2.3 ·Hb + 7.7)· (pH − 7.4)) ∗ (1− 0.023 ·Hb) (9)
Where HCO−3 and hemoglobin (Hb) areexpressed in mmol/L.
In accordance with Kellum [20], the followingequation of standard base excess (SBE) providesgreater precision than BE in vivo:
SBE = 0.9287·(HCO−3 −24.4+14.83·(pH−7.4))(10)
However, these equations assume a normalAT OT . When the concentration of albumin andphosphate decrease, as happens in the somecase of some critically ill patients, the followingcorrected equation is used:
SBEc =(HCO−3 − 24.4) + ((8.3 ·Alb · 0.15)+ (0.29 · PO−4 0.32)) · (pH − 7.4) (11)
Where albumin (Alb) is expressed en g/dL andphosphate (PO−4 ) in mg/dL. The user has theoption to calculate all the equations in the samemodule. Equations 10 and 11 are adequate,preferably with the value of SBEc; however, forthis case, as can be seen, it is necessary to usethe concentrations of albumin and PO−4 .
Module III: physicochemical approach
The model proposed by Stewart is rarely useddue to the mathematical difficulties it representsfor doctors and is frequently omitted by therelevant courses in medical and related degreeprograms. The software includes a module thatallows the solution to Stewart’s mathematicalmodel in two contexts: (1) clinical use and(2) as a didactic tool for the teaching of thisarea. It is necessary, for clinical use, to enterthe patient’s laboratory values - similarly fordidactic use, the user may increase or decreasethe concentrations of each of the variables andobserve what happens with the blood pH.
With the Stewart model, it is possible todetermine alterations caused by renal, digestiveor liver malfunction, which, in this aspect,
complements the classic Henderson-Hasselbalchmethod.
The equations used in this module were basedon the Stewart model (equations 4.3.4, 4.3.5in Kellum y Elbers [12]). The calculation of[H+] y [OH−] is carried out with the followingequations:
[H+] =
√K ′W +
( [SID]2
)2−( [SID]
2
)(12)
[OH−] =
√K ′W +
( [SID]2
)2+( [SID]
2
)(13)
Where: K′w is the water ion product [20]: K′w =Kw x [H2O], where Kw is the water dissociationconstant. [SID] is the strong ion difference.
The synthesized non-linear equations inMorgan [24], which are explicitly developed inKellum [20], Corey [25], Fidkowski and Helstrom[26], and Schück and Matous̆ovic [27] are alsoused in this module. The equations are asfollows:
[H+] · [OH−] = Kw · [H2O] = K ′W (14)
The equation used for the strong ion difference:
[SID+]a =[Na+] + [K+]− [Cl−] (15)− [lactate]− [other strong anion]
The equation used for the effective strong iondifference:
[SID+]e = [HCO−3 ] + [A−] (16)
Where [A−] is the concentration of weaknon-carbonic acids (principally albumin andphosphate) and is calculated in the followingmanner:
A−T OT =[Alb] · (0.123 · pH − 0.631) (17)+ [PO−4 ] · (0.309 · pH − 0.469)
The anion gap (AG) is calculated with thefollowing equation:
AG = ([Na+]+[K+])− ([Cl−]− [HCO−3 ]) (18)
The corrected anion gap (AGc) is calculated

182 R e v i s t a M e x i c a n a d e I n g e n i e r í a B i o m é d i c a · v o l u m e n 34 · n ú m e r o 2 · A g o s t o , 2013
u s ing:
AGc =([Na+] + [K+])− ([Cl−]− [HCO−3 ])− (2 ·Alb + 0.5 · PO−4 ) (19)
Wher e: Albu min (Alb) is en g/dL and p hos p hat e(PO−4 ) is in mg/dL
The s t r ong ion gap is obt ained u s ing t hefollow ing eq u at ion:
SIG =(Na+ + K+ + Ca2+ + Mg2+)− (Cl− + lactate−)
−(
2.46× 10⁻⁸ · PCO210−pH
(20)
+[Alb] · (0.123 · pH − 0.631)+ [PO−4 ] · (pH − 0.469))
The p H is obt ained t hu s :
pH = 6.1 + log(
SID −A−T OT
0.03 · PCO2
)(21)
Software development
The p r ogr am w as dev elop ed u s ing t helangu age Vis u al Bas ic R©, v er s ion 5.0 (Micr os oftCor p or at ion) on a PC w it h a p r oces s or feat u r ing1.73 GHz , 2.0GB of RAM and Window s XP.The p r ogr am w as comp iled as an ex ecu t able fi le(Eq u ilibr ar .ex e) for a Window s R© env ir onment .It is ex ecu t able on any comp at ible PC av ailableon t he mar ket t oday .
Interface
Ther e ar e v ar iou s box es fou nd in each int er face;t he y ellow box es ar e for dat a ent r y , w hile t hegr een and blu e box es s how t he ou t p u t fr om t hecalcu lat ions . The w indow s of t he int er face s how
t he follow ing menu s fou nd in t he u p p er p ar t oft he w indow (Figu r e 4): (1) How t o u s e - t hiss how s t he u s er how t o inp u t t he dat a and howt o u s e t he s p ecifi c modu le; (2) Unit conv er t er- her e t he u s er can conv er t u nit s fr om, forex amp le, mmol/L a mEq /L; (3) Ex amp les - her es ome clinical dat a is p r ov ided as an ex amp le;(4) Glos s ar y and nor mal v alu es - a glos s ar yof abbr ev iat ions and nor mal v alu es of s omev ar iables w hich help t he u s er ent er nor mal dat aand obs er v e t he calcu lat ed v alu e, (5) Su bjectr ev iew - t he u s er is able t o r ev iew s ome bas icconcep t s and t hemes her e.
RESULTS
The comp u t er p r ogr am t hat has been dev elop edint egr at es t he clas s ic Hender s on-Has s elbalchmodel, t he Dav enp or t Diagr am, ex ces s bas ecalcu lat ion, t he anion gap , St ew ar t ’ s modifi edmodel, and t he calcu lat ion for comp ens at or yp r oces s es . This p r ogr am allow s t he u s er t oobt ain a p r eliminar y diagnos t ic for acid-bas eimbalances , es t ablis h w het her t he condit ion isacu t e or chr onic, and, mor eov er , det er minet he p r es ence of a comp ens at or y p r oces s .As t he p r ogr am inclu des a clas s ifi cat ionof cor r es p onding acid-bas e alt er at ions , inaccor dance w it h t he clas s ifi cat ion u s ed by DiIor io et al. [21], in Modu le 1 t he u s er can obt aint he follow ing clinical diagnos es : u ncomp ens at edacu t e r es p ir at or y acidos is , p ar t ially comp ens at edacu t e r es p ir at or y acidos is , comp ens at edr es p ir at or y acidos is , u ncomp ens at ed acu t er es p ir at or y alkalos is , p ar t ially comp ens at edr es p ir at or y alkalos is , u ncomp ens at ed r es p ir at or yalkalos is , u ncomp ens at ed met abolic acidos is ,
Fig. 2. Par t ial v iew of t he t able of ex amp les of p r eliminar y diagnos t ic bas ed on t he w or k of Di Ior ioet al. [21]. Car r ied ou t on t he bas is of t he calcu lat ed v alu es in t he p hy s iological ap p r oach modu le, ames s age w it h t he cor r es p onding diagnos t ic ap p ear s once t he calcu lat ion has been made.

R e y e s -L a z a l d e e t a l . D e v e l o p m e n t o f a S o f t w a r e t o D e t e r m i n e D i s t u r b a n c e s i n t h e A c i d -B a s e B a l a n c e i n H u m a n B l o o d 183
Fig. 3. Gr ap hic s how ing, in t he u p p er p ar t , t hebox for t he calcu lat ion of [H+] fr om any v alu e ofp H. Pr es ent ed below is t he t able of eq u iv alencesbet w een p H and t he [H+].
p ar t ially comp ens at ed met abolic acidos is ,comp ens at ed met abolic acidos is , u ncomp ens at edacu t e met abolic alkalos is , p ar t ially comp ens at edmet abolic alkalos is , comp ens at ed met abolicalkalos is , mix ed acidemia and mix ed alkalemia.The p r ogr am feat u r es a t able s how ing t hecondit ions for p H, PaCO2 and [HCO−3 ] for eachcas e (Figu r e 2).
The concent r at ion of [H+] calcu lat ed by t hep r ogr am is mor e p r ecis e t han t he concent r at ionr ep or t ed by Hu er t a-Tor r ijos et al. [7] int heir s t u dy , in t hat Eq u at ion 2 meas u r es t heconcent r at ion of [H+] for any v alu e of p H; u nlikea t able t hat s how s an es t imat ed v alu e at anint er v al (Figu r e 3).
Wit h t he object iv e of s how ing t he u t ilit yof t he Equilibrar p r ogr am in t he comp let ion ofclinical t as ks , s ome clinical cas es ar e des cr ibed
below . In t he diagnos t ic ex amp le ou t lined below ,t he H-H eq u at ion, t he Dav enp or t Diagr am andcomp ens at or y p r oces s es ar e u s ed t o diagnos er es p ir at or y acidos is , di� er ent iat e bet w een anacu t e and chr onic p r oces s , and det er minew het her a comp ens at or y p r oces s is alr eadyp r es ent . Br iefl y , it w ill des cr ibe t he u s e oft he p r ogr am: how t o ent er t he dat a and t hecalcu lat ions it has t o car r y ou t .
Diagnostic example
A p at ient p r es ent ing p H = 7.35 and PaCO2= 55 mmHg. Wit h t his dat a [H+] y [HCO−3 ]ar e calcu lat ed and a p r eliminar y diagnos is ismade. The s t ep s in t he p r ogr am for t hecalcu lat ions ar e as follow s : <<ENFOQUEFISIOLÓ GICO>> → <<CÁ LCULO Á CIDO-BASE>> → <<ecu ació n de Hender s on-Has s elbalch>> → <<Conocemos p H yPaCO2 >> → <<CALCULAR>>. The r es u ltis : [H+] = 46.17 y [HCO3] = 28.58 and a box w it ha p r eliminar y diagnos t ic now op ens : p ar t iallycomp ens at ed r es p ir at or y acidos is , in accor dancew it h Di Ior io et al. [21] (Figu r e 4).
The comp ens at or y p r oces s es modu le ist hen u s ed t o det er mine and confi r m w het hera comp ens at or y p r oces s has alr eady beenes t ablis hed. While, w it h t hes e calcu lat ionsr ealiz ed, a p r eliminar y diagnos is of r es p ir at or yacidos is has alr eady been made, w hat now needst o be det er mined is w het her t he condit ion isacu t e or chr onic. To car r y t his ou t , t he v alu ePaCO2 = 55 is ent er ed in t he comp ens at ionint er face and t he v alu e of [HCO−3 ] is checkedfor an acu t e condit ion, w it h t he r es u lt being[HCO−3 ] = 25.5, a v alu e t hat is far fr om t he28.68 p r ev iou s ly calcu lat ed (s ee Figu r e 4). Fora chr onic cas e, t he calcu lat ion w as [HCO−3 ] =29, w hich is clos e t o t he p r ev iou s calcu lat ion.Cons eq u ent ly , a chr onic cas e is s u gges t ed (Figu r e5).

184 R e v i s t a M e x i c a n a d e I n g e n i e r í a B i o m é d i c a · v o l u m e n 34 · n ú m e r o 2 · A g o s t o , 2013
Fig. 4. Acid-bas e calcu lat ion int er face by means of t he clas s ic Hender s on-Has s elbalch model. Thev alu es for p H y PaCO2 ar e ent er ed and ar e s how n as r es u lt s [H+] y [HCO−3 ]. The p r ogr am p r odu ces ap r eliminar y diagnos t ic of p ar t ially comp ens at ed r es p ir at or y acidos is .
Fig. 5. Par t ial v iew of t he int er face w indow for t he calcu lat ion of comp ens at or y p r oces s es . The v alu e oft he p ar t ial CO2 p r es s u r e is ent er ed and t he bu t t on mar ked by ar r ow s is p r es s ed. In t he abov e cas e, t hev alu e of [HCO−3 ] is inv es t igat ed for an acu t e cas e, and below a chr onic cas e is inv es t igat ed. The v alu ecalcu lat ed, [HCO−3 ] = 29, is s imilar t o t hat calcu lat ed p r ev iou s ly ; [HCO−3 ] = 28.58. Thes e indicat e ap ar t ially comp ens at ed chr onic r es p ir at or y acidos is .

R e y e s -L a z a l d e e t a l . D e v e l o p m e n t o f a S o f t w a r e t o D e t e r m i n e D i s t u r b a n c e s i n t h e A c i d -B a s e B a l a n c e i n H u m a n B l o o d 185
Fig. 6. Int er face w her e t he u s er can calcu lat e p H and hav e t he r es u lt p r es ent ed gr ap hically by meansof t he Dav enp or t Diagr am. The r es u lt ing p oint , highlight ed w it h t he ar r ow , is fou nd in t he ar ea t hatcor r es p onds t o chr onic r es p ir at or y acidos is .
The doct or can t hen u s e t he p at ient ’ sclinical his t or y and fi nally det er mine w het her t hediagnos is s u gges t ed by t he p r ogr am is accu r at e.The r es u lt s ar e calcu lat ed on t he bas is of t he factt hat t her e is a decr eas e in t he p H and an incr eas ein PaCO2, w hich is char act er is t ic of r es p ir at or yacidos is . The incr eas e in [HCO−3 ] s u gges t s t hatt he kidney is comp ens at ing.
To confi r m w het her t he r es p ir at or y acidos is ischr onic, t he Dav enp or t Diagr am is u s ed. Figu r e6 s how s how blood p H can be calcu lat ed fr omPaCO2 y [HCO−3 ]. Wit h t hes e t hr ee v ar iablesa p oint on t he Dav enp or t Diagr am can beobt ained. A cir cle s u gges t ing chr onic r es p ir at or yacidos is is p r es ent ed in t he gr ap hic. This can bear r iv ed at by s elect ing << Conocemos PaCO2 y[HCO−3 ] >> and ent er ing t he cor r es p onding dat aobt ained by t he p r ev iou s calcu lat ion, PaCO2 =55 y [HCO−3 ] = 28.58.
Stewart model
A modu le for t he calcu lat ion of acid-bas eimbalances bas ed on t he St ew ar t Model asmodifi ed by Wat s on has been dev elop ed fort his s oft w ar e. The modu le <<ENFOQUEFISICOQUÍ MICO>> enables calcu lat ion w it hu nit s in mmol/L in accor dance w it h Schü ckand Mat ou � s ov ic [27] or w it h u nit s in mEq /L inaccor dance w it h Kellu m [20]. Figu r e 7 s how s t heu s er int er face for t he cas e of u nit s in mEq /L.
Clinical case and use of Stewart model
For t his ex amp le, t he nor mal v alu es p r op os ed byt w o di� er ent au t hor s w it h ent r y p ar amet er s inmmol/L, albu min in g/L and PaCO2 in mmHgw er e s elect ed. The r es u lt s r ep or t ed by Schü ckand Mat ou � s ov ic [27], ar e giv en in mmol/L;w hile t he r es u lt s r ep or t ed by Kellu m [20] ar e

186 R e v i s t a M e x i c a n a d e I n g e n i e r í a B i o m é d i c a · v o l u m e n 34 · n ú m e r o 2 · A g o s t o , 2013
Fig. 7. Int er face w indow for t he St ew ar t Model. Cl−, Ca2+, Mg2+, Na+, K+, lact at e, p hos p hat e,albu min, PaCO2 y p H concent r at ions ar e ent er ed. Her e t he calcu lat ions for [H+], [HCO−3 ], SIDa, SID,SIG, AG, AGc, BE, SBE, SBEc ar e car r ied ou t .
giv en in mEq /L. The modu le <<ENFOQUEFISICOQUÍ MICO>> s hou ld be chos en in t hes oft w ar e, w hich t hen leads t o a menu fr om w hicht he u nit s t hat ar e r eq u ir ed can be ent er ed: (1)mEq /L or (2) mmol/L. The r es u lt s ar e giv en int he u nit s t hat cor r es p ond t o t he cas e. To obt ainmEq /L as an ou t p u t , it is neces s ar y t o inp u tt hes e u nit s . If neces s ar y , t he p r ogr am u s es au nit conv er t er for t his t as k. The s ame p r oces sis follow ed in t he cas e of mmol/L.
Table 1 s how s t w o ex amp les of nor mal dat a inmmol/L in Colu mn A, and in mEq /L in Colu mnB, w hich cor r es p ond t o t hos e r ep or t ed by Schü cky Mat ou � s ov ic [27] y Kellu m [20], r es p ect iv ely .The ou t p u t dat a ar e: HCO−3 , AG, BE, SID ySIG. It is p os s ible t o obs er v e t hat t he calcu lat edv alu es bas ically coincide w it h t he r ep or t ed dat a.The concent r at ions of HCO−3 , AG y SID ar enor mal in ev er y cas e; t her e is no bas e ex ces s andt he v alu e of SIG t ends t ow ar d z er o as w ou ld beex p ect ed in a nor mal p at ient .
The dat a t aken fr om Kellu m [20] can befou nd in Colu mn C, cor r es p onding t o a p at ientw it h acidos is . In t his cas e, t he r es u lt s ar e giv enin mEq /L, for w hich t he cor r es p onding modu leis u s ed and t he neces s ar y conv er s ions car r iedou t . The r es u lt s bet w een t he p r ogr am andt hos e r ep or t ed by t he au t hor ar e p r act ically t hes ame (C ar t icle v s C p r ogr am). In t his cas e,t he p r ogr am r ep or t s met abolic acidos is in w hicht her e is an incr eas e in t he anion gap , a defi citof bas e and SID has decr eas ed, w hile t he v alu eent er ed for PaCO2 is low , indicat ing p u lmonar ycomp ens at ion.
The program as a didactic tool
The s u bject of acid-bas e balance is fu ndament alt o medical p r act ice and a clear u nder s t andingof it w ill det er mine t he e� ect iv e management ofcr it ically ill p at ient s . If w e t ake int o accou ntt hat her e in Mé x ico, cou r s es in mat hemat ics and

Reyes-Lazalde et al. Development of a Software to Determine Disturbances in the Acid-Base Balance in Human Blood 187
Table 1. Acid-base calculation made on the basis of the Stewart Model.In units mmol/L in column A and in mEq/L in columns B and C.The upper part corresponds to the entry parameters and the lower partcorresponds to the results. In each case, the units used are specified.Columns A and B correspond to cases of normal patients, and column Cto a patient with acidosis. It is possible to observe that the results thatare produced by the program are similar to those reported by Schücky Matous̆ovic (A article vs A y B program). Column C corresponds tothe data from a patient with acidosis reported by Kellum; the resultsproduced by the program are similar (C article vs C program).Parameters A B C
input normal (mmol/L) normal (mEq/L) acidosis (mEq/L)
Na+ 142 ± 2 142 130K+ 4.1 ± 0.3 3.9 3.5
Ca++ 2.3 ± 0.1 4.6 4.4Mg++ 0.8 ± 0.05 1.6 1.8Cl− 106 ± 2 106 107PO4 1 ± 0.2 1.1 1.5
Alb (g/L) 44 ± 3 4.4 2 (mg/dL)pH 7.422 ± 0.015 7.4 7.36
PCO2(mmHg) 38 ± 1.5 39 30Lactate 1 1 1.5
Parameters A A B C Coutput article program program article program
HCO−3 24.5 ± 0.8 23.15 24 8 7AG 16 ± 2 16.34 15.9 20 21BE 0.3 ± 0.5 -0.3 -0.4 -20 -21SID 39 ± 1 38.24 38.01 — 25SIG — 0.83 2.09 9.2 9.24
physics are not offered as part of medical degrees,the calculations involved can be very challengingfor undergraduate students, principally due tothe mathematics involved. This situation bringswith it as a consequence a superficial level oflearning in these types of areas of medicine.Each of the interfaces in the software presentedin this study give the user access to a menuin the upper part of their screen that givesthe following options: Exit, Authors, How touse, Examples, Subject Review, Unit Converter,and Glossary. These options give the studentaccess to a comprehensive review of the subjectand some examples from the study of bloodpH imbalance, while the glossary explains theabbreviations used in the program and indicatethe normal values for each of the variables.
Of particular didactic use is calculation optionusing the Stewart Model in units of mmL/Lin the <<ENFOQUE FISICOQUÍMICO>>module, in which it is possible to modify theconcentrations of the different entry variablesand observe the changes they produce in pH.
Example of use
Vomiting, gastric suction, and draining forgastrostomy cause high levels of water,electrolyte and hydrochloric acid loss. Theimmediate effect of such losses is seen in isotonicdehydration and metabolic alkalosis. One quickexample of this comes when pH is increasedafter the concentration of Cl− is decreased to 96mmL/L. Figure 8 shows the results.

188 R e v i s t a M e x i c a n a d e I n g e n i e r í a B i o m é d i c a · v o l u m e n 34 · n ú m e r o 2 · A g o s t o , 2013
Fig. 8. Simu lat ion of a p at ient ex p er iencing a Cl− los s w hich leads t o met abolic alkalos is .
In t hes e condit ions , t he p H w as calcu lat ed at7.54, w hich indicat es met abolic alkalos is . Theu s er can e� ect v ar iou s combinat ions in changingt he concent r at ion of t he ent r y v ar iables ands imu lat e a gr eat div er s it y of clinical cas es .
DISCUSSION
Doct or has v er y few op t ions av ailable t o s u p p or tt hem in t he calcu lat ion of acid-bas e imbalances .As has been ment ioned, t her e ar e only t w op r ogr ams av ailable on t he int er net bas ed ont he p hy s icochemical met hod: (1) A t eachingw ebs it e dev elop ed by Figge and (2) a p r ogr amon w hich t he calcu lat ion can be car r ied ou t ,w hich is not alw ay s av ailable. Di Ior io et al.[21] hav e r ep or t ed a r u le for t he calcu lat ion ofp H t hat u s es t he clas s ic met hod and p r odu cesa p r eliminar y diagnos t ic. Ther e is als o an
Ex cel s p r eads heet w hich bas ically s er v es as anar chiv ing t ool in w hich t he p at ient ’ s clinicalhis t or y and labor at or y r es u lt s can be not ed, andin w hich t he calcu lat ion of [H+] is bas ed ont he u s e of a t able of eq u iv alence bet w een bloodp H and [H+]; how ev er , t he p r incip al int ent ionbehind t he s p r eads heet is t he s y s t emiz at ion ofdat a. This s t u dy ou t lines t he imp lement at ionof a comp u t er p r ogr am t hat allow s for t hecalcu lat ion of acid-bas e t hr ou gh t he p r incip al ofcombining t he r elev ant met hods of calcu lat ion[20, 25]. In t he ex amp les of clinical cas es t hathav e been ou t lined her e, it is p os s ible t o s ee howt o ar r iv e at a diagnos is of p ar t ially comp ens at edchr onic r es p ir at or y acidos is u s ing t he calcu lat ionmodu les , each of w hich comp lement and confi r mt he diagnos is .
Wit h t his p r ogr am, it is p os s ible t o choos eany of t he met hods s ep ar at ely or all of t hem

Reyes-Lazalde et al. Development of a Software to Determine Disturbances in the Acid-Base Balance in Human Blood 189
together. In accordance with Kellum [20], it isultimately more effective to use all the methodstogether. It is opportune to mention thatthis program allows for the calculation of theacid-base variables and produces a preliminarydiagnosis; however, the definitive diagnosis isthe responsibility of the doctor - based on theirexperience, the data from the clinical history,a physical examination and on the correctlaboratory results. In accordance with Huerta-Torrijos et al., some calculations can be used tocorroborate the accuracy of laboratory results[7]. Moreover, this program can be used for theteaching of this area through the use of the helpwindows, the review of the topic option, andthrough simulations based on the clinical casedetails the program details. It can also be usedas a teaching aid where the help windows permita quick review. With the teaching module,various clinical cases can be simulated. There isa large amount of clinical case details availableon the internet, including laboratory data, anddiagnostic and treatment data. The student canenter these details into the program and carryout a simulation of the relevant clinical case.
There are few clinical cases which reportthe use of the Stewart Model, probably dueto the large quantity of data that it requiresand the complexities involved in its use. Thisstudy used the data provided by Kellum (2005)[20] and compared them with the calculationsproduced by the program. It should also benoted that the concentrations of Ca++ y Mg++
used by Kellum [20] were not used in thisstudy. However, the small variations foundin the different parameters did not modify thediagnostic interpretation. It should also be notedthat the values that this study reports herewere confirmed by means of alternative equationsand in each case were calculated using everyequation - such as those that use different unitsfor phosphate and albumin. The program isable to calculate other variables not reported byKellum [20].
CONCLUSIONS
This study describes the development of acomputer program for the study of blood acid-base balance that is easy to operate, combinesall the calculation tools available today, and fillsthe void that exists in computer programs ofthis type. The program allows for preliminarydiagnoses of respiratory or metabolic alkalosisand acidosis to be carried out, and distinguisheswhether the condition is acute or chronic. Italso can determine whether a compensatoryprocess is in effect, calculate the [H+] forany value of pH with greater precision thanthe relevant calculation tables, determine whichorgans are involved in the acid-base imbalance,and calculate the base or acid deficit - dependingon the case - in order that blood pH can berestored. The examples used in this studydemonstrate that the results calculated by thisprogram are essentially the same as thosereported in the bibliography from which thedata used by this study were obtained - equally,the program also obtained the same suspecteddiagnoses as those arrived at in the literature.It is important to emphasize that, in orderto arrive at a certain diagnosis, the patient’sclinical history and a physical examination arerequired. This program should, therefore, beseen as a support tool and not as a medicallyintelligent diagnostic program. Its use hasbeen envisioned principally to facilitate themathematic calculations for the doctor. It isadvised that the program can be used to teachand update medical students and those studyingrelated degrees on this area of medicine. It is alsorecommended as a tool for continuous educationfor medical residents and medical experts inintensive care. In general, while the program iseasy to operate and allows for the calculations tobe carried out in a straightforward way, it needsto be made clear that it is not a substitute for adoctor. The program will be able to be orderedat the email address provided.
190 Revista Mexicana de Ingeniería Biomédica · volumen 34 · número 2 · Agosto, 2013
DISCLAIMER
The Equilibrar program is not a substitute forclinical criteria. No medical decision should betaken solely on the basis of the results given bythis program.
ACKNOWLEDGEMENTS
We thank the Programa Institucional deFortalecimiento a la Capacidad Académica 2012for the support given to this publication. Wethank Ben Stewart for English revision.
REFERENCES
1. Gauthier PM, Szerlip HM. “Metabolicacidosis in the intensive care unit”. CritCare Clin 2002; 18:289-308.
2. Kellum JA. “Determinants of blood pH inhealth and disease”. Crit Care 2000; 4(1):6-14.
3. Walmsley RN, White GH. “Mixed acid-base disorders”. Clin Chem 1985;31(2):321-325.
4. Fencl V, Jabor A, Kazda A, FiggeJ. “Diagnosis of metabolic acid-basedisturbances in critically ill patients”. AmJ Respir Crit Med 2000; 162:2246-2251.
5. Manozzo MB, Cerveira PRC, Kappel RC,Rios SRV. “Acid-base disorders evaluationin critically ill patients: we can improveour diagnostic ability”. Intensive Care Med2009; 35:1377-1382.
6. Siggaard-Andersen O, Siggaard-AndersenM. “The oxygen status algorithm: acomputer program for calculating anddisplaying pH and blood gas data”. ScandJ Clin Lab Invest Suppl 1990; 203:29-45.
7. Huerta-Torrijos J, Díaz-Barriga RP,Sardiñas-Hernández JJ, Godoy-Vega I.“Análisis sistemático del equilibrio ácido-base en formato automatizado”. Principiosbásicos y propuesta. Medicina Critica yTerapia Intensiva 2001; 15(3):69-79.
8. Adrogue HJ, Gennari FJ, Galla JH, MediasNE. “Assessing acid-base disorders”.Kidney International 2009; 76:1239-1247.
9. Siggaard-Anderson O, Fogh-Andersen N.“Base excess or buffer base (strong iondifference) as a measure of a no-respiratoryacid-base disturbance”. Acta AnaesthesiolScand 1995; 107:123-128.
10. Stewart PA. “Independent and dependentvariables of acid-base control”. RespirPhysiol 1978; 33:9-26.
11. Stewart PA. “Modern quantitative acid-base chemistry”. Can J Physiol Pharmacol1983; 61:1441-1461.
12. Kellum JA, Elbers PW. Stewart’s textbookof acid-base. 2da ed. AcidBase.org,Amsterdam; 2009.
13. Kurtz I, Kraut J, Ornekian V, NguyenMK. “Acid-base analysis: a critiqueof the Stewart and bicarbonate-centeredapproaches”. Am J Physiol Renal Physiol2008; 294:F1009-F1031.
14. Schlichtig R, Grogono AW, SeveringhausJW. “Human PaCO2 and standardbase excess compensation for acid-baseimbalance”. Crit Care Med 1998;26(7):1173-1179.
15. Singer RB, Hastings AB. “An improvedclinical method for the estimation ofdisturbances of the acid-base balance ofhuman blood”. Medicine (Balt) 1948;27:223-242.
16. Stewart PA. “How to understand acid-base”. In: A quantitative acid-base primerfor biology and medicine. Edited byStewart PA, New York: Elsevier 1981; p.1-286.
17. Figge J, Rossling TH, Fencl V. “The roleof serum proteins in acid-base equilibria”.J Lab Clin Med 1991; 117:453-467.
18. Figge J, Mydosh T, Fencl V. “Serumproteins and acid-base equilibria: a follow-up”. J Lab Clin Med 1992; 120:713-719.

Reyes-Lazalde et al. Development of a Software to Determine Disturbances in the Acid-Base Balance in Human Blood 191
19. Watson PD. “Modeling the effects ofproteins on pH in plasma”. J Appl Physiol1999; 86:1421-1427.
20. Kellum JA. “Clinical review: Reunificationof acid-base physiology”. Crit Care 2005;9:500-507.
21. Di Iorio C, Rufolo L, Melillo EM,Granata A, Melillo G. “The slide rule:a new method for the assessment ofacid-base equilibrium disorders”. MinervaAnesthesiol 2007; 73:339-342.
22. Emmett MM, Narins RG. “Clinical use ofthe anion gap”. Medicine (Baltimore) 1977;56(1):38-54.
23. Kraut JA, Medias NE. “Metabolicacidosis: pathophysiology, diagnosis andmanagement”. Nat Rev Nephrol 2010;6:274-285.
24. Morgan TJ. “Clinical review: The meaningof acid-base abnormalities in the intensivecare unit - effects of fluid administration”.Critical Care 2005; 9(2):204-211.
25. Corey HE. “Bench-to-bedside review:fundamental principles of acid-basephysiology”. Critical Care 2005; 9(2):184-192.
26. Fidkowski C, Helstrom J. “Diagnosingmetabolic acidosis in critically ill: bridgingthe anion gap, Stewart, and base excessmethods”. Can J Anesth 2009; 56:247-256.
27. Schück O, Matous̆ovic K. “Relationbetween pH and the strong ion difference(SID) in body fluid”. Biomed Papers 2005;149(1):69-73.

192 Revista Mexicana de Ingeniería Biomédica · volumen 34 · número 2 · Agosto, 2013


![SCISCITATOR 2015 · [1]. Riverine communities experience two main types of disturbances: natural disturbances and anthropogenic disturbances. Natural disturbances in riverine ecosystems](https://img.pdfslide.us/doc/110x75/5f27dd3959f0c41da22eeec5/sciscitator-1-riverine-communities-experience-two-main-types-of-disturbances.jpg)