Embed Size (px)
Citation preview

DEVELOPMENT OF A SILICONE MOLD TOOL FOR
INJECTION MOLDING PLASTIC PARTS
A THESIS
PRESENTED IN PARTIAL FULFILLMENT OF THE REQUIREMENT FOR THE
DEGREE OF MASTER OF SCIENCE IN MECHANICAL ENGINEERING
UNIVERSITY OF MINNESOTA
BY
IRFAN TAHIR
ADVISOR
DR. VENKATA GIREESH MENTA
MAY 2020

2
© Copyright by Irfan Tahir 2020

I
Abstract
Injection molding is one of the most popular processing methods for manufacturing plastic
parts. Typically, injection mold tools are made out of metal. The design and development
of these metallic mold tools is a very expensive and lengthy process which means that it is
difficult to incorporate this process into the prototyping stage of a product. Currently, the
most widely researched method used for rapid prototyping of injection mold tools is
additive manufacturing (AM). This project investigates an alternative to AM as a rapid
prototyping method by investigating a cost-effective mold tool made out of silicone. A
robust step by step process of creating a silicone mold tool is presented. To determine the
right plastic to inject into the silicone mold tool, an injection molding simulation is
conducted comparing three types of plastics and their effect on the filling of the mold tool.
Following the simulation, Design of Experiment (DOE) is used to measure the main and
interaction effects of the silicone mold tool’s durometer hardness, geometry, and design
complexity on its performance. Additional DOE studies were conducted to optimize the
injection molding processing parameters for fabricating ASTM D638 Type IV tensile
specimens. From the experiments, it was found that a durometer of Shore A Hardness 40
is the most optimum value for a silicone mold tool. Durometers smaller than that increase
the likelihood of failure by flash and durometers larger than that damage the mold tool
through brittle failure. Design changes were made to the mold tool geometry to use 3D
printed inserts and shorten the length of the runner, the latter of which resulted in ideal
samples without any failures. Comparison of mechanical properties of the silicone mold
test coupons with those produced using a metallic mold tool revealed that there was a 7.3%
decrease in Ultimate Tensile Strength when going from metal to silicone mold tool, better
than those previously reported for some AM mold tools. In conclusion, the silicone mold
tool is a promising alternative to AM mold tools for rapid prototyping of injection molded
parts with certain limitations.

II
Table of Contents
Table of Contents ........................................................................................................... II
List of Tables................................................................................................................ IV
List of Figures ................................................................................................................ V
CHAPTER 1 INTRODUCTION......................................................................................1
1.1 Related Work .............................................................................................................. 3
1.2 Thesis Organization ..................................................................................................... 5
CHAPTER 2 SILICONE MOLD TOOL PROCESS ........................................................6
2.1 Durometer Hardness of Silicone .................................................................................. 6
2.2 Silicone Mold Tool Materials....................................................................................... 7
2.3 Process Flow ............................................................................................................... 8
2.4 Metallic Outer Frame ................................................................................................. 11
CHAPTER 3 INJECTION MOLDING SIMULATION ................................................. 15
3.1 Injection Molding Parameters and Sources of Failure ................................................. 15
3.2 Simulation Using Solidworks Plastics ........................................................................ 18
3.2.1 Simulation Steps ................................................................................................................ 19
3.2.2 Simulation Results ............................................................................................................. 22
CHAPTER 4 DESIGN OF EXPERIMENTS ................................................................. 29
4.1 Measuring Response........................................................................................................ 30
4.2 DOE # 1: Durometer vs. Mold Height vs. Corner Radius ........................................... 32
4.2.1 Deterioration of Mold Tool and Sample Quality ................................................................. 38
4.2.2 Durometer Hardness 60 ...................................................................................................... 40
4.3 DOE #2: Injection Pressure vs. Time vs. Clamping Pressure ...................................... 43
4.3.1 Increasing Clamping Pressure ............................................................................................ 49
CHAPTER 5 FURTHER EXPERIMENTS .................................................................... 52

III
5.1 FDM 3D Printed Insert .............................................................................................. 52
5.2 Center Injection ......................................................................................................... 55
CHAPTER 6 MECHANICAL PROPERTIES ............................................................... 58
CHAPTER 7 CONCLUSIONS ...................................................................................... 64
REFERENCES .............................................................................................................. 67

IV
List of Tables
Table 1: Material properties of different types of silicone ................................................8
Table 2 Sources of failures for the injection-molded part ............................................... 17
Table 3: Injection materials and their explanations ......................................................... 18
Table 4: Properties of the injection materials ................................................................. 19
Table 5: Injection molding simulation results for each injection material ....................... 22
Table 6: Criteria for the success of a sample .................................................................. 30
Table 7: Examples showing corresponding fill percentage with visual representation .... 31
Table 8: Constant variables for DOE #1 ......................................................................... 33
Table 9: Factors and levels for DOE #1 ......................................................................... 35
Table 10: Injection molding results for DOE#1 .............................................................. 36
Table 11: Injection molding parameters for the Durometer 60 mold tool runs ................ 42
Table 12: Constant variables for DOE #2 ....................................................................... 43
Table 13: Factors and levels for DOE #2 ....................................................................... 44
Table 14: Injection molding results for DOE #2 ............................................................. 45
Table 15: Injection molding parameters for the updated experiment............................... 50
Table 16: Injection molding parameters for center injection with outer metal frame ....... 55
Table 17: Mechanical properties comparison with standard deviations ........................... 59
Table 18: Mechanical properties comparison with a 95% confidence level .................... 59

V
List of Figures
Figure 1: Geometric shape of the tensile specimen. All dimensions are in mm .................8
Figure 2: Process flow of making a silicone mold tool .....................................................9
Figure 3: Equipment used for vacuum degassing of the silicone before pouring into the
cast ................................................................................................................................ 10
Figure 4: Making the silicone mold tool: (a) FDM 3D printed mold tool cast (b) Pouring
the liquid silicone into the cast (c) Making sure the liquid is level (d) Final shape of the
mold after curing ........................................................................................................... 11
Figure 5: Arrows showing the direction of deformation during injection ........................ 12
Figure 6: Outer metal frame used to limit mold deformation .......................................... 13
Figure 7: Schematic showing the pieces of the silicone mold tool. The pieces in gray are
made out of metal .......................................................................................................... 13
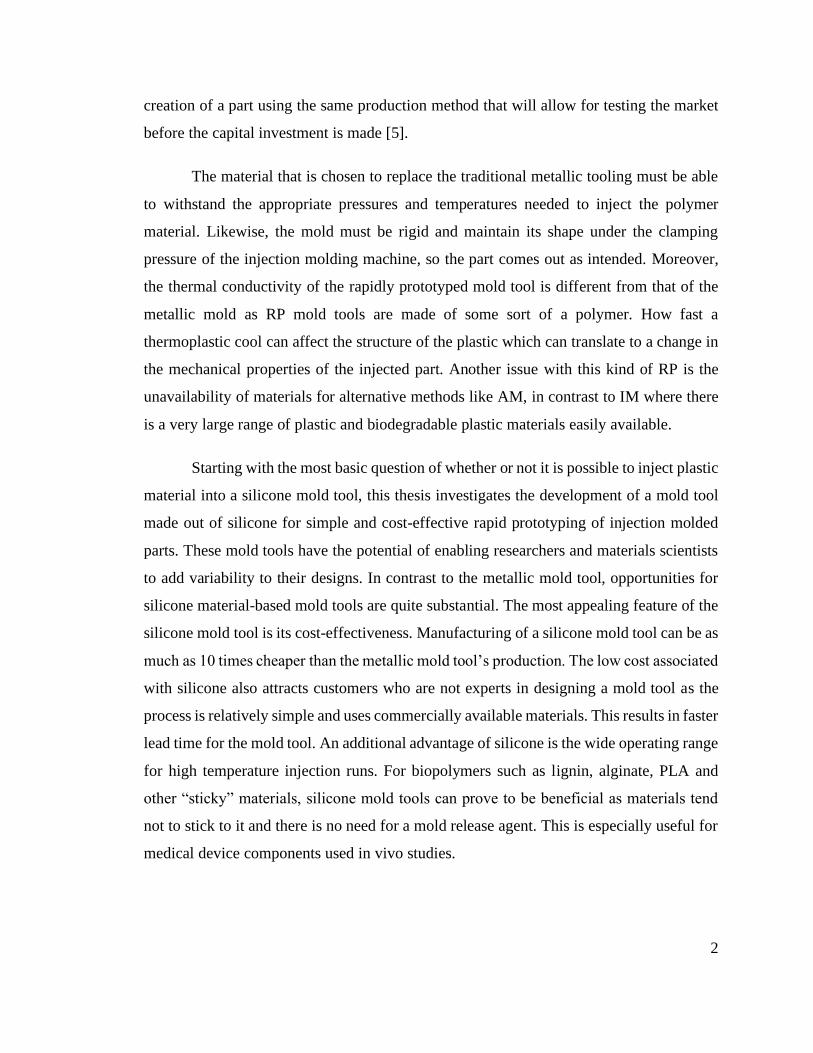
Figure 8: Schematic of the silicone mold in the outer metal frame ................................. 14
Figure 9: Morgan Press G-125T injection molding machine used in the experiments ..... 16
Figure 10: Surfaces were split to prepare the mold for simulation .................................. 20
Figure 11: Schematic showing the tetrahedral meshing of the mold tool in Solidworks
Plastic ............................................................................................................................ 21
Figure 12: Virtual mold represented by outer thin lines and the pink circle showing the
injection point ................................................................................................................ 22
Figure 13: Pressure distribution for HDPE ..................................................................... 24
Figure 14: Pressure distribution for PP ........................................................................... 25
Figure 15: Sink marks distribution for HDPE ................................................................ 26
Figure 16: Sink mark distribution for PP ........................................................................ 27
Figure 17: HDPE samples with the red rectangle showing the sink mark ....................... 28
Figure 18: PP blended with lignin samples showing no sink marks ................................ 28
Figure 19: Screenshot of ImageJ showing the relative scale ........................................... 31
Figure 20: A 40 Durometer mold with a mold height of 16 mm and outside corner radius
of 10 mm. The red arrows show the location of the outside corner radius. ...................... 34
Figure 21: Injection molding process diagram for DOE #1 ............................................ 34

VI
Figure 22: Tree diagram representing factors and levels for DOE #1.............................. 35
Figure 23: Pareto chart for DOE #1 ............................................................................... 38
Figure 24: Main effects plot for DOE #1 ........................................................................ 38
Figure 25: Durometer 30 mold with the edges showing mold damage after only 4 runs . 39
Figure 26: Durometer 40 mold with the edges showing mold damage after only 4 runs . 39
Figure 27: Photo of the sample obtained from Run #1.................................................... 40
Figure 28: Photo of the sample obtained from Run #7.................................................... 40
Figure 29: Durometer 60 mold tool, where the yellow circle shows the location of the
crack .............................................................................................................................. 41
Figure 30: Bottom of the Durometer 60 mold tool. The PP material can be seen leaking to
the bottom of the mold due to crack formation ............................................................... 42
Figure 31: Pareto chart for DOE #2 ............................................................................... 47
Figure 32: Main effects plot for DOE# 1 ........................................................................ 47
Figure 33: Interaction plot for DOE #2 .......................................................................... 48
Figure 34: Run # 2 sample from DOE #2 showing the leakage of material from runner . 49
Figure 35: Thermal camera photos taken before injecting. The scale on the bottom is in
°F .................................................................................................................................. 50
Figure 36: Photo of the sample obtained from Run #1.................................................... 51
Figure 37: Photo of the sample obtained from Run #2.................................................... 51
Figure 38: 3D printed PLA inserts ................................................................................. 52
Figure 39: Updated mold tool design to incorporate the 3D printed inserts ..................... 52
Figure 40: Sample showing 3D printed PLA insert melted with PP after solidifying ...... 53
Figure 41: Thermal camera photo of the Nylon insert mold tool before injecting. The
scale is in °F .................................................................................................................. 53
Figure 42: 3D printed Nylon insert mold tool with the outer metal frame ....................... 54
Figure 43: Sample obtained from 3D printed Nylon insert mold tool ............................. 54
Figure 44: Updated mold tool geometry eliminating the runner...................................... 55
Figure 45: Sample obtained from center injection with the outer metal frame ................ 56
Figure 46: Injection molding setup without the outer metal frame .................................. 56

VII
Figure 47: Thermal camera photo of the mold tool when placed in the injection molding
machine. The scale is in °F ............................................................................................ 57
Figure 48: Sample obtained with center injection without outer frame ........................... 57
Figure 49: Samples cut in half for tensile testing ............................................................ 57
Figure 50: Jaw grippers on the ATS tensile testing machine holding the sample in place58
Figure 51: Metal mold samples after tensile testing ........................................................ 59
Figure 52: Stress vs. Strain plot for metal mold tool ....................................................... 60
Figure 53: Stress vs. Strain plot for silicone mold tool ................................................... 60
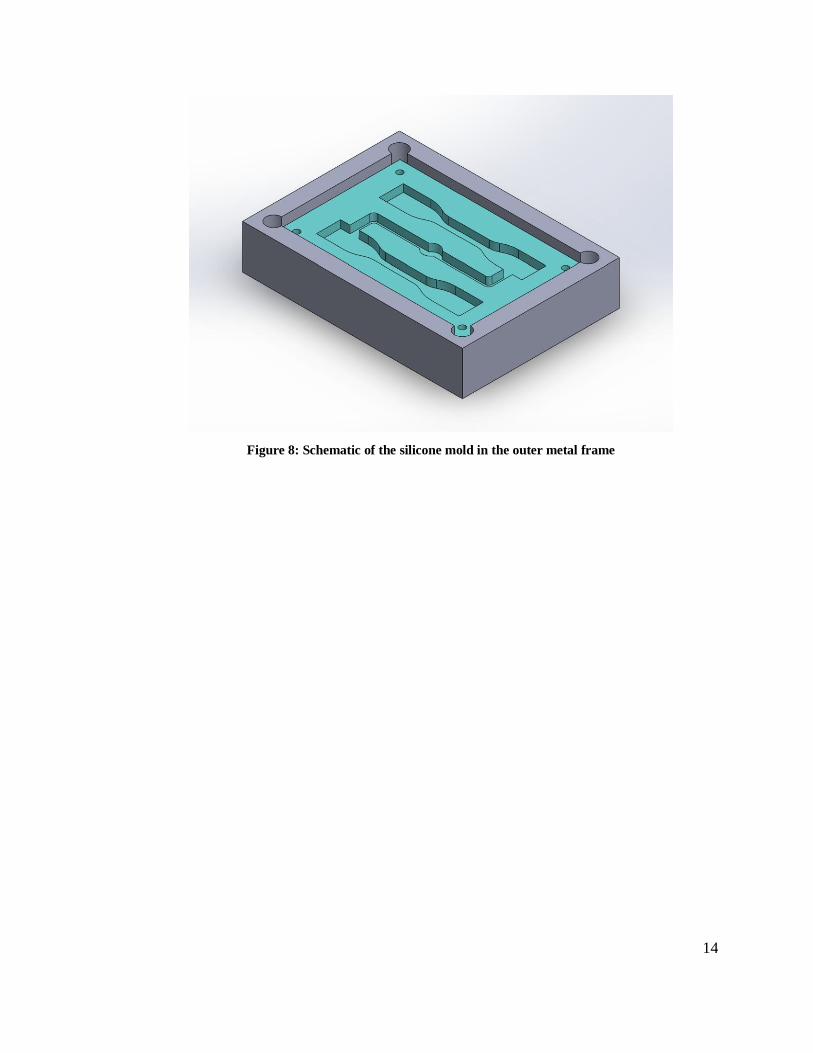
Figure 54: Comparison of Sample 3 Stress vs. Strain plots ............................................. 62
Figure 55: Comparison of UTS for all 10 samples ......................................................... 62
Figure 56: Comparison of average UTS for all 10 samples............................................. 63

1
CHAPTER 1
INTRODUCTION
Injection molding (IM) is a widely used polymer processing technique for
fabricating plastic parts of different shapes and profiles. The main working principle of the
process involves injecting molten material into a mold tool where it cools and hardens to
take the shape of the mold. Due to the ability to mass-produce at high speeds, high accuracy
for complicated shapes and lower mass production costs, the IM process has become one
of the most critical processing methods in the polymer industry [1]. In addition to this,
plastic parts produced via injection molding offer excellent repeatability [2]. Some of the
products manufactured using injection molding are bottles, toys, automotive components,
storage containers, and medical device components.
One of the major limitations of the IM process is high initial start-up costs during
the design and development stage of a product. These high costs and large lead times mean
that IM process technology is suitable only for large scale production for a minimum of
1000 parts, with the added pressure on the manufacturer of getting the mold tool right the
first time [3]. Any design improvements or modifications of the part at later stages is quite
difficult and expensive. Overall, the design of the mold tool is a time-consuming and
expensive stage in the product life cycle. Hence, injection molding is typically avoided in
making prototypes [4].
Rapid prototyping (RP) is a well-known process that has come to light with the
advancements in additive manufacturing (AM) and lower cost associated with Computer
Numerical Control (CNC) machining. The molds that are created using RP are created with
shorter lead time and at a fraction of the cost when compared to traditional tooling. The
decreased lead time for tooling allows for more time to modify or test the part and allows
more design iterations. The RP technology is very useful in the pre-series production: the
2
creation of a part using the same production method that will allow for testing the market
before the capital investment is made [5].
The material that is chosen to replace the traditional metallic tooling must be able
to withstand the appropriate pressures and temperatures needed to inject the polymer
material. Likewise, the mold must be rigid and maintain its shape under the clamping
pressure of the injection molding machine, so the part comes out as intended. Moreover,
the thermal conductivity of the rapidly prototyped mold tool is different from that of the
metallic mold as RP mold tools are made of some sort of a polymer. How fast a
thermoplastic cool can affect the structure of the plastic which can translate to a change in
the mechanical properties of the injected part. Another issue with this kind of RP is the
unavailability of materials for alternative methods like AM, in contrast to IM where there
is a very large range of plastic and biodegradable plastic materials easily available.
Starting with the most basic question of whether or not it is possible to inject plastic
material into a silicone mold tool, this thesis investigates the development of a mold tool
made out of silicone for simple and cost-effective rapid prototyping of injection molded
parts. These mold tools have the potential of enabling researchers and materials scientists
to add variability to their designs. In contrast to the metallic mold tool, opportunities for
silicone material-based mold tools are quite substantial. The most appealing feature of the
silicone mold tool is its cost-effectiveness. Manufacturing of a silicone mold tool can be as
much as 10 times cheaper than the metallic mold tool’s production. The low cost associated
with silicone also attracts customers who are not experts in designing a mold tool as the
process is relatively simple and uses commercially available materials. This results in faster
lead time for the mold tool. An additional advantage of silicone is the wide operating range
for high temperature injection runs. For biopolymers such as lignin, alginate, PLA and
other “sticky” materials, silicone mold tools can prove to be beneficial as materials tend
not to stick to it and there is no need for a mold release agent. This is especially useful for
medical device components used in vivo studies.

3
1.1 Related Work
While considerable work has been done on the rapid prototyping of injection mold
tools using AM, not much has been reported in literature on the development of silicone-
based mold tools. As AM is the current standard for rapid prototyping of mold tools, it is
worth highlighting some of the work that has been done in this area.
In a comparative study of rapid and traditional tooling for plastic injection molding,
Mendible et al. reported that additively manufactured molds last between 10 and 500
production runs, depending on the type of AM [6]. This shows that the quality of the mold
varies greatly depending on the type of AM technique. Direct metal laser sintering (DMLS)
three-dimensional (3D) printing produced excellent results with the molds lasting for 500
production runs whereas parts produced using jetted photopolymer (PolyJet) 3D printing
failed after 10 production runs. Damle et al. showed that the mechanical properties of
plastic parts injection mold tools produced using Stereolithography (SLA) were in the
range of 94% to 98% when compared to metal mold tools [7].
In 2017, Bartlett investigated the effects on the mechanical properties of
Polypropylene (PP) plastic parts produced using Fused Deposition Modeling (FDM) with
Digital ABS material [8]. The results showed that the Ultimate Tensile Strength (UTS)
decreased by 11%, Young’s modulus of the parts increased by 9.4% and strain at break, or
ductility of the parts, decreased significantly by 87% when compared to parts made using
a metallic mold. Annealing the samples before tensile testing helped increase ductility but
it was not as good as steel mold parts. In 2019, Simpson et al. also used Digital ABS with
PolyJet 3D printing and investigated the effects of different 3D printing materials and the
injection material on the mold tool [9]. It was reported that the strain at break of Digital
ABS was consistent with that of the steel mold, but stiffness was reduced. These results
are relevant to this project as Simpson et al. used Polypropylene as the injection material
for their experiments, the same one that is used in this project.

4
Another technique for rapid prototyping injection mold tools is to use composites
and additively manufactured inserts, also known as steel/plastic hybrid molds. In 1999,
Dawson et al. investigated composite mold tools made out of atactic polystyrene and
compared the properties of the plastic sample with a traditional steel mold [10]. Results
showed that parts produced using a composite mold had 17% lower UTS, similar Young's
modulus, 19% higher flexural strength and 20% lower ultimate elongation than parts
produced using a steel mold. In 2017, Mischkot et al. used Design of Experiments (DOE)
to study a disk-shaped insert made of PolyJet 3D printing and brass [11]. The material that
was injected into the mold was Low-Density Polyethylene (LDPE). The authors reported
that a cooling time of 50 seconds was necessary to enable the injection of the parts without
any major deformations or discoloration. The inserts lasted between 25 and 116 production
runs with a cycle time of 300 seconds. The authors concluded that an FDM 3D printed
insert is a viable option for medium-sized molds (80 x 60 x 20 mm3). Mendible et al.
suggested that the failure of Polyjet inserts can be minimized by modifying the draft angle,
surface finish, and injection pressure [6].
One of the most critical properties to consider is the thermal conductivity of the
mold material. Silicone, AM, and metal molds all have a different thermal conductivity.
This difference in thermal conductivity means that AM mold tools retain a greater amount
of heat when compared to steel or aluminum mold tools which signifies the need for a DOE
study to find the right injection molding parameters for a specific mold tool [9]. Kamal et
al. showed that changing the processing parameters can result in a dimensional shift of the
residual stresses in the injected plastic part [12]. This can lead to a higher level of
crystallinity which affects the degree of organization within the material that can have
varying effects on the toughness, density, hardness, modulus of elasticity, and yield
strength of the injected plastic [13].
Prior studies have shown that conducting simulation for the injection molding
process is a challenging task [14] [15]. In 1999, Dupret et al. proposed a numerical method
based on front tracking, automatic remeshing, and extrapolation [16]. Using this method,

5
they developed MOLDSYS, one of the first software designed specifically for injection
molding simulation. Since then, there has been a number of studies presenting simulation
data for all kinds of injection molding domains. In 2011, Guo et al. analyzed the
deformation of the mold tool core during the filling stage to study the effects of changing
materials and gate design [17]. In 2013, Kim and Lee presented a simulation technique to
predict the life of injection mold tools and compared their simulation results with fatigue
testing [18]. For their comparative study in 2015, Mendible et al. successfully used
Autodesk Simulation Moldflow Insight to compare the surface temperature, shrinkage,
flow, and core displacement of FDM 3D printed inserts [6]. With the advancements in
commercially available simulation software for injection molding, it is critical that a
simulation study is performed before conducting experiments.
Using silicone to cast shapes of various geometry is an age-old technique that has
multiple U.S. patents [20]. However, it should be noted that there is almost no literature
available for silicone or silicone inserts for the purposes of injection molding. In this
regard, the work that is done in this thesis is the first of its kind and can be categorized as
novel.
1.2 Thesis Organization
This thesis is organized as follows. Chapter 2 discusses the materials used to create
the silicone mold tool and outlines a step by step process of creating one. This chapter also
talks about expected deformation of the silicone mold tool during the injection molding
process and the approach taken to mitigate those deformations. Chapter 3 outlines the steps
for the injection molding simulation its results prior to conducting experiments. Next,
Chapter 4 discusses the factors, levels and responses of the Design of Experiment (DOE)
studies and analysis of their results. Based on the lessons learned from the DOE studies,
Chapter 5 extends those concepts to make further changes in the mold tool’s geometry to
obtain a testable sample for tensile testing. Chapter 6 makes a comparison between the
mechanical properties of samples obtained using silicone and metal mold tools. The
concluding discussion is given in Chapter 7

6
CHAPTER 2
SILICONE MOLD TOOL PROCESS
An elastomer is a viscoelastic polymer with weak intermolecular forces. Due to
these weak intermolecular forces, it generally has a low Young’s modulus and a higher
deformation rate compared to other materials [20]. A common euphemism in the materials
science world for elastomers is “rubber-like” material. Silicone is also an elastomer, and
hence exhibits many of the same properties as rubber. Some of the advantages that silicone
has over other materials is that it is non-reactive, useful over extreme temperatures (−50 to
295 °C), easily moldable into different shapes and inexpensive when compared to ceramics
or metals. Due to these properties, silicone can be found in many industrial and consumer
products such as insulation, automotive parts, electronics, medical devices, and food
storage [21].
In its native state, silicone is a highly adhesive liquid. To convert it from a liquid to
a solid, it must be cured, which is a chemical process involving the cross-linking of the
polymer chains. The materials used in this project are cured using a platinum-based and
tin-based cure system. In this chemical process, the siloxane polymer reacts with a platinum
or tin catalyst, which in turn creates an ethyl bridge between the two. This process is
advantageous over other curing methods due to its quick reaction time and the lack of
byproducts.
2.1 Durometer Hardness of Silicone
Hardness is the measure of a material’s resistance to localized plastic deformation.
For certain materials like polymers, rubber and in this case, silicone, an increase in hardness
is inversely related to the ductility of the materials [22]. In other words, as the hardness
number increases in these materials, they are more prone to brittle failure.

7
There are various experimental methods to measure a material’s hardness value.
For materials like silicone rubber, the ASTM D412 standard is followed to calculate a value
known as Shore A Hardness or Shore Durometer [23]. This method, like other hardness
tests, applies a given force on the materials and measures the depth of the indentation
caused by the given force. For accurate measurements, a hardened steel rod of about 1.1
mm in diameter with a truncated 35° cone of 0.79 mm diameter must be used to cause the
indentation. Typically, metallic molds made out of aluminum or steel incorporate different
methods for measuring the hardness numbers such as the popular Rockwell hardness B
scale. Consequently, the indentation depth on metallic molds is much less than on silicone
rubber as the former is rigid and inhibits a stark difference in material properties.
2.2 Silicone Mold Tool Materials
The silicone materials used in this project were sourced from the company Smooth-
On from their location in Pennsylvania, United States [24]. Specifically, the material is
branded under the Mold StarTM and Mold MaxTM that comes in two parts. To successfully
cure the silicone from liquid to solid, the two parts must be mixed together in a specific
ratio1. In total, one Mold StarTM silicone of Shore A Durometer Hardness 30 and two Mold
MaxTM silicone of Shore A Durometer Hardness of 40 and 60 respectively were used in
this project. The material properties of all three are listed in Table 1.
1 Detailed process is presented in section 2.3

8
Table 1: Material properties of different types of silicone
Silicone Specific
Gravity
(kg/cm3)
Shore A
Hardness
Tensile
Strength
(MPa)
100%
Modulus
(MPa)
Elongation
at Break
(%)
Useful
Temperature
Range (°C)
Mold
StarTM 30
1120 30 2.9 0.4 440 -53 to 232
Mold
MaxTM 40
1140 40 3.8 1.3 250 -53 to 205
Mold
MaxTM 60
1450 60 2.7 2.3 132 -53 to 294
2.3 Process Flow
The shape chosen for the mold tool was a simple dog bone shape based on the
ASTM D638 Type IV standard which is used for tensile testing of plastic materials. The
length of the part (115 mm) falls within the boundaries of the injection molding machine
available at the university’s facilities. A standard runner geometry was used [25].
Figure 1: Geometric shape of the tensile specimen. All dimensions are in mm
The flow diagram of the mold making process is shown in Figure 2. The first step
in creating a mold tool made out of silicone is designing the mold cast in a Computer-
Aided Design (CAD) software with accurate dimensions. After that, the CAD file is saved

9
as a Standard Tessellation Language (STL) file format which is converted into a G-Code
using an open source slicing software called Cura. With the G-code ready, now the mold
tool cast can be 3D printed. FDM was used to produce all the most tool casts for this project
with a Creality Ender 3 printer and Hatchbox PLA as the material. It should be noted that
the strength of the mold tool cast is not very important here, as a very low infill (20% or
more) can be used to save printing material. The important factor to consider is the part
finish as that will be reflected in the silicone mold tool.
Figure 2: Process flow of making a silicone mold tool
With the FDM 3D printed mold cast ready, the liquid silicone materials can now be
poured into the cast. The silicone material used in this project came in two parts which are
used to start the curing reaction. For an accurate mold type with minimal inconsistencies,
the following steps were followed for each mold:
1. Both Part A and Part B were poured into a measuring cup according to the
proportions specified for the specific durometer. For example, in the case of
MoldStarTM 40, the proportions were 10 grams of Part A for every 1 gram of Part
B. After pouring, both parts were stirred for 180 seconds.
2. To avoid entrapped air and air bubbles in the mold tool, vacuum degassing is
recommended. The mixing container was put in a vacuum chamber for 180 seconds
(Figure 3).
3. A level tool was used to make sure the surface on which the FDM 3D printed cast
is sitting was leveled. Then, the material was slowly poured into the FDM 3D
printed cast at a single point. As the silicone material filled the cast, pouring was
stopped.

10
4. The mold was left to cure for exactly 24 hours and then meticulously removed
from the FDM 3D printed cast using plastic pry tools.
Figure 3: Equipment used for vacuum degassing of the silicone before pouring into the cast
(a) (b)

11
(c) (d)
Figure 4: Making the silicone mold tool: (a) FDM 3D printed mold tool cast (b) Pouring the liquid
silicone into the cast (c) Making sure the liquid is level (d) Final shape of the mold after curing
2.4 Metallic Outer Frame
Before doing injection runs using the silicone mold tool, it was predicted that the
mold will deform in multiple directions as shown in Figure 5. The way the injection
molding machine is set up, the mold tool is constraint only from the top and bottom. This
means that the flexible silicone mold tool has room to deform.

12
Figure 5: Arrows showing the direction of deformation during injection
To mitigate this problem, a metallic outer frame was designed in CAD and
machined using a CNC machine. The inspiration for this design came from FDM 3D
Printed mold tools where an outer frame is often added to support the mold [8]. The
machined outer frame made out of 6061 Aluminum Alloy is shown in Figure 6. The mold
was placed in the outer frame and then a top metallic plate was placed on top of the mold
tool (Figure 7). This three-piece assembly is then placed in the injection molding machine.

13
Figure 6: Outer metal frame used to limit mold deformation
Figure 7: Schematic showing the pieces of the silicone mold tool. The pieces in gray are made out of
metal
14
Figure 8: Schematic of the silicone mold in the outer metal frame

15
CHAPTER 3
INJECTION MOLDING SIMULATION
Designing an injection molding tool might require several iterations, based on the
complexity of the part being produced. One way to avoid the loss of time and money is to
incorporate injection molding simulation into the process. Nevertheless, before jumping
into the simulation process, it is imperative to talk about the most important injection
molding parameters and possible sources of failure associated with them.
3.1 Injection Molding Parameters and Sources of Failure
There are a number of injection molding parameters that can have an influence on a plastic
part’s quality. Out of these, the most significant ones are the following:
● Nozzle Temperature: The temperature of the nozzle from which the plastic enters
the gate of the mold tool.
● Barrel Temperature: The temperature of the container in which solid plastic pellets
are inserted. Usually, this temperature is slightly lower than the nozzle temperature.
● Injection Pressure: One of the most important parameters, it is the pressure at which
the melted plastic enters the mold tool. This pressure is provided by the hydraulic
system of the injection molding machine.
● Clamping Pressure: It is the pressure that presses the top and bottom part of the
mold tool together.
● Injection Time: The amount of time the melted plastic flows through the mold tool
cavity.
● Mold Tool Temperature: The temperature of the mold tool when plastic is injected
into it. The nozzle, plate, and ambient temperature have a large effect on it.
● Plate Temperature: The temperature of the bottom surface on which the mold tool
rests.

16
● Hold Time: The time during which the mold tool sits in the injection molding
machine so that the plastic can solidify.
● Cycle Time: The total time it takes for injecting one plastic sample to the next one.
This also includes the hold time and the time it takes to take the sample out of the
mold.
Figure 9: Morgan Press G-125T injection molding machine used in the experiments
A mold tool can have different geometric parameters based on the application of
the injection molded part. Some mold tools also include cooling channels to control the
cooling rate of the product, as a constant cooling rate is linked to greater part quality [26].
During an injection mold process, there are several key factors that can affect the part
quality and lead to failure. These factors are summarized in Table 2.

17
Table 2 Sources of failures for the injection-molded part
Defect Description Possible Causes
Blister Raised zone on the surface of
the injected part
Lack of cooling around the mold tool or
excessively high nozzle temperature
Burn marks Black or brown burnt areas on
the injected part, usually
located at furthest points from
the gate
Lack of ventilation or injection speed is
too high
Color Streaks Uneven color distribution The plastic material and colorant aren’t
mixing. Applicable to only colored parts
Contaminates Foreign particle embedded in
the injected part
Particle on the tool surface. In the case
of AM mold tool, a high nozzle
temperature can melt part of the mold
tool
Flash Excess materials, leakage of
material outside the allowable
injected area
Tool damage, too much injection
pressure, low clamping pressure or too
much injection time
Flow marks Off tone wavy lines or patterns
on the injected part
Injection pressure too low, not giving
enough hold time for the material to
cool down and solidify
Jetting Injection part has a deformed
shape due to the turbulent flow
of the plastic material
Injection pressure too high, gate position
not in the middle
Polymer
degradation
Polymer breakdown due to
oxidation of the material
Excess moisture in the pellets or the
barrel temperature is too high

18
Sink marks Localized depressions in the
plastic part
Hold time or injection pressure too low.
Cooling time is too short. It can also be
caused by a high nozzle temperature.
Short shot Partial filling of the mold tool Lack of material, injection pressure or
time too low.
3.2 Simulation Using Solidworks Plastics
There are two main categories of simulation software for injection molding
processes. They are available as independent software whose sole purpose is to carry out
simulations related to plastic injection molding or they are available as an add-on for
existing CAD packages such as Autodesk or Solidworks. Simulation for plastic injection
molding is a relatively new technique as compared to other types of simulations such as
structural or fluids.
Solidworks Plastics is an add-on for the popular CAD software, Solidworks by
Dassault Systèmes. In short, Solidworks Plastics simulates how melted plastic flows
through the injection mold tool to predict the filling time, mold temperature and
manufacturing-related defects like shrinkage or warpage. Initial simulation runs showed
that unfortunately, Solidworks does not give information on mold tool defects or the effect
of flow on different mold materials. The main purpose of using Solidworks Plastics for this
project was to see how changing the injection material will have an effect on the quality of
the injected part. The explanations for the three injection materials and their properties are
illustrated in Table 3 and Table 4.
Table 3: Injection materials and their explanations
Material Type Explanation [27]
High-Density
Polyethylene
One of the most commonly used plastics in the world for consumer
products. Preferred due to its high ductility, tensile strength, impact

19
(HDPE) resistance, and recyclability.
Low-Density
Polyethylene
(HDPE)
Similar to HDPE in terms of part quality but with less density. Ideal
for mold tools with thin cavities.
Polypropylene
(PP)
Preferred due to its resistance to reactions with water, acids, and
detergents. Also melts at a higher temperature than HDPE and
LDPE.
Table 4: Properties of the injection materials
Property HDPE LDPE PP
Melting Point (°C) 210 220 230
Specific Heat (kJ/kg°C) 1.9 2.6 1.8
Thermal Conductivity
(W/m°C)
0.44 0.30 0.15
Young’s Modulus
(MPa)
900 125 1000
Poisson’s Ratio 0.42 0.40 0.40
3.2.1 Simulation Steps
Due to the lack of resources available online regarding Solidworks Plastics
specifically, detailed explanations of each critical step are provided so that the reader can
benefit from this project.
Firstly, it’s important to make sure that the mold tool is split into appropriate parts
instead of one solid body. This is important because it enables the user to specify the cavity

20
and the mold tool to Solidworks Plastics. If the mold tool is one solid body, the software
cannot automatically detect those parts (Figure 10).
Figure 10: Surfaces were split to prepare the mold for simulation
Once the mold is split into two (or more) parts, it is ready for meshing. A mesh is
used in finite element modeling to subdivide the part geometry into smaller domains called
elements, over which the governing equations of interest are solved. There are two types
of mesh that can be used during the simulation of injection molding plastic parts. The first
one is called a shell mesh that can be used for parts with thin walls. The second type is
called a solid mesh which provides more accurate results for any type of model, thin or
thick. As the mold tool used in this project does not have any thin walls, a solid mesh type
is used (Figure 11). After specifying the cavity and the mold, further detailed mesh settings
can be selected. For the purposes of this project, a tetrahedral mesh with a minimum
element size of 0.3 mm was used with 28,456 elements.

21
Figure 11: Schematic showing the tetrahedral meshing of the mold tool in Solidworks Plastic
The next step is to select the plastic material that will be injected into the mold tool.
Using the Solidworks in-built library, the first plastic HDPE was selected. The software
also enables the user to specify the mold materials. However, after running several
simulations, it was obvious that changing the model material has negligible effects on the
injection molding results. For all three simulations, the mold material was set to be
Aluminum Alloy 6061.
Once the mesh and the materials have been specified, the process parameters such
as injection pressure, clamping pressure, mold temperature or hold time can be set. The
injection pressure used for the simulations was 1500 psi or 10.1 MPa (the lowest injection
pressure setting on the real injection mold machine which was used to carry out the
experiments). Finally, the injection point was specified. Please note that for mold tools
with multiple gates, multiple injection points can be specified, and the size of the injection
point can also be adjusted. For this mold tool, an injection point of 2 mm in the center of
the mold was chosen (Figure 12).

22
Figure 12: Virtual mold represented by outer thin lines and the pink circle showing the injection
point
3.2.2 Simulation Results
While keeping all the other injection molding parameters constant, a comparison
was made between HDPE, LDPE and PP so that one of them can be selected for the
experiments with the silicone mold tool. The results of these simulations are summarized
in Table 5.
Table 5: Injection molding simulation results for each injection material
Property HDPE LDPE PP
Filling Time (s) 2.2772 2.1143 2.1060
Inlet flow rate (cm3/s) 7.71 7.83 7.73
Pressure at the end of fill (MPa) 9.79 11.31 8.34
Max shear stress (MPa) 0.0914 0.1125 0.0762
Temperature at the end of fill (°C) 209.62 219.69 229.92

23
It was found that all three materials had almost the same filling time, with PP filling
the mold tool at the fastest rate of 2.106 seconds. A similar trend was observed for the inlet
flow rate which remained almost unchanged. Comparing this with the experimental results
of a previous study involving PP, it was found that the experimental filling time was 88%
higher for HDPE and 84% higher for PP [28] [29]. These discrepancies can be explained
by the fact that in the experiments, an injection pressure of 3000 psi was used, which is
double of the one used in the simulation. The difference can also be attributed to the
temperature of the mold tool or surface finish of the cavity as the metal mold tool used in
experiments was produced using CNC machining.
The pressure at the end of the filling for PP was 14.3% less than HDPE and 26.25%
less than LDPE. This is an important property to take into account while experimenting
with the silicone mold tool as the goal is to minimize the amount of pressure used to fill
the mold so that the chances of mold deformation and flash are low. As shown in Figure
13 and Figure 14, not only the maximum pressure was lower in PP, the pressure was also
distributed much more evenly than in HDPE.
To avoid deformation of part, the shear stress of the melted plastic as it travels
through the mold cavities should also be minimized to avoid damages to the mold. In this
case, PP was again the material with the least maximum shear stress value at 0.0762 MPa,
as compared to 0.0914 MPa and 0.1125 MPa for HDPE and LDPE respectively. The
temperature at the end of the fill was highest in PP at 229.92 °C. Higher temperatures can
lead to a higher concentration of sink marks in the part, as illustrated by Figure 15 and
Figure 16. In the plot, it can be observed that while PP has a lower maximum size for the
sink mark at 0.092 mm, the concentration of those sink marks is higher than that of HDPE.

24
Figure 13: Pressure distribution for HDPE

25
Figure 14: Pressure distribution for PP

26
Figure 15: Sink marks distribution for HDPE

27
Figure 16: Sink mark distribution for PP
Comparing these with the experimental results, the sink marks for HDPE were
observed in only 1 out of 5 injected samples as shown in Figure 17 [28] [29]. When there
were sink marks, their size was less than the ones obtained through simulation. In a
previous study involving PP blended with a biopolymer lignin, no sink marks were
observed in the test samples as shown in Figure 18. At a later stage in the project, 5 PP
samples were injected into a metal mold tool using the same injection molding parameters
as the simulation. Those samples also did not show any sink marks as shown in Figure 51.

28
Figure 17: HDPE samples with the red rectangle showing the sink mark
Figure 18: PP blended with lignin samples showing no sink marks
After evaluating the results, PP was chosen as the material of choice for this project
out of the three options due to its low magnitude and distribution of pressure. The pressure
distribution plot for PP showed that most of the high pressure was distributed in the gate
area, whereas for HDPE, it carried to the part itself. Even though the size of the sink marks
for PP were larger than those for HDPE, the location of those sink marks was in the ends
of the tensile sample, where the tensile machine grips the sample. As there are no sink
marks in the neck of the sample it is not a critical source of concern for the silicone mold
experiments.

29
CHAPTER 4
DESIGN OF EXPERIMENTS
The term “experiment” is defined as an operation or procedure carried out under
controlled conditions in order to discover an unknown effect [30]. The scientific approach
to experiments avoids trial and error and instead proceeds in a systematic manner to
determine which process inputs have a significant impact on the process output.
Additionally, through experiments, the target level of those inputs can be found to achieve
the desired output. Design of Experiment (DOE) is the term used for such a systematic
approach. Designed experiments are not only useful in determining the relationship
between inputs and outputs but also, they are powerful tools using which manufacturing
costs and unnecessary revisions can be avoided [31]. In every DOE, there are three main
aspects of the process that are analyzed:
1. Factors: The inputs to the process. Factors can either be controllable or
uncontrollable variables. These are the main variables being analyzed. In this
project, factors can be variables such as injection molding parameters, mold tool
geometry or the durometer hardness of the mold tool.
2. Levels: The actual values for each factor in the process. Examples include an
injection pressure of 1500 psi, a durometer of 30 or an injection time of 5 seconds.
3. Response: The output of the process. Examples include fill percentage, quality of
the part or size of sink marks.
A successful injection run using a silicone mold tool should give a sample of the same
quality as the one obtained using the metal mold tool. To achieve this, a number of factors
were tested in various designed experiments. In total two DOE studies were conducted to
obtain the most optimum sample with a high repeatability rate.

30
4.1 Measuring Response
Visually, it is very easy to tell if an injection run is successful or not by looking at
the fill of the mold tool cavity, deformation of the mold tool or surface finish of the injected
sample. However, a quantitative measure of an injection run’s success was needed so that
appropriate DOE analysis can be performed once the experiments were concluded. This is
extremely important because a combination of two factors can affect the response of the
process [32].
Depending on the mold geometry and injection molding parameters, an overfill or
underfill of the Polypropylene plastic was expected. To quantify this, overfill or underfill,
a response variable “fill percentage” was introduced. Table 6 illustrates the difference
between a successful and unsuccessful injection run in relation to fill percentage of the
mold tool.
Table 6: Criteria for the success of a sample
Fill Percentage Injection Type Outcome
100% Ideal fill Success
< 100% Underfill Failure
> 100% Overfill Failure
One way to quantify this response was to calculate the surface area of each sample
and compare it to the surface area of the ideal sample. Using the 3D CAD model of the
mold tool, the surface area of the cavity was measured which was categorized as a 100%
fill percentage. To find the surface area of each sample, a photo of the sample was taken
from the same height. After taking the photo, the background was isolated and using the
image processing software ImageJ, the surface area was measured. By measuring a real
distance on the sample, a relationship was established in ImageJ of known distance vs.
distance in pixels (Figure 19). Depending on the type of sample (underfill or overfill), this

31
surface area was compared to the original 100% fill percentage and associated with a fill
percentage of its own using Equation 1.
𝑃𝑒𝑟𝑐𝑒𝑛𝑡𝑎𝑔𝑒 𝐼𝑛𝑐𝑟𝑒𝑎𝑠𝑒 = 𝐹𝑖𝑛𝑎𝑙 𝐴𝑟𝑒𝑎 − 𝐼𝑑𝑒𝑎𝑙 𝐶𝑎𝑠𝑒 𝐴𝑟𝑒𝑎
𝐼𝑑𝑒𝑎𝑙 𝐶𝑎𝑠𝑒 𝐴𝑟𝑒𝑎∗ 100 (1)
Figure 19: Screenshot of ImageJ showing the relative scale
Table 7: Examples showing corresponding fill percentage with visual representation
Sample # Area (in2) Fill Percentage (%) Image
Ideal
Case
6.309 100
1 10.419 165

32
2 11.041 175
3 6.948 110
For samples # 1 and 2 with an overfill, this technique gave appropriate results.
However, for sample # 3 with an underfill, this technique proved to be problematic. As
illustrated by the figure of sample # 3, during an underfill, the pixels that are outside the
mold cavity are indistinguishable by ImageJ. This means that even though quantitatively
the fill percentage is close to 100%, in reality, it is not close to an ideal sample when
compared to the ideal case in Table 7. Hence, a combination of ImageJ and visual
inspection was used to assign a fill percentage number to each sample.
4.2 DOE # 1: Durometer vs. Mold Height vs. Corner Radius
The purpose of the first DOE was to determine the right durometer hardness for the
silicone mold tool. A number of variables were kept constant during the DOE studies.
Keeping all the injection molding parameters mentioned in Chapter 3 constant is difficult.
For example, the controller of the nozzle and the barrel temperature has a steady-state error
of 5 °C. However, efforts were made to make sure that the variables are as close to the
constant value as possible with a minimum error. The parameters which were selected to
be constant during DOE study #1 are given in Table 8.

33
Table 8: Constant variables for DOE #1
Parameter Value
Nozzle Temperature (F) 440
Barrel Temperature (F) 420
Plate Temperature (F) 250
Hold Time (min) 4
Injection Pressure (psi) 1500
Injection Time (sec) 5
Clamping Pressure (psi) 8000
Material PP
A DOE study was conducted involving 30 and 40 durometer hardness. Two more
factors were chosen along with the durometer, namely the height of the silicone mold tool
and the outside corner of the mold cavity (Figure 20).
The reason for selecting the height of the mold tool as a factor was to investigate
whether having more material between the mold cavity and the bottom of the mold will
have any effect on the rigidity of the mold. The principle is analogous to a sheet of rubber,
where a thicker sheet of rubber requires more force to deform. Secondly, the outside corner
radius, as shown in Figure 18, was investigated to see if increasing the angle of the curve
where the melted plastic flows from the runner to the tensile specimen will help the plastic
flow with ease.
The reason for choosing 16 mm as the minimum value for mold height was because
this is the same height used for the metal mold tool and it is suited well for the injection

34
molding machine used in this project. The maximum of 26 mm is chosen to see the effects
of increasing 10 mm in the mold height for the injected sample. The reason for choosing
an outside corner radius of 5 mm and 10 mm was the same where 5 mm was the standard
for metal mold tool and 10 mm was chosen as double of that to see the effect of the plastic
as it flows through the outside corners.
Figure 20: A 40 Durometer mold with a mold height of 16 mm and outside corner radius of 10 mm.
The red arrows show the location of the outside corner radius.
Figure 21: Injection molding process diagram for DOE #1
The process diagram for this injection molding experiment can be seen in Figure
21. The three factors are also called the control factors because levels of these were
changed in the experiments and their effect on the response was measured. As there are
three factors with two levels each, the DOE requires 23 = 8 injection runs for a full

35
factorial design study. The tree diagram in Figure 22 and Table 9 shows the number of
runs and their respective combinations.
Table 9: Factors and levels for DOE #1
Factors Durometer Mold Height (mm) Outside Corner
Radius (mm)
Levels 1 30 16 5
2 40 26 10
Figure 22: Tree diagram representing factors and levels for DOE #1

36
Table 10: Injection molding results for DOE#1
Run # Durometer Mold Height
(mm)
Outside Corner
Radius (mm)
Fill Percentage (%)
1 30 16 5 145
2 30 16 10 128
3 30 26 5 135
4 30 26 10 132
5 40 16 5 119
6 40 16 10 109
7 40 26 5 122
8 40 26 10 111
After running the experiments and calculating the surface area of each test sample, the
fill percentage was calculated using ImageJ or visually inspected and input into Minitab, a
statistical analysis software. Using this software, the results can be analyzed in a number
of ways. Techniques for statistical analysis of an experiment can span many chapters, as it
is a mature topic practiced by many in the scientific field. In total, two graphical analysis
tools were utilized in this project. These were the Pareto chart and the main effects plot:
● The Pareto chart is a very useful tool for determining which factors have the largest
effect on the response of the process. It is one of the seven basic tools of quality
control [33]. Essentially, a Pareto Chart represents a bar chart in which the bars are
arranged in descending order of the factors which have the largest effect on the
response. It is also a useful tool to determine if a combination of two factors is
affecting the response.

37
● The main effects plot shows a slope for each factor representing the average of the
data points at the low and at the high factor settings. The greater the slope and the
length of the line plot, the larger the effect of that factor will be on the response
variable. Usually, when the interaction effects are insignificant, the main effects
plot can provide useful information on which factor has an effect on the response
variable.
The Pareto chart of the first DOE study is shown in Figure 23. The red dotted line
represents the standardized effect value. The standardized effects are t-statistics that test
the null hypothesis that the effect is 0. Any effect with bars reaching beyond the
standardized effect line is considered a significant effect at α = 0.05, where α is the Lenth's
pseudo standard error. In this Pareto chart, it can be seen that Durometer significantly
affects the response fill percentage. The outside corner radius and mold height did not have
as large of an effect and in the case of mold height, the effect is almost negligible as seen
in the Pareto chart.
As stated earlier, an ideal sample will have a fill percentage of 100%. The main effects
plot shown in Figure 24 can aid in determining which specific levels will result in a 100%
fill percentage. Each slope has a maximum and minimum value represented by blue dots.
The vertical axis of the main effects plot shows the mean fill percentage of the DOE study.
To determine which level should be used in future DOE studies, the factor which is closest
to a 100% mean fill percentage should be used. In this case, those factors were durometer
40, mold height 16 mm and outside corner radius of 10 mm.

38
Figure 23: Pareto chart for DOE #1
Figure 24: Main effects plot for DOE #1
4.2.1 Deterioration of Mold Tool and Sample Quality
In addition to exhibiting a high fill percentage and consequently failure by flash,
the 30 Durometer mold tool also showed deterioration from the four edges (Figure 25)
more than 40 Durometer mold tool (Figure 26) after 8 runs. This can be attributed to the

39
fact that the mold tool has an outer metal frame which limits the silicone mold tool’s
deformation. In contrast to this, the durometer 40 also showed a slight deterioration in the
corner, but it was much less than durometer 30. This shows that the durometer 30 silicone
is more prone to deformations which can lead to a failure by flash.
Figure 25: Durometer 30 mold with the edges showing mold damage after only 4 runs
Figure 26: Durometer 40 mold with the edges showing mold damage after only 4 runs
The samples which were overfilled did not show any shrinkage or dimensional
instability as shown in Figure 27. There was also no warpage or bending of the samples.
This can be explained by the fact that after the material has finished injecting, it is not

40
subjected to high pressure in the gate location. So, even if the mold tool is deformed
while injecting, it returns back to its original flat shape once the injection is finished. For
samples that were underfilled, there was a slight shrinkage that was observed in the
necking area of the sample as shown in Figure 28. This can be attributed to the material
not completely filling the cavity of the mold tool.
Figure 27: Photo of the sample obtained from Run #1
Figure 28: Photo of the sample obtained from Run #7
4.2.2 Durometer Hardness 60
Durometer was found to be the most significant factor affecting the mold tool
response. The main effects plot showed that to reach an ideal fill percentage of 100%, the
durometer should increase. Hence, along with 30 and 40, durometer hardness 60 was used
to conduct further experiments. The reason for not using durometer 50 was because that

41
durometer number is not commercially available from the manufacturers of the silicone
material used in this project.
The minimum possible injection molding pressure of 1500 psi and injection time
of 5 seconds was used to avoid brittle failure of the mold. However, on the first injection
run, a brittle fracture propagated through the runner of the mold (Figure 29). The
experiment was repeated with two other molds as illustrated in Table 11. For all three of
these experiments, a brittle failure to the mold caused the melted plastic to seep through
the mold as soon as it was injected. Thus, it was concluded that a durometer of 60 is too
high for a silicone mold and it was eliminated from any further DOE studies.
Figure 29: Durometer 60 mold tool, where the yellow circle shows the location of the crack

42
Figure 30: Bottom of the Durometer 60 mold tool. The PP material can be seen leaking to the bottom
of the mold due to crack formation
Table 11: Injection molding parameters for the Durometer 60 mold tool runs
Run
#
Injection
Pressure (psi)
Injection
Time (s)
Clamping
Pressure (psi)
Hold Time (s) Result
1 1500 5 8000 240 Mold
damaged
2 1500 5 8000 240 Mold
damaged
3 1500 5 8000 240 Mold
damaged

43
4.3 DOE #2: Injection Pressure vs. Time vs. Clamping Pressure
From the results of DOE #1, it was concluded that a durometer 40 silicone is more
suitable to use in the experiments than a durometer 30 silicone as durometer 30 silicone is
more prone to deformation and deterioration. In addition to this, a mold height of 16 mm
was chosen as it uses less material and an outside corner radius of 10 mm was chosen as
samples obtained from that type of mold are closest to the ideal case. The parameters which
were set constant for DOE #2 are given in Table 12.
Table 12: Constant variables for DOE #2
Parameter Value
Nozzle Temperature (F) 440
Barrel Temperature (F) 420
Plate Temperature (F) 250
Hold Time (min) 4
Mold Height (mm) 16
Outside Corner Radius (mm) 10
Durometer 40
Material PP
As an ideal sample with a fill percentage of 100% was not obtained via the first
DOE, it was decided to conduct a second DOE study with the focus on injection molding
parameters. The first parameter that was chosen as a control factor was injection pressure.
The reason for choosing this as a control factor was because based on previous experiments
using the same injection molding machine with HDPE, it was found that the injection
pressure had the greatest effect on the fill percentage while using a metallic mold [29]. In

44
total, 2 levels are chosen for the injection pressure. The first is 1500 psi which is the
minimum injection pressure at which the injection molding machine injects the material.
The second is 3000 psi, double of the first level’s value. The reason why this was the max
value, as opposed to something higher, was to avoid deterioration of the mold as a slight
deterioration of the 40 durometer mold tool was observed during DOE #1 (Figure 21).
The second parameter that was chosen was the injection time. If the injection time
is too small, there will be failure by short shot. If it’s too high, there will be failure by flash.
To find the optimum injection time that will give an ideal sample, two levels of injection
time were selected. The first one was 5 seconds, as that is the default injection time
recommended while injecting PP. The second one that was selected was 10 seconds. The
reasoning behind using these values is similar to that of injection pressure; a minimum
value was chosen that will inject the material and maximum value was chosen which avoids
any potential damage to the silicone mold while it deforms under high pressure.
The third parameter that was chosen was clamping pressure. It was hypothesized
that the reason for obtaining failure by flash was because the contact between the two mold
surfaces was not perfect. If there are any gaps in contact, the melted plastic will leak from
the runner as it is injected. The best way to avoid flash is to increase the clamping pressure
[34]. Hence, two levels of clamping pressure at 8000 psi (the standard for PP) and 10000
psi were chosen. These factors and levels are listed in Table 13 and Figure 28.
Table 13: Factors and levels for DOE #2
Factors Injection Pressure Injection Time Clamping Pressure
Levels 1 1500 psi 5 secs 8000 psi
2 3000 psi 10 secs 10000 psi

45
Figure 28: Tree diagram representing factors and levels for DOE #2
Similar to the previous DOE, the surface area of each sample was measured, and
the fill percentage was calculated to populate Table 14.
Table 14: Injection molding results for DOE #2
Run # Injection
Pressure (psi)
Injection
Time (s)
Clamping
Pressure (psi)
Fill
Percentage
(%)
1 1500 5 8000 61
2 1500 5 10000 73
3 1500 10 8000 88

46
4 1500 10 10000 108
5 3000 5 8000 154
6 3000 5 10000 139
7 3000 10 8000 183
8 3000 10 10000 160
By monitoring the response of each run in Table 14, the effect of each injection
molding parameter can be analyzed. For an injection pressure of 3000 psi, all the samples
failed by flash. When the injection pressure was half of that, there were short shots (or
underfill) but the fill percentage was much closer to 100%. This made it clear that an
injection pressure of 3000 psi was too high for the silicone mold tool. Additionally, an
injection time of 10 seconds when combined with an injection pressure of 1500 psi and
clamping pressure of 10000 psi gave the closest fill percentage (108%) to an ideal sample.
The Pareto chart in Figure 31 shows that there are two significant factors mainly,
injection pressure and injection time. A third variable that is also significant is the
combination of injection pressure and clamping pressure. The main effects plot in Figure
32 further shows how injection pressure and injection time had the greatest effect on the
fill percentage. Changing the clamping pressure from 8000 psi to 10000 psi did not result
in a large change in the fill percentage. This was contrary to past experiments on metal
mold in which increasing the clamping pressure reduced the flash. This meant that the
upper limit that was selected for the clamping pressure was not high enough.

47
Figure 31: Pareto chart for DOE #2
Figure 32: Main effects plot for DOE# 1

48
Figure 33: Interaction plot for DOE #2
The bottom left quadrant of Figure 33 shows the interaction of injection pressure
with clamping pressure in relation to fill percentage. It can be observed that an injection
pressure of 3000 psi with clamping pressure off 8000 psi resulted in a higher fill percentage
than with clamping pressure of 10000 psi. When the injection pressure was 1500 psi, the
opposite was observed. This shows that a higher clamping pressure results in a fill
percentage closer to a 100%, as seen in the y-axis of Figure 31. When the clamping pressure
is low, the melted plastic flows outside the mold cavity and results in failure by flash.
An interesting phenomenon that was noticed is that even when there was an
underfill, the melted plastic “leaked” from the runner. This can be seen in Figure 34 in
which as the melted plastic flowed through the mold cavity, it simultaneously flashed from
the runner. This again signified the need for increasing the clamping pressure to reduce the
gap between the silicone mold tool and the top metallic part of the mold.
One of the variables most akin to affect the response of the injection molding
process is the temperature of the mold tool. A cooler mold tool will pose significant
resistance for the melted plastic flowing through the mold cavity, and hence an incomplete

49
injection is more probable. In subsequent studies, the mold tool was given enough time to
heat to a specific temperature before restarting the injection cycle.
Figure 34: Run # 2 sample from DOE #2 showing the leakage of material from the runner
4.3.1 Increasing Clamping Pressure
Based on the interaction plot results (Figure 33) of DOE # 2, additional experiments
were conducted to measure the response of the mold tool on an increased value of the
clamping pressure.
A new variable, called pre-injection hold time was added to ensure that the mold
reaches the highest possible temperature, which was around 230 °F (110°C) for the silicone
mold. This temperature was validated using a thermal camera (Figure 35). The parameters
chosen for the first injection run were an injection pressure of 1500 psi, injection time of 5
seconds and an increased clamping pressure of 14000 psi. However, when the 5 seconds
injection time resulted in an underfill (Figure 36), another experiment was performed by
increasing the injection time to 10 seconds. The full injection molding parameters are listed
in Table 15.

50
Table 15: Injection molding parameters for the updated experiment
Run # Injection
Pressure (psi)
Injection Time
(s)
Clamping
Pressure (psi)
Pre-injection Hold
Time (s)
1 1500 5 14000 240
2 1500 10 14000 240
Figure 35: Thermal camera photos taken before injecting. The scale on the bottom is in °F
Results showed that increasing the clamping pressure with an increased injection
time did result in the reduction of flash. However, it also led to dimensional instabilities in
the shape of the sample as seen in Figure 37. The runner area of the mold tool expanded
due to the high clamping pressure. The problem of leakage from the runner was not solved
and a change in mold geometry was implemented.

51
Figure 36: Photo of the sample obtained from Run #1
Figure 37: Photo of the sample obtained from Run #2

52
CHAPTER 5
FURTHER EXPERIMENTS
Taking the results of the multiple DOE studies into account, further experiments
were conducted to measure the response of the mold tool on updated mold tool
geometries and designs.
5.1 FDM 3D Printed Insert
From the DOE studies, it was found that the melted plastic flashed mainly from the
runner, due to which a change was proposed to the mold tool geometry. To add rigidity to
the area around the runner, a 3D printed material using FDM was inserted into the mold
around the runner. (Figure 38).
Figure 38: 3D printed PLA inserts
Figure 39: Updated mold tool design to incorporate the 3D printed inserts

53
On the first injection run with an injection pressure of 1500 psi, injection time of 5
seconds and clamping pressure of 10000 psi, the 3D printed insert melted into the melted
plastic (Figure 40). The reason for this was that the 3D printed insert was made of PLA,
which has a melting point of around 150°C. This is much less than the nozzle temperature
of 220°C. Thus, another insert was 3D printed with Nylon, which has a melting point of
230°C.
Figure 40: Sample showing 3D printed PLA insert melted with PP after solidifying
Figure 41: Thermal camera photo of the Nylon insert mold tool before injecting. The scale is in °F
The Nylon insert was able to sustain the high nozzle temperature without melting.
Results showed that the insert was able to control failure by the flash from the runner and
this kind of mold tool gave the best samples in terms of quality so far (Figure 43). The
brown coloring of the sample is due to oxidation. This occurs when the sample is taken out
of the mold earlier than the specified hold time. Mischkot et al. injected LDPE into a disk-
shaped steel mold and found 50 seconds to be a sufficient hold time to avoid any loss in

54
the original color [11]. However, in this mold tool, whenever the hold time was below 240
seconds, a slight brown coloration of the samples was observed (Figure 43).
Figure 42: 3D printed Nylon insert mold tool with the outer metal frame
Figure 43: Sample obtained from 3D printed Nylon insert mold tool
Using FDM 3D printed nylon inserts solved the issue of flash but there was failure
by short shot as the plastic failed to fill the mold cavity completely. To investigate this
issue, a new DOE study on injection molding parameters should be conducted. As seen in
the previous DOE studies, different injection molding parameters resulted in different fill
percentages. With the flash controlled, it is predicted that increasing the injection pressure
or injection time will result in a 100% or more fill percentage. This DOE could not be

55
conducted due to the closure of university labs due to the spread of the COVID-19
pandemic in March 2020.
5.2 Center Injection
So far in all the experiments, the melted plastic leaked from the runner. A new
approach was implemented in parallel with the FDM 3D printed inserts. The revised mold
geometry eliminated the runner while keeping the neck length of the tensile specimen the
same (Figure 44). The main purpose of this mold design was to see the effects of a short
runner on the fill percentage.
Figure 44: Updated mold tool geometry eliminating the runner
Table 16: Injection molding parameters for center injection with outer metal frame
Injection
Pressure (psi)
Injection Time
(s)
Clamping Pressure
(psi)
Pre-injection Hold
Time (s)
1500 5 10000 240
The results in Figure 45 show that injecting in the center of the mold without a
runner reduced the flash considerably. However, there was still failure by flash as the
material leaked from the gate location.

56
Figure 45: Sample obtained from center injection with the outer metal frame
One of the reasons why the melted plastic was still leaking from the center of the
mold can be explained by the fact that contact between the top metallic plate and the bottom
silicone mold tool was not perfect. When the material is injected into the center of the mold
with high pressure, the silicone mold tries to expand. However, the outer metallic frame
prevents it from doing so, which results in a slight curve in the mold. This curve, in turn,
creates gaps between the silicone mold and the top metallic plate and hence leads to leakage
of the melted plastic. Taking these factors into account, an injection run was carried out
using the configuration shown in Figure 46. In this configuration, the outer metallic frame
was replaced with a borderless straight metallic plate so that the mold is free to expand and
does not curve.
Figure 46: Injection molding setup without the outer metal frame

57
Figure 47: Thermal camera photo of the mold tool when placed in the injection molding machine.
The scale is in °F
Using the same injection molding parameters as Table 17, an ideal sample with no
flash was obtained as shown in Figure 48. This injection run was repeated 3 more times,
and each time an ideal sample with a 100% fill percentage was obtained. The samples
were then post-processed and cut into half so that they can be tested using a tensile
testing machine.
Figure 48: Sample obtained with center injection without outer frame
Figure 49: Samples cut in half for tensile testing

58
CHAPTER 6
MECHANICAL PROPERTIES
To gauge the mechanical performance of the parts produced using the silicone mold
tool and compare them with those produced using a metal mold tool, tensile tests were
conducted on the samples. In total, 5 tensile samples were produced using a two-piece
standard metal mold made from Aluminum alloy 6061 and 5 samples were produced using
the silicone mold with center injection. The tensile tests were carried out as per ASTM
D638 standard on the Applied Testing Systems (ATS) Universal Testing Machine. All the
tests were performed at a cross head speed of 5 mm/min using a 500 lbs (226.8 kg) load
cell. Jaw grippers without extensometers were used for holding the tensile samples.
Figure 50: Jaw grippers on the ATS tensile testing machine holding the sample in place
Using a digital vernier caliper, the neck length and cross section area of each sample
were measured. Raw data in the form of load vs. displacement was obtained from the tests
and converted to stress and strain values and plotted using MATLAB.

59
Figure 51: Metal mold samples after tensile testing
Table 17: Mechanical properties comparison with standard deviations
Property Metal Mold Silicone Mold
Ultimate Tensile Strength (MPa) 32.197 ± 0.527 29.854 ± 0.912
Young’s Modulus (MPa) 360.255 ± 14.41 142.511 ± 31.75
Yield Strength (MPa) 18.194 ± 0.242 11.935 ± 1.158
Table 18: Mechanical properties comparison with a 95% confidence level
Property Metal Mold Silicone Mold
Ultimate Tensile Strength (MPa) 32.197 ± 0.462 29.854 ± 0.801
Young’s Modulus (MPa) 360.255 ± 12.64 142.511 ± 27.83
Yield Strength (MPa) 18.194 ± 0.213 11.935 ± 1.016

60
Figure 52: Stress vs. Strain plot for metal mold tool
Figure 53: Stress vs. Strain plot for silicone mold tool
61
To verify the tensile test results, the UTS values of the PP samples obtained from
the metal mold were compared with those present in online databases. In total three sources
were used as references. The comparisons showed that there was a 2.4%, 3.7% and 8.0%
error in UTS respectively for each of the three sources [35][36][37]. Overall, the tensile
tests of metal mold samples showed a better consistency than the silicone mold samples.
This can be quantitatively assessed by calculating the standard deviation of UTS of each
sample set, where the metal mold and silicone mold samples showed a standard deviation
of 0.461 and 0.801 respectively at the 95% confidence level (Table 18).
Comparing the average UTS, it was observed that there was a 7.3% decrease for
the silicone mold tool samples (Figure 56). This is less than the ones reported in the
literature for AM and composite molds, where in some studies, the decrease in UTS was
as high as 11% and 21% [8] [7]. Isolating the stress-strain plots for sample #3 for each
mold type, it was observed that the metal mold sample had a higher Young’s modulus and
yield strength than the silicone mold sample (Figure 54). On average, there was a 60.4%
decrease in Young’s modulus and a 34.4% decrease in the yield strength when going from
metal to silicone mold tool.
For PP tensile samples produced using a FDM 3D printed mold tool made out of
ABS Digital, Bartlett reported a 9.4% increase in Young’s modulus compared to parts
produced using a steel mold [8]. León-Cabezas et al. reported a 46% decrease in Young’s
modulus for tensile specimens produced using a Polyjet 3D printed mold tool when
compared to parts produced using a metal mold tool [38]. In another study of polystyrene
composite molds, Young’s modulus remained unchanged [7]. The decrease in stiffness of
the parts obtained using silicone mold can be explained by conducting a Differential
Scanning Calorimeter (DSC) analysis to measure the crystallinity of the injection molded
samples. The difference in silicone mold tool and AM material’s thermal conductivity and
surface roughness can lead to such a difference. After reaching the UTS, the silicone mold
sample continued to elongate and had a larger necking region than the metal mold tool.

62
Figure 54: Comparison of Sample 3 Stress vs. Strain plots
Figure 55: Comparison of UTS for all 10 samples

63
Figure 56: Comparison of average UTS for all 10 samples

64
CHAPTER 7
CONCLUSIONS
It has been shown that it is possible to develop a mold tool made from a flexible
material like silicone to inject Polypropylene. The question that was asked at the beginning
of the project was whether it is possible to inject plastics such as Polypropylene into the
silicone mold tool. It was hypothesized that because of silicone’s flexible nature, it will not
be able to withstand the high injection pressure during the injection process. However,
results show that not only silicone is able to withstand the high temperatures and pressures,
but also able to resist mold deterioration at certain durometer hardness. When the
durometer hardness was increased, the mold tool failed through brittle failure, similar to
mold tools made out of AM plastic. A decrease in durometer hardness lead to an increase
in mold deterioration and mold deformation during injection which lead to greater
inconsistencies in part quality.
It was found that the plastic parts produced from silicone mold did not show many
types of common failures found in injection molded samples. These include blisters, flow
marks, jetting, polymer degradation, and most importantly sink marks. The injection
molding simulation predicted sink marks in the runner area for Polypropylene samples,
however, these were not seen in the silicone mold sample. Furthermore, the samples did
not show any form of warpage, which is caused due to residual stresses in the injection-
molded plastic part. It can be hypothesized that the parts produced using a silicone mold
tool retained their level of crystallinity, as higher levels of crystallinity can lead to higher
levels of residual stresses. As silicone is a thermoset, its thermal conductivity and heat
deflection values vary drastically from additively manufactured plastics. For future work,
DSC tests should be conducted to measure the level of crystallinity (or organization of
molecules) in silicone mold samples.
There are limitations to using a silicone mold tool for injection molded parts.
Mainly, these are related to the geometry of the mold cavity. It was found that even with
the right type of durometer, the length of the runner of the mold tool can have a significant

65
effect on whether the part will fail through flash. A longer runner design with features such
as curves and corners lead to failure through flash in almost all the injection runs. When
the runner was shortened to a simple straight line, it did not fail. Typically, FDM 3D printed
mold tools are placed in an outer metal frame to add rigidity to the mold tool. However, it
was found using this technique on a flexible silicone mold tool can restrict its deformation
and forces the mold tool to curve as the plastic is injected into it with high pressure. This
curvature leads to further failure through flash as the plastic leaks from the mold tool cavity.
Another type of failure, through a short shot, was also observed when the injection time
was too small. The most ideal sample without any kind of failures was obtained using a
combination of a short runner, low injection pressure and time, high clamping pressure,
and the absence of any outer frame.
The use of silicone mold tools is promising especially for material scientists and
manufacturers experimenting with plastic parts in the early stages of their research.
Silicone is an excellent choice for injecting materials that have the tendency to stick to
other surfaces. Examples of these include medical-grade biomaterials such as PLA, PGLA,
lignin, alginate, and bio-based PET. Another advantage of using a silicone mold tool to
produce simple medical device components is that the mold surface does not require any
type of release agent to be sprayed prior to injecting. This eliminates the risk of
contamination in the medical component. Compared to most types of AM mold tools,
silicone is also able to withstand higher temperatures. It has the potential to inject resins
with high melting temperatures such as PEEK, PPA, and PEI. A rough cost analysis
indicates that a silicone mold tool is 10 times cheaper than a metal mold tool for the same
mold dimensions. A silicone mold tool is also cheaper than FDM 3D printed molds.
Comparing just the material costs, it was found that silicone mold materials are 3 times
cheaper per pound than the cheapest commercially available 3D printing filament. The
tensile strength of parts produced using a silicone mold tool was close to those produced
using a traditional metal mold tool, while the stiffness of parts decreased considerably.

66
Due to the COVID-19 pandemic and the subsequent closure of the university
facilities, many of the planned experiments could not be completed. For future work, it is
recommended that a DOE study is conducted with FDM 3D printed inserts as that proved
to be a viable solution to failure through flash without compromising the mold geometry.
In addition to FDM 3D printing, testing of parts with other types of additively
manufactured mold tools such as Stereolithography should be implemented to gauge the
performance of the type of AM. Further mechanical tests such as flexural, Izod impact, and
hardness tests of the injected plastic should be conducted. Repetitions of all the DOE
studies and tensile tests are vital to verify the reported values. In addition to a DSC test to
measure the crystallinity of the injected parts, surface roughness of the mold tool cavity
should be measured to analyze the effect of friction on the plastic flow.
Using the silicone mold tool, researchers can to continue using injection molding
for their prototypes instead of reverting to other techniques such as casting, AM, or
compression molding. For design projects where the final part will be made using injection
molding, the silicone mold tool encourages consistency in the design process. In
conclusion, this project can be expanded further by conducting said tests and experimenting
with more complex geometries so that the gap between preliminary research and
production of a part can be filled.

67
REFERENCES
[1] Groover, Mikell P. “Ch. 13 Shaping Processes for Plastics.” Fundamentals of
Modern Manufacturing, 5th ed., Wiley, 2012, pp. 316–326.
[2] Viana, J C., and N M. Alves. “Morphology and Mechanical Properties of Injection
Molded Poly(Ethylene Terephthalate).” Polymer Engineering and Science, vol. 44,
no. 12, 2004, pp. 2174–2184., doi:10.1002/pen.20245.
[3] “Injection Molding: the Manufacturing & Design Guide.” 3D Hubs,
www.3dhubs.com/guides/injection-molding/#the-basics.
[4] Rogers, Tony. “Everything You Need To Know About Injection Molding.”
Everything You Need To Know About Injection Molding, 21 Dec. 2015,
www.creativemechanisms.com/blog/everything-you-need-to-know-about-injection-
molding.
[5] Chua, C. K., et al. “Rapid Tooling Technology. Part 1. A Comparative Study.” The
International Journal of Advanced Manufacturing Technology, vol. 15, no. 8, 1999,
pp. 604–608., doi:10.1007/s001700050108.
[6] Mendible, Gabriel Antonio, et al. “Comparative Study of Rapid and Conventional
Tooling for Plastics Injection Molding.” Rapid Prototyping Journal, vol. 23, no. 2,
2017, pp. 344–352., doi:10.1108/rpj-01-2016-0013.
[7] Damle, M., Mehta, S., Malloy, R., McCarthy, S., 1998, “Effect of Fibre Orientation
on the Mechanical Properties of an Injection Molded part and a Stereolithography-
Insert Molded Part”, Proceedings of the society of plastics engineers (SPE) Annual
Technical Conference (ANTEC), Atlanta, USA, pp 584 - 588.
[8] Bartlett, Leah. "A Preliminary Study of Using Plastic Molds in Injection Molding."
Electronic Thesis or Dissertation. Ohio State University, 2017. OhioLINK
Electronic Theses and Dissertations Center.
[9] Simpson, Patrick, et al. “Injection Molding with an Additive Manufactured Tool.”
Polymer Engineering & Science, vol. 59, no. 9, 2019, pp. 1911–1918.,
doi:10.1002/pen.25192.

68
[10] Dawson, E K, and J D Muzzy. “The Effect of Rapid Prototype Tooling on Final
Product Properties.” Proceedings of the Society of Plastics Engineers (SPE) Annual
Technical Conference (ANTEC), vol. 1, 6 May 1999AD, pp. 456–460.
[11] Mischkot, M., Tosello, G., Nielsen, D. K. Y., Pedersen, D. B., Zhang, Y.,
Hofstätter, T., ... Hansen, H. N. (2017). “Injection Moulding Pilot Production:
Performance Assessment of Tooling Process Chains Based on Tool Inserts Made
from Brass and A 3d Printed Photopolymer.” Proceedings of ANTEC 2017 Society
of Plastics Engineers.
[12] Kamal, M. R., et al. “Residual Thermal Stresses in Injection Moldings of
Thermoplastics: A Theoretical and Experimental Study.” Polymer Engineering &
Science, vol. 42, no. 5, 2002, pp. 1098–1114., doi:10.1002/pen.11015.
[13] Rosato, Dominick V., et al. Injection Molding Handbook. Springer Science, LLC,
2000.
[14] Aluru, Rajitha, et al. “Simulation of Injection Molding into Rapid‐Prototyped
Molds.” Rapid Prototyping Journal, vol. 7, no. 1, 2001, pp. 42–51.,
doi:10.1108/13552540110365153.
[15] Hopkinson, Neil, and Phill Dickens. “Predicting Stereolithography Injection Mould
Tool Behaviour Using Models to Predict Ejection Force and Tool Strength.”
International Journal of Production Research, vol. 38, no. 16, 2000, pp. 3747–
3757., doi:10.1080/00207540050175987.
[16] Dupret, F., et al. “Modelling and Simulation of Injection Molding.” Rheology Series
Advances in the Flow and Rheology of Non-Newtonian Fluids, 1999, pp. 939–
1010., doi:10.1016/s0169-3107(99)80012-4.
[17] Guo, Jianxin, and Kwabena A. Narh. “Computer Simulation of Stress-Induced
Crystallization in Injection Molded Thermoplastics.” Polymer Engineering &
Science, vol. 41, no. 11, 2001, pp. 1996–2012., doi:10.1002/pen.10896.
[18] Kim, J. K., and C. S. Lee. “Fatigue Life Estimation of Injection Mold Core Using
Simulation-Based Approach.” International Journal of Automotive Technology, vol.
14, no. 5, 2013, pp. 723–729., doi:10.1007/s12239-013-0079-y.
[19] Zhang, Jun-Ying, and Mark J. Pellerite. Silicone Mold and Use Thereof.

69
[20] Spontak, Richard J, and Nikunj P Patel. “Thermoplastic Elastomers: Fundamentals
and Applications.” Current Opinion in Colloid & Interface Science, vol. 5, no. 5-6,
2000, pp. 333–340., doi:10.1016/s1359-0294(00)00070-4.
[21] Liu, X. Dong. Functional Materials and Biomaterials. Springer, 2007.
[22] Callister, William D., and David G. Rethwisch. Materials Science and Engineering:
an Introduction. Wiley, 2018.
[23] “ASTM D412 - 16.” ASTM International - Standards Worldwide,
https://www.astm.org/Standards/D412.
[24] “About Us.” SmoothOn, www.smooth-on.com/page/aboutus/.
[25] “ASTM D638 - 14.” ASTM International - Standards Worldwide,
www.astm.org/Standards/D638.
[26] Hassan, Hamdy, et al. “Modeling the Effect of Cooling System on the Shrinkage
and Temperature of the Polymer by Injection Molding.” Applied Thermal
Engineering, vol. 30, no. 13, 2010, pp. 1547–1557., doi:
10.1016/j.applthermaleng.2010.02.025.
[27] Mold, Midstate. “Most Common Thermoplastics Used in Injection Molding -
Midstate Mold.” Midstate Mold & Engineering, 6 Feb. 2018,
www.midstatemold.com/common-thermoplastics-injection-molding/.
[28] Tahir I, Mahmood S, Rapinac J, Menta V. “Thermo-Mechanical Characterization of
Polypropylene-Tobacco Lignin Blends.” International Conference on Advanced
Materials Science and Engineering. 2019; Hawaii.
[29] Mahmood S, Tahir I, Menta V. “Thermo-Mechanical Characterization of HDPE-
Tobacco Lignin Blends.” The Composites and Advanced Materials Expo. 2019;
California.
[30] “Experiment.” Merriam-Webster, Merriam-Webster, www.merriam-
webster.com/dictionary/experiment.
[31] Wagner, John R., et al. “Design of Experiments.” Extrusion, 2014, pp. 291–308.,
doi:10.1016/b978-1-4377-3481-2.00025-9.

70
[32] Dowlatshahi, Shad. “An Application of Design of Experiments for Optimization of
Plastic Injection Molding Processes.” Journal of Manufacturing Technology
Management, vol. 15, no. 6, 2004, pp. 445–454., doi:10.1108/17410380410547852.
[33] “Seven Basic Tools of Quality.” What Is Six Sigma? – Certification, Training,
Lean, www.whatissixsigma.net/7-qc-tools/.
[34] Rogers, Tony. “Top-10 Injection Molding Defects And How To Fix Them.” Top-10
Injection Molding Defects And How To Fix Them,
www.creativemechanisms.com/blog/what-cause-injection-molding-defects-and-
how-to-fix-them.
[35] “Polypropylene (PP).” MakeItFrom.com, 8 Sept. 2018,
www.makeitfrom.com/material-properties/Polypropylene-PP-Copolymer.
[36] “Polypropylene (PP) Mechanical Properties at 23 °C.” Polymer Database,
polymerdatabase.com/Commercial%20Polymers/PP.html.
[37] “Typical Properties of Polypropylene.” Tap Plastics,
www.tapplastics.com/uploads/pdf/Polypropylene_Data.pdf.
[38] León-Cabezas, M.a., et al. “Innovative Advances in Additive Manufactured Moulds
for Short Plastic Injection Series.” Procedia Manufacturing, vol. 13, 2017, pp. 732–
737., doi:10.1016/j.promfg.2017.09.124.