Embed Size (px)
Citation preview
DEVELOPMENT OF A RFID BASED INVENTORY MANAGEMENT SYSTEM
by Zahid Hasan Chowdhury
POST GRADUATE DIPLOMA IN INFORMATION AND COMMUNICATION TECHNOLOGY
Institute of Information and Communication Technology (IICT)
BANGLADESH UNIVERSITY OF ENGINEERING AND TECHNOLOGY
June, 2013

The project report titled “Development of a RFID based Inventory Management System” submitted by Zahid Hasan Chowdhury, Roll No.: 1008311017, Session 2008 has been accepted as satisfactory in partial fulfillment of the requirement for the Post Graduate Diploma in ICT help on 30 June, 2013.
BOARD OF EXAMINERS ________________ 1. Dr. Md. Liakot Ali Chairman Professor Institute of Information & Communication Technology (IICT) BUET, Dhaka-1000. ________________ 2. Dr. Md. Saiful Islam Member Professor & Director Institute of Information & Communication Technology (IICT) BUET, Dhaka-1000. ________________ 3. Dr. Mohammad Shah Alam Member Assistant Professor Institute of Information & Communication Technology (IICT) BUET, Dhaka-1000.
i

CANDIDATE’S DECLARATION It is hereby declared that this project report or any part of it has not been submitted elsewhere for the award of any degree or diploma. ____________ Zahid Hasan Chowdhury
ii

Dedicated To
All my well wisher
iii

Table of Contents
Title Page No.
Board of Examiners i
Candidate’s Declaration ii
Dedication iii
Table of Contents iv
List of Tables viii
List of Figures viii
List of Abbreviations x
Acknowledgement xi
Abstract xii
Chapter 1 Introduction
1.1 Overview 1
1.2 Motivation 2
1.3 Objectives with Specific Aims & Possible Outcome 3
1.4 Scopes 4
Chapter 2 An Overview of RFID Technology
2.1 Introduction to RFID 5
2.2 Fundamental Components in an RFID System 6
2.2.1 RFID Tag 6
2.2.1.1 Tag Formats 7
2.2.1.1.1 1-bit Transponder 8
2.2.1.1.2 Glass Housing 8
2.2.1.1.3 Disks and Coins 8
2.2.1.1.4 Smart Labels 9
2.2.1.1.5 Smart Cards 9
iv

2.2.1.2 Special Purpose Tags 10
2.2.1.2.1 Sensor Tags 10
2.2.1.2.2 Chipless Tags 10
2.2.1.2.3 Encrypted Tags 10
2.2.1.3 Tag Types 10
2.2.1.3.1 Passive RFID Tag 11
2.2.1.3.2 Active RFID Tag 12
2.2.1.3.3 Semi-Passive RFID Tag 13
2.2.1.4 Tag Memory 13
2.2.1.4.1 RO 14
2.2.1.4.2 RW 14
2.2.1.4.3 WORM 14
2.2.2 RFID Reader 15
2.2.2.1 Hand-held Reader 15
2.2.2.2 Fixed Reader Installed in Area 16
2.2.2.3 Fixed Reader Installed at Chokepoint 16
2.2.3 Middleware 16
2.3 Reader Antenna 17
2.4 RFID Standards 18
2.5 RFID Frequencies 19
2.6 Interfaces between Reader and Software 20
2.7 RFID vs. Barcode 20
2.8 Limitations of Reader and Tag Communications 21
Chapter 3 Development Process of the System
3.1 Outline of Methodology 22
3.2 Feasibility Study 23
3.3 Requirement Gathering, Specification & Planning 23
3.3.1 Identify User 23
3.3.1.1 Admin User (Administrator) 24
3.3.1.2 General User 24
v

3.3.2 Identify Member 24
3.3.3 Analysis of Main Features 24
3.3.4 Software Architecture 26
3.3.5 Software Interfaces 26
3.3.6 Hardware Interfaces 28
3.3.7 Security Requirements 32
3.4 Design 33
3.5 Coding & Model Testing 33
3.6 Integration & System Testing 33
3.7 Operational Mode 33
3.8 Modification & Maintenance 33
Chapter 4 System Design 4.1 Introduction 34
4.2 Database Design 34
4.3 E-R Diagram 34
4.3.1 E-R Diagram of IMS 35
4.3.2 E-R Diagram of User Information Table 36
4.3.3 E-R Diagram of Member Information Table 36
4.3.4 E-R Diagram of Vendor Information Table 37
4.3.5 E-R Diagram of Item Information Table 37
4.3.6 E-R Diagram of Item Category Information Table 38
4.3.7 E-R Diagram of Issue_Return Information Table 38
4.4 Data Dictionary 39
4.5 Software Design 41
4.5.1 UML Diagram 41
4.5.1.1 Use Case Diagram 41
4.5.1.1.1 Use Case Diagram of General User 42
4.5.1.1.2 Use Case Diagram of Admin User 43
4.5.1.2 Class Diagram 44
4.5.1.2.1 UML Class Symbol 44
4.5.1.2.2 Domain Model Class Diagram 45
vi

4.5.1.2.3 Domain Model Class Diagram of IMS 46
4.5.1.3 Activity Diagram 46
4.5.1.3.1 Activity Diagram of IMS 47
Chapter 5 Functionalities of the RFID System 5.1 Hardware Aspects 48
5.1.1 Item Registration Aspect 48
5.1.2 Item Issue Aspect 48
5.1.3 Item Return Aspect 49
5.2 Software Features 49
5.2.1 Login Form 49
5.2.2 Inventory Main Form 50
5.2.3 User Registration Form 50
5.2.4 Change Password Form 51
5.2.5 User Lookup Form 51
5.2.6 Member Registration Form 52
5.2.7 Member Lookup Form 52
5.2.8 Vendor Registration Form 53
5.2.9 Vendor Lookup Form 53
5.2.10 Item Category Form 54
5.2.11 Item Registration Form 54
5.2.12 Item Issue Form 55
5.2.13 Item Return Form 56
5.2.14 Item Lookup Form 57
5.2.15 Inventory Reports Form 57
Chapter 6 Conclusion
6.1 Conclusion 58
6.2 Future Works 58
References 59
vii
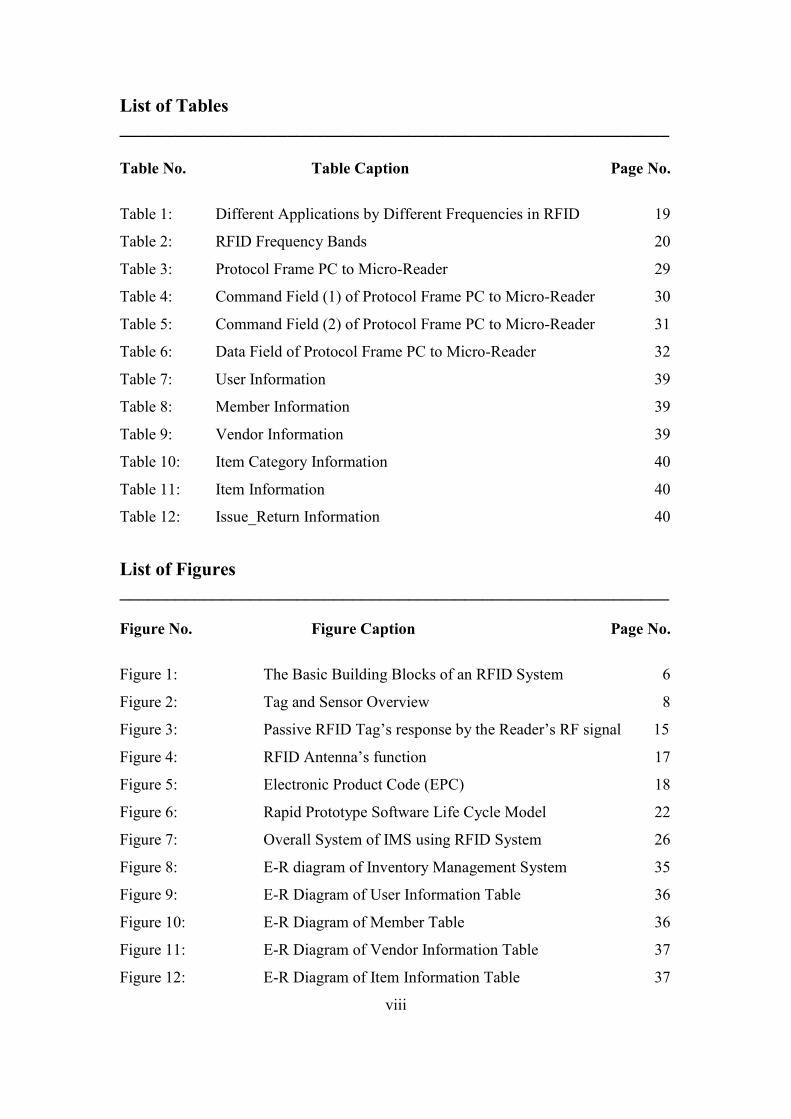
List of Tables ___________________________________________________________ Table No. Table Caption Page No.
Table 1: Different Applications by Different Frequencies in RFID 19
Table 2: RFID Frequency Bands 20
Table 3: Protocol Frame PC to Micro-Reader 29
Table 4: Command Field (1) of Protocol Frame PC to Micro-Reader 30
Table 5: Command Field (2) of Protocol Frame PC to Micro-Reader 31
Table 6: Data Field of Protocol Frame PC to Micro-Reader 32
Table 7: User Information 39
Table 8: Member Information 39
Table 9: Vendor Information 39
Table 10: Item Category Information 40
Table 11: Item Information 40
Table 12: Issue_Return Information 40
List of Figures ___________________________________________________________ Figure No. Figure Caption Page No.
Figure 1: The Basic Building Blocks of an RFID System 6
Figure 2: Tag and Sensor Overview 8
Figure 3: Passive RFID Tag’s response by the Reader’s RF signal 15
Figure 4: RFID Antenna’s function 17
Figure 5: Electronic Product Code (EPC) 18
Figure 6: Rapid Prototype Software Life Cycle Model 22
Figure 7: Overall System of IMS using RFID System 26
Figure 8: E-R diagram of Inventory Management System 35
Figure 9: E-R Diagram of User Information Table 36
Figure 10: E-R Diagram of Member Table 36
Figure 11: E-R Diagram of Vendor Information Table 37
Figure 12: E-R Diagram of Item Information Table 37
viii

Figure 13: E-R Diagram of Item Category Information Table 38
Figure 14: E-R Diagram of Issue_Return Information Table 38
Figure 15: Use Case Diagram 41
Figure 16: Use Case Diagram of General User 42
Figure 17: Use Case Diagram of Admin User 43
Figure 18: Domain Model Class Diagram of IMS 46
Figure 19: Activity Diagram of IMS 47
Figure 20: Item Registration Aspect 48
Figure 21: Item Issue Aspect 48
Figure 22: Item Return Aspect 49
Figure 23: Login Form 49
Figure 24: Inventory Main Form 50
Figure 25: User Registration Form 50
Figure 26: Change Password Form 51
Figure 27: User Lookup Form 51
Figure 28: Member Registration Form 52
Figure 29: Member Lookup Form 52
Figure 30: Vendor Registration Form 53
Figure 31: Vendor Lookup Form 53
Figure 32: Item Category Form 54
Figure 33: Item Registration Form 54
Figure 34: Item Issue Form 55
Figure 35: Item Return Form 56
Figure 36: Item Lookup Form 57
Figure 37: Inventory Reports Form 57
ix

List of Abbreviations RFID Radio Frequency Identification
IMS Inventory Management System
OOP Object Oriented Programming
EIN Electronic Identification Number
UPC Universal Product Code
RF Radio Frequency
EAS Electronic Article Surveillance
BAP Battery Assisted Passive
FCC Federal Communications Commission
EPC Electronic Product Code
RO Read Only
RW Read Write
WORM Write Once Read Many
RSSI Received Strength Signal Indicator
LF Low Frequency
HF High Frequency
UHF Ultra High Frequency
ISO International Organization for Standardization
ISM Industrial, Scientific and Medical
VB.NET Visual Basic.Net
MySQL My Structured Query Language
GUI Graphical User Interface
ADO.NET ActiveX Data Objects.Net
DBMS Database Management System
ERD Entity Relationship Diagram
OOAD Object Oriented Analysis & Design
UML Unified Modeling Language
x

Acknowledgement
First of all I would like to thank Almighty Allah for giving me the strength and
patience for carrying out this work and to complete this project.
I would also like to thank Dr. Md. Liakot Ali, Professor, Institute of Information &
Communication Technology (IICT), Bangladesh University of Engineering and
Technology, Dhaka, Bangladesh for his valuable suggestions and constant
encouragement throughout the whole period of the work, which inspired and guided
me in each and every step of the project.
I would like to acknowledge the efforts given by my family members especially my
parents for their continuous support and inspiration, which helped me to complete the
project successfully.
I would also like to remember the contributions and support given by my relatives and
friends for completing the project in time.
xi

Abstract Radio Frequency Identification (RFID) is a new generation of Auto Identification and Data collection technology which helps to automate business processes and allows identification of large number of tagged objects like assets, using radio waves. RFID based Inventory Management System (IMS) would allow fast transaction flow for the inventory and will prove immediate and long term benefits to inventory in traceability and security. The proposed system is based on Low Frequency Midrange RFID readers supported with antennas at transaction sections, and items containing RFID-transponders which are able to electronically store information that can be read or written even without the physical contact with the help of radio medium. The inventories across the globe started to use RFID to speed up the self check in or out processes, to control the theft and to ease the inventory control. Moreover, RFID could have a positive impact on the inventory control processes of the organization by either streamlining or formalizing them and facilitate the electronic storage of information captured in real-time, relating to the movement of stock and the amount of stock held, providing visibility to members of the organization. This project presents the experiments conducted to set up an RFID based IMS. Therefore, this system can play a vital role in removing the ongoing difficulties & irregularities in the inventory management in Bangladesh.
xii

Chapter 1 Introduction
1.1 Overview The project titled “RFID Based Inventory Management System” is an Inventory
Management Software for monitoring and controlling the transactions in an inventory.
This project is concerned with developing an Inventory Management System using
Object Oriented Programming (OOP) [1], which mainly focuses on basic operations
in an inventory like adding new user, member, items & updating information,
searching items and items issued & returned from the members and facilitating the
management system. In this system the Inventory Management becomes more
efficient & easier to handle with its reliable system components.
Inventory Management System is used to keep records of items and manage items of
any particular organization. By adopting RFID in middle or bigger sized inventories,
the client’s self-service efficiency can be greatly improved and the staff’s work time
can be effectively reduced. The barcode technology is slowly getting replaced by the
RFID technology. It provides more intelligent inventory management which in turn
means better service quality for the members.
The proposed system will consist of Passive RFID tag, a Low Frequency (LF)
Midrange RFID reader with a user - friendly computer software. In this work, a
system has been developed to keep records & track of items in IICT which are issued
to any member. The developed scheme keeps records of items, users, members &
vendors information. The RFID Reader will be placed in the room of inventory
controller. In this system an RFID tag will be placed into the body of every asset
which is registered in the system by physically attaching the tag. The reader will be
interfaced with computerized database where the Electronic Identification Number
(EIN) will be stored and used as key of information for tracking any tagged item
entering or leaving from particular locations. If a registered member wants to borrow
any item then the acting user would search his/her desired item information and by
placing the tag within the range of the reader and then will assign or allocate that item
1

for the member. The database will be maintained about the Member who is taking the
item and which item he/she is taking and that database will be updated when the item
is returned. Moreover, different records regarding items location and members can
also be viewed. As a result, the tracking of items becomes easier.
RFID technology is being implemented in a number of industries. Examples include
vehicle & personnel access control, automotive anti-theft systems, product & asset
tracking, animal identification, supply chain automation, waste management etc. In
the warehouse & retail supply chain, goods come in and leave. Only occasionally they
are returned. In inventories, items are taken out & returned many times. Thus the
same RFID tag is re-used many times. In Bangladesh most of the organizations
require and use a number of assets for different purposes. It is very difficult to
maintain this large number of assets that are spread & used by different branch or site
offices every day. It needs man power & hours to maintain these assets. Some of these
organizations already use desktop based software & others use web based software
with limited functionalities. So they require a complete low cost system. They can use
this inventory management software to maintain & collect information within their
network (intranet).
1.2 Motivation Radio Frequency Identification (RFID) is a new promising wireless technology for
automated data capturing [2]. It has the ability of identifying, locating, tracking and
monitoring people & objects. RFID is one of the fastest growing and most beneficial
technologies being adopted by business today and the benefits brings to the inventory
are obvious. RFID is already being used in supply chain management, logistics,
transportation, security, personnel identification, hospital management, airport
luggage control, building access etc. In this project the RFID has been proposed for
developing RFID based computerized management system for the inventory of an
organization. In the traditional inventory management system the assets are identified
manually primarily on paper based communications. The reliance on paperwork and
data entry depends on the staff’s efficiency. The more the assets become, the less
accurate and effective are these management practices. Later on Universal Product
2

Code (UPC) or barcodes have been used to overcome this situation. RFID tags are
now in the market for the replacement of barcodes having a number of important
advantages over the older barcode technology. RFID tags do not have to be visible to
be detected or scanned. It can be read even when it is embedded in an item. For
instance a tagged item could be inside a box and yet still be scanned. RFID systems
allow scanning from further distances than Barcode scanning. Therefore it is
necessary to develop a RFID based new system instead of barcode reader to ease the
problem of the conventional inventory management system and to eliminate
paperwork and manual processing.
1.3 Objective with Specific Aims & Possible Outcome
The aim of this project is to develop a RFID based asset tracking and management
system to provide real time audit and traceability of assets. To fulfill the aim the
project will focus on following objectives:
To develop a Graphical User Interface (GUI) for interfacing the RFID reader
with computer.
To develop a database for Asset Management System.
To test the system extensively and to use for real time asset management.
3

1.4 Scopes
Some scopes of this software are given below:
1. Any particular organization which has assets can use this software to keep
records of assets & to manage assets.
2. Any user can have access the software within a network (intranet).
3. Any user will be able to know about Items Issue & Return information.
4. A user will be able to log in into the system using given password.
5. After signing in a general user will be able to
Change the password.
Add, View, Edit & Delete Items Issue information.
Add, View, Edit & Delete Items Receive information.
Track all allocated items information with reliable Search options.
Verify Member’s Fine information.
View & Print Reports with specific Search options.
6. An administrator will be able to log in into the system using given password.
7. After signing in an administrator will be able to
Change the password.
Add, View, Edit & Delete Items Category information.
Add, View, Edit & Delete Items information.
Add, View, Edit & Delete Items Issue information.
Add, View, Edit & Delete Items Receive information.
Add, View, Edit & Delete User’s information.
Add, View, Edit & Delete Vendor’s information.
Add, View, Edit & Delete Member’s information.
Track all allocated items information with reliable Search options.
Verify Member’s Fine information.
View & Print all Reports with specific Search options.
4

Chapter 2 An Overview of RFID Technology
2.1 Introduction to RFID RFID (Radio Frequency Identification) [3] is used in all areas of automatic data
capture allowing contactless identification of objects or person using RF
electromagnetic fields to transfer data from a tag attached to an object, for the
purposes of automatic identification, locating and tracking. They can similarly be
embedded in identification badges to provide hands-free access to secure areas or
implanted beneath the skin of pets, such as cats and dogs, so they can be returned to
their owners if they are lost.
RFID is a technology where information can be read from and/or written to a
microchip without contact might be using HF magnetic induction or UHF
transmission and reflection. Both HF and UHF techniques have the same function,
interfacing between a reader & an information storage device by means of antennas,
but they are quite different in operation.
RFID, which is a “no touch technology”, can be used in surveillance, detection of
counterfeiting, computation, tracking & checking for objects in various fields of
industry such as manufacturing, construction & health care. With applications ranging
from secure internet payment systems to industrial automation & access control,
RFID technology solutions are receiving much attention in the research &
development departments of large corporations. RFID is a major growth in auto ID,
allowing emergency vehicles to safely trip traffic signals & providing the technology
behind contactless smart cards, "auto piloting" cars, and production automation.
An RFID system has a few major components, a reader with an antenna, a tag & a
database, often a Personal Computer with connection to a larger network. The tag is
placed on the object that is to be identified, contains the suitable information. The
reader has a number of different responsibilities like powering the tag, identify the
tag, read & sometimes write data to the tag. The reader also communicates with the
database in which the information from the tags will be processed.
5

Typical RFID system use inductive coupling between the card and the reader. Both of
them have coils which interacting with each other (magnetic coupling). This
interaction makes it possible to transfer power to the card (through alternating
magnetic field or pulses) and transfer information (modulating the magnetic field).
Typical this kind of inductively coupled systems operate at 125-kHz to 13.56-MHz
frequency range. ISO frequencies of 125 kHz and 13.56 MHz are generally used.
2.2 Fundamental Components in an RFID System An RFID system largely consists of Tags (transponder), Readers (transceiver) and
Middleware (Host Computer).
Figure 1: The Basic Building Blocks of an RFID System.
2.2.1 RFID Tag
An RFID tag is a device that stores certain unique information. The tag also known as
the transponder, from the term’s transmitter and responder, holds the data that is
transmitted between the tag and the reader. A tag consists of an Integrated Circuit (IC)
with memory (for storing and processing information, modulating and demodulating
a radio-frequency (RF) signal, collecting DC power from the incident reader signal,
and other specialized functions) and an antenna for receiving and transmitting the
signal. When the object that is tagged comes in a reader’s interrogation zone (reading
zone) and the reader sends out a radio wave to the tag then the tag powers up and the
data from its memory is retrieved and transmitted to the reader, in some cases new
6

information is sent from the reader to the tag. The reader sends the information to a
database that processes the data from the tag in a suitable way. Because RFID is using
radio waves, it is not necessary to have a line of sight between the reader’s antenna
and the tag.
The distance between the transponder and reader depends on which coupling and
frequency that are used. It is possible to achieve distances from a few centimeters up
to 100 meters. The speed which the data can be transferred between tag and reader is
also depending on which frequency that is used; lower frequencies can not transfer
data as fast as the higher frequencies, due to the higher clock frequency allowed in the
higher frequencies. This means that if it is necessary to read many tags at the same
time a higher frequency is preferred.
A key classification of RFID tags is the source of power. However, there are some
disadvantages of using power for the tag’s circuitry. The tag’s life span depends on
the battery; it stops working when the battery dies. Active RFID tags are also larger
and more expensive than passive RFID tags. This is particularly important in
environments that may have special requirements and different tracking needs, such
as health care facilities and hospitals that might be tracking large and expensive assets
with active RFID tags, but smaller, less-expensive or disposable inventory items with
passive or semi-passive tag technologies. 2.2.1.1 Tag Formats
Tags come in many shapes and sizes. The reading range of the different tags are
depending on which frequency that are used and the power level that are transmitted
from the reader. The tags also differ in memory capacity and temperature
survivability. Almost all tags are encapsulated for durability against shock, moist, dirt
and chemicals, but there are also cheaper tags without encapsulation.
7

Figure 2: Tag and Sensor Overview
The size of a tag depends primarily on two things, whether the tag have a battery or
not and the size and shape of the antenna. The size and shape of the antenna depends
on which frequency that is used.
2.2.1.1.1 1-bit Transponder The simplest of all tags is the 1-bit transponder. The 1-bit transponder is used in
Electronic Article Surveillance (EAS). The 1-bit tag can only represent two states 1
and 0, which means that the system only has two states as well, tag in readers
interrogation zone or no tag in readers interrogation zone, there are no identification
done. Despite of the 1-bit transponder limitations they are very widespread and its
main application is anti-theft systems in shops.
2.2.1.1.2 Glass Housing A glass tag is encapsulated in glass. The glass tag is mostly used for animal
identification. The tag gets inserted under the skin of the animal and can later be read,
or written, from the outside. These tags use the lower frequencies so the
electromagnetic wave can penetrate the animal’s tissue.
2.2.1.1.3 Disks and Coins A very common construction is the so-called disk (coin), a tag in round injection
molded housing with a diameter ranging from a few millimeters to several
centimeters.
8

2.2.1.1.4 Smart Labels Smart Label also called Smart Tag. Like bar codes, these labels are able to easily
applied, unobtrusive, quick to read, cheap & disposable. On a label the antenna is
printed, etched or punched on a thin paper/polyester substrate with a chip. They are
very flexible and can easily be attached to any products. They are less resistant to
environmental conditions than the encapsulated tag but much cheaper. The labels
provide low-cost benefits in open systems. When a label is involved in an open
system it is attached to the product somewhere in the supply chain but never removed,
so when it reaches the consumer it will never be reused. The labels can also be
printed with all existing formats and layouts of text, barcodes and graphics. These
printers also write information to the tags. The benefits that smart labels offer over bar
coding systems are beginning to outweigh the shortcomings and the costs of
implementing smart labels solutions, making smart labels a cost-effective technology.
2.2.1.1.5 Smart Cards Smart card, or contactless smart card, often looks like a normal credit card. There are
three types of smart cards; close-coupling smart card, proximity-coupling smart card
and vicinity coupling smart card. The close-coupling smart cards have extremely short
reading range and are often used for payment in public transportation like buses,
planes subways. Proximity coupling smart cards have a reading range of a few
centimeters, they are often used for large public gatherings that requires access
control like sport events or concerts. Vicinity-coupling smart cards are designed to
have a reading range up to a half meter or so, they are used as controlled access cards
in office buildings. [4]
9

2.2.1.2 Special Purpose Tags
2.2.1.2.1 Sensor Tags A sensor tag is not only designed to read or write from its memory, it can also
perform simple tasks like measure air pressure, temperature or the presence of
bacterial agents. A sensing device is packed together with the tag to record whatever
it was designed to monitor. The challenge is when you would like a passive sensor
tag. This means that the sensor only has power when the tag is in a reader’s
interrogation zone. That means that the sensor only can record the conditions for a
very brief period of time and with a very limited power. Sensor tags are mostly active.
2.2.1.2.2 Chipless Tags A chipless tag is, as it sounds, a tag without a chip. They are therefore passive and
most of the technologies involve the idea of encoding unique patterns on the surface
of the tag that reflects the radio waves.
2.2.1.2.3 Encrypted Tags The encrypted tag is used whenever you are looking for a secure system like payment
systems, ticketing or when you store company sensitive data on the tags like process
flow.
2.2.1.3 Tag Types RFID tags can be Passive, Active or Battery Assisted Passive. Since tags have
individual serial numbers, the RFID system design can discriminate several tags that
might be within the range of the RFID reader and read them simultaneously.
10

2.2.1.3.1 Passive RFID Tag A passive tag does not have a battery; they use the energy that the electromagnetic
wave from the reader induces in the antenna to power up the chip and to transmit the
data back to the reader. Passive tags reflect energy from the reader or receive and
temporarily store the energy in order to generate the tag response to the reader. A
passive tag is cheaper and smaller because it has no battery. Instead, the tag uses the
radio energy transmitted by the reader as its energy source. The interrogator must be
close for RF field to be strong enough to transfer sufficient power to the tag.
Rely entirely on the reader as their power source. These tags are may read up to 30
feet away depending on the type of material to which they are attached and have
lower production costs. Accordingly, they can be attached to the merchandise that is
less costly, higher volume or disposable. These tags may be manufactured to be
disposable, along with the items on which they are placed. A recent breed of passive
tags have incorporated electronic elements to store and save the energy received from
the reader in a fashion similar to how rechargeable batteries work. Tags may then use
the power from this source to transmit data in longer range of up to 50 feet.
Passive RFID systems are composed of three components: an interrogator (reader), a
passive tag and a host computer. The tag is composed of an antenna coil and a silicon
chip that includes basic modulation circuitry and non-volatile memory. The tag is
energized by a time-varying electromagnetic radio frequency (RF) wave that is
transmitted by the reader. This RF signal is called a carrier signal. When the RF field
passes through an antenna coil, there is an AC voltage generated across the coil. This
voltage is rectified to supply power to the tag. The information stored in the tag is
transmitted back to the reader. This is often called backscattering. By detecting the
backscattering signal, the information stored in the tag can be fully identified. Passive
RFID devices also use a serial bus, but the power, clock, and data are all in the same
signal. Instead of wires, this signal is carried through wireless means.
11

2.2.1.3.2 Active RFID Tag Active RFID tags have their own internal power source, which is used to power the
integrated circuits and periodically transmits its ID signal. It allows very low-level
signals to be received and can still generate high-level signal to be transmitted back to
the reader. Active RFID tags carry battery or some other power, which provides a
smarter function; can send more information than simple ID code, or has a longer
range than interrogator-powered versions. These tags are reserved for more costly
items that are read over greater distances. They broadcast high frequencies from 850
to 950 MHz and ISM 2.4 GHz band that can be read from 100 feet or more away.
Additional batteries can boost a tag's range to over 300 feet (100 meters).
The active tag lies in sleep-mode until it gets a wake-up signal from the reader. As
soon as the tag gets the wake-up signal the data carrier gets into operating mode. After
the completion of the data transaction, the tag gets into sleep-mode again. They have
therefore much longer reading range than a passive tag. On the other hand because
they have a battery, they have finite lifetime.
Active tags, due to their onboard power supply, also transmit at higher power levels
than passive tags, allowing them to be more effective in "RF challenged"
environments like water (including humans/cattle, which are mostly water), metal
(shipping containers, vehicles), or at longer distances, generating strong responses
from weak requests (as opposed to passive tags, which work the other way around).
Typical applications of Active RFID Solutions:
Personnel/Vehicle Access Control Body Temperatures of Patients & Babies Monitoring
Parking Lot Management Conference Personnel Tracking Fleet Monitoring Temperature/Humidity/Sunshine Monitoring Inventory Management Personnel Tracking at Mining & Oil Rig Container & Pallet Tracking Personnel & Asset Tracking in Hospital Manufacturing Line Management Prison Inmate Tracking Skids and Bins Tracking Tourist Group Tracking
12
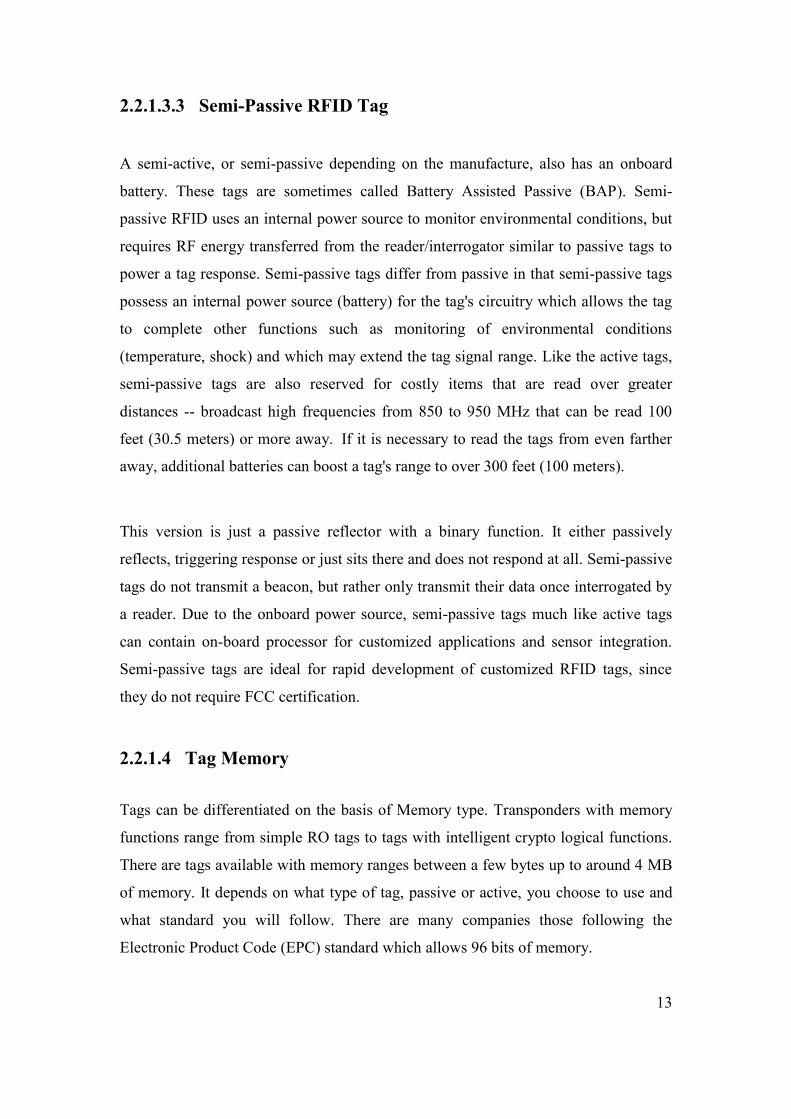
2.2.1.3.3 Semi-Passive RFID Tag
A semi-active, or semi-passive depending on the manufacture, also has an onboard
battery. These tags are sometimes called Battery Assisted Passive (BAP). Semi-
passive RFID uses an internal power source to monitor environmental conditions, but
requires RF energy transferred from the reader/interrogator similar to passive tags to
power a tag response. Semi-passive tags differ from passive in that semi-passive tags
possess an internal power source (battery) for the tag's circuitry which allows the tag
to complete other functions such as monitoring of environmental conditions
(temperature, shock) and which may extend the tag signal range. Like the active tags,
semi-passive tags are also reserved for costly items that are read over greater
distances -- broadcast high frequencies from 850 to 950 MHz that can be read 100
feet (30.5 meters) or more away. If it is necessary to read the tags from even farther
away, additional batteries can boost a tag's range to over 300 feet (100 meters).
This version is just a passive reflector with a binary function. It either passively
reflects, triggering response or just sits there and does not respond at all. Semi-passive
tags do not transmit a beacon, but rather only transmit their data once interrogated by
a reader. Due to the onboard power source, semi-passive tags much like active tags
can contain on-board processor for customized applications and sensor integration.
Semi-passive tags are ideal for rapid development of customized RFID tags, since
they do not require FCC certification.
2.2.1.4 Tag Memory Tags can be differentiated on the basis of Memory type. Transponders with memory
functions range from simple RO tags to tags with intelligent crypto logical functions.
There are tags available with memory ranges between a few bytes up to around 4 MB
of memory. It depends on what type of tag, passive or active, you choose to use and
what standard you will follow. There are many companies those following the
Electronic Product Code (EPC) standard which allows 96 bits of memory.
13

2.2.1.4.1 RO A Read Only (RO) tag has a pre-programmed serial number written on its memory.
The serial number is incorporated during chip manufacturing. The user can not alter
this serial number or write new data to the tag. When the tag enters a reader’s
interrogation zone it will instantly start to send out its unique identification number
and it will do so continuously until it is out of the reading zone. The data
communication is unidirectional; data transmission from the reader to the tag is not
possible. When using RO tags you need to connect the serial number of the tag with
which product it involves with appropriate software.
2.2.1.4.2 RW RW tags are often called Smart Tags. With a Read Write (RW) tag you can write new
information to the tag or write over existing information. It is only possible to write
information to the tag when it is in a reader’s interrogation zone. You can of course
also read information from the tag.
RW tags usually have a pre-programmed serial number that can not be written over.
But unlike the RO tags an RW tag also have a memory space where the user can put
his own information. An RW tag has limited write cycles depending on which type of
memory it is using.
2.2.1.4.3 WORM A Write Once Read Many (WORM) is a tag which is something between an RO and
an RW. You can, which the name indicates, write to the tag one time and read it as
many as you like. When you have written to the tag the data on the tag becomes
locked and you can only read from it. WORM tags can have additional data (like
another serial number) added once, but they cannot be overwritten.
14

2.2.2 RFID Reader An RFID system uses tags, or labels attached to the objects to be identified. Two-way
radio transmitter-receivers called interrogators or readers send a signal to the tag and
read its response. It creates a read zone between tags and readers. Below the reader
‘zaps’ the chip with a radio wave, the chip replies with its EPC.
Figure 3: Passive RFID Tag’s response by the Reader’s RF signal.
The reader connects with the tag and the host computer. The reader receives the tag’s
information and sends it through standard interface to the host computer. The tags
emit identifiable radio waves and the readers receive this information through their
internal antennas. The range of the read zone depends on the reader’s power and the
frequency used to communicate as well as the tag used. Lower-frequency tags can be
read from shorter distances and higher-frequency tags from longer distances.
The readers generally transmit their observations to a computer system running RFID
software or RFID middleware. When the tagged item moves in or passes by the
electromagnetic fields, the chips in that tag are stimulated by radio waves. The chip is
powered up and then broadcasts its data. Even though most tags operate similarly,
their applications differ depending on the location of reader and the types of readers
used. There are three basic kinds of RFID reader installations: hand-held, fixed reader
installed in area, and fixed reader installed at chokepoint. 2.2.2.1 Hand-held Reader A handheld reader is a small, lightweight device that is used to find tagged items
quickly and conveniently. Users can grip the hand-held reader easily and carry this
while users look for specific things that they want in large and complicated areas. The
user can determine how far away the desired tagged items are located through
measure and display of the Received Strength Signal Indicator (RSSI).
15

2.2.2.2 Fixed Reader Installed in Area A fixed reader is installed on a stationary point like a wall or a ceiling to read
movement, location or internal data of objects in the area. The reader collects the
information continuously. Depending on the reader size (especially its antenna), the
range & accuracy is greater than hand-held readers. In the other words, the antenna
size of the tag & reader is important for range considerations because a bigger antenna
can collect & broadcast more energy. So, fixed readers are used mainly with active
RFID tags.
2.2.2.3 Fixed Reader Installed at Chokepoint A fixed reader at a chokepoint is the most common application of RFID. The
operating principle of the reader is to read a signal whenever the tagged objects arrive
or depart. Thus, users are able to see the flow of assets with ease. Moreover, it is
efficient because all objects have to flow through the chokepoint. Fixed readers
installed at chokepoints are used mainly with passive RFID tags.
2.2.3 Middleware Middleware is the software loaded on the RFID host computer to integrate various
data received from several readers. This means that middleware connects two
disparate applications, reader & host computer, allowing these to pass information
between them. Through middleware, users can get data from the reader for displaying
on the host computer such as Electronic Product Code (EPC) number, sales, date,
inventory and directions in the movement of hardware (tags and readers).
16

2.3 Reader Antenna An antenna is connected to a reader (transceiver) and the antenna sends out the
reader’s signals. Basically, the reader tells the antennas how to generate the proper RF
field. This field can cover an area from a few centimeters up to 30 meter or more.
How large that area can be is depending on the power output & the frequency. When
an RFID tag moves into the antenna’s radio field, it becomes activated. After the
activation it sends back the information that is programmed into its memory. Through
its array of antennas, the reader receives the tag’s signal and decodes the signal. The
decoded signal is then sent to the software system. A reader can also transmit special
signals to a tag, for example telling a tag to come alive, synchronizing a tag with the
reader or interrogating all or part of the tag’s content. Antennas can act continuously
or on demand. The continuously active system is used when tags are present regularly
or for multiple tag reading in the antenna’s detection field. This detection field can be
activated only when needed by a sensor of some kind and is called the on-demand
method.
Figure 4: RFID Antenna’s function.
Normally one to four antennas can be attached to one reader. There are some readers
where up to eight antennas can be attached. The reason for that is the need of free
sight when using frequencies in the UHF band to read on metal. With, for example,
four antennas connected to a reader it is possible to cover a larger reading area from
four directions. This is very useful, especially if the tagged items have different
orientations in the reading area. An antenna gate can, for example, be used in a
doorway or in the process line. It is important to choose the right type of antenna to an
RFID system. Preferably the antenna should be a compromise between a very sharp
tune, i.e. maximum performance without detuning, and a very flat tune that is less
affected by detuning.
17

2.4 RFID Standards Development of RFID in industry, standardization for RFID becomes more important.
The purpose of RFID is convenient & rapid application, but if it is not easy to interact
with different locations or items, it will not serve its purpose. Thus, two types of
standards are considered here: Data standards and Technology standards. Data standards can provide unified data through the EPC. The EPC is a unique code
number which has same structure in every tag. This code, which was invented by MIT
Auto-ID Center, is divided into 4 portions. The 2 digit header number identifies the
length, type, structure, version & generation of the EPC. EPC manager number means
the company contained in the production of the manufacturer. With 28 bits, the EPC
manager is able to cover as many as 228 companies. Object class represents the stock
keeping unit (SKU) when applied to retail products. A serial number is used to
identify each product; it can share about 68 billion items. So the EPC will not be
repeated for different items.
Figure 5: Electronic Product Code (EPC)
Technology standards, that are different to EPC data structure, are associated with air
interface (frequency) between RFID tags & readers. There are several standards such
as the following: ISO 15693 (Smart Labels), ISO 14443 (Contactless payments) &
ISO 11784 (Livestock), but the ISO 18000 standards family is used most widely. [5] •ISO 18000-2 (LF): under 135 KHz
•ISO 18000-3 (HF): 13.56 MHz
•ISO 18000-4 (Microwave): 2.45 GHz
•ISO 18000-7: 433 MHz Even though these various standards exist, one RFID tag does not enable
interoperability with the reader of different manufacturers. However, ISO 18000-6
A/B (UHF) tried to communicate with RFID hardware by different manufacturers &
2nd generations by EPC global and ISO 18000-6 C (Passive UHF) have agreed to
interoperate their data. The unification of technology standards will improve the
utility of RFID.
18

2.5 RFID Frequencies Just as TV broadcasts in VHF or UHF band, similarly RFID systems also use
different bands for communication. Because of RFID systems generate & radiate
electromagnetic waves, they are justifiably classified as radio systems. The function
of other radio services must under no circumstances be disrupted or impaired by the
operation of RFID systems. So understanding the relation between RFID & frequency
can provide better knowledge about the application of RFID. RFID systems generally
operate at three different frequencies. These are low frequency (LF), high frequency
(HF) & ultra high frequency (UHF). There are advantages & disadvantages to all of
these frequencies.
Table 1: Different Applications by Different Frequencies in RFID.
Low frequency (LF) is generally referred to as frequency in the range of about 30 -
300 KHz. RFID mainly uses 125 - 134 KHz frequencies. The typical read range of a
LF RFID tag is typically less than 0.5 meters or 1.5 feet & transfers small data at rates
of less than 1 kbps. LF RFID tags are less sensitive to interference so they generally
perform better in harsh environments, on metal surfaces & in the presence of liquids.
High Frequency (HF) is 3 - 30 MHz. HF systems typically operate at a frequency of
13.56 MHz. They have a higher read speed & higher read range than LF RFID
systems. The read range for HF RFID is typically 1 meter or 3 feet. HF can transfer
data approx. 25 kbps. Like LF, this frequency passes through water, but also metal.
Ultra high frequency (UHF) is 300 MHz - 3 GHz. UHF RFID systems typically
operate at a frequency of 868 MHz - Europe, 902 - 928 MHz - USA. They have a
higher read speed & a higher read range than HF RFID systems. The read range for
UHF RFID is typically 3 meters or 9.5 feet and transfers 1 kbps, but it cannot
penetrate both water and metal.
19
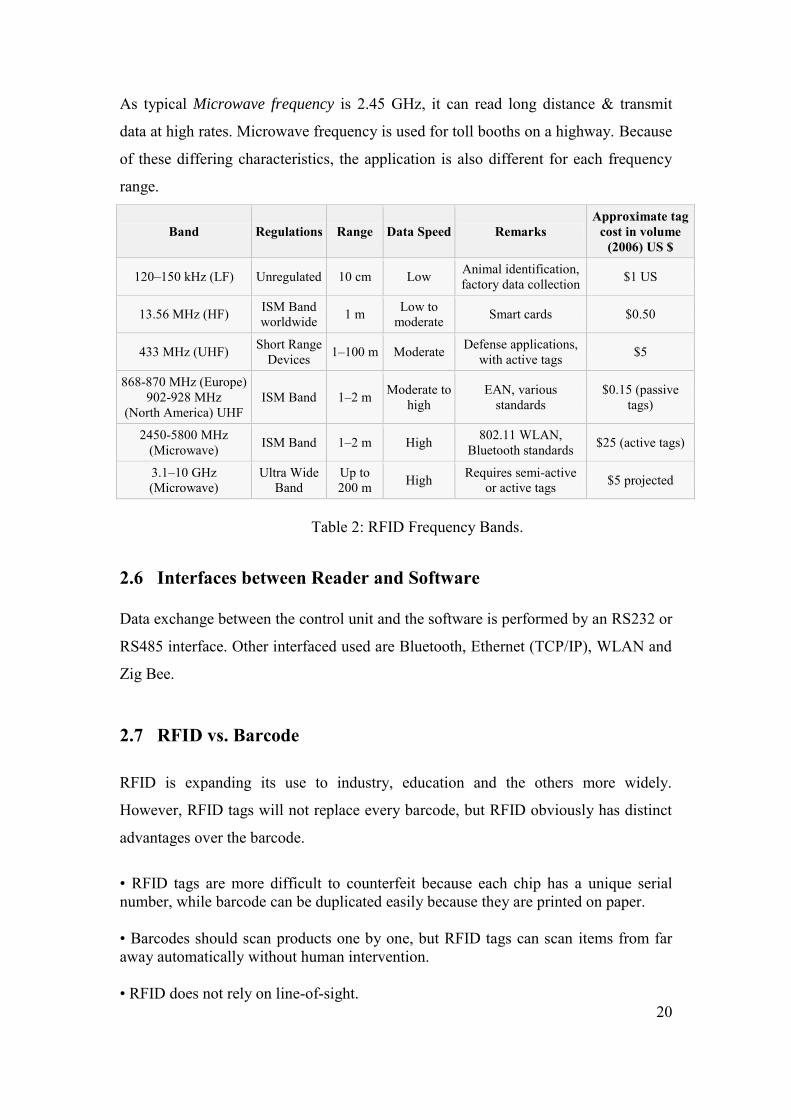
As typical Microwave frequency is 2.45 GHz, it can read long distance & transmit
data at high rates. Microwave frequency is used for toll booths on a highway. Because
of these differing characteristics, the application is also different for each frequency
range.
Band Regulations Range Data Speed Remarks Approximate tag
cost in volume (2006) US $
120–150 kHz (LF) Unregulated 10 cm Low Animal identification, factory data collection $1 US
13.56 MHz (HF) ISM Band worldwide 1 m Low to
moderate Smart cards $0.50
433 MHz (UHF) Short Range Devices 1–100 m Moderate Defense applications,
with active tags $5
868-870 MHz (Europe) 902-928 MHz
(North America) UHF ISM Band 1–2 m Moderate to
high EAN, various
standards $0.15 (passive
tags)
2450-5800 MHz (Microwave) ISM Band 1–2 m High 802.11 WLAN,
Bluetooth standards $25 (active tags)
3.1–10 GHz (Microwave)
Ultra Wide Band
Up to 200 m High Requires semi-active
or active tags $5 projected
Table 2: RFID Frequency Bands.
2.6 Interfaces between Reader and Software Data exchange between the control unit and the software is performed by an RS232 or
RS485 interface. Other interfaced used are Bluetooth, Ethernet (TCP/IP), WLAN and
Zig Bee.
2.7 RFID vs. Barcode
RFID is expanding its use to industry, education and the others more widely.
However, RFID tags will not replace every barcode, but RFID obviously has distinct
advantages over the barcode.
• RFID tags are more difficult to counterfeit because each chip has a unique serial number, while barcode can be duplicated easily because they are printed on paper. • Barcodes should scan products one by one, but RFID tags can scan items from far away automatically without human intervention. • RFID does not rely on line-of-sight.
20

• RFID tags can store more data than barcodes do. • RFID tags can read and write as well as revising. • RFID tags are not affected by harsh environments, while barcodes are.
2.8 Limitations of Reader and Tag Communications Due to the science of radio frequency is analogue, as that RF susceptible to
degradation caused by interference from spurious RF sources and environmental
conditions. The following examples can cause interference:
Liquid, for example water.
Metal, foil, or other metallic objects.
High humidity.
Extreme temperatures. Very cold or very hot.
Motors and engines.
Cordless phones.
Wireless devices, such as cell phones and Personal Digital Assistants (PDA).
Wireless computer or communication network.
How much these conditions affect a given RFID system’s performance depends on
the operating frequency. One of the most significant roles in the success of an RFID
deployment is the capability to address interference issues. Because of that, it is
critically important to extensive trials and pilots to enable optimal placement and
installation of the individual RFID components. RF engineers are making great
progress in designing systems to push the RF physics to overcome some of these
limitations. At the same time, many of the inconsistencies and inaccuracies also can
be addressed with sophisticated software solutions that implement error correction,
fault tolerance and redundancy.
21

Chapter 3 Development Process of the System
3.1 Outline of Methodology The project consists of the following Stages:
1. Feasibility Study
2. System Study Stage
I. Requirement Gathering
II. Specification
III. Planning
3. Design Stage
4. Coding Stage
5. Testing Stage
6. Operational Mode
7. Modification Stage This process followed the "Rapid Prototype Software Life Cycle Model”. The brief overview of the process is depicted below.
Figure 6: Rapid Prototype Software Life Cycle Model.
22
Feasibility
Requirement Gathering
Specification
Planning
Design
Coding & Model Testing
Integration & System Testing
Operation Mode
Modification
Development
Maintenance

3.2 Feasibility Study A project feasibility study is an exercise that involves documenting each of the
potential solutions to a particular business problem or opportunity. The purpose of a
project feasibility study is to clarify the wanted outcome of the project. It is important
to understand what the project will deliver. If a project is seen to be feasible from the
results of the study, the project can be continued to the next stage.
For an organization without any software it is very difficult to maintain these large
numbers of asset that are spread & used by different branch or site offices every day.
Some of these organizations already use desktop based software & others use web-
based software with limited functionalities. Some organizations maintain a section for
asset management. So, a complete low cost system will be financially feasible. The
system will reduce maintenance cost. The system will save user’s time and give
proper information when she/he wants.
3.3 Requirement Gathering, Specification & Planning Requirement Gathering, specification & planning are essential parts of any project
and project management. During this process, different similar software is analyzed
and hardware requirements are also studied & specified in this phase. Different types
of idea about the development are written up. The requirement process is completed
when the specifications for the new software product are written in a formal document
called the requirements specification document. In planning phase, a plan is made to
develop this software with requirement specification document.
3.3.1 Identify User Identifying the Administrator and the General users of software is very important. The
different types of users of the software are as follows:
1. Admin User (Administrator)
2. General User
23

3.3.1.1 Admin User (Administrator) System administrator can do anything on the software. System administrator is
responsible for updating and maintaining the database & codes of the software. The
administrators could view/insert/edit/delete item, category, user, vendor and
member’s information. She/he could also able to view/insert/edit/delete items issue &
receive from the members and verify member’s fine information.
3.3.1.2 General User
A general user is a responsible person appointed by the organization, who could
view/insert/edit/delete items issue & receive from the members and change his/her
own password. She/he could also able to verify member’s fine information.
3.3.2 Identify Member Members are faculties, employees and students of the organization. To use this
service, a member should have registered by the user. Then she/he could borrow
her/his desired items from the inventory system.
3.3.3 Analysis of Main Features The Inventory Management System software is designed to manage its fleet of items
more effectively & efficiently. An administrator can monitor items distribution,
retrieve any item’s historical information using this software. Some key features of
Inventory Management System are discussed next.
Allocation Process Any member can demand for an item. A user can allocate that item by select the
specific item by using the RFID reader & member ID. Users also add the allocated
days of issued item and the delay fee per day information which would be reasonable.
Users can see the inventory stock of item allocation.
24
Control Information The administrators can control different information such as users, issued days, fines
information etc. General users can only view limited information.
Sending to Issue Location Users can select the specific item by using the RFID reader and add the information
regarding sending of it to specific location according to member’s need. Users can
also insert the information about the allocated days of issued items and the delay fee
per day.
Return from Issue Location Users can select the specific item by using the RFID reader and verify the information
regarding item issue including fine and update the information of its new location
where it would be.
Search Records Users have power to search previous information from database by ID, name, address,
date or location. Users can search and select different records related to user, member,
item, category, vendor information.
Print Option Users can print inventory stock report which contains the information about item,
location and issue status. Users can print member’s fine report which contains the
allocation information about member, item, issued by, date, date, fine, location etc.
Nevertheless admin users have specific search options where they can print the
information about user, member, item, category and vendor. Users can keep hard
copies of allocation records through print option.
25

3.3.4 Software Architecture The developed Inventory Management System works within a network (Intranet). The
architecture for the system contains two necessary components: [6]
The Data & Data Server
The Client Application & Client.
Figure 7: Overall System of IMS using RFID System.
3.3.5 Software Interfaces In this project the following tools software are used:
Software: VB.NET Version No.: 2008 (VB 9.0)
Source: Microsoft Corporation
Purpose: Microsoft Visual Studio 2008 is sets of tools that are simple, fun, and easy to learn.
They enable developers of all skill levels—hobbyists, students, experienced, and
casual developers—to create cool, fun applications.
Definition of the Interface: VB.NET is an object-oriented computer programming language that can be viewed as
an evolution of the classic Visual Basic (VB), which is implemented on the .NET
Framework.
26
End Users SW (VB.Net)
Database (MySQL)
RFID Reader
The Client Application & Client
The Data & Data Server
Interfacing
Serial Communication

Software: MySQL Community Server
Version No.: 5.5
Source: MySQL
Purpose: Required as Database Server.
Definition of the Interface: MySQL is the world’s most popular open source database software. With superior
speed, reliability and ease of use, MySQL has become the preferred choice of
corporate IT Managers because it eliminates the major problems associated with
downtime, maintenance, administration and support. [7]
Connector/NET: MySQL Connector .NET
Version No.: 6.5.4
Source: MySQL
Purpose: ADO.NET Driver for MySQL. Definition of the Interface: MySQL Connector/Net is an open-source .NET data provider for MySQL.
Connector/Net is a fully managed ADO.NET driver for MySQL written in 100% pure
C# and does not utilize the MySQL client library. One managed-code, external library
is required (SharpZipLib) for compression of the data stream between the driver &
MySQL. (This used to be known as ByteFX.Data.) Connector/Net lets you easily
develop .NET applications that require secure, high-performance data connectivity
with MySQL. It implements the required ADO.NET interfaces and integrates into
ADO.NET-aware tools. Connector/Net includes full support for the features provided
by MySQL Server up to and including MySQL Server version 5.5.
27

SQLyog: MySQL GUI Version No.: 9.6.1
Edition: Community Edition
Source: Webyog, Inc.
Purpose: MySQL Front-end, MySQL Monitoring Tool. Definition of the Interface:
SQLyog - MySQL GUI is the most powerful MySQL manager and admin tool,
combining the features of MySQL Administrator, phpMyAdmin and other MySQL
Front Ends and MySQL GUI tools.
Crystal Reports: Crystal Reports Basic for Visual Studio 2008 Version No.: 2008
Source: Microsoft Corporation
Purpose: To generate & display interactive reports.
Definition of the Interface:
Crystal Reports is a business intelligence application used to design and create
powerful, user-friendly & dynamic reports from a wide range of data sources. Crystal
Reports allows users to graphically design data connection(s) & report layout. In the
Database Expert, users can select & link tables from a wide variety of data sources,
including Microsoft Excel spreadsheets, Oracle databases, Business Objects
Enterprise business views & local file system information.
3.3.6 Hardware Interfaces
This system is developed for the organizations which have their own network. So,
there is no need of extra computer or internet connection. Printer is necessary for
printing the documents generated from the system.
28

RFID Kit: Series 2000 Reader System Model No. : S2000 Micro Reader RI-STU-MRD1
Source: Texas Instruments Incorporated Purpose: The easy-to-use plug and play Low Frequency Midrange Reader Evaluation Kit gives
you the opportunity to explore the capabilities of Texas Instruments’ 134.2 kHz Radio
Frequency Identification (RFID) technology TIRIS™. RFID creates an automatic way
to collect information about a product, place, time or transaction quickly, easily and
without human error. It provides a contactless data link, without need for line of sight
or concerns about harsh or dirty environments that restrict other auto ID technologies
such as bar codes. [8]
Definition of the Interface: Protocol Frame PC to Micro-Reader: In order to select the “Read Mode” of the Micro-Reader we have to follow this frame
to communicate with the RFID Tags in the middleware.
Start Length Cmd 1 Cmd 2 Data BCC
Table 3: Protocol Frame PC to Micro-Reader.
Byte Contents (Hexadecimal Value) 0 Start Mark (SOH, 01hex) 1 Length 2 Command Field (1) 3 Command Field (2) (optional) 4(3) Data Field (1) . . N+3(2) Data Field (N) N+4(3) BCC Note: The total number of bytes sent within a protocol frame (including Start Mark and BCC) is limited to 41 bytes.
29

Start Mark
The 'Start-Mark' signifies the beginning of a message. It is represented by the ASCII
character SOH (Start Of Header, 01 hex).
Length
The 'Length' byte indicates the length, in bytes, of the following Command and Data Fields. Command Field
The 'Command Field(s)' defines the mode in which the Micro-reader operates and
determines the operation that is to be carried out in the transponder. Depending on the
setting of the relevant bits, the corresponding information specified in the Data Fields
will be sent to the transponder or not. Thus all functions of each particular
transponder type can be executed.
Command Field (1)
Bit Use Setting Comment 0/1 Mode/Cmd 00
(MSB,LSB) Perform single command (E.g.: single read, program, lock)
01 Read in continuous Normal Mode 10 Read in continuous Line Mode 11 Send Micro-reader S/W version
2 FBCC Calculation 1/0 If set, Micro-reader calculates FBCC of the MPT protocol
3 Power Burst I 1/0 If set, needs to be determined in Data Field 4 Power Pause
Duration 1/0 If set, needs to be determined in Data Field
5 Power Burst II 1/0 If set, needs to be determined in Data Field 6 Data 1/0 If set, needs to be determined in Data Field 7 Cmd Expansion Field 1/0 If set, Command Field (2) follows
Table 4: Command Field (1) of Protocol Frame PC to Micro-Reader.
If bit 2 (FBCC calculation) and bit 6 (Data) are set, the Micro-reader automatically
calculates a two byte BCC over the data to be sent to the transponder and adds it to
the protocol. When bits 2 and 6 are set the PC must not send the 2 byte FBCC to the
Micro-reader.
30

Bit 4 (Power Pause Duration) is for future use and must not be set when addressing
standard TIRIS transponders.
If bit 5 (Power Burst II, for example: for programming and locking) is set, the
Microreader automatically operates in single mode. Thus the user is enabled to
validate the programming or lock response before a further cycle is started.
Command Field (2)
Bit Use Setting Comment 0 Special Write
Timing
1/0 If set, needs to be determined in Data Field
1 Wireless Synchronization
1/0 If set, wireless synchronization is used
2 DBCC calculation 1/0 If set, Micro-reader calculates DBCC of the R/W and MPT write data
3-7 Reserved
Table 5: Command Field (2) of Protocol Frame PC to Micro-Reader.
If Command Field (2) is not present, standard TIRIS write timings are used and
wireless synchronization is switched on/off according to the status of input line
WLSC.
Note: The settings specified in Command Field (1) and (2) are only valid during the
execution of the current command.
Data Field
The presence of the relevant data field depends on the setting of the bits in the
Command Field. If the relevant bit (E.g.: Command bit 3 “Power Burst I”) is set to
“1”, then Data Field 1 is present defining the Power Burst length. If the relevant bit in
the Command Field is set to “ 0 ” the consequent Data Field is omitted, this results in
the following data field being moved forward (decremented) by one.
31

Data Field Use Range (dec) Comment 1 Power Burst I 1..255 ms If bit 3 of Command Field(1) is set 2 Power Pause
Duration 1..255 ms If bit 4 of Command Field(1) is set
3 Power Burst II 1..255 ms If bit 5 of Command Field(1) is set 4/5 toffLow
(LSByte/MSByte) 28..2044 ms If bit 0 of Command Field(2) is set
6/7 tonLow
(LSByte/MSByte) 28..2044 ms If bit 0 of Command Field(2) is set
8/9 toffHigh
(LSByte/MSByte) 28..2044 ms If bit 0 of Command Field(2) is set
10/11 tonHigh
(LSByte/MSByte) 28..2044 ms If bit 0 of Command Field(2) is set
12 # of Data Fields
that follow See *
If bit 6 of Command Field(1) is set
13.. Data Fields LSByte first
Table 6: Data Field of Protocol Frame PC to Micro-Reader. * The number of Data Fields must not cause an infringement of the total number of
bytes allowed within a protocol frame.
BCC The 'BCC' field is a one-byte value of the Longitudinal Redundancy Check
calculation (Xor'ed bytes) for the preceding message. The calculation is performed on
the whole message excluding the Start-Mark.
3.3.7 Security Requirements Most IT departments have security requirements for applications. The requirements
are often written as checklists.
Requires password & have options to change password.
Database servers should be physically secured.
Login ID & Password will be checked before starting the system.
Use a secured password for the MySQL Server administrator.
32

3.4 Design The design phase describes how the software is constructed so that it fulfils the
specifications agreed upon in the requirements specification document. It explains
required features & operation in detail, including database design, software design,
screen layouts & other documentation. When the design is completed it is recorded in
the design specification document. There are different types of design to develop this
software like ERD, UML etc. design stage is described in details in Chapter 4.
3.5 Coding & Model Testing In this stage, the designs are translated into code. The software is divided into separate
units called modules, in order to handle the complexity of the programming process.
All rules & regulations of programming language are maintained properly. Computer
programs are written using VB.Net 2008.
3.6 Integration & System Testing During this stage, the individual modules of the software product are combined to
form the integrated software product. A special testing environment is created to
check for errors, bugs & interoperability.
3.7 Operational Mode At this stage, the checked software is ready for use. If required, the modification stage
will modify & enhance the system according to the difficulty.
3.8 Modification & Maintenance After the system is in operation, various changes are made in order to fix bugs, to add
new functionality, to port the software to new platforms, or to adapt the software to
new technologies during the modification & maintenance phase of the system.
Although it may seem that the development of the software is finished after its
delivery, this is far from true. Even a successful software product need to be
developed or modified to meet the changing needs of the clients.
33

Chapter 4 System Design
4.1 Introduction The software system design describes the desired software features in detail, including
database design (ERD), software design (UML is produced here), screen layouts &
other documents. In system design, the software’s overall structure is defined with a
full data dictionary. These design elements are intended to describe the software in
detail that helps to develop the software with minimal additional input.
4.2 Database Design A database is a collection of information, organized in such a way that a computer
program can quickly select desired pieces of data. The computer program used to
manage & query a database is known as a database management system (DBMS) [9].
Databases are designed to offer an organized mechanism for storing, managing &
retrieving information. This includes detailed specification of data elements, data
types, indexing options & other parameters residing in the DBMS data dictionary.
Many models & languages are used for design of the database. To design the database
the Entity-Relationship (ER) Diagram is used.
4.3 E-R Diagram Entity-Relationship (ER) Diagram is a graphical representation of entities & their
relationship to each other, typically used in computing in regard to the organization of
data within databases or information systems. There are three basic elements in E-R
diagram.
Entities (tables) are the elements about which one seeks information.
Rectangular boxes are commonly used to represent entities.
Attributes are the data one collect about the entities. Ovals are used to
represent attributes.
Relationships provide the structure needed to draw information from multiple
entities. Diamonds are normally used to represent relationships.
34

4.3.1 E-R Diagram of Inventory Management System
Figure 8: E-R diagram of Inventory Management System.
Figure 8 shows entire an E-R diagram. The entities are given in detail in the later
figures. The descriptions of these entities are given next.
1. User Information: The name of this entity set is User. Due lack of space, this
entity set will be displayed in figure 9. 2. Member Information: The name of this entity set is Member. Due lack of space,
this entity set will be displayed in figure 10. 3. Vendor Information: The name of this entity set is Vendor. Due lack of space,
this entity set will be displayed in figure 11. 4. Item Information: The name of this entity set is Item. Due lack of space, this
entity set will be displayed in figure 12. 5. Item Category Information: The name of this entity set is Category. Due lack of
space, this entity set will be displayed in figure 13. 6. Issue_Return Information: The name of this entity set is Issue_Return. Due
lack of space, this entity set will be displayed in figure 14.
35

4.3.2 E-R Diagram of User Information Table Figure 9 shows the entire E-R diagram of User Information. Admin users can
add/view/edit/delete User Information in this table.
Figure 9: E-R Diagram of User Information Table.
4.3.3 E-R Diagram of Member Information Table Figure 10 shows the entire E-R diagram of Member Information. Admin users can
add/view/edit/delete Member Information in this table.
Figure 10: E-R Diagram of Member Information Table.
36
MemberContact
MemberAddress Member
ID
MemberName
MemberRegistrationDate
MemberEmail
UserContact
UserAddress
User
ID
UserPass
LoginID
UserType
UserName
UserRegistrationDate
UserEmail

4.3.4 E-R Diagram of Vendor Information Table
Figure 11 shows the entire E-R diagram of Vendor Information. Admin users can
add/view/edit/delete Vendor Information in this table.
Figure 11: E-R Diagram of Vendor Information Table.
4.3.5 E-R Diagram of Item Information Table Figure 12 shows the entire E-R diagram of Item Information. Admin users can
add/view/edit/delete Item Information in this table. Issue Status & Item Location will
be updated from Issue_Return table. General user can only view Item Information in
this table.
Figure 12: E-R Diagram of Item Information Table.
37
ItemLocation
CategoryID
Item
RFID
Price
SerialNo
ItemName
RegistrationDate IssueStatus
VendorID
VendorContact
VendorAddress
Vendor
ID
Company
VendorName
VendorEmail

4.3.6 E-R Diagram of Item Category Information Table Figure 13 shows the entire E-R diagram of Item Category Information. Admin users
can add/view/edit/delete Item Category Information in this table.
Figure 13: E-R Diagram of Item Category Information Table.
4.3.7 E-R Diagram of Issue_Return Information Table Figure 14 shows the entire E-R diagram of Item Issue & Return Information. Admin
users can add/view/edit/delete Item Issue & Return Information in this table. Admin
user can also add Issued Days & Delay Fee for the Issued Item & verify fine. General
user can also do the same in this table.
Figure 14: E-R Diagram of Issue_Return Information Table.
38
Category
ID
CategoryName
ReceivedBy
MemberID
Issue_Return
ID
IssuedDays
IssuedBy
DelayFee
RFID
IssueDate
ReturnDate

4.4 Data Dictionary Data Dictionary describes the table format (fields, data types, data length, primary,
foreign keys etc.) which is used in database design. The following tables are used in
database design. Table: User Information
Fields Domains Constraints Description ID Integer (11) Not null Auto Increment UserName Varchar (50) Not null Name of User LoginID Varchar (15) Not null Unique Key UserPass Varchar (15) Not null Password of User UserType Varchar (11) Not null Unique Key UserAddress Varchar (300) Address of User UserContact Integer (15) User’s Contact No. UserEmail Varchar (50) Email of User UserRegistrationDate Datetime User’s Registration
Date
Table 7: User Information.
Table: Member Information
Fields Domains Constraints Description ID Integer (11) Not null Auto Increment MemberName Varchar (50) Not null Name of Member MemberAddress Varchar
(300) Address of Member
MemberContact Integer (15) Member’s Contact No. MemberEmail Varchar (50) Email of Member MemberRegistrationDate Datetime Member’s Registration
Date Table 8: Member Information.
Table: Vendor Information
Fields Domains Constraints Description ID Integer (11) Not null Auto Increment VendorName Varchar (50) Not null Name of Vendor Company Varchar (50) Not null Unique Key VendorAddress Varchar (300) Address of Vendor VendorContact Integer (15) Vendor’s Contact No. VendorEmail Varchar (50) Email of Vendor
Table 9: Vendor Information.
39

Table: Item Category Information
Fields Domains Constraints Description ID Integer (11) Not null Auto Increment CategoryName Varchar (50) Not null Name of Item Category
Table 10: Item Category Information.
Table: Item Information
Fields Domains Constraints Description RFID Varchar (16) Not null Unique Key* CategoryID Integer (11) Not null Foreign Key VendorID Integer (11) Not null Foreign Key ItemName Varchar (50) Not null Name of Item SerialNo Varchar (15) Serial No. of Item Price Decimal Price of Item RegistrationDate Datetime Inventory Date of Item ItemLocation Varchar (100) Location of Item IssueStatus Integer (11) Not null Issue Status of Item * The EPC will be generated from RFID tags.
Table 11: Item Information.
Table: Issue_Return Information
Fields Domains Constraints Description ID Integer (11) Not null Auto Increment RFID Varchar (16) Not null Foreign Key MemberID Integer (11) Not null Foreign Key IssuedBy Integer (11) Not null Foreign Key IssueDate Date Not null Issue Date of Item IssuedDays Integer (11) Not null Issued Days for Item Issue DelayFee Integer (11) Not null Delay Fee for Item Issue ReceivedBy Integer (11) Foreign Key ReturnDate Date Return Date of Issued Item
Table 12: Issue_Return Information.
40

4.5 Software Design Software Design is a process of problem solving & planning for a software solution.
Object-Oriented Analysis and Design (OOAD) are implemented during the software
design. Each object represents some entity of interest in the system being modeled &
is characterized by its class, its state (data elements) & its behavior. Various models
can be created to show the static structure, dynamic behavior & run-time deployment
of these collaborating objects. There are a number of different notations for
representing these models such as the Unified Modeling Language (UML). Different
diagrams are used to help visualizing the whole development process.
4.5.1 Unified Modelling Language (UML) Diagram UML [10] is graphical notation system for Object-Oriented analysis & design. UML
is the industry standard language for the specification, visualization, construction &
documentation of the components of software systems as well as for business
modeling. UML helps to simplify the process of software design, making a model for
construction with a number of different views. One of the great merits of UML is the
way it helps open up the development process which is called use cases. These serve
to identify principal roles (actors) in the system, boundaries, actions & so on. UML
Use Case Diagram can be used to describe the functions of a system in a horizontal
way.
4.5.1.1 Use Case Diagram A use case diagram in the UML is a type of behavioral diagram defined by & created
from a Use case analysis. It is a set of scenarios that describes an interaction between
a user & a system. The two main components of a use case diagram are use cases &
actors. It can be shown by the figure 15.
Figure 15: Use Case Diagram.
41
Actor Use Case

An actor represents a person, organization or external system that will interact with
this system. The symbols of actors are drawn as stick figures. A use case is an
external view of the system that represents some actions the user might perform in
order to complete a task & is drawn as a horizontal ellipse. Lines are used to represent
the relationships between these elements.
4.5.1.1.1 Use Case Diagram of General User Figure 16 shows the use case diagram of General user. General user can log in his/her
account and can insert, update and delete item issue or return information for the
member. She/he can also logout from the account.
Figure 16: Use Case Diagram of General User.
42
Login
Change the Password
Insert Items Receive Information
View Items Information Insert/View Items Issue
Information
General User
Update
Update
Delete
Delete
Logout
Update
View Member’s Fine Information

4.5.1.1.2 Use Case Diagram of Admin User (Administrator) Figure 17 shows the use case diagram of Admin User (Administrator). Admin can log
in his/her account and can insert, update and delete the required information for the
system. She/he can also logout from the account.
Figure 17: Use Case Diagram of Admin User.
43
Login
Change the Password
Admin User
Update
Insert/View Items Category Information
Update
Delete
Insert Items Receive Information
Insert/View Items Issue Information
Update
Update
Delete
Delete
View Member’s Fine Information
Logout
Insert/View Users Information
Update
Insert/View Members Information
Insert/View Vendors Information
Update
Delete
Update
Delete
Update
Delete
Insert/View Items Information
Delete

4.5.1.2 Class Diagram In software engineering, a class diagram in the Unified Modeling Language (UML) is
a type of static structure diagram that describes the structure of a system by showing
the system's classes, their attributes, operations (or methods), and the relationships
among the classes. The class diagram is the main building block of object
oriented modeling. It is used both for general conceptual modeling of the systematic
of the application, and for detailed modeling translating the models into programming
code. Class diagrams can also be used for data modeling. The classes in a class
diagram represent both the main objects, interactions in the application and the classes
to be programmed.
In the design of a system, a number of classes are identified and grouped together in a
class diagram which helps to determine the static relations between those objects.
With detailed modeling, the classes of the conceptual design are often split into a
number of subclasses. In order to further describe the behavior of systems, these class
diagrams can be complemented by state diagram or UML state machine.
4.5.1.2.1 UML Class Symbol In the diagram, classes are represented with rectangle boxes which contain three parts:
The top section of the rectangle is the name of the class
The middle section is the attributes of the class
The bottom section lists the methods or operations of the class (methods
define the behavior of objects of the class). Methods are not always shown as
far as they are standard.
44
4.5.1.2.2 Domain Model Class Diagram A domain model in problem solving and software engineering is a conceptual model
of all the topics related to a specific problem. It describes the various entities, their
attributes, roles, and relationships, plus the constraints that govern the problem
domain. The domain model is created in order to represent the vocabulary and key
concepts of the problem domain. The domain model also identifies the relationships
among all the entities within the scope of the problem domain, and commonly
identifies their attributes. A domain model that encapsulates methods within the
entities is more properly associated with object oriented models. The domain model
provides a structural view of the domain that can be complemented by other dynamic
views, such as use case models. It can add precision and focus to discussion among
the business team as well as between the technical & business teams. Some key terms
of domain model class diagram are given below:
Unified Modelling Language (UML) diagram.
de facto standard for models used with object-oriented system development.
Domain model class diagram is a model to show classes of objects.
o Models things in the users’ work domain.
o Used to define requirements for OO.
No methods shown in domain model.
o Domain classes are not software classes.
Very similar to Entities in ERD.
o UML and domain model can be used in place of ERD in traditional
approach.
45

4.5.1.2.3 Domain Model Class Diagram of IMS
Figure 18 shows the domain model class diagram of IMS. Here shows all the classes
and their attributes of the system. The associations among the classes are also denoted
here.
Figure 18: Domain Model Class Diagram of IMS.
4.5.1.3 Activity Diagram An activity diagram illustrates the dynamic nature of a system by modeling the flow
of control from activity. An activity represents an operation of some classes in the
system that results in a change in the state of the system. Typically, activity diagrams
are used to model workflow or business process and internal operation. Activity
diagrams can show activities that are conditional or parallel.
46

4.5.1.3.1 Activity Diagram of Inventory Management System Figure 19 shows the activity diagram of IMS. In this case, both Admin User
(Administrator) & General User can issue or return items for the member after signing
in the system. Admin can also updating user, member, item category, item and
vendor’s information. The users would log-out from the system after finished their
works.
Figure 19: Activity Diagram of IMS.
47

Chapter 5 Functionalities of the RFID System
5.1 Hardware Aspects A User can do different works by using the RFID reader, which is interfaced with RS
232 serial communication. When an RFID tag is placed within the range of the RFID
reader’s antenna then the following works will be done.
5.1.1 Item Registration Aspect Administrators can register different Items by using the RFID reader. Here depicted
an inventory Item’s RFID tag is being registered by a User when it is placed within
the range of the RFID reader’s antenna.
Figure 20: Item Registration Aspect.
5.1.2 Item Issue Aspect Both Admin User (Administrator) and General User can Issue on demanded Items by
using the RFID reader to the members. Here depicted an Item’s RFID tag is being
Issued to a member when it is placed within the range of the RFID reader’s antenna.
Figure 21: Item Issue Aspect.
48

5.1.3 Item Return Aspect Both Admin User (Administrator) and General User can Receive Items by using the
RFID reader from the members & verify member’s fine information. Here depicted an
Issued Item’s RFID tag is being Returned from that member when it is placed within
the range of the RFID reader’s antenna.
Figure 22: Item Return Aspect.
5.2 Software Features The developed Inventory Management System has different essential features codes.
Screen shot of the main features are explained below.
5.2.1 Login Form Both Admin User (Administrator) and General User can access the system for their
role privilege with their own Login ID & Password those given to them when his/her
account would be created.
Figure 23: Login Form.
49

5.2.2 Inventory Main Form It contains the tree view of all the system’s features and the menu. Administrators can
do anything on the software whereas General Users can have access limited features.
Both Users after done their role privilege they can also logout from the system.
Figure 24: Inventory Main Form. 5.2.3 User Registration Form Administrators can create different User in this form. She/he will also able to go User
Lookup form and search and pick selected User information in here which could very
helpful for editing.
Figure 25: User Registration Form.
50

5.2.4 Change Password Form Both Admin User (Administrator) and General User can change his/her own password
if they wish.
Figure 26: Change Password Form.
5.2.5 User Lookup Form Administrators can view different User information with specific searching in this
form. Users can also print the selected information in here.
Figure 27: User Lookup Form.
51

5.2.6 Member Registration Form Administrators can create different Member in this form. She/he will also able to go
Member Lookup form and search and pick selected Member information in here
which could very helpful for editing.
Figure 28: Member Registration Form.
5.2.7 Member Lookup Form Administrators can view different Member information with specific searching in this
form. Users can also print the selected information in here.
Figure 29: Member Lookup Form.
52

5.2.8 Vendor Registration Form Administrators can register different Vendor in this form. She/he will also able to go
Vendor Lookup form and search and pick selected Vendor information in here which
could very helpful for editing.
Figure 30: Vendor Registration Form. 5.2.9 Vendor Lookup Form
Administrators can view different Vendor information with specific searching in this
form. Users can also print the selected information in here.
Figure 31: Vendor Lookup Form.
53

5.2.10 Item Category Form
Administrators can create different Item Category in this form.
Figure 32: Item Category Form.
5.2.11 Item Registration Form Administrators can register different Items by using the RFID reader in this form.
She/he will also able to go Item Lookup form and search and pick selected Item
information in here which could very helpful for editing.
Figure 33: Item Registration Form. 54
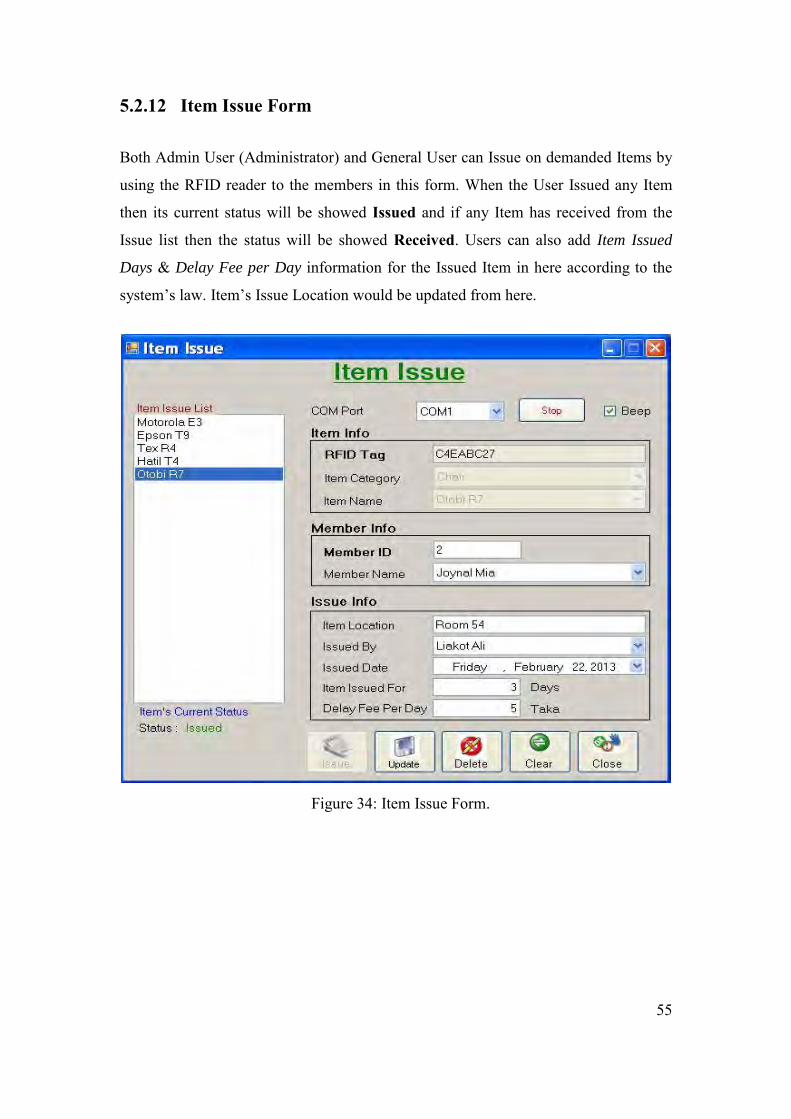
5.2.12 Item Issue Form Both Admin User (Administrator) and General User can Issue on demanded Items by
using the RFID reader to the members in this form. When the User Issued any Item
then its current status will be showed Issued and if any Item has received from the
Issue list then the status will be showed Received. Users can also add Item Issued
Days & Delay Fee per Day information for the Issued Item in here according to the
system’s law. Item’s Issue Location would be updated from here.
Figure 34: Item Issue Form.
55
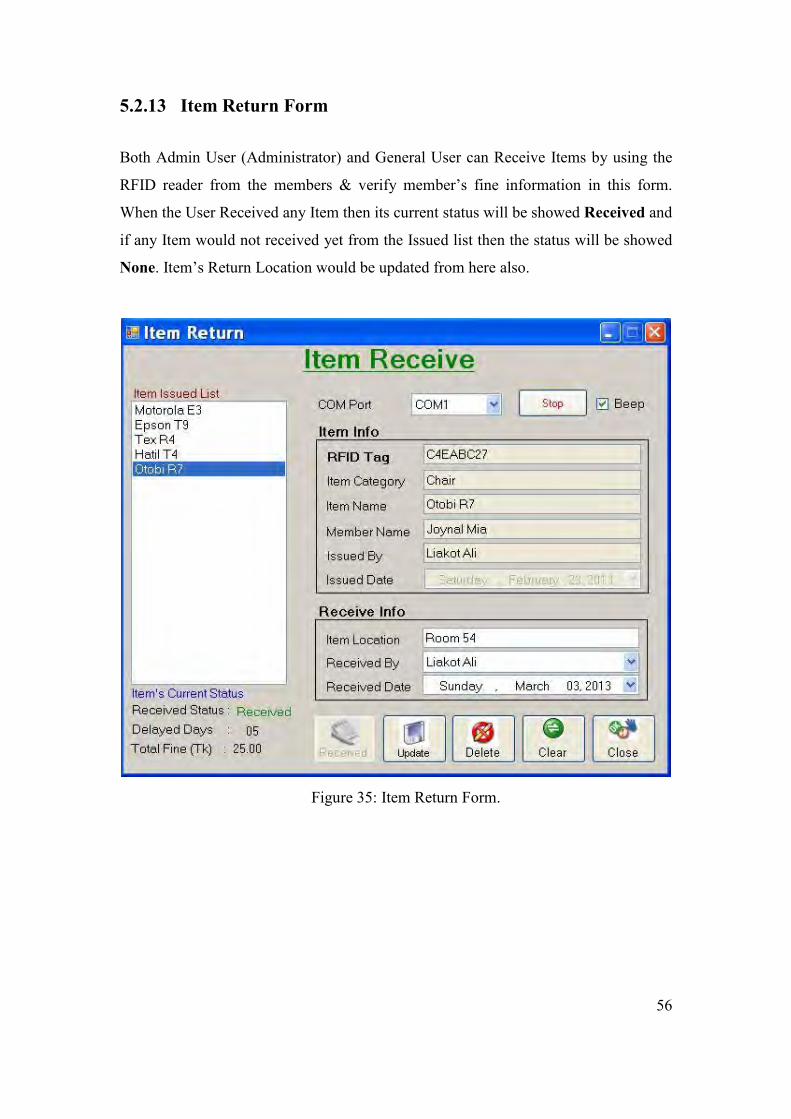
5.2.13 Item Return Form Both Admin User (Administrator) and General User can Receive Items by using the
RFID reader from the members & verify member’s fine information in this form.
When the User Received any Item then its current status will be showed Received and
if any Item would not received yet from the Issued list then the status will be showed
None. Item’s Return Location would be updated from here also.
Figure 35: Item Return Form.
56

5.2.14 Item Lookup Form Both Admin User (Administrator) and General User can view different Items
information with specific searching in this form. Users can also print the selected
information in here. Users could distinguish easily which Items are Issued or Vacant
from the Issue Status column.
Figure 36: Item Lookup Form.
5.2.15 Inventory Reports Form
Both Admin User (Administrator) and General User can view or print current Stock
information, Stock summary & Fine information of the Members in this Report form.
Figure 37: Inventory Reports Form.
57

Chapter 6
Conclusion
6.1 Conclusion RFID technology is now being used in a lot of useful applications. In this project it
has been shown the use of RFID technology in inventory management. RFID reader
Educational Kit and tags have been used to develop the proposed prototype system. A
GUI has been developed to interface with the RFID reader and tags. The GUI is user
friendly and it has the facility to add, view or delete new inventory items. Different
types of reports can also be generated from the GUI. Experimental result proves the
proper functionality of the complete system. Research and development work can be
carried out to improve the developed prototype system to a commercial product.
6.2 Future Works In the current system Low Frequency RFID reader has been used. In the future
version a high frequency RFID reader can be used to read the tag easily in a flexible
manner.
58

References 1. McMonnies, A., Object Oriented Programming in Visual Basic .Net, Addison
Wesley, 2004.
2. Weintein, R., “RFID: A Technical Overview and its Application to the Enterprise”,
IEEE IT Professional, PP. 27-33, May 2005.
3. Finkenzeller, K., “RFID Handbook”, 2nd Edition, John Wiley & Sons, LTD., 2003.
4. http://www.hidglobal.com/documents/tagsVsSmartcards_wp_en.pdf; Last
Accessed on 5th May 2013.
5. http://en.wikipedia.org/wiki/Rfid#Regulation_and_standardization; Last Accessed
on 5th May 2013.
6. http://www.softwaretestingclass.com/what-is-difference-between-two-tier-and-
three-tier-architecture; Last Accessed on 5th May 2013.
7. DuBois, P., MySQL Developer's Library, 5th Edition, Addison-Wesley, 2013.
8. Anonym, “Reference Guide, Series 2000 Standard Reader System”, Texas
Instruments, Literature Number: SCBU027, May 2000, from
http://www.ti.com/tool/ri-k3a-001a; Last Accessed on 5th May 2013.
9. Silberschatz, A., Korth, H., F., Sudarshan, S., Database System Concepts, 6th
Edition, McGraw-Hill, 2010.
10. Gogolla, M., Kobryn, C., UML 2001 - The Unified Modeling Language.
Modeling Languages, Concepts, and Tools: 4th International Conference, Toronto,
Canada, October 1-5, 2001. P (2001 Edition), 2001.
59