Embed Size (px)
Citation preview
1
Development of a Reconciliation
Strategy for the Olifants River Water
Supply System
Final Reconciliation Strategy
Presentation of the report
23 March 2012
2
Report Contents 1. Introduction
2. Overview of the study area and the study procedure
3. The Reserve
4. Current water use and projected water requirements
5. Water resource availability
6. Water quality
7. The water balance
8. Possible intervention scenarios
9. Reconciling the water requirements with the water resource
10. The strategy in a nutshell
11. Risks and uncertainties
12. Implementation arrangements
13. Recommendations for further work
14. References
3
1 Introduction
• Purpose of study
• Objectives of the ORS
• Relation between the Preliminary and Final
Reconciliation Strategies
• Report Structure
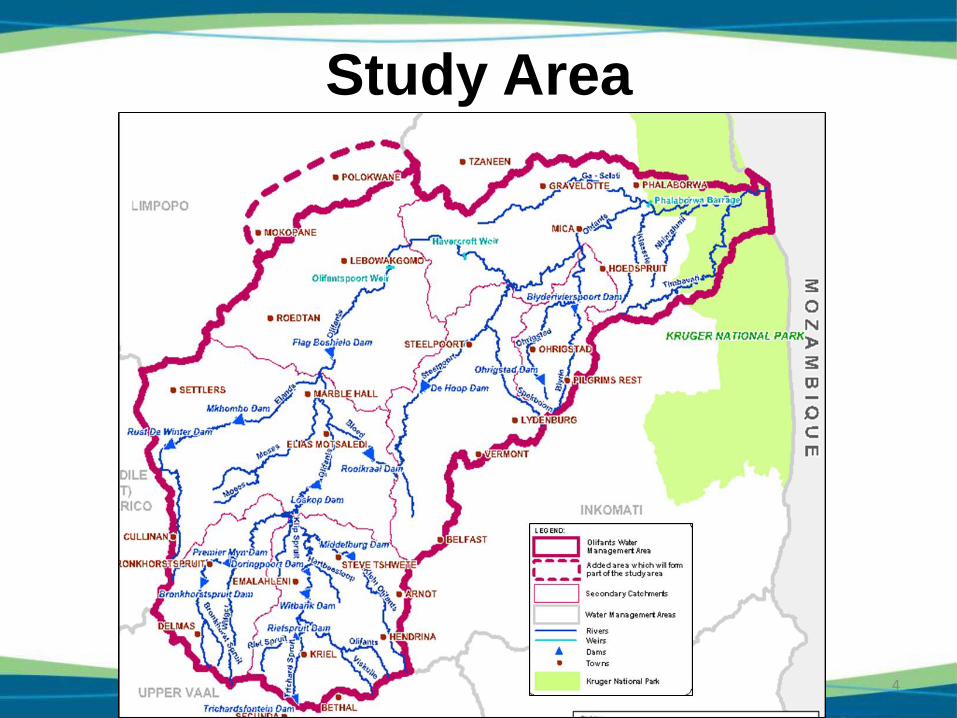
Study Area
4
5
Study Objectives
1. To address growing water demands
2. To address serious water quality problems
3. To identify resource development options
4. To provide reconciliation interventions
a) Structural
b) Administrative / regulatory
5. To facilitate communication and strengthen the
partnership between DWA and key stakeholders
6
Study Objectives
1. To address growing water demands
2. To address serious water quality problems
3. To identify resource development options
4. To provide reconciliation interventions
a) Structural
b) Administrative / regulatory
5. To facilitate communication and strengthen the
partnership between DWA and key stakeholders
Objectives of the Olifants Reconciliation
Strategy
• To meet legitimate current and future water
requirements
• To recommend the most suitable interventions to
balance the water requirements and water resources
• To identify responsible institutions and provide target
dates for implementation of the strategy.
7
8
Relation between the Preliminary and
Final Reconciliation Strategies • Preliminary Strategy completed in Nov 2010 – Based on best
information at that point in time
• Information gaps studied after Preliminary Strategy and
covered in the Final Reconciliation Strategy:
- Impact on the yield of the system as a result of the Reserve,
- Groundwater availability,
- Additional yield as a result of decant water from the coal mines,
- Urban and rural water requirements,
- Mining water requirements,
- Extent of unlawful water use,
- A more accurate estimate for WC/WDM savings in the irrigation
sector,
- A further reconciliation option, i.e. to transfer water into the Olifants
Catchment from the Crocodile (West) System
9
Report Structure
• Situation in the basin is described, i.e. Reserve, current water
use, projected water requirements, available water resources
and water quality. A water balance is then provided.
• The water shortages emerging from this water balance are
then addressed by identifying intervention measures and
reviewing these.
• The strategy for reconciling the future water requirements with
the available water and the optimum scenario of intervention
options are then described.
• The report concludes with lists of risks and uncertainties,
implementation arrangements and recommendations.
10
2 Overview of the study area and study
procedure
• System description
• Study procedure
System Description
• The study area: Olifants River Catchment and its adjacent supply
zones, Polokwane and Mogalakwena
• Several large dams located in the upper and middle reaches.
• The earlier dams were constructed to supply large irrigation
schemes, while later dams were constructed to meet growing
domestic, industrial and mining water requirements.
• A large number of water users who obtain their water from farm
dams, and run-of-river abstraction
• Also a significant supply to irrigators and mines from groundwater.
• Water use for power generation in upper part transferred from
neighbouring catchments
• Lower part of Olifants river flows through Kruger National Park
(KNP) into Mozambique
11
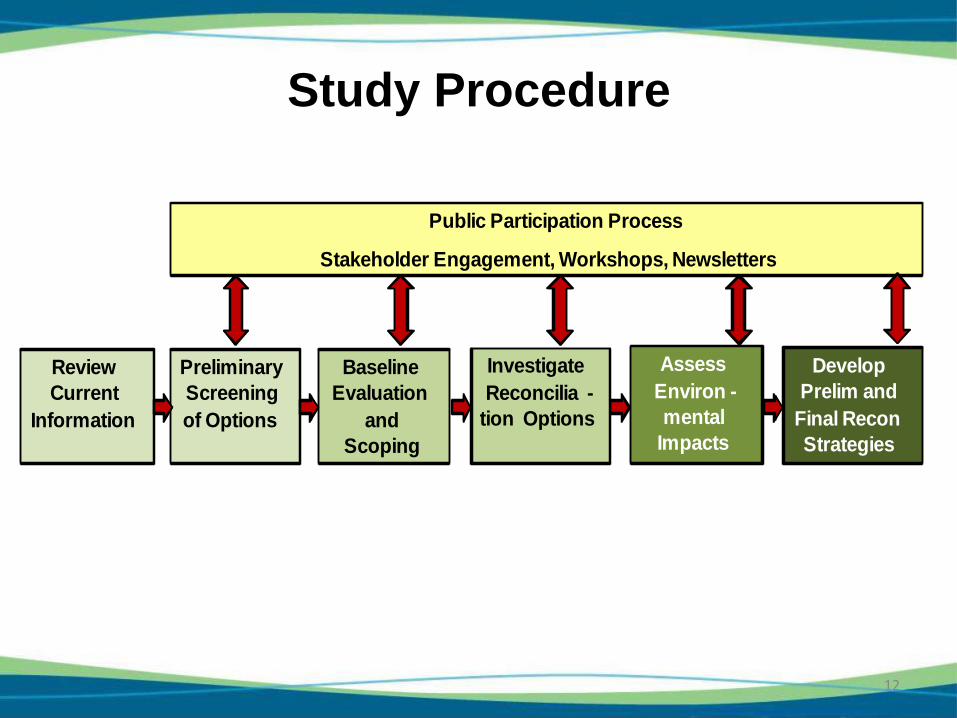
Study Procedure
12
Public Participation Process
Stakeholder Engagement, Workshops, Newsletters
Review
Current
Information
Preliminary
Screening
of Options
Baseline
Evaluation
and
Scoping
Assess
Environ -
mental
Impacts
Develop
Prelim and
Final Recon
Strategies
Investigate
Reconcilia -
tion Options
13
3 The Reserve
• Basic Human Needs component
• Ecological component
- Previous EWR study done for the system
- Ecological changes since previous
determinations
- Flood component of the Ecological Reserve
• Recommended Reserve Scenario
14
The Preliminary Ecological Reserve
• Comprehensive Reserve Study was undertaken – 1999
• Eco-classification was repeated in 2010 with main
objective to check how the EWRs would be affected by
the new classification procedure
• EWR determinations were not redone – EWR rule tables
are still the same as in the 1999 study
• Rule tables that were developed for the ecological
Reserve in 1999 study make provision for the release of
small floods (freshets) from dams
• Floods were removed from rule tables
• Separate resource classification study is currently being
undertaken by the Department. The Ecological Reserve
values used in the Olifants Reconciliation Study are
therefore seen as preliminary.
15
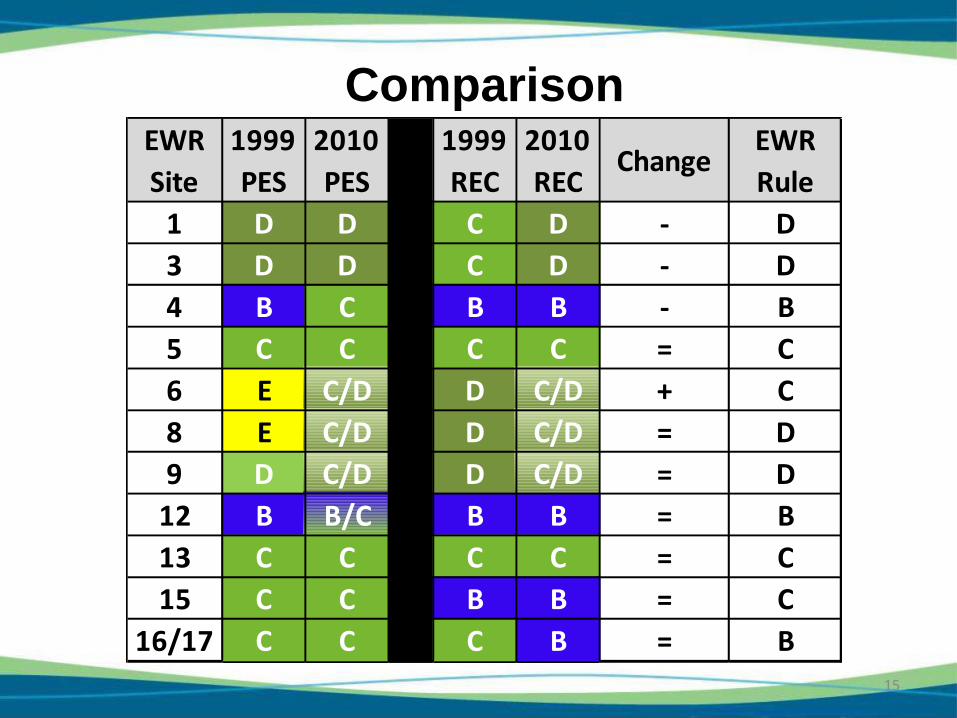
EWR
Site
1999
PES
2010
PES
1999
REC
2010
RECChange
EWR
Rule
1 D D C D - D
3 D D C D - D
4 B C B B - B
5 C C C C = C
6 E C/D D C/D + C
8 E C/D D C/D = D
9 D C/D D C/D = D
12 B B/C B B = B
13 C C C C = C
15 C C B B = C
16/17 C C C B = B
Comparison
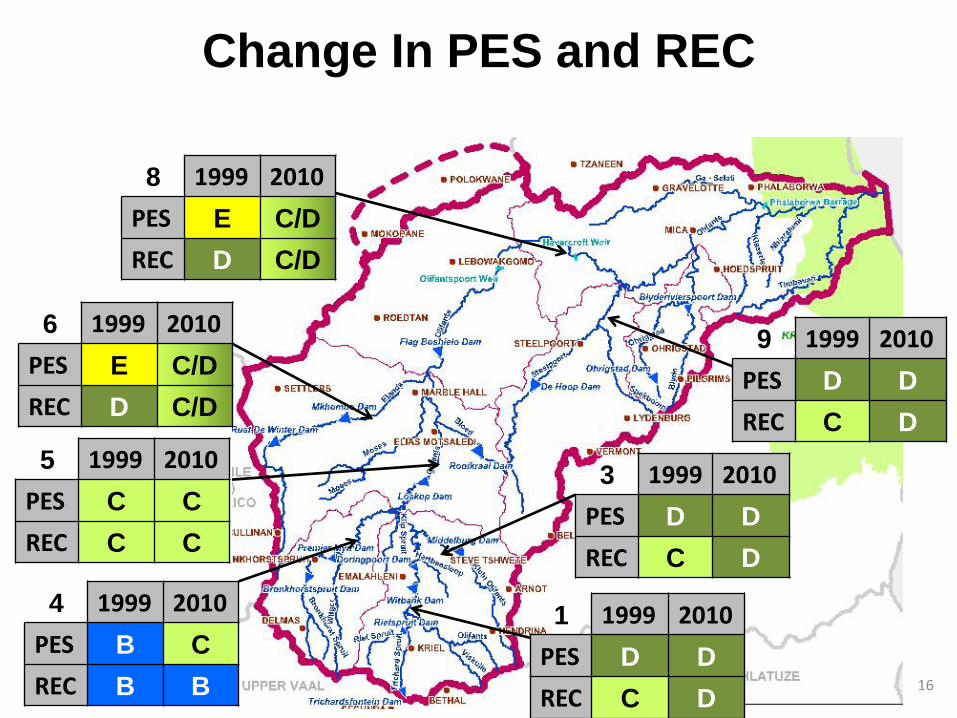
16
1 1999 2010
PES D D
REC C D
3 1999 2010
PES D D
REC C D
4 1999 2010
PES B C
REC B B
5 1999 2010
PES C C
REC C C
6 1999 2010
PES E C/D
REC D C/D
9 1999 2010
PES D D
REC C D
8 1999 2010
PES E C/D
REC D C/D
Change In PES and REC
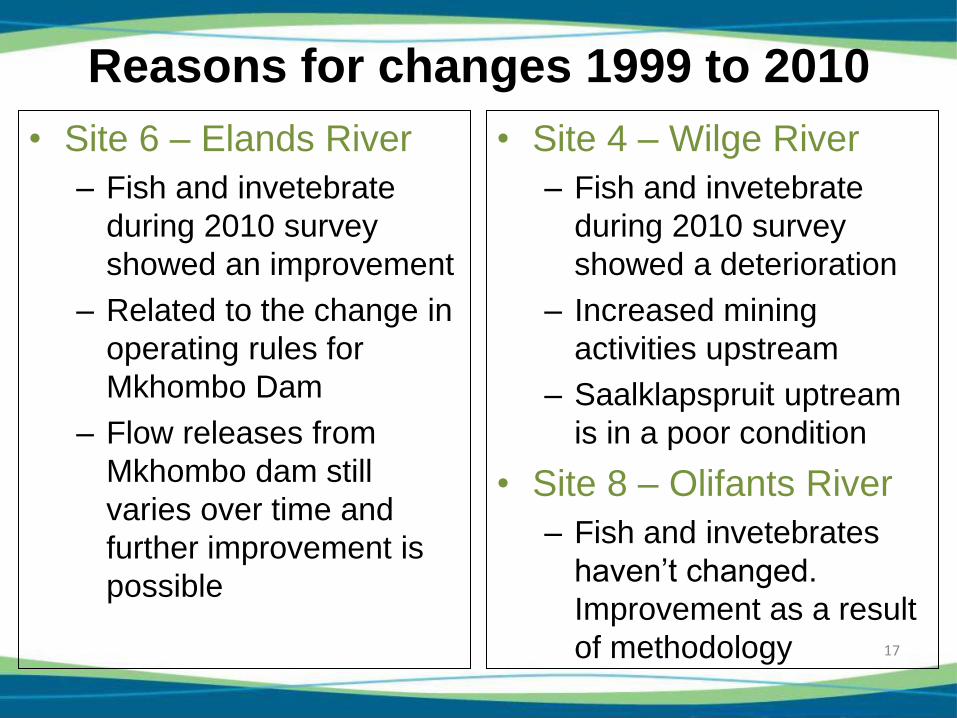
Reasons for changes 1999 to 2010
• Site 6 – Elands River
– Fish and invetebrate
during 2010 survey
showed an improvement
– Related to the change in
operating rules for
Mkhombo Dam
– Flow releases from
Mkhombo dam still
varies over time and
further improvement is
possible
• Site 4 – Wilge River
– Fish and invetebrate
during 2010 survey
showed a deterioration
– Increased mining
activities upstream
– Saalklapspruit uptream
is in a poor condition
• Site 8 – Olifants River
– Fish and invetebrates
haven’t changed.
Improvement as a result
of methodology
17
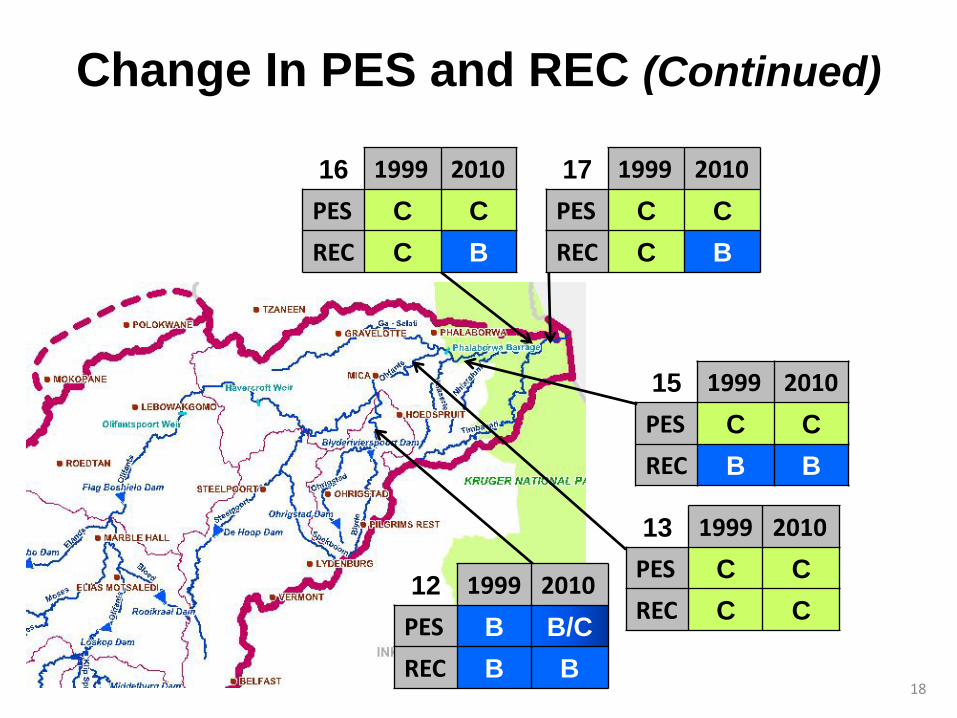
18
15 1999 2010
PES C C
REC B B
13 1999 2010
PES C C
REC C C 12 1999 2010
PES B B/C
REC B B
16 1999 2010
PES C C
REC C B
17 1999 2010
PES C C
REC C B
Change In PES and REC (Continued)
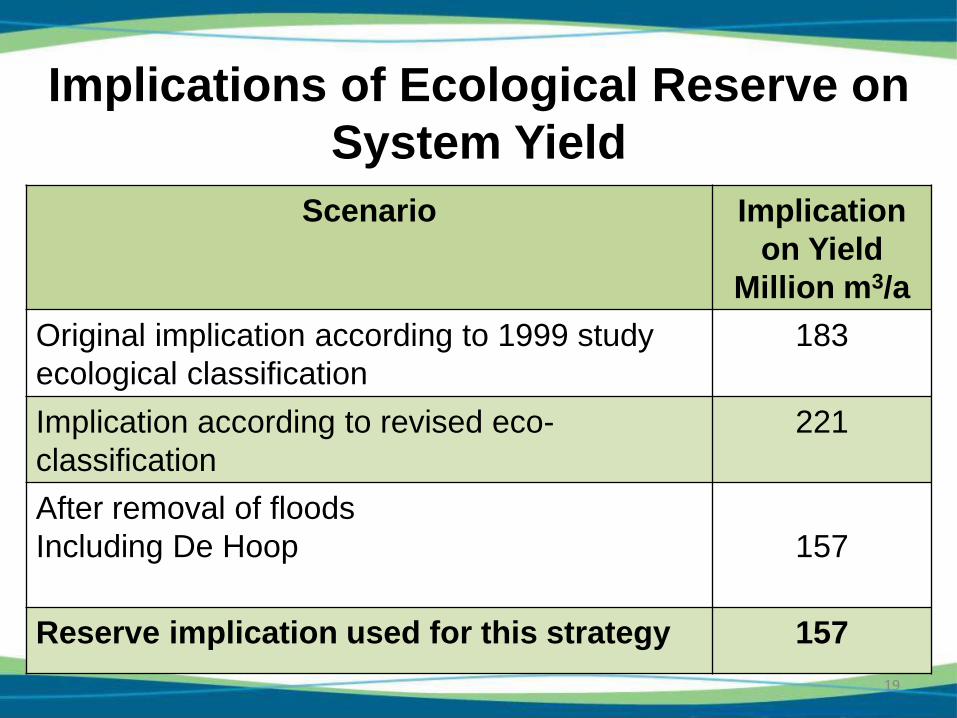
19
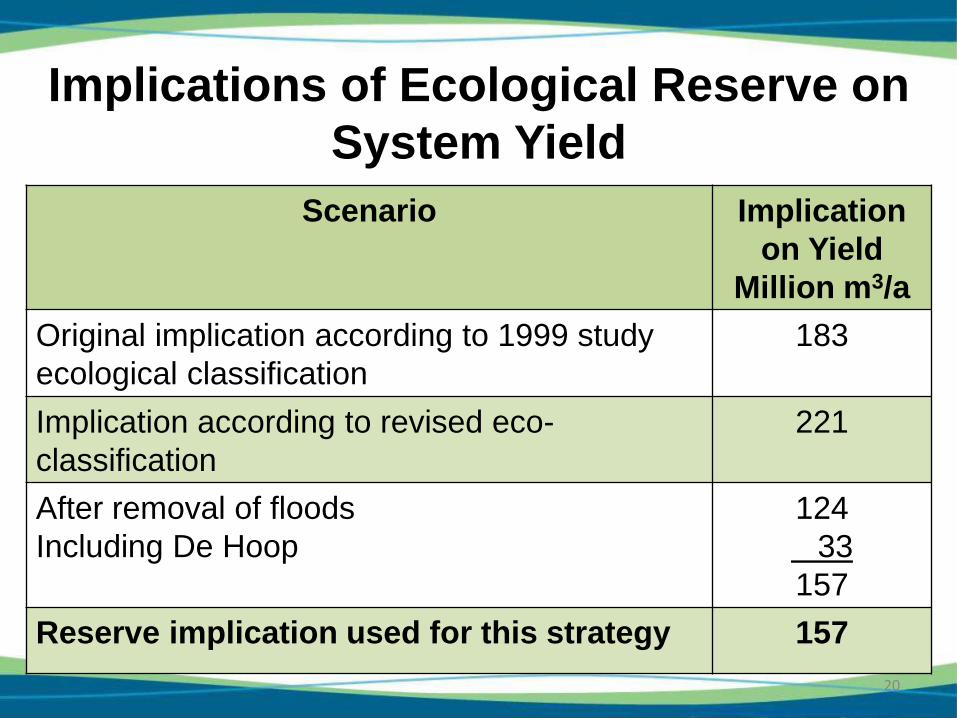
Implications of Ecological Reserve on
System Yield
Scenario Implication
on Yield
Million m3/a
Original implication according to 1999 study
ecological classification
183
Implication according to revised eco-
classification
221
After removal of floods
Including De Hoop
157
Reserve implication used for this strategy 157
20
Implications of Ecological Reserve on
System Yield
Scenario Implication
on Yield
Million m3/a
Original implication according to 1999 study
ecological classification
183
Implication according to revised eco-
classification
221
After removal of floods
Including De Hoop
124
33
157
Reserve implication used for this strategy 157
21
4 Current Water Use And Projected
Water Requirements
• Current water use
- Irrigation
- Urban and Rural
- Industrial
- Mining
- Power Generation
- Streamflow reduction
- Invasive Alien Plants
• Projected future water requirements
- (Sectors as above)
• Total High and Low scenario water requirements
22
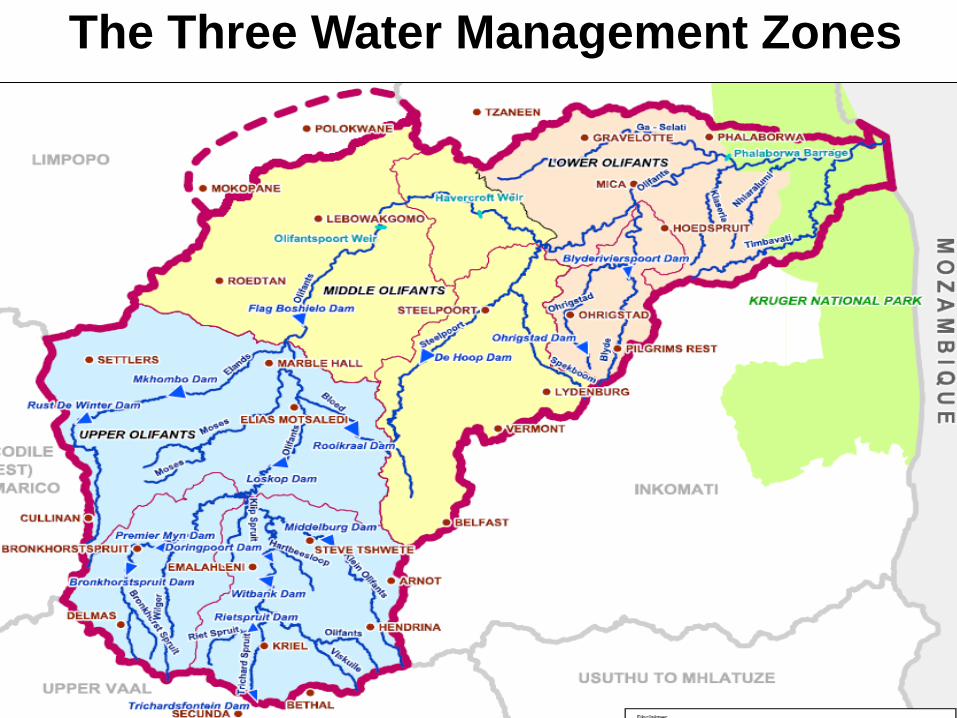
The Three Water Management Zones
23
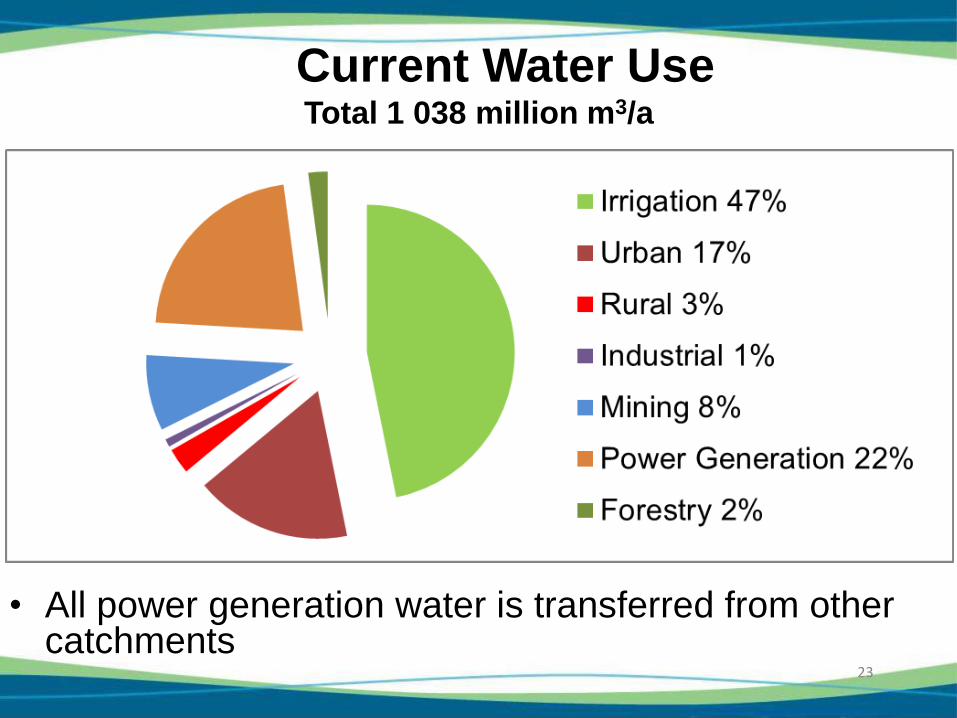
Current Water Use Total 1 038 million m3/a
• All power generation water is transferred from other catchments
24
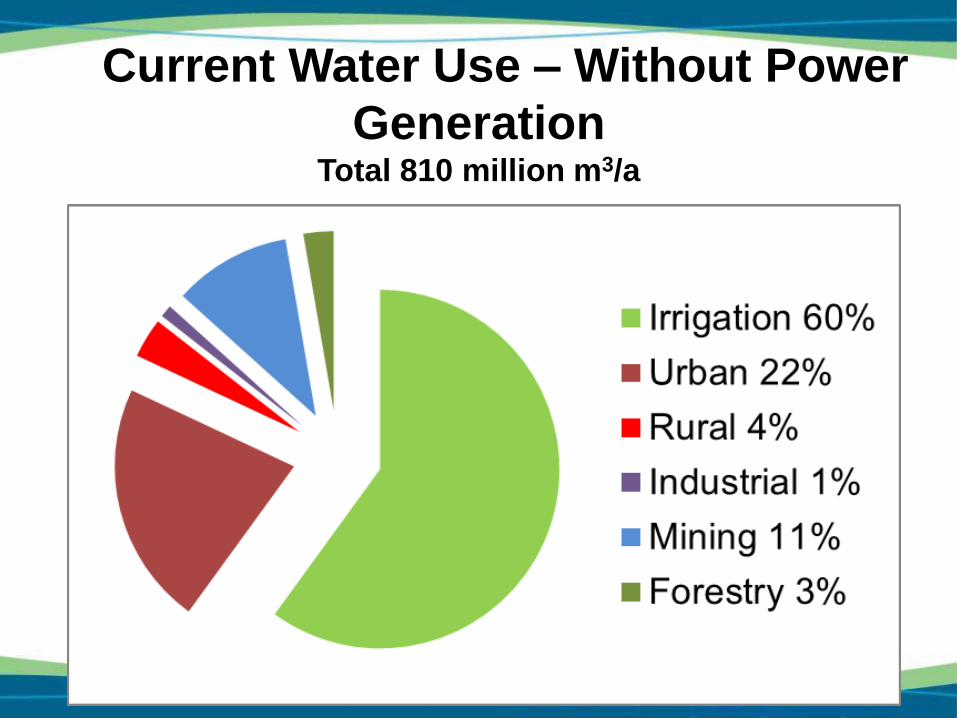
Current Water Use – Without Power
Generation Total 810 million m3/a
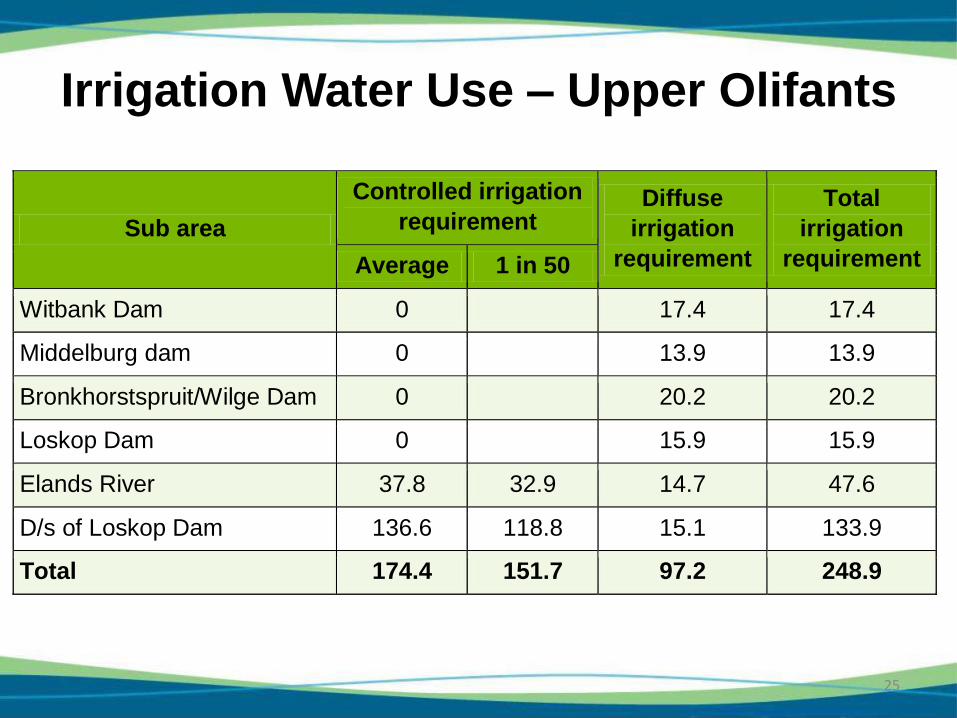
Irrigation Water Use – Upper Olifants
25
Sub area
Controlled irrigation
requirement Diffuse
irrigation
requirement
Total
irrigation
requirement Average 1 in 50
Witbank Dam 0 17.4 17.4
Middelburg dam 0 13.9 13.9
Bronkhorstspruit/Wilge Dam 0 20.2 20.2
Loskop Dam 0 15.9 15.9
Elands River 37.8 32.9 14.7 47.6
D/s of Loskop Dam 136.6 118.8 15.1 133.9
Total 174.4 151.7 97.2 248.9
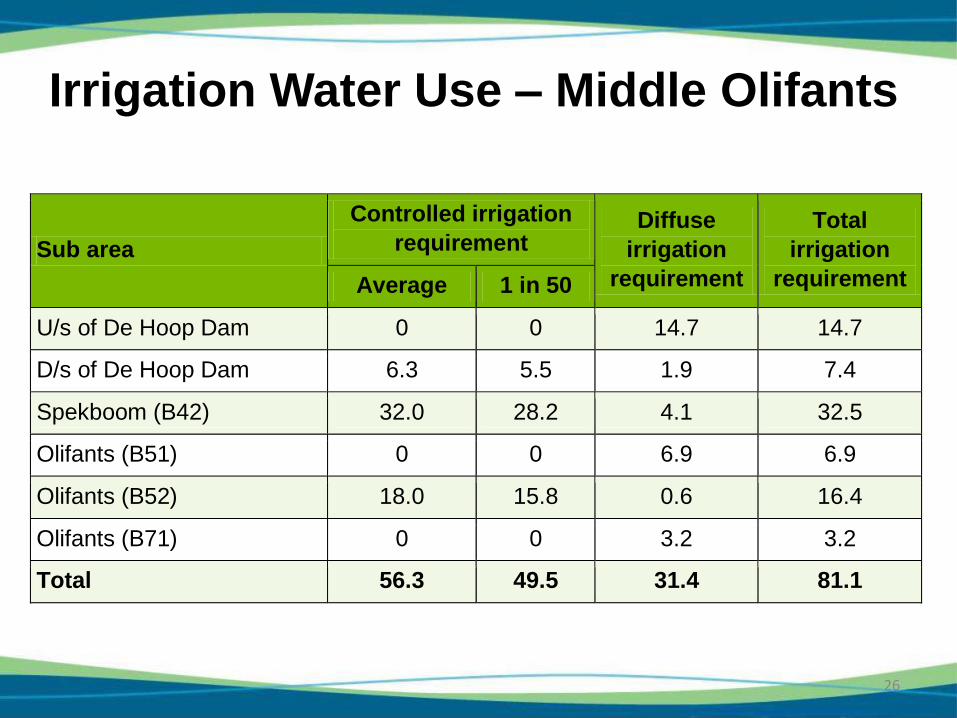
Irrigation Water Use – Middle Olifants
26
Sub area
Controlled irrigation
requirement Diffuse
irrigation
requirement
Total
irrigation
requirement Average 1 in 50
U/s of De Hoop Dam 0 0 14.7 14.7
D/s of De Hoop Dam 6.3 5.5 1.9 7.4
Spekboom (B42) 32.0 28.2 4.1 32.5
Olifants (B51) 0 0 6.9 6.9
Olifants (B52) 18.0 15.8 0.6 16.4
Olifants (B71) 0 0 3.2 3.2
Total 56.3 49.5 31.4 81.1
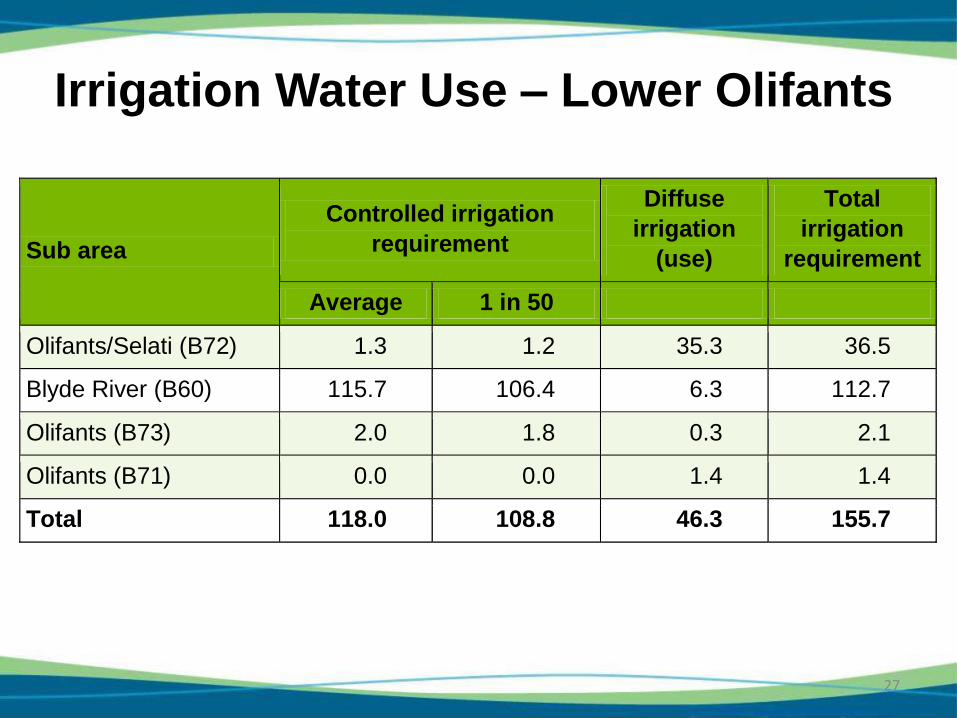
Irrigation Water Use – Lower Olifants
27
Sub area
Controlled irrigation
requirement
Diffuse
irrigation
(use)
Total
irrigation
requirement
Average 1 in 50
Olifants/Selati (B72) 1.3 1.2 35.3 36.5
Blyde River (B60) 115.7 106.4 6.3 112.7
Olifants (B73) 2.0 1.8 0.3 2.1
Olifants (B71) 0.0 0.0 1.4 1.4
Total 118.0 108.8 46.3 155.7
Irrigation Water Use – Entire
Catchment
28
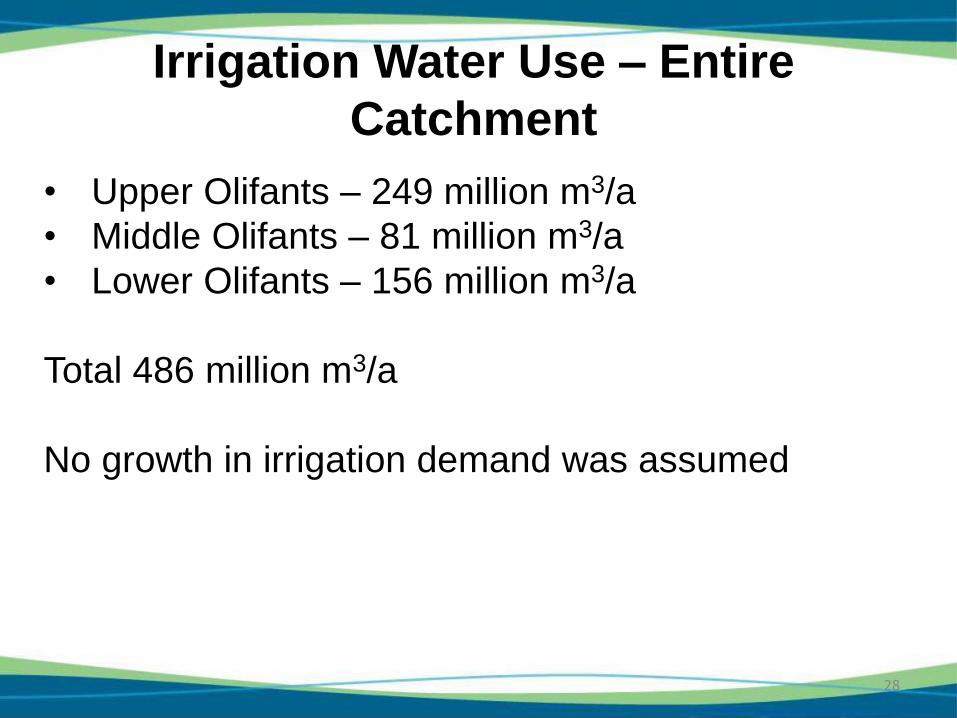
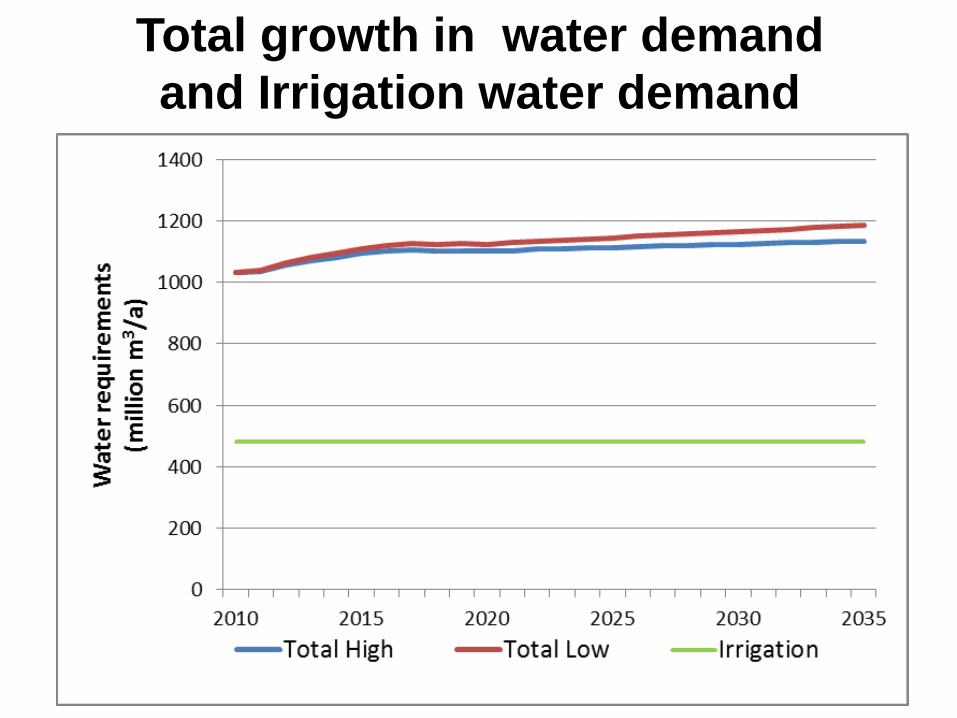
• Upper Olifants – 249 million m3/a
• Middle Olifants – 81 million m3/a
• Lower Olifants – 156 million m3/a
Total 486 million m3/a
No growth in irrigation demand was assumed
29
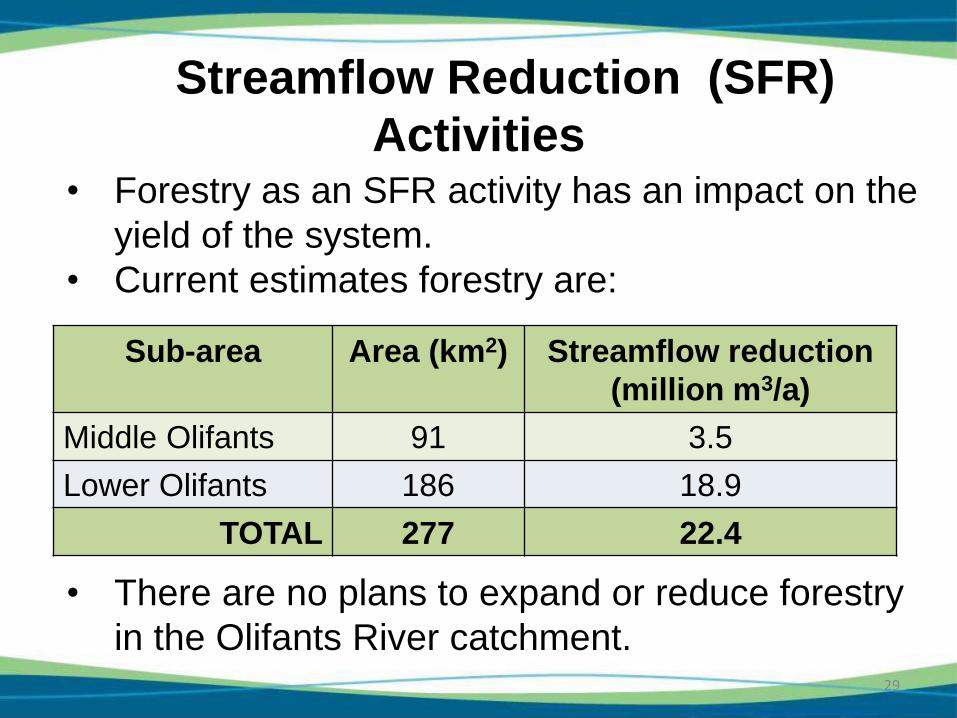
• Forestry as an SFR activity has an impact on the
yield of the system.
• Current estimates forestry are:
• There are no plans to expand or reduce forestry
in the Olifants River catchment.
Streamflow Reduction (SFR)
Activities
Sub-area Area (km2) Streamflow reduction
(million m3/a)
Middle Olifants 91 3.5
Lower Olifants 186 18.9
TOTAL 277 22.4
30
• Invasive Alien Plants (IAP) also reduces runoff
and hence the yield available from the system.
• The impact of IAPs was considered in detail as
part of this study, with new information from the
Agricultural Research Council forming the basis of
the areal extent of IAPs.
• The impact of these IAPs has been taken into
account in determining the yields of dams.
Invasive Alien Plants
31
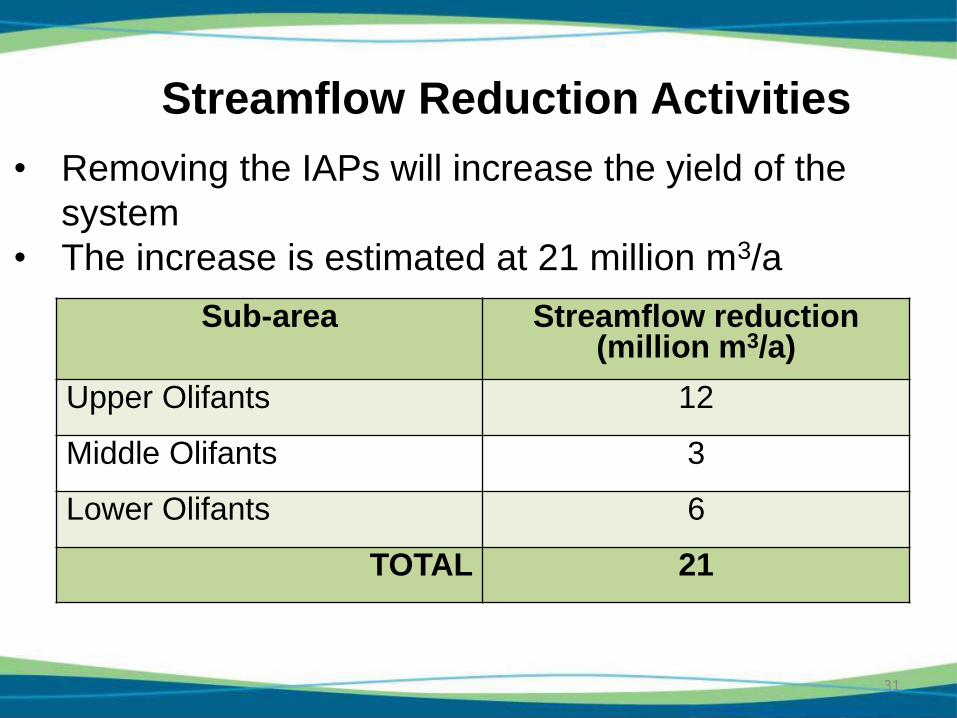
• Removing the IAPs will increase the yield of the
system
• The increase is estimated at 21 million m3/a
Streamflow Reduction Activities
Sub-area Streamflow reduction (million m3/a)
Upper Olifants 12
Middle Olifants 3
Lower Olifants 6
TOTAL 21
Future water use / growth projections
• The preliminary strategy was based on the growth
projections from:
– The Integrated Water Resources Management Plan
(2008)
– The Olifants Water Resources Development Project
(2005)
• The demographic information from the All Towns became
available during the course of the study and was the
primary source of information for this Final Strategy.
• Low growth scenarios were derived from STATS SA
• High growth scenarios were based on:
– Low growth in HIV/AIDS
– High Immigration
32
Further work done on future water
requirements
33
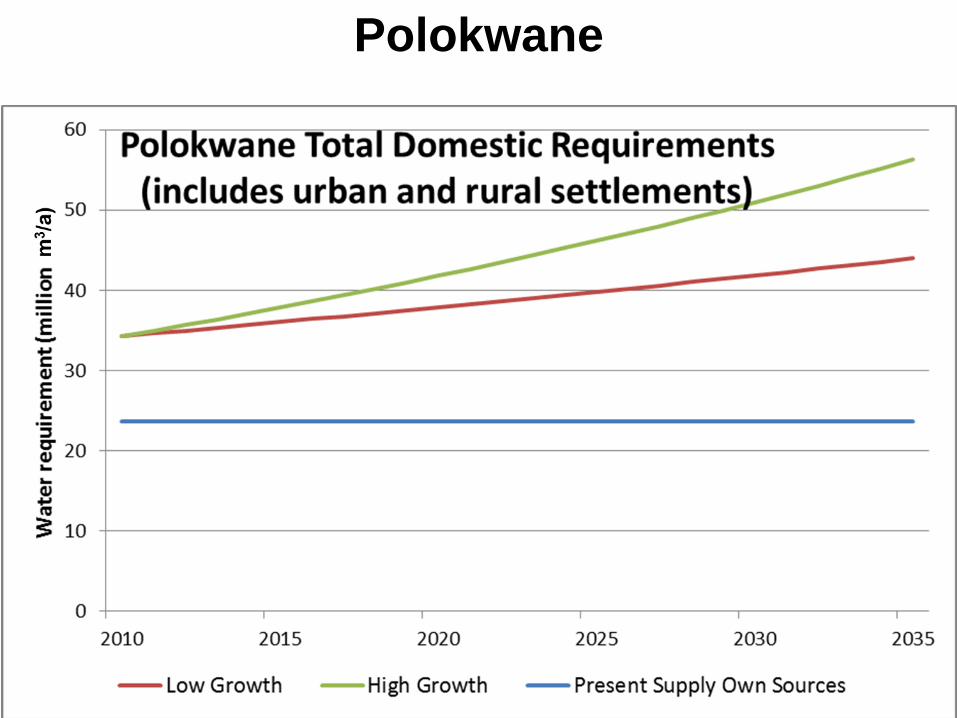
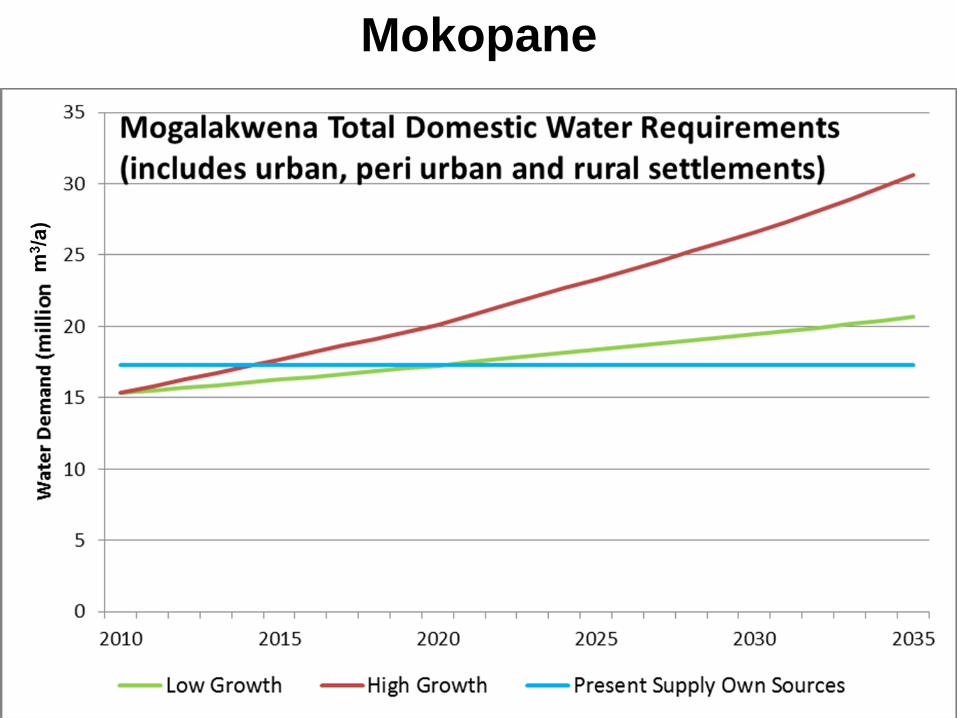
• Water use estimates from the All Towns studies were
checked with recent actual abstraction data and the Water
Services database - compared well, except for Polokwane
and Mokopane
• Recent reports on Polokwane and Mokopane instead of
All Towns were used as the main source of information on
the current and future water requirements of these towns.
• The Water Services database was also used to estimate
rural water use – compared well to All Towns Study data.
Further work done on future water
requirements (Continued)
34
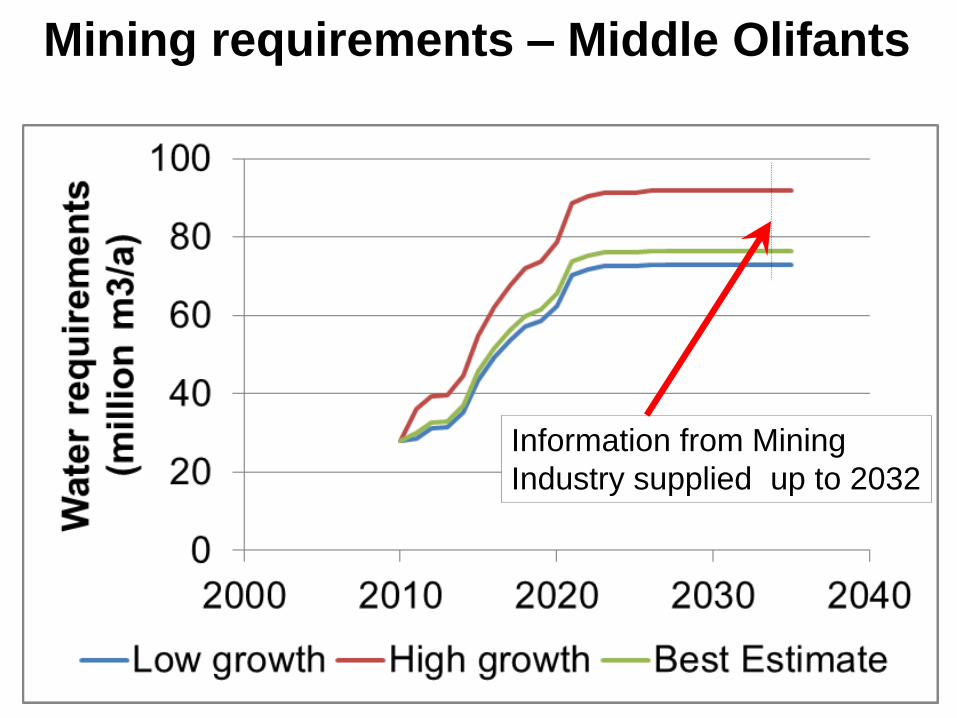
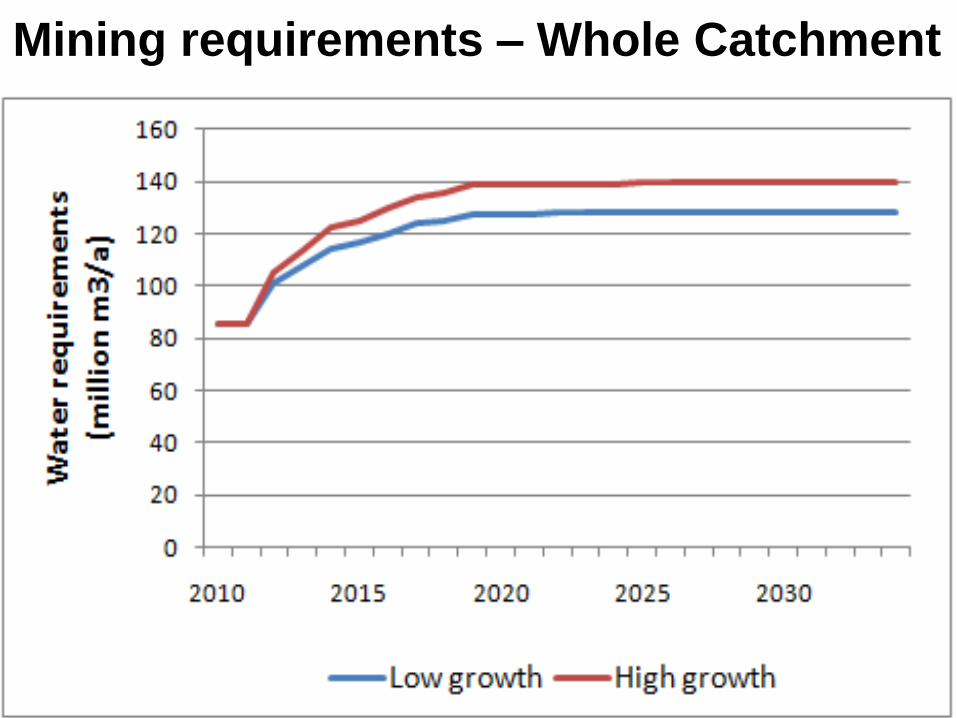
• The mining sectors have provided updated growth
projections (up to 2032)
– These projections are lower than assumed during the
ORWRDP
– Current mining water use was checked through
telephonic enquiries and the WARMS database
35
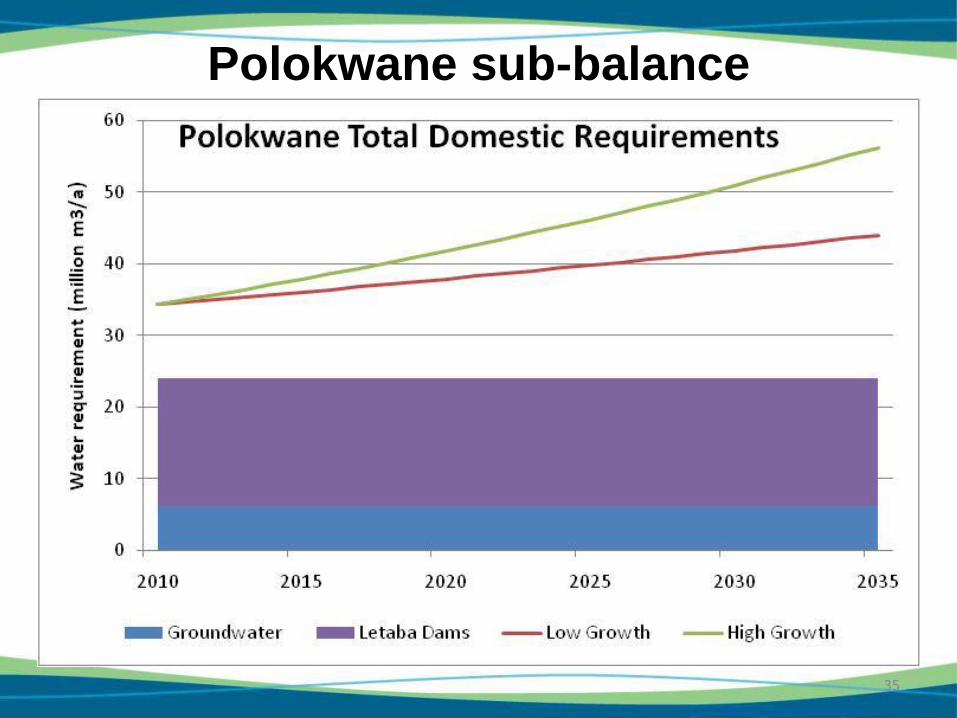
Polokwane sub-balance
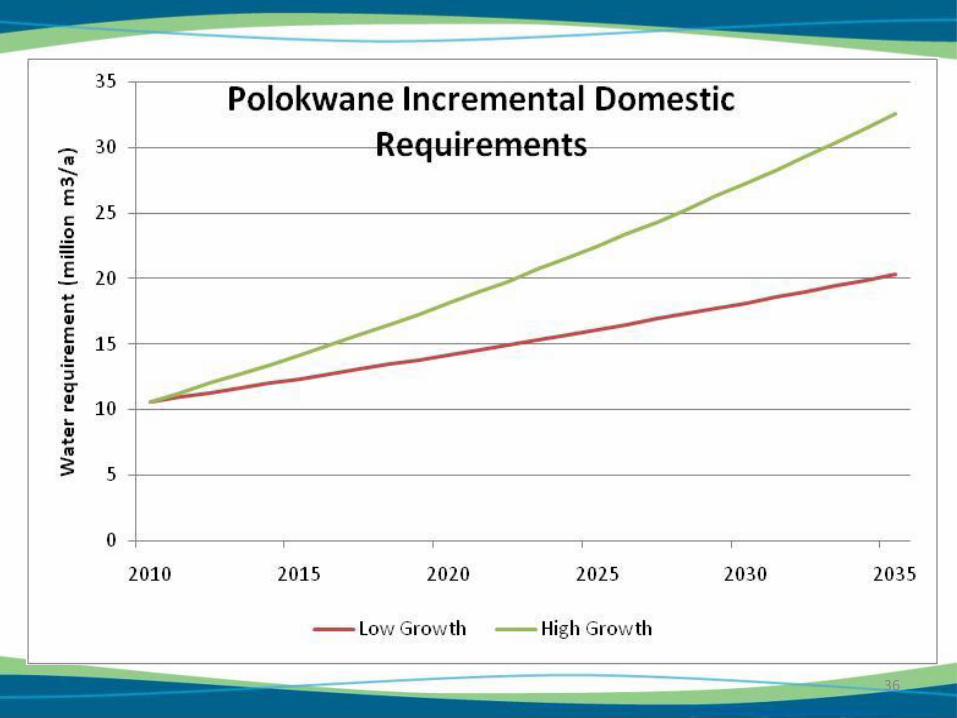
36
37
Polokwane
38
Mokopane
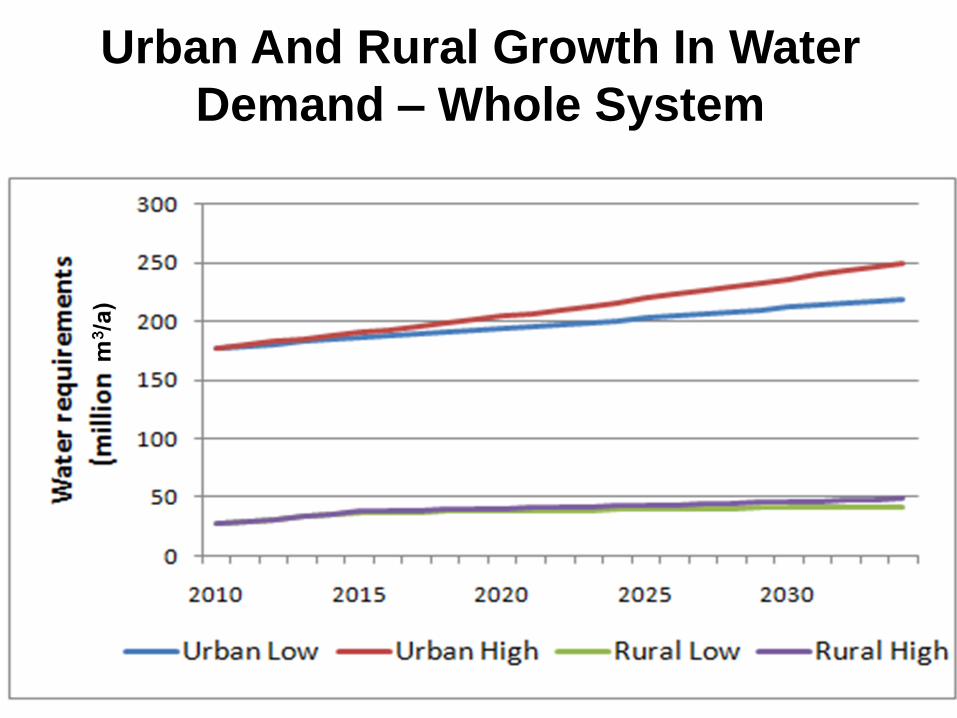
39
Urban And Rural Growth In Water
Demand – Whole System
40
Mining requirements – Middle Olifants
Information from Mining
Industry supplied up to 2032
41
Mining requirements – Whole Catchment
42
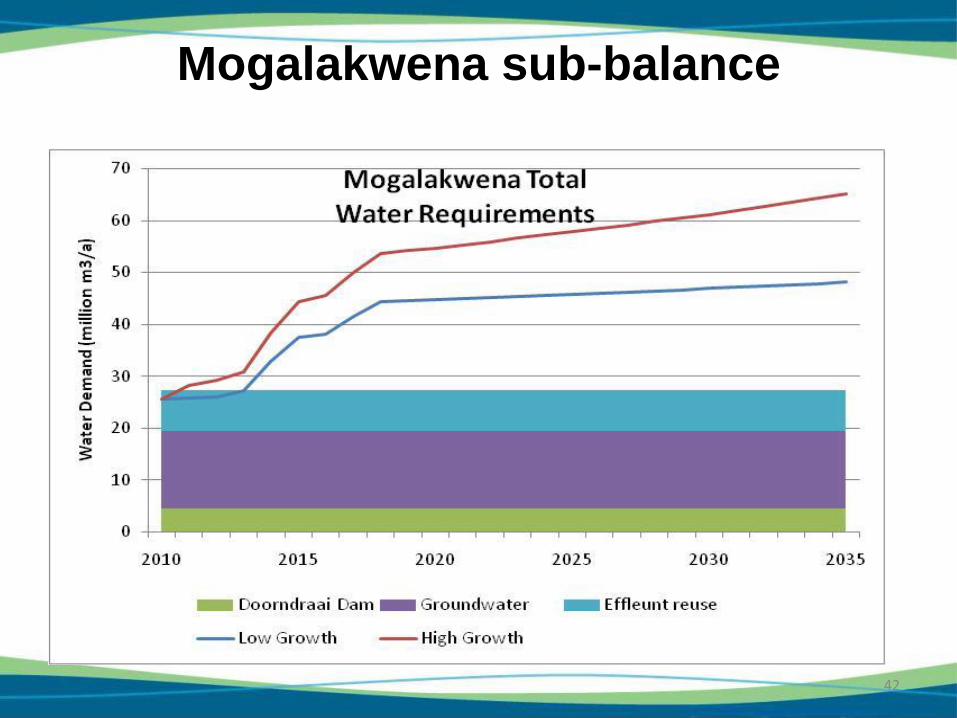
Mogalakwena sub-balance
43
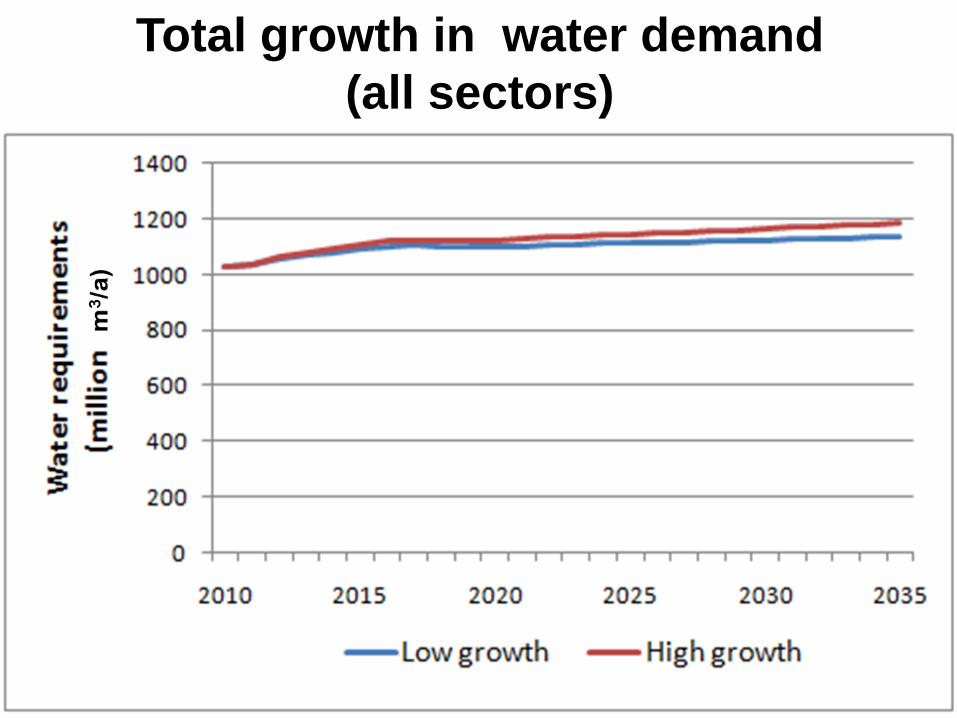
Total growth in water demand
(all sectors)
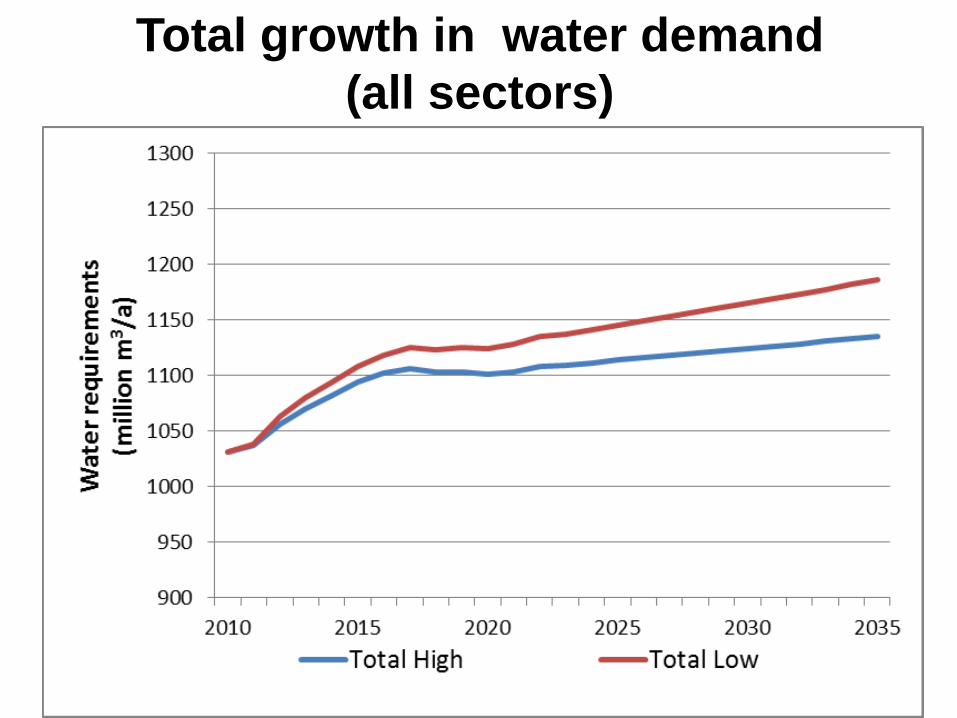
44
Total growth in water demand
(all sectors)
45
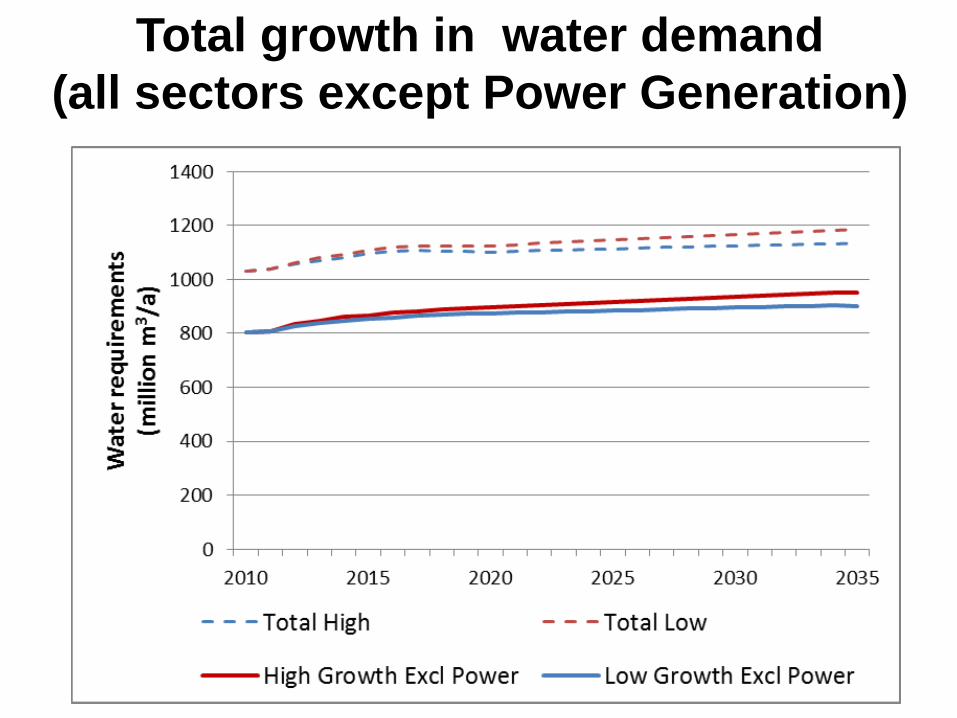
Total growth in water demand
(all sectors except Power Generation)
46
Total growth in water demand
and Irrigation water demand
47
5 Water Resource Availability
• Groundwater
- Geology and Geohydrology of the catchment
- Groundwater use and potential
- Further groundwater development options
- Management of groundwater
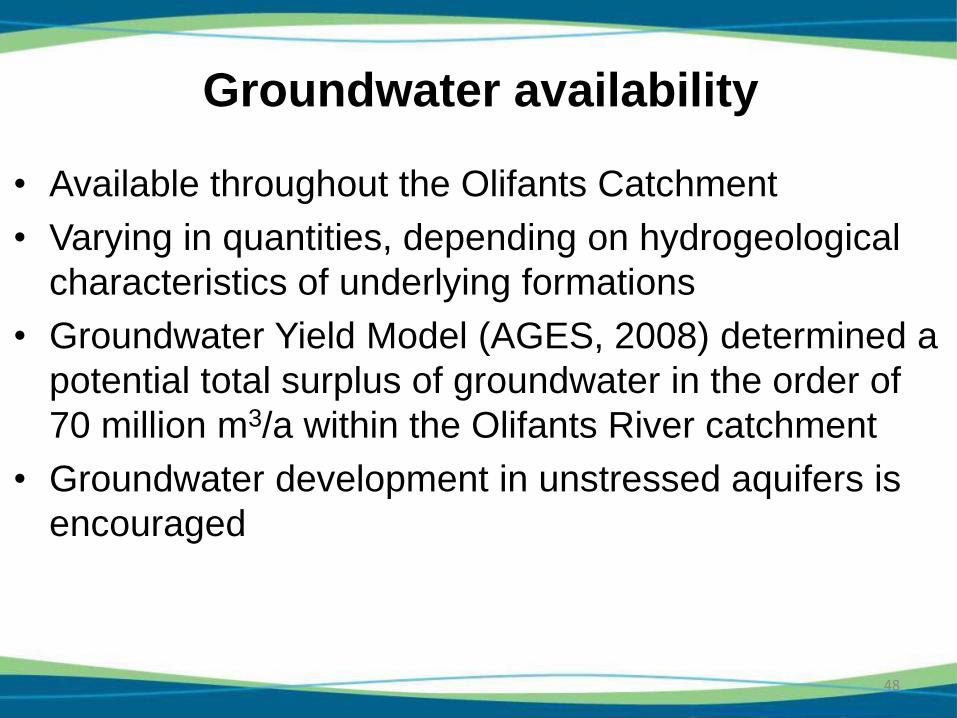
Groundwater availability
• Available throughout the Olifants Catchment
• Varying in quantities, depending on hydrogeological
characteristics of underlying formations
• Groundwater Yield Model (AGES, 2008) determined a
potential total surplus of groundwater in the order of
70 million m3/a within the Olifants River catchment
• Groundwater development in unstressed aquifers is
encouraged
48
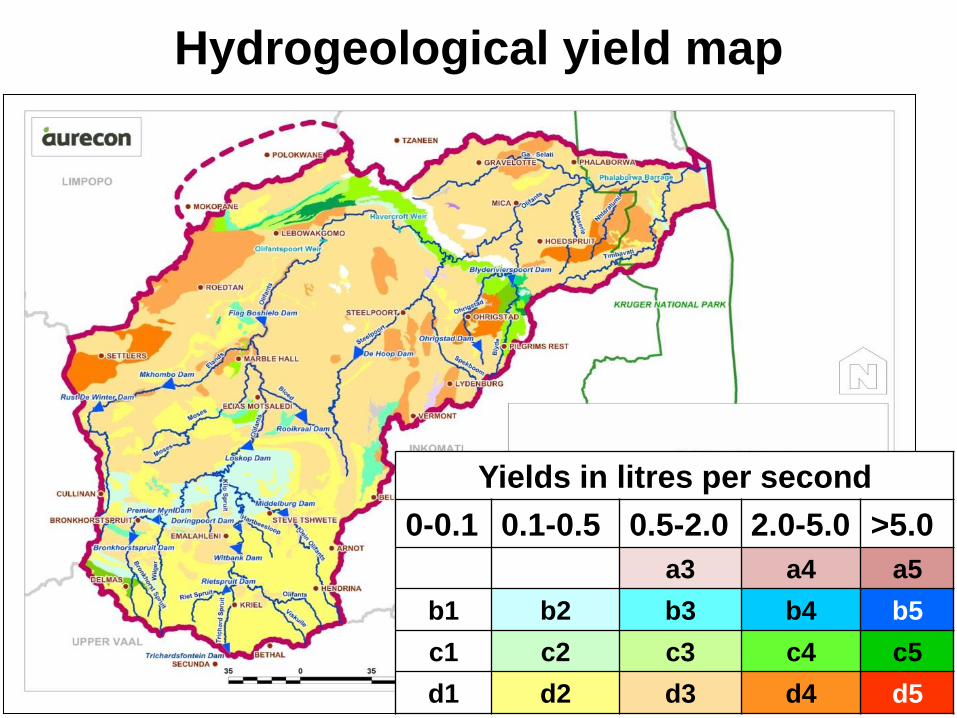
Hydrogeological yield map
49
Yields in litres per second
0-0.1 0.1-0.5 0.5-2.0 2.0-5.0 >5.0
a3 a4 a5
b1 b2 b3 b4 b5
c1 c2 c3 c4 c5
d1 d2 d3 d4 d5
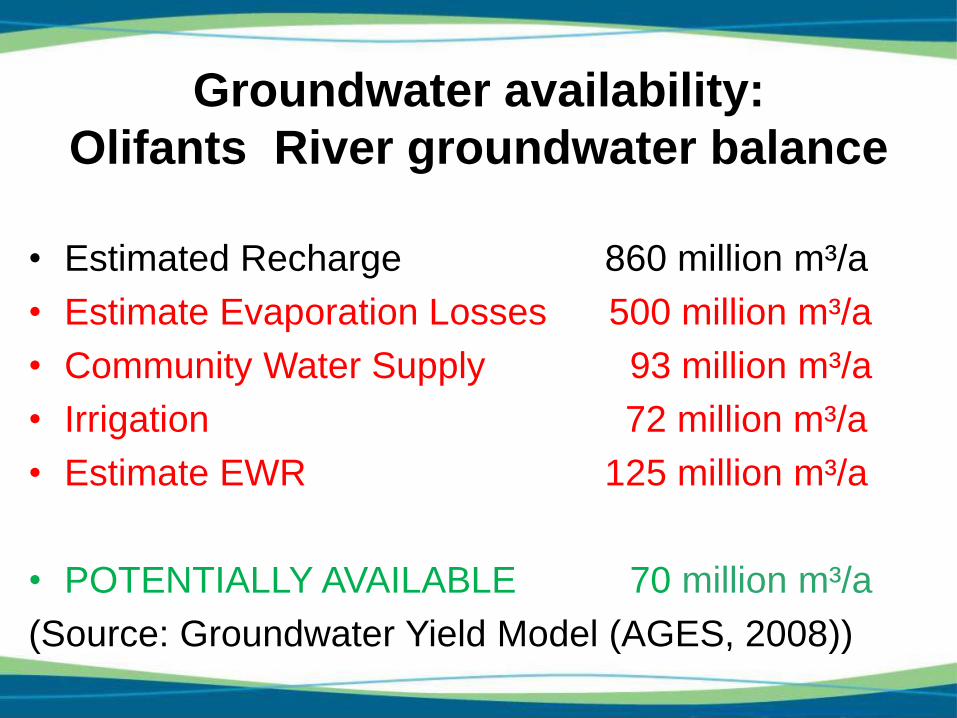
Groundwater availability:
Olifants River groundwater balance
• Estimated Recharge 860 million m³/a
• Estimate Evaporation Losses 500 million m³/a
• Community Water Supply 93 million m³/a
• Irrigation 72 million m³/a
• Estimate EWR 125 million m³/a
• POTENTIALLY AVAILABLE 70 million m³/a
(Source: Groundwater Yield Model (AGES, 2008))
50
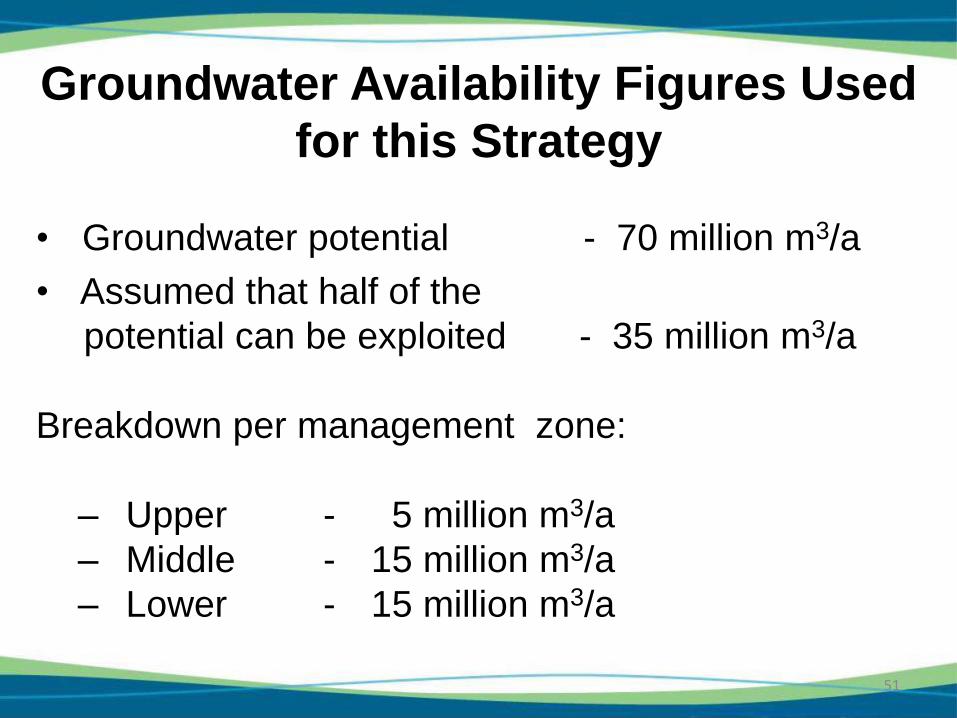
Groundwater Availability Figures Used
for this Strategy
• Groundwater potential - 70 million m3/a
• Assumed that half of the
potential can be exploited - 35 million m3/a
Breakdown per management zone:
– Upper - 5 million m3/a
– Middle - 15 million m3/a
– Lower - 15 million m3/a
51
52
5 Water Resource Availability (Cont’d)
• Surface water
- Yield of large dams
- Diffuse water resources
- Transfers in
- Other sources
- Additional yield from decommissioned coal
mines in the Upper Olifants zone
- Summary of current and future water resources
53
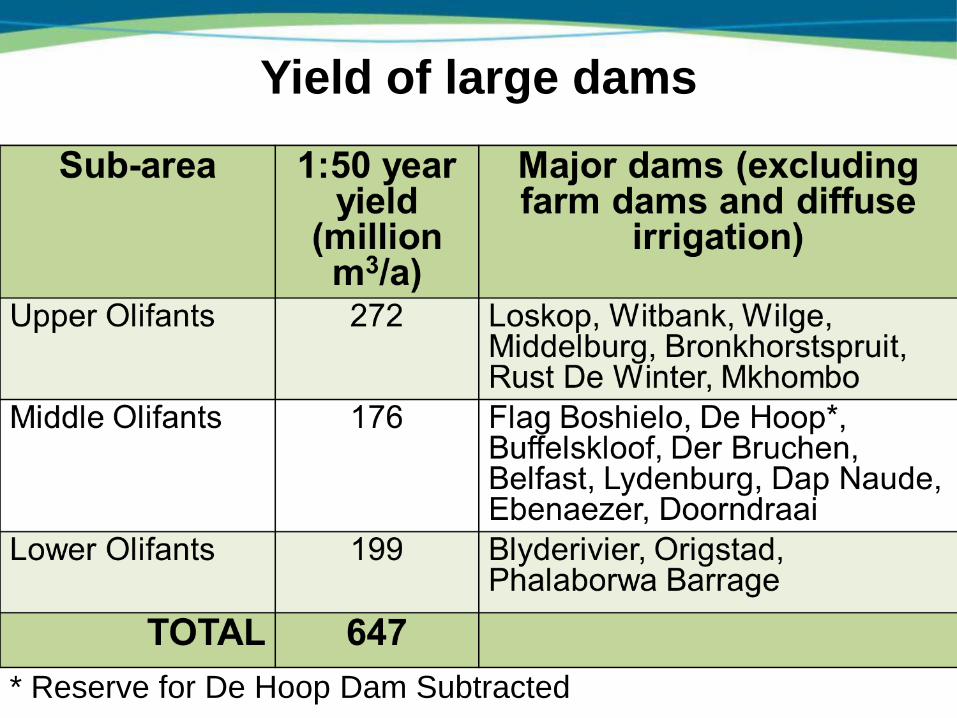
Yield of large dams
* Reserve for De Hoop Dam Subtracted
54
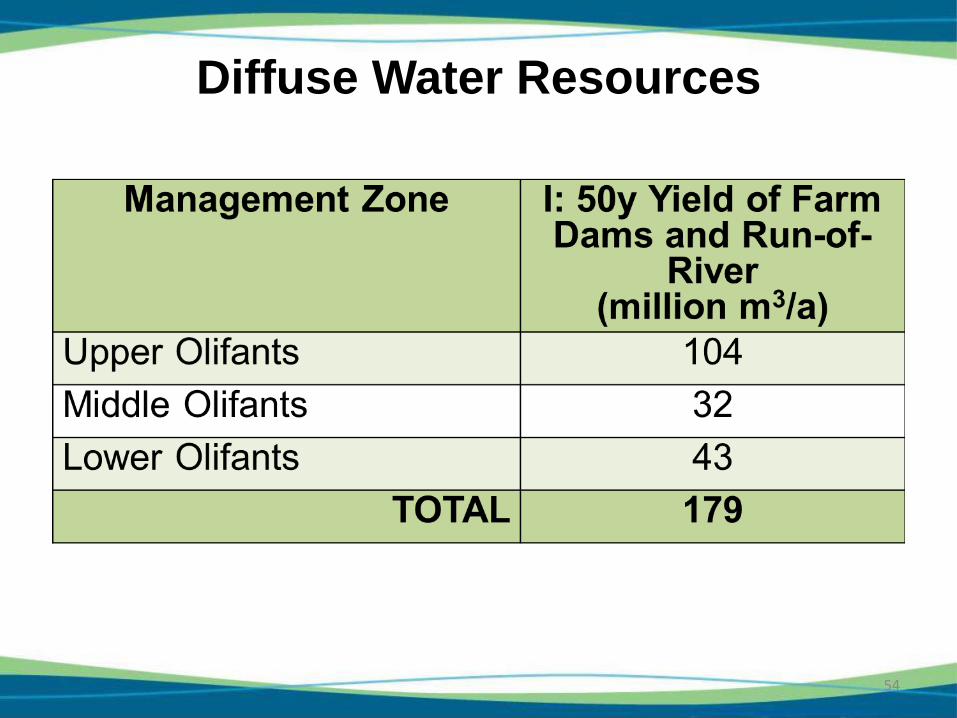
Diffuse Water Resources
55
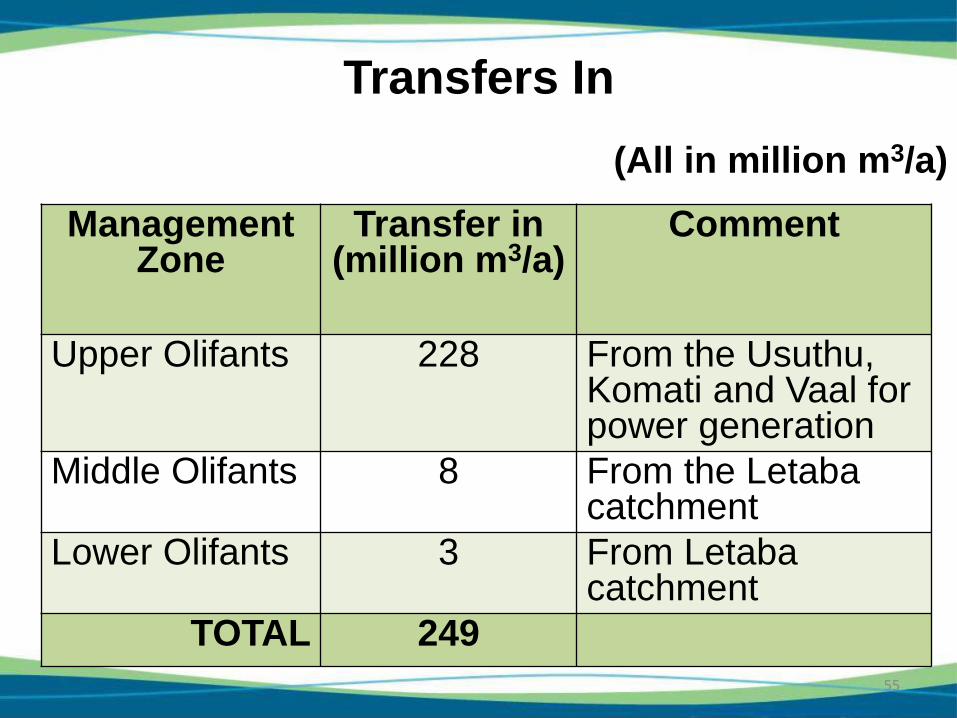
Transfers In
(All in million m3/a)
Management Zone
Transfer in (million m3/a)
Comment
Upper Olifants 228 From the Usuthu, Komati and Vaal for power generation
Middle Olifants 8 From the Letaba catchment
Lower Olifants 3 From Letaba catchment
TOTAL 249
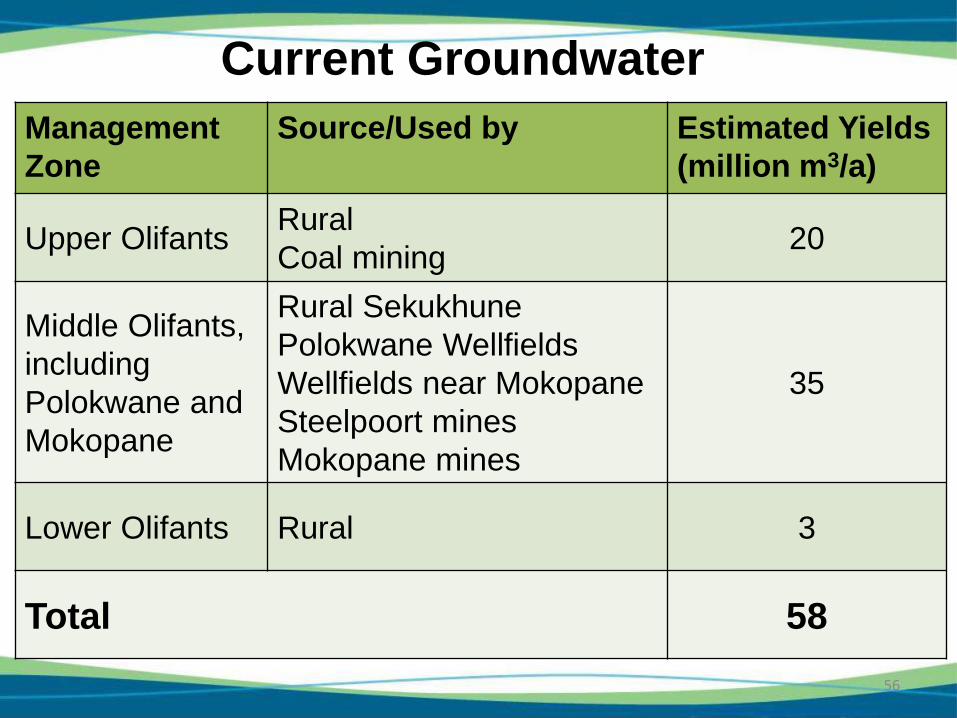
Current Groundwater
56
Management
Zone
Source/Used by Estimated Yields
(million m3/a)
Upper Olifants Rural
Coal mining 20
Middle Olifants,
including
Polokwane and
Mokopane
Rural Sekukhune
Polokwane Wellfields
Wellfields near Mokopane
Steelpoort mines
Mokopane mines
35
Lower Olifants Rural 3
Total 58
57
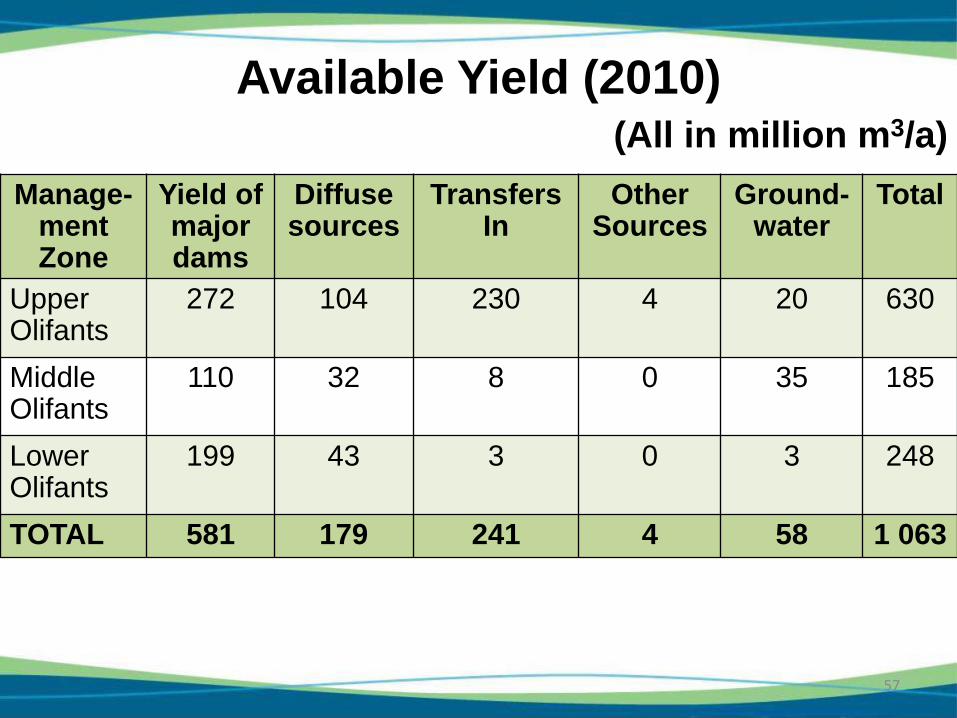
Available Yield (2010) (All in million m3/a)
Manage-ment Zone
Yield of major dams
Diffuse sources
Transfers In
Other Sources
Ground- water
Total
Upper Olifants
272 104 230 4 20 630
Middle Olifants
110 32 8 0 35 185
Lower Olifants
199 43 3 0 3
248
TOTAL 581 179 241 4 58 1 063
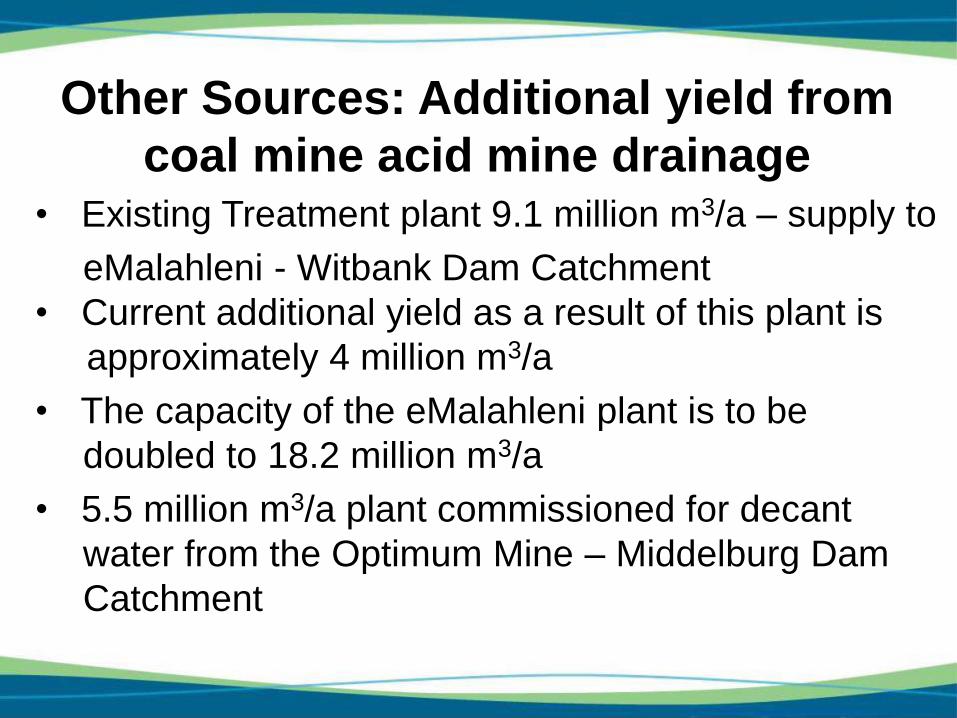
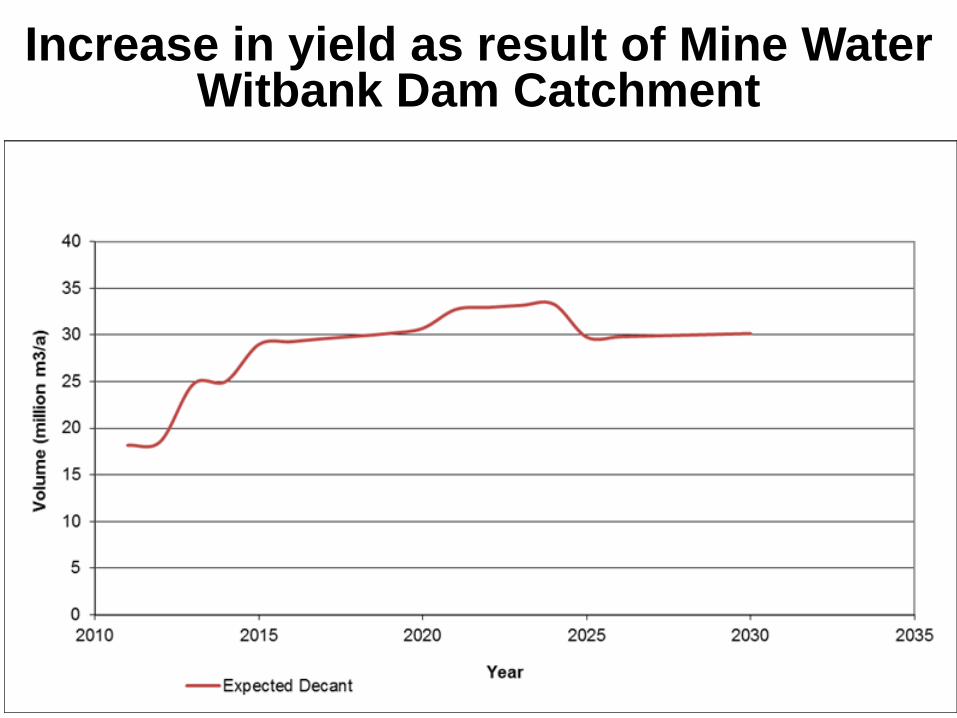
Other Sources: Additional yield from
coal mine acid mine drainage • Existing Treatment plant 9.1 million m3/a – supply to
eMalahleni - Witbank Dam Catchment
• Current additional yield as a result of this plant is
approximately 4 million m3/a
• The capacity of the eMalahleni plant is to be
doubled to 18.2 million m3/a
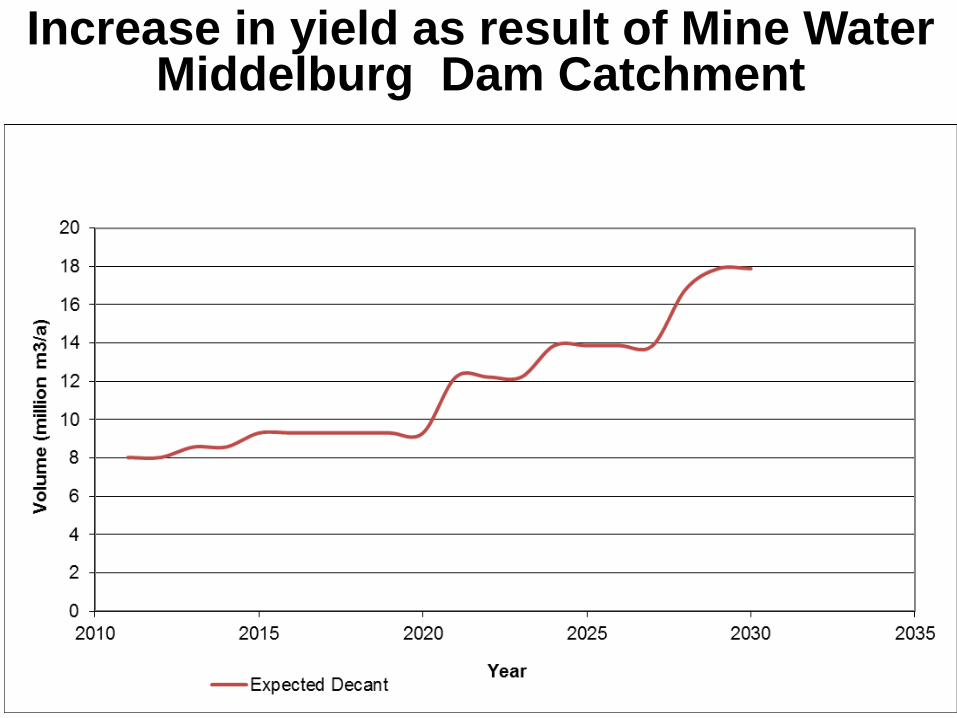
• 5.5 million m3/a plant commissioned for decant
water from the Optimum Mine – Middelburg Dam
Catchment
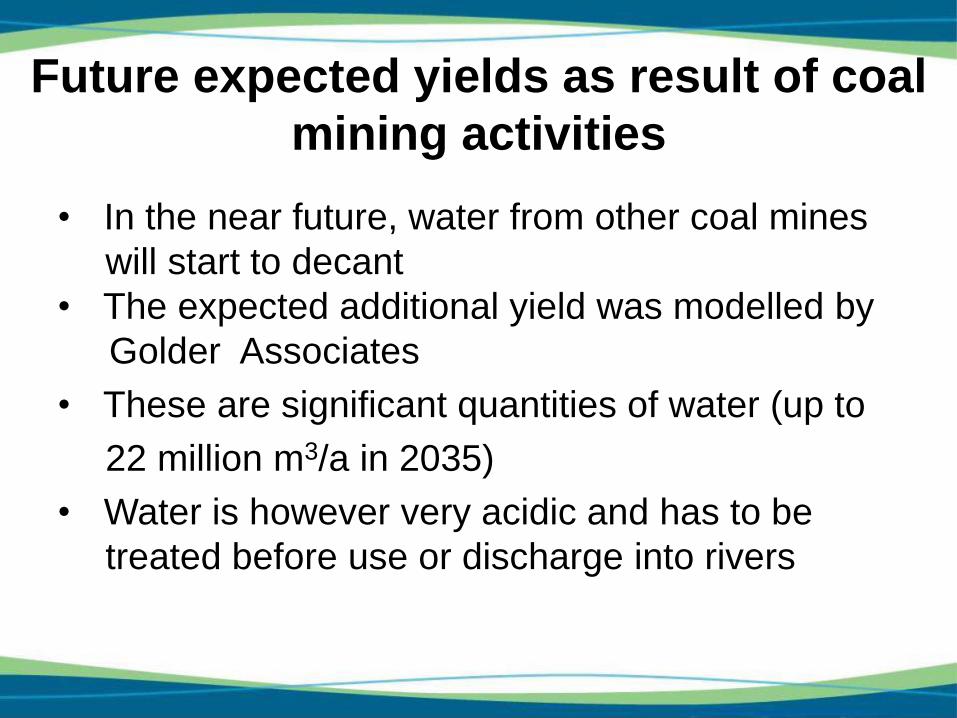
Future expected yields as result of coal
mining activities
• In the near future, water from other coal mines
will start to decant
• The expected additional yield was modelled by
Golder Associates
• These are significant quantities of water (up to
22 million m3/a in 2035)
• Water is however very acidic and has to be
treated before use or discharge into rivers
60
Increase in yield as result of Mine Water Witbank Dam Catchment
61
Increase in yield as result of Mine Water Middelburg Dam Catchment
Latest information on yield of
Phalaborwa Barrage
62
• The yield of the Phalaborwa Barrage was not
evaluated as part of the OWAAS study and therefore
was not included in the Preliminary Strategy
• Under present conditions, the yield at the Barrage is
estimated as:
– Historic yield: 42 million m3/a
– 1:50 year yield: 49 million m3/a
• This assumes a minimum flow at the Mamba weir in
the KNP
63
6 Water Quality
• Background
• Sources of pollution
• Actual water quality versus water quality objectives
- Water assessment categories
- Sampling sites used
- Water quality situation in the Olifants River
System
- Trend Analysis
64
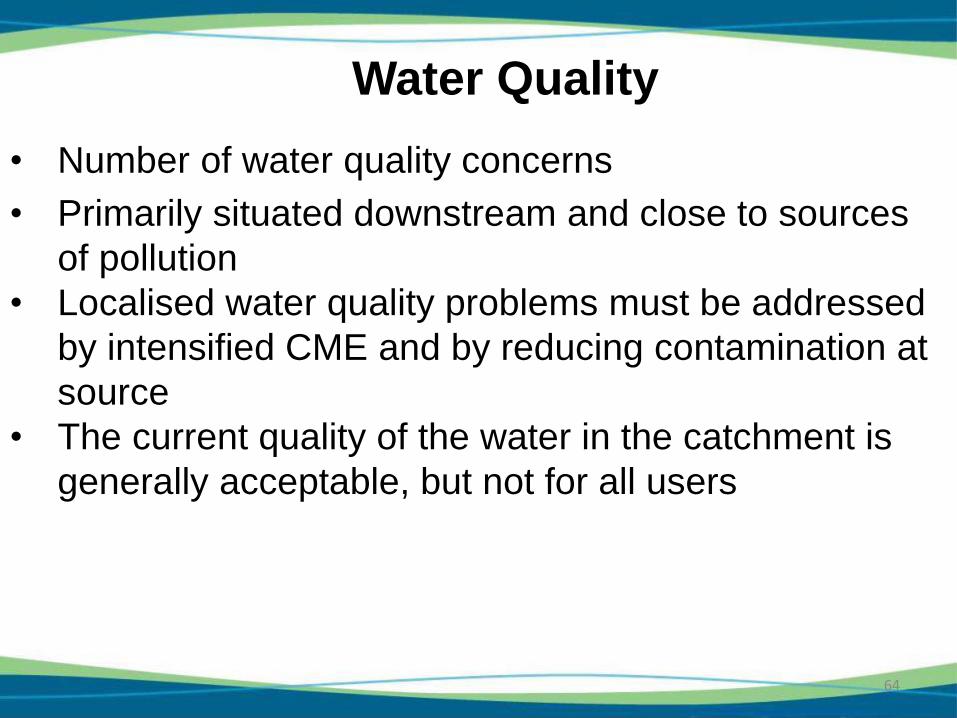
• Number of water quality concerns
• Primarily situated downstream and close to sources
of pollution
• Localised water quality problems must be addressed
by intensified CME and by reducing contamination at
source
• The current quality of the water in the catchment is
generally acceptable, but not for all users
Water Quality
65
Water Quality (Continued)
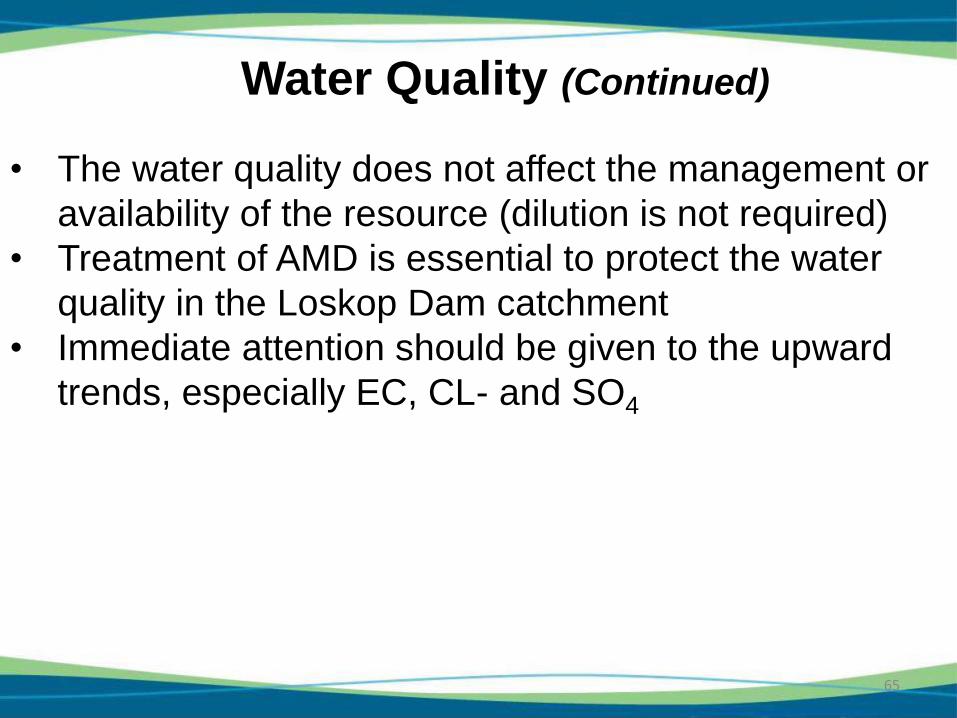
• The water quality does not affect the management or
availability of the resource (dilution is not required)
• Treatment of AMD is essential to protect the water
quality in the Loskop Dam catchment
• Immediate attention should be given to the upward
trends, especially EC, CL- and SO4
66
7 The Water Balance
• Current water balance with no interventions
• Future water balance with no interventions
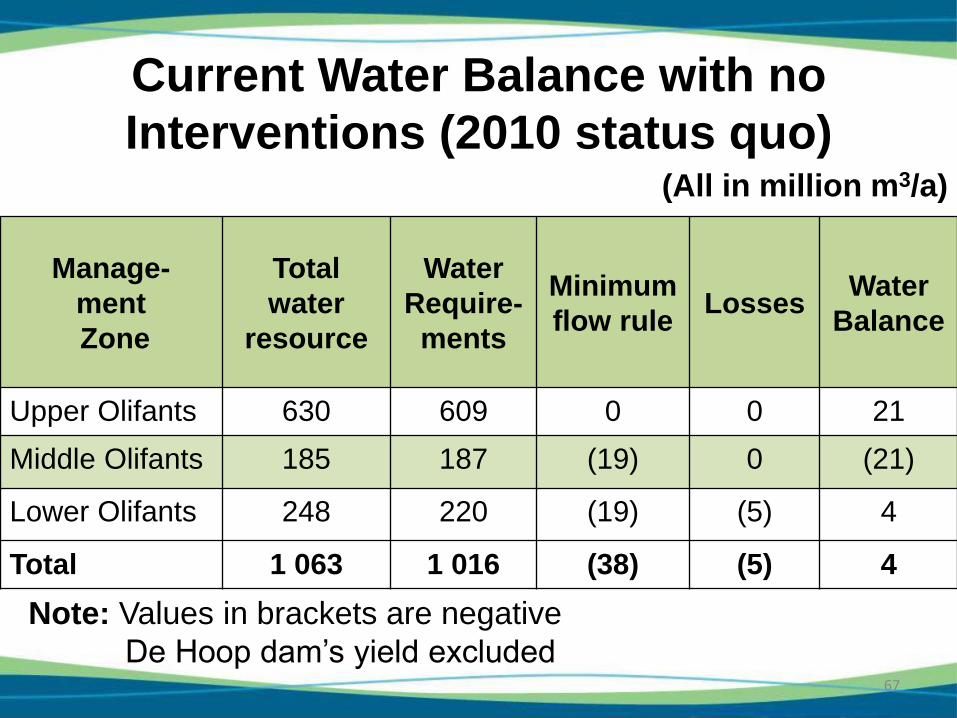
Current Water Balance with no
Interventions (2010 status quo)
67
(All in million m3/a)
Manage-
ment
Zone
Total
water
resource
Water
Require-
ments
Minimum
flow rule Losses
Water
Balance
Upper Olifants 630 609 0 0 21
Middle Olifants 185 187 (19) 0 (21)
Lower Olifants 248 220 (19) (5) 4
Total 1 063 1 016 (38) (5) 4
Note: Values in brackets are negative
De Hoop dam’s yield excluded
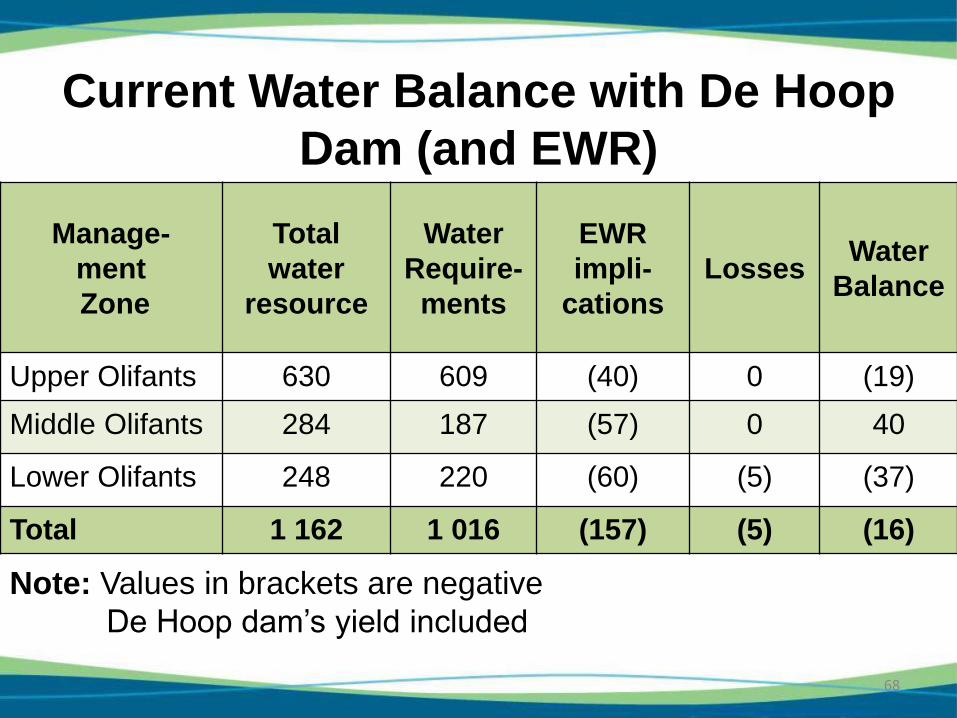
Current Water Balance with De Hoop
Dam (and EWR)
68
Manage-
ment
Zone
Total
water
resource
Water
Require-
ments
EWR
impli-
cations
Losses Water
Balance
Upper Olifants 630 609 (40) 0 (19)
Middle Olifants 284 187 (57) 0 40
Lower Olifants 248 220 (60) (5) (37)
Total 1 162 1 016 (157) (5) (16)
Note: Values in brackets are negative
De Hoop dam’s yield included
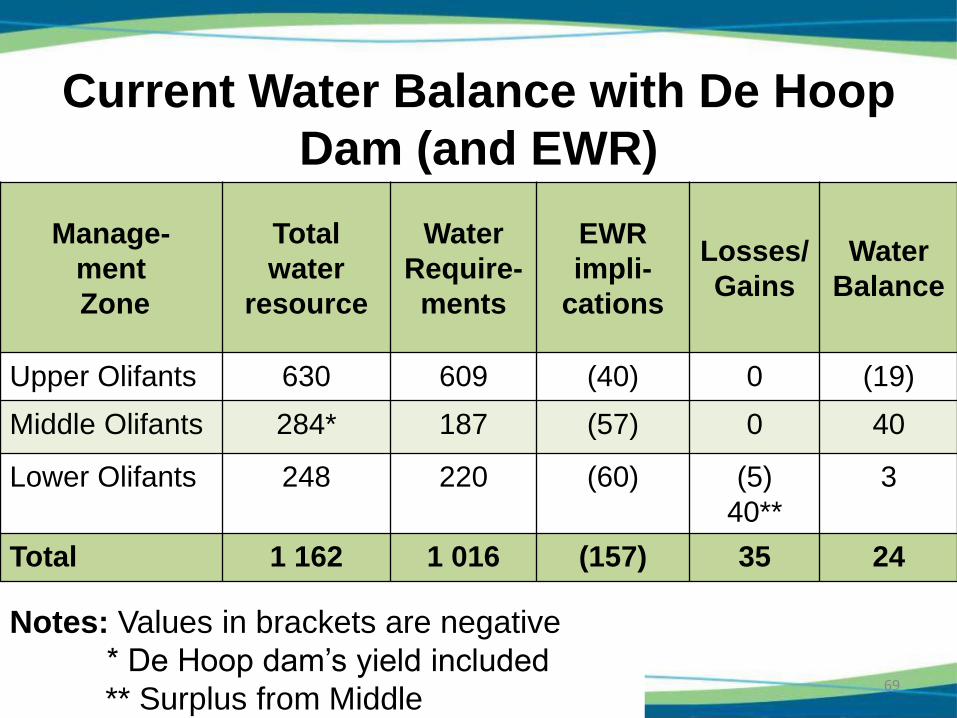
69
Manage-
ment
Zone
Total
water
resource
Water
Require-
ments
EWR
impli-
cations
Losses/
Gains
Water
Balance
Upper Olifants 630 609 (40) 0 (19)
Middle Olifants 284* 187 (57) 0 40
Lower Olifants 248 220 (60) (5)
40**
3
Total 1 162 1 016 (157) 35 24
Notes: Values in brackets are negative
* De Hoop dam’s yield included
** Surplus from Middle
Current Water Balance with De Hoop
Dam (and EWR)
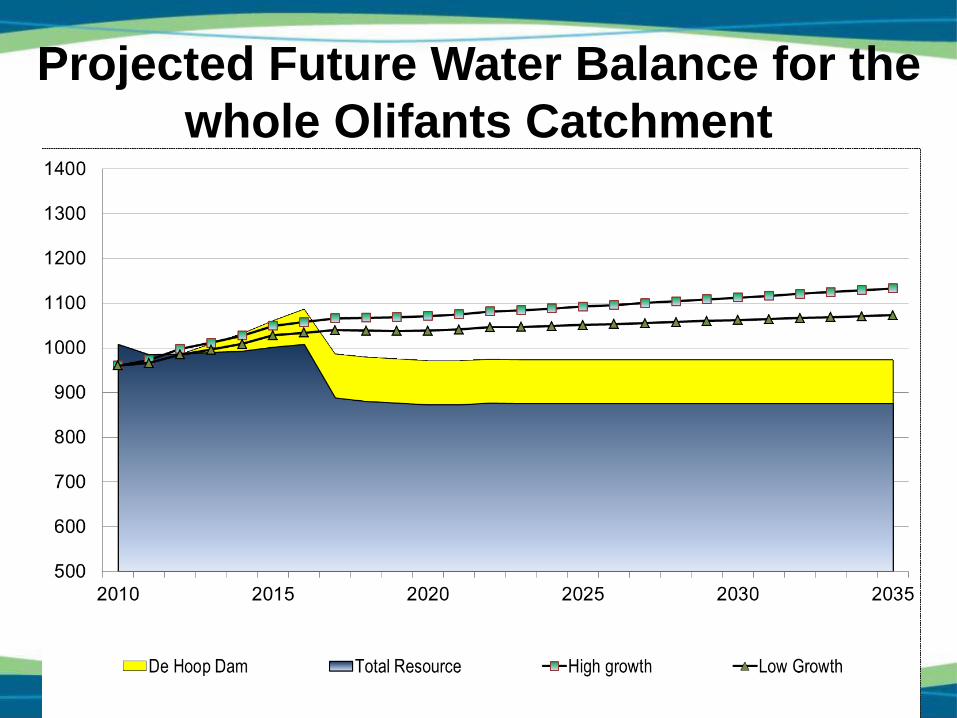
70
Projected Future Water Balance for the
whole Olifants Catchment
71
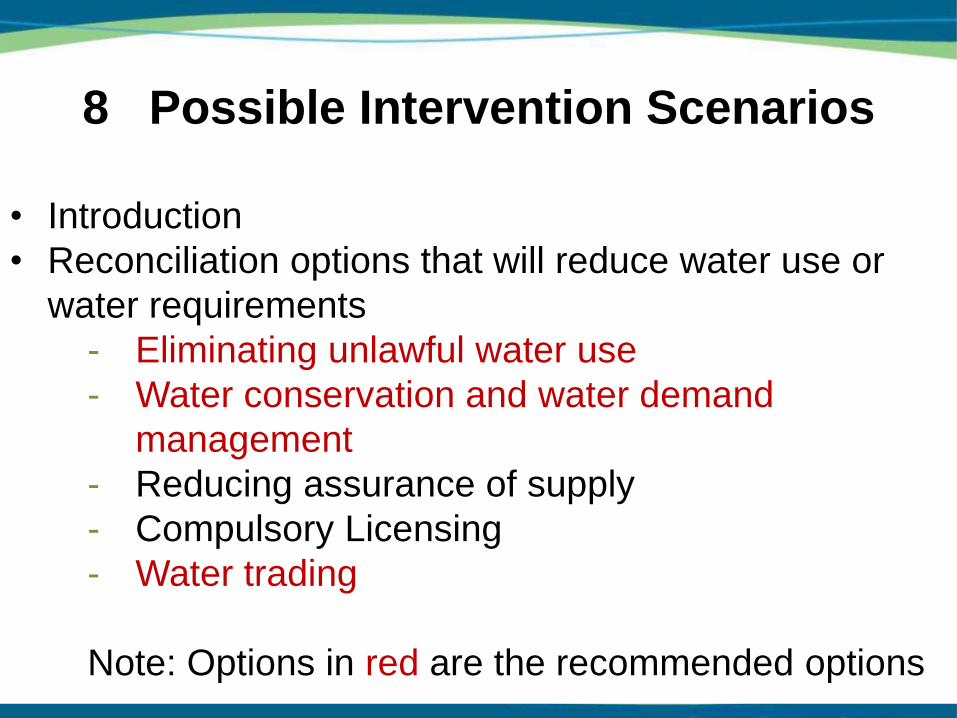
8 Possible Intervention Scenarios
• Introduction
• Reconciliation options that will reduce water use or
water requirements
- Eliminating unlawful water use
- Water conservation and water demand
management
- Reducing assurance of supply
- Compulsory Licensing
- Water trading
Note: Options in red are the recommended options
72
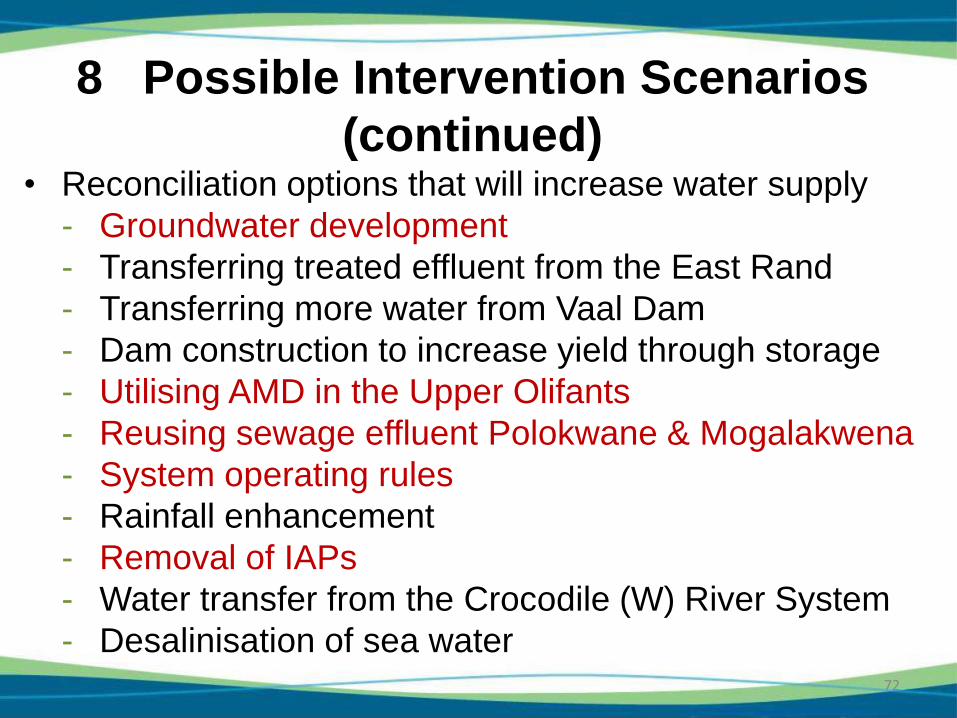
8 Possible Intervention Scenarios
(continued) • Reconciliation options that will increase water supply
- Groundwater development
- Transferring treated effluent from the East Rand
- Transferring more water from Vaal Dam
- Dam construction to increase yield through storage
- Utilising AMD in the Upper Olifants
- Reusing sewage effluent Polokwane & Mogalakwena
- System operating rules
- Rainfall enhancement
- Removal of IAPs
- Water transfer from the Crocodile (W) River System
- Desalinisation of sea water
73
8 Possible Intervention Scenarios
(continued) • Considerations for selecting the most appropriate
reconciliation options
- Basis for water reconciliation
- International obligations
- Summary of the yield and cost information of the
reconciliation options
- Selection of reconciliation scenarios
Reconciliation Options
• Options that will
reduce water
requirements
• Options that will
increase the water
supply
74
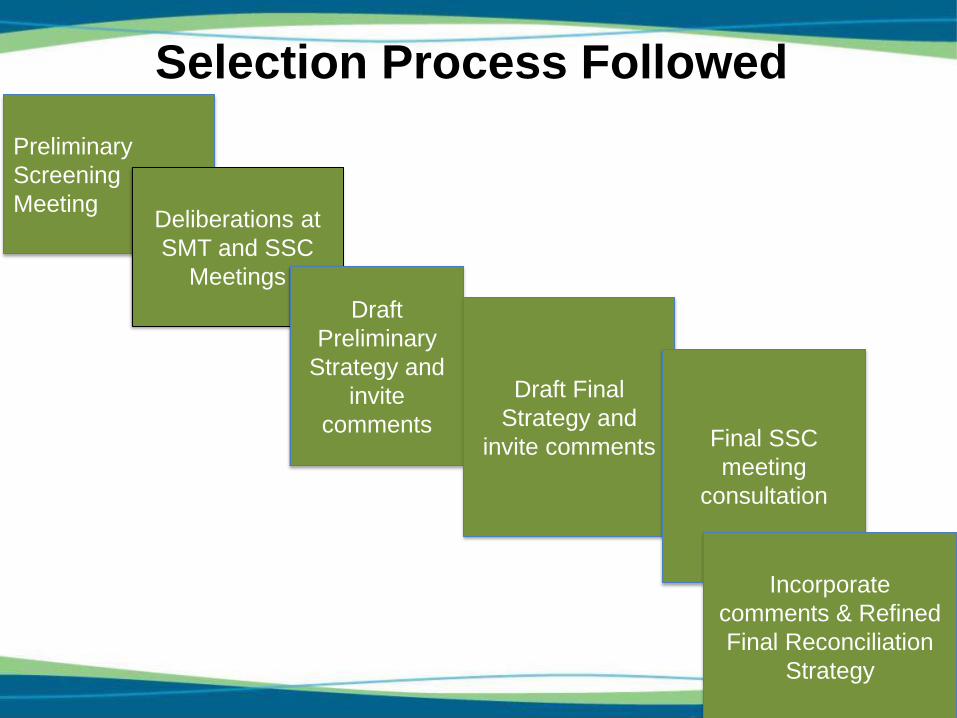
Selection Process Followed
Preliminary
Screening
Meeting Deliberations at
SMT and SSC
Meetings
Draft
Preliminary
Strategy and
invite
comments
Draft Final
Strategy and
invite comments Final SSC
meeting
consultation
Incorporate
comments & Refined
Final Reconciliation
Strategy
76
Considerations for selecting the most
appropriate Reconciliation Options
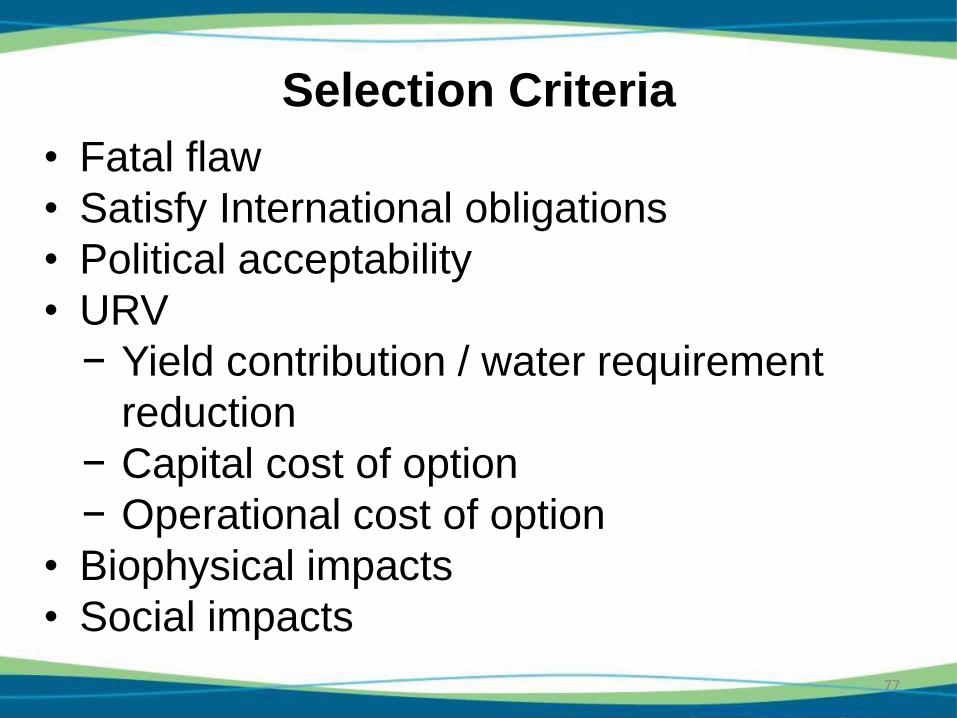
Selection Criteria
• Fatal flaw
• Satisfy International obligations
• Political acceptability
• URV
− Yield contribution / water requirement
reduction
− Capital cost of option
− Operational cost of option
• Biophysical impacts
• Social impacts
77
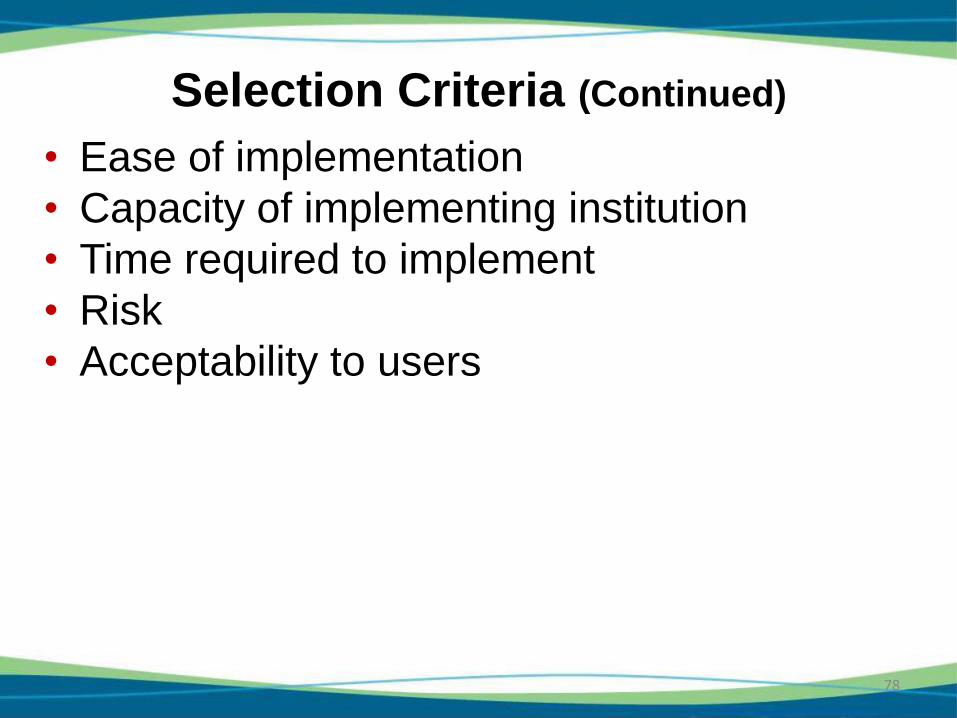
Selection Criteria (Continued)
• Ease of implementation
• Capacity of implementing institution
• Time required to implement
• Risk
• Acceptability to users
78
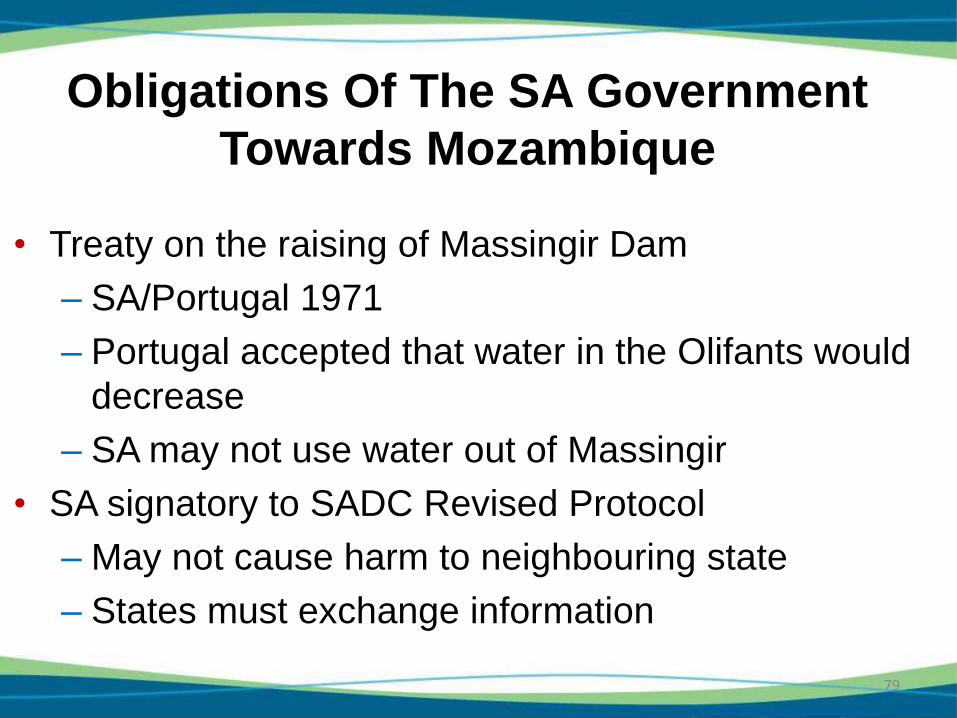
Obligations Of The SA Government
Towards Mozambique
79
• Treaty on the raising of Massingir Dam
– SA/Portugal 1971
– Portugal accepted that water in the Olifants would
decrease
– SA may not use water out of Massingir
• SA signatory to SADC Revised Protocol
– May not cause harm to neighbouring state
– States must exchange information
Environmental Screening Of Options
Environmental screening aims to:
• summarise any key environmental or social issues
that should be taken into account when considering
and comparing options;
• identify any environmental or social “fatal flaws” or
“red flags” associated with any of the projects; and
• identify environmental authorisations that will be
required for any of the projects.
80
Reconciliation options that can reduce
water requirements
• Eliminating unlawful water use
• Water Conservation and Water Demand
Management (WC/WDM) in the irrigation sector
• WC/WDM in the domestic water use sector
• WC/WDM in the mining sector
• Reducing assurances of supply
• Water trading
• Compulsory licensing (Conditions for application)
81
Selected reconciliation options that can
reduce water requirements
82
Recommended Options:
• Elimination of unlawful water use
• WC/WDM in urban, irrigation and mining sectors
• Water trading
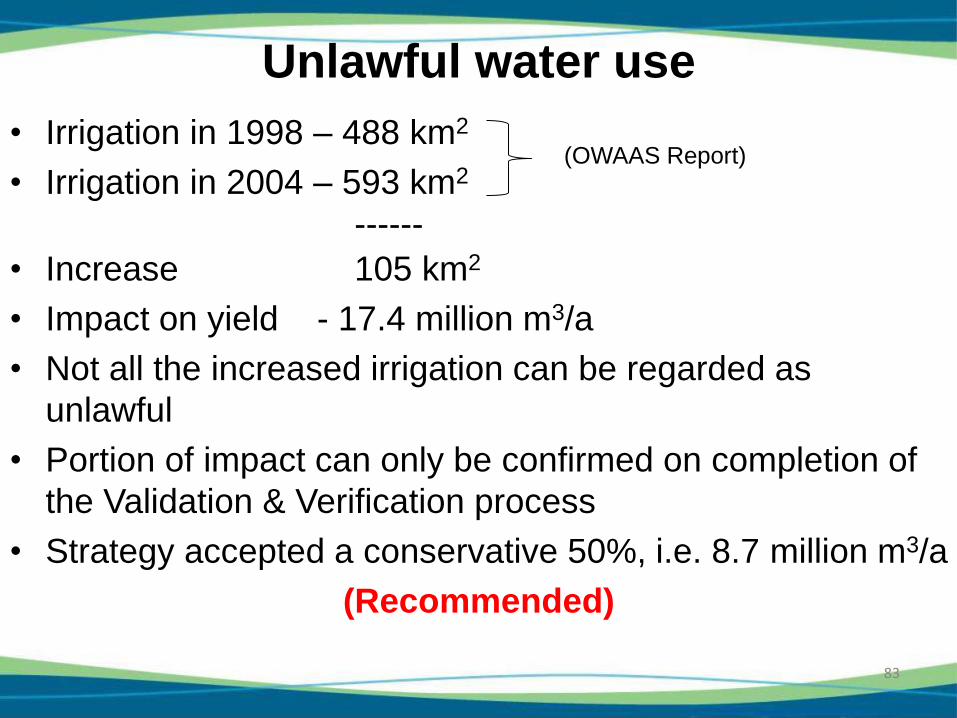
Unlawful water use
83
• Irrigation in 1998 – 488 km2
• Irrigation in 2004 – 593 km2
------
• Increase 105 km2
• Impact on yield - 17.4 million m3/a
• Not all the increased irrigation can be regarded as
unlawful
• Portion of impact can only be confirmed on completion of
the Validation & Verification process
• Strategy accepted a conservative 50%, i.e. 8.7 million m3/a
(Recommended)
(OWAAS Report)
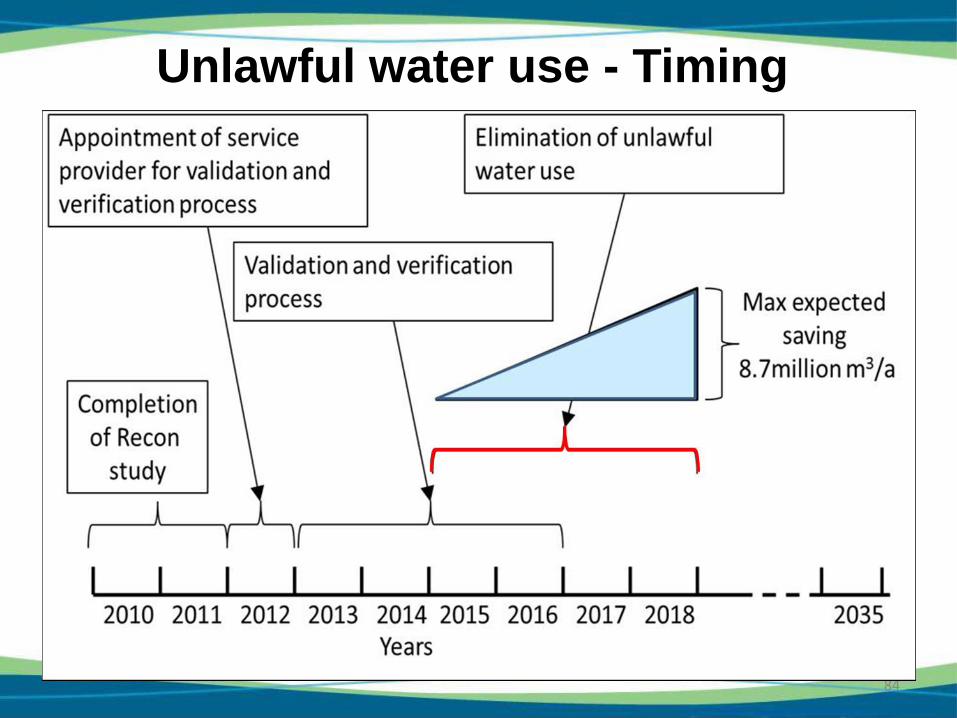
Unlawful water use - Timing
84
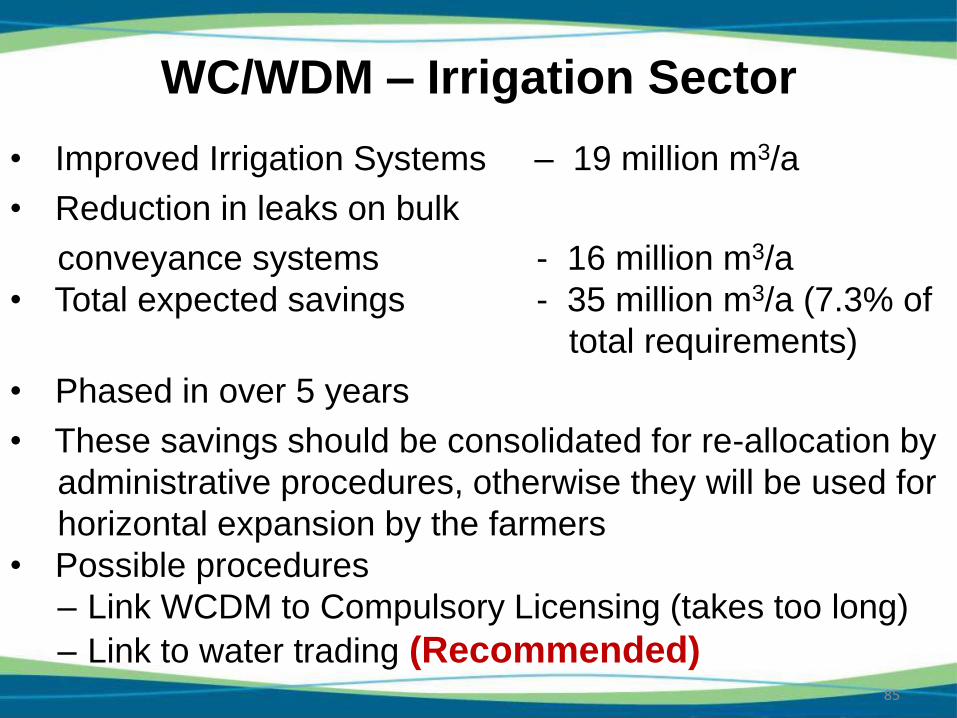
WC/WDM – Irrigation Sector
• Improved Irrigation Systems – 19 million m3/a
• Reduction in leaks on bulk
conveyance systems - 16 million m3/a
• Total expected savings - 35 million m3/a (7.3% of
total requirements)
• Phased in over 5 years
• These savings should be consolidated for re-allocation by
administrative procedures, otherwise they will be used for
horizontal expansion by the farmers
• Possible procedures
– Link WCDM to Compulsory Licensing (takes too long)
– Link to water trading (Recommended)
85
WC/WDM Urban Sector
• WC/WDM strategies were available for Emalahleni
and Lebowakgomo
• Water savings for these two towns were
extrapolated to the other towns
• Expected saving – 20 million m3/a (11.3% of
current urban requirements)
• Phased in over 5 years
(Recommended)
86
WC/WDM Mining Sector
• Expected saving 5 million m3/a (5.9% of current
mining requirements)
• Processes of some mines need to be changed,
therefore they need more time
• 10 year phasing period was adopted
(Recommended)
87
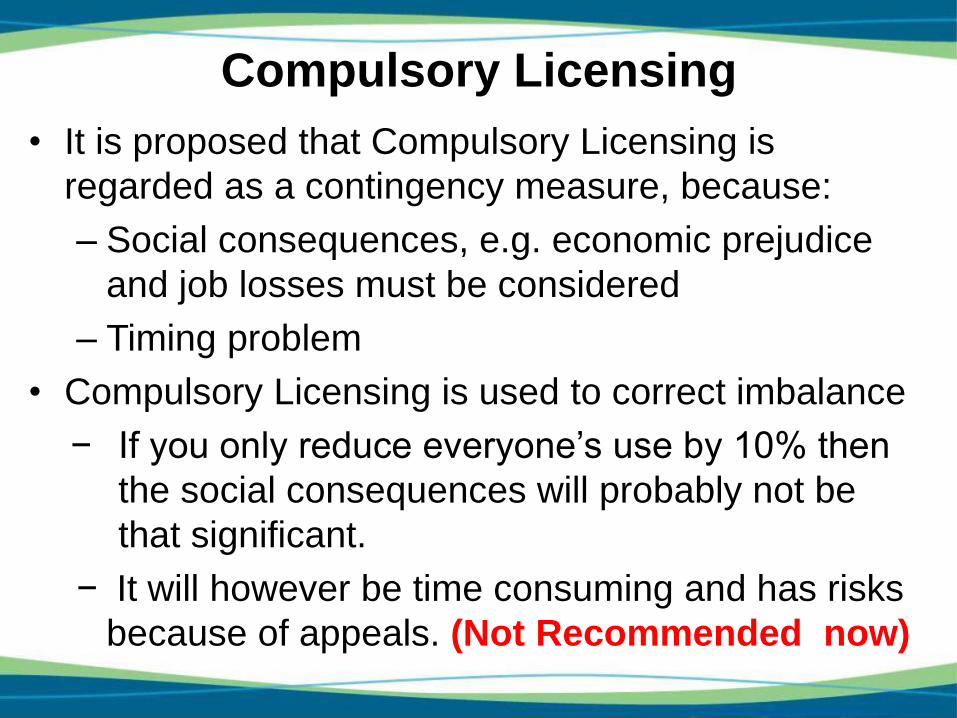
Compulsory Licensing
• It is proposed that Compulsory Licensing is
regarded as a contingency measure, because:
– Social consequences, e.g. economic prejudice
and job losses must be considered
– Timing problem
• Compulsory Licensing is used to correct imbalance
− If you only reduce everyone’s use by 10% then
the social consequences will probably not be
that significant.
− It will however be time consuming and has risks
because of appeals. (Not Recommended now)
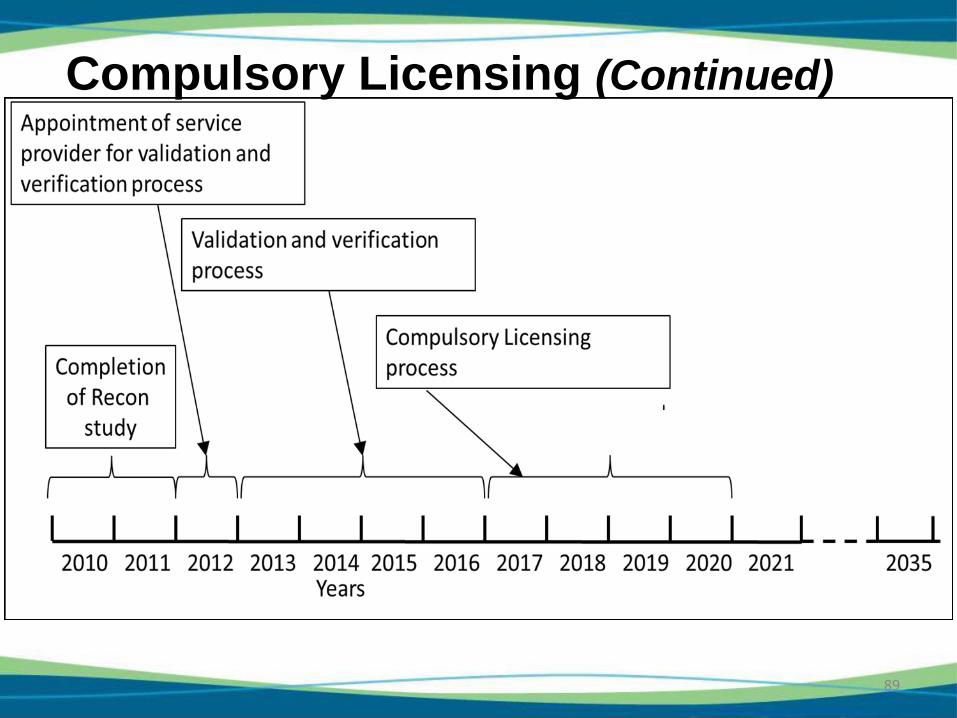
Compulsory Licensing (Continued)
89
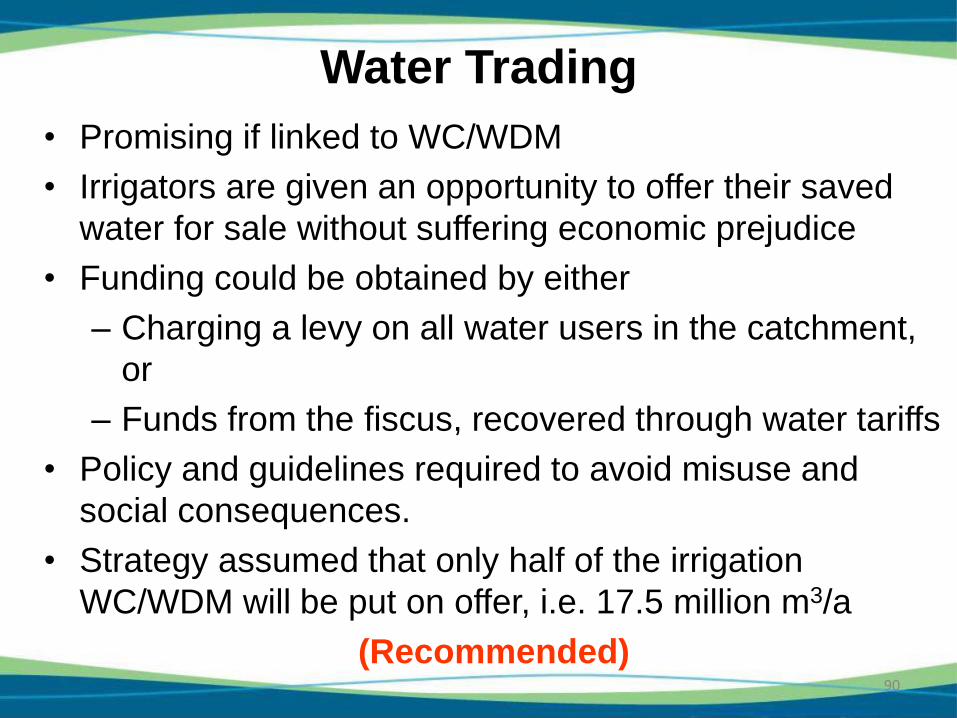
Water Trading
90
• Promising if linked to WC/WDM
• Irrigators are given an opportunity to offer their saved
water for sale without suffering economic prejudice
• Funding could be obtained by either
– Charging a levy on all water users in the catchment,
or
– Funds from the fiscus, recovered through water tariffs
• Policy and guidelines required to avoid misuse and
social consequences.
• Strategy assumed that only half of the irrigation
WC/WDM will be put on offer, i.e. 17.5 million m3/a
(Recommended)
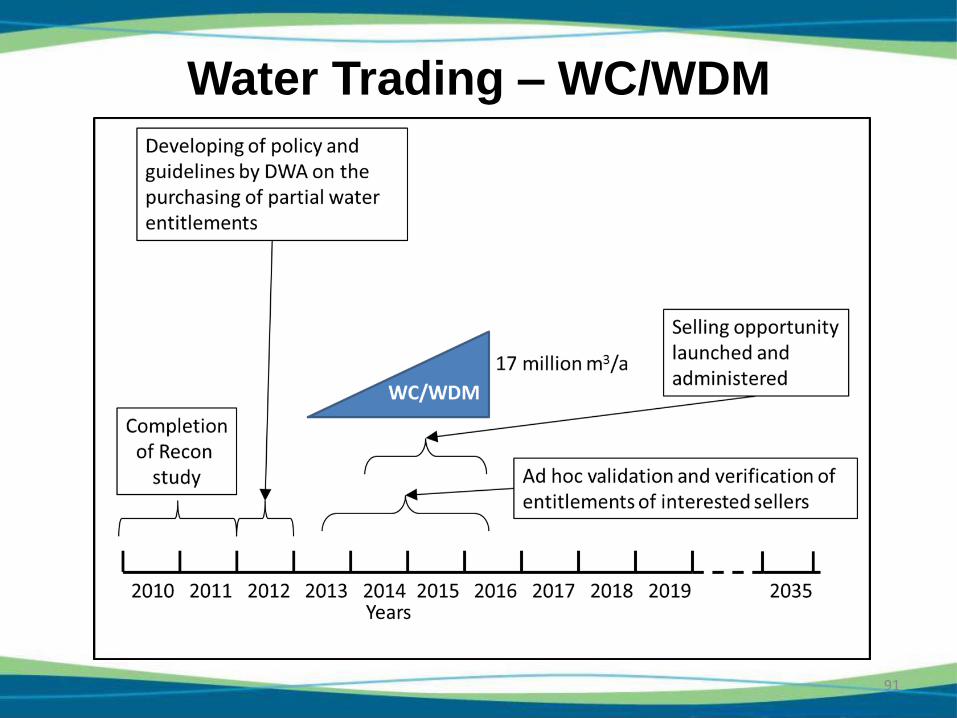
Water Trading – WC/WDM
91
Water Trading (Continued)
• Also possible to buy/sell full water entitlement
• Based on willing buyer/seller principle
• Should be well regulated as it could lead to
severe social impacts and job losses.
• This is a definite option but it has not been
factored into the reconciliation strategy as the
willingness of buyers and sellers is uncertain
(Recommended , but is not as yet necessary –
was regarded as a contingency measure and
was not taken into account for the strategy)
92
Selected Reconciliation Options That
Can Increase Water Supply
93
Recommended Options:
• Removal of Invasive Alien Plants
• Refinements to system operating rules
• Groundwater development
• Utilising AMD in the Upper Olifants zone
• Reusing sewage effluent in Polokwane and
Mogalakwena
Removal of Invasive Alien Plants
• 21 million m3/a of the yield are being taken up by
IAPs – based on areas in OWAAS Report
• WfW teams are already busy removing IAPs
• Programme must be continued and intensified
• The strategy assumed that 50% of the 21 million
m3/a can be gained over the planning period of
the study, i.e. 11.5 million m3/a
(Recommended)
94
Refinements To System Operating Rules
• Loskop, Flag Boshielo, Witbank, Middelburg and
De Hoop Dams should be operated as a system
• Better yields can be obtained by operating these
dams conjunctively
• A separate study is required to work out the
details
(Recommended but not included)
95
Rainfall Enhancement Through Cloud
Seeding
• Experiments in the Vaal Catchment weren’t
very successful
(Not Recommended)
96
Groundwater development
• Individual projects wherever groundwater is available (Recommended – allowed only 35 million m3/a of the 70
million m3/a potential)
• Possible regional water scheme with the Malmani
dolomites as resource should be investigated
− Impact of groundwater abstraction on surface water base
flow
− Possibility of artificial recharge with surface water where the
Olifants River crosses the Malmani aquifer
(Recommended)
97
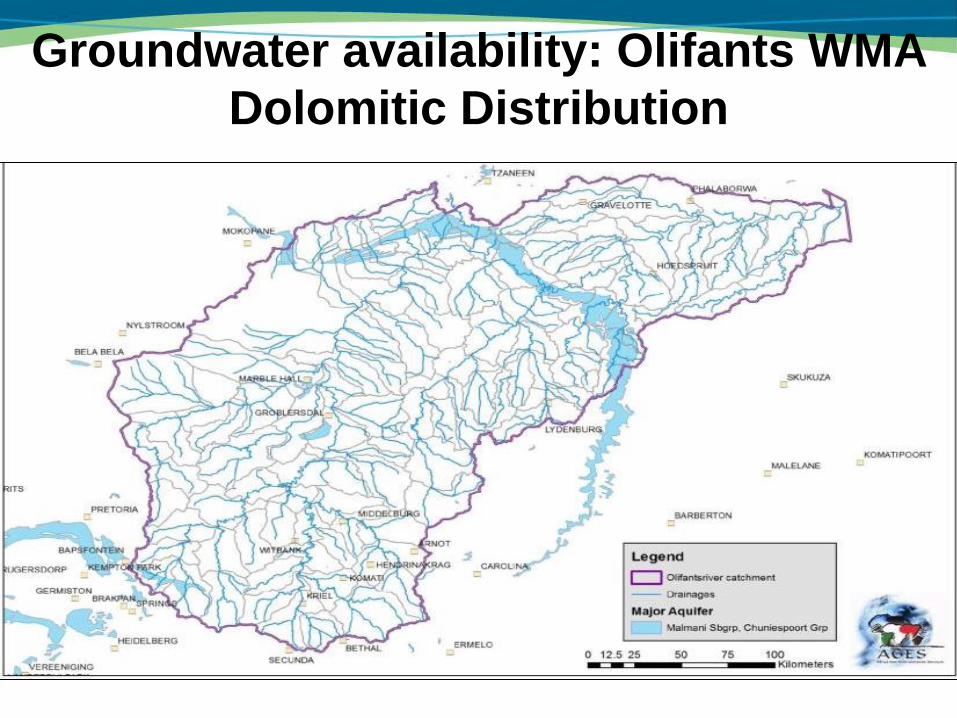
Groundwater availability: Olifants WMA
Dolomitic Distribution
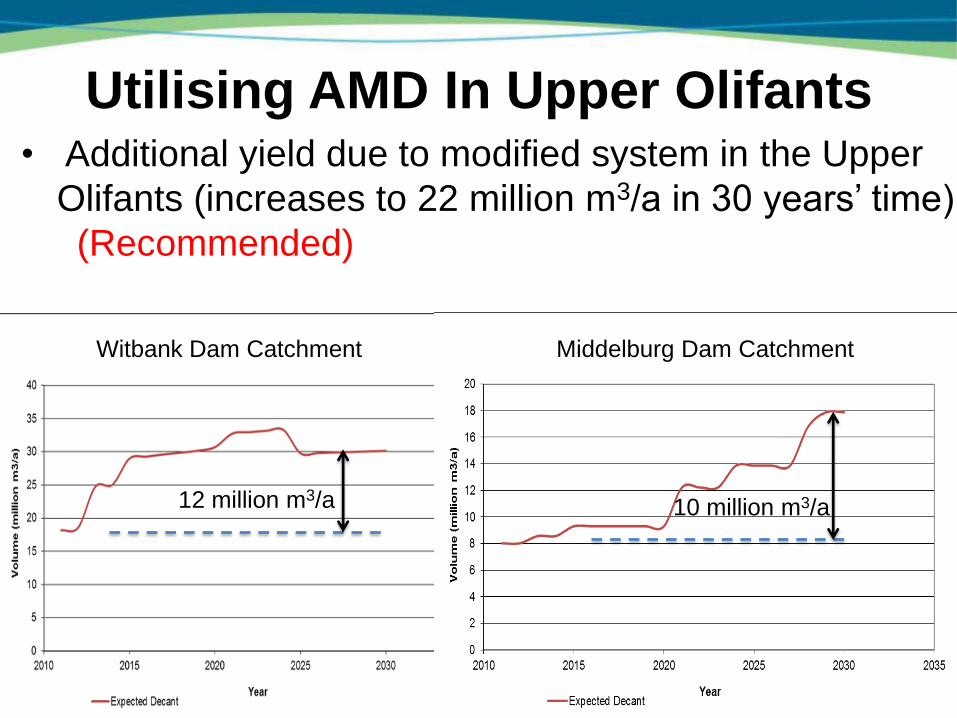
Utilising AMD In Upper Olifants • Additional yield due to modified system in the Upper
Olifants (increases to 22 million m3/a in 30 years’ time)
(Recommended)
99
Witbank Dam Catchment Middelburg Dam Catchment
12 million m3/a 10 million m3/a
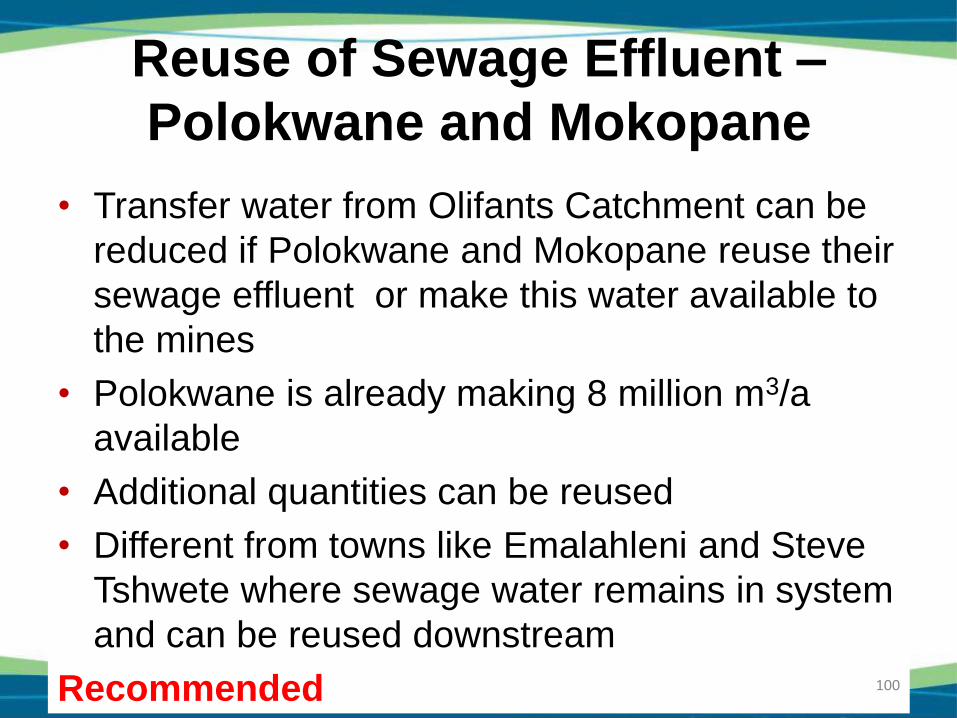
Reuse of Sewage Effluent –
Polokwane and Mokopane
• Transfer water from Olifants Catchment can be
reduced if Polokwane and Mokopane reuse their
sewage effluent or make this water available to
the mines
• Polokwane is already making 8 million m3/a
available
• Additional quantities can be reused
• Different from towns like Emalahleni and Steve
Tshwete where sewage water remains in system
and can be reused downstream
Recommended 100
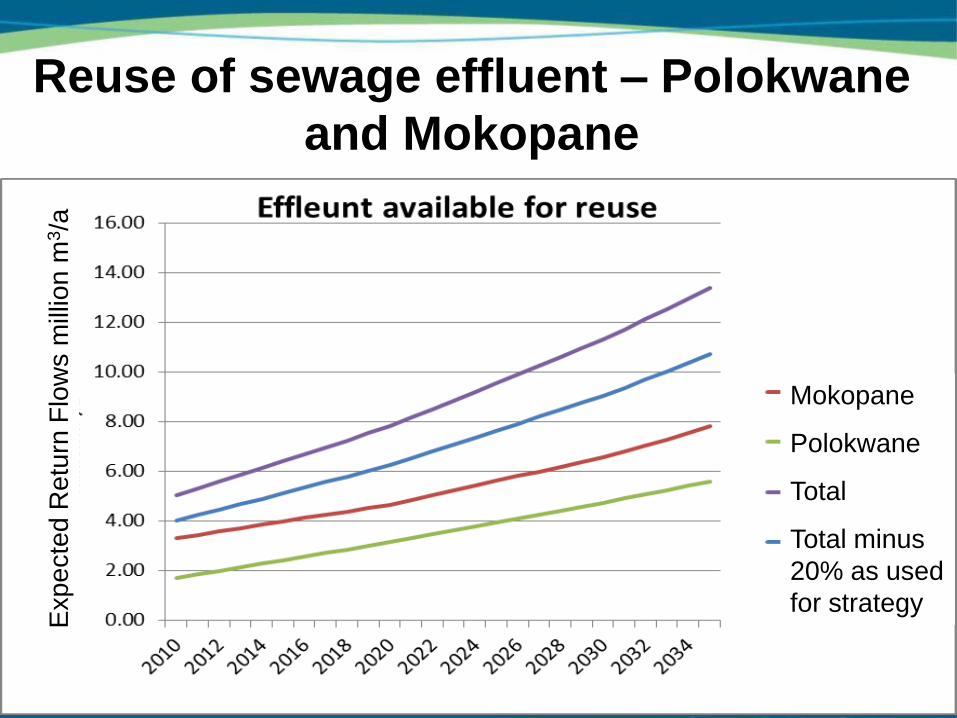
Reuse of sewage effluent – Polokwane
and Mokopane
101
Mokopane
Polokwane
Total
Total minus
20% as used
for strategy
Exp
ecte
d R
etu
rn F
low
s m
illio
n m
3/a
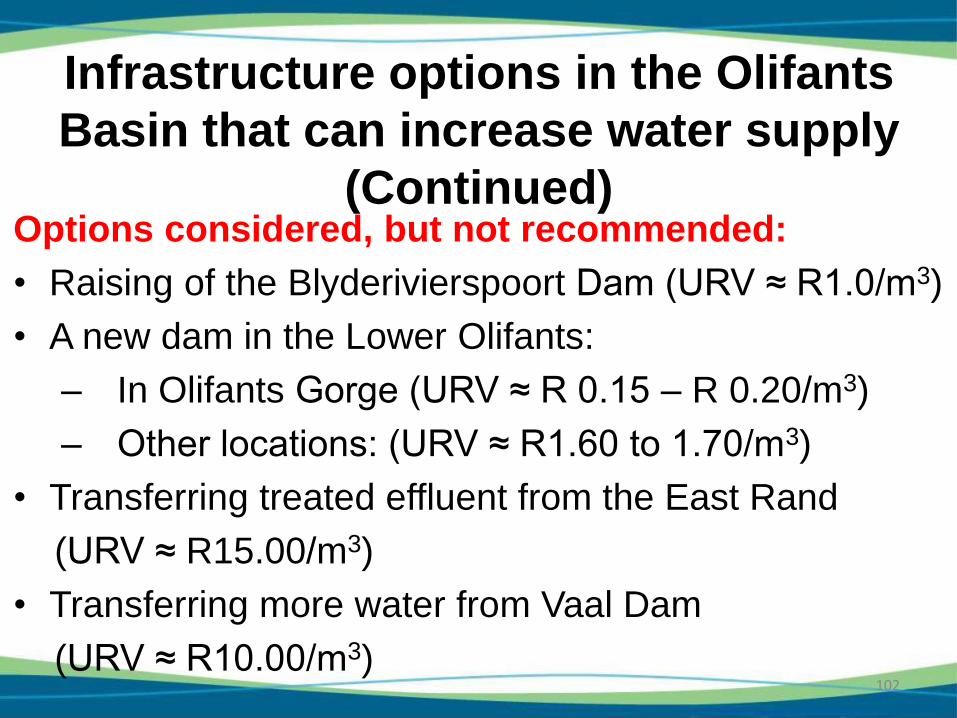
Infrastructure options in the Olifants
Basin that can increase water supply
(Continued) Options considered, but not recommended:
• Raising of the Blyderivierspoort Dam (URV ≈ R1.0/m3)
• A new dam in the Lower Olifants:
– In Olifants Gorge (URV ≈ R 0.15 – R 0.20/m3)
– Other locations: (URV ≈ R1.60 to 1.70/m3)
• Transferring treated effluent from the East Rand
(URV ≈ R15.00/m3)
• Transferring more water from Vaal Dam
(URV ≈ R10.00/m3) 102
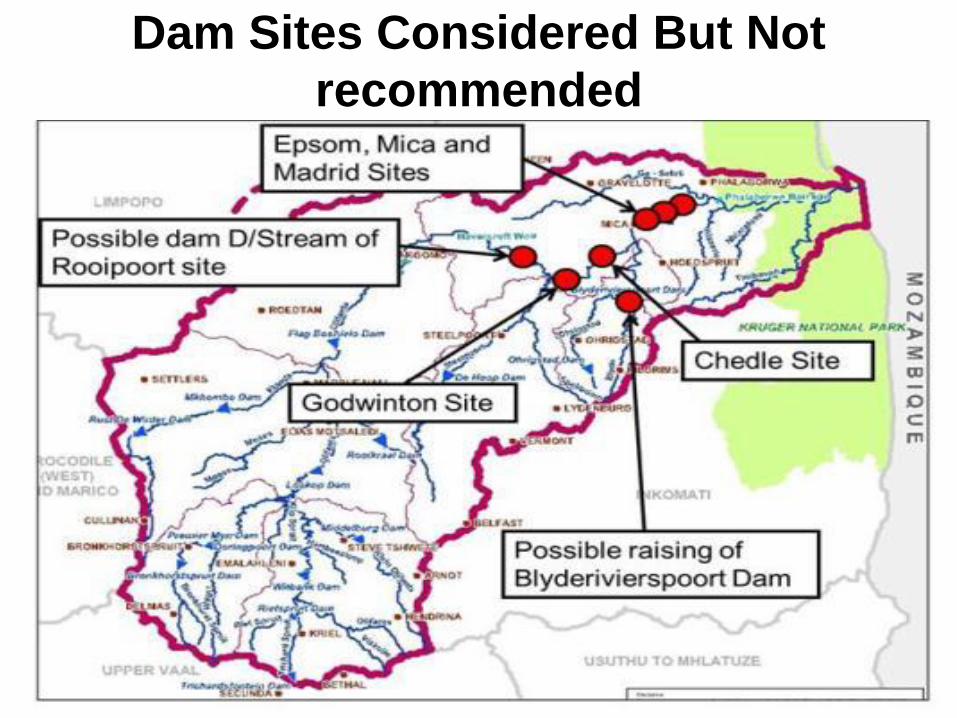
Dam Sites Considered But Not
recommended
Infrastructure options in the Olifants Basin that can increase water supply
(Continued)
Options considered, but not recommended
(Continued):
• Water transfer from the Crocodile (West) River System
• Desalination and transfer of seawater
104
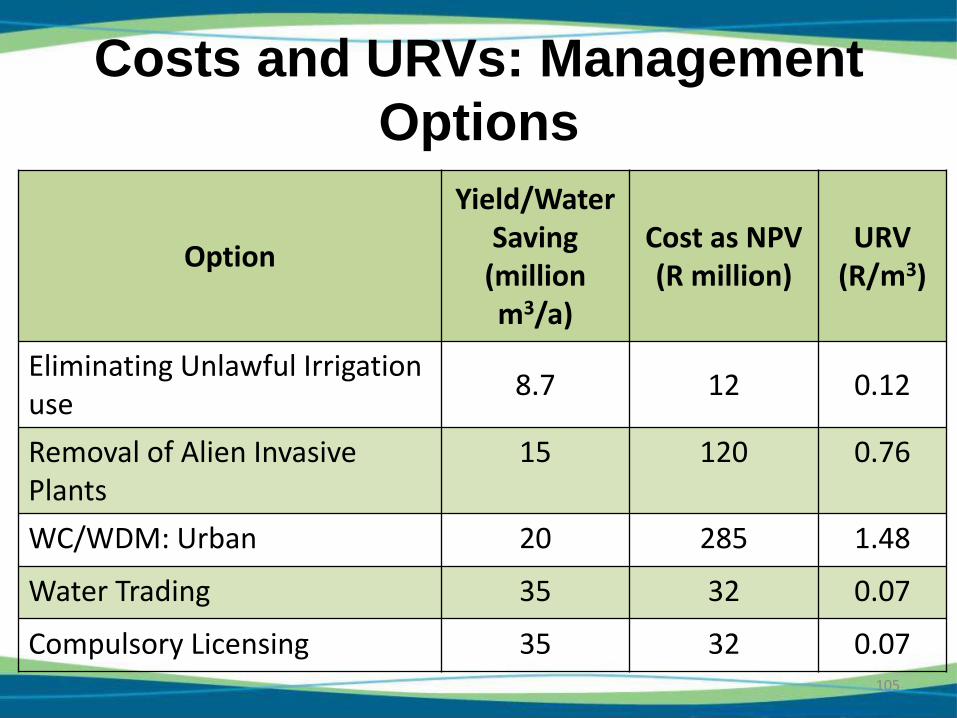
Costs and URVs: Management
Options
105
Option
Yield/Water Saving
(million m3/a)
Cost as NPV (R million)
URV (R/m3)
Eliminating Unlawful Irrigation use
8.7 12 0.12
Removal of Alien Invasive Plants
15 120 0.76
WC/WDM: Urban 20 285 1.48
Water Trading 35 32 0.07
Compulsory Licensing 35 32 0.07
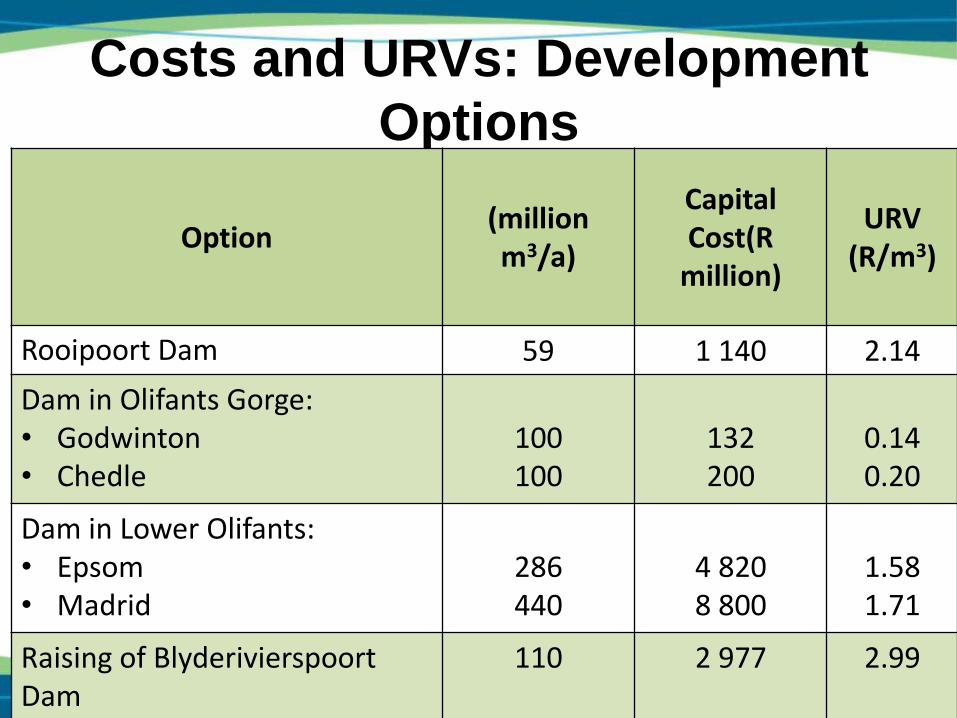
Costs and URVs: Development
Options
106
Option (million m3/a)
Capital Cost(R
million)
URV (R/m3)
Rooipoort Dam 59 1 140 2.14
Dam in Olifants Gorge: • Godwinton • Chedle
100 100
132 200
0.14 0.20
Dam in Lower Olifants: • Epsom • Madrid
286 440
4 820 8 800
1.58 1.71
Raising of Blyderivierspoort Dam
110 2 977 2.99
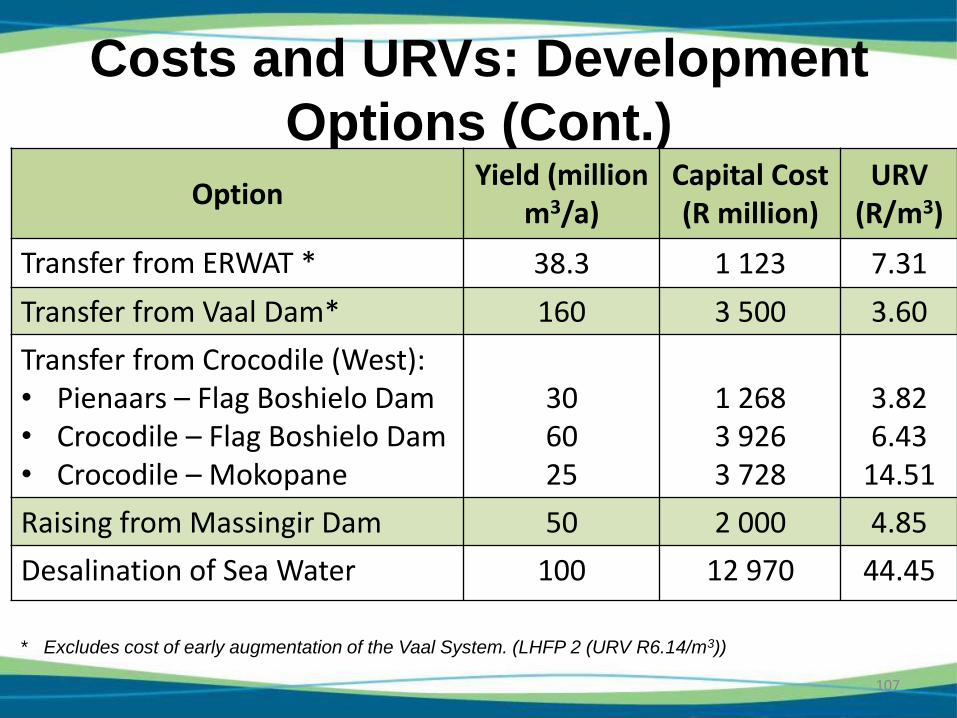
Costs and URVs: Development
Options (Cont.)
107
Option Yield (million
m3/a) Capital Cost (R million)
URV (R/m3)
Transfer from ERWAT * 38.3 1 123 7.31
Transfer from Vaal Dam* 160 3 500 3.60
Transfer from Crocodile (West): • Pienaars – Flag Boshielo Dam • Crocodile – Flag Boshielo Dam • Crocodile – Mokopane
30 60 25
1 268 3 926 3 728
3.82 6.43
14.51
Raising from Massingir Dam 50 2 000 4.85
Desalination of Sea Water 100 12 970 44.45
* Excludes cost of early augmentation of the Vaal System. (LHFP 2 (URV R6.14/m3))
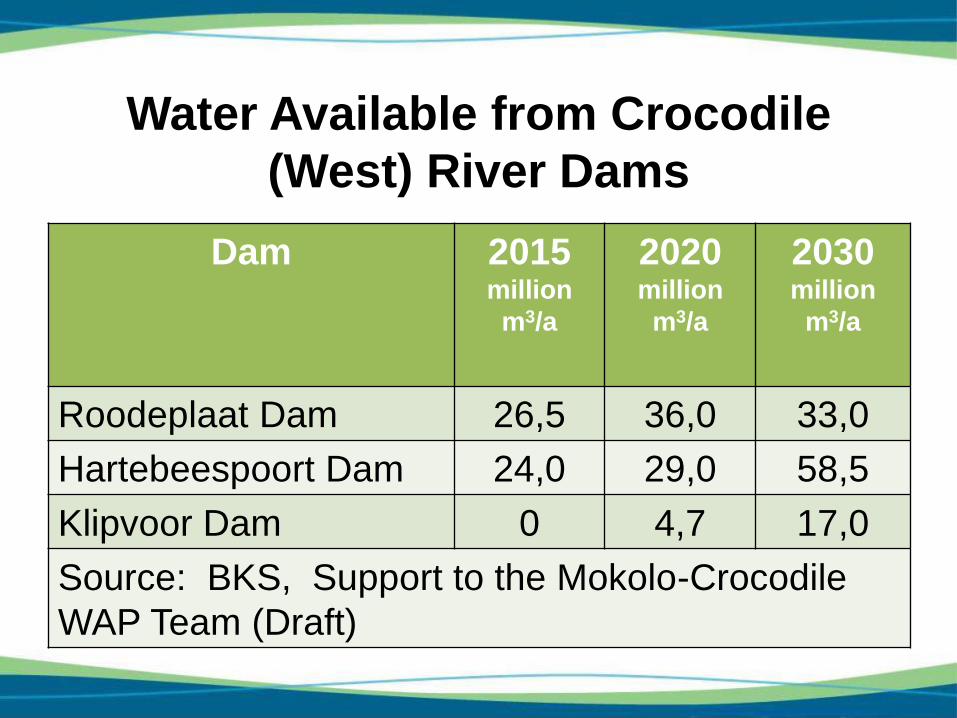
Water Available from Crocodile
(West) River Dams
Dam 2015 million
m3/a
2020 million
m3/a
2030 million
m3/a
Roodeplaat Dam 26,5 36,0 33,0
Hartebeespoort Dam 24,0 29,0 58,5
Klipvoor Dam 0 4,7 17,0
Source: BKS, Support to the Mokolo-Crocodile
WAP Team (Draft)
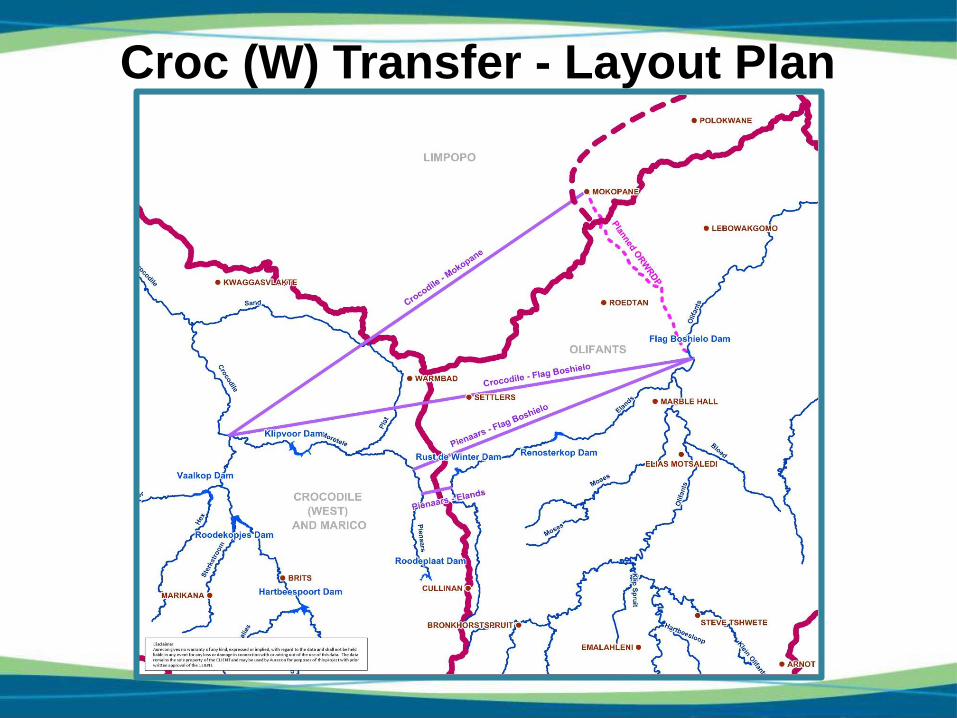
Croc (W) Transfer - Layout Plan
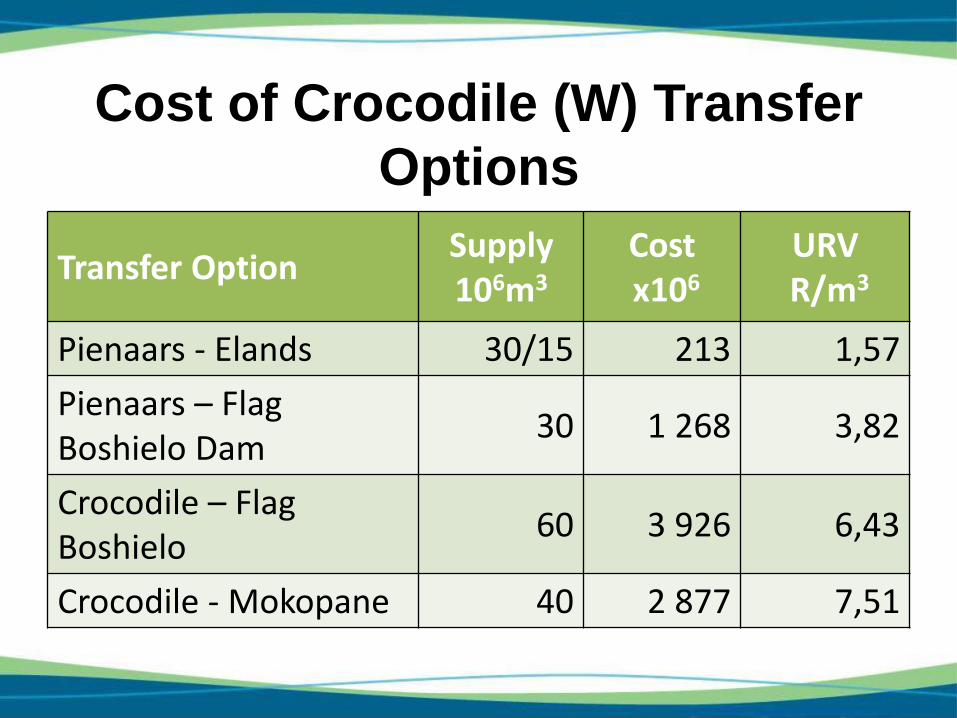
Cost of Crocodile (W) Transfer
Options
Transfer Option Supply 106m3
Cost x106
URV R/m3
Pienaars - Elands 30/15 213 1,57
Pienaars – Flag Boshielo Dam
30 1 268 3,82
Crocodile – Flag Boshielo
60 3 926 6,43
Crocodile - Mokopane 40 2 877 7,51
111
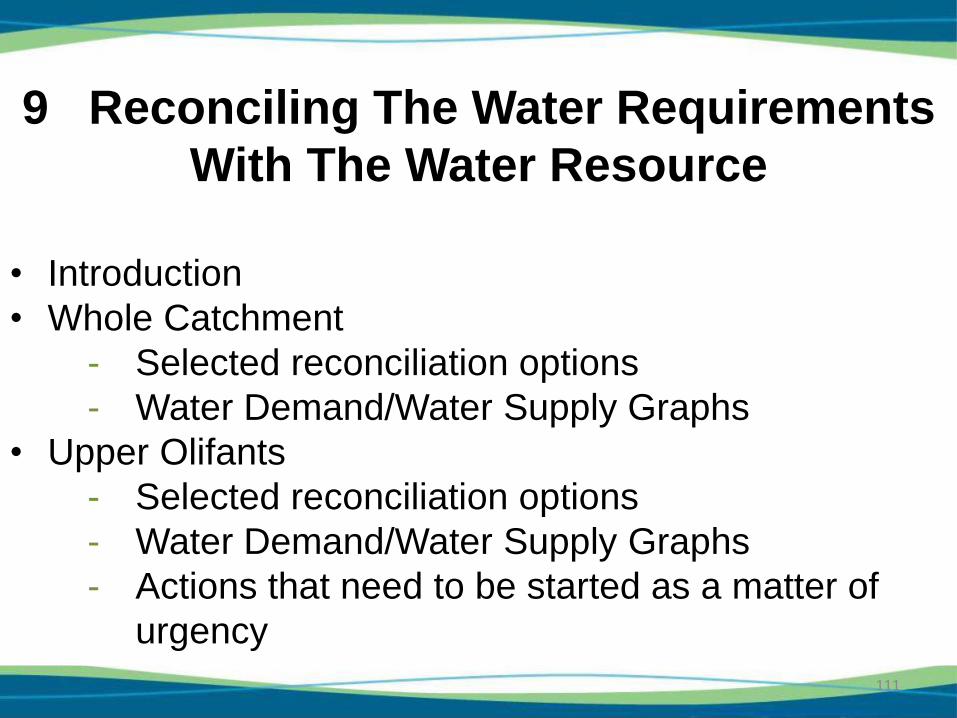
9 Reconciling The Water Requirements
With The Water Resource
• Introduction
• Whole Catchment
- Selected reconciliation options
- Water Demand/Water Supply Graphs
• Upper Olifants
- Selected reconciliation options
- Water Demand/Water Supply Graphs
- Actions that need to be started as a matter of
urgency
112
9 Reconciling The Water Requirements
With The Water Resource (Cont’d) • Middle Olifants
- Distributing De Hoop Dam water
- Selected reconciliation options
- Water Demand/Water Supply Graphs
- Split between Steelpoort River and Olifants River Main
Stem
- Actions that need to be started as a matter of urgency
• Lower Olifants
- Present situation
- Selected reconciliation options
- Water Demand/Water Supply Graphs
- Actions that need to be started as a matter of urgency
Basis for Water Reconciliation
• South Africa will meet its International Obligations.
• The Reserve is a priority
– EWRs to meet the recommended ecological category
will be maintained
– The water for basic human needs will be supplied
• Unlawful water use will be eliminated
• Water for strategic users for the benefit of the country must
receive priority before any other economic development
113
Basis for Water Reconciliation (Continued)
• Water for socio-economic development within the policy
parameters of the government will be provided.
• There will be no increase in total water allocations for
irrigation.
• No increase in forestry areas.
114
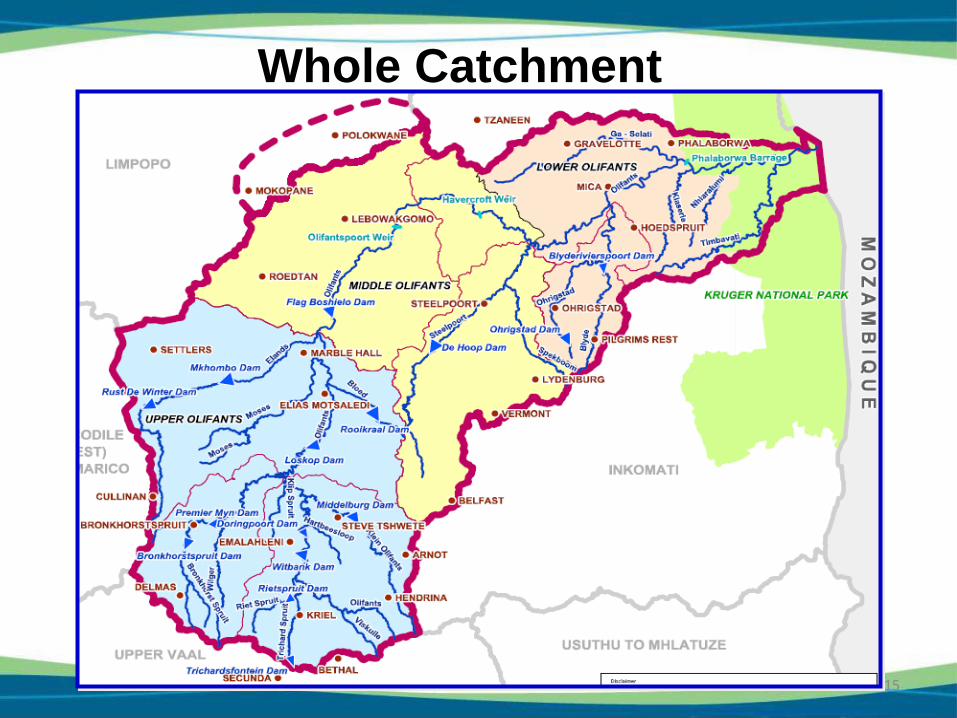
Whole Catchment
115
116
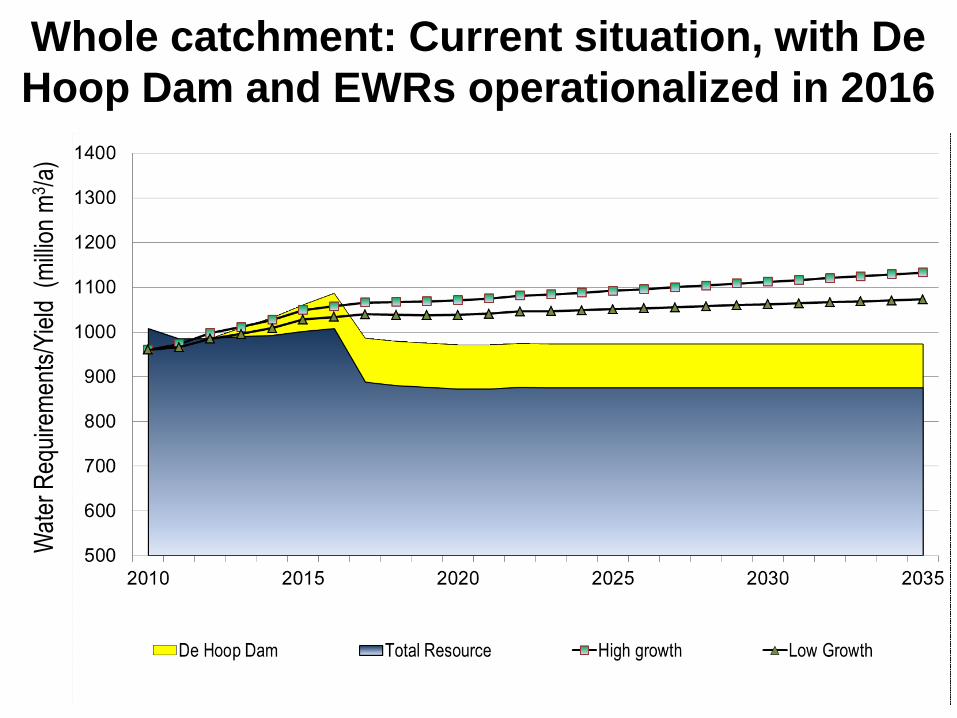
Whole catchment: Current situation, with De
Hoop Dam and EWRs operationalized in 2016 W
ater
Req
uire
men
ts/Y
ield
(m
illio
n m
3 /a)
117
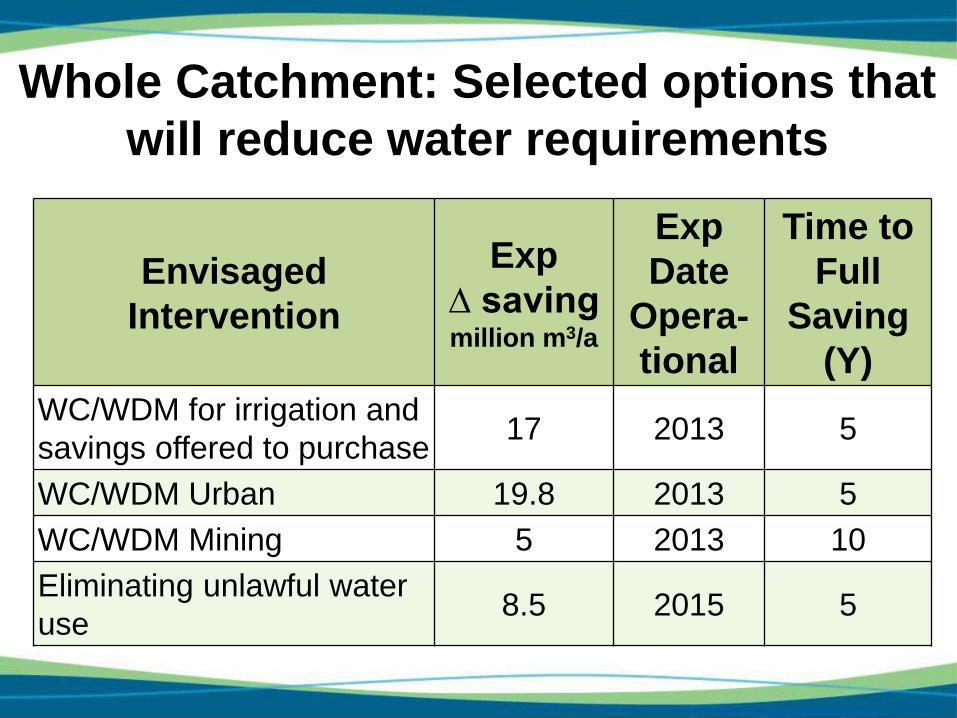
Whole Catchment: Selected options that
will reduce water requirements
Envisaged
Intervention
Exp
∆ saving million m3/a
Exp
Date
Opera-
tional
Time to
Full
Saving
(Y)
WC/WDM for irrigation and
savings offered to purchase 17 2013 5
WC/WDM Urban 19.8 2013 5
WC/WDM Mining 5 2013 10
Eliminating unlawful water
use 8.5 2015 5
118
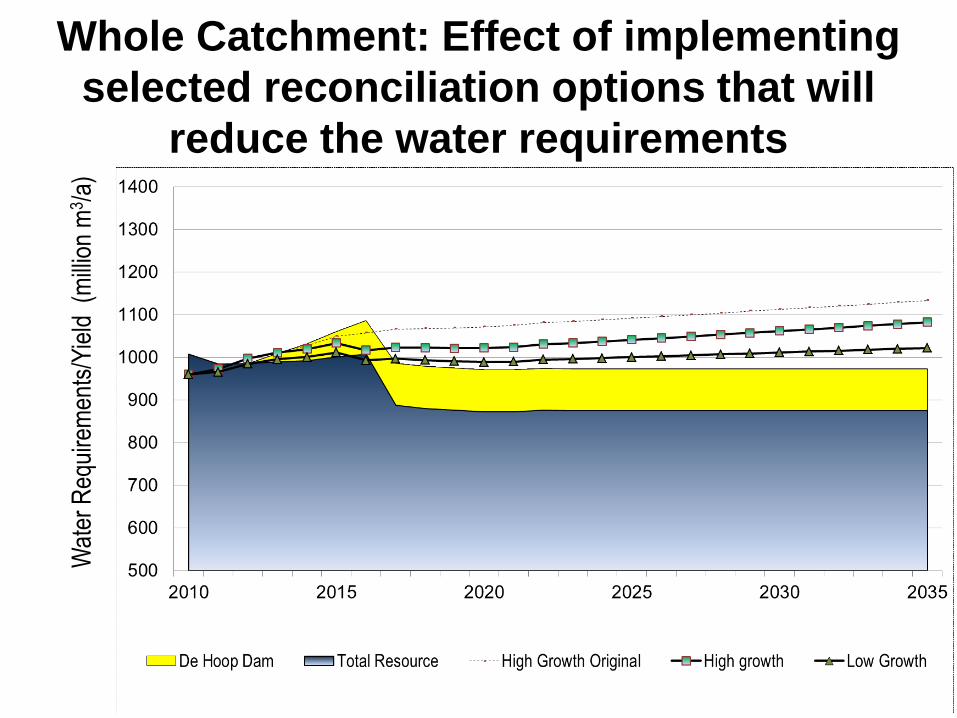
Whole Catchment: Effect of implementing
selected reconciliation options that will
reduce the water requirements
Wat
er R
equi
rem
ents
/Yie
ld (
mill
ion
m3 /
a)
119
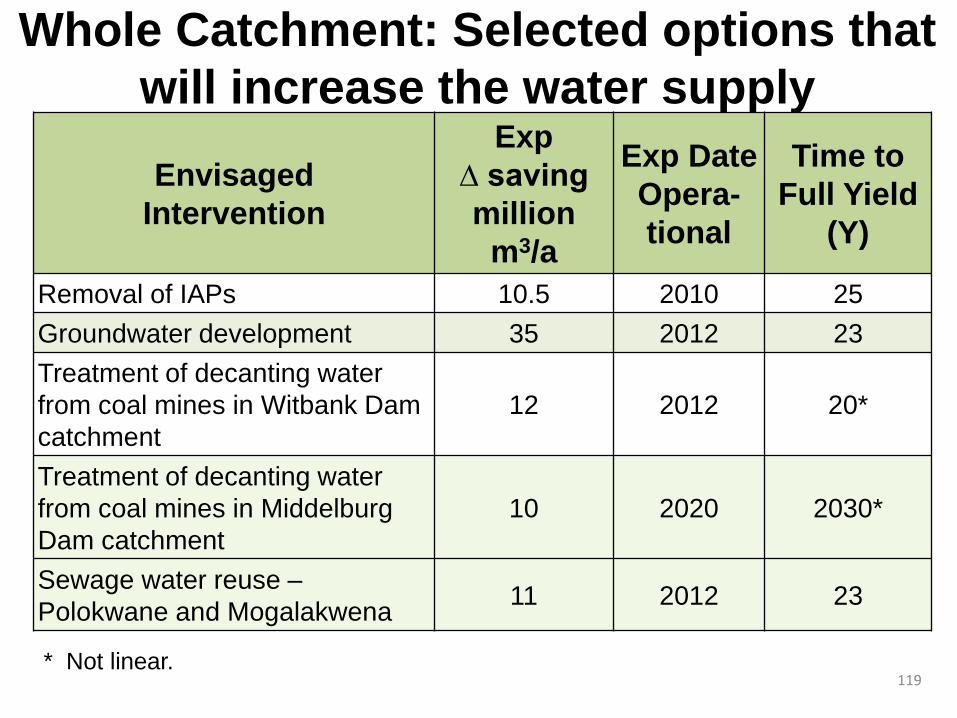
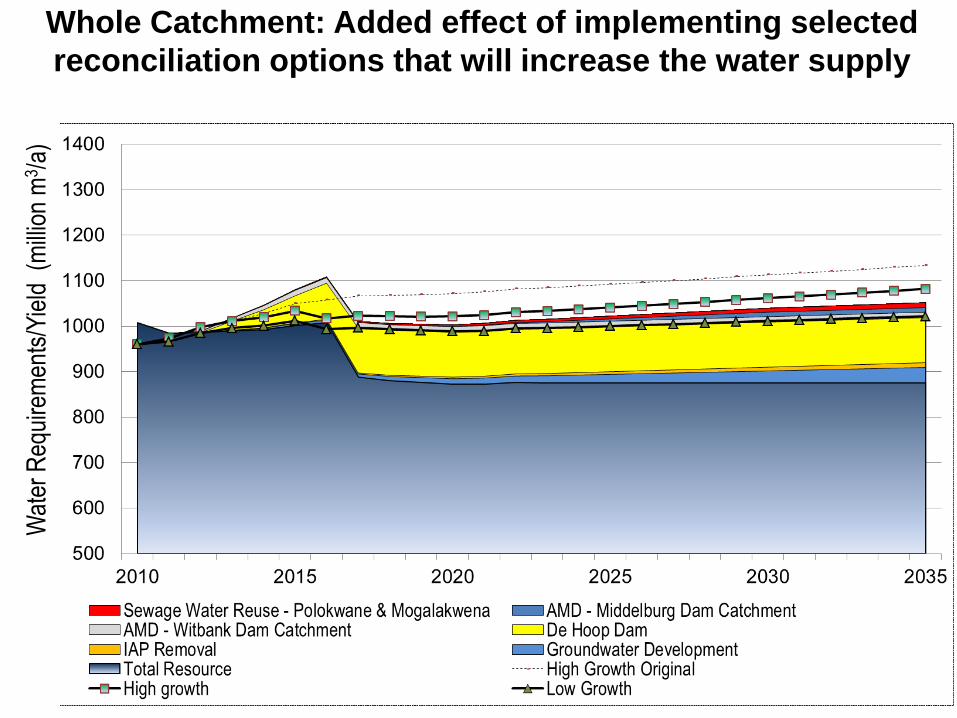
Whole Catchment: Selected options that
will increase the water supply
Envisaged
Intervention
Exp
∆ saving
million
m3/a
Exp Date
Opera-
tional
Time to
Full Yield
(Y)
Removal of IAPs 10.5 2010 25
Groundwater development 35 2012 23
Treatment of decanting water
from coal mines in Witbank Dam
catchment
12 2012 20*
Treatment of decanting water
from coal mines in Middelburg
Dam catchment
10 2020 2030*
Sewage water reuse –
Polokwane and Mogalakwena 11 2012 23
* Not linear.
120
Whole Catchment: Added effect of implementing selected
reconciliation options that will increase the water supply W
ater
Req
uire
men
ts/Y
ield
(m
illio
n m
3 /a)
121
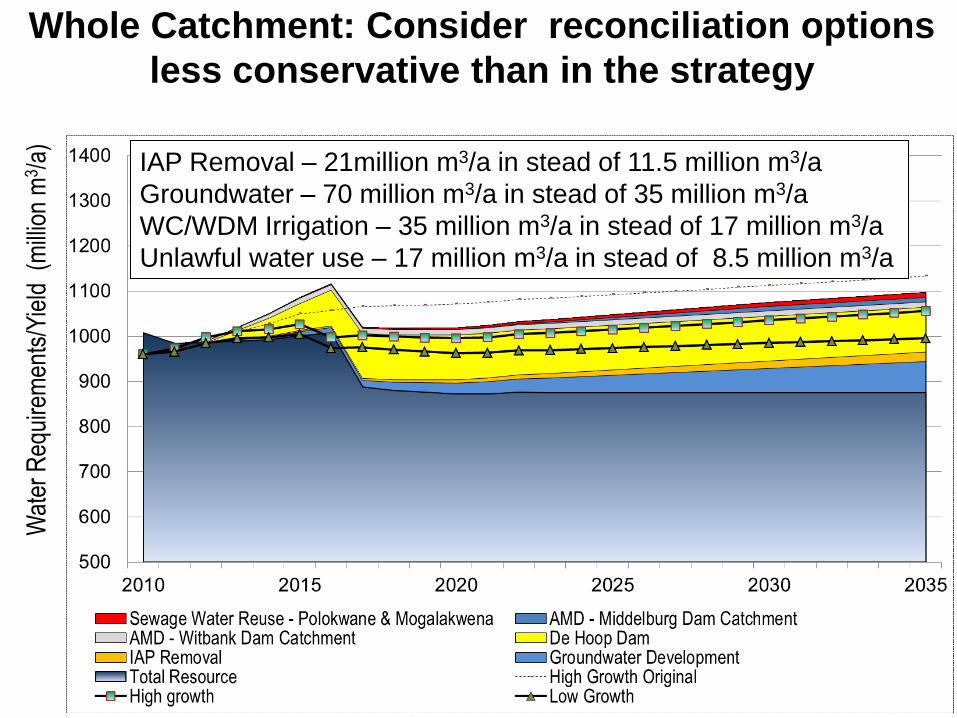
Whole Catchment: Consider reconciliation options
less conservative than in the strategy
IAP Removal – 21million m3/a in stead of 11.5 million m3/a
Groundwater – 70 million m3/a in stead of 35 million m3/a
WC/WDM Irrigation – 35 million m3/a in stead of 17 million m3/a
Unlawful water use – 17 million m3/a in stead of 8.5 million m3/a
Wat
er R
equi
rem
ents
/Yie
ld (
mill
ion
m3 /
a)
122
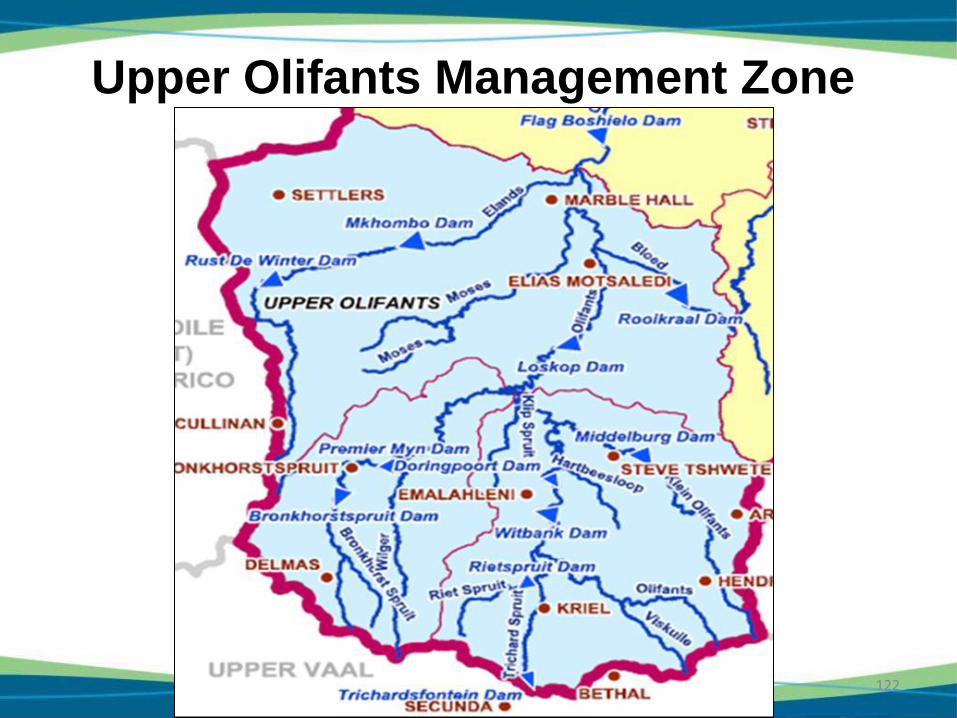
Upper Olifants Management Zone
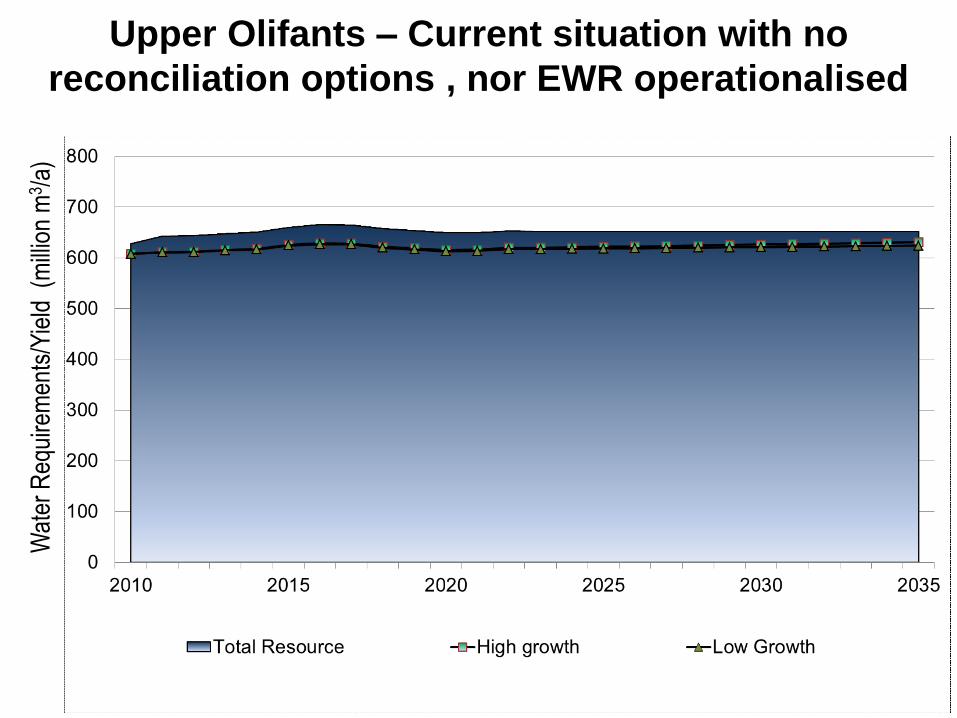
Upper Olifants – Current situation with no
reconciliation options , nor EWR operationalised
123
Wat
er R
equi
rem
ents
/Yie
ld (
mill
ion
m3 /
a)
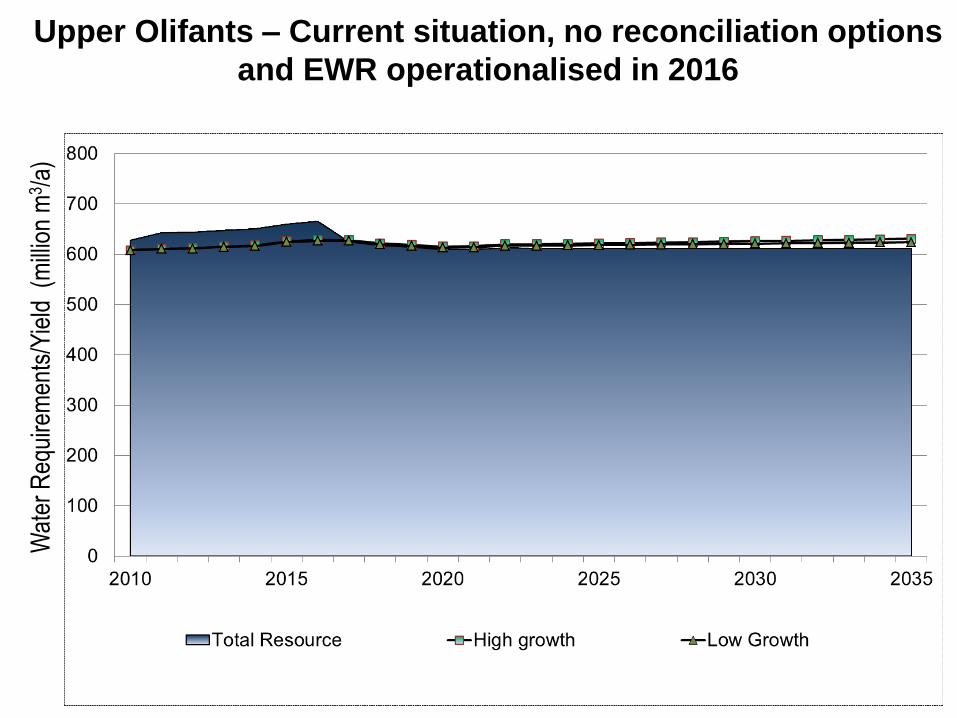
Upper Olifants – Current situation, no reconciliation options
and EWR operationalised in 2016
124
Wat
er R
equi
rem
ents
/Yie
ld (
mill
ion
m3 /
a)
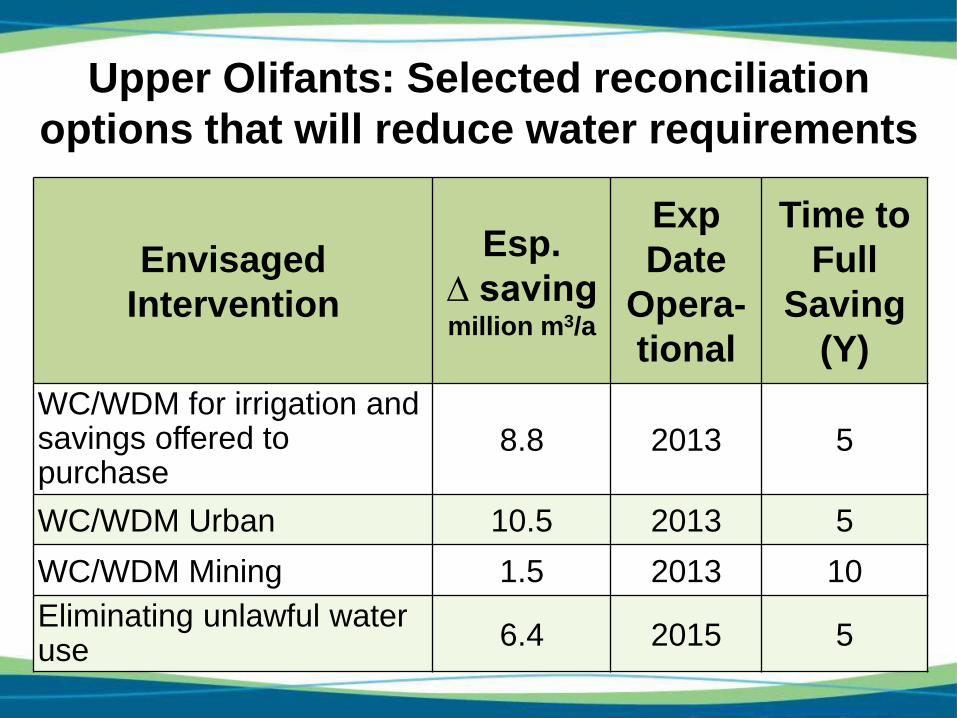
125
Envisaged
Intervention
Esp.
∆ saving million m3/a
Exp
Date
Opera-
tional
Time to
Full
Saving
(Y)
WC/WDM for irrigation and savings offered to purchase
8.8 2013 5
WC/WDM Urban 10.5 2013 5
WC/WDM Mining 1.5 2013 10
Eliminating unlawful water use
6.4 2015 5
Upper Olifants: Selected reconciliation
options that will reduce water requirements
126
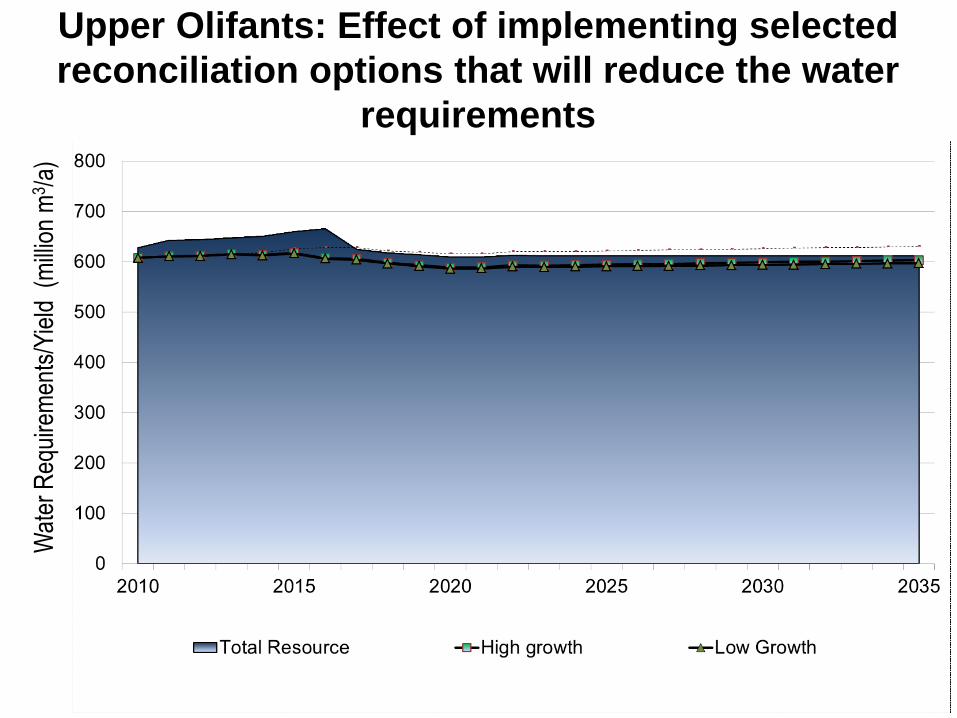
Upper Olifants: Effect of implementing selected
reconciliation options that will reduce the water
requirements
Wat
er R
equi
rem
ents
/Yie
ld (
mill
ion
m3 /
a)
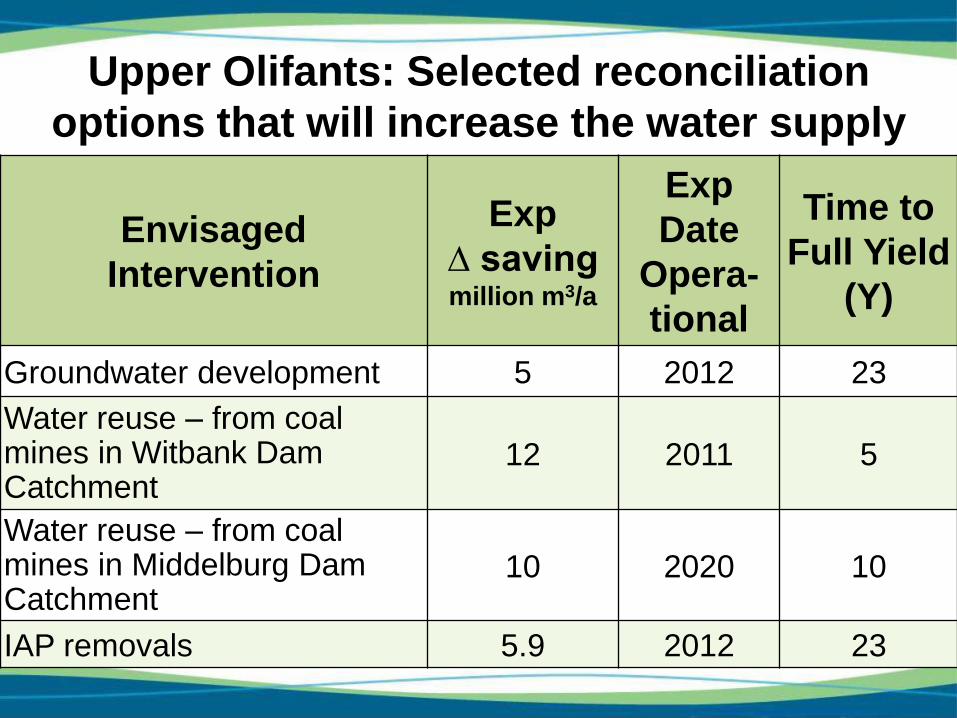
127
Envisaged
Intervention
Exp
∆ saving million m3/a
Exp
Date
Opera-
tional
Time to
Full Yield
(Y)
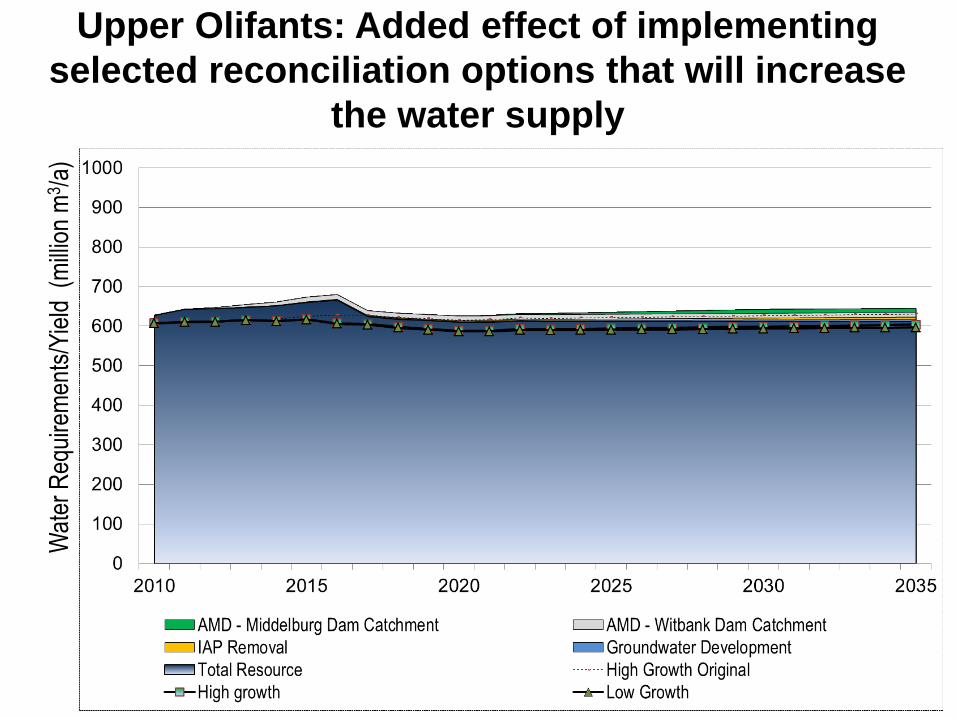
Groundwater development 5 2012 23
Water reuse – from coal mines in Witbank Dam Catchment
12 2011 5
Water reuse – from coal mines in Middelburg Dam Catchment
10 2020 10
IAP removals 5.9 2012 23
Upper Olifants: Selected reconciliation
options that will increase the water supply
128
Upper Olifants: Added effect of implementing
selected reconciliation options that will increase
the water supply
Wat
er R
equi
rem
ents
/Yie
ld (
mill
ion
m3 /
a)
129
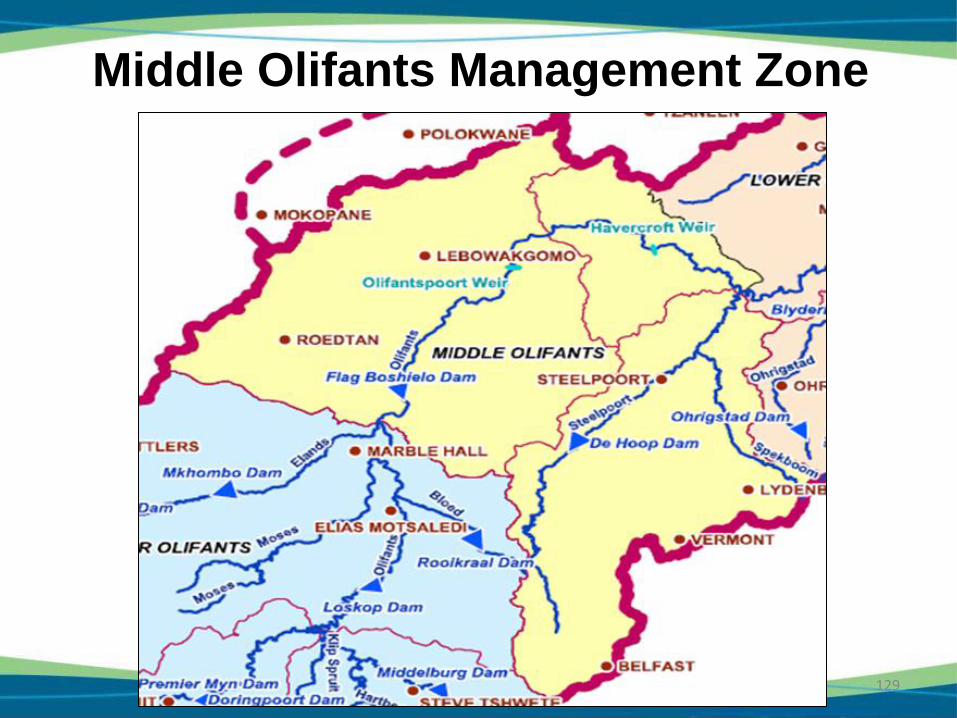
Middle Olifants Management Zone
130
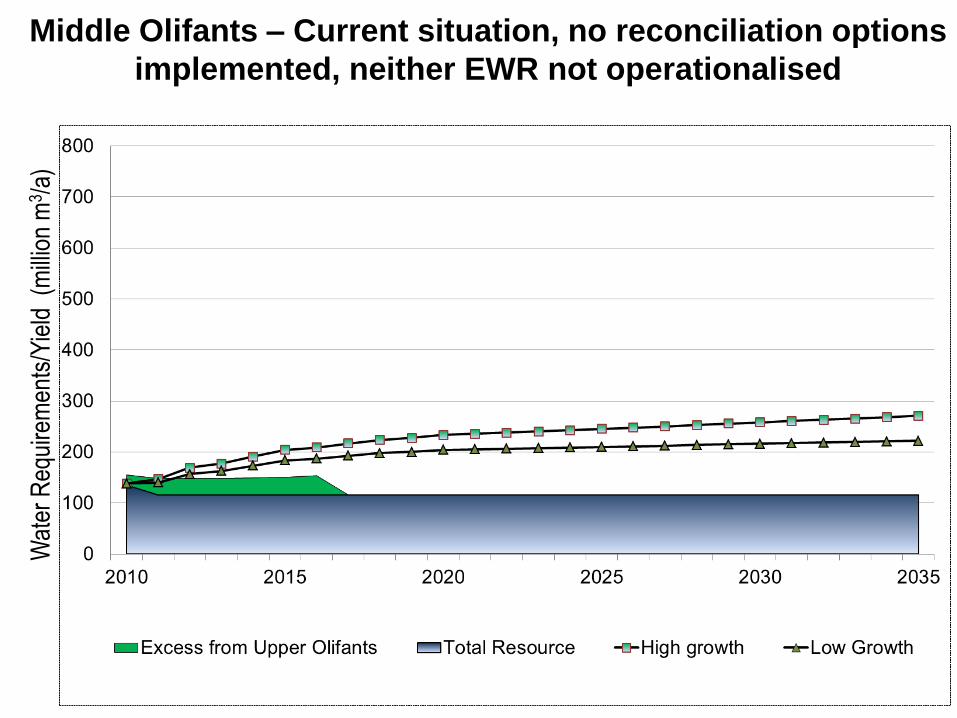
Middle Olifants – Current situation, no reconciliation options
implemented, neither EWR not operationalised W
ater
Req
uire
men
ts/Y
ield
(m
illio
n m
3 /a)
131
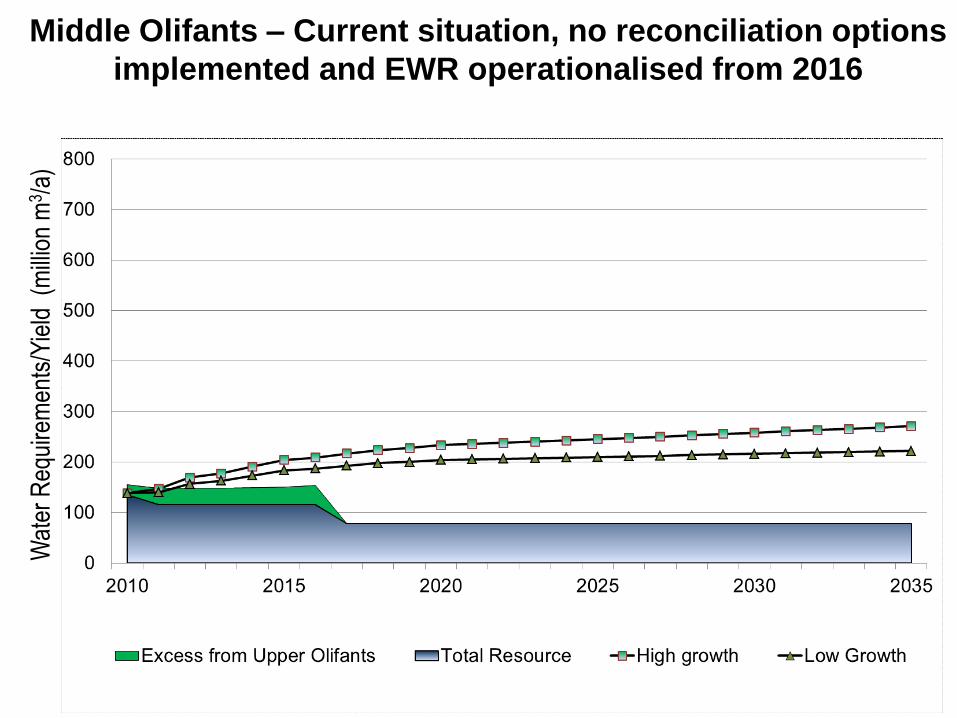
Middle Olifants – Current situation, no reconciliation options
implemented and EWR operationalised from 2016 W
ater
Req
uire
men
ts/Y
ield
(m
illio
n m
3 /a)
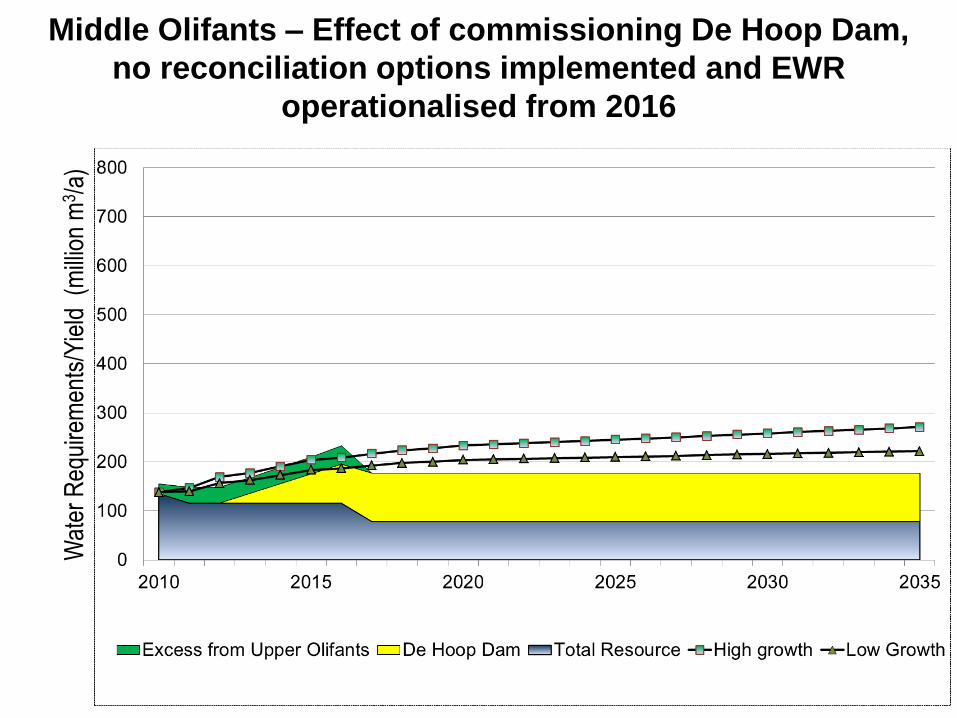
132
Middle Olifants – Effect of commissioning De Hoop Dam,
no reconciliation options implemented and EWR
operationalised from 2016 W
ater
Req
uire
men
ts/Y
ield
(m
illio
n m
3 /a)
133
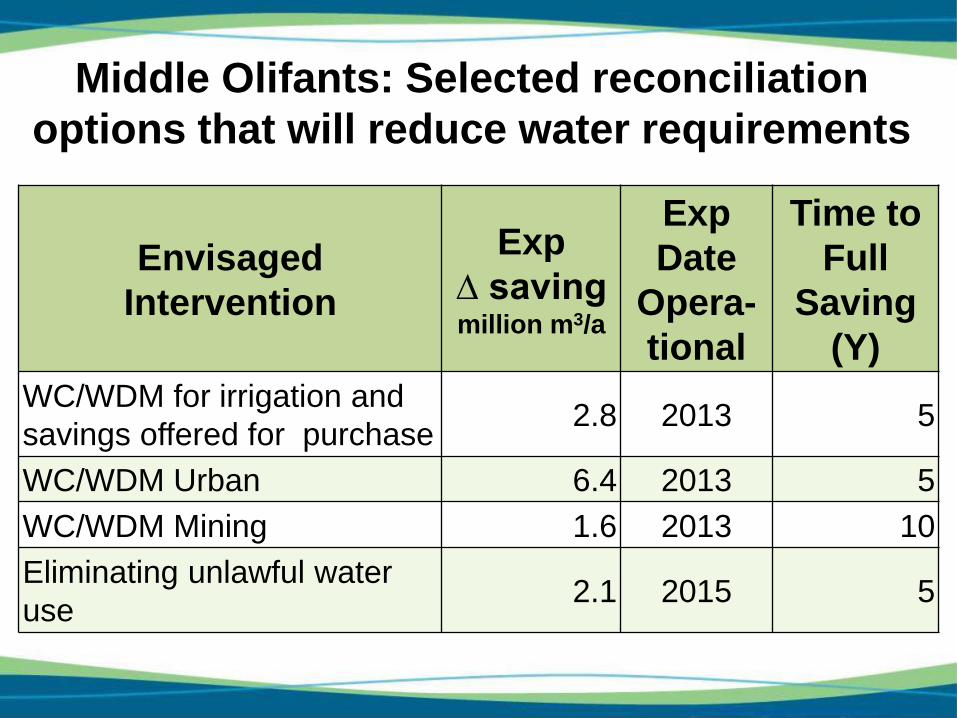
Envisaged
Intervention
Exp
∆ saving million m3/a
Exp
Date
Opera-
tional
Time to
Full
Saving
(Y)
WC/WDM for irrigation and
savings offered for purchase 2.8 2013 5
WC/WDM Urban 6.4 2013 5
WC/WDM Mining 1.6 2013 10
Eliminating unlawful water
use 2.1 2015 5
Middle Olifants: Selected reconciliation
options that will reduce water requirements
134
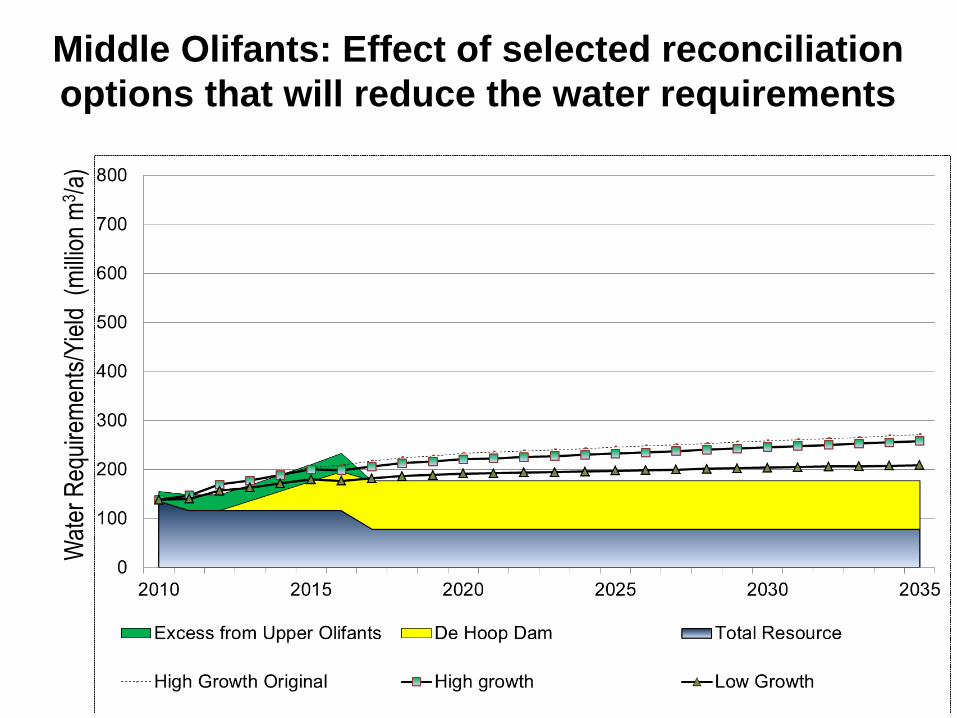
Middle Olifants: Effect of selected reconciliation
options that will reduce the water requirements W
ater
Req
uire
men
ts/Y
ield
(m
illio
n m
3 /a)
135
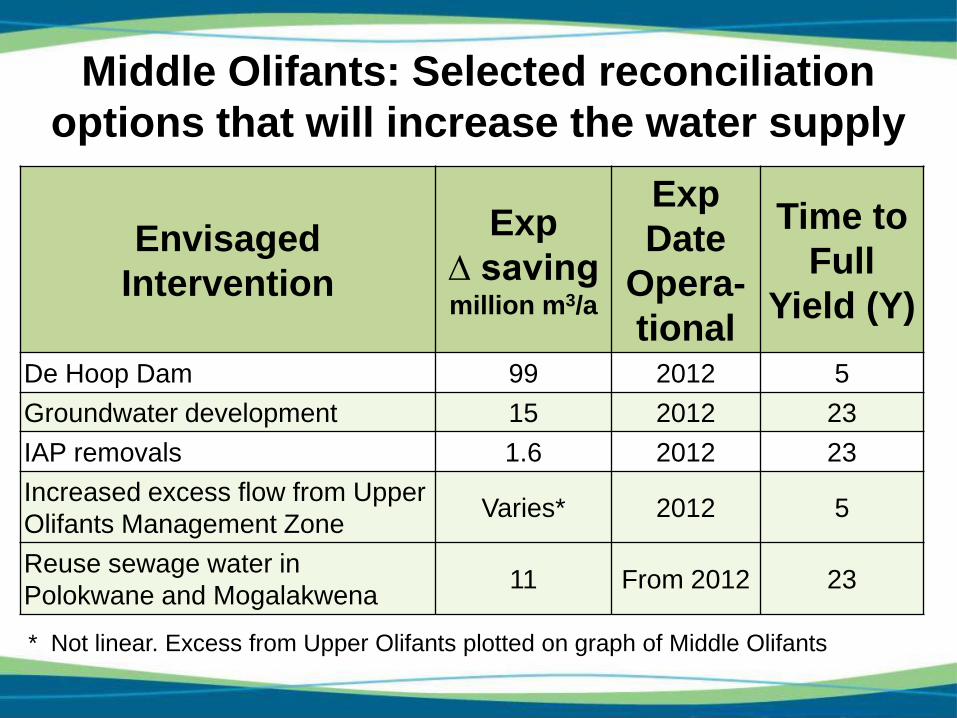
Envisaged
Intervention
Exp
∆ saving million m3/a
Exp
Date
Opera-
tional
Time to
Full
Yield (Y)
De Hoop Dam 99 2012 5
Groundwater development 15 2012 23
IAP removals 1.6 2012 23
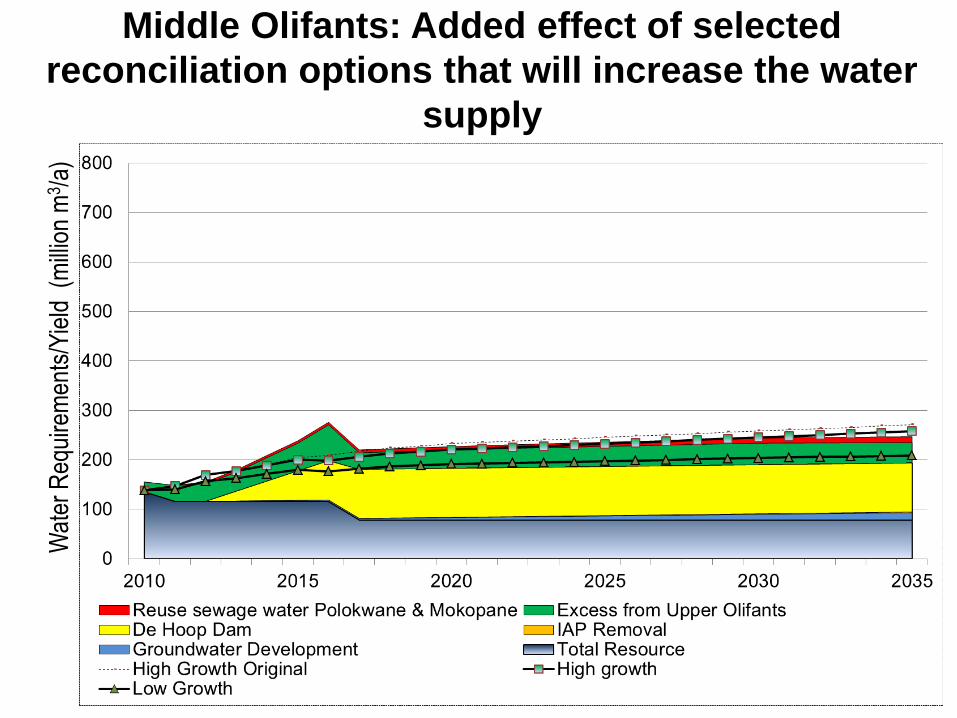
Increased excess flow from Upper
Olifants Management Zone Varies* 2012 5
Reuse sewage water in
Polokwane and Mogalakwena 11 From 2012 23
* Not linear. Excess from Upper Olifants plotted on graph of Middle Olifants
Middle Olifants: Selected reconciliation
options that will increase the water supply
136
Middle Olifants: Added effect of selected
reconciliation options that will increase the water
supply
Wat
er R
equi
rem
ents
/Yie
ld (
mill
ion
m3 /
a)
Concerns On Middle Olifants
• Will there be enough water available from the
Steelpoort Sub-catchment to supply all the
demands in the Middle Olifants as envisaged in the
ORWRDP ?
• With the proposed ORWRDP Phase 2B (pipeline
to Mokopane from Flag Boshielo Dam), will there
be water shortages in Flag Boshielo Dam and
Olifants River Main Stem in the Middle Olifants?
137
138
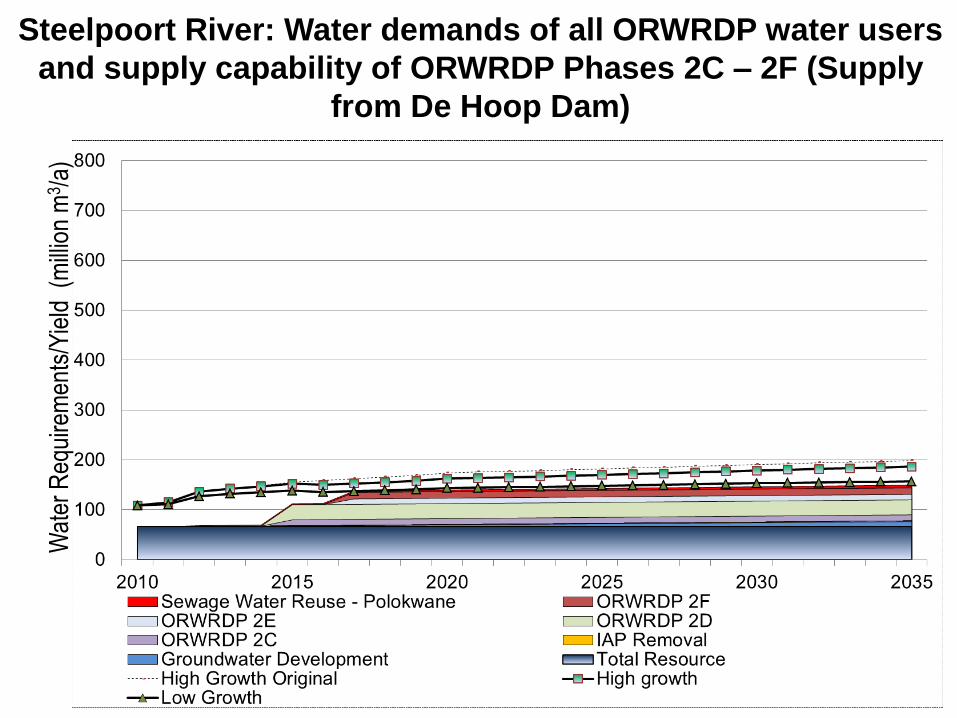
Steelpoort River: Water demands of all ORWRDP water users
and supply capability of ORWRDP Phases 2C – 2F (Supply
from De Hoop Dam)
Wat
er R
equi
rem
ents
/Yie
ld (
mill
ion
m3 /
a)
Conclusion – Supply from De Hoop Dam
• All water requirements earmarked for supply from
De Hoop Dam cannot be met
• Flag Boshielo Dam must continue to supply water
to certain areas
• Question: Will there then be shortfalls on the
Olifants Main Stem in the Middle Olifants
Management Zone?
139
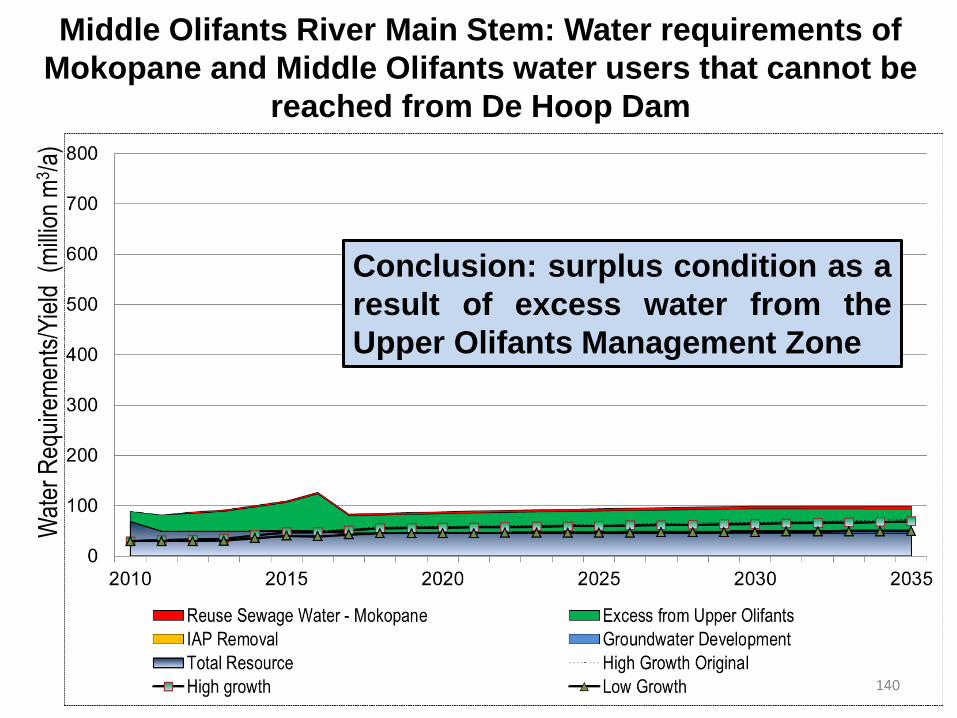
140
Middle Olifants River Main Stem: Water requirements of
Mokopane and Middle Olifants water users that cannot be
reached from De Hoop Dam
Conclusion: surplus condition as a
result of excess water from the
Upper Olifants Management Zone
Wat
er R
equi
rem
ents
/Yie
ld (
mill
ion
m3 /
a)
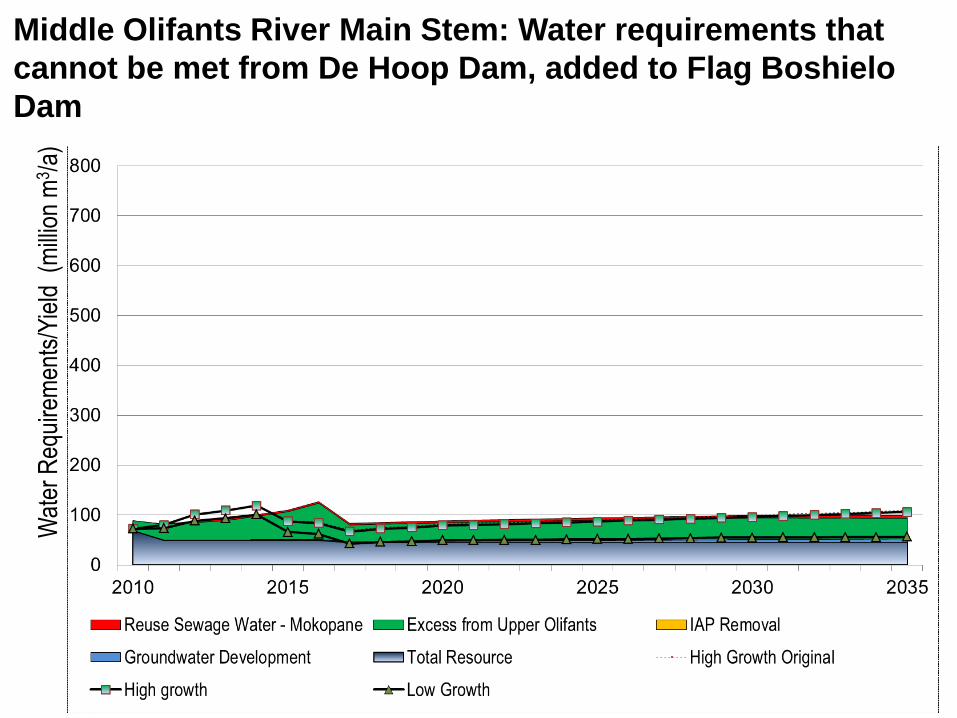
141
Middle Olifants River Main Stem: Water requirements that
cannot be met from De Hoop Dam, added to Flag Boshielo
Dam
Wat
er R
equi
rem
ents
/Yie
ld (
mill
ion
m3 /
a)
Conclusions Middle Olifants
• Slight deficits can be expected during the period 2012 to
2014 (As a result of the difference in assumed linear 5y for
De Hoop Dam for reaching its full yield and the expected
completion dates of the ORWRDP Phases 2C-2F)
• The early deficits will not necessarily occur (modelling
based on 1:50 y chance of failure). If required they can
possibly be resolved through the temporary transfers of
water entitlements (water trading).
142
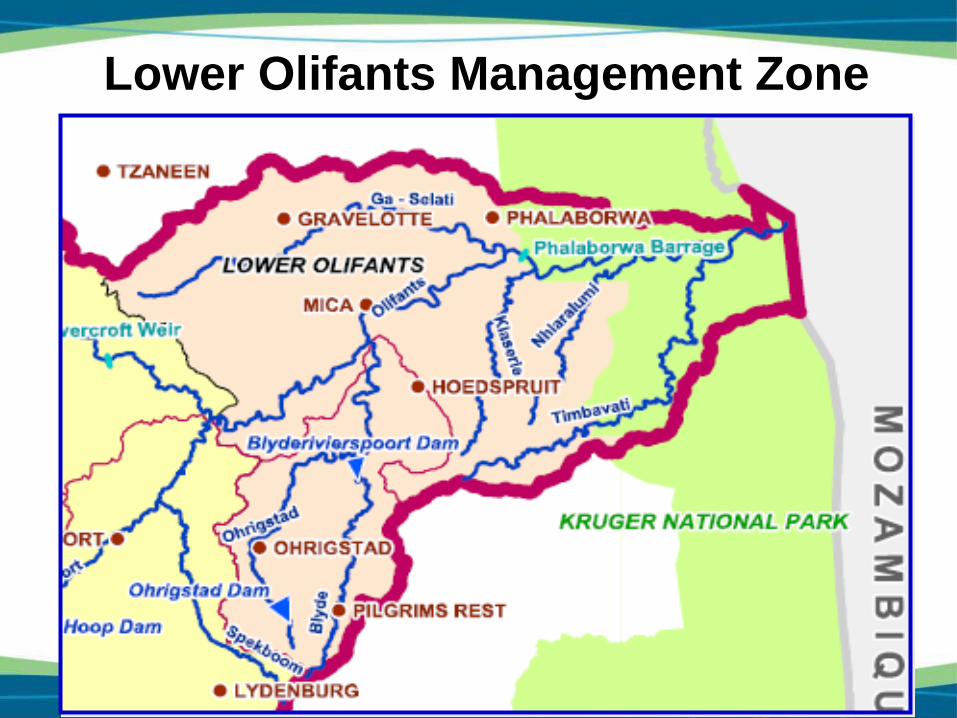
143
Lower Olifants Management Zone
144
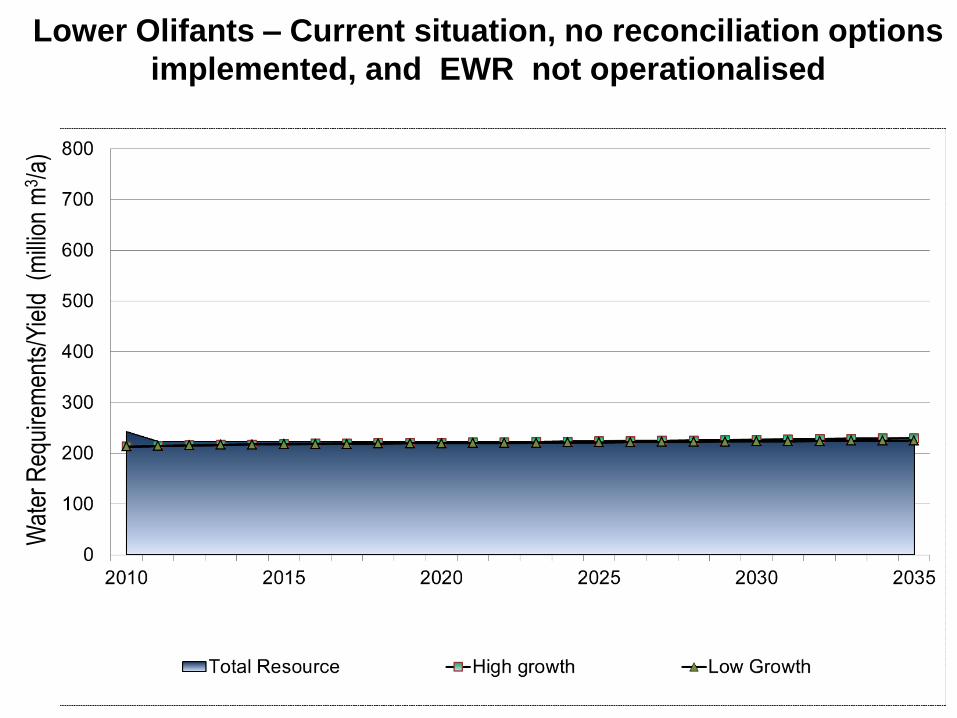
Lower Olifants – Current situation, no reconciliation options
implemented, and EWR not operationalised W
ater
Req
uire
men
ts/Y
ield
(m
illio
n m
3 /a)
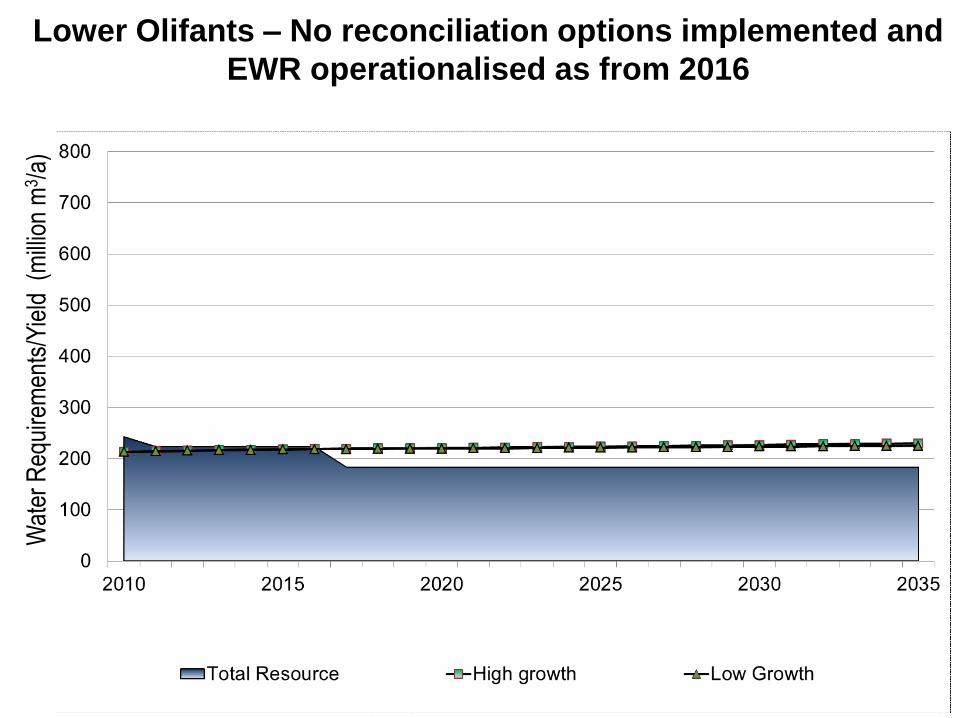
145
Lower Olifants – No reconciliation options implemented and
EWR operationalised as from 2016 W
ater
Req
uire
men
ts/Y
ield
(m
illio
n m
3 /a)
146
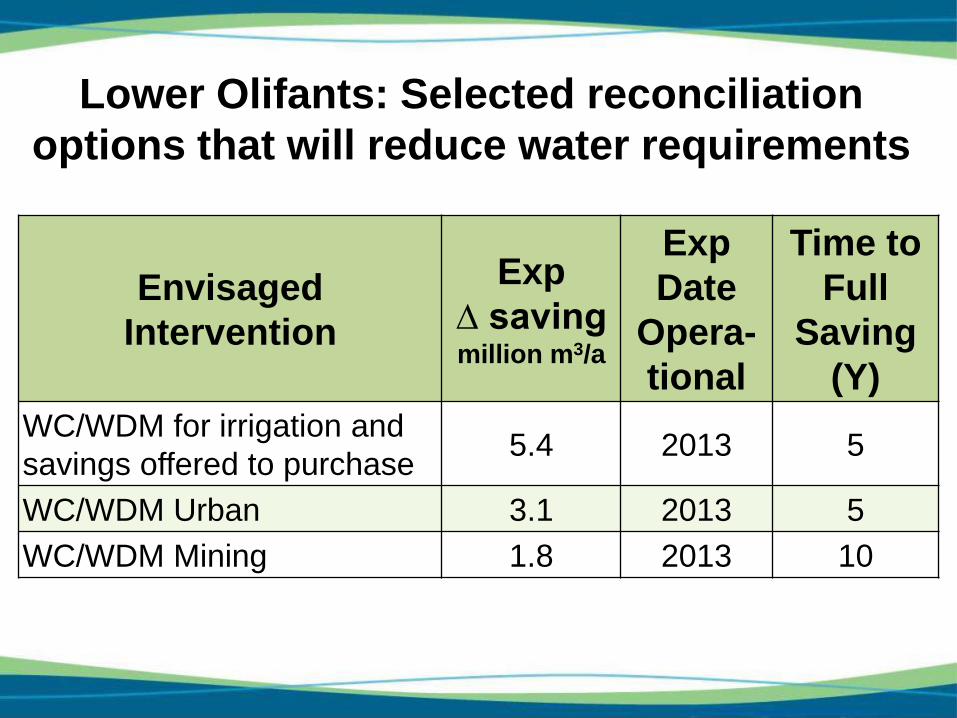
Envisaged
Intervention
Exp
∆ saving million m3/a
Exp
Date
Opera-
tional
Time to
Full
Saving
(Y)
WC/WDM for irrigation and
savings offered to purchase 5.4 2013 5
WC/WDM Urban 3.1 2013 5
WC/WDM Mining 1.8 2013 10
Lower Olifants: Selected reconciliation
options that will reduce water requirements
147
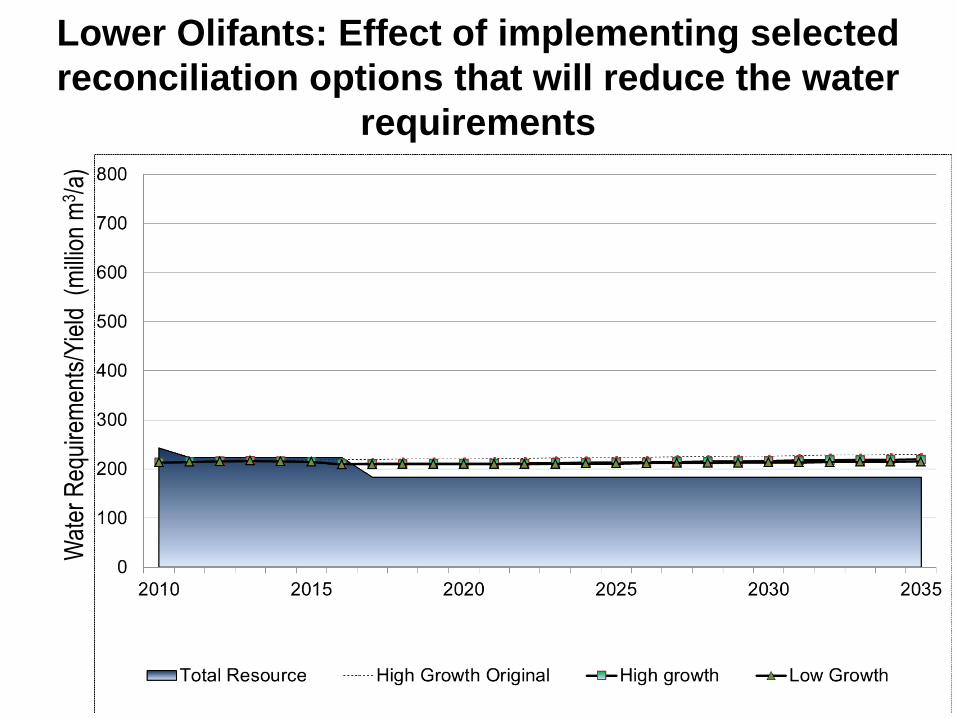
Lower Olifants: Effect of implementing selected
reconciliation options that will reduce the water
requirements
Wat
er R
equi
rem
ents
/Yie
ld (
mill
ion
m3 /
a)
148
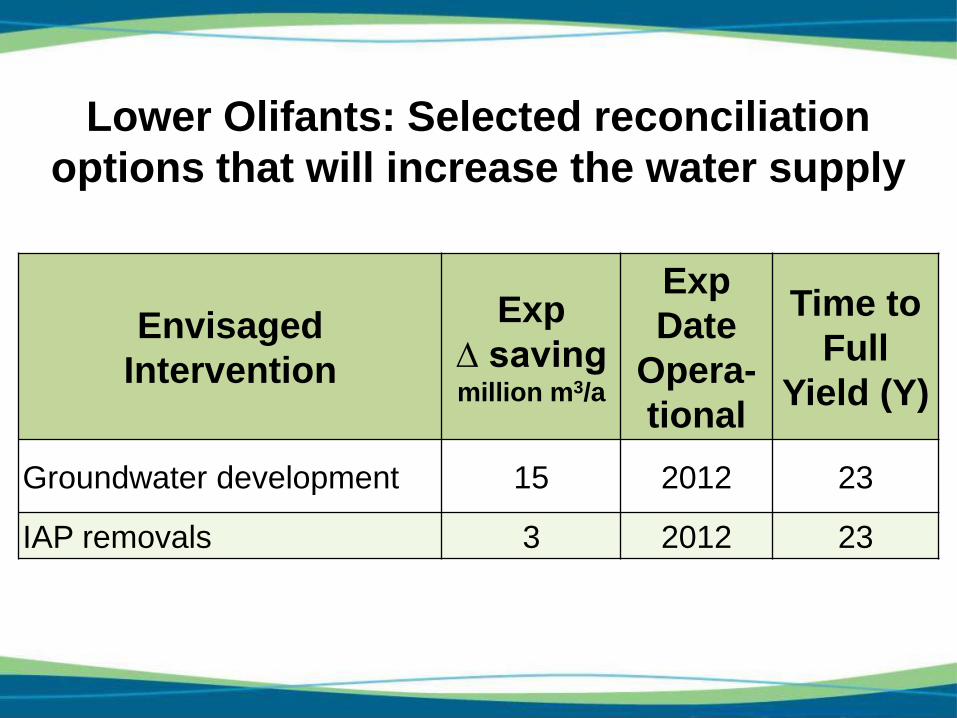
Envisaged
Intervention
Exp
∆ saving million m3/a
Exp
Date
Opera-
tional
Time to
Full
Yield (Y)
Groundwater development 15 2012 23
IAP removals 3 2012 23
Lower Olifants: Selected reconciliation
options that will increase the water supply
149
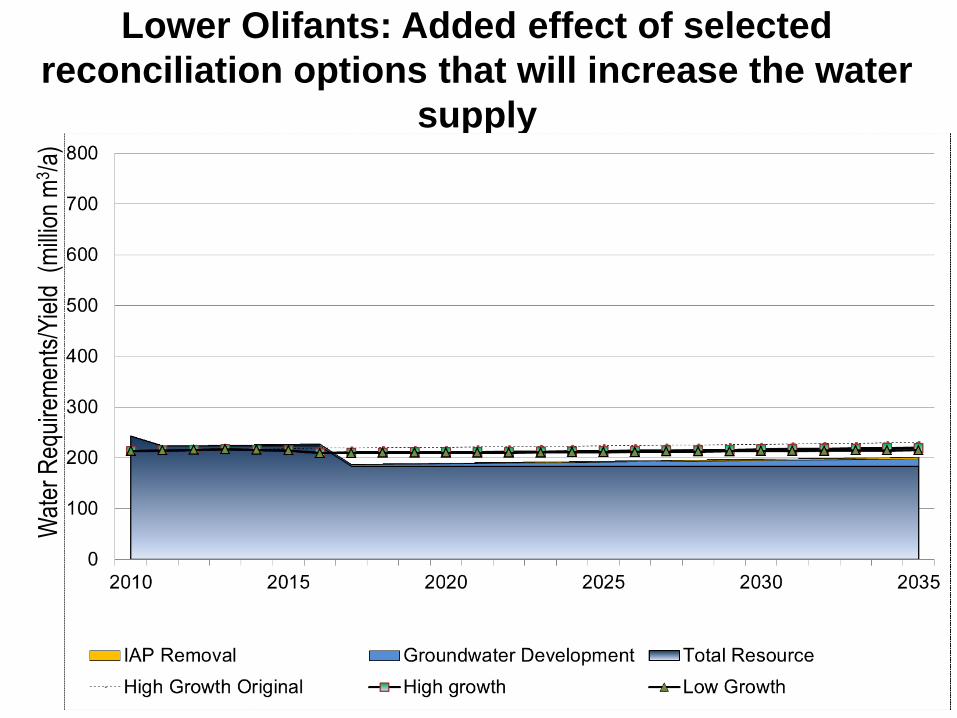
Lower Olifants: Added effect of selected
reconciliation options that will increase the water
supply
Wat
er R
equi
rem
ents
/Yie
ld (
mill
ion
m3 /
a)
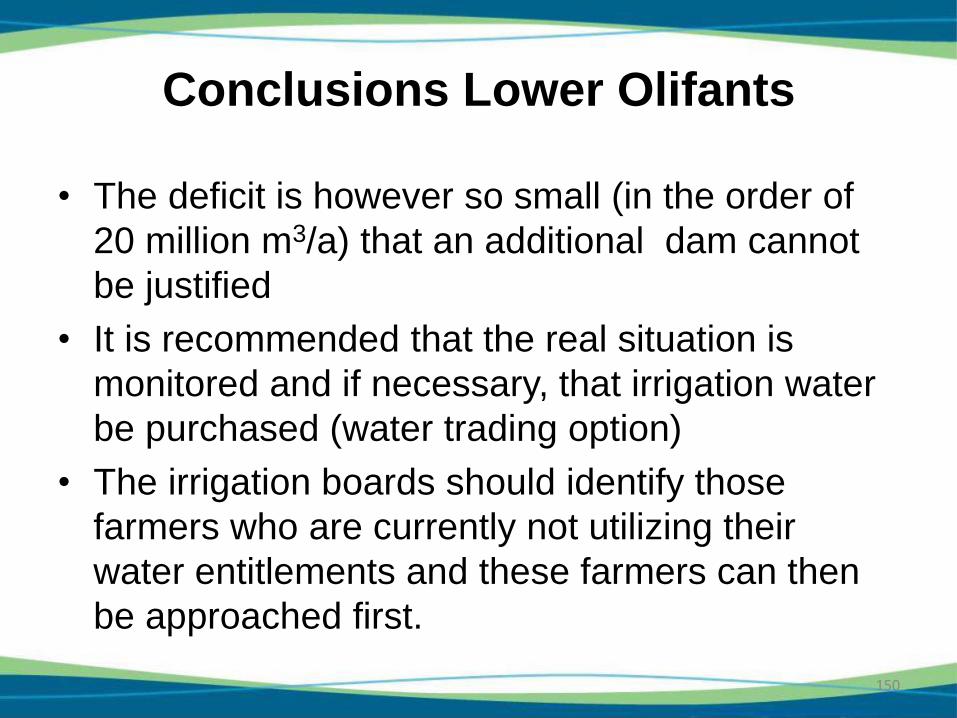
• The deficit is however so small (in the order of
20 million m3/a) that an additional dam cannot
be justified
• It is recommended that the real situation is
monitored and if necessary, that irrigation water
be purchased (water trading option)
• The irrigation boards should identify those
farmers who are currently not utilizing their
water entitlements and these farmers can then
be approached first.
150
Conclusions Lower Olifants
151
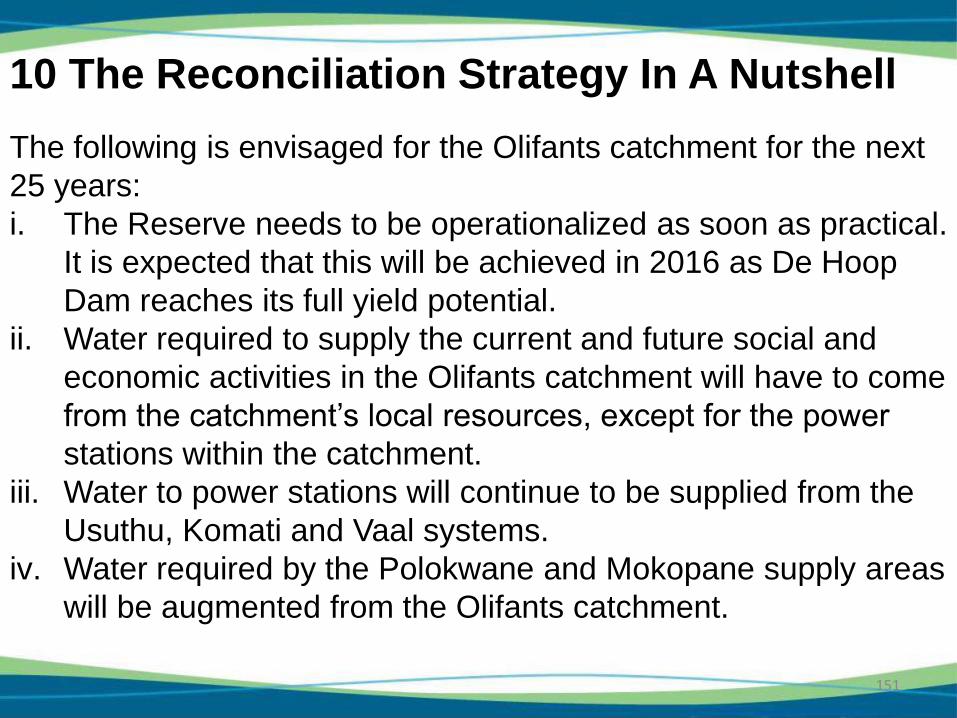
10 The Reconciliation Strategy In A Nutshell
The following is envisaged for the Olifants catchment for the next
25 years:
i. The Reserve needs to be operationalized as soon as practical.
It is expected that this will be achieved in 2016 as De Hoop
Dam reaches its full yield potential.
ii. Water required to supply the current and future social and
economic activities in the Olifants catchment will have to come
from the catchment’s local resources, except for the power
stations within the catchment.
iii. Water to power stations will continue to be supplied from the
Usuthu, Komati and Vaal systems.
iv. Water required by the Polokwane and Mokopane supply areas
will be augmented from the Olifants catchment.
152
The Reconciliation Strategy In A Nutshell
(Continued)
v. Water requirements can be balanced by availability through
the implementation of the following measures:
• Eliminating unlawful water use. The target date for the
majority of transgressions to be addressed is 2018, after
which compliance monitoring and enforcement will remain
an on-going activity.
• Introducing water conservation and water demand
management (WC/WDM) in all sectors. Full water savings
need to be achieved within five years in the irrigation and
urban water use sectors, and within 10 years in the mining
sector.
153
The Reconciliation Strategy In A Nutshell
(Continued)
v. Water requirements can be balanced by availability through
the implementation of the following measures:
• The introduction of a mechanism whereby water saved
through water use efficiency (WUE) measures, especially in
agriculture, can be traded back into the market. This means
that water users will be in a position to sell their water
savings, and not necessarily use this water to expand
horizontally.
• The treatment of acid mine drainage water to an acceptable
standard, either for immediate direct use or before it is
allowed to decant into the river system.
154
The Reconciliation Strategy In A Nutshell
(Continued)
v. Water requirements can be balanced by availability through
the implementation of the following measures:
• Invasive alien plants must be removed. Working for Water
programmes must be accelerated to ensure that at least
50% of infested areas, plus all new growth, is eradicated by
2035.
• Groundwater resources must be developed as a priority.
The Malmani dolomites must be investigated as a possible
resource for a regional water supply scheme.
• Return flows from Polokwane and Mokopane should be
reused by the urban or mining sector.
155
The Reconciliation Strategy In A Nutshell
(Continued)
vi. All above measures lean more towards management
interventions rather than development interventions. An
orchestrated effort is necessary to ensure that objectives are
achieved. If these implementation measures are not
successful as assumed, in spite of the fact that the assumed
measures are conservative, the water will have to be
reallocated to other use by means of compulsory licensing or
by buying out water entitlements in respect of low value
irrigation.
156
11 Risks And Uncertainties
9 Risks and uncertainties are listed in the strategy
report. A few crucial ones are listed below.
• Extent of unlawful water use. Best estimates will have to
suffice until V&V process is complete
• Success of purchasing WC/WDM savings is difficult to
predict. A well structured policy is urgently needed.
• Cooperation of WMIs, Local Authorities and mining
companies
• Successful implementation of the strategy holds a
significant risk if the establishment of the CMA is further
delayed
12 Implementation Arrangements
Role of NWRP in DWA:
• DWA is the trustee of the country’s water
resources
• Are facilitating the process of water
reconciliation planning
Implementation responsibility:
• All water users, water user institutions, and
water related management institutions
157
Implementation Arrangements (Continued)
Implementing institutions:
• DWA Regions
• CMA
• ESKOM
• Mines
• Industries
• Municipalities
• Water Boards
• Irrigation Boards and Water User Associations
• Nature conservation institutions (e.g. SA National Parks)
158
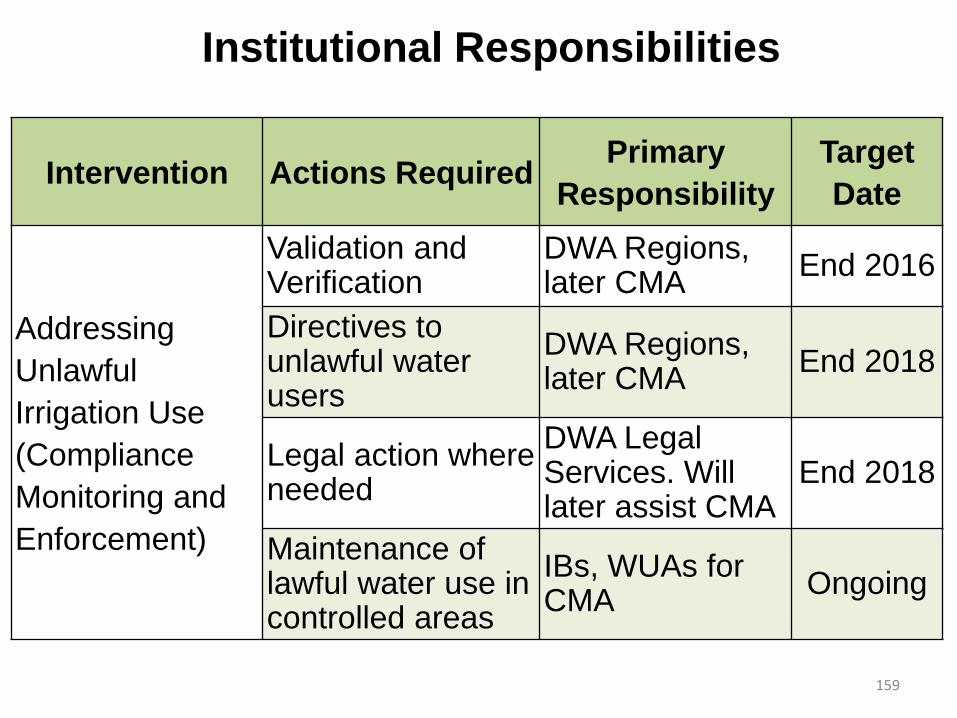
Institutional Responsibilities
159
Intervention Actions Required Primary
Responsibility
Target
Date
Addressing
Unlawful
Irrigation Use
(Compliance
Monitoring and
Enforcement)
Validation and Verification
DWA Regions, later CMA
End 2016
Directives to unlawful water users
DWA Regions, later CMA
End 2018
Legal action where needed
DWA Legal Services. Will later assist CMA
End 2018
Maintenance of lawful water use in controlled areas
IBs, WUAs for CMA
Ongoing
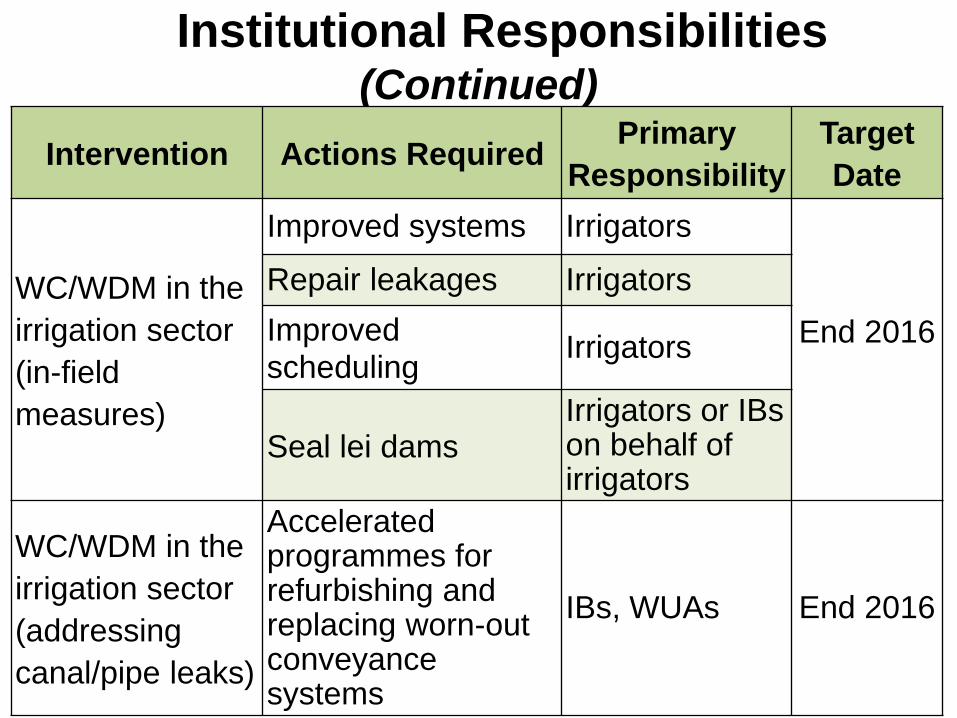
Institutional Responsibilities (Continued)
160
Intervention Actions Required Primary
Responsibility
Target
Date
WC/WDM in the
irrigation sector
(in-field
measures)
Improved systems Irrigators
End 2016
Repair leakages Irrigators
Improved scheduling
Irrigators
Seal lei dams Irrigators or IBs on behalf of irrigators
WC/WDM in the
irrigation sector
(addressing
canal/pipe leaks)
Accelerated programmes for refurbishing and replacing worn-out conveyance systems
IBs, WUAs End 2016
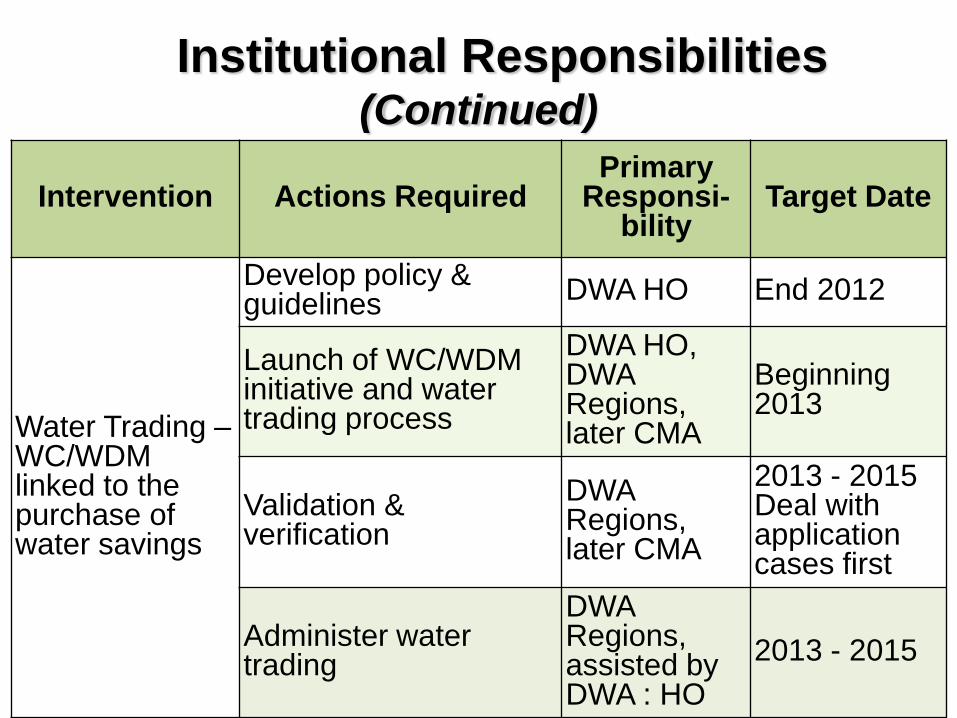
161
Intervention Actions Required Primary
Responsi-bility
Target Date
Water Trading – WC/WDM linked to the purchase of water savings
Develop policy & guidelines
DWA HO End 2012
Launch of WC/WDM initiative and water trading process
DWA HO, DWA Regions, later CMA
Beginning 2013
Validation & verification
DWA Regions, later CMA
2013 - 2015 Deal with application cases first
Administer water trading
DWA Regions, assisted by DWA : HO
2013 - 2015
Institutional Responsibilities (Continued)
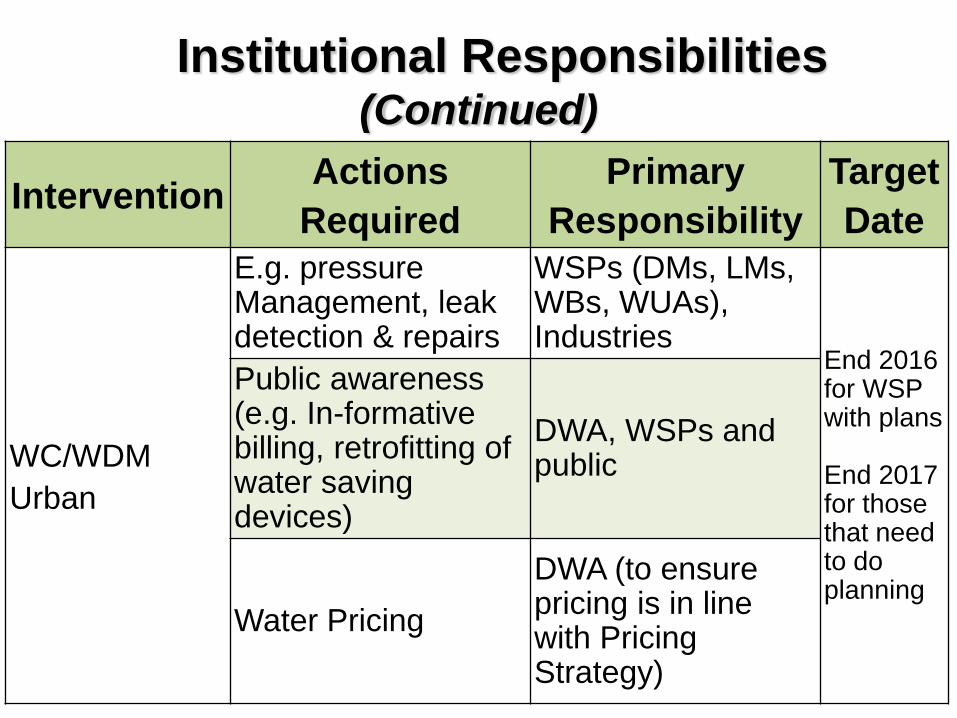
162
Intervention Actions
Required
Primary
Responsibility
Target
Date
WC/WDM
Urban
E.g. pressure Management, leak detection & repairs
WSPs (DMs, LMs, WBs, WUAs), Industries
End 2016 for WSP with plans End 2017 for those that need to do planning
Public awareness (e.g. In-formative billing, retrofitting of water saving devices)
DWA, WSPs and public
Water Pricing
DWA (to ensure pricing is in line with Pricing Strategy)
Institutional Responsibilities (Continued)
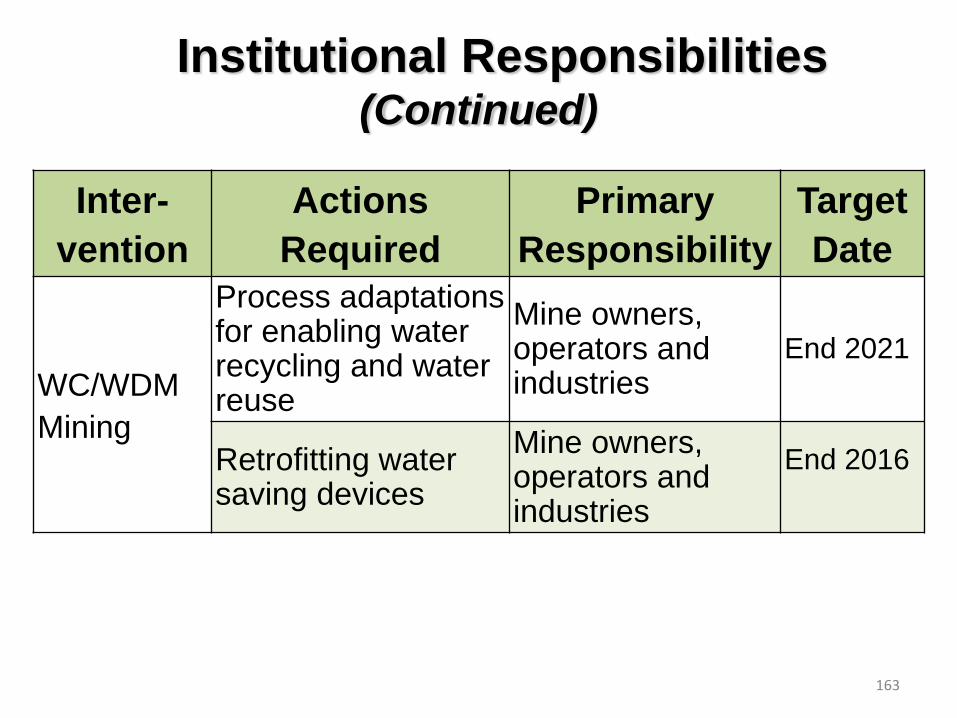
163
Inter-
vention
Actions
Required
Primary
Responsibility
Target
Date
WC/WDM
Mining
Process adaptations for enabling water recycling and water reuse
Mine owners, operators and industries
End 2021
Retrofitting water saving devices
Mine owners, operators and industries
End 2016
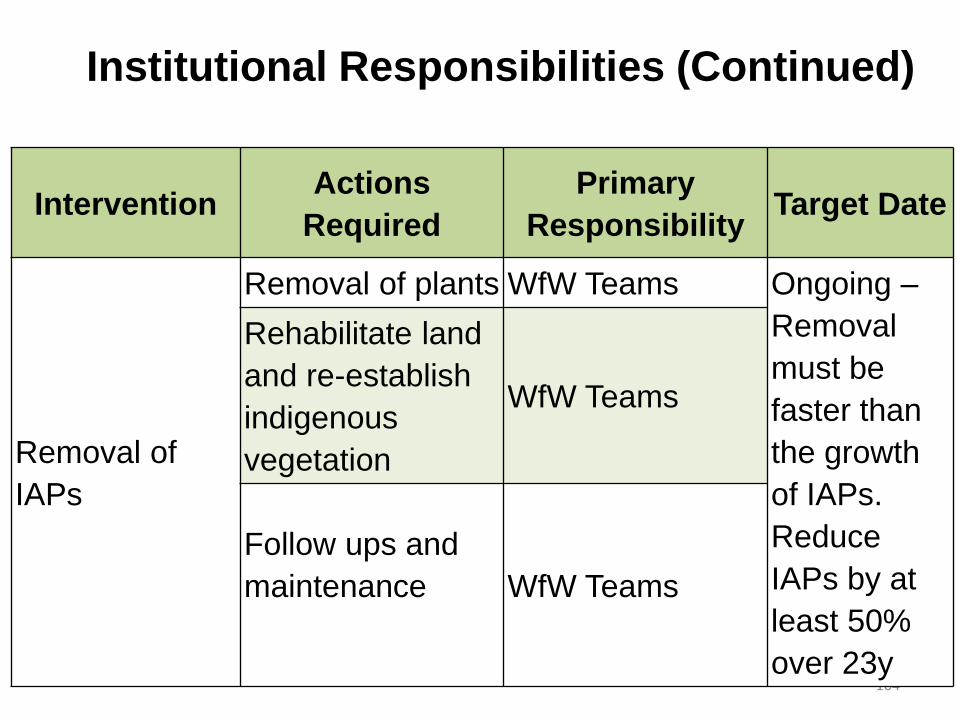
Institutional Responsibilities (Continued)
164
Intervention Actions
Required
Primary
Responsibility Target Date
Removal of
IAPs
Removal of plants WfW Teams Ongoing –
Removal
must be
faster than
the growth
of IAPs.
Reduce
IAPs by at
least 50%
over 23y
Rehabilitate land
and re-establish
indigenous
vegetation
WfW Teams
Follow ups and
maintenance
WfW Teams
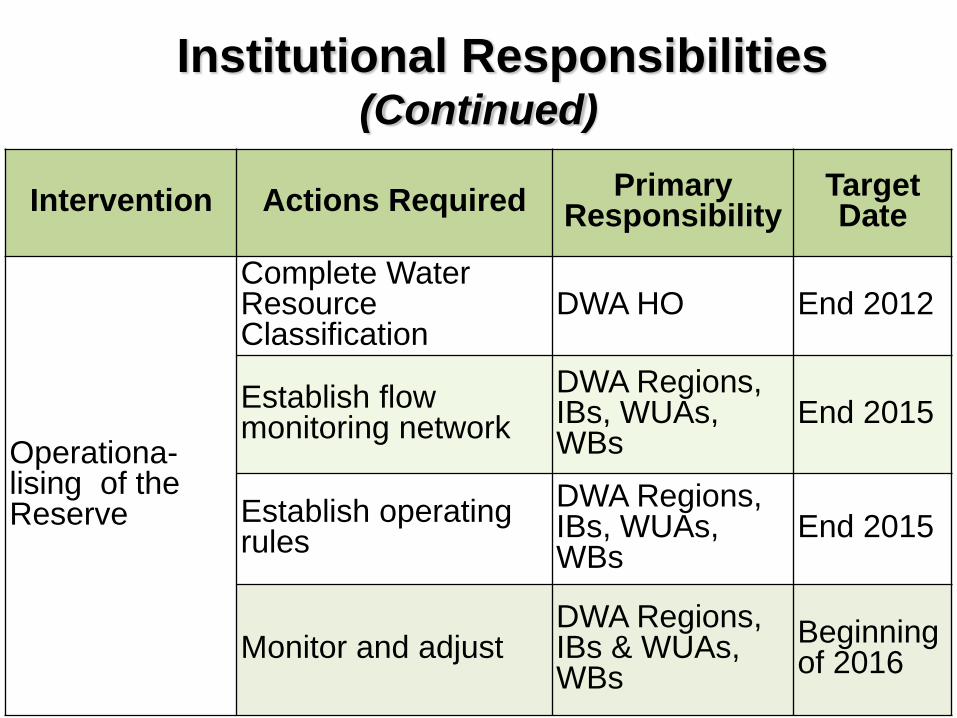
Institutional Responsibilities (Continued)
165
Intervention Actions Required Primary
Responsibility Target Date
Operationa-lising of the Reserve
Complete Water Resource Classification
DWA HO End 2012
Establish flow monitoring network
DWA Regions, IBs, WUAs, WBs
End 2015
Establish operating rules
DWA Regions, IBs, WUAs, WBs
End 2015
Monitor and adjust DWA Regions, IBs & WUAs, WBs
Beginning of 2016
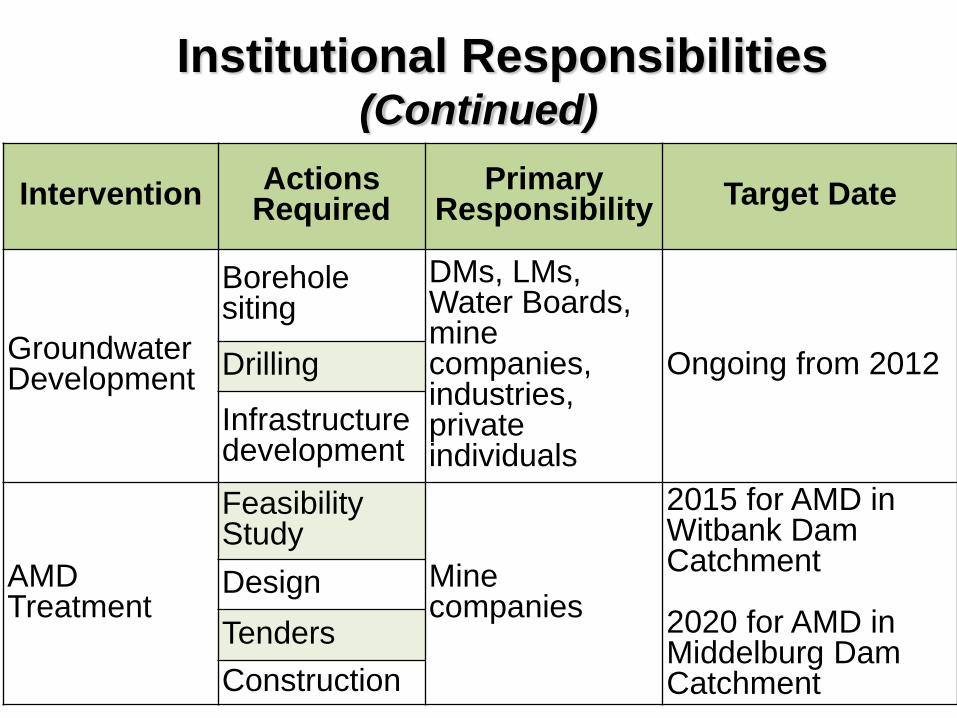
Institutional Responsibilities (Continued)
166
Intervention Actions
Required Primary
Responsibility Target Date
Groundwater Development
Borehole siting
DMs, LMs, Water Boards, mine companies, industries, private individuals
Ongoing from 2012 Drilling
Infrastructure development
AMD Treatment
Feasibility Study
Mine companies
2015 for AMD in Witbank Dam Catchment 2020 for AMD in Middelburg Dam Catchment
Design
Tenders
Construction
Institutional Responsibilities (Continued)
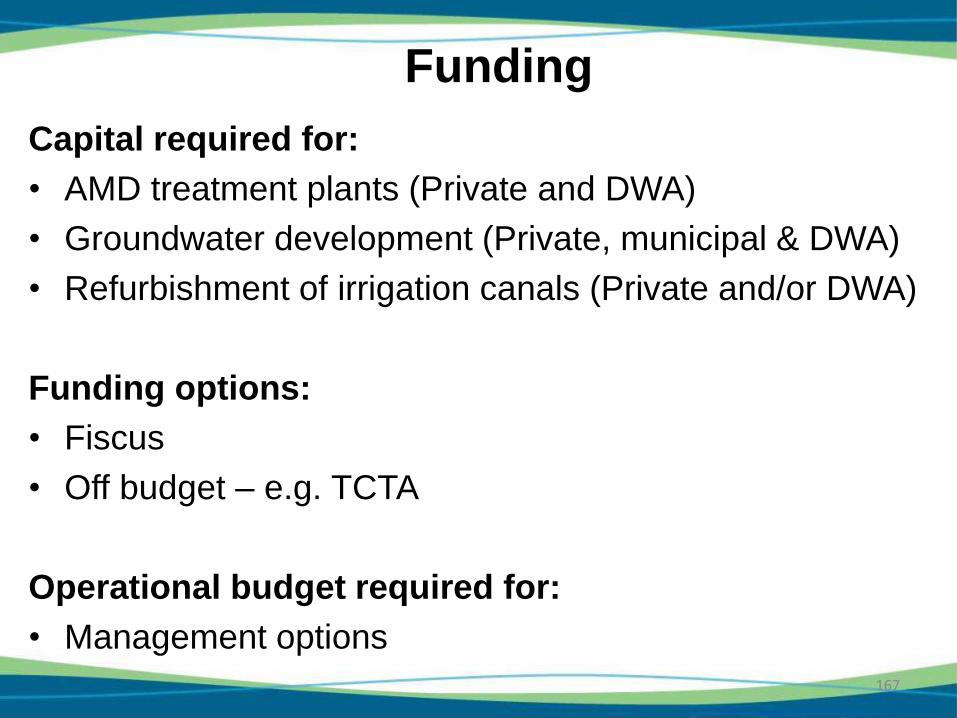
Funding
167
Capital required for:
• AMD treatment plants (Private and DWA)
• Groundwater development (Private, municipal & DWA)
• Refurbishment of irrigation canals (Private and/or DWA)
Funding options:
• Fiscus
• Off budget – e.g. TCTA
Operational budget required for:
• Management options
13 Recommendations Towards Implementation
168
• All Management options (except compulsory
licensing) to reduce water requirements must be
implemented asap
• The WC/WDM in irrigation sector should be linked
to water trading
• A policy and guideline document on purchase of
partial water entitlements must be produced in 2012
• The V & V process must be resumed asap. Various
interventions are dependent on this process.
• The establishment of a CMA must be accelerated
• Impacts of all interventions must be continuously
monitored
169
• Strategic groundwater development in unstressed
aquifers must continue
• Groundwater in stressed aquifers must be managed
and regulated better
Recommendations Towards Implementation
(Continued)
170
• Possible regional groundwater scheme with the
Malmani dolomites as resource should be
investigated
– Impact of groundwater abstraction on surface water
base flow
– Possibility of artificial recharge with surface water
• Operating rules for operating Loskop Dam, Flag
Boshielo Dam, Middelburg Dam, Witbank Dam and
De Hoop Dam as a system must be developed and
implemented
Recommendations For Further Work
171
• The current Study Steering Committee should be
transformed into a Strategy Steering Committee
• The following issues need attention in the follow up
Maintenance Study
– Estimated Groundwater use only include use for
municipal, rural and mining. Irrigation with groundwater
should also be factored in.
– River transmission losses should be investigated
– Current environmental releases of 19 million m3/a out of
Flag Boshielo Dam and Phalaborwa Barrage: It must be
ascertained that this value hasn’t been double counted
Recommendations For Further Work
(Continued)
172
• The following issues need attention in the follow up
Maintenance Study (Continued)
– The late water requirement inputs of Tshwane Metro and
by the Industrial Development Corporation (via Hatch)
must be investigated and it must be determined whether
the Reconciliation Strategy underestimated the water
requirements.
Recommendations For Further Work
(Continued)

Discussion
173