Embed Size (px)
Citation preview

Final Project 2004
DEVELOPMENT OF A QUALITY INDEX METHOD (QIM) SCHEME FOR FRESH COD (GADUS MORHUA) FILLETS AND CONSUMER ACCEPTANCE OF DIFFERENT COD PRODUCTS
Alma Cárdenas Bonilla Centro de Investigación en Alimentación y Desarrollo, A. C.
Carretera al Varadero Nacional Km 0.6. Guaymas, Sonora; México [email protected]
Supervisors
Kolbrún Sveinsdóttir and Emilía Martinsdóttir [email protected] and [email protected] Icelandic Fisheries Laboratories
ABSTRACT
The aim of the study was to develop and evaluate a Quality Index Method (QIM) scheme for fresh cod (Gadus morhua) fillets and to study consumer acceptability of different cod products in comparison to a trained sensory panel. QIM is an objective, rapid and reliable sensory method, based on well defined characteristic changes that occur in the deteriorative process of seafood. Demerit points are assigned to attributes and the resulting scores are summarised to give the Quality Index (QI). Cod fillets were stored at 0–1°C on ice up to 14 days. During storage, changes were observed and analysed using the QIM scheme for the raw fillets and Quantitative Descriptive Analysis (QDA) on cooked samples. In addition, total viable counts (TVC) and H2S-producing bacteria counts were done. As a result of this study, a QIM scheme for fresh cod fillets to evaluate freshness is proposed. A high correlation between QIM points and storage time on ice was found. The maximum storage time on ice determined by QDA of cooked fillets was found to be 8–10 days. Storage time could be predicted with an accuracy of ± 1.3 day. TVC and H2S-producing bacteria were at the limits of acceptability between seven and ten days of storage on ice. Thirty-five consumers grouped as Icelanders and non-Icelanders participated in a consumer test using a nine-point hedonic test for overall liking, texture and flavour for three different cod products. A sensory panel evaluated texture, appearance, flavour and odour using the QDA method and the results of both tests were compared. The results showed that the sensory panel found differences between all the samples, whereas the consumers only found differences between unfrozen and frozen/thawed wild cod with a preference to fresh products.
Cárdenas Bonilla
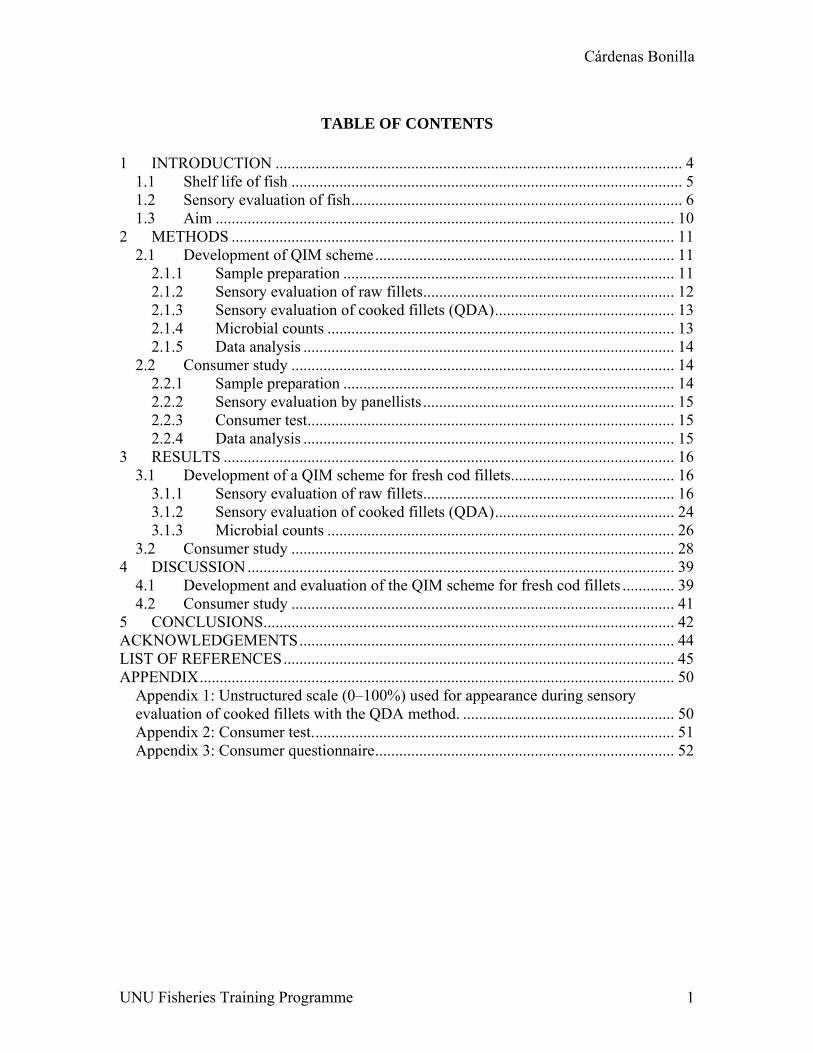
TABLE OF CONTENTS
1 INTRODUCTION ...................................................................................................... 4
1.1 Shelf life of fish .................................................................................................. 5 1.2 Sensory evaluation of fish................................................................................... 6 1.3 Aim ................................................................................................................... 10
2 METHODS ............................................................................................................... 11 2.1 Development of QIM scheme........................................................................... 11
2.1.1 Sample preparation ................................................................................... 11 2.1.2 Sensory evaluation of raw fillets............................................................... 12 2.1.3 Sensory evaluation of cooked fillets (QDA)............................................. 13 2.1.4 Microbial counts ....................................................................................... 13 2.1.5 Data analysis ............................................................................................. 14
2.2 Consumer study ................................................................................................ 14 2.2.1 Sample preparation ................................................................................... 14 2.2.2 Sensory evaluation by panellists ............................................................... 15 2.2.3 Consumer test............................................................................................ 15 2.2.4 Data analysis ............................................................................................. 15
3 RESULTS ................................................................................................................. 16 3.1 Development of a QIM scheme for fresh cod fillets......................................... 16
3.1.1 Sensory evaluation of raw fillets............................................................... 16 3.1.2 Sensory evaluation of cooked fillets (QDA)............................................. 24 3.1.3 Microbial counts ....................................................................................... 26
3.2 Consumer study ................................................................................................ 28 4 DISCUSSION ........................................................................................................... 39
4.1 Development and evaluation of the QIM scheme for fresh cod fillets ............. 39 4.2 Consumer study ................................................................................................ 41
5 CONCLUSIONS....................................................................................................... 42 ACKNOWLEDGEMENTS.............................................................................................. 44 LIST OF REFERENCES.................................................................................................. 45 APPENDIX....................................................................................................................... 50
Appendix 1: Unstructured scale (0–100%) used for appearance during sensory evaluation of cooked fillets with the QDA method. ..................................................... 50 Appendix 2: Consumer test........................................................................................... 51 Appendix 3: Consumer questionnaire........................................................................... 52
UNU Fisheries Training Programme 1

Cárdenas Bonilla
LIST OF FIGURES Figure 1: Cold chain for fish and seafood products in Mexico from raw material to
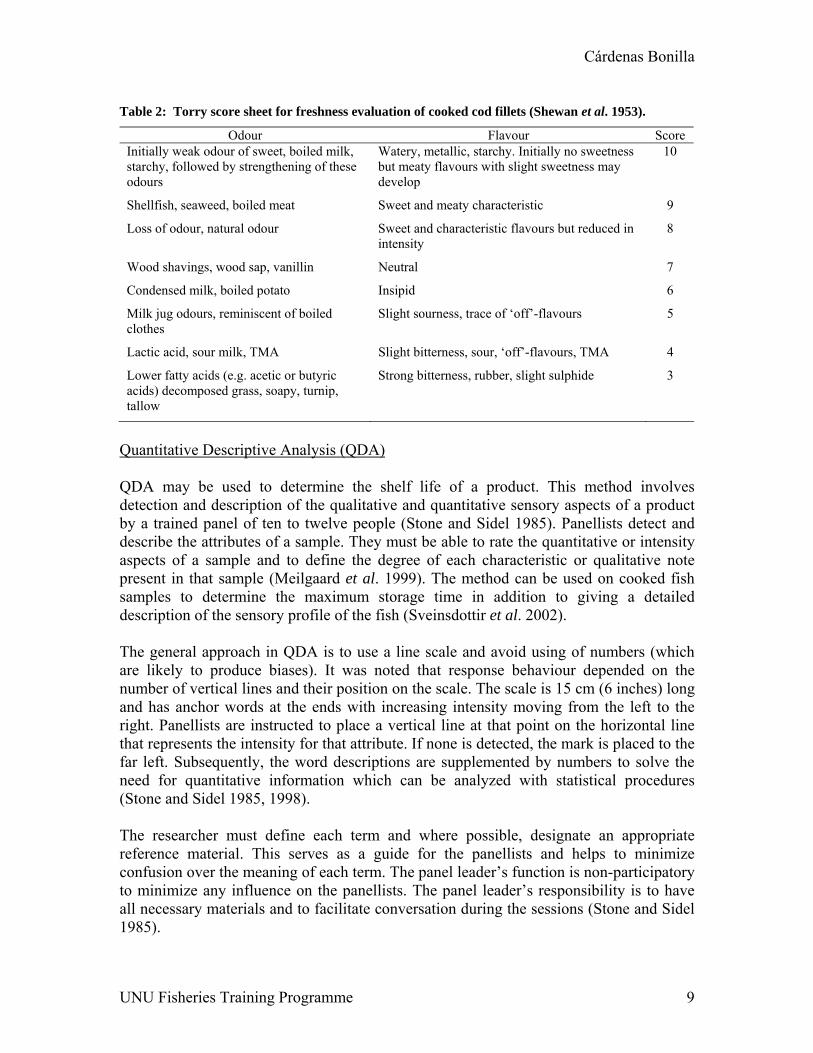
consumers. .................................................................................................................. 4 Figure 2: Changes in appearance of raw cod fillets stored on ice for zero and 14 days at
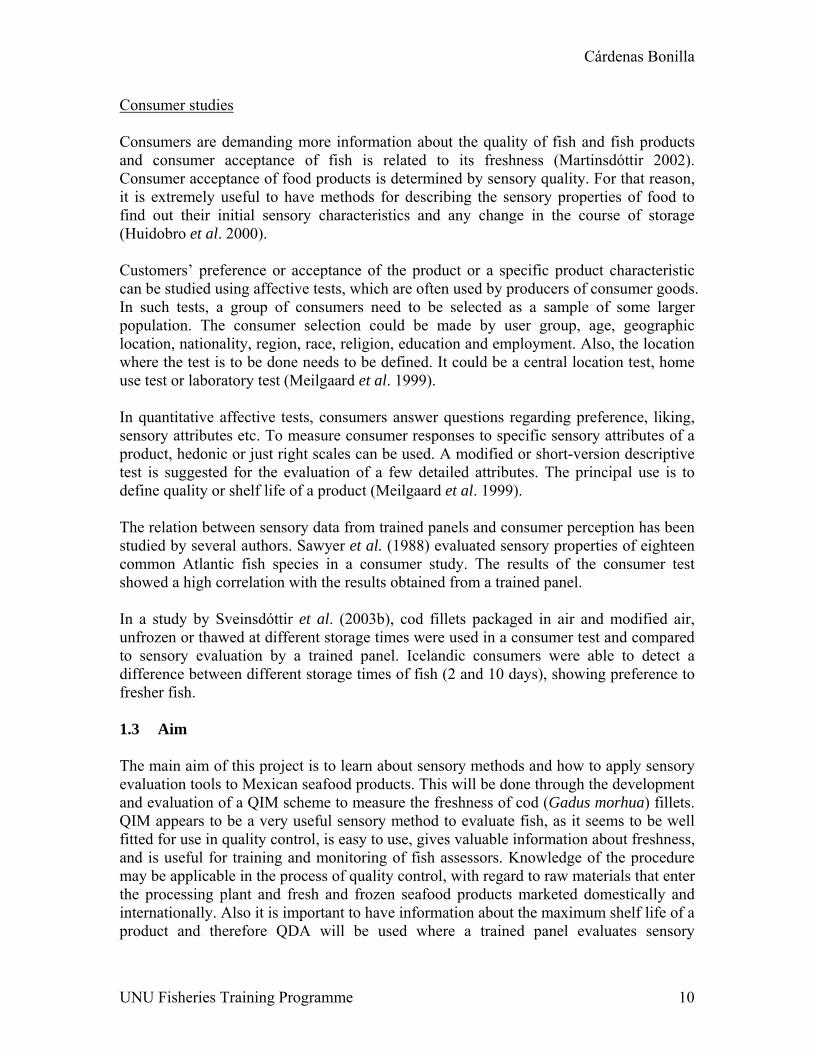
0–1°C. ....................................................................................................................... 19 Figure 3: QI of cod fillets. Averages over each day of storage analyzed against days on
ice. ............................................................................................................................. 20 Figure 4: PLS models of QIM data from cod stored on ice. Measured versus predicted
values are shown for storage time. Average QI scores for each storage day (A) and for each sample (B) were used in the calculations.................................................... 21
Figure 5: QI scores during the shelf life experiment. Median, 1st, 3rd quartiles, range and number (n) of panellists for each storage day evaluated........................................... 22
Figure 6: Average scores for each quality attribute evaluated with QIM scheme for cod fillets. ................................................................................................................. 23
Figure 7: Positive (A) and negative (B) flavour attributes (average scores) of cooked cod fillets against days on ice observed by a trained QDA panel. .................................. 25
Figure 8: Positive (A) and negative (B) odour attributes (average scores) of cooked cod fillets against days on ice observed by a trained QDA panel. .................................. 25
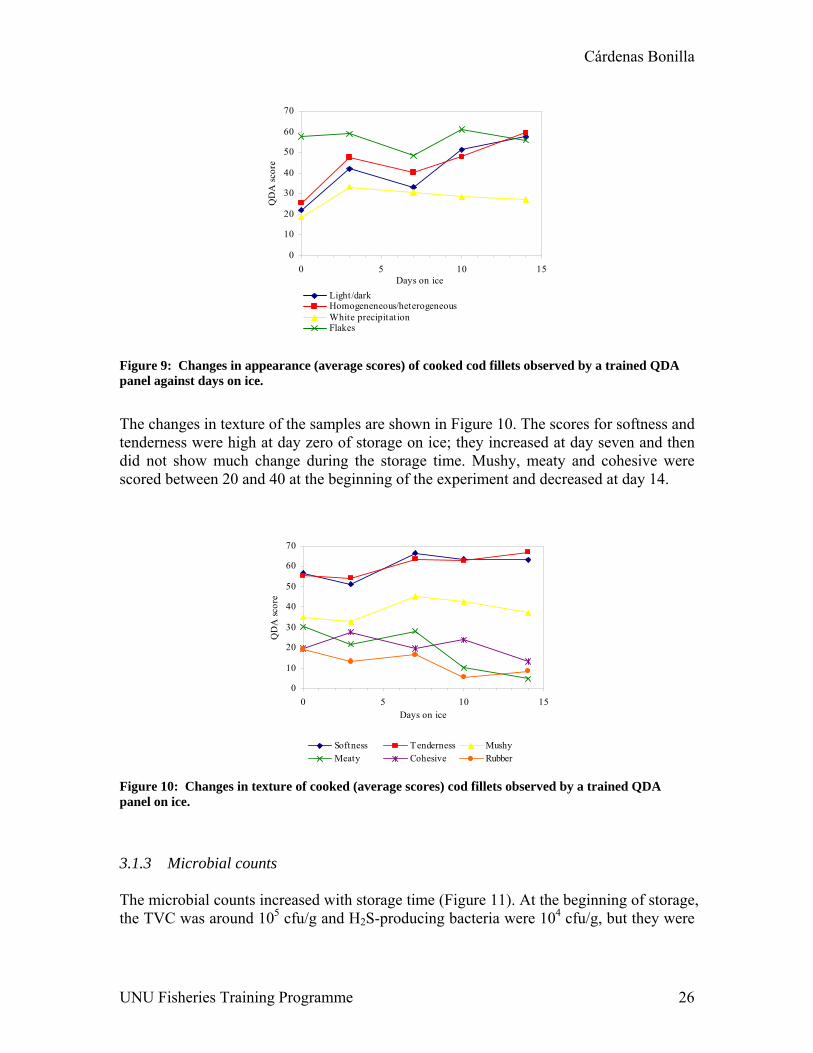
Figure 9: Changes in appearance (average scores) of cooked cod fillets observed by a trained QDA panel against days on ice..................................................................... 26
Figure 10: Changes in texture of cooked (average scores) cod fillets observed by a trained QDA panel on ice. ........................................................................................ 26
Figure 11: Total viable counts and selective counts of H2S-producing bacteria in flesh of cod fillets stored on ice at 0–1°C against days on ice............................................... 27
Figure 12: Correlation between bacteria counts in flesh and Quality Index of cod fillets stored on ice at 0–1°C. .............................................................................................. 27
Figure 13: Effect of sample origin (unfrozen farmed, unfrozen wild and frozen/thawed wild) on scores in the consumer test of overall liking, texture and flavour. The graphs show mean values with 95% confidence intervals........................................ 30
Figure 14: Effect of consumer’s age on scores in the consumer test of overall liking, texture and flavour. ................................................................................................... 31
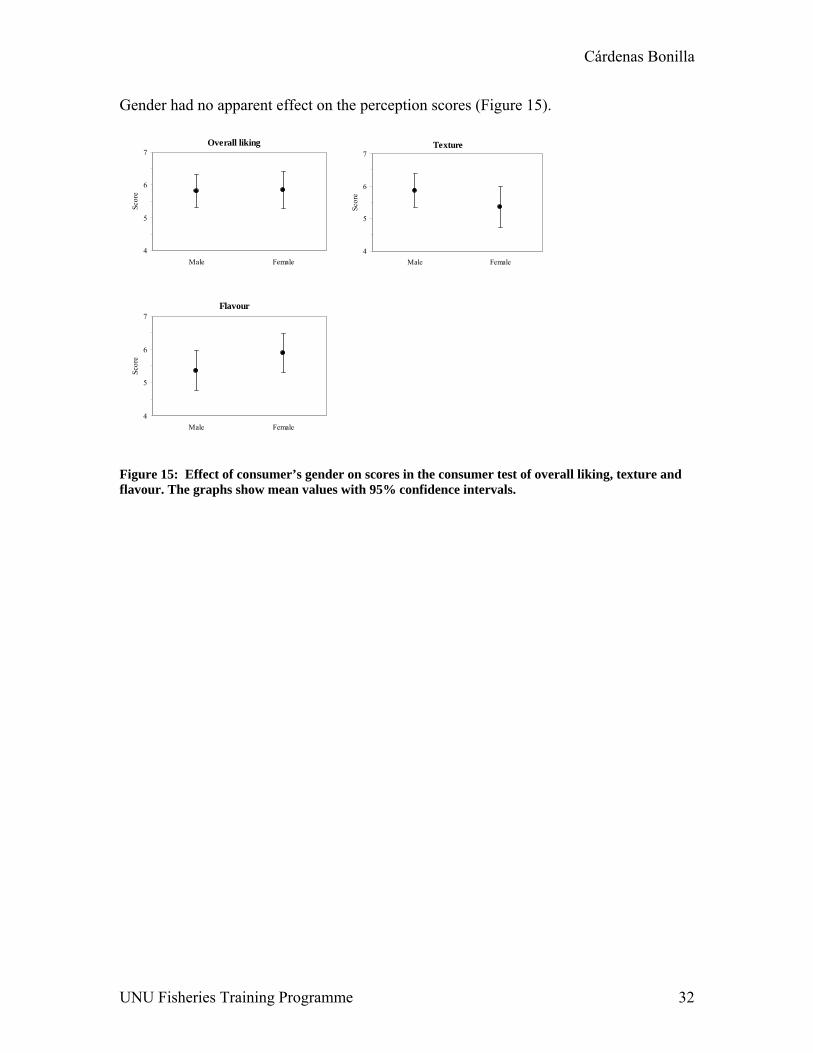
Figure 15: Effect of consumer’s gender on scores in the consumer test of overall liking, texture and flavour. The graphs show mean values with 95% confidence intervals. 32
Figure 16: Effect of frequency of fish consumption on scores in the consumer test of overall liking, texture and flavour. The graphs show mean values with 95% confidence intervals. ................................................................................................. 33
Figure 17: Effect of consumer’s nationality on scores in the consumer test of overall liking, texture and flavour. The graphs show means values with 95% confidence intervals..................................................................................................................... 34
Figure 18 : Consumers’ responses (frequency of scores in %) to the question about frequency of general fish consumption. In figure A (1 = one time per month or less; 2 = two to three times per month; 3 = one to two times per week; 4 = three times per week or more) and in figures B, C and D (1 = never; 3 = sometimes; 5 = always). 35
UNU Fisheries Training Programme 2
Cárdenas Bonilla
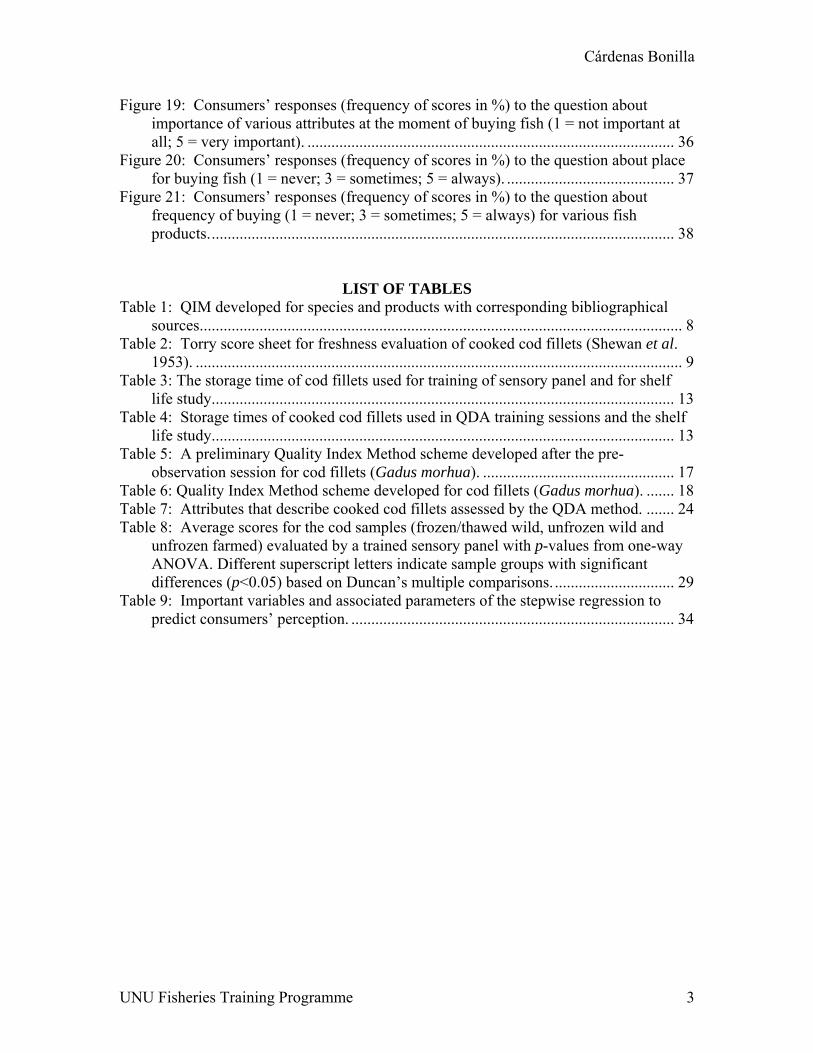
Figure 19: Consumers’ responses (frequency of scores in %) to the question about importance of various attributes at the moment of buying fish (1 = not important at all; 5 = very important). ............................................................................................ 36
Figure 20: Consumers’ responses (frequency of scores in %) to the question about place for buying fish (1 = never; 3 = sometimes; 5 = always). .......................................... 37
Figure 21: Consumers’ responses (frequency of scores in %) to the question about frequency of buying (1 = never; 3 = sometimes; 5 = always) for various fish products..................................................................................................................... 38
LIST OF TABLES Table 1: QIM developed for species and products with corresponding bibliographical
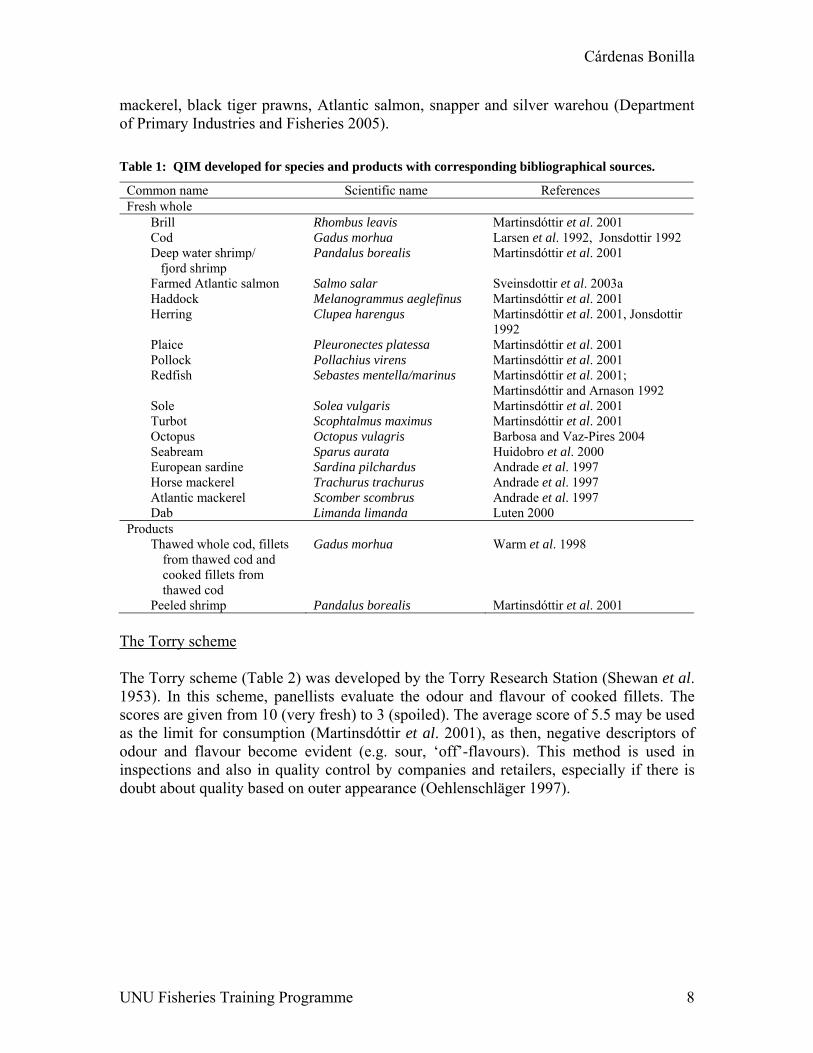
sources......................................................................................................................... 8 Table 2: Torry score sheet for freshness evaluation of cooked cod fillets (Shewan et al.
1953). .......................................................................................................................... 9 Table 3: The storage time of cod fillets used for training of sensory panel and for shelf
life study.................................................................................................................... 13 Table 4: Storage times of cooked cod fillets used in QDA training sessions and the shelf
life study.................................................................................................................... 13 Table 5: A preliminary Quality Index Method scheme developed after the pre-
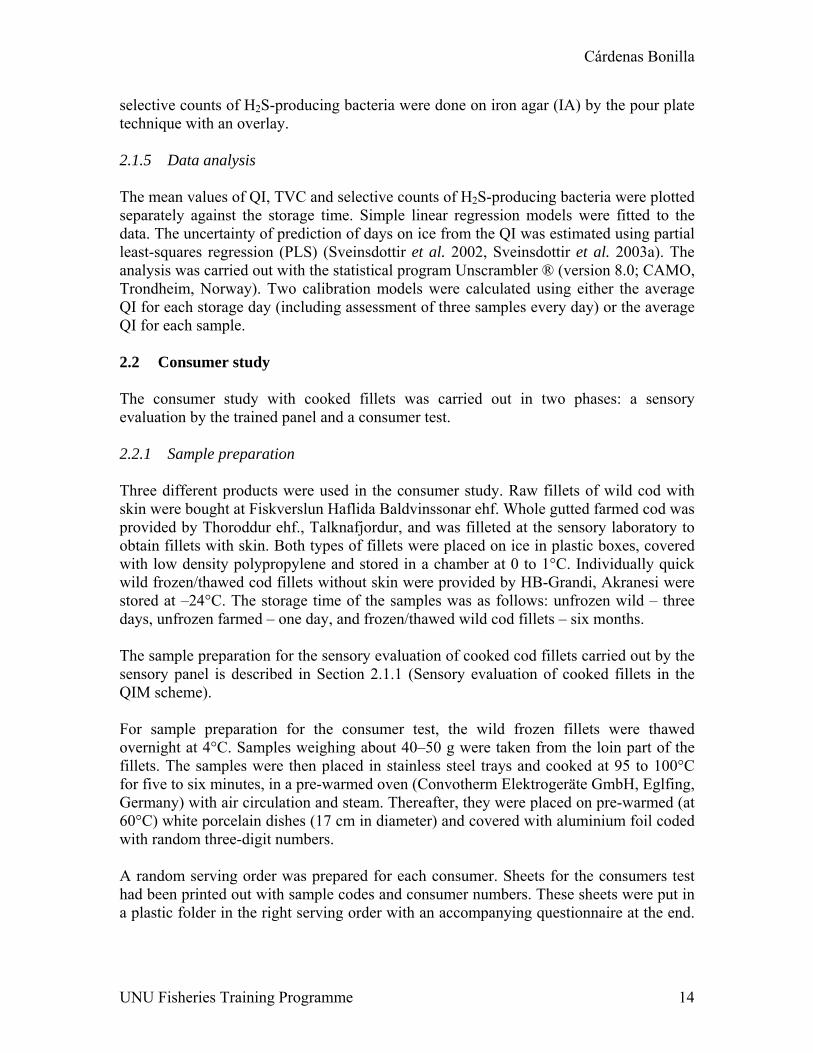
observation session for cod fillets (Gadus morhua). ................................................ 17 Table 6: Quality Index Method scheme developed for cod fillets (Gadus morhua). ....... 18 Table 7: Attributes that describe cooked cod fillets assessed by the QDA method. ....... 24 Table 8: Average scores for the cod samples (frozen/thawed wild, unfrozen wild and
unfrozen farmed) evaluated by a trained sensory panel with p-values from one-way ANOVA. Different superscript letters indicate sample groups with significant differences (p<0.05) based on Duncan’s multiple comparisons. .............................. 29
Table 9: Important variables and associated parameters of the stepwise regression to predict consumers’ perception. ................................................................................. 34
UNU Fisheries Training Programme 3

Cárdenas Bonilla
1 INTRODUCTION The term ‘quality’ with reference to food can have different meanings. It can refer to the sensory characteristics of a product, such as its appearance, flavour, odour and texture, but it can also indicate nutritional value, safety and other characteristics. Before buying a food product for the first time, the consumer evaluates its quality based on these characteristics. After its consumption, the consumer determines if the product meets his or her quality expectations and then decides whether to buy it again or not. Fish or seafood in general, must comply with quality and safety standards established for processing plants through regulations according to the type of product. Currently, with the opening of international markets, processors must not only meet the quality expectations of the national market, but also achieve international competitiveness. Seafood is perishable and maintaining the cold chain with minimal temperature fluctuations is fundamental for obtaining a high quality product. The cold chain for fish and seafood generally applied in Mexico is depicted in Figure 1. The objective is to keep products at low temperatures (refrigeration or freezing) to preserve the quality and safety characteristics defined for each product type.
Catching Landing Transport Processing
Storage Fresh fish markets
Transport Restaurants
Supermarkets
Consumers
Figure 1: Cold chain for fish and seafood products in Mexico from raw material to consumers.
The most frequent problem is temperature fluctuation and/or too high temperature of raw materials due to:
a) mishandling of fish after capture, b) lengthy unloading and transportation times to processing plants,
UNU Fisheries Training Programme 4

Cárdenas Bonilla
c) manual processing where the product can be kept for several hours waiting in the processing area,
d) lack of monitoring in the refrigeration and freezing chambers inside the processing plants, and
e) long distance to markets and lack of monitoring at the displays and storage at the market places.
This results in uncertainty of the shelf life and lower quality products. The principal method to evaluate the freshness of seafood raw materials and final products in Mexico is sensory evaluation, and the methodology used is rather general and varies among processing plants. Therefore it is important to establish a new methodology to effectively assess the quality of the products. The method should provide the necessary information, be routinely applicable and simple in use. 1.1 Shelf life of fish Freshness makes a major contribution to the quality of seafood, which is a very perishable product. From the moment the seafood is caught, the deterioration process starts and its quality for use as a food product is affected. Changes occur in composition and structure caused by biochemical, physical, enzymatic and bacterial reactions, negatively affecting the sensory quality of the product (Martinsdóttir 2002). Most of the chemical compounds found in spoiling seafood are volatile compounds produced by bacteria. These include trimethylamine, volatile sulphur compounds, aldehydes, ketones, esters, hypoxanthine and other low molecular weight compounds (Huss 1995). On live and newly caught fish, the micro-organisms are found on the skin, gills and in the intestines. The total number of organisms varies enormously depending on the environment and on the fish species. Fish caught in very cold, clean waters carry lower numbers compared with fish caught in warm waters, which have slightly higher counts. The flesh of healthy live or newly caught fish is sterile. When a fish dies, the bacteria are allowed to proliferate at the beginning on the skin and during storage, they invade the flesh (Huss 1995). The bacteria grow with a doubling time of approximately one day. After two to three weeks, they reach numbers of 108–109 cfu/g in flesh when fish (from temperate waters), is stored in ice. The flora of fish is composed almost of Pseudomonas spp. and Shewanella putrefaciens after one to two weeks when the fish is stored on ice (Huss 1995). Gram et al. (1987) studied total viable counts (TVC) and H2S-producing bacteria on whole cod and vacuum packed cod fillets. After nine to 10 days of storage at 0°C, the cod reached the limits of acceptability according to sensory evaluation. At this time, the TVC was 6 × 10⁶–108 cfu/g and the number of H2S-producing bacteria varied from 5 × 10⁶ to 8
UNU Fisheries Training Programme 5
Cárdenas Bonilla
× 107 cfu/g. Magnússon and Martinsdóttir (1995) reported TVC of 106–107 cfu/g for fresh cod fillets stored in ice at 0–1°C. Oehlenschläger (2002) conducted an experiment with muscle tissue of gutted, ungutted and gill cut/bled cod stored in ice. The TVC was approximately 50 cfu/g at the beginning of the experiment. During 21 days of storage, it never exceeded 103 cfu/g in ungutted and in gill cut/bled cod. The final count in gutted cod exceeded 104 cfu/g in flesh. 1.2 Sensory evaluation of fish Sensory changes in food are perceived with the human senses (sight, smell, taste, touch and hearing). Applying sensory evaluation to food products under controlled conditions produces results which can be analysed statistically. Sensory evaluation can be used to evaluate sensory characteristics of raw materials and finished products in storage tests, for new product development and in consumer tests (Jellinek 1985). Sensory evaluation takes place in inspection on all levels of marketing from auction sites, processing plants, wholesale to retail level. Seafood is also inspected by sensory methods when being imported. The sensory inspection is usually done by assessing appearance, texture and odour. The inspectors need training and retraining under supervision of experienced leaders (Oehlenschläger 1997). Regulations There are regulations dictated by countries, which describe the method to use in order to determine the freshness of seafood products. Mexican regulations contain a norm which generally describes the procedure (SE 1996). Some products, like tuna (SE 2000), shrimp (SE 1999), lobster (SE 2001), oyster (SE 1994a) and saltwater fish (SE 2004) have their own norms which include the general characteristics that should be checked when receiving raw materials at the processing plants. The freshwater fish norm (SE 1994b) is the only one that has a grading system, according to odour and texture of the flesh, general appearance, appearance of eyes and gills. The descriptions given in these regulations are not often clearly expressed. As a result, inexperienced people cannot conduct effective evaluations. The European Union has regulation No. 2406/96 which establishes the freshness rating for fishery products. It has a grading scheme with three categories of freshness: Extra, A and B (below B, the product is discarded for human consumption), that are given according to the sensory evaluation of skin, eyes, gills, smell, flesh and other characteristics. There are schemes for different groups of fish (whitefish, bluefish, selachii, cephalopods and crustaceans) (EC 1996). This scheme is often referred to as the EU-scheme. It includes general parameters for each group of fish but does not take into account differences between species (Ólafsdóttir et al. 1997, Martinsdóttir 2002, Luten and Martinsdóttir 1997, Hyldig and Nielsen 1997).
UNU Fisheries Training Programme 6

Cárdenas Bonilla
Quality Index Method (QIM) QIM was developed by the Tasmanian Food Research unit (Bremner 1985). The QIM is a grading system for freshness and quality estimation of fishery products in which the descriptions of the individual grades are precise, objective, independent and primary rather than a cluster of terms. It is based on parameters for raw fish, which are given scores, and needs to be developed for each fish species (Ólafsdóttir et al. 1997, Sveinsdottir et al. 2003a). QIM is a systematic and reliable method to assess the freshness and quality in fish (Hyldig and Nielsen 2004). It is based on significant, well-defined characteristic changes of appearance attributes that occur in raw fish such as eyes, skin, gills and changes that occur in odour and texture with storage time. A score from 0 to 3 demerit (index) points is given for each quality parameter according to the specific parameter descriptions. The scores are summarised to give an overall sensory score referred to as the Quality Index (QI). If the total length of shelf life of the species on ice is known, the total number of index points can also be used to estimate the past and remaining shelf life as the QI increases linearly with the storage time on ice. The shelf life can be determined with sensory evaluation of cooked fish (Luten and Martinsdóttir 1997, Martinsdóttir et al. 2001). In addition, in shelf life studies, it is useful to conduct microbiological and chemical analyses in parallel to the sensory evaluation to have supporting information about the spoilage of fish (Chytiri et al. 2004). QIM schemes have been developed for several species listed in Table 1. QIM Eurofish published a manual (Martinsdóttir et al. 2001), available in 11 languages. It contains QIM schemes for 12 fish species and information about how to use the QIM schemes (QIM-Eurofish 2004). Some of the advantages of QIM is that it requires only a short training, is rapid and easy to perform, non-destructive to the sample and can be used as a tool in production planning and quality assurance work (Hyldig and Nielsen 1997). Considering food safety, it is important to maintain the high quality of fish in each link of the chain from catch to consumer. Sensory evaluation is one of the most often used methods for assessing freshness and quality in the fish sector and in fish inspection services. The QIM may also be a useful tool for fishermen and thus affect handling of the catch on board. Also, it can be a part of labelling and identification of the catch (Hyldig and Nielsen 2004). Several authors have applied QIM in their studies. It is a rapid, reliable and generally accepted method to assess freshness in practical circumstances of auctions and processing sites (Martinsdóttir 2002). The QIM chain project, in which eight European institutions were involved, showed that some fish auctions in the Netherlands, Belgium and UK have started to use the QIM method on a daily basis (QIM-Eurofish 2004). A project initiated by the Sydney Fish market has been underway at the Department of Primary Industries and Fisheries in Australia to develop schemes according to the QIM methodology. To date, the Quality Index System incorporates six species: gold-band snapper, Spanish
UNU Fisheries Training Programme 7
Cárdenas Bonilla
mackerel, black tiger prawns, Atlantic salmon, snapper and silver warehou (Department of Primary Industries and Fisheries 2005). Table 1: QIM developed for species and products with corresponding bibliographical sources.
Common name Scientific name References Fresh whole
Brill Rhombus leavis Martinsdóttir et al. 2001 Cod Gadus morhua Larsen et al. 1992, Jonsdottir 1992 Deep water shrimp/ fjord shrimp
Pandalus borealis
Martinsdóttir et al. 2001
Farmed Atlantic salmon Salmo salar Sveinsdottir et al. 2003a Haddock Melanogrammus aeglefinus Martinsdóttir et al. 2001 Herring Clupea harengus Martinsdóttir et al. 2001, Jonsdottir
1992 Plaice Pleuronectes platessa Martinsdóttir et al. 2001 Pollock Pollachius virens Martinsdóttir et al. 2001 Redfish Sebastes mentella/marinus Martinsdóttir et al. 2001;
Martinsdóttir and Arnason 1992 Sole Solea vulgaris Martinsdóttir et al. 2001 Turbot Scophtalmus maximus Martinsdóttir et al. 2001 Octopus Octopus vulagris Barbosa and Vaz-Pires 2004 Seabream Sparus aurata Huidobro et al. 2000 European sardine Sardina pilchardus Andrade et al. 1997 Horse mackerel Trachurus trachurus Andrade et al. 1997 Atlantic mackerel Scomber scombrus Andrade et al. 1997 Dab Limanda limanda Luten 2000
Products Thawed whole cod, fillets
from thawed cod and cooked fillets from thawed cod
Gadus morhua Warm et al. 1998
Peeled shrimp Pandalus borealis Martinsdóttir et al. 2001 The Torry scheme The Torry scheme (Table 2) was developed by the Torry Research Station (Shewan et al. 1953). In this scheme, panellists evaluate the odour and flavour of cooked fillets. The scores are given from 10 (very fresh) to 3 (spoiled). The average score of 5.5 may be used as the limit for consumption (Martinsdóttir et al. 2001), as then, negative descriptors of odour and flavour become evident (e.g. sour, ‘off’-flavours). This method is used in inspections and also in quality control by companies and retailers, especially if there is doubt about quality based on outer appearance (Oehlenschläger 1997).
UNU Fisheries Training Programme 8
Cárdenas Bonilla
Table 2: Torry score sheet for freshness evaluation of cooked cod fillets (Shewan et al. 1953).
Odour Flavour Score Initially weak odour of sweet, boiled milk, starchy, followed by strengthening of these odours
Watery, metallic, starchy. Initially no sweetness but meaty flavours with slight sweetness may develop
10
Shellfish, seaweed, boiled meat Sweet and meaty characteristic 9
Loss of odour, natural odour Sweet and characteristic flavours but reduced in intensity
8
Wood shavings, wood sap, vanillin Neutral 7
Condensed milk, boiled potato Insipid 6
Milk jug odours, reminiscent of boiled clothes
Slight sourness, trace of ‘off’-flavours 5
Lactic acid, sour milk, TMA Slight bitterness, sour, ‘off’-flavours, TMA 4
Lower fatty acids (e.g. acetic or butyric acids) decomposed grass, soapy, turnip, tallow
Strong bitterness, rubber, slight sulphide 3
Quantitative Descriptive Analysis (QDA) QDA may be used to determine the shelf life of a product. This method involves detection and description of the qualitative and quantitative sensory aspects of a product by a trained panel of ten to twelve people (Stone and Sidel 1985). Panellists detect and describe the attributes of a sample. They must be able to rate the quantitative or intensity aspects of a sample and to define the degree of each characteristic or qualitative note present in that sample (Meilgaard et al. 1999). The method can be used on cooked fish samples to determine the maximum storage time in addition to giving a detailed description of the sensory profile of the fish (Sveinsdottir et al. 2002). The general approach in QDA is to use a line scale and avoid using of numbers (which are likely to produce biases). It was noted that response behaviour depended on the number of vertical lines and their position on the scale. The scale is 15 cm (6 inches) long and has anchor words at the ends with increasing intensity moving from the left to the right. Panellists are instructed to place a vertical line at that point on the horizontal line that represents the intensity for that attribute. If none is detected, the mark is placed to the far left. Subsequently, the word descriptions are supplemented by numbers to solve the need for quantitative information which can be analyzed with statistical procedures (Stone and Sidel 1985, 1998). The researcher must define each term and where possible, designate an appropriate reference material. This serves as a guide for the panellists and helps to minimize confusion over the meaning of each term. The panel leader’s function is non-participatory to minimize any influence on the panellists. The panel leader’s responsibility is to have all necessary materials and to facilitate conversation during the sessions (Stone and Sidel 1985).
UNU Fisheries Training Programme 9
Cárdenas Bonilla
Consumer studies Consumers are demanding more information about the quality of fish and fish products and consumer acceptance of fish is related to its freshness (Martinsdóttir 2002). Consumer acceptance of food products is determined by sensory quality. For that reason, it is extremely useful to have methods for describing the sensory properties of food to find out their initial sensory characteristics and any change in the course of storage (Huidobro et al. 2000). Customers’ preference or acceptance of the product or a specific product characteristic can be studied using affective tests, which are often used by producers of consumer goods. In such tests, a group of consumers need to be selected as a sample of some larger population. The consumer selection could be made by user group, age, geographic location, nationality, region, race, religion, education and employment. Also, the location where the test is to be done needs to be defined. It could be a central location test, home use test or laboratory test (Meilgaard et al. 1999). In quantitative affective tests, consumers answer questions regarding preference, liking, sensory attributes etc. To measure consumer responses to specific sensory attributes of a product, hedonic or just right scales can be used. A modified or short-version descriptive test is suggested for the evaluation of a few detailed attributes. The principal use is to define quality or shelf life of a product (Meilgaard et al. 1999). The relation between sensory data from trained panels and consumer perception has been studied by several authors. Sawyer et al. (1988) evaluated sensory properties of eighteen common Atlantic fish species in a consumer study. The results of the consumer test showed a high correlation with the results obtained from a trained panel. In a study by Sveinsdóttir et al. (2003b), cod fillets packaged in air and modified air, unfrozen or thawed at different storage times were used in a consumer test and compared to sensory evaluation by a trained panel. Icelandic consumers were able to detect a difference between different storage times of fish (2 and 10 days), showing preference to fresher fish. 1.3 Aim The main aim of this project is to learn about sensory methods and how to apply sensory evaluation tools to Mexican seafood products. This will be done through the development and evaluation of a QIM scheme to measure the freshness of cod (Gadus morhua) fillets. QIM appears to be a very useful sensory method to evaluate fish, as it seems to be well fitted for use in quality control, is easy to use, gives valuable information about freshness, and is useful for training and monitoring of fish assessors. Knowledge of the procedure may be applicable in the process of quality control, with regard to raw materials that enter the processing plant and fresh and frozen seafood products marketed domestically and internationally. Also it is important to have information about the maximum shelf life of a product and therefore QDA will be used where a trained panel evaluates sensory
UNU Fisheries Training Programme 10

Cárdenas Bonilla
attributes of cooked cod fillets, including spoilage attributes to estimate the maximum shelf life. In addition, a test will be conducted to examine consumer acceptability of different cod products and their freshness. It is very relevant to know how consumers perceive quality of fish products and if they can recognise if a product is fresh or not. The results of the consumer test will therefore be compared with the results obtained from a trained sensory panel to find how, or if, consumers detect differences between different cod products in accordance with the sensory panel. More specifically, the objectives of the project will be achieved by:
1) development of a QIM scheme for raw cod fillets, 2) training of panellists for the sensory evaluation of raw and cooked cod fillets, 3) conducting a shelf life study of fresh cod fillets (at 0–1°C), 4) estimating shelf life of the product using the developed QIM scheme, 5) determining the maximum storage time of cod fillets, 6) conducting a consumer test.
2 METHODS 2.1 Development of QIM scheme This section describes the methodology used to develop and evaluate the QIM scheme. The following method is based on the QIM scheme earlier described by Martinsdóttir et al. (2001), Martinsdóttir (2002) and Sveinsdottir et al. (2003a). 2.1.1 Sample preparation Raw fillets of wild cod with skin were bought at Fiskverslun Haflida Baldvinssonar ehf. At the sensory laboratory, the fillets were stored on ice in plastic boxes, covered with low density polypropylene and stored in a chamber at 0 to 1°C. The fish were filleted after up to five days of storage. Sensory evaluation of raw fillets For the QIM training and sensory evaluation during the shelf life study, raw fillets were placed on a white clean table at room temperature, under white fluorescent light. The panellists evaluated changes in colour, odour, appearance and texture of the flesh and skin. Sensory evaluation of cooked fillets For the QDA training and sensory evaluation during the shelf life study, samples weighing about 40–50 g were taken from the loin part of the fillets and placed in aluminium boxes coded with three-digit random numbers. The samples were cooked at
UNU Fisheries Training Programme 11

Cárdenas Bonilla
95 to 100°C for seven minutes in a pre-warmed oven (Convotherm Elektrogeräte GmbH, Eglfing, Germany) with air circulation and steam. 2.1.2 Sensory evaluation of raw fillets Pre-observation The objective of the pre-observation of raw fillets was to get an idea about the deterioration process. Two persons observed the fish from the day of purchase (day 0) until spoiled, every other day. Based on these observations, the sensory parameters were suggested and described. Each description received a score in which 0 corresponded to very fresh fillets. Then the scores increased according to spoilage with a maximum score of 3 for each parameter. A preliminary QIM scheme for the sensory evaluation of fresh cod fillets was made. Training sessions Eight to twelve panellists participated in three training sessions. Two cod fillets from different storage days were evaluated. The storage day was given with a note next to each fillet. During the following two sessions, the notes only showed three-digit numbers and at the end of the session, the panel was informed about the storage time. The storage time of the samples at each session is shown in Table 3. In the first training session, the panel used the scheme developed during the pre-observation of cod fillets. The panel leader explained how to use the scheme and how to evaluate each quality parameter. Then, the panel evaluated cod fillets by themselves. The panellists had an opportunity to ask questions regarding the evaluation at any time during the session. After each session, the panel leader and the panellists discussed the scheme and the panel leader made changes to the scheme according to their suggestions. The panellists were notified about these changes at the next session. Before the last training session, the QIM scheme for fresh cod fillets was completed. QIM in shelf life study The QIM scheme was used to evaluate raw fillets. Two sessions were carried out, in which the panellists evaluated cod fillets from different storage days. Three fillets from two to three storage different days per session were examined on the table (Table 3) and coded with three-digit numbers without information about the storage time. The panellists evaluated each fillet individually.
UNU Fisheries Training Programme 12

Cárdenas Bonilla
Table 3: The storage time of cod fillets used for training of sensory panel and for shelf life study.
Type of session Date of the sessions Session
number Number of
evaluated fillets Storage days
November 23, 2004 1 2 1, 4, 8 November 24, 2004 2 2 2, 5, 9
Training
November 25, 2004 3 2 3, 6, 10 November 29, 2004 1 3 0, 7, 14 Shelf life study December 2, 2004 2 3 3, 10
2.1.3 Sensory evaluation of cooked fillets (QDA) Training The panellists were trained during three sessions to evaluate cooked cod fillets with the QDA method (Stone and Sidel 1985). They observed differences in appearance, odour, texture and flavour of the fillets. At the first two sessions, the panel made a list of descriptors to describe samples under the guidance of the panel leader. At the last session, the panel described the intensity of each attribute for a given sample using an unstructured scale (from 0 to 100%) (Appendix 1). Each panellist evaluated duplicates of samples from one to three different days of storage. The storage times of the samples tested at each session are shown in Table 4. QDA in shelf life study The QDA of cooked fillets was conducted in parallel to the QIM sessions. The trained panel evaluated duplicate samples of cooked cod fillets, using the list developed during training. Two sessions were carried out during each day of the shelf life study. This procedure is described by Sveinsdottir et al. (2002). The storage days of the samples are shown in Table 4. The fish was served in a random order during two sessions each day of the sensory evaluation. Table 4: Storage times of cooked cod fillets used in QDA training sessions and the shelf life study.
Type of session Date of the sessions Session number Storage days November 23, 2004 1 1 November 24, 2004 2 9
Training
November 25, 2004 3 2, 5, 9 1 0, 7, 14 November 29, 2004 2 0, 7, 14 3 3, 10
Shelf life study
December 2, 2004 4 3, 10
2.1.4 Microbial counts Flesh samples for the microbial analysis were collected in parallel to QIM evaluation. Samples of minced flesh, weighing 25 g each, were placed in a stomacher bag containing 225 g Butterfield’s Buffer solution to obtain a 10-fold dilution. Blending was done in the stomacher for one minute. The plates were incubated at 22°C for three days. TVC and
UNU Fisheries Training Programme 13
Cárdenas Bonilla
selective counts of H2S-producing bacteria were done on iron agar (IA) by the pour plate technique with an overlay. 2.1.5 Data analysis The mean values of QI, TVC and selective counts of H2S-producing bacteria were plotted separately against the storage time. Simple linear regression models were fitted to the data. The uncertainty of prediction of days on ice from the QI was estimated using partial least-squares regression (PLS) (Sveinsdottir et al. 2002, Sveinsdottir et al. 2003a). The analysis was carried out with the statistical program Unscrambler ® (version 8.0; CAMO, Trondheim, Norway). Two calibration models were calculated using either the average QI for each storage day (including assessment of three samples every day) or the average QI for each sample. 2.2 Consumer study The consumer study with cooked fillets was carried out in two phases: a sensory evaluation by the trained panel and a consumer test. 2.2.1 Sample preparation Three different products were used in the consumer study. Raw fillets of wild cod with skin were bought at Fiskverslun Haflida Baldvinssonar ehf. Whole gutted farmed cod was provided by Thoroddur ehf., Talknafjordur, and was filleted at the sensory laboratory to obtain fillets with skin. Both types of fillets were placed on ice in plastic boxes, covered with low density polypropylene and stored in a chamber at 0 to 1°C. Individually quick wild frozen/thawed cod fillets without skin were provided by HB-Grandi, Akranesi were stored at –24°C. The storage time of the samples was as follows: unfrozen wild – three days, unfrozen farmed – one day, and frozen/thawed wild cod fillets – six months. The sample preparation for the sensory evaluation of cooked cod fillets carried out by the sensory panel is described in Section 2.1.1 (Sensory evaluation of cooked fillets in the QIM scheme). For sample preparation for the consumer test, the wild frozen fillets were thawed overnight at 4°C. Samples weighing about 40–50 g were taken from the loin part of the fillets. The samples were then placed in stainless steel trays and cooked at 95 to 100°C for five to six minutes, in a pre-warmed oven (Convotherm Elektrogeräte GmbH, Eglfing, Germany) with air circulation and steam. Thereafter, they were placed on pre-warmed (at 60°C) white porcelain dishes (17 cm in diameter) and covered with aluminium foil coded with random three-digit numbers. A random serving order was prepared for each consumer. Sheets for the consumers test had been printed out with sample codes and consumer numbers. These sheets were put in a plastic folder in the right serving order with an accompanying questionnaire at the end.
UNU Fisheries Training Programme 14
Cárdenas Bonilla
The folder was attached to the table in front of the participant so that it was invisible to him or her. 2.2.2 Sensory evaluation by panellists The QDA of cooked fillets was conducted before the consumer test sessions. The trained panel evaluated various attributes, such as odour, flavour, texture and appearance, in duplicate samples of cooked cod fillets. The fish was served in a random order during two sessions, on the same day as the consumer test. 2.2.3 Consumer test There were two sessions for the consumer test, held at 1.30 PM and 3.00 PM. At each session the maximum number of consumers was expected to be 20. The consumer test was based on a nine-point hedonic test (Resurreccion 1998). Thirty-five volunteers, recruited from the staff of Sjávarútveghúsid (where the UNU-FTP programme took place) participated in this study. The study was carried out at the sensory laboratory facilities. Each consumer received a sample and a form (shown in Appendix 2) to fill out. When the next sample was served, the form that had been filled out was collected and the next one was handed out. The consumers were asked to evaluate overall liking, flavour and texture of the three different cod products. After testing the samples, the consumers answered another questionnaire (shown in Appendix 3) with general questions about fish consumption. 2.2.4 Data analysis The scores for the different attributes assessed by QDA were analysed using one-way ANOVA to find whether there were any detectable differences between samples. Multiple comparisons were made by Duncan’s method using the program STATISTICA 6.0 (StatSoft, Tulsa, USA). The data from the consumer test was examined by plotting the scores against each of the variables obtained from the questionnaires to assess their potential effects on perception. These variables included: sample origin (unfrozen wild, unfrozen farmed and frozen/thawed wild cod), consumer’s age, gender and nationality (Icelander, non-Icelander), and also the frequency of fish consumption (2–3 times per month, 1–2 times per week, 3 and more times per week). Age was a continuous variable. Since the frequency of fish consumption had only three levels, it was treated as a categorical variable (rather than continuous or ordinal). All the remaining variables were categorical variables. A stepwise linear regression was used to search for the subset of potential predictor variables that best described the response variable (consumer’s perception). The stepwise procedure was carried out using the function ‘step’ in the program ‘R’ (Ihaka and Gentleman, 1996). The step-function in this program selects a model based on the AIC statistic, rather than on traditional p-values (Venables and Ripley, 2002). Among the considered predictors were all the variables from the filled form.
UNU Fisheries Training Programme 15

Cárdenas Bonilla
3 RESULTS 3.1 Development of a QIM scheme for fresh cod fillets A QIM scheme for raw cod fillets was developed through some changes during the pre-observation and training which resulted in a QIM scheme that correlated highly with storage time on ice. The detailed results are described below. 3.1.1 Sensory evaluation of raw fillets Pre-observation Parameters that describe changes in skin and flesh were listed in a preliminary scheme during the pre-observation of raw cod fillets (Table 5). The maximum sum of points was 19. Training sessions During the training sessions, the skin scales, flesh water, and skin-flesh dryness parameters were removed. The descriptions of skin slime, flesh colour, brightness, and gaping were modified to get the best words that defined them. After the last training session, the scheme was completed. The total sum of points was 18 (Table 6). The scheme described two parameters for skin and six for flesh.
UNU Fisheries Training Programme 16

Cárdenas Bonilla
Table 5: A preliminary Quality Index Method scheme developed after the pre-observation session for cod fillets (Gadus morhua).
Quality parameter Description Score
Iridescent pigmentation 0 Rather dull 1
Brightness
Dull 2 Uniform, thin, transparent 0 Slime Small bubbles 1 Uniform 0
Skin
Scales Single scales loose, leaving white spots 1 Firm 0 Rather soft 1
Texture
Very soft 2 No sign of water leaking 0 Water Water leaking 1 Bright red 0 Dull red 1
Blood
Shadowy, brown 2 Fresh, neutral 0 Seaweedy, marine 1 Sour milk 2
Odour
Acetic, ammonia 3 White, greyish 0 Yellowish, a little pinkish 1
Colour
Yellow and dark pink 2 Transparent 0 Bright Opaque 1 No gaping 0 Little gaping, still whole 1 Some gaping, does not look very whole 2
Flesh
Gaping
Excessive gaping 3 Wet, normal shape 0 Dryness Dry, shrunk 1
Quality index (0–19)
UNU Fisheries Training Programme 17
Cárdenas Bonilla
Table 6: Quality Index Method scheme developed for cod fillets (Gadus morhua).
Quality parameter Description Score
Iridescent pigmentation 0 Rather dull 1
Brightness
Dull 2 Uniform, thin, transparent 0 Little thicker, opaque 1
Skin
Slime
Clotted, thick, yellowish 2 Firm 0 Rather soft 1
Texture
Very soft 2 Bright red, not present 0 Dull red 1
Blood
Shadowy, brown 2 Fresh, neutral 0 Seaweedy, marine, grass 1 Sour milk 2
Odour
Acetic, ammonia 3 White, greyish 0 Some yellowish, a little pinkish 1
Colour
Yellow, over all pink 2 Transparent, bluish 0 Opaque 1
Bright
Milky 2 No gaping, one longitudinal gaping at the neck
part of the fillet 0
Slight gaping less than 25% of the fillet 1 Slight gaping, 25–75% of the fillet 2
Flesh
Gaping
Deep gaping or slight gaping over 75% of the fillet
3
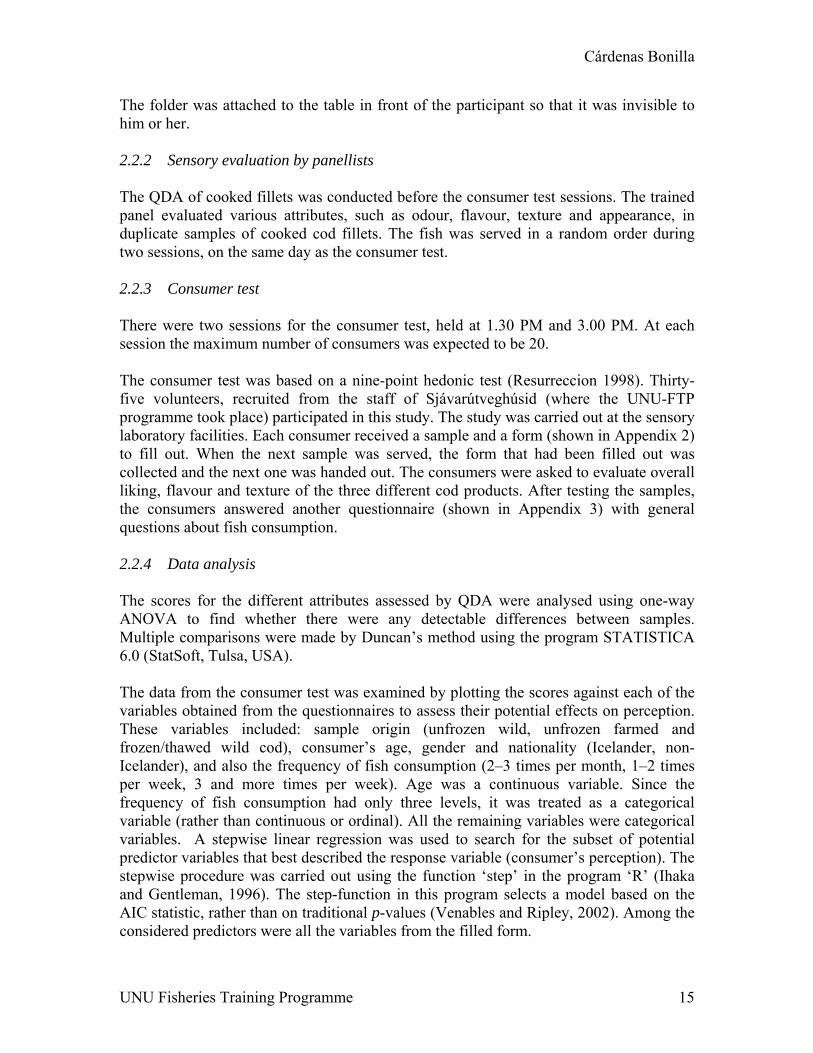
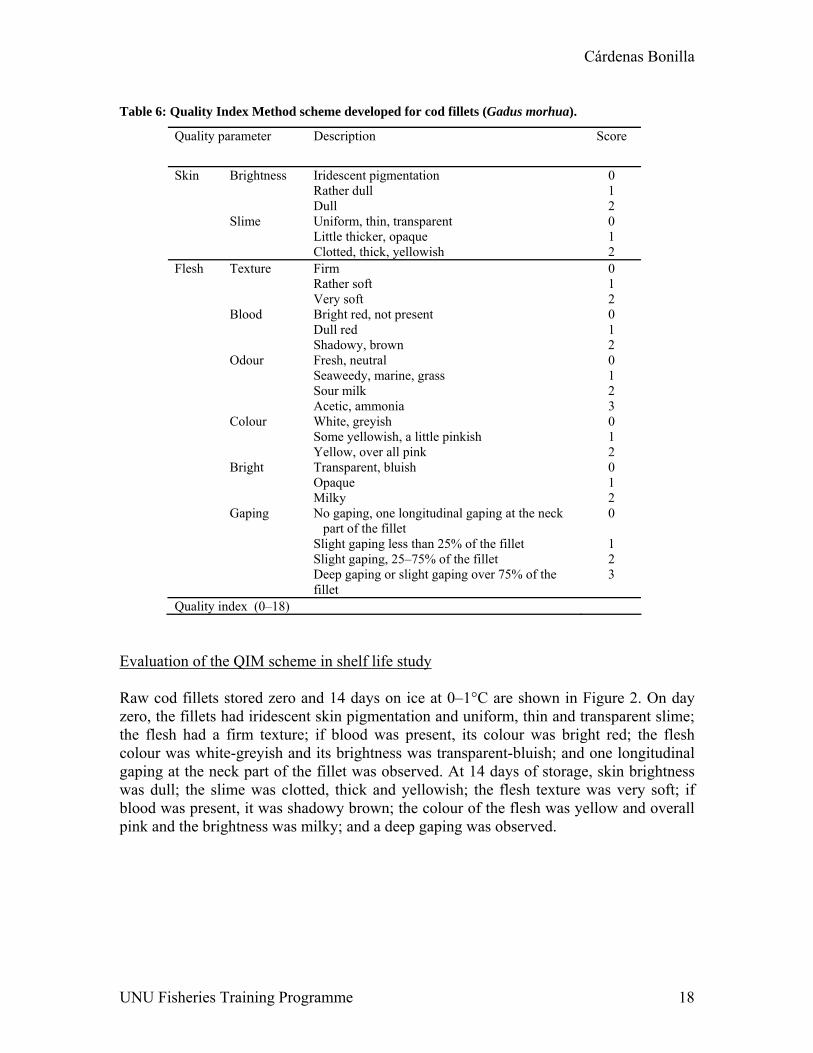
Quality index (0–18) Evaluation of the QIM scheme in shelf life study Raw cod fillets stored zero and 14 days on ice at 0–1°C are shown in Figure 2. On day zero, the fillets had iridescent skin pigmentation and uniform, thin and transparent slime; the flesh had a firm texture; if blood was present, its colour was bright red; the flesh colour was white-greyish and its brightness was transparent-bluish; and one longitudinal gaping at the neck part of the fillet was observed. At 14 days of storage, skin brightness was dull; the slime was clotted, thick and yellowish; the flesh texture was very soft; if blood was present, it was shadowy brown; the colour of the flesh was yellow and overall pink and the brightness was milky; and a deep gaping was observed.
UNU Fisheries Training Programme 18
Cárdenas Bonilla
Figure 2: Changes in appearance of raw cod fillets stored on ice for zero and 14 days at 0–1°C.
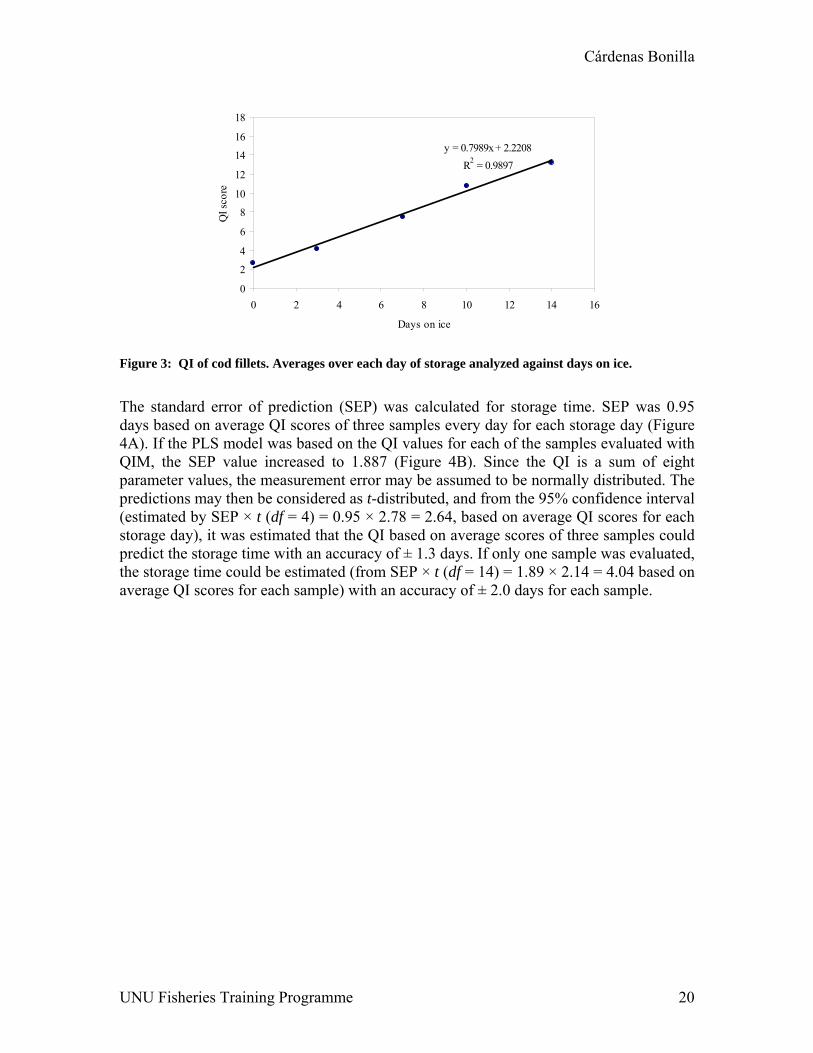
The QI was calculated for each trial day of storage, and was linearly related to storage time on ice (Figure 3). There was a high correlation (R2=0.989) between the average QI and days of storage on ice.
UNU Fisheries Training Programme 19
Cárdenas Bonilla
y = 0.7989x + 2.2208R2 = 0.9897
0
2
4
6
8
10
12
14
16
18
0 2 4 6 8 10 12 14 16
Days on ice
QI s
core
Figure 3: QI of cod fillets. Averages over each day of storage analyzed against days on ice.
The standard error of prediction (SEP) was calculated for storage time. SEP was 0.95 days based on average QI scores of three samples every day for each storage day (Figure 4A). If the PLS model was based on the QI values for each of the samples evaluated with QIM, the SEP value increased to 1.887 (Figure 4B). Since the QI is a sum of eight parameter values, the measurement error may be assumed to be normally distributed. The predictions may then be considered as t-distributed, and from the 95% confidence interval (estimated by SEP × t (df = 4) = 0.95 × 2.78 = 2.64, based on average QI scores for each storage day), it was estimated that the QI based on average scores of three samples could predict the storage time with an accuracy of ± 1.3 days. If only one sample was evaluated, the storage time could be estimated (from SEP × t (df = 14) = 1.89 × 2.14 = 4.04 based on average QI scores for each sample) with an accuracy of ± 2.0 days for each sample.
UNU Fisheries Training Programme 20

Cárdenas Bonilla
A
Figure 4: PLS models of QIM data from cod stored on ice. Measured versus predicted values ashown for storage time. Average QI scores for each storage day (A) and for each sample (B) werused in the calculations.
UNU Fisheries Training Programme
B
ree
21
Cárdenas Bonilla
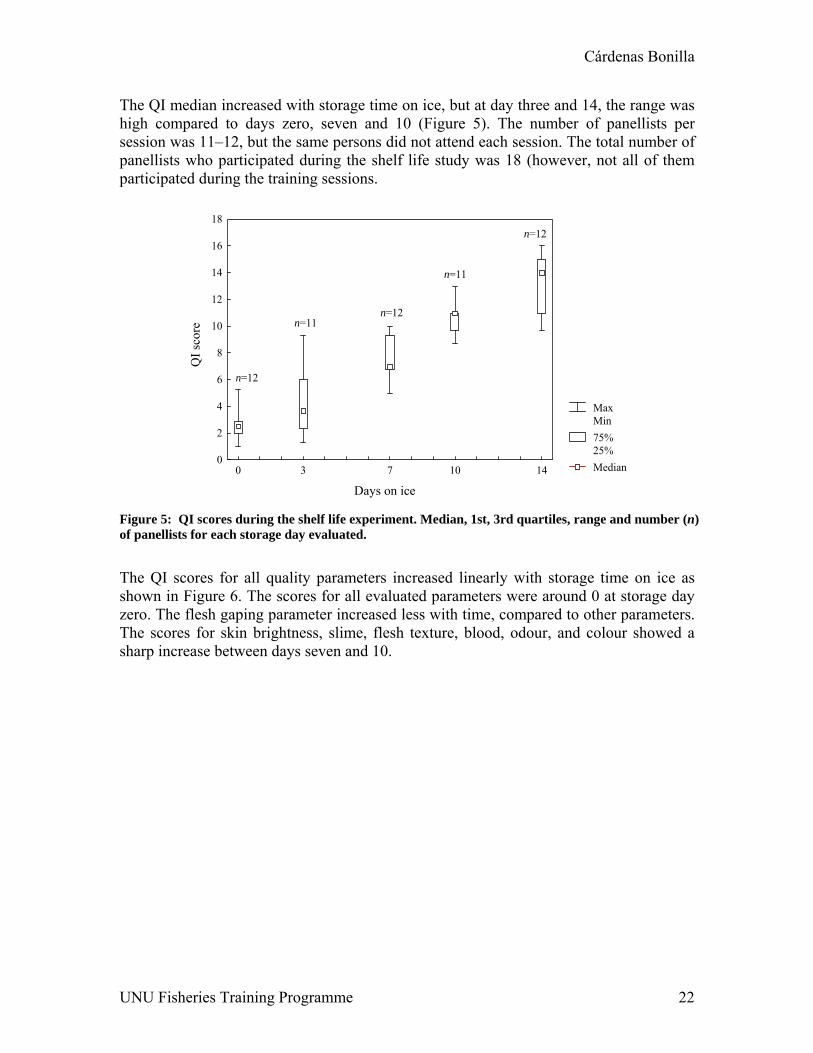
The QI median increased with storage time on ice, but at day three and 14, the range was high compared to days zero, seven and 10 (Figure 5). The number of panellists per session was 11–12, but the same persons did not attend each session. The total number of panellists who participated during the shelf life study was 18 (however, not all of them participated during the training sessions.
MaxMin75%25%Median
Days on ice
QI s
core
0
2
4
6
8
10
12
14
16
18
0 3 7 10 14
n=12
n=11
n=11
n=12
n=12
Figure 5: QI scores during the shelf life experiment. Median, 1st, 3rd quartiles, range and number (n) of panellists for each storage day evaluated.
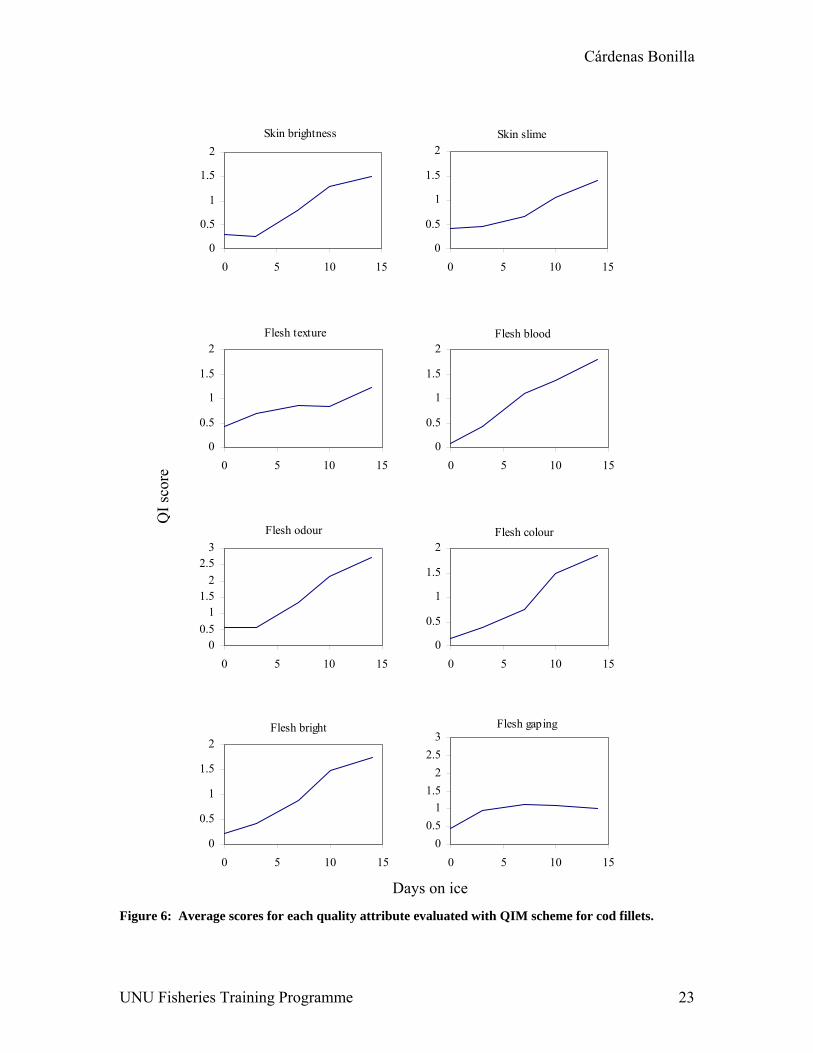
The QI scores for all quality parameters increased linearly with storage time on ice as shown in Figure 6. The scores for all evaluated parameters were around 0 at storage day zero. The flesh gaping parameter increased less with time, compared to other parameters. The scores for skin brightness, slime, flesh texture, blood, odour, and colour showed a sharp increase between days seven and 10.
UNU Fisheries Training Programme 22
Cárdenas Bonilla
Skin brightness
0
0.5
1
1.5
2
0 5 10 15
Skin slime
0
0.5
1
1.5
2
0 5 10 15
Flesh texture
0
0.5
1
1.5
2
0 5 10 15
Flesh blood
0
0.5
1
1.5
2
0 5 10 15
Flesh odour
00.5
11.5
22.5
3
0 5 10 15
Flesh colour
0
0.5
1
1.5
2
0 5 10 15
Flesh bright
0
0.5
1
1.5
2
0 5 10 15
QI s
core
Flesh gaping
00.5
11.5
22.5
3
0 5 10 15
Figure 6: Average scores for each quality attribute evaluated with QIM scheme for cod fillets.
Days on ice
UNU Fisheries Training Programme 23
Cárdenas Bonilla
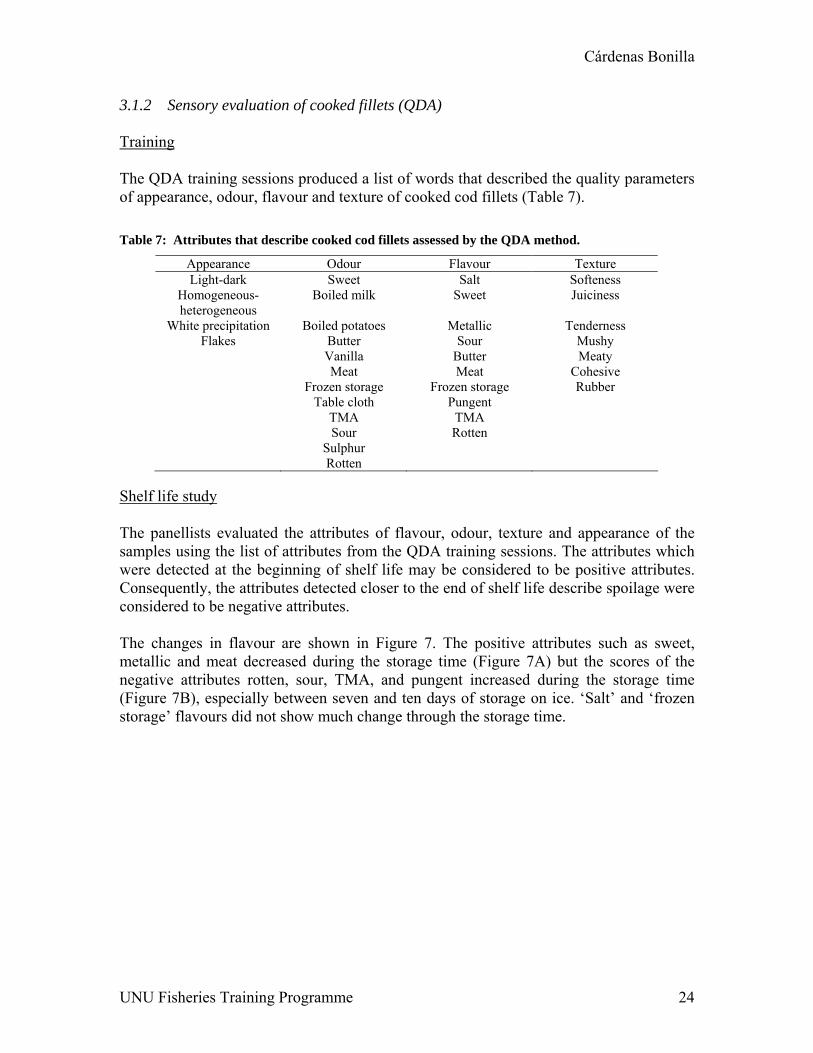
3.1.2 Sensory evaluation of cooked fillets (QDA) Training The QDA training sessions produced a list of words that described the quality parameters of appearance, odour, flavour and texture of cooked cod fillets (Table 7). Table 7: Attributes that describe cooked cod fillets assessed by the QDA method.
Appearance Odour Flavour Texture Light-dark Sweet Salt Softeness
Homogeneous-heterogeneous
Boiled milk Sweet Juiciness
White precipitation Boiled potatoes Metallic Tenderness Flakes Butter Sour Mushy
Vanilla Butter Meaty Meat Meat Cohesive Frozen storage Frozen storage Rubber Table cloth Pungent TMA TMA Sour Rotten Sulphur Rotten
Shelf life study The panellists evaluated the attributes of flavour, odour, texture and appearance of the samples using the list of attributes from the QDA training sessions. The attributes which were detected at the beginning of shelf life may be considered to be positive attributes. Consequently, the attributes detected closer to the end of shelf life describe spoilage were considered to be negative attributes. The changes in flavour are shown in Figure 7. The positive attributes such as sweet, metallic and meat decreased during the storage time (Figure 7A) but the scores of the negative attributes rotten, sour, TMA, and pungent increased during the storage time (Figure 7B), especially between seven and ten days of storage on ice. ‘Salt’ and ‘frozen storage’ flavours did not show much change through the storage time.
UNU Fisheries Training Programme 24

Cárdenas Bonilla
0
10
20
30
40
50
60
70
0 5 10 15Days on ice
QD
A sc
ore
Sweet MetallicButter Meat
A
0
10
20
30
40
50
60
70
0 5 10 15Days on ice
QD
A sc
ore
Salt Frozen storageSour PungentTMA Rotten
B
Figure 7: Positive (A) and negative (B) flavour attributes (average scores) of cooked cod fillets against days on ice observed by a trained QDA panel.
The changes in odour that indicated spoilage of the samples are shown in Figure 8. The scores of the positive attributes: boiled potatoes, boiled milk, sweet, vanilla and meat decreased with storage (Figure 8A), but negative attributes: sulphur, rotten, table cloth, TMA, sour increased rapidly from seven days of storage on ice (Figure 8B).
0
10
20
30
40
50
60
70
0 5 10 15Days on ice
QD
A sc
ore
Sweet Boiled milkBoiled potatoes ButterVanilla Meat
A
0
10
20
30
40
50
60
70
0 5 10 15Days on ice
QD
A sc
ore
Frozen storage Table clothTMA SourSulphur Rotten
B
Figure 8: Positive (A) and negative (B) odour attributes (average scores) of cooked cod fillets against days on ice observed by a trained QDA panel.
The changes in appearance of the samples are shown in Figure 9. There were increases in the scores of homogeneous/heterogeneous and light/dark. White precipitation increased at day three of storage but later did not show much change.
UNU Fisheries Training Programme 25
Cárdenas Bonilla
0
10
20
30
40
50
60
70
0 5 10 15Days on ice
QD
A sc
ore
Light/darkHomogeneneous/heterogeneousWhite precipitationFlakes
Figure 9: Changes in appearance (average scores) of cooked cod fillets observed by a trained QDA panel against days on ice.
The changes in texture of the samples are shown in Figure 10. The scores for softness and tenderness were high at day zero of storage on ice; they increased at day seven and then did not show much change during the storage time. Mushy, meaty and cohesive were scored between 20 and 40 at the beginning of the experiment and decreased at day 14.
0
10
20
30
40
50
60
70
0 5 10Days on ice
QD
A sc
ore
15
Softness Tenderness MushyMeaty Cohesive Rubber
Figure 10: Changes in texture of cooked (average scores) cod fillets observed by a trained QDA panel on ice.
3.1.3 Microbial counts The microbial counts increased with storage time (Figure 11). At the beginning of storage, the TVC was around 105 cfu/g and H2S-producing bacteria were 104 cfu/g, but they were
UNU Fisheries Training Programme 26

Cárdenas Bonilla
approximately 109 cfu/g for TVC and109 cfu/g for H2S-producing bacteria at the end of storage time.
0
2
4
6
8
10
0 3 6 9 12 15
Storage time (days)
Log
cfu/
g
Total Viable Count H2S-producing bacteria
Figure 11: Total viable counts and selective counts of H2S-producing bacteria in flesh of cod fillets stored on ice at 0–1°C against days on ice.
A high correlation was found between QI and TVC and selective counts of H2S-producing bacteria (Figure 12).
y = 2.826x - 12.803R2 = 0.944
02468
101214
4 5 6 7 8 9Log TVC cfu/g
QI s
core
y = 2.785x - 10.737R2 = 0.975
0246
8101214
4 5 6 7 8 9
Log H2S Producing-bacteria cfu/g
QI s
core
Figure 12: Correlation between bacteria counts in flesh and Quality Index of cod fillets stored on ice at 0–1°C.
UNU Fisheries Training Programme 27

Cárdenas Bonilla
3.2 Consumer study In this section, the consumer study is described through three stages: QDA for consumer study samples, consumer test and questionnaire. QDA for consumer study samples Trained panellists evaluated odour, appearance, flavour and texture of unfrozen wild, unfrozen farmed and frozen/thawed wild cod fillets using the QDA method. Differences among the samples were found for the perception of odour of the type ‘meat’ and ‘table-cloth’; appearance in terms of brightness and homogeneity; flavours of the type ‘metallic’, ‘meat’, ‘TMA’ and ‘frozen-storage’; and texture attributes of ‘tenderness’, ‘mushy’, ‘meaty’ and ‘rubber’ (Table 8). Multiple comparisons showed that differences were most often found between unfrozen farmed and frozen/thawed wild cod. Only frozen-storage flavour was different between frozen/thawed and unfrozen (wild and farmed) cod.
UNU Fisheries Training Programme 28
Cárdenas Bonilla
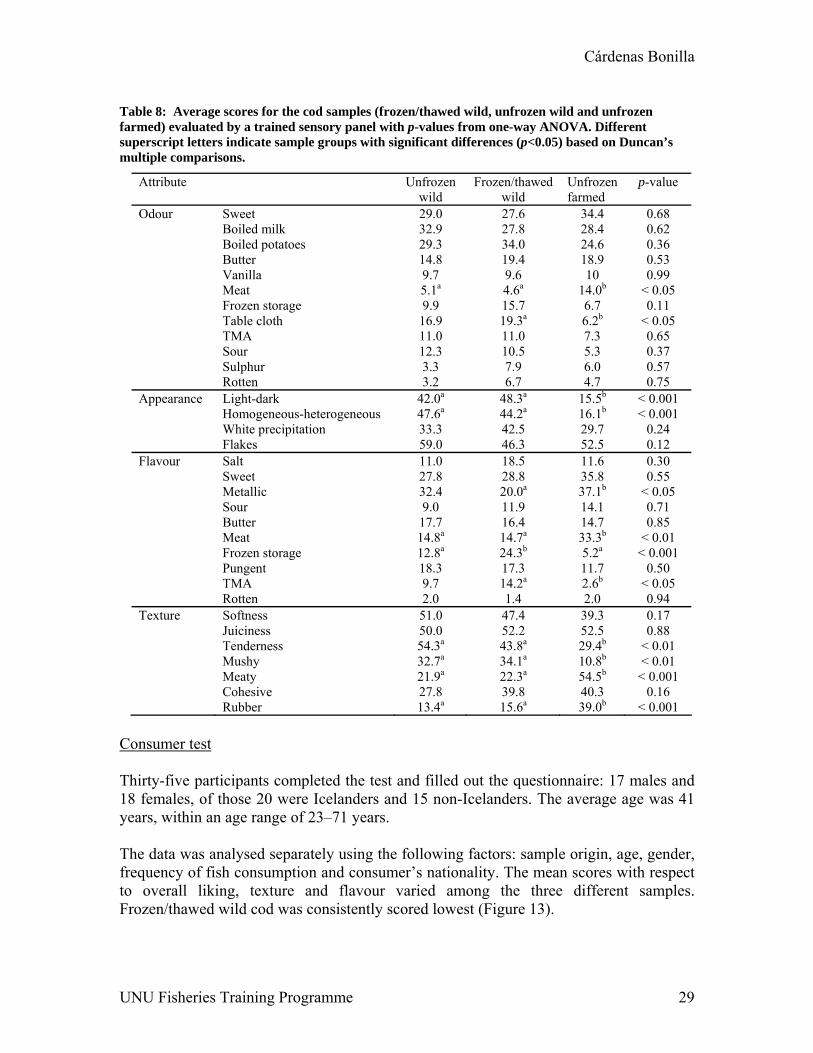
Table 8: Average scores for the cod samples (frozen/thawed wild, unfrozen wild and unfrozen farmed) evaluated by a trained sensory panel with p-values from one-way ANOVA. Different superscript letters indicate sample groups with significant differences (p<0.05) based on Duncan’s multiple comparisons.
Attribute Unfrozen wild
Frozen/thawed wild
Unfrozen farmed
p-value
Odour Sweet 29.0 27.6 34.4 0.68 Boiled milk 32.9 27.8 28.4 0.62 Boiled potatoes 29.3 34.0 24.6 0.36 Butter 14.8 19.4 18.9 0.53 Vanilla 9.7 9.6 10 0.99 Meat 5.1a 4.6a 14.0b < 0.05 Frozen storage 9.9 15.7 6.7 0.11 Table cloth 16.9 19.3a 6.2b < 0.05 TMA 11.0 11.0 7.3 0.65 Sour 12.3 10.5 5.3 0.37 Sulphur 3.3 7.9 6.0 0.57 Rotten 3.2 6.7 4.7 0.75 Appearance Light-dark 42.0a 48.3a 15.5b < 0.001 Homogeneous-heterogeneous 47.6a 44.2a 16.1b < 0.001 White precipitation 33.3 42.5 29.7 0.24 Flakes 59.0 46.3 52.5 0.12 Flavour Salt 11.0 18.5 11.6 0.30 Sweet 27.8 28.8 35.8 0.55 Metallic 32.4 20.0a 37.1b < 0.05 Sour 9.0 11.9 14.1 0.71 Butter 17.7 16.4 14.7 0.85 Meat 14.8a 14.7a 33.3b < 0.01 Frozen storage 12.8a 24.3b 5.2a < 0.001 Pungent 18.3 17.3 11.7 0.50 TMA 9.7 14.2a 2.6b < 0.05 Rotten 2.0 1.4 2.0 0.94 Texture Softness 51.0 47.4 39.3 0.17 Juiciness 50.0 52.2 52.5 0.88 Tenderness 54.3a 43.8a 29.4b < 0.01 Mushy 32.7a 34.1a 10.8b < 0.01 Meaty 21.9a 22.3a 54.5b < 0.001 Cohesive 27.8 39.8 40.3 0.16 Rubber 13.4a 15.6a 39.0b < 0.001
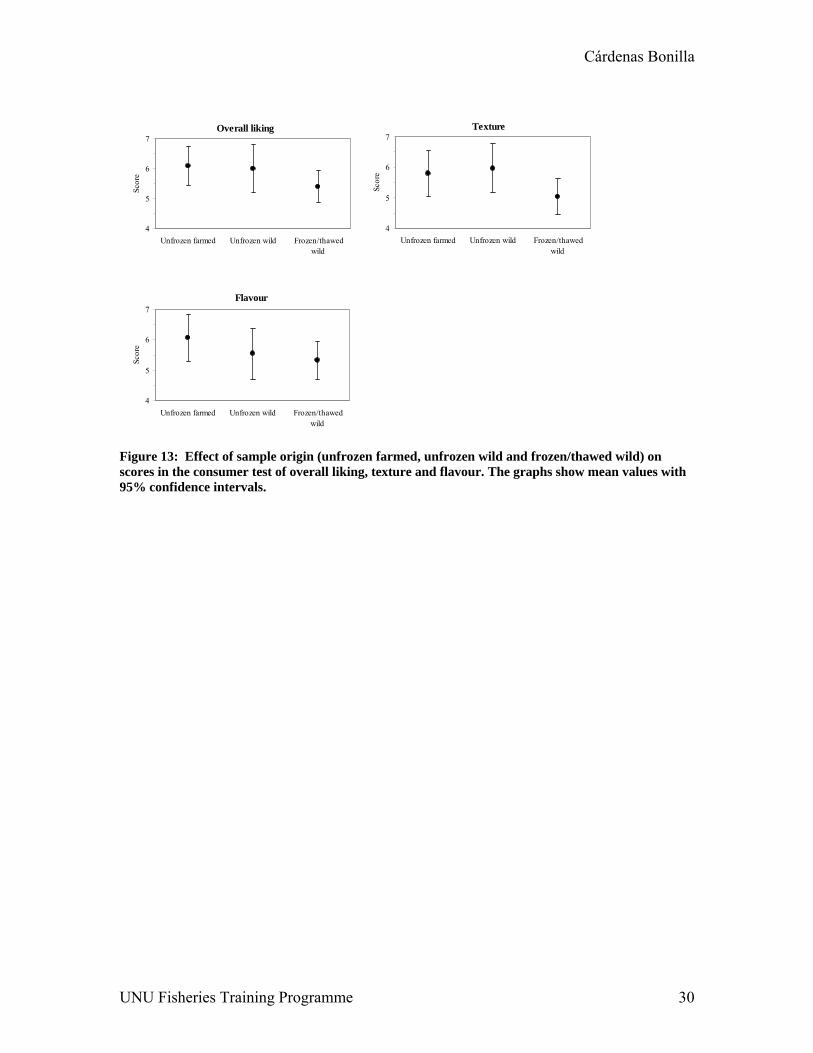
Consumer test Thirty-five participants completed the test and filled out the questionnaire: 17 males and 18 females, of those 20 were Icelanders and 15 non-Icelanders. The average age was 41 years, within an age range of 23–71 years. The data was analysed separately using the following factors: sample origin, age, gender, frequency of fish consumption and consumer’s nationality. The mean scores with respect to overall liking, texture and flavour varied among the three different samples. Frozen/thawed wild cod was consistently scored lowest (Figure 13).
UNU Fisheries Training Programme 29
Cárdenas Bonilla
Overall liking
4
5
6
7
Unfrozen farmed Unfrozen wild Frozen/thawedwild
Scor
eTexture
4
5
6
7
Unfrozen farmed Unfrozen wild Frozen/thawedwild
Scor
e
Flavour
4
5
6
7
Unfrozen farmed Unfrozen wild Frozen/thawedwild
Scor
e
Figure 13: Effect of sample origin (unfrozen farmed, unfrozen wild and frozen/thawed wild) on scores in the consumer test of overall liking, texture and flavour. The graphs show mean values with 95% confidence intervals.
UNU Fisheries Training Programme 30
Cárdenas Bonilla
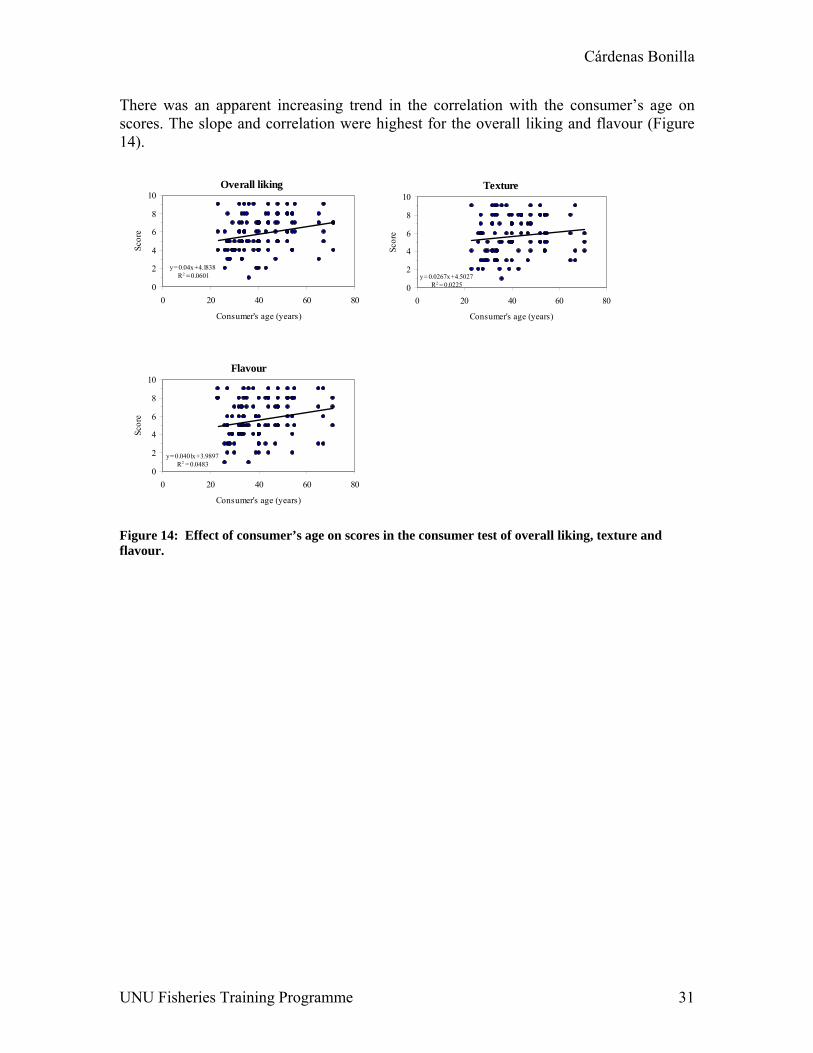
There was an apparent increasing trend in the correlation with the consumer’s age on scores. The slope and correlation were highest for the overall liking and flavour (Figure 14).
Overall liking
y = 0.04x + 4.1838R2 = 0.0601
0
2
4
6
8
10
0 20 40 60 80
Consumer's age (years)
Scor
e
Texture
y = 0.0267x + 4.5027R2 = 0.02250
2
4
6
8
10
0 20 40 60 80
Consumer's age (years)
Scor
e
Flavour
y = 0.0401x + 3.9897R2 = 0.0483
0
2
4
6
8
10
0 20 40 60 8
Consumer's age (years)
Scor
e
0
Figure 14: Effect of consumer’s age on scores in the consumer test of overall liking, texture and flavour.
UNU Fisheries Training Programme 31
Cárdenas Bonilla
Gender had no apparent effect on the perception scores (Figure 15).
Overall liking
4
5
6
7
Male Female
Scor
e
Texture
4
5
6
7
Male Female
Scor
e
Flavour
4
5
6
7
Male Female
Scor
e
Figure 15: Effect of consumer’s gender on scores in the consumer test of overall liking, texture and flavour. The graphs show mean values with 95% confidence intervals.
UNU Fisheries Training Programme 32

Cárdenas Bonilla
With respect to the effect of frequency of fish consumption on the perception results, the lowest scores, for all the three attributes were observed for the intermediate frequency of one to two times per week (Figure 16).
Overall liking
4
5
6
7
2-3 x per month 1-2 x per week ≥ 3 x per week
Scor
e
Texture
4
5
6
7
2-3 x per month 1-2 x per week ≥ 3 x per week
Scor
e
Flavour
4
5
6
7
2-3 x per month 1-2 x per week ≥ 3 x per week
Scor
e
Figure 16: Effect of frequency of fish consumption on scores in the consumer test of overall liking, texture and flavour. The graphs show mean values with 95% confidence intervals.
UNU Fisheries Training Programme 33

Cárdenas Bonilla
The effect of nationality on the perception results of overall liking, texture and flavour was apparent in that Icelandic consumers scored higher than non-Icelanders. This effect was most noticeable in the perception of flavour (Figure 17).
Overall liking
4
5
6
7
Icelander Non-Icelander
Consumer's nationality
Scor
e
Texture
4
5
6
7
Icelander Non-Icelander
Consumer's nationality
Scor
e
Flavour
4
5
6
7
Icelander Non-Icelander
Consumer's nationality
Scor
e
Figure 17: Effect of consumer’s nationality on scores in the consumer test of overall liking, texture and flavour. The graphs show means values with 95% confidence intervals.
In the stepwise regression, the selected models varied among the tested parameters (Table 9). With respect to overall liking, age was the only predictor variable that considerably explained the variation in the response variable. The scores increased, on average, with age. The final selected model for texture included frequency of fish consumption and sample origin. Texture was scored lowest for the frequency one to two times per week and highest for the frequency three and more times per week. Unfrozen wild cod received higher scores than unfrozen farmed cod, while both were preferred to the frozen/thawed wild cod. The stepwise procedure selected only consumer’s nationality as an important factor explaining the variation in perception of flavour. Icelanders scored this parameter higher (on average, by 1.2) than non-Icelanders. Table 9: Important variables and associated parameters of the stepwise regression to predict consumers’ perception.
Tested parameter
Variable entered Intercept Regression coefficient Std.
error t-value p
Overall Liking
Age 4.18 0.04 0.02 2.57 <0.05
Texture Frequency Sample origin
6.06 –1.03 (1–2 x per week) –0.34 (2–3 x per month)
–0.94 (wild frozen/thawed) –0.17 (farmed unfrozen)
0.47 0.59 0.49 0.49
–2.20 –0.58 –1.91 –0.35
<0.05 0.56 0.06 0.73
Flavour Nationality 4.96 1.20 (Icelander) 0.42 2.88 <0.01
UNU Fisheries Training Programme 34
Cárdenas Bonilla
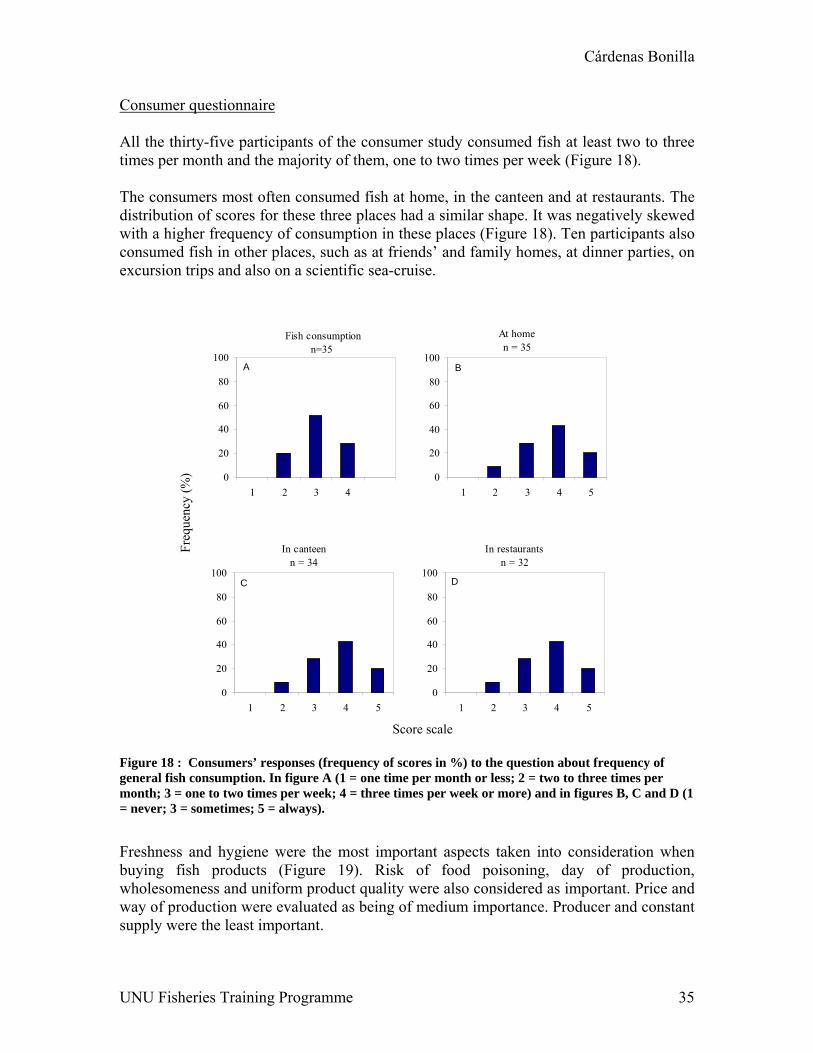
Consumer questionnaire All the thirty-five participants of the consumer study consumed fish at least two to three times per month and the majority of them, one to two times per week (Figure 18). The consumers most often consumed fish at home, in the canteen and at restaurants. The distribution of scores for these three places had a similar shape. It was negatively skewed with a higher frequency of consumption in these places (Figure 18). Ten participants also consumed fish in other places, such as at friends’ and family homes, at dinner parties, on excursion trips and also on a scientific sea-cruise.
Fish consumptionn=35
0
20
40
60
80
100
1 2 3 4
A
At homen = 35
0
20
40
60
80
100
1 2 3 4 5
B
In canteenn = 34
0
20
40
60
80
100
1 2 3 4 5
C
Freq
uenc
y (%
)
In restaurantsn = 32
0
20
40
60
80
100
1 2 3 4 5
D
e
Figure 18 : Consumers’ responses (frequency ogeneral fish consumption. In figure A (1 = one month; 3 = one to two times per week; 4 = thre= never; 3 = sometimes; 5 = always).
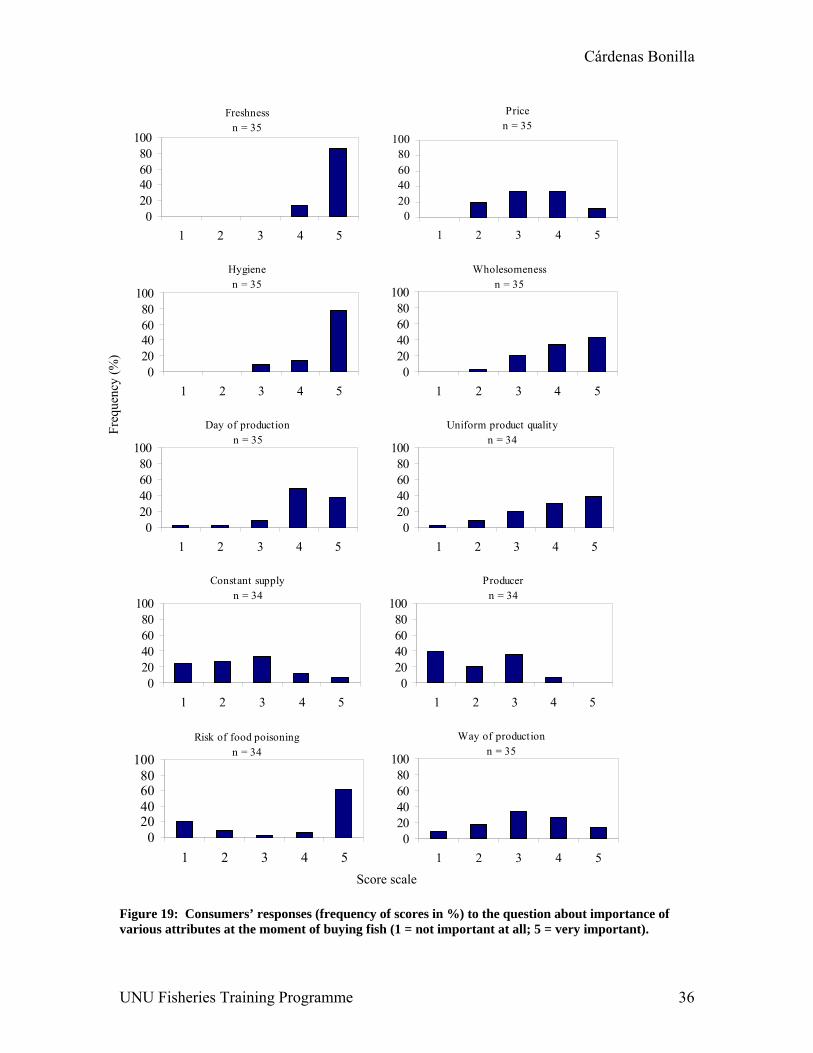
Freshness and hygiene were the most imbuying fish products (Figure 19). Rwholesomeness and uniform product qualway of production were evaluated as beinsupply were the least important.
UNU Fisheries Training Programme
Score scal
f scores in %) to the question about frequency oftime per month or less; 2 = two to three times per e times per week or more) and in figures B, C and D (1
portant aspects taken into consideration when isk of food poisoning, day of production, ity were also considered as important. Price and g of medium importance. Producer and constant
35
Cárdenas Bonilla
Freshnessn = 35
020406080
100
1 2 3 4 5
Pricen = 35
020406080
100
1 2 3 4 5
Hygienen = 35
020406080
100
1 2 3 4 5
Wholesomenessn = 35
020406080
100
1 2 3 4 5
Day of productionn = 35
020406080
100
1 2 3 4 5
Uniform product qualityn = 34
020406080
100
1 2 3 4 5
Constant supplyn = 34
020406080
100
1 2 3 4 5
Producern = 34
020406080
100
1 2 3 4 5
Risk of food poisoningn = 34
020406080
100
1 2 3 4 5
Way of productionn = 35
020406080
100
1 2 3 4 5
Freq
uenc
y (%
)
Score scale
Figure 19: Consumers’ responses (frequency of scores in %) to the question about importance of various attributes at the moment of buying fish (1 = not important at all; 5 = very important).
UNU Fisheries Training Programme 36

Cárdenas Bonilla
The consumers mainly bought fish from fish mongers and supermarkets (Figure 20). Buying fish directly from fishermen and through home delivery was considerably rarer. Obtaining fish from relatives and catching it (both of which do not involve paying for the product) was even rarer.
Home deliveryn = 34
0
20
40
60
80
100
1 2 3 4 5
Supermarketsn = 34
0
20
40
60
80
100
1 2 3 4 5
Fish mongersn = 34
0
20
40
60
80
100
1 2 3 4 5
Direct from the fishermenn = 33
0
20
40
60
80
100
1 2 3 4 5
From relativesn = 34
0
20
40
60
80
100
1 2 3 4 5
Catch it myselfn = 34
0
20
40
60
80
100
1 2 3 4 5
Freq
uenc
y (%
)
e Figure 20: Consumers’ responses (frequencyfish (1 = never; 3 = sometimes; 5 = always).
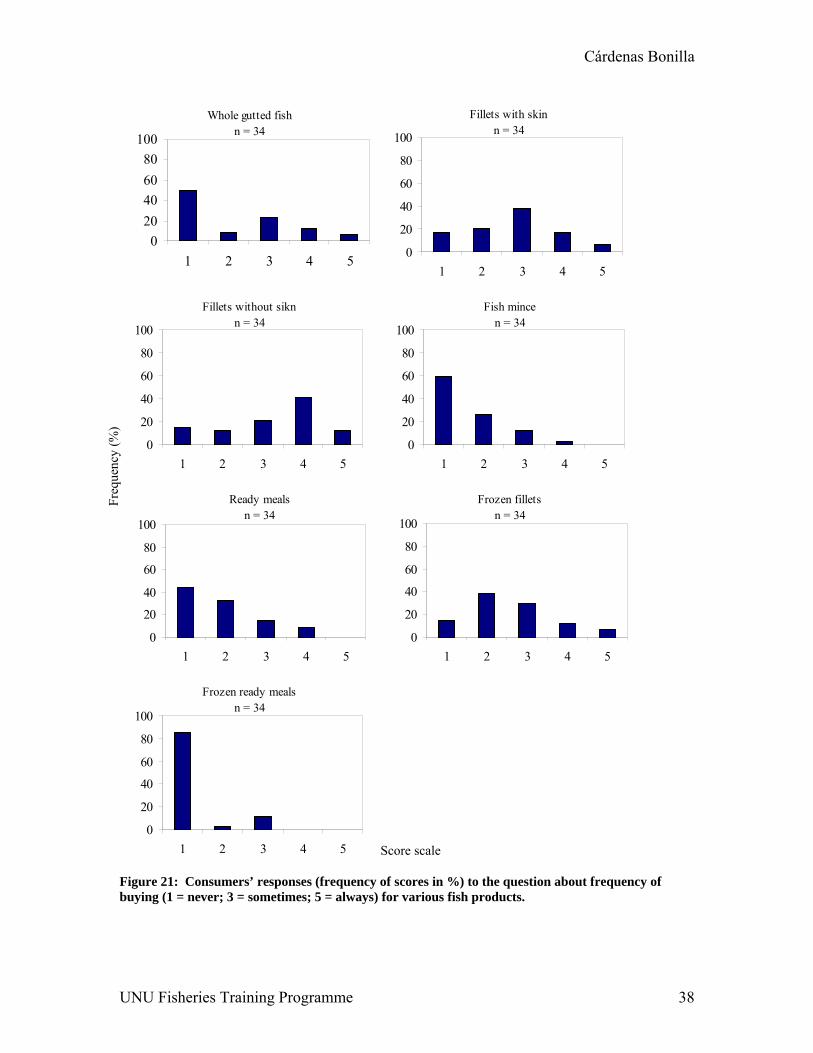
The most preferred fish products were(Figure 21). Frozen fillets were slightlyfish, fish mince and ready meals wedisliking for frozen ready meals. Shellungutted fish, and sun-dried and smokepurchased by the respondents.
UNU Fisheries Training Programme
Score scal
of scores in %) to the question about place for buying
fillets without skin followed by fillets with skin less appreciated than fresh fillets. Whole gutted
re rarely bought. The respondents had a strong fish, fish cheeks, marinated or salted fish, whole d fish were mentioned among other fish products
37
Cárdenas Bonilla
Whole gutted fishn = 34
020406080
100
1 2 3 4 5
Fillets with skinn = 34
0
20
40
60
80
100
1 2 3 4 5
Fillets without siknn = 34
0
20
40
60
80
100
1 2 3 4 5
Fish mincen = 34
0
20
40
60
80
100
1 2 3 4 5
Ready mealsn = 34
0
20
40
60
80
100
1 2 3 4 5
Frozen filletsn = 34
0
20
40
60
80
100
1 2 3 4 5
Frozen ready mealsn = 34
0
20
40
60
80
100
1 2 3 4 5
Freq
uenc
y (%
)
Score scale
Figure 21: Consumers’ responses (frequency of scores in %) to the question about frequency of buying (1 = never; 3 = sometimes; 5 = always) for various fish products.
UNU Fisheries Training Programme 38
Cárdenas Bonilla
4 DISCUSSION 4.1 Development and evaluation of the QIM scheme for fresh cod fillets The deteriorative changes occurring in cod fillets were observed during the pre-observation sessions. Changes occurred on the skin (dry surface and single scales lost) and flesh (dryness). These attributes were included in the pre-observation scheme, but they were omitted from the QIM scheme because they were not observed during the training sessions. The explanation could be that the samples were handled repeatedly during pre-observation, while during the training sessions each sample was evaluated only once. Larsen et al. (1992) used the QIM scheme for whole cod and reported that the parameters dealing with scales could not be evaluated in this species. The description of gaping used during the pre-observation sessions was modified to more precisely describe the attribute during the training sessions. The modified descriptions corresponded more with the number and deepness of gaping present in the fillet flesh. In the process of gaping, as described by Botta (1995), the flakes that are originally (in a fresh fillet) connected to each other by connective tissue separate and the fillet loses the appearance of a continuous muscle. Although this is a natural process and could clearly be seen during the pre-observation stage, it is likely that the repeated handling of fish accelerated the process. The fillets evaluated at the training sessions did not show such dramatic changes in gaping and scores for gaping did not change much after seven days of storage. The flesh texture was found to be rather difficult to evaluate during training. It varied and depended on where in the fillet it was evaluated. At the loin near to the neck it was always firm, but soft at the tail. Therefore, it is important to always evaluate the texture at the same spot in the fillet and give detailed guidelines to panellist. These guidelines include recommendations to evaluate the texture in the middle of the spine muscle by pressing a finger and observing if and how fast the flesh recovers (Martinsdóttir et al. 2001). The number of parameters included in the QIM scheme developed for fresh cod fillets was higher than that for thawed cod fillets developed by Warm et al. (1998) and used by Jensen and Jørgensen (1997). There were two differences between these two QIM schemes. One was that both authors considered presence of parasites as a parameter in the QIM scheme. Martinsdóttir and Stefansson (1984) developed a freshness quality grading scheme for cod fillets in which they suggested to add 0.05 to the average grade resulting from the evaluation of smell, gaping, blood veins and colour if there were worms. In the QIM scheme developed in this study, the presence of parasites was not considered to be related to freshness of fillets. However, parasites are present in the cod flesh and they contribute to an unpleasant appearance. This affects the total quality of the fish, but does not contribute to the freshness changes through storage time. Another difference between these two QIM schemes was that the QIM scheme developed in this study includes evaluation of skin. The reason for inclusion of this parameter was that some negative
UNU Fisheries Training Programme 39
Cárdenas Bonilla
changes were observed during the pre-observation stage which were subsequently confirmed during the training sessions. A high correlation was found between the total QI score (sum of all attributes) and the storage time, which shows that the attributes gradually deteriorated with time. The individual attributes were independent of each other, but all changed and received higher scores through increased storage time. Therefore, all of them should be used in the assessment of the freshness of cod fillets. The QI may be used to predict the remaining storage time with an accuracy of ± 1.3 day if three fillets from the same lot are assessed by a trained panel. Due to individual variations present in the samples (even from the same storage day), a minimum of three samples should be used to adequately assess the degree of gaping. According to the guidelines for freshness assessment of whole fish given by Martinsdóttir et al. (2001), a minimum of three (in large fish) to ten (in small fish) random samples should be taken to cover the biological differences in spoilage rate of fish. Sveinsdottir et al. (2002) reported that when more than three whole fish per batch of storage time were assessed, it could increase the precision of the prediction of storage time. Cod fillets reached the limits of acceptance between seven and ten days of storage according to the sensory evaluation of cooked cod. Then the panel detected unacceptable flavours and odours related to spoilage. This is a shorter shelf life compared to what has earlier been reported for cod fillets. A shelf life study of fresh fillets and skin-frozen fillets packed one day after being caught, and stored at 0°C, resulted in a shelf life of 13 days (Martinsdóttir et al. 2004). Vacuum packed cod fillets passed the limit of acceptability after 9–10 days of storage (Gram et al. 1987). Huss (1995) reported 14 days for packed cod at 0°C. The shorter storage life obtained in this study may be due to the storage time of the whole fish from catch until filleting, which was up to five days, and handling of the fish before filleting and conditions during filleting. The attributes TMA and rotten for odour and flavour showed that the scores increase above 30 (judged unacceptable for consumption by the panel at IFL sensory laboratory) between days seven and ten. Those odours and flavours had mainly microbial origin (Huss 1995). Growth curves for TVC and H2S producing bacteria counts had a very similar shape. This was in agreement with the study of Martinsdóttir and Magnússon (2001) on thawed cod fillets stored on ice at 0 and 4°C. The bacteria counts were between 107–108 cfu/g for TVC and 106–108 for H2S, producing bacteria counts at the limits of acceptability. The acceptability was, according to the sensory panel, between days seven and 10. The microbial counts were higher than that shown in a previous experiment done by Magnússon and Martinsdóttir (1995), in which they reported TVC of 106–107 cfu/g between days six and nine for cod fillets stored in ice at 0–1°C. Gram et al. (1987) reported TVC of 106–108 cfu/g and 106–107 for counts of H2S-producing bacteria between days nine and 10 on vacuum packed fillets stored at 0°C.
UNU Fisheries Training Programme 40

Cárdenas Bonilla
4.2 Consumer study The sensory evaluation carried out by a trained panel, showed that none of the samples used in the consumer study had reached the end of the shelf life, but the panellists found a difference between samples (unfrozen farmed, unfrozen wild and frozen/thawed wild) with regard to several sensory attributes. The frozen/thawed wild cod received the highest sensory scores for some of the so-called negative attributes (e.g. table cloth odour, TMA and frozen storage flavours). On the other hand, the unfrozen farmed cod had more meaty odour and flavour, lighter and more homogeneous appearance and more metallic flavour than unfrozen wild and frozen/thawed wild. The consumer study was conducted with a group of 35 persons. It could be questioned, if a sample of this size is representative and can generate meaningful results. Resurreccion (1998) mentions that usually 25–50 persons take part in this kind of test, but also that the statistical significance increases with 50–100 participants. A general tendency to buy fresh fish was observed among the consumers in the present study. This was, for example, seen in the high importance that consumers gave to the information about the day of production when buying fish. Nielsen et al. (2003) reported that consumers considered frozen fish as having less eating quality than fresh fish but at the same time as a convenient and cheaper product. The present study shows that there is no one single attribute that the consumer takes into consideration when he or she selects a product, but there is a group of aspects of which freshness is considered important. The mean scores obtained in the evaluation of overall liking, texture and flavour against sample origin were very similar. The consumers could not distinguish a difference between the products. In an in-home consumer study by Kole et al. (2003) farmed and wild cod perception was tested and the consumers perceived little differences between the two products. When the information about the sample origin was provided, wild cod received higher scores for overall ‘satisfaction’ and ‘attractiveness’ and also for perceived ‘odour’ and ‘colour’. Overall liking increased on average with age. This may indicate that acceptance of fish in general increases with age. Olsen (2003) points out that elderly people in general eat fish more often than younger people. One of the reasons could be that fish is generally associated with healthy food and people are more conscious with age. The differences in perception of texture that were found among the different products in the consumer test may not be meaningful as the products had different storage times; thus, their freshness varied accordingly. To study the real effect of product origin such as wild and farmed, it is necessary to use material of comparable freshness. It seems that consumers are able to distinguish between fresh and less fresh products. Sveinsdóttir et al. (2003b) reported that consumers found differences between samples stored for two and 10 days and preferred those stored for two days. This could have indicated that the freshness of the samples stored for 10 days was close to being unacceptable and such a product should not be sold to consumers.
UNU Fisheries Training Programme 41

Cárdenas Bonilla
Most of the participants in the consumer test consumed fish one to two times a week. In Iceland, a fish consumer is considered as regular, when he or she eats fish at least once a week (Sveinsdóttir et al. 2003b). This group of consumers gave in the present study consistently lower scores to all tested attributes than those who consumed fish at a lower and higher frequency. It is unclear why this pattern was observed and whether it is present in the whole population of consumers in general. This observation might result from the small consumer group size. A trend was found that Icelanders scored higher with respect to flavour, texture and overall liking (the perception attributes) than non-Icelanders. Flavour seems to be the major attribute that determines fish preference among Icelandic consumers. Sawyer et al. (1988) reported that flavour of fish was the most important factor which determined consumer acceptance. The different perception results by the two nationality categories in the present study might be related to frequency of fish consumption. Olsen (2003) points out that seafood consumption varies greatly across nations giving Iceland as an example of top consuming countries. However, this was not obvious from the present sample of consumers apparently due to the small sample size and a variety of nationalities in the category of ‘non-Icelanders’. To determine the real effect of nationality and frequency of fish consumption, further studies are required with a larger consumer group. There were no apparent preferences among the common places where fish is consumed (at home, in canteen and restaurants). On the other hand, the way in which fish products are acquired is of great importance to consumers. The respondents of the questionnaire were buying fish preferably at supermarkets or from fish mongers. Besides, they prefer preparing their meals from convenient products of high quality such as fillets without skin rather than whole gutted fish or fillets with skin. 5 CONCLUSIONS The use of the QIM scheme developed for fresh cod fillets in this study showed a clear linear relationship between the QI and storage time on ice. The QIM scheme consisted of eight parameters which gave a total of 18 demerit points. The maximum storage time was eight to 10 days on ice, determined by descriptive sensory evaluation. At the beginning of the storage time, small changes of the positive attributes of odour and flavour were observed. After the seventh day of storage they were not detectable, because of the increase of negative attributes. The unusually high microbial counts indicate that the handling in the chain from catch to storage affects negatively the quality of the fillets, resulting in an unusually short shelf life for cod fillets. The QI could be used to estimate the remaining storage time on ice with an accuracy of ± 1.3 days with a minimum of three fillets per lot. This information may be used in quality management of cod fillets stored on ice (assuming optimum storage conditions) to estimate the storage time. In the consumer study, the trained panel found a difference between the three different samples (unfrozen wild, unfrozen farmed and frozen/thawed cod). With regard to freshness, the sensory evaluation done by the sensory panel showed that the samples used
UNU Fisheries Training Programme 42

Cárdenas Bonilla
in the consumer study had not reached the end of the shelf life. The consumer test showed that the consumers could find difference in texture between unfrozen and frozen/thawed wild cod. To determine the real effect of freshness, further studies are required with samples with more differences in storage time. With regard to the sample origin, the consumers could not find differences between unfrozen wild and farmed cod. On the other hand, this study shows that there is a group of attributes that the consumers value when they select a product of which freshness is considered the most important.
UNU Fisheries Training Programme 43

Cárdenas Bonilla
ACKNOWLEDGEMENTS I would like to thank my supervisors Kolbrún Sveinsdóttir and Emilía Martinsdóttir for their active guidance, valuable advice and support during my stay in Iceland. I am very grateful to Tumi Tomasson, Thor Asgeirsson and Sigrídur Kr. Ingvarsdóttir for their assistance. I would like to thank the Fisheries Training Programme at the United Nations University and Research Centre for Food and Development for making it possible for me to attend this programme. I would also like to thank to Andrzej Jaworski for his guidance in statistical analysis, all the people who performed the sensory evaluation, the people who participated at the consumer survey and Ernesto from Machete Media for the photos included in this report.
UNU Fisheries Training Programme 44

Cárdenas Bonilla
LIST OF REFERENCES Andrade, A., Nunes, M.L. and Batista, I. 1997. Freshness quality grading of small pelagic species by sensory analysis. In Olafsdóttir, G., Luten, J., Dalgaard, P., Careche, M., Verrez-Bagnis, E., Martinsdótirr, E., and Heia, K. eds. Methods to determine the freshness of fish in research and industry. Proceedings of the Final Meeting of the Concerted Action Evaluation of Fish Freshness, pp. 333–338. Paris: International Institute of Refrigeration. Barbosa, A. and Vaz-Pires, P. 2004. Quality index method (QIM): development of a sensorial scheme for common octopus (Octopus vulgaris). Food Control 15: 161–168. Bremner, H.A. 1985. A convenient easy to use system for estimating the quality of chilled seafood. Fish Processing Bulletin 7: 59–70. Botta, J.R. 1995. Evaluation of seafood freshness quality. pp. 65–97. New York: VCH Publishers Chytiri, S., Chouliara, I., Savvaidis, I.N. and Kontominas, M.G. 2004. Microbiological, chemical and sensory assessment of iced whole and filleted aquacultured rainbow trout. Food Microbiology 21: 157–165. Department of Primary Industries and Fisheries 2005. Queensland Government [January 2005] <http://www.dpi.qld.gov.au/home/default.html> EC 1996. Council of the European Union. Council Regulation No. 2406/96 of November 26, 1996. Laying down common marketing standards for certain fishery products. Official Journal of the European Communities No. L334: 9–13. Gram, L., Trolle, G. and Huss, H.H. 1987. Detection of specific spoilage bacteria from fish stored at low (0°C) and high (20°C) temperatures. International Journal of Food Microbiology 4(1): 65–72. Huidobro, A., Pastor, A. and Tejada, M. 2000. Quality Index Method Developed for Raw Gilthead Seabream (Sparus aurata). Journal of Food Science 65(7): 1202–1205. Huss, H.H. 1995. Quality and quality changes in fresh fish. FAO Fisheries Technical Paper 348. pp. 130–131. Rom: FAO. Hyldig, G. and Nielsen, J. 1997. A rapid sensory method for quality management. In Olafsdóttir G, Luten J, Dalgaard P, Careche M, Verrez-Bagnis E, Martinsdóttir E, and Heia K. eds. Methods to Determine the Freshness of Fish in Research and Industry. Proceedings of the Final Meeting of the Concerted Action Evaluation of Fish Freshness, pp. 297–305. Paris: International Institute of Refrigeration.
UNU Fisheries Training Programme 45
Cárdenas Bonilla
Hyldig, G. and Nielsen, J. 2004. QIM-a tool for determination of fish freshness. In Shahidi, F. and Simpson, B.K. eds. Seafood Quality and Safety. Advances in the New Millennium. pp. 81–89. St. John’s, NL: ScienceTech Publishing Company. Ihaka, R. and Gentleman, R. 1996. R: A Language for Data Analysis and Graphics. Journal of Computational and Graphical Statistics 5(3): 299–314. Jellinek, G. 1985. Sensory Evaluation of Food: Theory and Practice. p. 17. England: Ellis Horwood Ltd. Jensen, H.S. and Jørgensen, B.M. 1997. A sensometric approach to cod-quality measurement. Food Quality and Preference 8(5/6):403–407. Jonsdottir, S. 1992. Quality index method and TQM system. In Olafsson, R. and Ingthorsson, A.H. eds. Quality Issues in the Fish Industry. Proceedings from the COMETT Conference Course: Quality Issues in the Fish Industry, European Cooperation. Reykjavik Iceland. September 1992. pp. 81–94. Kole, A., Luten, J.B., Schelvis, R., Heide, M., Carlehög, M., Akse, L. and Richardsen, R. 2003. Consumer perception of wild and farmed cod under different information conditions: Two in-home consumers studies. In Proceedings of the TAFT 2003 Conference. First Joint Trans-Atlantic Fisheries Technology Conference, 33rd WEFTA Meeting and 48th Atlantic Fisheries Technology Conference. 111 p. Iceland. Larsen, E., Heldbo, J., Jespersen, C.M. and Nielsen, J. 1992. Development of a method for quality assessment of fish for human consumption based on sensory evaluation. In Huss, H.H., Jakobsen, M., and Liston, J. eds. Quality Assurance in the Fish Industry. Amsterdam: Elsevier Science Publishing. pp. 351–358. Luten, J.B. 2000. Development and implementation of a computerised sensory system (QIM) for evaluation fish freshness. CRAFT FAIR CT97 9063. Final report for the period from 01-01-98 to 31-03-00. RIVO. Wageningen, The Netherlands: The Netherlands Institute for Fisheries Research. Luten, J.B. and Martinsdóttir, E. 1997. QIM: a European tool for fish freshness evaluation in the fishery chain. In Olafsdóttir, G., Luten, J., Dalgaard, P., Careche, M., Verrez-Bagnis, E., Martinsdótirr, E., and Heia, K. eds. Methods to Determine the Freshness of Fish in Research and Industry. Proceedings of the Final Meeting of the Concerted Action Evaluation of Fish Freshness. Paris: International Institute of Refrigeration. pp. 287–296. Magnússon, H. and Martinsdóttir, E. 1995. Storage quality of fresh and frozen-thawed fish in ice. Journal of Food Science 60(2): 273–278.
UNU Fisheries Training Programme 46
Cárdenas Bonilla
Martinsdóttir, E. 2002. Quality management of stored fish. In Bremner, H.A. ed. Safety and Quality Issues in Fish Processing. pp. 360–378. England: Woodhead Publishing Limited. Martinsdóttir, E. and Stefánsson, G. 1984. Development of a new grading system for fresh fish. In Möller, A. ed. Fifty Years of Fisheries Research in Iceland. Papers Presented at the Jubilee Seminar of the Icelandic Fisheries Laboratories. pp.45–59. Iceland: Icelandic Fisheries Laboratories. Martinsdóttir, E. and Arnason, A. 1992. Redfish, kapittel 4. Sluttraport. In Nordic Industrial Fund. Quality Standards for Fish: Final Report Phase II. pp. 21–35. Martinsdóttir, E. and Magnússon, H. 2001. Keeping quality of sea-frozen thawed cod fillets on ice. Journal of Food Science 66(9): 1401–1408. Martinsdóttir, E., Sveinsdottir, K., Luten, J.B., Schelvis-Smit, R., Hyldig, G. 2001. Reference manual for the fish sector: sensory evaluation of fish freshness. QIM Eurofish. P.O. Box. 68, 1970 AB IJumiden, The Netherlands. Martinsdóttir, E., Guðbjörnsdóttir, B., Lauzon, H.L., Ólafsdóttir, G., Þóroddsson, Þ., Tryggvadóttir, S.T. and Arnarson, G.Ö. 2004. Effects of skin freezing on the quality of fish fillets. Icelandic Fisheries Laboratories Report Summary. 69 p. Iceland: Icelandic Fisheries Laboratories. Meilgaard, M., Civille, G.V. and Carr, B.T. 1999. Sensory Evaluation Techniques. 3rd edition. 387 pp. New York: CRC Press. Nielsen, J., Listov-Saabye, F. and Jensen, K.N. 2003. A consumer view of frozen fish. In Proceedings of the TAFT 2003 Conference. First Joint Trans-Atlantic Fisheries Technology Conference, 33rd WEFTA Meeting and 48th Atlantic Fisheries Technology Conference.. Iceland. pp. 116–118. Oehlenschläger, J. 1997. Sensory evaluation in inspection. In Olafsdóttir, G., Luten, J., Dalgaard, P., Careche, M., Verrez-Bagnis, E., Martinsdótirr, E. and Heia, K. eds. Methods to Determine the Freshness of Fish in Research and Industry. Proceedings of the Final Meeting of the Concerted Action Evaluation of Fish Freshness. Paris: International Institute of Refrigeration pp. 339–334. Oehlenschläger, J. 2002. Influence of different pre-storage treatments on resulting shelf life of iced-stored Barents-sea cod. Journal of Aquatic Food Product Technology 11(3/4): 187–200. Ólafsdóttir, G., Martinsdóttir, E., Oehlenschläger, J., Dalgaard, P., Jensen, B., Undeland, I., Mackie, I.M., Henehan, G., Nielsen, J. and Nilsen, H. 1997. Methods to evaluate fish freshness in research and industry. Trends in Food Science & Technology 8: 258–265.
UNU Fisheries Training Programme 47
Cárdenas Bonilla
Olsen, S.O. 2003. Antecedents of seafood consumption behaviour. In Proceedings of the TAFT 2003 Conference. First Joint Trans-Atlantic Fisheries Technology Conference, 33rd WEFTA Meeting and 48th Atlantic Fisheries Technology Conference. Iceland. pp. 99–105. QIM-Eurofish 2004. QIM – your ideal tool for quality determination of fish freshness [January 2005] <http//:www.qim-eurofish.com>. Resurreccion, A.V.A. 1998. Consumer Sensory Testing for Product Development. pp. 9–42. Maryland: Aspen Publishers, Inc. Sawyer, F.M., Cardillo, A.V. and Prell, P.A. 1988. Consumer evaluation of the sensory properties of fish. Journal of Food Science 53(1): 12–18. SE 1994a. Secretaria de Economia. NMX-FF-001-1994-SCFI. Fish products. Oyster in shell. Specifications. pp. 6–7. Mexico, D.F.: Official Federation Diary. SE 1994b. Secretaria de Economia. NMX-FF-002-1994-SCFI. Fish products. Refrigerated freshwater fish. Specifications. pp. 6–8. Mexico, D.F.: Official Federation Diary. SE 1996. Secretaria de Economia. NMX-F-540-1996-SCFI. Fish products freshness determination. Test method. pp. 10. Mexico, D.F.: Official Federation Diary. SE 1999. Secretaria de Economia. NMX-F-559-SCFI-1999. Fish products. Refrigerated fresh shrimp. Specification. pp. 9. Mexico, D.F.: Official Federation Diary. SE 2000. Secretaria de Economia. NMX-F-574-SCFI-2000. Fish products. Frozen fresh back of tuna. Specifications. pp. 7–8. Mexico, D.F.: Official Federation Diary. SE 2001. Secretaria de Economia. NMX-FF-085-SCFI-2001. Fish products. Live Lobster. Specifications. pp. 4–5. Mexico, D.F.: Official Federation Diary. SE 2004. Secretaria de Economia. NMX-F-101-SCFI-2004. Fish products. Refrigerated fresh seawater fish. Specifications. pp. 7. Mexico, D.F.: Official Federation Diary. Shewan, J.M., Macintosh, R.G., Tucker, C.G. and Ehrenberg, A.S.C. 1953. The development of a numerical scoring system for the sensory assessment of the spoilage of wet white fish stored in ice. Journal of the Science of Food and Agriculture. 4(6): 283–298. Stone, H. and Sidel, J.L. 1985. Sensory Evaluation Practices. pp. 194–226. Florida: Academic Press, Inc. Stone, H. and Sidel, J.L. 1998. Quantitative descriptive analysis: developments, applications and the future. Food Technology 52(8): 48–52.
UNU Fisheries Training Programme 48
Cárdenas Bonilla
Sveinsdottir, K., Martinsdottir, E., Hyldig, G., Jorgensen, B. and Kristbergsson, K. 2002. Application of Quality Index Method (QIM) scheme in shelf-life study of farmed Atlantic salmon (Salmo salar). Journal of Food Science 67(4): 1570–1579. Sveinsdottir, K., Hyldig, G., Martinsdottir, E., Jorgensen, B. and Kristbergsson, K. 2003a. Quality Index Method (QIM) scheme developed for farmed Atlantic salmon (Salmo salar). Food Quality and Preference 14: 237–245. Sveinsdottir, K., Þorkelsdóttir, A., and Martinsdottir, E. 2003b. Consumer survey: Cod fillets packaged in air and modified atmosphere (MAP). In Proceedings of the TAFT 2003 Conference. First Joint Trans-Atlantic Fisheries Technology Conference, 33rd WEFTA Meeting and 48th Atlantic Fisheries Technology Conference.. Iceland. pp. 112–114. Venables, W.N. and Ripley, B.D. 2002. Modern Applied Statistics with S. 4th ed. New York: Springer. Warm, K., Bøknæs, N. and Nielsen, J. 1998. Development of Quality Index Methods for evaluation of frozen cod (Gadus morhua) and cod fillets. Journal of Aquatic Food Product Technology 7(1): 45–59.
UNU Fisheries Training Programme 49
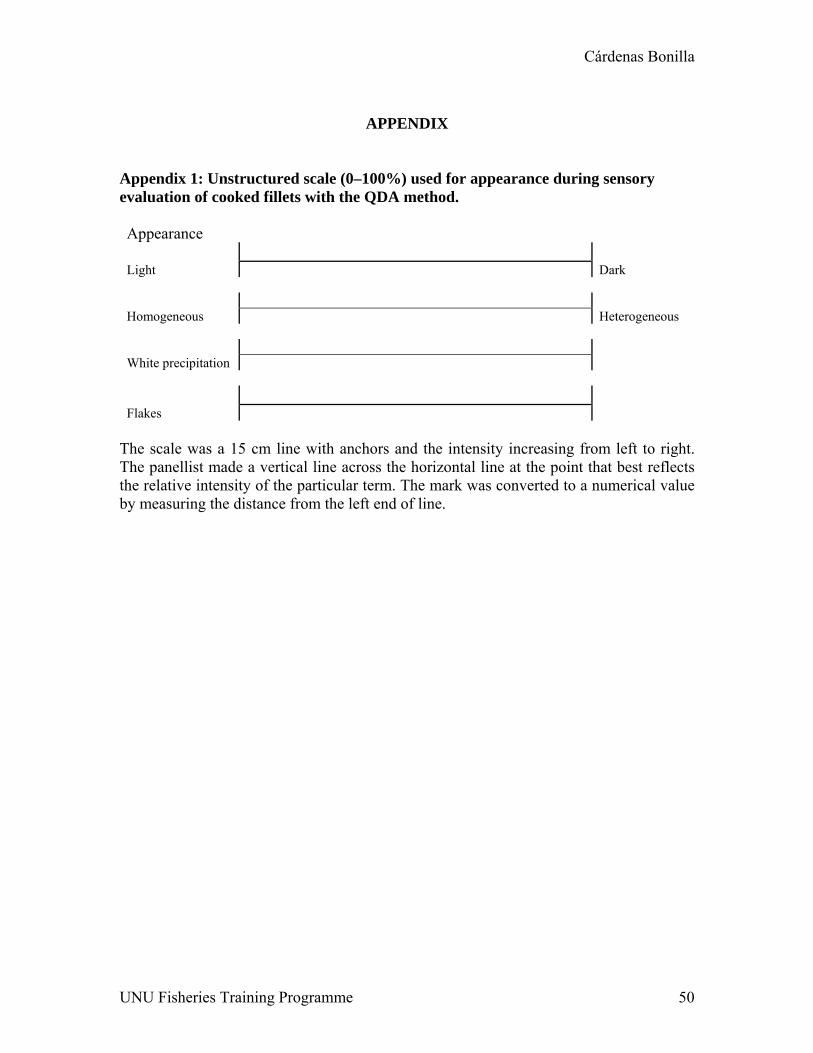
Cárdenas Bonilla
APPENDIX
Appendix 1: Unstructured scale (0–100%) used for appearance during sensory evaluation of cooked fillets with the QDA method. Appearance Light Dark Homogeneous Heterogeneous White precipitation Flakes
The scale was a 15 cm line with anchors and the intensity increasing from left to right. The panellist made a vertical line across the horizontal line at the point that best reflects the relative intensity of the particular term. The mark was converted to a numerical value by measuring the distance from the left end of line.
UNU Fisheries Training Programme 50
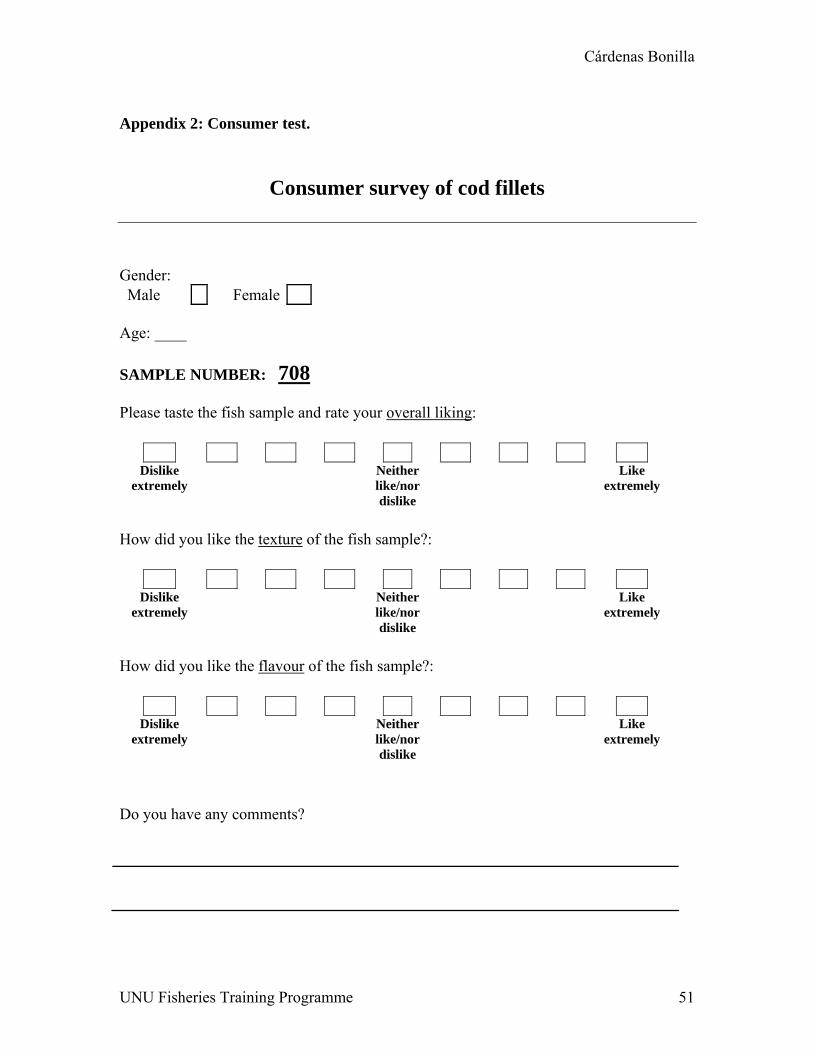
Cárdenas Bonilla
Appendix 2: Consumer test.
Consumer survey of cod fillets
Gender: Male Female
Age: ____ SAMPLE NUMBER: 708 Please taste the fish sample and rate your overall liking:
Dislike extremely
Neither like/nor dislike
Like extremely
How did you like the texture of the fish sample?:
Dislike extremely
Neither like/nor dislike
Like extremely
How did you like the flavour of the fish sample?:
Dislike extremely
Neither like/nor dislike
Like extremely
Do you have any comments?
UNU Fisheries Training Programme 51

Cárdenas Bonilla
Appendix 3: Consumer questionnaire Consumer survey of cod fillets
1. Gender: male female 2. Age: years 3. How often do you consume fish?
1x per month or less
2-3 x per month
1-2x per week
3x per week or more
4. Where do you consume fish: how often on the scale 1-5? Please answer all never sometimes always 1 2 3 4 5 At home In canteen In restaurants Elsewhere If elsewhere, then where? 5. When you buy fish, how important are the following topics on the scale 1-5? Please answer all Not important
at all Very
important 1 2 3 4 5 Freshness Price Hygiene Wholesomeness Day of production Uniform product quality
UNU Fisheries Training Programme 52

Cárdenas Bonilla
Constant supply Producer Risk of food poisoning Way of production 6. How often do you buy or provide fish from potentials listed below on the scale 1-5? Please answer all never sometimes always 1 2 3 4 5 Home delivery Supermarkets Fish mongers Direct from the fisherman From relatives Catch it myself 7. How often do you choose to buy fish it in the following way on the scale 1-5? Please answer all never sometimes always 1 2 3 4 5 Whole gutted fish Fillets with skin Fillets without skin Fish mince Ready meals Frozen fillets Frozen ready meals Other? Then what …………
UNU Fisheries Training Programme 53