Embed Size (px)
Citation preview
Solid Earth, 7, 727–739, 2016
www.solid-earth.net/7/727/2016/
doi:10.5194/se-7-727-2016
© Author(s) 2016. CC Attribution 3.0 License.
Development of a numerical workflow based on µ-CT imaging for
the determination of capillary pressure–saturation-specific
interfacial area relationship in 2-phase flow pore-scale porous-media
systems: a case study on Heletz sandstone
Aaron Peche1,2, Matthias Halisch3, Alexandru Bogdan Tatomir2, and Martin Sauter2
1Leibniz-Universität Hannover, Institute of Fluid Mechanics and Environmental Physics, Appelstraße 9A,
30167 Hannover, Germany2Georg-August Universität Göttingen, Department of Applied Geology, Goldschmidtstraße 3, 37077 Göttingen, Germany3Leibniz Institute for Applied Geophysics, Department 5, Petrophysics and Borehole Geophysics, Stilleweg 2,
30655 Hannover, Germany
Correspondence to: Aaron Peche ([email protected])
Received: 29 February 2016 – Published in Solid Earth Discuss.: 8 March 2016
Revised: 7 April 2016 – Accepted: 20 April 2016 – Published: 4 May 2016
Abstract. In this case study, we present the implementa-
tion of a finite element method (FEM)-based numerical pore-
scale model that is able to track and quantify the propa-
gating fluid–fluid interfacial area on highly complex micro-
computed tomography (µ-CT)-obtained geometries. Special
focus is drawn to the relationship between reservoir-specific
capillary pressure (pc), wetting phase saturation (Sw) and
interfacial area (awn). The basis of this approach is high-
resolutionµ-CT images representing the geometrical charac-
teristics of a georeservoir sample. The successfully validated
2-phase flow model is based on the Navier–Stokes equations,
including the surface tension force, in order to consider cap-
illary effects for the computation of flow and the phase-field
method for the emulation of a sharp fluid–fluid interface.
In combination with specialized software packages, a
complex high-resolution modelling domain can be obtained.
A numerical workflow based on representative elementary
volume (REV)-scale pore-size distributions is introduced.
This workflow aims at the successive modification of model
and model set-up for simulating, such as a type of 2-phase
problem on asymmetricµ-CT-based model domains. The ge-
ometrical complexity is gradually increased, starting from
idealized pore geometries until complex µ-CT-based pore
network domains, whereas all domains represent geostatis-
tics of the REV-scale core sample pore-size distribution. Fi-
nally, the model can be applied to a complex µ-CT-based
model domain and the pc–Sw–awn relationship can be com-
puted.
1 Introduction
Understanding the evolution of the fluid–fluid interfaces in
2-phase flow in porous-media systems is relevant for a se-
ries of engineering and technological applications (e.g. car-
bon capture and storage (CCS), nuclear waste repository, oil
recovery; Hassanizadeh and Gray, 1990; Joekar-Niasar et al.,
2008; Niessner and Hassanizadeh, 2008; Reeves and Celia,
1996). The quantity of the (typically unknown parameter)
interfacial area between two phases restricts kinetic inter-
phase mass and energy transfer (Ahrenholz et al., 2011). In
numerical modelling with classical macro-scale flow mod-
els, these processes are not properly taken into account
(Muccino et al, 1998; Ahrenholz et al., 2011). Here, aver-
aged quantities neglecting the interfacial area are often used
(Tatomir et al., 2015), which are described to lead to neg-
ligence of kinetics of mass transfer, assuming local equilib-
rium (Niessner and Hassanizadeh, 2009). In order to resolve
this, the capillary pressure(pc)-wetting phase saturation(Sw)-
interfacial area(awn) relationship using the concept of spe-
Published by Copernicus Publications on behalf of the European Geosciences Union.
728 A. Peche et al.: Development of a numerical workflow based on µ-CT imaging
cific interfacial area per volume described by Hassanizadeh
and Gray (1990) can be used.
Based on an extended form of Darcy’s law (consider-
ing fluid–fluid friction force and interfacial forces), the
mathematical fundamentals of pore-scale 2-phase flow re-
garding the pc–Sw–awn relationship, are given in Has-
sanizadeh and Gray (1980, 1990, 1993) and Niessner and
Hassanizadeh (2008). The derivation of this porous-media-
specific pc–Sw–awn relationship can be realized using phys-
ical experiments e.g. in the form of micromodels as de-
scribed amongst others in Karadimitriou et al. (2013, 2014),
Karadimitriou and Hassanizadeh (2012) and Lenormand and
Touboul (1988). Corresponding numerical models are given,
amongst others, in Ahrenholz et al. (2011) and Porter et
al. (2009). These specific approaches succeed in deriving the
pc–Sw–awn relationship, but are based on Lattice-Boltzmann
simulations, which are considered to be elegant but are lim-
ited by computational resources (White et al., 2006). Gen-
erally, the derivation of this parametric relationship on the
pore scale requires a high computational effort as well as a
complex numerical model. Arzanfudi and Al-Khoury (2015)
present a finite element method (FEM)-based model that is
able to simulate CO2 leakage through a wellbore. In that
one-dimensional approach, the moving CO2–water interface
is successfully traced using the level-set method. Akhlaghi
Amiri and Hamouda (2013) evaluate two approaches for dy-
namic interface tracking: the level-set method and the phase-
field method for two-dimensional FEM-based modelling of
2-phase flow with viscosity contrast in a dual-permeability
porous medium. Both approaches are able to quantify the
specific interfacial area between the fluids. They conclude
that the phase-field method is more successful in complicated
porous media, gives more realistic results regarding pressure
gradients and fluid profiles and they observed less computa-
tion time compared with the level-set method.
Several experimental and numerical approaches were de-
veloped to measure the interfacial area between the two fluid
phases. Current research in the field of CCS focuses on the
design and development of field investigation techniques al-
lowing short response times in on-site plume monitoring
and detection. Detection and quantification of the CO2–brine
fluid–fluid interface could be realized using kinetic interface
sensitive (KIS) tracers as described in Schaffer et al. (2013).
Several mathematical models for immiscible 2-phase flow
and KIS tracer transport in porous media were developed in
Tatomir et al. (2013, 2014) and Tatomir et al. (2015), whereas
the latter also considers compositional effects. In Tatomir
et al. (2015) a 2-phase four -component flow and transport
model is realized with a kinetic mass transfer of tracers be-
tween the two fluids, taking the dissolution of CO2 and brine
into account. The pc–Sw–awn relationship is seen as an ex-
tension to the standard Brooks–Corey model (Brooks and
Corey, 1964).
The modelling approaches by Tatomir et al. (2013, 2014)
and Tatomir et al. (2015) require the a priori knowledge of
the fluid–fluid-solid system-specific pc–Sw–awn constitutive
relationship (Tatomir et al., 2013).
The present article presents the corresponding model de-
veloped for deriving this specific pc–Sw–awn constitutive re-
lationship. In this study, a finite element method (FEM)-
based pore-scale model is used in order to determine the dy-
namic evolution of the CO2–water interface in geometries
with a gradually increasing level of complexity. Within this
case study, we present the workflow that enables the deriva-
tion of pc–Sw–awn relationships of sandstone core-sample-
based model domains. We describe a feasible and relatively
simple numerical model that enables the dynamic fluid–fluid
interface tracking on micro-computed tomography (µ-CT)-
obtained geometries. Initial and boundary conditions as well
as spatial and temporal discretization are derived using a
novel approach, taking simplified idealized geometries based
on REV-scale pore geometry statistics into account.
Besides using the resulting pc–Sw–awn relationship as in-
put for the model given by Tatomir et al. (2015), this work
contributes to designing the KIS tracer laboratory experi-
ments described in Tatomir et al. (2015). Furthermore, the
derived relationship aims at improving the characterization
of the Heletz sandstone reservoir (Edlmann et al., 2016;
Niemi et al., 2016; Tatomir et al., 2016).
2 Heletz georeservoir geology and mineralogy
The sandstone sample on which this case study is based orig-
inates from Heletz, Israel, which is a scientifically motivated
deep saline CO2 storage pilot site (Niemi et al., 2016). This
CO2 injection site extends to depths of 1300 to 1500 m over
an area of 22 km2. The reservoir itself consists of sandstone
layers overlaid by an impermeable cap rock consisting of
shale and marl. A detailed description of the site geology
is given in Tatomir et al. (2016) and Niemi et al. (2016).
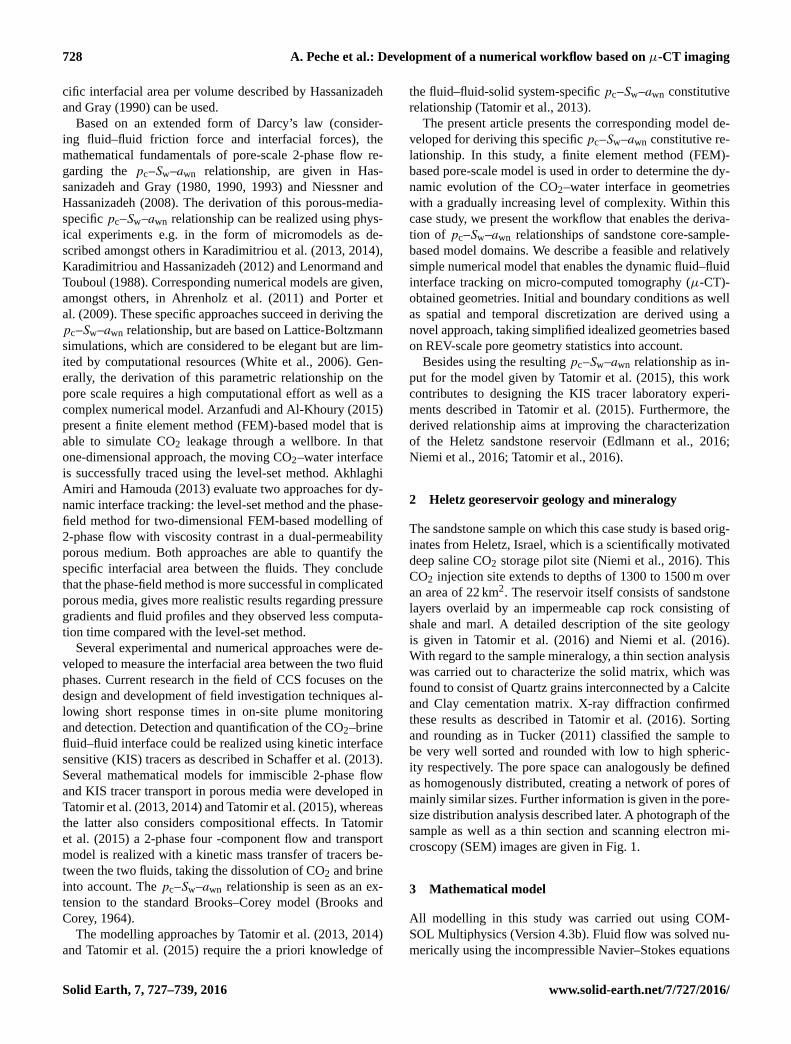
With regard to the sample mineralogy, a thin section analysis
was carried out to characterize the solid matrix, which was
found to consist of Quartz grains interconnected by a Calcite
and Clay cementation matrix. X-ray diffraction confirmed
these results as described in Tatomir et al. (2016). Sorting
and rounding as in Tucker (2011) classified the sample to
be very well sorted and rounded with low to high spheric-
ity respectively. The pore space can analogously be defined
as homogenously distributed, creating a network of pores of
mainly similar sizes. Further information is given in the pore-
size distribution analysis described later. A photograph of the
sample as well as a thin section and scanning electron mi-
croscopy (SEM) images are given in Fig. 1.
3 Mathematical model
All modelling in this study was carried out using COM-
SOL Multiphysics (Version 4.3b). Fluid flow was solved nu-
merically using the incompressible Navier–Stokes equations
Solid Earth, 7, 727–739, 2016 www.solid-earth.net/7/727/2016/
A. Peche et al.: Development of a numerical workflow based on µ-CT imaging 729
Figure 1. Top left: photograph of a well core sample. Top right: thin
section image of the sample confirming the well sorted and rounded
character. Labels mark the main mineral components quartz, calcite,
clay and the pore space. Bottom left: SEM image showing a plane
view on a mineral conglomerate of quartz grains interconnected by
clayey and carbonatic cement. Bottom right: SEM image highlight-
ing the partially significant amount of cementation (modified from
Tatomir et al., 2016).
(NSEs) as governing equations. Defining a Newtonian fluid
of constant density and laminar flow enables us to solve
the governing equations in the form of momentum balance
(Eq. 1) and continuity (Eq. 2) as follows (Cengel and Cim-
bala, 2013):
ρDu
Dt=−∇p+µ∇2u+Fst+ ρg (1)
∇ × u= 0, (2)
where ∇ is the nabla operator and t , p, ρ, µ, u, g, T and Fst
denote time, pressure, density, dynamic viscosity, velocity,
gravity, matrix transpose superscript and a surface-tension
force component respectively. The latter was added in order
to include pore-scale-dependent capillary effects. For simpli-
fication, gravity was neglected.
Sharp fluid–fluid interface tracking was realized by imple-
menting the phase-field method as described amongst oth-
ers in Kim (2012). Here, interfaces are defined as regions
of rapid change in an auxiliary parameter P or phase field
(Popatenko, 2007). Phase change occurs at −1< P < 1.
The change of phase component concentration over time
can be described as the product of diffusion coefficient and
chemical potential known as the Cahn–Hilliard equation
(Cahn and Hilliard, 1958). In the present model, this equa-
tion is used in the form of Eq. (3) using the terms mobility
γ , predefined interface thickness ε, mixing energy density λ
and a phase field help variable 9 comprising the chemical
potential. The latter is calculated according to Eq. (4).
∂P
∂t+ u×∇P =∇ ×
γ λ
ε2×∇9 (3)
9 =−∇ε2∇P + (P 2
− 1)P (4)
The typical interface thickness parameter is ε = hc/2,
whereas hc is the characteristic spatial mesh element size
at interface position. Calculating the surface tension coeffi-
cient σ = 2√
23
λε
in the form of energy per area (Woodruff,
1973) derives the mixing energy density λ= 3σε
2√
2. The mo-
bility is solved mathematically using γ = χε2 with the man-
ually chosen mobility tuning parameter χ (here: χ = 1). Vol-
ume fractions of fluid 1 (f1) and fluid 2 (f2) can then be
calculated according to Vf1 =1−P
2and Vf2 =
1+P2
. Prior to
computation, ρ and µ of both fluids have to be defined. In
the phase transition zone, ρmix and µmix are calculated ac-
cording to Eq.(5) and Eq.(6).
ρmix = ρf1+ (ρf2− ρf1)×Vf2 (5)
µmix = µf1+ (µf2−µf1)×Vf2 (6)
4 Model validation
The model described in this study was validated by repro-
duction of three analytical solutions. First validation refers to
single-phase flow and second and third validation at 2-phase
flow and fluid–fluid interface tracking.
The NSE model is validated by simulating plane Poiseuille
flow. This type of problem describes pressure-driven
steady, incompressible laminar viscous flow through a two-
dimensional channel (Rogers, 1992). Within the channel, a
parabolic velocity profile forms and the maximum velocity
(umax) is in the channel centre. This can be calculated us-
ing Eq. (7) derived from the NSEs (Pillai and Ramakrishnan,
2006):
umax =h2
8µ
(−∂p
∂x
). (7)
Here, h, mu and∂p∂x
denote the channel height, dynamic
viscosity and change of pressure over channel length re-
spectively. More detailed descriptions about plane Poiseuille
flow are given amongst others in Chughtai et al. (2009) and
Shahriari et al. (2013). Comparing the results of the analyti-
cal solution with the corresponding umax obtained from mod-
elling (based on a channel geometry of length and height of
approx. x = 146 and h= 48µm, whereas the latter represents
the mean pore diameter of the complex µ-CT based geome-
try) gave a deviation of 1umax = 0.05 %. Thus, the compu-
tation of plane Poiseuille flow can be seen as precise. Here
it has to be stated that the channel length was extended on
www.solid-earth.net/7/727/2016/ Solid Earth, 7, 727–739, 2016
730 A. Peche et al.: Development of a numerical workflow based on µ-CT imaging
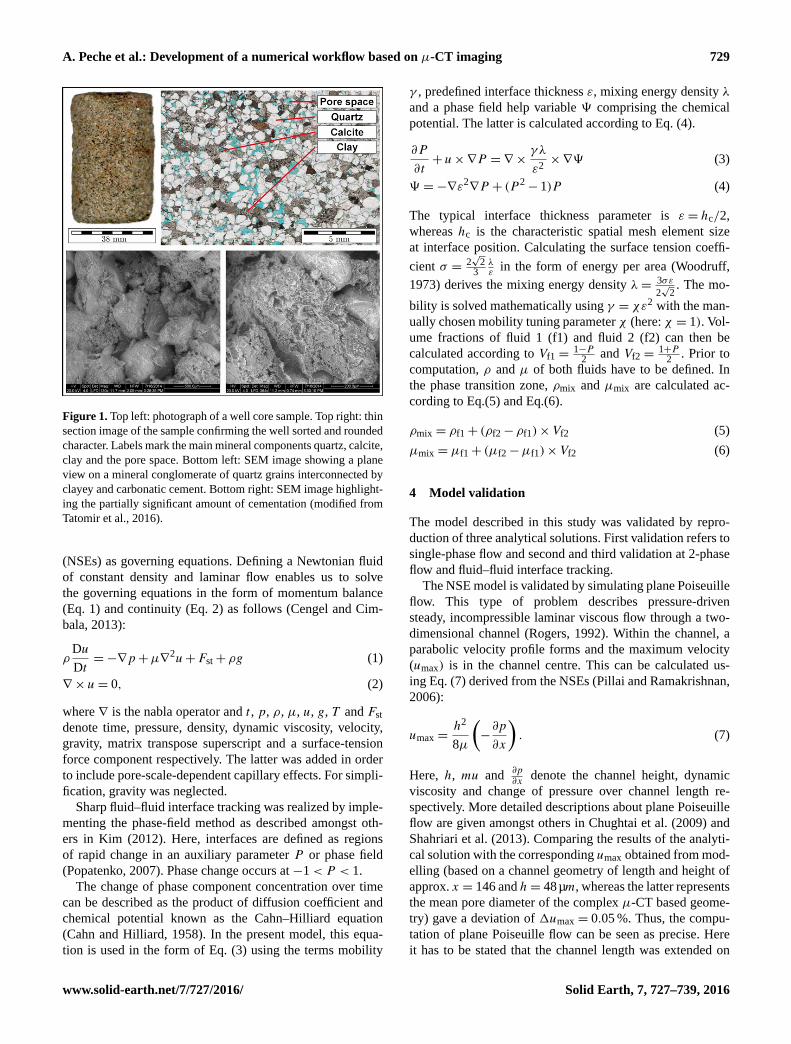
Figure 2. Model set-up for the model validation using plane
Poiseuille flow. Coloured lines indicate isolines of velocity, whereas
blue and red colours define lower and higher velocities respectively.
The subgeometry used for the analysis is marked by the black box.
both sides by a correction length xcorr = 1/2× x in order to
neglect boundary in- and outflow effects. These extensions
were neglected for the validation analysis. A visualization of
the model set-up as well as model results in the form of iso-
lines of velocities is given in Fig. 2.
For the validation of the phase-field method regarding the
emulation of the sharp fluid–fluid interface, the Rayleigh-
Taylor instability has been numerically designed and mod-
elled. In principle, the Rayleigh-Taylor instability is de-
scribed as the gravity-driven unstable displacement of a light
fluid f2 with a heavy fluid f1 (Lord Rayleigh and Strutt, 1883;
Taylor, 1950; Mikaelian, 2014). Initial separation of both flu-
ids is given by a cosine-shaped interface of the amplitude η0.
Over time, f1 breaks into f2 causing a characteristic inter-
face amplitude change∂η∂t
. With regard to the characteristic∂η∂t
, Mikaelian (2014) defines three stages of the Rayleigh-
Taylor instability in the form of linear, nonlinear and tur-
bulent regimes. At the transition of nonlinear to turbulent
regime (later time steps at η(wavelengthλ)= λ2π
, Anuchina
et Al., 1978; Kordilla, 2014), the interface amplitude change
can be described mathematically as follows (Read, 1984;
Youngs, 1984):
η(t)= αqAgt2. (8)
A, g and t are Atwood number (dimensionless density
ratio: A= [ρ1− ρ2]/ [ρ1+ ρ2]), gravitational acceleration
and time respectively, while αq is a growth rate coef-
ficient that should range within 0.01 and 0.08 (Glimm
et al., 2001). Modelling was carried out within a geom-
etry, based on the auxiliary parameter dp = 0.048 m de-
scribing a rectangular shape of width w = dp and height
h= 2dp. The initial cosine-shaped interface was defined
as a function y = dp+ 0.05× dp× cos(x) with a vector
x = (0, π4π2
3π4π 3π
4π2π4,0) separating f1 representing H2O
(ρH2O = 999.6 kg m−3) and f2 as supercritical CO2 (ρCO2=
700 kg m−3). Boundary conditions were set to no slip and
modelling was solved transiently over a time interval t =
0.75 s using a direct MUMPS (MUltifrontal Massively Paral-
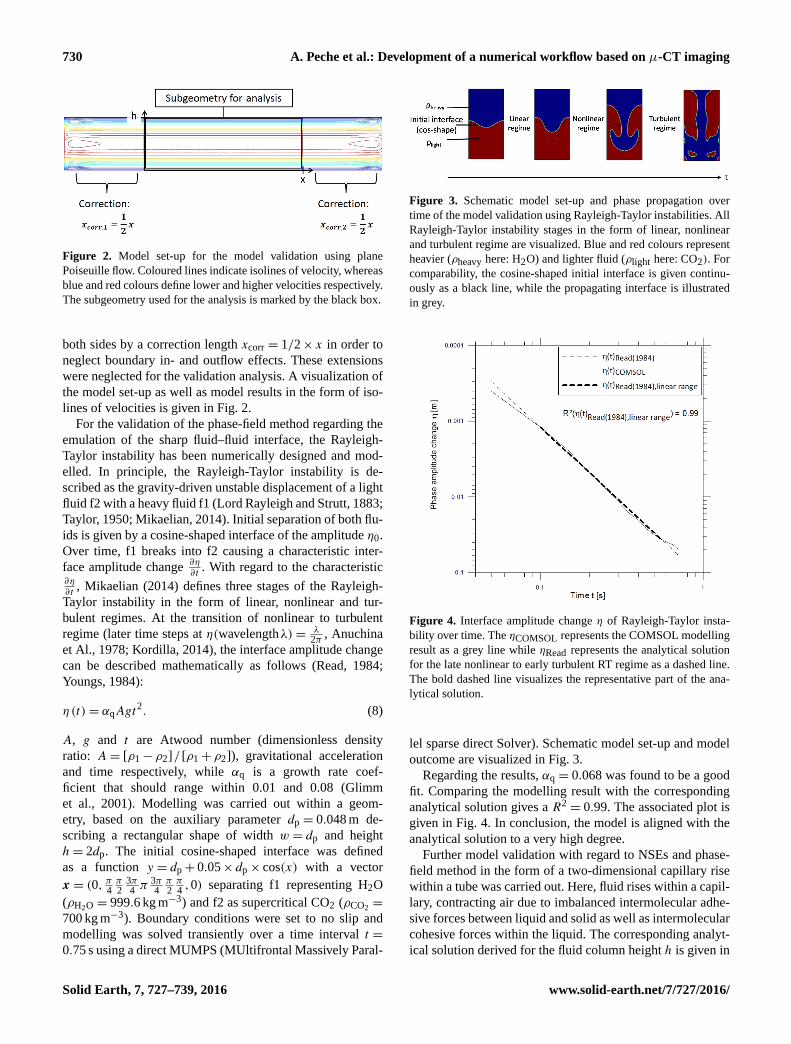
Figure 3. Schematic model set-up and phase propagation over
time of the model validation using Rayleigh-Taylor instabilities. All
Rayleigh-Taylor instability stages in the form of linear, nonlinear
and turbulent regime are visualized. Blue and red colours represent
heavier (ρheavy here: H2O) and lighter fluid (ρlight here: CO2). For
comparability, the cosine-shaped initial interface is given continu-
ously as a black line, while the propagating interface is illustrated
in grey.
Figure 4. Interface amplitude change η of Rayleigh-Taylor insta-
bility over time. The ηCOMSOL represents the COMSOL modelling
result as a grey line while ηRead represents the analytical solution
for the late nonlinear to early turbulent RT regime as a dashed line.
The bold dashed line visualizes the representative part of the ana-
lytical solution.
lel sparse direct Solver). Schematic model set-up and model
outcome are visualized in Fig. 3.
Regarding the results, αq = 0.068 was found to be a good
fit. Comparing the modelling result with the corresponding
analytical solution gives a R2= 0.99. The associated plot is
given in Fig. 4. In conclusion, the model is aligned with the
analytical solution to a very high degree.
Further model validation with regard to NSEs and phase-
field method in the form of a two-dimensional capillary rise
within a tube was carried out. Here, fluid rises within a capil-
lary, contracting air due to imbalanced intermolecular adhe-
sive forces between liquid and solid as well as intermolecular
cohesive forces within the liquid. The corresponding analyt-
ical solution derived for the fluid column height h is given in
Solid Earth, 7, 727–739, 2016 www.solid-earth.net/7/727/2016/
A. Peche et al.: Development of a numerical workflow based on µ-CT imaging 731
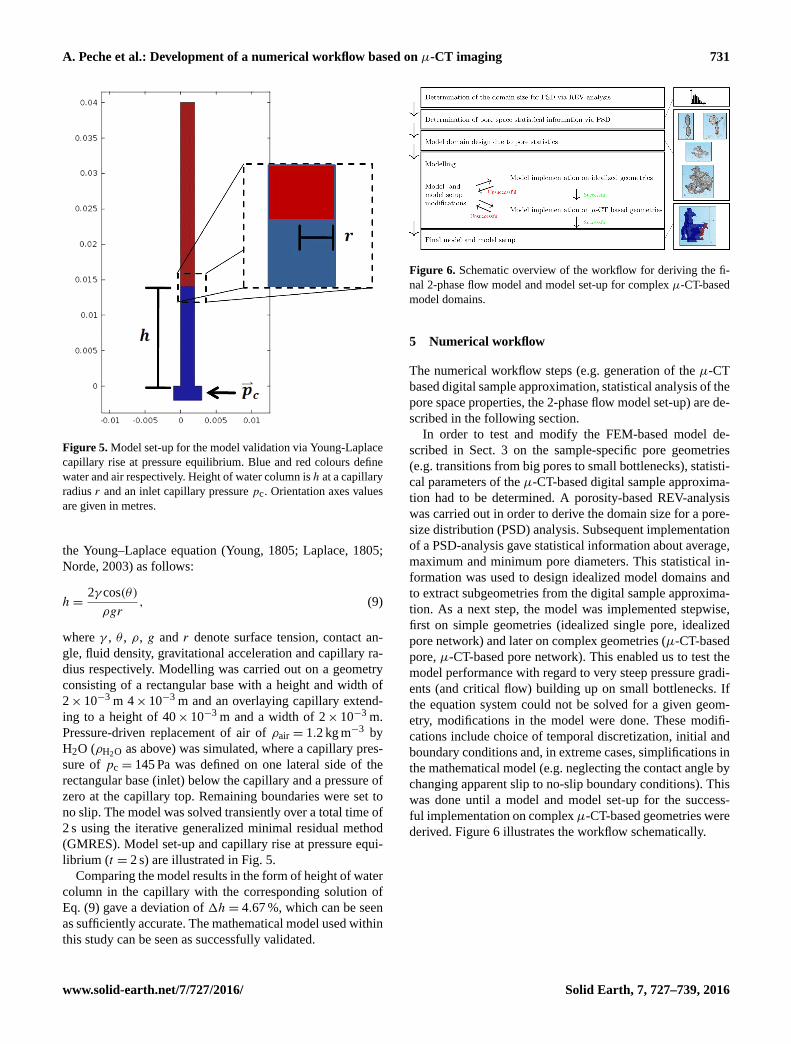
Figure 5. Model set-up for the model validation via Young-Laplace
capillary rise at pressure equilibrium. Blue and red colours define
water and air respectively. Height of water column is h at a capillary
radius r and an inlet capillary pressure pc. Orientation axes values
are given in metres.
the Young–Laplace equation (Young, 1805; Laplace, 1805;
Norde, 2003) as follows:
h=2γ cos(θ)
ρgr, (9)
where γ , θ , ρ, g and r denote surface tension, contact an-
gle, fluid density, gravitational acceleration and capillary ra-
dius respectively. Modelling was carried out on a geometry
consisting of a rectangular base with a height and width of
2× 10⁻³ m 4× 10⁻³ m and an overlaying capillary extend-
ing to a height of 40× 10−3 m and a width of 2× 10⁻³ m.
Pressure-driven replacement of air of ρair = 1.2 kg m−3 by
H2O (ρH2O as above) was simulated, where a capillary pres-
sure of pc = 145 Pa was defined on one lateral side of the
rectangular base (inlet) below the capillary and a pressure of
zero at the capillary top. Remaining boundaries were set to
no slip. The model was solved transiently over a total time of
2 s using the iterative generalized minimal residual method
(GMRES). Model set-up and capillary rise at pressure equi-
librium (t = 2 s) are illustrated in Fig. 5.
Comparing the model results in the form of height of water
column in the capillary with the corresponding solution of
Eq. (9) gave a deviation of 1h= 4.67 %, which can be seen
as sufficiently accurate. The mathematical model used within
this study can be seen as successfully validated.
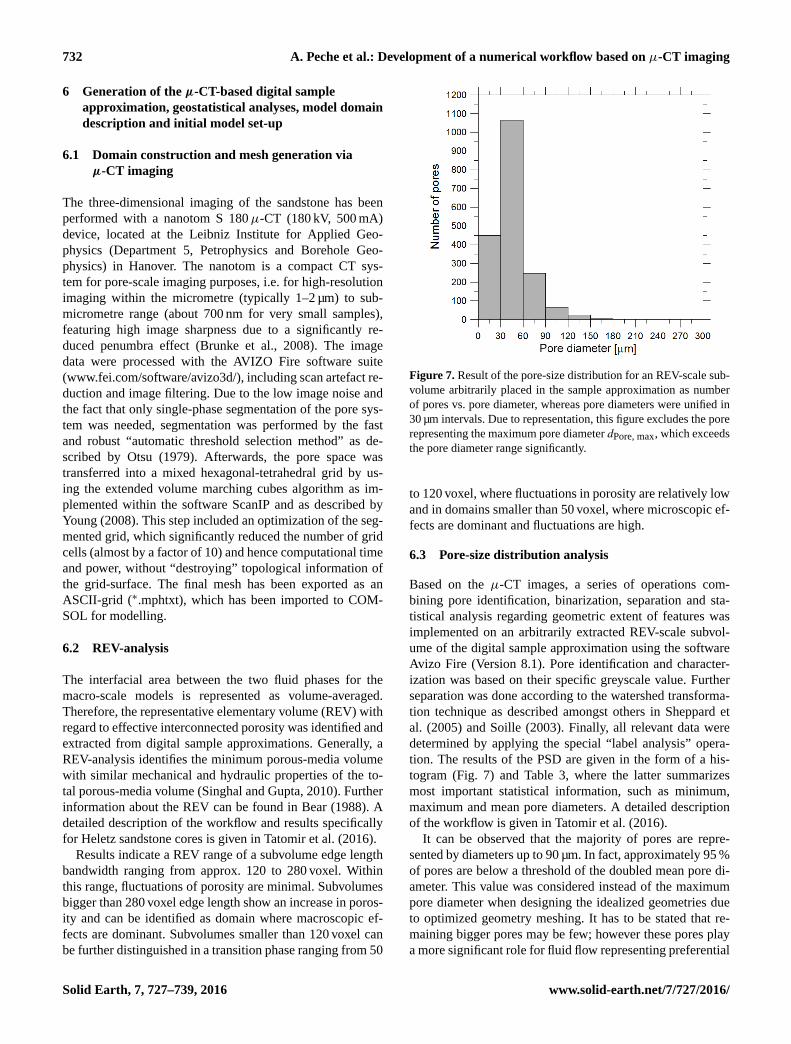
Figure 6. Schematic overview of the workflow for deriving the fi-
nal 2-phase flow model and model set-up for complex µ-CT-based
model domains.
5 Numerical workflow
The numerical workflow steps (e.g. generation of the µ-CT
based digital sample approximation, statistical analysis of the
pore space properties, the 2-phase flow model set-up) are de-
scribed in the following section.
In order to test and modify the FEM-based model de-
scribed in Sect. 3 on the sample-specific pore geometries
(e.g. transitions from big pores to small bottlenecks), statisti-
cal parameters of the µ-CT-based digital sample approxima-
tion had to be determined. A porosity-based REV-analysis
was carried out in order to derive the domain size for a pore-
size distribution (PSD) analysis. Subsequent implementation
of a PSD-analysis gave statistical information about average,
maximum and minimum pore diameters. This statistical in-
formation was used to design idealized model domains and
to extract subgeometries from the digital sample approxima-
tion. As a next step, the model was implemented stepwise,
first on simple geometries (idealized single pore, idealized
pore network) and later on complex geometries (µ-CT-based
pore, µ-CT-based pore network). This enabled us to test the
model performance with regard to very steep pressure gradi-
ents (and critical flow) building up on small bottlenecks. If
the equation system could not be solved for a given geom-
etry, modifications in the model were done. These modifi-
cations include choice of temporal discretization, initial and
boundary conditions and, in extreme cases, simplifications in
the mathematical model (e.g. neglecting the contact angle by
changing apparent slip to no-slip boundary conditions). This
was done until a model and model set-up for the success-
ful implementation on complexµ-CT-based geometries were
derived. Figure 6 illustrates the workflow schematically.
www.solid-earth.net/7/727/2016/ Solid Earth, 7, 727–739, 2016
732 A. Peche et al.: Development of a numerical workflow based on µ-CT imaging
6 Generation of the µ-CT-based digital sample
approximation, geostatistical analyses, model domain
description and initial model set-up
6.1 Domain construction and mesh generation via
µ-CT imaging
The three-dimensional imaging of the sandstone has been
performed with a nanotom S 180µ-CT (180 kV, 500 mA)
device, located at the Leibniz Institute for Applied Geo-
physics (Department 5, Petrophysics and Borehole Geo-
physics) in Hanover. The nanotom is a compact CT sys-
tem for pore-scale imaging purposes, i.e. for high-resolution
imaging within the micrometre (typically 1–2 µm) to sub-
micrometre range (about 700 nm for very small samples),
featuring high image sharpness due to a significantly re-
duced penumbra effect (Brunke et al., 2008). The image
data were processed with the AVIZO Fire software suite
(www.fei.com/software/avizo3d/), including scan artefact re-
duction and image filtering. Due to the low image noise and
the fact that only single-phase segmentation of the pore sys-
tem was needed, segmentation was performed by the fast
and robust “automatic threshold selection method” as de-
scribed by Otsu (1979). Afterwards, the pore space was
transferred into a mixed hexagonal-tetrahedral grid by us-
ing the extended volume marching cubes algorithm as im-
plemented within the software ScanIP and as described by
Young (2008). This step included an optimization of the seg-
mented grid, which significantly reduced the number of grid
cells (almost by a factor of 10) and hence computational time
and power, without “destroying” topological information of
the grid-surface. The final mesh has been exported as an
ASCII-grid (∗.mphtxt), which has been imported to COM-
SOL for modelling.
6.2 REV-analysis
The interfacial area between the two fluid phases for the
macro-scale models is represented as volume-averaged.
Therefore, the representative elementary volume (REV) with
regard to effective interconnected porosity was identified and
extracted from digital sample approximations. Generally, a
REV-analysis identifies the minimum porous-media volume
with similar mechanical and hydraulic properties of the to-
tal porous-media volume (Singhal and Gupta, 2010). Further
information about the REV can be found in Bear (1988). A
detailed description of the workflow and results specifically
for Heletz sandstone cores is given in Tatomir et al. (2016).
Results indicate a REV range of a subvolume edge length
bandwidth ranging from approx. 120 to 280 voxel. Within
this range, fluctuations of porosity are minimal. Subvolumes
bigger than 280 voxel edge length show an increase in poros-
ity and can be identified as domain where macroscopic ef-
fects are dominant. Subvolumes smaller than 120 voxel can
be further distinguished in a transition phase ranging from 50
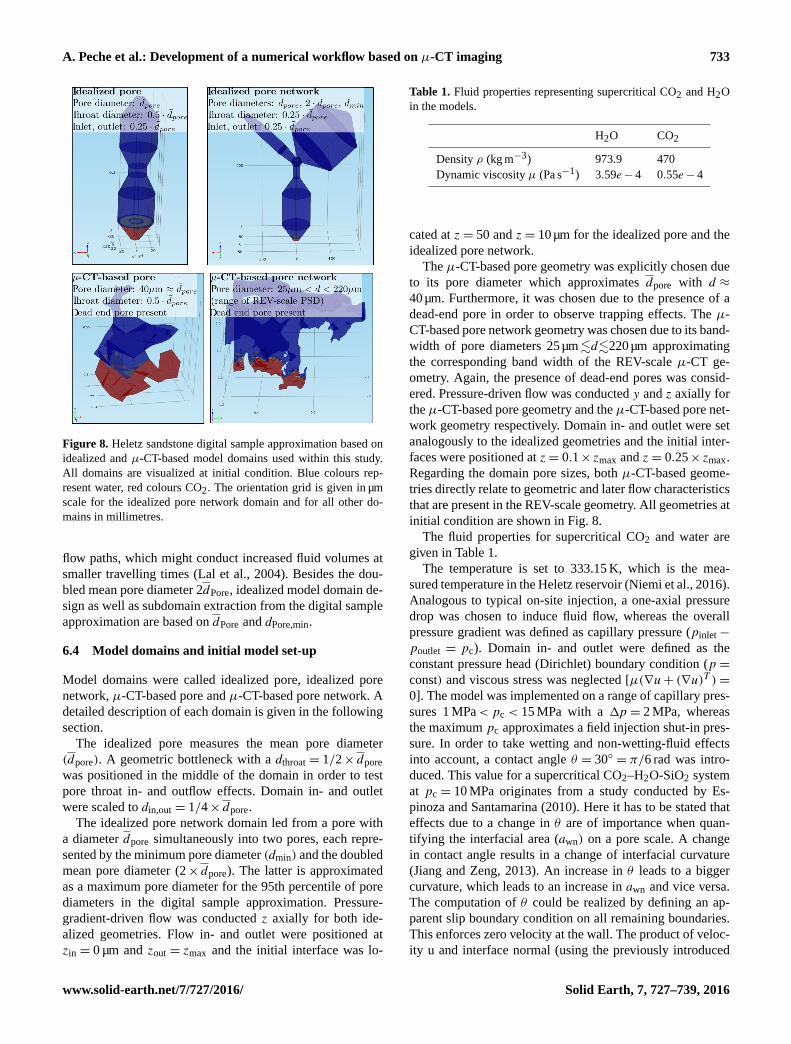
Figure 7. Result of the pore-size distribution for an REV-scale sub-
volume arbitrarily placed in the sample approximation as number
of pores vs. pore diameter, whereas pore diameters were unified in
30 µm intervals. Due to representation, this figure excludes the pore
representing the maximum pore diameter dPore, max, which exceeds
the pore diameter range significantly.
to 120 voxel, where fluctuations in porosity are relatively low
and in domains smaller than 50 voxel, where microscopic ef-
fects are dominant and fluctuations are high.
6.3 Pore-size distribution analysis
Based on the µ-CT images, a series of operations com-
bining pore identification, binarization, separation and sta-
tistical analysis regarding geometric extent of features was
implemented on an arbitrarily extracted REV-scale subvol-
ume of the digital sample approximation using the software
Avizo Fire (Version 8.1). Pore identification and character-
ization was based on their specific greyscale value. Further
separation was done according to the watershed transforma-
tion technique as described amongst others in Sheppard et
al. (2005) and Soille (2003). Finally, all relevant data were
determined by applying the special “label analysis” opera-
tion. The results of the PSD are given in the form of a his-
togram (Fig. 7) and Table 3, where the latter summarizes
most important statistical information, such as minimum,
maximum and mean pore diameters. A detailed description
of the workflow is given in Tatomir et al. (2016).
It can be observed that the majority of pores are repre-
sented by diameters up to 90 µm. In fact, approximately 95 %
of pores are below a threshold of the doubled mean pore di-
ameter. This value was considered instead of the maximum
pore diameter when designing the idealized geometries due
to optimized geometry meshing. It has to be stated that re-
maining bigger pores may be few; however these pores play
a more significant role for fluid flow representing preferential
Solid Earth, 7, 727–739, 2016 www.solid-earth.net/7/727/2016/
A. Peche et al.: Development of a numerical workflow based on µ-CT imaging 733
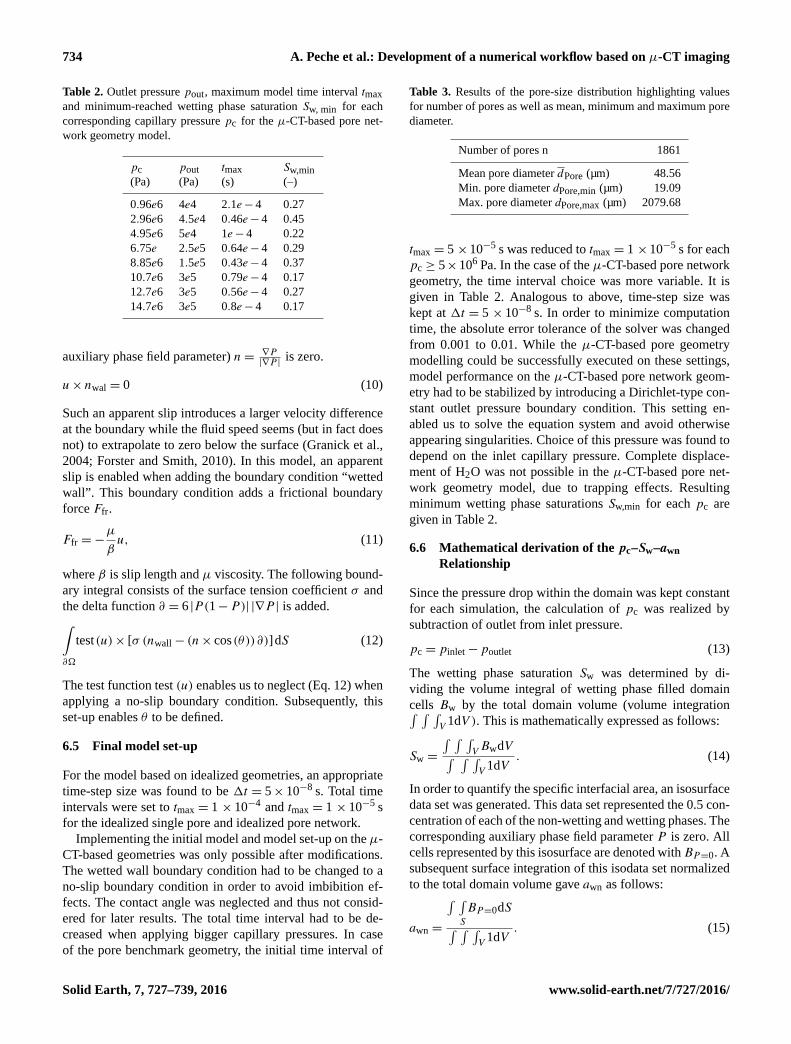
Figure 8. Heletz sandstone digital sample approximation based on
idealized and µ-CT-based model domains used within this study.
All domains are visualized at initial condition. Blue colours rep-
resent water, red colours CO2. The orientation grid is given in µm
scale for the idealized pore network domain and for all other do-
mains in millimetres.
flow paths, which might conduct increased fluid volumes at
smaller travelling times (Lal et al., 2004). Besides the dou-
bled mean pore diameter 2dPore, idealized model domain de-
sign as well as subdomain extraction from the digital sample
approximation are based on dPore and dPore,min.
6.4 Model domains and initial model set-up
Model domains were called idealized pore, idealized pore
network, µ-CT-based pore and µ-CT-based pore network. A
detailed description of each domain is given in the following
section.
The idealized pore measures the mean pore diameter
(dpore). A geometric bottleneck with a dthroat = 1/2× dpore
was positioned in the middle of the domain in order to test
pore throat in- and outflow effects. Domain in- and outlet
were scaled to din,out = 1/4× dpore.
The idealized pore network domain led from a pore with
a diameter dpore simultaneously into two pores, each repre-
sented by the minimum pore diameter (dmin) and the doubled
mean pore diameter (2× dpore). The latter is approximated
as a maximum pore diameter for the 95th percentile of pore
diameters in the digital sample approximation. Pressure-
gradient-driven flow was conducted z axially for both ide-
alized geometries. Flow in- and outlet were positioned at
zin = 0 µm and zout = zmax and the initial interface was lo-
Table 1. Fluid properties representing supercritical CO2 and H2O
in the models.
H2O CO2
Density ρ (kg m−3) 973.9 470
Dynamic viscosity µ (Pa s−1) 3.59e− 4 0.55e− 4
cated at z= 50 and z= 10µm for the idealized pore and the
idealized pore network.
The µ-CT-based pore geometry was explicitly chosen due
to its pore diameter which approximates dpore with d ≈
40µm. Furthermore, it was chosen due to the presence of a
dead-end pore in order to observe trapping effects. The µ-
CT-based pore network geometry was chosen due to its band-
width of pore diameters 25µm .d.220µm approximating
the corresponding band width of the REV-scale µ-CT ge-
ometry. Again, the presence of dead-end pores was consid-
ered. Pressure-driven flow was conducted y and z axially for
the µ-CT-based pore geometry and the µ-CT-based pore net-
work geometry respectively. Domain in- and outlet were set
analogously to the idealized geometries and the initial inter-
faces were positioned at z= 0.1× zmax and z= 0.25× zmax.
Regarding the domain pore sizes, both µ-CT-based geome-
tries directly relate to geometric and later flow characteristics
that are present in the REV-scale geometry. All geometries at
initial condition are shown in Fig. 8.
The fluid properties for supercritical CO2 and water are
given in Table 1.
The temperature is set to 333.15 K, which is the mea-
sured temperature in the Heletz reservoir (Niemi et al., 2016).
Analogous to typical on-site injection, a one-axial pressure
drop was chosen to induce fluid flow, whereas the overall
pressure gradient was defined as capillary pressure (pinlet−
poutlet = pc). Domain in- and outlet were defined as the
constant pressure head (Dirichlet) boundary condition (p =
const) and viscous stress was neglected [µ(∇u+ (∇u)T )=
0]. The model was implemented on a range of capillary pres-
sures 1 MPa< pc < 15 MPa with a 1p = 2 MPa, whereas
the maximum pc approximates a field injection shut-in pres-
sure. In order to take wetting and non-wetting-fluid effects
into account, a contact angle θ = 30◦ = π/6 rad was intro-
duced. This value for a supercritical CO2–H2O-SiO2 system
at pc = 10 MPa originates from a study conducted by Es-
pinoza and Santamarina (2010). Here it has to be stated that
effects due to a change in θ are of importance when quan-
tifying the interfacial area (awn) on a pore scale. A change
in contact angle results in a change of interfacial curvature
(Jiang and Zeng, 2013). An increase in θ leads to a bigger
curvature, which leads to an increase in awn and vice versa.
The computation of θ could be realized by defining an ap-
parent slip boundary condition on all remaining boundaries.
This enforces zero velocity at the wall. The product of veloc-
ity u and interface normal (using the previously introduced
www.solid-earth.net/7/727/2016/ Solid Earth, 7, 727–739, 2016
734 A. Peche et al.: Development of a numerical workflow based on µ-CT imaging
Table 2. Outlet pressure pout, maximum model time interval tmax
and minimum-reached wetting phase saturation Sw, min for each
corresponding capillary pressure pc for the µ-CT-based pore net-
work geometry model.
pc pout tmax Sw,min
(Pa) (Pa) (s) (–)
0.96e6 4e4 2.1e− 4 0.27
2.96e6 4.5e4 0.46e− 4 0.45
4.95e6 5e4 1e− 4 0.22
6.75e 2.5e5 0.64e− 4 0.29
8.85e6 1.5e5 0.43e− 4 0.37
10.7e6 3e5 0.79e− 4 0.17
12.7e6 3e5 0.56e− 4 0.27
14.7e6 3e5 0.8e− 4 0.17
auxiliary phase field parameter) n= ∇P|∇P |
is zero.
u× nwal = 0 (10)
Such an apparent slip introduces a larger velocity difference
at the boundary while the fluid speed seems (but in fact does
not) to extrapolate to zero below the surface (Granick et al.,
2004; Forster and Smith, 2010). In this model, an apparent
slip is enabled when adding the boundary condition “wetted
wall”. This boundary condition adds a frictional boundary
force Ffr.
Ffr =−µ
βu, (11)
where β is slip length and µ viscosity. The following bound-
ary integral consists of the surface tension coefficient σ and
the delta function ∂ = 6 |P(1−P)| |∇P | is added.∫∂�
test(u)× [σ (nwall− (n× cos(θ))∂)]dS (12)
The test function test (u) enables us to neglect (Eq. 12) when
applying a no-slip boundary condition. Subsequently, this
set-up enables θ to be defined.
6.5 Final model set-up
For the model based on idealized geometries, an appropriate
time-step size was found to be 1t = 5× 10⁻⁸ s. Total time
intervals were set to tmax = 1 × 10⁻⁴ and tmax = 1 × 10⁻⁵ s
for the idealized single pore and idealized pore network.
Implementing the initial model and model set-up on the µ-
CT-based geometries was only possible after modifications.
The wetted wall boundary condition had to be changed to a
no-slip boundary condition in order to avoid imbibition ef-
fects. The contact angle was neglected and thus not consid-
ered for later results. The total time interval had to be de-
creased when applying bigger capillary pressures. In case
of the pore benchmark geometry, the initial time interval of
Table 3. Results of the pore-size distribution highlighting values
for number of pores as well as mean, minimum and maximum pore
diameter.
Number of pores n 1861
Mean pore diameter dPore (µm) 48.56
Min. pore diameter dPore,min (µm) 19.09
Max. pore diameter dPore,max (µm) 2079.68
tmax = 5 ×10⁻⁵ s was reduced to tmax = 1 ×10⁻⁵ s for each
pc ≥ 5×10⁶ Pa. In the case of the µ-CT-based pore network
geometry, the time interval choice was more variable. It is
given in Table 2. Analogous to above, time-step size was
kept at 1t = 5 × 10⁻⁸ s. In order to minimize computation
time, the absolute error tolerance of the solver was changed
from 0.001 to 0.01. While the µ-CT-based pore geometry
modelling could be successfully executed on these settings,
model performance on the µ-CT-based pore network geom-
etry had to be stabilized by introducing a Dirichlet-type con-
stant outlet pressure boundary condition. This setting en-
abled us to solve the equation system and avoid otherwise
appearing singularities. Choice of this pressure was found to
depend on the inlet capillary pressure. Complete displace-
ment of H2O was not possible in the µ-CT-based pore net-
work geometry model, due to trapping effects. Resulting
minimum wetting phase saturations Sw,min for each pc are
given in Table 2.
6.6 Mathematical derivation of the pc–Sw–awn
Relationship
Since the pressure drop within the domain was kept constant
for each simulation, the calculation of pc was realized by
subtraction of outlet from inlet pressure.
pc = pinlet−poutlet (13)
The wetting phase saturation Sw was determined by di-
viding the volume integral of wetting phase filled domain
cells Bw by the total domain volume (volume integration∫ ∫ ∫V
1dV ). This is mathematically expressed as follows:
Sw =
∫ ∫ ∫VBwdV∫ ∫ ∫V
1dV. (14)
In order to quantify the specific interfacial area, an isosurface
data set was generated. This data set represented the 0.5 con-
centration of each of the non-wetting and wetting phases. The
corresponding auxiliary phase field parameter P is zero. All
cells represented by this isosurface are denoted withBP=0. A
subsequent surface integration of this isodata set normalized
to the total domain volume gave awn as follows:
awn =
∫ ∫S
BP=0dS∫ ∫ ∫V
1dV. (15)
Solid Earth, 7, 727–739, 2016 www.solid-earth.net/7/727/2016/
A. Peche et al.: Development of a numerical workflow based on µ-CT imaging 735
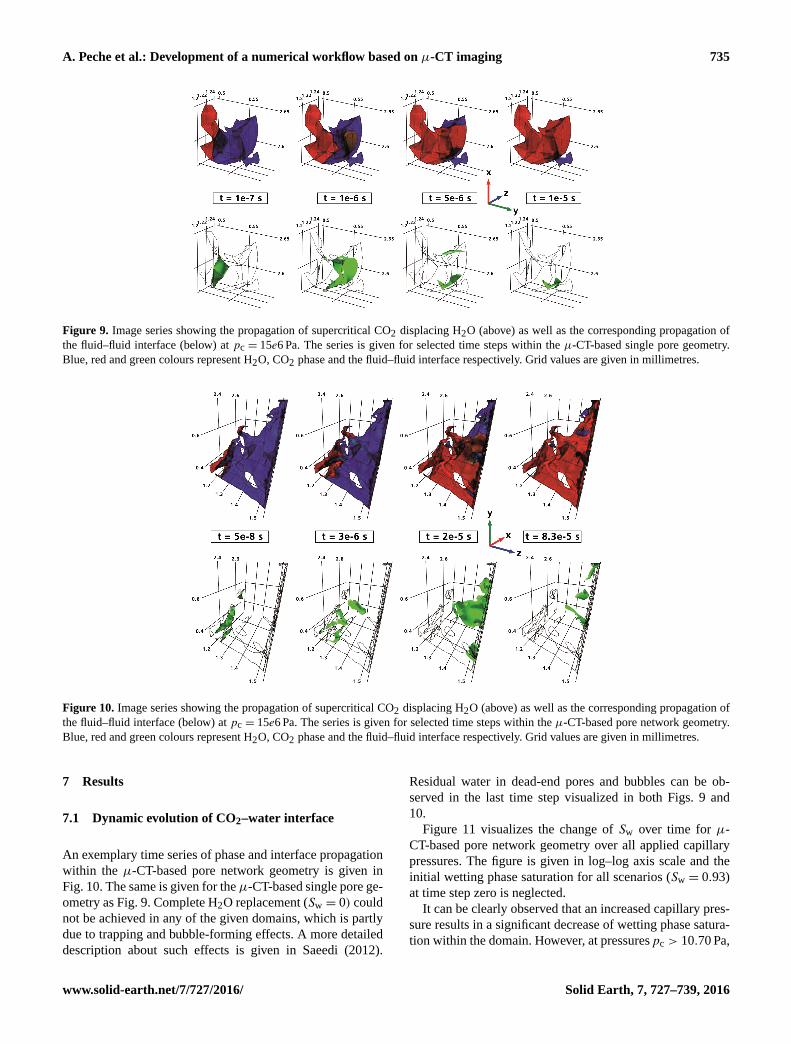
Figure 9. Image series showing the propagation of supercritical CO2 displacing H2O (above) as well as the corresponding propagation of
the fluid–fluid interface (below) at pc = 15e6 Pa. The series is given for selected time steps within the µ-CT-based single pore geometry.
Blue, red and green colours represent H2O, CO2 phase and the fluid–fluid interface respectively. Grid values are given in millimetres.
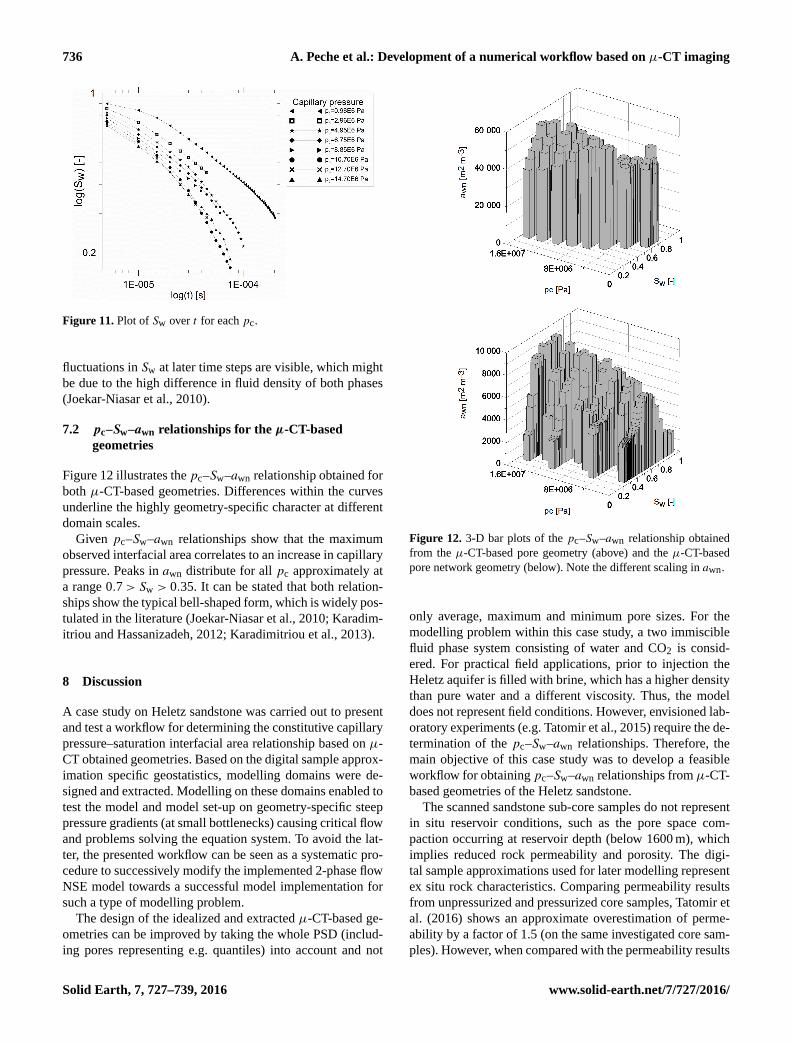
Figure 10. Image series showing the propagation of supercritical CO2 displacing H2O (above) as well as the corresponding propagation of
the fluid–fluid interface (below) at pc = 15e6 Pa. The series is given for selected time steps within the µ-CT-based pore network geometry.
Blue, red and green colours represent H2O, CO2 phase and the fluid–fluid interface respectively. Grid values are given in millimetres.
7 Results
7.1 Dynamic evolution of CO2–water interface
An exemplary time series of phase and interface propagation
within the µ-CT-based pore network geometry is given in
Fig. 10. The same is given for theµ-CT-based single pore ge-
ometry as Fig. 9. Complete H2O replacement (Sw = 0) could
not be achieved in any of the given domains, which is partly
due to trapping and bubble-forming effects. A more detailed
description about such effects is given in Saeedi (2012).
Residual water in dead-end pores and bubbles can be ob-
served in the last time step visualized in both Figs. 9 and
10.
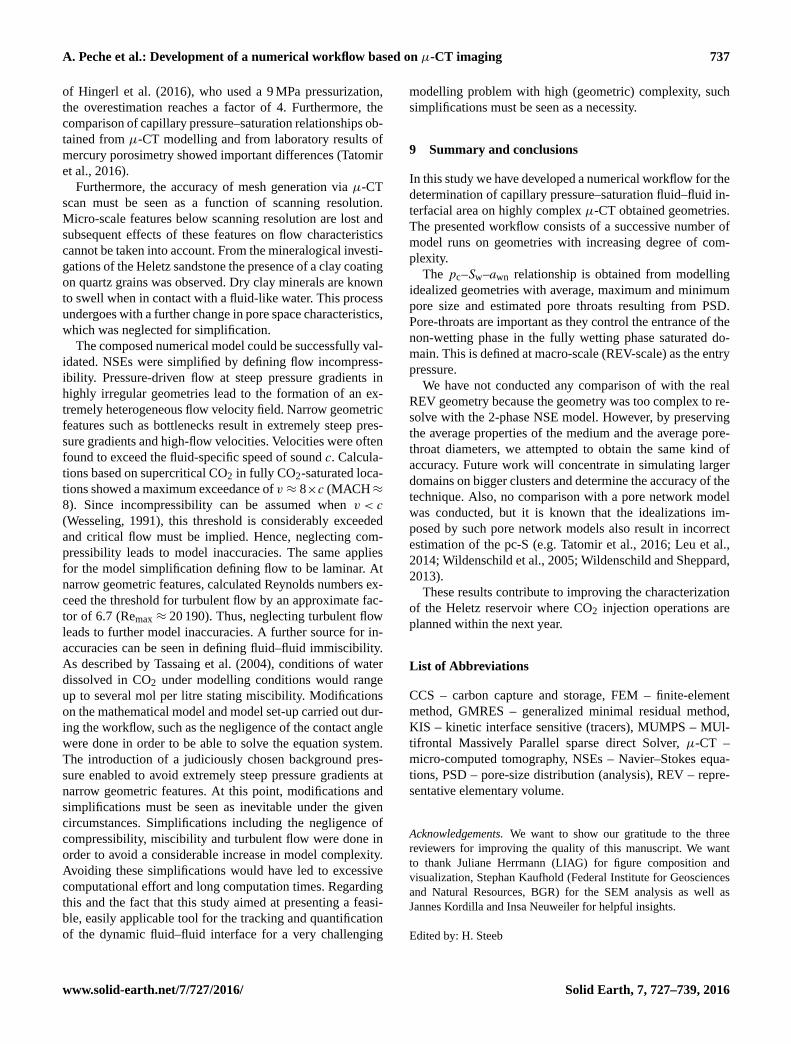
Figure 11 visualizes the change of Sw over time for µ-
CT-based pore network geometry over all applied capillary
pressures. The figure is given in log–log axis scale and the
initial wetting phase saturation for all scenarios (Sw = 0.93)
at time step zero is neglected.
It can be clearly observed that an increased capillary pres-
sure results in a significant decrease of wetting phase satura-
tion within the domain. However, at pressurespc > 10.70 Pa,
www.solid-earth.net/7/727/2016/ Solid Earth, 7, 727–739, 2016
736 A. Peche et al.: Development of a numerical workflow based on µ-CT imaging
Figure 11. Plot of Sw over t for each pc.
fluctuations in Sw at later time steps are visible, which might
be due to the high difference in fluid density of both phases
(Joekar-Niasar et al., 2010).
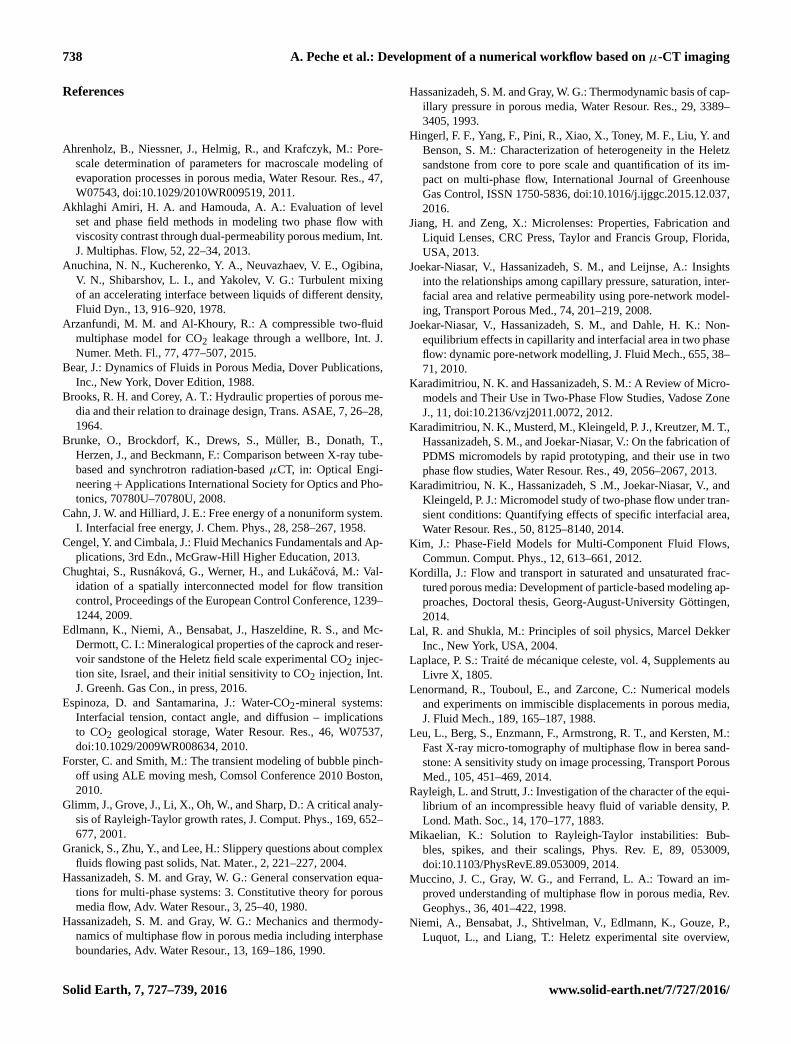
7.2 pc–Sw–awn relationships for the µ-CT-based
geometries
Figure 12 illustrates the pc–Sw–awn relationship obtained for
both µ-CT-based geometries. Differences within the curves
underline the highly geometry-specific character at different
domain scales.
Given pc–Sw–awn relationships show that the maximum
observed interfacial area correlates to an increase in capillary
pressure. Peaks in awn distribute for all pc approximately at
a range 0.7> Sw > 0.35. It can be stated that both relation-
ships show the typical bell-shaped form, which is widely pos-
tulated in the literature (Joekar-Niasar et al., 2010; Karadim-
itriou and Hassanizadeh, 2012; Karadimitriou et al., 2013).
8 Discussion
A case study on Heletz sandstone was carried out to present
and test a workflow for determining the constitutive capillary
pressure–saturation interfacial area relationship based on µ-
CT obtained geometries. Based on the digital sample approx-
imation specific geostatistics, modelling domains were de-
signed and extracted. Modelling on these domains enabled to
test the model and model set-up on geometry-specific steep
pressure gradients (at small bottlenecks) causing critical flow
and problems solving the equation system. To avoid the lat-
ter, the presented workflow can be seen as a systematic pro-
cedure to successively modify the implemented 2-phase flow
NSE model towards a successful model implementation for
such a type of modelling problem.
The design of the idealized and extracted µ-CT-based ge-
ometries can be improved by taking the whole PSD (includ-
ing pores representing e.g. quantiles) into account and not
Figure 12. 3-D bar plots of the pc–Sw–awn relationship obtained
from the µ-CT-based pore geometry (above) and the µ-CT-based
pore network geometry (below). Note the different scaling in awn.
only average, maximum and minimum pore sizes. For the
modelling problem within this case study, a two immiscible
fluid phase system consisting of water and CO2 is consid-
ered. For practical field applications, prior to injection the
Heletz aquifer is filled with brine, which has a higher density
than pure water and a different viscosity. Thus, the model
does not represent field conditions. However, envisioned lab-
oratory experiments (e.g. Tatomir et al., 2015) require the de-
termination of the pc–Sw–awn relationships. Therefore, the
main objective of this case study was to develop a feasible
workflow for obtaining pc–Sw–awn relationships from µ-CT-
based geometries of the Heletz sandstone.
The scanned sandstone sub-core samples do not represent
in situ reservoir conditions, such as the pore space com-
paction occurring at reservoir depth (below 1600 m), which
implies reduced rock permeability and porosity. The digi-
tal sample approximations used for later modelling represent
ex situ rock characteristics. Comparing permeability results
from unpressurized and pressurized core samples, Tatomir et
al. (2016) shows an approximate overestimation of perme-
ability by a factor of 1.5 (on the same investigated core sam-
ples). However, when compared with the permeability results
Solid Earth, 7, 727–739, 2016 www.solid-earth.net/7/727/2016/
A. Peche et al.: Development of a numerical workflow based on µ-CT imaging 737
of Hingerl et al. (2016), who used a 9 MPa pressurization,
the overestimation reaches a factor of 4. Furthermore, the
comparison of capillary pressure–saturation relationships ob-
tained from µ-CT modelling and from laboratory results of
mercury porosimetry showed important differences (Tatomir
et al., 2016).
Furthermore, the accuracy of mesh generation via µ-CT
scan must be seen as a function of scanning resolution.
Micro-scale features below scanning resolution are lost and
subsequent effects of these features on flow characteristics
cannot be taken into account. From the mineralogical investi-
gations of the Heletz sandstone the presence of a clay coating
on quartz grains was observed. Dry clay minerals are known
to swell when in contact with a fluid-like water. This process
undergoes with a further change in pore space characteristics,
which was neglected for simplification.
The composed numerical model could be successfully val-
idated. NSEs were simplified by defining flow incompress-
ibility. Pressure-driven flow at steep pressure gradients in
highly irregular geometries lead to the formation of an ex-
tremely heterogeneous flow velocity field. Narrow geometric
features such as bottlenecks result in extremely steep pres-
sure gradients and high-flow velocities. Velocities were often
found to exceed the fluid-specific speed of sound c. Calcula-
tions based on supercritical CO2 in fully CO2-saturated loca-
tions showed a maximum exceedance of v ≈ 8×c (MACH≈
8). Since incompressibility can be assumed when v < c
(Wesseling, 1991), this threshold is considerably exceeded
and critical flow must be implied. Hence, neglecting com-
pressibility leads to model inaccuracies. The same applies
for the model simplification defining flow to be laminar. At
narrow geometric features, calculated Reynolds numbers ex-
ceed the threshold for turbulent flow by an approximate fac-
tor of 6.7 (Remax ≈ 20 190). Thus, neglecting turbulent flow
leads to further model inaccuracies. A further source for in-
accuracies can be seen in defining fluid–fluid immiscibility.
As described by Tassaing et al. (2004), conditions of water
dissolved in CO2 under modelling conditions would range
up to several mol per litre stating miscibility. Modifications
on the mathematical model and model set-up carried out dur-
ing the workflow, such as the negligence of the contact angle
were done in order to be able to solve the equation system.
The introduction of a judiciously chosen background pres-
sure enabled to avoid extremely steep pressure gradients at
narrow geometric features. At this point, modifications and
simplifications must be seen as inevitable under the given
circumstances. Simplifications including the negligence of
compressibility, miscibility and turbulent flow were done in
order to avoid a considerable increase in model complexity.
Avoiding these simplifications would have led to excessive
computational effort and long computation times. Regarding
this and the fact that this study aimed at presenting a feasi-
ble, easily applicable tool for the tracking and quantification
of the dynamic fluid–fluid interface for a very challenging
modelling problem with high (geometric) complexity, such
simplifications must be seen as a necessity.
9 Summary and conclusions
In this study we have developed a numerical workflow for the
determination of capillary pressure–saturation fluid–fluid in-
terfacial area on highly complex µ-CT obtained geometries.
The presented workflow consists of a successive number of
model runs on geometries with increasing degree of com-
plexity.
The pc–Sw–awn relationship is obtained from modelling
idealized geometries with average, maximum and minimum
pore size and estimated pore throats resulting from PSD.
Pore-throats are important as they control the entrance of the
non-wetting phase in the fully wetting phase saturated do-
main. This is defined at macro-scale (REV-scale) as the entry
pressure.
We have not conducted any comparison of with the real
REV geometry because the geometry was too complex to re-
solve with the 2-phase NSE model. However, by preserving
the average properties of the medium and the average pore-
throat diameters, we attempted to obtain the same kind of
accuracy. Future work will concentrate in simulating larger
domains on bigger clusters and determine the accuracy of the
technique. Also, no comparison with a pore network model
was conducted, but it is known that the idealizations im-
posed by such pore network models also result in incorrect
estimation of the pc-S (e.g. Tatomir et al., 2016; Leu et al.,
2014; Wildenschild et al., 2005; Wildenschild and Sheppard,
2013).
These results contribute to improving the characterization
of the Heletz reservoir where CO2 injection operations are
planned within the next year.
List of Abbreviations
CCS – carbon capture and storage, FEM – finite-element
method, GMRES – generalized minimal residual method,
KIS – kinetic interface sensitive (tracers), MUMPS – MUl-
tifrontal Massively Parallel sparse direct Solver, µ-CT –
micro-computed tomography, NSEs – Navier–Stokes equa-
tions, PSD – pore-size distribution (analysis), REV – repre-
sentative elementary volume.
Acknowledgements. We want to show our gratitude to the three
reviewers for improving the quality of this manuscript. We want
to thank Juliane Herrmann (LIAG) for figure composition and
visualization, Stephan Kaufhold (Federal Institute for Geosciences
and Natural Resources, BGR) for the SEM analysis as well as
Jannes Kordilla and Insa Neuweiler for helpful insights.
Edited by: H. Steeb
www.solid-earth.net/7/727/2016/ Solid Earth, 7, 727–739, 2016
738 A. Peche et al.: Development of a numerical workflow based on µ-CT imaging
References
Ahrenholz, B., Niessner, J., Helmig, R., and Krafczyk, M.: Pore-
scale determination of parameters for macroscale modeling of
evaporation processes in porous media, Water Resour. Res., 47,
W07543, doi:10.1029/2010WR009519, 2011.
Akhlaghi Amiri, H. A. and Hamouda, A. A.: Evaluation of level
set and phase field methods in modeling two phase flow with
viscosity contrast through dual-permeability porous medium, Int.
J. Multiphas. Flow, 52, 22–34, 2013.
Anuchina, N. N., Kucherenko, Y. A., Neuvazhaev, V. E., Ogibina,
V. N., Shibarshov, L. I., and Yakolev, V. G.: Turbulent mixing
of an accelerating interface between liquids of different density,
Fluid Dyn., 13, 916–920, 1978.
Arzanfundi, M. M. and Al-Khoury, R.: A compressible two-fluid
multiphase model for CO2 leakage through a wellbore, Int. J.
Numer. Meth. Fl., 77, 477–507, 2015.
Bear, J.: Dynamics of Fluids in Porous Media, Dover Publications,
Inc., New York, Dover Edition, 1988.
Brooks, R. H. and Corey, A. T.: Hydraulic properties of porous me-
dia and their relation to drainage design, Trans. ASAE, 7, 26–28,
1964.
Brunke, O., Brockdorf, K., Drews, S., Müller, B., Donath, T.,
Herzen, J., and Beckmann, F.: Comparison between X-ray tube-
based and synchrotron radiation-based µCT, in: Optical Engi-
neering+Applications International Society for Optics and Pho-
tonics, 70780U–70780U, 2008.
Cahn, J. W. and Hilliard, J. E.: Free energy of a nonuniform system.
I. Interfacial free energy, J. Chem. Phys., 28, 258–267, 1958.
Cengel, Y. and Cimbala, J.: Fluid Mechanics Fundamentals and Ap-
plications, 3rd Edn., McGraw-Hill Higher Education, 2013.
Chughtai, S., Rusnáková, G., Werner, H., and Lukácová, M.: Val-
idation of a spatially interconnected model for flow transition
control, Proceedings of the European Control Conference, 1239–
1244, 2009.
Edlmann, K., Niemi, A., Bensabat, J., Haszeldine, R. S., and Mc-
Dermott, C. I.: Mineralogical properties of the caprock and reser-
voir sandstone of the Heletz field scale experimental CO2 injec-
tion site, Israel, and their initial sensitivity to CO2 injection, Int.
J. Greenh. Gas Con., in press, 2016.
Espinoza, D. and Santamarina, J.: Water-CO2-mineral systems:
Interfacial tension, contact angle, and diffusion – implications
to CO2 geological storage, Water Resour. Res., 46, W07537,
doi:10.1029/2009WR008634, 2010.
Forster, C. and Smith, M.: The transient modeling of bubble pinch-
off using ALE moving mesh, Comsol Conference 2010 Boston,
2010.
Glimm, J., Grove, J., Li, X., Oh, W., and Sharp, D.: A critical analy-
sis of Rayleigh-Taylor growth rates, J. Comput. Phys., 169, 652–
677, 2001.
Granick, S., Zhu, Y., and Lee, H.: Slippery questions about complex
fluids flowing past solids, Nat. Mater., 2, 221–227, 2004.
Hassanizadeh, S. M. and Gray, W. G.: General conservation equa-
tions for multi-phase systems: 3. Constitutive theory for porous
media flow, Adv. Water Resour., 3, 25–40, 1980.
Hassanizadeh, S. M. and Gray, W. G.: Mechanics and thermody-
namics of multiphase flow in porous media including interphase
boundaries, Adv. Water Resour., 13, 169–186, 1990.
Hassanizadeh, S. M. and Gray, W. G.: Thermodynamic basis of cap-
illary pressure in porous media, Water Resour. Res., 29, 3389–
3405, 1993.
Hingerl, F. F., Yang, F., Pini, R., Xiao, X., Toney, M. F., Liu, Y. and
Benson, S. M.: Characterization of heterogeneity in the Heletz
sandstone from core to pore scale and quantification of its im-
pact on multi-phase flow, International Journal of Greenhouse
Gas Control, ISSN 1750-5836, doi:10.1016/j.ijggc.2015.12.037,
2016.
Jiang, H. and Zeng, X.: Microlenses: Properties, Fabrication and
Liquid Lenses, CRC Press, Taylor and Francis Group, Florida,
USA, 2013.
Joekar-Niasar, V., Hassanizadeh, S. M., and Leijnse, A.: Insights
into the relationships among capillary pressure, saturation, inter-
facial area and relative permeability using pore-network model-
ing, Transport Porous Med., 74, 201–219, 2008.
Joekar-Niasar, V., Hassanizadeh, S. M., and Dahle, H. K.: Non-
equilibrium effects in capillarity and interfacial area in two phase
flow: dynamic pore-network modelling, J. Fluid Mech., 655, 38–
71, 2010.
Karadimitriou, N. K. and Hassanizadeh, S. M.: A Review of Micro-
models and Their Use in Two-Phase Flow Studies, Vadose Zone
J., 11, doi:10.2136/vzj2011.0072, 2012.
Karadimitriou, N. K., Musterd, M., Kleingeld, P. J., Kreutzer, M. T.,
Hassanizadeh, S. M., and Joekar-Niasar, V.: On the fabrication of
PDMS micromodels by rapid prototyping, and their use in two
phase flow studies, Water Resour. Res., 49, 2056–2067, 2013.
Karadimitriou, N. K., Hassanizadeh, S .M., Joekar-Niasar, V., and
Kleingeld, P. J.: Micromodel study of two-phase flow under tran-
sient conditions: Quantifying effects of specific interfacial area,
Water Resour. Res., 50, 8125–8140, 2014.
Kim, J.: Phase-Field Models for Multi-Component Fluid Flows,
Commun. Comput. Phys., 12, 613–661, 2012.
Kordilla, J.: Flow and transport in saturated and unsaturated frac-
tured porous media: Development of particle-based modeling ap-
proaches, Doctoral thesis, Georg-August-University Göttingen,
2014.
Lal, R. and Shukla, M.: Principles of soil physics, Marcel Dekker
Inc., New York, USA, 2004.
Laplace, P. S.: Traité de mécanique celeste, vol. 4, Supplements au
Livre X, 1805.
Lenormand, R., Touboul, E., and Zarcone, C.: Numerical models
and experiments on immiscible displacements in porous media,
J. Fluid Mech., 189, 165–187, 1988.
Leu, L., Berg, S., Enzmann, F., Armstrong, R. T., and Kersten, M.:
Fast X-ray micro-tomography of multiphase flow in berea sand-
stone: A sensitivity study on image processing, Transport Porous
Med., 105, 451–469, 2014.
Rayleigh, L. and Strutt, J.: Investigation of the character of the equi-
librium of an incompressible heavy fluid of variable density, P.
Lond. Math. Soc., 14, 170–177, 1883.
Mikaelian, K.: Solution to Rayleigh-Taylor instabilities: Bub-
bles, spikes, and their scalings, Phys. Rev. E, 89, 053009,
doi:10.1103/PhysRevE.89.053009, 2014.
Muccino, J. C., Gray, W. G., and Ferrand, L. A.: Toward an im-
proved understanding of multiphase flow in porous media, Rev.
Geophys., 36, 401–422, 1998.
Niemi, A., Bensabat, J., Shtivelman, V., Edlmann, K., Gouze, P.,
Luquot, L., and Liang, T.: Heletz experimental site overview,
Solid Earth, 7, 727–739, 2016 www.solid-earth.net/7/727/2016/
A. Peche et al.: Development of a numerical workflow based on µ-CT imaging 739
characterization and data analysis for CO2 injection and geolog-
ical storage, Int. J. Greenh. Gas Con., in press, 2016.
Niessner, J. and Hassanizadeh, S. M.: A model for two-phase flow in
porous media including fluid-fluid interfacial area, Water Resour.
Res., 44, W08439, doi:10.1029/2007WR006721, 2008.
Niessner, J. and Hassanizadeh, S. M.: Non-equilibrium interphase
heat and mass transfer during two-phase flow in porous media-
Theoretical considerations and modeling, Adv. Water Resour.,
32, 1756–1766, 2009.
Norde, W.: Colloids and Interfaces in Life Sciences, Marcel Dekker
Inc., New York, Basel, 2003.
Otsu, N.: An automatic threshold selection method based on dis-
criminate and least squares criteria, Denshi Tsushin Gakkai Ron-
bunshi, 63, 349–356, 1979.
Pillai, N. N. and Ramakrishnan, C. R.: Principles of Fluid Me-
chanics and Fluid Machines, 2nd Edn., Universities Press, India,
2006.
Popatenko, S.: Integral Methods in Science and Engineering: Tech-
niques and Applications, Springer London, 2007.
Porter, M. L., Schaap, M. G. and Wildenschild, D.: Lattice-
Boltzmann simulations of the capillary pressure-saturation-
interfacial area relationship for porous media, Adv. Water Re-
sour., 32, 1632–1640, 2009.
Read, K.: Experimental investigation of turbulent mixing by
Rayleigh-Taylor instability, Physica D, Nonlinear Phenomena,
21, 137–148, 1984.
Reeves, P. C. and Celia, M. A.: A functional relationship between
capillary pressure, saturation and interfacial area as revealed by
a pore-scale network model, Water Resour. Res., 32, 2345–2358,
1996.
Rogers, D.: Laminar Flow Analysis, Cambridge University Press,
1992.
Saeedi, A.: Experimental study of multiphase flow in porous media
during CO2 Geo-Sequestration processes, Springer, Berlin Hei-
delberg, 2012.
Schaffer, M., Maier, F.,Licha, T., and Sauter, M.: A new genera-
tion of tracers for the characterization of interfacial areas during
supercritical carbon dioxide injections into deep saline aquifers:
Kinetic interface-sensitive tracers (KIS tracer), Int. J. Greenh.
Gas Con., 14, 200–208, 2013.
Shahriari, S., Hassan, I. G., and Kadem, L.: Modeling unsteady flow
characteristics using smoothed particle hydrodynamics, Appl.
Math. Model., 37, 1431–1450, 2013.
Sheppard, A. P., Sok, R. M., and Averdunk, H.: Improved Pore Net-
work Extraction Methods. Paper submitted for the International
Symposium of the Society of Core Analysts, Toronto, 21–25 Au-
gust 2005.
Singhal, B. B. S., and Gupta, R. P.: Applied hydrogeology of frac-
tured rocks, 2nd Edn., doi:10.1007/978-90-481-8799-7, 2010.
Soille, P.: Morphological Image Analysis, Principles and Applica-
tions, Springer Verlag, Berlin, 2003.
Tassaing, T., Oparin, R., Danten, Y., and Besnard, M.: Water-carbon
dioxide mixtures at high temperatures and pressures as studied
by infrared and raman spectroscopies, Paper submitted for 14th
International Conference on the Properties of Water and Steam,
Kyoto, 2004.
Tatomir, A. B., Maier, F., Schaffer, M., Licha, T., and Sauter, M.:
Modelling of Kinetic Interface Sensitive Tracers for Two-Phase
Systems, in: Clean Energy Systems in the Subsurface, Produc-
tion, Storage and Conversion, Springer Verlag, Berlin, Heidel-
berg 2013.
Tatomir, A. B., Jyoti, A., Maier, F., and Sauter, M.: Modeling of Ki-
netic Interface Sensitive Tracers for Two Phase Immiscible Flow
in Porous Media with COMSOL Multiphysics, Excerpt from the
Proceedings of the 2014 COMSOL Conference in Cambridge,
2014.
Tatomir, A. B., Schaffer, M., Kissinger, A., Hommel, J., Nuske, P.,
Licha, T., and Sauter, M.: Novel approach for modeling kinetic
interface-sensitive (KIS) tracers with respect to time-dependent
interfacial area change for the optimization of supercritical car-
bon dioxide injection into deep saline aquifers, Int. J. Greenh.
Gas Con., 33, 145–153, 2015.
Tatomir, A. B., Halisch, M., Duschl, F., Peche, A., Wiegand, B.,
Schaffer, M., and Sauter, M.: An integrated core-based analysis
for the characterization of flow, transport and mineralogical pa-
rameters of the Heletz pilot CO2 storage site reservoir, Int. J.
Greenh. Gas Con., in press, 2016.
Taylor, G.: The instability of liquid surfaces when accelerated in a
direction perpendicular to their planes, Proc. R. Soc. Lond., 201,
192–196, 1950.
Tucker, M.: Sedimentary rocks in the field: A practical guide. John
Wiley and Sons, Hoboken, New Jersey, 4th Edn., 2011.
Wesseling, P.: Principles of Computational Fluid Dynamics, Vol-
ume 1 of the Springer Series in Computational Mathematics,
Springer Verlag, Berlin, Heidelberg, 1991.
White, J. A., Borja, R. I., and Fredrich, J. T.: Calculating the ef-
fective permeability of sandstone with multiscale lattice Boltz-
mann/finite element simulations, Acta Geotech., 1, 195–209,
2006.
Wildenschild, D. and Sheppard, A. P.: X-ray imaging and analy-
sis techniques for quantifying pore-scale structure and processes
in subsurface porous medium systems, Adv. Water Resour., 51,
217–246, 2013.
Wildenschild, D., Hopmans, J. W., Rivers, M. L., and Kent, A.
J. R.: Quantitative analysis of flow processes in a sand using
synchrotron-based X-ray microtomography, Vadose Zone J., 4,
112–126, 2005.
Woodruff, D. P.: The solid-liquid interface, CUP Archive, 1973.
Young, P. G., Beresford-West, T. B. H., Coward, S. R. L., Notar-
berardino, B., Walker, B., and Abdul-Aziz, A.: An efficient ap-
proach to converting three-dimensional image data into highly
accurate computational models, P. T. Roy. Soc. Lon., 366, 3155–
3173, 2008.
Young, T.: An essay on the cohesion of fluids, Philos. Trans. R. Soc.
Lond., 95, 65–87, 1805.
Youngs, D. L.: Numerical simulation of turbulent mixing by
Rayleigh-Taylor instability, Physica D, Nonlinear Phenomena,
12, 32–44, 1984.
www.solid-earth.net/7/727/2016/ Solid Earth, 7, 727–739, 2016