Embed Size (px)
Citation preview
lable at ScienceDirect
LWT - Food Science and Technology 56 (2014) 187e193
Contents lists avai
LWT - Food Science and Technology
journal homepage: www.elsevier .com/locate/ lwt
Development of a novel synbiotic dark chocolate enriched withBacillus indicus HU36, maltodextrin and lemon fiber: Optimization byresponse surface methodology
Özlem Erdem a, Mine Gültekin-Özgüven a, Ijlal Berktas a, Sevcan Ersan a, H. Ezgi Tuna a,Ayse Karada�g a, Beraat Özçelik a,*, Gürbüz Günes a, Simon M. Cutting b
aDepartment of Food Engineering, Faculty of Chemical and Metallurgical Engineering, Istanbul Technical University, Maslak, TR-34469 Istanbul, Turkeyb School of Biological Sciences, Royal Holloway University of London, Egham, Surrey TW20 0EX, United Kingdom
a r t i c l e i n f o
Article history:Received 16 June 2011Received in revised form7 December 2012Accepted 11 October 2013
Keywords:Bacillus indicus HU36ProbioticSynbiotic chocolateRSMSensory profiling
* Corresponding author. Tel.: þ90 212 2856042; faxE-mail addresses: [email protected], beraat.ozc@g
0023-6438/$ e see front matter � 2013 Elsevier Ltd.http://dx.doi.org/10.1016/j.lwt.2013.10.020
a b s t r a c t
The aim of this study was to investigate the effects of probiotic Bacillus indicus HU36 and dietary fibers(maltodextrin and lemon fiber) addition on color and organoleptic quality properties of dark chocolate.The viability of B. indicus HU36 in dark chocolate was examined as well in the study. Three-level [1.5, 3.5,5.5 (g/100 g)], two factorial (maltodextrin, lemon fiber) Central Composite Design (CCD) was performedfor developing synbiotic chocolate formulation. According to our results, B. indicus HU36 showed survivalrate between 88 and 91% in samples. Descriptive sensory analysis (QDA�) and color analysis were per-formed to examine the effects of factors and their levels on quality attributes and describe developedchocolates in detail. While bacteria and dietary fiber addition did not show any negative effects onproduct sensory and color properties; dietary fiber addition improved some sensorial features signifi-cantly i.e. sweetness, firmness and adherence, The validation of the model had been accomplished byapplying the conditions generated by the RSM model. This study is the first report on the use of B. indicusHU36 in potentially probiotic chocolate production.
� 2013 Elsevier Ltd. All rights reserved.
1. Introduction
Chocolate is an internationally craved and highly consumedproduct among confectionery products. Latest studies have shownthat chocolate was not only a simple blend of fat and sugar, but alsoa rich source of flavonoids and polyphenols which shows highantioxidant activities (Pimentel, Nitzke, Klipel, & de Jong, 2010;Schinella et al., 2010; Vanzani, Rosetto, De Arco, Rigo, & Scarpa,2011). In addition to exhibiting antioxidant activity, chocolatemight serve as a better probiotic carrier than dairy products forintestinal delivery. Possemiers, Marzorati, Verstraete, and Ven deWiele (2010) claimed that chocolate ensured probiotic survival upto 4 times higher than milk-containing products. However, dairyproducts are still the most dominant sources for probiotic productsin the market.
Although, probiotic sources are not limited with Lactobacillusand Bifidobacteria species, they are the most dominant speciesstudied in probiotic formulations. Recent studies showed that
: þ90 212 2857333.mail.com (B. Özçelik).
All rights reserved.
Bacillus species like Bacillus subtilis, Bacillus pumilus, Bacilluscoagulans, Bacillus cereus and Bacillus clausii have probiotic prop-erties (Cutting, 2010; Hong, Duc, & Cutting, 2005). Bacillus indicusHU36 is spore-forming bacteria with a high resistance to gastro-intestinal environment and it has been characterized for its safetyas probiotic supplements and its high content of dietary caroten-oids (Duc, Fraseer, Tam, & Cutting, 2006; Hong et al., 2008).
Dietary fibers are carbohydrates of plant origins which areindigestible in small intestine. They are claimed to possess manyhealth benefits such as; lowering calorie intake, shortening boweltransit time, increasing fecal bulk, delaying gastric emptying,helping to reduce the risk of cancer and heart disease, slowingglucose absorption, enhancing immune functions and loweringserum cholesterol levels (Drehner, 2001). They are added to a va-riety of food products for nutritional and functional enhancementpurposes. Carboxymethylcellulose, locust bean gum, inulin andpolydextrose added high-fiber bread (Angioloni & Collar, 2011); thedefatted rice bran hemicelluloses B and insoluble dietary fiberadded bread (Hu, Huang, Cao, & Ma, 2009); inulin, guar gum andpea fiber added pasta (Tudorica, Kuri, & Brennan, 2002); frozenpizzas containing high content dietary fiber stabilized rice branflour (deDelahaye, Jimenez, & Perez, 2005); cakes enriched with
Ö. Erdem et al. / LWT - Food Science and Technology 56 (2014) 187e193188
apple pomace (Sudha, Baskaran, & Leelavathi, 2007); ice creamenriched with oat fiber, wheat fiber, apple fiber and inulin(Soukoulis, Lebesi & Tzia, 2009); and yoghurts including apple fiber,wheat fiber, bamboo and inulin (Staffolo, Bertola, Martino &Bavilacqua, 2004) might be given as some examples to the prod-ucts enriched with dietary fibers.
Beards, Tuohy, and Gibson (2010) tested the effects of maltitol,polydextrose and resistant starch addition to chocolate. Forty vol-unteers consumed reformulated chocolate samples for over a sixweek period. Their results showed that, consumption of samplescontaining polydextroseemaltitol blend increased the level ofLactobacilli and Bifidobacteria levels in faeces after 6 weeks. In-crease in the levels of short chain fatty acids i.e. propionate andbutyrate were observed. Formula development of chocolate pro-vided prebiotic effects to consumers in addition to the decrease inenergy values.
Although chocolate is basically a uniform blend of cocoa, cocoabutter and sugar, its production process is very unique andcomplicated. It consists of 6 main stages as mixing, refining, con-ching, tempering, molding and packaging. Tempering is a stage ofcontrolling cocoa butter crystallization, helps to stabilize thepolymorphic transitions of cocoa butter crystals during storage andprovides the smooth and shiny appearance of chocolate, aswell (Beckett, 2008, 2009; Windhab, 2009).
The aim of this study is to develop the optimum formulation of anovel potentially probiotic and synbiotic dark chocolates enrichedwith novel probiotic strains B. indicus HU36; to investigate thesurvival of B. indicusHU36 in formulations; to evaluate the additionof dietary fiber on color and sensorial properties of the product.Formula optimization for synbiotic products was done by using theResponse Surface Methodology (RSM) method.
2. Materials and methods
2.1. Inoculum preparation
B. indicus HU36 was supplied from EU 7th Framework acro-nymed Project “COLORSPORE” (Project number: 207948). B. indicusHU36 spores were obtained by exhaustion method described byNicholson and Setlow (1990). According to the method, DifcoSporulation Medium (DSM) was streaked with colony of B. indicusHU 36 and incubated overnight at 37 �C. Then, a fresh colony wasinoculated into Luria Bertoni (LB) Broth and incubated at 30 �C on arolling drum overnight. DSM agar and LB broth were supplied fromOxoid (Basingstoke, UK). Afterward, the culture was grown in anorbital shaking water bath at 37 �C until OD600 of the culture wasreached approximately 1.00. Then culture was spread plated onDSM agar and incubated at 30 �C for 24 h. Afterward, the level ofvisible sporulation of the culture was checked frequently. Whenmore than 90% of visible sporulation was detected, spores wereharvested with water after removal of vegetative cells by washingwith distilled water. Finally, harvested spores were lyophilized byusing Christ Alpha 1-2 LD Plus Freeze Dryer (Martin Christ GMBH,Osterede am Harz, Germany).
2.2. Chocolate production
Dark chocolate couvertures containing 50 g cocoa/100 g weredonated from Nestle Turkey Gida A.S. Dietary fibers (maltodextrin,carboxymethylcellulose, inulin, lemon fiber, apple fiber, wheat fi-ber) were all obtained from various local companies in Turkey indried and powdered from, no further process had been applied. Allsamples were produced in laboratory conditions. After couvertureswere melted at 45 �C in water bath, lyophilized B. indicus HU36spores were added to have 6.08 log cfu/g of chocolate. Dietary
fibers, particle size 40 micron at most, were mixed with cou-vertures. Then, the mixture was tempered manually according tothe tabliering method (Brown, 2008;Wybauw, 2004). After coolingto room temperature samples were wrapped in aluminum foil forpackaging, stored at 18 �C until the corresponding analysis.
2.3. A pre-study on dietary fiber determination
A 9-point scale hedonic sensory analyses was performed todetermine the most suitable dietary fiber type. To conduct thesensory analysis, chocolate samples were manufactured by using 6different types of dietary fiber (maltodextrin, carboxymethylcel-lulose, inulin, lemon fiber, apple fiber, wheat fiber), each containing5 (g/100 g) dietary fiber and one control sample without fiber wasproduced, as well. None of the samples contained B. indicus HU36.10 voluntary panelists (6 females & 4 males, between 25 and 40years) were chosen from both graduate students and facultymembers of Istanbul Technical University of Food EngineeringDepartment. Panelists were selected according to their interests inchocolate consumption and willingness to participate. They weregiven information about basic sensory attributes of chocolate(appearance, aroma, taste, mouthfeel, texture). Scoring was per-formed by using a 9-point scale, in which points represented theexpressions from 1 to 9 (dislike extremely to like extremely). Thepanels were conducted in two sessions, 4 samples were given toeach panelist in each session.
2.4. Experimental design by using RSM
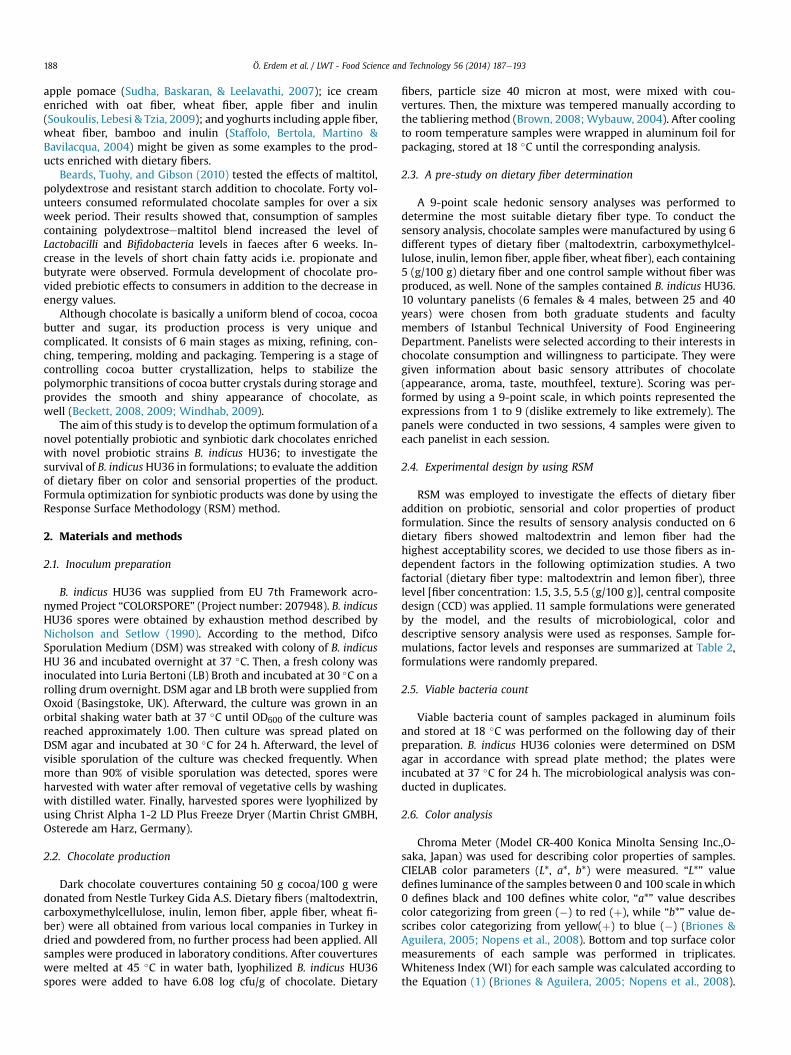
RSM was employed to investigate the effects of dietary fiberaddition on probiotic, sensorial and color properties of productformulation. Since the results of sensory analysis conducted on 6dietary fibers showed maltodextrin and lemon fiber had thehighest acceptability scores, we decided to use those fibers as in-dependent factors in the following optimization studies. A twofactorial (dietary fiber type: maltodextrin and lemon fiber), threelevel [fiber concentration: 1.5, 3.5, 5.5 (g/100 g)], central compositedesign (CCD) was applied. 11 sample formulations were generatedby the model, and the results of microbiological, color anddescriptive sensory analysis were used as responses. Sample for-mulations, factor levels and responses are summarized at Table 2,formulations were randomly prepared.
2.5. Viable bacteria count
Viable bacteria count of samples packaged in aluminum foilsand stored at 18 �C was performed on the following day of theirpreparation. B. indicus HU36 colonies were determined on DSMagar in accordance with spread plate method; the plates wereincubated at 37 �C for 24 h. The microbiological analysis was con-ducted in duplicates.
2.6. Color analysis
Chroma Meter (Model CR-400 Konica Minolta Sensing Inc.,O-saka, Japan) was used for describing color properties of samples.CIELAB color parameters (L*, a*, b*) were measured. “L*” valuedefines luminance of the samples between 0 and 100 scale inwhich0 defines black and 100 defines white color, “a*” value describescolor categorizing from green (�) to red (þ), while “b*” value de-scribes color categorizing from yellow(þ) to blue (�) (Briones &Aguilera, 2005; Nopens et al., 2008). Bottom and top surface colormeasurements of each sample was performed in triplicates.Whiteness Index (WI) for each sample was calculated according tothe Equation (1) (Briones & Aguilera, 2005; Nopens et al., 2008).
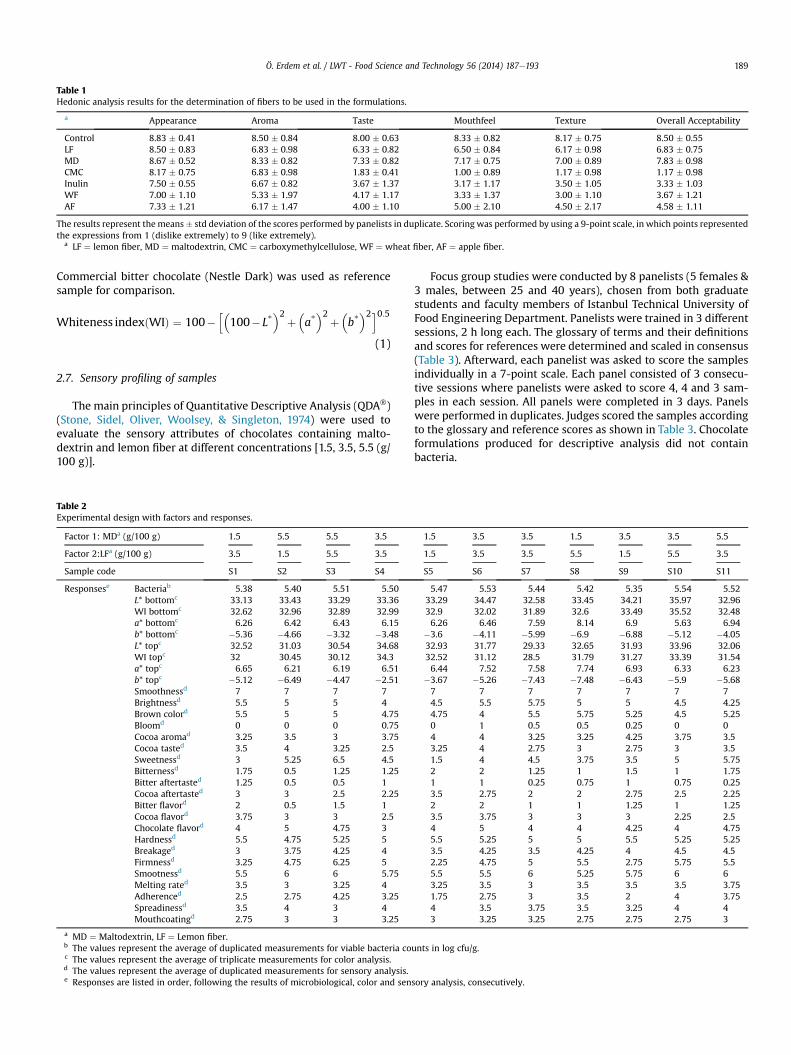
Table 1Hedonic analysis results for the determination of fibers to be used in the formulations.
a Appearance Aroma Taste Mouthfeel Texture Overall Acceptability
Control 8.83 � 0.41 8.50 � 0.84 8.00 � 0.63 8.33 � 0.82 8.17 � 0.75 8.50 � 0.55LF 8.50 � 0.83 6.83 � 0.98 6.33 � 0.82 6.50 � 0.84 6.17 � 0.98 6.83 � 0.75MD 8.67 � 0.52 8.33 � 0.82 7.33 � 0.82 7.17 � 0.75 7.00 � 0.89 7.83 � 0.98CMC 8.17 � 0.75 6.83 � 0.98 1.83 � 0.41 1.00 � 0.89 1.17 � 0.98 1.17 � 0.98Inulin 7.50 � 0.55 6.67 � 0.82 3.67 � 1.37 3.17 � 1.17 3.50 � 1.05 3.33 � 1.03WF 7.00 � 1.10 5.33 � 1.97 4.17 � 1.17 3.33 � 1.37 3.00 � 1.10 3.67 � 1.21AF 7.33 � 1.21 6.17 � 1.47 4.00 � 1.10 5.00 � 2.10 4.50 � 2.17 4.58 � 1.11
The results represent themeans� std deviation of the scores performed by panelists in duplicate. Scoring was performed by using a 9-point scale, in which points representedthe expressions from 1 (dislike extremely) to 9 (like extremely).
a LF ¼ lemon fiber, MD ¼ maltodextrin, CMC ¼ carboxymethylcellulose, WF ¼ wheat fiber, AF ¼ apple fiber.
Ö. Erdem et al. / LWT - Food Science and Technology 56 (2014) 187e193 189
Commercial bitter chocolate (Nestle Dark) was used as referencesample for comparison.
Whiteness indexðWIÞ ¼ 100�h�
100� L*�2þ
�a*�2þ
�b*�2i0:5
(1)
2.7. Sensory profiling of samples
The main principles of Quantitative Descriptive Analysis (QDA�)(Stone, Sidel, Oliver, Woolsey, & Singleton, 1974) were used toevaluate the sensory attributes of chocolates containing malto-dextrin and lemon fiber at different concentrations [1.5, 3.5, 5.5 (g/100 g)].
Table 2Experimental design with factors and responses.
Factor 1: MDa (g/100 g) 1.5 5.5 5.5 3.5
Factor 2:LFa (g/100 g) 3.5 1.5 5.5 3.5
Sample code S1 S2 S3 S4
Responsese Bacteriab 5.38 5.40 5.51 5.50L* bottomc 33.13 33.43 33.29 33.36WI bottomc 32.62 32.96 32.89 32.99a* bottomc 6.26 6.42 6.43 6.15b* bottomc �5.36 �4.66 �3.32 �3.48L* topc 32.52 31.03 30.54 34.68WI topc 32 30.45 30.12 34.3a* topc 6.65 6.21 6.19 6.51b* topc �5.12 �6.49 �4.47 �2.51Smoothnessd 7 7 7 7Brightnessd 5.5 5 5 4Brown colord 5.5 5 5 4.75Bloomd 0 0 0 0.75Cocoa aromad 3.25 3.5 3 3.75Cocoa tasted 3.5 4 3.25 2.5Sweetnessd 3 5.25 6.5 4.5Bitternessd 1.75 0.5 1.25 1.25Bitter aftertasted 1.25 0.5 0.5 1Cocoa aftertasted 3 3 2.5 2.25Bitter flavord 2 0.5 1.5 1Cocoa flavord 3.75 3 3 2.5Chocolate flavord 4 5 4.75 3Hardnessd 5.5 4.75 5.25 5Breakaged 3 3.75 4.25 4Firmnessd 3.25 4.75 6.25 5Smootnessd 5.5 6 6 5.75Melting rated 3.5 3 3.25 4Adherenced 2.5 2.75 4.25 3.25Spreadinessd 3.5 4 3 4Mouthcoatingd 2.75 3 3 3.25
a MD ¼ Maltodextrin, LF ¼ Lemon fiber.b The values represent the average of duplicated measurements for viable bacteria coc The values represent the average of triplicate measurements for color analysis.d The values represent the average of duplicated measurements for sensory analysis.e Responses are listed in order, following the results of microbiological, color and sen
Focus group studies were conducted by 8 panelists (5 females &3 males, between 25 and 40 years), chosen from both graduatestudents and faculty members of Istanbul Technical University ofFood Engineering Department. Panelists were trained in 3 differentsessions, 2 h long each. The glossary of terms and their definitionsand scores for references were determined and scaled in consensus(Table 3). Afterward, each panelist was asked to score the samplesindividually in a 7-point scale. Each panel consisted of 3 consecu-tive sessions where panelists were asked to score 4, 4 and 3 sam-ples in each session. All panels were completed in 3 days. Panelswere performed in duplicates. Judges scored the samples accordingto the glossary and reference scores as shown in Table 3. Chocolateformulations produced for descriptive analysis did not containbacteria.
1.5 3.5 3.5 1.5 3.5 3.5 5.5
1.5 3.5 3.5 5.5 1.5 5.5 3.5
S5 S6 S7 S8 S9 S10 S11
5.47 5.53 5.44 5.42 5.35 5.54 5.5233.29 34.47 32.58 33.45 34.21 35.97 32.9632.9 32.02 31.89 32.6 33.49 35.52 32.486.26 6.46 7.59 8.14 6.9 5.63 6.94
�3.6 �4.11 �5.99 �6.9 �6.88 �5.12 �4.0532.93 31.77 29.33 32.65 31.93 33.96 32.0632.52 31.12 28.5 31.79 31.27 33.39 31.546.44 7.52 7.58 7.74 6.93 6.33 6.23
�3.67 �5.26 �7.43 �7.48 �6.43 �5.9 �5.687 7 7 7 7 7 74.5 5.5 5.75 5 5 4.5 4.254.75 4 5.5 5.75 5.25 4.5 5.250 1 0.5 0.5 0.25 0 04 4 3.25 3.25 4.25 3.75 3.53.25 4 2.75 3 2.75 3 3.51.5 4 4.5 3.75 3.5 5 5.752 2 1.25 1 1.5 1 1.751 1 0.25 0.75 1 0.75 0.253.5 2.75 2 2 2.75 2.5 2.252 2 1 1 1.25 1 1.253.5 3.75 3 3 3 2.25 2.54 5 4 4 4.25 4 4.755.5 5.25 5 5 5.5 5.25 5.253.5 4.25 3.5 4.25 4 4.5 4.52.25 4.75 5 5.5 2.75 5.75 5.55.5 5.5 6 5.25 5.75 6 63.25 3.5 3 3.5 3.5 3.5 3.751.75 2.75 3 3.5 2 4 3.754 3.5 3.75 3.5 3.25 4 43 3.25 3.25 2.75 2.75 2.75 3
unts in log cfu/g.
sory analysis, consecutively.
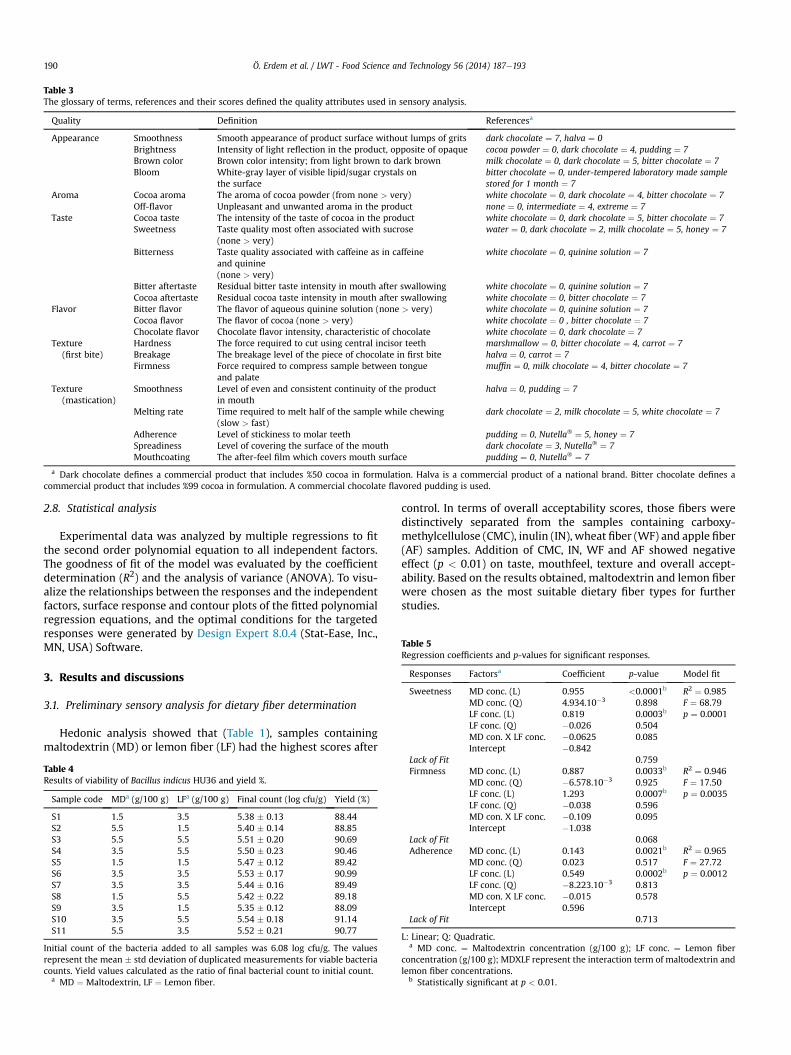
Table 3The glossary of terms, references and their scores defined the quality attributes used in sensory analysis.
Quality Definition Referencesa
Appearance Smoothness Smooth appearance of product surface without lumps of grits dark chocolate ¼ 7, halva ¼ 0Brightness Intensity of light reflection in the product, opposite of opaque cocoa powder ¼ 0, dark chocolate ¼ 4, pudding ¼ 7Brown color Brown color intensity; from light brown to dark brown milk chocolate ¼ 0, dark chocolate ¼ 5, bitter chocolate ¼ 7Bloom White-gray layer of visible lipid/sugar crystals on
the surfacebitter chocolate ¼ 0, under-tempered laboratory made samplestored for 1 month ¼ 7
Aroma Cocoa aroma The aroma of cocoa powder (from none > very) white chocolate ¼ 0, dark chocolate ¼ 4, bitter chocolate ¼ 7Off-flavor Unpleasant and unwanted aroma in the product none ¼ 0, intermediate ¼ 4, extreme ¼ 7
Taste Cocoa taste The intensity of the taste of cocoa in the product white chocolate ¼ 0, dark chocolate ¼ 5, bitter chocolate ¼ 7Sweetness Taste quality most often associated with sucrose
(none > very)water ¼ 0, dark chocolate ¼ 2, milk chocolate ¼ 5, honey ¼ 7
Bitterness Taste quality associated with caffeine as in caffeineand quinine(none > very)
white chocolate ¼ 0, quinine solution ¼ 7
Bitter aftertaste Residual bitter taste intensity in mouth after swallowing white chocolate ¼ 0, quinine solution ¼ 7Cocoa aftertaste Residual cocoa taste intensity in mouth after swallowing white chocolate ¼ 0, bitter chocolate ¼ 7
Flavor Bitter flavor The flavor of aqueous quinine solution (none > very) white chocolate ¼ 0, quinine solution ¼ 7Cocoa flavor The flavor of cocoa (none > very) white chocolate ¼ 0 , bitter chocolate ¼ 7Chocolate flavor Chocolate flavor intensity, characteristic of chocolate white chocolate ¼ 0, dark chocolate ¼ 7
Texture(first bite)
Hardness The force required to cut using central incisor teeth marshmallow ¼ 0, bitter chocolate ¼ 4, carrot ¼ 7Breakage The breakage level of the piece of chocolate in first bite halva ¼ 0, carrot ¼ 7Firmness Force required to compress sample between tongue
and palatemuffin ¼ 0, milk chocolate ¼ 4, bitter chocolate ¼ 7
Texture(mastication)
Smoothness Level of even and consistent continuity of the productin mouth
halva ¼ 0, pudding ¼ 7
Melting rate Time required to melt half of the sample while chewing(slow > fast)
dark chocolate ¼ 2, milk chocolate ¼ 5, white chocolate ¼ 7
Adherence Level of stickiness to molar teeth pudding ¼ 0, Nutella� ¼ 5, honey ¼ 7Spreadiness Level of covering the surface of the mouth dark chocolate ¼ 3, Nutella� ¼ 7Mouthcoating The after-feel film which covers mouth surface pudding ¼ 0, Nutella� ¼ 7
a Dark chocolate defines a commercial product that includes %50 cocoa in formulation. Halva is a commercial product of a national brand. Bitter chocolate defines acommercial product that includes %99 cocoa in formulation. A commercial chocolate flavored pudding is used.
Table 5Regression coefficients and p-values for significant responses.
Responses Factorsa Coefficient p-value Model fit
Sweetness MD conc. (L) 0.955 <0.0001b R2 ¼ 0.985F ¼ 68.79p ¼ 0.0001
MD conc. (Q) 4.934.10�3 0.898LF conc. (L) 0.819 0.0003b
LF conc. (Q) �0.026 0.504MD con. X LF conc. �0.0625 0.085Intercept �0.842
Ö. Erdem et al. / LWT - Food Science and Technology 56 (2014) 187e193190
2.8. Statistical analysis
Experimental data was analyzed by multiple regressions to fitthe second order polynomial equation to all independent factors.The goodness of fit of the model was evaluated by the coefficientdetermination (R2) and the analysis of variance (ANOVA). To visu-alize the relationships between the responses and the independentfactors, surface response and contour plots of the fitted polynomialregression equations, and the optimal conditions for the targetedresponses were generated by Design Expert 8.0.4 (Stat-Ease, Inc.,MN, USA) Software.
3. Results and discussions
3.1. Preliminary sensory analysis for dietary fiber determination
Hedonic analysis showed that (Table 1), samples containingmaltodextrin (MD) or lemon fiber (LF) had the highest scores after
Table 4Results of viability of Bacillus indicus HU36 and yield %.
Sample code MDa (g/100 g) LFa (g/100 g) Final count (log cfu/g) Yield (%)
S1 1.5 3.5 5.38 � 0.13 88.44S2 5.5 1.5 5.40 � 0.14 88.85S3 5.5 5.5 5.51 � 0.20 90.69S4 3.5 5.5 5.50 � 0.23 90.46S5 1.5 1.5 5.47 � 0.12 89.42S6 3.5 3.5 5.53 � 0.17 90.99S7 3.5 3.5 5.44 � 0.16 89.49S8 1.5 5.5 5.42 � 0.22 89.18S9 3.5 1.5 5.35 � 0.12 88.09S10 3.5 5.5 5.54 � 0.18 91.14S11 5.5 3.5 5.52 � 0.21 90.77
Initial count of the bacteria added to all samples was 6.08 log cfu/g. The valuesrepresent the mean � std deviation of duplicated measurements for viable bacteriacounts. Yield values calculated as the ratio of final bacterial count to initial count.
a MD ¼ Maltodextrin, LF ¼ Lemon fiber.
control. In terms of overall acceptability scores, those fibers weredistinctively separated from the samples containing carboxy-methylcellulose (CMC), inulin (IN), wheat fiber (WF) and apple fiber(AF) samples. Addition of CMC, IN, WF and AF showed negativeeffect (p < 0.01) on taste, mouthfeel, texture and overall accept-ability. Based on the results obtained, maltodextrin and lemon fiberwere chosen as the most suitable dietary fiber types for furtherstudies.
Lack of Fit 0.759Firmness MD conc. (L) 0.887 0.0033b R2 ¼ 0.946
F ¼ 17.50p ¼ 0.0035
MD conc. (Q) �6.578.10�3 0.925LF conc. (L) 1.293 0.0007b
LF conc. (Q) �0.038 0.596MD con. X LF conc. �0.109 0.095Intercept �1.038
Lack of Fit 0.068Adherence MD conc. (L) 0.143 0.0021b R2 ¼ 0.965
F ¼ 27.72p ¼ 0.0012
MD conc. (Q) 0.023 0.517LF conc. (L) 0.549 0.0002b
LF conc. (Q) �8.223.10�3 0.813MD con. X LF conc. �0.015 0.578Intercept 0.596
Lack of Fit 0.713
L: Linear; Q: Quadratic.a MD conc. ¼ Maltodextrin concentration (g/100 g); LF conc. ¼ Lemon fiber
concentration (g/100 g); MDXLF represent the interaction term of maltodextrin andlemon fiber concentrations.
b Statistically significant at p < 0.01.
Ö. Erdem et al. / LWT - Food Science and Technology 56 (2014) 187e193 191
3.2. Viable bacteria count
Results of viable cell counts showed that in spite of theobserved reduction (w<1 log cfu/gr) of B. indicus HU36 concen-tration compare to the initial count, all samples contained morethan 5 log cfu/g bacteria survival (Table 4). Yield values indicate theresistance of bacteria to our production process, and the range of88e91% in all samples showed that B. indicus HU36 was highlyresistant. Maragkoudakis et al. (2006) considered probiotic loadbetween 5 and 8 log cfu/g acceptable for dairy products. Sincestudies showed that chocolate is a better sample for probiotics
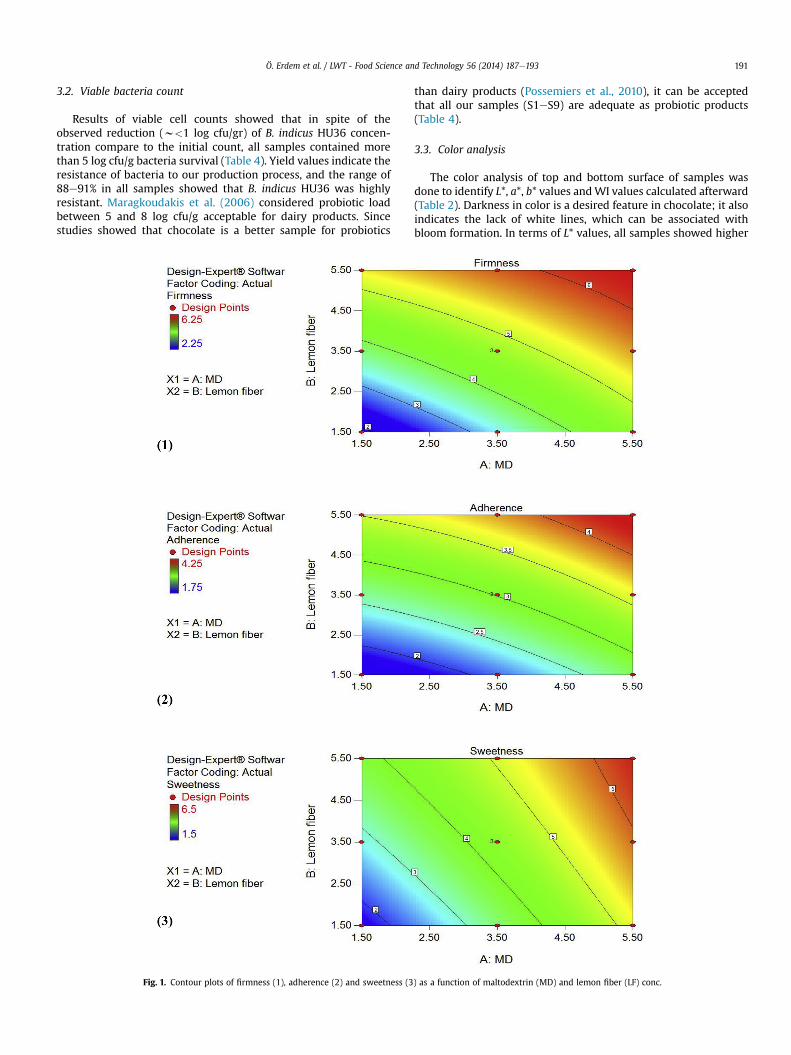
Fig. 1. Contour plots of firmness (1), adherence (2) and sweetness (3
than dairy products (Possemiers et al., 2010), it can be acceptedthat all our samples (S1eS9) are adequate as probiotic products(Table 4).
3.3. Color analysis
The color analysis of top and bottom surface of samples wasdone to identify L*, a*, b* values andWI values calculated afterward(Table 2). Darkness in color is a desired feature in chocolate; it alsoindicates the lack of white lines, which can be associated withbloom formation. In terms of L* values, all samples showed higher
) as a function of maltodextrin (MD) and lemon fiber (LF) conc.
Ö. Erdem et al. / LWT - Food Science and Technology 56 (2014) 187e193192
bottom and top surface L* values than the reference sample (30.52and 29.30 for bottom and top surface). WI values showed similarresults to L* values; showing that the reference sample was darkerthan all samples we produced.
3.4. Model fitting (RSM)
The results of color, sensory analysis, and bacterial counts (re-sponses) of the chocolate formulations all the experiments areshown in Table 2. The experimental data was used to calculate thecoefficients of the quadratic polynomial equations, which were
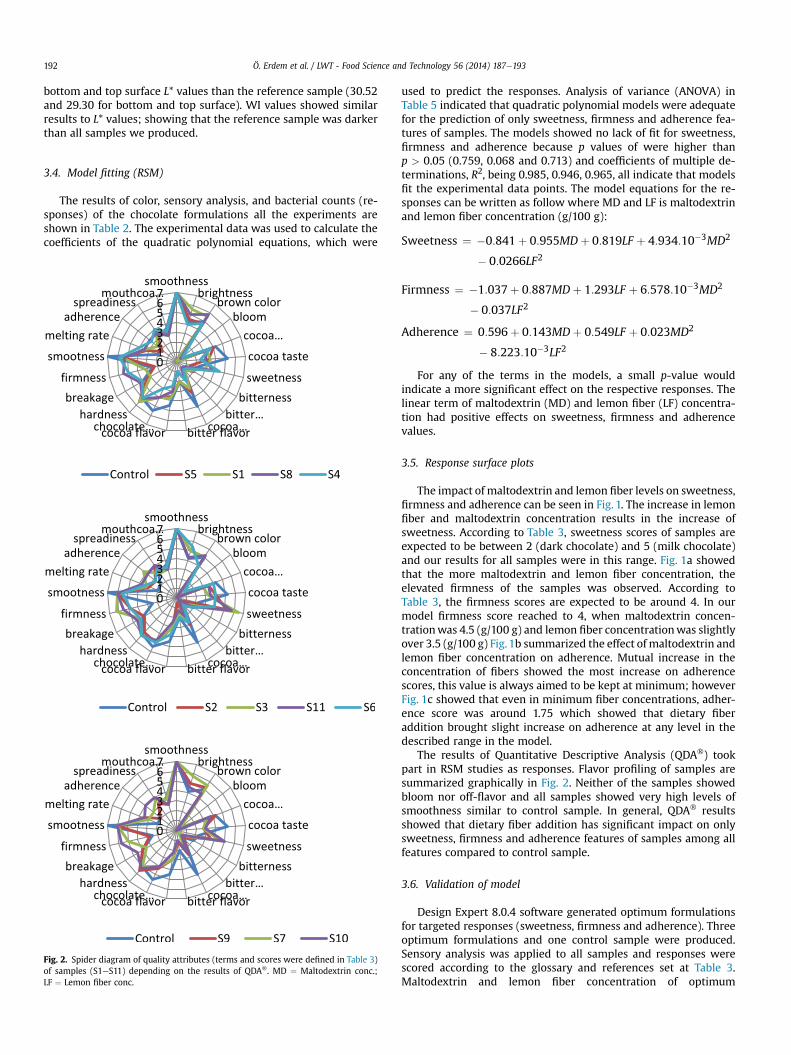
Fig. 2. Spider diagram of quality attributes (terms and scores were defined in Table 3)of samples (S1eS11) depending on the results of QDA�. MD ¼ Maltodextrin conc.;LF ¼ Lemon fiber conc.
used to predict the responses. Analysis of variance (ANOVA) inTable 5 indicated that quadratic polynomial models were adequatefor the prediction of only sweetness, firmness and adherence fea-tures of samples. The models showed no lack of fit for sweetness,firmness and adherence because p values of were higher thanp > 0.05 (0.759, 0.068 and 0.713) and coefficients of multiple de-terminations, R2, being 0.985, 0.946, 0.965, all indicate that modelsfit the experimental data points. The model equations for the re-sponses can be written as follow where MD and LF is maltodextrinand lemon fiber concentration (g/100 g):
Sweetness ¼ �0:841þ 0:955MDþ 0:819LF þ 4:934:10�3MD2
� 0:0266LF2
Firmness ¼ �1:037þ 0:887MDþ 1:293LF þ 6:578:10�3MD2
� 0:037LF2
Adherence ¼ 0:596þ 0:143MDþ 0:549LF þ 0:023MD2
� 8:223:10�3LF2
For any of the terms in the models, a small p-value wouldindicate a more significant effect on the respective responses. Thelinear term of maltodextrin (MD) and lemon fiber (LF) concentra-tion had positive effects on sweetness, firmness and adherencevalues.
3.5. Response surface plots
The impact of maltodextrin and lemon fiber levels on sweetness,firmness and adherence can be seen in Fig. 1. The increase in lemonfiber and maltodextrin concentration results in the increase ofsweetness. According to Table 3, sweetness scores of samples areexpected to be between 2 (dark chocolate) and 5 (milk chocolate)and our results for all samples were in this range. Fig. 1a showedthat the more maltodextrin and lemon fiber concentration, theelevated firmness of the samples was observed. According toTable 3, the firmness scores are expected to be around 4. In ourmodel firmness score reached to 4, when maltodextrin concen-trationwas 4.5 (g/100 g) and lemon fiber concentrationwas slightlyover 3.5 (g/100 g) Fig.1b summarized the effect of maltodextrin andlemon fiber concentration on adherence. Mutual increase in theconcentration of fibers showed the most increase on adherencescores, this value is always aimed to be kept at minimum; howeverFig. 1c showed that even in minimum fiber concentrations, adher-ence score was around 1.75 which showed that dietary fiberaddition brought slight increase on adherence at any level in thedescribed range in the model.
The results of Quantitative Descriptive Analysis (QDA�) tookpart in RSM studies as responses. Flavor profiling of samples aresummarized graphically in Fig. 2. Neither of the samples showedbloom nor off-flavor and all samples showed very high levels ofsmoothness similar to control sample. In general, QDA� resultsshowed that dietary fiber addition has significant impact on onlysweetness, firmness and adherence features of samples among allfeatures compared to control sample.
3.6. Validation of model
Design Expert 8.0.4 software generated optimum formulationsfor targeted responses (sweetness, firmness and adherence). Threeoptimum formulations and one control sample were produced.Sensory analysis was applied to all samples and responses werescored according to the glossary and references set at Table 3.Maltodextrin and lemon fiber concentration of optimum
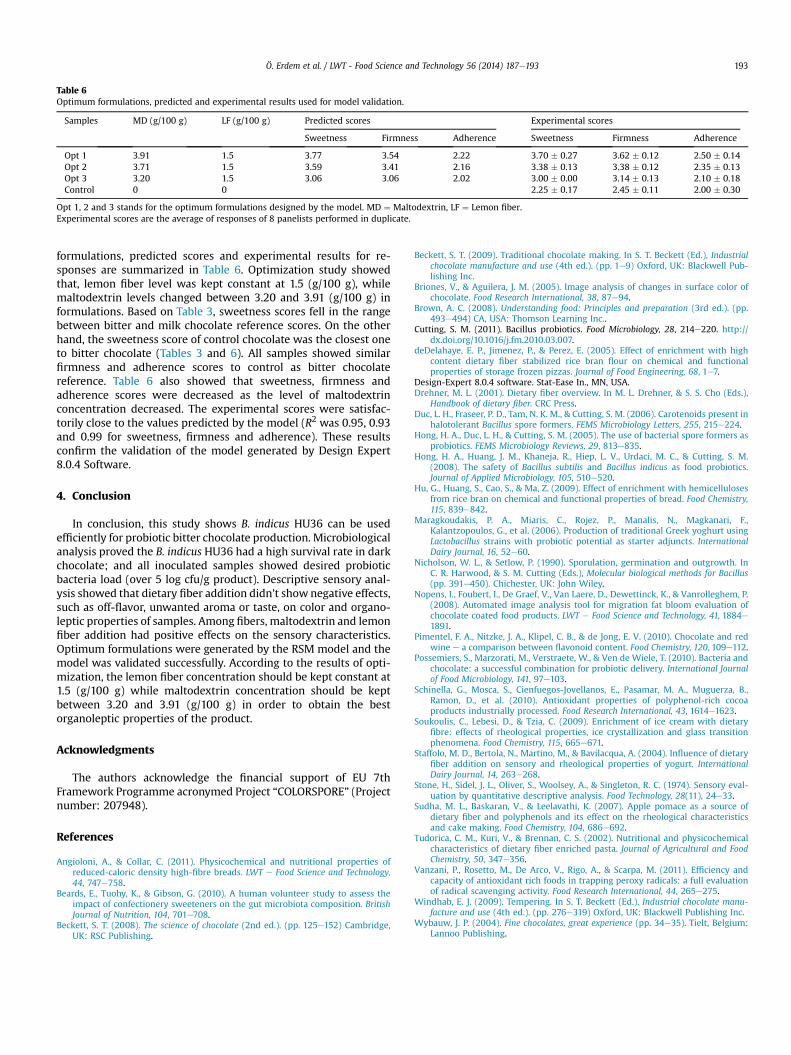
Table 6Optimum formulations, predicted and experimental results used for model validation.
Samples MD (g/100 g) LF (g/100 g) Predicted scores Experimental scores
Sweetness Firmness Adherence Sweetness Firmness Adherence
Opt 1 3.91 1.5 3.77 3.54 2.22 3.70 � 0.27 3.62 � 0.12 2.50 � 0.14Opt 2 3.71 1.5 3.59 3.41 2.16 3.38 � 0.13 3.38 � 0.12 2.35 � 0.13Opt 3 3.20 1.5 3.06 3.06 2.02 3.00 � 0.00 3.14 � 0.13 2.10 � 0.18Control 0 0 2.25 � 0.17 2.45 � 0.11 2.00 � 0.30
Opt 1, 2 and 3 stands for the optimum formulations designed by the model. MD ¼ Maltodextrin, LF ¼ Lemon fiber.Experimental scores are the average of responses of 8 panelists performed in duplicate.
Ö. Erdem et al. / LWT - Food Science and Technology 56 (2014) 187e193 193
formulations, predicted scores and experimental results for re-sponses are summarized in Table 6. Optimization study showedthat, lemon fiber level was kept constant at 1.5 (g/100 g), whilemaltodextrin levels changed between 3.20 and 3.91 (g/100 g) informulations. Based on Table 3, sweetness scores fell in the rangebetween bitter and milk chocolate reference scores. On the otherhand, the sweetness score of control chocolate was the closest oneto bitter chocolate (Tables 3 and 6). All samples showed similarfirmness and adherence scores to control as bitter chocolatereference. Table 6 also showed that sweetness, firmness andadherence scores were decreased as the level of maltodextrinconcentration decreased. The experimental scores were satisfac-torily close to the values predicted by the model (R2 was 0.95, 0.93and 0.99 for sweetness, firmness and adherence). These resultsconfirm the validation of the model generated by Design Expert8.0.4 Software.
4. Conclusion
In conclusion, this study shows B. indicus HU36 can be usedefficiently for probiotic bitter chocolate production. Microbiologicalanalysis proved the B. indicus HU36 had a high survival rate in darkchocolate; and all inoculated samples showed desired probioticbacteria load (over 5 log cfu/g product). Descriptive sensory anal-ysis showed that dietary fiber addition didn’t show negative effects,such as off-flavor, unwanted aroma or taste, on color and organo-leptic properties of samples. Among fibers, maltodextrin and lemonfiber addition had positive effects on the sensory characteristics.Optimum formulations were generated by the RSM model and themodel was validated successfully. According to the results of opti-mization, the lemon fiber concentration should be kept constant at1.5 (g/100 g) while maltodextrin concentration should be keptbetween 3.20 and 3.91 (g/100 g) in order to obtain the bestorganoleptic properties of the product.
Acknowledgments
The authors acknowledge the financial support of EU 7thFramework Programme acronymed Project “COLORSPORE” (Projectnumber: 207948).
References
Angioloni, A., & Collar, C. (2011). Physicochemical and nutritional properties ofreduced-caloric density high-fibre breads. LWT e Food Science and Technology,44, 747e758.
Beards, E., Tuohy, K., & Gibson, G. (2010). A human volunteer study to assess theimpact of confectionery sweeteners on the gut microbiota composition. BritishJournal of Nutrition, 104, 701e708.
Beckett, S. T. (2008). The science of chocolate (2nd ed.). (pp. 125e152) Cambridge,UK: RSC Publishing.
Beckett, S. T. (2009). Traditional chocolate making. In S. T. Beckett (Ed.), Industrialchocolate manufacture and use (4th ed.). (pp. 1e9) Oxford, UK: Blackwell Pub-lishing Inc.
Briones, V., & Aguilera, J. M. (2005). Image analysis of changes in surface color ofchocolate. Food Research International, 38, 87e94.
Brown, A. C. (2008). Understanding food: Principles and preparation (3rd ed.). (pp.493e494) CA, USA: Thomson Learning Inc..
Cutting, S. M. (2011). Bacillus probiotics. Food Microbiology, 28, 214e220. http://dx.doi.org/10.1016/j.fm.2010.03.007.
deDelahaye, E. P., Jimenez, P., & Perez, E. (2005). Effect of enrichment with highcontent dietary fiber stabilized rice bran flour on chemical and functionalproperties of storage frozen pizzas. Journal of Food Engineering, 68, 1e7.
Design-Expert 8.0.4 software. Stat-Ease In., MN, USA.Drehner, M. L. (2001). Dietary fiber overview. In M. L. Drehner, & S. S. Cho (Eds.),
Handbook of dietary fiber. CRC Press.Duc, L. H., Fraseer, P. D., Tam, N. K. M., & Cutting, S. M. (2006). Carotenoids present in
halotolerant Bacillus spore formers. FEMS Microbiology Letters, 255, 215e224.Hong, H. A., Duc, L. H., & Cutting, S. M. (2005). The use of bacterial spore formers as
probiotics. FEMS Microbiology Reviews, 29, 813e835.Hong, H. A., Huang, J. M., Khaneja, R., Hiep, L. V., Urdaci, M. C., & Cutting, S. M.
(2008). The safety of Bacillus subtilis and Bacillus indicus as food probiotics.Journal of Applied Microbiology, 105, 510e520.
Hu, G., Huang, S., Cao, S., & Ma, Z. (2009). Effect of enrichment with hemicellulosesfrom rice bran on chemical and functional properties of bread. Food Chemistry,115, 839e842.
Maragkoudakis, P. A., Miaris, C., Rojez, P., Manalis, N., Magkanari, F.,Kalantzopoulos, G., et al. (2006). Production of traditional Greek yoghurt usingLactobacillus strains with probiotic potential as starter adjuncts. InternationalDairy Journal, 16, 52e60.
Nicholson, W. L., & Setlow, P. (1990). Sporulation, germination and outgrowth. InC. R. Harwood, & S. M. Cutting (Eds.), Molecular biological methods for Bacillus(pp. 391e450). Chichester, UK: John Wiley.
Nopens, I., Foubert, I., De Graef, V., Van Laere, D., Dewettinck, K., & Vanrolleghem, P.(2008). Automated image analysis tool for migration fat bloom evaluation ofchocolate coated food products. LWT e Food Science and Technology, 41, 1884e1891.
Pimentel, F. A., Nitzke, J. A., Klipel, C. B., & de Jong, E. V. (2010). Chocolate and redwine e a comparison between flavonoid content. Food Chemistry, 120, 109e112.
Possemiers, S., Marzorati, M., Verstraete, W., & Ven de Wiele, T. (2010). Bacteria andchocolate: a successful combination for probiotic delivery. International Journalof Food Microbiology, 141, 97e103.
Schinella, G., Mosca, S., Cienfuegos-Jovellanos, E., Pasamar, M. A., Muguerza, B.,Ramon, D., et al. (2010). Antioxidant properties of polyphenol-rich cocoaproducts industrially processed. Food Research International, 43, 1614e1623.
Soukoulis, C., Lebesi, D., & Tzia, C. (2009). Enrichment of ice cream with dietaryfibre: effects of rheological properties, ice crystallization and glass transitionphenomena. Food Chemistry, 115, 665e671.
Staffolo, M. D., Bertola, N., Martino, M., & Bavilacqua, A. (2004). Influence of dietaryfiber addition on sensory and rheological properties of yogurt. InternationalDairy Journal, 14, 263e268.
Stone, H., Sidel, J. L., Oliver, S., Woolsey, A., & Singleton, R. C. (1974). Sensory eval-uation by quantitative descriptive analysis. Food Technology, 28(11), 24e33.
Sudha, M. L., Baskaran, V., & Leelavathi, K. (2007). Apple pomace as a source ofdietary fiber and polyphenols and its effect on the rheological characteristicsand cake making. Food Chemistry, 104, 686e692.
Tudorica, C. M., Kuri, V., & Brennan, C. S. (2002). Nutritional and physicochemicalcharacteristics of dietary fiber enriched pasta. Journal of Agricultural and FoodChemistry, 50, 347e356.
Vanzani, P., Rosetto, M., De Arco, V., Rigo, A., & Scarpa, M. (2011). Efficiency andcapacity of antioxidant rich foods in trapping peroxy radicals: a full evaluationof radical scavenging activity. Food Research International, 44, 265e275.
Windhab, E. J. (2009). Tempering. In S. T. Beckett (Ed.), Industrial chocolate manu-facture and use (4th ed.). (pp. 276e319) Oxford, UK: Blackwell Publishing Inc.
Wybauw, J. P. (2004). Fine chocolates, great experience (pp. 34e35). Tielt, Belgium:Lannoo Publishing.