Embed Size (px)
Citation preview
Development of a model for intensity of flavourcharacter in blackcurrant concentratesRaymond K Boccorh, Alistair Paterson* and John R PiggottCentre for Food Quality, University of Strathclyde, Department of Bioscience and Biotechnology, 204 George Street, Glasgow G1 1XW,Scotland, UK
Abstract: The feasibility of routine quanti®cation of ¯avour character intensity in fruit concentrates by
chromatography was studied. A set of 37 volatile components, previously identi®ed as ¯avour-active by
gas chromatography-olfactometry, were quanti®ed in 133 different blackcurrant concentrates from
three seasons, by gas chromatography with ¯ame ionisation detection. Sensory data on intensities of
¯avour character in these concentrates were obtained using ratio scaling. Partial least squares
regression (PLS) was employed to develop models describing relationships between intensity of ¯avour
character and concentrations of speci®c ¯avour components. Separate models were obtained for
concentrates produced within three single seasons. Individual concentrates varied in: geographical
origin; post-harvest fruit storage (chilled or frozen); and concentration strategy, either conventional
thermal or freeze technology. Cross-validation (by PLS) determined the number of correlation factors
required to reach minimum prediction error for each model. The ®nal model had a regression
coef®cient of 0.80, dependent upon 10 ¯avour components, and was suited for predicting ¯avour
character intensity in blackcurrant drinks from concentrates.
# 1999 Society of Chemical Industry
Keywords: partial least square regression; multivariate statistical modelling; fruit ¯avour; fruit drinks; gaschromatography-olfactometry; sensory compositional relationships
INTRODUCTIONIn fruit drinks industries, it is important that products
are of consistent ¯avour quality and intensity despite
variations in availability of the fruit concentrates which
are primary ingredients. Although concentrates can be
blended to minimise sensory differences, manufac-
turers cannot currently routinely determine level of
concentrate required to obtain a predetermined
intensity of ¯avour character by a compositional
analysis.
Multivariate statistics can facilitate understanding of
relationships between ¯avour composition and sensory
character,1 correlating sensory factors, such as attri-
bute intensity, with chromatographic data. Williams
and his coworkers2,3 have summarised the different
options. Whereas least squares curve ®tting, and other
classical correlation approaches, model important
sources of variance, these may ignore other data
yielding important information on overall ¯avour
character and be suitable only for model systems.1 In
contrast, inverse calibration methods (eg multiple
linear regression, canonical correlation analysis and
redundancy analysis) compensate for all, including
minor, sources of variance on the basis that every
variable contains unique information. Theoretical
considerations suggest neither is well suited to
chromatographic data, failing to satisfy key criteria
for identi®cation of meaningful relationships.2,3
Further, for both approaches, the number of samples
should exceed that of the total of variables which is not
always possible in practice.
Two intermediate methodologies, principal compo-
nent (PCR) and partial least squares (PLS) regression
have been used to model primary sources of variance
in ¯avour data. PCR summarises and extracts the
maximum of information, via principal component
analysis, in the original variables but in practice may
yield models with poor predictive abilities. One
problem is that PCR shows a bias towards variables
accounting for large proportions of variance indepen-
dent of sensory signi®cance. However, PLS both
summarises information in variables and maximises
explanation of speci®c sensory variables, minimising
prediction error. In summary, PLS may not yield
models with the predictive ability of multiple linear
regression or redundancy analysis, or the ability to
summarise analytical data of principal component
regression, but does provides robust models that
minimise prediction errors.
The aim was to clarify the compositional basis of
overall ¯avour character intensity in thermal evapora-
tive fruit concentrates, speci®cally from blackcurrants.
Journal of the Science of Food and Agriculture J Sci Food Agric 79:1495±1502 (1999)
* Correspondence to: Alistair Paterson, Centre for Food Quality, University of Strathclyde, Department of Bioscience and Biotechnology, 204George Street, Glasgow G1 1XW, UKE-mail: [email protected](Received 16 March 1998; revised version received 1 April 1999; accepted 20 April 1999)
# 1999 Society of Chemical Industry. J Sci Food Agric 0022±5142/99/$17.50 1495
It was also important to determine if a suf®ciently
robust model could be developed to be used with
concentrates of different geographical origins, seasons
and prepared from fruits stored at either�4 orÿ20°C.
Earlier studies4,5 had identi®ed by gas chromatogra-
phy/olfactometry (GCO), 37 volatile components in
concentrates which were ¯avour-active (Table 1). PLS
was chosen to model linear relationships between
concentrations of such components, from GC data,
and a single sensory factor, intensity of ¯avour
character (PLS 1), obtained by ratio scaling. A
previous study6 developed a model for a restricted
set of blackcurrant concentrates using total GC data
from a ¯ame ionisation detector. In this study a wider
range of concentrates was studied and compositional
data edited to include only the ¯avour-active compo-
nents.
MATERIALS AND METHODSQuantification of flavour componentsBlackcurrant concentrates used were described pre-
viously.5 Flavour components were concentrated by
sorbent extraction and quanti®ed as described else-
where.7 Integrated GC data on ¯avour-active compo-
nents were normalised to unitary variance. For each
sample duplicate extractions were made, and for each
extract duplicate injections were performed and mean
values used for construction of data sets. Flavour
components were discriminated into character-enhan-
cing or character-diminishing on the basis of char-
acterisation of extracts obtained using different
sorbent eluents and gas chromatography/olfactome-
try.4,8
Determination of flavour character intensity inconcentratesRatio scaling of ¯avour intensity in model blackcurrant
drinks was carried out as described elsewhere.9 Prior
to statistical analysis, individual assessor scores for
samples were pooled to two standards by modulus
normalisation.10 This brought sample scores within a
single consensus range, eliminating variation between
assessors. Sensory analyses were performed in dupli-
cate sessions employing balanced presentations.11
Statistical modellingModelling of relationships between data sets was
effected using PLS1 relating compositional to sensory
data, employing Unscrambler, v3.55 (CAMO A/S,
N-7041 Trondheim, Norway).
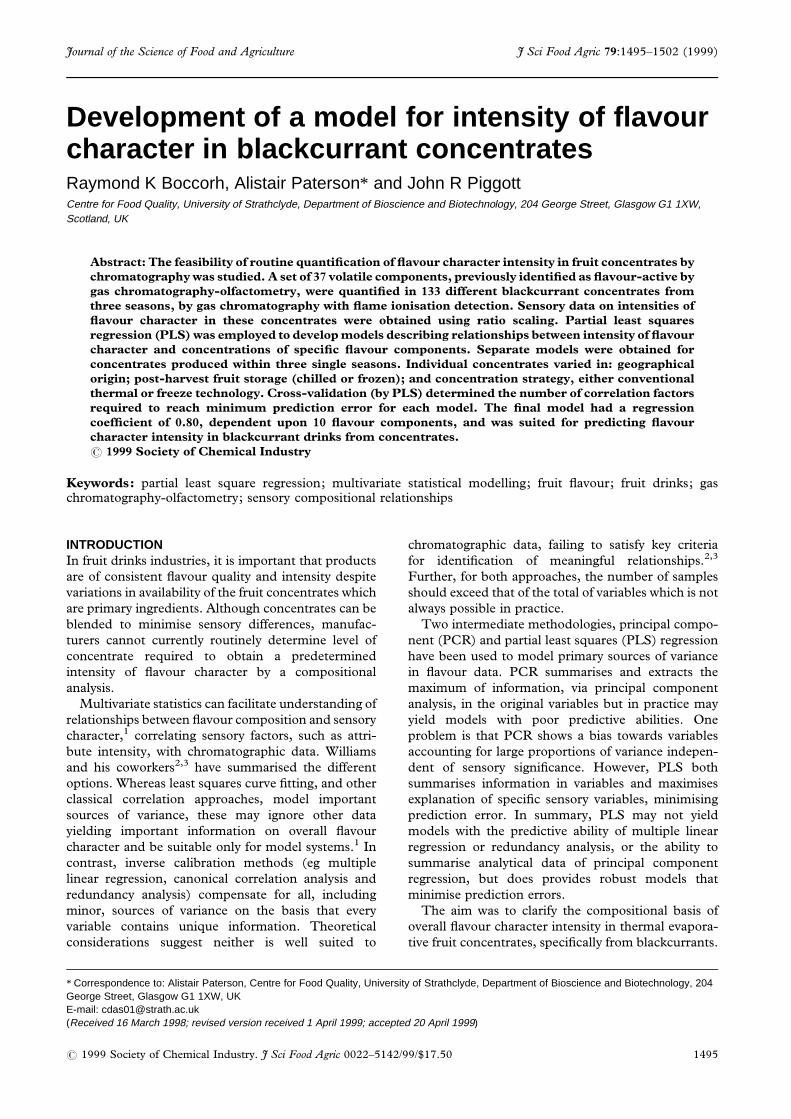
RESULTSConcentrates from 1989 fruitFor 1989 concentrates, cross-validation showed two
signi®cant PLS factors explaining 58% variance (Fig
1) Discriminating on the basis of chilled or frozen
storage of fruits on the ®rst Factor, separated New
Zealand and fresh fruit concentrates. Factor 2
separated New Zealand and frozen fruit from fresh
UK berry concentrates. From PLS loadings, 17
¯avour components in¯uenced this model. Variables
conferring character-enhancing cooked beans and spicyaroma notes were best described by Factor 1, with
positive loadings and highly intercorrelated. Also
described by Factor I were components with dimin-
ishing faecal, burnt beans and dried hay aroma notes,
with negative loadings. These were negatively corre-
lated with character-enhancing components. On
Factor 2 components with enhancing cooked beansand burnt incense notes had high positive loadings, and
those with character-diminishing notes had negative
loadings. A single compound with the enhancing
manure-like note was clustered with components with
diminishing notes. Clustering of variables was pro-
nounced particularly with negatively loaded wilted¯ower, dried hay and burnt rubber notes. The compo-
nents with a leathery note had no in¯uence in the
model.
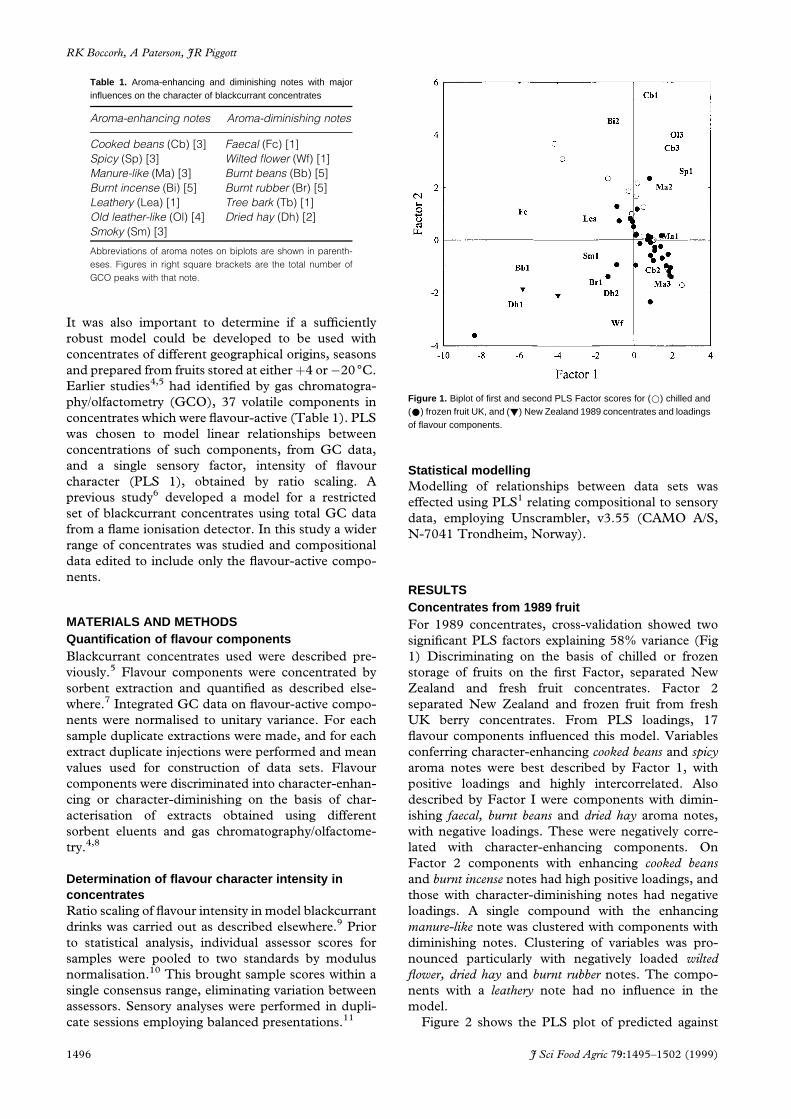
Figure 2 shows the PLS plot of predicted against
Table 1. Aroma-enhancing and diminishing notes with majorinfluences on the character of blackcurrant concentrates
Aroma-enhancing notes Aroma-diminishing notes
Cooked beans (Cb) [3] Faecal (Fc) [1]
Spicy (Sp) [3] Wilted ¯ower (Wf) [1]
Manure-like (Ma) [3] Burnt beans (Bb) [5]
Burnt incense (Bi) [5] Burnt rubber (Br) [5]
Leathery (Lea) [1] Tree bark (Tb) [1]
Old leather-like (Ol) [4] Dried hay (Dh) [2]
Smoky (Sm) [3]
Abbreviations of aroma notes on biplots are shown in parenth-
eses. Figures in right square brackets are the total number of
GCO peaks with that note.
Figure 1. Biplot of first and second PLS Factor scores for (*) chilled and(*) frozen fruit UK, and (!) New Zealand 1989 concentrates and loadingsof flavour components.
1496 J Sci Food Agric 79:1495±1502 (1999)
RK Boccorh, A Paterson, JR Piggott
measured ¯avour character intensity. A correlation
coef®cient of 0.39, indicated low predictive ability.
Concentrates from New Zealand and frozen UK fruits
were outliers and contributed to large errors. There
was no differentiation of concentrates on the basis of
differences in post-harvest storage of fruits.
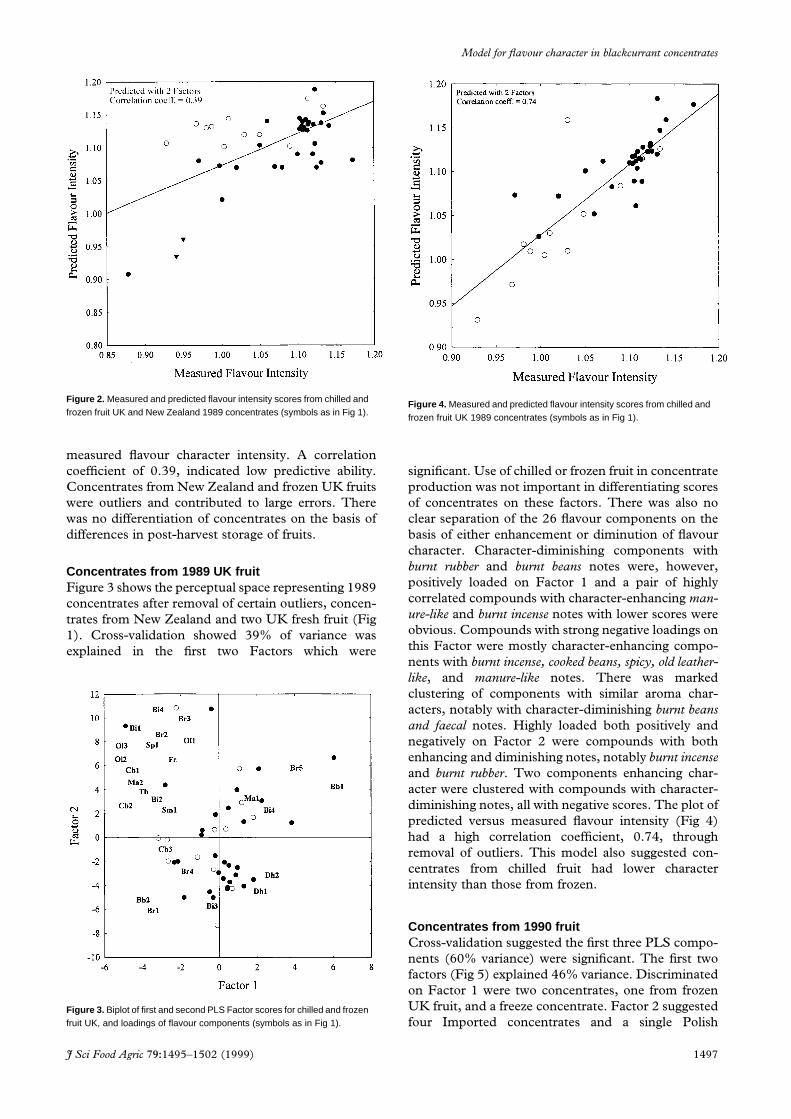
Concentrates from 1989 UK fruitFigure 3 shows the perceptual space representing 1989
concentrates after removal of certain outliers, concen-
trates from New Zealand and two UK fresh fruit (Fig
1). Cross-validation showed 39% of variance was
explained in the ®rst two Factors which were
signi®cant. Use of chilled or frozen fruit in concentrate
production was not important in differentiating scores
of concentrates on these factors. There was also no
clear separation of the 26 ¯avour components on the
basis of either enhancement or diminution of ¯avour
character. Character-diminishing components with
burnt rubber and burnt beans notes were, however,
positively loaded on Factor 1 and a pair of highly
correlated compounds with character-enhancing man-ure-like and burnt incense notes with lower scores were
obvious. Compounds with strong negative loadings on
this Factor were mostly character-enhancing compo-
nents with burnt incense, cooked beans, spicy, old leather-like, and manure-like notes. There was marked
clustering of components with similar aroma char-
acters, notably with character-diminishing burnt beansand faecal notes. Highly loaded both positively and
negatively on Factor 2 were compounds with both
enhancing and diminishing notes, notably burnt incenseand burnt rubber. Two components enhancing char-
acter were clustered with compounds with character-
diminishing notes, all with negative scores. The plot of
predicted versus measured ¯avour intensity (Fig 4)
had a high correlation coef®cient, 0.74, through
removal of outliers. This model also suggested con-
centrates from chilled fruit had lower character
intensity than those from frozen.
Concentrates from 1990 fruitCross-validation suggested the ®rst three PLS compo-
nents (60% variance) were signi®cant. The ®rst two
factors (Fig 5) explained 46% variance. Discriminated
on Factor 1 were two concentrates, one from frozen
UK fruit, and a freeze concentrate. Factor 2 suggested
four Imported concentrates and a single Polish
Figure 2. Measured and predicted flavour intensity scores from chilled andfrozen fruit UK and New Zealand 1989 concentrates (symbols as in Fig 1).
Figure 3. Biplot of first and second PLS Factor scores for chilled and frozenfruit UK, and loadings of flavour components (symbols as in Fig 1).
Figure 4. Measured and predicted flavour intensity scores from chilled andfrozen fruit UK 1989 concentrates (symbols as in Fig 1).
J Sci Food Agric 79:1495±1502 (1999) 1497
Model for ¯avour character in blackcurrant concentrates
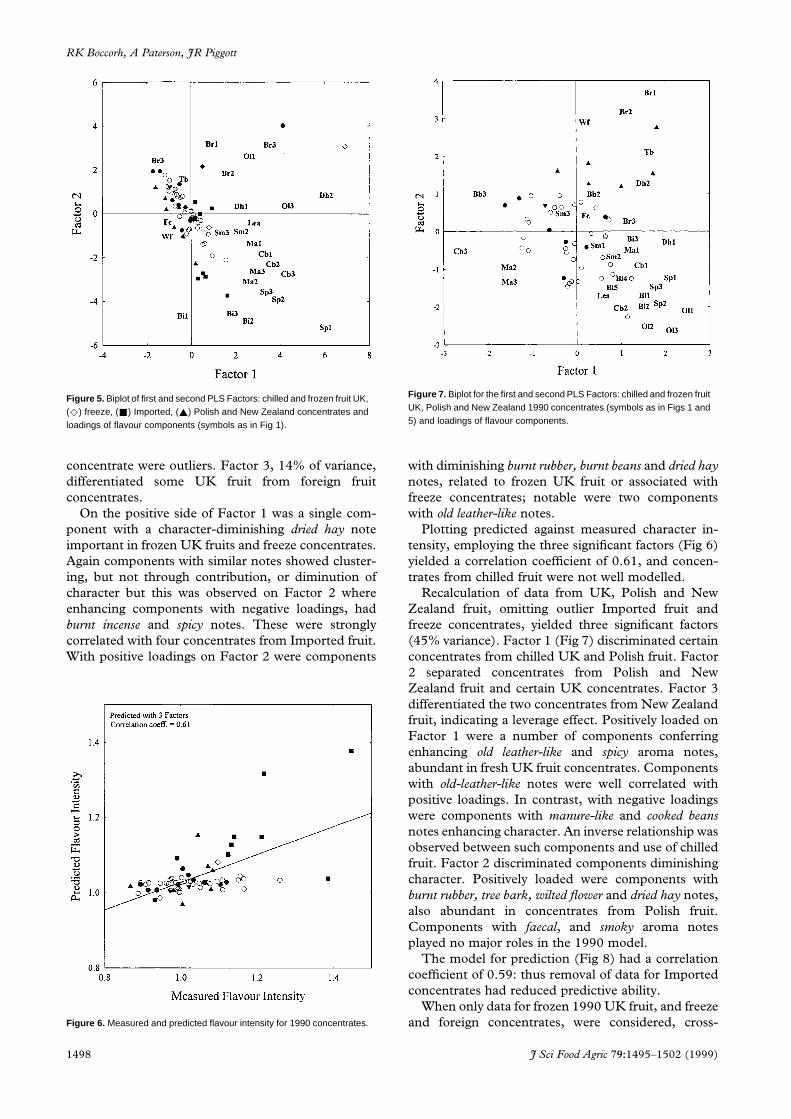
concentrate were outliers. Factor 3, 14% of variance,
differentiated some UK fruit from foreign fruit
concentrates.
On the positive side of Factor 1 was a single com-
ponent with a character-diminishing dried hay note
important in frozen UK fruits and freeze concentrates.
Again components with similar notes showed cluster-
ing, but not through contribution, or diminution of
character but this was observed on Factor 2 where
enhancing components with negative loadings, had
burnt incense and spicy notes. These were strongly
correlated with four concentrates from Imported fruit.
With positive loadings on Factor 2 were components
with diminishing burnt rubber, burnt beans and dried haynotes, related to frozen UK fruit or associated with
freeze concentrates; notable were two components
with old leather-like notes.
Plotting predicted against measured character in-
tensity, employing the three signi®cant factors (Fig 6)
yielded a correlation coef®cient of 0.61, and concen-
trates from chilled fruit were not well modelled.
Recalculation of data from UK, Polish and New
Zealand fruit, omitting outlier Imported fruit and
freeze concentrates, yielded three signi®cant factors
(45% variance). Factor 1 (Fig 7) discriminated certain
concentrates from chilled UK and Polish fruit. Factor
2 separated concentrates from Polish and New
Zealand fruit and certain UK concentrates. Factor 3
differentiated the two concentrates from New Zealand
fruit, indicating a leverage effect. Positively loaded on
Factor 1 were a number of components conferring
enhancing old leather-like and spicy aroma notes,
abundant in fresh UK fruit concentrates. Components
with old-leather-like notes were well correlated with
positive loadings. In contrast, with negative loadings
were components with manure-like and cooked beansnotes enhancing character. An inverse relationship was
observed between such components and use of chilled
fruit. Factor 2 discriminated components diminishing
character. Positively loaded were components with
burnt rubber, tree bark, wilted ¯ower and dried hay notes,
also abundant in concentrates from Polish fruit.
Components with faecal, and smoky aroma notes
played no major roles in the 1990 model.
The model for prediction (Fig 8) had a correlation
coef®cient of 0.59: thus removal of data for Imported
concentrates had reduced predictive ability.
When only data for frozen 1990 UK fruit, and freeze
and foreign concentrates, were considered, cross-
Figure 5. Biplot of first and second PLS Factors: chilled and frozen fruit UK,(^) freeze, (&) Imported, (~) Polish and New Zealand concentrates andloadings of flavour components (symbols as in Fig 1).
Figure 6. Measured and predicted flavour intensity for 1990 concentrates.
Figure 7. Biplot for the first and second PLS Factors: chilled and frozen fruitUK, Polish and New Zealand 1990 concentrates (symbols as in Figs 1 and5) and loadings of flavour components.
1498 J Sci Food Agric 79:1495±1502 (1999)
RK Boccorh, A Paterson, JR Piggott
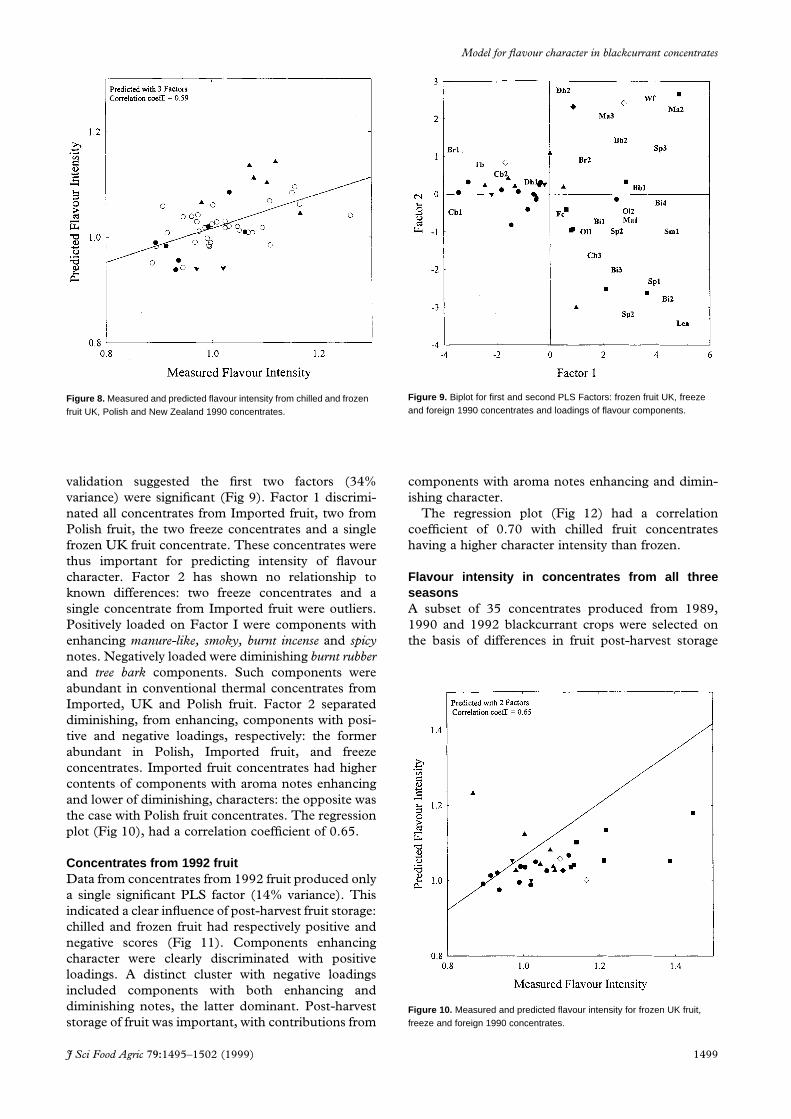
validation suggested the ®rst two factors (34%
variance) were signi®cant (Fig 9). Factor 1 discrimi-
nated all concentrates from Imported fruit, two from
Polish fruit, the two freeze concentrates and a single
frozen UK fruit concentrate. These concentrates were
thus important for predicting intensity of ¯avour
character. Factor 2 has shown no relationship to
known differences: two freeze concentrates and a
single concentrate from Imported fruit were outliers.
Positively loaded on Factor I were components with
enhancing manure-like, smoky, burnt incense and spicynotes. Negatively loaded were diminishing burnt rubberand tree bark components. Such components were
abundant in conventional thermal concentrates from
Imported, UK and Polish fruit. Factor 2 separated
diminishing, from enhancing, components with posi-
tive and negative loadings, respectively: the former
abundant in Polish, Imported fruit, and freeze
concentrates. Imported fruit concentrates had higher
contents of components with aroma notes enhancing
and lower of diminishing, characters: the opposite was
the case with Polish fruit concentrates. The regression
plot (Fig 10), had a correlation coef®cient of 0.65.
Concentrates from 1992 fruitData from concentrates from 1992 fruit produced only
a single signi®cant PLS factor (14% variance). This
indicated a clear in¯uence of post-harvest fruit storage:
chilled and frozen fruit had respectively positive and
negative scores (Fig 11). Components enhancing
character were clearly discriminated with positive
loadings. A distinct cluster with negative loadings
included components with both enhancing and
diminishing notes, the latter dominant. Post-harvest
storage of fruit was important, with contributions from
components with aroma notes enhancing and dimin-
ishing character.
The regression plot (Fig 12) had a correlation
coef®cient of 0.70 with chilled fruit concentrates
having a higher character intensity than frozen.
Flavour intensity in concentrates from all threeseasonsA subset of 35 concentrates produced from 1989,
1990 and 1992 blackcurrant crops were selected on
the basis of differences in fruit post-harvest storage
Figure 8. Measured and predicted flavour intensity from chilled and frozenfruit UK, Polish and New Zealand 1990 concentrates.
Figure 9. Biplot for first and second PLS Factors: frozen fruit UK, freezeand foreign 1990 concentrates and loadings of flavour components.
Figure 10. Measured and predicted flavour intensity for frozen UK fruit,freeze and foreign 1990 concentrates.
J Sci Food Agric 79:1495±1502 (1999) 1499
Model for ¯avour character in blackcurrant concentrates
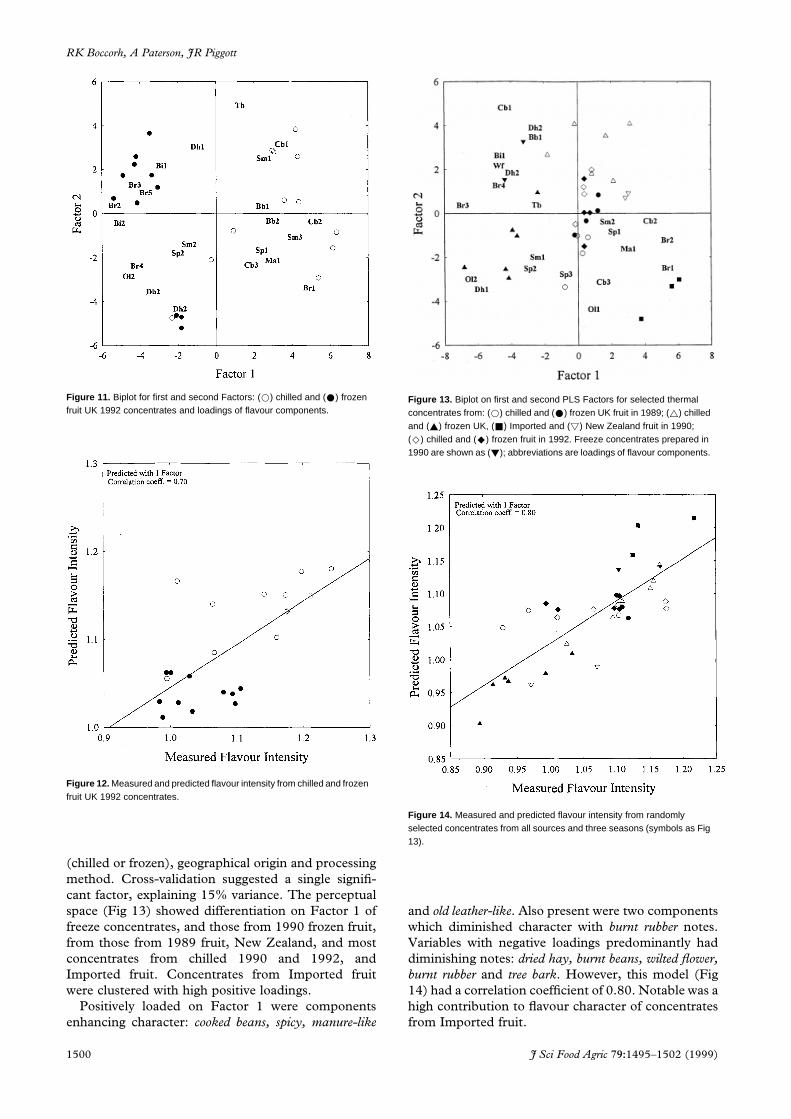
(chilled or frozen), geographical origin and processing
method. Cross-validation suggested a single signi®-
cant factor, explaining 15% variance. The perceptual
space (Fig 13) showed differentiation on Factor 1 of
freeze concentrates, and those from 1990 frozen fruit,
from those from 1989 fruit, New Zealand, and most
concentrates from chilled 1990 and 1992, and
Imported fruit. Concentrates from Imported fruit
were clustered with high positive loadings.
Positively loaded on Factor 1 were components
enhancing character: cooked beans, spicy, manure-like
and old leather-like. Also present were two components
which diminished character with burnt rubber notes.
Variables with negative loadings predominantly had
diminishing notes: dried hay, burnt beans, wilted ¯ower,burnt rubber and tree bark. However, this model (Fig
14) had a correlation coef®cient of 0.80. Notable was a
high contribution to ¯avour character of concentrates
from Imported fruit.
Figure 11. Biplot for first and second Factors: (*) chilled and (*) frozenfruit UK 1992 concentrates and loadings of flavour components.
Figure 12. Measured and predicted flavour intensity from chilled and frozenfruit UK 1992 concentrates.
Figure 13. Biplot on first and second PLS Factors for selected thermalconcentrates from: (*) chilled and (*) frozen UK fruit in 1989; (~) chilledand (~) frozen UK, (&) Imported and (!) New Zealand fruit in 1990;(^) chilled and (^) frozen fruit in 1992. Freeze concentrates prepared in1990 are shown as (!); abbreviations are loadings of flavour components.
Figure 14. Measured and predicted flavour intensity from randomlyselected concentrates from all sources and three seasons (symbols as Fig13).
1500 J Sci Food Agric 79:1495±1502 (1999)
RK Boccorh, A Paterson, JR Piggott
Prediction of flavour character intensity inconcentratesRegression coef®cients for all ¯avour-active compo-
nents in the ®nal model for the subset of concentrates
from all three seasons and fruit of differing geographic
origins showed a subset of 20 were important.
Leverages and residual variances, however, suggested
that 10 components, with both enhancing and
diminishing notes, had major in¯uences. Components
enhancing character included those with spicy,manure-like 1, cooked beans 1 and 2, old leather-like 2
and smoky 2 notes. Components diminishing character
included certain with wilted ¯ower, burnt rubber 1 and
dried hay 1 & 2 notes (Table 2).
From calculated coef®cients, intensity of ¯avour in
the selected concentrates could be predicted from the
following equation:
Y � 0:9033� 0:125�SP2� � 0:54�MAN1�ÿ 0:61�SM2� ÿ 0:026�CB1� � 0:034�CB2�ÿ 0:135�OL2� ÿ 0:151�WF� ÿ 0:003�BR1�ÿ 0:042�DH1� � 6:26�DH2�
DISCUSSIONDrinks manufacturers could predict intensity of
¯avour character from compositional data, but there
are few reports.6,12±14 The PLS 1 model for ¯avour
intensity in diverse concentrates of three seasons was
signi®cantly better than for individual years. Dis-
cussions on enhancement or reduction in ¯avour
character were based upon sensory studies of sorbent
and liquid/liquid extracts from a single blackcurrant
concentrate7,8 and originate in many products having
unpleasant aroma notes.15±17 Processed fruit ¯avour
components have similar origins in thermal modi®ca-
tions of labile ¯avour compounds and their precur-
sors.18
The 1989 concentrates model included only those
from a single production site following elimination of
outliers (New Zealand and two UK concentrates from
fresh fruits) enhancing predictive ability. Other con-
centrates showed marked variations in contents of
components both enhancing and diminishing ¯avour
character. The relevance of either enhancing or
diminishing overall character intensity merits consid-
eration. Among 1990 concentrates there was no clear
separation on this basis on the ®rst PLS Factor, and
this was not related to prediction, whereas in the 1992
concentrates model there was a clear relationship on
the ®rst Factor. This could be associated with the
heterogeneous composition (varied geographical ori-
gin) of 1990 concentrates. A group of similar
concentrates from a single season7 should yield a
model with enhanced predictive ability. However, the
reverse was observed in that the ®nal model, for a
randomly selected subset of concentrates, had greatest
predictive ability. Models for individual seasons could
be improved by elimination of outliers; ie those not
well modelled and away from the regression line. It is
however crucial to avoid elimination of extreme end-
member objects central to delineation of product
spaces.19 All outliers deleted in this study belonged to
the former group. Elimination of outliers may achieve
some improvement but at the expense of robustness.
The ®nal model coped with the characteristics of most
concentrates.
Sensory/compositional models can be discriminated
into the ad-hoc predictive and causative,20±22 this
model is predictive. Prediction of overall ¯avour
character remains technically challenging and merits
further theoretical and experimental studies.
Arti®cial neural networks form an alternative pre-
dictive strategy, exhibiting brain characteristics of
learning, adaptation and self-organisation,23 optimis-
ing establishment of both inter-and intra-relation-
ships.24 However, such prediction is not amenable to
logical analyses.25 Thus although neural networks may
be attractive for prediction of food quality, accept-
ability and preference in fruit drinks, there may be
problems when novel features are encountered.2,26
REFERENCES1 Martens M and Martens H, Partial least squares regression, in
Statistical Procedures in Food Research, ed by Piggott JR, Elsevier
Applied Science, London. pp 293±359 (1986).
2 Williams AA, Rogers CA and Collins AJ, Relating chemical/
physical and sensory data in food acceptance studies. Food
Qual Pref 1:25±31 (1988).
3 Williams AA, Flavour quality±understanding the relationship
between sensory responses and chemical stimuli. What are we
trying to do? The data, approaches and problems. Food Qual
Pref 5:3±16 (1994).
4 Boccorh RK, An analysis of the relationships between composition of
blackcurrant concentrates and intensity of formulated beverage
¯avour. PhD Thesis, University of Strathclyde, Glasgow, UK
(1996).
5 Boccorh RK, Paterson A and Piggott JR, Factors in¯uencing
contents of sugars and organic acids in blackcurrant concen-
trates. Z Lebensm Unters Forch 206:273±278 (1998).
6 Piggott JR, Paterson A and Clyne J, Prediction of ¯avour
intensity of blackcurrant (Ribes nigrum L) drinks from
compositional data on fruit concentrates by partial least
squares regression. Int J Food Sci Technol 28:629±637 (1993).
7 Boccorh RK, Paterson A and Piggott JR, Variations in ¯avour
Table 2. Aroma-enhancing and -diminishing notes with majorinfluences on the global (three-year) model for character inblackcurrant concentrates
Aroma-enhancing notes Aroma-diminishing notes
Spicy 2 (Sp2) Wilted ¯ower (Wf)
Cooked beans 1 (Cb1) Burnt rubber 1 (Br1)
Cooked beans 2 (Cb2) Dried hay 1 (Dh1)
Manure-like 1 (Mal) Dried hay 2 (Dh2)
Old leather-like 2 (Ol2)
Smoky 2 (Sm2)
Abbreviations of aroma notes on biplots are shown in parenth-
eses.
J Sci Food Agric 79:1495±1502 (1999) 1501
Model for ¯avour character in blackcurrant concentrates
components in blackcurrant concentrates. Z Lebensm Unters
Forch 208:362±368.
8 Boccorh RK, Paterson A and Piggott JR, Use of solid-phase
extraction to quantify ¯avour character in a processed fruit
concentrate. Flavour and Fragrance Journal (submitted)
(1999).
9 Boccorh RK, Paterson A and Piggott JR, Comparison of free
choice pro®ling and ratio scaling methods for the prediction of
¯avour character of blackcurrant beverages. J Sens Stud
(submitted) (1999).
10 Moskowitz HR, Product Testing and Sensory Evaluation of Foods:
Marketing and Research and Development Approaches. Food &
Nutrition Press Inc, Westport, Conn (1983).
11 MacFie HJ, Bratchell N, Greenhoff K and Vallis LV, Designs to
balance the effect of order of presentation and ®rst order carry-
over effects in Hall tests. J Sens Study 4:129±148 (1989).
12 Leland JV, Lahiff M and Reineccius GA, Predicting intensities of
milk off-¯avours by multivariate analysis of gas chromato-
graphic data, in. Flavour Science and Technology, ed, by
Martens M, Dalen GA and Russwurm Jr H, John Wiley and
Sons, Chichester, UK. pp 453±467 (1987).
13 Schutz HG, Predicting preference from sensory and analytical
data, in Flavour Science and Technology, ed by Martens M,
Dalen GA and Russwurm Jr H, John Wiley and Sons,
Chichester, UK. pp 399±406 (1987).
14 Noes T and Kowalski B, Predicting sensory pro®les from external
instrumental measurements. Food Qual Pref 4:135±147
(1989).
15 Tatum JH, Shaw PE and Berry RE, Some compounds formed
during non-enzymic browning of orange powder. J Agric Food
Chem 15:773±775 (1967).
16 Tatum JH, Nagy S and Berry RE, Degradation products formed
in canned single-strength orange juice during storage. J Food
Sci 40:707±709 (1995).
17 Parliment TH, Thermal generation of aromas: An overview, in.
Thermal Generation of Aromas, ed by Parliment TH, McGorrin
R and Ho CT, American Chemical Society, ACS Series 409,
Washington, DC. pp 2±11 (1989).
18 Williams PJ, Hydrolytic ¯avour release in fruit and wines through
hydrolysis of non-volatile precursors. in Flavour Science,
American Chemical Society, ACS Symposium Series 2516,
Washington DC. pp 287±308 (1993).
19 Esbensen K, Schonkopf S and Midtgaard T, Multivariate
Analysis in Practice. CAMO A/S, Trondheim, Norway (1994).
20 Persson T, von Sydow E and AÊ kesson C, The aroma of canned
beef: Models for correlation of instrumental and sensory data.
J Food Sci 38:682±689 (1973).
21 von Sydow E and AÊ kesson C, Correlating instrumental and
sensory ¯avour data. in Sensory Properties of Foods, ed by Birch
GG, Brennan JG and Parker KJ, Applied Science Publishers,
London. pp 113±127 (1977).
22 Martens M, Fjeldsenden B, Russwurm H and Martens H,
Relationships between sensory and chemical quality criteria for
carrots studied by multivariate data analysis, in Sensory Quality
in Foods and Beverages: De®nition, Measurement and Control, ed
by Williams AA and Atkins RK, SCI, Ellis Horwood Ltd,
Chichester. pp 233±246 (1983).
23 Carpenter GA, Neural network models for pattern recognition
and associative memory. Neural Networks 2:243±257 (1989).
24 Rataj J and Schindler B Multivariate data correlations by
combining data analysis and neural networks techniques, in
Neurocomputing: Foundations of Research, ed by Anderson JA
and Rosen®eld E, MIT Press, Boston, MA. pp 156±177
(1991).
25 Smith PM and Walter LG, Neural networks in sensory
perception, in Sensory Science Theory and Applications in Foods,
ed by Lawless HT and Klein BD, Marcel Dekker, New York.
pp 207±222 (1991).
26 Shepherd R, Factors in¯uencing food preferences and choice, in
Handbook of the Psychophysiology of Human Eating, ed by
Shepherd R, Wiley, Chichester. pp 3±24 (1989).
27 Nagy S, Rouseff RL and Lee HS, Thermally degraded ¯avours in
citrus juice products, in Thermal Generation of Aromas, ed by
Parliment TH, McGorrin J and Ho CT, American Chemical
Society ACS Series 409, Washington DC. pp 331±345 (1989).
1502 J Sci Food Agric 79:1495±1502 (1999)
RK Boccorh, A Paterson, JR Piggott