Embed Size (px)
Citation preview

DEVELOPMENT OF A MATURITY MODEL FOR EFFECTIVE ADDITIVE MANUFACTURING
INTEGRATION IN THE PRODUCT DEVELOPMENT PROCESS
by
Stéphanie LAMONTAGNE
THESIS PRESENTED TO ÉCOLE DE TECHNOLOGIE SUPÉRIEURE IN PARTIAL FULFILLMENT FOR A MASTER’S DEGREE
WITH THESIS IN MECHANICAL ENGINEERING M.A.Sc.
MONTREAL, NOVEMBER 10, 2016
ÉCOLE DE TECHNOLOGIE SUPÉRIEURE UNIVERSITÉ DU QUÉBEC
© Copyright 2016 reserved by Stéphanie Lamontagne

© Copyright reserved
It is forbidden to reproduce, save or share the content of this document either in whole or in parts. The reader
who wishes to print or save this document on any media must first get the permission of the author.

BOARD OF EXAMINERS
THIS THESIS HAS BEEN EVALUATED
BY THE FOLLOWING BOARD OF EXAMINERS Mrs. Sylvie Doré, Thesis Supervisor Mechanical Engineering Department at École de technologie supérieure Mr. Éric Wagnac, President of the Board of Examiners Mechanical Engineering Department at École de technologie supérieure Mr. James Lapalme, Member of the jury Operations and Logistics Engineering Department at École de technologie supérieure Mr. Stéphane Goulet, Industry Supervisor Research and Technology Coordinator and Innovation Lead at Bombardier Transportation Americas
THIS THESIS WAS PRESENTED AND DEFENDED
IN THE PRESENCE OF A BOARD OF EXAMINERS AND PUBLIC
ON OCTOBER 11, 2016
AT ÉCOLE DE TECHNOLOGIE SUPÉRIEURE


ACKNOWLEDGMENTS
First and foremost, I would like to thank my academic and industry supervisors, Sylvie Doré
and Stéphane Goulet for their incredible generosity, technical guidance and continuous
support. I want to express my gratitude to have had these passionate and talented engineers as
mentors during these two years.
Sylvie, working with you has made me a more thorough and methodic engineer and this will
help me throughout my professional life.
Stéphane, thank you for challenging me, for supporting and promoting this project internally
at Bombardier Transportation (BT). Your contribution was instrumental to the success of this
project.
To my colleagues at BT: Bernard Janssens, Danny Higgins, and Victor Feret, thank you for
the discussions, laughs, chocolate, and team spirit.
I am grateful to have had the opportunity to collaborate with Bombardier Aerospace (BA) at
the beginning of the project, and want to thank Julien Chaussée and Jean-Philippe Carmona
for sharing BA's experience with additive manufacturing.
I must acknowledge the participants to the case study I conducted at BT that made the
validation of the maturity model possible.
I would also like to acknowledge Bombardier Transportation, Fonds de recherche du Québec
Nature et technologies (FRQNT) and Conseil de recherches en sciences naturelles et en génie
du Canada (CRSNG) for their financial support to this research during the past two years.
Last but not least, sincere thanks to my family and friends, for their unconditional support,
positive energy and encouraging words.


DÉVELOPPEMENT D’UN MODÈLE DE MATURITÉ POUR L’INTÉGRATION EFFICACE DE LA FABRICATION ADDITIVE DANS LE PROCESSUS DE DÉVELOPPEMENT DE PRODUITS
Stéphanie LAMONTAGNE
RÉSUMÉ
Les procédés de fabrication additive (FA) englobent plusieurs technologies permettant de fabriquer des pièces ou assemblages par dépôt de matière couche par couche, ou par dépôt sélectif de matière, en utilisant divers matériaux tels que les métaux, plastiques, céramiques, composites, le papier, et même de la matière biologique à partir d'un fichier numérique. Ce principe de fabrication permet notamment l’obtention d'une complexité géométrique et fonctionnelle qu’il serait impossible d'obtenir avec les procédés de fabrication conventionnels par enlèvement ou déformation de la matière. Une panoplie de procédés de FA, de machines, et de matériaux rendent complexes le choix d'un procédé et sa mise en application pour une industrie spécifique. Peu d'information est présentement disponible sur la méthodologie à appliquer pour intégrer la FA dans le processus de développement de produits d'une entreprise. L’objectif de ce projet est de développer un modèle de maturité afin de faciliter l’intégration de la FA au processus de développement de produits d’une entreprise en fonction de ses besoins initiaux. Ce projet est fondé sur la méthode de recherche « Action Design Research », dont le but est de développer des artéfacts permettant de résoudre des problèmes pratiques dans un contexte organisationnel. Cette méthode comprend des cycles itératifs d’évaluation, de réflexion et d’apprentissage portant sur la problématique, l’artéfact développé et l’organisation. Premièrement, le modèle de maturité organisationnel basé sur le concept de compétence, sur les usages de la FA (prototypage, outillage, et pièces de production) et les phases du processus de développement de produits de l’organisation a été développé durant une étude de cas dans une entreprise manufacturière. Le modèle comprend sept niveaux de maturité et propose un niveau innovateur pour considérer l’évolution des technologies de FA. Ensuite, le niveau de maturité de l’organisation (compétences initiales) par rapport à la FA a été déterminé grâce à un sondage en ligne basé sur le modèle de maturité. Enfin, une stratégie d’intégration de la FA comprenant une feuille de route et un outil didactique (guide d’identification) reflétant ce niveau de maturité est proposée afin d’utiliser la FA de manière compétitive. Ces derniers documents ont servi à valider l’utilité du modèle de maturité mais n’ont pas été évalués eux-mêmes. Par conséquent, ils sont considérés étant hors de la portée scientifique du projet.

VIII
En adaptant le modèle de maturité et le sondage aux pratiques et à la terminologie d’autres entreprises, cet artéfact pourrait être utilisé pour d’autres domaines d’affaires. Afin de guider précisément les efforts d’intégration de la FA, les éléments du modèle pourraient être divisés en sous-éléments (e.g. usages divisés en : prototypage, outillage et pièces de production). Afin de valider que le modèle permet réellement à une entreprise d’atteindre un niveau de maturité plus élevé, il est recommandé de réaliser les études de cas prescrites et de réévaluer le niveau de maturité dans trois ans. En plus de la feuille de route stratégique, cette organisation bénéficierait de l’utilisation d’un outil d’aide à la décision pour le choix d’un procédé et d’équipement de FA pour des applications particulières. Mots-clés : fabrication additive, modèle de maturité, maturité organisationnelle

DEVELOPMENT OF A MATURITY MODEL FOR EFFECTIVE ADDITIVE MANUFACTURING INTEGRATION IN
THE PRODUCT DEVELOPMENT PROCESS
Stéphanie LAMONTAGNE
ABSTRACT Additive manufacturing (AM) covers technologies that fabricate parts layer by layer or by selective material deposition with various materials such as metals, polymers, ceramics, composites, paper and even biological matter from a digital file. The layer-wise principle allows geometrical and functional complexity that would be impossible to generate using traditional manufacturing processes. A plethora of AM processes, machines, and materials make the process selection and the application for a specific industry complex. Little information is currently available in the literature regarding the methodological aspects of the integration of additive manufacturing within an organization’s practices. The aim of this thesis is to develop a maturity model that can support effective integration of AM in the product development process of an organization. The research is grounded in the Action Design Research method, which aims at developing artifacts to solve practical problems in an organizational setting while continuously evaluating, reflecting and learning about the problem, the developed artifact and the organization. First, an AM organizational maturity model based on the concept of competency, on AM uses (prototyping, tooling and production parts) and the organization’s product development process phases is developed through a case study for the manufacturing industry. The model comprises seven maturity levels and showcases an innovative level to account for the evolution of AM technologies. Second, the company’s AM maturity level (initial skills) is determined using the maturity model and a web-based survey. Third, an integration strategy comprising a roadmap and an identification guide, that considers the resulting maturity level, is provided to use AM as a competitive advantage. This strategy was used to evaluate the usefulness of the maturity model, but it was not evaluated itself. It is therefore considered out of the scientific scope of the project. With slight modifications on terminology and practices, and subsequent testing with additional companies, the maturity model and survey could be generalizable and applicable to other industries. To provide insights into specific weaknesses and guide improvements in line with an organization’s goals, granularity could be included in future versions of the maturity model. Granularity represents the division of model elements into sub-elements, such as dividing AM uses in prototyping, tooling, and production parts.

X
Finally, we recommend conducting case studies as suggested, and reassess the maturity level in three years to validate if a higher level is reached by using the model. In addition to the roadmap and identification guide, a decision tool on AM process selection would be helpful to support the organization’s future AM users. Keywords: additive manufacturing, maturity model, maturity assessment, organizational maturity

TABLE OF CONTENTS
Page
INTRODUCTION ..................................................................................................................... 1
CHAPTER 1 LITERATURE REVIEW ............................................................................ 5 1.1 Additive Manufacturing .................................................................................................5
1.1.1 Definition .................................................................................................... 5 1.1.2 Additive Manufacturing uses ...................................................................... 8 1.1.3 Additive Manufacturing process flow and methodologies ......................... 9
1.2 Maturity models ...........................................................................................................12 1.2.1 Types of maturity models ......................................................................... 13 1.2.2 Development of maturity models.............................................................. 19
1.3 Gaps in the literature ....................................................................................................24
CHAPTER 2 METHODOLOGY .................................................................................... 27 2.1 Methodological foundations ........................................................................................27 2.2 Project methodology ....................................................................................................33
CHAPTER 3 PROBLEM FORMULATION AND MATURITY MODEL METHODOLOGY ....................................................................................39
3.1 Problem formulation ....................................................................................................39 3.1.1 Research opportunity and initial research question .................................. 39
3.1.1.1 Preliminary maturity level assessment....................................... 40 3.1.2 Problem within class of problems ............................................................. 45 3.1.3 Theoretical bases and prior technology advances ..................................... 50 3.1.4 Organization commitment, roles and responsibilities ............................... 50
3.2 Maturity model methodology ......................................................................................51
CHAPTER 4 AM MATURITY MODEL ........................................................................ 57 4.1 Maturity model design .................................................................................................57 4.2 Maturity model contents ..............................................................................................63 4.3 Maturity model evaluation ...........................................................................................69 4.4 Maturity survey testing and results impact ..................................................................73
CHAPTER 5 AM MATURITY SURVEY ...................................................................... 75 5.1 Survey methodology ....................................................................................................75
5.1.1 Develop the maturity survey ..................................................................... 75 5.1.2 Test the maturity model and deploy survey .............................................. 78 5.1.3 Survey respondents profile ....................................................................... 79 5.1.4 Maturity assessment .................................................................................. 81
5.1.4.1 AM uses ..................................................................................... 81

XII
5.1.4.2 AM materials and process categories ........................................ 83 5.1.4.3 AM good practices ..................................................................... 85 5.1.4.4 AM standards ............................................................................. 89 5.1.4.5 Related technologies .................................................................. 89
5.1.5 Survey educational purpose ...................................................................... 90
CHAPTER 6 FINAL EVALUATION OF THE PROJECT ARTIFACT .......................93 6.1 Scope ........................................................................................................................... 93 6.2 Challenges ................................................................................................................... 95
CHAPTER 7 DISCUSSION ............................................................................................99 7.1 Maturity model ............................................................................................................ 99
7.1.1 Model development .................................................................................. 99 7.1.2 Model contents ........................................................................................ 100 7.1.3 Conclusion on the evaluation of the maturity model .............................. 103
7.2 Maturity survey ......................................................................................................... 104 7.2.1 Assessment tool choice ........................................................................... 104 7.2.2 Survey results discussion ........................................................................ 105
7.3 Implementation strategy ............................................................................................ 110
CHAPTER 8 FORMALIZATION OF LEARNING .....................................................111 8.1 Difficulties encountered and lessons learned ............................................................ 111 8.2 Design principles ...................................................................................................... 113
CONCLUSION AND RECOMMENDATIONS ..................................................................115
APPENDIX I DELIVERABLES ....................................................................................119
APPENDIX II PAPER PROPOSAL ................................................................................133
APPENDIX III MATURITY MODEL DESCRIPTORS..................................................149
APPENDIX IV SURVEY CONTENTS ............................................................................159
APPENDIX V SURVEY RESULTS ...............................................................................169
APPENDIX VI USE CASES AND ACTIVITIES LIST ..................................................187
APPENDIX VII WORK PACKAGES ...............................................................................189
LIST OF REFERENCES .......................................................................................................193

LIST OF TABLES
Page Table 1.1 AM processes, acronyms and machine manufacturers ................................7
Table 1.2 Maturity models comparison .....................................................................16
Table 1.3 Maturity model requirements (extracted from Becker, Knackstedt and Pöppelbuß (2009)) .....................................................................................22
Table 2.1 Artifacts and knowledge types and forms (extracted from Johannesson and Perjons (2014)) ....................................................................................32
Table 2.2 Case study ADR steps and principles ........................................................33
Table 3.1 Negotiation with practitioner during problem formulation .......................44
Table 3.2 BT’s PDP phases (1/2) ...............................................................................48
Table 3.3 BT’s PDP phases (2/2) ...............................................................................49
Table 3.4 ADR method participants’ roles ................................................................50
Table 3.5 Prototyping uses .........................................................................................54
Table 3.6 Tooling uses ...............................................................................................55
Table 3.7 Production uses ..........................................................................................56
Table 3.8 Product development process phases and AM uses ...................................56
Table 4.1 AM decision factors to model indicators ...................................................58
Table 4.2 Maturity levels ...........................................................................................59
Table 4.3 Negotiation with AM expert and practitioner during BIE (model) ...........62
Table 4.4 Maturity model contents (1/3) ...................................................................65
Table 4.5 Maturity model contents (2/3) ...................................................................66
Table 4.6 Maturity model contents (3/3) ...................................................................67
Table 4.7 Criteria regarding maturity model contents ...............................................70

XIV
Table 4.8 Criteria regarding the maturity model use .................................................70
Table 4.9 Criteria regarding the maturity model function .........................................71
Table 4.10 Methodology to evaluate maturity model ..................................................72
Table 4.11 Methodology to evaluate maturity survey .................................................72
Table 4.12 Survey impact on maturity model ..............................................................73
Table 5.1 Negotiation with AM expert and practitioner during BIE (survey) ...........77
Table 6.1 Negotiations with practitioner during integration strategy design .............96
Table 7.1 Evaluation of the maturity model using criteria ......................................103
Table 8.1 Design principles for organizations .........................................................114
Table 8.2 Design principles for technologies ...........................................................114

LIST OF FIGURES
Page
Figure 1.1 AM process flow (adapted from Gibson, Stucker and Rosen) ..................10
Figure 1.2 Maturity model constitutive elements ........................................................13
Figure 2.1 ADR method stages and principles (adapted from Sein et al. (2011) ........29
Figure 2.2 Organization-dominant BIE process (adapted from Sein et al. (2011)) ....35
Figure 2.3 Case study results and relations between artifact and deliverables ...........36
Figure 3.1 AM uses as part types ................................................................................42
Figure 5.1 AM process selection survey question .......................................................76
Figure 5.2 Experience and position responses ............................................................80
Figure 5.3 AM uses maturity results ...........................................................................81
Figure 5.4 AM uses: prototypes maturity results ........................................................82
Figure 5.5 AM uses: tooling and parts maturity results ..............................................82
Figure 5.6 AM process selection maturity results .......................................................83
Figure 5.7 AM materials maturity results ...................................................................83
Figure 5.8 AM materials maturity results (1/2) ...........................................................84
Figure 5.9 AM materials maturity results (2/2) ...........................................................84
Figure 5.10 BT’s practices maturity results ..................................................................85
Figure 5.11 Organizational culture towards emerging technologies integration maturity results ...........................................................................................86
Figure 5.12 Personal attitude towards emerging technologies maturity results ............86
Figure 5.13 AM integration at organization maturity results ........................................87
Figure 5.14 AM good practices maturity results ...........................................................87
Figure 5.15 AM opportunities and limits maturity results ............................................88

XVI
Figure 5.16 AM service providers experience maturity results ....................................88
Figure 5.17 AM standards maturity results ...................................................................89
Figure 5.18 Related technologies maturity results ........................................................89
Figure 5.19 Topology optimization, file generation and 3D scanning maturity results .........................................................................................................90
Figure 5.20 Educational section results .........................................................................91
Figure 5.21 Results on additional support on AM ........................................................92
Figure 7.1 Maturity level distribution .......................................................................105
Figure 7.2 Indicators maturity levels pattern .............................................................106
Figure 7.3 Levels pattern (1/2) ..................................................................................107
Figure 7.4 Levels pattern (2/2) ..................................................................................108
Figure 7.5 Organizational culture vs personal attitude ..............................................109

LIST OF ABBREVIATIONS AND ACRONYMS AM additive manufacturing AMT advanced manufacturing technologies 3DP® Three-Dimensional Printing 3SP® Scan, Spin and Selectively Photocure ASTM American Society for Testing and Materials BA Bombardier Aerospace BIM Building Information Modeling BT Bombardier Transportation CAD Computer-Aided Design CJP® ColorJet Printing CLAD® Construction Laser Additive Directe CLIP® Continuous Liquid Interface Production CMM® Capability Maturity Model CMMI® Capability Maturity Model Integration CNC Computer Numeric Control DfAM Design for additive manufacturing DMLS® Direct Metal Laser Sintering DSR Design Science Research EBM Electron Beam Melting FDM® Fused Deposition Modeling FEA Finite Element Analysis

XVIII
FFF Fused Filament Fabrication FST Fire Smoke Toxicity ISO International Organization for Standardization LENS® Laser Engineered Net Shaping MJP MultiJet Printing MRL Manufacturing Readiness Levels ORL Organizational Readiness Levels PDP Product Development Process SLA® Stereolithography SLM® Selective Laser Melting SLS® Selective Laser Sintering STL STereoLithography file format TRL Technology Readiness Levels UAM® Ultrasonic Additive Manufacturing WP Work Packages

INTRODUCTION
Additive manufacturing (AM) is a group of technologies that either fuses or solidifies
material to build a part layer by layer. The layer-wise process allows building geometries and
assembly-free mechanisms that cannot be fabricated otherwise (i.e. using traditional
subtractive or forming processes). Various materials such as metals, polymers, ceramics,
composites, paper and even biological matter are used to produce physical parts from a
digital file for numerous applications such as prototyping, production parts or tooling. AM
technologies exist for more than 25 years, but their application remains limited to prototyping
for many industries. For a more extensive use and for production parts, the medical, dental,
automotive and aerospace industries are among leaders with use cases that present
customization and weight reduction benefits (Wohlers and Caffrey, 2015).
The railway industry is more conservative, and thus is just starting to use AM. Bombardier
Transportation (BT) designs and manufactures rail vehicles, propulsion and controls, bogies
and rail signalling systems. The organization is present in 28 countries under four main
divisions: Americas (AME), Asia-Pacific (APA), Central and Eastern Europe (CEE) and
Western Europe-Middle East-Africa (WMA). Even though the St-Bruno Prototype Center
(AME) and Milton Industrial Design (APA) have acquired experience with one polymer-
based AM process for prototyping during the last few years, the Innovation and R&T
(Research and Technology) team wants the company to intensify its use of additive
manufacturing technologies. Through its role in the company, the Innovation and R&T team
has identified additive manufacturing technologies as a game changer and envisions it could
provide the organization a competitive advantage.
However, industries face numerous obstacles with regards to AM adoption and integration in
the product development process (PDP). They are chiefly the major equipment investments,
lack of knowledge and talent, and lack of confidence towards part quality (PwC, 2016).

2
At BT, for the Head of R&T, it was clear that the lack of knowledge and lack of conclusive
business cases for the railway industry are major factors for the limited use of AM.
In the next few years, Bombardier Transportation’s goal will thus be to manufacture
prototypes during the design phases and production parts and assemblies using additive
manufacturing processes to benefit from weight reduction potential and development time
advantages. These goals were identified after a literature survey, conferences attendance,
student projects and meetings with AM service bureau representatives. However, the first
required step is to determine the initial level of knowledge and capabilities at BT or, in other
words, its current maturity in integrating AM in its product development process.
Currently, there is little information regarding the methodological aspects of the integration
of additive manufacturing in the product lifecycle. Companies have to work experimentally
with these technologies and identify steps to integrate them to their product development
process.
This project research question is formulated to address this need:
How can a maturity model be designed in order to be useful for Bombardier Transportation
to integrate additive manufacturing to its product development process?
The project goal is to develop a maturity model that can support effective integration of
additive manufacturing (AM) in Bombardier Transportation’s product development process.
A set of evaluation criteria is first used to evaluate the maturity model. An integration
strategy of AM to BT’s product development process is designed and used in combination
with evaluation criteria to perform a second evaluation of the maturity model. This strategy
was not evaluated itself and is therefore considered out of the scientific scope of the project.
The model development and integration strategy elaboration are achieved through a case
study at BT.
It is crucial to determine the current AM maturity level in order to minimize risks and to
maximize opportunities. Risks include difficulty in the identification of industry-specific
value-added cases while investing in costly AM machines for in-house production.
3
Considering BT’s worldwide presence, the AM adoption rate might be higher in some sites.
There is therefore a need to prevent going through the same learning curve twice by
identifying use cases that consider the current level of competencies and then propose an
adapted roadmap (use cases planning) to suit their current profile and address their current
issues.
The thesis first provides a literature review on AM and maturity models, and a presentation
of the methodology and the problem formulation. The next three chapters are dedicated to the
maturity model, to the survey, and to the final evaluation of the project artifact, that is the
maturity model and survey. A discussion on the contents of the model and survey results
follow. The last chapter covers the formalization of learning, or in other words, the
challenges the researcher has faced and how the project results can be generalized for
different technologies than additive manufacturing and for other organizations. A conclusion
and recommendations complete this thesis.


CHAPTER 1
LITERATURE REVIEW
This chapter is divided in a literature review on additive manufacturing, followed by a review
of maturity models. A summary of the gaps in the literature conclude this chapter.
1.1 Additive Manufacturing
The maturity model we propose is based on competency with a strong focus on the technical
aspects of AM (e.g. uses, tools, materials, technologies). This section therefore presents
definitions of technical elements that will be later found in the project results, namely, the
maturity model and survey, and the integration strategy comprising the identification guide,
the roadmap and the work packages.
1.1.1 Definition
Parts are either made by deforming material (e.g. forging), removing material (e.g.
machining) or adding material. The latter is the principle guiding additive manufacturing
technologies that either fuses or cures material to build a part layer by layer or by selective
material deposition in the case of multiple axis processes. A digital file resulting from
Computer-Aided Design software, often an STL file, is the input to AM equipment. Software
specific to the AM equipment reads the digital file, performs various operations (i.e. position
multiple parts in build space (nesting), generate supports if needed), then virtually slices it in
multiple layers to produce code that then drives the path of the print head or energy source
for each layer. The American Society for Testing and Materials (ASTM) has established in
the standard on Terminology for Additive Manufacturing Technologies F2792-12a seven
categories of AM processes: binder jetting, directed energy deposition, material extrusion,
material jetting, powder bed fusion, sheet lamination, and vat photopolymerization. The

6
International Organization for Standardisation (ISO, 2015) also adopted this classification of
AM processes. Each process uses specific materials and materials forms (powder, filament,
liquid, sheet). Materials include polymers, metals, ceramics, composites, paper, and even
biological matter.
A thorough knowledge of the AM domain is required for effective AM process selection due
to the large variety of AM processes, equipment and materials.
Table 1.1 presents the seven AM processes for a better grasp of the challenges and the
expertise extent it entails for an organization to adopt these technologies. The table provides
a non-exhaustive list of technologies acronyms and machine manufacturers. The information
sources are the Wohlers Report 2016, AM equipment manufacturers’ websites and standards
((ASTM, 2012b), (ISO, 2015)). The meaning of each acronym is provided in a list at the
beginning of this document.

7
Table 1.1 AM processes, acronyms and machine manufacturers
Processes definitions Processes acronyms examples
Machine manufacturers
examples Binder jetting: bonding liquid is selectively deposited using inkjet printheads on a powder bed, either plaster-based, acrylate, sand or metal.
3DP®, CJP® 3D Systems (ZCorp)
ExOne voxeljet
Directed energy deposition: a focused source of thermal energy is used to melt metal powder or wire while it is deposited.
LENS® Optomec
CLAD® BeAm
Sciaky Material extrusion: a thermoplastic filament is heated and deposited through a nozzle.
FDM® Stratasys 3D Systems
FFF Material jetting: drops of photopolymer or wax are deposited through inkjet printheads.
MJP® 3D Systems
Stratasys
Powder bed fusion: a thermal energy source selectively fuses or melts polymer or metal powder particles in an inert gas atmosphere.
DMLS® EOS
EBM® Arcam
SLM® SLM Solutions
SLS 3D Systems
Renishaw
Sheet lamination: Sheets of paper or metal are joined using projected adhesives or ultrasonic welding. A tool then either cuts unnecessary material or machines it away.
UAM® Fabrisonic
MCor Technologies
Vat photopolymerization: UV light scans photopolymer liquid in a vat, which cures layer by layer.
SLA® 3D Systems SL Formlabs
CLIP Carbon3D
3SP® EnvisionTEC

8
The parts resulting from these processes have their particular uses. For example, vat
photopolymerization parts are often used as prototypes, while metal powder bed fusion parts
are generally used for final parts. The next section presents a classification of part
applications.
1.1.2 Additive Manufacturing uses
This project is aimed towards the use of AM for industrial applications. These uses can be
divided in the three following categories and sub-categories:
1) Prototyping: prototypes are physical models used to carry information during the product
development process for testing the product design and set up the production process
(Pfeifer et al., 1994). Specific types of prototypes will assist particular needs:
a. design models,
b. geometrical prototypes,
c. functional prototypes,
d. technical prototypes,
e. pre-production parts.
2) Production parts: also called direct part manufacturing, it refers to the use of AM to
produce a part that is then sold to a customer. This category of parts can be divided in
three subcategories:
a. original part (serie of one or several parts),
b. spare part,
c. repair.
3) Tooling: refers to the use of AM to produce a mold, a pattern, or a die that is then used to
produce a part, also called indirect part manufacturing. Tooling can also refer to parts
directly produced with AM that can be used as assembly aids, testing devices, and jigs for
machining or measurement purposes. We consider both types of tooling in this project.
Part classification is adapted from Pfeifer et al. (1994) and Gebhardt (2011) for the case
study domain of application.

9
1.1.3 Additive Manufacturing process flow and methodologies
This section aim is to provide definitions of AM concepts. We first present the definition,
and then explain how these concepts are expressed within AM applications.
• CAD (Computer-Aided Design) software: software such as CATIA or SolidWorks used to
design and represent parts in 3D;
• Support structures: when building parts layer by layer with many of the AM processes,
additional material needs to be added to maintain overhanging/cantilevered features in
place during part building or to anchor the part to a build platform;
• Post-processing: varies depending on AM process and includes support removal, heat
treatment, curing, polishing, plating, painting, etc.;
• Design rules or design for additive manufacturing (DfAM): DfAM rules are essentially
geometric guidelines allowing the manufacturability of a design by a specific AM process.
Examples include: minimum wall size thickness, support structures, and powder removal
design. It implies a change of paradigm to design parts by adding material compared to
removing or forming material;
• 3D scanning: defining the geometry of a part by collecting data as point clouds that can be
transformed in a 3D digital file of a physical part, often used in synergy with AM to copy
a part;
• Topology optimization: method to optimize the distribution of material within a given
design space under defined loading and boundary conditions. It is often used with AM to
reduce weight of parts. Popular software include OptiStruct by Altair, Inspire by
solidThinking and Within by Autodesk. AM is often seen as the only manufacturing
process that can fabricate the organic and complex geometrical features resulting from
topology optimization (Zegard and Paulino, 2016);
• Part slicing: the AM machine software separates the digital file into numerous slices
according to the selected layer thickness, which represent the consecutive layers to be
deposited, fused or cured.

10
The defined concepts are presented in bold in the next paragraphs.
As with traditional manufacturing processes, industries can buy equipment to fabricate parts
in-house or they can outsource fabrication to service bureaus. In-house fabrication is
sometimes referred to as a “Make scenario” and outsourcing as a “Buy scenario” within the
industry. Since AM equipment can be expensive (Wohlers and Caffrey, 2015) and many
industrials don’t yet have the necessary skills to operate AM equipment or don’t yet know
how they could effectively benefit from AM, many will work with service bureaus for their
AM needs. These bureaus can also assist in the design of parts for AM, the preparation for
fabrication (e.g. support structures) and post-processing. Like traditional processes, design
rules or Design for Additive Manufacturing (DfAM) need to be applied to obtain precise (i.e.
repeatable) and accurate (i.e. within tolerances) parts. Some service bureaus can also provide
3D scanning and topology optimization services.
The process flow (adapted from Gibson, Stucker and Rosen (2015)) to obtain a part using
AM is summarized in the Figure 1.1. It is sometimes referred to as the “value chain” of AM
(Deloitte University Press, 2015).
Figure 1.1 AM process flow (adapted from Gibson, Stucker and Rosen)
The part is first designed using CAD software to produce a digital file of the part to be
fabricated. The digital file could also be obtained by 3D scanning the part. The CAD file is
then converted to a file format acceptable by AM machines such as STL. The AM file is
transferred to the AM machine and operations such as supports generation and part slicing
are conducted if required by the selected AM process. The AM machine set-up includes
determining process parameters such as layer thickness, energy source speed and power. The
AM part is then fabricated and this step might take from several hours to days. Then, the part

11
is taken out of the machine and depending on the process, unfused powder or liquid polymer
is cleaned off the part. In some AM processes, the part needs to be removed from its build
plate. Finally, post-processing is applied.
The process flow for AM is distinct from that of traditional manufacturing processes. The
methodologies to design parts are also different. These methods allow to fully benefit from
AM opportunities such as consolidation of parts, geometrical complexity, or time and cost
reduction. The following examples illustrate approaches applicable or developed specifically
for AM.
Functional analysis: One opportunity from AM is part consolidation, which means to
combine multiple parts in a single one, which usually cannot be done with traditional
manufacturing processes considering the geometrical complexity involved. In order to
benefit from part consolidation, a method based on functional analysis is proposed
(Rodrigue, 2010). In summary, the function of each part is determined and its role in the
assembly defined, and a decision on the consolidation of parts can be taken. Rodrigue’ study
also refers to the possibility of building mechanisms with moving parts with no assembly
required, or assembly-free mechanisms, which is a unique feature of AM.
Hybrid manufacturing: A major AM benefit is the production of organic and complex
shapes. On the other hand, AM is often criticized for the duration of part fabrication that can
reach days (Wohlers and Caffrey, 2015). To benefit from this complexity and to minimize
the build time impact, a methodology that combines subtractive and additive manufacturing
is proposed in Kerbrat’s work (2009).
Part candidates identification: With regards to the economic viability of AM, a study by
Lindemann et al. (2015) provides a methodology for part identification, including decision-
making criteria. It is crucial to choose the right candidates because it can be more
advantageous to manufacture some parts using traditional manufacturing processes namely
for geometrical, economical, and material availability reasons. We refer to the study by
Lindemann et al. in Appendix I.

12
Process selection: Finally, numerous studies have been conducted on the development of
AM decision support tools to assist AM users in the choice of AM process, machine, material
and finishing methods, namely Ghazy (2012), Munguía et al. (2010) and Smith and Rennie
(2010). We would like to point out the work of Buvat (2016) who reviewed more than 10
decision tools and developed a decision system specifically for Bombardier Aerospace, the
sister division of Bombardier Transportation. The selection of the appropriate AM process
category, machine, and material is crucial because it will lead to better results (precision,
accuracy) and to parts properties that meet desired requirements such as surface finish,
resolution, or mechanical properties.
These methodologies supported the definition of the elements of the maturity model we
propose in CHAPTER 4.
1.2 Maturity models
A maturity model can be defined as a conceptual framework composed of elements that
describe the advancement of a specific domain of interest over time (Klimko, 2001). It can
also detail a process by which an organization can progress by the development of its
capabilities and the adoption of desirable practices (PMI, 2003). Becker, Knackstedt and
Pöppelbuß (2009) define maturity models as “artifacts which serve to solve the problems of
determining a company’s status quo of its capabilities and deriving measures for
improvement therefrom.”
It was decided to use a maturity model to assess the initial level of AM expertise of an
organization for its easiness to be translated into an assessment tool, to provide a roadmap for
improvement and to be used as a learning tool.
As a maturity model, an artifact often takes the form of an analytical evaluation rubric which
contains the following elements illustrated on Figure 1.2:
• A scale that describes maturity levels or stages;
• Indicators that represent areas of application of a domain;

13
• Descriptors that define the performance required to reach the given level of a given
indicator.
Figure 1.2 Maturity model constitutive elements
We use the Computer Integrated Construction Research Program BIM maturity model to
illustrate these three concepts:
• The scale comprises maturity levels such as nonexistent, initial, managed, defined,
quantitatively managed, and optimizing;
• The indicators are referred to as planning elements such as “education” and
“organizational mission and goals”;
• The descriptor for the “education” indicator, for maturity level 2-Managed, states:
“formal presentations on what is BIM and the benefits it has for the organization” (The
Computer Integrated Construction Research Program, 2012).
1.2.1 Types of maturity models
Maturity models can be used to:
• Describe an organization’s current practices;
• Prescribe a plan to guide progress toward an objective;
• Compare an organization’s current practices to standards and other companies’ best
practices (Pigosso, Rozenfeld and McAloone, 2013).

14
Various types of maturity are covered in the literature. In our study, we refer to three types of
maturity, namely technology, manufacturing, and organizational maturity.
The Technology Readiness Levels were first developed for the space exploration domain, in
order to quantify the maturity of an element with regards to a flight proven scale. The
proposed scale goes from TRL 1 where technology is at a research stage and scientific
principles are observed, to TRL 9 for which the technology is successfully used in a mission
(ISO, 2013).
The Manufacturing Readiness Levels (MRLs) were designed to be linked to TRLs. MRLs
address the manufacturing risks in the acquisition process of the U.S. Department of Defense
(DoD) through the support of technology development projects to transition new
technologies to weapons applications. The DoD maturity model is based on manufacturing
risk areas such as technology and industrial base capabilities, design, cost and funding,
materials, or quality management (OSD Manufacturing Technology Program, 2012).
Organizational maturity can be defined as “the level of organization’s readiness and
experience in relation to people, processes, technologies and consistent measurement
practices” (Bersin by Deloitte, 2015).
An example from a medical surgery tools supplier can be used to illustrate the three types of
maturity. The technology maturity refers to the maturity of the polymer powder bed fusion
AM process for medical applications used in a controlled environment. The manufacturing
maturity refers to surgery guides made into full-rate production, and thus succeeding at the
industrialization of the powder bed fusion process. Finally, the organizational maturity refers
to a methodology that an organization could use to integrate the powder bed fusion process to
its product development cycle and fully benefit from it.

15
Within a specific domain of application, as demonstrated in this example for the medical
domain, we can look at different maturity aspects, that is technology, manufacturing, or
organizational. In the case of this academic project, the focus is on the manufacturing domain
of application, on the organizational maturity aspect, and the maturity scale is competency
based.
Numerous maturity models address organizational maturity for domains such as:
• ecodesign practices adoption (Pigosso, Rozenfeld and McAloone, 2013),
• energy management (Ngai et al., 2013), (Antunes, Carreira and Mira da Silva, 2014),
• strategic planning in construction engineering (The Computer Integrated Construction
Research Program, 2012), (Succar, 2010),
• information technology (Becker, Knackstedt and Pöppelbuß, 2009).
We present details of five maturity models for diverse application domains. The models were
selected because they clearly presented and defined the following elements:
• levels of maturity,
• model output,
• model elements.
Table 1.2 presents a comparison of these five organizational maturity models.

16
Table 1.2 Maturity models comparison
Maturity models Maturity levels Model outputs Model elements CMMI (Capability Maturity Model Integration) (CMMI Product Team, 2010)
4 capability levels (incomplete, performed, managed, defined) and 5 maturity levels (initial, managed, defined, quantitatively managed, optimizing)
evolutionary path for organizational process improvement
22 process areas such as: product integration, project monitoring and control, project planning, requirements development, requirements management, technical solution
Ecodesign maturity model (Pigosso, Rozenfeld and McAloone, 2013)
5 evolution levels and 5 capability levels (incomplete, ad hoc, formalized, controlled, improved), adapted from CMMI
diagnosis of maturity profile and proposal of ecodesign practices and improvement projects for ecodesign implementation, benchmarking of ecodesign practices, assessment of strengths and weaknesses and a common language
ecodesign practices, ecodesign maturity levels by product development process phases, application method
EUMMM (Energy and Utility Management Maturity Model) (Ngai et al., 2013)
5 maturity levels (initial, managed, defined, quantitatively managed, optimized) and a process-based maturation framework including 4 phases (practice establishment, practice standardization, performance management and continuous improvement)
assessment framework for analyzing maturity level of energy and utility management in organizations, progressive framework to guide organizational advancement in energy and utility management, guidelines for maturity assessment and improvement
energy and utility resource management process areas
Energy Management Maturity Model (Antunes, Carreira and Mira da Silva, 2014)
5 maturity levels (initial, planning, implementation, monitoring, improvement)
roadmap for achieving higher energy efficiency, support organizations in their improvement to reach compliance with energy management standards
energy management activities
BIM (Building Information Modeling) (The Computer Integrated Construction Research Program, 2012)
6 maturity levels (nonexistent, initial, managed, defined, quantitatively managed, optimizing)
maturity assessment of planning elements, desired level of BIM implementation, and advancement strategy
planning elements: strategy, BIM uses, process, information, infrastructure and personnel

17
1) Capability Maturity Model Integration (CMMI Product Team, 2010) focuses on
organizational process improvement and is referred to by numerous maturity models.
This model proposes two improvement paths with two types of evaluation levels. We
distinguish levels as follows:
a) Capability levels: “achievement of process improvement within an individual process
area.” A CMMI process area is “a cluster of related practices in an area that, when
implemented collectively, satisfies a set of goals considered important for making
improvement in that area”;
b) Maturity levels: “degree of process improvement across a predefined set of process
areas in which all goals in the set are attained.”
The definitions provided are from CMMI for Development, a version of CMMI focusing on
development of products and services.
2) Pigosso, Rozenfeld and McAloone (2013) developed an ecodesign maturity model whose
goal is to support deployment of strategic roadmaps by assessing an organization’s
profile and proposing an implementation framework to guide best practices application.
Their model maturity levels are a combination of evolution levels and capability levels.
Evolution levels indicate ecodesign implementation steps and capability levels
“qualitatively measure how well a company applies an ecodesign management practice.”
Capability levels (incomplete, ad hoc, formalized, controlled, and improved) were
adapted from CMMI.
3) The EUMMM (Ngai et al., 2013) also builds on CMMI to propose a five maturity levels
assessment method and four phases of maturation processes (establishment,
standardization, management, and improvement) to improve organizational maturity for
sustainable manufacturing.
4) The Energy Management Maturity Model’s (Antunes, Carreira and Mira da Silva, 2014)
goal is to support organizations in their improvement to reach compliance with energy
management standards and to enable benchmarking of current energy practices. Again,

18
five maturity levels are described: initial, planning, implementation, monitoring and
improvement.
5) Finally, from the construction engineering field, numerous Building Information
Modeling (BIM) maturity models exist. We reviewed the Computer Integrated
Construction Research Program model (2012) that is also based on CMMI. The result of
the Building Information Modeling process is an electronic model of a building or facility
utilized for visualization, engineering analysis, budgeting, and other uses. Maturity levels
refer to the organization’s performance for each BIM use. The BIM maturity model is
partially based on BIM uses such as “generating, processing, communicating, executing,
and managing information about the facility.”
We can observe through the maturity models reviewed that different labels are used to
designate the evaluation scale: maturity, readiness, capability, and competency. These
concepts are defined:
• Maturity: “metric to evaluate capabilities of an organization regarding a certain
discipline” (Antunes, Carreira and Mira da Silva, 2014);
• Readiness: from ISO TRL standard (2013), we understand that readiness is used to
designate a mature technology that is expressed as “technology defined by a set of
reproducible processes for the design, manufacture, test and operation of an element for
meeting a set of performance requirements in the actual operational environment”;
• Capability: CMMI defines a capable process as “A process that can satisfy its specified
product quality, service quality, and process performance objectives.” We could then
see capability as the ability to reach a goal that is established following a domain of
application best practices;
• Competency: “a complex know-how-to-act requiring the mobilization and the efficient
combination of a variety of internal and external resources within a family of

19
situations1” (Tardif, 2006). Internal resources refer to knowledge, skills, attitudes,
schemes, while service bureaus, machine manufacturers, and experts are examples of
external resources. The family of situations describes the context, and to a certain
measure, the scope, in which the competency will be deployed. For this project, the
family of situations refers to the use of additive manufacturing technologies within the
product development process at Bombardier Transportation.
With regards to the concepts of capability and competency, it seems that what distinguishes
them is the evaluation focus. Capability is used for process qualification, whereas
competency involves the participation of a person and its use of a tool, process or method. In
the case of this project, we will refer to the maturity label for our evaluation scale while
including competency as the underlying foundation of our model.
1.2.2 Development of maturity models
It is now necessary to present how maturity models are developed and to uncover the
characteristics of a relevant maturity model.
Very few studies describe the methodology to develop a maturity model. We found two
papers presenting methodologies: De Bruin et al. (2005) and Becker, Knackstedt and
Pöppelbuß (2009). In their study, De Bruin et al. present six steps to develop a maturity
model:
1) Scope: determine whether the focus of the model is specific to a domain or general,
identify the stakeholders (from academia, industry, government), and perform an
exhaustive literature review to get a thorough understanding of the application domain
and to have a basis for later comparison with existing maturity models;
1 The translation is ours. The original French definition is given here : « Un savoir-agir complexe prenant appui sur la mobilisation et la combinaison efficaces d’une variété de ressources internes et externes à l’intérieur d’une famille de situation ».

20
2) Design: determine why a model is needed, how it will be used (e.g. self-assessment,
audit), identify the participants and geographical position or if they are part of a specific
group involved in the use of the model. De Bruin et al. recommend using a top-down or
bottom-up method to define the maturity levels. In the top-down method, which is more
appropriate for new domains of application, the attention is first on what constitutes
maturity and then how it can be measured. For well-known domains, the bottom-up
method focus is first on the measurements methods and then on the definition of the
stages;
3) Populate: identify the contents of the assessment and the method to conduct the
assessment. In other words, it means to identify what needs to be measured and how.
When dividing the maturity model in hierarchical layers, or as previously defined, the
indicators (e.g. domain, domain component, domain sub-component), the component and
sub-component should be “mutually exclusive and collectively exhaustive”. A literature
review and interviews are suggested to identify and validate the domain components. For
well-known domains, these components can be identified by referring to key success
factors and obstacles to adoption of a new technology, for example. To adequately
describe the sub-component layer of the model, it is recommended to use, among
techniques, the Delphi technique (experts answer multiple rounds of questionnaires and a
facilitator summarizes results at each round) and focus groups;
4) Test: validity, reliability and generalizability of:
a) model construct: complete and accurate in view of the model scope (face validity),
complete representation of the model (content validity),
b) assessment tools: tools measure what they were planned to measure (validity), tools
provide repeatable and accurate results (reliability).
5) Deploy: first application should be at the organization where the model was developed
and tested and then at external organizations to validate the generalizability of the model.
De Bruin et al. recommend to use an electronic survey that offers answer choices as
scales such as the Likert scale to proceed to maturity assessment;

21
6) Maintain: a generalizable model should support various applications and will thus evolve
with time. It’s especially crucial to regularly update a maturity model when its goal is to
provide instructions on how to progress in maturity.
Becker, Knackstedt and Pöppelbuß suggest a methodology to assist in the design of maturity
models that is based on Design Science guidelines for Information Systems Research
(Hevner, 2004). It is now necessary to point out that the methodological foundation of our
research is Action Design Research (ADR) and is presented in CHAPTER 2. ADR and DS
share the goal to help people find solutions to their problems by creating artifacts but ADR
considers that the organizational setting is instrumental in the development and improvement
of the artifact. Unlike in DS, in ADR the development, intervention within the organization,
and evaluation of the artifact is an iterative process. Nevertheless, since these two research
methods share a common objective in the development of artifacts to solve problems, we use
Design Science literature as the guidelines to create an artifact for this project.
The Design Science guidelines are associated to Becker, Knackstedt and Pöppelbuß’s
maturity model requirements in Table 1.3. Becker, Knackstedt and Pöppelbuß listed the
requirements of a relevant maturity model and linked them to the Design Science guidelines
proposed by Hevner so as to provide an evaluation method of maturity models. The letter R
represents the requirements in Table 1.3 and the number represents Becker, Knackstedt and
Pöppelbuß’s maturity model development steps.

22
Table 1.3 Maturity model requirements (extracted from Becker, Knackstedt and Pöppelbuß (2009))
Design Science guidelines Maturity model requirements 1- Design as an Artifact R1: comparison with existing maturity models 2- Problem Relevance R5: identification of problem relevance
R6: problem definition 3- Design Evaluation R3: evaluation 4- Research Contributions R1: comparison with existing maturity models 5- Research Rigor R4: multi-methodological procedures 6- Design as a Search Process R2: iterative procedure
R3: evaluation 7- Communication of Research R7: targeted presentation of the results
R8: scientific documentation
Becker, Knackstedt and Pöppelbuß’s methodology consists in the following phases and sub-
phases of development of a maturity model:
1) Define the problem;
2) Compare existing maturity models;
3) Determine the design methodology;
4) Develop the maturity model with an iterative method:
a) Determine model hierarchical structure;
b) Select information sources to support model contents;
c) Develop model section;
d) Evaluate model section.
5) Determine model communication formats and evaluation method;
6) Deploy the maturity model;
7) Assess on the performance of maturity model;
8) Withdraw maturity model if inadequate or obsolete.
Out of the few papers we found on methodologies to design a maturity model, we
summarized the elements of importance to the contents of models, namely the foundations,
the levels definition, and assessment tools. We believe these represent the minimal content

23
requirements of maturity models. We present a summary of the characteristics that make a
maturity model relevant and really help companies develop their competencies for their
application domain.
De Bruin et al. state that the model should provide distinct stages definition (descriptors) and
the evolution through stages (scale) should be coherent. Each stage should be designated with
one or two words that describe the stage well. The model should provide descriptors that
summarize major requirements and measures. The stage-gate method is preferred to a series
of one-dimensional linear stages since it provides a more detailed profile of an organization
on multiple areas of interest (e.g. domain, domain component, domain sub-component
(competency area)). These subdivisions, also referred to as “granularity” by Succar or
“indicators” in our project, lead to accurate determination of strengths and weaknesses and
facilitate identification of improvement activities. An electronic survey is recommended to
assess the maturity. Well defined descriptors can support the formulation of survey questions.
The survey questions should be validated by pilot groups and comments collected on the
structure of the survey, ease and time to complete survey and how well the questions cover
the domain of interest.
Succar (2010) agrees that a maturity model should not comprise too many levels (scale
elements), that they should be distinct and do no overlap. It should be possible to apply the
model internally as a self-assessment but also by an external agent (i.e. audit) using a
maturity scoring system.
The model should be constituted of different granularity levels so that it enables “low-detail,
informal and self-administered assessments to high-detail, formal and specialist-led
appraisals”. As previously introduced, the concept of granularity from Succar’s BIM model
refers to dividing a competency area in what we could call “sub-competencies”, or in our
case “sub-indicators”. For example, the resources level is divided in physical, knowledge and
human resources levels. The BIM maturity matrix aims to be specific, flexible, current,
relevant to industry and academia, but also informative.

24
In a critical review of CMM, Bach (1994) states that CMM doesn’t have a strong basis in the
literature; it is mostly based on experience. He also states that the CMM does not account for
innovation in its model. We agree that an adequate model should be strongly rooted in theory
and include an innovative level.
1.3 Gaps in the literature
As previously outlined, the first goal of this study is to develop a maturity model to support
effective integration of AM in the product development process of an organization. The
second objective is to propose an AM integration strategy based on this maturity model. The
model testing and integration strategy elaboration are achieved through an industrial case
study at BT.
Few articles report on integration methodologies of advanced manufacturing technologies
(AMT) in the product development process of a company. Most references either report on
the adoption of AMT in general and on the organizational changes it requires (Costa and
Lima, 2008), (Sohal et al., 2006). We found some references that report on specific AMT
such as Computer Numeric Control (CNC) machining as the effect of its adoption on an
organization’s performance (Koc and Bozdag, 2007) and on success factors for its
implementation (Burcher, Lee and Sohal, 1999), but we found none on AM technologies.
A paper by Karlsson, Taylor and Taylor (2010) reports on the profile of organizations that
facilitate the integration of new technologies in their products. According to the level of
organizations’ technological maturity and the technological advancement of their products,
the authors suggest different integration mechanisms based either on structure, process,
resources, or culture. However, it cannot be directly applied for AM integration since it
focuses on the integration of technology into products, whereas the interest here is the
integration of new technologies in the product development process.

25
Literature on the integration of AM within organizations generally focuses on the maturity of
the technology or on the industrialization process and not on the maturity of the organization
towards the adoption of this technology. For example, academic papers will often report on
the laser parameters of a specific machine and the microstructure obtained (Aboulkhair et al.,
2014), (Spierings and Levy, 2009). Other technical documents will provide information on
the surface finish (Calignano et al., 2012) or the development of new materials.
We found only one instance related to an organization’s practice adaptation to use AM.
Mellor, Hao and Zhang (2014) propose an integration framework for AM in the form of a list
of implementation factors which are classified as strategic (e.g. business, manufacturing, and
research and development strategy alignment), technological (e.g. technology maturity),
organizational (e.g. organizational culture), operational (e.g. quality control), and supply
chain-related (AM machines vendors). This can guide an organization for implementation
steps, such as “strategic alignment of the business, manufacturing and R&D strategy” or
“rethink design for manufacturing”, but no assessment method is proposed in order to
evaluate its initial skills and knowledge profile. Consortiums and research institutes support
organizations in the integration of these technologies, such as MTC (2015), EWI (2015), and
Fraunhofer Institute (Fraunhofer-Gesellschaft, 2015), but they do not make their methods
public. There is therefore an urgent need for an AM-specific descriptive tool of a company’s
current maturity profile as well as a prescriptive tool to support the integration of AM
technologies so that its deployment can be more effective.


CHAPTER 2
METHODOLOGY
The problem this thesis is aimed at can be translated in the following research question:
How can a maturity model be designed in order to be useful for Bombardier Transportation
to integrate additive manufacturing to its product development process?
The project objective is to develop a maturity model that can support effective integration of
additive manufacturing (AM) in Bombardier Transportation’s product development process.
A set of evaluation criteria is first used to evaluate the maturity model. Out of the scientific
scope of the project, but of great value to the organization, an integration strategy of AM to
BT’s product development process is designed. The adequacy of this strategy to the
organization’s needs is considered in combination with evaluation criteria to perform a
second evaluation of the maturity model. The model development and integration strategy
elaboration are achieved through a case study at BT.
2.1 Methodological foundations
In order to address a research question, one must first select the scientific method that will
guide the research. Common scientific methods used in traditional science include (Dresch,
Lacerda and Antunes Jr., 2015):
• Inductive method: observe phenomena that leads to determine relationships between
phenomena and then generalize findings as laws or theories;
• Deductive method: suggest explanations to phenomena based on laws and theories;
• Hypothetical-deductive method: suggest and test a hypothesis that then results in the
explanation of a problem.

28
From a strictly academic point of view, a demonstration of the hypothetical-deductive
scientific method applied to the integration of AM in organizations could be as follows:
• State the hypothesis that “a maturity model supports the integration of AM in
organizations and allows a progression in maturity”;
• Assess the current maturity level;
• Conduct the deployment of AM in the organization;
• Reassess the maturity level to prove the hypothesis.
However, such a classical approach does not fulfill our goal since it is mainly used to
explore, describe, explain, or predict phenomena through observation and experience. In this
project, we solely use assumptions or “working hypothesis” to build the maturity model and
its associated survey and to plan the adoption of AM at BT. These assumptions refer to the
initial maturity level of the organization and are presented in CHAPTER 3.
While first “tackling” Bombardier Transportation’s problem (how to adopt AM
technologies), the researcher could not address the scope of the problem with traditional
research methods to solve the organization’s problem (and take the organizational context
into account (BT’s concerns or issues)). Action Design Research, a research method that
considers the design of the artifact, the intervention in the organization and the evaluation of
the artifact as activities that cannot be segmented, is therefore justified for this project. ADR
draws on abductive reasoning, which is a creative process. ADR is different from the
traditional epistemological perspectives from Natural and Social Science in the sense that it
seeks to create ideas and concepts rather than studying or explaining them. We can see
Action Design Research as an emerging scientific method (Sein et al., 2011).
Sein et al. (2011) suggest, in their essay on ADR, four stages of the method and seven
underlying principles as shown on Figure 2.1. We identify the thesis chapters in which each
ADR method stage will be embodied in the case of this project.

29
Figure 2.1 ADR method stages and principles (adapted from Sein et al. (2011)
An exemplification of these stages and principles which we adhere to for the current project
is presented in section 2.2.
ADR has the objective to help people find solutions to their problems by creating artifacts
and learn from this intervention in an organizational context. Our goal is to develop an
artifact (made of two components: a maturity model and a survey) to solve an organization’s
problem that is the lack of methodology to adopt AM. The ADR method implies the use of
innovative methods while addressing problems for a class of systems. This class of systems
is represented as maturity models of different types (as presented in section 1.2.1). However,
for the needs of this project, existing models cannot be reused, so a new model, specific to
additive manufacturing, has to be developed. In addition, a survey is designed to assess the
maturity level of the organization, said level being the starting point of the AM integration
strategy.

30
The model and survey are components of an artifact which is defined as an object that
addresses a class of problems that is exemplified here as the integration of additive
manufacturing technologies within BT’s product development process so it can better benefit
from these technologies. The elements that form this class of problems include the evaluation
of the maturity level, the identification of training and information sources on AM, the
decision on the application domains to prioritize (e.g. spare parts or new fire-resistant
materials) and the elaboration of a strategy to increase the level of maturity. Not only does
Action Design Research aim at producing an artifact, it also provides knowledge about the
artifact, how to use it and its context. In our case, it is obvious that to truly benefit from our
maturity model, it is necessary to provide knowledge and instructions pertaining to its use
considering its novelty and the scope of AM application domain.
Dresch, Lacerda and Antunes Jr. refer to Action Design Research where “it can contribute to
the construction of artifacts in cases where development is dependent on the interaction of
the participants of the research or when evaluation can only be performed in the context of
the organization and with the involvement of people within the environment under study.”
In the present case, the role of the researcher involved in the environment is to:
• Observe the practices and conduct preliminary assessment of maturity (refer to
section 3.1.1.1) with the help of the environment actors, whom we refer to as the
practitioner in Table 3.4.
• Act as an expert on AM, and provide educational material to a number of BT
employees, and thus contribute to the progression in maturity;
• Administer the survey and collect responses.
ADR encompasses different research methods at different steps of our research project, such
as artifact creation (e.g. creation of new descriptors using abductive reasoning), a case study,
and artifact evaluation (survey: classical quantitative method).

31
We referred to artifacts several times and how they carry and express different types of
knowledge. Johannesson and Perjons (2014) classify artifacts by the type of knowledge they
convey. Five main knowledge types are reported:
• Definitional: “consist of concepts, constructs, terminologies, definitions,
vocabularies”;
• Descriptive: “describes, summarizes, generalizes and classifies observations of
phenomena or events”;
• Explanatory: “provides answers to questions of how and why”;
• Predictive: “predicts outcomes based on underlying factors but without explaining
causal or other relationships between them”;
• Prescriptive: “models and methods that help solve practical problems.”
The type of knowledge describes its goal whereas the knowledge form defines how it is
carried out. It can thus be:
• Explicit: knowledge is communicated in a coherent manner, it can be shared with
others;
• Embodied: knowledge is found in the thoughts of individuals and generally not
explicit;
• Embedded: knowledge is an integral part of physical objects, processes, or structures.
Literature on additive manufacturing is a media presenting explicit knowledge and can be
easily shared between individuals who wish to learn about it. However, reading about Design
for AM (DfAM) rules might not be sufficient to acquire that skill. DfAM skills can be
represented as embodied knowledge since it cannot be easily and explicitly explained. In our
case, examples of carriers of embedded knowledge include physical objects such as parts
produced using AM and in technology such as AM equipment and related technologies (e.g.
CAD software).
Accordingly, four categories of artifacts are identified with associated knowledge types and
forms in the context of Design Science in Table 2.1.

32
Table 2.1 Artifacts and knowledge types and forms (extracted from Johannesson and Perjons (2014))
Types of artifacts Knowledge
classification
Constructs: “terms, notations, definitions, and concepts that are
needed for formulating problems and their possible solutions.” Definitional
Models: “representations of possible solutions to practical
problems … can be used for supporting the construction of
other artifacts.”
Prescriptive
Methods: “define guidelines and processes for how to solve
problems and achieve goals … how to create artifacts.” Prescriptive
Instantiations: “working systems that can be used in practice.”
A model can be instantiated. Embedded
The maturity model we propose comprises each of these artifacts types, but globally it is a
model-type of artifact: it prescribes the procedure to progress in organizational maturity.
When evaluating the maturity level, it could be seen as definitional since it provides
descriptions of the levels, or what we refer to as the descriptors.
The maturity model was used to support the design of the survey, and additional artifacts,
referred to as the deliverables (nonscientific part of the project), briefly presented in
CHAPTER 6 and provided with more detail in Appendix I. The maturity model comprises
constructs in the form of terms and concepts to label, for instance, the maturity levels and to
introduce additive manufacturing technologies. The deliverables are examples of method
artifacts: they provide instructions on the use cases to conduct in order to achieve a higher
maturity goal.
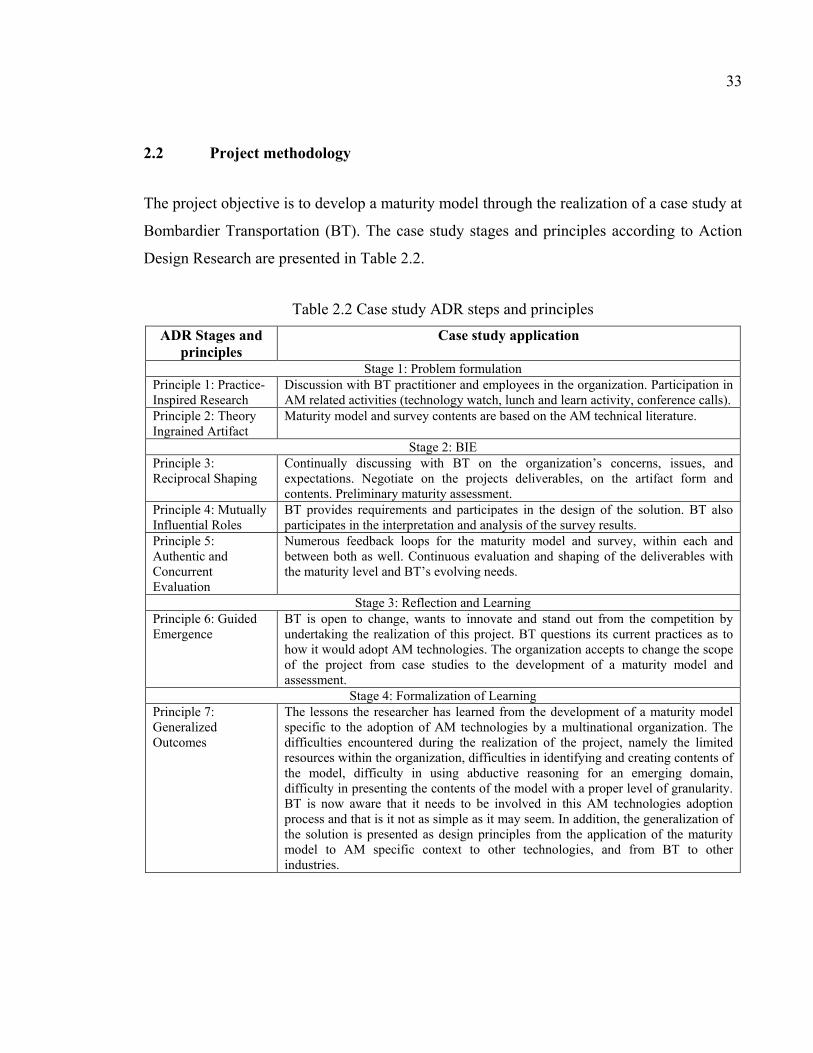
33
2.2 Project methodology
The project objective is to develop a maturity model through the realization of a case study at
Bombardier Transportation (BT). The case study stages and principles according to Action
Design Research are presented in Table 2.2.
Table 2.2 Case study ADR steps and principles
ADR Stages and principles
Case study application
Stage 1: Problem formulation Principle 1: Practice-Inspired Research
Discussion with BT practitioner and employees in the organization. Participation in AM related activities (technology watch, lunch and learn activity, conference calls).
Principle 2: Theory Ingrained Artifact
Maturity model and survey contents are based on the AM technical literature.
Stage 2: BIE Principle 3: Reciprocal Shaping
Continually discussing with BT on the organization’s concerns, issues, and expectations. Negotiate on the projects deliverables, on the artifact form and contents. Preliminary maturity assessment.
Principle 4: Mutually Influential Roles
BT provides requirements and participates in the design of the solution. BT also participates in the interpretation and analysis of the survey results.
Principle 5: Authentic and Concurrent Evaluation
Numerous feedback loops for the maturity model and survey, within each and between both as well. Continuous evaluation and shaping of the deliverables with the maturity level and BT’s evolving needs.
Stage 3: Reflection and Learning Principle 6: Guided Emergence
BT is open to change, wants to innovate and stand out from the competition by undertaking the realization of this project. BT questions its current practices as to how it would adopt AM technologies. The organization accepts to change the scope of the project from case studies to the development of a maturity model and assessment.
Stage 4: Formalization of Learning Principle 7: Generalized Outcomes
The lessons the researcher has learned from the development of a maturity model specific to the adoption of AM technologies by a multinational organization. The difficulties encountered during the realization of the project, namely the limited resources within the organization, difficulties in identifying and creating contents of the model, difficulty in using abductive reasoning for an emerging domain, difficulty in presenting the contents of the model with a proper level of granularity. BT is now aware that it needs to be involved in this AM technologies adoption process and that is it not as simple as it may seem. In addition, the generalization of the solution is presented as design principles from the application of the maturity model to AM specific context to other technologies, and from BT to other industries.
34
The BIE, stage 2, is the iterative process by which the artifact is created and refined and the
problem and artifact are continuously evaluated and improved. The schema illustrated on
Figure 2.2 depicts the building, intervention and evaluation step. The artifact components are
refined numerous times during the project (as shown on Figure 2.2).
According to the ADR method, there are two types of BIE: technology-dominant BIE or
organization-dominant BIE.
For the additive manufacturing domain of application, the technology-dominant BIE could
refer to the development of a new AM technology for spare parts applications, whereas an
organization-dominant BIE would consist in an intervention within the organization to
support the adoption of AM technologies. The latter is the object of this project for which an
artifact, made of two components, a maturity model and a survey, is developed by a
researcher; the Master’ student. An AM expert is also referred to in the evaluation of the
model and survey steps and can be considered as a second researcher in the project. The
Master’ student is also considered a practitioner because she is active in the environment as a
technological watch lead and thus both influencing the development of the artifact and the
environment. A second practitioner, the research and technology coordinator and innovation
lead, is involved in the realization of the case study, and end users are represented by the
organization’s employees.

35
Figure 2.2 Organization-dominant BIE process (adapted from Sein et al. (2011))
First, the practitioner states the organization’s needs and requirements. The researcher
prepares a statement of work that is then reviewed with the practitioner. The goal is then
established to identify case studies. The end users are invited to provide information on their
current use and knowledge of AM (preliminary maturity assessment). Considering this
assessment, actual needs of users and the organization are identified and updated. A maturity
model is then developed by the researcher. The maturity model is reviewed by the
practitioner and one external expert. A survey is developed, reviewed with practitioner and
end users are asked to complete it. The practitioner analyzes results of survey and evaluate
the maturity model. The scientific contribution is therefore: design principles as a
methodology for the development of a maturity model for the AM domain of application.
The nonscientific contributions are an AM integration strategy, and learning opportunities for
end users.

36
During the problem formulation stage and design cycles of the artifact, the organization
expressed a need for a strategy that would support the adoption of additive manufacturing to
its product development process. It is important to mention that the Master’s thesis emphasis
is directed on the maturity model. The model and associated survey compose the scientific
portion of this project as an artifact with multiple components for the maturity evaluation
(model and survey). On the other hand, the implementation strategy, embodied by three
deliverables (identification guide, roadmap and work packages), constitute the
organizational, or in other words, the nonscientific part of the project. The artifact
components and the deliverables as well as the relations between these elements are
presented in Figure 2.3.
Figure 2.3 Case study results and relations between artifact and deliverables
The common thread that connects the artifact and deliverables, or the scientific and
nonscientific portions of the project is the maturity level of the organization and its
application domain, the rail industry. With regards to the nonscientific part of the project, the
description of the PDP supports the identification of potential use cases and stakeholders, as
well as survey respondents. It also provides insights into projects critical path and skills to

37
develop, which are necessary inputs to the strategic roadmap. The identification guide criteria
weighting and examples reflect the low maturity level. The strategic roadmap and work
packages also start from the maturity level 1 to progress to level 3. The deliverables are
briefly presented in CHAPTER 6 and provided with more detail in APPENDIX I.


CHAPTER 3
PROBLEM FORMULATION AND MATURITY MODEL METHODOLOGY
This chapter’s objective is to present the steps that lead to the development of the maturity
model. It comprises a description of the Action Design Research problem formulation stage
(Sein et al., 2011) as steps that lead to the development of the artifact, and the maturity model
design steps.
3.1 Problem formulation
For each of the following problem formulation stage tasks identified by Sein et al. (2011), we
describe how it is exemplified for our case study.
1) Identify and conceptualize the research opportunity;
2) Formulate initial research questions;
3) Cast the problem as an instance of a class of problems;
4) Identify contributing theoretical bases and prior technology advances;
5) Secure long-term organizational commitment;
6) Set up roles and responsibilities.
Steps 1 and 2 are covered in the same section (3.1.1), as well as steps 5 and 6 (3.1.4).
3.1.1 Research opportunity and initial research question
In this project, the research opportunity identified is the lack of information on the
methodological aspects of the integration of additive manufacturing in the product
development process. Companies have to work experimentally with these technologies and
identify steps to adopt them.

40
The initial research question is thus formulated to address this need:
How can a maturity model be designed in order to be useful for Bombardier Transportation
to integrate additive manufacturing to its product development process?
The goal of this project is to develop a maturity model that can support effective integration
of AM in the product development process of an organization.
With regards to the nonscientific portion of the project, an AM integration strategy based on
the maturity model, which comprises an AM candidates identification guide, a strategic
roadmap and work packages, is developed.
The adequacy of this strategy to the organization’s needs is considered in combination with
evaluation criteria to evaluate the maturity model. The model development (scientific aspect
of the project) and integration strategy elaboration (nonscientific aspect) are achieved
through an industrial case study at BT. The maturity level of the organization is tested using
a survey.
3.1.1.1 Preliminary maturity level assessment
At the beginning of the case study, a preliminary assessment of initial AM maturity was
conducted at the organization in order to use the organization terminology for the survey
design, and to propose questions that would consider the initial estimated maturity level. For
example, if most employees don’t know what AM is, one answer choice should be “never
heard of AM.” The goal was to design the survey so higher levels are defined and that a
progression can thus be drawn from the results.
The preliminary assessment was conducted through these activities:
• Field observations which revealed:
o The acquisition and extensive use of binder jetting machines by Americas (AME)
and Asia-Pacific (APA) divisions for 10 years;
o The acquisition of a desktop 3D printer and use by a few engineers;

41
o The realization of an academic project on the redesign of a train door part for AM
during the winter 2014 was the first production oriented AM project for the AME
division.
• Exhaustive review of the AME prototyping center prototypes registry on two major
projects that revealed:
o Main AM uses are validation of customer requirements for design and aesthetics,
crash and fire testing, human factors, and assembly hours validation;
o Prototypes are used relatively late in the design process.
• AM inventory initiative: each division of BT was asked to provide information on its
current use of AM and whether it had in-house AM equipment and/or had worked
with an external service bureau to get AM parts. It was also requested that they
submit information on the workforce having AM related skills.
The inventory activity was also conducted at Bombardier Aerospace (BA), the sister division
of Bombardier Transportation. BA already has an important knowledge base on AM. BA has
been working for a few years on research projects on AM and is mostly interested by
polymer and metal production parts, mainly at its Canadian and Irish sites.
The Figure 3.1 illustrates the main uses of AM (part types) that were identified during this
AM inventory initiative. To respect confidentiality agreements, illustrations of the parts were
removed.
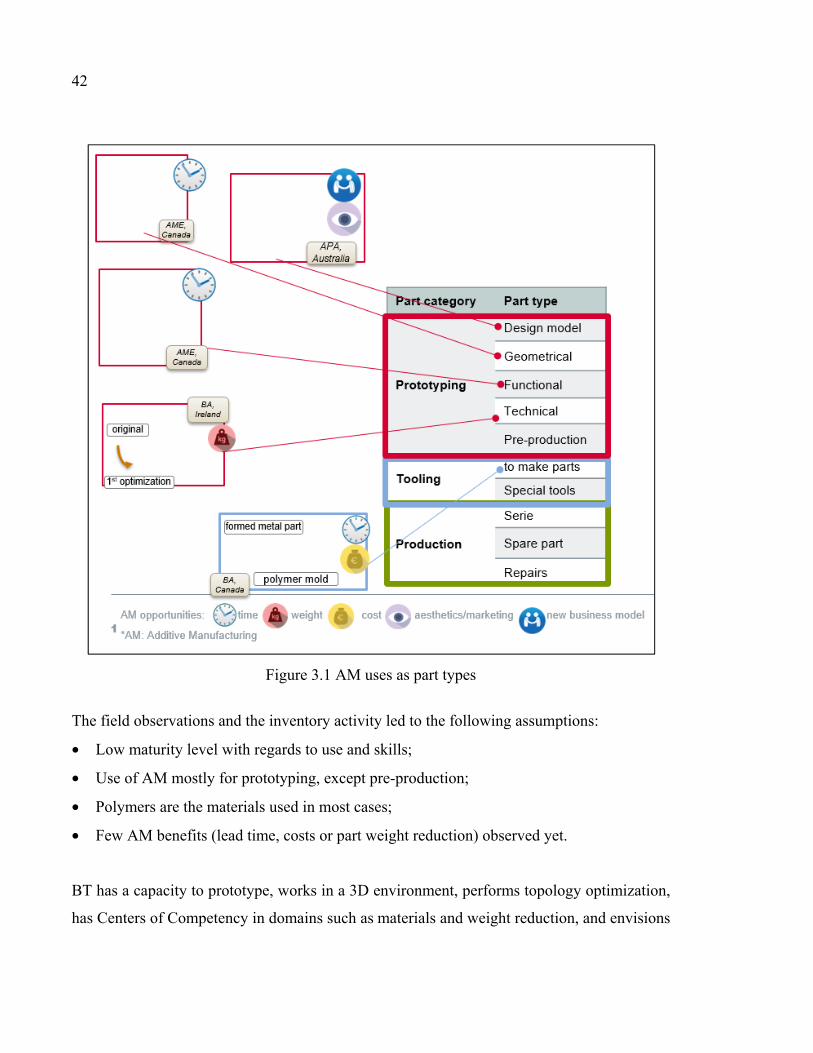
42
Figure 3.1 AM uses as part types
The field observations and the inventory activity led to the following assumptions:
• Low maturity level with regards to use and skills;
• Use of AM mostly for prototyping, except pre-production;
• Polymers are the materials used in most cases;
• Few AM benefits (lead time, costs or part weight reduction) observed yet.
BT has a capacity to prototype, works in a 3D environment, performs topology optimization,
has Centers of Competency in domains such as materials and weight reduction, and envisions

43
Design to Cost and Design for Manufacturing practices, which are necessary to fully benefit
from AM.
Following this initial maturity assessment, the researcher produced a statement of work
describing the project objectives, methodology, and deliverables. Efforts were put into the
definition of the customer attributes with regards to the realization of AM case studies. Since
ADR is a method that implies continuous reflection and learning, as depicted by step 3 of the
method by Sein et al., negotiation with the practitioner started during the problem
formulation stage. The Table 3.1 presents the elements that were discussed with the
organization’s practitioner, the decisions taken and the consequences of these decisions.

44
Table 3.1 Negotiation with practitioner during problem formulation
Elements discussed Decision Consequences Contents of the statement of work.
Discussions on the organization’s needs and decision on the project solution as case studies. The targets of the case studies in terms of weight, costs and development time reduction. The focus of the project during the first year is on case studies. It was justified because it was valued by employees and stakeholders to have business cases and case studies to prove what AM can do. The organization also requests to build a portfolio of AM contacts (AM machine manufacturers, service providers).
Efforts put into the identification of case studies (parts, applications, materials).
Characterization of the organization’s product development process to identify the steps of the PDP for which AM would have an impact.
A document describing the PDP was designed but since the organization is undergoing major changes in its organizational structure and documentation, it was decided not to complete this document.
The researcher spent about one month collecting data and describing the PDP. Even if the document was not completed, it provided insights on the organization’s practices, terminology and preliminary maturity. This preliminary assessment was useful for the development of the maturity model and survey.
Proposal of a maturity model as the project solution.
Discussions on the added value of assessing the initial maturity of the organization over the realization of case studies on AM parts. Practitioner accepts to replace case studies with maturity model and evaluation of maturity. Conclusion was that case studies would be conducted by some employees within current projects with the support of AM service providers.
Researcher has to learn how to devise a maturity model and an assessment method for an emerging technology application domain (additive manufacturing) for the rail industry that is known to be conservative.
We therefore demonstrated that we adhere to ADR principle 1 “Practice-inspired research”
by discussing with the organization’s practitioner and taking the organization’s needs,
concerns and suggestions into account for the subsequent steps of the project.

45
3.1.2 Problem within class of problems
The class of problems that this project aims at is the integration of AM within an
organization’s product development process. More specifically, problems include answering
the following questions:
• What is the AM maturity level of the organization?
• How can the organization progress in maturity with regards to its adoption of AM?
• Where can the information on AM be found?
• Where can training opportunities be found on AM?
• Which AM-related aspects or opportunities should be prioritized considering the
organization’s requirements (e.g. rail industry specific materials, business models,
reduction of weight)?
As previously mentioned, the research question implies the adoption of AM within the scope
of the whole product development process. It was therefore decided to dedicate a large
portion of our work to the study of the organization’s product development process (PDP)
since additive manufacturing (AM) has an impact on the whole PDP. The characterization of
the PDP can first support the design of the model if we consider that a mature organization
would have integrated AM within every step of its product development process. It can also
allow the identification of potential use cases, skills required to use AM, and stakeholders
(individuals or groups) within the organization. The identification of these elements is
covered in APPENDIX I.
A product development process is made up of a series of successive activities whose ultimate
goal is to commercialize optimized and tested goods or services in order to solve a problem.
The classical development process starts with a problem to be solved, or task, and usually
present the following main phases (Pahl and Beitz, 1994):
1) clarification of the task,
2) conceptual design,

46
3) embodiment design,
4) detail design.
In this project, we intend to consider the product development process at the organization
level, so that it covers the whole product lifecycle, as described by Pahl et al. (2007):
1) market, need, problem, or goals of a company,
2) product planning, task setting,
3) design, development,
4) production, assembly, test,
5) marketing, consulting, sales,
6) use, consumption, maintenance,
7) energy recovery or recycling,
8) disposal, environment.
Diverse teams such as marketing, design, production and sales are involved in the process
and during design reviews between each activity to make sure the product requirements are
met and that the next phase should be started. These reviews, also called gates, are “key
elements of the design control process and are implemented across product development
activities to assess progress and verify the quality of the work achieved.” (Huet et al., 2007)
During the characterization of BT’s PDP, each phase was reviewed in the light of AM
adoption with an engineer from the Bombardier Engineering Systems team to assess the
impact AM will have on the organization’s practices, teams, and documentation.
Table 3.2 and Table 3.3 present BT’s PDP phases for which AM might have an impact and
associate these phases to Pahl et al.’s product lifecycle phases. This PDP review also
provided insights on the organization’s practices, terminology and preliminary maturity. This
preliminary assessment was useful for the development of the maturity survey that is
presented in the next chapter. A matrix was built with the name of the process phase, its
stakeholders, current estimated maturity level, required modification for AM, and related

47
documents. In the end, it was decided not to complete this document since the organization is
undergoing major changes in its organizational structure and documentation.

48
Table 3.2 BT’s PDP phases (1/2)
Product development process phases Pahl et al. BT’s PDP phases impacted by AM
1) Market, need, problem, or goals of a company
Bid Activities
2) Product planning, task setting
Strategy and Governance: Drive Strategic Sourcing
Operational/Manufacturing Planning Activities: Operational/Manufacturing Strategy
Operational/Manufacturing Planning Activities: Investment and Technology Planning
Technology and Roadmap: Explore and Develop Future Technologies
Technology and Roadmap: Plan Products & Future Technologies
3) Design, development
Develop & Manage Product: Develop & Maintain Subsystem
Design and Sourcing Activities: Configure Mechanical Concept & Interfaces
Design and Sourcing Activities: Design Product Performance
Design and Sourcing Activities: Define to Buy (Purchase Level 1)
Design and Sourcing Activities: Define to Make (Purchase Level 2)
Design and Sourcing Activities: Integrate Subsystem Design
Design and Sourcing Activities: Validate Subsystems

49
Table 3.3 BT’s PDP phases (2/2)
Product development process phases Pahl et al. BT’s PDP phases impacted by AM
4) Production, assembly, test
Design and Sourcing Activities: Plan and Manage Procurement Project
Realization Activities: Product Preparation Activities - Preparation of Material and Logistics Management
Realization Activities: Product Preparation Activities - Human and Technical Capacity Preparation and Validation
Realization Activities: Product Preparation Activities - Manufacturing and Test method preparation
Realization activities: Product Preparation Activities - Production Line (tools and equipment) Preparation and Setup
Realization Activities: Product Execution Activities - Material and Logistics Management
Realization Activities: Product Execution Activities - First Unit/Pre-Series
Realization Activities: Product Execution Activities - Series Realization
5) Marketing, consulting, sales
6) Use, consumption, maintenance
Field Support Activities: Fleet System Management - Spare Parts Management
Maintenance Activities: Overhaul 7) Energy recovery or recycling
8) Disposal, environment

50
3.1.3 Theoretical bases and prior technology advances
The problem identification was justified by conducting a literature review on additive
manufacturing technologies at the beginning of the research project. We could not find any
studies reporting on methodologies for the adoption of AM technologies nor on additive
manufacturing specific maturity models.
Technical literature on AM dating less than five years before the start of the project was
identified, reviewed and considered as the basis of the maturity model.
Literature on the development of maturity models and recognized models, such as CMMI
(2010) and BIM (2012), were used as guidelines and inspiration for our model. We can
therefore assume that ADR principle 2, theory-ingrained artifact, is respected.
3.1.4 Organization commitment, roles and responsibilities
Within an ADR project, long-term commitment of the organization is decisive to go through
numerous building, intervention and evaluation cycles, but also to reflect on the contributions
of the participants and in the generalization of the project teachings as design principles. The
roles of the participants are described in Table 3.4.
Table 3.4 ADR method participants’ roles
Participants’ roles
Responsibilities
Researcher Develop a maturity model, evaluate AM maturity, propose a strategy for integration of AM in PDP, act as an expert on AM (provide information, give a presentation, technology watch).
Practitioner: Provide insights on organization’s needs, identify stakeholders and convince them of AM advantages.
End users Voice AM-related needs, respond to survey, and suggest AM case studies.

51
3.2 Maturity model methodology
Once the decision was made to develop a maturity model as the basis of a maturity
assessment tool, the researcher then determined the model use, scope and foundation, while
considering literature on maturity models. In this section, these first three development steps
are described and compared to De Bruin et al. and Becker, Knackstedt and Pöppelbuß
methodologies.
1) Determine maturity model use
The first step was to determine the maturity model functions:
• Act as the foundation of the assessment tool: the survey;
• Provide descriptive knowledge on the initial BT maturity level;
• Provide descriptive knowledge on the desired BT maturity level;
• Provide prescriptive knowledge as suggesting a path from initial to desired level.
In comparison with existing maturity models, our proposal is not to evaluate the technology
readiness, nor to verify the manufacturing capacity of a process. The maturity model purpose
is to assess the current profile of an organization with regards to its use and knowledge of
AM and to suggest an integration path.
2) Determine model scope and literature review
According to De Bruin et al., the scope step consists in determining the focus of the model
(domain specific or general), identify the stakeholders (from academia, industry,
government), and perform an exhaustive literature review to get a thorough understanding of
the application domain and to have a basis for later comparison with existing maturity
models.
The model scope was determined as covering the adoption of AM for organizations that
design and/or manufacture mechanical systems, irrespective of the field of application
(aerospace, automotive, railway, etc.). The model main stakeholder is Bombardier
Transportation.

52
The model can also benefit the academic community that is interested in the adoption of
emerging technologies and/or the development of organizational maturity models.
The literature review was required to identify the characteristics of maturity models and
common constitutive elements such as maturity levels, structure, foundations, and assessment
tools. The organizational maturity models were compared and summarized in Table 1.2. As
suggested by Becker, Knackstedt and Pöppelbuß, conducting a comparison study between
existing maturity models facilitates the choice of design strategy such as a completely new
model, design, improvement of a model or use of similar content for a different area of
application. For example, we decided to build a new model but transferring some maturity
labels from the Computer Integrated Construction Research Program’s BIM and Pigosso,
Rozenfeld and McAloone’s model. The conclusion of the literature review is that maturity
models for technology, manufacturing or organizational maturity exist, but not specifically
for AM. Becker, Knackstedt and Pöppelbuß state that in the problem definition step, the need
for the maturity model must be clearly established. We did put effort in the definition of the
customer needs and not only based on the AM application domain. In other words, we didn’t
assume that all AM opportunities would be applicable without considering the customer’s
actual needs. The organization needed support to conduct AM use cases and to have access to
a learning tool to progressively adopt AM technologies. We identified how the organization
could benefit from AM for its specific business domain and our model prioritizes these
benefits: weight, lead time, and cost reductions.
3) Decision on the foundation of the model
Through the literature review, it was observed that maturity models were mainly based on the
following elements:
• process areas: process management, project management, engineering and support
(Ngai et al., 2013), project planning, product integration (CMMI Product Team,
2010),
• product development process phases: concept design, production preparation, product
monitoring (Pigosso, Rozenfeld and McAloone, 2013),

53
• planning elements: strategy, uses, process, information, infrastructure and personnel
(The Computer Integrated Construction Research Program, 2012).
In addition to the concept of competency, we considered uses from the planning elements
and the product development phases as a good fit for the foundational concepts of our model.
We already knew that an organization having a high maturity level would have integrated
AM through all of its product development process. To first adopt AM, parts candidates need
to be identified and we observed through our first exchanges of information with BT
divisions that demonstrating AM opportunities through applications, which are tangible and
can easily be visualized, was the most efficient way to keep individuals interested about AM.
We thus listed and detailed AM potential uses in Table 3.5, Table 3.6 and Table 3.7. These
lists are non-exhaustive and are customized to BT’s needs and its initial estimated maturity
level.

54
Table 3.5 Prototyping uses
Part category Part type Use
1. Prototyping 1.1. Design model
1.1. Design Model - generic use
1.1.1. Validate optical and haptic requirements
1.1.2. Internal and external communication
1.1.3. Validate ergonomics
1.1.4. Initial market analysis
1.2. Geometrical prototype
1.2. Geometrical prototype - generic use 1.2.1. Validate geometrical requirements 1.2.2. Verification of production and assembling suitability 1.2.3. Rough production planning
1.3. Functional prototype
1.3. Functional prototype - generic use 1.3.1. Validate functional requirements (form, fit & function) 1.3.2. Verification and optimization of functional principle 1.3.3. Manufacturing sequence and assembly planning
1.4. Technical prototype
1.4. Technical prototype - generic use 1.4.1. Customer acceptance verification 1.4.2. Mechanical, thermal and chemical properties verification 1.4.3. Manufacturing process application
1.5. Pre-production part
1.5. Pre-production part - generic use 1.5.1. Validate production material, process and tools 1.5.2. Product and market tests 1.5.3. Market introduction 1.5.4. Process parameter determination and optimization

55
Table 3.6 Tooling uses
Part category
Part type Use
2. Tooling 2.1. Series of parts
2.1. Series of parts - generic use Generic series of parts
2.1.1. Form a part by injection injection mold
2.1.2. Form a mold by room temperature vulcanizing (RTV)
silicone (RTV) pattern
2.1.3. Produce liquid silicone rubber part liquid silicone rubber mold
2.1.4. Deform a plastic sheet thermoforming mold
2.1.5. Produce a hollow plastic part blow molding mold
2.1.6. Produce a composite part composite parts soluble core fiber layup mold
2.1.7. Deform a metal sheet or part hydroforming die
sheet metal bending die
metal drawing punch and die forging die
2.1.8. Form a part by sandcasting sand casting pattern
sand casting core
sand casting mold
2.1.9. Form a part by investment casting investment casting (lost wax) pattern investment casting mold
2.2. Other applications
2.2. Other applications - generic use Generic other applications
2.2.1. Stage a part for CMM inspections fixtures & jigs
2.2.2. Hold work piece during machining
2.2.3. Position parts when bonding or assembling 2.2.4. Testing test fixture/device
2.2.5. Aligning tool manufacturing/drill guide
2.2.6. Assemble parts assembly tool

56
Table 3.7 Production uses
Part category
Part type Use
3. Production
3.1. Original part (serie of one or several parts)
3.1. Serie - generic use 3.1.1. Customization (every part is unique) 3.1.2. Mass customization (options) 3.1.3. Mass production
3.2. Spare part 3.2.1. Solve obsolescence problems 3.3. Repair 3.3.1. Repair metal parts
The following product development process phases, listed in chronological order, are
examples of activities that can be directly associated to a potential use of AM.
Table 3.8 Product development process phases and AM uses
Product development process phases AM uses
Bid Activities Design model
Design Activities: Configure Mechanical Concept and
Interfaces
Geometrical
prototype
Product Preparation Activities: Manufacturing and Test
Method Preparation
Functional or
technical prototype
Product Preparation Activities: Production Line (tools and
equipment) Preparation and Setup Tooling to make parts
Product Execution Activities: First Unit/Pre-Series Pre-production part
Production part
Maintenance Activities: Fleet/System Operation Tooling: special tools
Fleet System Management: Spare Parts Management Spare part
CHAPTER 4
AM MATURITY MODEL
This chapter introduces the ADR step 2: building, intervention and evaluation phase. The aim
is to present the maturity model design steps, the model contents, the evaluation criteria of
the model, and how the maturity survey development, testing and results impact the final
design of the model.
4.1 Maturity model design
These steps follow the steps presented in the last chapter as the identification of the model
use, scope and foundation.
1) Determine the model indicators
As previously stated, we started with AM uses and PDP phases in mind to build the maturity
model. Each PDP phase can be directly associated to a potential use of AM and accordingly,
to AM processes, materials, good practices and standards, as well as related technologies, as
presented in this section. Examples of PDP phases and their associated AM uses can be
found in Table 3.8. When faced with the fabrication of a part using AM, a user will have to
go through a decision process which steps we used to determine our model’s indicators as
presented in Table 4.1.

58
Table 4.1 AM decision factors to model indicators
AM decision process steps Maturity model indicators Identify use of the part (e.g. production part). AM uses Identify AM process to use to fabricate part. AM process categories Choose an AM material, the AM process will narrow down the choice of material.
AM materials
Prepare part for AM (e.g. design rules). Consider limits and opportunities of AM. Identify service provider(s) to fabricate part.
AM good practices
Consider standards for designing or testing part. AM standards Use various technologies to obtain CAD file, or to optimize design of part.
Related technologies
These indicators encompass AM themes on tools, technologies, and skills that were reviewed
from the literature.
For the “populate” development phase of the model, De Bruin et al. recommend to divide the
maturity model in hierarchical layers (e.g. domain, domain component, domain sub-
component), as it is “critical for complex domains as this enables a deeper understanding of
maturity, without which the identification of specific improvement strategies is difficult.”
From cognitive psychology, we could apply Miller’s Law , which states that the human
working memory can hold about seven objects (Miller, 1956), so that dividing the model
indicators in sub-indicators would facilitate its understanding and use.
We did divide our model in layers, or indicators, but not in sublayers. This is one of our
model weaknesses, but elements such as "uses" could be easily divided in sub-uses
(prototyping, tooling, production parts) to enable a more exhaustive maturity profile.
2) Determine maturity levels In the literature reviewed, most models presented four to five maturity levels, as shown in
Table 4.2.

59
Table 4.2 Maturity levels
0 1 2 3 4 5 6
CMMI initial managed defined quantitatively managed
optimizing
BIM nonexistent initial managed defined quantitatively managed
optimizing
Ecodesign maturity model
incomplete
ad hoc formalized controlled improved
EUMMM initial managed defined quantitatively managed
optimized
EMMM initial planning implementation monitoring improvement
Our model nonexistent initial occasional formalized controlled optimized innovative
The terminology was first compared to see the underlying concept for each level. We roughly
kept the same designations and decided to keep the “nonexistent” label from The Computer
Integrated Construction Research Program’s BIM and to add one that is higher than
optimizing. The model we propose thus presents seven levels. The seventh one, the
innovative level, is a novel contribution and is proposed to consider the fact that the AM
industry is constantly evolving and that companies that will really stay ahead of the AM
market will be innovating by developing tools, materials, and machines to suit their industry.
3) Define the descriptors
The model is designed as a matrix with the rows representing the five indicators and the
columns the seven maturity levels (the maturity scale). We used the literature to fill the
matrix and develop the descriptors. We searched for the following AM themes that can be
classified as internal and external resources as mentioned in the competency definition at
section 1.2.1:
• Internal resources:
o Knowledge on general engineering materials science, AM process categories
principles, and AM opportunities and limits;

60
o Skills that include AM candidates selection expertise, Design for AM rules
application, Computer-Aided Design (CAD), Computer-Aided Manufacturing,
topology optimization and finite element analysis, cost analysis, technology
watch, design for environment, and quality control;
o Attitudes, such as having an innovative and creative mindset and readiness for
change.
• External resources, namely service providers, material suppliers, machine
manufacturers, AM standards, and CAD file formats.
Although many maturity models are based on the concept of capability, few define it. Ning,
Fan, and Feng (2006) propose that the definition of knowledge capability could be included
as the “knowledge system that can synergy and reconstruct the resources, knowledge and
capabilities within and without the organization to realize the harmonious development with
its environment.” Knowledge capability includes core knowledge resource that makes the
organization competitive and the knowledge operating capabilities that make the knowledge
resource effective and profitable. This definition is meant to encompass the following
notions: an ability to act, based on knowledge and resources in a task-specific context. It is
also meant to be dynamic in the sense that it is reconstructed with changing internal and
external environment.
We find that the definition of competency proposed by Tardif (2006) to be much more
operational: “a complex know-how-to-act requiring the mobilization and the efficient
combination of a variety of internal and external resources within a family of situations.” The
family of situations describes the context, and to a certain measure, the scope, in which the
competency will be deployed. From the literature reviewed, we understand that competency
and capability could be used as synonyms, but that in some cases (e.g. CMMI), capability
focuses on measuring the performance of the process and not of the human using the process.
A study could be conducted on defining and comparing capability and competency, but it is
not the goal here. As mentioned in CHAPTER 1, we refer to a “maturity label” for our
evaluation scale while including competency as the underlying foundation of our model.

61
A first version of the model was created as a matrix and each indicator was subdivided in
distinct factors to reflect the required knowledge, skills, attitudes and external resources. For
example:
• AM materials and process categories:
o AM materials (metal, ceramic, polymer, paper, wax, composite),
o AM process category knowledge,
o AM process category selection.
Since the model is in part based on PDP phases, we considered as a “working hypothesis”
that if an organization has integrated AM throughout its PDP, it has attained a high maturity
level. The organization’s PDP phases review helped support the definition of the descriptors.
The definition of the descriptors for each indicator was done starting from level 1, then
determining level 3, and the highest level 6. Then the levels in-between were completed. The
lower levels have more literature to support them, whereas the optimized and innovative
levels are quite unknown in the industry. Studies show that most organizations are currently
in the “TRL” phase; they are studying if the technologies are mature and what they can
accomplish, but not what impact it will have on their organization, how they should adopt
and how they will get more familiar with them (PwC, 2016). We don’t really know what is
going on at high levels since companies using AM extensively do not make their practices
public for competitiveness reasons. This is why we used abductive reasoning to create new
descriptors for high maturity levels.
4) Review model
The maturity model was reviewed twice with one AM expert, who is a university professor in
mechanical engineering and who has been working with AM for 20 years. According to the
initial estimated maturity level, which is low, we excluded factors of the model on themes
that we believe should be addressed to more intermediate or expert users such as recycling
AM parts or intellectual property protection for AM parts.
Table 4.3 presents elements discussed with the AM expert and the organization’s practitioner
during the building, intervention and evaluation stage of the project. Continuous exchanges

62
of information between the practitioner and the researcher on the contents of the model, on
the organization’s requirements and vision/conceptualization of the project solution helped
shape the subsequent versions of the model.
Table 4.3 Negotiation with AM expert and practitioner during BIE (model)
Elements discussed Decision/Conclusion Consequences on model Maturity levels range. Choice of levels should
be based on literature while considering the organization’s low maturity level and innovative aspect of AM.
Add a level 0 and a level 6 to existing recognized models that generally comprise four levels.
Descriptors, how they translate to survey answer choices.
Descriptors to be associated directly to survey answer choices.
Rewrite descriptors in seven distinct rubrics.
How exhaustive the maturity model should be, for example whether the model would include guidelines to progress in maturity within each of the levels (e.g. to progress from initial to occasional: read a particular book).
The model should allow the development of an integration strategy, and act as the foundation of the survey. It is not mandatory that it includes, at that time, instructions and resources as guidelines to progress in maturity.
Emphasis is put on the definition of the descriptors, and organization specific guidelines are provided in the integration strategy and deliverables.
We can then assume that ADR principles 3, 4 and 5, respectively reciprocal shaping,
mutually influential roles, and authentic and concurrent evaluation were respected as
demonstrated above in Table 4.3.
The remaining steps that cover the development of the survey are presented in CHAPTER 5.

63
4.2 Maturity model contents
As previously outlined in the literature review, maturity models are generally used to:
• Describe current strengths and weaknesses;
• Prescribe a methodology for improvement;
• Evaluate practices in comparison with industry best practices and standards.
The model we propose was designed to act as the foundation of an assessment tool to
evaluate an organization’s initial competencies and to guide the integration efforts as a
progression through the model levels.
The progression through the maturity levels is seen as increasing efficiency in the
mobilization of resources or, in other words, in becoming more competent in the use of AM.
It also represents an increase in technical difficulty through the descriptors definition. For
example, producing a safety critical metal part is more complex than manufacturing a
polymer prototype, namely considering the expected mechanical properties and AM
parameters. From the organization’s point of view that wants to gain AM expertise, the
internal resources can refer to:
• AM knowledge that is embodied in the employees’ mind and embedded in the
organization’s practices and documents (high maturity: knowledge is organized, is
available, is shared, is effectively managed, and relevant);
• AM skills: effective use of CAD and topology optimization software, selection of
relevant AM part candidates, design AM cost model (high maturity: proven
cost/weight/time reduction on multiple use cases);
• Attitudes such as innovative mindset, no resistance to change (high maturity: creation
of new practices or tools to fulfill needs, innovative organizational culture).
External resources refer to resources that an organization is less likely to build or heavily
invest in, at least when starting to adopt AM from a low maturity level:
• Tools: buy or lease a 3D scanner, CAD software, topology optimization software;
64
• Information: technology watch, gather information from machine manufacturers,
standards;
• Experts: collaborate with service bureaus for DfAM, organize training sessions.
This section presents the maturity matrix (Table 4.4, Table 4.5 and Table 4.6) for all
indicators and the maturity levels justification for one indicator, the AM uses. The
descriptors for the other indicators (materials and process categories, good practices,
standards, and related technologies) and their justification are found in APPENDIX II.
Through the justifications, we intend to show distinctions between the levels and that the
evolution reflects this definition towards complete maturity (Fraser, Moultrie and Gregory,
2002):
“Maturity implies that the process is well understood, supported by documentation and
training, is consistently applied in projects throughout the organization, and is continually
being monitored and improved by its users.”

65
Table 4.4 Maturity model contents (1/3)
0. Nonexistent
1. Initial
2. Occasional
3. Formalized
4. Controlled
5. Optimized
6. Innovative
AM uses (prototyping, tooling, production parts)
Employees have never heard about AM typical uses.
AM is used occasionally but not integrated in the Product Development Process (PDP). Employees have heard about most AM typical uses.
AM is occasionally used for various applications.
AM is frequently used and parts are designed for particular applications from experience.
Design rules are applied with regards to AM use.
Part geometry, assemblies, CAD files for printing are systematically optimized with regards to specific AM applications.
New applications are developed for AM.
AM materials and process categories
Employees have never heard about AM.
Employees have heard about AM-specific materials and forms (e.g. powder). The same AM process is used, in-house or with service providers.
A few AM process categories are used.
AM materials are regularly used but not with Design for AM (DfAM). Rules from experience are used to select processes.
Parts are designed and potential is exploited for AM materials and forms An existing process category selection tool is used.
New AM materials are characterized to fulfill the organization’s needs. Material selection is systematically optimized for specific applications. Appropriate selection is proven by numerous conclusive case studies.
New AM materials are developed, characterized and used. Methodologies are developed to assist in the selection of an AM process category.

66
Table 4.5 Maturity model contents (2/3)
0.
Nonexistent 1.
Initial 2.
Occasional 3.
Formalized 4.
Controlled 5.
Optimized 6.
Innovative
AM good practices
Employees have never heard about part consolidation, weight reduction potential using AM nor AM limits. No service providers identified (i.e. printing and DfAM services).
Employees have heard about AM opportunities, but do not benefit from it. AM is not totally integrated in the PDP.
Part consolidation and weight reduction techniques are used, but not specifically for AM. AM limits such as build speed and build size are observed. A methodology is used to integrate AM in the PDP.
Part consolidation and weight reduction possibilities from AM are exploited, with an ad hoc method. An integration methodology for AM is created. Organization reaches out to various service providers.
Various tools are used to better benefit from AM (DfAM rules, AM-specific geometries (e.g. lattice, shape complexity)). Engineers and procurement use AM service providers’ directories.
AM is integrated within all the PDP. Various strategies are designed in order to ‘bypass’ AM limits. The organization contributes to AM service providers’ directories.
Employees work at pushing the limits of AM technologies (e.g. develop larger and faster AM machines). Methodologies are developed to detect opportunities such as part consolidation and weight reduction.
AM standards
Employees have never heard about AM standards.
Employees have heard about AM standards, but never read them.
Employees have read major AM standards.
Employees regularly perform a watch on new or updated AM standards.
AM standards are used to test or characterize AM materials.
AM standards are gradually integrated in technical requirements for contracts.
The organization participates in standards committees on AM.
66

67
Table 4.6 Maturity model contents (3/3)
0.
Nonexistent 1.
Initial 2.
Occasional 3.
Formalized 4.
Controlled 5.
Optimized 6.
Innovative
Related techno-logies
CAD software and 3D scanning are not used. Employees have never heard about topology optimization. There is no organized attempt at integration of emerging technologies.
Employees have a basic understanding of CAD file formats characteristics but not of AM-specific file formats. Finite element analysis is used but not topology optimization. The integration of emerging technologies failed in the past.
Topology optimization basic principles are used for traditional manufacturing processes only. AM-specific file generation process is known but not largely used. A 3D scanner is used occasionally, with no particular methodology.
A 3D scanner is used regularly, with no particular methodology. Topology optimization is regularly used for traditional manufacturing processes. An integration methodology exists for emerging technologies and for AM-specific file generation.
Good practices guides are used for related technologies such as CAD files and 3D scanning, but not for AM applications yet.
AM is integrated within all of the PDP. 3D scanning is used in synergy with AM applications. Successful case studies conducted with emerging technologies, including AM. Industrialization of AM is a success. The AM-specific files generation process is optimized. Topology optimization is used for AM applications and design for AM principles are applied.
Needs not met by current topology optimization software are identified and the development of software and file format to improve AM parts results is underway. An organization reaching this level is ahead of competition and uses emerging technologies for new and creative applications.

Model contents - AM uses (prototyping, tooling, production parts)
0 Nonexistent Employees have never heard about AM typical uses.
1 Initial AM is used occasionally but not integrated in the Product Development Process
(PDP). Employees have heard about most AM typical uses.
Justification: To integrate AM in the PDP requires numerous resources, knowledge, skills.
PDP phases and resources to integrate AM need to be identified.
2 Occasional AM is occasionally used for various applications.
Justification: Using AM always in the same manner, or using it in different situations, but
still occasionally.
3 Formalized AM is frequently used and parts are designed for particular applications from
experience.
Justification: Higher frequency of use, AM requires to design parts specifically for the
material, for the AM process and even for the AM machine used, but here it still is based on
designing from personal experience.
4 Controlled Design rules are applied with regards to AM use.
Justification: Applying design rules imply that you know design rules exist. Design rules
refer to DfAM, examples include minimum wall thickness, support structures, and powder
removal design.
68

69
5 Optimized Part geometry, assemblies, CAD files for printing are systematically optimized
with regards to specific AM applications.
Justification: This refers to fully benefit from AM potential by designing parts that exactly
comply to design rules and extending that to assemblies, which are more complex.
Systematically optimizing implies years of experience with AM and we could imagine
applications that are more safety critical here because the resulting part will behave exactly
how it was intended because parts will be accurate and precise.
6 Innovative New applications are developed for AM.
Justification: Using AM to produce parts that do not fit with our current definitions of
prototypes, production parts or tooling parts categories. We might see new business models
appear at this level.
4.3 Maturity model evaluation
The evaluation of the maturity model is conducted using evaluation criteria and the results
from the survey. In the scope of Action Design Research, the contributions of the researcher
are formulated as design principles and include “best practices” regarding the creation of
solutions to the class of problems initially identified as the adoption of AM. The
requirements, or evaluation criteria, of maturity models that we present below are therefore
guidelines on how to build an artifact that addresses this problem.
In addition to presenting the criteria, this sections aims at defining and justifying each
criterion in the case of this particular project. The criteria are classified in three categories:
with regards to the maturity model contents (Table 4.7), use (Table 4.8) and function (Table
4.9).

70
Table 4.7 Criteria regarding maturity model contents
Criteria Definition Criteria justification
Contains constitutive elements
Scale, indicators (application domain), descriptors (define performance)
Multiple levels to describe current and desired levels.
Distinct levels Levels are mutually exclusive and collectively exhaustive, each level presents requirements and metrics, one or two words describing level.
Well defined descriptors can help the formulation of the survey questions.
Accurate Based on the literature. It is deemed necessary to rely on current AM uses, and commercially available AM processes and materials.
Granularity Levels of hierarchy of indicators, example: materials: metals (stainless steel, titanium, copper), polymers, ceramics…)
Identification of strengths and weaknesses and integration efforts to deploy, facilitates comprehension.
Up to date Considers the most recent data from the literature.
AM domain evolves quickly.
Specific Sufficient detail so it can be applied to a particular domain.
Considers AM specific possibilities and limits.
Table 4.8 Criteria regarding the maturity model use
Criteria Definition Criteria justification
Considers the evaluation method
Model is designed and structured according to the evaluation method initially chosen.
Maturity model act as the foundation of the survey.
Comprises a scoring system
Use of the model internally (self-assessment) but also by someone external to the organization (audit).
AM maturity could be evaluated by an external AM expert.

71
Table 4.9 Criteria regarding the maturity model function
Criteria Definition Criteria justification
Usefulness Solves a problem. Observations reveal a need to support the adoption of AM. Results from the maturity model allow the development of an adoption strategy.
Relevance for the industry and for academics.
Model can be used within the industry, in a research context, or in education.
Model has to consider initial and desired maturity level of the stakeholders.
Informative Provides definitions and examples.
Education is necessary before adoption of AM.
The usefulness criterion is in bold because it is the requirement we believe has the most
importance. If it allows the development of an integration strategy and a progression in
maturity, then the project goals will be met. It is then necessary to explain how the criteria
are used to evaluate the maturity model. Table 4.10 and Table 4.11 provide a summary, for
each criterion previously identified, of the methodology that was used during the case study
to evaluate the maturity model, and survey.

72
Table 4.10 Methodology to evaluate maturity model
Criteria Methodology to ensure criteria is met
Contains constitutive elements
Build model based on recognized literature: used guidelines by Hevner, the reference in the field of maturity models to build the model structure.
Distinct levels Build levels based on recognized literature and consider low level of organization and innovative aspect of AM. Five levels of CMMI model (recognized model) + level 0 and level 6 for innovation.
Accurate List the main technical bibliographic references on AM: Wohlers 2014-2015, AM technologies.
Granularity Divide model in sections. Verify that similar maturity levels are obtained for each indicator in survey results (little spread in results).
Up to date Select bibliographic references from literature from past 5 years. Specific Ensure AM specific possibilities and limits are covered. Have an AM
expert review the model contents. Considers the evaluation method
Build the maturity model as questions. Formulate the descriptors to be directly associated to a survey answer choice.
Comprises a scoring system
Ensure that a score can be used after using model.
Usefulness Review the integration strategy with the client (BT) and ensure it is aligned with its needs.
Relevance for the industry and for academics.
Review model with the client and ask if needs are met, and otherwise, revise the model.
Informative Ensure that the model provides definitions: ask testers if they learn on AM when first consulting the model.
Table 4.11 Methodology to evaluate maturity survey
Criteria Methodology to ensure criteria is met
Comprehension Evaluation with five individuals and ask them if they did not understand question(s) and provide their comments.
Time to complete Time the completion of survey by respondents. Adjust number of questions considering the completion time.
Relevance for the industry and for academics.
Review model with client and ask if needs are met, and otherwise, revise the model. Test the model in an academic setting and ask teachers if the survey helps them evaluate the students AM maturity.
The actual evaluation of the maturity model is conducted in CHAPTER 7.

73
4.4 Maturity survey testing and results impact
The maturity survey and the results are presented in the next chapter, but we present in this
section how the survey testing and results influenced the final version of the maturity model.
Table 4.12 Survey impact on maturity model
Survey step Observations Impact on final version of maturity model
Testing Questions such as “list the AM uses you have experience with” increase length of survey and cannot be easily linked to a maturity level. Reducing time to complete survey. No means of verifying how respondents learned about AM.
Revision of the answer choices and remove open-ended questions. Provide sub-questions when respondent answers “I already used this material or AM use.” Add questions to verify if respondent learned from taking survey.
Results Results largely spread out between responses such as: “has never used, but heard about AM” and “uses AM occasionally.” Confirmation that two levels needed to describe someone who has heard about AM, and someone who uses AM occasionally. Almost half the respondents do not know how to select an AM process. More than half of respondents never heard about AM standards.
2 distinct levels: “heard of” and “used occasionally.” An indicator “AM materials and process categories” is created and emphasis is put on the use and creation of a methodology to assist in the selection of an AM process category in the higher levels (controlled, optimized, and innovative). An indicator is dedicated to AM standards.


CHAPTER 5
AM MATURITY SURVEY
5.1 Survey methodology
This section presents the design and testing of the maturity survey, and deployment and
testing of the maturity model through the administration of the survey.
5.1.1 Develop the maturity survey
During the model development, potential survey questions were drafted based on the
descriptor’s definitions. After reviewing the model with an AM expert, it was agreed to
evaluate the organization’s maturity on two main aspects:
1) organizational practices towards innovation in general,
2) AM knowledge and practices.
From the drafted questions, we build the survey directly in Survey Monkey, a web-based
tool. It was chosen as the assessment tool for its ease of distribution through the organization
worldwide divisions, for the low cost of utilization, and the instant availability of results.
The educational purpose of the survey was met by providing a brief topic introduction at the
beginning of each question. Finally, for each question, the potential answer choices were
associated with a maturity level since it was decided that the survey would be single choice
answer to most questions.
The second version was reviewed another time with the same AM expert, and a third and
fourth sections to the survey were added to include the profile of the respondents and to
conclude on the educational goal.

76
The introductory information and questions were further refined in the third version to have a
more precise profile of the respondents’ experience. For example, instead of asking which of
the AM opportunities from a list a user has heard of, specific questions for the main
opportunities were written. Thus, the questions “45. Rate your experience with this AM
opportunity: part consolidation.” and “46. Rate your experience with this AM opportunity:
weight reduction.” replaced “How many of the AM opportunities have you heard of?”.
Further factors were removed in this version such as post-treatment of AM parts and CAD
file management to account for the length of the future survey, with a goal to limit the
number of questions to about 50.
Great attention was put into very distinct definition of the answers so that there would be no
ambiguous answer choices and that the answer choice would be directly associated with a
maturity level. Analyzing results is thus done solely on the association of the level by
counting the occurrences of each answer choice. As an example, we provide one question
from the survey with the answer choices on Figure 5.1:
Figure 5.1 AM process selection survey question

77
To demonstrate the Action Design Research iterative nature, we provide a summary of the
discussions and negotiation with the AM expert and the organization’s practitioner during the
development of the survey in Table 5.1.
Table 5.1 Negotiation with AM expert and practitioner during BIE (survey)
Elements discussed Decision Consequences on survey Need to educate employees on AM technologies, uses and opportunities.
Prepare and give a presentation during a Lunch and Learn activity on AM technologies and the prototyping center capacities.
Identification of potential survey respondents.
Need to educate survey respondents on AM technologies, uses and opportunities.
Provide informative material in the survey.
Add technical information and visuals before each question, this results in a longer survey than initially planned. Add questions to verify if respondent learned from taking survey.
Order of questions.
First ask questions on the organization’s practices and then specific on AM.
Revise the survey numerous times to ensure logical order of questions.
Respondents’ profiles. Ensure to collect information on respondents during completion of survey.
Research potential survey respondents’ profiles (position, experience, location) and ensure they are available as answer choices.
Amount of questions vs completion time.
Completion time established at a maximum of 25 minutes.
Add sub-questions when respondent responds for example “I already used this material.” to get a more precise user profile, and to have non-users skip questions to reduce completion time.
Goals of questions Determine the goal for each survey question.
Some questions removed since no relevant goal could be stated.

78
According to De Bruin et al., assessment tools have to be tested for validity and reliability. In
our case, the face validity of the survey was assessed by seven individuals, five of them
working at the organization, the other two externals; one is a mechanical engineering
university professor on AM (the AM expert) and the last one a mechanical engineer. Their
understanding of the questions and the time to complete the survey were validated. Survey
was reviewed in order to take their comments into account. The content validity sits on a
thorough literature review covering additive manufacturing, advanced manufacturing, and
prototyping.
On the other hand, we did not test the reliability of the survey. Considering the duration of
the project, we did not have time to make sure the survey responses would be accurate and
repeatable with pilot groups.
The final version of the survey includes 55 questions and is divided in three sections:
demographics, the maturity assessment (on organizational practices towards innovation in
general and AM knowledge and practices), and conclusion on the educational purpose of the
survey. The six AM indicators are represented under the “AM knowledge and practices”
section of the survey. The survey contents is provided in APPENDIX IV.
5.1.2 Test the maturity model and deploy survey
The maturity model was tested through the administration of the maturity survey and the
survey results analysis.
The following criteria were used to select survey respondents:
• Their participation to a Lunch & Learn activity in two AME sites;
• Their current work is directly related to AM: industrial design, prototyping,
weight reduction group, production;
• They possess skills that are necessary to use AM effectively: materials expertize,
cost analysis, computer-aided design, for example;
• They had personally shown interest in AM.
79
This includes a bias in the respondent selection. Nevertheless, we believe that since most of
these individuals have already been exposed to AM, they will probably show the highest
knowledge level with regards to AM. Asking more employees would certainly lead to more
representative results, but the maturity level should not be any higher. The product
development process description also provided insights on potential groups of persons as
respondents.
The survey was sent to 142 individuals who were asked to complete the survey within a two
weeks timeframe and the estimated time to complete it was 20 minutes. Further information
can be found on the identification of the respondents in the next section.
The survey is divided in three main sections;
1. Demographic information (questions 1 to 5), section 5.1.3;
2. Maturity assessment, section 5.1.4:
2.1 Organizational practices (questions 6 to 10);
2.2 Additive Manufacturing knowledge and practices (questions 11 to 51);
3. Educational purpose and conclusion (questions 52 to 55), section 5.1.5.
5.1.3 Survey respondents profile
The first section of survey provided information on respondents’ profile. Globally, the survey
was completed by 27 respondents from Americas, 12 from Europe, 3 from Asia and
Australia. Questions three to five asked about years of experience and position as presented
on Figure 5.2.

80
Figure 5.2 Experience and position responses
Nearly half of the respondents (20/42) have over 20 years of experience. The main position
occupied is manager (17/42) and engineer (13/42), the former may have had an engineering
education, but we did not verify. The “position” results might suggest that the respondents’
interests could be more oriented towards the feasibility and performance of AM and how
much it costs to use it rather than CAD file preparation for AM or skills to develop that
would be of interest to technicians or human resources advisors, for example.
It could be interesting to conduct an analysis of the survey responses by profile, i.e. assessing
maturity with regards to years of experience to investigate if recent engineering graduates are
more knowledgeable of AM since the AM enthusiasm is quite recent (Wohlers and Caffrey,
2015) and thus recently included in engineering curriculum, but it hasn’t been done in the
context of this project.

81
5.1.4 Maturity assessment
This section covers the survey results, for sections two and three of the survey, respectively
Organizational practices (questions 6 to 10) and Additive Manufacturing knowledge and
practices (questions 11 to 51). We provide the survey results as graphs by indicator (e.g. AM
uses) that represent multiple questions, for which the results are averaged to provide a global
maturity level. We also provide graphs per individual question. The full survey results,
including the numerical data, are presented in APPENDIX V where we also provide
interpretation of the results for each question.
5.1.4.1 AM uses
Figure 5.3 AM uses maturity results
Figure 5.3 represents the average responses for AM uses (design models, geometrical
prototypes, functional prototypes, technical prototypes, pre-production parts, tooling to
produce series of parts, tooling for test / maintenance / assembly and production parts, spare
parts and repairs) for which the resulting maturity level is 1-Initial (mean: 27, standard
deviation: 3.7). The standard deviation illustrated by error bars indicates how the maturity
results are scattered for the different uses as it is presented in the next figures.

82
When broken down into specific uses, as shown on Figure 5.4 and Figure 5.5, we observe a
slightly higher use (i.e. more responses for the higher maturity levels) of design model and
geometrical prototypes.
Figure 5.4 AM uses: prototypes maturity results
Figure 5.5 AM uses: tooling and parts maturity results

83
5.1.4.2 AM materials and process categories
Figure 5.6 shows results to a question on how the respondent selects an AM process category
for a specific application. Nearly half the respondents (19/42) don’t know how to select a
process, which results in maturity level 0-Nonexistent.
Figure 5.6 AM process selection maturity results
Figure 5.7 represents the averaged responses for AM materials and illustrates that the
maturity level is around 0-Nonexistent and 1-Initial when considering the standard deviation.
The deviation can be observed in the next figures that present levels for each AM material.
Figure 5.7 AM materials maturity results

84
When broken down into specific material categories, as illustrated on Figure 5.8 and Figure
5.9, we observe, among results, higher maturity (levels 1-2) for thermoplastics and for “steel,
aluminum,…”, whereas slightly lower maturity (levels 0-1) is observed for “sand, glass,
ceramic” and wax materials. The material category that is associated to a higher maturity
profile is thermoplastics.
Figure 5.8 AM materials maturity results (1/2)
Figure 5.9 AM materials maturity results (2/2)

85
5.1.4.3 AM good practices
We divide good practices in two sections: BT’s practices towards AM in general
(organizational culture, personal attitude towards emerging technologies, AM integration),
and AM good practices (opportunities, limits, service providers).
Figure 5.10 provides an overview of BT’s practices with regards to AM and emerging
technologies and we observe a large standard deviation. This deviation is explained in the
next figures.
Figure 5.10 BT’s practices maturity results
When we examine the individual maturity results from “BT’s practices”, we observe a
maturity level of 2-Occasional for the organizational culture on Figure 5.11 and a level of 5-
Optimized for the respondents’ position towards emerging technologies on Figure 5.12. This
disparity is discussed in section 7.2.2.

86
Figure 5.11 Organizational culture towards emerging technologies integration maturity results
Figure 5.12 Personal attitude towards emerging technologies maturity results

87
More than half the respondents (27/42) answered that they use a methodology to integrate
AM to BT’s product development process, which is associated to maturity level 2-
Occasional, as shown on Figure 5.13.
Figure 5.13 AM integration at organization maturity results
The second section of the good practices results is on AM good practices as opportunities,
limits, and interaction with service providers. The averaged results indicate maturity between
levels 0 and 1.
Figure 5.14 AM good practices maturity results

88
We can observe on Figure 5.15 the deviation from Figure 5.14 chiefly at level 1 between the
part weight reduction and part consolidation opportunities. A gap is also observed between
the build speed and build size limits and the part weight reduction opportunity.
Figure 5.15 AM opportunities and limits maturity results
Figure 5.16 shows a maturity level between 0-Nonexistent and 1-Initial for the respondents’
experience with AM service providers. They either have not identified any service providers
or they know some providers but haven’t worked with them yet.
Figure 5.16 AM service providers experience maturity results

89
5.1.4.4 AM standards
Figure 5.17 presents the experience with AM standards, for which a maturity level of
0-Nonexistent is associated. It implies that most respondents (29/42) never heard of AM
standards.
Figure 5.17 AM standards maturity results
5.1.4.5 Related technologies
Figure 5.18 shows the averaged maturity results for the related technologies indicator which
comprise AM file generation and processing, topology optimization and 3D scanner use.
Large standard deviation values prevent the conclusion of a maturity level between 0, 1 or 2.
Figure 5.19 details each technology or tool for a more accurate maturity profile.
Figure 5.18 Related technologies maturity results

90
From Figure 5.19, we can conclude that the respondents have more experience in the use of a
3D scanner (level 1-Initial), than topology optimization software (levels 0-1). The responses
on file generation and processing are more spread out through levels 0 to 5.
Figure 5.19 Topology optimization, file generation and 3D scanning maturity results
5.1.5 Survey educational purpose
Along with the maturity assessment goal, the proposed survey also had an educational
purpose. Throughout the questionnaire, before the majority of questions, a short paragraph
introduced the question and provided information. For example, before asking questions on
AM process categories, this introduction is provided:
AM-specific materials are commercially available in filament, powder, liquid or sheet form
and are specific to an AM process category and machine. Some machines are mono-
material, others allow combination of materials. The choice of a material will guide the
choice of a particular AM process category. AM processes can be classified in seven
categories as cited by ASTM:2
2 At the moment the survey was published, ISO had not yet adopted the ASTM standard.

91
• Binder jetting: a liquid bonding agent is selectively deposited to join powder materials (e.g.
3DP, Color Jet Printing)
• Directed energy deposition: focused thermal energy is used to fuse materials by melting as
they are being deposited (e.g. LENS, laser cladding)
• Material extrusion: material is selectively dispensed through a nozzle or orifice (e.g. FDM,
FFF)
• Material jetting: droplets of build material are selectively deposited (e.g. PolyJet)
• Powder bed fusion: thermal energy selectively fuses regions of a powder bed (e.g. Laser
Sintering, SLS, Laser Melting)
• Sheet lamination: sheets of material are bonded to form an object
• Vat photopolymerization: liquid photopolymer in a vat is selectively cured by light-
activated polymerization (e.g. stereolithography, SLA, DLP)
The achievement of this educational objective was verified in the conclusion portion of the
survey. The educational purpose of the survey was met with a majority of respondents
answering positively and having learned mostly on AM process categories as illustrated on
Figure 5.20 (40 respondents out of 42). The survey itself can be seen as a tool to increase the
organization’s maturity level.
Figure 5.20 Educational section results

92
Figure 5.21 shows that the majority of respondents want to learn more about AM and to have
access to a decision tool to support their use of AM.
Figure 5.21 Results on additional support on AM

CHAPTER 6
FINAL EVALUATION OF THE PROJECT ARTIFACT
Following the evaluation of the maturity model using the criteria presented in section 4.3, an
AM integration strategy (the nonscientific portion of the project) based on the model, and
comprising organizational deliverables as: an AM candidates identification guide, a strategic
roadmap and work packages is developed. The integration strategy is therefore seen as a
maturity model acceptance criteria: the model should make the strategy development
possible. We first present the integration strategy scope and then summarize the challenges
encountered during this step as well as how the results from the survey support the
development of the integration strategy. A detailed description of the deliverables and their
contents is presented in Appendix I.
6.1 Scope
BT goals towards the use of AM were discussed with the Research and Technology team and
were defined as:
• Reduce development time;
• Increase Services division offer (spare parts);
• Increase AM maturity;
• Reduce costs.
The strategy scope was thus devised considering these goals.
First of all, every AM technology was considered and the roadmap includes prototypes,
tooling and production parts. Numerous industrial cases studies report on development time
and costs reduction when using AM for prototyping and tooling (Stratasys, 2014), (Wheeler,
2015). Polymer, metallic, ceramic, composite and paper materials were considered.

94
Bombardier Transportation also determined a strategic objective for the next years consisting
in increasing its Services division offer. Nowadays, transport agencies tend to replace their
rolling stock equipment later than before, often 20 years past their prescribed lifetime, which
totals approximately 60 years. Obsolescence issues are common. Projects that aim at quickly
replacing damaged parts in service receive great interest from the upper management. Spare
parts are often very expensive since tooling doesn’t exist anymore and short series are
needed; this results in spare parts being about two to three times more expensive than
original parts. The strategic roadmap and work packages have taken this objective into
account.
The proposed strategy includes the use of emerging technologies, such as 3D scanning, with
AM in the development process as was required by BT. 3D scanning can allow effective
reverse engineering, and for spare parts applications, obtaining a 3D model directly on the
operation site is possible. Manufacturing the scanned part on-site could then be envisioned
and would provide a major time and cost advantages.
The BT internal customers of this strategy have been identified as:
• the mechanical integration team manager,
• the structural integration team manager (these first two groups are in charge of the
vehicle design and finite element analysis),
• the integration and design of mechanical subsystems team manager, also including
tooling design,
• the Prototype Center core team,
• the Bombardier Engineering Systems team manager, responsible of the engineering
processes.
The suggested strategy allows these customers to learn about AM technologies. This strategy,
including the identification guide, the strategic roadmap and the work packages, will guide
the customers for the realization of new case studies on industrial parts. It is designed so that
its users can use it in an autonomous manner. In addition to this strategy, the maturity survey

95
allows any BT employee to learn more about AM even after this academic project ends, as
long as it is updated regularly.
Finally, the proposed strategy has to consider BT’s industry requirements. The choice for the
technologies and materials for production parts was made according to the Fire Smoke
Toxicity (FST) standards that must be met in the transportation industry, a key element for
which other manufacturing sectors are not required to comply to.
6.2 Challenges
The negotiations with the organization’s practitioner during the development of the AM
integration strategy are summarized in Table 6.1. The decisions and consequences highlight
the difficulties encountered during this step as well as how the survey results were used to
devise the integration strategy.

96
Table 6.1 Negotiations with practitioner during integration strategy design
Elements discussed
Decision Consequences
Using AM for prototyping
Using AM to produce functional prototypes first seen as a “game changer” by the practitioner and the researcher, but it was observed that most employees and stakeholders were more interested in production parts or tooling.
Realign the focus of the case studies.
Case studies as part of the integration strategy
At the beginning of the project, case studies were the main deliverables. Decision to replace case studies by maturity model, survey and integration strategy.
The researcher spent four weeks identifying use cases (applications and specific parts). Conclusion was that it is difficult even for someone knowledgeable of additive manufacturing to identify AM candidates that have the potential to respond to the organization’s goals such as reducing weight, development time or costs. However, some of the use cases identified were reused in the work packages and helped support the development of the identification guide.
Identification of AM candidates
Devise a tool to identify AM candidates. The tool should provide examples for the organization’s own production parts. The evaluation criteria and weighting of the criteria have to reflect the organization’s goals (e.g. reduce weight). The evaluation has to be quantified and conducted by someone with little knowledge of AM.
The organization’s examples were identified and evaluated using the guide. Clarifications on the methodology steps to use the guide and modifications of the criteria weights. An automatic scoring system was added and instructions to decide whether a part is an acceptable candidate or not.

97
Table 6.1 Negotiations with practitioner during integration strategy design (continued)
Elements discussed Decision Consequences
Development of the roadmap
Use the survey results to devise the roadmap.
This step took more time than expected since it was deemed necessary to review results for each question to devise the roadmap and justifying why specific use cases, activities or skills to develop has been challenging since there is no material to rely on. In addition, for some of the model indicators (e.g. AM materials, AM uses), the desired maturity level was not 3, but lower or higher considering the organization’s needs.
Choice of work packages
Three major cases categories were selected as work packages on their priority with regards to the organization’s strategic objectives, their representativeness for various AM processes, materials, uses, and skills: WP1: AM adoption and Cost models, WP2: Metal AM use cases, WP3: Polymer AM use cases.
Three work packages are not sufficient to cover every aspect that the organization wanted initially to progress on, but provide an adequate starting point considering the low maturity level.
In view of the integration strategy design process described above, we can conclude that the
maturity model makes the strategy development possible. The usefulness of the maturity
model is further discussed in the next chapter.


CHAPTER 7
DISCUSSION
7.1 Maturity model
We have presented in the literature review four references that state the recommended
elements of a relevant maturity model. This section therefore presents the requirements for
maturity models that are compared to the maturity model we propose on additive
manufacturing. To summarize, we use the evaluation criteria to assess the performance of the
maturity model.
7.1.1 Model development
Becker, Knackstedt and Pöppelbuß state that after the design of the model, the strategy for
the transfer of the model to the customers has to be determined. We conducted this step
earlier in our process, during the review of the statement of work and update of the
organization’s needs, refer to Figure 2.2. The maturity model is made available first through
the maturity matrix in Table 4.4, Table 4.5 and Table 4.6, then through the survey (as answer
choices) in CHAPTER 5 and finally through the nonscientific portion of the project as a
roadmap (as recommendations to progress in maturity) in CHAPTER 6. We also plan on
making the model available to the academic community by means of a paper that is presented
in APPENDIX II.
In their study, De Bruin et al. present a “maintain” phase of development after the model
deployment. To be generalizable, a model should be deployed in external organizations and
thus support diverse domains while being regularly updated. This is especially important for
our model that is about additive manufacturing, a group of technologies that are evolving
extremely fast. This maintenance phase is not included in our study, but the organization, and

100
the AM community at large, would benefit from updating it in the next years through their
use of it and deployment of AM in their practices.
Finally, Fraser, Moultrie and Gregory (2002) report that few references within the literature
conclude on the results from the use of a maturity model. However, it is necessary to prove
their use really leads to improvement within organizations, that it helps them improve their
practices, or to develop their competencies in their domain. We can therefore state that
maturity model published documentation should include extensive testing of the model and
demonstrate how a thorough definition of levels really supports organizations in their
improvement efforts. After the envisioned adoption of AM at BT in the next three years, a
second study should be conducted to reassess the maturity level and thus conclude on the
performance of the maturity model.
7.1.2 Model contents
De Bruin et al. (2005) state that the model should provide distinct stages definition and the
evolution through stages should be coherent.
Our model evolution through stages is logical but the descriptors from a level to another are
not all distinct. We found two instances of indistinct descriptors. First, for the AM materials
and process categories indicator:
• Level 2 occasional: A few AM process categories are used;
• Level 3 formalized: AM materials are regularly used but not with Design for AM
(DfAM). Rules from experience are used to select processes.
The two levels could overlap, they are not mutually exclusive. The same can be observed for
the AM standards indicator:
• Level 4 controlled: AM standards are used to test or characterize AM materials;
• Level 5 optimized: AM standards are gradually integrated in technical requirements
for contracts;
• Level 6 innovative: The organization participates in standards committees on AM.

101
The model should also provide stages (maturity scale) designated with one or two words that
describe each stage well and stage definitions (descriptors) that summarize major
requirements and measures.
Our model stages (scale) are designated with short labels that are reused (or their synonyms)
in some descriptors. For example, for level 2 occasional:
• AM is occasionally used for various applications. A 3D scanner is used occasionally,
with no particular methodology.
A stage-gate method should be preferred to one dimensional linear stages because it provides
a more detailed profile of an organization on multiple areas of interest (e.g. domain, domain
component, domain sub-component (competency area)). Succar (2010) refers to this as
granularity. We did not include granularity levels into our model. Nevertheless, as an
example, the indicator AM uses could easily be divided into three sub-indicators:
prototyping, tooling, and production parts. The AM materials and process categories could be
divided into a materials section and processes section. For example, the materials sub-section
could be divided into metal, polymer and others so that a lower level in metals could provide
insights into specific weaknesses and guide improvements in line with an organization’s
goals. Similarly, the AM processes indicator could be divided in the seven ASTM (American
Society for Testing and Materials) / ISO (International Organization for Standardization)
process categories: binder jetting, directed energy deposition, material extrusion, material
jetting, powder bed fusion, sheet lamination, and vat photopolymerization.
Our model does provide guidance for next steps but it needs to be reflected upon by someone
internal at the company or knowledgeable of the organization’s practices. It could not be
used as an audit tool by external personnel. Most models that were reviewed in the literature
did not propose an assessment tool, except CMMI that does audits. Our model does have the
advantage to propose an assessment tool.
Bach (1994) states that the CMM does not account for innovation in its model. In addition to
being strongly grounded in up-to-date technologies, our model proposes an innovative level

102
to account for AM quick evolution. Accordingly, the model descriptors shall be updated in
the future to account for AM technologies evolution. The descriptors we now associate with
the optimized and innovative maturity levels might be considered common in a few years.
A study by Mellor, Hao, and Zhang (2014) presents AM implementation by strategic,
technological, organizational, operational, and supply chain-related factors. Our maturity
model covers factors from the technological (materials, standards), organizational
(integration of AM in PDP), operational (DfAM) and supply chain (service providers)
factors. The proposed model does not explicitly take strategic factors into account which
constitutes a limit. However, one could argue that if an organization spends time defining
standard processes for a given task (maturity level 4 or 5), it is strategically aligned, implying
that strategic factors are implicit to the model.
Lastly, with regards to the model contents, our model is based on the concept of competency
whereas numerous model reviewed, namely CMMI, EUMMM, Ecodesign Maturity Model
and the Computer Integrated Construction Research Program’s BIM, also based on CMMI,
are rooted in the concept of capability. As noted in the literature review, capability focuses
on process qualification whereas competency considers human interaction. Our model is not
solely focusing on process, but it also considers the human aspect of the adoption of new
technologies, which is a success factor in adoption of advanced manufacturing technologies
(Co, Patuwo and Hu, 1998).

103
7.1.3 Conclusion on the evaluation of the maturity model
This section aims at summarizing the evaluation of the maturity model using the evaluation
criteria that were presented in section 4.3. Details are provided on how each criterion was
met in Table 7.1.
Table 7.1 Evaluation of the maturity model using criteria
Criteria Details for this use case Target met
Contains constitutive elements
Build model based on recognized literature: used guidelines by Hevner, the reference in the field of maturity models to build the model structure.
Yes
Distinct levels Five levels of CMMI model + level 0 and level 6 for innovation.
Yes
Accurate List the main technical bibliographic references on AM: Wohlers 2014-2015, AM technologies.
Yes
Granularity Level of hierarchy of indicators is sufficient for the current level of maturity of the organization. Little deviation within the survey results: trends were observed in maturity for most indicators.
Yes
Up to date Select bibliographic references from literature from past 5 years.
Yes
Specific Sufficient detail so it can be applied to a particular domain. Considers AM specific possibilities and limits.
Yes
Considers the evaluation method
The descriptors were formulated to be directly associated to a survey answer choice
Yes
Comprises a scoring system
A maturity score is not directly obtained from taking the survey, it has to be calculated manually.
No
Usefulness It has been possible to devise an integration strategy from the survey results and the maturity model
Yes
Relevance for the industry and for academics.
Client confirmed that needs were met. A study in an academic setting has not been conducted.
Yes for
industry
Informative Survey provided information on AM, such as on uses, materials, processes.
Yes

104
7.2 Maturity survey
7.2.1 Assessment tool choice
At the beginning of the project, the maturity assessment methods we considered were
interviews, focus groups and electronic survey. It was decided that the assessment method
would be an electronic survey considering the duration of the project, that only one person
was dedicated to the project (the actual Master’s candidate) and the desire to seek the
participation of respondents around the world. Using a survey also increases reproducibility
of the research project: another researcher could administer the survey in the organization
and obtain similar results, as opposed to reproducing a focus group activity or interviews.
In addition to assessing the maturity of the organization with regards to additive
manufacturing, our survey originality resides in its educational purpose. From previous
observations on BT’s sites and when discussing with multiple engineers, it was clear that the
utilization of AM was quite occasional and level of knowledge of AM was low, except for
prototyping applications. Therefore the educational purpose was deemed necessary and a
survey was assumed to be efficient for this purpose. If it had been judged first from
observations that the knowledge level was higher, less efforts would have been put into
providing explanations and pictures of AM technologies and uses.
The chosen web-based tool was Survey Monkey. Since the survey was to be completed on
work hours, it was designed so as to be quick to respond to and some questions were
automatically skipped if the user responded “I never heard of” this element. We preferred to
have more respondents answer the survey than to have a high volume of data from few
respondents. The type of questions were closed questions even if this implies a bias (from the
survey authors) in the respondents' answers, to simplify results analysis and considering time
constraints. Conducting focus groups in the future would allow collecting answers with no
bias from the authors, but from the respondents’ side during the interpretation of the
questions.

105
7.2.2 Survey results discussion
The survey is used to validate the maturity model in the sense that answer choices are
directly related to a maturity level and represent a descriptor from the model. The survey was
tailored for BT and is AM-specific; we are therefore confident that the survey really
measures what it’s intended to measure. For most questions, we observe the same resulting
maturity level, which comforts us in adequate answer choices definition and thus in the
validity of our model.
The response rate was established at 29.6% as 42 individuals out of 142 completed the whole
survey online. Answers from incomplete surveys (6 respondents) were not considered in the
analysis. Maturity assessment was calculated by counting the occurrences for each answer
choice, which is directly related to a maturity level (seven answer choices per question in
most cases). Succar states that the maturity model should provide a maturity scoring system.
For each indicator of our model (e.g. AM uses), which can represent multiple questions, the
occurrences of answers are averaged and associated to a level. It can thus lead to different
maturity levels for each indicator, which is an advantage since it helps point out weaknesses
and strengths, but equal weight is associated with indicators.
Figure 7.1 Maturity level distribution

106
The survey results indicate that the organization is currently at level 1 with 48% of the
answers, the initial level. Seventy-one percent of the answers put the organization at level
0-Nonexistent and 1-Initial as illustrated on Figure 7.1. Our preliminary assumption of low
maturity level is confirmed by this distribution. However, 42 individuals completed the
survey, which definitely doesn’t represent the organization. As previously stated, this is a
first assessment, and the individuals who answered had been identified because they had
participated in AM presentations or their work is or will be impacted by AM. We assumed
that these people would know more about AM than the remaining part of the organization.
We consider this as an optimistic result, in the sense that the maturity level should not be
higher than 1, and starting from that point will ensure most skills and knowledge are acquired
before progressing with more complex applications and use cases. On Figure 7.1, we can
observe the distribution for each of the seven maturity levels.
We can conclude that the levels were correctly defined because a pattern on the maturity
levels can be observed on Figure 7.2 within the different model indicators.
Figure 7.2 Indicators maturity levels pattern

107
As additional examples, patterns are observed on results from specific questions on Figure
7.3:
• Have you heard about 3D scanning? Rate your experience.
• Rate your experience of the following typical use of AM (5/8): Pre-production part.
• Rate your experience of the following AM-specific material category (1/7): stainless
steel, nickel, cobalt-chrome, titanium, copper alloys, aluminum, superalloys.
These three questions represent a more advanced use of technologies, in the sense that we
observe that the combination of 3D scanning with AM does not yet prevail in the industry,
and that the use of AM to produce pre-production parts using metals involves more machine
parameters configuration than using polymers.
Figure 7.3 Levels pattern (1/2)
The three indicators chiefly point to level 1-Initial. Roughly 8 respondents make level
2-Occasional slightly higher for 3D scanning, and this might be explained by the fact that the
use of a 3D scanner is not AM-specific.

108
On Figure 7.4, patterns are observed within these questions:
• Rate your experience of the following typical use of AM (1/8): Design model.
• Rate your experience of the following typical use of AM (2/8): Geometrical prototype.
• Rate your experience of the following AM-specific material category (3/7):
thermoplastics polymers.
Thermoplastics are usually the materials used to produce design models and geometrical
prototypes, which could explain why we observe a pattern in the maturity levels for these
three questions.
Figure 7.4 Levels pattern (2/2)
The pattern in Figure 7.4 is slightly different from that shown in Figure 7.3; levels are more
spread out between 1 and 2 with a few respondents having more experience with geometrical
prototypes and design models than with thermoplastics at level 5-Optimized. As mentioned
in the preliminary maturity level assessment in section 3.1.1.1, two BT divisions have been
working with binder jetting (plaster-based material) technology for 10 years to make

109
prototypes that could explain the slightly higher maturity with prototypes than with
thermoplastics.
On the other hand, we observe a complete opposition in the resulting levels from answers to
the following questions:
• How would you rate BT's culture towards the integration of emerging technologies?
• What is your position towards the integration of new technologies?
In this case, it doesn’t necessarily reflect inadequate association of answer choices and levels,
but that there are probably obstacles to new technologies adoption in the organization.
Figure 7.5 Organizational culture vs personal attitude
Maturity levels results should not be concluded and acted upon without the organizational
context in mind. The interpretation of results is important, for example regarding the low
level of topology optimization skills. It seems there are few topology optimization experts in
the organization, but improving in maturity does not mean having a large number of experts.

110
The adequate ratio of AM topology optimization experts should be determined. A thorough
knowledge of AM and tools is required to analyze the results appropriately.
7.3 Implementation strategy
This chapter aimed at demonstrating that the maturity model and the resulting maturity level
cannot be used directly to improve maturity level. Someone knowledgeable of the
organization and of additive manufacturing must ponder on the maturity survey results to
elaborate robust recommendations to achieve a higher maturity level. Even though it cannot
be used directly to improve maturity, the maturity model and maturity survey structure
(organizational practices, AM knowledge and practices, educational section) were
instrumental to the maturity assessment and development of the AM integration strategy
organizational deliverables. It could still be helpful to an AM novice or someone that has less
experience within the organization.

CHAPTER 8
FORMALIZATION OF LEARNING
This chapter is presented according to Action Design Research final stage on the
formalization of learning. We first present the difficulties encountered during the project as
lessons that other researchers could benefit from in the development of a maturity model in
an organizational setting. The outcomes of the project are then expressed as design principles
and we discuss the generalization of the solution for other organizations and other
technologies than additive manufacturing.
8.1 Difficulties encountered and lessons learned
The first challenge has been to identify a maturity assessment method that would give an
accurate profile of the organization, while asking a minimal number of persons to participate,
knowing that only a limited amount of resources would be available to complete the survey.
Since the participation to the case study is not part of the respondent’s tasks, the time to
complete the survey has to be limited to a maximum of 25 minutes.
In addition, identifying and reaching out to the right individuals to provide information on
their current use and knowledge of AM for the preliminary maturity assessment and to
respond to the survey has been time consuming. It was decided to have individuals from
diverse divisions of the organization and sites (around the world) respond to the survey.
Then, with regards to maturity models, the first challenge for the researcher was to learn
about what a maturity model is, how it should be used, and how to design one since she had
no prior knowledge on maturity models. It was also the first time the researcher built,
administered and analyzed the results from a survey. The evaluation of the model was a great
source of questioning for the researcher. The elaboration and justification of the evaluation
criteria, as well as defining how we can ensure that the criteria are met was a great challenge.

112
Then, framing the research in the right methodology has been demanding. Once again, the
researcher had no prior knowledge of Action Design Research. Actually, the project was first
framed on the Design Research and Action Research methods. With regards to ADR and its
iterative nature, during the building, intervention and evaluation (BIE) stage, the
understanding of the problem changed: the problem was initially construed as not having
conducted any case study but was later seen as not knowing which one to start with as part of
the integration strategy.
Concerning the organizational context, the company is evolving within a very conservative
domain, the rail industry, so the adoption of emerging (to this domain) technologies is not an
easy feat. Stakeholders have to be convinced of the potential of the technologies. Some
survey respondents wrote that they did not believe in AM potential and that they see it only
as a gadget. Since there are very few business cases available, and on other than rail industry
cases, it was quite challenging to convince employees to get involved. Most employees were
interested in the spectacular applications seen on internet such as large metal topology
optimized structures with high weight reduction results. The organization is also
continuously evolving, and changing. For example, the organization's product development
process (PDP) was being reworked during the project so the researcher had to use the latest
version available but to keep in mind that it would change.
Finally, the researcher had to learn about additive manufacturing technologies since her
knowledge of these technologies was limited to brief technology watch.
If we think about how the project could have been done outside the organization, we can say
that the model could have been developed as an external consultant, but the data collection
on the organization and its PDP as well as the survey's administration would not have
resulted in as great results as those obtained.
Considering that the initial maturity level of the organization was low, having the industry
supervisor actively promoting AM and this research project within the organization was
tremendously helpful. To experience success in an AM integration initiative, an organization
113
needs to get involved with numerous participants and conduct regularly report on its
progress.
8.2 Design principles
As expressed by Sein et al. (2011), the last step of the Action Design Research method
implies the connection of “generalized outcomes, in the form of design principles, to a class
of solutions and a class of problems”. These principles can be seen as guidelines for the
design of other artifacts that are part of the same class of systems, which in this case, are
maturity models. As previously stated, the class of problems that this project aims at is the
integration of AM within an organization’s product development process. The class of
solutions is therefore defined as instructions on the use of the model to facilitate this
integration.
In the case of this project, the maturity model and survey could be generalized over two
dimensions, from specific solutions to generic solutions:
• From a specific (Bombardier Transportation) to a generic solution (other
organizations);
• From a specific (additive manufacturing) to a generic solution (other technologies).
The Table 8.1 presents design principles derived from the criteria used to evaluate our model
and how they could be used to create new maturity models for other organizations. The Table
8.2 is presented in a similar manner to generalize the model from an additive manufacturing
specific maturity model to a maturity model for other types of technologies.

114
Table 8.1 Design principles for organizations
Design principles Generalization comments Contains constitutive elements Adapt terminology in descriptors. Distinct levels and granularity Adapt terminology to preliminary observed maturity level.
Depending on the organization’s business and initial maturity, some indicators hierarchy (granularity) may be more detailed than for this project.
Accurate, specific and up-to-date
Refer to AM literature specific to the organization’s business (AM uses, materials and processes of interest).
Considers the evaluation method and comprises a scoring system
Model is designed according to chosen evaluation method (survey, focus groups, and interviews).
Usefulness and relevance for the industry and for academics
Define the organization’s needs well first and ensure the model is adapted to the industry practices, evaluate if an educational purpose is needed.
Table 8.2 Design principles for technologies
Design principles Generalization comments Contains constitutive elements Adapt descriptors and indicators terminology to other
technologies. Distinct levels and granularity Adapt levels terminology to preliminary observed maturity
level for the technology to adopt. Innovative level might not be as important as for AM for example.
Accurate, specific and up-to-date
A literature review is necessary to establish the grounds of the model.
Considers the evaluation method and comprises a scoring system
Another method than a survey may be suitable, for example focus groups or interviews if the maturity evaluation is intended to gather specific details on the use of the technology.
Usefulness and relevance for the industry and for academics
Consult experts on this technology within the organization to get insights on the barriers to adoption.

CONCLUSION AND RECOMMENDATIONS
This project aimed at answering how a maturity model can be developed to support
Bombardier Transportation (BT) in its integration of additive manufacturing (AM) to its
product development process. The project objective was to develop a maturity model that can
support effective adoption of these technologies. On the one hand, the scientific portion of
the project comprised the development of a multiple component artifact to evaluate the
maturity of the organization (model and survey). On the other hand, out of the scientific
scope of the project, the AM implementation strategy is embodied by three deliverables
(identification guide, strategic roadmap and work packages), that were proposed to the
organization.
The maturity survey allowed the evaluation of maturity towards AM of a small group within
BT in November 2015. The results provided a basis for the roadmap, embodied as a proposal
of strategic and tactical framework for AM adoption for 2017-2019.
As observed in our literature review, very few papers report on the integration methodologies
of advanced technologies, such as AM, in the product development process of a company.
Our research provides a unique methodology to first evaluate an organization’s maturity level
(initial skills, knowledge profile and attitudes) with regards to AM, and propose an
integration framework and educational tools considering the resulting maturity level. We thus
propose a descriptive, definitional, and prescriptive tool, the model for AM adoption, which
is a novel contribution that could both benefit the organization and academia.
The foundation of our maturity model is unique as it is defined by AM uses and the
organization’s product development process phases as well as based on an explicit definition
of competency. Our novel contribution is also demonstrated by designing the model with a
seventh level, innovative level. The models reviewed have between four and six maturity
levels. Our model considers that the AM industry is in constant progression and that

116
companies that have a competitive advantage continuously innovate by developing tools,
materials, and machines to suit their industry and that a seventh level represents this reality.
With regards to the application domain, the rail industry, this study is quite unique,
considering that AM studies generally focus on the medical or aerospace industries.
Our research methodological foundations were based on Action Design Research, a research
method that has the objective to help people find solutions to their problems by creating
artifacts and learn from this intervention in an organizational context. The problem was
exemplified as how can Bombardier Transportation better benefit from AM.
The organization clearly stated at the beginning of the project that the deliverables (the
nonscientific portion of the project) would need to be used autonomously by any of the
organization’s divisions. The identification guide, the strategic roadmap, and work packages,
are simple, concise, and their use was tested for understanding, so it should be easily used
with no additional explanations.
The project artifact and deliverables were presented, except confidential elements, to three
conferences (Advanced Manufacturing Canada, ÉTS Graduate Studies Event, and Réseau
Québec-3D Annual Conference), and four companies showed their interest in the maturity
model and would like to conduct the same initiative to accelerate their adoption of AM. This
shows that there is a need for companies to have support in their adoption, and justification
of the use of AM within their industry.
The main limits of this project are related to the maturity model and survey contents. The
model main limit is that it cannot be directly used to adopt AM. It does provide guidance for
next steps but it needs to be reflected upon by someone knowledgeable of the organization
practices to identify use cases, for example. The model only provides a level of granularity
(sub-components within the maturity levels) that considers the initial maturity level of BT,
which is low. In order to provide insights into specific weaknesses and guide improvements
in line with the organization’s goals, granularity should be included in the future versions of

117
the model. In addition to focus groups, the Delphi technique, for which experts answer
multiple rounds of questionnaires and a facilitator summarizes results at each round, could be
used to adequately describe the sub-component layer of the model. As the use of AM
becomes more common within the industry, the model should be upgraded so as to consider
more advanced skills and tools. It should introduce AM topics that can be used to design
potential additional questions (e.g. recycling of AM material, AM supports design, etc.).
Finally, we provide recommendations with regards to three elements, namely the
methodology, the maturity model, and the organization’s next steps.
First, the proposed case studies from the roadmap and work packages should be conducted,
and the maturity level reassessed after realization of these cases. Then, a validation on
whether a higher level of maturity is reached or not could be conducted. It could be
interesting to conduct an analysis of the survey responses by profile, i.e. assessing maturity
with regards to respondents’ years of experience to investigate if recent engineering
graduates are more knowledgeable of AM since the AM enthusiasm is quite recent and thus
recently included in engineering curriculum.
We also recommend testing the reliability of the survey with pilot groups to ensure the
answers are accurate and repeatable within the groups.
We briefly discussed the relevance of the maturity model for the academic domain. The
model could be used in education, for example, by teachers that would like to evaluate their
students’ level of knowledge and experience with additive manufacturing technologies at the
beginning and at the end of the semester.
Furthermore, in addition to pursuing the adoption of AM using the roadmap and work
packages, the organization should develop a decision tool to support its users. The last
section of the survey asked respondents if they wanted to learn more about AM and if they
would like to have access to a decision tool and they answered positively.


APPENDIX I
DELIVERABLES
Artifact: identification guide
The preliminary maturity assessment was confirmed by the survey as 1-Initial. Considering
this low maturity level and thus educational needs in the adoption of AM, an identification
guide was developed. The literature review was completed to summarize the recommended
methodologies to identify parts candidates and part selection criteria. A section from the
identification guide matrix is presented on Figure-A I-1 to show the structure of the
document, and the following figures (I-1 to I-6) illustrate its main constituents. A candidate
parts selection workflow (Figures I-1(A) and I-2) was written, including the profile of
stakeholders that should be involved in an identification activity. A matrix (as an Excel
spreadsheet (Figure I-1(D))) was built based on Lindemann et al.’s work comprising
decision-making criteria, criteria weight, criteria definition (Figure I-1(C)), literature
examples (Figure I-5) and BT examples. The weighting criteria is based on the maturity level
of the organization and its priorities such as part weight reduction. For instance, part weight
reduction has a weight of 20 compared to lead time reduction with a weight of 10.
Decision-making criteria include:
• AM material availability,
• weight reduction potential using AM (low: 1-10%, moderate:11-24%, high: 25%+),
• development time reduction potential using AM,
• functional integration potential using AM,
• lead time reduction potential using AM (advantageous for spare parts),
• cost reduction potential using AM.
The matrix was filled with drop-down menus so the user can choose whether his or her part
has a low, moderate, or high potential for a specific criteria. The AM potential is associated
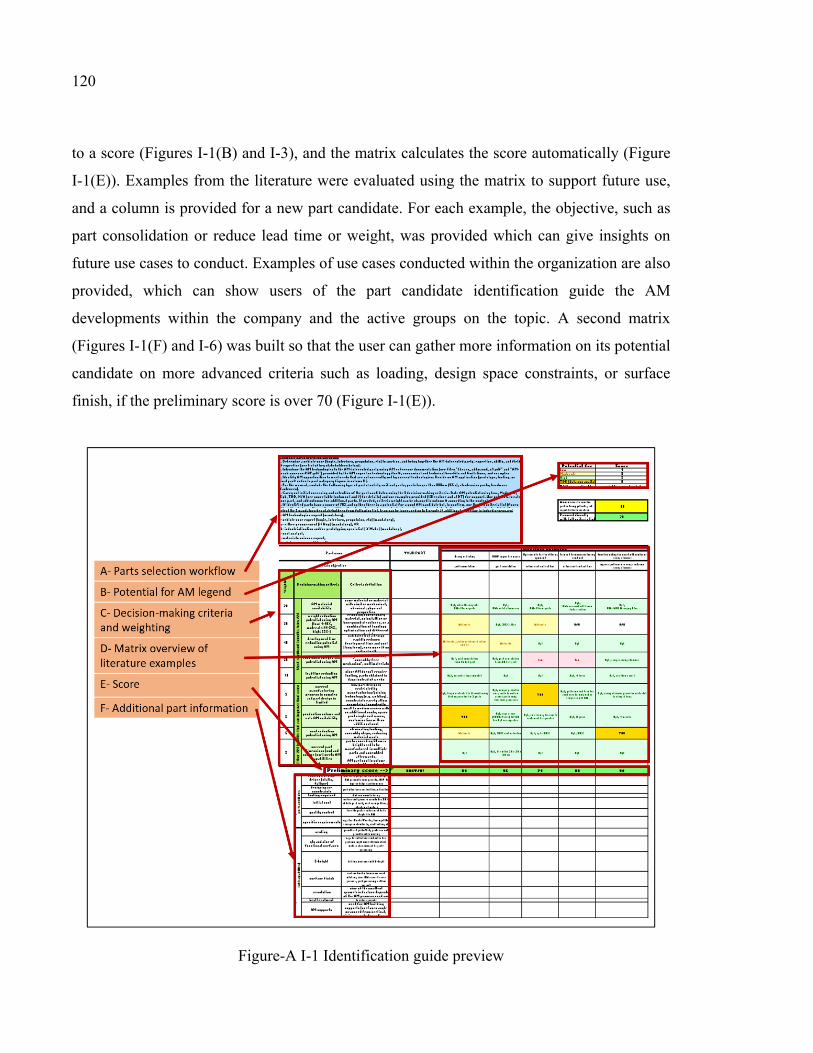
120
to a score (Figures I-1(B) and I-3), and the matrix calculates the score automatically (Figure
I-1(E)). Examples from the literature were evaluated using the matrix to support future use,
and a column is provided for a new part candidate. For each example, the objective, such as
part consolidation or reduce lead time or weight, was provided which can give insights on
future use cases to conduct. Examples of use cases conducted within the organization are also
provided, which can show users of the part candidate identification guide the AM
developments within the company and the active groups on the topic. A second matrix
(Figures I-1(F) and I-6) was built so that the user can gather more information on its potential
candidate on more advanced criteria such as loading, design space constraints, or surface
finish, if the preliminary score is over 70 (Figure I-1(E)).
Figure-A I-1 Identification guide preview

121
Figure-A I-2 Parts selection workflow (A)
Figure-A I-3 Potential for AM legend (B)
Select the 3 mandatory key stakeholders from following list, team can be increased up to 6 people if additional expertise is judged necessary:1- AM technologies expert (mandatory),2- vehicle zone expert (mandatory),3a- either procurement (if Buy) (mandatory), OR3b- industrialisation and/or prototyping specialist (if Make) (mandatory),4- cost analyst,5- materials science expert,6-maintenance expert if applies.
Candidate parts selection workflow 1. Determine a vehicle zone to work on, and bring together the AM-interested party: expertise, skills, and field of expertise (see list of key stakeholders below).2. Introduce the AM technologies to the AM-interested party using AM reference documentation provided by the AM expert on technology itself, economical and technical benefits and limitations, and examples.3. Identify AM opportunities to meet needs that are not currently met by current technologies. Decide on AM application (prototype, tooling, or final part: refer to part category figure in column K).4. For the moment, exclude the following type of parts: safety-critical parts, parts larger than 800mm (32in), electronics parts, hardware (fasteners).5. Carry out initial screening and selection of the part candidates using the 9 decision-making criteria. Rate AM potential using Low, Moderate, High, TBD, N/A (see score table (columns I and J) for details) and use examples provided (literature and at BT) for support. Use column E to rate your part, and add columns for additional parts. If needed, criteria weight can be changed in column A according to the context.6. If identified parts have a score of 70% and up then there is a potential for a good AM candidate but, to confirm, use the full criteria list (Annex 1) to gather information on the part (functional requirements, manufacturing cycle requirements including post-processing) and validate its potential for AM (AM capabilities).7. Make a final choice on part candidates from overall information collected in the two previous steps (steps 4 and 5).8. Proceed to the AM-oriented design of the best-rated part(s) to fulfill functional, post-processing and certification requirements.

122
Figure-A I-4 Decision-making criteria and weighting (C)
Wei
ghtin
g
Criteria definition
20 AM material availability same material or material with similar
mechanical, chemical, physical properties
20weight reduction potential using AM (low: 1-10%, moderate:11-24%, high:
25%+)
removing unnecessary material, using lattice or honeycomb structures, or a combination of topology optimisation
and different material
10development time reduction potential
using AM
validate/test a design rapidly reduces development time and cost (long
term), even more if on critical path
20functional integration potential using
AMe.g. part consolidation, ''assembly-free mechanism'', multimaterials
10lead time reduction potential using
AM
since AM doesn't require tooling, parts obtained in days instead of
weeks
5current manufacturing process is complex and part design is limited
how part design is restricted by manufacturing/joining technology
(e.g. welding), constraints rarely allow geometrical complexity
5production volume and rate AM
suitability
small to medium series with no additional costs, spare part single unit
cases, customization with no additional cost
5 cost reduction potential using AMeliminating tooling, assembly steps,
reducing material waste
5current part dimensions (cm) and
volume (cm³) meets AM capabilities
parts exceeding 50 cm in height need to be manufactured in multiple parts
and assembled afterwards,AM part cost is volume dependent
(quantity of material to bind/fuse/extrude) and not only size
dependent
Decision-making criteria
Mos
t sig
nific
ant b
enef
its fr
om A
MO
ther
AM
ben
efits
that
can
impr
ove
final
scor
e

123
Figure-A I-5 Matrix overview of literature examples and score (D-E)
Part name air ducting engine fuel nozzleassembly tool for
lettering alignmenttransmission
housing sand mold
Injection molding tool insert with conformal cooling
channels
Main objective part consolidation part consolidationreduce cost and
lead timereduce cost and
lead timeimprove performance using conformal cooling channels
AM material availability High, initial:
thermoplasticAM: thermoplastic
High, AM: cobalt chrome alloy
High, AM: thermoplastic
High,AM: silica sand with furan binder system
High,AM: MS1 Maraging Steel
weight reduction potential using AM (low: 1-10%,
moderate:11-24%, high: 25%+)
Moderate High, 25% lighter Moderate N/A N/A
development time reduction potential using
AM
Moderate, quicker validation of airflow and
fitModerate High High High
functional integration potential using AM
High, part consolidationfrom 16 to 1 part
High, part consolidation from 20 to 1 part
Low Low High, complex cooling channels
lead time reduction potential using AM
High, assembly steps eliminated
High High High, 4 hours High, less than a week
current manufacturing process is complex and
part design is limited
High, design restricted by thermoforming that
requires duct in 3 parts
High, complex geometry only possible to make in
several parts using traditional processes
TBD
High, patterns and tools for sand core
forming not as complex as with
AM
High, cooling channels geometry restricted by
straight drilling
production volume and rate AM suitability
TBDHigh, large volume
(1000+/year) but GE has High level expertise
High, small volume, tool can be customized to
operator
High, 5 pieces High, 4 inserts
cost reduction potential using AM Moderate High, 30% cost reduction High, up to 90% High, 50% TBD
current part dimensions (cm) and volume (cm³) meets AM capabilities
HighHigh, fits within 25 x 25 x
25 cm High High High
Preliminary score --> 81 96 71 80 94
Literature examples
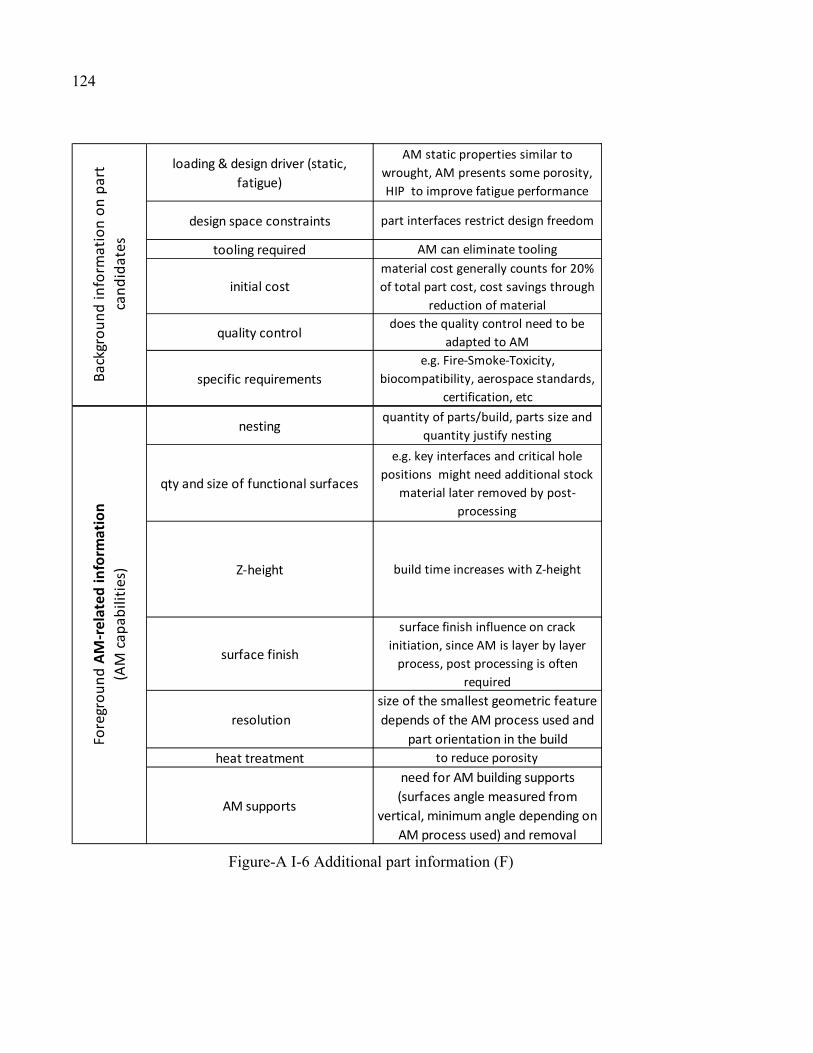
124
Figure-A I-6 Additional part information (F)
loading & design driver (static, fatigue)
AM static properties similar to wrought, AM presents some porosity, HIP to improve fatigue performance
design space constraints part interfaces restrict design freedom
tooling required AM can eliminate tooling
initial costmaterial cost generally counts for 20% of total part cost, cost savings through
reduction of material
quality controldoes the quality control need to be
adapted to AM
specific requirementse.g. Fire-Smoke-Toxicity,
biocompatibility, aerospace standards, certification, etc
nestingquantity of parts/build, parts size and
quantity justify nesting
qty and size of functional surfaces
e.g. key interfaces and critical hole positions might need additional stock
material later removed by post-processing
Z-height build time increases with Z-height
surface finish
surface finish influence on crack initiation, since AM is layer by layer
process, post processing is often required
resolutionsize of the smallest geometric feature depends of the AM process used and
part orientation in the buildheat treatment to reduce porosity
AM supports
need for AM building supports (surfaces angle measured from
vertical, minimum angle depending on AM process used) and removal
Back
grou
nd in
form
atio
n on
par
t ca
ndid
ates
Fore
grou
nd A
M-r
elat
ed in
form
atio
n(A
M c
apab
ilitie
s)

125
The identification guide was reviewed by two engineers at BT and one professor from ÉTS
(the AM expert previously presented). Multiple improvements were made such as
clarifications on the methodology steps to use the guide, modifications of the weights, and
adding objectives for each showcased example.
Artifact: roadmap
The strategic roadmap is the artifact that provides planning for the years 2017 to 2019 as use
cases, skills and knowledge. Considering the current maturity level 1-Initial, and after
discussing with BT’s Research & Technology manager, we decided that aiming for level
3-Formalized for most indicators within the next 3 years is possible. Figure-A I-7 illustrates
an overview of the part types that were covered up to 2016 and what we plan for 2017-2019.
The document is adapted to protect confidential information.
The product development process (PDP) was an important input, along with the maturity
model, for the roadmap realization. First, through this review of the PDP, the identification of
the groups of individuals who would be impacted by the use of AM was done. They would
be impacted in two cases:
• Their current work is directly related to AM: industrial design, prototyping, weight
reduction group, production;
• They possess skills that are necessary to use AM effectively: materials expertize, cost
analysis, Computer-Aided Design, for example.
In addition, the characterization of the PDP provided insights for the identification of the use
cases and their stakeholders presented in the roadmap and work packages, and even skills to
develop for effective use of AM, which are also included in the roadmap.
The review of the PDP documents allowed the identification of the critical path in the
projects realization. AM could be a facilitator in reducing the duration of activities on the
critical path, or the duration of activities that are prerequisites of critical activities. In the
future, with an increase in the use of AM, the organization’s documentation on its practices
and processes should be modified to support AM adoption.

126
Figure-A I-7 Roadmap overview by part types
88

The maturity model was used to plan how to progress from level 1 to level 3 with regards to
the model indicators: AM uses, AM materials and process categories, AM good practices,
AM standards and related technologies. For some of the indicators, the desired level was not
3, but lower or higher considering the organization’s needs. For example, the use of paper or
wax materials was deemed of low importance for the current applications of the organization,
so the level 2 is the objective while a level 4 is the aim for the weight reduction
opportunities.
The strategic roadmap is presented in three formats as shown on Figure-A I-8.
Figure-A I-8 Strategic roadmap formats
These three documents contents are covered in this section. First, the Excel matrix was built
by using each question from the survey and the resulting maturity level, as the basis for the
recommendations. The matrix column titles are:
• survey question,
• 2016 maturity level,
• desired maturity level in 2019,
• recommendations of use cases and activities,
• priority,
• owner or stakeholder,
• prerequisite(s).

128
The matrix rows present each question from the survey, as illustrated in a non-
confidential extract from the roadmap on Table-A I-1.
Table-A I-1 Roadmap structure
As a recommendation example, for the survey question 22. Rate your experience of
the following typical use of AM (6/8): Tooling to produce series of parts., the most
popular answer was: Heard but never used. This answer matches level 1, and the
desired level is 3. The answer that matches level 3 is Formalized: frequent use of AM
and try to design part for this particular application from experience. We therefore
conclude that simple, low criticality, and industry proven use cases need to be
conducted, while requiring minimal part redesign. From observations of quality issues
with castings we thus suggest a use case on AM tooling as sandcasting molds and
cores.
A total of 25 use cases and 22 activities were identified and listed in APPENDIX V.
Examples of use cases include AM sandcasting molds and cores for carbon steel
castings pre-production for faster castings validation and AM hydrosoluble core and
mold for composite layup. An important recommended activity is to develop a rail-
specific business model that considers the organization’s priorities as part weight
reduction and reduction in product development time.
Survey questionCurrent maturity
level
2019 maturity level
Recommendations Priority Stakeholder Prerequisite
1.7
Rate your level of knowledge of the following typical use of AM (6/8):
Tooling to produce series of
parts
1: Heard but never
used.
3: Formalized: frequent use of AM and try to design part for this particular
application from
experience.
1.7.1 sandcasting molds and cores for steel castings
pre-production or prototyping for faster castings
validation
must-do ... ...

129
Each element of the roadmap was reviewed with the R&T manager to ensure the result
would fulfill the organization’s needs.
The use of AM to fabricate prototypes was presented several times in this project as a major
use, requiring low organizational maturity. Nevertheless, after having read recent (April
2016) BT documents on the use of various prototypes types, it was decided not to prioritize
prototyping use cases in the 2017-2019 planning. This information was not available when
the survey was first administered (November 2015).
In addition to using the maturity model and lists of types of parts, the following elements
provide insights to identify potential candidates for AM use cases:
• Technical revisions requests, change requests documents;
• Problems identified during design or engineering reviews;
• Interference problems when designing;
• Most expensive parts;
• Longest lead time parts;
• Parts with reliability issues in operation.
Second, the roadmap was developed into a Microsoft Project file as a planning tool to
efficiently determine the duration of the activities and identify the predecessors. The use
cases and activities from the Excel document were transferred to the Project document. This
document helps visualise the duration and predecessors for each use case. It also provides
information on the resources required for each use case. Duration of use cases was generally
estimated between 90 and 120 days. Predecessors are identified using the priority section
from the roadmap. Third, a summary of the roadmap was designed in a PowerPoint file to be
used as a concise presentation to the organization as shown in Erreur ! Source du renvoi
introuvable.. This is a visual tool that presents a short label for each planned use case and
activity and resource in 2017 to 2019, and in a detailed manner for quarters of 2017. The
2017 portion is the basis of the work packages, the last artifact of the project.
The roadmap should be updated as soon as the use cases are conducted to reflect progression,
and in 2019 a second maturity assessment with an updated survey should be conducted.

130
Figure-A I-9 Roadmap summary

131
Artifact: work packages
The work packages (WP) represent a list and exhaustive description of selected
recommended use cases for the first year of official adoption of AM at BT. Three major
cases categories were selected on their priority, their representativeness for various AM
processes, materials, uses, and skills:
• WP1: AM adoption and Cost models,
• WP2: Metal AM use cases,
• WP3: Polymer AM use cases.
From the previously designed roadmap, the WP goal, priority, context and owner were used
as the basis of the WP. Then a detailed task description with associated budget and resources
was written. The input to the WP and relation to other WP, the deliverables, the reference
documents and external partners list are provided for each WP. A justification of how these
WP build on each other and are related is provided.
Each WP can be used directly by its owner with no additional instructions, it could be used
independently in another BT division or region. It thus meets the objective established in the
project scope to be exhaustive so that its users can use it in an autonomous manner.
The first work package is provided as an example in APPENDIX VI. A total of three work
packages were devised on the three categories mentioned previously.

APPENDIX II
PAPER PROPOSAL This is a first version of the paper and it will be further reviewed before submitting it to a journal. Some differences can be observed with the main body of the thesis since this paper proposal was written earlier during the project. Maturity model for efficient additive manufacturing integration in organizations Stéphanie Lamontagne, Sylvie Doré* Department of Mechanical Engineering, École de technologie supérieure, Montréal, Canada *Corresponding author : 1100, rue Notre-Dame Ouest, Montréal (Québec) H3C 1K3, Tel.: +1-514 396-8800, ext. 8965. Email address: [email protected] Efficient management of Advanced Manufacturing is complex, but necessary for organizations to stay competitive in today's globalized world. It is even more complicated for organizations to adopt advanced manufacturing (AdvM) technologies such as additive manufacturing (AddM) when there is no methodology or tool available to support them. The goal of this study is to develop a maturity model to help organizations integrate AddM into their product development process. The model is based on the concept of competency and is presented as a matrix where the rows are based on AddM decision factors and embody the internal and external resources to be mobilized. The columns of the matrix represent seven different stages of deployment and of technical difficulty, reflecting an increased efficiency in resource mobilization. The results from our maturity assessment tool, a survey, provide straightforward roadmap indications to progress towards AddM adoption. This paper presents a literature review on maturity models and adoption of technologies, the methodology used to develop the maturity model and survey and the survey results for a multinational organization. Patterns observed in the respondent’s answers indicate adequate modelling of the levels, and reuse for other organizations is possible with terminology adaptation. Keywords: additive manufacturing; maturity model; maturity assessment; technology adoption; organizational maturity; resource mobilization 1. Introduction
Manufacturing has become increasingly complex and competitive in today’s world. Efficient management of manufacturing is a challenge for all organizations that may feel confused in this fast paced, connected and continuously more demanding market, sometimes referred to as the fourth industrial revolution or Industry 4.0 (Kagermann et al., 2013). Organizations have to adopt advanced manufacturing technologies and management methods to stay competitive in this globalized world, considering the major investments required.

134
According to the American President’s Council of Advisors on Science and Technology in their 2011 report, AdvM technologies can be defined as:
a family of activities that (a) depend on the use and coordination of information, automation, computation, software, sensing, and networking, and/or (b) make use of cutting edge materials and emerging capabilities enabled by the physical and biological sciences, for example nanotechnology, chemistry, and biology. This involves both new ways to manufacture existing products, and especially the manufacture of new products emerging from new advanced technologies.
Examples of AdvM technologies include CAD (computer-aided design), flexible machining centers, and robotics(OECD, 2013). Additive manufacturing (AddM) defined as ‘a process of joining materials to make objects from 3D model data, usually layer upon layer, as opposed to subtractive manufacturing methodologies’ by ASTM (2012b), should be considered as an advanced manufacturing technology since it encompasses the use of emerging materials and technologies supported by computer-controlled systems for products that would be otherwise too costly or even impossible to bring to market, or is helpful in reducing lead time, costs, or weight.
Even though AddM exists since 25 years, the enthusiasm is recent. According to the Wohlers’ Report 2015 (Wohlers and Caffrey, 2015) which reports annually on the growth of the industry, the AddM systems and materials sales grew by 44.5% in 2013, while AddM services revenues increased by 26.3%. Globally, the AddM products and services market almost tripled in the past four years. On the one hand, profuse information is available as technology watch resources (3D Printing Industry, 2015), and brief case studies (Concept Laser, 2009; EOS GmbH, 2013; Stratasys, 2014) that can encourage companies to jump into AddM. On the other hand, companies can be hesitant to adopt AddM for different reasons, one of which being the profusion of different machines, vendors, materials, service bureaus, etc. The American Society for Testing and Materials (ASTM) proposes to classify AddM in seven process categories: binder jetting, directed energy deposition, material extrusion, material jetting, vat photopolymerization, powder bed fusion, and sheet lamination, each category based on a different physical shaping principle, offering a range of materials but in a single form(ASTM, 2012b). We can observe that small and large companies find the adoption of AddM complex due to the yearly developments of these machines and materials (within each of the seven process categories) and the general lack of information of adoption strategies specific to this technology. Oettmeier and Hofmann (2016) cite compatibility and demand-side benefits as determining factors in AddM adoption for industrial parts production. Companies thus need first to determine if AddM is compatible with their industry, which can also be seen as the extent of the integration efforts and impact on the organization’s practices, and if demand-side (customers) benefits such as customization or shorter lead time are applicable.
To benefit from AddM’s full potential, organizations have to transform their practices and involve their workforce. But how does the organization transform? What are the steps to adoption? The goal of this study is to develop a maturity model to support organizations in the integration of AddM into their product development process and use it as a competitive

135
advantage. This paper presents a literature review on maturity models and adoption of AddM technologies, the methodology used to develop the maturity model and survey and the survey results for a multinational organization, before concluding. 2. Literature review
Little information is currently available on methodological aspects of the integration of AddM in an organization’s practices ((Mellor, Hao and Zhang, 2014), (Lindemann et al., 2015)). Companies currently have to experiment with these technologies and identify steps to integrate them to their product development process (from client requirements definition to maintenance and aftermarket service). They have to make sure they possess the capabilities to pilot AddM integration, in other words, that they become competent in the use of AddM. A literature review was conducted in order to justify the creation and use of an AddM maturity model and also to gather technical information to build a comprehensive model.
Although many maturity models are based on the concept of capability, few define it. Ning, Fan, and Feng (2006) propose that:
the definition of knowledge capability could be included as the “knowledge system that can synergy and reconstruct the resources, knowledge and capabilities within and without the organization to realize the harmonious development with its environment”. Knowledge capability includes core knowledge resource that make the organization competitive and the knowledge operating capabilities that make the knowledge resource effective and profitable.
While it may not be evident, this definition is meant to encompass the following notions: an ability to act, based on knowledge and resources in a task-specific context. It is also meant to be dynamic in the sense that it is reconstructed with changing internal and external environment. We find that the definition of competency proposed by Tardif (2006) to be much more operational: ‘a complex know-how-to-act requiring the mobilization and the efficient combination of a variety of internal and external resources within a family of situations3’: Internal resources refer to knowledge, skills, attitudes, schemes, while service bureaus, machine manufacturers, and experts are examples of external resources. The family of situations describes the context, and to a certain measure, the scope, in which the competency will be deployed. For this project, the situation is that of design and manufacture of tangible goods, irrespective of the field of application. From the literature reviewed, we understand that competency and capability could be used as synonyms. A study could be conducted on defining and comparing capability and competency, but it is not the goal here.
3 The translation is ours. The original french definition is given here : « Un savoir-agir complexe prenant appui sur la mobilisation et la combinaison efficaces d’une variété de ressources internes et externes à l’intérieur d’une famille de situation ».

136
Different types of maturity models can apply to AdvM in general and AddM in particular; that of the technology itself (Technology Readiness Level - TRL) (ISO, 2013), that pertaining to its use from a manufacturing perspective (Manufacturing Readiness Level - MRL) (OSD Manufacturing Technology Program, 2012) or that which reflects an organization’s ability to integrate the technology efficiently in its processes (Organization Readiness Level - ORL). More precisely, organizational maturity can be defined as ‘the level of organization’s readiness and experience in relation to people, processes, technologies and consistent measurement practices’(Bersin by Deloitte, 2015). Different organizational maturity models are developed with different goals in mind. Among the most common are to guide implementation efforts to achieve compliance with standards and enable benchmarking of current practices (Antunes, Carreira and Mira da Silva, 2014), support deployment of strategic roadmaps by assessing an organization’s profile and proposing an implementation framework to guide best practices application (Pigosso, Rozenfeld and McAloone, 2013).
With regards to AddM, standards only cover AddM terminology (ASTM, 2012b), process categories, test methods, data processing and file format, materials (ASTM, 2014). A design guidelines standard for AddM is under preparation by ASTM (ASTM, 2012a).
Literature on the integration of AddM within organizations generally focuses on the maturity of the technology or on the industrialization process and not on the maturity of the organization towards the adoption of this technology. We found only one instance of the latter. Mellor, Hao, and Zhang (2014) propose an integration framework for AddM in the form of implementation factors which are classified as strategic (e.g. business, manufacturing, and research and development strategy alignment), technological (e.g. technology maturity), organizational (e.g. organizational culture), operational (e.g. quality control), and supply chain-related (AddM machines vendors). This can guide an organization for implementation steps, such as ‘strategic alignment of the business, manufacturing and R&D strategy’ or ‘rethink design for manufacturing’, but no assessment method is proposed in order to evaluate its initial skills and knowledge profile. Consortiums and research institutes support organizations in the integration of these technologies, such as MTC (2015), EWI (2015), Fraunhofer Institute (2015), but they do not make their methods public.
On the other hand, maturity models and assessment methodologies for non-manufacturing fields are numerous. The purpose here is not to present a comprehensive review of such models but to present those which inspired certain features of our model as presented in Table 1. The models were selected because they clearly presented and defined the following elements: levels of maturity, model output, and model elements. We found no maturity model addressing the adoption of Advanced Manufacturing (AdvM) nor providing an assessment tool of AdvM organizational maturity.
The CMMI (Capability Maturity Model Integration) focuses on organizational process improvement and is referred to by numerous maturity models. In their paper, Pigosso, Rozenfeld and McAloone (2013) developed an ecodesign maturity model which comprises maturity levels. Maturity levels are a combination of evolution levels and capability levels.

137
Evolution levels indicate ecodesign implementation steps and capability levels ‘qualitatively measure how well a company applies an ecodesign management practice’. Capability levels (incomplete, ad hoc, formalized, controlled, and improved) were adapted from CMMI. The EUMMM (Ngai et al., 2013) also builds on CMMI to propose a five maturity level assessment method and four phases of maturation processes (establishment, standardization, management, and improvement) to improve organizational maturity for sustainable manufacturing. The Energy Management Maturity Model (Antunes, Carreira and Mira da Silva, 2014) goal is to support organizations in their improvement to reach compliance with energy management standards. Again, five maturity levels are described: initial, planning, implementation, monitoring and improvement.
Finally, from the civil engineering field, the Building Information Modeling (BIM) maturity model (The Computer Integrated Construction Research Program, 2012) is also based on CMMI. The BIM is an electronic model of a facility utilized for visualization, engineering analysis, budgeting, and other uses. Maturity levels refer to organization performance for each BIM use. The BIM maturity model is partially based on BIM Uses such as ‘generating, processing, communicating, executing, and managing information about the facility’. Table 1 summarizes the maturity levels, model’s outputs and elements that influenced our AddM maturity model.

138
Table 1 Maturity models comparison
Maturity models Maturity levels Model’s outputs Model’s elements CMMI (Capability Maturity Model Integration) (CMMI Product Team, 2010)
4 capability levels (incomplete, performed, managed, defined) and 5 maturity levels (initial, managed, defined, quantitatively managed, optimizing)
evolutionary path for organizational process improvement
22 process areas such as: product integration, project monitoring and control, project planning, requirements development, requirements management, technical solution
Ecodesign maturity model (Pigosso, Rozenfeld and McAloone, 2013)
5 evolution levels and 5 capability levels (incomplete, ad hoc, formalized, controlled, improved), adapted from CMMI
diagnosis of maturity profile and proposal of ecodesign practices and improvement projects for ecodesign implementation, benchmarking of ecodesign practices, assessment of strengths and weaknesses and a common language
ecodesign practices, ecodesign maturity levels by product development processes phases, application method
EUMMM (Energy and Utility Management Maturity Model) (Ngai et al., 2013)
5 maturity levels (initial, managed, defined, quantitatively managed, optimized) and a process-based maturation framework including 4 phases (practice establishment, practice standardization, performance management and continuous improvement)
assessment framework for analyzing maturity level of energy and utility management in organizations, progressive framework to guide organizational advancement in energy and utility management, guidelines for maturity assessment and improvement
energy and utility resource management process areas
Energy Management Maturity Model (Antunes, Carreira and Mira da Silva, 2014)
5 maturity levels (initial, planning, implementation, monitoring, improvement)
roadmap for achieving higher energy efficiency, support organizations in their improvement to reach compliance with energy management standards
energy management activities
BIM (Building Information Modeling) (The Computer Integrated Construction Research Program, 2012)
6 maturity levels (non-existent, initial, managed, defined, quantitatively managed, optimizing)
maturity assessment of planning elements, desired level of BIM implementation, and advancement strategy
planning elements: strategy, BIM uses, process, information, infrastructure and personnel
Our model 7 maturity levels (nonexistent, initial, occasional, formalized, controlled, optimized, innovative)
assessment tool as a survey, model ‘built-in’ roadmap
AddM decision factors: AddM uses, materials, process categories, good practices, standards, and related technologies

139
3. Methodology to develop the maturity model and survey
The proposed methodology of AddM maturity modelling and assessment is composed of four steps: 1) Define the maturity model goal(s); 2) Design the maturity model; 3) Design the assessment tool: survey; 4) Analyze the survey results.
1) Definition of the model goal(s)
We believe that for efficient integration of new technologies, assessment of current capabilities is the first necessary step to reduce risks and maximise opportunities. In comparison with existing maturity models, our proposal is not to evaluate the technology readiness, nor verifying the manufacturing capacity of a process. Our model neither aims at benchmarking practices of organizations nor to support an organization in complying with standards. The compliance with standards cannot be achieved since no standard currently advise on AddM adoption. The maturity model purpose is to assess the current profile of an organization with regards to its use and knowledge of AddM technologies and to provide a roadmap to guide their implementation. Our model is competency-oriented, but very specific to AddM.
2) Maturity model design
The proposed AddM maturity model presents itself as a matrix as illustrated in Table 2. The rows are based on AddM decision factors and embody the internal and external resources to be mobilized. For an organization that wants to gain AddM expertise, internal resources refer to AddM knowledge, skills (e.g. efficient use of CAD), and attitudes (e.g. openness to change). External resources refer to resources that an organization is less likely to build or heavily invest in, at least when starting to adopt AddM from a low maturity level, such as tools (e.g. 3D scanner), information (e.g. technology watch), and experts.
From the literature reviewed, we observed that maturity models were mainly based on process areas, product development process (PDP) phases, and planning elements such as uses. From the AddM literature review, we concluded that an organization that would have a high maturity level would have integrated AddM through all of its PDP for numerous uses. We thus selected AddM uses as the foundation of the model, which can directly be associated with PDP phases. For example, PDP phase ‘manufacturing preparation’ can be associated with functional or technical prototypes.
The model features AddM decision factors such as AddM uses (prototyping, tooling and production of parts), materials, process categories, good practices, standards and related technologies. These decision factors, presented in detail below, were selected because they encompass the main AddM themes on tools, technologies and required skills from reviewed technical literature (Wohlers and Caffrey, 2015), (Gibson, Stucker and Rosen, 2015).

140
Deloitte refers to organizational maturity as including "consistent measuring practices". The model we propose is oriented towards organizational maturity but it does not comprise the dimension where an organization collects data, analyzes it and uses the results to optimize its processes and practices. It is rather focusing on an increase in efficiency in mobilization of resources.
Table 2 Maturity model matrix
Maturity levels 0.
Nonexistent 1.
Initial 2.
Occasional 3.
Formalized 4.
Controlled 5.
Optimized 6.
Innovative
Dec
isio
n fa
ctor
s
AddM uses AddM materials
AddM process categories
AddM good practices
Related technologies
We propose that for efficient use of AddM, knowledge of the following aspects is required, but not limited to: general engineering materials science, AddM process categories principles, and AddM opportunities and limits. Skills required include, but are not limited to: AddM candidates’ selection expertise, Design for AddM rules application, computer-aided design, computer-aided manufacturing, topology optimization and finite elements analysis, cost analysis, technology watch, design for environment, and quality control. Attitudes can include having an innovative and creative mindset and readiness for change. External resources and information refer to service providers, machine manufacturers, AddM standards, and CAD file formats. The next paragraphs aim at describing how technical AddM literature was used to support the maturity model development. When a new AddM application is targeted, usually the starting point is the use of the future part or assembly. AddM typical uses are referred to as prototyping, production of parts and assemblies, and tooling. Prototypes can be classified as design model, geometrical prototype, functional prototype, technical prototype and pre-production part(Pfeifer et al., 1994). Production parts examples include series of parts, spare parts to solve obsolescence problems, or repairs, such as metal parts cladding. Finally, tooling produced by AddM can be used to produce series of parts (e.g. injection mold, sand casting pattern, hydroforming die) or for various other applications such as an assembly, testing or machining jig.
This use will dictate the material and then this material will determine the process category to be used. AddM material choices are limited, but can be hard to choose for beginners (less mature users). AddM materials range from thermoplastics and thermosets polymers, to paper, ceramics, composites, metals to waxes and can even be organic. The material form (powder, filament, liquid, or sheet) can also influence the choice of a process category since it can

141
affect the mechanical properties of the part. Then, good practices for the chosen process category will need to be followed and standards might apply. Good practices include design for AddM which can be defined as geometric guidelines allowing the manufacturability of a design by a specific process (e.g. minimum wall size thickness, support structures, powder removal design). In the design process, AddM standards might be used for specific applications and process categories, such as the powder bed fusion of Ti-6Al-4V (a titanium, aluminum, vanadium alloy) standard defining requirements and ‘ensuring component properties’(ASTM, 2014).
Gomez & Vargas (2012) showed that the use of a technology is positively related to the use of other technologies with which it forms a system. A category on technologies related to AddM, such as computer-aided design to bring a virtual file to the printer, the use of a 3D scanner to possibly facilitate the design process, or topology optimization to reduce weight of parts, was added to the model.
The model we propose presents seven levels (nonexistent, initial, occasional, formalized, controlled, optimized, and innovative). The innovative level is a novel contribution and is proposed to consider the fact that the AddM industry is constantly evolving and that companies that will really stay ahead of the AddM market will be innovating by developing tools, materials, machines, to suit their industry. To define the maturity levels, we first compared each level terminology of reviewed models to determine its underlying concept. We roughly kept the same designations as the Ecodesign maturity model and BIM and added a level that is more advanced than optimizing (i.e. innovative).
The columns in Table 2 thus represent seven different stages of deployment and of technical difficulty, reflecting an increased efficiency in resource mobilization. For example, choosing an AddM process based on limited experience rather than using a decision-based proven tool might translate to cost overrun and exceeding timeframes, or non-satisfactory part specifications (surface finish, tolerances, and mechanical properties). A description of each maturity level for all decision factors can be found in Appendix 1.
The greatest challenge in the development of this model was to determine for each level (and corresponding assessment tool answer choice), the appropriate AddM description. We knew from experience that most organizations are at the initial level where they are still looking at the technology maturity (TRL) and wondering how it will affect their operations and what strategy they should use to adopt AddM. Little information is available on the top levels of the model, since very few companies have attained this expertise, and haven’t made this information public.
3) Assessment tool design
From the maturity models cited in Table 1, only the CMMI has an appraisal program to evaluate the maturity of an organization. For other models, no external organization performs audits and assessment criteria are qualitative. We decided to assess current maturity level through a survey.

142
The survey was created specifically for a multinational organization that designs and manufactures passenger rail vehicles, propulsion and controls, bogies and rail signalling systems. The company already uses AddM for prototyping, but is interested in accelerating its adoption of AddM technologies for a wider range of uses in order to gain a competitive advantage. The organization has, among others, expertise in 3D prototyping, both virtual and physical, in topology optimization, in materials, in design to cost and design for manufacturing. One of their rolling stock competitors has developed expertise in design for manufacturing of AddM production of polymer parts for aftermarket applications.
Very early in the design of the survey, it became apparent that it needed to be adapted to the organization using its own terminology and based on an assumption of its initial maturity level, which was determined by conducting a review of various internal documents. For any organization, a thorough review of its product development process documents is required in order to have an overview of AddM activities and specific vocabulary. Since many organizations start using AddM for prototyping, a prototypes types’ lists with description, time and cost to produce prototypes can be a valued source of information. An inventory of AddM equipment, AddM uses, as well as identification of employees who have shown an interest in AddM throughout an organization should be done. As described in change management literature (Gagnon, 2006), these contacts could be ‘super-users’, which don’t necessarily have AddM experience, but are motivated to learn more about it and support its adoption by promoting it to their colleagues.
The assumption of the organization’s current maturity level is that its current AddM expertise is for prototyping with one AddM process. AddM is used by a few engineers and good practices need to be established. The organization has the objective to manufacture prototypes during design phases and production parts and assemblies using AddM in the next few years. This assumption influences the survey’s questions content. Since the maturity level of the organization is low at the start of the research project, the majority of the survey’s questions provided explanations on the technologies and visual ‘aids’, which might not be necessary if the maturity level is higher. The survey thus had an educational purpose in this case, since we believe that efficient technology integration starts with education. If the assumption of a higher maturity level is made, additional and more challenging questions can be added.
The survey includes 55 questions divided in four sections: demographics, organizational practices towards innovation in general, AddM knowledge and practices, and conclusion. The six AddM decision factors are represented under the ‘AddM knowledge and practices’ section of the survey. Most questions are multiple choice questions in order to associate answers to one of the seven maturity levels. For example, to the question ‘Rate your level of knowledge of AddM-specific thermoplastics polymers’, the respondent has the following choices:
0-Never heard of it.
1-Heard but never used it.

143
2-Occasional use: used this material category a few times.
3-Formalized: regular use of this material category but not with design for additive manufacturing (DfAddM).
4-Controlled: design parts and exploit potential for this material category and form (e.g. powder), and machines opportunities (DfAddM).
5-Optimized: characterize new materials in this category.
6-Innovative: develop, characterize, and use new materials in this category.
The survey was made available online on the Survey Monkey platform. The face validation of the survey was assessed by seven individuals, five of them working at the organization, the other two externals; one is a mechanical engineering university professor on AddM and the last one a mechanical engineer. Their understanding of the questions and the time to answer the survey were validated. Survey was reviewed in order to take their comments into account. The goal was not to evaluate the model contents at that time. Knowing that AddM has an impact on many functions of an organization (management, engineering, tooling, production, procurement, aftersales, marketing) and on the whole product development process, it is important to integrate AddM in a structured way and make sure that all functions are involved and participate. Respondents can be divided in three groups: the first group was comprised of 95 individuals having expressed their interest for AddM by participating in a ‘Lunch&Learn’ activity on AddM introduction. The second group consisted of 17 managers of Research & Development projects that regularly conduct technology watch. Finally, a group of 30 individuals whose work will probably be influenced by AddM in a near future were identified. In total, 142 individuals were asked to complete the survey within a two weeks’ timeframe and the estimated time to complete it was 20 minutes. This selection of respondents includes a bias in the population surveyed, but an assumption is made that the maturity level obtained will be the highest when surveying these individuals. In other words, had the respondents been chosen randomly, the results would not have shown a higher maturity level.
4. Survey results analysis
The response rate was established at 29,6% as 42 individuals completed the whole survey online. Answers from incomplete surveys (6 respondents) were not considered. Table 3 presents the respondent distribution.

144
Table 3 Survey's respondents’ distribution
Targeted group Response rate
Respondents’ location
Respondents’ position
‘Lunch&Learn’ participants (95)
19/95 (20%)
Canada (19) 11 engineers, 1 expert, 4 managers, 1 technician, 1 competency development specialist, 1 mechanical designer
Research & Development managers (17)
9/17 (53%)
France (1) 1 expert Germany (3) 1 manager, 1 expert, 1
analyst Switzerland (4) 4 managers Thailand (1) 1 manager
Individuals whose work might be impacted by AddM (30)
15/30 (50%)
Germany (4) 2 managers, 1 expert, 1 engineer
Australia (2) 1 industrial designer, 1 manager
Canada (8) 1 expert, 1 technician, 5 managers, 1 engineer
United States (1) 1 manager
Forty-eight percent of answers put the organization at level 1-initial, 70% of their answers put it at level 0 and 1 as illustrated on Figure 1. Our assumption of the current low maturity level of the organization is confirmed by this distribution.
Figure 1 Maturity level distribution
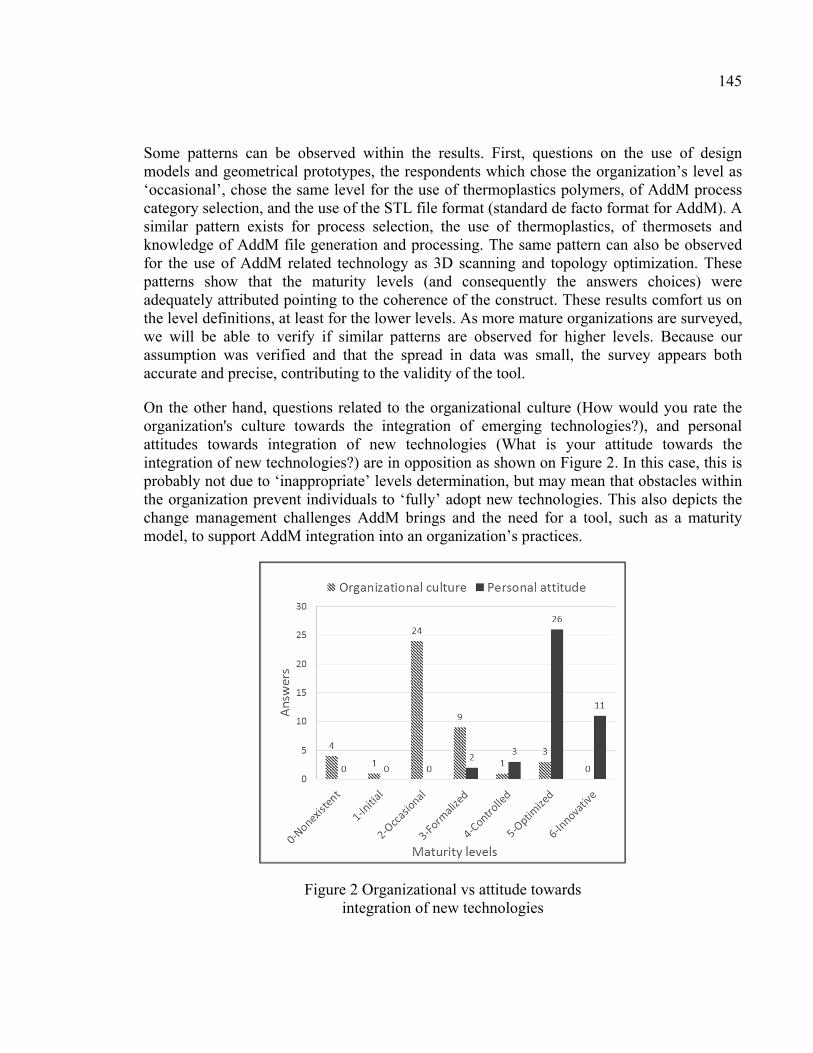
145
Some patterns can be observed within the results. First, questions on the use of design models and geometrical prototypes, the respondents which chose the organization’s level as ‘occasional’, chose the same level for the use of thermoplastics polymers, of AddM process category selection, and the use of the STL file format (standard de facto format for AddM). A similar pattern exists for process selection, the use of thermoplastics, of thermosets and knowledge of AddM file generation and processing. The same pattern can also be observed for the use of AddM related technology as 3D scanning and topology optimization. These patterns show that the maturity levels (and consequently the answers choices) were adequately attributed pointing to the coherence of the construct. These results comfort us on the level definitions, at least for the lower levels. As more mature organizations are surveyed, we will be able to verify if similar patterns are observed for higher levels. Because our assumption was verified and that the spread in data was small, the survey appears both accurate and precise, contributing to the validity of the tool.
On the other hand, questions related to the organizational culture (How would you rate the organization's culture towards the integration of emerging technologies?), and personal attitudes towards integration of new technologies (What is your attitude towards the integration of new technologies?) are in opposition as shown on Figure 2. In this case, this is probably not due to ‘inappropriate’ levels determination, but may mean that obstacles within the organization prevent individuals to ‘fully’ adopt new technologies. This also depicts the change management challenges AddM brings and the need for a tool, such as a maturity model, to support AddM integration into an organization’s practices.
Figure 2 Organizational vs attitude towards integration of new technologies

146
Since great care was taken to align the choice of answers to questions in the ‘AddM knowledge and practices’ section of the survey to the seven levels of the model, it becomes rather straightforward to elaborate a roadmap. Some questions can indicate next steps to improve on the path to AddM adoption. For example, 19 out of 42 respondents don’t know how to select an AddM process category for an application. The next step could consist in the design or the adoption of an existing decision tool to increase the organization’s maturity. Another example refers to topology optimization skills. Twenty-one out of 42 respondents have never heard about it. Training is thus required. However, organizations have to be careful, and think about what is the adequate ratio of users and experts on topology optimization. To our knowledge, no information is available on the competency structure of an organization with regards to AddM.
In addition to establishing the maturity level of an organization, the survey’s goal was to educate the survey’s respondents on AddM. Forty respondents out of 42 answered that they had learned about AddM processes while completing the survey. The goal of educating it thus achieved for a small group within the organization. The survey itself can be seen as a tool to increase maturity level.
5. Limits of current study
The limits of our study are listed in this section. They pertain both to the maturity model and to the assessment tool, or survey.
5.1 Model: With regards to the study by Mellor, Hao, and Zhang (2014) for which AddM implementation is presented by factors (strategic, technological, organizational, operational, and supply chain-related) our maturity model covers factors from the technological (materials, standards), organizational (integration of AddM in PDP), operational (DfAddM) and supply chain (service providers) factors. However, the proposed model does not explicitly take strategic factors into account which constitutes a limit. However, one could argue that if an organization spends time defining standard processes for a given task (maturity level 4 or 5), it is strategically aligned, implying that strategic factors are implicit to the model. Even if a roadmap can be figured out from the model, it doesn’t fully describe tools, good practices and processes to evolve from one maturity level to another. For example, if the difference between two levels is the use of a methodology, that methodology first needs to be presented, and to be accessible to users. 5.2 Survey
• The maturity profile obtained from the survey’s results is not representative of the whole organization since only a small portion of the organization was surveyed;
• The selection method of the survey participants introduces a bias in the results. An assumption is made that the maturity level obtained will be the highest when surveying these individuals.

147
Finally, the model and survey shall be refined and tested with additional companies. Then, deriving recommendations from the survey results, conducting use cases and re-assessing the maturity level would allow to conclude on the efficiency of the proposed model in supporting organizations in their adoption of AddM.
6. Conclusion
The goal of this study was to develop a maturity model to support organizations in the integration of AddM into their product development process and use it to gain a competitive advantage. We thus proposed an AddM organizational maturity model, and devised an assessment tool to establish the maturity level of a multinational organization. The model, based on AddM decision factors, and its seven maturity levels were presented as a matrix, and also includes a ‘built-in’ roadmap. The maturity assessment tool was devised and adapted to the organization namely by using its own terminology. From the maturity assessment results, patterns were observed as similar maturity levels between questions, showing an appropriate definition of the maturity levels.
The novel contribution of this study includes the maturity model itself for the AddM field and its levels definition based on competency in contrast with the existing literature that generally focuses on processes and continuous improvement of these processes. We propose a progression from a maturity level to another that is related to an increase in competency level (i.e. an increase in the efficiency of the mobilization of internal and external resources). The results from our unique maturity assessment tool, the survey, provides straightforward roadmap indications for steps to progress towards AddM adoption. Future work should include testing with additional organizations and refinement of the maturity model and survey.
Acknowledgments
We thank the private organization that provided valuable information on its industry and practices, and participated in the survey. Funding
This work was supported by the CRSNG (Conseil de recherches en sciences naturelles et en génie du Canada), FRQNT (Fonds de recherche du Québec – Nature et technologies), and the private organization under Grant BMP scholarship (Programme de bourses de recherche en milieu de pratique). We have no conflicts of interest to disclose.

APPENDIX III
MATURITY MODEL DESCRIPTORS Model descriptors - AM uses (prototyping, tooling, production parts) 0 Nonexistent Employees have never heard about AM typical uses. 1 Initial AM is used occasionally but not integrated in the Product Development Process (PDP). Employees have heard about most AM typical uses. Justification: To integrate AM in the PDP requires numerous resources, knowledge, skills. PDP phases and resources to integrate AM need to be identified. 2 Occasional AM is occasionally used for various applications. Justification: Using AM always in the same manner, or using it in different situations, but still occasionally. 3 Formalized AM is frequently used and parts are designed for particular applications from experience. Justification: Higher frequency of use, AM requires to design parts specifically for the material, for the AM process and even for the AM machine used, but here it still is based on designing from personal experience. 4 Controlled Design rules are applied with regards to AM use. Justification: Applying design rules imply that you know design rules exist. Design rules refer to DfAM, examples include minimum wall thickness, support structures, and powder removal design. 5 Optimized Part geometry, assemblies, CAD files for printing are systematically optimized with regards to specific AM applications. Justification: This refers to fully benefit from AM potential by designing parts that exactly comply to design rules and extending that to assemblies, which are more complex. Systematically optimizing implies years of experience with AM and we could imagine applications that are more safety critical here because the resulting part will behave exactly how it was intended because parts will be accurate and precise. 6 Innovative New applications are developed for AM.

150
Justification: Using AM to produce parts that do not fit with our current definitions of prototype, production parts or tooling parts categories. We might see new business models appear at this level.

151
Model descriptors - AM materials and process categories 0 Nonexistent Employees have never heard about AM. 1 Initial Employees have heard about AM-specific materials and forms (e.g. powder). The same AM process is used, in-house or with service providers. Justification: To have heard doesn’t imply a thorough knowledge. The choice of the appropriate AM process is a step towards part quality and performance. Meeting a wide range of requirements with only one AM process might not be possible. Working with service providers could provide benefits from using multiple processes that could be better fit to their application. 2 Occasional A few AM process categories are used. Justification: Using more than one process should ensure better fit with diverse applications, but it doesn’t imply that the right process is used for the application. 3 Formalized AM materials are regularly used but not with Design for AM (DfAM). Rules from experience are used to select processes. Justification: More than one material used more frequently. While not using DfAM rules might result in lower quality, using rules to select an AM process shows progress. When rules stem from experience, it might be only one individual within the company that possesses this embedded knowledge. 4 Controlled Parts are designed and potential is exploited for AM materials and forms. An existing process category selection tool is used. Justification: Designing parts specifically for AM materials and forms should lead to better part quality. Using a selection tool should lead to appropriate choices and facilitate a faster selection of the process. 5 Optimized New AM materials are characterised to fulfill the organization’s needs. Material selection is systematically optimised for specific applications. Appropriate selection is proven by numerous conclusive case studies. Justification: Material characterization requires a high level of knowledge of materials science, and the organization’s needs have to be well defined. In this case, an organization probably has an adoption strategy for AM, an efficient selection process and most users can select the appropriate process. Conducting multiple use cases and managing a feedback loop to validate that selection was accurate takes time and expertise. 6 Innovative New AM materials are developed, characterised and used. Methodologies are developed to assist in the selection of an AM process category.

152
Justification: Developing its own tools to satisfy its own needs reflects a continuous desire to improve. It means a thorough review of what’s existing was done and concluded that it didn’t meet current needs. This gives an organization power considering the current market is led by machines manufacturers and their proprietary materials.

153
Model descriptors - AM good practices 0 Nonexistent Employees have never heard about part consolidation, weight reduction potential using AM nor AM limits. No service providers identified (i.e. printing and design for AM services). Justification: A few individuals might use AM, but probably do not fully benefit from it, or only for low criticality applications such as prototyping. Using AM only internally may provide acceptable parts but may limit opportunities to benefit from AM and to gain skills. 1 Initial Employees have heard about AM opportunities, but do not benefit from it. AM is not totally integrated in the PDP. Justification: No actions are conducted to progress in AM adoption. Not integrated in PDP means few individuals use AM. 2 Occasional Part consolidation and weight reduction techniques are used, but not specifically for AM. AM limits such as build speed and build size are observed. A methodology is used to integrate AM in the PDP. Justification: Already using these techniques with other manufacturing techniques will help adopt AM, it is necessary to observe AM limits so afterwards can bypass them. Using a method to adopt AM for multiple phases of PDP will lead to a more formalized practice. 3 Formalized Part consolidation and weight reduction possibilities from AM are exploited, with an ad hoc method. An integration methodology for AM is created. Organization reaches out to various service providers. Justification: Exploiting AM possibilities will lead to conclusive use cases and convince organization of AM potential with credibility. Creating an integration methodology that includes the organization’s terminology and practices should lead to smoother adoption if the employees actually use it. More benefits from working with multiple providers, such as comparing prices, wider range of materials and machines, and increase knowledge level. 4 Controlled Various tools are used to better benefit from AM (design for AM rules, AM-specific geometries (e.g. lattice, shape complexity)). Organization uses AM service providers’ directories. Justification: Should have the competency to properly identify part candidates for AM and evaluate when traditional manufacturing is more profitable. Using DfAM rules will lead to better parts quality, accuracy and precision. Using AM specific geometries allows full benefits (e.g. weight reduction, increased performance such as using conformal cooling channels), these AM specific geometries require expertise in complex CAD modeling and AM preparation.

154
5 Optimized AM is integrated within all the PDP. Various strategies are designed in order to ‘bypass’ AM limits. The organization contributes to AM service providers’ directories. Justification: AM used in most departments and well-known by large number of employees. It means AM used for prototyping, production parts, tooling and thus cost and time savings should be observed. A thorough knowledge of AM process is required to bypass AM limits such as dividing a part in smaller parts so they fit into a machine, or sending parts to different service providers to get parts quickly. Contributing to directories should imply a company possesses equipment and operates it efficiently. 6 Innovative Employees work at pushing the limits of AM technologies (e.g. develop larger and faster AM machines). Methodologies are developed to detect opportunities such as part consolidation and weight reduction. Justification: Development of a new machine requires thorough knowledge of available equipment and assessing that it doesn’t fulfill the company’s needs. Additional expertise on areas such mechanics, physics, manufacturing or safety is also required to design a new AM machine. Developing a method to identify opportunities means characteristics of parts that could fit this goal have been identified, and an organization that designs its own method should observe better performance of its products.

155
Model descriptors - AM standards 0 Nonexistent Employees have never heard about AM standards. 1 Initial Employees have heard about AM standards, but never read them. Justification: AM standards are a source of information and current published standards include terminology, materials and processes, and test methods. 2 Occasional Employees have read major AM standards. Justification: This means employees have at least a basic understanding of the seven AM processes. 3 Formalized Employees regularly perform a watch on new or updated AM standards. Justification: this may imply that individuals have a dedicated AM role and that AM is integrated in the organization’s practices. 4 Controlled AM standards are used to test or characterise AM materials. Justification: this implies an organization already has a DfAM expertise and that current materials do not conform to its requirements. 5 Optimized AM standards are gradually integrated in technical requirements for contracts. Justification: for BT, technical requirements are documents that detail an outsourced part (a Buy) characteristics, namely: material, surface finish, post-processing. Parts made using AM have to be accepted by the customers and making sure these parts comply with standards is mandatory. An organization that includes AM standards into its technical requirements for contracts has therefore probably integrated AM through its PDP and is fabricating or outsourcing quality production parts. 6 Innovative The organization participates in standards committees on AM. Justification: to participate in standards committees requires a global overview of current standards, of the AM industry, and of companies’ AM needs.

156
Model descriptors - Related technologies 0 Nonexistent CAD software and 3D scanning are not used. Employees have never heard about topology optimization. There is no organized attempt at integration of emerging technologies. Justification: CAD software is necessary to produce a digital file that is sent to AM machines, it is mandatory unless CAD is outsourced. 1 Initial Employees have a basic understanding of CAD file formats characteristics but not of AM-specific file formats. Finite elements analysis is used but not topology optimization. The integration of emerging technologies failed in the past. Justification: this implies the use of CAD by some individuals in the organization. FEA is a phase that is part of the topology optimization process (optimization, CAD redesign, FEA). 2 Occasional Topology optimization basic principles are used for traditional manufacturing processes only. AM-specific file generation process is known but not largely used. A 3D scanner is used occasionally, with no particular methodology. Justification: 3D scanning allows acquisition of a CAD file by relatively quickly scanning a part that can then be produced using AM. Topology optimization is a tool used to reduce weight of parts. These technologies allow to better benefit from AM when used in synergy. Using them with traditional manufacturing is the first logical step to smooth adoption with AM. 3 Formalized A 3D scanner is used regularly, with no particular methodology. Topology optimization is regularly used for traditional manufacturing processes. An integration methodology exists for emerging technologies and for AM-specific file generation. Justification: AM specific files have particular requirements (i.e. fully closed model and resolution) that will determine in a great proportion the final part quality. At formalized level, a methodology exists but it doesn’t mean it is largely used. 4 Controlled Good practices guides are used for related technologies such as CAD files and 3D scanning, but not for AM applications yet. Justification: Using a guide will support the development of skills for quality CAD files generation. 5 Optimized AM is integrated within all of the PDP. 3D scanning is used in synergy with AM applications. Successful case studies conducted with emerging technologies, including AM. Industrialization of AM is a success. The AM-specific files generation process is optimised. Topology optimization is used for AM applications and design for AM principles are applied.

157
Justification: Industrialization means the organization fully benefits from AM and implies it can demonstrate economic benefits as well. Its supply chain probably also benefits from it. 6 Innovative Needs not met by current topology optimization software are identified and the development of a software and file format to improve AM parts results is underway. An organization reaching this level is ahead of competition and uses emerging technologies for new and creative applications. Justification: this implies an exhaustive review of the organization's and the industry’s needs.


APPENDIX IV
SURVEY CONTENTS This section aims at presenting the survey questions and justify the choice of these questions and their contents. Through this section on the survey contents, textual information extracted from the survey will be in italics. Welcome to Additive Manufacturing BT Maturity Assessment! Additive Manufacturing (also called 3D Printing or AM) has greatly improved in the last decade and is now considered a disruptive technology by many throughout the industry. Bombardier Transportation envisions an acceleration of its adoption in the next years. This survey has two objectives: provide information on AM and evaluate BT's maturity level towards the adoption of AM. The survey is confidential and anonymous. It should not take you more than 20 minutes to answer the questions. The survey is divided into three sections: 1. Demographic information 2. Organizational practices (prototyping and new technologies integration) 3. Additive Manufacturing knowledge and practices References can be found at the end of the survey. We thank you in advance for your input. The AME Innovation and R&T team The Demographic information section asked the following questions: 1. Demographic information 1. Select the division you work in. 2. Select your site. 3. Select your total years of experience (from the start of your career, including at other organizations than BT). 4. Select your position. 5. Select your years of experience in this position. The survey completion was anonymous but we wanted to determine the profile of respondents, determine if AM expertise in specific regions and/or divisions of the organization, in order to better manage efforts in deployment of AM. Information provided could also be used to measure whether recent graduates or people with a few years of experience would be more knowledgeable and experienced with AM or not, or if prototyping is more common within industrial designers practice. This also allows gathering information on which groups or regions should be stakeholders of future use cases.

160
The second section was on Organizational practices. Educational material was provided in the second and third sections of the survey to increase the knowledge level of respondents. 2. Organizational practices Section two of the survey asks generic questions on organizational practices and introduces terminology. For the purpose of this survey, physical prototypes are classified in five categories: • Design model • Geometrical prototype • Functional prototype • Technical prototype • Pre-production part Please refer to the table below (kind of prototype and operation fields): An image from the literature was provided to illustrate each physical prototypes types. 6. Which prototype type and associated use listed below have you made use of? Check all that apply. 7. If you selected prototype(s) type(s) at the last question, was Additive Manufacturing used? First two questions are on prototypes, since its application is generally the most known and most used since it is a low safety critical application. However, it should be kept in mind that using prototyping doesn’t mean AM is used for this purpose, but often the first encounter with AM is through prototyping. This prototype classification is proposed by (Pfeifer et al., 1994). Most questions in the survey present five to six answer choices, in order to directly relate the choice to a maturity level. They are meant to be mutually exclusive. Emerging technology refers to innovative techniques in development in a particular field. Examples of emerging technologies from the past decades at BT include: computer-aided design, robot laser welding, and advanced composites. 8. How would you rate BT's culture towards the integration of emerging technologies? If an organization has had successful experiences in adopting emerging technologies and we consider AM as an emerging technology, then we could assume the adoption of AM could be facilitated. This question refers to organizational maturity, for which an organization fully benefits from a technology when it is integrated into its practices and tangible benefits are observed. 9. Rate the level of integration of AM in the organization. BT: The highest maturity level in terms of integration is that the whole PDP is covered, since we know AM has an impact from beginning to end of process. 10. What is your position towards the integration of new technologies?
161
This question is about one's own perception of his openness to new technologies, but it is a personal perception and might not directly translate in actions at the workplace. Question 9 and 10 both need to be asked to figure out if mechanisms are preventing use of new technologies. 3. Additive Manufacturing knowledge and practices Section three surveys your knowledge of Additive Manufacturing. The next questions are on AM typical uses. Below is a list of AM typical uses: • Design model • Geometrical prototype • Functional prototype • Technical prototype • Pre-production part • Tooling to produce series of parts • Tooling for test / maintenance / assembly • Production / spare / repairs parts. A picture was provided for each use example. Design model: Initial market analysis. Geometrical prototype: Verification of assembling suitability. Functional prototype: Working principle verification. Technical prototype: Manufacturing process application. Pre-production part: Process parameter determination and optimization. Tooling: to produce series of parts (e.g. hydroforming). Tooling: for dimensional control. Serie of production parts. The following sixteen questions cover these uses, and for each use a first question acts as a filter, allowing to skip the second question if the respondent answers “never heard of” or “heard but never used”. For example, answering “never heard of” at question 11 will skip question 12. This shortens the time to complete the survey. We knew use of AM was quite limited in the organization, so only those who answer “used or worked with” will be prompted to answer the next question to rate their experience of this use. Each question presents the use image. Each use question is presented on a separate page. 11. Rate your level of knowledge of the following typical use of AM (1/8): Design model: Visual and haptic (sense of touch) requirements validation. Ergonomics validation. Initial market analysis. 13. Rate your level of knowledge of the following typical use of AM (2/8): Geometrical prototype: Verification of production and assembling suitability. Rough production and assembly planning. 15. Rate your level of knowledge of the following typical use of AM (3/8): Functional prototype: Working principle verification. Functional principle optimization. 17. Rate your level of knowledge of the following typical use of AM (4/8): Technical prototype: Customer acceptance verification. Fatigue strength and material properties verification.

162
19. Rate your level of knowledge of the following typical use of AM (5/8): Pre-production part: Product and market tests. Market introduction. Process parameter determination and optimization. 21. Rate your level of knowledge of the following typical use of AM (6/8): Tooling to produce series of parts (e.g. hydroforming die). 23. Rate your level of knowledge of the following typical use of AM (7/8): Tooling for test / maintenance / assembly (e.g. inspection tool). 25. Rate your level of knowledge of the following typical use of AM (8/8): Production / spare / repairs parts. o Never heard of. o Heard but never used. o Used or worked with. The next question is on your level of experience with typical AM uses or applications. Read the definition of each level before answering. In the definitions, design rules refer to geometric guidelines allowing the manufacturability of a design by a specific process (e.g. minimum wall size thickness, support structures, powder removal design). 12. Rate your experience of the following typical use of AM (1/8): Design model: Visual and haptic (sense of touch) requirements validation. Ergonomics validation. Initial market analysis. 14. Rate your experience of the following typical use of AM (2/8): Geometrical prototype: Verification of production and assembling suitability. Rough production and assembly planning. 16. Rate your experience of the following typical use of AM (3/8): Functional prototype: Working principle verification. Functional principle optimization. 18. Rate your experience of the following typical use of AM (4/8): Technical prototype: Customer acceptance verification. Fatigue strength and material properties verification. 20. Rate your experience of the following typical use of AM (5/8): Pre-production part: Product and market tests. Market introduction. Process parameter determination and optimization. 22. Rate your experience of the following typical use of AM (6/8): Tooling to produce series of parts (e.g. hydroforming die). 24. Rate your experience of the following typical use of AM (7/8): Tooling for test / maintenance / assembly (e.g. inspection tool). 26. Rate your experience of the following typical use of AM (8/8): Production / spare / repairs parts.

163
In the first version of the survey, questions on the use of AM for product development process (PDP) phases were asked. They were removed since the uses (prototypes, tooling, and production) can be associated to a phase of the process, and it seemed more simple to answer on the uses than on the PDP phases. 27. How do you select AM process category(ies) for a specific application? This selection competency is important since the wrong choice of process category will have an impact on the quality of the part and/or its properties and potential to fulfill the purpose it was designed for. Unsatisfactory experiences with AM in obtaining quality parts will spread out a negative reputation for AM in the organization. AM-specific materials are commercially available in filament, powder, liquid or sheet form and are specific to an AM process category and machine. Some machines are mono-material, others allow combination of materials. The choice of a material will guide the choice of a particular AM process category. AM processes can be classified in seven categories as cited by ASTM [9]: • Binder jetting: a liquid bonding agent is selectively deposited to join powder materials (e.g. 3DP, Color Jet Printing) • Directed energy deposition: focused thermal energy is used to fuse materials by melting as they are being deposited (e.g. LENS, laser cladding) • Material extrusion: material is selectively dispensed through a nozzle or orifice (e.g. FDM, FFF) • Material jetting: droplets of build material are selectively deposited (e.g. PolyJet) • Powder bed fusion: thermal energy selectively fuses regions of a powder bed (e.g. Laser Sintering, SLS, Laser Melting) • Sheet lamination: sheets of material are bonded to form an object • Vat photopolymerization: liquid photopolymer in a vat is selectively cured by light-activated polymerization (e.g. stereolithography, SLA, DLP) The seven AM-specific materials categories will be presented in the next questions and you will be asked to rate your experience with each. 28. Rate your level of knowledge of the following AM-specific material category (1/7): • stainless steel, nickel, cobalt-chrome, titanium, copper alloys, aluminum, superalloys (powder, wire, foil) 30. Rate your level of knowledge of the following AM-specific material category (2/7): • sand, glass, ceramic (powder) 32. Rate your level of knowledge of the following AM-specific material category (3/7): • thermoplastics polymers: ABS, PLA, PC, PA, PS, Nylon, PEEK (filament, powder) 34. Rate your level of knowledge of the following AM-specific material category (4/7): • thermosets polymers: acrylates, epoxies, polyurethane (liquid) 36. Rate your level of knowledge of the following AM-specific material category (5/7): • paper (sheet) 38. Rate your level of knowledge of the following AM-specific material category (6/7): • wax (liquid)

164
40. Rate your level of knowledge of the following AM-specific material category (7/7): • composites (powder, filament) o Never heard of. o Heard but never used. o Used or worked with. 29. Rate your experience of the following AM-specific material category (1/7): • stainless steel, nickel, cobalt-chrome, titanium, copper alloys, aluminum, superalloys (powder, wire, foil) 31. Rate your experience of the following AM-specific material category (2/7): • sand, glass, ceramic (powder) 33. Rate your experience of the following AM-specific material category (3/7): • thermoplastics polymers: ABS, PLA, PC, PA, PS, Nylon, PEEK (filament, powder) 35. Rate your experience of the following AM-specific material category (4/7): • thermosets polymers: acrylates, epoxies, polyurethane (liquid) 37. Rate your experience of the following AM-specific material category (5/7): • paper (sheet) 39. Rate your experience of the following AM-specific material category (6/7): • wax (liquid) 41. Rate your experience of the following AM-specific material category (7/7): • composites (powder, filament) Computer-aided design (CAD) files need to be converted to a specific file format that can be processed by Additive Manufacturing machines. 42. Rate your knowledge of AM file generation and processing. One could argue that this step should be a technical drafter’s role, but we think that managers should also be aware of the STL (or other file type for AM machines) contents and complexity, and the challenges and risks that putting all the part information in one file entails, such as IP and the opportunities (i.e. sending only file to remote AM equipment). As previously mentioned, CAD files need to be converted to a file format that can be processed by AM machines. Properly modeled part (i.e. closed surfaces, free of errors) will facilitate conversion to an AM-specific file format. Three formats are worth mentioning: • STL: most used file format, surfaces defined by triangles • AMF: AM-specific file developed by ASTM can include information such as material and microstructure, but not largely used • 3MF: new unified file format being developed by Microsoft to include AM parameters such as material and texture. 43. Which format(s) have you heard of and used? This question goal is mainly educational to present AMF and 3MF file formats which release is quite recent, in 2011 for AMF and 2015 for 3MF, and their utilization remains limited.

165
Nevertheless, the industry expressed a need for a file format that would contain all information necessary for AM (e.g. color, texture, material…). Topology optimization is a method to optimize the distribution of material within a determined design space, for given loads and boundary conditions, to meet an objective such as weight reduction. AM can allow manufacturing of complex geometries resulting from topology optimization. 44. Rate your experience with topology optimization. We knew before administering the survey that there are a few topology optimization experts at BT that are working on weight reduction of parts. This question has the goal to introduce this method to a larger audience and to verify if some users currently use it with AM or only with traditional manufacturing methods. Following images represent some opportunities from AM: part consolidation, assembly-free mechanism, and personalization. The next questions will ask you to rate your experience with AM opportunities. Part consolidation: printing numerous parts in a single one. Assembly-free mechanism: functional mechanism made of moving parts and produced in a single print build (no post-production assembly required). Personalization. 45. Rate your experience with this AM opportunity: part consolidation. The goal with this question is to educate on an AM opportunity, but also to verify if respondents can measure the trade-offs and when this opportunity should be taken. 46. Rate your experience with this AM opportunity: weight reduction. This question presents ways to reduce weight, and it demonstrates the link between weight reduction, tools and methods to reduce weight. It summarizes and reviews methods and tools from past questions such as topology optimization and DfAM. Weight reduction was identified as one main advantage from AM for BT. The next questions will ask you to rate your experience with the following AM limits: build speed and build size. 47. Rate your experience with this AM limit: build speed. It might have respondents think about how AM can take more time to build a part than machining (if considering a simple part), but if the part necessitates tooling, AM would provide parts more efficiently. 48. Rate your experience with this AM limit: build size. AM build speed and size are often cited as limiting the use of AM for production parts, among uses. The goal of these questions is to go beyond naming limits and proposing ways

166
to bypass these limits. Assessing if respondents are aware of these limits means they are aware of the size of machines and of the layered process. Next question is on AM standards. Here is a non-exhaustive list of AM standards: • ASTM F2792 − 12a: ''Standard Terminology for Additive Manufacturing Technologies'' • NF E67-001 ''Fabrication additive - Vocabulaire'' • ISO 17296-2 ''Additive manufacturing — General principles — Part 2: Overview of process categories and feedstock'' • ISO/ASTM 52915:2013 ''Standard specification for additive manufacturing file format (AMF)'' • ASTM F3049-14 ''Standard Guide for Characterizing Properties of Metal Powders Used for Additive Manufacturing Processes'' • ASTM F2924-14 ''Standard Specification for Additive Manufacturing Titanium-6 Aluminum-4 Vanadium with Powder Bed Fusion'' 49. Rate your experience with AM standards. This question aims at validating if standards are used as information sources and it provides a list of major standards so that respondents can access them. It also demonstrates that effort in the AM industry is being put to organize and regulate its use. The next question is on your knowledge and interaction with AM service providers. 50. Rate your experience with AM service providers (e.g. printing and Design for AM services). AM service providers directories include, but are not limited to: • 3D Printing Industry Directory • Additively • 3dbusinesses • Wohlers Associates Resource Listings • Réseau Québec-3D iCRIQ The goal is to provide resources so that respondents will reach out to service providers to collaborate and asses how often they resort to external expertise on AM. A 3D scanner can provide a three-dimensional numerical representation of an object, can be used for inspection and for reverse engineering. Also referred to as ''scan-to-print'', the use of 3D scanning and Additive Manufacturing in synergy can facilitate the product development process. 51. Have you heard about 3D scanning? Rate your experience. For BT, an advantage of using 3D scanning would be to scan a part on the service site and reproduce it on-site with AM, or in the case of spare parts for which only a few parts might be needed, and no tooling if justified. It can be used in synergy with AM and the process (scan to obtain CAD file) continually improves. Therefore this question educates on its potential and identifies it as an enabler of AM.
167
Conclusion This section is to gather feedback on your survey experience. 52. Did you learn about: Prototyping Additive Manufacturing process categories Additive Manufacturing opportunities and limits This question is a way to have feedback on the survey’s second objective which is to educate on AM. 53. Would you like to have access to a decision tool to assist you with the integration of AM in your tasks? This provides a quick answer to the question what tool would be the most useful for AM users. 54. Would you like to know more about Additive Manufacturing? 55. How would you like to learn more about Additive Manufacturing? These questions give insights to R&T team in how to proceed to provide additional educational material and organise activities to keep interest of respondents. Thank you! Thank you for taking the time to answer this survey. Your collaboration will allow us to make a first group assessment of Bombardier Transportation's maturity level towards Additive Manufacturing technologies and thus make the right choices for the use of these technologies in future projects. 56. Please provide any comments or suggestions.


APPENDIX V
SURVEY RESULTS This section covers the survey results, for sections two and three of the survey, respectively Organizational practices (questions 6 to 10) and Additive Manufacturing knowledge and practices (questions 11 to 51). Each question answer is reviewed with regards to its level of maturity. The numbers in the right section of the tables represent the occurrences of answers, unless otherwise noted. For each question, we also provide interpretation of the results, and a justification on how the question allows the evaluation of maturity. 6. Which prototype type and associated use listed below have you made use of? Check all that apply.
Design model: Visual and haptic (sense of touch) requirements validation. Ergonomics validation. Initial market analysis.
30
Geometrical prototype: Verification of production and assembling suitability. Rough production and assembly planning.
27
Functional prototype: Working principle verification. Functional principle optimization. Manufacturing sequence or assembly planning. Layout planning. Resource planning.
30
Technical prototype: Customer acceptance verification. Fatigue strength and material properties verification. Manufacturing process application.
24
Pre-production part: Product and market tests. Market introduction. Process parameter determination and optimization.
21
None 8 I have never heard about prototypes types. 0 Other (please specify) 0
7. If you selected prototype(s) type(s) at the last question, was Additive Manufacturing used?
Yes 18 No 18
These two questions do not allow the attribution of a maturity level with regards to AM, since prototyping can be done with traditional manufacturing methods. Nevertheless, it gives indications on the PDP phase during which the prototypes are used and on technical difficulty. For example, design models are used at the beginning of the design process, whereas the pre-production parts are used closer to the realization of first series production. Design models are usually less refined than pre-production parts that need to be similar to production parts and made with production tools. We can thus conclude here that prototypes are used slightly more at the beginning of the PDP for design models and functional prototypes, but pre-production parts are nevertheless used by half of the respondents. Three-quarters of respondents have used prototypes. For half of the prototypes uses, AM was used.

170
The question provides insights on the use, but doesn’t tell if benefits result (i.e. reduced time to develop products) and if design models are used early enough in the PDP. From observations and BT’s documents, we observed that the models were used mostly for customers’ requirements and not systematically to develop better products. 8. How would you rate BT's culture towards the integration of emerging technologies?
Maturity levels : 0 1 2 3 4 5 6No organized attempt at integration. 4 Integration often fails. 1 Occasionally facilitates integration. 24 Formalized: integration methodology exists. 9 Controlled: integration methodology is used. 1 Optimized: successful case studies/pilot projects. 3 Innovative: uses emerging technology in new ways. 0
The organization is perceived as occasionally facilitating the integration of emerging technologies, and an integration methodology (apparently) exists. This existing method needs to be made accessible and promoted. It could be based on successful introduction of new technologies at the organization such as welding technologies. 9. Rate the level of integration of AM in the organization. BT:
Maturity levels : 0-1 2 3 4 5 6has not yet integrated AM. 13 uses AM occasionally but not integrated AM in its Product Development Process (PDP).
27
uses a methodology to integrate AM in the PDP. 1 created an integration methodology for AM. 0 created and uses systematically an integration methodology for AM.
1
integrated AM within all of the PDP. 0 A quarter of the respondents answered that the organization has not yet integrated AM, but the word ‘integrated’ might be interpreted as used in a formalized way. For a better comprehension, the word integration could be defined before the question. More than half the respondents answered that AM is used occasionally. One respondent answered that he/she created an integration methodology; this could be investigated, adapted if necessary and made accessible to a larger audience. The identification guide that we propose in section Erreur ! Source du renvoi introuvable. can be used as part of an integration strategy since it allows the identification and evaluation of AM parts candidates.

171
10. What is your position towards the integration of new technologies? Maturity levels : 0 1 2 3 4 5 6
I don’t see added value to adopt new technologies when I can use existing ones that work well, are reliable, and safe.
0
I usually wait so that technology is proven before using it. 0 0 I am open to new ideas and products within my expertise domain. 3 3 I believe technology is a way to gain competitive advantage. I try new products, methods or processes when I believe there is added value.
26
I enjoy trying new products, methods or processes and I often propose new ways of doing.
11
The majority of the respondents are enthusiastic towards new technologies, so it might mean they are open to trying out AM. With regards to AM in question 9, we see the level is low, investigation should be conducted to determine if mechanisms prevent the use of emerging technologies at the organization. 11. Rate your level of knowledge of the following typical use of AM (1/8): Design model: Visual and haptic (sense of touch) requirements validation. Ergonomics validation. Initial market analysis.
Never heard of. 1 Heard but never used. 22 Used or worked with. 19
12. Rate your experience of the following typical use of AM (1/8): Design model. Maturity levels : 0 1 2 3 4 5 6
Occasional use: used AM a few times for this application.
10
Formalized: frequent use of AM and try to design part for this particular application from experience.
3
Controlled: apply design rules from literature and experience for this application.
1
Optimized: optimize part geometry and material choice for this particular application.
4
Innovative: develop new applications for AM. 1 More than half of the respondents have never used AM for design models, and one-fourth has used AM for them occasionally.

172
13. Rate your level of knowledge of the following typical use of AM (2/8): Geometrical prototype: Verification of production and assembling suitability. Rough production and assembly planning.
Never heard of. 1 Heard but never used. 24 Used or worked with. 17
14. Rate your experience of the following typical use of AM (2/8): Geometrical prototype. Maturity levels : 0 1 2 3 4 5 6
Occasional use: used AM a few times for this application. 9 Formalized: frequent use of AM and try to design part for this particular application from experience.
3
Controlled: apply design rules from literature and experience for this application.
1
Optimized: optimize part geometry and material choice for this particular application.
3
Innovative: develop new applications for AM. 1 More than half of the respondents have never used AM for geometrical prototypes. 15. Rate your level of knowledge of the following typical use of AM (3/8): Functional prototype: Working principle verification. Functional principle optimization.
Never heard of. 1 Heard but never used. 26 Used or worked with. 15
16. Rate your experience of the following typical use of AM (3/8): Functional prototype. Maturity levels : 0 1 2 3 4 5 6
Occasional use: used AM a few times for this application.
10
Formalized: frequent use of AM and try to design part for this particular application from experience.
2
Controlled: apply design rules from literature and experience for this application.
0
Optimized: optimize part geometry and material choice for this particular application.
1
Innovative: develop new applications for AM. 2 More than half of the respondents have never used AM for functional prototypes.

173
17. Rate your level of knowledge of the following typical use of AM (4/8): Technical prototype: Customer acceptance verification. Fatigue strength and material properties verification.
Never heard of. 9 Heard but never used. 27 Used or worked with.
18. Rate your experience of the following typical use of AM (4/8): Technical prototype.
Maturity levels : 0 1 2 3 4 5 6 Occasional use: used AM a few times for this application.
2
Formalized: frequent use of AM and try to design part for this particular application from experience.
1
Controlled: apply design rules from literature and experience for this application.
0
Optimized: optimize part geometry and material choice for this particular application.
2
Innovative: develop new applications for AM. 1 The majority of the respondents never used AM for technical prototypes. 19. Rate your level of knowledge of the following typical use of AM (5/8): Pre-production part: Product and market tests. Market introduction. Process parameter determination and optimization.
Never heard of. 5 Heard but never used. 34 Used or worked with.
20. Rate your experience of the following typical use of AM (5/8): Pre-production part. Maturity levels : 0 1 2 3 4 5 6
Occasional use: used AM a few times for this application.
1
Formalized: frequent use of AM and try to design part for this particular application from experience.
1
Controlled: apply design rules from literature and experience for this application.
0
Optimized: optimize part geometry and material choice for this particular application.
1
Innovative: develop new applications for AM. 0 Very few respondents used AM for pre-production parts. For these five types of prototypes, most respondents have heard of these applications, so to progress in maturity, guidelines should be provided on when and how to efficiently use them.

174
21. Rate your level of knowledge of the following typical use of AM (6/8): Tooling to produce series of parts (e.g. hydroforming die).
Never heard of. 8 Heard but never used. 30 Used or worked with.
22. Rate your experience of the following typical use of AM (6/8): Tooling to produce series of parts.
Maturity levels : 0 1 2 3 4 5 6 Occasional use: used AM a few times for this application.
2
Formalized: frequent use of AM and try to design part for this particular application from experience.
0
Controlled: apply design rules from literature and experience for this application.
1
Optimized: optimize part geometry and material choice for this particular application.
1
Innovative: develop new applications for AM. 0 23. Rate your level of knowledge of the following typical use of AM (7/8): Tooling for test / maintenance / assembly (e.g. inspection tool).
Never heard of. 10 Heard but never used. 25 Used or worked with. 7
24. Rate your experience of the following typical use of AM (7/8): Tooling for test / maintenance / assembly.
Maturity levels : 0 1 2 3 4 5 6 Occasional use: used AM a few times for this application. 4 Formalized: frequent use of AM and try to design part for this particular application from experience.
0
Controlled: apply design rules from literature and experience for this application.
1
Optimized: optimize part geometry and material choice for this particular application.
1
Innovative: develop new applications for AM. 1 Very few respondents used AM for tooling to produce series of parts or for tooling for test / maintenance / assembly. First step required would be education and demonstration of successful use cases studies specific to the rail industry.

175
25. Rate your level of knowledge of the following typical use of AM (8/8): Production / spare / repairs parts.
Never heard of. 7 Heard but never used. 28 Used or worked with.
26. Rate your experience of the following typical use of AM (8/8): Production / spare / repairs parts.
Maturity levels : 0 1 2 3 4 5 6 Occasional use: used AM a few times for this application.
5
Formalized: frequent use of AM and try to design part for this particular application from experience.
0
Controlled: apply design rules from literature and experience for this application.
0
Optimized: optimize part geometry and material choice for this particular application.
1
Innovative: develop new applications for AM. 1 Very few respondents used AM for production parts. From our observations and discussions, top management has high interest in using AM for spare parts, but first necessary step is education on AM in general, materials, processes, etc. before making production parts. Some spare parts might be safety critical and/or must comply to regulations. Considering the overall low maturity level on AM, for BT to produce spare parts soon, collaboration with external partners such as research centers, universities and AM service bureaus will be necessary to accelerate the adoption of this use. 27. How do you select AM process category(ies) for a specific application?
Maturity levels : 0 1 2 3 4 5 6 I don't know how to select a process. 19 I always use the same AM process, in-house or with service providers.
5
I occasionally use more than one process. 9 I use rules from experience to select processes. 5 I use an existing selection tool from the literature. 2 I have proven appropriate selection by numerous conclusive case studies.
2
I created a selection methodology which is used by myself and others.
0
Almost half of the respondents do not know how to select an AM process. This can be a concern since seven categories exist and the range of available machines is expanding. To overcome this, the use of a selection tool is recommended, and again, collaboration with external partners is necessary to accelerate use.

176
28. Rate your level of knowledge of the following AM-specific material category (1/7): • stainless steel, nickel, cobalt-chrome, titanium, copper alloys, aluminum, superalloys (powder, wire, foil)
Maturity levels : 0 1 2 3 4 5 6 Never heard of. 6 Heard but never used. 34 Used or worked with.
29. Rate your experience of the following AM-specific material category (1/7): • stainless steel, nickel, cobalt-chrome, titanium, copper alloys, aluminum, superalloys
Maturity levels : 0 1 2 3 4 5 6 Occasional use: used this material category a few times. 1 Formalized: regular use of this material category but not with Design for Additive Manufacturing (DfAM).
0
Controlled: design parts and exploit potential for this material category and form (e.g. powder), and machines opportunities (DfAM).
1
Optimized: characterize new materials in this category. 0 Innovative: develop, characterize, and use new materials in this category.
0
Only two respondents have used metal AM. This is not surprising since most AM metal applications are for medical, dental or aerospace industries where unique and customized parts are required or if weight reduction is critical. More than three-quarter have heard about it so progression should then be aimed at presenting rail-industry applicable case studies, and identifying cases specific for BT.

177
30. Rate your level of knowledge of the following AM-specific material category (2/7): • sand, glass, ceramic (powder)
Maturity levels : 0 1 2 3 4 5 6Never heard of. 14 Heard but never used. 28 Used or worked with.
31. Rate your experience of the following AM-specific material category (2/7): sand, glass, ceramic
Maturity levels : 0 1 2 3 4 5 6 Occasional use: used this material category a few times. 0 Formalized: regular use of this material category but not with Design for Additive Manufacturing (DfAM).
0
Controlled: design parts and exploit potential for this material category and form (e.g. powder), and machines opportunities (DfAM).
0
Optimized: characterize new materials in this category. 0 Innovative: develop, characterize, and use new materials in this category.
0
No respondent has used sand, glass, ceramic materials with AM. Considering BT’s domain or application, few uses apply, except potentially using AM sandcasting molds. 32. Rate your level of knowledge of the following AM-specific material category (3/7): • thermoplastics polymers: ABS, PLA, PC, PA, PS, Nylon, PEEK (filament, powder)
Maturity levels : 0 1 2 3 4 5 6 Never heard of. 3 Heard but never used. 20 Used or worked with. 19
33. Rate your experience of the following AM-specific material category (3/7): thermoplastics polymers
Maturity levels : 0 1 2 3 4 5 6Occasional use: used this material category a few times.
13
Formalized: regular use of this material category but not with Design for Additive Manufacturing (DfAM).
3
Controlled: design parts and exploit potential for this material category and form (e.g. powder), and machines opportunities (DfAM).
1
Optimized: characterize new materials in this category.
0
Innovative: develop, characterize, and use new materials in this category.
2
Thermoplastics is the material category that is the most used.

178
34. Rate your level of knowledge of the following AM-specific material category (4/7): • thermosets polymers: acrylates, epoxies, polyurethane (liquid)
Maturity levels : 0 1 2 3 4 5 6 Never heard of. 14 Heard but never used. 19 Used or worked with. 9
35. Rate your experience of the following AM-specific material category (4/7): thermosets polymers.
Maturity levels : 0 1 2 3 4 5 6 Occasional use: used this material category a few times. 7 Formalized: regular use of this material category but not with Design for Additive Manufacturing (DfAM).
2
Controlled: design parts and exploit potential for this material category and form (e.g. powder), and machines opportunities (DfAM).
0
Optimized: characterize new materials in this category. 0 Innovative: develop, characterize, and use new materials in this category.
0
One third never heard about AM thermoplastics, and half never used them, which can be surprising since the vat photopolymerization, often referred as stereolithography, exists for more than 25 years, and should then be used more extensively. We could think that respondents don’t know how to associate the right material to its process. 36. Rate your level of knowledge of the following AM-specific material category (5/7): • paper (sheet)
Maturity levels : 0 1 2 3 4 5 6 Never heard of. 17 Heard but never used. 23 Used or worked with.
37. Rate your experience of the following AM-specific material category (5/7): paper. Maturity levels : 0 1 2 3 4 5 6
Occasional use: used this material category a few times. 1 Formalized: regular use of this material category but not with Design for Additive Manufacturing (DfAM).
1
Controlled: design parts and exploit potential for this material category and form (e.g. powder), and machines opportunities (DfAM).
0
Optimized: characterize new materials in this category. 0 Innovative: develop, characterize, and use new materials in this category.
0

179
38. Rate your level of knowledge of the following AM-specific material category (6/7): • wax (liquid)
Maturity levels : 0 1 2 3 4 5 6 Never heard of. 15 Heard but never used. 26 Used or worked with.
39. Rate your experience of the following AM-specific material category (6/7): wax Maturity levels : 0 1 2 3 4 5 6
Occasional use: used this material category a few times. 1 Formalized: regular use of this material category but not with Design for Additive Manufacturing (DfAM).
0
Controlled: design parts and exploit potential for this material category and form (e.g. powder), and machines opportunities (DfAM).
0
Optimized: characterize new materials in this category. 0 Innovative: develop, characterize, and use new materials in this category.
0
About half the respondents heard of paper and wax as AM materials. We consider this acceptable when considering the few applications for rail industry. 40. Rate your level of knowledge of the following AM-specific material category (7/7): • composites (powder, filament)
Maturity levels : 0 1 2 3 4 5 6 Never heard of. 13 Heard but never used. 24 Used or worked with.
41. Rate your experience of the following AM-specific material category (7/7): composites Maturity levels : 0 1 2 3 4 5 6
Occasional use: used this material category a few times. 3 Formalized: regular use of this material category but not with Design for Additive Manufacturing (DfAM).
1
Controlled: design parts and exploit potential for this material category and form (e.g. powder), and machines opportunities (DfAM).
0
Optimized: characterize new materials in this category. 1 Innovative: develop, characterize, and use new materials in this category.
0
Slightly more than half respondents heard of AM composites. Identification of use cases is necessary, such as special tools.

180
42. Rate your knowledge of AM file generation and processing. Maturity levels : 0 1 2 3 4 5 6
I am unfamiliar with CAD software. 8 I have a basic understanding of CAD file formats characteristics but not of AM-specific file format.
12
I have heard about AM-specific file generation process. 12 A formalized procedure is available for generation of AM-specific files but I do not use it.
3
I regularly use a formalized procedure for generation and processing of AM-specific files.
5
I optimize AM-specific files generation process. 2 I have developed a new AM-specific file format. 0
Respondents that have used a procedure for file generation and processing are also respondents that used thermoplastics and thermosets. They also used design models at higher levels (3: formalised, and up), and generally knew how to select an AM process. 43. Which format(s) have you heard of and used?
STL-Never heard of. 6 STL-Heard of. 10 STL-Used. 18 AMF-Never heard of. 29 AMF-Heard of. 5 AMF-Used. 0 3MF-Never heard of. 29 3MF-Heard of. 5
Most respondents never heard of AMF or 3MF file formats which was expected since these file types have recently appeared and are not largely used yet. Information on these file types should be provided in the procedure for file generation.

181
44. Rate your experience with topology optimization. Maturity levels : 0 1 2 3 4 5 6
Never heard of it. 21 I use finite elements analysis but not topology optimization.
10
I occasionally use topology optimization basic principles but not with AM.
4
I regularly use topology optimization but not with AM. 4 I occasionally use topology optimization for AM applications.
2
I regularly use topology optimization for AM applications and apply Design for AM (DfAM) principles.
0
I participate in the development of new topology optimization methods and tools.
1
Three quarters of the respondents don’t use topology optimization and half never heard of it. This skill expertise level is quite low, but it’s important to reflect upon the right ratio of engineers that need this expertise to benefit from AM. To start AM integration in an organization, should the optimization skill be developed internally or outsourced? Topology optimization is one method to reduce weight of parts, but other methods exist, such as using lighter materials, part consolidation, or designing by experience. Multiple loops of topology optimization, redesign in CAD, and FEA are not always necessary. 45. Rate your experience with this AM opportunity: part consolidation.
Maturity levels : 0 1 2 3 4 5 6 I never heard of part consolidation, neither for AM nor traditional manufacturing.
7
I heard of it, but do not use it. 27 I used part consolidation, but not specifically for AM. 4 I occasionally use part consolidation specifically for AM, with an ad hoc method.
3
I use an existing design methodology to reduce AM part count and exploit possibility for more complex AM parts.
1
I systematically optimize assemblies to benefit from AM part consolidation while measuring trade-offs between part count reduction and part replacement (i.e. having to replace whole part instead of a smaller component within an assembly) as well as costs savings.
0
I developed a methodology to quickly detect AM part consolidation possibilities from an assembly using functional analysis.
0
The majority of respondents have never heard of or never used part consolidation. Education is thus necessary to provide successful case studies specific to the rail industry and to explain

182
when part consolidation is an advantage and when it might not be (e.g. maintenance, part replacement). 46. Rate your experience with this AM opportunity: weight reduction.
Maturity levels : 0 1 2 3 4 5 6 I never heard of weight reduction potential using AM. 4 I heard of this opportunity, but do not apply a method to reduce weight of AM or traditionally manufactured parts.
20
I reduce weight of traditionally manufactured parts but not of AM parts.
13
I occasionally reduce weight of AM parts, but do not apply Design for AM (DfAM) principles.
2
I regularly exploit AM-specific geometries (e.g. lattice, mesh, complex shell, shape complexity) and possibilities (e.g. different densities or structures in different zones), and/or topology optimization basic principles to reduce weight using a formalized methodology.
2
I optimize AM-specific geometries, and conduct multiple topology optimization cycles to reduce weight while optimizing nesting and build configuration according to a formalized methodology.
1
I have identified needs not met by current topology optimization software and develop a new one to improve AM parts results in terms of weight reduction.
0
A quarter of respondents aim at reducing weight of traditionally manufactured parts. Education through demonstration of the geometrical complexity potential of AM is necessary, including presentation of tools that allow the design of these complex structures. 47. Rate your experience with this AM limit: build speed.
Maturity levels : 0 1 2 3 4 5 6 Never heard of it. 11 Heard of it. 19 I experienced this limit a few times. 10 I separate my designs in parts and send them to different service providers.
0
I optimize toolpaths, use slicing software and/or minimize support structures so that build time is reduced.
2
I participate in the development of new materials and/or energy sources to reduce build time.
0
I work on the development of a new faster AM machine.
0
Answers are spread out between a quarter that never heard of build speed limit, half that heard of it, and a quarter that observed it. In a future version of the survey, it could be

183
interesting to ask what has more value: time to obtain part (i.e. layered AM process vs machining) or enhanced performance from geometrical complexity. 48. Rate your experience with this AM limit: build size.
Maturity levels : 0 1 2 3 4 5 6 Never heard of it. 6 Heard of it. 20 I observed this limit a few times. 11 I divide parts in sub parts so they fit in the AM machine.
2
I use AM to produce tooling and then make parts with satisfactory results.
2
I optimize build configuration, nesting and part segmentation.
1
I work on the development of a new larger AM machine.
0
Half the respondents heard about the build size limit. However, it should limit AM use less as machines improve in the future. 49. Rate your experience with AM standards.
Maturity levels : 0 1 2 3 4 5 6 I heard of no AM standard. 29 I am aware of the existence of AM standards, but have never read any.
13
I have read most AM standards. 0 I regularly perform a technology watch on new or updated standards on AM.
0
I use standards to test or characterize new material(s) for AM.
0
I participate in the integration of AM standards in technical requirements for contracts.
0
I participate in standards committees on AM. 0 More than half the respondents never heard about AM standards. For now it is not too concerning since standards are generally about terminology and test methods. However, in a few years when standards dictate how AM parts should be build and are included in BT’s customers’ contracts, engineers will need to be more knowledgeable of these documents. It’ll be important to assess which individuals within the organization will need to be knowledgeable of AM standards.
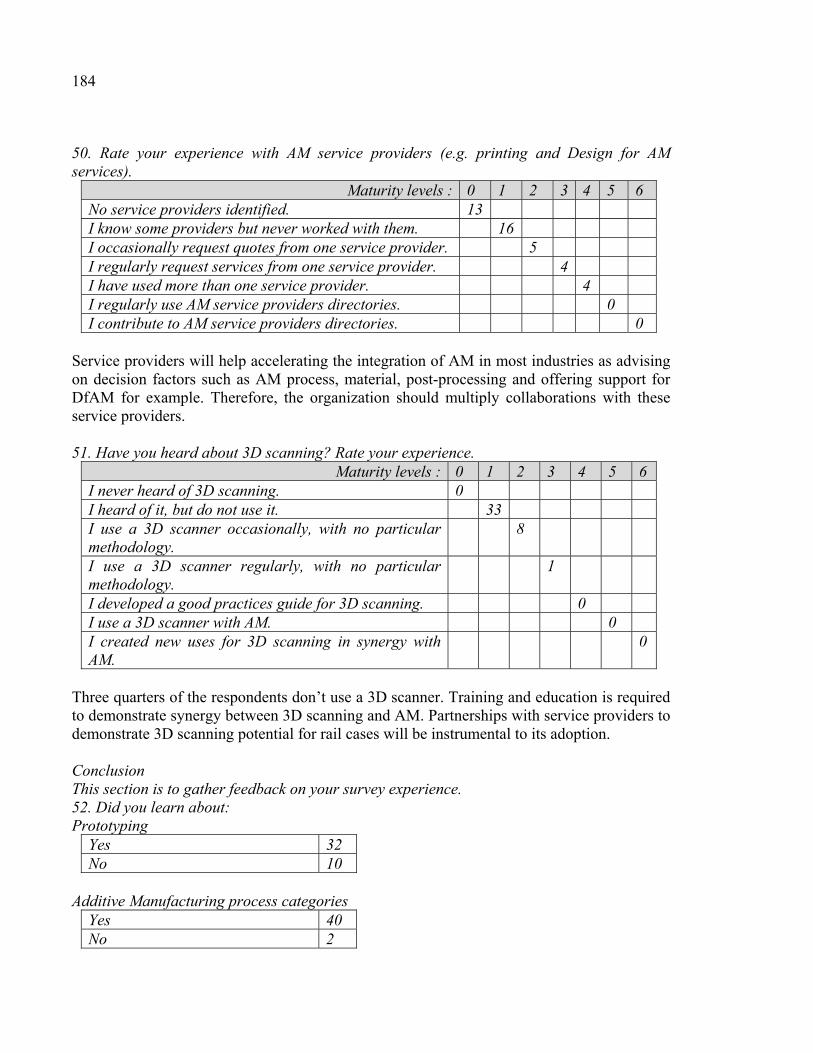
184
50. Rate your experience with AM service providers (e.g. printing and Design for AM services).
Maturity levels : 0 1 2 3 4 5 6 No service providers identified. 13 I know some providers but never worked with them. 16 I occasionally request quotes from one service provider. 5 I regularly request services from one service provider. 4 I have used more than one service provider. 4 I regularly use AM service providers directories. 0 I contribute to AM service providers directories. 0
Service providers will help accelerating the integration of AM in most industries as advising on decision factors such as AM process, material, post-processing and offering support for DfAM for example. Therefore, the organization should multiply collaborations with these service providers. 51. Have you heard about 3D scanning? Rate your experience.
Maturity levels : 0 1 2 3 4 5 6 I never heard of 3D scanning. 0 I heard of it, but do not use it. 33 I use a 3D scanner occasionally, with no particular methodology.
8
I use a 3D scanner regularly, with no particular methodology.
1
I developed a good practices guide for 3D scanning. 0 I use a 3D scanner with AM. 0 I created new uses for 3D scanning in synergy with AM.
0
Three quarters of the respondents don’t use a 3D scanner. Training and education is required to demonstrate synergy between 3D scanning and AM. Partnerships with service providers to demonstrate 3D scanning potential for rail cases will be instrumental to its adoption. Conclusion This section is to gather feedback on your survey experience. 52. Did you learn about: Prototyping
Yes 32 No 10
Additive Manufacturing process categories
Yes 40 No 2

185
Additive Manufacturing opportunities and limits Yes 32 No 10
The educational purpose of the survey was met with a majority of respondents answering positively and mostly on AM process categories. The survey itself can be seen as a tool to increase maturity level. 53. Would you like to have access to a decision tool to assist you with the integration of AM in your tasks?
Yes 35 No 6 I already use or I created an ‘’AM decision tool’’.
0
54. Would you like to know more about Additive Manufacturing?
Yes 41 No 1
55. How would you like to learn more about Additive Manufacturing?
BT SharePoint 25 Lunch & Learn activity 22 Conference 28 On my own, please provide me references. 14
Majority of respondents want to learn more about AM and to have access to a decision tool.


APPENDIX VI
USE CASES AND ACTIVITIES LIST
Use cases
1) Sandcasting molds and cores for carbon steel castings pre-production/prototyping for faster castings validation or as temporary part on the assembly line to prevent stopping line;
2) Hydrosoluble core/mold for composite layup of spare parts; 3) Sandcasting patterns (SLA, paper, wax); 4) Hydroforming die; 5) Welding quality inspection tool; 6) Special tools: go no-go device, measuring device, identification of use case in 2017 from
special tools (production line, e.g. go/no-go gauges, measuring tools, gauge block) to bench test equipment/maintenance;
7) Polymer production part: Ultem9085, parts such as armrest, handles, air ducting using extrusion process;
8) Metal non structural production part: additive and subtractive manufacturing of castings as temporary parts on the assembly line;
9) Metal structural production part and leveraging of topology optimization skills; 10) Metal structural production part; 11) Define additional use cases for post-processing and collaborate with external partner. a) polymer (support removal, polishing, painting,...), b) metal (shot peening, heat treatment, support removal, machining, polishing, painting,
welding,..). 12) Polymer spare part; 13) Metal non structural spare part; 14) Metal structural spare part to identify in 2018; 15) Metal non structural repair case to identify in 2018; 16) Metal structural repair 1: potential use of cold-spray; 17) Metal structural repair 2: potential use of cold-spray; 18) Identify a metal use case with PPC; 19) Identify a metal use case with RCS; 20) Advanced materials R&D, processing into complex shapes; 21) Insulating materials R&D, potential for spare parts; 22) Technology watch on sand/glass/ceramics materials; 23) Thermosets molds for urethane/rubber or metal casting; 24) Identify partner (Creaform/other) and work with to demonstrate 3D scanning potential; 25) Must-do use cases to promote AM potential, compare with current weight reduction
methods/materials.

188
Activities 1) Monitor BT foundry suppliers' expertise with AM tooling; 2) AM process selection expertise development; 3) Develop machines/equipment selection guide; 4) Invest in a few Senvol Indexes (data sets for AM material characterization comprising
test specimen properties, process parameters and feedstock properties for a specific machine) to increase material knowledge in particular for powder bed fusion;
5) FST Ultem9085 test certification EN-45545 (Europe); 6) Ultem9085 air ducting; 7) Topology optimization of polymer parts; 8) Follow up on results of the FST materials project; 9) Technology watch on composites, until process is more mature, keep BT composites
experts informed; 10) Technology watch on standards until more applications-based standards are published; 11) Validation of current weight reduction practices to future AM use compatibility; 12) Determine adequate ratio of topology optimization experts; 13) Technology watch on 3D scanning by Knowledge Domain; 14) Use and promote identification guide as an integration methodology; 15) Develop a good practices guide comprising design guidelines to develop design
optimization thinking (design paradigms evolution to add material and not only form or remove material);
16) Resume Additive Manufacturing Knowledge Domain activities and include Prototyping center and EMO representatives in meetings, SharePoint must be updated;
17) Develop AM business models that includes cost models considering weight, time and added value; weight reduction complete cost study;
18) Technology watch to monitor machines speed improvements; 19) Technology watch to monitor machines sizes improvements; 20) AM file generation and processing competence development; 21) Use of AM during 3P work shops; 22) Verification of progression in the use of design models and geometrical prototypes.

APPENDIX VII
WORK PACKAGES
Table-A VI-1
Work package WP1.1 Adoption of AM and education Use cases references: 3.1.1, 4.3.1, 5.2.1, 5.2.3, 5.5.1, 5.6.1
Goal Increase level of knowledge, skills and organize the adoption of AM.
Priority Must-do
Context AM processes selection expertise is needed to make adequate technology choices in future casestudies. AM deployment required for Make or Buy decision. In 2017, focus on Buy cases: identification of material and process and requirements definition. When more knowledge is gained through 2017-2018, decision could become Make cases, a machines/equipment selection guide will then be amust-do and the Operations group will be the owner of this guide in 2018. Owner Knowledge Domain Members Hours: 1660 h ODC: 3
kUSD Total: 144 kUSD
Core team budget Additional participants budget Hours: 940 h ODC: 3 kUSD Total: 82.9
kUSD Hours: 720 h ODC: 0 Total: 61.2
kUSD Task description Use and promote identification guide (5.2.1) as an integration methodology with engineers (from bogie, carbody, interiors) and designers. Follow the first 7 steps of the guide for identification and selection of part candidates. In 2017, identify and evaluate 1 part for each of the following category: safety critical, non-critical, primary structure, secondary structure, aesthetic, prototype, production, and repairs.
2017
Q1-
Q2
Tot
al
19 k
US
D
OD
C
0 H
ours
22
4 h
3D scanning (4.3.1) BT AM specialist to present AM and scanning to representatives from Services and Procurement and then identify BT needs. Identify an external partner for 3D scanning initiative. The most known and cited in case studies are Creaform and Faro. Conduct a preliminary case of scanning and generation of a file usable by a 3D printer for a spare parts application. Use a spare part such as ‘…’. Validate BT needs such as resolution, maximum part size, scanning speed, and need to capture internal features. Gather information from the preliminary case on scanner technology and software selection and use, on the scanning process, tools and skills (scanning, points cloud conversion)
2017
Q2-
Q4 T
otal
4.
3kU
SD
OD
C
0

190
required. Validate business model on options such as renting or buying a 3D scanner, training required and/or assistance from service provider. Share results and recommendations with Knowledge Domain.
Hou
rs
50 h
Resume AM Knowledge Domain activities and include Prototyping center and EMO representatives in meetings (5.2.3). Plan one group call every two months, and use cases owners’ calls every month. Conduct technology watch on build speed (5.5.1), build size (5.6.1), new materials and standards (3.1.1). Update the AM SharePoint with latest news on AM related to rail applications.
2017
-201
9 T
otal
/ ye
ar
35.7
kU
SD
OD
C
Hou
rs/y
ear
420
Increase AM networking and use external ressources, for example : participate in Réseau Québec-3D committees (in particular Comité de mise en place de la chaîne de valeur and Comité de recherche et développement) and annual conferences. Join Canada Makes and participate in future AM workshops and trainings. Report to Knowledge Domain (KD) on Quebec & Canada AM training offering and events. The same approach should be used for Germany and United States AM activities and reported to KD.
2017
Q1-
-201
9 T
otal
/yea
r 33
.6 k
USD
O
DC
/yea
r 3
kUSD
H
ours
/yea
r 36
0
Conduct focus groups meetings for a more thorough understanding of AM maturity at BT, as compared to AM survey results, specifically with Methods groups, Internal Supply Chain (incl. PPC and Operations) and teams working near assembly and production lines (5-6 persons). Use the survey as a basis for discussion and ask additional open questions to identify Methods and supply-chain needs that could be met using AM.
2017
Q2
Tot
al
4.8
kUS
D
OD
C
0 H
ours
56
h
Start to develop DfAM (Design for Additive Manufacturing) mindset by organizing a series of learning activities (metal powder bed fusion, metal directed energy deposition, polymer extrusion, and polymer powder bed fusion) offered to all engineering and operations/methods groups. Learning activities themes should focus on opportunities and limits of AM and the preparation steps (supports, orientation, nesting, etc.) and post-processing when applicable. DfAM knowledge will gradually be gained through use cases with external partners. eLearning approaches shall be used to accelerate AM deployment. 20
17 Q
3-Q
4 T
otal
46
.8 k
USD
O
DC
0
Hou
rs
550
h
Input & relations to other WP Input: AM survey, AM survey maturity level 1-initial, identification guide, past Knowledge

191
Domain meeting’s material. This ‘AM deployment’ work package will help in defining future use cases and work packages. It isa prerequisite for the work package on BT AM cost model (WP1.2). Budget details per task for 2017 6 stakeholders + 1 AM specialist presenter during 8 hours : 7x 8= 56 hours, could be conducted every quarter = 56h x 4/year TOTAL HOURS=224 h AM specialist + 1 representative from Services and Procurement 1st meeting 2h : 3 persons x 2h= 6h, BT group meetings with scanners representatives : 2 meetings x 4 persons x 3h=24h, equipment selection meeting : 3 persons x 3h= 9h, business model meeting: 3 persons x 3h= 9h, TOTAL HOURS= ~50 h 15 KD members x 6 calls/year x 1h (90h)+ 12 use cases calls/year x 2hour x 5 members(120h) + calls preparation (60 h)= 270 h, technology watch 1 person x 8h/month x 12 =~100 hours, SharePoint updates 1 person x 50h = 50, TOTAL HOURS=420 h per year RQc3D conference: committee participation 1 persons x 8h/month x 12=96h, 1 persons x 24h=24 h, 1x 1000$ conference tickets (ODC: Other Direct Cost), TOTAL QC=120h +1000$ ODC, TOTAL QC+USA+Germany=~360h + 3000$ ODC focus groups 6 persons + AM presenter, introductory meeting: 7 persons x 2h=14h, maturity assessment meeting: 7 x 3h=21h, maturity results meeting: 7 x 3h=21h TOTAL HOURS=56h 1 AM specialist presenting trainings: 4/year x (preparation 8h + presentation 8h)= 64h, 20 ‘’students’’ x 4/year x 6h =480h, TOTAL HOURS=~550h Deliverables 1. AM candidates list 2. executive summary on 3D scanning technology choice, 3D scanner business case, stl file and printed model of scanned spare part. 3. technology watch summary, updated SharePoint 4. conference findings, adoption of AM in Quebec, Canada, USA, and Germany 5. focus groups activities results 6. Learning activities trainings documents Reference documents IDENTIFICATION_guide_vf.xlsx AM survey link
External partners -Creaform consultant(s) -Faro consultant(s) -Réseau Québec-3D -Canada Makes - Bombardier Aerospace


LIST OF REFERENCES
3D Printing Industry. 2015. "3D Printing Industry 3D Printer News, Reports, Directory and Videos". <http://3dprintingindustry.com/>. Accessed November 26, 2015.
Aboulkhair, Nesma T., Nicola M. Everitt, Ian Ashcroft and Chris Tuck. 2014. "Reducing
porosity in AlSi10Mg parts processed by selective laser melting". Additive Manufacturing, vol. 1–4, p. 77-86.
Antunes, Pedro, Paulo Carreira and Miguel Mira da Silva. 2014. "Towards an energy
management maturity model". Energy Policy, vol. 73, p. 803-814. ASTM. 2012a. New Guide for Design for Additive Manufacturing. ASTM WK38342. West
Conshohocken, PA. < www.astm.org >. Accessed November 27, 2016. ASTM. 2012b. Standard Terminology for Additive Manufacturing Technologies. F2792-12a.
West Conshohocken, PA, 3 p. Accessed September 4, 2014. ASTM. 2014. Standard Specification for Additive Manufacturing Titanium-6 Aluminum-4
Vanadium with Powder Bed Fusion. F2924-14. West Conshohocken, PA. Accessed November 27, 2016.
Bach, James. 1994. "The Immaturity of CMM". American Programmer. Becker, Jörg, Ralf Knackstedt and Jens Pöppelbuß. 2009. "Developing Maturity Models for
IT Management". Business & Information Systems Engineering, vol. 1, no 3, p. 213-222.
Bersin by Deloitte. 2015. "Organizational Maturity". <http://www.bersin.com/Lexicon/
Details.aspx?id=14272>. Accessed November 27, 2015. Burcher, Peter, Gloria Lee and Amrik Sohal. 1999. "Lessons for implementing AMT: Some
case experiences with CNC in Australia, Britain and Canada". International Journal of Operations & Production Management, vol. 19, no 5/6, p. 515-527.
Buvat, Gaël. 2016. "Conception d'un outil d'aide à la décision de technologies de fabrication
additive en milieu aéronautique". Mémoire de maîtrise. Montréal, École de technologie supérieure.
Calignano, F., D. Manfredi, E. P. Ambrosio, L. Iuliano and P. Fino. 2012. "Influence of
process parameters on surface roughness of aluminum parts produced by DMLS".

194
The International Journal of Advanced Manufacturing Technology, vol. 67, no 9, p. 2743-2751.
CMMI Product Team. 2010. CMMI ® for Development, Version 1.3. Software Engineering
Institute, 482 p. Co, Henry C., B. Eddy Patuwo and Michael Y. Hu. 1998. "The human factor in advanced
manufacturing technology adoption: An empirical analysis". International Journal of Operations & Production Management, vol. 18, no 1, p. 87-106.
Concept Laser. 2009. "Laser Melting Metal, Additive Manufacturing - Automotive Industry -
Concept Laser". <http://www.concept-laser.de/en/industry/automotive.html>. Accessed December 17, 2014.
Costa, S.E. Gouvea da, and E. Pinheiro de Lima. 2008. "Advanced manufacturing technology
adoption: an integrated approach". Journal of Manufacturing Technology Management, vol. 20, no 1, p. 74-96.
De Bruin, Tonia, Ronald Freeze, Uday Kaulkarni and Michael Rosemann. 2005.
"Understanding the Main Phases of Developing a Maturity Assessment Model". In Australasian Conference on Information Systems (ACIS). (Australia, New South Wales, Sydney, November 30 - December 2, 2005).
Deloitte University Press. 2015. 3D opportunity for product design: Additive manufacturing
and the early stage. Dresch, Aline, Daniel Pacheco Lacerda and José Antônio Valle Antunes Jr. 2015. Design
Science Research : A Method for Science and Technology Advancement. Springer International Publishing, 161 p.
EOS GmbH. 2013. "Aerospace: Light, Cost and Resource Effective – Researching
Sustainability of Direct Metal Laser Sintering (DMLS)". <http://www.eos.info/press/customer_case_studies/eads>. Accessed November 27, 2014.
EWI. 2015. "Additive Manufacturing Consortium Operated by EWI".
<https://ewi.org/additive-manufacturing-consortium/>. Accessed November 28, 2015. Fraser, Peter, James Moultrie and Mike Gregory. 2002. "The use of maturity models/grids as
a tool in assessing product development capability". In Engineering Management Conference, 2002. IEMC'02. 2002 IEEE International. Vol. 1, p. 244-249. IEEE.
Fraunhofer-Gesellschaft. 2015. "Additive manufacturing – The 3D revolution for product
manufacturing in the digital age (AGENT-3D)". <http://www.iws.fraunhofer.de/en/

195
business_fields/additive_manufacturing_printing/printing_technologies/projects/agent-3d.html>. Accessed November 28, 2015.
Gagnon, Yves-Chantal. 2006. Prenez part au changement technologique : guide
d'accompagnement des intervenants. Sainte-Foy: Presses de l'Université du Québec, 154 p.
Gebhardt, Andreas. 2011. Understanding Additive Manufacturing - Rapid Prototyping,
Rapid Tooling, Rapid Manufacturing. Hanser Publishers, 164 p. Ghazy, Mootaz M. 2012. "Development of an Additive Manufacturing Decision Support
System (AMDSS)". Doctoral Thesis. Newcastle University, 233 p. Gibson, Ian, Brent Stucker and David Rosen. 2015. Additive Manufacturing Technologies:
3D Printing, Rapid Prototyping, and Direct Digital Manufacturing. Springer-Verlag New York, 498 p.
Gomez, J., and P. Vargas. 2012. "Intangible resources and technology adoption in
manufacturing firms ". Research Policy, vol. 41, no 9, p. 1607-1619. Hevner, Alan R. 2004. "Design Science in Information Systems Research". MIS Quarterly,
vol. 28, no 1, p. 75-105. Huet, Gregory, Stephen J. Culley, Christopher A. McMahon and Clément Fortin. 2007.
"Making sense of engineering design review activities". Artificial Intelligence for Engineering Design, Analysis and Manufacturing, vol. 21, no 3, p. 243-266.
ISO. 2013. Space systems - Definition of the Technology Readiness Levels (TRLs) and their
criteria of assessment. ISO 16290. ISO. 2015. Additive manufacturing -- General principles -- Part 2: Overview of process
categories and feedstock. ISO 17296-2. Geneva, Switzerland, 8 p. Johannesson, Paul, and Erik Perjons. 2014. An Introduction to Design Science. Springer
International Publishing, 197 p. Kagermann, Henning, Wolfgang Wahlster, Johannes Helbig and acatech. 2013.
"Recommendations for implementing the strategic initiative INDUSTRIE 4.0". Frankfurt.
Karlsson, Christer, Margaret Taylor and Andrew Taylor. 2010. "Integrating new technology
in established organizations: A mapping of integration mechanisms". International Journal of Operations & Production Management, vol. 30, no 7, p. 672-699.

196
Kerbrat, Olivier. 2009. "Méthodologie de conception d'outillages modulaires hybrides basée sur l'évaluation quantitative de la complexité de fabrication". Thèse de doctorat. Cachan, École Centrale de Nantes, 202 p.
Klimko, G. 2001. "Knowledge management and maturity models: Building common
understanding". In 2nd European Conference on Knowledge Management. p. 269-278.
Koc, Tufan, and Erhan Bozdag. 2007. "An empirical research for CNC technology
implementation in manufacturing SMEs". The International Journal of Advanced Manufacturing Technology, vol. 34, no 11, p. 1144-1152.
Lindemann, Christian, Thomas Reiher, Ulrich Jahnke and Rainer Koch. 2015. "Towards a
sustainable and economic selection of part candidates for additive manufacturing". Rapid Prototyping Journal, vol. 21, no 2, p. 216-227.
Mellor, Stephen, Liang Hao and David Zhang. 2014. "Additive manufacturing: A framework
for implementation". International Journal of Production Economics, vol. 149, p. 194-201.
Miller, G. A. 1956. "The magical number seven plus or minus two: some limits on our
capacity for processing information". Psychol Rev, vol. 63, no 2, p. 81-97. MTC. 2015. "Net Shape & Additive Manufacturing". <http://www.the-mtc.org/our-
technologies/net-shape-additive-manufacturing>. Accessed November 28, 2015. Munguía, Javier, Joaquim Lloveras, Sonia Llorens and Tahar Laoui. 2010. "Development of
an AI-based Rapid Manufacturing Advice System". International Journal of Production Research, vol. 48, no 8, p. 2261-2278.
Ngai, E. W. T., D. C. K. Chau, J. K. L. Poon and C. K. M. To. 2013. "Energy and utility
management maturity model for sustainable manufacturing process". International Journal of Production Economics, vol. 146, no 2, p. 453-464.
Ning, Y., Z.-P. Fan and B. Feng. 2006. "Knowledge capability: A definition and research
model". In 1st International Conference on Knowledge Science, Engineering and Management, KSEM 2006, August 5, 2006 - August 8, 2006. (Guilin, China). Springer Verlag.
OECD. 2013. "Glossary of Statistical Terms - Advanced manufacturing technology
definition". <https://stats.oecd.org/glossary/detail.asp?ID=52>. Accessed November 28, 2015.
197
Oettmeier, Katrin, and Erik Hofmann. 2016. "Additive manufacturing technology adoption: an empirical analysis of general and supply chain-related determinants". Journal of Business Economics, p. 1-28.
OSD Manufacturing Technology Program. 2012. "Manufacturing Readiness Level (MRL)
Deskbook ". 82 p. Pahl, G., and W. Beitz. 1994. Engineering Design. London: The Design Council/Springer. Pahl, Gerhard, Wolfgang Beitz, Jörg Feldhusen and Karl-Heinrich Grote. 2007.
"Introduction". In Engineering Design: A Systematic Approach. p. 1-25. London: Springer London.
Pfeifer, T., W. Eversheim, W. Konig and M. Weck. 1994. "Rapid prototyping: The Way
Ahead". In Manufacturing Excellence - The Competitive Edge. p. 173-182. London: Chapman & Hall.
Pigosso, Daniela C. A., Henrique Rozenfeld and Tim C. McAloone. 2013. "Ecodesign
maturity model: a management framework to support ecodesign implementation into manufacturing companies". Journal of Cleaner Production, vol. 59, p. 160-173.
PMI. 2003. Organizational Project Management Maturity Model (OPM3): Knowledge
Foundation. Newtown Square, Pennsylvania: Project Management Institute. President's Council of Advisors on Science and Technology. 2011. Report to the President
on ensuring American Leadership in Advanced Manufacturing. <https://www.whitehouse.gov/sites/default/files/microsites/ostp/pcast-advanced-manufacturing-june2011.pdf>. Accessed November 25, 2015.
PwC. 2016. "3D Printing comes of age in US industrial manufacturing".
<http://www.pwc.com/us/en/industrial-products/3d-printing-comes-of-age.html>. Accessed April 30, 2016.
Rodrigue, Hugo. 2010. "Méthodologie de conception et d'optimisation de mécanismes
fabriqués par fabrication rapide". Thèse de maîtrise. Montréal, Université de Montréal, 75 p.
Sein, Maung K., Ola Henfridsson, Sandeep Purao and Matti Rossi. 2011. "Action Design
Research". MIS Quarterly, vol. 35, no 1, p. 37-56. Smith, Paul, and Allan Rennie. 2010. "Computer aided material selection for additive
manufacturing materials". Virtual and Physical Prototyping, vol. 5, no 4, p. 209-213.
198
Sohal, A. S., J. Sarros, R. Schroder and P. O'Neill. 2006. "Adoption framework for advanced manufacturing technologies". International Journal of Production Research, vol. 44, no 24, p. 5225-5246.
Spierings, A. B., and G. Levy. 2009. "Comparison of density of stainless steel 316L parts
produced with selective laser melting using different powder grades ". In Solid Freeform Fabrication (Austin, Texas).
Stratasys. 2014. "Bianchi Bikes Accelerates Development Cycle with 3D Printing".
<http://www.stratasys.com/resources/case-studies/consumer-goods/bianchi-bikes>. Accessed February 6, 2015.
Succar, Bilal. 2010. "Building Information Modelling Maturity Matrix". In Handbook of
Research on Building Information Modelling and Construction Informatics: Concepts and Technologies, IGI Publishing. p. 65-103.
Tardif, Jacques 2006. L'évaluation des compétences. Documenter le parcours de
développement. Montréal: Chenelière Éducation, 384 p. The Computer Integrated Construction Research Program. 2012. BIM Building Information
Modeling Planning Guide for Facility Owners, Version 1.01. University Park, PA: The Pennsylvania State University, 96 p. < http://bim.psu.edu >.
Wheeler, Andrew. 2015. "Volvo Cuts Turnaround Time by Whopping 94% with 3D
Printing". <http://3dprintingindustry.com/news/volvo-cuts-turnaround-time-by-whopping-94-with-3d-printing-45012/>. Accessed March 28, 2015.
Wohlers, Terry T., and T. Caffrey. 2015. Wohlers Report 2015 : 3D Printing and Additive
Manufacturing State of the Industry. Annual Worldwide Report. Fort Collins, Colorado, 314 p.
Zegard, Tomás, and Glaucio H. Paulino. 2016. "Bridging topology optimization and additive
manufacturing". Structural and Multidisciplinary Optimization, vol. 53, no 1, p. 175-192.