Embed Size (px)
Citation preview
Development of a large scale flow cytometry screening method
to identify novel treatment options for cancer
Christian Naucke
Department of Radiation Biology
Institute for Cancer Research
The Norwegian Radium Hospital
Oslo University Hospital
Dissertation submitted for the degree of Ph.D.
Department of Clinical Medicine
Faculty of Medicine
University of Oslo

© Christian Naucke, 2021 Series of dissertations submitted to the Faculty of Medicine, University of Oslo ISBN 978-82-8377-866-3 All rights reserved. No part of this publication may be reproduced or transmitted, in any form or by any means, without permission. Cover: Hanne Baadsgaard Utigard. Print production: Reprosentralen, University of Oslo.
3
Table of Contents
1 Acknowledgements ......................................................................................................................... 5
2 List of papers ................................................................................................................................... 7
3 Summary.......................................................................................................................................... 9
4 Introduction ................................................................................................................................... 13
4.1 Cell cycle ................................................................................................................................ 14
4.1.1 Cell cycle regulation and checkpoints ........................................................................... 14
4.2 DNA damage induction ......................................................................................................... 16
4.2.1 Endogenously induced DNA damage ............................................................................ 17
4.2.2 DNA damage induced by ionized radiation ................................................................... 17
4.3 DNA damage response pathways .......................................................................................... 18
4.3.1 DNA damage repair pathways ....................................................................................... 19
4.3.2 DNA damage and repair marker γ-H2AX ....................................................................... 20
4.4 Repair of DNA double strand breaks ..................................................................................... 21
4.4.1 NHEJ ............................................................................................................................... 23
4.4.2 HR .................................................................................................................................. 23
4.4.3 Other end resection dependent DNA repair pathways ................................................. 25
4.5 Checkpoint activation after damage ..................................................................................... 25
4.5.1 G1/S Checkpoint ............................................................................................................ 25
4.5.2 S-phase Checkpoint ....................................................................................................... 26
4.5.3 G2/M Checkpoint .......................................................................................................... 29
4.6 Abnormal cell cycle and DNA damage response in cancer ................................................... 30
4.7 Cancer treatment modalities ................................................................................................ 30
4.7.1 Wee1 and Chk1 inhibitors ............................................................................................. 30
4.7.2 Radioresistance ............................................................................................................. 32
4.8 Drug repurposing ................................................................................................................... 33
6 Aim of study................................................................................................................................... 35
7 Summary of papers ....................................................................................................................... 37
7.1 Paper I .................................................................................................................................... 37
7.2 Paper II ................................................................................................................................... 39
7.3 Paper III .................................................................................................................................. 41
8 Discussion ...................................................................................................................................... 43
8.1 Screen Endpoints analysis ..................................................................................................... 43
8.2 Considerations regarding yH2AX as a DNA damage marker ................................................. 45

4
8.3 Screens with Wee1 and Chk1 inhibitors ................................................................................ 46
8.4 DNA repair screen: multiple HDACS inhibitors are candidate hits ........................................ 47
8.5 Cancer cell lines as a model system ...................................................................................... 50
8.6 Flow Cytometry in a large scale screen setup ....................................................................... 51
9 Concluding remarks ....................................................................................................................... 53
10 Reference list ............................................................................................................................. 55
Appendix: Papers I-III

5
1 Acknowledgements
The work presented in this thesis was carried out at the Department of Radiation Biology at the
Norwegian Radium Hospital, Oslo University Hospital from 2016 to 2020. The funding received from
the South-Eastern Norway Regional Health Authority (Helse Sør-Øst) is gratefully acknowledged.
Most importantly, I would like to thank my supervisor Randi Syljuåsen for being a positive light
guiding me through the PhD. I couldn’t have wished for a more supporting and understanding
mentor. Your ability to spark enthusiasm and scientific curiosity was every time an uplifting
experience, which I will never forget. I can’t express how much I appreciate this whole journey with
you.
I also would like to thank the whole group, former and present members, for creating a warm and
helping working environment. I appreciate everyone for always having an open ear for questions and
discussion in scientific and other matters. Same goes for everyone in the whole department. Thanks
to all for your kindness, you all made my start in a new country so easy, and I never felt alone. A
special thanks to Trond Stokke and his flow cytometry core facility team for your guidance, especially
at the start of my PhD.
I couldn’t imagine achieving anything without my amazing family and friends, supporting and
believing in me throughout every step in my life. Thank you all so much, I love you.

6

7
2 List of papers
List of papers included in the thesis, referred to as Papers I-III in the following text:
Paper I
Combined inhibition of Wee1 and Chk1 gives synergistic DNA damage in S-phase due to
distinct regulation of CDK activity and CDC45 loading
Sissel Hauge, Christian Naucke, Grete Hasvold, Mrinal Joel, Gro Elise Rødland, Petras
Juzenas, Trond Stokke, Randi G. Syljuåsen
Oncotarget. 2017; 8: 10966-10979.
Paper II
A flow cytometry based screen reveals the antifungal compound Ciclopirox as more potent in
combination with CHK1 than WEE1 inhibition
Christian Naucke, Lilian Lindbergsengen, Trond Stokke, Randi G. Syljuåsen
Manuscript
Paper III
A flow cytometry based large-scale screen to identify compounds that inhibit DNA repair
after radiation
Christian Naucke, Trond Stokke, Randi G. Syljuåsen
Manuscript

8
9
3 Summary
Cancer is a complex and severe health issue, which is characterized by abnormal cells with
uncontrolled growth. Depending on the cancer and the patient, different treatment options
are available, for example surgery, chemotherapy, radiation therapy or a combination of
them. The radiation treatment and many chemotherapeutic drugs induce lethal DNA
damage in the cancer cells and some drugs are designed for targeting the changes in cancer
cells compared to normal cells. Unfortunately, these treatments can have limited success
rate in the case the cancer has acquired radioresistance or the chemotherapeutic drug is not
specific enough.
The aim of my thesis was to identify novel cancer treatment options utilizing high
throughput flow cytometry screens. The screens were developed and optimized to detect
DNA damage and repair after combination treatment with radiation and compound libraries,
or after combination treatment with a DNA damaging drug and compound libraries. For the
general screen setup, cells were plated in 384-well plates pre-printed with different
compound libraries. The compounds target specific biological functions. One library
consisted of FDA-approved drugs used for treatment of other diseases than cancer. Using
drugs with known functions in other diseases and applying them for potential cancer
treatment, is called drug repurposing. This can likely facilitate a more rapid clinical
translation of screen results. The samples in the 384-well plates were stained with an
antibody to the DNA damage marker yH2AX, to detect DNA damage, and with a DNA stain to
assess cell cycle position. In some screens cells were co-stained with an antibody to the
mitotic marker phosphorylated Histone 3 (pH3), to monitor the G2 checkpoint.
Wee1 and Chk1 are important kinases in the DNA damage response and in the regulation of
cell cycle checkpoints. The Wee1 inhibitor MK1775 is known to cause S-phase DNA damage
and G2 checkpoint abrogation. In the first paper, the screen was set up to discover
compounds that synergistically increase the S-phase DNA damage effects of MK1775. The
screen was optimized for Reh leukemia suspension cell line and 1664 compounds were
tested in combination with MK1775. The yH2AX marker was used to detect DNA damage
during S-phase and two Chk1 inhibitors, LY2603618 and AZD7762, were among the
candidate hits. Combination treatment with MK1775 and a Chk1 inhibitor gave a synergistic
increase in S-phase DNA damage. Both Chk1 and Wee1 inhibitors are being tested in clinical
10
studies, most often together with other cancer treatments. It is also known that each
inhibitor causes high DNA damage in S-phase and abrogation of cell cycle checkpoints. Some
preclinical studies had demonstrated synergistic effects on cancer growth when using Chk1
and Wee1 inhibitors together, but the underlying mechanism was not yet determined. The
results of the first paper gave some insight into the different functions regarding Chk1 and
Wee1. Both kinases, Chk1 and Wee1, influence the G2 cell cycle checkpoint by regulating the
inhibitory phosphorylation of CDK/cyclin complexes. Our results suggest another function in
the regulation of replication initiation, especially regarding Chk1 and the replication factor
CDC45. In our established model, if Wee1 is inhibited alone, the active Chk1 limits replication
catastrophe by suppressing CDC45 loading. On the other hand, inhibition of Chk1 alone
results in limited CDC45 loading due to Wee1 suppressing the CDK activity. The simultaneous
inhibition of Chk1 and Wee1 removes the restrictions on CDC45 loading, which leads to
unscheduled replication initiation and replication catastrophe.
In the second paper, we wanted to further investigate the mechanistic differences between
Wee1 and Chk1 inhibition. For this paper the screen setup consisted of 355 compounds, and
was modified to include a barcoding step which enables the detection of even small
deviations of the yH2AX signal during S-phase. In this screen the Wee1 inhibitor MK1775
and the Chk1 inhibitor LY2606368 were used together with the same drug library, to
compare screen results for MK1775 and LY2606368. The resulting candidate hits from the
performed screens were compounds which showed synergistic effects with MK1775 or
LY2606368, or with both. Ciclopirox, one of the candidate hits and an antifungal agent,
showed a stronger synergistic effect when combined with LY2606368 than MK1775. We
further investigated if the increased S-phase damage caused by the synergy of Ciclopirox and
LY2606368 also has an effect on the cell viability. With the CellTiterGlo assay we could
observe a bigger synergistic decrease in the cell viability with the combination of Ciclopirox
and LY2606368 compared to Ciclopirox and MK1775. Further experiments are needed to
investigate the mechanism behind the synergistic effect of Ciclopirox and the Chk1 inhibitor
LY2606368, but Ciclopirox could have the potential to be used in future clinical applications.
Furthermore, the screen setup could be used in future screens, and other candidate hits
could also lead to novel treatment options and insight into Chk1 and Wee1 inhibition.
11
In the third paper, we wanted to discover potential compounds that could interfere with
DNA repair after radiation. One of the problems with standard radiation therapy is the
chance for radioresistant cancers, due to, for example, increased DNA repair capability.
Under normal circumstances during a treatment with radiation, the radiation dose is enough
to cause lethal DNA damage in the cancer cells. In the mentioned case of radioresistance, a
more promising treatment could be a combination treatment with a DNA damage repair
inhibitor and radiation therapy. The screen setup was modified to include two time points.
One time point is shortly after irradiation, at 30 minutes, and the other is at six hours after
irradiation. The 30 minute time point allows us to monitor the peak of the yH2AX signal from
the induced DNA damage of the irradiation and/or the compound. The six hours time point
will show us how much DNA damage was repaired, which will be represented as a decrease
in the yH2AX signal compared to the signal at 30 minutes. In addition, we could observe
G2 cell cycle checkpoint abrogation with the mitotic marker pH3. This screen was performed
in the Reh cell line and in A549, a lung cancer cell line. We used several different libraries
accumulating in over 1900 compounds. The results gave several candidate hits which are
known radiosensitizers and known to interfere with DNA damage repair, but also several
compounds which are not known to have such functions.
In conclusion, two different screen setups were developed, that can be used to identify
promising new combination treatments for cancer. The screen results obtained throughout
our three papers revealed many candidate hits. Several of these will be interesting to follow
up in future studies to explore molecular mechanism and clinical potential.

12

13
4 Introduction
Cancer is a complex heterogeneous disease with poor outcome and the common and
established therapy modalities often show low success rates. Adaptation of each therapy,
targeted to the individual patient and his specific type of cancer, is needed and in the focus
of current research [1, 2]. Exploiting specific differences between normal and cancer cells,
for example in the cell cycle or in the DNA damage response pathways, is a step to find more
selective targets for cancer therapy. Possible targets could be from the DNA repair or cell
cycle checkpoint pathways, since they are, depending on the cancer, frequently mutated,
upregulated, or not as efficient as in a normal cell.
Another issue is the resistance of cancer cells to standard treatments such as radiotherapy.
Some cancers are radio resistant due to mutations even before treatment or can become
resistant after radiation therapy. Radio resistance is a big challenge for the treatment
success [3]. One way to improve radiotherapy is therefore to add DNA repair inhibitors.
The development of novel drugs, which can be used for cancer treatment, is a challenging
and over a decade long process until a new drug can be tested or used in patients. Therefore
some researchers try to find already existing drugs that could potentially be used in new
applications for treatment of cancer patients. The benefit of using established drugs would
be to avoid the long developing, approving and testing phases in mouse models and human
trials. This process, called drug repurposing, could also lead to improved treatment
combinations [4, 5].
The list of possible drugs that could be repurposed is too long to check one by one. This
testing process can be sped up by using a high throughput screening method. Novel
automated methods, like high throughput flow cytometry, facilitate the screening process
[6]. A multiparameter flow cytometry screen enables to collect data of several different
endpoints in one experiment. This allows more information to be obtained from each screen
experiment.
This introduction will cover background information about the cell cycle and cell cycle
checkpoints, damage and repair of DNA, novel treatment options for cancer, and drug
repurposing.

14
4.1 Cell cycle
The cell cycle describes the repeatable phases a cell passes through to achieve controlled cell
division. It will pass through Gap 1 Phase (G1), Synthesis-Phase (S) and Gap 2 Phase (G2)
until the cell reaches Mitosis-Phase (M) (Figure 1). The first three phases (G1, S and G2) are
called the interphase. The whole interphase prepares the cell for the mitosis, which divides
the cell into two identical daughter cells. The M-Phase can be further structured in Prophase,
Metaphase, Anaphase and Telophase. After the cell division a cell could enter the resting
phase called Gap 0 (G0), or in the presence of mitogenic factors could stay in the cell cycle
for future cell divisions. Any unresolved complications during the cell cycle can lead to cell
death or senescence, which means the irreversible state of non-proliferation [7].
Figure 1: Cyclin-CDK dependent Cell cycle progression
The four main phases of the cell cycle consists of two gap phases, the fist (G1) and second
(G2) gap phase, separating the DNA synthesis phase (S) and the mitosis (M). Cyclins and
CDKs form complexes to promote cell cycle progression and transition to the next phase.
4.1.1 Cell cycle regulation and checkpoints
Controlling each step in the cell cycle is important to create healthy identical daughter cells.
Therefore checkpoints ensure that every phase was completed correctly before the cell
progresses further in the cell cycle. Registered failures during the cell cycle lead to a halt of
the progression of the cell until it repairs the failure or starts apoptosis. The main proteins
15
involved in a normal cell cycle progression are the Cyclin-dependent kinases (CDKs), which
are mostly stably expressed throughout the cell cycle and are a subunit of a heterodimer [8].
The other part of the heterodimer is an array of cell cycle molecules, the cyclins. Most of the
cyclins are generated and destroyed in specific points during the cell cycle. This ensures a
time dependent regulation of each cyclin-CDK complex in the cell cycle phases (Figure 1). In
addition to the binding with the cyclins, the CDKs are also activated throughout the cell cycle
by phosphorylation of the CDK-activating kinases (CAKs) [9, 10]. The different cyclin and CDK
combinations during the cell cycle are numerous, but the following information will focus on
the relevant ones for this thesis.
The first part of the interphase is the G1-phase. In this phase, depending on the presence of
mitogenic factors, the cell enters the quiescent state G0 or starts the proliferation cycle.
Mitogenic factors trigger an expression of cyclinDs, which activate and bind mostly with
CDK4 and CDK6, to prepare for the DNA synthesis. The cyclinE-CDK2 complex is crucial for
the transition from G1 to S-phase. CyclinE expression is limited to G1 and early S-phase and
cyclinA expression increases till the end of the S-phase. CyclinA activates and also binds to
CDK2 and drives the cell cycle from S-phase to G2. CyclinAs also activate CDK1 at the
beginning of G2, and both the CyclinA-CDK1 and CyclinB-CDK1 complexes can drive the entry
from G2 into mitosis. The CyclinB-CDK1 complex pulls the cell trough the mitosis [11].
Specific control points in the cell cycle are called checkpoints. In response to any
complications these checkpoints would halt or slow down the cell cycle to allow DNA repair,
chromatin remodeling and even sometimes exiting the cell cycle permanently. The
regulation happens mostly on the CDKs in a timely, negative manner. As an example Myt1
and Wee1 kinases can add an inhibitory phosphorylation on the CDK1 and CDK2 at Thr14
and Tyr15 [12, 13]. These inhibitory phosphorylations are removed by the CDC25
phosphatase. Another example would be the CDK inhibitor proteins (CKIs). P27, a CKI of the
CIP/KIP family, can bind to cyclinA-CDK2 complex and inactivate its catalytic activity in late S-
phase [14, 15]. In G1 p21, another CKI, can bind to and inhibit cyclinE-CDK2 [16].
16
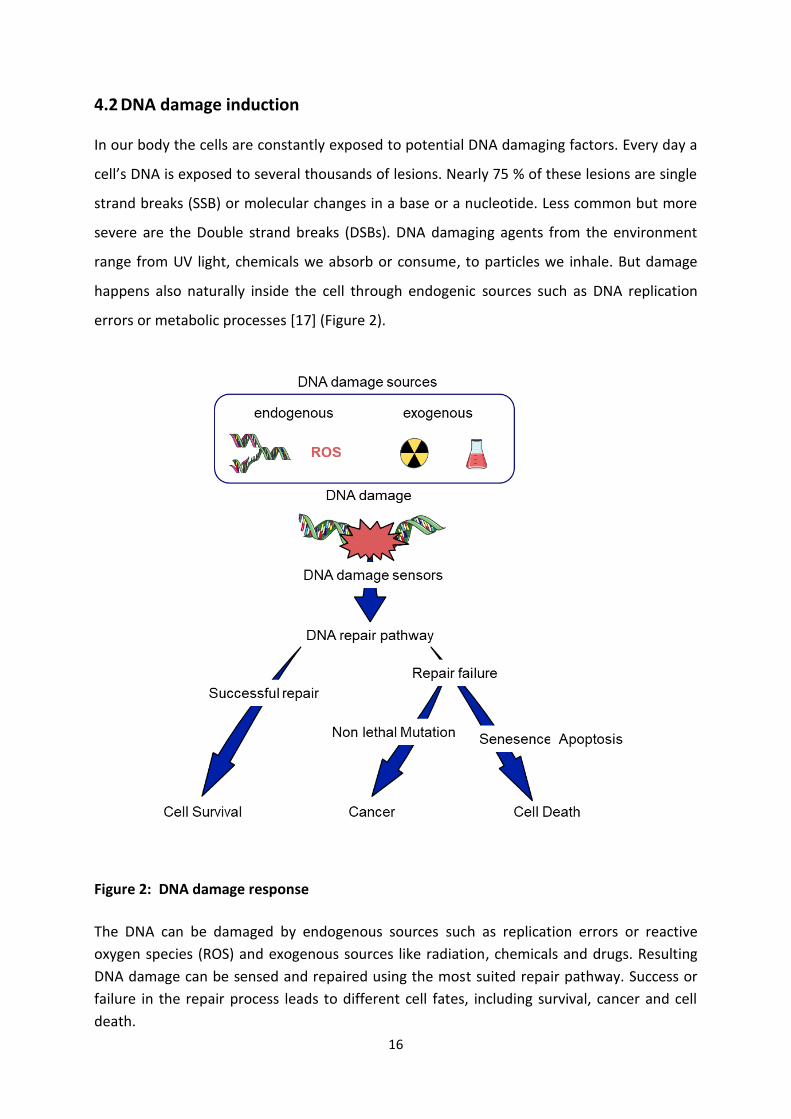
4.2 DNA damage induction
In our body the cells are constantly exposed to potential DNA damaging factors. Every day a
cell’s DNA is exposed to several thousands of lesions. Nearly 75 % of these lesions are single
strand breaks (SSB) or molecular changes in a base or a nucleotide. Less common but more
severe are the Double strand breaks (DSBs). DNA damaging agents from the environment
range from UV light, chemicals we absorb or consume, to particles we inhale. But damage
happens also naturally inside the cell through endogenic sources such as DNA replication
errors or metabolic processes [17] (Figure 2).
Figure 2: DNA damage response
The DNA can be damaged by endogenous sources such as replication errors or reactive
oxygen species (ROS) and exogenous sources like radiation, chemicals and drugs. Resulting
DNA damage can be sensed and repaired using the most suited repair pathway. Success or
failure in the repair process leads to different cell fates, including survival, cancer and cell
death.

17
4.2.1 Endogenously induced DNA damage
Some of the endogenous damage happens during normal metabolism. Reactive oxygen
species (ROS) are byproducts in a cell during oxidative metabolism and inflammation [18].
They are also generated for signaling pathways or as a response to cytokines or growth
factors [19]. ROS induced damage causes mostly single strand breaks (SSB) but two
occurrences of SSB can lead to the more severe double strand break (DSB).The immune
system uses planned DSB induction in the early stages of B and T cell maturation to enable a
higher diversity during the immune response. These DSBs induce class switch recombination
and V(D)J recombination, two important and distinct mechanisms, which depend on the
Non-homologous end joining (NHEJ) DNA repair pathway to resolve [20].
Replication stress can be any event, which disrupts the replication in S-phase and cause DNA
damage. For example the replication of highly repetitive DNA sequences, like telomeres can
cause replication stress. Another factor for replication stress is shortage of proteins for the
assembly of the replication machinery or shortage of nucleotides during the synthesis of
DNA. This shortage during replication can lead to stalling of replication forks. Unresolved
stalled replication forks can collapse resulting in DNA damage [21].
4.2.2 DNA damage induced by ionized radiation
Ionizing radiation (IR) is an example of an exogenous source, which induces DNA damage. IR
induces a broad spectrum of different DNA damage types, from single and double strand
breaks, damaged bases to crosslinks of DNA-DNA and DNA-protein. IR is a photon or particle
that has enough energy to remove an electron from an atom, turning it into an ion. Gamma
rays and X-rays belong to the electromagnetic photon radiation, which have the required
energy to ionize atoms. Examples of particle radiation are alpha and beta particles and
protons [22-25]. The DNA damage can occur as a direct consequence of an ionization event
inside the DNA molecule. Another event that could happen is the creation of stable radicals
from IR exposed oxygen or water which can cause damage in a nearby DNA molecule [26]. If
a cell is exposed to IR all molecules inside the cell have the possibility to become damaged.
However, depending on whether it is a protein with abundance or the more crucial DNA, the
outcomes differ greatly. DNA damage is most critical for the cell.
18
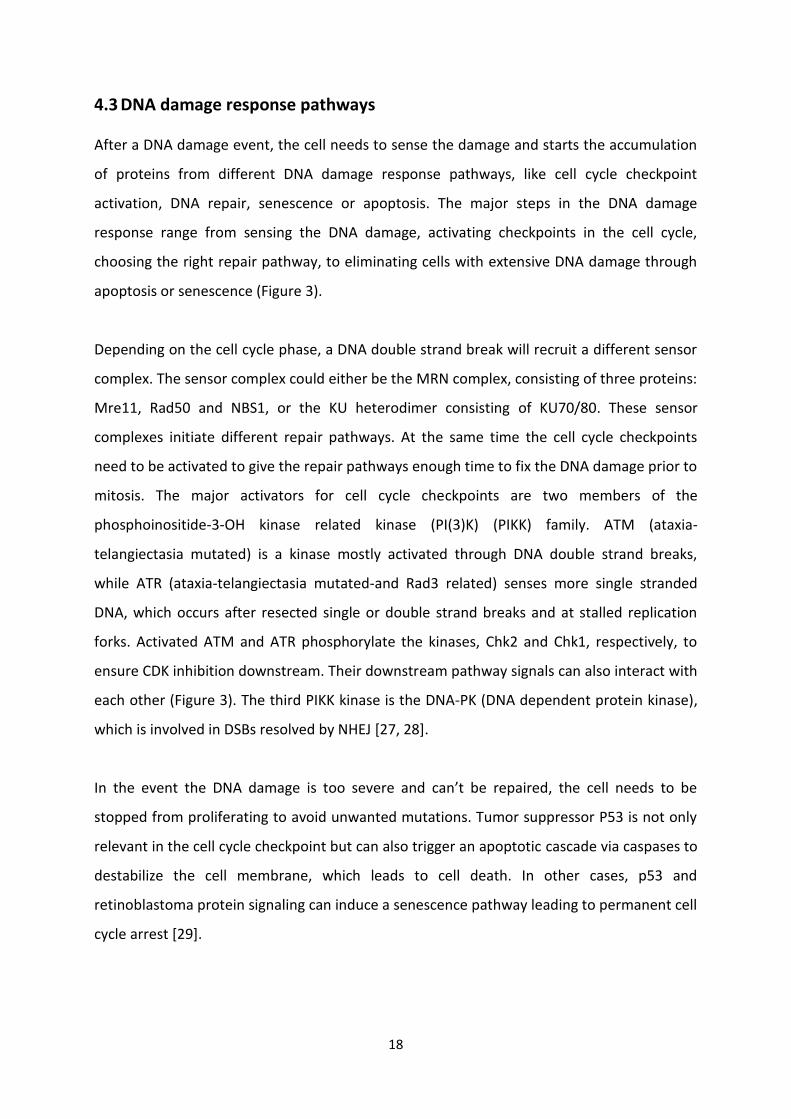
4.3 DNA damage response pathways
After a DNA damage event, the cell needs to sense the damage and starts the accumulation
of proteins from different DNA damage response pathways, like cell cycle checkpoint
activation, DNA repair, senescence or apoptosis. The major steps in the DNA damage
response range from sensing the DNA damage, activating checkpoints in the cell cycle,
choosing the right repair pathway, to eliminating cells with extensive DNA damage through
apoptosis or senescence (Figure 3).
Depending on the cell cycle phase, a DNA double strand break will recruit a different sensor
complex. The sensor complex could either be the MRN complex, consisting of three proteins:
Mre11, Rad50 and NBS1, or the KU heterodimer consisting of KU70/80. These sensor
complexes initiate different repair pathways. At the same time the cell cycle checkpoints
need to be activated to give the repair pathways enough time to fix the DNA damage prior to
mitosis. The major activators for cell cycle checkpoints are two members of the
phosphoinositide-3-OH kinase related kinase (PI(3)K) (PIKK) family. ATM (ataxia-
telangiectasia mutated) is a kinase mostly activated through DNA double strand breaks,
while ATR (ataxia-telangiectasia mutated-and Rad3 related) senses more single stranded
DNA, which occurs after resected single or double strand breaks and at stalled replication
forks. Activated ATM and ATR phosphorylate the kinases, Chk2 and Chk1, respectively, to
ensure CDK inhibition downstream. Their downstream pathway signals can also interact with
each other (Figure 3). The third PIKK kinase is the DNA-PK (DNA dependent protein kinase),
which is involved in DSBs resolved by NHEJ [27, 28].
In the event the DNA damage is too severe and can’t be repaired, the cell needs to be
stopped from proliferating to avoid unwanted mutations. Tumor suppressor P53 is not only
relevant in the cell cycle checkpoint but can also trigger an apoptotic cascade via caspases to
destabilize the cell membrane, which leads to cell death. In other cases, p53 and
retinoblastoma protein signaling can induce a senescence pathway leading to permanent cell
cycle arrest [29].

19
Figure 3: DNA damage repair overview
Different DNA damage sensors will be recruited to the damage site, resulting in different
DNA damage repair pathways and possible cell cycle arrest.
4.3.1 DNA damage repair pathways
The function and survival of a cell depends on an intact DNA, which is constantly undergoing
change and is exposed to harmful factors. Therefore a cell needs a way to repair DNA
damage. The cell can use several different DNA damage repair pathways depending on the
type of damage. Small base lesions, which are not affecting the DNA helix structure, are
repaired by base excision repair (BER). This kind of damage in form of deamination or
oxidation is the result of DNA decay or can be induced by environmental factors. The DNA
glycosylases play an important part in BER. They separate the wrong DNA base from the
deoxyribose. BER is mostly used during G1. Due to UV radiation exposure, the nucleotides of
the DNA can generate crosslinks between adjacent pyrimidines, which result in the

20
distortion of the DNA helix [30, 31]. Nucleotide excision repair (NER) recognizes and repairs
these aberrations [32]. A special version of DNA damage is the interstrand crosslink
formation, which requires the fanconi anemia (FA) pathway to resolve. The FA proteins of
the pathway act on exogenous damage, mostly from DNA crosslinking agents like cisplatin,
but are also active during S-phase in repair of replication errors [33]. The DNA double strand
repair pathways, Non-homologous end-joining (NHEJ) and Homologous recombination (HR)
will be further explained in later sections.
4.3.2 DNA damage and repair marker γ-H2AX
An important chromatin structure for the cell is the packaging of the DNA in nucleosomes.
These nucleosomes consist of DNA wrapped around eight histone proteins, consisting of two
of each of the four histone families H2A, H2B, H3 and H4 [34]. Histones in general tend to be
modified, like by phosphorylation or acetylation, which can result in changes of chromosome
condensation and recruitment of proteins. One of the four histone families, H2A, can be
further characterized into three subfamilies H2AZ, H2AX and H2A1-H2A2 [35]. The histone
H2A variant H2AX has a special C-terminal motif, SQ(D/E)(I/L/Y)-(end) with a serine at 139
[36], where it can be phosphorylated with the help of proteins from the PIKK family, like
ATM, ATR and DNA-PK [37]. The phosphorylated H2AX on serine 139 is referred to as γ-H2AX
[38]. At the same time dephosphorylation of Tyr 142 occurs, which is phosphorylated under
no damage conditions [39].
Detecting γ-H2AX with an antibody results in a localized focus that is big enough to be
visualized by standard fluorescence microscopy (Figure 4). This is because γ-H2AX occurs not
only at the DSB but also in the vicinity of the break [40]. γ-H2AX plays a vital role in the early
DNA damage response pathway as a signaling factor for repair proteins, such as the MRN
complex, Brca1 and 53BP1. However, the recruitment of these repair proteins to DSB sites is
not relying of γ-H2AX. γ-H2AX rather facilitates to concentrate these repair proteins on the
DNA-DSB [41]. By measuring the formation of DSBs with Pulsed-field Gel Electrophoresis
(PFGE) compared to the formation of γ-H2AX foci with immunofluorescence, it was
demonstrated that one DSB correlates with one γ-H2AX focus [42]. As shown in the same
paper, the kinetics of dephosphorylation of γ-H2AX also mimics the kinetics of DSB repair.
Therefore, γ-H2AX foci can be used as a marker for DNA damage and DNA damage repair.
21
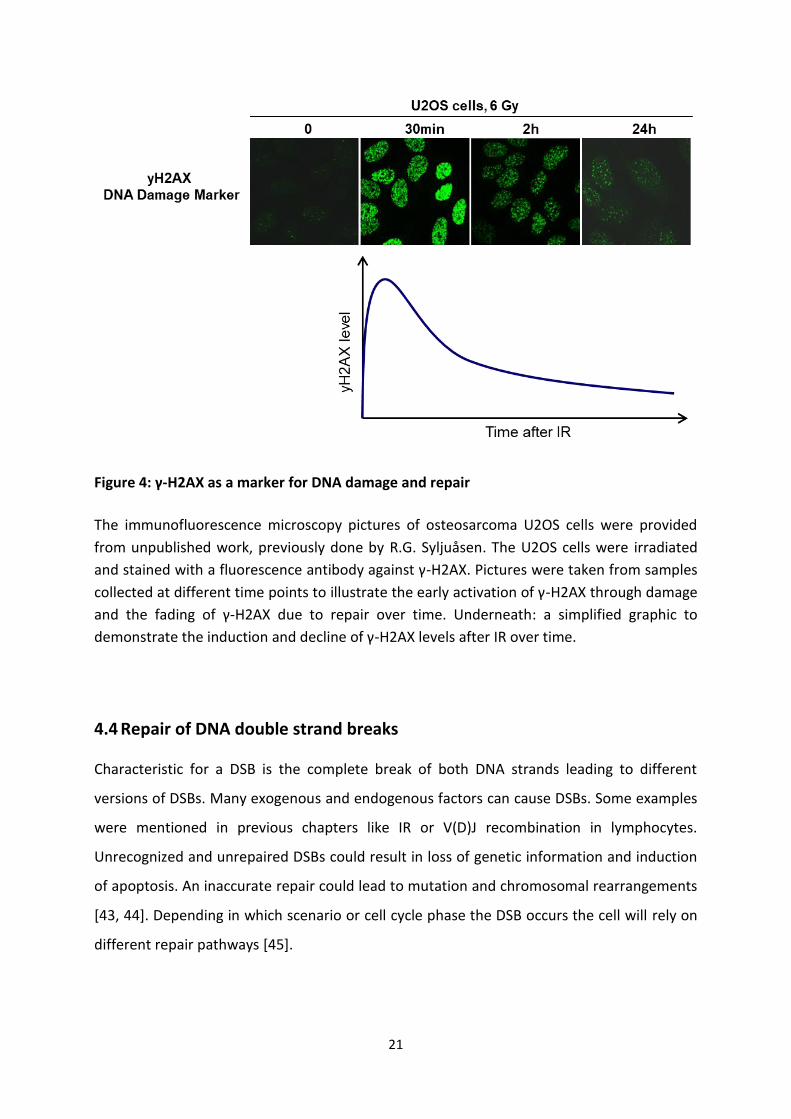
Figure 4: γ-H2AX as a marker for DNA damage and repair
The immunofluorescence microscopy pictures of osteosarcoma U2OS cells were provided
from unpublished work, previously done by R.G. Syljuåsen. The U2OS cells were irradiated
and stained with a fluorescence antibody against γ-H2AX. Pictures were taken from samples
collected at different time points to illustrate the early activation of γ-H2AX through damage
and the fading of γ-H2AX due to repair over time. Underneath: a simplified graphic to
demonstrate the induction and decline of γ-H2AX levels after IR over time.
4.4 Repair of DNA double strand breaks
Characteristic for a DSB is the complete break of both DNA strands leading to different
versions of DSBs. Many exogenous and endogenous factors can cause DSBs. Some examples
were mentioned in previous chapters like IR or V(D)J recombination in lymphocytes.
Unrecognized and unrepaired DSBs could result in loss of genetic information and induction
of apoptosis. An inaccurate repair could lead to mutation and chromosomal rearrangements
[43, 44]. Depending in which scenario or cell cycle phase the DSB occurs the cell will rely on
different repair pathways [45].
22
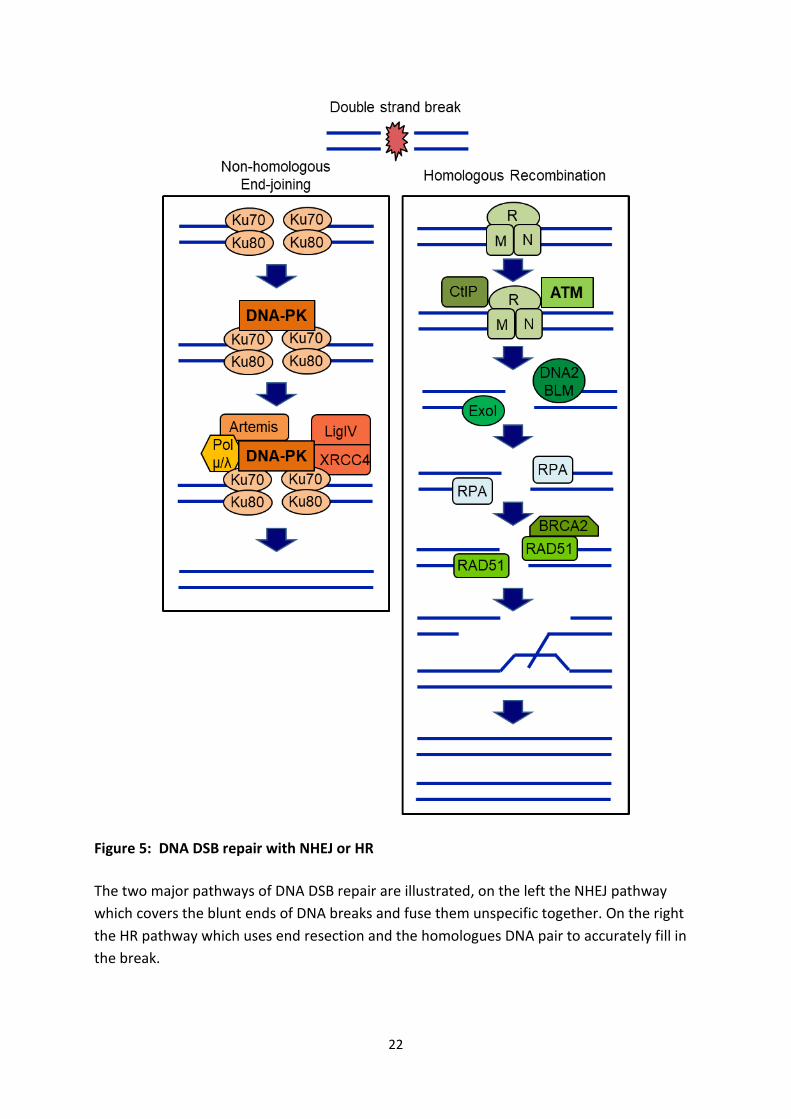
Figure 5: DNA DSB repair with NHEJ or HR
The two major pathways of DNA DSB repair are illustrated, on the left the NHEJ pathway
which covers the blunt ends of DNA breaks and fuse them unspecific together. On the right
the HR pathway which uses end resection and the homologues DNA pair to accurately fill in
the break.

23
4.4.1 NHEJ
One of the repair pathways for DSBs is the non-homologous end-joining (NHEJ) (Figure 5).
This DNA repair process is one of the major mechanisms. It doesn’t require a template for
repair, which allows it to be used in a flexible manner throughout the cell cycle, but is
favored in G1 and early S [46] (Figure 6). DSBs can be generated with blunt ends or very
short overhangs, for example upon exposure to IR. The first complex that localizes and
strongly binds to these ends is the KU70/KU80 heterodimer, which in turn recruits the DNA-
PK catalytic subunit (DNA-PKcs) to form the active DNA-PK. Any small overhangs of DNA are
being processed by an endonuclease like Artemis, which is recruited by DNA-PK [47, 48]. The
last step includes DNA polymerases of the X family, pol µ and pol λ, which add missing
nucleotides to the DNA break ends, followed by the ligation of the DSB through DNA ligase
IV/XRCC4 [49]. NHEJ is a very fast and efficient way to repair DSBs by connecting close blunt
DNA ends, but in turn has a chance to induce translocations in the genome, due to
connecting the wrong ends with another and is therefore an error-prone repair pathway.
4.4.2 HR
Homologous recombination (HR) facilitates the exchange of genetic information between
identical sequences and therefore can be used as a nearly error free, but slow, DNA repair
pathway (Figure 5). After IR-induced DNA damage HR occurs more frequently during the S-
phase and S/G2 phase, where there is a sister chromatid as a template (Figure 6). HR also
plays an important role in the replication restart after collapsed replication forks, which lead
to double strand breaks. Recognized DSBs are processed to generate 3’-single stranded DNA
(ssDNA) overhangs, through resection. This ssDNA invades the homolog strand to create
holiday junctions. After the replication of the missing DNA, the holiday junctions get
resolved.
The MRN complex plays a vital part in the recognition and resection of the DSB. Both Mre11
and Rad50 have an affinity to bind to DNA and form the base of the MRN complex. Rad50 is
important for the activation of Mre11 [50, 51]. Mre11 has both endo and exonuclease
activity. NBS1, the last part of the MRN complex, recruits the inactive ATM dimer to the

24
damage site, and activates it [52, 53]. The now active ATM monomer will induce cell cycle
arrest through checkpoint activation (see chapter 3.5) [54]. The MRN function shifts from
being a DNA damage-sensor to resection-activator, with the help of CtBP-interacting Protein
(CtIP). CtIP has also an endonuclease activity especially with DNA flap structures on the 5’-
end [55, 56]. Blooms’s syndrome helicase (BLM) belongs to the RecQ family of helicases and
helps to unwind the DNA end. DNA replication helicase/nuclease 2 (DNA2) has only the
ssDNA endonuclease activity during the HR and facilitates the accumulation of RPA on the
ssDNA. DNA2 and BLM form the DNA2/BLM complex and get recruited to the formation of
the 3’ overhang by exonuclease 1 (EXO1) [57]. This DNA end resection also ensures that the
KU heterodimer can’t form since it has a low affinity to ssDNA. RPA binds to and stabilizes
ssDNA, and induces recombinase Rad51 [58, 59]. Rad51 is negatively regulated by RPA but
RPA needs to be replaced by Rad51 to initiate the homology search by mediator proteins.
One of the main mediators of this replacement is BRCA2, which creates Rad51 monomers
from the native Rad51 heptamers [60, 61]. Rad51 covered ssDNA induces strand invasion
and formation of holiday junctions (HJs). After DNA synthesis with DNA polymerase, a group
of proteins called resolvases lead to the resolution of the HJ. Depending on the number of
HJs, crossover products can emerge [62].
Figure 6: DSB repair pathway preference throughout the cell cycle
The two major DSB repair pathways NHEJ and HR illustrated in a graph to show the
preferred usage during the cell cycle.
25
4.4.3 Other end resection dependent DNA repair pathways
The DNA end resection mentioned above marks also the start for Single strand annealing
(SSA) and alternative end-joining (alt-EJ). Similar proteins that take part in HR for the DNA
end resection are also used for SSA and alt-EJ, like the MRN complex, CtIP, EXO1, DNA2/BLM
complex [63]. SSA occurs in genomic regions with large homologies and repeats. It is more a
single strand end joining instead of repair. The homologues ssDNA are annealing with the
help of Rad52 and existing flaps are cleaved by the ERCC1/XPF nuclease. Induced nicks are
being ligated by DNA ligase 1. Especially in repetitive regions of DNA, SSA can cause huge
deletions [64]. Alt-EJ is a backup pathway to both NHEJ and HR. It can rely on short 2-4
nucleotide homologies. These microhomologies are a very low threshold compared to what
is required for HR or SSA. Main initiator is PARP-1 which competes against KU and can switch
from NHEJ to alt-EJ. Alignment of DNA, resulting from the microhomologies, creates gaps,
which are filled by PolQ (Polϴ). PolQ can counteract Rad51 to inhibit the HR pathway [65,
66].
4.5 Checkpoint activation after damage
Damage of the DNA during the cell cycle needs to be repaired as fast and efficiently as
possible. As mentioned above there are several pathways for every damage type. These
repair pathways need enough time to attempt and complete the repair, without the cell
cycle continuing to the next cell cycle phase. Checkpoints regulate the cell cycle through the
CDK and cyclins which are fundamental for the cell cycle progression. These checkpoints
allow the needed time for DNA damage repair [67, 68].
4.5.1 G1/S Checkpoint
A cycling cell needs some sort of checkpoint to ensure, the cell is not entering the S-phase
premature without preparations for the DNA replication [69]. One major regulator in G1 is a
phosphoprotein, the retinoblastoma protein (pRb) [70]. The hypophosphorylated state of
pRb binds the transcription factors of the E2F family, resulting in the inhibition of the E2F
family transcription factors. Without the transcription factors the cell lacks the necessary
proteins to initiate cell growth. CyclinDs with their CDK4 and 6 complexes can partially
phosphorylate pRb during exposure of mitogenic factors [71]. Phosphorylated pRb releases

26
the bound E2F factors and lifts the inhibitory effect. Among the transcribed proteins are the
cyclinEs. The emerging cyclinE CDK2 complexes assist with the phosphorylation of pRb,
leading to a positive feedback loop, resulting in a hyperphosphorylation of pRb [72]. Another
regulator in G1 is p21 and its upstream activator, the tumor suppressor, p53 [16]. P53 gets
mostly activated in the event of DNA damage, through ATM/Chk2. The resulting
transcription of p21 leads to a binding of a DNA clamp, the proliferating cell nuclear antigen
(PCNA), which is essential for replication of DNA [73]. P21 can also induce cell cycle arrest in
G1 due to cyclinE CDK2 inhibition, since p21 is a CKI of the CIP/KIP family, as p27 (see 3.1.1.).
Activated Chk2 also degrades CDC25, a phosphatase which removes the inhibitory
phosphorylation on the CDKs. Degradation of the CDC25 keeps the CDKs in an inactive state
[74, 75].
4.5.2 S-phase Checkpoint
A cell passing the G1-S transition commits to replicate the DNA in the S-phase. DNA
replication is a crucial step and the preparation starts in G1 with the licensing of the DNA,
which leads to coordinated firing of DNA replication origins during S-phase. Other proteins
like topoisomerase and helicases unwind the coiled DNA and separate the two DNA strands,
respectively. This results in the formation of a replication fork, where DNA polymerase can
start to replicate the DNA [76].
During the replication process, if there are any complications, due to lack of dNTPs or DNA
breaks, the S-phase checkpoint can delay the cell cycle but is unable to completely stop it.
DNA damage during replication often leads to unstable ssDNA, which gets stabilized by RPA
(Figure 3). RPA covered DNA recruits DNA topoisomerase 2-binding protein1 (TOPBP1) and
ATR interacting protein (ATRIP). ATRIP helps localize ATR to the ssDNA and TOPBP1 increases
the activity of ATR [77]. ATR activates its main target, Checkpoint kinase 1 (Chk1), by
phosphorylation at the S317 and S345 residues on Chk1 [78]. A main regulatory function of
Chk1 relies on the ability to phosphorylate the phosphatases CDC25A, CDC25B and CDC25C.
Depending on the phosphorylation site the CDC25s will be inhibited or even degraded.
Under normal conditions the CDC25s would remove the inhibiting phosphorylation on
CDK/cyclin complexes. Wee1 is a key kinase that phosphorylates CDK/cyclin complexes in an

27
inhibitory manner on Y15, similar to Myt1 mentioned in 2.1. [79, 80]. Therefore removing
the CDC25s, result in an accumulation of inhibited CDK/cyclin complexes [81] (Figure 7).
Chk1 activation thereby has a role in inhibiting the initiation of origin firing, through causing
impaired loading of CDC45 via the low CDK/cyclin activity [82].
Figure 7: Chk1 and Wee1 regulation of CDK1 and CDK2 activity in the cell cycle
The CDK/cyclin complex can be negatively regulated by a phosphorylation at the Tyrosine 15
site. This phosphorylation can be induced by Wee1 but also gets removed by CDC25,
generating an equilibrium. Additionally, Chk1 can inhibit CDC25, which would result in an
increase of inactive phosphorylated CDK/Cyclin complex and the arrest of the cell cycle

28
4.5.2.1 Function of Wee1 and Chk1 in S-phase
Wee1 and Chk1 are main regulatory kinases especially during S-phase. Both kinases can
inhibit the cell cycle progression with their CDK/cyclin complex interaction as described in
3.5.2. Inhibition of either kinase has shown a similar phenotype of increased DNA damage
during S-phase (Figure 8). This phenotype could be explained through the unrestrained
progression of the cell cycle and upregulated CDK activity, which will lead to increased
initiation of origin firing. The unscheduled firing of origins results in a higher demand of
replication elements in the form of nucleotides and RPA. The depletion of the replication
elements stalls the replication fork, which are susceptible to nuclease activity, like Mus81 an
endonuclease (Figure 8). Increased activity of nucleases induces DNA cuts at replication forks
and ultimately DNA breaks [83, 84].
Figure 8: Consequences of Chk1 and/or Wee1 inhibition
Illustration of the established consequences of Chk1 and/or Wee1 inhibition and the
resulting DNA damage during S-phase.
29
4.5.3 G2/M Checkpoint
Damaged DNA from the S-phase can still remain when a cell reaches G2, due to the inability
to completely stop the replication process during replication. In addition, exogenous DNA
damaging agents such as IR can induce DNA damage in G2 phase cells. Therefore the G2
checkpoint has to ensure the integrity of the DNA before the next critical cell division.
The main difference of the checkpoint activation in S-phase compared to G2, is that in
response of checkpoint activation in S-phase the cell cycle slows down and in G2 it becomes
a cell cycle arrest [85]. Both ATM/Chk2 and ATR/Chk1 pathways can be activated during G2.
While ATM is only required for the G2 checkpoint at early times after DNA damage
induction, ATR/Chk1 is a more general regulator of this checkpoint [86, 87]. In the presence
of a DNA damaging agent, inhibitors of ATR, Chk1 or Wee1 can lead to a G2 checkpoint
abrogation. This promotes mitotic entry because the inhibitors decrease the inhibitory
phosphorylation on CDK1 (Figure 7).
4.5.3.1 H3p a mitotic marker
An important step during the mitosis is the regulation of the chromatin structure of the DNA.
The chromatin needs to be condensed to be able to achieve equal separation of the
duplicated DNA sequence. 147 base pairs of DNA are wrapped around specific histones and
proteins to form the base unit of the chromatin, the nucleosome. Histones have an N-
terminal tail, which reaches outside of the tight nucleosome and enables a variety of
modifications, like ubiquitination, acetylation or phosphorylation. These modifications could
change the local nucleosome environment or recruit other proteins for chromatin
remodeling or gene expression [88].
The phosphorylation of histone 3 on Ser10 (H3ser10p) is commonly used as a mitotic marker.
The phosphorylation is induced by AuroraB kinase and occurs during the mitosis and
meiosis. Specific antibodies for the histone 3 phosphorylation site show a rapid increase in
signal from the early prophase to metaphase, with a decline in anaphase. Recent studies
demonstrated that also on serine28 phosphorylation occurs at early prophase, but the
detectable amount is negligible and tends to be unstable [89].

30
4.6 Abnormal cell cycle and DNA damage response in cancer
Cancerous cells arise from persistent mutations in key proteins, which control important
functions, like apoptosis, to ensure the survival of the cancer [90]. As described above, the
cell cycle is a tightly regulated process mostly dependent on Cdk/cyclin complexes. Many
cancer types have upregulated expression levels of Cdks, cyclins and CAK to ensure steady
progression. On the other hand, the tumor suppressor gene Rb is lost or inhibited in some
cancers, to eliminate the checkpoint activation in G1 via Rb [91]. Another frequent
inactivating mutation occurs in p53 in over 50% of cancer types. Loss of p53 interferes with
the cell cycle arrest, the DNA damage response and apoptosis pathways [92].
4.7 Cancer treatment modalities
At the moment the three most used treatment options are: Chemotherapy, surgery and
radiation therapy. They are used alone or in combination depending on many factors, like
localization and type of cancer. In addition, immune therapy is emerging.
Chemotherapy uses cytotoxic compounds to disrupt cancer cell specific abilities, like rapid
cell growth, to have a targeted effect. Unfortunately many drugs are not selective enough
and have side effects on normal cells. Radiation therapy uses IR to inflict localized cell
damage on tumors but will also target healthy tissue within the path of the IR beam. Both
treatment options have to face genetic diversity of cancers between individual patients,
which could make some compounds less effective or the cancer radio resistant.
Combination of both treatment modalities with synergizing effect could result in lower IR or
cytotoxic compound doses, which in turn reduces damaging effect on surrounding cells and
organs [93].
4.7.1 Wee1 and Chk1 inhibitors
Many cancers have mutations in DNA damage response pathways, which make the cancer
more reliant on only selected checkpoints. An example would be the common mutation in
p53. In this case the cancers cells rely more on the S and G2/M checkpoint. Targeting
important kinases like Wee1 or Chk1, together with treatment with a DNA damaging agent,
31
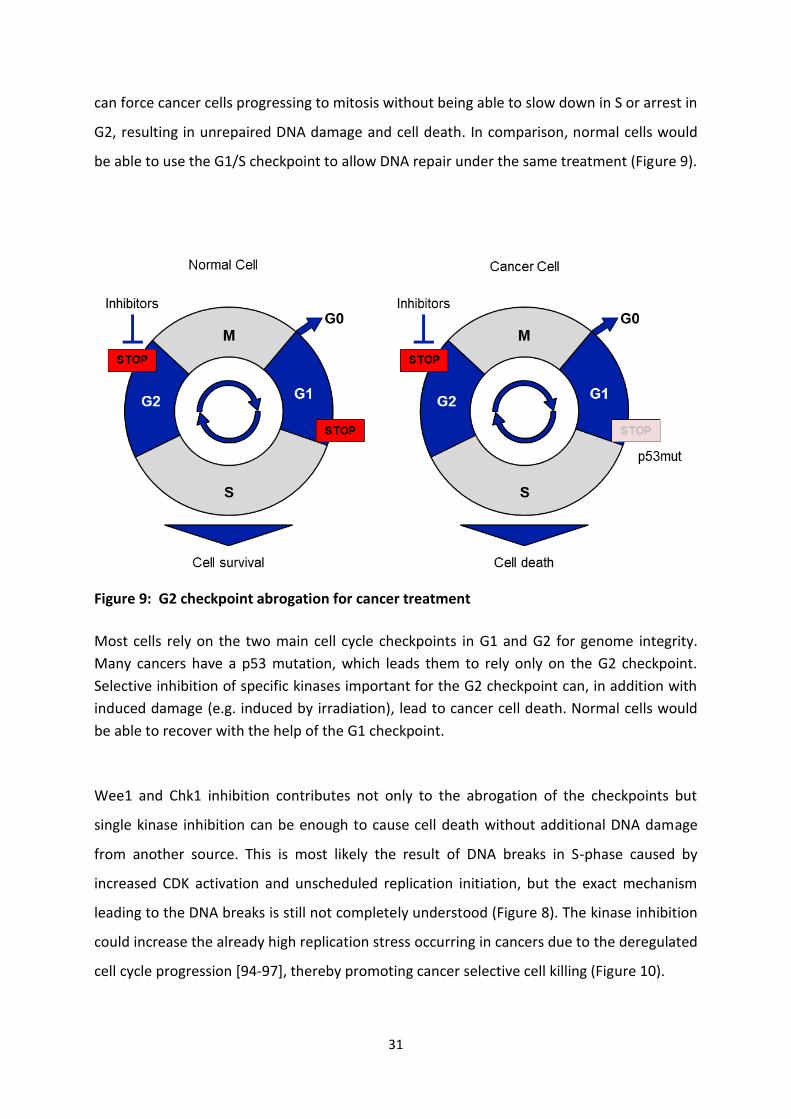
can force cancer cells progressing to mitosis without being able to slow down in S or arrest in
G2, resulting in unrepaired DNA damage and cell death. In comparison, normal cells would
be able to use the G1/S checkpoint to allow DNA repair under the same treatment (Figure 9).
Figure 9: G2 checkpoint abrogation for cancer treatment
Most cells rely on the two main cell cycle checkpoints in G1 and G2 for genome integrity.
Many cancers have a p53 mutation, which leads them to rely only on the G2 checkpoint.
Selective inhibition of specific kinases important for the G2 checkpoint can, in addition with
induced damage (e.g. induced by irradiation), lead to cancer cell death. Normal cells would
be able to recover with the help of the G1 checkpoint.
Wee1 and Chk1 inhibition contributes not only to the abrogation of the checkpoints but
single kinase inhibition can be enough to cause cell death without additional DNA damage
from another source. This is most likely the result of DNA breaks in S-phase caused by
increased CDK activation and unscheduled replication initiation, but the exact mechanism
leading to the DNA breaks is still not completely understood (Figure 8). The kinase inhibition
could increase the already high replication stress occurring in cancers due to the deregulated
cell cycle progression [94-97], thereby promoting cancer selective cell killing (Figure 10).

32
Figure 10: S-phase DNA damage in cancer treatment
Inhibition of checkpoint kinases could lead to selective cancer cell death, due to already increased
replication stress, caused by oncogenes, during S-phase.
4.7.2 Radioresistance
In the last decades the technology for radiation treatment has advanced and been improved
to deliver more precise and localized dose towards tumors. Many solid cancers are treated
successfully curative or palliative with radiation therapy. In contrast to the success, loco
regional recurrences can form due to survival of a fraction of the cancer population, with
already existing or acquired radio resistance. The major clinical effect IR has is mostly
credited to the result of DNA damage, but other biological processes triggered by IR could
also contribute to the effect. For example a hypoxic micro environment of a tumor could
reduce the DNA damage by limiting the creation of ROS. Another form of radioresistance is
acquired by deregulation of DNA damage response proteins regarding the DNA repair or the
cell cycle checkpoints. Increasing the tumor specificity for radiation treatment by increasing
radio sensitivity by targeting DNA damage response pathways, is achieved by exploring
33
differences between normal tissue and cancer cells. An example would be radiation
combined with PARP inhibition in HR deficient tumors [3].
4.8 Drug repurposing
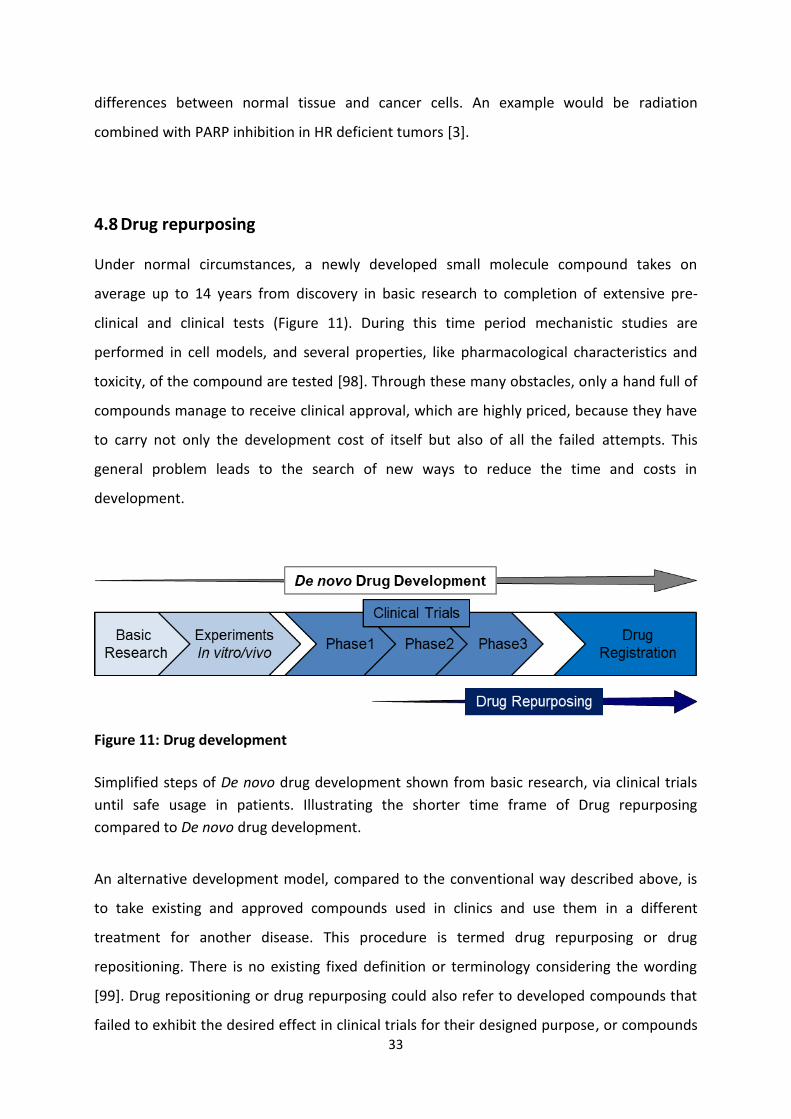
Under normal circumstances, a newly developed small molecule compound takes on
average up to 14 years from discovery in basic research to completion of extensive pre-
clinical and clinical tests (Figure 11). During this time period mechanistic studies are
performed in cell models, and several properties, like pharmacological characteristics and
toxicity, of the compound are tested [98]. Through these many obstacles, only a hand full of
compounds manage to receive clinical approval, which are highly priced, because they have
to carry not only the development cost of itself but also of all the failed attempts. This
general problem leads to the search of new ways to reduce the time and costs in
development.
Figure 11: Drug development
Simplified steps of De novo drug development shown from basic research, via clinical trials
until safe usage in patients. Illustrating the shorter time frame of Drug repurposing
compared to De novo drug development.
An alternative development model, compared to the conventional way described above, is
to take existing and approved compounds used in clinics and use them in a different
treatment for another disease. This procedure is termed drug repurposing or drug
repositioning. There is no existing fixed definition or terminology considering the wording
[99]. Drug repositioning or drug repurposing could also refer to developed compounds that
failed to exhibit the desired effect in clinical trials for their designed purpose, or compounds

34
that have not yet reached clinical trials but have undergone testing in preclinical studies. Any
of the termed alternative options require additional research and testing for the new effect.
The huge benefit of these compounds, is the already existing background on toxicity and
pharmacological characteristics or even on safe administration to patients, which reduces
the time and costs to find new applications for them [4, 100]. An efficient way to find
possible new applications for existing compounds is to apply the desired new end point in a
screen setting. Depending on the method several hundred till thousand compounds can be
screened in plates with the numbers of wells ranging from 96 till 384 and even more.
35
6 Aim of study
The development and optimization of a large-scale screening method was at the center of
this work. The overall goal was to identify promising new combination treatments for
cancer, which could potentially be clinically useful in the future.
The following three studies were performed to explore several sub-goals:
I. Discover compounds that synergistically increase the S-phase DNA damage effects of
MK1775, a Wee1 inhibitor, using a flow cytometry based screen. Two of the
candidate hits were Chk1 inhibitors, which led to further investigations of the
mechanism behind Wee1 and Chk1 inhibitor synergy.
II. Identify compounds, with a flow cytometry based screen, which can alter the S-phase
DNA damage effects of a Wee1 and/or a Chk1 inhibitor. The compound Ciclopirox
had a stronger synergistic effect in combination with a Chk1 inhibitor than with a
Wee1 inhibitor. Additional investigation was performed to gather more insight into
the combined effects of Ciclopirox and Chk1 versus Wee1 inhibitor.
III. Identify compounds that could interfere with the DNA repair after radiation, using a
large-scale flow cytometry based screen.

36
37
7 Summary of papers
7.1 Paper I
Combined inhibition of Wee1 and Chk1 gives synergistic DNA damage in S-phase due to
distinct regulation of CDK activity and CDC45 loading
Wee1 inhibition is used in clinical trials for cancer treatment, resulting in S-phase damage
and cell cycle checkpoint abrogation. Exploring the mechanism of the antitumor effects we
optimized and performed a large scale screen, using Reh leukemia cells, with 1664
compounds in combination with MK1775, a Wee1 inhibitor. The endpoint of the screen was
to detect a synergistic increase in DNA damage during S-phase, using yH2AX as a marker for
DNA damage. Among the candidate hits were two Chk1 inhibitors LY2603618 and AZD7762.
In clinical studies, Chk1 inhibitors, as well as Wee1 inhibitors, are used separate and together
with chemotherapy or radiotherapy. The inhibition of Chk1, like the inhibition of Wee1, is
known to create S-phase damage and cell cycle checkpoint abrogation. Combined Wee1 and
Chk1 inhibition is already been shown in preclinical studies to have a synergistic effect on
tumor cell growth, but the mechanism behind that synergy is not well understood. The
screen with its S-phase endpoint and the shown synergy of the combined inhibition, could
point to a possible explanation for the mechanism. We confirmed the screen findings in
another cell line, U2OS osteosarcoma. Different experiments measuring yH2AX, DNA
fragmentation with a Tunel assay and RPA phosporylation confirmed the induction of
synergistic increase in DNA damage in S-phase upon combined Wee1 and Chk1 inhibition.
Clonogenic assays showed a severe decrease in surviving cells after the combined inhibition,
linking the increased S-phase DNA damage to cell death.
Looking closer into the underlying mechanism of the synergy we started to investigate the
CDK activity, after treatment with the Wee1 inhibitor or Chk1 inhibitor or the combination of
both. We used two methods to measure the CDK-dependent phosphorylations in each of the
cell cycle phases by using a novel flow cytometry based assay and we also included Western
Blotting analysis of the Tyr15 inhibitory phosphorylation sites on CDK1 and CDK2.
Surprisingly, Chk1 inhibition alone caused more DNA damage but induced lower CDK activity
compared to Wee1 inhibition alone. Wee1 inhibition caused higher CDK activity but lower

38
DNA damage alone. The combined treatment of both Chk1 and Wee1 inhibition caused
about similar CDK activity as Wee1 inhibition but much higher DNA damage than either
inhibitor alone. Investigating these interesting results we looked at the replication initiation
factor CDC45. To measure CDC45 loading we included a chromatin extraction step in our
flow cytometry and Western blot analysis. Chk1 inhibition alone gave more CDC45 loading
compared to Wee1 inhibition alone and the combination treatment gave a huge increase of
CDC45 loading. Considering all these findings, the synergistic effect of both Wee1 and Chk1
inhibition is a combination of the increase of CDC45 loading and elevated CDK activity, which
leads to major DNA damage in S-phase by probably unscheduled replication initiation.
According to our model, Chk1 suppresses CDC45 loading upon Wee1 inhibition alone, and
Wee1 suppresses CDK-dependent CDC45 loading upon Chk1 inhibition alone. However,
combined Chk1 and Wee1 inhibition leads to a very high CDC45 loading, thereby causing
massive DNA damage in S-phase.
39
7.2 Paper II
A flow cytometry based screen reveals the antifungal compound Ciclopirox as more potent
in combination with Chk1 than Wee1 inhibition
In this paper we continued our investigation of the differences and similarities of Wee1 and
Chk1 inhibition. To further explore mechanisms of the S phase damage and to identify
compounds that are promising in combination with Chk1 inhibition and/or Wee1 inhibition,
we modified our flow cytometry based screening method used in Paper I by including
barcoding. We wanted to see a synergistic increase in DNA damage during S-phase from a
compound in combination with the Wee1 inhibitor MK1775 or in combination with the Chk1
inhibitor LY2606368, at 4 hours after treatment. The screen was performed with the Reh
leukemia cell line and comprised of 355 compounds. It was run in three different plates, one
containing just the compounds, the second containing compounds and MK1775, and the last
containing compounds and LY2606368. The added barcoding step, with different
concentrations of pacific blue staining, allowed us to mix the three treated plates together
into one plate. The resulting plate was stained with an antibody to yH2AX, to measure DNA
damage, and a DNA stain to assess cell cycle position. This procedure eliminates plate-to-
plate variations in staining and allows a highly accurate comparison between the three
conditions. The pacific blue staining allowed, during analysis, to separate each sample into
the three original samples.
We found several interesting hits that scored synergistically with either one of the inhibitors
or both. Ciclopirox, an antifungal agent, was among those hits and had an increased
synergistic effect in combination with LY2606368 compared to MK1775. We validated the
screen results in a lung cancer cell line A549 where we obtained similar results as in the
original screen at 4 hours after treatment. The concentration of the compounds used in the
screen was 10µM. In A549 cells we found that 10µM or even a lower concentration of 5µM
Ciclopirox reproduced the screen result giving a synergistic increase in S-phase DNA damage
in combination with LY2606368. However, no synergy was found with the Chk1 inhibitor and
1µM Ciclopirox in A549 cells at 4 hours after treatment. We also wanted to explore whether
combined treatment of Ciclopirox and Chk1 or Wee1 inhibition could affect cell viability. We
tested this with the CellTiterGlo assay and measured cell viability at four days after
treatment with Ciclopirox and the inhibitors for 24 hours. We observed a bigger synergistic

40
decrease in cell viability with 1µM Ciclopirox and LY2606368 compared to 1µM Ciclopirox
and MK1775. However, at higher concentrations of Ciclopirox, 5µM or 10 µM, we observed
similar synergistic decrease in cell viability with LY2606368 and MK1775. These results at
different concentrations could be explained by the different time point of the experiments.
The synergistic S-phase damage was measured immediately after 4 hours treatment and the
viability assay was performed at four days after 24 hours treatment. Indeed a different
experiment using a 24 hour time point for the S-phase damage experiment showed only a
difference in synergistic effect for LY2606368 and MK1775 with the 1µM Ciclopirox,
consistent with the viability assay.
These findings suggest that the performed flow cytometry screen can identify new
treatment combination with LY2606368 and/or MK1775. Especially Ciclopirox showed
promising results for a potential cancer treatment combination with the Chk1 inhibitor
LY2606368. Further investigation is necessary to look into the mechanism of that treatment
combination and also possible other hits from the screen.
41
7.3 Paper III
A flow cytometry based large-scale screen to identify compounds that inhibit DNA repair
after radiation
One of the most common cancer treatments is radiotherapy, which cause lethal DNA
damage in cancer cells and surrounding tissue. However, some cancer cells could have a
more efficient way of DNA repair, which would enable them to avoid the lethal outcome
from the radiotherapy. DNA damage repair inhibitors could therefore be an interesting
treatment combination with radiotherapy. In this paper we applied the flow cytometry
screen with the yH2AX DNA damage marker, but in this case over two time points to monitor
the repair of the DNA after irradiation. The first time point is 30 minutes after irradiation and
the second is 6 hours after irradiation. We also included a non-irradiated plate. With the two
time points we were able to identify compounds that interfered with the DNA repair, which
meant that the 6 hours time point had still high levels of yH2AX. In this screen setup we also
included another parameter with the mitotic marker phospho-H3, which allows us to see if
any compound would keep the cells cycling despite being irradiated (i.e. abrogates the G2/M
checkpoint). We also applied the barcoding method from the second paper to this screen
setup and even optimized the screen not only for the leukemia cell line Reh but also for the
lung cancer cell line A549.
In total we screened over 1900 compounds with this screen setup in Reh and/or A549, giving
us up to 80 candidate hits depending on the criteria used from the endpoints. The candidate
hits consisted of known radio sensitizers and DNA damage repair inhibitors but also
compounds so far not attributed to interfere with DNA repair, or to manipulate the G2/M
checkpoint. To this point we could validate several of the candidate hits in different cancer
cell lines. Revealing the underlying mechanism of the observed effects from the candidate
hits would be the next step towards finding possible new treatment combinations with
radiotherapy to improve the effect on the cancer treatment outcome.

42

43
8 Discussion
8.1 Screen Endpoints analysis
In my screens, throughout the three papers, I used a yH2AX antibody to detect DNA damage.
The yH2AX antibody was used for two different endpoints. In the first two papers we
combined the yH2AX readout with the information of the DNA marker to see the increase in
yH2AX levels in the cells during the S-phase. In paper 1 we calculated the yH2AXdiff value
where we subtracted the yH2AX values of "the only compound library plate" from the
compound library plate treated additionally with an inhibitor of Wee1. In the second paper
we calculated the yH2AXcomb value for the Chk1 inhibitor and for the Wee1 inhibitor. To
show how yH2AXcomb was calculated I will use the Wee1 inhibitor as example, but it is
applicable also for the Chk1 inhibitor. Basically, we started with the yH2AX value from the
combination of compound X with MK1775, and subtracted the yH2AX value from the
MK1775 alone and the yH2AX value from compound X alone. Each yH2AX value also got the
yH2AX value from the control wells (non-treated cells) subtracted. This gave the following
equation: yH2AXcomb = (yH2AX MK1775+compoundX - yH2AXcontrol) – (yH2AX MK1775 - yH2AXcontrol) -
(yH2AXcompoundX - yH2AXcontrol). This will result in yH2AXcomb values accumulating around 0
for the majority of compounds, as well as for the controls. However, if the combination of
compound X with e.g. MK1775 has synergistic effect, the value of yH2AXcomb will get bigger
than 0. The potential candidate hits would thus have a high positive value of yH2AXcomb.
In the third paper we wanted to see the overall yH2AX value throughout the cell cycle and its
change after radiation over two time points, 30 minutes and 6 hours. At 6 hours a plate
treated with compound library only was also collected. The 30 minutes time point was
chosen to have a high yH2AX value resulting from the DNA damage induced by radiation.
This high yH2AX value could then be compared to the yH2AX value at the 6 hours time point
to see the DNA repair. The comparison of the yH2AX levels over time after irradiation can
identify regulators of the DNA repair mechanism. To quantify the extent of DNA repair, we
therefore calculated the yH2AX ratio that compares these two yH2AX values. We first tried a
simple division of the two values: yH2AX ratio1 = yH2AX6h6Gy/yH2AX30min6Gy. As an example, a
value of 1 for the yH2AX ratio would mean no change of the yH2AX value over the time
course of 5 and a half hours, thus indicating a complete deactivation of the DNA repair

44
pathways. Unfortunately, this ratio would also highlight compounds that cause extreme high
yH2AX values alone without radiation, which is not in our interest. One strategy to avoid this
issue was to subtract the yH2AX value without radiation from the other two values in the
ratio equation yH2AX ratio2 = (yH2AX6h6Gy- yH2AX6h0Gy)/(yH2AX30min6Gy- yH2AX6h0Gy). This
improved ratio gave us potential candidate hits without including undesired compounds, and
this equation was used to calculate the yH2AXratio throughout paper 3. Of note, in this
equation we subtracted the 6 hour no irradiation time point from the 30 minutes timepoint.
Since some compounds may react differently over time, it could be not ideal to handle these
different time points in such a manner. We therefore also tested another ratio which would
leave the 30 minutes time point as is, without subtracting the value from 6 hour without
irradiation: yH2AX ratio3= (yH2AX6h6Gy- yH2AX6h0Gy)/yH2AX30min6Gy. This ratio gave us the same
candidate hit list of compounds as yH2AX ratio2, when these were tested on the four screen
experiments in paper 3 with the Enzo pathway and Biomol kinome libraries (data not
shown). We therefore concluded that the small change above in the ratio equation from
“yH2AX ratio2” to “yH2AX ratio3” would not change the results for the candidate hits.
The acquired yH2AXdiff, yH2AXcomb and yH2AXratio from each of the three papers gave us
a value for each compound in a library but now we had to determine the cut off value to
separate potential candidate hits from the rest. Regarding the first paper, we used a Z-score
value, since the library was divided across different plates. This Z-score enabled us to
compare the yH2AXdiff values even between plates. The threshold was set with a Z-score of
2.5 standard deviations away from the median value of yH2AXdiff, for all plates. The second
paper used 3.5 standard deviations away from the median value of a defined main peak of
yH2AXcomb values from the plate. This main peak excluded the two lowest values of
yH2AXcomb of the plate and included every value until 500. In the third paper the screen to
screen variation, regarding the yH2AX ratio, made it difficult to use a defined value of
standard deviations for the threshold. For that reason we decided to visually determine the
threshold, for each screen in paper 3, using the histogram of the yH2AX ratio. We defined
the threshold to be clearly higher than the value of the main peak (see for example figure 2B
in Paper 3).
Another endpoint I included in my screen was G2/M checkpoint abrogation, as detected by
presence of mitotic cells by the phoshpo-H3 antibody. The phosphorylation of Histone 3
45
occurs in the mitotic phase, and is thought to be important for cell cycle progression and
chromosome condensation. A population of cells with favorable conditions will have around
2% cells in mitosis, which will be seen as pH3 positive cells. After radiation the G2 checkpoint
is induced and the amount of pH3 positive cells would be close to zero. Indeed, in the third
paper the control samples showed zero percent of pH3 positive cells at 6 hours after the
radiation treatment. We were interested in compounds that keep cells dividing even after
radiation, but we wanted to exclude compounds that caused an arrest in mitosis in the
absence of radiation. We therefore plotted the pH3 values in percentage against each other
from both 6 hours samples, with and without radiation. This allowed us to determine our
candidate hits, excluding compounds that already caused an increase in pH3 positive cells
without radiation. These candidate hits could potentially be interesting in combination
treatment together with radiotherapy. Since some cancers lost the G1/S checkpoint, they
may therefore rely on the G2 checkpoint and abrogating the G2 checkpoint might cause
radiosensitization.
8.2 Considerations regarding yH2AX as a DNA damage marker
As mentioned in the introduction the phosphorylation on the histone 2AX is an important
part of the DNA damage response machinery. DNA double strand breaks are an important
and desired outcome throughout my screens for identifying potential new treatment
combinations for cancer killing. Throughout my screens I used an antibody designated to
detect the phosphorylation site of H2AX and made the conclusion of induced DNA damage
via radiation or chemical compounds. While the signal from yH2AX represents a true DNA
double strand damage signal, which is proven in the article from Rothkamm, K. and M.
Löbrich [42], there could also possibly be alternative explanations. Compounds from the
libraries could cause increased activation of yH2AX without increased DNA damage or the
signal of yH2AX could persist on already repaired DNA damage sites.
Regarding the first two papers, yH2AX was used to measure the increase in DNA damage, in
the form of lethal DSBs, during S-phase with inhibitor combinations. Interestingly H2AX can
also be phosphorylated during S-phase by ATR and localize with RPA on stalled replication
forks and single DNA strands [101]. Therefore yH2AX does not always represent DSBs but
could also represent replication block. In all three papers some compounds could potentially
46
cause hyper phosphorylation of H2AX by upregulating phosphorylating proteins or inhibit
phosphatases. Some inhibitors from the libraries could have a similar effect as ATR on H2AX
or amplify the activation of ATR. As a control to check proper lethal double strand breaks a
tunel assay can be performed to identify DSBs, mostly regarding dying cells. Also, western
blotting can be used to identify activation of key DNA DSB marker and replication stalling
proteins, like DNA-PKcs and RPA [102]. Both methods, tunel assay (Fig2C) and western blot
(Fig3A and 4A), were performed in the first paper. On the other hand, compounds could
decrease the yH2AX signal even in the presence of DNA DSBs, by activating
dephosphorylation events similar to the phosphatase Wip1 [103]. In that case a comet assay
or Pulsed-field Gel Electrophoresis could have been used to identify DNA breaks. It is also
documented that yH2AX could persist after a repaired DNA DSB and rejoined chromosomes
[104]. For verification any of the above mentioned methods could likely identify if DNA
breaks exist. Also important to consider is the cell line specific yH2AX levels in each cell cycle
phase prior to treatment, especially in cancer cell lines. The variation between cell lines
could be the result of different mutations which lead to up or downregulation of key
components in important pathways. For example, high replication stress in cancer cells may
lead to higher endogenous levels of yH2AX in S-phase.
8.3 Screens with Wee1 and Chk1 inhibitors
Chk1 and Wee1 are important kinases in the maintenance of the of DNA integrity.
Previously, in our group and in other labs, siRNA screens identified CHK1 and Wee1 as major
key kinases for genomic integrity [83, 105, 106]. Both kinases are known to have a crucial
role especially in S-phase [83]. Inhibition of either Wee1 or Chk1 leads to increased S-phase
damage [84, 107]. This is the reason why in the first and second paper we choose to monitor
the yH2AX levels in S-phase for the possibility to find a synergistic effect which would be
reflected in an increase in S-phase damage.
In the first paper we performed a large scale screen to identify possible interaction partners
with the Wee1 inhibitor. The result from this screen showed synergistic effect with a Chk1
inhibitor, which lead us to the 2nd paper where we compared the effect of a Wee1- and a
Chk1- inhibitor in combination with a screen library. From the first paper we concluded that
Wee1 acts on the CDK-activity in contrast to Chk1 which affects CDC45 in a CDK independent

47
manner during S-phase. Further investigation of the different mechanisms can potentially
arise from the screen in the 2nd paper, and new interaction partners for Wee1 or Chk1
inhibitors can be identified. The results of the 2nd paper showed many more compounds
increasing the DNA damage in S-phase with the Chk1 inhibitor compared to the Wee1
inhibitor.
Ciclopirox (CPX) scored in the 2nd paper when combined with the Chk1 inhibitor but not with
the Wee1 inhibitor. Ciclopirox is a synthetic fungicide for superficial fungal infections [108].
It also has antibacterial properties and has shown effect on cell cycle arrest in G1 in
mammalian cells [109]. Other studies indicate anticancer effects related to different
pathways [110, 111]. Apparently CPX induces phosphorylation of CDC25A, which leads to
downregulation of CDC25A protein levels. Decreased levels of CDC25A result in an increase
of the inhibited CDKs mostly in G1 [112]. Since Chk1-mediated phosphorylation of CDC25 is
known to negatively regulate the CDC25 levels, this could likely mean CPX leads to activation
of Chk1. This might explain the synergistic effect with Chk1 inhibition seen in the screen of
the 2nd paper.
8.4 DNA repair screen: multiple HDACS inhibitors are candidate hits
In paper 3 we performed various DNA repair screens with different libraries. The results
showed many different types of candidate hits, ranging from ion channel inhibitors, PKC
inhibitors to CDK inhibitors. Some of the candidates were briefly discussed in paper 3. HDAC
inhibitors scored as major candidate hits in several of the screens from paper 3. As an
example, 12 out of 17 known HDAC inhibitors scored in the screens with the Enzo
epigenetics and Biomol kinase library. Therefore I will discuss HDACs and HDAC inhibitors in
more detail.
Histone acetyltransferases (HATs) and histone deacetylases (HDACs) play important roles in
epigenetics via the regulation of posttranslational histone acetylation. Acetylation of a
histone generally loosens the chromatin structure and enables access to the DNA, which in
turn can be reversed be deacetylation. There are 18 HDACs characterized, which are
grouped in four main classes [113]. These classes are based on the homology in their yeast
counterparts. Class I HDACs are found more in the nucleus and consists of HDAC 1, 2, 3 and

48
8. Class II (HDACs 4, 5, 6, 7, 9 and 10) and Class IV (HDAC 11) are cytosolic and nuclear. The
3rd Class HDACs have a different mechanism and are called sirtuins (SIRT1-7). Altered
epigenetics is a hall mark of cancer and abnormal alteration of chromatin structure via
histone modification is observed in cancer development [114]. Upregulated level of HDACs is
associated with advanced stages and poor outcome in cancers and diseases. HDACs main
function is to modify histones but they can also regulate non-histone proteins in many
different cell pathways [115, 116].
A possible explanation for the disturbed repair by HDAC inhibitors in the screen of the third
paper could be the role of HDACs in the DNA damage response. HDACs play a vital role in
chromatin remodeling and maintenance of proteins in the DNA damage response and repair
pathway, via acetylation [117]. As an example HDAC1 and 2 are located at DNA damage
sites and facilitate NHEJ-factors Artemis and Ku formation. Class1 HDACs also regulate other
important proteins in DNA damage response, like ATR, ATM and BRCA1. The inhibition of
class 1 HDACs showed reduced expression of DNA repair genes [118]. Interestingly,
depletion of HDAC 1 and 2 showed sensitization towards DNA damage inducing agents and
therefore the combination of specific HDAC1/2 inhibitors combined with radiation therapy
could be a more efficient treatment option for cancers compared to the pan HDAC inhibitors
[119].
Histone H2AX plays a vital role in DNA damage response, especially its phosphorylation is
well described as mentioned in the introduction part. A paper also looked into an acetylation
site of H2AX. Tip60, a HAT, acetylates H2AX on the lysine 5 (K5) site during DNA damage
sensing similar to the phosphorylation. Apparently, the acetylation is not required for the
formation but helps to fine tune, focus and accumulate Nsb1 on the DNA damage site [120].
In the theoretical context of the HDAC inhibitors the acetylation maintains beyond the repair
process in the absence of working HDACs. The Nsb1 would then still be recruited to the
damaged site and could keep the MRN complex from dissolving. Two potential scenarios
could arise from that theory, either the damage is repaired but the signal could still be
maintained and monitored in my screen as the yH2AX endpoint, or the continuous
recruitment of Nsb1 leads to a shortage of MRN complex formation and therefore shows
unrepaired damage sites. Several HDACs interact as antagonist to Tip60, which could
potentially explain why several of the HDAC inhibitor scored in my screen, and could perhaps
49
work in one of the two ways described above [121-123]. Further investigation would be
needed to proof or disproof the mentioned possibilities which are still only a few of several
ones.
Several HDAC inhibitors, which scored in the screens, have a high affinity towards HDAC6.
Compared to pan HDAC inhibitors, a more selective HDAC inhibitor could potentially have
less off-target effects, and therefore lessen the eventually toxicity of the inhibitor. HDAC6
has several interesting non-histone interactions, one of them being the apoptotic regulators
p53 and HSP-90, in addition to many others [124-126]. Among the HDAC inhibitors
identified in my third paper BML-281, M-344 and Belinostat have a high affinity towards
HDAC6. Targeting HDAC6 could proof as an efficient combination treatment option but for
example Belinostat, which is used in clinical trials at the moment, has also effects on other
HDACs depending on the doses. The 10µM concentration, mostly used in my screens, could
with a high certainty cause a more pan like inhibition of several HDACs in addition to the
HDAC 6 inhibition. Therefore follow up experiments with lower concentrations are
necessary.
One HDAC inhibitor, Oxamflatin, scored not only in the repair screen from the 3rd paper but
also in the screen from the 2nd paper, more strongly with the Chk1 inhibitor than with the
Wee1 inhibitor. In fact, it was only a borderline hit with the Wee1 inhibitor in the 2nd paper,
which could also explain why it didn’t score in the first paper with the same Wee1 inhibitor.
Oxamflatin is a pan HDAC inhibitor and therefore could work in similar ways in the DNA
damage response and repair as described above or could also be involved in cell cycle
regulation. Some HDACs have shown roles in the cell cycle. HDAC1 and 2 bind to promoters
of p21, p27 and p57 genes. HDAC5 knockdown results in upregulation of p21 and low
expression of CDK2/4/6 and cyclin D1 [127] resulting in a G1 arrest. G2/M transition can also
be impaired by HDAC inhibition via cyclinA2 expression [128, 129]. Aurora A and B
degradation via HDAC3/6 inhibition leads to mitotic arrest [130]. In the screens I didn’t see a
cell cycle arrest with HDAC inhibitors but that could be due to the 4 to 6 hour time points. In
most of the papers the cell cycle arrest was monitored after 24 hours.
HDAC inhibitors have become an interesting possibility for cancer treatment. They are in
focus of cancer treatment since preclinical results in vitro and in vivo showed synergistic or
additive effects when combined with radiotherapy or chemotherapy [131, 132]. The effects
50
of HDAC inhibitors are not yet fully understood, but the preference towards malignant cells
compared to normal cells made them an attractive tool for cancer therapy [133]. At the
moment over 100 clinical trials are ongoing and even more have been completed. There are
three different kinds of HDAC inhibitors which are used and designed. The most common
ones are the multiple class inhibitors. A prominent example, which also scored throughout
my screens, is Vorinostat (suberoylanilide hydroxamic acid (SAHA)). Vorinostat is a long
approved chemotherapeutic drug for cutaneous T-cell lymphoma treatment (since 2006)
and inhibits class I and II HDACs [134]. There are 48 recruiting/ongoing clinical trials and 130
completed clinical trials regarding the treatment effect in different cancers types. The
second kind of HDAC inhibitors are designed to be more specific towards a single class or
even a single HDAC, such as discussed above regarding the HDAC 6 inhibitors BML-281 or
Belinostat. The newer versions of inhibitors try to combine several therapeutic targets in one
compound and are called multipharmacological HDAC inhibitors. CUDC-101 scored as
candidate hit in the second paper and not only inhibits HDACs but also EGFR and HER2 [135-
137].
8.5 Cancer cell lines as a model system
Throughout the three papers cancer cell lines made the foundation of the experimental
work. Generally in cancer research, primarily derived cancer cell lines or established cell lines
are important experimental tools for studying cancer biology in vitro. New observations in
these cell lines can be extrapolated to the biology of the tumor in vivo. The tumor and the
cell line can share their genetically profile but the 2D culture lacks the complexity of the 3D
tumor environment. This hinders novel discoveries of treatments in a cancer cell line to be
directly applied to the tumor. Also depending on the cell line and passage number, cancer
cell lines can experience genetic mutations which could alter the desired phenotype during
experiments. Nevertheless cancer cell lines have also many advantages which make them
still an ideal model system for cancer research. Cancer cell lines, if cultivated correctly, can
be an auto-replicative source of highly homogenous and easy to manipulate cells.
Maintenance of cell lines is a cheap and simple process, which can give any desired number
of cells for any scale of experiments. Alternative option to the 2D monolayer cell culture
described above could be 3D cell culture or cell lines grown as spheres. These two options
are closer to the complexity of a 3D environment but also more difficult to maintain.
51
In my screens I used two different cancer cell lines, the acute lymphocytic leukemia (non-T;
non-B) suspension cell line called REH and the adherent non-small cell lung adenocarcinoma
cell line A549. Both REH and A549 cells have wild type p53 expression. A549 has mutations
in EGFR and KRAS. In some validation experiments we also used an additional lung cancer
cell line, H1975, which has a mutation in EGFR and in p53, and U2OS, an osteosarcoma cell
line, with wild type p53 status. The REH cell line was used to optimize the screen setup since
the suspension cell line allowed an easier application in the 384-well plate environment.
Results from both REH and A549 cell lines could translate to novel compound combination
options for leukemia and lung cancers treatments [138-140], but the A549 cell line was more
relevant for the radiation repair screen since radiation therapy is widely used for lung cancer
cell lines but rarely used for leukemia. Additionally, the A549 is a radioresistant cell line,
maybe because of the mutation in Ras, therefore in need for a combination treatment to
sensitize the cancer cell towards radiation therapy. Overall the cancer cell lines allow us to
research the molecular mechanism of desired phenotypes, but to further investigate the
potential of the treatment combinations in a clinical aspect, other experimental systems in
vivo are required.
8.6 Flow Cytometry in a large scale screen setup
Flow cytometry allows acquisition of multiparameter information from single cells of a large
population. In my screens I used four parameters, the two endpoints discussed earlier,
yH2AX and pH3, as well as the DNA stain FxCycle Far Red and a barcoding dye. For a better
comparison of samples harvested at different conditions, I included a barcoding step with
Pacific Blue to enable the detection of smaller changes and eliminate changes of the signal
due to different flow cytometer settings or staining conditions. After obtaining the flow
cytometer data from the whole sample I can use my parameters to select different
populations of cells by signal intensity. The parameters can be viewed individually but it
becomes more comprehensive to utilize more than one parameter. For example I can use
the DNA stain and the yH2AX marker to determine in which cell cycle phase the DNA
damage occurred. This setup works also very well with a high throughput sampler which
enables this flow cytometer setting to be applied to a large variety of compound libraries, as
shown in my papers. Some groups have performed high-throughput flow cytometry screens

52
before, but using different endpoints and cell lines than the setup I performed in my screens
in my papers [141-143].
In flow cytometry you use chemical fluorophores with excitation and emission spectra
limited by the wavelength of light. After applying a few fluorophores in the same setup, a so
called spill over or spectral overlap will occur. Spectral overlap means that the emission of a
fluorophore can be detected in multiple bandpass filters. That means that a signal could be
amplified without having more of the antibody tagged substrate present, which would lead
to false positives. To avoid the spectral overlap you need to perform a compensation for
each fluorophore used in the setup. This is done by using each fluorophore separately, and
measuring the signals in all the detector channels upon excitement with the relevant lasers.
The software then adjusts the signal to filter out the spectral overlap. New machines exists
using a mass cytometry technique, like the CyTOF (cytometry by time of flight mass
spectometry), which uses metals instead of fluorophore. This allows to nearly eliminating
the problem with spectral overlap. In my screen setup I used mostly four chemical
fluorophores ranging from low to high wavelength, the barcoding-, yH2AX-, pH3- and DNA
staining. Some spectral overlap occurred with this setup. The sample with the highest
barcoding staining could show a small spillover from pacific blue into the yH2AX channel. To
avoid influencing the results I used the control screen plate (the plates not treated with
Wee1 or Chk1 inhibitor in paper 2, and not treated with radiation in paper 3) always for the
highest barcoding stain. This could potentially mean I underestimated some results, but tests
showed that the increase from that spectral overlap is so low that it didn’t affect the results.
Flow cytometry is a powerful tool to gain a lot of information of a cell population in short
amount of time, but it cannot show the localization of the signal. For this point of interest
microcopy would be a better choice. In microcopy you can determine the localization of the
marked target of choice and intensity but most of the time you sacrifice time and number of
cells [144].

53
9 Concluding remarks
Screens are powerful experimental tools for the acquisition and comparison of many
different compounds for a desired question. I developed and optimized screens fitting for
each of my papers endpoints which lead us to some new insights and possible new targets.
For the first paper I designed a screen to discover compounds that synergistically increase
the S-phase damage effects of MK1775, a Wee1 inhibitor. I optimized the screen in the REH
cell line to be able to detect increased DNA damage in S-phase with the yH2AX marker. Our
interest focused on the synergy with the Chk1 inhibitor and the underlying mechanism of
the different influences both Wee1 and Chk1 inhibitor have during the S-phase to increase
the DNA damage. This fascinating link between Wee1 and Chk1 inhibitors lead to the second
paper, were we wanted to study compounds that can alter the effect of either Wee1 or Chk1
inhibition or both, in regards to the S-phase DNA damage. In this screen I implemented a
barcoding step, which increased the sensitivity of our results and eliminated staining or flow
cytometer related variations. In the third paper we wanted to investigate compounds that
could interfere with DNA repair after radiation. For this screen setup I optimized the
radiation doses and time points to register any change in the DNA repair. Furthermore I
included a second cell line, A549, and adjusted the screen setup for this other cell line.
These different screens throughout my three papers gave us new information, some
answers and also new questions. In the first paper we found a synergy between Wee1 and
Chk1 inhibitors. This synergy was caused by different mechanisms of the corresponding
Wee1 and Chk1 kinases during S-phase. Wee1 showed regulation of CDK activity, whereas
Chk1 regulated the replication initiation factor CDC45 in a CDK-independent manner. This
shows different mechanisms for Chk1 and Wee1 during S-phase. The question to further
understand the mechanistic differences between Chk1 and Wee1 inhibitors during S-phase,
lead us to conduct the screen in paper II. Several candidate hits were determined and so far
we investigated some potential candidates, and examined the antifungal compound
Ciclopirox in more detail. Ciclopirox could potentially be a new cancer treatment
combination with the Chk1 inhibitor. For the last paper we wanted to identify compounds
that inhibit DNA repair after irradiation and found several interesting compounds in both
Reh and A549 cancer cell lines. Among those compounds were some known radiosensitizers,
which demonstrated the feasibility of the screen setup, as well as compounds not previously

54
known to regulate DNA repair. Further experiments are needed to explore promising
compounds that could lead to new cancer treatment options in combination with radiation.
Some of the compounds identified in our screens are currently, or have been, in clinical
trials, or were published to have effects on a cancer type in preclinical experiments. Other
compounds are not known to have an effect either on our endpoints or in the cancer
treatment setting, and some compounds will never reach a clinical setting. Nevertheless,
each of the candidate hits that we identified, even if not directly suitable for patient
treatment, could help find a new angle or mechanism for future compounds.
55
10 Reference list
1. Siegel, R.L., K.D. Miller, and A. Jemal, Cancer statistics, 2018. 2018. 68(1): p. 7-30. 2. DeVita, V.T., Jr. and S.A. Rosenberg, Two hundred years of cancer research. The New England
journal of medicine, 2012. 366(23): p. 2207-2214. 3. Peters, L.J., et al., Tumor radioresistance in clinical radiotherapy. Int J Radiat Oncol Biol Phys,
1982. 8(1): p. 101-8. 4. Ashburn, T.T. and K.B. Thor, Drug repositioning: identifying and developing new uses for
existing drugs. Nat Rev Drug Discov, 2004. 3(8): p. 673-83. 5. Xue, H., et al., Review of Drug Repositioning Approaches and Resources. International journal
of biological sciences, 2018. 14(10): p. 1232-1244. 6. Varbanov, H.P., et al., Repositioning approved drugs for the treatment of problematic cancers
using a screening approach. PloS one, 2017. 12(2): p. e0171052-e0171052. 7. Vermeulen, K., D.R. Van Bockstaele, and Z.N. Berneman, The cell cycle: a review of regulation,
deregulation and therapeutic targets in cancer. Cell Prolif, 2003. 36(3): p. 131-49. 8. Malumbres, M., et al., Cyclin-dependent kinases: a family portrait. Nature Cell Biology, 2009.
11(11): p. 1275-1276. 9. Kaldis, P., The cdk-activating kinase (CAK): from yeast to mammals. Cellular and Molecular
Life Sciences CMLS, 1999. 55(2): p. 284-296. 10. Tassan, J.P., et al., Cell cycle analysis of the activity, subcellular localization, and subunit
composition of human CAK (CDK-activating kinase). Journal of Cell Biology, 1994. 127(2): p. 467-478.
11. Satyanarayana, A. and P. Kaldis, Mammalian cell-cycle regulation: several Cdks, numerous cyclins and diverse compensatory mechanisms. Oncogene, 2009. 28(33): p. 2925-2939.
12. McGowan, C.H. and P. Russell, Cell cycle regulation of human WEE1. The EMBO journal, 1995. 14(10): p. 2166-2175.
13. Liu, F., et al., The human Myt1 kinase preferentially phosphorylates Cdc2 on threonine 14 and localizes to the endoplasmic reticulum and Golgi complex. Molecular and cellular biology, 1997. 17(2): p. 571-583.
14. Polyak, K., et al., Cloning of p27Kip1, a cyclin-dependent kinase inhibitor and a potential mediator of extracellular antimitogenic signals. Cell, 1994. 78(1): p. 59-66.
15. Abbastabar, M., et al., Multiple functions of p27 in cell cycle, apoptosis, epigenetic modification and transcriptional regulation for the control of cell growth: A double-edged sword protein. DNA Repair (Amst), 2018. 69: p. 63-72.
16. Karimian, A., Y. Ahmadi, and B. Yousefi, Multiple functions of p21 in cell cycle, apoptosis and transcriptional regulation after DNA damage. DNA Repair (Amst), 2016. 42: p. 63-71.
17. Chatterjee, N. and G.C. Walker, Mechanisms of DNA damage, repair, and mutagenesis. Environ Mol Mutagen, 2017. 58(5): p. 235-263.
18. Williams, G.M. and A.M. Jeffrey, Oxidative DNA Damage: Endogenous and Chemically Induced. Regulatory Toxicology and Pharmacology, 2000. 32(3): p. 283-292.
19. Thannickal, V.J. and B.L. Fanburg, Reactive oxygen species in cell signaling. American Journal of Physiology-Lung Cellular and Molecular Physiology, 2000. 279(6): p. L1005-L1028.
20. Fugmann, S.D., et al., The RAG proteins and V(D)J recombination: complexes, ends, and transposition. Annu Rev Immunol, 2000. 18: p. 495-527.
21. Zeman, M.K. and K.A. Cimprich, Causes and consequences of replication stress. Nature Cell Biology, 2014. 16(1): p. 2-9.
22. Ward, J.F., DNA damage produced by ionizing radiation in mammalian cells: identities, mechanisms of formation, and reparability. Prog Nucleic Acid Res Mol Biol, 1988. 35: p. 95-125.
23. Reisz, J.A., et al., Effects of ionizing radiation on biological molecules--mechanisms of damage and emerging methods of detection. Antioxidants & redox signaling, 2014. 21(2): p. 260-292.
56
24. Ward, J.F., The yield of DNA double-strand breaks produced intracellularly by ionizing radiation: a review. Int J Radiat Biol, 1990. 57(6): p. 1141-50.
25. Ruiz de Almodóvar, J.M., et al., Dose-rate effect for DNA damage induced by ionizing radiation in human tumor cells. Radiat Res, 1994. 138(1 Suppl): p. S93-6.
26. Pouget, J.P. and S.J. Mather, General aspects of the cellular response to low- and high-LET radiation. Eur J Nucl Med, 2001. 28(4): p. 541-61.
27. Blackford, A.N. and S.P. Jackson, ATM, ATR, and DNA-PK: The Trinity at the Heart of the DNA Damage Response. Mol Cell, 2017. 66(6): p. 801-817.
28. Falck, J., J. Coates, and S.P. Jackson, Conserved modes of recruitment of ATM, ATR and DNA-PKcs to sites of DNA damage. Nature, 2005. 434(7033): p. 605-11.
29. Ciccia, A. and S.J. Elledge, The DNA damage response: making it safe to play with knives. Molecular cell, 2010. 40(2): p. 179-204.
30. Wallace, S.S., Base excision repair: a critical player in many games. DNA repair, 2014. 19: p. 14-26.
31. Memisoglu, A. and L. Samson, Base excision repair in yeast and mammals. Mutation Research/Fundamental and Molecular Mechanisms of Mutagenesis, 2000. 451(1): p. 39-51.
32. Lindahl, T., P. Karran, and R.D. Wood, DNA excision repair pathways. Current Opinion in Genetics & Development, 1997. 7(2): p. 158-169.
33. Jones, M.J.K. and T.T. Huang, The Fanconi anemia pathway in replication stress and DNA crosslink repair. Cellular and molecular life sciences : CMLS, 2012. 69(23): p. 3963-3974.
34. Luger, K., et al., Crystal structure of the nucleosome core particle at 2.8 Å resolution. Nature, 1997. 389(6648): p. 251-260.
35. Redon, C., et al., Histone H2A variants H2AX and H2AZ. Current Opinion in Genetics & Development, 2002. 12(2): p. 162-169.
36. Mannironi, C., W.M. Bonner, and C.L. Hatch, H2A.X. a histone isoprotein with a conserved C-terminal sequence, is encoded by a novel mRNA with both DNA replication type and polyA 3' processing signals. Nucleic acids research, 1989. 17(22): p. 9113-9126.
37. Abraham, R.T., Cell cycle checkpoint signaling through the ATM and ATR kinases. Genes Dev, 2001. 15(17): p. 2177-96.
38. Rogakou, E.P., et al., DNA double-stranded breaks induce histone H2AX phosphorylation on serine 139. J Biol Chem, 1998. 273(10): p. 5858-68.
39. Cook, P.J., et al., Tyrosine dephosphorylation of H2AX modulates apoptosis and survival decisions. Nature, 2009. 458(7238): p. 591-596.
40. Rogakou, E., et al., Megabase Chromatin Domains Involved in DNA Double-Strand Breaks in Vivo. The Journal of cell biology, 1999. 146: p. 905-16.
41. Celeste, A., et al., Histone H2AX phosphorylation is dispensable for the initial recognition of DNA breaks. Nature Cell Biology, 2003. 5(7): p. 675-679.
42. Rothkamm, K. and M. Löbrich, Evidence for a lack of DNA double-strand break repair in human cells exposed to very low x-ray doses. Proceedings of the National Academy of Sciences, 2003. 100(9): p. 5057.
43. Haber, J.E., DNA recombination: the replication connection. Trends Biochem Sci, 1999. 24(7): p. 271-5.
44. Pastink, A., J.C. Eeken, and P.H. Lohman, Genomic integrity and the repair of double-strand DNA breaks. Mutat Res, 2001. 480-481: p. 37-50.
45. Her, J. and S.F. Bunting, How cells ensure correct repair of DNA double-strand breaks. The Journal of biological chemistry, 2018. 293(27): p. 10502-10511.
46. Lieber, M.R., The mechanism of double-strand DNA break repair by the nonhomologous DNA end-joining pathway. Annual review of biochemistry, 2010. 79: p. 181-211.
47. Gu, J., et al., DNA-PKcs regulates a single-stranded DNA endonuclease activity of Artemis. DNA Repair (Amst), 2010. 9(4): p. 429-37.

57
48. Chang, H.H.Y., G. Watanabe, and M.R. Lieber, Unifying the DNA end-processing roles of the artemis nuclease: Ku-dependent artemis resection at blunt DNA ends. The Journal of biological chemistry, 2015. 290(40): p. 24036-24050.
49. Critchlow, S.E., R.P. Bowater, and S.P. Jackson, Mammalian DNA double-strand break repair protein XRCC4 interacts with DNA ligase IV. Curr Biol, 1997. 7(8): p. 588-98.
50. de Jager, M., et al., Human Rad50/Mre11 is a flexible complex that can tether DNA ends. Mol Cell, 2001. 8(5): p. 1129-35.
51. Williams, R.S., et al., Mre11 dimers coordinate DNA end bridging and nuclease processing in double-strand-break repair. Cell, 2008. 135(1): p. 97-109.
52. Myler, L.R., et al., Single-Molecule Imaging Reveals How Mre11-Rad50-Nbs1 Initiates DNA Break Repair. Mol Cell, 2017. 67(5): p. 891-898.e4.
53. Lau, W.C., et al., Structure of the human dimeric ATM kinase. Cell Cycle, 2016. 15(8): p. 1117-24.
54. Lee, J.H. and T.T. Paull, Direct activation of the ATM protein kinase by the Mre11/Rad50/Nbs1 complex. Science, 2004. 304(5667): p. 93-6.
55. You, Z., et al., CtIP links DNA double-strand break sensing to resection. Molecular cell, 2009. 36(6): p. 954-969.
56. Takeda, S., et al., Ctp1/CtIP and the MRN complex collaborate in the initial steps of homologous recombination. Mol Cell, 2007. 28(3): p. 351-2.
57. Nimonkar, A.V., et al., BLM-DNA2-RPA-MRN and EXO1-BLM-RPA-MRN constitute two DNA end resection machineries for human DNA break repair. Genes Dev, 2011. 25(4): p. 350-62.
58. Maréchal, A. and L. Zou, RPA-coated single-stranded DNA as a platform for post-translational modifications in the DNA damage response. Cell Res, 2015. 25(1): p. 9-23.
59. Sullivan, M.R. and K.A. Bernstein, RAD-ical New Insights into RAD51 Regulation. Genes (Basel), 2018. 9(12).
60. Liu, J., et al., Human BRCA2 protein promotes RAD51 filament formation on RPA-covered single-stranded DNA. Nature structural & molecular biology, 2010. 17(10): p. 1260-1262.
61. Kolinjivadi, A.M., et al., Moonlighting at replication forks - a new life for homologous recombination proteins BRCA1, BRCA2 and RAD51. FEBS Lett, 2017. 591(8): p. 1083-1100.
62. Ip, S.C., et al., Identification of Holliday junction resolvases from humans and yeast. Nature, 2008. 456(7220): p. 357-61.
63. Sallmyr, A. and A.E. Tomkinson, Repair of DNA double-strand breaks by mammalian alternative end-joining pathways. 2018. 293(27): p. 10536-10546.
64. Bhargava, R., D.O. Onyango, and J.M. Stark, Regulation of Single-Strand Annealing and its Role in Genome Maintenance. Trends Genet, 2016. 32(9): p. 566-575.
65. Mateos-Gomez, P.A., et al., Mammalian polymerase θ promotes alternative NHEJ and suppresses recombination. Nature, 2015. 518(7538): p. 254-7.
66. Simsek, D. and M. Jasin, Alternative end-joining is suppressed by the canonical NHEJ component Xrcc4-ligase IV during chromosomal translocation formation. Nat Struct Mol Biol, 2010. 17(4): p. 410-6.
67. Sancar, A., et al., Molecular mechanisms of mammalian DNA repair and the DNA damage checkpoints. Annu Rev Biochem, 2004. 73: p. 39-85.
68. Hustedt, N. and D. Durocher, The control of DNA repair by the cell cycle. Nature Cell Biology, 2017. 19(1): p. 1-9.
69. Grant, G.D. and J.G. Cook, The Temporal Regulation of S Phase Proteins During G(1). Adv Exp Med Biol, 2017. 1042: p. 335-369.
70. Weinberg, R.A., The retinoblastoma protein and cell cycle control. Cell, 1995. 81(3): p. 323-30. 71. Choi, Y.J. and L. Anders, Signaling through cyclin D-dependent kinases. Oncogene, 2014.
33(15): p. 1890-903. 72. Connell-Crowley, L., J.W. Harper, and D.W. Goodrich, Cyclin D1/Cdk4 regulates
retinoblastoma protein-mediated cell cycle arrest by site-specific phosphorylation. Mol Biol Cell, 1997. 8(2): p. 287-301.
58
73. Chen, J., et al., Separate domains of p21 involved in the inhibition of Cdk kinase and PCNA. Nature, 1995. 374(6520): p. 386-8.
74. Mailand, N., et al., Rapid destruction of human Cdc25A in response to DNA damage. Science, 2000. 288(5470): p. 1425-9.
75. Falck, J., et al., The ATM-Chk2-Cdc25A checkpoint pathway guards against radioresistant DNA synthesis. Nature, 2001. 410(6830): p. 842-7.
76. Gillespie, P.J. and J.J. Blow, Clusters, factories and domains: The complex structure of S-phase comes into focus. Cell Cycle, 2010. 9(16): p. 3218-26.
77. Mordes, D.A., et al., TopBP1 activates ATR through ATRIP and a PIKK regulatory domain. Genes Dev, 2008. 22(11): p. 1478-89.
78. Sørensen, C.S. and R.G. Syljuåsen, Safeguarding genome integrity: the checkpoint kinases ATR, CHK1 and WEE1 restrain CDK activity during normal DNA replication. Nucleic Acids Res, 2012. 40(2): p. 477-86.
79. Fattaey, A. and R.N. Booher, Myt1: a Wee1-type kinase that phosphorylates Cdc2 on residue Thr14. Prog Cell Cycle Res, 1997. 3: p. 233-40.
80. Elbæk, C.R., V. Petrosius, and C.S. Sørensen, WEE1 kinase limits CDK activities to safeguard DNA replication and mitotic entry. Mutat Res, 2020. 819-820: p. 111694.
81. Rudolph, J., Cdc25 phosphatases: structure, specificity, and mechanism. Biochemistry, 2007. 46(12): p. 3595-604.
82. Moiseeva, T.N. and C.J. Bakkenist, Dormant origin signaling during unperturbed replication. DNA Repair (Amst), 2019. 81: p. 102655.
83. Beck, H., et al., Regulators of cyclin-dependent kinases are crucial for maintaining genome integrity in S phase. J Cell Biol, 2010. 188(5): p. 629-38.
84. Syljuåsen, R.G., et al., Inhibition of human Chk1 causes increased initiation of DNA replication, phosphorylation of ATR targets, and DNA breakage. Mol Cell Biol, 2005. 25(9): p. 3553-62.
85. Stark, G.R. and W.R. Taylor, Analyzing the G2/M checkpoint. Methods Mol Biol, 2004. 280: p. 51-82.
86. Xu, B., et al., Two molecularly distinct G(2)/M checkpoints are induced by ionizing irradiation. Mol Cell Biol, 2002. 22(4): p. 1049-59.
87. Landsverk, K.S., et al., Three independent mechanisms for arrest in G2 after ionizing radiation. Cell Cycle, 2011. 10(5): p. 819-29.
88. Bannister, A.J. and T. Kouzarides, Regulation of chromatin by histone modifications. Cell Res, 2011. 21(3): p. 381-95.
89. Pérez-Cadahía, B., B. Drobic, and J.R. Davie, H3 phosphorylation: dual role in mitosis and interphase. Biochem Cell Biol, 2009. 87(5): p. 695-709.
90. Iranzo, J., I. Martincorena, and E.V. Koonin, Cancer-mutation network and the number and specificity of driver mutations. Proc Natl Acad Sci U S A, 2018. 115(26): p. E6010-e6019.
91. Kent, L.N. and G. Leone, The broken cycle: E2F dysfunction in cancer. Nat Rev Cancer, 2019. 19(6): p. 326-338.
92. Duffy, M.J., N.C. Synnott, and J. Crown, Mutant p53 as a target for cancer treatment. Eur J Cancer, 2017. 83: p. 258-265.
93. Wang, J.J., K.F. Lei, and F. Han, Tumor microenvironment: recent advances in various cancer treatments. Eur Rev Med Pharmacol Sci, 2018. 22(12): p. 3855-3864.
94. Qiu, Z., N.L. Oleinick, and J. Zhang, ATR/CHK1 inhibitors and cancer therapy. Radiother Oncol, 2018. 126(3): p. 450-464.
95. Dent, P., Investigational CHK1 inhibitors in early phase clinical trials for the treatment of cancer. Expert Opin Investig Drugs, 2019. 28(12): p. 1095-1100.
96. Matheson, C.J., D.S. Backos, and P. Reigan, Targeting WEE1 Kinase in Cancer. Trends Pharmacol Sci, 2016. 37(10): p. 872-881.
97. Geenen, J.J.J. and J.H.M. Schellens, Molecular Pathways: Targeting the Protein Kinase Wee1 in Cancer. Clin Cancer Res, 2017. 23(16): p. 4540-4544.
59
98. Harrison, R.K., Phase II and phase III failures: 2013-2015. Nat Rev Drug Discov, 2016. 15(12): p. 817-818.
99. Langedijk, J., et al., Drug repositioning and repurposing: terminology and definitions in literature. Drug Discov Today, 2015. 20(8): p. 1027-34.
100. Pushpakom, S., et al., Drug repurposing: progress, challenges and recommendations. Nat Rev Drug Discov, 2019. 18(1): p. 41-58.
101. Ward, I.M. and J. Chen, Histone H2AX is phosphorylated in an ATR-dependent manner in response to replicational stress. J Biol Chem, 2001. 276(51): p. 47759-62.
102. Hauge, S., L. Macurek, and R.G. Syljuåsen, p21 limits S phase DNA damage caused by the Wee1 inhibitor MK1775. Cell Cycle, 2019. 18(8): p. 834-847.
103. Cha, H., et al., Wip1 directly dephosphorylates gamma-H2AX and attenuates the DNA damage response. Cancer research, 2010. 70(10): p. 4112-4122.
104. Suzuki, M., et al., Phosphorylated histone H2AX foci persist on rejoined mitotic chromosomes in normal human diploid cells exposed to ionizing radiation. Radiat Res, 2006. 165(3): p. 269-76.
105. Maya-Mendoza, A., et al., Chk1 regulates the density of active replication origins during the vertebrate S phase. The EMBO journal, 2007. 26(11): p. 2719-2731.
106. Domínguez-Kelly, R., et al., Wee1 controls genomic stability during replication by regulating the Mus81-Eme1 endonuclease. The Journal of cell biology, 2011. 194(4): p. 567-579.
107. Beck, H., et al., Cyclin-dependent kinase suppression by WEE1 kinase protects the genome through control of replication initiation and nucleotide consumption. Mol Cell Biol, 2012. 32(20): p. 4226-36.
108. Subissi, A., et al., Ciclopirox: recent nonclinical and clinical data relevant to its use as a topical antimycotic agent. Drugs, 2010. 70(16): p. 2133-52.
109. Hoffman, B.D., et al., A new class of reversible cell cycle inhibitors. Cytometry, 1991. 12(1): p. 26-32.
110. Kim, Y., et al., Targeting the Wnt/beta-catenin pathway with the antifungal agent ciclopirox olamine in a murine myeloma model. In Vivo, 2011. 25(6): p. 887-93.
111. Eberhard, Y., et al., Chelation of intracellular iron with the antifungal agent ciclopirox olamine induces cell death in leukemia and myeloma cells. Blood, 2009. 114(14): p. 3064-73.
112. Shen, T., et al., Ciclopirox inhibits cancer cell proliferation by suppression of Cdc25A. Genes & cancer, 2017. 8(3-4): p. 505-516.
113. Seto, E. and M. Yoshida, Erasers of histone acetylation: the histone deacetylase enzymes. Cold Spring Harbor perspectives in biology, 2014. 6(4): p. a018713-a018713.
114. Fraga, M.F., et al., Loss of acetylation at Lys16 and trimethylation at Lys20 of histone H4 is a common hallmark of human cancer. Nat Genet, 2005. 37(4): p. 391-400.
115. Singh, B.N., et al., Nonhistone protein acetylation as cancer therapy targets. Expert review of anticancer therapy, 2010. 10(6): p. 935-954.
116. Glozak, M.A., et al., Acetylation and deacetylation of non-histone proteins. Gene, 2005. 363: p. 15-23.
117. Li, Z. and W.-G. Zhu, Targeting histone deacetylases for cancer therapy: from molecular mechanisms to clinical implications. International journal of biological sciences, 2014. 10(7): p. 757-770.
118. Thurn, K.T., et al., Histone deacetylase regulation of ATM-mediated DNA damage signaling. Molecular cancer therapeutics, 2013. 12(10): p. 2078-2087.
119. Miller, K.M., et al., Human HDAC1 and HDAC2 function in the DNA-damage response to promote DNA nonhomologous end-joining. Nature structural & molecular biology, 2010. 17(9): p. 1144-1151.
120. Ikura, M., et al., Acetylation of Histone H2AX at Lys 5 by the TIP60 Histone Acetyltransferase Complex Is Essential for the Dynamic Binding of NBS1 to Damaged Chromatin. Molecular and cellular biology, 2015. 35(24): p. 4147-4157.
121. Chen, P.B., et al., Hdac6 regulates Tip60-p400 function in stem cells. Elife, 2013. 2: p. e01557.

60
122. Yi, J., et al., Regulation of histone acetyltransferase TIP60 function by histone deacetylase 3. The Journal of biological chemistry, 2014. 289(49): p. 33878-33886.
123. Peng, L., et al., SIRT1 negatively regulates the activities, functions, and protein levels of hMOF and TIP60. Mol Cell Biol, 2012. 32(14): p. 2823-36.
124. Ryu, H.W., et al., HDAC6 deacetylates p53 at lysines 381/382 and differentially coordinates p53-induced apoptosis. Cancer Lett, 2017. 391: p. 162-171.
125. Kawaguchi, Y., et al., The deacetylase HDAC6 regulates aggresome formation and cell viability in response to misfolded protein stress. Cell, 2003. 115(6): p. 727-38.
126. Kovacs, J.J., et al., HDAC6 regulates Hsp90 acetylation and chaperone-dependent activation of glucocorticoid receptor. Mol Cell, 2005. 18(5): p. 601-7.
127. Fan, J., et al., Down-regulation of HDAC5 inhibits growth of human hepatocellular carcinoma by induction of apoptosis and cell cycle arrest. Tumour Biol, 2014. 35(11): p. 11523-32.
128. Juengel, E., et al., HDAC-inhibition counteracts everolimus resistance in renal cell carcinoma in vitro by diminishing cdk2 and cyclin A. Molecular cancer, 2014. 13: p. 152-152.
129. Senese, S., et al., Role for histone deacetylase 1 in human tumor cell proliferation. Molecular and cellular biology, 2007. 27(13): p. 4784-4795.
130. Cha, T.L., et al., Dual degradation of aurora A and B kinases by the histone deacetylase inhibitor LBH589 induces G2-M arrest and apoptosis of renal cancer cells. Clin Cancer Res, 2009. 15(3): p. 840-50.
131. Lane, A.A. and B.A. Chabner, Histone deacetylase inhibitors in cancer therapy. J Clin Oncol, 2009. 27(32): p. 5459-68.
132. Marks, P.A. and W.S. Xu, Histone deacetylase inhibitors: Potential in cancer therapy. Journal of cellular biochemistry, 2009. 107(4): p. 600-608.
133. Bolden, J.E., M.J. Peart, and R.W. Johnstone, Anticancer activities of histone deacetylase inhibitors. Nat Rev Drug Discov, 2006. 5(9): p. 769-84.
134. Bubna, A.K., Vorinostat-An Overview. Indian journal of dermatology, 2015. 60(4): p. 419-419. 135. Galloway, T.J., et al., A Phase I Study of CUDC-101, a Multitarget Inhibitor of HDACs, EGFR,
and HER2, in Combination with Chemoradiation in Patients with Head and Neck Squamous Cell Carcinoma. Clin Cancer Res, 2015. 21(7): p. 1566-73.
136. Cai, X., et al., Discovery of 7-(4-(3-ethynylphenylamino)-7-methoxyquinazolin-6-yloxy)-N-hydroxyheptanamide (CUDc-101) as a potent multi-acting HDAC, EGFR, and HER2 inhibitor for the treatment of cancer. J Med Chem, 2010. 53(5): p. 2000-9.
137. Liffers, K., et al., Histone Deacetylase Inhibitors Resensitize EGFR/EGFRvIII-Overexpressing, Erlotinib-Resistant Glioblastoma Cells to Tyrosine Kinase Inhibition. Target Oncol, 2016. 11(1): p. 29-40.
138. Ghelli Luserna Di Rorà, A., et al., Targeting WEE1 to enhance conventional therapies for acute lymphoblastic leukemia. Journal of hematology & oncology, 2018. 11(1): p. 99-99.
139. Ghelli Luserna Di Rorà, A., et al., Synergism Through WEE1 and CHK1 Inhibition in Acute Lymphoblastic Leukemia. Cancers, 2019. 11(11): p. 1654.
140. Zhou, L., et al., A regimen combining the Wee1 inhibitor AZD1775 with HDAC inhibitors targets human acute myeloid leukemia cells harboring various genetic mutations. Leukemia, 2015. 29(4): p. 807-818.
141. Ding, M., et al., Application of High-Throughput Flow Cytometry in Early Drug Discovery: An AstraZeneca Perspective. SLAS Discov, 2018. 23(7): p. 719-731.
142. Joslin, J., et al., A Fully Automated High-Throughput Flow Cytometry Screening System Enabling Phenotypic Drug Discovery. SLAS Discov, 2018. 23(7): p. 697-707.
143. Bredemeyer, A.L., et al., High-Throughput Screening Approach for Identifying Compounds That Inhibit Nonhomologous End Joining. SLAS Discov, 2018. 23(7): p. 624-633.
144. Boutros, M., F. Heigwer, and C. Laufer, Microscopy-Based High-Content Screening. Cell, 2015. 163(6): p. 1314-25.

I


Oncotarget10966www.impactjournals.com/oncotarget
www.impactjournals.com/oncotarget/ Oncotarget, 2017, Vol. 8, (No. 7), pp: 10966-10979
Combined inhibition of Wee1 and Chk1 gives synergistic DNA damage in S-phase due to distinct regulation of CDK activity and CDC45 loading
Sissel Hauge1, Christian Naucke1, Grete Hasvold1, Mrinal Joel1, Gro Elise Rødland1, Petras Juzenas1, Trond Stokke1, Randi G. Syljuåsen1
1Department of Radiation Biology, Institute for Cancer Research, Norwegian Radium Hospital, Oslo University Hospital, Oslo, N-0310, Norway
Correspondence to: Randi G. Syljuåsen, email: [email protected]: checkpoint kinase inhibitors, cancer treatment, replication stress, DNA damage, CDK activityReceived: August 04, 2016 Accepted: December 15, 2016 Published: December 22, 2016
ABSTRACTRecent studies have shown synergistic cytotoxic effects of simultaneous Chk1-
and Wee1-inhibition. However, the mechanisms behind this synergy are not known. Here, we present a flow cytometry-based screen for compounds that cause increased DNA damage in S-phase when combined with the Wee1-inhibitor MK1775. Strikingly, the Chk1-inhibitors AZD7762 and LY2603618 were among the top candidate hits of 1664 tested compounds, suggesting that the synergistic cytotoxic effects are due to increased S-phase DNA damage. Combined Wee1- and Chk1-inhibition caused a strong synergy in induction of S-phase DNA damage and reduction of clonogenic survival. To address the underlying mechanisms, we developed a novel assay measuring CDK-dependent phosphorylations in single S-phase cells. Surprisingly, while Wee1-inhibition alone induced less DNA damage compared to Chk1-inhibition, Wee1-inhibition caused a bigger increase in S-phase CDK-activity. However, the loading of replication initiation factor CDC45 was more increased after Chk1- than Wee1-inhibition and further increased by the combined treatment, and thus correlated well with DNA damage. Therefore, when Wee1 alone is inhibited, Chk1 suppresses CDC45 loading and thereby limits the extent of unscheduled replication initiation and subsequent S-phase DNA damage, despite very high CDK-activity. These results can explain why combined treatment with Wee1- and Chk1-inhibitors gives synergistic anti-cancer effects.
INTRODUCTION
Inhibitors of Wee1 kinase are currently in clinical trials for cancer treatment as single agents and in combination with radiation or chemo-therapy [1]. The antitumor effects have traditionally been attributed to the role of Wee1 in preventing G2 checkpoint abrogation [2]. Wee1 is required for the G2 checkpoint through mediating inhibitory phosphorylation of the Tyr-15 residue on CDK1 [3]. Wee1 inhibition leads to abnormally high CDK1 activity, resulting in G2 checkpoint abrogation followed by mitotic catastrophe [4, 5].
However, in addition to its role in G2 checkpoint regulation, Wee1 also plays a major role in suppressing DNA breakage during S-phase [6–8]. Inhibition of Wee1 leads to high CDK1 and CDK2 activity in S-phase followed by unscheduled replication initiation. This results
in shortage of replication factors such as nucleotides and replication factor A (RPA), and subsequent replication stalling and endonuclease-induced DNA breakage [7, 9, 10]. Such S-phase damage has been termed “replication catastrophe” [10] and is most likely the major cause behind single-agent antitumor activity of Wee1 inhibitors [11].
Similar as for Wee1, inhibition of Checkpoint kinase 1 (Chk1) causes both G2 checkpoint abrogation and replication catastrophe [12, 13]. Chk1 is thought to regulate these processes mainly through phosphorylation of the Cdc25A phosphatase [7, 13]. Upon Chk1 inhibition Cdc25A is stabilized, giving increased capacity of Cdc25A to remove the inhibitory phosphorylation on CDK1 and CDK2, thereby causing increased CDK activity [14, 15]. Inhibitors of either Chk1 or Wee1 were thus considered to induce replication catastrophe through
Research Paper
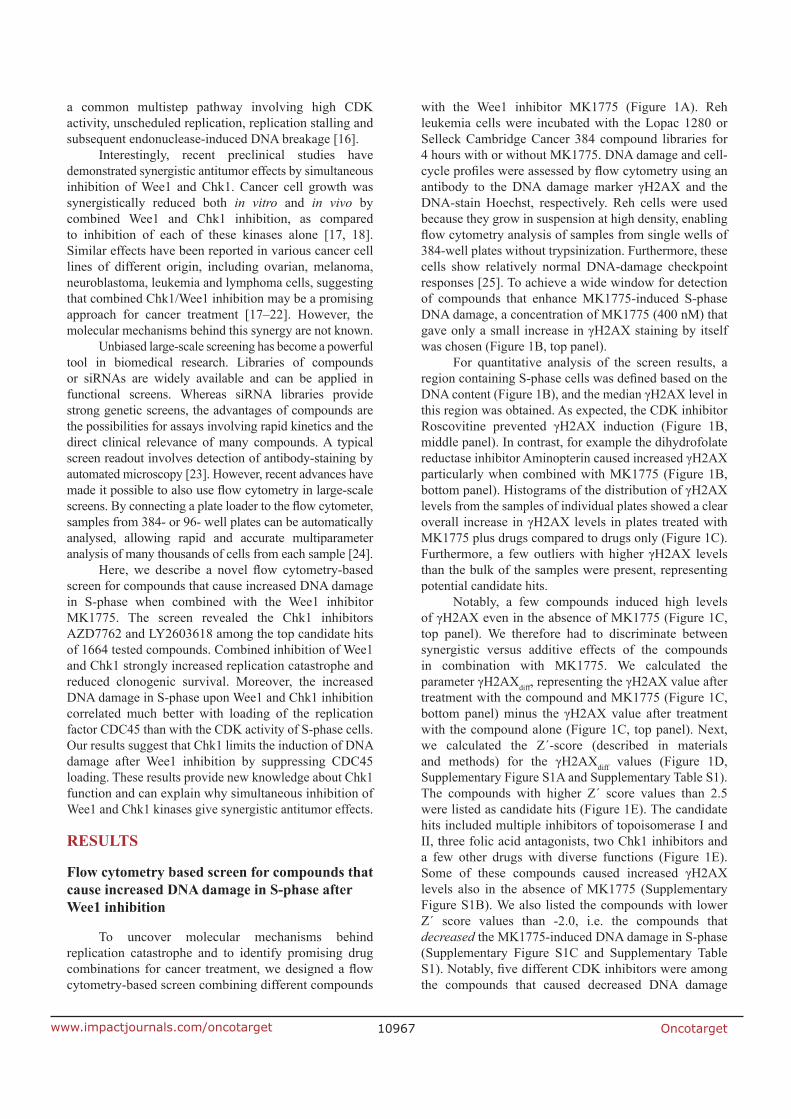
Oncotarget10967www.impactjournals.com/oncotarget
a common multistep pathway involving high CDK activity, unscheduled replication, replication stalling and subsequent endonuclease-induced DNA breakage [16].
Interestingly, recent preclinical studies have demonstrated synergistic antitumor effects by simultaneous inhibition of Wee1 and Chk1. Cancer cell growth was synergistically reduced both in vitro and in vivo by combined Wee1 and Chk1 inhibition, as compared to inhibition of each of these kinases alone [17, 18]. Similar effects have been reported in various cancer cell lines of different origin, including ovarian, melanoma, neuroblastoma, leukemia and lymphoma cells, suggesting that combined Chk1/Wee1 inhibition may be a promising approach for cancer treatment [17–22]. However, the molecular mechanisms behind this synergy are not known.
Unbiased large-scale screening has become a powerful tool in biomedical research. Libraries of compounds or siRNAs are widely available and can be applied in functional screens. Whereas siRNA libraries provide strong genetic screens, the advantages of compounds are the possibilities for assays involving rapid kinetics and the direct clinical relevance of many compounds. A typical screen readout involves detection of antibody-staining by automated microscopy [23]. However, recent advances have made it possible to also use flow cytometry in large-scale screens. By connecting a plate loader to the flow cytometer, samples from 384- or 96- well plates can be automatically analysed, allowing rapid and accurate multiparameter analysis of many thousands of cells from each sample [24].
Here, we describe a novel flow cytometry-based screen for compounds that cause increased DNA damage in S-phase when combined with the Wee1 inhibitor MK1775. The screen revealed the Chk1 inhibitors AZD7762 and LY2603618 among the top candidate hits of 1664 tested compounds. Combined inhibition of Wee1 and Chk1 strongly increased replication catastrophe and reduced clonogenic survival. Moreover, the increased DNA damage in S-phase upon Wee1 and Chk1 inhibition correlated much better with loading of the replication factor CDC45 than with the CDK activity of S-phase cells. Our results suggest that Chk1 limits the induction of DNA damage after Wee1 inhibition by suppressing CDC45 loading. These results provide new knowledge about Chk1 function and can explain why simultaneous inhibition of Wee1 and Chk1 kinases give synergistic antitumor effects.
RESULTS
Flow cytometry based screen for compounds that cause increased DNA damage in S-phase after Wee1 inhibition
To uncover molecular mechanisms behind replication catastrophe and to identify promising drug combinations for cancer treatment, we designed a flow cytometry-based screen combining different compounds
with the Wee1 inhibitor MK1775 (Figure 1A). Reh leukemia cells were incubated with the Lopac 1280 or Selleck Cambridge Cancer 384 compound libraries for 4 hours with or without MK1775. DNA damage and cell-cycle profiles were assessed by flow cytometry using an antibody to the DNA damage marker γH2AX and the DNA-stain Hoechst, respectively. Reh cells were used because they grow in suspension at high density, enabling flow cytometry analysis of samples from single wells of 384-well plates without trypsinization. Furthermore, these cells show relatively normal DNA-damage checkpoint responses [25]. To achieve a wide window for detection of compounds that enhance MK1775-induced S-phase DNA damage, a concentration of MK1775 (400 nM) that gave only a small increase in γH2AX staining by itself was chosen (Figure 1B, top panel).
For quantitative analysis of the screen results, a region containing S-phase cells was defined based on the DNA content (Figure 1B), and the median γH2AX level in this region was obtained. As expected, the CDK inhibitor Roscovitine prevented γH2AX induction (Figure 1B, middle panel). In contrast, for example the dihydrofolate reductase inhibitor Aminopterin caused increased γH2AX particularly when combined with MK1775 (Figure 1B, bottom panel). Histograms of the distribution of γH2AX levels from the samples of individual plates showed a clear overall increase in γH2AX levels in plates treated with MK1775 plus drugs compared to drugs only (Figure 1C). Furthermore, a few outliers with higher γH2AX levels than the bulk of the samples were present, representing potential candidate hits.
Notably, a few compounds induced high levels of γH2AX even in the absence of MK1775 (Figure 1C, top panel). We therefore had to discriminate between synergistic versus additive effects of the compounds in combination with MK1775. We calculated the parameter γH2AXdiff, representing the γH2AX value after treatment with the compound and MK1775 (Figure 1C, bottom panel) minus the γH2AX value after treatment with the compound alone (Figure 1C, top panel). Next, we calculated the Z´-score (described in materials and methods) for the γH2AXdiff values (Figure 1D, Supplementary Figure S1A and Supplementary Table S1). The compounds with higher Z´ score values than 2.5 were listed as candidate hits (Figure 1E). The candidate hits included multiple inhibitors of topoisomerase I and II, three folic acid antagonists, two Chk1 inhibitors and a few other drugs with diverse functions (Figure 1E). Some of these compounds caused increased γH2AX levels also in the absence of MK1775 (Supplementary Figure S1B). We also listed the compounds with lower Z´ score values than -2.0, i.e. the compounds that decreased the MK1775-induced DNA damage in S-phase (Supplementary Figure S1C and Supplementary Table S1). Notably, five different CDK inhibitors were among the compounds that caused decreased DNA damage
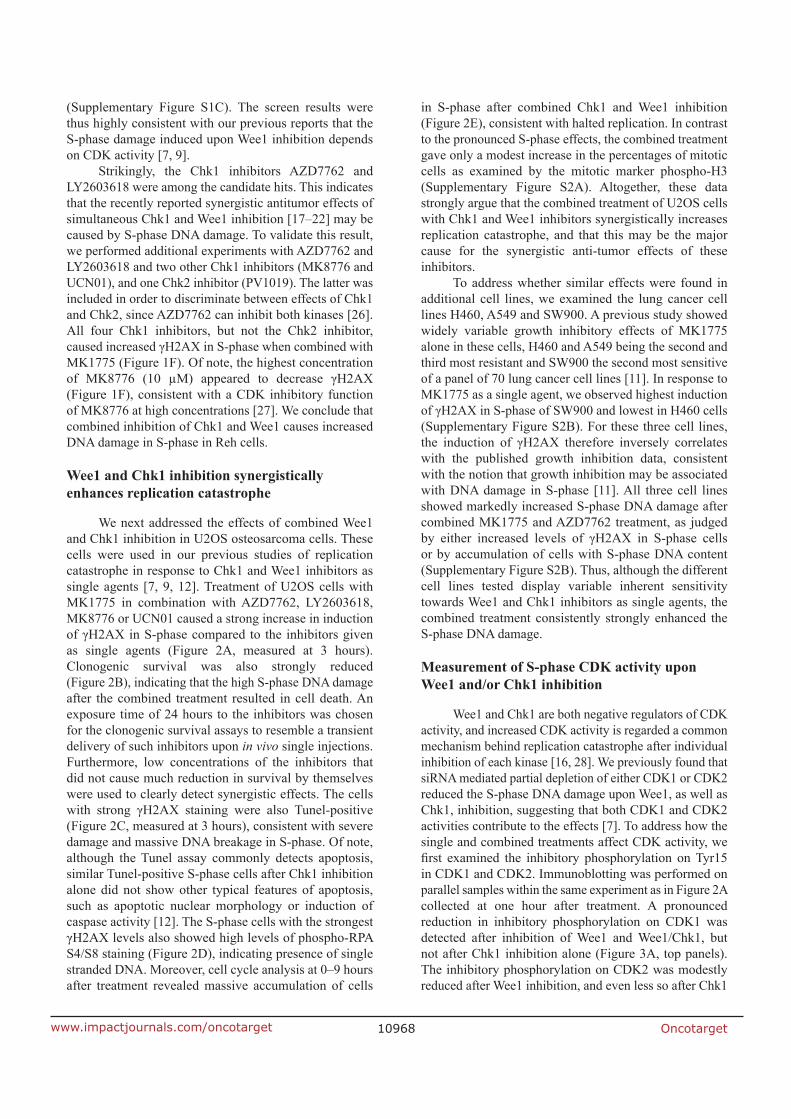
Oncotarget10968www.impactjournals.com/oncotarget
(Supplementary Figure S1C). The screen results were thus highly consistent with our previous reports that the S-phase damage induced upon Wee1 inhibition depends on CDK activity [7, 9].
Strikingly, the Chk1 inhibitors AZD7762 and LY2603618 were among the candidate hits. This indicates that the recently reported synergistic antitumor effects of simultaneous Chk1 and Wee1 inhibition [17–22] may be caused by S-phase DNA damage. To validate this result, we performed additional experiments with AZD7762 and LY2603618 and two other Chk1 inhibitors (MK8776 and UCN01), and one Chk2 inhibitor (PV1019). The latter was included in order to discriminate between effects of Chk1 and Chk2, since AZD7762 can inhibit both kinases [26]. All four Chk1 inhibitors, but not the Chk2 inhibitor, caused increased γH2AX in S-phase when combined with MK1775 (Figure 1F). Of note, the highest concentration of MK8776 (10 µM) appeared to decrease γH2AX (Figure 1F), consistent with a CDK inhibitory function of MK8776 at high concentrations [27]. We conclude that combined inhibition of Chk1 and Wee1 causes increased DNA damage in S-phase in Reh cells.
Wee1 and Chk1 inhibition synergistically enhances replication catastrophe
We next addressed the effects of combined Wee1 and Chk1 inhibition in U2OS osteosarcoma cells. These cells were used in our previous studies of replication catastrophe in response to Chk1 and Wee1 inhibitors as single agents [7, 9, 12]. Treatment of U2OS cells with MK1775 in combination with AZD7762, LY2603618, MK8776 or UCN01 caused a strong increase in induction of γH2AX in S-phase compared to the inhibitors given as single agents (Figure 2A, measured at 3 hours). Clonogenic survival was also strongly reduced (Figure 2B), indicating that the high S-phase DNA damage after the combined treatment resulted in cell death. An exposure time of 24 hours to the inhibitors was chosen for the clonogenic survival assays to resemble a transient delivery of such inhibitors upon in vivo single injections. Furthermore, low concentrations of the inhibitors that did not cause much reduction in survival by themselves were used to clearly detect synergistic effects. The cells with strong γH2AX staining were also Tunel-positive (Figure 2C, measured at 3 hours), consistent with severe damage and massive DNA breakage in S-phase. Of note, although the Tunel assay commonly detects apoptosis, similar Tunel-positive S-phase cells after Chk1 inhibition alone did not show other typical features of apoptosis, such as apoptotic nuclear morphology or induction of caspase activity [12]. The S-phase cells with the strongest γH2AX levels also showed high levels of phospho-RPA S4/S8 staining (Figure 2D), indicating presence of single stranded DNA. Moreover, cell cycle analysis at 0–9 hours after treatment revealed massive accumulation of cells
in S-phase after combined Chk1 and Wee1 inhibition (Figure 2E), consistent with halted replication. In contrast to the pronounced S-phase effects, the combined treatment gave only a modest increase in the percentages of mitotic cells as examined by the mitotic marker phospho-H3 (Supplementary Figure S2A). Altogether, these data strongly argue that the combined treatment of U2OS cells with Chk1 and Wee1 inhibitors synergistically increases replication catastrophe, and that this may be the major cause for the synergistic anti-tumor effects of these inhibitors.
To address whether similar effects were found in additional cell lines, we examined the lung cancer cell lines H460, A549 and SW900. A previous study showed widely variable growth inhibitory effects of MK1775 alone in these cells, H460 and A549 being the second and third most resistant and SW900 the second most sensitive of a panel of 70 lung cancer cell lines [11]. In response to MK1775 as a single agent, we observed highest induction of γH2AX in S-phase of SW900 and lowest in H460 cells (Supplementary Figure S2B). For these three cell lines, the induction of γH2AX therefore inversely correlates with the published growth inhibition data, consistent with the notion that growth inhibition may be associated with DNA damage in S-phase [11]. All three cell lines showed markedly increased S-phase DNA damage after combined MK1775 and AZD7762 treatment, as judged by either increased levels of γH2AX in S-phase cells or by accumulation of cells with S-phase DNA content (Supplementary Figure S2B). Thus, although the different cell lines tested display variable inherent sensitivity towards Wee1 and Chk1 inhibitors as single agents, the combined treatment consistently strongly enhanced the S-phase DNA damage.
Measurement of S-phase CDK activity upon Wee1 and/or Chk1 inhibition
Wee1 and Chk1 are both negative regulators of CDK activity, and increased CDK activity is regarded a common mechanism behind replication catastrophe after individual inhibition of each kinase [16, 28]. We previously found that siRNA mediated partial depletion of either CDK1 or CDK2 reduced the S-phase DNA damage upon Wee1, as well as Chk1, inhibition, suggesting that both CDK1 and CDK2 activities contribute to the effects [7]. To address how the single and combined treatments affect CDK activity, we first examined the inhibitory phosphorylation on Tyr15 in CDK1 and CDK2. Immunoblotting was performed on parallel samples within the same experiment as in Figure 2A collected at one hour after treatment. A pronounced reduction in inhibitory phosphorylation on CDK1 was detected after inhibition of Wee1 and Wee1/Chk1, but not after Chk1 inhibition alone (Figure 3A, top panels). The inhibitory phosphorylation on CDK2 was modestly reduced after Wee1 inhibition, and even less so after Chk1
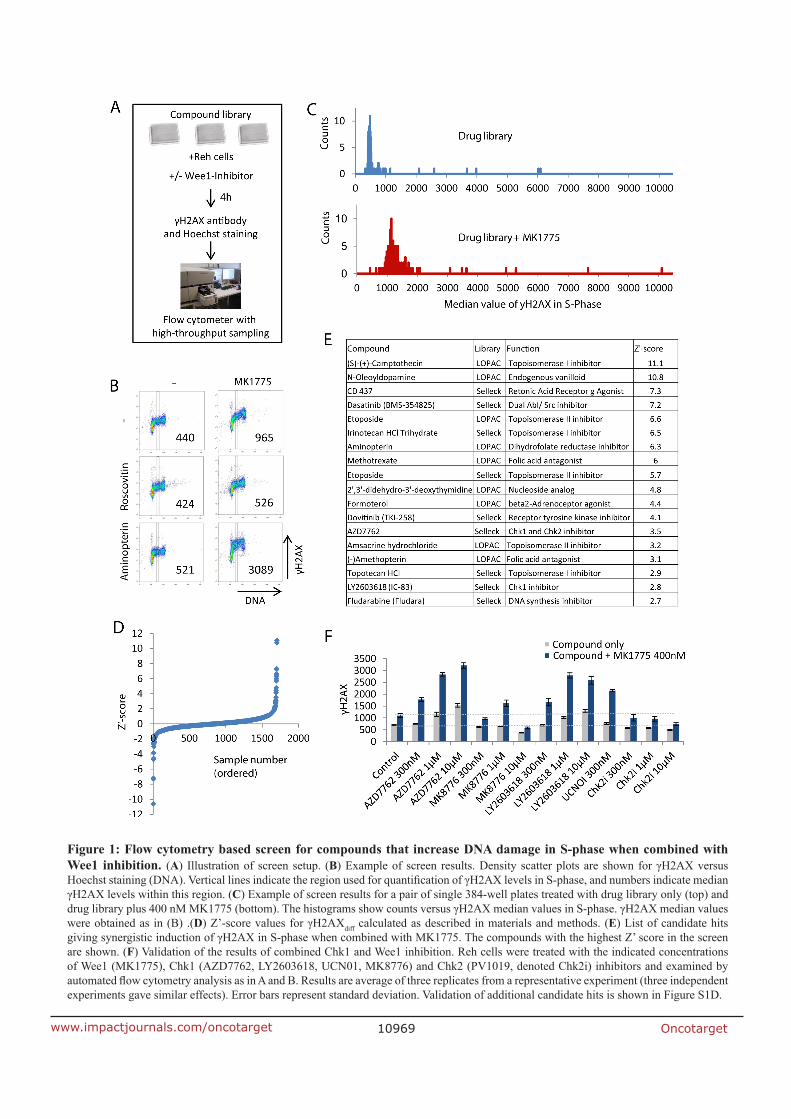
Oncotarget10969www.impactjournals.com/oncotarget
Figure 1: Flow cytometry based screen for compounds that increase DNA damage in S-phase when combined with Wee1 inhibition. (A) Illustration of screen setup. (B) Example of screen results. Density scatter plots are shown for γH2AX versus Hoechst staining (DNA). Vertical lines indicate the region used for quantification of γH2AX levels in S-phase, and numbers indicate median γH2AX levels within this region. (C) Example of screen results for a pair of single 384-well plates treated with drug library only (top) and drug library plus 400 nM MK1775 (bottom). The histograms show counts versus γH2AX median values in S-phase. γH2AX median values were obtained as in (B) .(D) Z’-score values for γH2AXdiff calculated as described in materials and methods. (E) List of candidate hits giving synergistic induction of γH2AX in S-phase when combined with MK1775. The compounds with the highest Z’ score in the screen are shown. (F) Validation of the results of combined Chk1 and Wee1 inhibition. Reh cells were treated with the indicated concentrations of Wee1 (MK1775), Chk1 (AZD7762, LY2603618, UCN01, MK8776) and Chk2 (PV1019, denoted Chk2i) inhibitors and examined by automated flow cytometry analysis as in A and B. Results are average of three replicates from a representative experiment (three independent experiments gave similar effects). Error bars represent standard deviation. Validation of additional candidate hits is shown in Figure S1D.

Oncotarget10970www.impactjournals.com/oncotarget
Figure 2: Combined Wee1 and Chk1 inhibition synergistically enhances replication catastrophe. (A) Flow cytometric analysis of U2OS cells treated for 3 hours with the Wee1 inhibitor MK1775, either of the Chk1 inhibitors AZD7762, LY2603618, MK8776, UCN01, or the combination of MK1775 with each of the Chk1 inhibitors. Scatter plots of γH2AX versus Hoechst (DNA) are shown from a representative experiment. Numbers are the percentage of cells within the indicated region with strong γH2AX signal (red color). (B) Clonogenic survival of U2OS cells treated with MK1775 and/or AZD7762 (left) or MK1775 and/or LY2603618 (right), at concentrations 0, 25, 50 or 100 nM for 24 hours. Average survival fractions from three independent experiments are shown. Error bars: SEM (n = 3). (C) U2OS cells treated with a combination of MK1775 (300 nM) and AZD7762 (150 nM) or LY2603618 (500 nM) for 3 hours were processed for simultaneous flow cytometric analysis of γH2AX and the TUNEL assay. Scatter plots of γH2AX versus Hoechst (DNA) (top panel) and TUNEL versus Hoechst (bottom panel) are shown. A region defined based on cells with strong γH2AX signals is shown in red color. (D) U2OS cells treated as in C processed for simultaneous flow cytometric analysis of γH2AX and phospho-RPA (Ser4/Ser8). A region defined based on cells with strong γH2AX signals is shown in red color. (E) U2OS cells treated with MK1775 or AZD7762 or the combination of the two inhibitors as indicated, were stained with Hoechst and analyzed by flow cytometry. DNA histograms are shown.

Oncotarget10971www.impactjournals.com/oncotarget
inhibition, whereas the combined treatment showed a small reduction (Figure 3A, middle panels). We also examined Cyclin E levels (Figure 3A, bottom panels). Since Cyclin E is degraded in S-phase in a manner dependent on CDK2 activity, reduced Cyclin E levels may reflect increased CDK2 activity [29]. We observed a small decrease in Cyclin E levels after Chk1 inhibition (Figure 3A, bottom panels), consistent with a slight increase in CDK2 activity. Wee1 inhibition caused a similar or even stronger reduction in Cyclin E levels, but Cyclin E levels were not more reduced after the combined treatment. Taken together with the measurements of γH2AX from Figure 2A, these results suggest that the induction of DNA damage in S-phase does not strictly correlate with CDK1 or CDK2 activity upon inhibition of Wee1 and Chk1.
To further investigate this finding, we developed a flow cytometry method to accurately measure phosphorylation of CDK targets in individual S-phase cells. In this method cells were stained with a DNA-dye together with antibodies to previously reported CDK2 targets (phospho-B-Myb [30, 31] and phospho-BRCA2 [32]) and CDK1 targets (phospho-MPM2 [33]), to measure cell-cycle distribution and CDK activity, respectively (Figure 3B). Addition of Wee1 or Wee1 plus Chk1 inhibitors clearly increased the S-phase signals with all three antibodies (Figure 3B and Supplementary Figure S3). Furthermore, addition of the CDK1 inhibitor RO-3306, the CDK2 inhibitor CVT-313 or the dual CDK1 and CDK2 inhibitor Roscovitine reduced the signals (Supplementary Figure S3A and S3B), indicating that these phosphorylations depend on both CDK1 and CDK2 activity. Cells were also co-stained with an antibody to γH2AX to simultaneously measure the amount of DNA damage. To eliminate potential errors caused by variation in antibody staining, we employed barcoding with pacific blue of sets of four samples.
This method allowed us to assess whether the induction of DNA damage in S-phase correlated with the increase in CDK activity. To investigate early events after adding the inhibitors, cells were treated for one hour. Consistent with our results obtained by immunoblotting, Wee1 inhibition caused a higher increase in CDK activity compared to Chk1 inhibition (Figure 3B). However, Chk1 inhibition caused higher induction of γH2AX. The combined treatment strongly enhanced γH2AX, but showed no or only slight increase in CDK activity compared to after Wee1 inhibition alone (Figure 3B). Thus, the induction of DNA damage in S-phase upon Wee1 and/or Chk1 inhibition does not show an overall correlation with levels of CDK activity.
Loading of the replication initiation factor CDC45 after Wee1 inhibition is restrained by Chk1
Since unscheduled replication initiation is considered a major cause of replication catastrophe
[16, 28], we next examined loading of the replication initiation factor CDC45 after Wee1 and Chk1 inhibition. CDC45 is limiting for replication initiation in humans [34], and we previously showed that partial depletion of CDC45 by siRNA transfection reduced the DNA damage in S-phase upon Chk1 inhibition [12]. Immunoblotting of nonextractable chromatin-bound CDC45 showed a small increase in CDC45 loading after Wee1 inhibition alone, but a markedly higher increase after Chk1 inhibition alone, and the combined treatment further increased CDC45 loading (Figure 4A).
To more accurately measure CDC45 loading in S-phase cells, we conducted flow cytometry analysis with an antibody to CDC45 combined with a DNA-stain after extraction of unbound proteins at one hour after treatment. Again, barcoding of sets of four samples was included to minimize sample-to-sample variations. Wee1 inhibition gave a smaller increase in CDC45 loading compared to Chk1 inhibition, and the combined treatment further increased CDC45 loading (Figure 4B and 4C). Consistent with increased replication initiation, measurements of uptake of the nucleoside analog EdU in S-phase cells followed the same pattern and was also most increased upon the combined treatment (Supplementary Figure S4A and S4B). Levels of γH2AX and phospho-B-Myb were examined in parallel samples within the same experiments to assess induction of DNA damage and CDK activity, respectively. Again, we observed a strong synergistic induction of DNA damage in S-phase upon the combined treatment (Figure 4D), but no synergistic increase of CDK activity (Supplementary Figure S4C). When levels of CDC45 loading in S-phase cells at one hour after treatment with MK1775 and AZD7762 as single agents and in combination were plotted against γH2AX levels, we observed a strong correlation between CDC45 loading and the induction of S-phase DNA damage (Figure 4E, left panel; Pearson coefficient: 0.89 (p < 0.0001)). In contrast, γH2AX levels correlated less with CDK activity measurements in the same experiments (Figure 4E, right panel; Pearson coefficient: 0.54 (p = 0.005)). These results are consistent with the notion that unscheduled replication initiation is a major cause of the observed S-phase DNA damage in response to Wee1 and Chk1 inhibitors. Furthermore, the increased DNA damage in S-phase upon combined Wee1 and Chk1 inhibition correlates with increased CDC45 loading rather than with higher CDK activity.
DISCUSSION
This study provides an explanation behind the previously reported synergy between Wee1- and Chk1- inhibitors observed in preclinical cancer treatment studies [17–22]. Our results suggest that this synergy is due not only to enhanced CDK activity, but also to an additional, CDK-independent role of Chk1 in regulating CDC45

Oncotarget10972www.impactjournals.com/oncotarget
Figure 3: S-phase CDK activity poorly correlates with the extent of DNA damage after Chk1/Wee1 inhibition. (A) Left: Immunoblot analysis on parallel samples within the same experiment as in Figure 2A collected at one hour after treatment. U2OS cells were exposed to MK1775 (300 nM) and/or AZD7762 (150 nM), LY2603618 (500 nM), MK8776 (1000 nM) and UCN01 (300 nM) for 1 hour. 10%, 20% and 50% of the non-treated sample (Mock) were loaded in the three first lanes to measure the dynamics for each antibody, respectively. Right: Quantifications of phospho-CDK1 (Tyr15) (relative to CDK1), phospho-CDK2 (Tyr15) (relative to CDK2), and Cyclin E levels (relative to CDK1 or CDK2). Error bars: SEM (n = 2 or 3). (B) Flow cytometric analysis of CDK-dependent phosphorylations compared to γH2AX in S-phase cells. U2OS cells were treated with MK1775 (600 nM), AZD7762 (100 nM) or both MK1775 (600 nM) and AZD7762 (100 nM) for 1 hour, or left untreated (Mock). The four samples were bar-coded with Pacific Blue before antibody staining with the indicated antibodies. S-phase cells are indicated in dark color. Graphs show average median values in S-phase (relative to Mock) from three independent experiments. Error bars: SEM (n = 3).
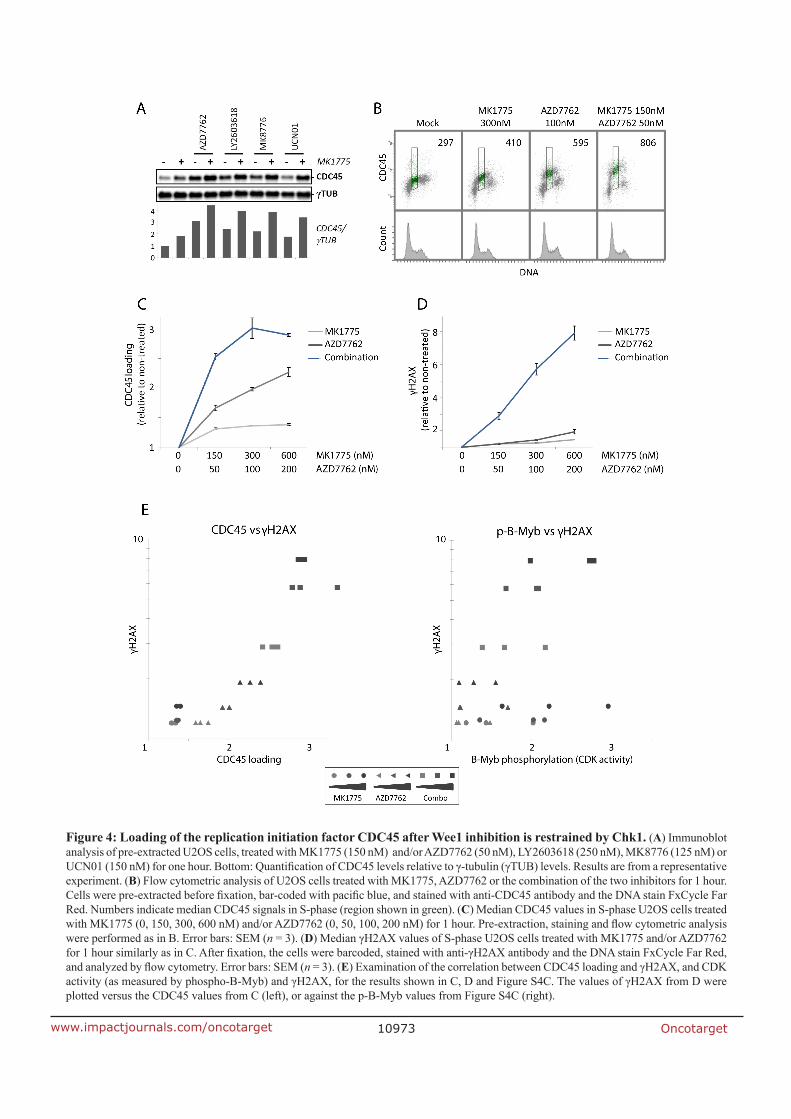
Oncotarget10973www.impactjournals.com/oncotarget
Figure 4: Loading of the replication initiation factor CDC45 after Wee1 inhibition is restrained by Chk1. (A) Immunoblot analysis of pre-extracted U2OS cells, treated with MK1775 (150 nM) and/or AZD7762 (50 nM), LY2603618 (250 nM), MK8776 (125 nM) or UCN01 (150 nM) for one hour. Bottom: Quantification of CDC45 levels relative to γ-tubulin (γTUB) levels. Results are from a representative experiment. (B) Flow cytometric analysis of U2OS cells treated with MK1775, AZD7762 or the combination of the two inhibitors for 1 hour. Cells were pre-extracted before fixation, bar-coded with pacific blue, and stained with anti-CDC45 antibody and the DNA stain FxCycle Far Red. Numbers indicate median CDC45 signals in S-phase (region shown in green). (C) Median CDC45 values in S-phase U2OS cells treated with MK1775 (0, 150, 300, 600 nM) and/or AZD7762 (0, 50, 100, 200 nM) for 1 hour. Pre-extraction, staining and flow cytometric analysis were performed as in B. Error bars: SEM (n = 3). (D) Median γH2AX values of S-phase U2OS cells treated with MK1775 and/or AZD7762 for 1 hour similarly as in C. After fixation, the cells were barcoded, stained with anti-γH2AX antibody and the DNA stain FxCycle Far Red, and analyzed by flow cytometry. Error bars: SEM (n = 3). (E) Examination of the correlation between CDC45 loading and γH2AX, and CDK activity (as measured by phospho-B-Myb) and γH2AX, for the results shown in C, D and Figure S4C. The values of γH2AX from D were plotted versus the CDC45 values from C (left), or against the p-B-Myb values from Figure S4C (right).
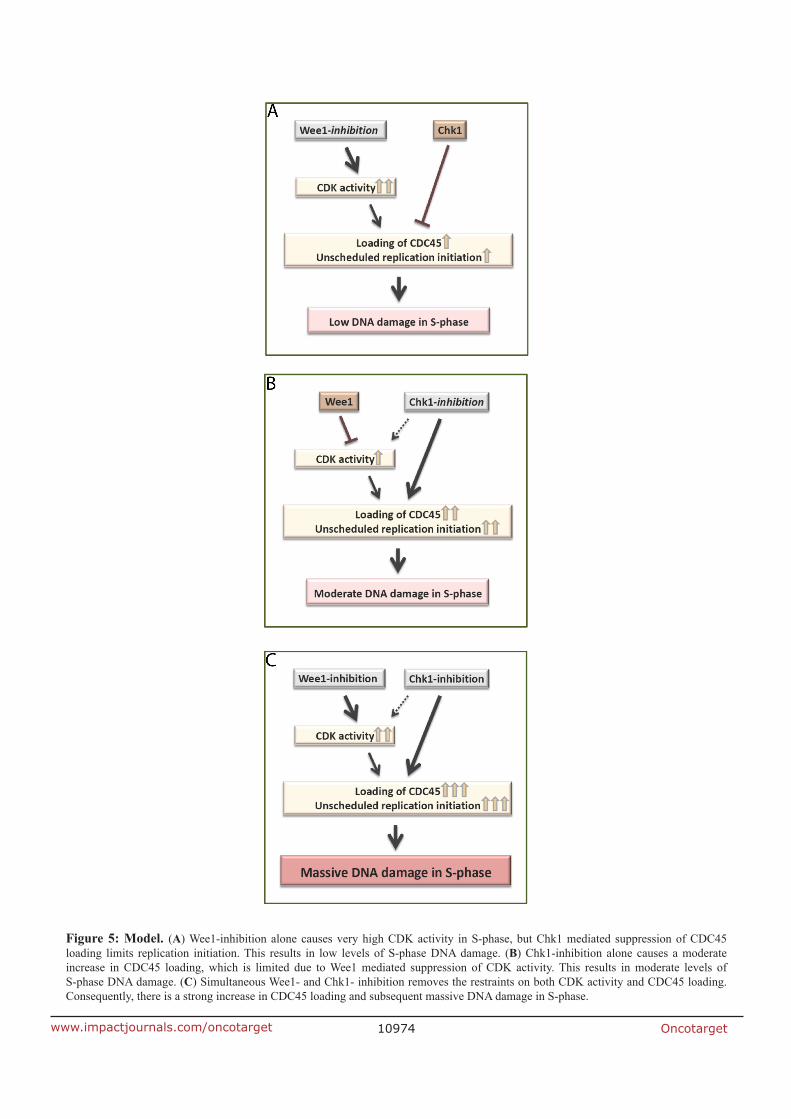
Oncotarget10974www.impactjournals.com/oncotarget
Figure 5: Model. (A) Wee1-inhibition alone causes very high CDK activity in S-phase, but Chk1 mediated suppression of CDC45 loading limits replication initiation. This results in low levels of S-phase DNA damage. (B) Chk1-inhibition alone causes a moderate increase in CDC45 loading, which is limited due to Wee1 mediated suppression of CDK activity. This results in moderate levels of S-phase DNA damage. (C) Simultaneous Wee1- and Chk1- inhibition removes the restraints on both CDK activity and CDC45 loading. Consequently, there is a strong increase in CDC45 loading and subsequent massive DNA damage in S-phase.

Oncotarget10975www.impactjournals.com/oncotarget
loading. According to this model, the activity of Chk1 suppresses CDC45 loading and thereby limits replication catastrophe upon Wee1 inhibition alone (Figure 5A). And upon Chk1 inhibition alone, Wee1 suppresses CDK activity and thereby limits CDC45 loading (Figure 5B). However, after inhibition of both kinases, both restraints on CDC45 loading are removed, leading to massive unscheduled replication initiation and subsequent replication catastrophe (Figure 5C).
We have applied a novel assay to measure CDK activity in S-phase (Figure 3B and Supplementary Figure S3). The inclusion of multiple antibodies to previously published CDK2 and CDK1 targets and a DNA-stain to assess cell cycle position, together with the bar-coding approach, enable highly accurate measurements of CDK activity specifically in S-phase cells. This method is an extension of our own previous work with a single CDK target [35], and of others investigating CDK target phosphorylation in mitosis versus interphase [36]. The small increase in S-phase CDK activity upon Chk1 inhibition alone (Figure 3B and Supplementary Figure S4C) is in agreement with previous reports that Chk1 suppresses CDK activity in unperturbed S-phase, through negative regulation of CDC25A phosphatase [12, 15, 28].
Of note, the antibodies used to detect inhibitory phosphorylation (Figure 3A) may not be entirely specific for CDK1 versus CDK2 [29], and some of the CDK-targets in Figure 3B may potentially be phosphorylated by both CDKs. Nevertheless, with all the different readouts we have used to assay CDK activity, our results show that Wee1 is a more potent regulator of S-phase CDK activity compared to Chk1 (Figure 3 and Supplementary Figure S4C). The exact distinction between CDK1 versus CDK2 activity also becomes less important since our previous and present data strongly suggest that both CDK1 and CDK2 contribute to cause the S-phase DNA damage: Depletion of either CDK1 or CDK2 by siRNA reduced the induction of γH2AX in response to Wee1, as well as Chk1, inhibition [7], and inhibitors of either CDK1 (RO-3306) or CDK2 (CVT-313) markedly reduced γH2AX after the combined treatment (Supplementary Figure S3A and S3B, bottom panels).
The mechanisms by which Chk1 can suppress CDC45 loading in the presence of high CDK activity are intriguing. A CDK-independent function of Chk1 in regulation of CDC45 loading was first described in cancer cells exposed to the carcinogen benzo[a]pyrene dihydrodiol epoxide [37]. Recent work has suggested that Chk1 negatively regulates the action of Treslin, a replication factor positively stimulating CDC45 loading [38]. The expression of a mutant version of Treslin that could not bind Chk1 caused increased replication initiation [38]. Based on these findings it seems plausible that Chk1-mediated regulation of Treslin can contribute to suppress
CDC45 loading. Notably, Wee1 inhibition causes increased Chk1 activation (Supplementary Figure S4D and [7]), which may further enhance the Chk1-mediated suppression of CDC45 loading.
Interestingly, the combined treatment with Wee1 and Chk1 inhibitors caused massive DNA damage in S-phase without causing premature mitosis (Figure 2 and Supplementary Figure S2A). In contrast, a previous study reported premature mitosis from S-phase upon combined treatment of one breast cancer cell line with MK1775 and AZD7762 [39]. However, the concentration of MK1775 (1 µM) was higher than in our experiments (300 nM) and the incubation time with the inhibitors was longer (8 hours compared to 3 hours in our experiments). Although we cannot exclude that premature mitosis would happen at a later timepoint in U2OS cells, our results clearly show that the massive S-phase DNA damage induced by checkpoint kinase inhibition is not a consequence of premature mitosis.
In this study we present a novel flow cytometry-based screen for compounds that give synergistic DNA damage in S-phase when combined with a Wee1 inhibitor. The strength of our screening approach is the rapid analysis of many thousands cells and accurate measurements of γH2AX levels specifically in S-phase cells. The screen identified several candidate hits, in addition to the Chk1 inhibitors, that have previously been reported to synergize with Wee1 inhibition (Figure 1E). For example, preclinical studies have shown that MK1775 potentiates the cytotoxic effects of Camptothecin [40]. Furthermore, MK1775 combined with Irinotecan Hcl Trihydrate or Topotecan Hcl are currently being tested in clinical trials (Clinical.Trials.Gov). Moreover, three anti-folates were among the candidate hits (Figure 1E and Supplementary Figure S1D). Since anti-folates cause nucleotide deficiency [41], the results of our screen thus support and extend recent work demonstrating a synthetic lethal interaction between Wee1 inhibition and low levels of the ribonucleotide reductase subunit RRM2 [42]. In addition, our results show that MK1775 can enhance the growth inhibitory effects of Dasatinib (Supplementary Figure S1E). Altogether, this strongly suggests that our screen efficiently identifies compounds that synergize with MK1775.
In conclusion, a novel flow cytometry based compound screen revealed synergistic DNA damage in S-phase in cancer cells after simultaneous treatment with Wee1 and Chk1 inhibitors. Our subsequent analysis uncovered that this synergy can be explained by differential functions of Wee1 and Chk1 in regulation of CDK activity and CDC45 loading. Importantly, several of the Wee1 and Chk1 inhibitors used in this study are currently being tested in clinical trials. Our work gives new knowledge about how these inhibitors work as single agents and in combination. These results can help optimizing the future use of Wee1 and Chk1 inhibitors for cancer treatment.

Oncotarget10976www.impactjournals.com/oncotarget
MATERIALS AND METHODS
Cell culture and drug treatments
Human NCI-H460 and A549 lung cancer (ATCC) and U2OS osteosarcoma cells were cultured in DMEM (Dulbecco’s modified Eagle’s) medium, and SW900 lung cancer and Reh pre-B cell leukemia cells in RPMI (Roswell Park Memorial Institute) medium (both media from Life Technologies), at 37°C in a humidified atmosphere with 5% CO2. The media were supplemented with 10% fetal bovine serum (origin South America, Life Technologies) and 1% Penicillin/Streptomycin (Life Technologies). All cell lines (except Reh) were verified by STR (short tandem repeat) technology as described previously [43]. The Wee1 inhibitor MK1775 (AZD1775) was from Merck Calbiochem. The Chk1 inhibitors AZD7762, LY2603618 and MK8776 were from Selleck Chemicals, UCN01 was a gift from R.J. Schultz, National Cancer Institute, and the Chk2 inhibitor PV1019 was from Millipore. The dual CDK1/ CDK2 inhibitor Roscovitine and the CDK2 inhibitor CVT-313 were from Cell Signaling, and the CDK1 inhibitor RO-3306 from Merck Calbiochem.
Flow cytometry-based high-throughput screen
Aliquots of the LOPAC1280 Library of Pharmacologically Active Compunds and the Selleck Chem Cambridge Cancer Compound Library distributed in 384-well plates (V-bottom #6008590, Perkin Elmer) were obtained from the Chemical Biology platform, Biotechnology Centre, University of Oslo part of the NOR-OPENSCREEN infrastructure. The screen was conducted at the Flow Cytometry Core Facility, Norwegian Radium Hospital, Oslo University Hospital. A microplate sample processor (Precision XS, BioTek) and microplate washer (EL × 405 Select, BioTek) were used to facilitate the cell seeding, fixation and staining. The final compound concentration was 10 µM. Exponentially growing Reh leukemia cells were seeded at 105 cells/100 µl medium per well. Two parallel plates were processed and analyzed together: one containing compounds only, and the other containing an identical set of compounds plus the Wee1 inhibitor MK1775 (400 nM). Cells were incubated for 4 hours at 37oC/5%CO2 and thereafter pelleted by centrifugation. The cell pellets were washed once with PBS, and 70 μl methanol per well was added for fixation. The plates were then stored at −20°C until further analysis. To measure DNA damage in S-phase, cells were stained with an antibody to the DNA damage marker γH2AX together with the DNA stain Hoechst 33258 (Sigma). Cells were incubated for 1 hour at room temperature with 20 μl of mouse anti-phospho-H2AX(Ser139) antibody (05-636, Millipore) diluted 1:1000 in PBS containing 0.2% Tween-20 (Sigma) and 4% milk powder, followed by 30 min incubation with 20 μl of Alexa Fluor 488 anti-
mouse IgG diluted 1:1000 (Molecular Probes), and finally resuspended in 80 μl of Hoechst 33258 (1 µg/ml in PBS). The stained plates were stored at 4°C in the dark overnight.
Flow cytometry analysis in the screen was performed with an LSR II flow cytometer (BD Biosciences) equipped with a BD High Throughput Sampler using the FACS Diva Software version 6.1.3 (BD Biosciences) during acquisition. The FlowJo software (FlowJo, LLC) was used during analysis. A region in S-phase was defined based on the Hoechst signal, and the median γH2AX signal within this region was obtained for all samples. To evaluate effects of the drug libraries alone (Supplementary Figure S1B), we calculated the Z-score for each sample (the number of standard deviations away from the median γH2AX sample value of the plate). The calculation of Z-score values separately for each plate enabled comparison of results across plates, despite variations between the plates in overall signal intensity. To identify synergistic effects between MK1775 and the drugs, we calculated the parameter γH2AXdiff, representing the difference in γH2AX levels between paired samples treated with drug library only, and with MK1775 plus drug library [γH2AX diff = γH2AX MK1775+drug - γH2AX drug]. Thereafter, we calculated the Z score for each set of paired plates separately (denoted Z´: the number of standard deviations away from the median sample value of γH2AXdiff). Samples with higher Z´ score values than 2.5 were considered as candidate hits in the screen (Figure 1E).
Flow cytometry analysis of CDK targets, CDC45 loading and DNA damage
For analysis of protein phosphorylation, cells were fixed with 70% ethanol and stained with antibodies as described previously [44]. The primary antibodies were mouse anti-phospho-H2AX(Ser139) (05-636, Millipore), rabbit anti-phospho-RPA (Ser4/Ser8)(A300-245, Bethyl Laboratories), rabbit anti-phospho-H3(Ser10) (06-570, Millipore), and three antibodies to CDK targets: rabbit anti-phospho-BRCA2(Ser3291) (AB9986, Millipore), rabbit anti-phospho-B-Myb(Thr487) (ab76009, Abcam) and mouse anti-phospho-Ser/Thr-Pro MPM-2 (05-368, Millipore). Secondary antibodies were Alexa Fluor 488 and 647 (Molecular Probes), Dylight 549 (VectorLabs) and Cy3 (Jackson ImmunoResearch) anti-mouse and anti-rabbit IgG. For analysis of CDC45 loading, cells were pre-extracted and fixed as described in [45], and stained with anti-CDC45 (sc-55569, Santa Cruz) followed by Alexa Fluor 488 anti-mouse IgG. In experiments where median values were measured, barcoding of sets of four samples with pacific blue was used as before [35, 44] to eliminate variation in antibody staining between the individual samples. The DNA stain FxCycle™ Far Red (200 nM FxCycle and 0.1mg/ml RNase A) (Thermo Fisher Scientific) was used in barcoding experiments, and Hoechst 33258 (1.5 µg/ml) in other experiments. The

Oncotarget10977www.impactjournals.com/oncotarget
TUNEL TdT kit from Roche, Biotin-16-dUTP (Roche) and Streptavidin-Cy5 (GE Healthcare) were used according to the manufacturer’s instruction, combined with antibody staining of anti-phospho-H2AX(Ser139). Flow cytometry analysis was performed on a LSRII flow cytometer (BD Biosciences) using FACS Diva software. The Pearsons correlation coefficient was calculated to quantify the degree of correlation between parameters.
Clonogenic survival assays
Between 150 and 300 U2OS cells were seeded in 6cm culture dishes (BD Biosciences) in triplicate with medium containing various concentrations of Wee1 and/or Chk1 inhibitors. After 24 hours, the medium was replaced by 4 ml fresh medium without inhibitors. Cells were then cultured for an additional 13 days, fixed in 70% ethanol and stained with methylene blue. Colonies of 50 or more cells were counted as survivors. Survival fractions were calculated in each experiment as the average cloning efficiency (from 3 parallel dishes) after treatment with the inhibitors, divided by the average cloning efficiency for non-treated cells.
Immunoblotting
Cells were lysed in SDS boiling buffer (2% SDS, 10 mM Tris-HCl pH 7.5, 100 µM Na3VO4), and immunoblotting was performed as described previously [43]. The following antibodies were used for blotting: mouse anti-CDK1 (9112, Cell Signaling), rabbit anti-CDK2 (sc-163, Santa Cruz), rabbit anti-phospho-CDK1(Tyr15) (9111, Cell Signaling), rabbit anti-phospho-CDK2(Tyr15) (76147, Abcam), rabbit anti-CyclinE (sc-198, Santa Cruz), mouse anti-CDC45 (sc-55569, Santa Cruz), rabbit anti-phospho-Chk1(Ser296) (2349, Cell Signaling) and mouse anti-γ-Tubulin (T6557, Sigma-Aldrich). In experiments with pre-extraction of unbound proteins, an extraction buffer (0.5% Triton, 20 mM Hepes pH 7.4, 50 mM NaCl, 3 mM MgCl2, 300 mM Sucrose) was added for 5 minutes whilst the cells were kept on ice, before one wash in ice-cold PBS, lysis and immunoblotting.
ACKNOWLEDGMENT
We thank Beata Grallert for critical reading of the manuscript.
CONFLICTS OF INTEREST
The authors declare no conflicts of interest.
GRANT SUPPORT
This work was supported by grants from the Norwegian Cancer Society, the South-Eastern Norway Health Authorities and the EEA Czech-Norwegian
Research Programme (Norwegian Financial Mechanism 2009-2014 and the Ministry of Education, Youth and Sports under Project Contract no MSMT-22477/2014 (7F14061)).
REFERENCES
1. Mueller S, Haas-Kogan DA. WEE1 Kinase As a Target for Cancer Therapy. J Clin Oncol. 2015; 33:3485–3487.
2. Bridges KA, Hirai H, Buser CA, Brooks C, Liu H, Buchholz TA, Molkentine JM, Mason KA, Meyn RE. MK-1775, a novel Wee1 kinase inhibitor, radiosensitizes p53-defective human tumor cells. Clin Cancer Res. 2011; 17:5638–5648.
3. Parker LL, Piwnica-Worms H. Inactivation of the p34cdc2-cyclin B complex by the human WEE1 tyrosine kinase. Science. 1992; 257:1955–1957.
4. De Witt Hamer PC, Mir SE, Noske D, Van Noorden CJ, Wurdinger T. WEE1 kinase targeting combined with DNA-damaging cancer therapy catalyzes mitotic catastrophe. Clin Cancer Res. 2011; 17:4200–4207.
5. Mir SE, De Witt Hamer PC, Krawczyk PM, Balaj L, Claes A, Niers JM, Van Tilborg AA, Zwinderman AH, Geerts D, Kaspers GJ, Peter Vandertop W, Cloos J, Tannous BA, et al. In silico analysis of kinase expression identifies WEE1 as a gatekeeper against mitotic catastrophe in glioblastoma. Cancer Cell. 2010; 18:244–257.
6. Anda S, Rothe C, Boye E, Grallert B. Consequences of abnormal CDK activity in S phase. Cell Cycle. 2016; 15:963–973.
7. Beck H, Nähse V, Larsen MS, Groth P, Clancy T, Lees M, Jorgensen M, Helleday T, Syljuåsen RG, Sørensen CS. Regulators of cyclin-dependent kinases are crucial for maintaining genome integrity in S phase. J Cell Biol. 2010; 188:629–638.
8. Dominguez-Kelly R, Martin Y, Koundrioukoff S, Tanenbaum ME, Smits VA, Medema RH, Debatisse M, Freire R. Wee1 controls genomic stability during replication by regulating the Mus81-Eme1 endonuclease. J Cell Biol. 2011; 194:567–579.
9. Beck H, Nähse-Kumpf V, Larsen MS, O›Hanlon KA, Patzke S, Holmberg C, Mejlvang J, Groth A, Nielsen O, Syljuåsen RG, Sørensen CS. Cyclin-dependent kinase suppression by WEE1 kinase protects the genome through control of replication initiation and nucleotide consumption. Mol Cell Biol. 2012; 32:4226–4236.
10. Toledo LI, Altmeyer M, Rask MB, Lukas C, Larsen DH, Povlsen LK, Bekker-Jensen S, Mailand N, Bartek J, Lukas J. ATR prohibits replication catastrophe by preventing global exhaustion of RPA. Cell. 2013; 155:1088–1103.
11. Guertin AD, Li J, Liu Y, Hurd MS, Schuller AG, Long B, Hirsch HA, Feldman I, Benita Y, Toniatti C, Zawel L, Fawell SE, Gilliland DG, et al. Preclinical evaluation of the WEE1 inhibitor MK-1775 as single-agent anticancer therapy. Mol Cancer Ther. 2013; 12:1442–1452.

Oncotarget10978www.impactjournals.com/oncotarget
12. Syljuåsen RG, Sørensen CS, Hansen LT, Fugger K, Lundin C, Johansson F, Helleday T, Sehested M, Lukas J, Bartek J. Inhibition of human Chk1 causes increased initiation of DNA replication, phosphorylation of ATR targets, and DNA breakage. Mol Cell Biol. 2005; 25:3553–3562.
13. Zhao H, Watkins JL, Piwnica-Worms H. Disruption of the checkpoint kinase 1/cell division cycle 25A pathway abrogates ionizing radiation-induced S and G2 checkpoints. Proc Natl Acad Sci USA. 2002; 99:14795–14800.
14. Blomberg I,Hoffmann I. Ectopic expression of Cdc25A accelerates the G(1)/S transition and leads to premature activation of cyclin E- and cyclin A-dependent kinases. Mol Cell Biol. 1999; 19:6183–6194.
15. Sørensen CS, Syljuåsen RG, Falck J, Schroeder T, Ronnstrand L, Khanna KK, Zhou BB, Bartek J, Lukas J. Chk1 regulates the S phase checkpoint by coupling the physiological turnover and ionizing radiation-induced accelerated proteolysis of Cdc25A. Cancer Cell. 2003; 3:247–258.
16. Sørensen CS, Syljuåsen RG. Safeguarding genome integrity: the checkpoint kinases ATR, CHK1 and WEE1 restrain CDK activity during normal DNA replication. Nucleic Acids Res. 2012; 40:477–486.
17. Carrassa L, Chila R, Lupi M, Ricci F, Celenza C, Mazzoletti M, Broggini M, Damia G. Combined inhibition of Chk1 and Wee1: in vitro synergistic effect translates to tumor growth inhibition in vivo. Cell Cycle. 2012; 11:2507–2517.
18. Russell MR, Levin K, Rader J, Belcastro L, Li Y, Martinez D, Pawel B, Shumway SD, Maris JM, Cole KA. Combination therapy targeting the Chk1 and Wee1 kinases shows therapeutic efficacy in neuroblastoma. Cancer Res. 2013; 73:776–784.
19. Chaudhuri L, Vincelette ND, Koh BD, Naylor RM, Flatten KS, Peterson KL, McNally A, Gojo I, Karp JE, Mesa RA, Sproat LO, Bogenberger JM, Kaufmann SH, et al. CHK1 and WEE1 inhibition combine synergistically to enhance therapeutic efficacy in acute myeloid leukemia ex vivo. Haematologica. 2014; 99:688–696.
20. Chila R, Basana A, Lupi M, Guffanti F, Gaudio E, Rinaldi A, Cascione L, Restelli V, Tarantelli C, Bertoni F, Damia G, Carrassa L. Combined inhibition of Chk1 and Wee1 as a new therapeutic strategy for mantle cell lymphoma. Oncotarget. 2015; 6:3394–3408. doi: 10.18632/oncotarget.2583.
21. Magnussen GI, Emilsen E, Giller Fleten K, Engesaeter B, Nahse-Kumpf V, Fjaer R, Slipicevic A, Florenes VA. Combined inhibition of the cell cycle related proteins Wee1 and Chk1/2 induces synergistic anti-cancer effect in melanoma. BMC Cancer. 2015; 15:462.
22. Qi W, Xie C, Li C, Caldwell JT, Edwards H, Taub JW, Wang Y, Lin H, Ge Y. CHK1 plays a critical role in the anti-leukemic activity of the wee1 inhibitor MK-1775 in acute myeloid leukemia cells. J Hematol Oncol. 2014; 7:53.
23. Korn K,Krausz E. Cell-based high-content screening of small-molecule libraries. Curr Opin Chem Biol. 2007; 11:503–510.
24. Black CB, Duensing TD, Trinkle LS, Dunlay RT. Cell-based screening using high-throughput flow cytometry. Assay Drug Dev Technol. 2011; 9:13–20.
25. Landsverk KS, Lyng H, Stokke T. The response of malignant B lymphocytes to ionizing radiation: cell cycle arrest, apoptosis and protection against the cytotoxic effects of the mitotic inhibitor nocodazole. Radiat Res. 2004; 162:405–415.
26. Aris SM, Pommier Y. Potentiation of the novel topoisomerase I inhibitor indenoisoquinoline LMP-400 by the cell checkpoint and Chk1-Chk2 inhibitor AZD7762. Cancer Res. 2012; 72:979–989.
27. Guzi TJ, Paruch K, Dwyer MP, Labroli M, Shanahan F, Davis N, Taricani L, Wiswell D, Seghezzi W, Penaflor E, Bhagwat B, Wang W, Gu D, et al. Targeting the replication checkpoint using SCH 900776, a potent and functionally selective CHK1 inhibitor identified via high content screening. Mol Cancer Ther. 2011; 10:591–602.
28. Petermann E, Woodcock M, Helleday T. Chk1 promotes replication fork progression by controlling replication initiation. Proc Natl Acad Sci USA. 2010; 107:16090–16095.
29. Sakurikar N, Thompson R, Montano R, Eastman A. A subset of cancer cell lines is acutely sensitive to the Chk1 inhibitor MK-8776 as monotherapy due to CDK2 activation in S phase. Oncotarget. 2016; 7:1380–94. doi: 10.18632/oncotarget.6364.
30. Sadasivam S, Duan S, DeCaprio JA. The MuvB complex sequentially recruits B-Myb and FoxM1 to promote mitotic gene expression. Genes Dev. 2012; 26:474–489.
31. Ziebold U, Bartsch O, Marais R, Ferrari S, Klempnauer KH. Phosphorylation and activation of B-Myb by cyclin A-Cdk2. Curr Biol. 1997; 7:253–260.
32. Esashi F, Christ N, Gannon J, Liu Y, Hunt T, Jasin M, West SC. CDK-dependent phosphorylation of BRCA2 as a regulatory mechanism for recombinational repair. Nature. 2005; 434:598–604.
33. Yaffe MB, Schutkowski M, Shen M, Zhou XZ, Stukenberg PT, Rahfeld JU, Xu J, Kuang J, Kirschner MW, Fischer G, Cantley LC, Lu KP. Sequence-specific and phosphorylation-dependent proline isomerization: a potential mitotic regulatory mechanism. Science. 1997; 278:1957–1960.
34. Kohler C, Koalick D, Fabricius A, Parplys AC, Borgmann K, Pospiech H, Grosse F. Cdc45 is limiting for replication initiation in humans. Cell Cycle. 2016; 15:974–985.
35. Hasvold G, Lund-Andersen C, Lando M, Patzke S, Hauge S, Suo Z, Lyng H, Syljuåsen RG. Hypoxia-induced alterations of G2 checkpoint regulators. Mol Oncol. 2016;
36. Krajewska M, Heijink AM, Bisselink YJ, Seinstra RI, Sillje HH, de Vries EG, van Vugt MA. Forced activation of Cdk1 via wee1 inhibition impairs homologous recombination. Oncogene. 2013; 32:3001–3008.
37. Liu P, Barkley LR, Day T, Bi X, Slater DM, Alexandrow MG, Nasheuer HP, Vaziri C. The Chk1-mediated S-phase checkpoint targets initiation factor Cdc45 via a Cdc25A/Cdk2-independent mechanism. J Biol Chem. 2006; 281:30631–30644.
Oncotarget10979www.impactjournals.com/oncotarget
38. Guo C, Kumagai A, Schlacher K, Shevchenko A, Shevchenko A, Dunphy WG. Interaction of Chk1 with Treslin negatively regulates the initiation of chromosomal DNA replication. Mol Cell. 2015; 57:492–505.
39. Aarts M, Sharpe R, Garcia-Murillas I, Gevensleben H, Hurd MS, Shumway SD, Toniatti C, Ashworth A, Turner NC. Forced mitotic entry of S-phase cells as a therapeutic strategy induced by inhibition of WEE1. Cancer Discov. 2012; 2:524–539.
40. Hirai H, Arai T, Okada M, Nishibata T, Kobayashi M, Sakai N, Imagaki K, Ohtani J, Sakai T, Yoshizumi T, Mizuarai S, Iwasawa Y, Kotani H. MK-1775, a small molecule Wee1 inhibitor, enhances anti-tumor efficacy of various DNA-damaging agents, including 5-fluorouracil. Cancer Biol Ther. 2010; 9:514–522.
41. Wilson PM, Danenberg PV, Johnston PG, Lenz HJ, Ladner RD. Standing the test of time: targeting thymidylate biosynthesis in cancer therapy. Nat Rev Clin Oncol. 2014; 11:282–298.
42. Pfister SX, Markkanen E, Jiang Y, Sarkar S, Woodcock M, Orlando G, Mavrommati I, Pai CC, Zalmas LP, Drobnitzky N, Dianov GL, Verrill C, Macaulay VM, et al. Inhibiting WEE1 Selectively Kills Histone H3K36me3-Deficient Cancers by dNTP Starvation. Cancer Cell. 2015; 28:557–568.
43. Hasvold G, Nähse-Kumpf V, Tkacz-Stachowska K, Rofstad EK, Syljuåsen RG. The efficacy of CHK1 inhibitors is not altered by hypoxia, but is enhanced after reoxygenation. Mol Cancer Ther. 2013; 12:705–716.
44. Tkacz-Stachowska K, Lund-Andersen C, Velissarou A, Myklebust JH, Stokke T, Syljuåsen RG. The amount of DNA damage needed to activate the radiation-induced G2 checkpoint varies between single cells. Radiother Oncol. 2011; 101:24–27.
45. Håland TW, Boye E, Stokke T, Grallert B, Syljuåsen RG. Simultaneous measurement of passage through the restriction point and MCM loading in single cells. Nucleic Acids Res. 2015; 43:e150.
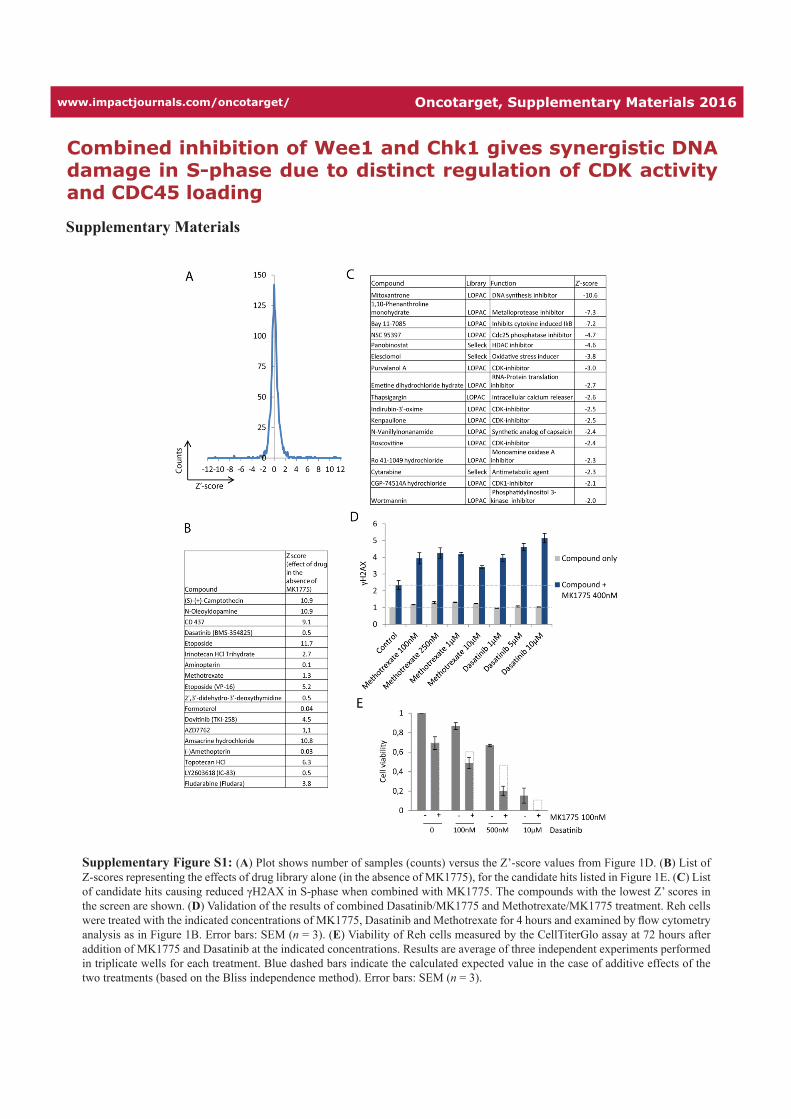
www.impactjournals.com/oncotarget/ Oncotarget, Supplementary Materials 2016
Combined inhibition of Wee1 and Chk1 gives synergistic DNA damage in S-phase due to distinct regulation of CDK activity and CDC45 loading
Supplementary Materials
Supplementary Figure S1: (A) Plot shows number of samples (counts) versus the Z’-score values from Figure 1D. (B) List of Z-scores representing the effects of drug library alone (in the absence of MK1775), for the candidate hits listed in Figure 1E. (C) List of candidate hits causing reduced γH2AX in S-phase when combined with MK1775. The compounds with the lowest Z’ scores in the screen are shown. (D) Validation of the results of combined Dasatinib/MK1775 and Methotrexate/MK1775 treatment. Reh cells were treated with the indicated concentrations of MK1775, Dasatinib and Methotrexate for 4 hours and examined by flow cytometry analysis as in Figure 1B. Error bars: SEM (n = 3). (E) Viability of Reh cells measured by the CellTiterGlo assay at 72 hours after addition of MK1775 and Dasatinib at the indicated concentrations. Results are average of three independent experiments performed in triplicate wells for each treatment. Blue dashed bars indicate the calculated expected value in the case of additive effects of the two treatments (based on the Bliss independence method). Error bars: SEM (n = 3).

Supplementary Figure S2: (A) The samples from Figure 2A were co-stained with phospho-Histone H3 antibody, and analyzed by flow cytometry. Scatter plots of phospho-Histone H3 (H3P) versus Hoechst (DNA) are shown. Numbers indicate the percentage of cells in the region for H3P-positive (mitotic) cells. (B) Flow cytometric analysis of SW900, A549 and H460 lung cancer cells treated with MK1775 (300 nM) and/or AZD7762 (300 nM) for 24 hours. Scatter plots of γH2AX versus Hoechst (DNA) and DNA histograms (counts versus DNA) are shown from a representative experiment (three independent experiments were performed with similar results). Lines are included for reference purposes.

Supplementary Figure S3: (A) Flow cytometric analysis of U2OS cells treated for one hour with the combination of MK1775 (600 nM) and AZD7762 (200 nM), alone and in the presence of Roscovitine (25 μM) or RO3306 (10 μM). After barcoding with pacific blue, the samples were split in two and co-stained for phospho-B-Myb and phospho-Ser/Thr-Pro MPM-2 (two top panels), or phospho-BRCA2 and γH2AX (two bottom panels). S-phase regions were defined based on the DNA content (dark color), and numbers indicate median signals in S-phase. (B) U2OS cells were treated for one hour with the combination of MK1775 (600 nM) and AZD7762 (200 nM), alone or in the presence of CVT-313 (1.25 or 5 μM). Staining and analysis were performed as in A.
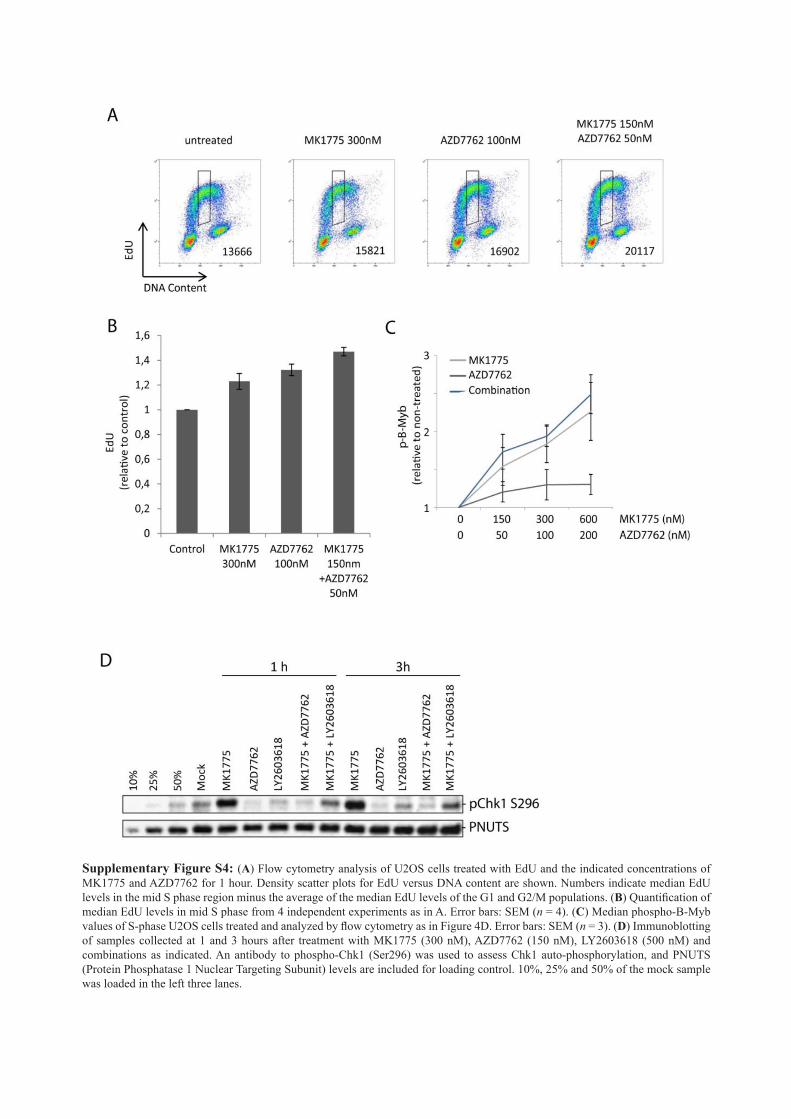
Supplementary Figure S4: (A) Flow cytometry analysis of U2OS cells treated with EdU and the indicated concentrations of MK1775 and AZD7762 for 1 hour. Density scatter plots for EdU versus DNA content are shown. Numbers indicate median EdU levels in the mid S phase region minus the average of the median EdU levels of the G1 and G2/M populations. (B) Quantification of median EdU levels in mid S phase from 4 independent experiments as in A. Error bars: SEM (n = 4). (C) Median phospho-B-Myb values of S-phase U2OS cells treated and analyzed by flow cytometry as in Figure 4D. Error bars: SEM (n = 3). (D) Immunoblotting of samples collected at 1 and 3 hours after treatment with MK1775 (300 nM), AZD7762 (150 nM), LY2603618 (500 nM) and combinations as indicated. An antibody to phospho-Chk1 (Ser296) was used to assess Chk1 auto-phosphorylation, and PNUTS (Protein Phosphatase 1 Nuclear Targeting Subunit) levels are included for loading control. 10%, 25% and 50% of the mock sample was loaded in the left three lanes.

CellTiterGlo viability assayReh cells were seeded at 5000 cells per well in 96-
well plates (white wall/clear bottom plates, Corning) and treated for 72 hours with 10 μm, 500 nM and 100 nM Dasatinib (Sellekchem) in the presence and absence of 100 nM MK1775. Cell viability was assessed by the CellTiter-Glo® Luminescent Cell Viability Assay (Promega) according to the manufacturer’s instruction. Luminescence was assessed by a Spark 10M plate reader (Tecan) using the SparkControl Magellan 1.2 software. The Bliss independence method [1] was used to calculate the expected values for additive effects of Dasatinib and MK1775 (PDasatinib + MK1775 = PDasatinib + PMK177 − PDasatinib × PMK177, where P is the percentage of non-viable cells).
EdU uptake
U2OS cells were treated with MK1775 and/or AZD7762 in the presence of 2 μM EdU for one hour, barcoded with pacific blue (as in Figure 3 and 4) and stained with the Click-iT® EdU Alexa Fluor® 488 Flow Cytometry Assay Kit (ThermoFisher Scientific) and the FxCycleTM Far Red DNA-stain/RNase A. Flow cytometry analysis was performed as in Figures 3 and 4.
REFERENCE
1. Bliss CI. The toxicity of poisons applied jointly. Ann Appl Biol. 1939; 26, 585–615.
Supplementary Table S1: Screen raw data


II


III