Embed Size (px)
Citation preview

This thesis has been submitted in fulfilment of the requirements for a postgraduate degree
(e.g. PhD, MPhil, DClinPsychol) at the University of Edinburgh. Please note the following
terms and conditions of use:
This work is protected by copyright and other intellectual property rights, which are
retained by the thesis author, unless otherwise stated.
A copy can be downloaded for personal non-commercial research or study, without
prior permission or charge.
This thesis cannot be reproduced or quoted extensively from without first obtaining
permission in writing from the author.
The content must not be changed in any way or sold commercially in any format or
medium without the formal permission of the author.
When referring to this work, full bibliographic details including the author, title,
awarding institution and date of the thesis must be given.

Development of a high-throughput platform for evaluation of chicken immune responses
Dominika Borowska
A dissertation submitted for the degree of Doctor of Philosophy
University of Edinburgh
2016

Author’s declaration
I declare that the work in this dissertation is original except where indicated by
special reference in the text and no part of the dissertation has been submitted for
any other degree.
Signed…………………..
Date……………………..

Contents
Abstract ......................................................................................................................... i
Lay summary ............................................................................................................... iii
Acknowledgements ..................................................................................................... v
List of figures............................................................................................................... vi
List of tables ................................................................................................................. x
Abbreviations and acronyms .................................................................................... xii
Introduction ............................................................................................. 1 Chapter 1
Background................................................................................................... 1 1.1
The immune system ..................................................................................... 7 1.2
Avian Pattern Recognition Receptors (PRRs) ........................................... 9 1.2.1
Chicken breeding for improved immune robustness ................................ 18 1.3
Inbred lines ............................................................................................. 18 1.3.1
Microsatellites markers and QTL mapping ............................................ 19 1.3.2
High-density single nucleotide polymorphism (SNP) panels ................. 21 1.3.3
Combination of gene expression and genomic markers ....................... 22 1.3.4
Studies on differences in gene expression between chicken lines ............ 22 1.4
Transcriptomics tools for immune gene expression analysis .................... 25 1.5
Microarrays ............................................................................................ 26 1.5.1
RNA sequencing ..................................................................................... 27 1.5.2
Quantitative polymerase chain reaction (qPCR) .................................... 28 1.5.3
The BioMark System .............................................................................. 29 1.5.4
Aims and objectives ................................................................................... 31 1.6
Materials and Methods ......................................................................... 33 Chapter 2
In silico materials ........................................................................................ 33 2.1
Basic Local Alignment Search Tool (BLAST)............................................ 33 2.1.1
ClustalX 2.1 ............................................................................................. 33 2.1.2
GeneDoc ................................................................................................. 33 2.1.3
Bowtie 1.0.0 ........................................................................................... 33 2.1.4
TopHat 2.0.9 ........................................................................................... 34 2.1.5

Cufflinks 2.1.1 ......................................................................................... 34 2.1.6
BestKeeper software .............................................................................. 35 2.1.7
NormFinder ............................................................................................ 35 2.1.8
geNorm................................................................................................... 35 2.1.9
Molecular cloning ....................................................................................... 36 2.2
E. coli JM109 competent cells ................................................................ 36 2.2.1
pGEM-T Easy .......................................................................................... 36 2.2.2
Cell cultures ................................................................................................ 38 2.3
Resurrection and passage of COS-7 cells. .............................................. 38 2.3.1
Transfecting cells with plasmid DNA .......................................................... 38 2.4
DEAE-dextran transient transfection method for COS-7 cells ............... 38 2.4.1
Production of recombinant chicken IL-4, GM-CSF and CSF-1 ................ 39 2.4.2
Primary cell experiments ........................................................................... 40 2.5
Generation of bone marrow-derived dendritic cells (BMDC) and bone 2.5.1
marrow-derived macrophages (BMDM) ............................................................ 40
Optimising LPS concentrations for stimulating BMDC and BMDM ....... 41 2.5.2
Isolation of heterophils from chicken blood .......................................... 41 2.5.3
Isolation of peripheral leukocytes from chicken blood ......................... 42 2.5.4
Phagocytosis assay ................................................................................. 42 2.5.5
Oxidative burst ....................................................................................... 43 2.5.6
Degranulation assay ............................................................................... 44 2.5.7
Purification of nucleic acids ....................................................................... 44 2.6
Purifying total RNA from chicken cells ................................................... 44 2.6.1
Purifying total RNA from chicken tissues ............................................... 45 2.6.2
DNA and RNA amplification ....................................................................... 45 2.7
Oligonucleotide primer design ............................................................... 45 2.7.1
First-strand reverse transcription using SuperScript III ......................... 46 2.7.2
First strand reverse transcription using High Capacity Reverse 2.7.3
Transcription Kit ................................................................................................. 46
DNA amplification by PCR ...................................................................... 47 2.7.4

Quantitative PCR – hydrolysis probe-based gene expression analysis .. 48 2.7.5
Fluorescent dye-based qPCR.................................................................. 50 2.7.6
Agarose gel electrophoresis ................................................................... 51 2.7.7
Gel extraction ......................................................................................... 52 2.7.8
Ligation ................................................................................................... 52 2.7.9
Transformation................................................................................... 53 2.7.10
Screening bacterial colonies by colony PCR ....................................... 53 2.7.11
Plasmid DNA purification ........................................................................... 54 2.8
Small scale plasmid purification ............................................................. 54 2.8.1
Large scale endotoxin-free plasmid purification ................................... 55 2.8.2
Sequencing plasmid DNA ....................................................................... 56 2.8.3
RNA-seq ...................................................................................................... 56 2.9
Sample preparation and sequencing ..................................................... 56 2.9.1
Transcriptome alignment and differential expression analysis ............. 57 2.9.2
Quantitative PCR (qPCR) using 96.96 Dynamic Array Integrated Fluidic 2.10
Circuits. ................................................................................................................... 57
Primer design and optimisation ......................................................... 58 2.10.1
Reference gene normalisation ........................................................... 58 2.10.2
RNA extraction and cDNA generation for 96.96 Dynamic Array IFC . 59 2.10.3
Preamplification ................................................................................. 59 2.10.4
Exonuclease I treatment .................................................................... 59 2.10.5
Quantitative PCR assay and sample master mix preparation............ 59 2.10.6
Chip priming ....................................................................................... 60 2.10.7
Chip loading ........................................................................................ 60 2.10.8
qPCR and data analysis....................................................................... 60 2.10.9
GenEx5 pre-processing....................................................................... 61 2.10.10
GenEx statistical analysis.................................................................... 61 2.10.11
Statistical analysis ...................................................................................... 62 2.11
Evaluation of cellular and molecular methods as diagnostic tools for Chapter 3
immune robustness ................................................................................................... 63

Introduction ............................................................................................... 63 3.1
Materials and methods .............................................................................. 66 3.2
Generation and stimulation of bone marrow-derived dendritic cells and 3.2.1
macrophages ...................................................................................................... 66
Phagocytosis, oxidative burst and degranulation assays....................... 66 3.2.2
Assessment of cytokine and chemokine expression using reverse 3.2.3
transcription quantitative polymerase chain reaction (RT-qPCR) ..................... 66
Results ........................................................................................................ 67 3.3
Bone marrow-derived macrophage and dendritic cell cultures ............ 67 3.3.1
Isolation of heterophils from blood ....................................................... 68 3.3.2
Induction of heterophil phagocytosis, degranulation and oxidative burst 3.3.3
by Salmonella Enteritidis.................................................................................... 70
Pro-inflammatory cytokine and chemokine expression upon stimulation 3.3.4
with lipopolysaccharide (LPS)............................................................................. 73
Discussion ................................................................................................... 76 3.4
Generation of gene list - selection and cloning of genes involved in Chapter 4
early immune responses. .......................................................................................... 80
Introduction ............................................................................................... 80 4.1
Materials and methods .............................................................................. 82 4.2
Selection criteria for creation of gene list .............................................. 82 4.2.1
RNA sequencing of BMDC, BMDM and heterophils .............................. 82 4.2.2
Comparison of RNA-seq data between analyses and published studies 4.2.3
for further gene selection .................................................................................. 82
Amplification, cloning and sequencing of candidate gene cDNA .......... 82 4.2.4
Results ........................................................................................................ 84 4.3
Creation of innate immune gene list ..................................................... 84 4.3.1
RNA-seq analysis .................................................................................... 87 4.3.2
Comparison of RNA-seq results with previous studies .......................... 88 4.3.3
Molecular cloning and sequencing of candidate genes ......................... 93 4.3.4
Discussion ................................................................................................... 96 4.4
Reference gene normalisation .............................................................. 98 Chapter 5
Introduction ............................................................................................... 98 5.1
Materials and methods ............................................................................ 104 5.2
Tissue collection ................................................................................... 104 5.2.1
RNA extraction and cDNA synthesis .................................................... 104 5.2.2
Gene selection and quantitative PCR................................................... 104 5.2.3
NormFinder, geNorm and BestKeeper analyses .................................. 105 5.2.4
Results ...................................................................................................... 106 5.3
Validation of reference gene primers .................................................. 106 5.3.1
Expression profiles of reference genes ................................................ 108 5.3.2
Transformation of Cq values to quantities (Q) .................................... 109 5.3.3
NormFinder analysis............................................................................. 110 5.3.4
geNorm analysis ................................................................................... 111 5.3.5
BestKeeper analysis.............................................................................. 113 5.3.6
Discussion ................................................................................................. 116 5.4
Optimisation and validation of 96.96 Dynamic Array as a diagnostic Chapter 6
tool 119
Introduction ............................................................................................. 119 6.1
Materials and methods ............................................................................ 122 6.2
Tissue collection and sample preparation ........................................... 122 6.2.1
cDNA synthesis ..................................................................................... 122 6.2.2
Primer design and optimisation ........................................................... 122 6.2.3
The BioMark System qPCR ................................................................... 123 6.2.4
Data analysis settings and visualisation ............................................... 123 6.2.5
Results ...................................................................................................... 124 6.3
Primer optimisation ............................................................................. 124 6.3.1
Optimisation of the 96.96 qPCR Dynamic Array via pilot studies ........ 126 6.3.2
Preamplification optimisation.............................................................. 130 6.3.3
Application of the optimised qPCR protocol to RNA from tissues from 6.3.4
Aviagen broilers on pedigree and sibling test farms........................................ 136
Data pre-processing ............................................................................. 138 6.3.5
The analysis of tissue gene expression from Aviagen broilers raised in 6.3.6
two hygienic settings........................................................................................ 139
Validation of differentially expressed genes by qPCR ............................. 149 6.4
Discussion ................................................................................................. 150 6.5
General discussion ............................................................................... 156 Chapter 7
Overview of this study.............................................................................. 156 7.1
Challenges and limitations of the study ................................................... 157 7.2
Future applications................................................................................... 159 7.3
Future challenges of poultry breeding ..................................................... 161 7.4
Conclusions .............................................................................................. 162 7.5
References ............................................................................................................... 163
Appendix 1 ............................................................................................................... 192
i
Abstract
The poultry industry has successfully applied breeding and production
programmes to meet growing consumer demands for chicken meat and eggs. Over
the last four decades, poultry breeders have selected birds not only for productivity,
but also for improved health, welfare, fitness and environmental robustness.
Intensive production settings contribute to faster spread of diseases and greater
losses in production due to increased morbidity and mortality of the flock.
Traditional methods of disease treatment and prevention have played a critical role
in control of disease. However, growing resistance of pathogens to therapeutic
measures and consumer concerns led to the withdrawal of antibiotics as growth
promoting additives in chicken feed. In addition, some vaccines have been
overcome by increasing variation and virulence of pathogens and are no longer
successful in disease prevention. The emergence of virulent and drug resistant
pathogens have emphasised the need to focus on other solutions to disease,
particularly natural genetic resistance. Genetic loci or gene expression patterns
associated with the differential resistance of lines to specific pathogens have been
identified, providing valuable markers for selective breeding. However, to date
relatively few of these have been successfully incorporated into commercial lines.
An ability to suppress or resist multiple pathogens, by selection for improved innate
immune robustness has also been studied but it has not been introduced in
commercial production, partly as the phenotype is ill-defined. Previous studies that
focused on pro-inflammatory cytokines and their mRNA levels expressed by innate
immune effector cells (heterophils and macrophages) identified differences
between resistant and susceptible chicken lines, with the former producing stronger
responses, supporting efforts to select poultry with an efficient early innate
response. Here, small-scale qPCR screening and cellular techniques were evaluated
with the conclusion that a more rapid, cheaper and reproducible method needs to
be applied.

ii
The main objective of this project was therefore to design and validate a
diagnostic tool that could be used to phenotype the immune responses of chickens
at the level of innate immunity. For this purpose, a panel of 89 genes was selected
based on previously published infection studies and on RNA-seq results obtained
from stimulation of heterophils, macrophages and dendritic cells with
lipopolysaccharide (LPS). Target genes were cloned and sequenced to optimise the
design of qPCR reactions and primers. A multiplex qPCR platform, the Fluidigm
96.96 Dynamic Array, was selected as the tool of choice with the capacity to
measure transcription of 96 genes of interest in 96 samples simultaneously. The
preamplification reaction was optimised and the platform validated using a
commercial line of chickens housed in clean or pathogen-challenged environments.
Lymphoid tissues, including bursa of Fabricius, spleen, ileum with Peyer’s patches,
caecal tonsils, and blood leukocytes were isolated and transcript levels for immune-
related genes defined between organs, birds and farms. For qPCR analysis, a panel
of reference genes was normalised and TBP, ACTB and GAPDH genes were selected
and validated as the most stable. The high-throughput qPCR analysis identified
peripheral blood leukocytes as a potentially reliable indicator of immune responses
among all the tissues tested with the highest number of genes significantly
differentially expressed between birds housed in varying hygienic environments.
The research described here could potentially aid the selection of poultry for
improved immune robustness. The technical optimisation and validation of a new
tool to simultaneously quantify expression of tens of relevant immune-related
genes will prime research in many areas of avian biology, especially to define
baseline immune gene expression for selection, the basis of differential resistance,
and host responses to infection, vaccination or immuno-modulatory substances.

iii
Lay summary
Over the last four decades poultry breeders have selected birds not only for
productivity, but also for improved health, welfare, fitness and environmental
robustness. However, with the intensification of production some traits have been
compromised. Traditional methods of disease treatment and prevention have
played a critical role in control of disease. However, growing resistance of
pathogens to therapeutic measures and consumer concerns led to the withdrawal
of antibiotics as growth promoting additives in chicken feed. The emergence of
virulent and drug resistant pathogens have emphasised the need to focus on other
solutions to disease, particularly natural genetic resistance.
Previous attempts to describe immune robustness in poultry have focused on early
responses in chicken immune cells (heterophils and macrophages) and found
stronger responses in resistant lines compared to susceptible ones. These
experiments suggest that selection of chickens that are characterised with early and
efficient immune responses is possible. Popular techniques that are commonly used
to characterise immune responses at the level of gene expression were evaluated in
this thesis with a conclusion that more rapid, reproducible and cheaper methods
need to be applied.
The main objective of this thesis was to design and test a tool that would allow us to
assess the levels of expression of many immune-related genes in many samples at
once. This would allow for easier and faster characterisation of the ability of
chickens to mount immune responses. A group of 89 genes was selected based on
previous studies and analysis of genes induced in chicken immune cells upon
stimulation with a bacterial agonist of early responses. To confirm the existence of
selected genes in chicken genome they were cloned and sequenced. The Fluidigm
96.96 Dynamic Array platform was chosen as the diagnostic tool. This platform can
run 9,216 reactions at once. Chicken organs involved in immune responses (spleen,
bursa of Fabricius, caecal tonsils, ileum and blood) were sampled from birds raised
on two farms that differed in levels of hygiene. To normalise the results from

iv
Fluidigm platform a set of reference genes that show stable expression across a
range of conditions was selected. Among all the different tissues tested, blood cells
showed the highest number of genes that were differentially expressed between
birds from clean and pathogen-challenged farms, suggesting that blood tests to
analyse expression of immune-related genes may be useful. The research described
here could potentially aid the selection of poultry for improved immune robustness.
The technical optimisation and validation of a new tool to simultaneously quantify
expression of tens of relevant immune-related genes will prime research in many
areas of avian biology, especially to define baseline immune gene expression for
selection, the basis of differential resistance, and host responses to infection,
vaccination or immuno-modulatory substances.

v
Acknowledgements
I would like to express my gratitude to my supervisors Professor Pete Kaiser,
Professor Mark Stevens and Dr Lonneke Vervelde for their understanding, patience,
and support throughout the course of my PhD. The vast knowledge you provided
during the project and thesis-writing period was greatly appreciated. I would also
like to acknowledge my thesis committee members Professor Dave Burt and Dr
Jayne Hope, as well as my industrial supervisors Dr Kellie Watson and Dr Richard
Bailey. A special thank you to Lisa Rothwell and Kate Sutton for their help and
guidance throughout my postgraduate career.
I would like to thank my late mom, the most loving and caring person in my
life, without whom I would not be here. In addition, I am grateful to the rest of my
family, my grandmother, my dad, my sister Karolina, my brother-in-law Mateusz
and my niece Laura. You all give me a lot of support and reasons to smile.
A special thank you goes to my friends Kate and Maggie. Our weekly Skype
chats are essential part of my life and thank you both for doing everything to make
it happen despite us living in three different time zones. We have a good craic!
Thanks also goes to my high school friend Izabela for always having kind words and
for sticking with me for the last 18 years. She is the person “with whom I could steal
horses”. Last but certainly not least, Maciek, my partner and best friend – thank you
for your unconditional love and support in the most difficult and challenging time in
my life.
vi
List of figures
Chapter 1
Figure 1.1. The components of innate and adaptive immune system in mammals.... 7
Figure 1.2. Differentiation of helper T cell subset in mammals................................. 16
Figure 1.3. Structure of 96.96 Dynamic Array IFC for gene expression. .................... 30
Chapter 2
Figure 2.1. Map of pGEM-T EASY vector .................................................................... 37
Chapter 3
Figure 3.1. Morphology of chicken bone marrow cells. ............................................ 68
Figure 3.2. Leukocytes isolated from blood using a discontinuous gradient. ........... 69
Figure 3.3. Phagocytosis of S. Enteritidis by heterophils isolated from day-old
chickens. ..................................................................................................................... 70
Figure 3.4. . Ability of heterophils to generate an oxidative burst response following
stimulation with opsonised S. Enteritidis and the inflammatory agonist phrorbol A-
myristate 13-acetate. ................................................................................................. 71
Figure 3.5. Effect of opsonised S. Enteritidis on degranulation by heterophils. ....... 72
Figure 3.6.. Evaluation of expression of proinflammatory cytokine genes in BMDM
and BMDC stimulated with LPS .................................................................................. 74
Figure 3.7. Evaluation of proinflammatory gene expression in heterophils as
measured by RT-qPCR. ............................................................................................... 75
Chapter 4
Figure 4.1. RNA-seq results ........................................................................................ 88
Figure 4.2. Comparison of published studies and RNA-seq gene lists ....................... 89
Figure 4.3. Examples of agarose gel images of amplicons of cDNAs for selected
genes of interest. ....................................................................................................... 94
Figure 4.4. Examples of agarose gel electrophoresis to validate pGEM-T clones of
selected amplicons by PCR. ........................................................................................ 95
vii
Chapter 5
Figure 5.1. Specificity of qPCR reaction with reference gene primers .................... 107
Figure 5.2. Quantification cycles (Cq) values reflecting expression levels of seven
reference genes in all tissues tested. ....................................................................... 108
Figure 5.3. The pairwise variation (Vn/Vn + 1) between the normalisation factors NFn
and NFn+1 to determine the optimal number of reference genes for normalisation.
.................................................................................................................................. 112
Chapter 6
Figure 6.1. Examples of optimisation of primer pairs based on melting curveanalysis.
.................................................................................................................................. 124
Figure 6.2. Examples of primer specificity confirmation by agarose gel
electrophoresis......................................................................................................... 125
Figure 6.3. Sequence alignments of selected qPCR products. ................................. 126
Figure 6.4. Heat map view of qPCR results from first optimisation of 96.96 Dynamic
Array. ........................................................................................................................ 127
Figure 6.5.Heat map view of the third pilot study using serial dilutions of samples
predicted to have high levels of the target cDNA. ................................................... 129
Figure 6.6. Preamplification test in 5 μl performed using a standard qPCR machine
.................................................................................................................................. 131
Figure 6.7. Preamplification test in 20 μl reaction volume and 10-cycle PCR ......... 132
Figure 6.8. Preamplification test of cDNA made using a High Capacity Reverse
Transcription Kit and 100 ng/μl total RNA in 10 ul and 20 ul reactions. ................. 133
Figure 6.9. Heat map view of a) non-preamplified cDNA and b) preamplified cDNA
corresponding to control transcripts. ...................................................................... 134
Figure 6.10. Preamplification test with the use of higher cDNA concentration and
higher reaction volume. ........................................................................................... 135
Figure 6.11. Heat map view of 96.96 Dynamic Array qPCR for immune-related genes
in broilers on pedigree and sibling test farms. ........................................................ 137

viii
Figure 6.12. Heat map view of 89 genes mRNA expression detected by 96.96
Dynamic Array qPCR in 8 tissue samples tested in quadruplicates. ........................ 138
Figure 6.13. Principal component analysis indicating broad similarities and
differences in transcription of immune-related genes in analysed tissues. ............ 139
Figure 6.14. Principal component analysis of qPCR data for immune-related genes
across tissues of birds reared on the pedigree and sibling test farms without PBL
samples..................................................................................................................... 140
Figure 6.15. Relative expression (mean ± SEM) of genes expressed in tissues
collected from pedigree (green) and sibling test (blue) farms. ............................... 141
Figure 6.16. Volcano plot of genes expressed in chicken blood (PBL) collected from
pedigree and sibling test farms. ............................................................................... 142
Figure 6.17. Volcano plot of immune-related genes expressed in tissues collected
from chickens raised on pedigree and sibling test farms ........................................ 143
Figure 6.18. Correlation of the magnitude and direction of gene expression in
tissues from chickens raised on pedigree (y axis) and sibling test (x axis) farms .... 144
Figure 6.19. Relative expression (mean ± SEM) of significantly DE genes between
birds from the sibling test farm (1-4) and pedigree farm (5-8) ............................... 146
Figure 6.20. Relative expression (mean ± SEM) of genes expressed in PBL collected
from pedigree (blue) and sibling test (green) farms. ............................................... 148
Figure 6.21. Validation of 96.96 Dynamic Array qPCR results for selected 3
transcripts ................................................................................................................ 149
Appendix 1
Figure 1. RNA-seq differential expression pipeline..…………………………………………….193
Figure 2. Melting curves for No Template Control (NTC) samples from qPCR analysis
using 96.96 Dynamic Array platform……………………………………………………………………216
Figure 3. Melting curves for all reference genes for all conditions from analysis using
96.96 Dynamic Array……………………………………………………………………………………………217

ix
Figure 4. Melting curves for genes where primers do not span exon/exon
boundaries and with introns < 500 bp…………………………………………………………………218
Figure 5. Unusual melting curves with additional peaks at lower temperatures from
qPCR analysis using 96.96 Dynamic Array…………………………………………………………….223

x
List of tables
Chapter 1
Table 1.1. TLR family members and their antagonists in humans and chickens ....... 11
Chapter 2
Table 2.1 High Capacity Reverse Transcription Master Mix components ................. 47
Chapter 3
Table 3.1. Phagocytic index. ....................................................................................... 71
Chapter 4
Table 4.1. Results of search queries for creation of the gene list.............................. 84
Table 4.2. A list of genes of interest upregulated upon stimulation with pathogens
or agonists based on published studies. .................................................................... 86
Table 4.3. Genes of interest and the type of studies with differential expression in
mammalian species and the chicken. ........................................................................ 90
Chapter 5
Table 5.1. Reference genes selected for evaluation and the function of the encoded
products. .................................................................................................................. 105
Table 5.2. NormFinder (NF) analysis of the most stable reference genes and their
stability values for all sample tested........................................................................ 110
Table 5.3. geNorm analysis showing the pairs of most stable reference genes for
each tissue sample tested and their stability expression M value. ......................... 111
Table 5.4. BestKeeper analysis results. .................................................................... 114
Appendix 1
Table 1. Primers for sequencing cDNA inserts in pGEM-T…………………………………….192
Table 2. Probes and primers used in RT-qPCR……………………...........………………………192

xi
Table 3. Primers designed to clone genes of interest…………………………………………..194
Table 4. Gene symbols and transcripts accession numbers for the final 89 genes
………….…………………………………………………………………………………………………………………199
Table 5. Primers, alignment site and amplicon length for qPCR detection of
transcripts of genes of interest using the 96.96 Dynamic Array in BioMark System
(Fluidigm)…………………………………………………………………………………………………………….202
Table 6. Primers designed for seven reference genes used in BioMark System
(Fluidigm)…………………………………………………………………………………………………………….207
Table 7. Slope and reaction efficiencies for reference genes tested in tissue samples
from birds reared on the pedigree farm………………………………………………………………208
Table 8. Slope and efficiencies for reference genes tested in tissue samples from
birds reared on the sibling test farm……………………………………………………………………210
Table 9. Transformation of Cq values into quantities by ΔCt method - samples from
pedigree farm……………………………………………………………………………………………………..212
Table 10. Transformation of Cq values into quantities by ΔCt method - samples from
sibling test farm………………………………………………………………………………………………..…214

xii
Abbreviations and acronyms
% - Percentage
°C - Degrees Celsius
μg - Microgram
μm - Micromolar
ADOL - Avian Disease and Oncology Laboratory
AIV - Avian Influenza Virus
AM - Arithmetic Mean
APC - Antigen-Presenting Cell
APEC - Avian Pathogenic Escherichia coli
BCR – B-cell Receptor
BKI - Best Keeper Index
BLAST - Basic Local Alignment Software Tool
BMDC - Bone Marrow-derived Dendritic Cells
BMDM - Bone Marrow-derived Macrophages
cDNA - Complementary DNA
CEF - Chicken Embryo Fibroblast
CLR - C-type Lectin Receptor
CNV - Copy Number Variation
COS-7 - CV-1 (simian) in Origin, carrying the SV40 genetic material
CS - Chicken Serum
CSF - Colony Stimulating Factor
Cq - Quantification Cycle
CV - Coefficient of Variance
DC - Dendritic Cell

xiii
DCFH-DA - Dichloro-dihydro-fluorescein diacetate
DE - Differential Expression
DEAE - Diethylaminoethyl
DMEM - Dulbecco’s Modified Eagle’s Medium
DMSO - Dimethyl sulphoxide
dsDNA - Double stranded DNA
EDTA - Ethylenediaminetetraacetic acid
eQTL - Expression QTL
Exo I - Exonuclease I
FAM - 5-carboxyfluorescein
FCS - Foetal Calf Serum
FM - Full-text Minute-space
FPKM - Fragments Per Kilobase per Million mapped reads
GM - Geometric Mean
GOI - Gene of Interest
HBSS - Hanks Balanced Salt Solution
HET - Heterophil Extracellular Trap
IBDV - Infectious Bursal Disease Virus
IBV - Infectious Bronchitis Virus
IFC - Integrated Fluidic Circuit
IFN - Interferon
Ig - Immunoglobulin
IL - Interleukin
ILTV - Infectious Laryngotracheitis Virus
IPTG - Isopropyl β-D-1-Thiogalactopyranoside

xiv
LPS - Lipopolysaccharide
LRR - Leucine-Rich Repeats
MAS - Marker-Assisted Selection
MDV - Marek’s Disease Virus
MHC - Major Histocompatibility Complex
MLN - Mesenteric Lymph Nodes
MNC - Mononuclear Cell
NDV - Newcastle Disease Virus
NE - Necrotic Enteritis
NLR - NOD-Like Receptor
NO - Nitric Oxide
NOD - Nucleotide-binding Oligomerisation Domain
PAMP - Pathogen-Associated Molecular Pattern
PBL - Peripheral Blood Leukocytes
PBS - Phosphate Buffered Saline
PCR - Polymerase Chain Reaction
PMA - Phorbol A-Myristate 13-Acetate
PRR - Pattern Recognition Receptor
qPCR - Quantitative Polymerase Chain Reaction
QTL - Quantitative Trait Locus
RFU - Relative Fluorescent Unit
RIG-I - Retinoic acid-Inducible Gene-1
RLR - Retinoic acid-inducible gene-1 (RIG-I) Like Receptor
RNA - ribonucleic acid
RNA-seq - RNA Sequencing

xv
rRNA - Ribosomal RNA
ROS - Reactive Oxygen Species
RPMI - Roswell Park Memorial Institute
RT - Reverse Transcription
RT-PCR - Reverse Transcription Polymerase Chain Reaction
RT-qPCR – Reverse Transcription quantitative Polymerase Chain Reaction
SAL1 - Salmonellosis Resistance Locus 1
SD - Standard Deviation
SNP - Single Nucleotide Polymorphism
TAE - Tris Acetate-EDTA
TAMRA - Tetramethylrhodamine
TCR – T-cell Receptor
TE - Tris EDTA
TGF - Transforming Growth Factor
Th - T helper
TIR - Toll/interleukin (IL)-1R homology domain
TLR- Toll-Like Receptor
TRT - Turkey Rhinotracheitis
x-gal - 5-bromo-4-chloro-3-indolyl-β-D-galactopyranoside
1
Introduction Chapter 1
Background 1.1
Poultry are reared in most parts of the world and are vital to global food
security. Since domestication around 4000 years ago, chickens were first bred in
Europe by the Romans around 500 B.C. (Parkhurst and Mountney, 2012; page 3).
Nowadays the poultry industry is the dominant and fastest growing supplier of high
quality and inexpensive animal protein worldwide. Many aspects have contributed
to the intensification of chicken farming, for example affordable feed, efficiency of
feed conversion relative to other farmed animals, changes in housing and better
disease control. In the period of 12 years, between 2000 and 2012, the number of
slaughtered chickens increased from 40,635 million to 59,861 million, and the meat
weight per bird increased from 1.44kg to 1.55kg (Global Poultry Trends, 2014). It is
estimated that these numbers will increase substantially due to global population
growth and rising affluence. By the end of this decade, 124 million tons of poultry
will be consumed worldwide, with Asia and Africa as the leaders (Meat Atlas;
Heinrich Böell Foundation and Friends of the Earth).
To sustain market requirements, most poultry are raised in large operations,
which can lead to rapid transmission of diseases and zoonotic pathogens among the
flock. Intensive rearing conditions may also lead to stress and injury, making birds
more vulnerable to diseases. The chicken immune system is challenged by diverse
viral, prokaryotic and eukaryotic pathogens. Some of these microbes can infect both
chickens and humans, for example, Gram-negative bacteria such as Salmonella and
Campylobacter and avian influenza. Such agents are sometimes carried in the
absence of symptoms, making carriers difficult to identify and enabling agents to
spread undetected in flocks and through the food chain. The spread of pathogens is
affected not only by host factors but environment and housing. Changes from caged
to enriched cages and non-cage system housing regulations for laying hens in EU
countries were implemented in 2012. Reports from countries that introduced new
housing systems earlier showed an increase in the incidence of bacterial infections
(Fossum et al., 2009; Kaufmann-Bart and Hoop, 2009). Conventional battery cages

2
limited the contact of hens with their faeces and provided less opportunity for
stress or injury associated with formation of a social hierarchy.
The most prevalent foodborne pathogens are Campylobacter and
Salmonella species. According to a UK Government report on zoonotic diseases
during 2013, Salmonella was responsible for 8,459 laboratory-confirmed cases of
gastrointestinal infections in humans, whereas Campylobacter caused 66,575 cases
in United Kingdom in 2013. The increase in the number of reported enteric and non-
enteric infections related to Campylobacter in part can be attributed to better
outbreak surveillance systems, which have resulted in infections being more readily
identified. National-scale genotyping was used to quantify the contributions of
different sources of human Campylobacter infection. The study revealed that the
main source of campylobacteriosis in Scotland in 2005-2006 was contaminated
chicken meat (Sheppard et al., 2009). Also many Salmonella serovars, such as
Heidelberg, Enteritidis, Infantis, Typhimurium, linked to human infections have
been isolated from poultry, eggs and egg-containing products (Dutil et al., 2010; Yim
et al., 2010; Cloeckaert et al., 2007). These pathogens are the main bacterial agents
causing food-borne illnesses in developed countries.
Losses in poultry production can be caused by diverse pathogens, some of
which cause serious outbreaks with high mortality. In some cases it is necessary to
slaughter entire flocks to prevent the infectious agents from spreading. Low
pathogenic avian influenza virus (AIV), high pathogenic AIV and Newcastle Disease
Virus (NDV) are the most common viruses, which have reservoirs in wild birds, and
hence are difficult to control. Despite Infectious Bronchitis Virus (IBV) not having
other hosts apart from the chicken, it can cause significant losses in production due
to poor weight gain, mortality and reduced egg production. Avian pathogenic
Escherichia coli (APEC) causes diverse respiratory and systemic diseases (collectively
termed colibacillosis) in chickens and other avian species. Infected birds often show
lower growth rates and feed conversion efficiency and have inflammation
associated with one or more visceral organs. Colibacillosis also leads to higher

3
mortality causing losses to the industry. Outbreaks of parasitic infections with
Eimeria species can cause high morbidity and mortality and can persist in chicken’s
environment in faeces and litter as oocysts. Infected birds often exhibit increased
intestinal colonisation by Clostridium perfringens leading to necrotic enteritis and
with Salmonella species, which intensifies the risk to food security and spread of
foodborne pathogens (Qin et al., 1996; Collier et al., 2008).
Good husbandry practices together with support from vaccines and
coccidiostats make poultry production on industrial scale achievable (Blake and
Tomley, 2014). There are vaccines available against many pathogens, for example
NDV, IBV, AIV, infectious bursal disease virus (IBDV), Marek’s Disease Virus (MDV),
fowl pox, Infectious Laryngotracheitis (ILTV), Salmonella Enteritidis, S. Typhimurium
and Eimeria species. However, such vaccines can be expensive and time-consuming
to administer and in some cases require updating to cover circulating strains.
In the past, the role of genetic disease resistance was limited due to
extensive application of antibiotics (Zekarias et al., 2002). The prophylactic
administration of antibiotics, as well as the use of in-feed antibiotics at sub-
therapeutic doses as growth-promoters, was prohibited in the European Union
from 2006 (reviewed in Castanon, 2007) in the light of increasing antibiotic
resistance of many pathogens and understandable concerns from consumers .
Therapeutic use is still allowed, but is increasingly hindered by transmissible drug
resistance and restrictions on antibiotic residues entering the food chain. Despite
the availability of vaccines for most of the common poultry diseases, there are still
regular breaks where disease can cause devastating problems for the commercial
production flock. Numerous factors can contribute to these disease outbreaks. The
factors include failure of vaccines to protect against a new or highly virulent form of
the pathogen. A recent report by Read et al. (2015) established that imperfect viral
vaccines that do not result in clearance might select for the occurrence of escape
mutants and more virulent strains by allowing a longer period for virus to mutate in
the host. In addition, loss of vaccine function due to incorrect storage or use, or the

4
disease challenge itself may be so high that it overwhelms vaccine-induced
immunity (Fulton, 2004). Although recovery after such outbreaks can be observed,
production efficiency rarely achieves the levels before the disease occurred.
Given the diversity of infectious threats to poultry health and challenge of
preventing and treating diseases, improved immune function would be
advantageous for chicken breeders. In this context, selection of more resistant
chicken lines offers much potential. The first selection experiments happened in
1935 and were aimed to decrease disease occurrence, which was mainly caused by
Salmonella enterica serovars Pullorum and Gallinarum that cause severe systemic
disease in birds (reviewed in Jie and Liu, 2011). For many decades, poultry breeders
focused their breeding schemes on phenotypic traits, which led to production of
chickens with increased body weight. The last 60 years of selective breeding in
broilers led to decrease in days required to reach processing weight. Nowadays it
takes 42 days compared to 84 days in the 1950s. In 1957, a 42-day-old broiler
weighed on average 591 g (Havenstein et al., 2003) whereas the avergage slaughter
weight of modern broilers is approximately 2672 g. Breeding programs directed
towards accelerated growth and feed conversion efficiency may unintentionally
reduce the responsiveness to the plethora of immune challenges (Swaggerty et al.,
2009).
While it has been possible to improve poultry by genetic selection for
resistance to specific diseases (Star et al., 2008), achieving a general increase in
immunological competence is considered challenging because of low heritability
and the difficulty of measuring this trait. In addition, progress in vaccination and use
of antibiotics repressed the requirement to generate immune protection through
breeding programs. Although the heritability estimates of disease resistance are
reported to be low, phenotypic variation is high in populations and genetic selection
can be used to complement improvements in vaccination practices to support
poultry in the “arms race” between pathogens and their host (reviewed in Hocking,
2010). The selection based on immune function has no effect on growth promotion,

5
therefore it could be possible to select for immune responsiveness without causing
a decline in weight gain abilities (van der Most et al., 2011). Selection for host
responses to individual pathogens is achievable and has been used in breeding
programmes (Zekarias et al., 2002) but it is not desirable.
Few lines selected for resistance to specific pathogen have been tested for
susceptibility to other pathogens. Hartmann et al. (1984) showed correlation of ALV
resistance with MD resistance in two pairs of strain, where a third pair presented
lower MD mortality rate. This demonstrates that the susceptibility spectrum to
pathogens other than the one used for selection has different outcomes in different
populations. Approaches to directly select for a single trait by creating divergent
populations have been performed in the past. Multi-determinant and non-
pathogenic antigen – sheep red blood cells (SRBC), was first used in mice (Biozzi et
al., 1979) and resulted in great differences in the magnitude of antibody responses.
The application of selection for SRBC responses in chickens led to a long-term
experiment using a White Leghorn population. The offspring of divergent lines (high
antibody – HA, low antibody – LA) differed in antibody titer to Newcastle Disease
Virus, mites, Mycoplasma gallisepticum, Eimeria necatrix and splenomeglia virus,
with HA chickens characterised by better humoral responses. On the other hand, LA
chickens were shown to be less susceptible to Escherichia coli and Staphylococcus
aureus (Gross et al., 1980; Dunnington et al., 1991). Resistance of high antibody
chickens to parasitic and viral pathogens was confirmed in experiments with
Eimeria tenella (Martin et al., 1986) and Marek’s Disease (Dunnington et al., 1986).
The susceptibility of the HA line to bacterial infections may lie in differential genetic
regulation and negative correlation between immune responses to wide spectra of
pathogens (Lamont et al., 2003).
Genes involved in adaptive immune responses control resistance to specific
pathogens. Therefore, selection based on adaptive immunity may be highly specific
against one particular pathogen and unlikely to give resistance to even closely
related pathogens. In addition, it can lead to susceptibility to other pathogens.

6
Breeding chickens for growth traits revealed its negative association with some
aspects of immune system performance. Another problem associated with this
approach is the difficulty to predict the specific types of microbes that may be
present in the commercial poultry environment and thus genetic selection for
resistance to a particular pathogen will not ensure infection-free chicken stocks
(Lamont et al., 2008).
A well-developed immune system that responds adequately to pathogens is
necessary to reduce disease occurrence. The generation of more robust lines of
birds with improved liveability would prevent major economic losses or
contamination of food products (Swaggerty et al., 2009). In order to do this there is
a demand for diagnostic tools that could rapidly and precisely evaluate avian
immune responses associated with innate immunity and disease resistance. The
innate immune response directs the adaptive response. Before this discovery,
immunological research had been focused on clonal expansion of T and B cells by
specific antigens (Parish and O’Neill, 1997). Since then many laboratories focused
their research on evaluating various aspects of the innate immune response in
poultry (Ferro et al., 2004; Wigley et al., 2006; Swaggerty et al., 2008). Kramer et al.
(2003) performed experiments with various breeds of chickens and their abilities to
fight the infection with innate or adaptive immune responses. The study showed
that Old Dutch breeds were characterised by higher production of nitric oxide (NO),
lower Salmonella survival in splenic leukocytes and higher total IgM and IgY
antibody concentrations compared to a commercial broiler group. These
experiments concluded that many aspects of the immune system should be
included in the selective breeding program. Focusing on only one branch of immune
system does not reliably indicate general responsiveness or immunocompetence.
Therefore, better understanding of avian immunology is crucial in determining
disease robustness in chickens.

7
The immune system 1.2
All living organisms have evolved defence mechanisms against invading
pathogens. Apart from commensal microflora that reaches homeostasis, the
immune system is constantly challenged with a broad spectrum of microorganisms.
Similar to mammalian species, chicken have developed two arms of defence: innate
and adaptive immune responses (Figure 1.1).
Figure 1.1. The components of innate and adaptive immune system in mammals. The cells (granulocytes, dendritic cells, macrophages, natural killer cells, mast cells) and soluble molecules (complement proteins) of the innate immune response act as the first line of defence against infection. The adaptive immune response is triggered by innate components, and it is highly characterised with high antigenic specificity and memory. The components of adaptive immune system include antibodies, B cells, and CD4+ and CD8+ T lymphocytes. Natural killer T cells and γδ T cells are cytotoxic lymphocytes that interact and bridge the innate and adaptive immunity (Adapted from Dranoff, 2004).
The innate immune component generates responses immediately after the
recognition of pathogen-associated molecular patterns (PAMPs). Adaptive
immunity starts as a second line of defence and is highly specific to the invading
organism(s). It requires time to design responses against invaders and to avoid

8
damaging of host tissues. The establishment of immunological memory by the
adaptive branch of the immune system allows responses to be generated faster
when the infection reoccurs. An important aspect of activation of adaptive immune
responses is the presentation of foreign antigen to the T cell or B cell receptor by
cells from the innate immune system that encountered pathogens via phagocytosis.
The Major Histocompatibility Complex (MHC) is essential for such antigen
presentation. The genes involved in MHC encode for glycoproteins that, after
antigen processing and degradation, present small peptides to the cell surface and
present them to the T or B lymphocytes. Naïve B cells can be activated by follicular
dendritic cells (FDCs) after presentation of unprocessed antigen in secondary
lymphoid organs (Batista and Harwood, 2009). B and T cells have major roles in the
development and organisation of adaptive immunity, respectively producing
antibody or targeting infected cells for killing. In the adaptive immune response,
antigen is recognised by two distinct sets of highly variable receptors, the B cell
receptor (BCR) and the T cell receptor (TCR). To protect against pathogens, the host
needs to generate a diverse pool of BCR that will recognise a broad range of
antigens and initiate the antibody production. TCR diversity has evolved as a result
of the arms race with emerging pathogens to cover most of the antigen diversity
(Nikolich-Zugich et al., 2004). In the chicken, mechanisms of somatic DNA
recombination to create variability in the TCR are identical as in mammals (Jung et
al., 2006). A vital part of immunity and control of infections with extracellular and
intracellular pathogens are the T helper 1 (Th1) and T helper 2 (Th2) cells. The
components of Th1 and Th2 responses required in mammals, including signature
cytokines and transcription factors, have been identified in the chicken genome
(Kaiser et al., 2005).
The avian immune system differs from those of mammalian species at the
genetic, molecular, cellular and organ level. Birds have different repertoires of Toll-
like receptors (TLRs) involved in pattern recognition, as well as different antibodies.
They also lack draining lymph nodes and the sites of antigen uptake, processing and
immunological priming are relatively poorly defined (reviewed in Kaiser, 2010).

9
Birds have an avian-specific primary lymphoid organ, the bursa of Fabricius, which is
the site of development of the B-cell repertoire (Glick et al., 1956). At the cellular
level, the avian functional equivalents of mammalian neutrophils are heterophils
(Kogut et al., 2005). The chicken eosinophils appear to be non-functional (Maxwell,
1987) and the components that control migration of eosinophils, for example
eotaxins, eotaxin receptor and chemokines, are missing in the chicken genome
(Kaiser, 2012). Similar to eosinophils, the numbers of basophils and mast cells, all
typical cells of Th2 responses, are much lower compared to mammalian species
(Schijns et al., 2014). The chicken Major Histocompatibility Complex (MHC) genes
differ in the structure, function and architecture from the mammalian MHC
(Kaufman et al., 2013). The chicken MHC is more compact, containing only 19 genes
within the 92 kb region of the B locus on the chromosome 16. The 20-fold smaller
size compared to human MHC has been termed “the minimal essential” MHC
(Kaufman et al., 1995).
Avian Pattern Recognition Receptors (PRRs) 1.2.1
Similar to mammals, the chicken innate immune system depends on the
recognition of pathogens or pathogen-associated molecular patterns through
Pattern Recognition Receptors (PRRs) including TLRs, retinoic acid-inducible gene-1
(RIG-I) like receptors (RLRs), nucleotide-binding oligomerisation domain (NOD)-like
receptors (NLRs) and C-type lectin receptors (CLRs) family members. A RIG-I
orthologue is present in both the duck and goose genomes (Barber et al., 2010; Sun
et al., 2013) but it has not been identified in the chicken (Karpala et al., 2011). The
most studied family are TLRs. This family consists of transmembrane glycoproteins,
expressed on the cell membrane or intracellularly. The extracellular domain consists
of leucine-rich repeats (LRR) responsible for pathogen recognition. The
transmembrane domain and intracellular region containing Toll/interleukin (IL)-1R
homology domains (TIR) recruits adaptor proteins, which then activate signal
transduction cascades. A core signalling pathway is engaged by surface TLRs and
leads to activation of transcription factors involved in pro-inflammatory gene
expression (O’Neill and Bowie, 2007).

10
Avian TLR family members comprise mammalian orthologues and avian
specific TLRs and their ligands, where known, are listed in (Table 1.1). The
mammalian TLR1 family can form heterodimers with TLR2, which increases the
capacity to detect PAMPs (Ozinsky et al., 2000). Tandemly duplicated genes, TLR1A,
TLR1B and TLR2A, TLR2B represent the chicken TLR1 family (Boyd et al., 2001; Fukui
et al., 2001). Similar to mammalian TLR2, chicken TLR1 and TLR2 families can form
heterodimers and detect PAMPs (Higuchi et al., 2008). Orthologues for TLR3
(Schwarz et al., 2007), TLR4 (Leveque et al., 2003), TLR5 (Iqbal et al., 2005) and TLR7
(Philbin et al., 2005) are present in the chicken genome. TLR4 detects
lipopolysaccharide and is associated with early regulation of Salmonella infection
(Leveque et al., 2003). TLR5 detects flagellated Salmonella serovars (Iqbal et al.,
2005). Detection of viral RNA is mediated by intracellular TLR3 and TLR7 (Schwarz et
al., 2007; Philbin et al., 2005). Chicken TLR8 is a pseudogene disrupted by a chicken
repeat-1 (CR1) retrovirus-like element (Philbin et al., 2005). Although TLR9 gene is
absent from the chicken genome, chickens are able to detect CpG motifs via TLR21
(Brownlie et al., 2009; Keestra et al., 2010). Avian-specific TLR15 have been shown
to detect range of PAMPs from various pathogens, for example Salmonella
Typhimurium, S. Enteritidis, Escherichia coli, B- and C-type CpG oligonucleotides
(ODN), tripalmitoylated lipopeptide (PAM3CSK4), LPS, virulence-associated fungal
and bacterial proteases, yeast-derived agonist and Eimeria tenella sporozoites
(Higgs et al., 2006; Shaughnessy et al., 2009; Nerren et al., 2010; Ciraci and Lamont,
2011; De Zoete et al., 2011, Boyd et al., 2013, Zhou et al., 2013).

11
Table 1.1. TLR family members and their agonists in humans and chickens
Human Chicken Agonists Pathogen
TLR1/6/10 TLR1A TLR1B
Lipoprotein Mycobacteria
TLR2 TLR2A TLR2B
Peptidoglycan Bacteria
TLR3 Present
dsRNA Viruses
TLR4 Present
LPS Gram- bacteria
TLR5 Present
Flagella Gram- bacteria
TLR7 Present
ssRNA Viruses
TLR8 Pseudogene
ssRNA Viruses
TLR9 TLR21
CpG Bacteria and viruses
Absent TLR15 LPS
Lipoprotein CpG
Gram+/- bacteria, viruses fungi
Non-cellular components of innate immune system 1.2.2
Cytokines and chemokines play an essential role in the immune response.
These small regulatory molecules act as extracellular signals between cells during
the course of an immune response. Knowledge of the cytokine repertoire in the
chicken radically changed after the chicken genome sequence became available
(Hiller et al., 2004). Due to very low (25-35%) identity with their mammalian
orthologues there are only few cross-reactive monoclonal antibodies or bioassays
(reviewed in Kaiser and Staeheli, 2008). The repertoire of chicken cytokines includes
interferons (IFNs), interleukins (ILs), transforming growth factors (TGFs), tumour
necrosis factors (TNFs), colony stimulating factors (CSFs) and chemokines (Kaiser et
al., 2005). Many studies focus now on expression of pro-inflammatory cytokines in
effector cells upon stimulation with TLR agonists. Pro-inflammatory cytokines and
chemokines are involved in responses to various pathogens challenges and
increased resistance against disease have been shown to be associated with strong
pro-inflammatory cytokine and chemokine responses (Coussens et al., 2004, Ferro
et al., 2004).

12
Role of the effector cells 1.2.3
Various cells of both arms of the immune system have been described in the
chicken. The activity of dendritic cells, macrophages, heterophils, natural killer cells
(NKT), γδ T cells against invading microbes is considered a part of the innate
immune response. In the context of this study, dendritic cells (DCs), macrophages
and heterophils will be reviewed. Dendritic cells and macrophages phagocytose the
encountered pathogen and present degraded peptides in the context of MHC
molecules. MHC molecules play crucial role as a restriction element presenting
antigens to T cells. MHC class I and II molecules have similar functions, both present
the antigens to T cells, CD8+ and CD4+, respectively. The difference lies in the origin
of the antigen. Generally, MHC class I molecules present peptides originated from
intracellular pathogens whereas MHC class II molecules present exogenous peptides
(reviewed in Vyas et al., 2008). In some circumstances, extracellular-derived
antigens can be presented via MHC class I molecules to CD8+ T cells. The
phenomenon of cross presentation has been described 30 years ago (Bevan, 1976)
and is still a “hot topic” as it is not yet fully elucidated. The migratory CD103+ DCs
have been shown to be most efficient in cross-presentation in mammals (Joffre et
al., 2012). It is now known that the immune system uses this mechanism to monitor
tissues and phagocytic cells for the presence of antigens.
Since Metchnikoff first used the “macrophage” term to describe phagocytic
leukocytes in 1884, the knowledge about these cells has grown hugely. Their role in
innate and adaptive immunity, inflammation as well as in tissues homeostasis is
well established in mammals (reviewed in Gordon, 2003). The macrophage
repertoire consists of heterogeneous cells located in different tissues throughout
the body in both vertebrates and invertebrates (Gordon and Taylor, 2005). They
function as phagocytes and stimulate immune responses of other cells by
expression of cytokines and chemokines, and therefore play primary roles in both
innate and adaptive immunity. Carrell and Ebeling first described the isolation of
macrophages from chicken blood in 1922. The adherence abilities of macrophages
have been used to develop a protocol of selecting monocyte-derived macrophages
13
from peripheral blood (Peck et al., 1982). It is now possible to culture chicken bone
marrow-derived macrophages with colony-stimulating factor 1 (Garceau et al.,
2010). Mammalian dendritic cells (DCs) have been identified over 30 years ago
(Steinman et al., 1975) and have become the basis of immune responses studies in
mammalian species since. Unlike macrophages or B cells, DCs are much more
effective at inducing a primary immune response in resting naive T lymphocytes,
and are called professional antigen-presenting cells (APCs) (Nakayama, 2015). Apart
from phagocytosis and antigen processing, macrophages and dendritic cells also
produce cytokines and chemokines and express MHC Class II molecules on their
surface after recognition of PAMPs. The level of knowledge and availability of
diagnostic tools to study avian effector cells is limited compared to the mammalian
field. The populations of both types of effector cells are heterogeneous. Several
different subtypes of dendritic cells have been identified and characterised in the
chicken – bursal secretory DCs, follicular DCs, thymic DCs, Langerhans cells and
bone marrow-derived DCs (Igyarto et al., 2006; Igyarto et al., 2007; del Cacho et al.,
2008; Wu et al., 2010, Olah and Nagy, 2013). Recent studies have characterised
bone marrow-derived DC during viral infections with AIV and IBDV (Vervelde et al.,
2013; Liang et al., 2015). The advent of transgenic chickens in which all cells of the
myeloid lineage express a fluorescent protein under the control of the CSF-1
receptor promoter has begun to shed light on the spatial organisation and function
of macrophages in the chicken (Garceau et al., 2015).
Heterophils, the avian equivalent of mammalian neutrophils, have not been
reported as APCs. However, several genes involved in the MHC class II system
(CD80, MHC II β chain, c-KIT) were reported to be upregulated in Salmonella
Enteritidis-stimulated heterophils derived from a resistant line of chickens (Chiang
et al., 2008). Heterophils are useful biomarkers for measuring the innate immune
response as they act early (within an hour) to engulf and destroy pathogens via
phagocytosis (Swaggerty et al., 2003). Pathogens are then entrapped inside
phagosomes that begin to fuse with cytoplasmic granules with microbicidal
substances. Similarly to neutrophils, heterophils have evolved specific tools to

14
prevent pathogens from spreading. They are capable of producing reactive oxygen
species (ROS) but the process of oxidative burst differs from the process observed in
human neutrophils. The lack of myeloperoxidase, catalase and alkaline phosphatase
enzymes distinguish them from neutrophils (Brune et al., 1972).
Apart from intracellular phagocytic killing, heterophils are equipped with
extracellular killing mechanisms. Heterophils have granules whose contents are
released into the external environment upon contact with pathogens . The release
of networked extracellular fibres made up of DNA, histones and granular enzymes
has been shown in chicken heterophils stimulated with pathogens or their products .
These heterophil extracellular traps (HET) are independent of phagocytosis, making
heterophils the most equipped effector cells (Chuammitri et al., 2008). Association
of HET production with variation at the locus associated with salmonellosis and
SLC11A1 gene has been revealed in studies on two intercross lines of chickens
challenged with S. Enteritidis (Redmond et al., 2011), indicating that it may be
under genetic control. Antimicrobial proteins, peptides, enzymes and adhesion
molecules are among the potentially toxic substances found in chicken heterophil
granules. An antimicrobial cationic peptide, cathelicidin-2, has been shown to be
released from heterophil granules upon stimulation with S. Enteritidis (van Dijk et
al., 2009). Heterophils are able to release the granule contents at the infection site
in a controlled manner to avoid damaging surrounding tissues (Genovese et al.,
2013). Phagocytosis has been shown to be associated with degranulation processes.
Similar to phagocytosis, various microbial substances were found to stimulate
degranulation (Kogut et al., 2005).
Adaptive immune response 1.2.4
The adaptive immune response is activated after the presentation of antigen
to lymphocytes (Medzhitov and Janeway, 1998), in the context of the MHC, by
antigen-presenting cells, especially DCs. CD8+ T cells and/or CD4+ T cells are
stimulated and activated depending on the nature of the pathogen. Stimulation of
naive T helper cells, expressing CD4 molecules, with IFN-γ, IL-12 or IL-18 secreted by

15
innate immune system effector cells initiates the differentiation of Th1 cells . In
contrast, IL-4 and IL-13 trigger the differentiation of Th2 cells (Figure 1.2).
Th1 cells enhance cell-mediated immunity against intracellular pathogens,
whereas Th2 cells are important for control of extracellular pathogens via humoral
responses. They are also responsible for activation of B cells (Lebman and Coffman,
1988). Markers of these Th cell subsets are the transcription factor Tbet, the cell
surface marker TRANCE and the signature cytokine IFN-γ for Th1 cells and, for Th2
cells, GATA-3, Tim1 and IL-4 and IL-13 (reviewed by Zhu and Paul, 2008).
Until recently, the Th1/Th2 paradigm (Mosmann and Coffman, 1989) has
been used to describe the different adaptive responses triggered by various
pathogens. Evidences of Th1/Th2 polarisation in the chicken have been shown
based on infection studies with viruses and helminths (Eldaghayes et al., 2006;
Degen et al., 2005). The Th1/Th2 paradigm does not explain many complicated
pathological situations. The discovery of a third subset of Th cells (Th17) has
expanded the Th1/Th2 paradigm (Ouyang et al., 2008). The primary function of
Th17 cells is to handle pathogens that have not been cleared by Th1 or Th2 cells .
Differentiation of Th17 cells is triggered by a combination of TGF-β, IL-6 and IL-23
(reviewed in Korn et al., 2009). Th17 cells express the transcription factor RORγt,
the receptor IL-23R on their surface and the signature cytokines IL-17A and IL-17F
(Ivanov et al., 2006). The chicken IL-17 family consists of five members that have
been identified in the genome: IL-17A, IL-17B, IL-17C, IL-17D and IL-17F (Kaiser et
al., 2005). After successful clearance of the pathogen, some T cells, which
previously encountered antigen, remain in the system as memory cells (reviewed in
Korn et al., 2009). The immune system developed a mechanism that control the
damage caused by immune responses. Regulatory T cells (Treg) are a subset of T
cells that specialises in immune suppression. The disruption of regulatory function
of immune system causes the autoimmune diseases. One of the unique markers of
Treg is Foxp3 (Li et al., 2008b) which has not yet been identified in the chicken. The
Treg family consists of Th3 cells, CD8+Foxp3+ cells, γδT cells, NKT cells and CD4-CD8-

16
TCRαβ+ cells. Chicken CD4+CD25+ cells have been shown to have similar suppressive
functions as mammalian Treg cells (Shanmugasundaram and Selvaraj, 2011).
Figure 1.2. Differentiation of helper T cell subset in mammals. Antigen –activated dendritic cells (DCs) interact with naïve CD4+ T cells which leads to polarisation into different effector T cell subsets — T helper 1 (Th1), Th2, Th17 and regulatory T (Treg) cells.Distinct sets of transcription factors control differentiation of each effect T cell type. Naïve T cells can differentiate into Th17 cells in the presence of interleukin-6 (IL-6) and transforming growth factor-β (TGFβ). Th17 cells express the transcription factors retinoic acid receptor-related orphan receptor-γt (RORγt) and signal transducer and activator of transcription 3 (STAT3). FOXP3 - forkhead box P3; GATA3 - GATA-binding protein 3; IFNγ - interferon-γ; TCR - T cell receptor (Adapted from Zou and Restifo, 2010).
The humoral response is a part of the adaptive branch of immunity and
involves activity of B lymphocytes. In mammals B cells develop in bone marrow
from pluripotent haematopoietic stem cells that give rise to common lymphoid
progenitor cells. Progenitor B cells undergo rearrangement of the immunoglobulin
(Ig)-heavy chain and light chain genes. This process results in immature B cel l
population that express the membrane-bound IgM. B cells migrate to lymphoid
organs as naïve cells, meaning they have not yet been exposed to antigen. Activated
B cells differentiate to plasma cells, express and secrete different classes of Ig. The
switch between IgG, IgA, IgD, IgE and IgM is orchestrated by cytokines. In contrast
to bone marrow B cell development in mammals, chickens unique lymphoid organ,

17
the Bursa of Fabricius is the site where B cells originate and differentiate (Barnes,
2001; Glick, 1988). The B cells mature inside the bursa’s follicles and develop
antigenic diversity after exposure to antigens by APCs (Glick, 1977; Ratcliffe, 1989).
Humoral responses are maintained by matured B cells that migrate from bursa to
spleen and lymphoid tissues (Pope, 2001).
Avian immunoglobulins are classified into three groups: IgA, IgG and IgM
(Hodek and Stiborova, 2003). Because of the structural differences between
mammalian IgG and avian IgG, it was suggested to rename it to IgY (from yolk)
(Leslie and Clem, 1969). Activation of mature B cells occurs when it recognises
antigen in conjunction with signals from Th2 cells, which triggers proliferation and
differentiation of B cells into a plasma cells. Plasma cells can be classified as
antibody-producing cells or memory cells that survive for many years with the
ability to produce antibody against specific antigen. Immunoglobulins consist of
dimerised heavy and light chain with constant (C) and variable (V) regions. Somatic
recombination of families of gene segments – V and joining (J) genes, produce light
chains, and diversity (D) genes in case of heavy chain. The V(D)J recombination
leads to great diversity in antigen recognition. Further changes in antigen
recognition are manipulated by mutations occurring in the V, D, J genes, called
somatic hypermutation. The Ig genes in avian species undergo rearrangement like
their mammalian counterparts, but antibody diversity is primarily generated by
gene conversion, which usually occurs after initial recombination of the single VJ or
VH genes and surface expression of the B cell receptor. Single copies of VL and JL
genes encode light chain and VH and JH genes encode heavy chain, which limits the
diversity and the V(D)J rearrangements occurrence (Ratcliffe and Jacobsen, 1994;
Reynaud et al., 1985). The recombination with clusters of pseudogenes upstream of
the heavy and light chains loci increases the diversity of the Ig V region (Reynaud et
al., 1987; Reynaud et al., 1989).

18
Chicken breeding for improved immune robustness 1.3
Improvements in the poultry industry can be achieved by development of
chicken lines with better immune responsiveness. To accomplish this, improved
understanding of chicken immunology is necessary. Every aspect of the acquired
immune response has its beginning in the innate response of effector cells. Stronger
and more rapid innate responses to infection lead to higher resistance in particular
chicken lines (Swaggerty et al., 2009). Over the years, many studies have shown
that commercial broiler lines have distinct immune function parameters, due to
differences in their genetic make-up, which results in disease resistance and/or
susceptibility. Poultry breeders and producers should co-select for both immune
competence and growth traits (Cheema et al., 2003). Disease resistance is generally
a polygenic trait (Cavero et al., 2009). Before the chicken genome became available,
the genetics of complex traits had been studied without identifying the genes
involved. The basis for selection was estimated breeding values calculated from
phenotypic records and pedigrees, and knowledge of the heritability of each trait.
However, this process is slow and, in the case of disease resistance, measuring the
trait is expensive. Identification of genes controlling this trait would be
advantageous in selection of animals carrying the desirable alleles (Goddard and
Hayes, 2009). Early studies of immunological traits were limited to measurements
of antibody levels to a defined antigen. These biomarkers are still relevant because
they are easy to assess and relatively cheap. However, over the past 20 years, the
methods available for identification of DNA variation have changed and costs of
these assays decreased (reviewed in Lamont et al., 2008). The early methods used
to discover the genes were a candidate gene approach and gene mapping to a
chromosomal location (reviewed in Jie and Liu, 2011).
Inbred lines 1.3.1
Toward the genetic improvement of poultry, a number of inbred lines of
varying phenotypes have been created in the chicken from a selection of breed
stocks (Crawford, 1990). First experiments with inbreeding started in 1939 at the
Regional Poultry Disease Laboratory, now known as the Avian Disease and Oncology
19
Laboratory (ADOL). The natural variability inherent in a chicken population was
explored with the use of individual cages, artificial insemination and brother-sister
mating. Families with inherent high resistance or susceptibility to avian leukosis
were formed with carefully selected source stocks. This resulted in production of
several specific lines (Stone, 1975). Using inbred lines to identify sources of
variation is advantageous, as the level of biological variance of the trait is very low
compared to outbred lines. The phenotypic variance decreases in backcross
populations. This allows the mapping of genomic regions associated with the trait of
interest, termed quantitative trait loci (QTL) by association of the genotype of the
backcross progeny with the phenotype under study. In addition, backcrossed
populations maintain the non-random association of alleles at different loci,
therefore the power to identify a QTL is maintained (Soller et al., 2006). The
identification of QTL associated with a trait could lead to greater examination in
order to find the causative gene or linked marker that can be used for marker-
assisted selection (MAS) in breeding programmes.
Microsatellites markers and QTL mapping 1.3.2
With the development of the polymerase chain reaction, amplification of DNA
in a rapid inexpensive manner became available to detect variation. PCR techniques
were used to identify short repetitive sequence length variations – microsatellites.
Their many characteristics, such as codominance, high polymorphism and
multiallele dispersion in the genome were used as DNA-based markers for breeding
selection. This approach produced microsatellite-based genomic maps, which were
then applied in studies on experimental crosses for identification of genomic
regions influencing commercially important traits. With the use of genomic maps of
the location of specific microsatellites, the identification of genomic regions
responsible for quantitative traits became possible.
Many of the studies utilised the inbred lines and their crosses characterised
with resistance and susceptibility to certain pathogens in identification of QTL.
Instead of reviewing all literature on how immune function has been implicated in

20
genomic studies on heritable resistance to infection I will focus on selected
pathogens as examples. As of August 2015, the animal genome QTL database
reported 224 publications identifying more than 4,676 QTL for 319 traits, including
those for specific disease resistance (www.animalgenome.org). The QTLs associated
with MDV resistance have been studied in resistant and susceptible inbred lines,
which were developed in ADOL. Several potential QTL have been determined from
backcrosses between these lines. Vallejo et al. (1998) used inbred lines that differ in
their susceptibility to Marek’s Disease Virus (MDV) to produce intercross progeny in
order to map QTL affecting MDV susceptibility. With the use of 78 microsatellites
markers, six QTL were mapped with significant and suggestive association with
Marek’s Disease (MD) traits. Following these experiments Yonash et al. (1999)
genotyped all birds used in the previous study and added 49 new microsatellites
markers. McElroy et al. (2005) reported identification of the same QTL for MD
resistance in commercial layers, showing that the experimental inbred lines and
their crosses are useful tool for commercial populations. In addition, Heifetz et al.
(2007), using microsatellites markers, confirmed localisation of previously reported
QTL significantly associated with resistance to MD in commercial lines.
Mariani et al. (2001) used microsatellite markers in low density QTL mapping
of a substantial component of resistance to systemic salmonellosis (SAL1) to chicken
chromosome 5. These experiments were performed on a highly susceptible inbred
line and highly resistant inbred line to Salmonella infection and their progeny from
the backcross with the parental line. Separately, Beaumont et al. (2003)
demonstrated the importance of genomic region carrying gene SLC11A1 in
Salmonella resistance. Populations derived from inbred lines were used in the
identification of several QTL for resistance to carrier state using selective
genotyping approach (Tilquin et al., 2005). The bacteria count of S. Enteritidis and S.
Typhimurium from cloacal swabs in backcross and F2 progeny determined which
individuals were characterised by extreme phenotype and selected birds were
genotyped. Studies on Salmonella carrier state QTL in commercial lines confirmed
that the locus carrying the SLC11A1 (Nramp1) candidate gene is significantly

21
associated with carrier state resistance variations in different chicken lines. In
addition, a QTL associated with Salmonella gut colonisation has been identified on
chromosome 2 (Calegne et al., 2009).
High-density single nucleotide polymorphism (SNP) panels 1.3.3
Together with the first chicken genome assembly in 2004 a 2,8 million single
nucleotide polymorphism (SNP) map was produced (International Chicken
Polymorphism Map Consortium, 2004) which further allowed identification of many
QTL and determined many disease-related genes, e.g. MHC, SLC11A1 (Nramp1),
IFN, TLRs, IRAK-4, MyD88, NFκB, TNFSF, using various molecular technologies
(reviewed in Kaiser et al., 2008).
The SNP number and density has been increasing since the first published SNP
map (Wong et al., 2004). Re-sequencing of divergent chicken lines provides
additional SNP (Rubin et al., 2010). With the use of high-density SNP panel, Fife et
al. (2009) refined the location of SAL1 locus and two potential candidate genes
were identified (SIVA1 and AKT1). The SNP panel was used in studies on
identification of Salmonella colonisation QTL. The four QTL, mapped to
chromosome 2, 3, 12 and 15, are significant at either the genome-wide or the
chromosome-wide level (Fife et al., 2010). However, to identify causative genes
higher density SNP panels are needed. Genomic analysis of advanced intercross
lines responses to Salmonella has supported the importance of the SAL1 QTL that
contains AKT1 and SIVA1 genes as candidates that control resistance to systemic
salmonellosis (Redmond et al., 2011). The fine-mapping of QTLs is limited by poor
precision in gathering phenotypic data and reliability of these assessments. The
development of new technologies such as RNA-seq, microarray expression analyses
and high density SNP genotyping should expedite the search for mechanisms of
genetic resistance (reviewed in Calenge et al., 2010).
Other causes of genetic variation, in addition to SNPs, are emerging and can
be associated with disease resistance. Copy number variations (CNVs) are difficult
for most mapping approaches and for sequence assembly and were therefore
22
largely ignored in the search for QTL (reviewed in Dodgson et al., 2011). CNVs are a
type of genomic structural variation involving deletions, insertions and duplications
and range from kilobase to megabases. Now it is clear that CNVs are involved in
phenotypic differences such as late feathering (Elferink et al., 2008). The number of
nucleotides affected by CNVs has been shown to exceed the number of SNPs
(Conrad et al., 2010). Wang et al. (2010) observed 96 CNVs in 10 sampled birds.
Among those CNVs, fifteen involved functional genes. Recently the number of CNVs
and CNV regions (CNVRs) increased to 130 with the use of an Agilent 400k array
CGH (comparative genomic hybridisation) platform (Wang et al., 2012).
Combination of gene expression and genomic markers 1.3.4
By considering gene expression as a quantitative trait or phenotype and
combining with other genetic markers, the genomic location(s) that control
variation can be revealed (Cogburn et al., 2007). The combination of gene
expression studies and marker genotypes has a great promise for studies of
complex traits. By comparing gene expression data with the location of QTL
previously associated with MDV traits in inbred lines, the IRG1 gene was identified
as having a potential role in MD susceptibility (Smith et al., 2011). Heams et al.
(2011) used gene expression with comparison with mapped QTL region to study
Eimeria tenella infections. This approach highlighted potential candidate genes that
are positioned within significant QTL for Eimeria lesions. The QTL associated with
variation can be either cis or trans to the gene of interest. The cis-eQTL could be
interpreted as the sequence flanking gene, hence regulating its expression. The
trans-acting eQTL could modulate the expression by transcription factors. The
former are more difficult to identify, even with a complete genome sequence
(Cogburn et al., 2007).
Studies on differences in gene expression between chicken lines 1.4
As stated in the previous section, over the years, genetic resistance to
diseases in chickens has been studied in context of various pathogens. In this

23
section, examples of mRNA gene expression and functional studies will be reviewed
in context of heritable natural genetic resistance.
Divergent chicken lines were used to study immune responses to Salmonella
species, Eimeria species, and Campylobacter jejuni. Studies by Wigley et al. (2002)
on resistant inbred birds showed lower mortality and morbidity when infected with
Salmonella Gallinarum. Subsequent in vitro comparison of macrophages from
resistant and susceptible lines revealed that innate immunity played a role in
responsiveness to S. Gallinarum with better clearance of bacteria in the former line.
Increased expression of pro-inflammatory cytokines in the resistant line suggested
efficient initiation of innate and adaptive immune responses that is pivotal in
immunity to systemic salmonellosis (Beal et al., 2004). The results were confirmed
in studies on the same lines monocyte-derived macrophages stimulated with S.
Gallinarum and S. Typhimurium (Wigley et al., 2006) where higher and more rapid
mRNA gene expression of cytokines and chemokines was observed in macrophages
from resistant line.
In addition to macrophages, heterophils from resistant and susceptible lines
have been shown to respond differently to infection with S. Enteritidis (Swaggerty
et al., 2003). Commercial lines and their reciprocal crosses were evaluated based on
heterophil degranulation, phagocytosis and oxidative burst responses when
challenged with Salmonella. The results showed that the ability of heterophils to
efficiently react to infection is genetically transferred to the progeny. A study on
systemic infection with S. Enteritidis administered into the abdomen of day-old
chickens from the parental line and reciprocal crosses showed heterophil influx to
the site of infection to be much higher in the resistant line and the progeny
compared to susceptible line (Swaggerty et al., 2005). These studies were
supplemented with experiments on mRNA gene expression after stimulation with S.
Enteritidis in the same commercial lines and their reciprocal crosses (Ferro et al.,
2004; Swaggerty et al., 2004). The upregulation of pro-inflammatory cytokines was
observed in heterophils isolated from the resistant chickens and their F1 progeny.
24
Similar responses in more resistant lines were observed when birds were
challenged with the Gram-positive bacterium Enterococcus (Swaggerty et al., 2005).
Swaggerty et al. (2008) continued the evaluation of commercial broiler line
immune responses where mRNA expression of pro-inflammatory cytokines and
chemokines from sires and generated progeny were assessed. The RNA from
peripheral blood leukocytes (PBL) was used in quantitative PCR reactions where
expression of IL-1β, IL-6, CXCLi2 and CCLi2 was tested. Gene expression profiles of
pro-inflammatory cytokines and chemokines in leukocytes from high expression
sires led to higher expression of the selected genes in generated progeny. In
addition, the results showed that progeny from sires characterised with low gene
expression had also lower immune performance. The highest values of gene
expression from those birds were much lower compared to the lowest values from
high expression sires progeny. This approach allowed for identification of sires with
higher/lower than average expression of proinflammatory cytokines and
chemokines. The progeny produced from the selected sires carried similar immune
responsiveness without losing the desired growth qualities.
The same lines, parental and F1 reciprocal crosses were challenged with
Campylobacter jejuni and evaluation of cloacal swabs revealed that again, resistant
lines and their sires progeny had significantly fewer C. jejuni colonies. These results
indicated that paternal effects influenced the resistance to bacterial colonisation (Li
et al., 2008c). The continuation of testing commercial lines and their F1 crosses
confirmed that resistant lines and paternal progeny managed to enhance the
responses to coccidial infections accompanied by higher gain weight (Swaggerty et
al., 2011; Swaggerty et al., 2015), proving that the efficient innate responsiveness
guards against not only bacteria but broader range of pathogens, including
parasites. Transcriptome analysis of splenic gene expression in parental lines
challenged with Campylobacter revealed differences in molecular regulations during
infection. Moreover, different defence mechanisms were involved in the
Campylobacter resistant line where genes involved in apoptosis and cytochrome c

25
release from mitochondria were activated compared to susceptible line (Li et al.,
2012).
Schokker et al. (2012) studied immune responses of three commercial broiler
lines after infection of newly hatched birds with S. Enteritidis. The results showed
that different lines differed in their response to systemic spread of bacteria possibly
due to variation in intestinal development. Another study on responses to S.
Enteritidis in broiler, layer and Fayoumi lines showed differences in mRNA gene
expression in the spleen which suggest that divergent genetic lines use different
components of immune responses in the response to Salmonella infection (Coble et
al., 2011). Redmond et al. (2009), obtained similar results with a Fayoumi native line
showing higher expression of selected innate immunity-related genes in heterophils
stimulated with S. Enteritidis. Wang et al., (2014) performed RNA-seq analysis on
lungs from Leghorn and Fayoumi chickens samples and showed the latter to be
more resistant to AIV infection with haemoglobin family genes playing a pivotal
protective role. The studies where immune responses of indigenous Fayoumi
chickens were compared to those of commercial broilers and layers show that
native lines, without genetic selection, may provide biodiversity to improve
breeding programmes for the innate immunity in commercial birds.
Transcriptomics tools for immune gene expression analysis 1.5
Gene expression triggered by infection is a trait that can be measured in both
in vitro and in vivo studies on varied tissues and cells in the organism. This approach
leads to understanding the regulation of genes and pathways during the disease
and the discovery of biomarkers. To study gene expression, transcriptomics
methods need to be applied. The transcriptome comprises the complete set of
transcripts in a cell. Transcriptome profiles in response to biological stimuli, i.e.
pathogen invasion, provide data to interpret functional elements of the genome
and understand disease processes (Wang et al., 2011). The transcription process is
the first step of gene expression. Not every transcript will be translated into
functioning protein, therefore gene expression cannot be interpreted as

26
corresponding protein levels. In chicken studies, where availability of tools and
reagents lags behind the mammalian field, experiments with the use of
transcriptomics methods offer relatively inexpensive way to identify eQTL and
biomarkers for selection.
Microarrays 1.5.1
Microarrays have been used as a genomic tool since 1990 and rapidly
became the platform of choice in transcriptomics studies in model organisms,
including the chicken. The principle is based on comparison of transcript levels
between two samples. Data are generated based on the cDNA reverse transcribed
from the purified mRNA transcriptome of a sample (Murphy, 2002). The cDNA
generated from test and control samples are separately labelled with different
fluorescent dyes and hybridised to an array containing DNA probes for different
genes. The intensity of the fluorescent signal resulting from hybridisation to a
specific probe depends on the amount of hybridised cDNA from a given sample, and
in turn reflects the abundance of the transcript from which it was reverse
transcribed. The differences in the signals from both samples are analysed and
interpreted as differential expression. This technology has been useful in many
aspects of science, including potential biomarkers discovery or drug targets . More
than a dozen microarrays, either cDNA- or oligonucleotide-based have been
developed for chicken gene expression (reviewed in Cogburn et al., 2003).
A commercial microarray for analysis of the chicken transcriptome with 44k
probes (Li et al., 2008a) is available from Agilent (http://www.genomicS.
agilent.com). This new whole genome microarray was designed based on the 2004
chicken (Gallus gallus) v1.0 draft assembly and it has been widely used to measure
mRNA levels. For example, Chiang et al. (2008) used this technique to profile
differential gene expression in heterophils from two genetically distinct lines
infected with Salmonella Enteritidis. It has been recently used to evaluate gene
expression in liver of S. Enteritidis infected broilers (Coble et al., 2013) and in
leukocytes from APEC infected broilers (Sandford et al., 2012). Other chicken arrays

27
were customised for measurement of gene expression in specific cell types (Bliss et
al., 2005) or gene sets (Smith et al., 2006). The global view of gene expression
produced by microarrays can identify candidate genes or pathways that are
associated with differences in phenotype between the test and control systems (or
animal lines) studied. As the probe set on the microarray is set for known cDNA
sequences, this technology does not allow the detection of novel transcripts or
sequence variants (Mortazavi et al., 2008).
RNA sequencing 1.5.2
An alternative to microarrays is the use of next generation sequencing of
cDNA derived by reverse transcription from mRNA (also termed RNA-seq). In this
technique, the RNA population is converted to a library of cDNA fragments with
adaptors attached to one or both ends. After amplification, each molecule is
subjected to massively-parallel sequencing to obtain short sequences of 30-400 bp.
The reads of sequenced fragments are then aligned to a reference genome (Wang
et al., 2009). This identifies the transcripts present, whereas the abundance of the
sequence reads for a specific gene reflect the relative abundance of the transcript in
the sample. The microarray approach is still preeminent for large numbers of
samples in regard of costs, but RNA-seq techniques have the advantage that no
assumptions are made as to which genes are likely to be transcribed. In addition,
RNA-seq is more sensitive due to its massively-parallel ‘deep sequencing’ nature
and it is more accurate because the quantification is based on digital counts of the
sequence reads corresponding to each transcript. RNA-seq is competing to replace
microarrays for analysing the transcriptome in an unbiased and comprehensive
manner (Wang et al., 2011). The ability to measure allele-specific expression (ASE)
in heterozygotes using RNA-seq is advantageous over microarrays technique in
which the same probe set targets both alleles (Sun, 2012). RNA-seq also provides
tools for the discovery of new un-annotated genes of interest (Dodgson et al.,
2011).
28
The advantages of RNA-seq over microarrays have advanced progress of
transcriptomics field producing great amount of data. Since 2008, when RNA-seq
technology became available, more than a thousand research articles on gene
expression were published in the PubMed database, including chicken studies . This
includes published work on necrotic enteritis (NE) and differential gene expression
(DEG) in inbred lines (Truong et al., 2015), AIV infection in Fayoumi and leghorn
lines (Wang et al., 2014), and caecal tissues responses to Campylobacter jejuni
(Connell et al., 2012).
Quantitative polymerase chain reaction (qPCR) 1.5.3
In addition to high-throughput transcriptome analysis tools, quantitative
PCR (qPCR) has been used for more than two decades to quantify transcription of
specific genes. It is a technique where amplification and simultaneous quantification
of targeted DNA molecules is possible. Transcripts are first reverse transcribed to
cDNA, for example using oligo dT targeting polyA tails and random hexamers. The
abundance of cDNAs is assumed to mirror that of template transcripts. Specific
cDNAs can then be detected in PCR reactions using primers that anneal to the
target sequence. Two main approaches exist to detect amplification. The first uses a
labelled nucleotide that is incorporated into the cDNA, thus the amount of labelled
product reflects the abundance of the target transcript. The second uses a probe
that hybridises to the target cDNA between the primer annealing sites and which
has a 5’ fluorophore and 3’ quencher. During PCR with flanking primers, the
fluorophore is removed by the 5’-3’ exonuclease activity of advancing polymerase.
The quencher no longer inhibits fluorescence of the released fluorophore and the
fluorescence intensity proportional to the amount of product made in exponential
phase of PCR (threshold value). Comparison of number of amplification cycles that
reached particular quantification threshold fluorescence signal allows the initial
amounts of cDNA template to be quantified. Therefore, fewer PCR cycles are
needed for the detection if more copies of cDNA molecules are present at the
beginning of the reaction. Compared to previously described transcriptome
platforms, qPCR is useful in studies where gene expression of only a subset of
29
transcripts of interest is evaluated during infection or stimulation. This type of
targeted expression is beneficial when genes involved are known to be responsible
for different outcomes and it has been widely used in chicken immune responses
studies (Kaiser et al., 2006; Abasht et al., 2009; He et al., 2012). QPCR analysis does
not involve complex bioinformatics analysis of the output and is considered straight
forward relative to RNA-seq. After the cautious selection of primers and
optimisation of reaction, qPCR delivers results within hours.
In recent years, emphasis has been placed on selection of reference genes
for qPCR to permit comparison between samples that may differ in composition and
integrity. The lack of consensus in reagents, protocols and analysis methods used
for qPCR, and the high-profile retractions of manuscripts, for example from Science
(Bohlenius et al., 2007), have forced qPCR experts to provide guidelines for authors,
reviewers and editors with specification for the minimum information that must be
included in the manuscript methods. As discussed in Chapter 5, the selection of
reference genes needs to be more stringent and properly normalised before their
use in qPCR reactions (Bustin et al., 2009).
The BioMark System 1.5.4
The BioMark system from Fluidigm is a platform to run multiple qPCR
reactions against multiple RNA samples at once. It relies on microfluidics to perform
qPCR reactions on a nanolitre scale and was made possible by advances in micro-
and nanofabrication. There are four high-throughput qPCR platforms that use
microfluidics currently on the market: the BioMark system, the OpenArray from Life
Technologies, the LightCyclerTM 1536 from Roche and SmartchipTM from
Wafergen, that allow for parallel gene expression analysis. Only the BioMark System
is relevant for this project, therefore other platforms will not be discussed here. The
Dynamic Array Integrated Fluid Controller is a microfluidic chip for the BioMark
system that allows for amplification of single molecule in the microfluidics chip that
consists of matrixes of chambers and valves (Figure 1.3). The dynamic array chip
exists in two formats: 48.48 and 96.96. The 48 (or 96) samples are simultaneously

30
used in qPCR with 48 (or 96) assays which results in 2,304 (or 9,216) reactions from
one run. The use of a dynamic array greatly reduces the volume of reagents and
pipetting and is a reliable and rapid method for high-throughput gene expression
analysis (Spurgeon et al., 2008).
a)
b)
Figure 1.3. Structure of 96.96 Dynamic Array IFC for gene expression. a) 96 assays and 96 samples with qPCR master mix are loaded in different dimensions. The IFC controller mix both samples and assays in 9,216 contained chambers, each with volume of 6,7 nl; b) The mixing of assays and samples is possible with the use of network of control lines and fluid lines that transfer liquids into the reaction chambers where qPCR reaction occurs.
The statistical power of an experiment increases when in a single run greater
number of replicated reactions can be performed (Weaver et al., 2010). Therefore,
from biomarker screening perspective, high-throughput qPCR is beneficial with
additional sensitivity, reproducibility and possible detection of very low abundant
targets.
96 assays 96 samples
9,216 reactions

31
Aims and objectives 1.6
For decades, breeding selection has focused on overall livability and
phenotypic traits, such as weight gain and feed conversion efficiency, rather than
targeting the immune system directly. The widespread use of vaccines and
antibiotics has meant that relatively little emphasis has been placed on selection for
disease resistance. A danger exists that breeding for resistance to particular
pathogen may increase susceptibility to other pathogens. In this context, selection
for birds with elevated innate immune function is desirable given the non-specific
nature of the response. Selection of lines with improved immune robustness could
solve the problems of greater variation of pathogens and emergence of new
resistant strains and reduce the need for antibiotic use.
The overarching hypothesis for this study is that disease resistant birds are
inherently primed to produce a stronger innate immune response, and hence
control invading pathogens better by killing and mounting stronger adaptive
immune response. This hypothesis is supported by previous studies, which showed
that effector cell function and pro-inflammatory gene expression was stronger and
more rapid in resistant lines compared to susceptible lines. I therefore aimed to:
1. Evaluate existing cellular and molecular assays as tools for swift and
accurate determination of immune robustness in the chicken, with emphasis on
analysis of heterophil, macrophage and dendritic cell phenotypes.
2. Generate a list consisting of approximately 100 genes of interest that are
involved in immune responses to a plethora of infections caused by bacteria and
bacterial components, viruses and parasites. The gene list will be created based on
published challenge studies in chicken and mammalian species as well as an RNA-
seq analysis of chicken effector cells (bone marrow-derived dendritic cells (BMDC),
bone marrow-derived macrophages (BMDM) and heterophils) stimulated with
lipopolysaccharide (LPS). For novel genes identified by this approach I aimed to
clone and sequence the genes to aid the design of assays of gene expression.

32
3. Select a platform for gene expression analysis, optimise and validate it
with the use of an Aviagen broiler line housed in low biosecurity, resembling
commercial settings (sibling test farm) and high biosecurity (pedigree farm)
environments. Primers will be designed for selected genes and used in high-
throughput qPCR reactions with tissues and blood RNA as template.
The ultimate goal was to evaluate if peripheral leukocytes isolated from
blood could be used to detect changes in the level of immune robustness between
chickens raised in different environments and within the same farm.
33
Materials and Methods Chapter 2
In silico materials 2.1
Basic Local Alignment Search Tool (BLAST) 2.1.1
Sequences of all cloned DNA fragments ,presented in Chapter 4, were
compared with the chicken genome database (Gallus_gallus-4.0) using BLAST
software. This heuristic algorithm finds similar sequences by locating short matches
between the query and target sequence. This method allows observed and
expected sequences to be compared and can identify single nucleotide changes or
insertion/deletion events (Altschul et al., 1990).
ClustalX 2.1 2.1.2
ClustalX is a general purpose multiple sequence alignment tool for DNA or
proteins. Differences, similarities and identities can be visualised after the best
matches are calculated and lined up for the selected sequences. ClustalX uses
colour coding where the darkest shading indicates highest conservation (Larkin et
al., 2007).
GeneDoc 2.1.3
GeneDoc provides tools for visualising multiple alignments of nucleic acid
sequences. GeneDoc displays sequence alignments with different shading modes,
that depend on the level of conservation between observed and expected
sequences (Nicholas et al., 1997). Both, ClustalX and GeneDoc were used to present
alignments of cloned genes (Appendix 2, electronic file).
Bowtie 1.0.0 2.1.4
Bowtie software was used in RNA-seq analysis pipeline (Appendix 1, Figure
1). Bowtie is an ultrafast short-read aligner that employs a Burrows-Wheeler index
and full-text minute-space (FM) index. Reverse permutation of the characters in
text, as in the Burrows-Wheeler algorithm, is applied in Bowtie to allow large data
of text to be searched efficiently while keeping the memory footprint small. FM
index is the exact-matching algorithm and Bowtie uses two extensions to match the

34
sequencing errors or genetic variations. Bowtie input data can be in FASTQ and
FASTA formats. Bowtie forms the basis for other tools, including TopHat and
Cufflinks (Langmead et al., 2009).
TopHat 2.0.9 2.1.5
TopHat is a script that aligns RNA-Seq reads to a genome in order to identify
exon-exon splice junctions. Bowtie cannot align reads that span introns. TopHat was
created to address this issue of large gaps in alignments. It uses Bowtie as an
alignment tool and breaks up reads into smaller pieces called segments. Many of
these segments align contiguously which results in build-up of an index of splice
junctions (Trapnell et al., 2009).
Cufflinks 2.1.1 2.1.6
Cufflinks uses output data from TopHat to assemble aligned RNA-seq reads
into transcripts. Multiple splice variants may be present for a given gene, therefore
to overcome this issue Cufflinks reports a parsimonious transcriptome assembly of
the data. Only few full-length transcripts fragments (transfrags) are defined by
Cufflinks to sufficiently explain all the splicing event outcomes in the input data. To
derive a likelihood of abundance levels and filter out artificial transfrags Cufflinks
uses a statistical model of paired-end sequencing experiments. The software then
computes the overall likelihood by multiplying these probabilities. The outcome of
properly normalised RNA-seq fragment counts can be used as a measure of relative
abundance of transcripts. Cufflinks uses Fragments per Kilobase of exon per Million
fragments mapped (FPKM) to present expression of each transcript. Cufflinks
contains a program (Cuffcompare) that can support comparison of assembled
transfrags and reference annotation. Cufflinks also includes a script called
Cuffmerge that allows merging of several Cufflinks assemblies. Differential
expression of transcripts can be verified using Cuffdiff 2 that tests the observed log-
fold change in gene expression against the null hypothesis of no change. Cuffdiff 2
predicts how much variance is in the number of reads originating from a gene or
transcript. It is completed in the form of a table that is keyed by the average reads
35
across replicates. The table is queried to retrieve the variance from the number of
reads. By simulating assignment to a locus and to the splice isoforms for that locus,
Cuffdiff 2 accounts for probable errors in gene mapping. At the end of the
estimation procedure, Cuffdiff 2 obtains an estimate of the number of reads that
originated from each gene and transcript, along with variances in those estimates.
The read counts are reported along with FPKM values and their variances. Change in
expression is reported as the log fold change in FPKM, and the FPKM variances
allow the program to estimate the variance in the log-fold-change itself. Genes with
highly variable expression will have highly variable log-fold change between two
conditions (Trapnell et al., 2010).
BestKeeper software 2.1.7
BestKeeper is an Excel-based programme that is used to compare expression
levels of reference genes and target genes in up to one hundred biological samples.
BestKeeper input data is in form of raw Cq values which are plotted in an Excel
table. Pairwise correlation analysis and the geometric mean determine the ‘optimal’
reference genes (Pfaffl et al., 2004). The BestKeeper software was used in Chapter 5
to select most stable gene.
NormFinder 2.1.8
NormFinder is an algorithm for identifying the optimal reference gene
among a set of candidates. It ranks a set of genes according to their expression
stability in a given sample. The software uses a model-based approach of gene
expression and statistical framework to estimate variation in overall expression and
variations between subgroups. NormFinder automatically calculates the stability
value for all candidate genes (Andersen et al., 2004). The Normfinder software was
used in Chapter 5 to select most stable genes.
geNorm 2.1.9
GeNorm is an algorithm that determine the most stable reference genes
from a set of tested candidate genes in a given sample panel. A gene expression

36
normalisation factor can be calculated for each sample based on the geometric
mean of a user–defined number of reference genes. Pairwise variation of each gene
is determined as standard deviation of the logarithmically transformed expression
ratios. An M value is calculated for a particular gene as the arithmetic mean of
pairwise variation with all other genes in the same panel. Genes that are stably
expressed are characterised by the lowest M value. Stepwise exclusion of the least
stable genes results in combination of two constitutively expressed reference genes
(Vandesompele et al., 2001). The geNorm software was used in Chapter 5 to select
most stable genes.
Molecular cloning 2.2
E. coli JM109 competent cells 2.2.1
E. coli JM109 strain {endA1, recA1, gyrA96, thi, hsdR17 (rk–, mk+), relA1,
supE44, Δ(lac-proAB), [F´, traD36, proAB, lacIqZΔM15]} has a mutation in the recA
gene to improve plasmid stability and reduce scope for unwanted recombination
events. The JM109 strain also carries the endA1 mutation that inactivates a
nuclease that might co-purify with plasmids. This mutation allows purification of
higher quality plasmids. JM109 bacterial cells are classified as an E. coli K strain
based on the presence of the restriction and modification system that functions
around EcoK I. JM109 cells carry the hsdR17 (rκ-, mκ+) mutation that inactivates the
EcoK I restriction enzyme but leaves the methylase intact. Therefore, this strain
does not degrade plasmid DNA isolated from K strains but does methylate it.
pGEM-T Easy 2.2.2
pGEM-T Easy is a 3015 bp linear vector used for cloning of PCR products
(Figure 2.1). The plasmid contains a single thymidine extension at the 3’-ends that
are complementary to the non-template-derived 3’-adenosine residues that are
added to double-stranded DNA products by Taq DNA polymerase. The 3’-end
thymidine also prevents the vector from recircularisation during ligation. This high-
copy-number vector contains T7 and SP6 RNA polymerase promoters flanking a
multiple cloning site located within a truncated lacZ gene that encodes the α-

37
peptide coding region of the enzyme β-galactosidase. The host E. coli strain carries a
partial lacZ deletion (lacZΔM15) which encodes the ω-peptide. Neither, α- or ω-
peptide is functional by itself. Transformation of plasmid containing lacZ α sequence
into the lacZΔM15 cells causes the formation of functional β-galactosidase enzyme.
A molecular mimic of allolactose - Isopropyl β-D-1-thiogalactopyranoside (IPTG) is
added to the agar to induce the lac promoter that drives α-peptide synthesis. The
presence of a functional β-galactosidase is detected by galactose linked to a
substitute indole, called X-gal (5-bromo-4-chloro-3-indolyl-β-D-galactopyranoside)
added to the agar. X-gal is cleaved by β-galactosidase to formo 5-bromo-4-chloro-
indoxyl, that spontaneously forms the insoluble pigment 5,5’-dibromo-4,4’-dichloro-
indigo resulting in blue colour in cells containing functional enzyme. The process of
rescuing function of β-galactosidase by the α-peptide, called α-complementation, is
used in the blue/white screening method. White colour of JM109 colonies
transformed by pGEM-T recombinants indicate that formation of an active β-
galactosidase was disrupted by the insertion of a gene of interest into lacZα.
Figure 2.1. Map of pGEM-T EASY vector

38
Cell cultures 2.3
Resurrection and passage of COS-7 cells. 2.3.1
COS-7 cells were used to produce of recombinant chicken proteins, which
were used to generate bone marrow-derived cells, as presented in Chapter 3. COS-7
[CV-1 (simian) in Origin, carrying the SV40 genetic material] is a fibroblast-like cell
line derived from African Green Monkey Cercopithecus aethiops. COS-7 cells were
removed from liquid nitrogen storage and defrosted in a water-bath at 37°C.
Dulbecco’s Modified Eagle’s Medium (DMEM) supplemented with 10% (v/v) heat-
inactivated foetal calf serum (FCS), 200 mM L-glutamine, 100X non-essential amino
acids, 1 U/ml of penicillin and 1 µg/ml of streptomycin was used to resuspend the
cells. After washing and pelleting cells at 1,200 x g for 5 min the supernatant was
discarded, cells resuspended in 15 ml of complete DMEM in 75 cm2 culture flask
(Thermo Scientific) and incubated at 37°C, 5% CO2. After 72 hours, cells were 70-
80% confluent and ready to passage. The cell layer was washed twice with pre-
warmed phosphate-buffered saline (PBS). To lift the cells from the flask 5 ml of PBS
containing 10% (w/w) trypsin/versene solution was then added. After 5 min in 5%
CO2, at 37°C the flask was tapped several times to detach any remaining cells from
the surface and complete DMEM was added to quench the trypsin enzymatic
activity. The cell suspension was pelleted at 1,200 x g for 5 min in a 30 ml Universal
container. The supernatant was removed and cell pellet resuspended in 10 ml of
complete DMEM. Cell number was determined using a haemocytometer and trypan
blue, for exclusion of dead cells. Cells were seeded at 7.5 x 10⁵ cells/ml in 75 cm2
culture flasks. All cell culture reagents were sourced from Sigma-Aldrich Ltd (Dorset,
UK).
Transfecting cells with plasmid DNA 2.4
DEAE-dextran transient transfection method for COS-7 cells 2.4.1
Transfection mediated by diethylaminoethyl (DEAE)-dextran works very
efficiently with the COS-7 cell line. Negatively charged plasmid DNA complexes with
positively charged DEAE-dextran to create aggregates, which then bind to
negatively charged surface structures on cell membranes and uptake via
39
endocytosis occurs. Addition of chloroquine prevents endosome acidification and
inhibits lysosomal degradation of the DNA.
COS-7 cells were passaged and seeded in complete DMEM media at 2 x 10⁶
cells/ml in 25 cm2 flasks. After twenty-four hours DMEM media were replaced by
serum-free media containing chloroquine (0.1 μM), plasmid DNA (37.5 μg), DEAE-
dextran (30 µg/ml) and cultures were incubated for 3.5 hours at 37°C, 5% CO2. After
incubation, cells were treated with dimethyl sulphoxide (DMSO) (10% (v/v) in PBS)
for 2 min to enhance uptake of adsorbed plasmid DNA by increasing the
permeability of cell membranes. DMSO solution was replaced with complete DMEM
media and cells were incubated for further a 24 hours at 37°C, 5% CO2. Complete
media was replaced with serum-free media and recombinant protein-containing
supernatant was harvested after 72 hours. To remove any cell debris the
supernatant was centrifuged at 1,200 x g and then stored at 4°C until needed.
Production of recombinant chicken IL-4, GM-CSF and CSF-1 2.4.2
Recombinant chicken IL-4, GM-CSF (CSF-2) and CSF-1 proteins were produced
in the COS-7 transient expression system described in section 2.4.1 for generation
of bone marrow-derived dendritic cells and macrophages. Plasmids containing CSF-
1, IL-4 and GM-CSF inserts were available in E. coli strains as glycerol stocks. To
reach a single colony bacterial glycerol stocks were streaked out on LB agar plates
containing 100 μg/ml of ampicillin (LBAMP100) and incubated overnight in 37°C. Single
colonies were placed in 5 ml of LBAMP100 Broth and incubated at 37°C, 200 rpm for
24 hours. LBAMP100 Broth, in volume of 250 ml, was used to subculture bacteria (2.5
ml) for an additional 18 hours in 37°C, 200 rpm. Bacterial suspensions were
centrifuged at 3,000 x g for 30 min and pellets were used in a modified plasmid
extraction protocol (EndoFree Plasmid Maxi Prep, Qiagen; section 2.8.2).

40
Primary cell experiments 2.5
Generation of bone marrow-derived dendritic cells (BMDC) and 2.5.1bone marrow-derived macrophages (BMDM)
All the animals used in the work reported in this thesis were handled and
killed in accordance with the Animals (Scientific Procedures) Act 1986. The chickens
used in the following experiments were Brown Leghorn-J line birds housed by the
National Avian Research Facility at The Roslin Institute.
Immediately after death by cervical dislocation, both femurs and tibias were
removed aseptically from 4-6 week old birds and placed in phosphate-buffered
saline (PBS) on ice until further use. Using sterile scissors both ends of each bone
were cut off. Bone marrow was flushed from the bone using a 0.8 x 40 mm
diameter needle (21G x 1.5 Terumo) and syringe with 10 ml of PBS. Cells
suspensions were passaged through 70 μm nylon mesh strainers (Fisher Scientific)
into 50 ml Falcon tubes. Cells were pelleted at 500 x g for 10 min at room
temperature and resuspended in 10 ml of PBS. Histopaque 1.077 was used to
separate mononuclear cells (MNCs) by underlying the bone marrow cell suspension
and centrifugation at 1,200 x g for 20 min with the brake switched off. The enriched
MNC fraction between the plasma and Histopaque layers was carefully removed by
aspiration with a Pasteur pipette and placed in 30 ml Universal tube. Cell
suspensions were washed in PBS by centrifugation at 500 x g for 10 min at 4°C. Cell
pellets were resuspended in 10 ml of pre-warmed Roswell Park Memorial Institute
(RPMI) 1640 medium. Cell viability was assessed by Trypan blue staining and live
cells were counted and adjusted to 1 x 10⁶ cells/ml concentration in RPMI medium
supplemented with 10% (v/v) chicken serum (CS) (in BMDC cultures) or 2% (v/v) CS
+ 3% (v/v) foetal calf serum (FCS) (in BMDM), 200 mM L-glutamine, 1U/ml of
penicillin and 1 μg/ml of streptomycin. To culture BMDC, cells were placed in 6-well
plates (Thermo Scientific) in a volume of 3 ml with appropriate dilutions of
recombinant chIL-4 and (1/20) GM-CSF (1/20) (exCOS-7) and incubated at 41°C, 5%
CO2. After two and four days of culture 75% of the medium was replaced with fresh
complete RPMI with addition of chIL-4 and chGM-CSF. To culture BMDM cells

41
concentration was adjusted 1.5 x 10⁷/ml in 15 ml complete media with appropriate
CSF-1 dilutions, placed in square Petri dish and incubated at 41°C, 5% CO2. For
BMDM culture in 6-well plates, the same concentrations were used as for BMDC.
Complete medium with cytokines was replaced at day four of culture.
Optimising LPS concentrations for stimulating BMDC and BMDM 2.5.2
Primary bone marrow cell cultures were used to determine the
concentration of lipopolysaccharide (LPS) (Escherichia coli 055:B5, Sigma Aldrich) to
induce maturation of antigen-presenting cells (APCs). BMDC and BMDM were
cultured in 6-well plates, as described in section 2.5.1. Stimulation of cells was
performed on day 6 of culture with various amounts of LPS: 20, 200 and 250 ng/ml
LPS (20 min, 1 h and 4 h) for BMDM or 20 ng/ml and 200 ng/ml LPS (4 h and 24 h)
for BMDC. Cells were removed from wells by pipetting and pelleted for 5 min at 500
x g. RLT buffer from RNeasy Mini Kit (QIAGEN) was used to lyse the cells. The lysate
was stored at - 20°C until use. Total RNA was purified from each sample following
the manufacturer’s protocol as described in section 2.6.1. The amount of LPS used
in stimulation of heterophils was previously optimised (Farnell et al., 2003) and
10 μg/ml for 1 h was used. LPS stimulated bone marrow-derived cells were used in
Chapter 3 (evaluation of cellular methods) and in Chapter 4 (RNA-seq).
Isolation of heterophils from chicken blood 2.5.3
Peripheral blood was collected by cervical dislocation and decapitation of
day-old chickens from Hy-Line W36, Aviagen broilers or RI-J line into Spray-coated
K2 ethylenediaminetetraacetic acid (EDTA) tubes (BD Diagnostics, USA). The blood
from Novogen breed was collected from embryos at day 20 into Universal tubes
containing 5 mM EDTA. Blood from approximately 100 chickens was pooled and
mixed 1:1 with 1% (w/v) methylcellulose (Sigma Aldrich, Poole, UK), prepared in
RPMI medium. The mix was centrifuged at 25 x g for 15 min at 4°C. The supernatant
was carefully removed to a fresh 50 ml Falcon tube. Ca2+- and Mg2+-free Hanks
balanced salt solution (HBSS, Sigma Aldrich) was added to the supernatant to a final
volume of 50 ml. A discontinuous Histopaque gradient (Sigma Aldrich, specific

42
gravity 1.077/1.119) was prepared by adding 10 ml of Histopaque 1.077 to a Falcon
tube and carefully under layering 15 ml of Histopaque 1.119. The supernatant (25
ml) was then layered over the gradient solution and centrifuged at 250 x g for 1 h at
room temperature. The mononuclear cells appeared between the plasma and
gradient phases, whereas heterophils were suspended in the 1.119 gradient phase.
Heterophils were collected into a new tube and mixed with RPMI to dilute the cell
solution and centrifuged at 425 x g for 15 min at 4°C. The cell pellet was then
resuspended in RPMI. Cells were counted, diluted to the desired concentration and
stored on ice before use. The RNA isolated from heterophils (Novogen, Aviagen, RI-J
lines) was used in RT-qPCR reactions, as described in Chapter 3. In addition, RI-J
heterophils RNA was used in RNA-seq analysis, as described in Chapter 4.
Isolation of peripheral leukocytes from chicken blood 2.5.4
Blood was collected from three-week-old male Aviagen broilers into tubes
containing 5 mM EDTA. Peripheral blood leukocytes were separated from 1 ml of
whole blood sample and red blood cells removed, as described above in section
1.5.3. PBS was combined with blood to a total volume of 4 ml. A Histopaque
1.077/1.119 (Sigma Aldrich, Dorset, UK) discontinuous gradient was prepared by
underlying 4 ml of Histopaque 1.077 with 4 ml of Histopaque 1.119 in 15 ml Falcon
tube and overlying 4 ml of blood/PBS mixture. The gradient mixture was centrifuged
at 700 x g with brakes off for 30 min at room temperature. Cells were removed
from plasma/1.077 Histopaque interface (mononuclear cells) and from the
1.077/1.119 Histopaque interface (heterophils). Cells were combined and washed
twice with an equal volume of PBS by centrifugation at 600 x g for 10 min at room
temperature. Cells were counted and 107 cells/ml was pelleted and lysed with
buffer RLT with β-mercaptoethanol for further total RNA extraction. The RNA from
PBL was used in optimisation of 96.96 Dynamic Array, as decribed in Chapter 6.
Phagocytosis assay 2.5.5
Live Salmonella Enteritidis (SE, #97-11771 strain; 107 cells/ml) was
suspended in normal chicken serum (CS) and opsonised for 30 min at 39°C on a

43
rotary shaker. Bacterial suspension was washed twice with Ca2+, Mg2+ - free HBSS
and stored in 4°C until used. Heterophils from W36 Hy-Line were diluted to 5 x 10⁶
cells/ml. A combination of 2 ml of heterophils and 2 ml of SE was centrifuged in
sterile conical tubes for 15 min at 1,500 x g at 4˚C. Heterophils with the SE
suspension were then incubated at 39˚C, 5% CO2 for 1 h. The sample was
submerged in an ice bath for 15 min to stop phagocytosis. Cells were washed with
ice-cold RPMI and centrifuged for 15 min at 1,500 x g, 4˚C. The pellet was
resuspended in 2 ml ice-cold gentamicin (100 μg/ml) and diluted in RPMI without
phenol red. Cells were incubated for 1 h at 37˚C to kill extracellular bacteria and
then centrifuged at 1,500 x g for 15 min, at 4˚C. The pellet was washed three times
in ice-cold RPMI, for 15 min at 1,500 x g. Phagocytosis of SE by heterophils was
evaluated microscopically. For each treatment group, five cytospin slides were
prepared using 200 μl of cell suspension. Results were recorded as the phagocytosis
index: PI = (number of heterophils that contain bacteria x the average number of
bacteria per ingesting heterophil) x 100. Results are presented in Chapter 3.
Oxidative burst 2.5.6
Production of reactive oxygen species (ROS) by chicken heterophils during
oxidative burst was measured by oxidation of 2’7’ dichlorofluorescein-diacetate
(DCFH-DA) to fluorescent DCF. Chicken heterophils isolated from W36 Hy-Line (900
μl; 1 x 10⁷ cells/ml) were incubated with Salmonella Enteritidis (#97-11771 strain)
(90 μl; 1 x 10⁸ cfu/ml) and DCFH-DA (10 μg/ml) for 1 h at 37˚C. Phorbol A-myristate
13-acetate (PMA) (2 μg/ml), a well-known agonist that activates protein kinase C
(PKC) was used as a positive control. Aliquots of cell cultures (150 μl) were placed in
a black 96-well CoStar flat-bottomed plate and the relative fluorescent units (RFUs)
were measured at excitation wavelength 485 nm and emission wavelength 530 nm
using a GENios Plus Fluorescence Microplate Reader (TECAN US Inc, Research
Triangle Park, NC). Results are presented in Chapter 3.

44
Degranulation assay 2.5.7
Degranulation was monitored by quantifying the levels of β-D-glucuronidase
in culture medium following stimulation of heterophils with opsonised Salmonella
Enteritidis (1 x 10⁸ cfu/ml). The heterophils from W36 Hy-Line were adjusted to 1 x
107 cells/ml and incubated with stimulants for 1 h, at 39˚C in a 5% CO2 incubator.
The reaction was stopped by transferring the tubes containing the cells to an ice
bath for 5-10 min. Cell suspensions were then centrifuged for 10 min at 250 x g, at
4˚C. The supernatants were removed from each sample and used for the assay.
Each sample (25 μl) was added to non-treated, black CoStar flat-bottomed ELISA
plate and incubated with 50 μl of freshly prepared substrate buffer (10 mM 4-
methylumbelliferyl-β-D-glucoronide, 0.1% Triton X-100 in 0.1 M sodium acetate
buffer) for 4 h at 41˚C. The reaction was stopped by adding 200 μl of stop solution
(0.05 M glycine and 5 mM EDTA; pH 10.4). Liberated 4-methylumbelliferone was
measured fluorimetrically (excitation wavelength of 355 nm, emission wavelength
of 460 nm) with a GENios Plus Fluorescence Microplate Reader (TECAN US Inc,
Research Triangle Park, NC). Results are presented in Chapter 3.
Purification of nucleic acids 2.6
Purifying total RNA from chicken cells 2.6.1
Total RNA from cells (BMDC, BMDM, PBL, heterophils) was extracted using
the Qiagen RNeasy Mini Kit following the manufacturer’s instructions. The cell
lysate was mixed by pipetting with one volume of 70% (v/v) ethanol. The mix was
placed in an RNeasy spin column housed in 2 ml collection tube and centrifuged for
15 s at 8,000 x g. The flow-through was discarded and 700 μl of RW1 buffer was
used once to wash RNA bound to the silica membrane for 15 s at 8,000 x g and RPE
buffer, diluted in absolute ethanol, was used twice (15 s and 2 min) at 8,000 x g.
After washing steps, the RNeasy column was placed in a new collection tube and
centrifuged at 16,000 x g for 1 min to remove any RPE buffer residues. Columns
were moved to 1.5 ml collection tubes, 30 μl of RNase-free water was placed onto
the membranes and centrifuged for 1 min at 8,000 x g. The eluate was re-applied to
the silica membrane and centrifugation repeated in order to increase the RNA yield.

45
Purifying total RNA from chicken tissues 2.6.2
Total RNA from chicken tissues (spleen, bursa, caecal tonsils, and ileum), for
experiments in Chapter 5 and Chapter 6, was extracted using an RNeasy Mini Kit
(Qiagen) according to manufacturer’s instructions. Tissues were stored in RNA later
(Ambion) solution at 4°C. Stabilised tissues were removed from the reagent using
sterile forceps. No more than 30 mg of tissues was used for RNA extraction.
FastPrepTM Lysing Matrix tubes containing ~30 mg of tissues were filled with 600 μl
of RLT buffer. To disrupt and homogenize tissues the FastPrep® FP120 Cell Disrupter
was used. Each sample was homogenized for 45 sec at speed of 6.5 m/sec. The
lysate was centrifuged for 3 min at 16,000 x g to remove any remaining insoluble
material. Cleared lysate was mixed by pipetting with 1 volume of 70% (v/v) ethanol.
The mix was placed in an RNeasy spin column placed in a 2 ml collection tube and
centrifuged for 15 sec at 8,000 x g. The flow-through was discarded and 350 μl of
RW1 buffer was used once to wash RNA bound to the silica membrane for 15 sec at
8,000 x g. DNase I stock solution was prepared by dissolving the lyophilised DNase I
(1500 Kunitz units) in 550 μl of RNase-free water. The DNase I stock solution (10 μl)
was mixed with buffer RDD (70 μl) and 80 μl of the mix was placed directly onto the
column for 15 min at room temperature. After the incubation, an additional 350 μl
of buffer RW1 was added and the column was centrifuged for 15 sec at 8,000 x g.
RPE buffer, diluted in absolute ethanol, was used twice (15 sec and 2 min) at 8,000 x
g. After washing steps, the RNeasy column was placed in a new collection tube and
centrifuged at 16,000 x g for 1 min to remove any RPE buffer residues. Columns
were moved to 1.5 collection tubes, 30 μl of RNase-free water was placed onto the
membranes and centrifuged for 1 min at 8,000 x g. The eluate was re-applied to the
silica membrane and centrifugation repeated in order to increase the RNA yield.
DNA and RNA amplification 2.7
Oligonucleotide primer design 2.7.1
Oligonucleotides for cDNA amplification were designed based on predicted
sequences available from Ensembl (ensembl.org) or NCBI
(http://www.ncbi.nlm.nih.gov/gene) databases. The design of primers for cloning of
46
full length sequences of target gene (Chapter 4) was performed manually by
comparing candidate oligonucleotides melting temperatures and GC content in
OligoAnalyzer 3.1 online tool
(http://eu.idtdna.com/analyzer/applications/oligoanalyzer/default.aspx).
First-strand reverse transcription using SuperScript III 2.7.2
Complementary DNA (cDNA) was used as a template in gene cloning
experiments (Chapter 4). Various mRNA samples were used to generate cDNA
panels using SuperScript III (Invitrogen) following the manufacturer’s instructions.
First strand cDNA synthesis required mixing 10 pg - 5 μg total RNA, 1 μl of
oligo(dT)20 (50 μM) and 1 μl of 10 mM dNTP Mix with 10 μl of sterile, distilled water.
The mixture was incubated at 65°C for 5 min and then placed on ice for 1 min. Next,
4 μl of 4X First-Strand Buffer, 1 μl of dithiothreitol (DTT) reducing agent, 1 μl of
RNaseOUT (Promega) and 1 μl of SuperScript III reverse transcriptase were added.
The final mixture was incubated at 50°C for 60 min. The reverse transcription
reaction was inactivated by heating to 70°C for 15 min. Complementary DNA was
ready to use and could be stored at -20°C.
To synthesise template cDNA for qPCR with EvaGreen fluorescent dye for
experiments presented in Chapter 5 and Chapter 6, random primers (250 ng) were
used instead of oligo(dT)20 which modified the second part of reaction. Additional 5
min incubation at 25°C was performed before temperature increased to 55°C for 60
min for the reverse transcription phase. Inactivation of enzymatic reaction was the
same.
First strand reverse transcription using High Capacity Reverse 2.7.3Transcription Kit
The High Capacity Reverse Transcription Kit was used to generate cDNA for
experiments described in Chapter 6. The reverse transcription kit (Applied
Biosystems) contains reagents that when combined form a 2X reverse transcription
(RT) master mix (Table 2.1).

47
Table 2.1 High Capacity Reverse Transcription Master Mix components
Component Volume [μl]
10X RT Buffer 1
25X dNTP Mix (100 mM) 0.4 10X RT Random Primers 1 MultiScribe™ Reverse Transcriptase 0.5 RNase Inhibitor 0.5 Nuclease-free water 1.6 Total 5
The RNA sample was diluted to a concentration of 100 ng/μl and 5 μl of RNA was
mixed with 5 μl of master mix. The sample was centrifuged briefly and placed in a
thermocycler with set temperatures as follows: 25°C for 10 min, 37°C for 120 min
and 85°C for 5 min. Complementary DNA (cDNA) was stored at -20°C until further
use.
DNA amplification by PCR 2.7.4
Candidate gene cDNA sequences predicted to reflect transcripts were
collected from both Ensembl and NCBI databases. Primers were designed using full -
length and/or common regions if there were differences in the predicted sequences
between databases or transcripts. Gene list with transcripts accession numbers
used to design primers is presented in Appendix 1, Table 4. If needed, more than
one primer pair was designed and tested. For longer cDNAs, partial sequences were
used to design primers. To clone full or partial sequences, a panel of c DNA was
generated by reverse transcription PCR (RT-PCR) of separate RNA samples isolated
from caecal tonsils and spleen from a Campylobacter trial, bursa from an infectious
bursal disease virus (IBDV) trial, spleen from IBDV and Marek’s disease virus (MDV)
trial, HD11 cells stimulated with LPS, heterophils stimulated with Salmonella
enterica serovar Enteritidis, or BMDM, BMDC and heterophils stimulated with LPS.
Polymerase chain reactions were performed in 20 μl and 50 μl volumes. For each
reaction, the following components were added: 1X PCR buffer (-Mg), 0.2 mM of
each dNTP, 1.5 mM of MgCl2, 0.5 μM of primers, 1U of Taq DNA Polymerase and
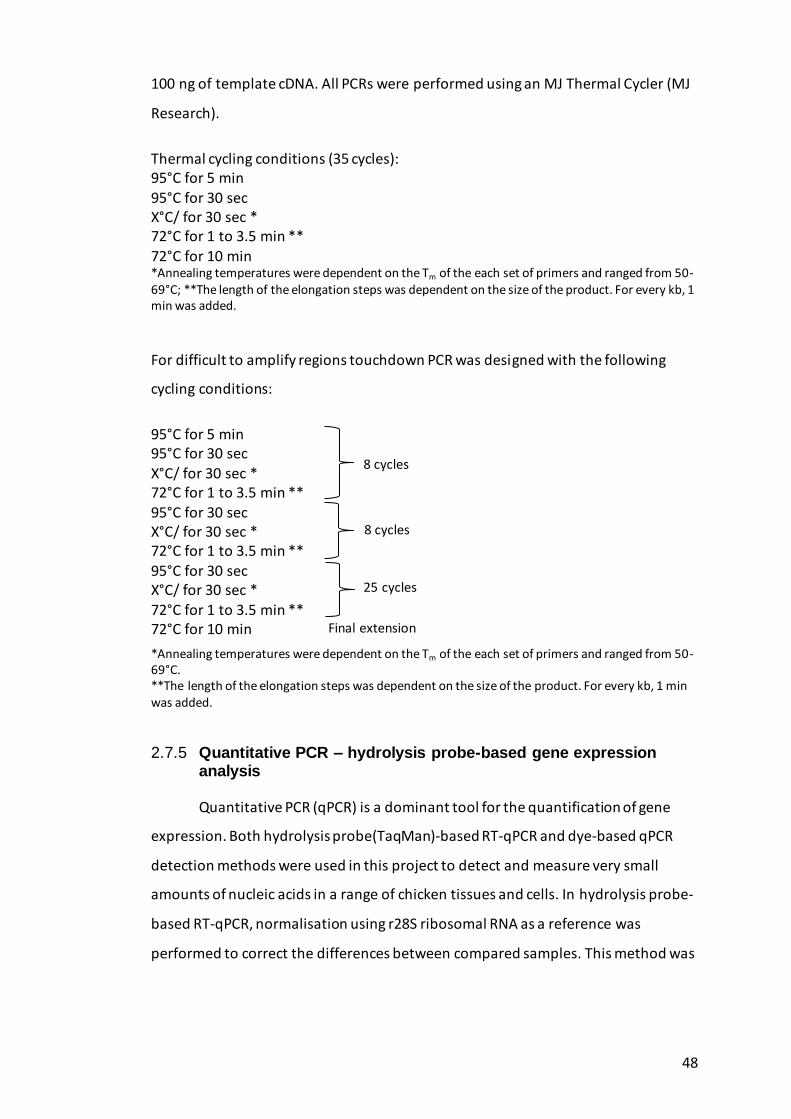
48
100 ng of template cDNA. All PCRs were performed using an MJ Thermal Cycler (MJ
Research).
Thermal cycling conditions (35 cycles): 95°C for 5 min 95°C for 30 sec X°C/ for 30 sec * 72°C for 1 to 3.5 min **
72°C for 10 min *Annealing temperatures were dependent on the Tm of the each set of primers and ranged from 50-69°C; **The length of the elongation steps was dependent on the size of the product. For every kb, 1 min was added.
For difficult to amplify regions touchdown PCR was designed with the following
cycling conditions:
95°C for 5 min 95°C for 30 sec X°C/ for 30 sec * 72°C for 1 to 3.5 min **
95°C for 30 sec X°C/ for 30 sec * 72°C for 1 to 3.5 min **
95°C for 30 sec X°C/ for 30 sec * 72°C for 1 to 3.5 min **
72°C for 10 min Final extension
*Annealing temperatures were dependent on the Tm of the each set of primers and ranged from 50-69°C. **The length of the elongation steps was dependent on the size of the product. For every kb, 1 min was added.
Quantitative PCR – hydrolysis probe-based gene expression 2.7.5analysis
Quantitative PCR (qPCR) is a dominant tool for the quantification of gene
expression. Both hydrolysis probe(TaqMan)-based RT-qPCR and dye-based qPCR
detection methods were used in this project to detect and measure very small
amounts of nucleic acids in a range of chicken tissues and cells. In hydrolysis probe-
based RT-qPCR, normalisation using r28S ribosomal RNA as a reference was
performed to correct the differences between compared samples. This method was
8 cycles
8 cycles
25 cycles
49
used in Chapter 3. For each gene, a primer pair and hydrolysis probe were designed
based on the template target gene sequence using Primer Express software
(Applied Biosystems). Primers were synthesised by Sigma Aldrich (Poole, UK) and
probes by Eurogentec (Southampton, UK). The 5’ end of each probe was labelled
with 5-carboxyfluorescein (FAM) fluorophore and the 3’ end with
tetramethylrhodamine (TAMRA) quencher dye.
Primer design was performed with consideration of general guidelines. The
melting temperature of all primers was set between 58°C and 60°C, with probes
being 10°C higher. Both probes and primers default length was no longer than 30
nucleotides and GC content in the range of 30-80% where amplicon length did not
exceed 150 bp. The last five nucleotides at the 3’ end of each primer consisted of ≤
3 guanines or cytosines and preferably no triplicates of the same base. At least one
of the primers or the probe overlapped a predicted intron-exon boundary to
increase specificity of reaction.
The 5’-3’ exonuclease activity of Taq DNA polymerase is the driving force
behind the RT-qPCR method. During the RT-qPCR the probe anneals to the target
template. Fluorescence from the FAM moiety is quenched by the nearby TAMRA
moiety at this stage. If Taq polymerase extends the 3’ end of primer annealed to the
template it encounters the FAM fluorophore at the 5’ end of the probe uses its 5’-3’
exonuclease activity to displace the 5’ end and degrade the probe. Separation of the
fluorophore and quencher at this stage results in emission of fluorescence. The
temperature of probe hybridisation is usually set at 8-10°C above the melting point
of the primers to ensure attachment to the template and extension is performed at
a lower temperature than normal for PCR to guarantee maximum 5’-3’ exonuclease
activity of the enzyme. These reaction conditions reduce Taq polymerase
processivity, hence to ensure maximum efficiency short amplicons are designed.
The number of cycles at which the fluorescence levels of the probe passes the
background of detection is called quantification cycle (Cq) and this value is used to
present the raw data. The set of primers used in RT-qPCR were previously
50
optimised: r28S rRNA, IL-1β, IL-6 (Kaiser et al., 2000); IL-18 (Kaiser et al., 2003);
CXCLi1 and CXCLi2 (Kogut et al., 2005). All RT-qPCR reactions were performed using
TaqMan FAST Universal PCR Master Mix and One-step RT-PCR MultiScribe (Applied
Biosystems). For each sample 10 μl reaction mix consisting of 5 μl 2X Fast Master
Mix, 0.5 μl of primer mix, 0.25 μl (125 nM) of probe, 0.25 μl 40X MultiScribe
enzyme, 1.5 μl of DEPC treated-H2O and 2.5 μl of diluted RNA. RNA samples were
diluted 1:500 for r28S rRNA analysis and 1:5 for target gene detection. All assays
were performed in triplicate wells. For standard curve and slope analysis in r28S
rRNA assay RNA from HD11 cells stimulated with LPS (200 ng/ml for 6 h) was used.
In IL-1β, IL-6, IL-18, CXCLi2, RNA derived from transfected COS-7 cells was used. The
Applied Biosystems 7500 Fast Real-Time PCR System was used to amplify and detect
products. The thermal cycles were set for reverse transcription steps: 48°C for 30
min, 95°C for 20 sec followed by PCR steps: 95°C for 3 sec, 60°C for 30 sec repeated
for 40 cycles. Primer and probe sequences and concentrations for all target genes
tested are given in Appendix 1, Table 2. To calculate levels of expression for all
target genes standard curves were created using Cq values of the serially diluted
standard RNA for specific gene. The slope of the standard curve (y = mx + c) was
used to determine efficiency of the reaction using formula E = (10(-1/slope)). To correct
for differences between RNA levels in samples within the experiment, the
difference factor was calculated by dividing the mean Cq value for r28S rRNA
specific product from the same sample. Normalised Cq values were calculated using
the formula Cq + (N’t – C’q) * S/S’, where N’t is the mean Cq for r28S rRNA among
all samples, C’q is the mean Cq for r28S rRNA in the sample and S and S’ are the
slopes of the regressions of the standard plots for the cytokine/chemokine mRNA
and the r28S rRNA, respectively. Results are expressed as fold-difference from levels
in control samples.
Fluorescent dye-based qPCR 2.7.6
EvaGreen dye is a green fluorescent nucleic acid dye used in several
applications including qPCR. Excitation and emission spectra of EvaGreen are very
close to those of fluorescein (FAM) or SYBRGreen I, therefore EvaGreen is already

51
compatible with instruments equipped with visible light excitation with wavelengths
in that region. The dye is nonfluorescent by itself, but becomes highly fluorescent
upon binding to DNA. Compared to SYBRGreen, EvaGreen dye is non-mutagenic and
non-toxic as it is impermeable to cell membranes. It is also less inhibitory towards
qPCR and less likely to cause nonspecific amplification. Similarly to SYBRGreen,
EvaGreen binds to double stranded DNA (dsDNA). With every PCR cycle the amount
of dsDNA increases which results in fluorescence intensity. The Applied Biosystems
7500 Fast Real-Time PCR System was used to amplify and detect products. The
reaction mix was prepared using the following components for each of the samples:
10 μl ABI TaqMan Gene Expression Master Mix (Applied Biosystems), 1 μl 20X
EvaGreen (Biotum, VWR-Bie & Berntsen), 2.3 μl 20 μM specific primer pair (forward
and reverse) and 4.7 μl nuclease-free water. Each reaction contained 2 μl of cDNA
diluted 1:5 in nuclease-free water. The following cycle parameters were used: 2 min
at 50°C, 10 min at 95°C, followed by 40 or 30 cycles with denaturing for 15 sec at
95°C and by annealing/elongation for 1 min at 60°C. Melting curves were generated
after each run to confirm a single PCR product (from 60°C to 95°C, increasing 1°C/3
sec). The EvaGreen-based qPCR was used in reference gene normalisation
experiments (Chapter 5) and in 96.96 Dynamic Array optimisation in Chapter 6,
following the sample and assay mix preparation protocols as described in section
2.10.6.
Agarose gel electrophoresis 2.7.7
To determine presence and size of DNA in PCR and qPCR, agarose gel
electrophoresis was performed. Agarose gels were prepared by mixing agarose
powder at a (w/v)%, which was dependent on the size of expected PCR product,
with 1X Tris Acetate-EDTA (TAE) buffer. TAE is a mixture of
tris(hydroxymethyl)aminomethane (tris base), glacial acetic acid and EDTA, that
works to sequester divalent cations. Compared to TBE buffer, TAE is less stable but
double-stranded DNA runs faster through agarose dissolved in TAE buffer. The mix
was heated until the agarose powder dissolved completely. An intercalating dye,
SYBR Safe® (Invitrogen), was added to the gel solution in order to visualise any DNA

52
molecules amplified by PCR. The molten agarose was poured into a plastic tray with
appropriate comb sizes inserted.
Gel extraction 2.7.8
Agarose gel electrophoresis was used to detect and visualise products of
PCRs. To extract products a QIAquick Gel Extraction Kit (QIAGEN) was used
according to the manufacturer’s instructions, as follows. Agarose gel containing
amplified DNA of interest was excised with a clean, sharp scalpel on a UV
transilluminator. The gel slice was weighted in a 1.5 ml Eppendorf tube. QG buffer
was added at 3 times the volume of the excised gel fragment (300 μl; QG buffer/100
mg of gel) and incubated at 50°C for 10 min with frequent vortexing to liquefy it.
The QG buffer contains a pH indicator allowing easy determination of the optimal
pH for DNA binding. QG buffer of yellow colour indicated pH is <7.5 which is ideal
for DNA adsorption. Sodium acetate (3 M, pH 5.0) was added to the sample when
needed to adjust for the optimal pH. To increase the yield of DNA fragments <500
bp, 1 volume of isopropanol was added to the mix. To bind DNA, the sample was
placed in the QIAquick column with 2 ml collection tube and centrifuged at 10,000 x
g for 1 min. The flow-through was discarded and an additional 500 μl of QG buffer
was added to remove all traces of agarose and centrifuged for 1 min. The flow-
through was discarded and the silica membrane was washed by adding 750 μl of PE
buffer to the column and centrifugation for 1 min. The flow-through was discarded
and dry spin was applied to remove residual ethanol from PE buffer. The column
was then placed in a clean 1.5 ml microcentrifuge tube. DNA was eluted by adding
30 μl of EB buffer (10 mM Tris Cl, pH 8.5) to the centre of the column and incubated
at room temperature for 1 min followed by centrifugation at 13,000 x g for 1 min.
Samples were used immediately in ligation reactions. Remaining samples were
stored at -20°C.
Ligation 2.7.9
Ligation is a process to create recombinant DNA molecules by joining DNA
fragments together. The DNA ends are joined together by the formation of
53
phosphodiester bonds between the 3’-hydroxyl of one DNA terminus with the 5’-
phosphoryl of another. The ligation reaction buffer contains adenosine triphosphate
(ATP), which is required as the energy source for T4 DNA ligase. This enzyme is
derived from Enterobacteria phage T4 and its ability to repair nicks in double
stranded DNA with 3’ OH and 5’ phosphate ends is used in connecting DNA
fragments with plasmids. Cohesive end ligation was carried out at 16°C to maintain
good balance between annealing of ends and activity of the enzyme. All ligation
reactions were carried out using 2X ligation buffer (80 mM Tris HCl, 20 mM MgCl2,
20 mM DTT, 2 mM ATP), pGEM-T Easy Vector, T4 DNA ligase (Promega) and
nuclease-free water.
Transformation 2.7.10
Transformation was performed using high-efficiency chemically competent
E. coli cells (≥ 1 x 10⁸ cfu/μg DNA). Escherichia coli JM109 cells (Promega) were
removed from -80°C storage and defrosted on ice for 5 min. A 50 μl aliquot of the
cell suspension was added to 1.5 ml Eppendorf tube containing 2 μl of ligation
reaction, mixed by gently flicking the tube and incubated on ice for 20 min. Sample
was then heat-shocked for 50 s at 42°C and immediately placed on ice for additional
2 min. The heat-shock approach creates small holes in the cell wall of the bacteria
allowing the uptake of DNA. Super Optimal Broth media (SOB) was added in 950 μl
volume and incubated for 1.5 h at 37°C with shaking (~180 rpm) to allow
transformants to recover and express plasmid-encoded antibiotic resistance. Cells
were pelleted by centrifugation for 10 min at 1,000 x g and resuspended in 200 μl of
SOB media. LB agar containing 100 μg/ml ampicillin (LBAMP100), 100 μl isopropyl β-D-
1-thiogalactopyranoside (IPTG) and 20 μl X-gal (BCIG, 5-bromo-4-chloro-3-indolyl-β-
D-galactopyranoside) was used to plate out transformation reactions in duplicate
(100 μl each).
Screening bacterial colonies by colony PCR 2.7.11
In colony PCR, gene-specific primers or plasmid-specific primers flanking the
multiple cloning region (Appendix 1, Table 1) were used to examine for presence of
54
inserted DNA of expected size. Single white colonies were picked using a pipette tip
and streaked in numbered areas of an LBAMP100 agar plate. The same pipette tip was
used to inoculate 50 μl of dH2O for 1 min. The bacterial suspensions were then
heat-shocked for 5 min at 95°C and centrifuged for 10 min at 9,000 x g. Supernatant
was used as a template DNA in PCR. Amplicons were analysed by agarose gel
electrophoresis. The streaked LBAMP100 agar plates were incubated for 24 h in 37°C.
The positive colonies identified by colony PCR were used to inoculate 5 ml of
LBAMP100 broth for 24 h in 37°C with shaking at 200 rpm for plasmid purification.
Plasmid DNA purification 2.8
Small scale plasmid purification 2.8.1
To confirm cloning of genes (Chapter 4), recombinant pGEM-T Easy plasmids
were sequenced. To prepare samples for sequencing, DNA from Escherichia coli
pGEM-T Easy–containing cells was purified using QIAprep Spin Miniprep Kit
(QIAGEN) as follows. After inoculation of LBAMP100 broth with a single colony of a
putative recombinant the bacterial suspension was pelleted for 15 min at 3,000 x g.
Supernatant was discarded and cells were resuspended in 250 μl of P1 buffer with
added RNase A for sufficient digestion and LyseBlue as a colour indicator for visual
identification of optimum buffer mixing. The sample was moved to a 1.5 ml
Eppendorf tube and 250 μl of lysis buffer P2 was added. The solutions were mixed
by inverting the tube 4-6 times without vortexing to avoid genomic DNA shearing.
To neutralize the lysate and adjust to high-salt binding conditions, 350 μl of N3
buffer was added and mixed by inverting the tube 4-6 times or until the solution
became cloudy and without visible localised precipitation. The sample was then
centrifuged for 10 min at 17,900 x g to pellet denatured proteins, chromosomal
DNA and cellular debris. Supernatant containing smaller plasmid DNA was applied
to the QIAprep spin column by pipetting and centrifuged for 1 min at 17,900 x g to
capture DNA in the silica matrix. A brief wash step with 500 μl of PB buffer was
performed to efficiently remove endonucleases and prevent plasmid DNA
degradation. A second wash step using 750 μl of PE buffer was applied to remove
salts. The flow-through was discarded and the column was centrifuged for an
55
additional 1 min to remove residual wash buffer, which could inhibit subsequent
enzymatic reactions. The QIAprep column was placed in a clean 1.5 ml Eppendorf
tube and 50 μl of elution buffer EB was added to the centre of the spin column for
centrifugation for 1 min followed by 1 min, at 17,900 x g. The plasmid DNA yield
was examined using NanoDrop™ 1000 Spectrophotometer.
Large scale endotoxin-free plasmid purification 2.8.2
To obtain a high yield of plasmid DNA for transfection and recombinant
protein production an EndoFree Plasmid DNA Purification Maxi Kit was used
according to the manufacturer’s instructions with minor modifications as follows.
Previously sequenced plasmids containing genes of interest were stored as glycerol
stock of bacterial cells (i.e. JM109, DH5α). Single colonies were used to inoculate
5 ml of LBAMP100 broth and samples were incubated at 37°C with shaking at 200 rpm
for 12 h. Larger volumes (250 ml) of LBAMP100 broth were inoculated with 2.5 ml of
the bacterial starter culture and incubated for 24 h at 37°C with shaking at 200 rpm.
Bacterial cells were pelleted in 50 ml Falcon tubes for 30 min at 2,465 x g.
Supernatant was discarded and the pellet resuspended completely by vortexing in
10 ml of P1 buffer containing RNase A and LyseBlue. To lyse the cells 10 ml of buffer
P2 was added and mixed by inverting the tube 4-6 times. The lysate was incubated
at room temperature for 5 min. During the incubation, a QIAfilter Cartridge was
prepared by screwing the cap onto the outlet nozzle of the QIAfilter Maxi Cartridge
and placing in a convenient tube. Precipitation was enhanced by adding 10 ml of
chilled buffer P3 to the lysate and inverting the tube 4-6 times. Precipitated
material (genomic DNA, proteins, cell debris) forms fluffy white material. The lysate
was moved immediately into QIAfilter Cartridge and incubated at room
temperature for 10 min. After this period, the precipitate floated and formed a
layer on top of the solution. The outlet nozzle was opened on the QIAfilter Cartridge
and a plunger inserted to filter the lysate into the 50 ml tube. The endotoxin
removal (ER) buffer that prevents LPS molecules from binding to the resin in the
QIAGEN tips was added in 2.5 ml volume to the filtered lysate and allows
purification of DNA. The solution was incubated on ice for 30 min, when the

56
QIAGEN-tip 500 was being equilibrated by applying 10 ml of buffer QBT and
allowing the column to be emptied by gravitational flow. After the incubation on ice
the filtered lysate was applied to the QIAGEN-tip and allowed to enter the resin by
gravity flow. The tip was washed twice with 30 ml of QC buffer. DNA was eluted
using 15 ml of buffer QN and precipitated by addition of 10.5 ml of isopropanol. The
solution was mixed and centrifuged immediately at 3,220 x g for 1 hour.
Supernatant was carefully removed and the pellet was washed with 5 mL of 70%
(v/v) ethanol and collected by centrifugation at 3,220 x g for 1 h, 4°C. Supernatant
was carefully removed without disturbing the pellet. The DNA was left to air-dry for
5-10 min and redissolved in appropriate volume of TE buffer for 5 min at room
temperature. The DNA solution was vortexed for several seconds and its
concentration was measured using NanoDrop™ 1000 Spectrophotometer.
Sequencing plasmid DNA 2.8.3
To confirm gene cloning, recombinant plasmids were sequenced using
plasmid-specific primers and analysed using Sanger ABI 3730xl (GATC Biotech,
Germany). Expected and observed sequences were aligned using ClustalX (section
2.1.2).
RNA-seq 2.9
Sample preparation and sequencing 2.9.1
The BMDC, BMDM and heterophils were cultured as described in Chapter 2,
section 2.5. For RNA sequencing, BMDM were stimulated with 250 ng/ml of LPS
(Escherichia coli O55:B5, Sigma Aldrich) for 4 h, BMDC with 200 ng/ml for 24 h (Wu
et al., 2010) and heterophils with 10 μg/ml for 1 h (Farnell et al., 2003). Total RNA
was extracted as described in Chapter 2, section 2.6.1 with additional steps. The
cells were lysed with 600 μl of buffer RLT with added β-mercaptoethanol (β-ME)
and on-column DNase digestion was performed. Total RNA extracted from BMDC,
BMDM and heterophils (control and LPS stimulated) was diluted to 100 ng/μl in 20
μl of RNase-free water. The sample preparation was performed by Edinburgh
Genomics facility (Roslin Institute, Midlothian, UK) using a Tru-Seq total RNA Sample
57
Preparation v2 kit as per the manufacturer's protocol. Resulting libraries were
quality-checked on an Agilent DNA 1000 Bioanalyzer (Agilent Technologies, South
Queensferry, UK) and then clustered onto a paired end flowcell using the Illumina
TruSeq® Rapid PE Cluster Kit at a 8 pM concentration. The paired-end sequencing,
consisting of 100 cycles, was carried out on the Illumina HiSeq 2500 using an
Illumina TruSeq® Rapid SBS Kit (Illumina, Little Chesterford, UK).
Transcriptome alignment and differential expression analysis 2.9.2
The RNA-seq pipeline is presented in Appendix 1, Figure 1. The raw reads
were subject to quality control measures, including the removal of remaining
sequence adapters. The cleaned, paired-end 100 bp reads were aligned to the
chicken reference genome (Galgal4) assembly from the Ensembl database
(http://ensembl.org) with TopHat (v2.0.9) splice junction mapper, which aligned
reads using Bowtie aligner (v1.0.0). Cufflinks software (v2.1.1) assembled reads into
transcripts that were used as input data together with aligned reads in Cuffdiff to
determine expression levels by calculating the Fragments per Kilobase per Million
mapped reads (FPKM) and the differential expression between conditions using
default options.
Quantitative PCR (qPCR) using 96.96 Dynamic Array Integrated 2.10Fluidic Circuits.
The BioMark System 96.96 Dynamic Array is a high-throughput platform that
allows combining 96 samples with 96 primer pairs into 9,216 qPCRs in one
integrated fluidic circuit (IFC). The system includes optical, thermal cycling and
software components to perform quantitative PCR. The Dynamic Array IFC is a
nanofluidic network that allows to run 24-fold more reactions compared to 384-well
plate. The liquid handling steps, number of pipetting and volumes of reactions are
greatly reduced. The high-resolution CCD camera that covers whole chip area
images all reactions simultaneously. The quantification cycle (Cq) values from each
reaction chamber in the chip are visualised as an easy to analyse heat map. The
values behind the heat map can be exported and further analyse using gene
expression analysis software.

58
Primer design and optimisation 2.10.1
Primers for qPCR using 96.96 Dynamic Array were designed in the same
manner as primers for RT-qPCR outlined in section 2.7.5. At least one primer was
designed to overlap intron-exon boundaries of a gene, where possible. Optimisation
of primers was performed to assess their specificity in binding to a single template
at a working concentration of 1.15 μM. Primer amplification efficiencies and
dynamic range were acquired from standard curves constructed from dilution series
of highly responding samples. Melting curves were inspected for all primer assays.
Agarose gel electrophoresis and sequencing of selected amplicons were performed
to ensure primer specificity. To prepare qPCR products for sequencing DNA bands
were excised from an agarose gel using sterile scalpel and products were cleaned-
up using Nucleo-Spin Gel and PCR Clean-up kit (Macherey-Nagel, UK) following
manufacturer’s instructions. For every 100 mg of gel fragment, 200 μl of buffer NTI
was added and incubated at 50°C for 10 min. Completely dissolved samples was
then placed in Nucleo-Spin Gel and PCR Clean-up Column with collection tube and
centrifuged for 30 s at 11,000 x g. The flow-through was discarded and column was
washed with 700 μl of buffer NT3 with added 96-100% ethanol, by centrifugation
for 30 s at 11,000 x g. The silica membrane was dried by centrifugation for 1 min at
11,000 x g to remove buffer NT3 completely. The column was placed into a new 1.5
ml microcentrifuge tube and 30 μl of buffer NE was added. The column was
incubated at room temperature for 1 min and centrifuged for 1 min at 11,000 x g.
Cleaned-up qPCR product was sent for direct sequencing.
Reference gene normalisation 2.10.2
The stability of reference genes was examined using BestKeeper,
NormFinder and geNorm outlined in sections 2.1.7, 2.1.8 and 2.1.9. More detail is
provided in Chapter 5.

59
RNA extraction and cDNA generation for 96.96 Dynamic Array 2.10.3IFC
RNA for high throughput qPCR was extracted as described in paragraph
2.6.2. The cDNA was reversely transcribed using SuperScript III Kit and High Capacity
Reverse Transcription Kit as described in section 2.7.2 and 2.7.3, respectively.
Preamplification 2.10.4
Preamplification was performed using TaqMan PreAmp Master Mix (Applied
Biosystems, PN 4391128). A stock of 200 nM primer mix was prepared combining
equal concentration of all primers used in the following qPCR. TaqMan PreAmp
Master Mix (10 μl) was mixed with 5 μl of 200 nM stock primer mix and 5 μl of
cDNA in concentration of 185 ng/μl. Reaction tubes were vortexed and centrifuged
briefly before PCR. Samples were incubated at 95°C for 10 min followed by 14 cycles
of 95°C for 15 sec and 60°C for 4 min. Preamplified cDNA was stored in -20°C until
further use. Steps taken to optimise preamplification are discussed in Chapter 6,
section 6.3.3.
Exonuclease I treatment 2.10.5
A clean-up step using Exonuclease I (E. coli) (New England Biolabs; M0293S)
was performed to remove unincorporated primers from preamplified cDNA.
Exonuclease I was diluted to 4 U/μl by mixing 1.4 μl of water, 0.2 μl of Exonuclease I
Reaction Buffer and Exonuclease I (at 20 U/μl). For each 5 μl of preamplified cDNA a
total volume of 2 μl Exo I reaction solution was added and incubated at 37°C for 30
min. The reaction was stopped by heating at to 80°C for 15 min. Reactions were
held at 4°C until storage at -20°C.
Quantitative PCR assay and sample master mix preparation 2.10.6
Assay mix was prepared by mixing 2.5 μl 2X Assay Loading Reagent
(Fluidigm, PN 85000736), 2.3 μl of primer pair mix and 0.2 μl low EDTA TE buffer
which combined gave 5 μl of assay mix. Sample mix was prepared by mixing 2.5 μl
TaqMan Gene Expression Master Mix (Applied Biosystems; PN 4369016), 0.25 μl

60
20X DNA Binding Dye Sample Loading Reagent (Fluidigm; PN 100-388), 20X
EvaGreen DNA binding dye (Biotum; PN 31000) and 2 μl of preamplified cDNA
which combined gave 5 μl of sample mix.
Chip priming 2.10.7
96.96 Dynamic Array IFC was primed by injecting 150 μl of control line fluid
into each accumulator on the chip followed by placing the chip into the Integrated
Fluidic Circuit (IFC) controller and running the Chip Prime (138x) script.
Chip loading 2.10.8
Assay mix and sample mix solutions (5 μl) were pipetted into the inlets on
the chip after priming. Using IFC controller software, Load Mix (138x) script was
applied. After loading finished, the chip was removed from IFC controller and any
dust particles or debris were cleaned from the chip surface using scotch tape.
qPCR and data analysis 2.10.9
Quantitative PCR was performed in the BioMark HD instrument using the
Data Collection Software. The loaded chip was placed into the reader. After barcode
verification, application was set as Gene Expression (GE), passive reference as ROX,
probe as single probe and probe type as EvaGreen. Thermal cycling protocol was
chosen for 96.96 chip: GE 96x96 PCR+Melt v1.pcl. Auto Exposure was confirmed
and the program was verified.
Thermal conditions for GE 96x96 qPCR:
Thermal mix 50°C for 2 min 70°C for 30 min
25°C for 10 min Hot start 50°C for 2 min
95°C for 10 min
PCR cycle (x30) 95°C for 15 sec 60°C for 60 sec
Melting 60°C for 3 sec to 95°C
61
Real-Time PCR Analysis software was used to visualise results. Analysis
settings were as follows: quality threshold was set to 0.65, baseline correction to
linear (derivative) and Cq threshold method to auto (global). Data from the qPCR
were analysed under these settings and a heat map was generated to visualise the
results. Sample names and assays symbols were assigned to each row/column using
template documents in .xls format. Melting curves and amplification graphs were
examined for each gene. Data from the heat map view were exported as .csv file
that was used as an input data in GenEx5 software.
GenEx5 pre-processing 2.10.10
Data from 96.96 Dynamic Array runs was examined in Real Time PCR
Analysis software and handled in GenEx5 software before statistical analysis. Data
exported from heat map views were arranged with the measured genes in columns
headed with gene symbols and samples in rows. Additional classification columns
were included with labels: #tissue, #bird, #farm. A classification column for #repeats
was added automatically by the GenEx5 software. Validation of data in pre-
processing included removal of columns/rows with less than 50% values. Gene
quality graphs were produced to examine the number of empty values. The missing
data were either filled with the mean of replicates or by imputation based on a
tissue. Data were corrected for reaction efficiency for each primer assay individually
before normalisation with the reference genes: ACTB, GAPDH and TBP as selected in
Chapter 5. Normalised dataset repeats were averaged and further normalisation to
maximum Cq value for a given gene was performed. Relative quantities were
transformed to logarithmic scale (log2) before statistical analysis.
GenEx statistical analysis 2.10.11
Groups for comparison were created using GenEx5 Data Manager. Data were
grouped depending on the farm (pedigree, sibling test), bird (1-8), tissue (bursa,
spleen, caecal tonsils, ileum, PBL) and tissue/farm (e.g. bursa/sib, bursa/ped).
Groups were compared in bar graphs using descriptive statistics. Each comparison
generated a table with data values sorted by gene and group. Statistical analysis
62
was performed using a t-test. For principal component analysis (PCA), a trial version
of GenEx Enterprise was used. Gene expression was considered highly significant (p
value ≤ 0.0005) and significant (p value ≤ 0.05) for fold change values lower than -1
and higher than 1.
Statistical analysis 2.11
Chapter 3 oxidative burst and degranulation data were analysed by the
Student’s t-test using SigmaStat software (Jandel Scientific, USA) and expressed as
the mean ± SD. RT-qPCR data in Chapter 3 were checked for normality and
statistical analyses were carried out using Mann Whitney-U in Minitab 16.1.0 (State
College, USA). Statistical significance was determined as p≤0.05 (significant) or
p≤0.001 (highly significant). Mann-Whitney-U test (GenEx5) was used in validation
of the arrays expeiment.

63
Evaluation of cellular and molecular methods Chapter 3
as diagnostic tools for immune robustness
Introduction 3.1
The main aim of this study was to evaluate the practicality of widely used
cellular and molecular methods for measuring immune robustness in chickens. This
work was completed to answer the question if in vitro cultured bone marrow-
derived macrophages (BMDM) and dendritic cells (BMDC) and heterophils isolated
from blood provide an inexpensive, swift and informative tool for predicting
immune robustness that could be used in wider selection programmes. Evaluation
was based on BMDM and BMDC from Roslin Institute J line (RI-J) birds and on
heterophils isolated from blood samples of RI-J line, Novogen layers and Aviagen
broilers. A panel of proinflammatory cytokines and chemokines, known to be
differentially expressed during the regulation of immune responses, was examined
in effector cells stimulated with a lipopolysaccharide. The phagocytosis,
degranulation abilities and production of reactive oxygen species (ROS) was
examined in heterophils isolated from W36 Hy-Line and stimulated with opsonised
Salmonella Enteritidis.
In the animal breeding sector, genetic selection can increase resistance to
specific pathogens (Janss and Bolder, 2000) but genetic or phenotypic markers for
resistance to the wide spectrum of viral, bacterial and protozoan pathogens are
lacking. Disease resistance is often a polygenic trait therefore genetic selection for
the immune robustness is complex. It is therefore of interest to explore phenotypes
that may be predictive of the response to infection. There have been studies on
chicken immune responses to infections which showed that the number and types
of effector cells and the timing and magnitude of effector cells of their responses
influences resistance and susceptibility to diseases (Chapter 1).
The bone marrow, as the source of the myeloid lineage of white blood cells,
can be used to develop functional macrophages and dendritic cells, which can be
screened for phenotypes associated with the response to infection. The use of

64
primordial cells to derive effector cells results in broad representation of the
immune repertoire that has not influenced by cytokines and other features of
immune system (Sun et al., 2015). Studies on the effector cells and their
performance during stimulation with TLR ligands and/or live pathogens suggest that
the increased resistance to Salmonella correlates with the increased levels of
transcripts encoding proinflammatory cytokines and chemokines (Swaggerty et al.,
2003; Ferro et al., 2004, Wigley et al., 2006). Such molecules orchestrate the nature,
strength and kinetics of later stages of immunity. Hence, stronger and more rapid
innate defences can not only influence the first line of defence against pathogens
but also trigger more effective adaptive immune responses.
In chickens, the degranulation process of heterophils is closely associated
with phagocytosis (Kogut et al., 2001). Not only live bacteria but also various
microbial components have been shown to stimulate degranulation (Kogut et al.,
2005). The ability of heterophils to degranulate and produce an oxidative burst was
examined in vivo after CpG ODN treatment or Salmonella stimulation (He et al.,
2007; Kogut et al., 2005) and in vitro in two F1 reciprocal crosses (Swaggerty et al.,
2006). Chicken macrophages cell line (HD11), monocyte-derived macrophages and
heterophils isolated from blood have been used in many studies where immune
gene expression was evaluated upon stimulation with antigens in different breeds
(Iqbal et al., 2005; Smith et al., 2005, Lavric et al., 2008; Nerren et al., 2009). The
macrophages isolated from a Salmonella-resistant inbred line expressed
proinflammatory cytokines and chemokines more rapidly, and at greater levels,
compared to a susceptible line (Wigley et al., 2006) and could be used as
biomarkers. Since the first report on generation of the chicken bone-marrow
derived dendritic cells was published (Wu et al., 2010) recent studies have focused
on the nature of interactions between BMDC and various antigens/pathogens (Liang
et al., 2013; Vervelde et al., 2013; Rajput et al., 2014). The finding of differential
responses to the pathogens between resistant and susceptible inbred chicken lines
and the studies on the nature of gene expression in effector cells isolated or

65
differentiated from such lines suggest that it may be feasible to find biomarkers of
the innate response that are predictive of resistance to disease.

66
Materials and methods 3.2
Generation and stimulation of bone marrow-derived dendritic 3.2.1cells and macrophages
Chicken macrophages and dendritic cells can be derived from the bone
marrow cells by differentiation driven by recombinant CSF-1 or IL-4 and GM-CSF
(CSF-2), respectively. The recombinant chicken proteins were produced by
transfecting the COS-7 cells with plasmids containing chicken CSF-1, IL-4, GM-CSF
gene inserts, as described in Chapter 2, section 2.4.2. The bone marrow cells from
4-6 week old RI-J line chickens were differentiated into dendritic cells (BMDC) and
macrophages (BMDM) after six days of cultures, as described in Chapter 2, section
2.5.1.
Phagocytosis, oxidative burst and degranulation assays 3.2.2
The peripheral blood was used to isolate a heterophil population as
described in Chapter 2, section 2.5.3. Live Salmonella Enteritidis, opsonised with
normal chicken serum was used to stimulate phagocytosis, oxidative burst and
degranulation of heterophils after 1 h incubation. All three experiments were
performed during a visit to the USDA facility in College Station, Texas using 100 one
day old Hy-Line W36 chickens. The protocols are described in Chapter 2, section
2.5.5, 2.5.6 and 2.5.7.
Assessment of cytokine and chemokine expression using 3.2.3reverse transcription quantitative polymerase chain reaction (RT-qPCR)
The total RNA from unstimulated and stimulated BMDM, BMDC and
heterophils was used in RT-qPCRs to determine the levels of expression of cytokines
and chemokines. Primers and probes used in this experiment are listed in Appendix
1, Table 2. The amplification and detection was carried out using fluorescent
hydrolysis probes in the Applied Biosystems 7500 Fast Real-Time PCR System as
described in Chapter 2, section 2.7.5.

67
Results 3.3
The populations of macrophages and dendritic cells in chicken body tissues
are generally vast but difficult to isolate, therefore to evaluate their immune gene
expression levels, cells were differentiated from bone marrow for analysis of
responses to different stimuli ex vivo. If such assays prove reliable they could be
used to understand the basis of differential resistance and/or as predictive tools for
selection of immune robustness.
Bone marrow-derived macrophage and dendritic cell cultures 3.3.1
In this study, addition of CSF-1 and GM-CSF and IL-4 to bone marrow cells
generated clumping formation of adherent colonies. On day six, cells were
stimulated with LPS to induce immune gene expression. LPS is a strong stimulator of
innate immunity. For the purpose of this experiment 250 ng/ml was added to
BMDM. Dendritic cells were stimulated with 200 ng/ml of LPS, a concentration
previously described as optimal to trigger immune response in BMDC (Wu et al.,
2010). The stimulation with LPS triggered changes in the appearance of both BMDM
and BMDC + LPS cultures (Figure 3.1b and Figure 3.1c) compared to the
unstimulated control cells (Figure 3.1a). In BMDC culture, larger colonies of cells
decreased in numbers and single cells became more visible. BMDC that underwent
maturation during LPS stimulation displayed long veils or dendritic appearance
(Figure 3.1d). The BMDM population after stimulation with LPS was characterised
by colonies of spindle shaped strongly adherent cells (Figure 3.1b).

68
c)
d)
Figure 3.1. Morphology of chicken bone marrow cells from RI-J line. a) control cells; magnification 60x; b) cells cultured for 7 days in presence of CSF-1and stimulated with 250 ng/ml LPS for 24 h; magnification 60x; c) cell aggregates at day 7 of culture with presence of GM-CSF and IL-4 and stimulated with 200 ng/ml of LPS; magnification 60x; d) single cell from BMDC culture after stimulation with 200 ng/ml of LPS for 24 h, showing apparent long veils; 100x.
Isolation of heterophils from blood 3.3.2
A technique described by Kogut et al. (2001) was followed to isolate
heterophils, initially using blood from four to eight birds of 3-6 weeks age. The
number of circulating heterophils drastically drops from ~70% of total blood cells at
the first week to ~25% at the third week of life (reviewed by Maxwell and
Robertson, 1998). The age of the chickens and the small amount of blood (~8 ml)
used affected the final yield of heterophils. The purity and number of the isolated
cells was low (Figure 3.2a and Figure 3.2b). The population consisted of different
cells with very few heterophils detected. It can be observed that mature circulating
a)
b)

69
heterophils are round, although it has been reported that their shape may be
distorted because of a polar distribution of the specific cytoplasmic granules or
lobulation. They have two nuclear lobes, faintly pink cytoplasmic matrix, brick-red
rod-shaped granules with the May-Grunwald and Giemsa combination of stains, as
reported by Lucas and Jamroz (1961) (reviewed by Maxwell and Robertson, 1998).
To undertake any heterophil functional assays the number of cells has to be at least
1 x 10⁶ per ml. The use of ~100 day-old chickens increased the yield and purity of
isolated heterophils with approximately 95 % pure cells in 107 – 108 cells/ml (Figure
3.2c).
a)
b)
c)
Figure 3.2. Leukocytes isolated from blood using a discontinuous gradient. Cells were cytocentrifuged and stained with May-Grunwald Giemsa stain (a and b) and with Hematology 3-step stain (c); a) and b) heterophils isolated from blood of three-six week old RI-J line chickens; (b) heterophils isolated from blood of W36 Hy-Line day-old chickens, magnification with immersion oil 100x.

70
Induction of heterophil phagocytosis, degranulation and 3.3.3oxidative burst by Salmonella Enteritidis
The ability of live opsonised Salmonella Enteritidis to induce phagocytosis,
degranulation and oxidative burst was measured in heterophils isolated from blood
of day-old W36 Hy-Line chickens after 1 h incubation. Phagocytosis in heterophils
was evaluated microscopically (Figure 3.3). Not all heterophils contained bacterial
cells but those that did phagocytose Salmonella, on average, contained more than
two bacterial cells. For every 100 heterophils on a cytospin slide, 63 contained
Salmonella Enteritidis. Rarely, heterophils were observed with a large number of
internalised bacteria. The results are presented as phagocytic index (Chapter 2,
section 2.5.5.). Data are expressed as mean ± standard deviation (Table 3.1).
Figure 3.3. Phagocytosis of S. Enteritidis by heterophils isolated from day-old chickens. Cytospin smears were stained with Hematology 3-step stain and examined by light microscopy with the oil immersion objective (100x).

71
Table 3.1. Phagocytic index. Phagocytosis of opsonised S. Enteritidis (107 cfu/ml) by heterophils (106 cells/ml) isolated from day-old chickens. The numbers are from two independent studies, each consisting of five technical replicates.
% heterophils containing S. Enteritidis
Average number of bacteria per heterophil
Phagocytic Index (PI)
63 ± 2.94 2.62 ± 0.38 165.17 ± 23.10
Live, opsonised S. Enteritidis and phorbol A-myristate 13-acetate (PMA) were used
to evaluate production of reactive oxygen species (ROS) by heterophils using an
oxidative burst assay. The levels of ROS production were indicated by the amount of
fluorescence caused by oxidation of DCFH-DA to DCF. PMA gave the strongest
stimulation to the oxidative burst. Although bacteria were a less effective stimulant
than PMA, the level of ROS produced by heterophils in the presence of S. Enteritidis
doubled after 1 h incubation compared to control cells (Figure 3.4).
Figure 3.4. Ability of heterophils to generate an oxidative burst response following stimulation with opsonised S. Enteritidis and the inflammatory agonist phrorbol A-myristate 13-acetate. Reactions contained 1 x 10⁷ cells/ml, 10 μg DCFH-DA/ml and 108 cfu/ml of opsonised S. Enteritidis. Samples were incubated at 37˚C for 1 h. The control relative fluorescence units (RFU) value was obtained from unstimulated cells at the same time point. Data represent the mean ± standard deviation (SD) of three independent assays. C - control cells, SE - cells stimulated with S. Enteritidis, PMA - cells stimulated with . phorbol A-myristate 13-acetate; *p ≤ 0.05.
The levels of enzymatic processes of degranulation was measured in
heterophils incubated with S. Enteritidis. The presence of bacteria triggered the
release of granule contents, which was detected by quantifying the levels of β-D-
*
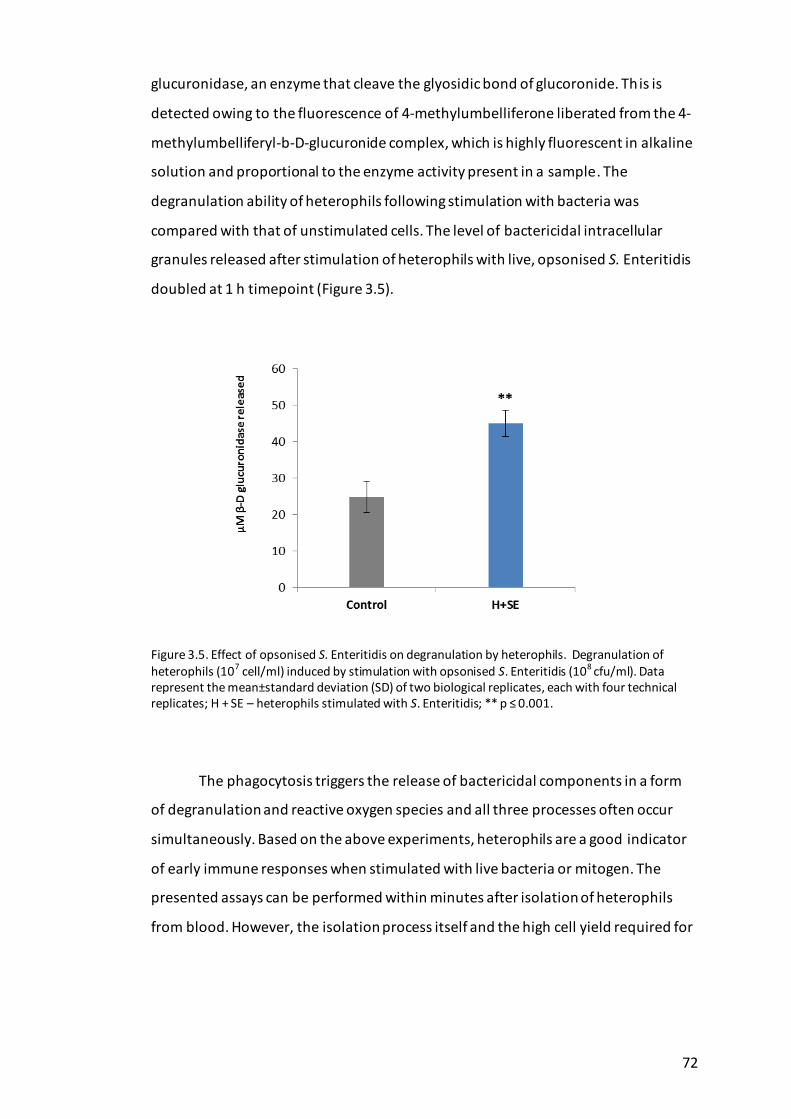
72
glucuronidase, an enzyme that cleave the glyosidic bond of glucoronide. This is
detected owing to the fluorescence of 4-methylumbelliferone liberated from the 4-
methylumbelliferyl-b-D-glucuronide complex, which is highly fluorescent in alkaline
solution and proportional to the enzyme activity present in a sample. The
degranulation ability of heterophils following stimulation with bacteria was
compared with that of unstimulated cells. The level of bactericidal intracellular
granules released after stimulation of heterophils with live, opsonised S. Enteritidis
doubled at 1 h timepoint (Figure 3.5).
Figure 3.5. Effect of opsonised S. Enteritidis on degranulation by heterophils. Degranulation of heterophils (107 cell/ml) induced by stimulation with opsonised S. Enteritidis (108 cfu/ml). Data represent the mean±standard deviation (SD) of two biological replicates, each with four technical replicates; H + SE – heterophils stimulated with S. Enteritidis; ** p ≤ 0.001.
The phagocytosis triggers the release of bactericidal components in a form
of degranulation and reactive oxygen species and all three processes often occur
simultaneously. Based on the above experiments, heterophils are a good indicator
of early immune responses when stimulated with live bacteria or mitogen. The
presented assays can be performed within minutes after isolation of heterophils
from blood. However, the isolation process itself and the high cell yield required for

73
the experiments make these methods not useful for screening older and larger
populations of birds.
Pro-inflammatory cytokine and chemokine expression upon 3.3.4stimulation with lipopolysaccharide (LPS)
The value of bone marrow-derived cell cultures in evaluating immune
robustness was examined by testing BMDC and BMDM responses to LPS as an
example. The mRNA levels of the pro-inflammatory cytokines IL-1β and IL-6, and of
the Th1-associated cytokine IL-18, were studied in BMDM and BMDC + LPS after six
days of culture. Additionally, transcript levels for the pro-inflammatory chemokines
CXCLi1 and CXCLi2 were quantified. The BMDC cultures were stimulated with 200
ng/ml of LPS for 24 hours and the BMDM with 250 ng/ml of LPS for 4 hours. The
timepoints were selected based on the published data.
The level of transcription varied greatly between cell types. For some
transcripts, there was also a large variation observed between replicates. The
highest induction of expression was observed for IL-6 transcripts, in both BMDC and
BMDM. The IL-1β transcript was upregulated in both cell types with higher levels in
BMDM after 4 h stimulation. The Th1-associated cytokine IL-18 was also
upregulated in both cell types but the level of expression was much lower in BMDM
when compared to IL-1β and IL-6. The mRNA expression of CXCLi1 in BMDC was
detected at 24 hours but the levels were much lower compared to BMDM. The
mRNA expression of CXCLi2 chemokine in BMDC was upregulated reaching 20 fold
change, where in BMDM expression of CXCLi2 was not detected at 4 h timepoint
compared to the unstimulated control cells. Data are presented in Figure 3.6.

74
Fold
ch
ange
in e
xpre
ssio
n
Figure 3.6. Evaluation of expression of proinflammatory cytokine genes in BMDM and BMDC stimulated with LPS a) IL-1β; b) IL-6; c) IL-18 and chemokines d) CXCLi1; e) CXCLi2; in bone marrow-derived dendritic cells (BMDC), stimulated for 24 h with 200 ng/ml of LPS and in bone marrow-derived macrophages (BMDM), stimulated for 4 h with 250 ng/ml of LPS. Data are presented as fold change compared to unstimulated control cells, each bar represent average of three biological replicates ± SD; *p ≤ 0.05.
The transcript levels for proinflammatory cytokines (IL-1β, IL-6 and IL-18),
proinflammatory chemokine (CXCLi2) and anti-inflammatory cytokine (TGF-β4)
were also examined in heterophils upon LPS stimulation (Figure 3.7). Three different
breeds were used to isolate heterophils from blood of day-old chickens. The highest
0
100
200
300
BMDC BMDM
IL-1β
0
200
400
600
BMDC BMDM
IL-6
0
10
20
30
BMDC BMDM
IL-18
0
300
600
BMDC BMDM
CXCLi1
0
10
20
30
BMDC BMDM
CXCLi2
a) b)
e)
d) c)
*
* *
*
*
*
*

75
level of expression of IL-1β was observed in the Novogen line heterophils. In the
same line IL-6 mRNA expression was the lowest compared with other lines tested,
where the RI-J line showed the highest level of mRNA expression. The IL-18 cytokine
was differentially expressed compared to the control cells in all lines tested but the
levels were low. In the case of CXCLi2, Aviagen line and RI-J line exhibited similar
level of expression with Novogen line demonstrating higher upregulation. The anti -
inflammatory cytokine TGF-β4 showed little or no consistent change in expression
across the lines studied.
Figure 3.7. Evaluation of proinflammatory gene expression in heterophils as measured by RT-qPCR. Level of mRNA expression of cytokines: IL-1β; IL-6; IL-18; chemokine CXCLi2 and anti-inflammatory cytokine TGF-β4 in heterophils isolated from three breeds; heterophils were stimulated with 10 μg/ml of LPS for 1 h. Data are presented as fold change compared to unstimulated control cells, each bar represent average of three technical replicates ± SEM.
0
10
20
30
40
IL-1β IL-6 IL-18 CXCLi2 TGF-β4
fold
ch
ange
in e
xpre
ssio
n
Aviagen
RI-J line
Novogen

76
Discussion 3.4
Commercial broiler lines have distinct immune function parameters, due to
differences in their genetic make-up, which results in a disease resistance and/or
susceptibility (Lakshmanan et al., 1997). Disease resistance is a complex trait, which
is influenced by genetics, environment, diet and other factors. Enhancing innate
resistance to pathogens in chickens is of increasing interest as an alternative to
antimicrobial use. There are widely used laboratory-based assays that could be
implemented to test chicken’s responsiveness to different stimuli. Their usage in
screening chickens, as a diagnostic tool, has been evaluated here in pilot studies.
Studies on regulation of innate immune cells are important as effector cells direct
the adaptive immune response. Although studies of cytokine expression in primary
cells provide comprehensive data, culturing dendritic cells and macrophages from
bone marrow is time-consuming and the quality of cell culture will vary depending
on breed type and the age of the birds. More rapid, cheaper and reproducible
techniques will have to be applied for assessment of differences in immune
robustness in chicken lines.
Heterophils act early in response to invading microorganisms and have
evolved many mechanisms to clear pathogens. They are therefore useful functional
biomarkers for evaluating innate immune competence in poultry (Swaggerty et al.,
2003). Recognition of PAMPs of foreign microorganisms stimulates phagocytosis,
degranulation and generation of oxidative burst (Kogut et al., 2003; He et al., 2005)
that was also shown in current study in which heterophils were stimulated with S.
Enteritidis. Similar results were obtained by He et al. (2003) where S. Enteritidis-
stimulated heterophils increased production of oxidative burst. The above data and
other studies show that functional comparisons of heterophils, using phagocytosis,
degranulation and oxidative burst assays, provide comprehensive data on the
performance of the early immune response. Heterophils were also used in mRNA
expression experiments and similarly to published studies (Swaggerty et al., 2003)
there were great differences observed in cytokine expression between different
breeds of chickens. The RT-qPCR experiment showed that, although most of the

77
genes tested were expressed in heterophils stimulated with LPS, there were great
differences in level of expression between broiler (Aviagen) and layer (Novogen and
RI-J) lines. There have been few reports on differences in immune responses
between layers and broilers in studies on LPAI H7N2 strains (Ladman et al., 2008),
after IBV infection (Smith et al., 1985) and on cellular and humoral responses to
antigens (Koenen et al., 2002; Parmentier et al., 2010).
An alternative method could involve assessment of the number and activity of
heterophils and the measurement of differences in levels of proinflammatory
responses. It has been shown that the number of heterophils that migrate to the
site of infection is associated with increased resistance against systemic S.
Enteritidis (Swaggerty et al., 2005). Together with the correlation between
resistance to S. Enteritidis and differences in expression of innate immune genes,
these methods could be used to select for increased resistance to other pathogens
but their role as diagnostic tool would be limited considering high number of
heterophils needed to perform the experiments. Insufficient numbers can be
obtained in blood to permit analysis of heterophil function as a screening tool.
Without the need for culture, they are able to phagocytose, degranulate and
produce ROS, but those functions can be deficient in newly hatched birds (Wells et
al., 1998). Although using heterophils to study differences in responses to
pathogens is faster than using bone marrow-derived effector cells, the isolation of
sufficient number of cells requires bleeding of at least 100 day-old chicks.
Quantitative PCR was performed to determine whether pro-inflammatory
cytokines (IL-1β, IL-6), the Th1-associated cytokine IL-18 and pro-inflammatory
chemokines (CXCLi1, CXCLi2) were induced upon stimulation of BMDM and BMDC
with LPS. Upregulation of IL-1β, IL-6 and CXC chemokines by Salmonella has been
shown in various tissues, including ileum and liver (Withanage et al., 2004), spleen
(Cheeseman et al., 2007), heterophils and macrophages (Kaiser et al., 2006; Kogut
et al., 2006; Swaggerty et al., 2008). Bone marrow-derived macrophages and
dendritic cells have been proven a good source for studying mRNA gene expression

78
triggered by pathogens and mitogens (Wigley et al., 2006; Wu et al., 2010; Vervelde
et al., 2013). In the current study, LPS stimulation of BMDM and BMDC from
outbred, vaccinated chickens has shown the mRNA levels of cytokines markedly
different in magnitude compared to unstimulated cells and between biological
replicates.
In the current study, the mRNA gene expression varied greatly between cell
types, timepoints and LPS concentrations. Depending on the time of stimulation
and LPS concentration, some genes may not be detected leading to a conclusion
that they are not expressed, but the real reason may be that this particular cell
culture has responded and is in homeostasis. As the bone marrow-derived cells
have to be in culture for six days, their responses may differ due to differences in
developmental stages and maturity at the time of stimulation. Therefore, the
selection of stimulant concentration and the timepoints would have to be well
thought through as the improper choices may lead to false conclusions.
The cited studies confirm that different types of microbes and different
strains trigger varied levels of response of the genes tested in presented
experiments not only in in vitro studies but also in tissues from infection studies. It
is difficult to agree what genes and at what level of expression are perfect
signatures of immune responsiveness. The bone-marrow derived macrophages and
dendritic cells are not a good choice for determination of immune resistance or
susceptibility. As the current study and previous reports show, the differences in
the speed and the magnitude of gene expression depend on a time of stimulation,
type of antigen/pathogen used and antigen/pathogen load. The use of progenitor
cells, their culture outside the body in simulated settings and stimulation with one
pathogen or antigen does not mimic the real environment of broilers. The culture of
BMDM and BMDC are a standard technique in chicken mRNA gene expression
studies where immune responses are evaluated. They may be informative and
useful to further characterise cell populations but the selection of birds that
supposed to have a robust immune response, based on expression of few genes

79
produce less information compared to high-throughput techniques. Although a
small number of immune-related genes could be practical in distinguishing which
line of chickens have better early immune response to particular pathogen, a bigger
panel of genes would return a broader view.

80
Generation of gene list - selection and cloning Chapter 4
of genes involved in early immune responses.
Introduction 4.1
The cellular and molecular assays described in the previous chapter were
dismissed as being effective and rapid tools for testing immune robustness in
chicken lines. To screen the immune performance of greater number of birds, a new
high-throughput qPCR platform, the 96.96 Dynamic Array with BioMark System
from Fluidigm, will be tested as alternative (introduced in Chapter 6). This type of
qPCR platform allows the expression of up to 96 genes across 96 samples to be
tested simultaneously. Therefore, it is necessary to select a panel of ~100 immune-
related genes of interest to test their expression in commercial lines of chickens.
There have been many studies performed on various chicken lines,
susceptible and resistant to particular pathogens and on cells isolated from chickens
and stimulated with antigens and/or pathogens. These types of studies are
important to examine the immune response to the particular pathogen of interest
but they do not reflect immune responses in the commercial environment where
birds are exposed to multiple pathogens and stressors. Many of those
microorganisms act simultaneously on the chicken’s immune system. As the
screening tool should be suitable for testing birds reared under both clean and
commercial circumstances, selected genes have to reflect immune responses to
different antigens and/or pathogens. A list of genes was compiled from studies
using resistant and susceptible chicken lines as well as cell lines and primary cells
challenged with a range of pathogens or constituents thereof. Studies with similar
agents but using mammalian species were also included to determine if there are
conserved immune responses across species to different stimuli. Additionally, RNA-
seq analysis was performed on effector cells stimulated with LPS and the results
were compared to the panels of genes differentially expressed (DE) in previous
studies to increase the number of genes of interest.

81
The selected genes have their sequences available in the latest chicken
genome assembly (Galgal4). With the use of Ensembl and NCBI databases each gene
sequence can be compared and used as a template in primer design for future qPCR
applications. As the chicken genome sequence is still under development and the
published studies based their studies on preceding genome release, there is a need
to confirm the sequences using molecular cloning followed by sequencing. This
approach will allow the design of qPCR assays for use in Chapter 6 and by the wider
research community.

82
Materials and methods 4.2
Selection criteria for creation of gene list 4.2.1
The articles were collected by searching the NCBI database with the queries
‘innate immune response’, ‘gene expression infection’ in both chicken and
mammalian species, and by doing searches of cited references in selected articles.
The publications used to select the genes had to contain an analysed differential
expression (DE) dataset in the body of text and/or in the supplementary data
available online. Infection studies on various pathogens and their interactions with
the host as well as in vitro studies on stimulated primary cells and/or cell lines were
included in this collection. Each article’s differential expression (DE) dataset was
compared with other studies and the genes that were upregulated in two or more
studies were considered a good candidate for the gene list.
RNA sequencing of BMDC, BMDM and heterophils 4.2.2
Sample preparation and RNA sequencing methods are described in Chapter
2, section 2.9.1. The analysis of sequencing results was performed as described in
Chapter 2, section 2.9.2. The RNA-seq pipeline is shown Appendix 1, Figure 1.
Comparison of RNA-seq data between analyses and published 4.2.3studies for further gene selection
The three lists of significantly DE genes obtained from RNA-seq analysis of
BMDC, BMDM and heterophils stimulated with LPS were compared between each
other. The genes that were common for two or more lists were selected. The genes
with significant differential expression in one cell type in the RNA-seq results were
screened against the lists of genes from the articles used in the first selection
(Chapter 4, 4.3.1). Genes that were present in two or more lists (RNA-seq results
and published studies lists) were placed on the final gene list.
Amplification, cloning and sequencing of candidate gene cDNA 4.2.4
Amplicon lengths, primer sequences and genes IDs are described in Appendix
1, Table 3 and Table 5. PCR was performed as described in Chapter 2, section 2.7.4.
PCR products were separated and visualised by agarose gel electrophoresis
83
(Chapter 2, section 2.7.7) and amplicons of the expected size were excised DNA
extracted and ligated into the pGEM-T Easy vector (Chapter 2, section 2.7.8 and
2.7.9). Transformation of highly competent JM109 cells with ligated PCR products
was performed as described in Chapter 2 section 2.7.10. Blue/white screening of
transformed bacterial cells helped to distinguish putative recombinants, which were
then confirmed by dideoxy chain termination (Sanger) sequencing. The results were
assembled and visualised using the DNASTAR® SeqMan Pro application. Cloned and
reference sequences were aligned by ClustalX (Chapter 2, section 2.1.2). Alignments
were visualised by using GeneDoc software (Chapter 2, section 2.1.3). Alignments of
all cloned genes and their master sequences are shown in Appendix 2 (electronic
file).
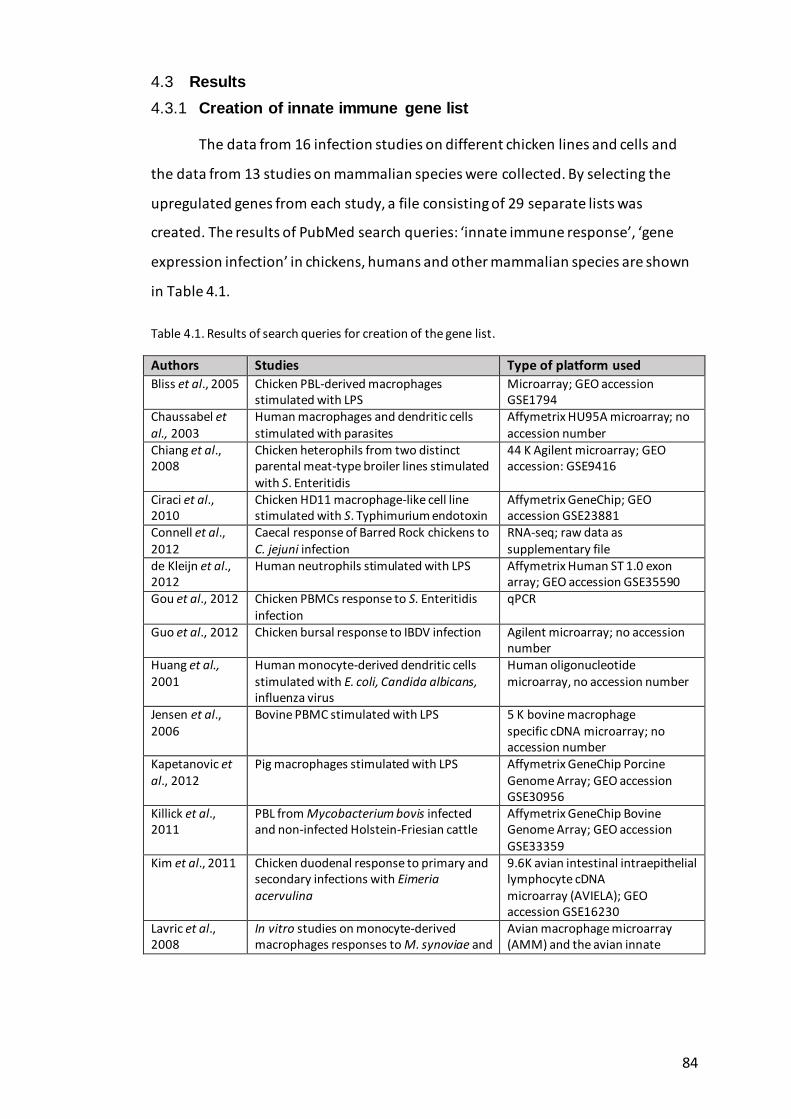
84
Results 4.3
Creation of innate immune gene list 4.3.1
The data from 16 infection studies on different chicken lines and cells and
the data from 13 studies on mammalian species were collected. By selecting the
upregulated genes from each study, a file consisting of 29 separate lists was
created. The results of PubMed search queries: ‘innate immune response’, ‘gene
expression infection’ in chickens, humans and other mammalian species are shown
in Table 4.1.
Table 4.1. Results of search queries for creation of the gene list.
Authors Studies Type of platform used
Bliss et al., 2005 Chicken PBL-derived macrophages stimulated with LPS
Microarray; GEO accession GSE1794
Chaussabel et al., 2003
Human macrophages and dendritic cells stimulated with parasites
Affymetrix HU95A microarray; no accession number
Chiang et al., 2008
Chicken heterophils from two distinct parental meat-type broiler lines stimulated with S. Enteritidis
44 K Agilent microarray; GEO accession: GSE9416
Ciraci et al., 2010
Chicken HD11 macrophage-like cell line stimulated with S. Typhimurium endotoxin
Affymetrix GeneChip; GEO accession GSE23881
Connell et al., 2012
Caecal response of Barred Rock chickens to C. jejuni infection
RNA-seq; raw data as supplementary file
de Kleijn et al., 2012
Human neutrophils stimulated with LPS Affymetrix Human ST 1.0 exon array; GEO accession GSE35590
Gou et al., 2012 Chicken PBMCs response to S. Enteritidis infection
qPCR
Guo et al., 2012 Chicken bursal response to IBDV infection Agilent microarray; no accession number
Huang et al., 2001
Human monocyte-derived dendritic cells stimulated with E. coli, Candida albicans, influenza virus
Human oligonucleotide microarray, no accession number
Jensen et al., 2006
Bovine PBMC stimulated with LPS 5 K bovine macrophage specific cDNA microarray; no accession number
Kapetanovic et al., 2012
Pig macrophages stimulated with LPS Affymetrix GeneChip Porcine Genome Array; GEO accession GSE30956
Killick et al., 2011
PBL from Mycobacterium bovis infected and non-infected Holstein-Friesian cattle
Affymetrix GeneChip Bovine Genome Array; GEO accession GSE33359
Kim et al., 2011 Chicken duodenal response to primary and secondary infections with Eimeria acervulina
9.6K avian intestinal intraepithelial lymphocyte cDNA microarray (AVIELA); GEO accession GSE16230
Lavric et al., 2008
In vitro studies on monocyte-derived macrophages responses to M. synoviae and
Avian macrophage microarray (AMM) and the avian innate
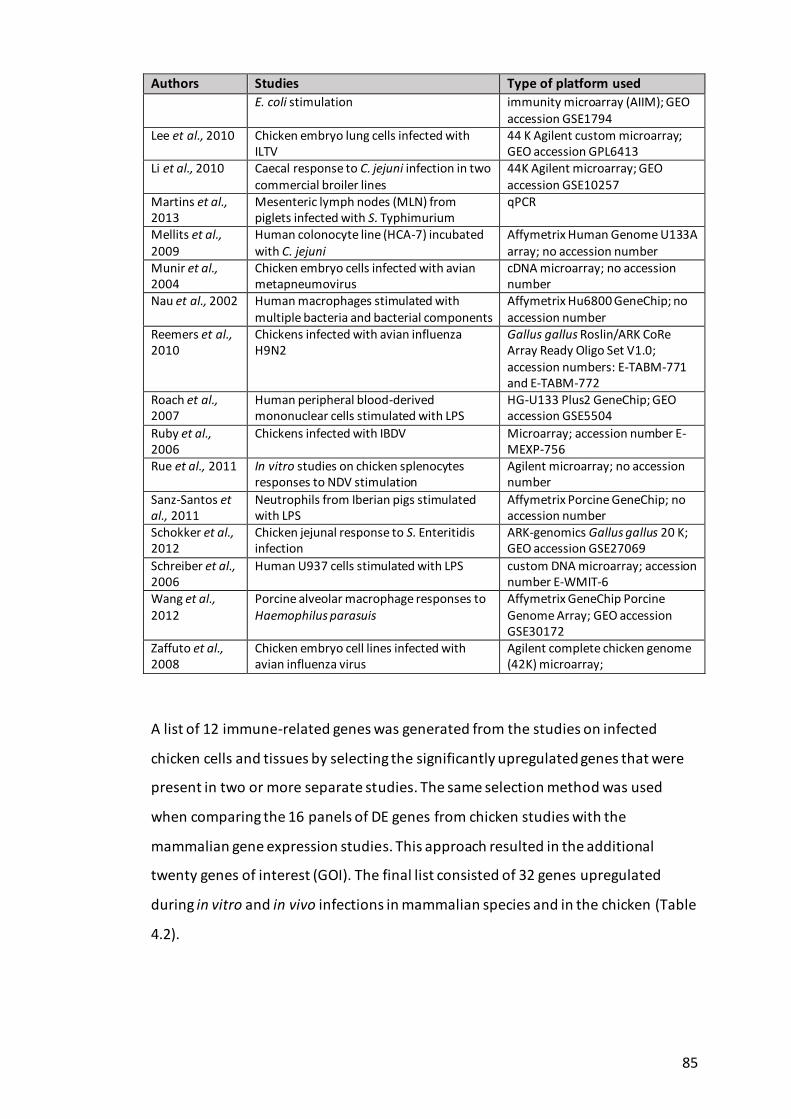
85
Authors Studies Type of platform used
E. coli stimulation immunity microarray (AIIM); GEO accession GSE1794
Lee et al., 2010 Chicken embryo lung cells infected with ILTV
44 K Agilent custom microarray; GEO accession GPL6413
Li et al., 2010 Caecal response to C. jejuni infection in two commercial broiler lines
44K Agilent microarray; GEO accession GSE10257
Martins et al., 2013
Mesenteric lymph nodes (MLN) from piglets infected with S. Typhimurium
qPCR
Mellits et al., 2009
Human colonocyte line (HCA-7) incubated with C. jejuni
Affymetrix Human Genome U133A array; no accession number
Munir et al., 2004
Chicken embryo cells infected with avian metapneumovirus
cDNA microarray; no accession number
Nau et al., 2002 Human macrophages stimulated with multiple bacteria and bacterial components
Affymetrix Hu6800 GeneChip; no accession number
Reemers et al., 2010
Chickens infected with avian influenza H9N2
Gallus gallus Roslin/ARK CoRe Array Ready Oligo Set V1.0; accession numbers: E-TABM-771 and E-TABM-772
Roach et al., 2007
Human peripheral blood-derived mononuclear cells stimulated with LPS
HG-U133 Plus2 GeneChip; GEO accession GSE5504
Ruby et al., 2006
Chickens infected with IBDV Microarray; accession number E-MEXP-756
Rue et al., 2011 In vitro studies on chicken splenocytes responses to NDV stimulation
Agilent microarray; no accession number
Sanz-Santos et al., 2011
Neutrophils from Iberian pigs stimulated with LPS
Affymetrix Porcine GeneChip; no accession number
Schokker et al., 2012
Chicken jejunal response to S. Enteritidis infection
ARK-genomics Gallus gallus 20 K; GEO accession GSE27069
Schreiber et al., 2006
Human U937 cells stimulated with LPS custom DNA microarray; accession number E-WMIT-6
Wang et al., 2012
Porcine alveolar macrophage responses to Haemophilus parasuis
Affymetrix GeneChip Porcine Genome Array; GEO accession GSE30172
Zaffuto et al., 2008
Chicken embryo cell lines infected with avian influenza virus
Agilent complete chicken genome (42K) microarray;
A list of 12 immune-related genes was generated from the studies on infected
chicken cells and tissues by selecting the significantly upregulated genes that were
present in two or more separate studies. The same selection method was used
when comparing the 16 panels of DE genes from chicken studies with the
mammalian gene expression studies. This approach resulted in the additional
twenty genes of interest (GOI). The final list consisted of 32 genes upregulated
during in vitro and in vivo infections in mammalian species and in the chicken (Table
4.2).
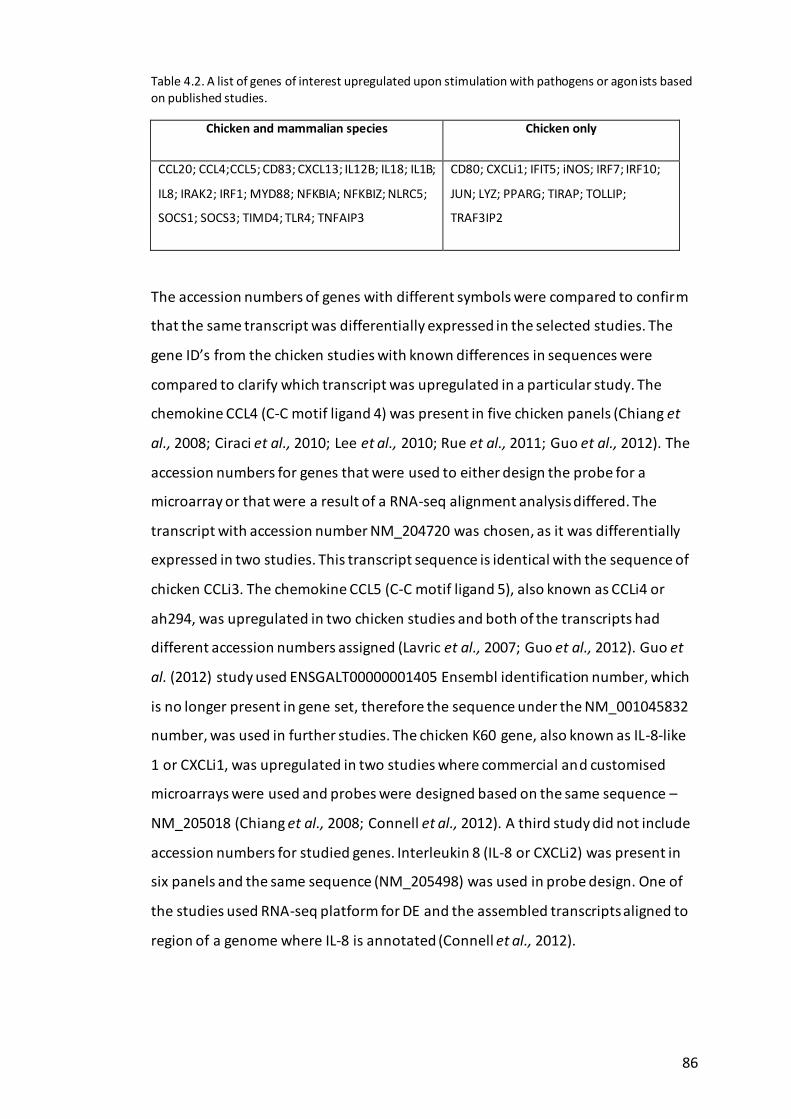
86
Table 4.2. A list of genes of interest upregulated upon stimulation with pathogens or agonists based on published studies.
Chicken and mammalian species Chicken only
CCL20; CCL4;CCL5; CD83; CXCL13; IL12B; IL18; IL1B;
IL8; IRAK2; IRF1; MYD88; NFKBIA; NFKBIZ; NLRC5;
SOCS1; SOCS3; TIMD4; TLR4; TNFAIP3
CD80; CXCLi1; IFIT5; iNOS; IRF7; IRF10;
JUN; LYZ; PPARG; TIRAP; TOLLIP;
TRAF3IP2
The accession numbers of genes with different symbols were compared to confirm
that the same transcript was differentially expressed in the selected studies. The
gene ID’s from the chicken studies with known differences in sequences were
compared to clarify which transcript was upregulated in a particular study. The
chemokine CCL4 (C-C motif ligand 4) was present in five chicken panels (Chiang et
al., 2008; Ciraci et al., 2010; Lee et al., 2010; Rue et al., 2011; Guo et al., 2012). The
accession numbers for genes that were used to either design the probe for a
microarray or that were a result of a RNA-seq alignment analysis differed. The
transcript with accession number NM_204720 was chosen, as it was differentially
expressed in two studies. This transcript sequence is identical with the sequence of
chicken CCLi3. The chemokine CCL5 (C-C motif ligand 5), also known as CCLi4 or
ah294, was upregulated in two chicken studies and both of the transcripts had
different accession numbers assigned (Lavric et al., 2007; Guo et al., 2012). Guo et
al. (2012) study used ENSGALT00000001405 Ensembl identification number, which
is no longer present in gene set, therefore the sequence under the NM_001045832
number, was used in further studies. The chicken K60 gene, also known as IL-8-like
1 or CXCLi1, was upregulated in two studies where commercial and customised
microarrays were used and probes were designed based on the same sequence –
NM_205018 (Chiang et al., 2008; Connell et al., 2012). A third study did not include
accession numbers for studied genes. Interleukin 8 (IL-8 or CXCLi2) was present in
six panels and the same sequence (NM_205498) was used in probe design. One of
the studies used RNA-seq platform for DE and the assembled transcripts aligned to
region of a genome where IL-8 is annotated (Connell et al., 2012).

87
RNA-seq analysis 4.3.2
The genes selected, based on previous studies, resulted in a small list
consisting of 32 genes involved in immune response to pathogens or agonists. To
increase the number of the genes of interest, an RNA-seq analysis was performed
on RNA from chicken primary cells (BMDC, BMDM and heterophils) stimulated with
LPS. The Illumina HiSeq 2500 platform generated 14.1-18.6 million RNA-seq tag
pairs per sample (95.8 million in total) each 100 nucleotides in length resulting in
19.7 Gb of data. The Cufflinks program containing Cuffdiff algorithm was used to
find significant changes in transcript levels between LPS-treated and control cells.
The DE genes were determined by using the fold change >1 (Figure 4.1a). Among
the differentially expressed genes, there was only one gene, TGM4, upregulated in
all of the three cell types. Between BMDC and BMDM, 30 DE genes were common
and each cell type shared only nine DE genes with the heterophils (Figure 4.1b). The
DE analysis revealed that many of the significantly expressed genes have not been
annotated in chicken genome. For further analysis, only the annotated genes were
taken under consideration. The reads for four differentially expressed genes
assembled into transcripts that spanned the location of two closely annotated
genes. It has resulted in pair of genes assigned to the same genomic location with
shared fold change value. Therefore, 24 genes significantly differentially expressed
in two or more cell types were chosen as genes of interest.

88
a)
b)
Figure 4.1. RNA-seq results a) Number of significantly differentially expressed genes in chicken primary cells stimulated with LPS. Abbreviations: BMDC, bone marrow-derived dendritic cells; BMDM, bone marrow-derived macrophages; DE- differentially expressed compared to unstimulated cells; b) Venn diagram showing the number of transcripts significantly DE; A) in heterophils; B) in BMDM; C) BMDC; D) common DE gene for three cell types; E) shared between BMDC and BMDM; F) shared between BMDM and heterophils; G) shared between BMDC and heterophils; numbers of unannotated genes are presented in brackets.
Comparison of RNA-seq results with previous studies 4.3.3
The criteria for genes to be ranked as genes of interest were as follows:
candidate gene had to be differentially expressed in any of the cell type tested from
the RNA-seq analysis and at least once in the previous studies used to generate the
initial list of 32 genes. Against this criterion, 17 genes qualified. A further 15 genes
were added to the list, based on their overexpression in more than one of the
previous studies analysed. From the RNA-seq data, 44 genes were added to the list
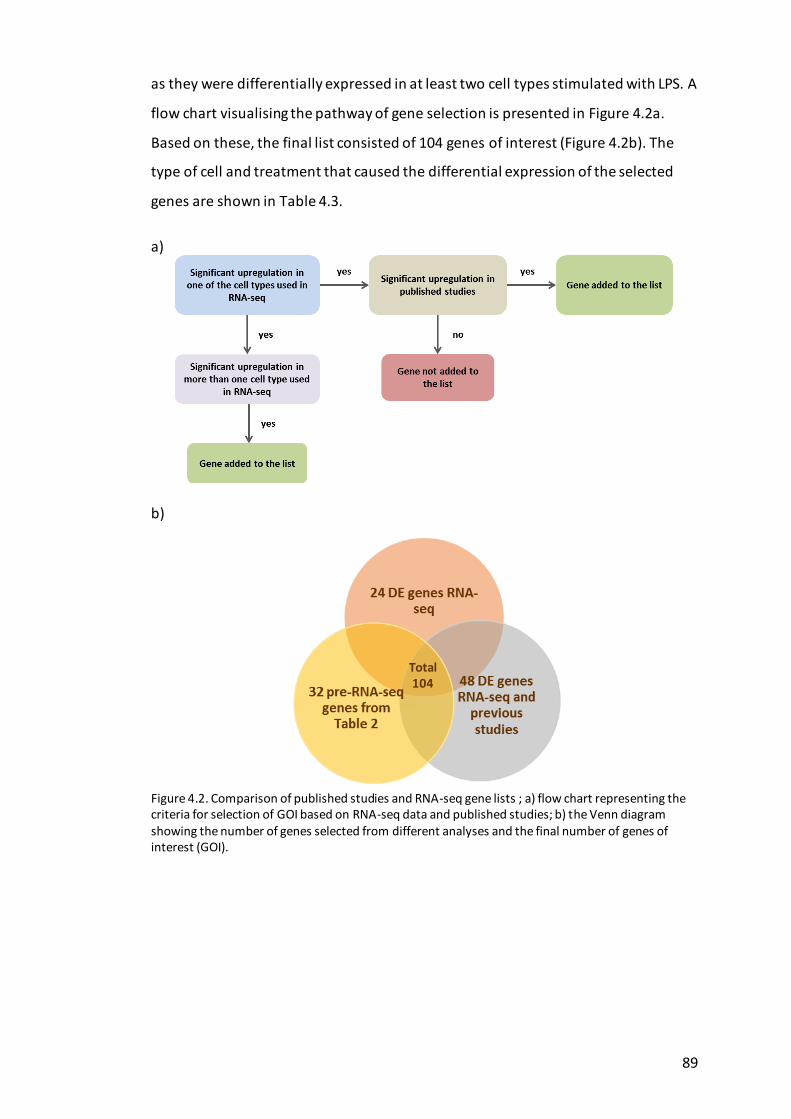
89
as they were differentially expressed in at least two cell types stimulated with LPS. A
flow chart visualising the pathway of gene selection is presented in Figure 4.2a.
Based on these, the final list consisted of 104 genes of interest (Figure 4.2b). The
type of cell and treatment that caused the differential expression of the selected
genes are shown in Table 4.3.
a)
b)
Figure 4.2. Comparison of published studies and RNA-seq gene lists ; a) flow chart representing the criteria for selection of GOI based on RNA-seq data and published studies; b) the Venn diagram showing the number of genes selected from different analyses and the final number of genes of interest (GOI).
Total 104

90
Table 4.3. Genes of interest and the type of studies with differential expression in mammalian species and the chicken.
Gene symbol Type of study with differential expression
ABCG2 BMDM and BMDC + LPS RNA-seq
ADM BMDM and BMDC + LPS RNA-seq; hNEUT + LPS; bMph + LPS;
hMph + bacteria and bacterial components
ATF3 HET +LPS RNA-seq; hMph + LPS
BATF3 BMDM and BMDC + LPS RNA-seq; ELC + ILTV; hNEUT + LPS
BCL2A1 HET and BMDM + LPS RNA-seq; hMph and hDCs + parasites; hDCs + E. coli, C. albicans, influenza virus
C3ORF52 BMDM and BMDC + LPS RNA-seq
CCL19 BMDM + LPS RNA-seq; chicken intestines + C. jejuni
CCL20 ELC + ILTV; chicken intestines + C. jejuni; chMph + LPS; HCA-7 C.
jejuni; hNEUT + LPS; bMph + LPS
CCL4 HET + S. Enteritidis; chPBMC + S. Enteritidis; HD11 + S.
Typhimurium; ELC + ILTV; Chicken spleen + NDV; hNEUT+ LPS; hMph + LPS; pMph + LPS
CCL5 bursa + IBDV; chMph + APEC; hMph + LPS; bMph + LPS; pMph+ LPS; hMph and DCs + parasites
CD40 BMDM and HET +LPS RNA-seq; bMph + LPS; chPBMC + S. Enteritidis
CD72 BMDM and BMDC + LPS RNA-seq; chicken intestines + C. jejuni
CD80 Chicken jejunum + S. Enteritidis; chPBMC + S. Enteritidis; bMph + LPS
CD83 HET + LPS RNA-seq; mMph + LPS; Chickens + IBDV; bMph + LPS; hNEUT + LPS; HD11 + S. Typhimurium; chMph + APEC; chicken intestines + C. jejuni; hMph + bacteria and bacterial
components; hMph and DCs + parasites
CSF1 BMDC RNA-seq ; pMph + LPS
CXCL13 BMDM and BMDC + LPS RNA-seq; Chicken spleen + NDV; pMph
+ LPS
CXCL13L2 BMDM and BMDC + LPS RNA-seq; chicken intestines + C. jejuni
CXCLI1 HET + S. Enteritidis; chicken intestines + C. jejuni; CE cells infected with avian metapneumovirus
CXORF21 HET and BMDM + LPS RNA-seq
DLG3 BMDM and BMDC + LPS RNA-seq
DTX2 HET and BMDM + LPS RNA-seq; chicken intestines + C. jejuni
EAF2 BMDM and BMDC + LPS RNA-seq
EDN1 BMDM + LPS RNA-seq; pMph +LPS; bMph + LPS; hMph and DCs + parasites
EGR1 HET + LPS RNA-seq; mMph + LPS; chicken intestines + C. jejuni
ENSGALG00000002955 BMDM and BMDC + LPS RNA-seq
ENSGALG00000005747 BMDM and BMDC + LPS RNA-seq
ENSGALG00000011172 BMDM and BMDC + LPS RNA-seq

91
ENSGALG00000015395,
ENSGALG00000027419
BMDM and BMDC + LPS RNA-seq
ENSGALG00000022324 BMDM and BMDC + LPS RNA-seq
ENSGALG00000025905 BMDM and BMDC + LPS RNA-seq
ENSGALG00000026592 HET and BMDC + LPS RNA-seq
ETS2 BMDM + LPS RNA-seq; bMph + LPS; hMph + LPS; hNEUT + LPS; hMph + bacteria and bacterial components
F3 BMDC + LPS RNA-seq; bMph + LPS
G0S2 HET and BMDC + LPS RNA-seq; hNEUT + LPS; hMph and DCs + parasites
GABRA5 BMDM + LPS RNA-seq ; chicken intestines + C. jejuni;
GCH1 BMDM + LPS RNA-seq; HD11 + S. Typhimurium; hNEUT + LPS;
hMph + bacteria and bacterial components
GLUL BMDM and BMDC + LPS RNA-seq
HPS5 BMDM and BMDC + LPS RNA-seq
IFIT5 Chicken spleen + NDV; chMph+ APEC; chicken intestines + C. jejuni; Chickens + IBDV
IL10RA HET ; hNEUT + LPS
IL12B HET + LPS RNA-seq; PMph + LPS; HET + S. Enteritidis; chPBMC+ S. Enteritidis; hMph + bacteria and bacterial components
IL13RA2 BMDC + LPS RNA-seq; chMph+ APEC
IL17REL HET and BMDM + LPS RNA-seq; chicken intestines + C. jejuni
IL18 Chicken spleen + NDV; Chickens + IBDV; pMph + LPS; hNEUT + LPS; bMph + LPS; Chickens + AIV
IL19 BMDM and BMDC + LPS RNA-seq
IL1B BMDC + LPS RNA-seq; hNEUT + LPS; bMph + LPS; hMph + LPS; pMph + LPS; chMph+ APEC; HD11 + S. Typhimurium; ELC+ ILTV;
chPBMC+ S. Enteritidis; chMph+ LPS; HET + S. Enteritidis; hMph and DCs + parasites; hDCs + E. coli, C. albicans, influenza virus
IL1R2 HET + LPS RNA-seq; hNEUT + LPS
IL20RA BMDM + LPS RNA-seq ; chicken intestines + C. jejuni
IL4I1 HET and BMDC + LPS RNA-seq
IL6 HET and BMDM + LPS RNA-seq; bMph + LPS; HET + S. Enteritidis; ELC+ ILTV; chPBMC+ S. Enteritidis; hMph + bacteria and bacterial components; hMph and DCs + parasites; hDCs +
E. coli, C. albicans, influenza virus
IL8 HD11 + S. Typhimurium; ELC+ ILTV; chPBMC+ S. Enteritidis;
chicken intestines + C. jejuni; HET + S. Enteritidis; ELC+ ILTV; Chickens + IBDV; hMph + LPS; HCA-7 C. jejuni; pMph + LPS;
bMph + LPS; hMph + bacteria and bacterial components; hMph and DCs + parasites; hDCs + E. coli, C. albicans, influenza virus
iNOS chMph+ LPS; Chicken spleen + NDV; ELC+ ILTV; chMph+ APEC;
Chickens + IBDV
IRAK2 HD11 + S. Typhimurium; hNEUT + LPS; bMph + LPS

92
IRF1 chPBMC+ S. Enteritidis; chicken intestines + C. jejuni; Chicken
spleen + NDV; Chickens + IBDV; hMph + LPS; pMph + LPS; hMph + bacteria and bacterial components; hMph and DCs + parasites; Chickens + AIV
IRF10 Chicken spleen + NDV; chPBMC+ S. Enteritidis; Chickens + AIV
IRF7 Chicken spleen + NDV; chicken intestines + C. jejuni; chPBMC+
S. Enteritidis; hMph + LPS; pMph + LPS; hMph and DCs + parasites
IRG1 HET RNA-seq ; chicken intestines + C. jejuni; ELC+ ILTV
JUN HD11 + S. Typhimurium; chPBMC+ S. Enteritidis; hMph + bacteria and bacterial components
LYG2 BMDM + LPS RNA-seq; chicken intestines + C. jejuni; ELC+ ILTV
LYZ Chicken spleen + NDV; ELC+ ILTV; chicken intestines + C. jejuni
MADPRT BMDM and BMDC + LPS RNA-seq; chicken intestines + C. jejuni
MAFA BMDM and BMDC + LPS RNA-seq
MAFF BMDC + LPS RNA-seq; hMph + LPS
MARCKSL1 BMDM and BMDC + LPS RNA-seq; chicken intestines + C. jejuni
MYD88 ChPBMC+ S. Enteritidis; pMph + LPS; hMph and DCs + parasites;
Chickens + AIV
NDNF BMDM and BMDC + LPS RNA-seq
NFKB2 BMDC + LPS RNA-seq; chPBMC+ S. Enteritidis; chicken intestines + C. jejuni; hMph + LPS; hNEUT + LPS; hMph and DCs + parasites
NFKBIA HD11 + S. Typhimurium; hNEUT + LPS; bMph + LPS; pMph + LPS; hMph + bacteria and bacterial components; hMph and DCs + parasites
NFKBIZ chPBMC+ S. Enteritidis; ELC+ ILTV; hNEUT + LPS; PMph + LPS
NLRC5 BMDC + LPS RNA-seq ; HD11 + S. Typhimurium; hNEUT + LPS
NR4A3 HET + LPS RNA-seq; chicken intestines + C. jejuni; bMph + LPS
PFKFB3 BMDM and BMDC + LPS RNA-seq; bMph + LPS
PKD2L1 BMDM and BMDC + LPS RNA-seq
PLA2G5 BMDM + LPS RNA-seq ; chicken intestines + C. jejuni
PLK3 BMDM and BMDC + LPS RNA-seq; hNEUT + LPS
PPARG ELC+ ILTV; HET + S. Enteritidis: chicken intestines + C. jejuni
PTGS2 BMDM and BMDC + LPS RNA-seq; bMph + LPS; HET + S. Enteritidis; hMph and DCs + parasites
RASD1 HET + LPS RNA-seq; chicken intestines + C. jejuni; ELC+ ILTV
RNF19B BMDC + LPS RNA-seq ; chicken intestines + C. jejuni
SAAL1 BMDM and BMDC + LPS RNA-seq
SDC4 BMDM + LPS RNA-seq; HCA-7 + C. jejuni; hMph + bacteria and bacterial components; Chickens + AIV
SELE BMDC + LPS RNA-seq; pMph + LPS; chicken intestines + C. jejuni
SERPINE2 BMDM and BMDC + LPS RNA-seq
SLC39A8 BMDM + LPS RNA-seq; bMph + LPS
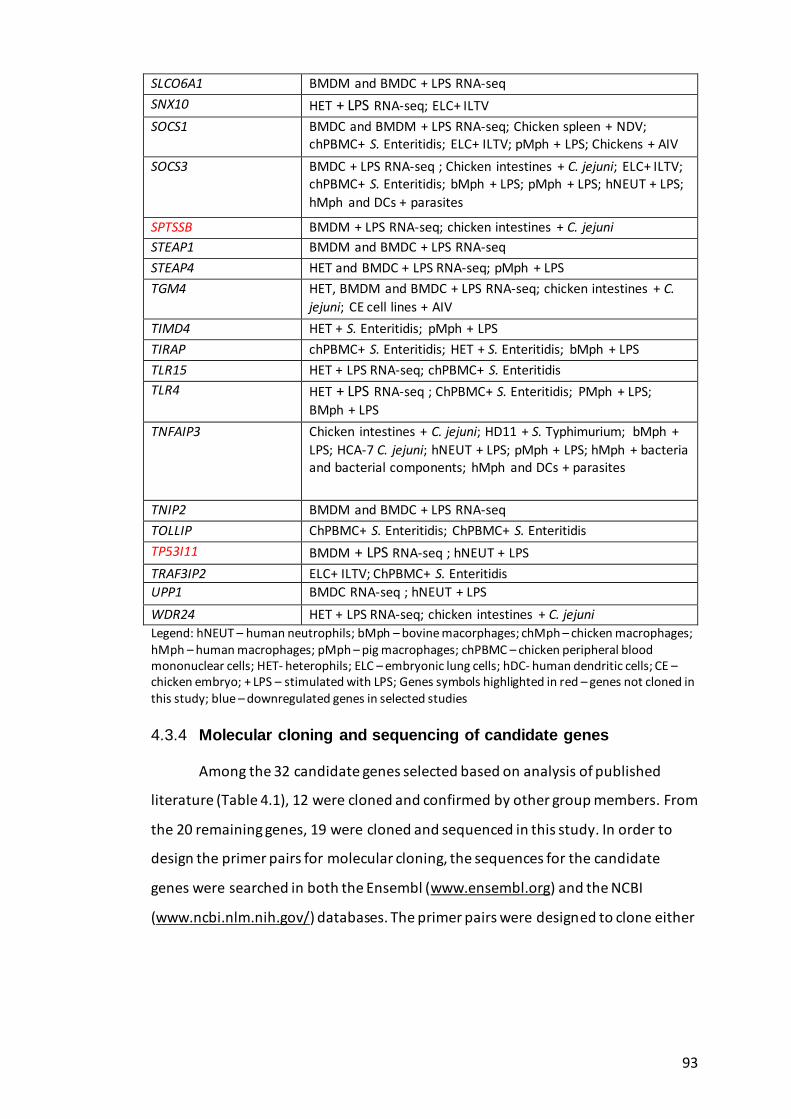
93
SLCO6A1 BMDM and BMDC + LPS RNA-seq
SNX10 HET + LPS RNA-seq; ELC+ ILTV
SOCS1 BMDC and BMDM + LPS RNA-seq; Chicken spleen + NDV; chPBMC+ S. Enteritidis; ELC+ ILTV; pMph + LPS; Chickens + AIV
SOCS3 BMDC + LPS RNA-seq ; Chicken intestines + C. jejuni; ELC+ ILTV; chPBMC+ S. Enteritidis; bMph + LPS; pMph + LPS; hNEUT + LPS;
hMph and DCs + parasites
SPTSSB BMDM + LPS RNA-seq; chicken intestines + C. jejuni
STEAP1 BMDM and BMDC + LPS RNA-seq
STEAP4 HET and BMDC + LPS RNA-seq; pMph + LPS
TGM4 HET, BMDM and BMDC + LPS RNA-seq; chicken intestines + C.
jejuni; CE cell lines + AIV
TIMD4 HET + S. Enteritidis; pMph + LPS
TIRAP chPBMC+ S. Enteritidis; HET + S. Enteritidis; bMph + LPS
TLR15 HET + LPS RNA-seq; chPBMC+ S. Enteritidis
TLR4 HET + LPS RNA-seq ; ChPBMC+ S. Enteritidis; PMph + LPS;
BMph + LPS
TNFAIP3 Chicken intestines + C. jejuni; HD11 + S. Typhimurium; bMph +
LPS; HCA-7 C. jejuni; hNEUT + LPS; pMph + LPS; hMph + bacteria and bacterial components; hMph and DCs + parasites
TNIP2 BMDM and BMDC + LPS RNA-seq
TOLLIP ChPBMC+ S. Enteritidis; ChPBMC+ S. Enteritidis
TP53I11 BMDM + LPS RNA-seq ; hNEUT + LPS
TRAF3IP2 ELC+ ILTV; ChPBMC+ S. Enteritidis
UPP1 BMDC RNA-seq ; hNEUT + LPS
WDR24 HET + LPS RNA-seq; chicken intestines + C. jejuni
Legend: hNEUT – human neutrophils; bMph – bovine macorphages; chMph – chicken macrophages; hMph – human macrophages; pMph – pig macrophages; chPBMC – chicken peripheral blood mononuclear cells; HET- heterophils; ELC – embryonic lung cells; hDC- human dendritic cells; CE – chicken embryo; + LPS – stimulated with LPS; Genes symbols highlighted in red – genes not cloned in this study; blue – downregulated genes in selected studies
Molecular cloning and sequencing of candidate genes 4.3.4
Among the 32 candidate genes selected based on analysis of published
literature (Table 4.1), 12 were cloned and confirmed by other group members. From
the 20 remaining genes, 19 were cloned and sequenced in this study. In order to
design the primer pairs for molecular cloning, the sequences for the candidate
genes were searched in both the Ensembl (www.ensembl.org) and the NCBI
(www.ncbi.nlm.nih.gov/) databases. The primer pairs were designed to clone either
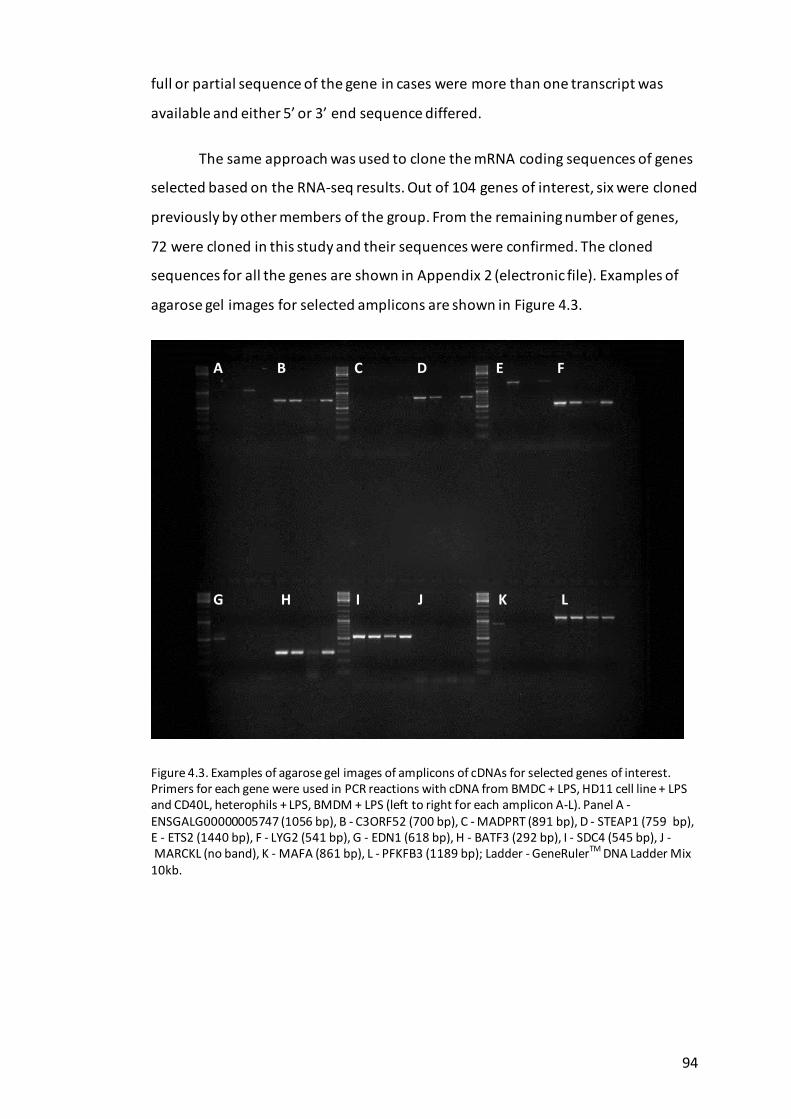
94
full or partial sequence of the gene in cases were more than one transcript was
available and either 5’ or 3’ end sequence differed.
The same approach was used to clone the mRNA coding sequences of genes
selected based on the RNA-seq results. Out of 104 genes of interest, six were cloned
previously by other members of the group. From the remaining number of genes,
72 were cloned in this study and their sequences were confirmed. The cloned
sequences for all the genes are shown in Appendix 2 (electronic file). Examples of
agarose gel images for selected amplicons are shown in Figure 4.3.
Figure 4.3. Examples of agarose gel images of amplicons of cDNAs for selected genes of interest. Primers for each gene were used in PCR reactions with cDNA from BMDC + LPS, HD11 cell line + LPS and CD40L, heterophils + LPS, BMDM + LPS (left to right for each amplicon A-L). Panel A - ENSGALG00000005747 (1056 bp), B - C3ORF52 (700 bp), C - MADPRT (891 bp), D - STEAP1 (759 bp), E - ETS2 (1440 bp), F - LYG2 (541 bp), G - EDN1 (618 bp), H - BATF3 (292 bp), I - SDC4 (545 bp), J - MARCKL (no band), K - MAFA (861 bp), L - PFKFB3 (1189 bp); Ladder - GeneRulerTM DNA Ladder Mix 10kb.
A B C D E F
G H I J K L

95
An example of agarose gel electrophoresis to confirm cloning of amplicons by
colony PCR is shown in Figure 4.4. Though in most cases amplicons of the expected
size were obtained, rarely amplicons of an aberrant number or size were detected
(e.g. amplicons from clones E2, G2, I3 and K1) .
Figure 4.4. Examples of agarose gel electrophoresis to validate pGEM-T clones of selected amplicons by PCR. Panel A - ENSGALG00000005747 (1056 bp), B - C3ORF52 (700 bp), C - MADPRT (891 bp), D - STEAP1 (759 bp), E - ETS2 (1440 bp), F - LYG2 (541 bp), G - EDN1 (618 bp), H - BATF3 (292 bp), I - SDC4 (545 bp), J - MAFA (861 bp), K - PFKFB3 (1189 bp); Ladder - GeneRulerTM DNA Ladder Mix 10kb.
G H I J K
A B C D E F
96
Discussion 4.4
The aim of this study was to select ~100 genes involved in innate immune
responses in chickens that represent immune robustness/performance. Their
expression will be examined using a high-throughput qPCR platform 96.96 Dynamic
Array from Fluidigm. Many genes are repeatedly used in qPCR experiments on
immune responses, such as proinflammatory cytokines and chemokines. These
genes are proven to be important markers in immune-related studies but there are
many additional genes which may assist in estimation of the immune robustness. To
create a broader view of immune performance, a list of genes of interest was
generated by scrutiny of available literature and RNA-seq analysis of primary cells
stimulated with bacterial LPS.
The use of whole transcriptome platforms, such as microarrays, or the use of
RNA-seq would be more informative as a screening tool but these techniques could
not be used for screening a larger number of birds in a rapid and cost-effective
manner. In addition, analysis of the sequencing data would be complex and time-
consuming. To be included in the list of genes of interest, the corresponding
transcript had to be upregulated at least twice in two different studies. This
instruction allowed selection of more genes, as many of the DE genes were only
characteristic to one of the experimental settings. The published studies were
performed with a number of pathogens infecting different organs or cell types. The
genes selected from those studies were upregulated in early timepoints suggesting
their involvement in the innate immune responses. Addition of the data from RNA-
seq studies performed on primary chicken cells stimulated with LPS expanded the
list of genes.
Molecular cloning was performed in order to confirm the sequences of
selected genes of interest as many of them have few mRNA transcript sequences
available in the databases. Therefore, the primer design had to include only the
common part of the transcript to avoid difficulties with molecular cloning. As a
result, many genes were detected in numerous cDNA samples used as a template,
which means that they were involved in immune responses to different

97
pathogens/antigens used in a particular study. There were also amplicons that were
only obtained in one of the cDNA templates used in the cloning panel and few were
not obtained at all. The reason behind this may lie in the primers not being optimal
for the qPCR reactions but also the design could have been based on an incorrectly
assembled or annotated sequence. The first release of the chicken genome draft in
2004 has proven to be an important tool in avian genomic research but since then
many changes have been introduced to improve the annotation. The main tools for
building predicted annotations were based on the homology with sequences from
human and mouse full-length cDNA making this approach successful for protein-
coding genes. This method was not effective when translated across to birds which
are evolutionary distant from mammals. This has proven to be even less useful for
the annotation of rapidly evolving innate immune genes or non-coding genes. The
Ensembl gene annotation protocol now incorporates the RNA sequencing data to
expand the prediction of chicken genes (Flicek et al., 2014). The gene list was
created before the update of Ensembl chicken genome with the RNA-seq results,
which could lead to changes in the mRNA sequences of the selected innate immune
genes. When genes were selected from previous studies, the gene symbols along
with the annotation IDs were examined to ensure that all studies reported
upregulation of the same mRNA fragment. Many genes have multiple names but
also mammalian nomenclature is often assigned to genes, which cause confusion
when used interchangeably with chicken names. By carefully selecting the gene
accession numbers and sequences behind them, the final list of cloned genes of
interest consists of transcripts that were confirmed to be overexpressed in various
studies.
Before high-throughput qPCR assays can be used to evaluate transcription of
the immune-related genes selected here, careful consideration of the reference
genes for normalisation of data is required. This is the subject of the next Chapter.
98
Reference gene normalisation Chapter 5
Introduction 5.1
The aim of this study was to select a set of genes that could serve as internal
controls in chicken immune-related tissue mRNA expression studies. The expression
levels of 7 reference genes: β-actin (ACTB), β-2-microglobulin (B2M),
glyceraldehyde-3-phosphate dehydrogenase (GAPDH), β-glucuronidase (GUSB),
TATA box binding protein (TBP), α-tubulin (TUBAT), r28S ribosomal RNA (r28S) were
measured in tissues (spleen, bursa, caecal tonsils, ileum and blood) isolated from
Aviagen male broilers reared on pedigree and sibling test farms. In order to identify
the most stable reference genes across the tested samples, the expression
stabilities of the reference genes were examined using three algorithms:
NormFinder, Best Keeper and geNorm. NormFinder and geNorm software recognise
the most suitable control genes by determining their stability value whereas
BestKeeper uses descriptive statistics and the Pearson correlation coefficient to
evaluate the most stable reference gene. The use of three algorithms to calculate
reference gene stability will guide the selection of the most reliable reference
gene(s) to avoid misinterpretation of expression studies.
Over the decades, different techniques have been applied to study
transcriptional regulation in infection studies from northern blotting, cDNA
microarrays, in situ hybridisation to quantitative PCR (qPCR) (Matulova et al., 2013;
Sandford et al., 2012; Bojesen et al., 2004). High sensitivity and potential for high
throughput and enhanced specificity makes qPCR the most exploited molecular
technique in host-pathogen interaction studies. These characteristics are very
important in immunological research where genes of interest frequently have many
splice variants and very low expression levels (Huggett et al., 2005). It is therefore
an especially useful technique in chicken immunology where not many species-
specific antibodies are commercially available (de Boever et al., 2008). Although it is
the most relevant method for many experiments, there are still many problems
associated with its use, mainly inherent variability of RNA samples and differences
in efficiencies of reverse transcription (RT) and PCRs (Bustin, 2002). An efficient

99
normalisation strategy is needed to collect reproducible and relevant qPCR results
corrected for non-biological sample-to-sample variations (Andersen et al., 2004).
Several strategies are available to correct experimentally introduced variation, each
with their own advantages and considerations (Huggett et al., 2005). Not all the
sources of variation can be completely reduced, therefore control along the entire
workflow of qPCR analysis is very important. Lack of standardisation of each step
and application of normalisation at the final step cannot eliminate errors (Ståhlberg
et al., 2003). Similar sample sizes for RNA extraction with DNase treatment and
reverse transcription are recommended together with use of standard curves using
samples spiked with known quantities of RNA molecules (Gilsbach et al., 2006).
These are the methods to indicate the efficiency of reverse transcription and qPCR
inhibition. All these aspects were discussed at the 3rd London qPCR Symposium in
April 2005 and the agreement was that the reference gene concept is the favoured
technique for normalisation of qPCR data. The Minimum Information for Publication
of Quantitative Real- Time PCR Experiments (MIQE) guidelines (Bustin et al., 2009)
describes the necessary information that should be included in evaluation of qPCR
experiments and publication of the work. The guidelines emphasise the need to use
more than one reference gene and the need to report the method of determination
of reference gene stability.
Several commercial companies provide optimised reference gene panels for
many species. The idea of using a housekeeping gene as an internal control is
attractive as those genes are affected by the same experimental variations as the
tested genes but are predicted to show stable constitutive expression. Quantitative
PCR results for a gene of interest are then normalised by using the housekeeping
reference gene that is measured using the same methods (Vandesompele et al.,
2009). To minimise inaccuracies there are several rules that can be followed, for
example: uniform sample size, RNA extraction method, reduction of gDNA
contamination and internal controls. These guidelines are not mutually exclusive
and can be all included in the protocol (Huggett et al., 2005). In theory, mRNA
expression levels of any reference gene are stable due to the permanent function

100
that they play in cellular processes (Zhu et al., 2008). Ideal reference genes show
consistent expression in varying experimental and environmental conditions.
Expression of genes of interest can then be normalised with internal control genes
in samples that vary in qualities and quantities of starting RNA. Differences in
enzymatic efficiencies are compensated when reference genes are used as
normalisers because they undergo the same preparation steps and are exposed to
the same treatments as the gene of interest.
So far an ideal reference gene has not yet been identified (Bär et al., 2009).
Many authors suggest that definite or universal internal control gene for every
condition in different tissues and cells does not exist (Vandesompele et al., 2002;
Coulson et al., 2008; Maltseva et al., 2013). There is an increasing number of studies
on widely employed reference genes that prove many of them are not resistant to
changes in the experimental environment (Bas et al., 2004; Yin et al., 2011; Sugden
at al., 2010; Yang et al., 2013; Schmittgen and Zakrajsek 2000; Lupberger et al.,
2002; Dheda et al., 2004; He at al., 2008; Yue et al., 2010). Based on these and
many other studies that prove there is no universal internal control for gene
expression analyses it has been suggested that determination of appropriate
reference genes should be performed for every qPCR experiment (Riemer et al.,
2012). Most frequently used reference genes are: ACTB, GAPDH, r18S or r28S.
GAPDH is a catalytic enzyme in glycolysis and it participates in DNA repair (Meyer-
Siegler et al., 1991). In the early years of qPCR technique, the use of GAPDH as a
reference gene was shown to be constant (Edwards and Denhardt 1985; Winer et
al., 1999). There have been many reports of GAPDH instability in gene expression
induced during the experiment (Lin et al., 2009; Sudgen et al., 2010). An
investigation of IL-4 and Toll-like receptors expression in TB patients has shown that
normalisation to inappropriate reference gene (GAPDH and ACTB) changed the
significance of results (Dheda et al., 2005). Earlier, Suzuki et al. (2000), Stűrzenbaum
and Kille (2001) established that GAPDH mRNA expression levels could be
influenced by experimental conditions, both in vivo and in vitro. Mozdziak et al.

101
(2003) also established that in chickens, nutritional manipulations can alter
transcription of GAPDH and its levels are upregulated with age.
Yin et al. (2011) evaluated the stability of expression for 11 genes in mouse
and 8 genes in chicken under different experimental conditions. Results have shown
that practice of use of popular reference genes without prior stability normalisation
could lead to inaccurate and divergent qPCR data. The conventional use of a single
reference gene was also demonstrated to introduce large errors (Vandesompele et
al. 2002). Often the decision which gene should be included as reference in
particular study is based on past experiments. The published studies on evaluation
of mRNA expression levels in different tissues or cells, under different treatments
and from various species use similar reference genes to normalise the data
(Banskota et al., 2015; Ji et al., 2014, Xiao et al., 2015). A literature search has also
shown that no single gene has been consistently used as reference gene in studies
related to chicken immune system (Abasht et al., 2009; Adams et al., 2009, Brisbin
et al., 2010).
RNA extraction techniques do not guarantee the total exclusion of genomic
DNA (gDNA), which in consequence could give false-positive readings unless reverse
transcription is designed to span exon-intron boundaries. Genomic pseudogenes
retain introns, thus their size is bigger (Smith et al., 2001). There are also intronless
pseudogenes that have arisen by retrotransposition. They resemble target
sequences and have 3’ polyA tail, therefore, designing primers that span intron -
exon boundaries is not applicable as these DNA structures cannot be distinguished
from cDNA (Mighell et al., 2000).
Researchers have used many methods to identify reference genes. The most
popular strategies are the use of algorithms such as GeNorm (Vandesompele et al.,
2002), BestKeeper (Pfaffl et al., 2004) and NormFinder (Andersen et al., 2004). As
the statistical methods behind these programs differ in their assumptions, many
researchers use more than one program to assess stability of candidate reference
genes (Chang et al., 2012; Ledderose et al., 2011; Perez et al., 2008).
102
Vandesompele et al. (2002) suggests using an expression stability index (M
value) that would be calculated based on mean pair-wise variations between the
gene and the other candidate genes across all samples. The underlying principle for
software is that the expression ratio of two reference genes is constant across all
samples. geNorm calculates pairwise variation for each gene with all other genes as
the standard deviation of the logarithmic transformed expression ratios. Next, the
stability value (M) is calculated as the pairwise variation of particular reference
gene with all other tested candidate genes. The software performs additional
variation analysis of normalisation factors calculated for an increasing number of
reference genes to determine the minimal number of reference genes for accurate
normalisation (Vandesompele et al., 2009). The NormFinder algorithm, developed
by Andersen et al. (2004), identifies the most stable gene (pair of genes) with the
use of mathematical model supported by a statistical framework. It ranks the
candidate genes in a given sample and given experimental design based on their
expression stability value. Mathematical, ANOVA-based model uses statistical
framework to determine the overall expression variation of the genes but also the
variation between subgroups. NormFinder relies on Q values to estimate the
stability of each gene. Quantities are first log-transformed and then used in an
ANOVA model-based approach to calculate expression variation where intra- and
inter-group variations are estimated. The two sources of variation represent
systematic error that will occur when the given gene will be used (Andersen et al.,
2004). The gene with the lowest M value is the most stable in expression and the
gene with the highest M value has the least stable expression. BestKeeper
calculates the gene expression variation for the chosen reference genes based on
the collected Cq values. The examination consists of two steps: first is the
descriptive statistics analysis: geometric mean (GM), arithmetic mean (AM),
minimal (Min) and maximal (Max) value, standard deviation (SD) and coefficient of
variance (CV). Using CV and SD values, in a second step, pairwise correlation
analysis is performed using BestKeeper Index (BKI). The most stable genes have the
lowest CV and where the SD value is below 1. Internal controls with SD higher than
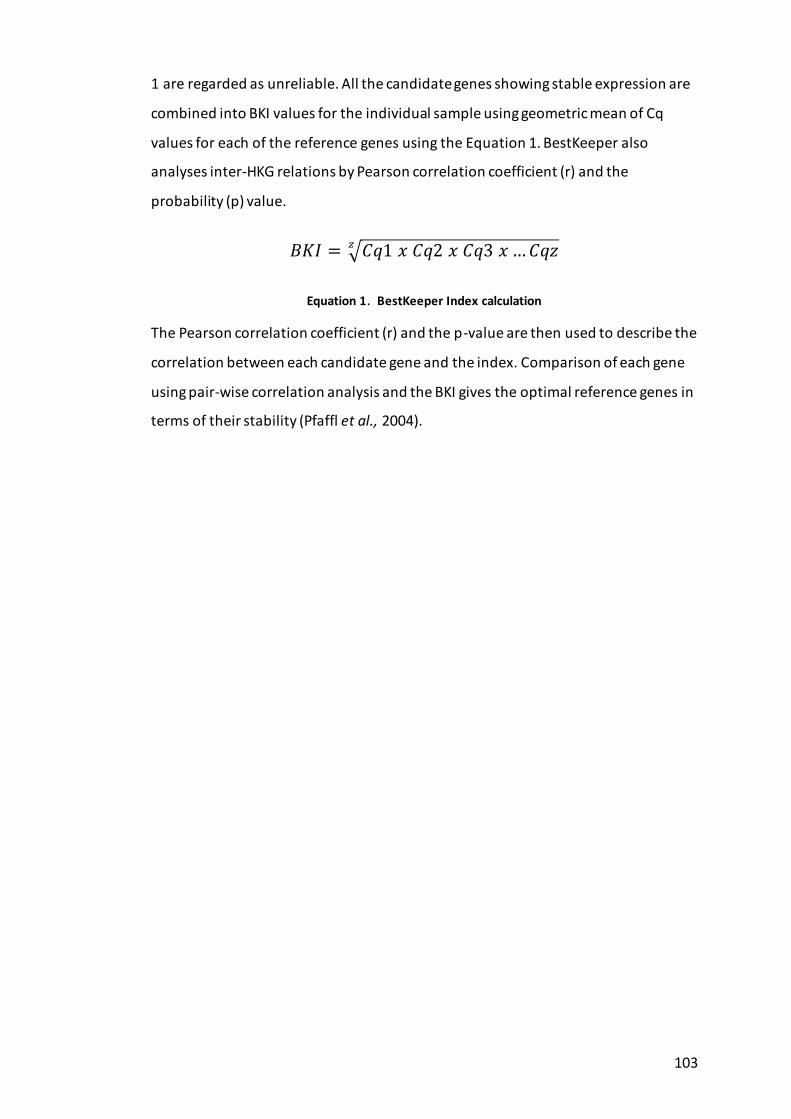
103
1 are regarded as unreliable. All the candidate genes showing stable expression are
combined into BKI values for the individual sample using geometric mean of Cq
values for each of the reference genes using the Equation 1. BestKeeper also
analyses inter-HKG relations by Pearson correlation coefficient (r) and the
probability (p) value.
𝐵𝐾𝐼 = √𝐶𝑞1 𝑥 𝐶𝑞2 𝑥 𝐶𝑞3 𝑥 … 𝐶𝑞𝑧𝑧
Equation 1. BestKeeper Index calculation
The Pearson correlation coefficient (r) and the p-value are then used to describe the
correlation between each candidate gene and the index. Comparison of each gene
using pair-wise correlation analysis and the BKI gives the optimal reference genes in
terms of their stability (Pfaffl et al., 2004).

104
Materials and methods 5.2
Tissue collection 5.2.1
Samples were collected from broiler chickens reared at an Aviagen high
biosecurity pedigree farm and a farm where environment aimed to resemble
broader commercial conditions - sibling test farm. The 3-week-old birds (n=10)
came from the same hatch. Bursa of Fabricius, spleen, caecal tonsils and part of the
gut (ileum) were collected and stored at 4°C in RNAlater until further use. Blood, in
a volume of ~1 ml, was collected into EDTA containing tubes and isolation of white
blood cells was performed the same day, as described in Chapter 2, section 2.5.4.
RNA extraction and cDNA synthesis 5.2.2
To perform EvaGreen-based qPCRs for reference gene normalisation, total
RNA was isolated from collected tissue and blood samples and reversely transcribed
to generate cDNA, which was then used as a qPCR template. Total RNA was isolated
using an RNeasy Mini Kit (Qiagen, Crawley, UK), as described in Chapter 2, section
2.6.1 and 2.6.2 with an additional DNase step. The quality and quantity of extracted
total RNA was evaluated by spectrophotometry using a NanoDrop™ 1000
instrument. First-strand cDNA synthesis was performed using a SuperScript III
reverse transcription kit (Paisley, UK) containing random primers (Sigma-Aldrich,
Poole, UK), as described in Chapter 2, section 2.7.2. The same amount of total RNA
(1 μg) was used to generate cDNA from the tissues and blood collected. The cDNA
was stored in -20°C until further use.
Gene selection and quantitative PCR 5.2.3
Seven genes commonly used as reference genes in quantitative PCR (qPCR)
gene expression experiments were selected and are briefly described in Table 5.1.
All qPCR primers were designed using Primer Express Software 3.0 (Life
Technologies) and synthesised by Sigma Aldrich (Poole, UK). Primer sequences and
amplicons length are shown in Appendix 1, Table 6. Quantitative PCR, using 7500
Fast Real-Time PCR System was performed as described in Chapter 2, section 2.7.6.
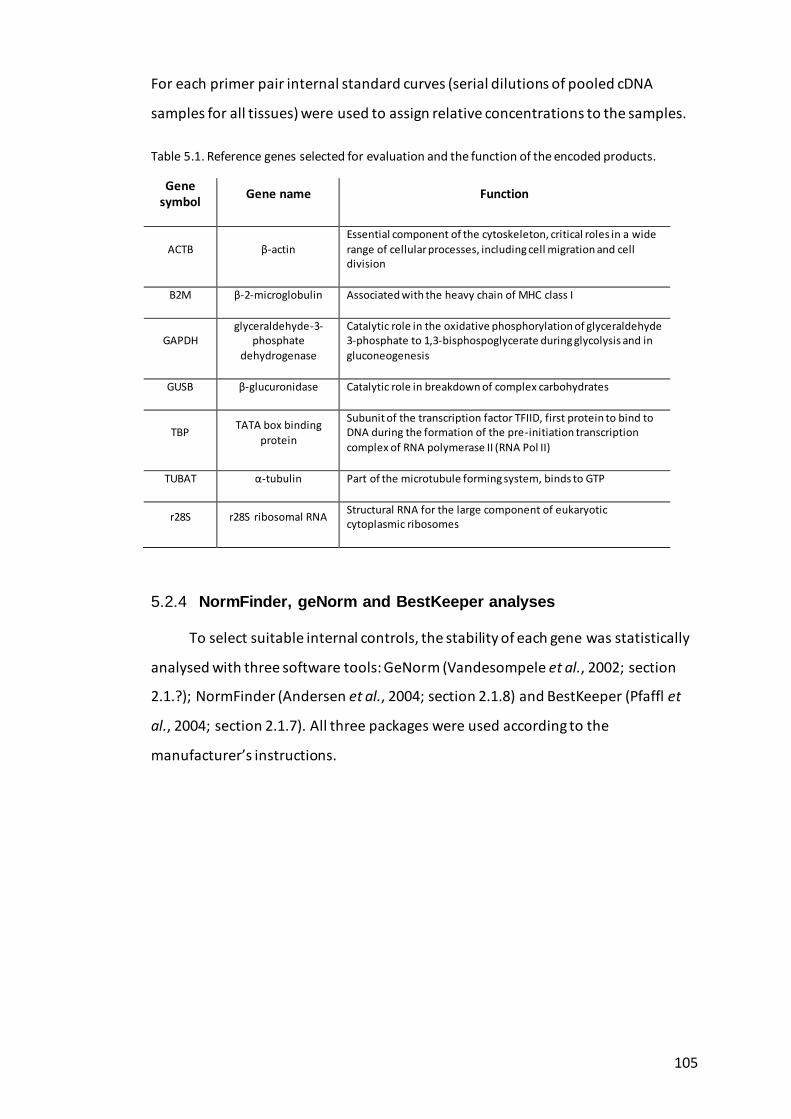
105
For each primer pair internal standard curves (serial dilutions of pooled cDNA
samples for all tissues) were used to assign relative concentrations to the samples.
Table 5.1. Reference genes selected for evaluation and the function of the encoded products.
Gene symbol
Gene name Function
ACTB β-actin
Essential component of the cytoskeleton, critical roles in a wide
range of cellular processes, including cell migration and cell division
B2M β-2-microglobulin Associated with the heavy chain of MHC class I
GAPDH glyceraldehyde-3-
phosphate
dehydrogenase
Catalytic role in the oxidative phosphorylation of glyceraldehyde 3-phosphate to 1,3-bisphospoglycerate during glycolysis and in
gluconeogenesis
GUSB β-glucuronidase Catalytic role in breakdown of complex carbohydrates
TBP TATA box binding
protein
Subunit of the transcription factor TFIID, first protein to bind to DNA during the formation of the pre-initiation transcription
complex of RNA polymerase II (RNA Pol II)
TUBAT α-tubulin Part of the microtubule forming system, binds to GTP
r28S r28S ribosomal RNA Structural RNA for the large component of eukaryotic cytoplasmic ribosomes
NormFinder, geNorm and BestKeeper analyses 5.2.4
To select suitable internal controls, the stability of each gene was statistically
analysed with three software tools: GeNorm (Vandesompele et al., 2002; section
2.1.?); NormFinder (Andersen et al., 2004; section 2.1.8) and BestKeeper (Pfaffl et
al., 2004; section 2.1.7). All three packages were used according to the
manufacturer’s instructions.

106
Results 5.3
Validation of reference gene primers 5.3.1
Primer pairs for seven reference genes were designed against the template
using Primer Express software 3.0 and following six strict conditions described in
Chapter 2, section 2.7.5. Primers pairs span exon-intron boundaries for the ACTB,
B2M, GAPDH, GUSB and TBP gene. The r28S ribosomal RNA does not carry coding
sequence and the TUBAT gene primer pair does not cross exon-intron boundaries,
as attempts to optimise previously designed oligonucleotides were unsuccessful.
Primer pair specificity was tested in qPCR by examining the melting curve
performed at the end of the reaction (Figure 5.1a). The single peak with no
shouldering suggested the specificity of primer annealing. Primer pairs that
produced more than one peak and/or shoulder were tested again and, when
needed, redesigned. Amplicons from qPCR reactions were confirmed by agarose gel
electrophoresis, where a single band suggested a single amplicon. Results of melting
curve analysis are shown in Figure 5.1b.

107
a)
D
eriv
ativ
e re
po
rter
(-R
n) ACTB B2M GAPDH
GUSB TBP TUBAT
r28S Temperature (°C)
b)
Figure 5.1. Specificity of qPCR reaction with reference gene primers ; a) melting curve analysis to define the specificity of reference gene qPCR; b) agarose gel electrophoresis of the corresponding qPCR amplicons.
AC
TB
B2
M
GA
PD
H
GU
SB
TBP
TUB
AT
28
S
100 bp

108
Expression profiles of reference genes 5.3.2
Expression profiles of each reference gene were examined by calculating
quantification cycle (Cq) value, which represents the cycle number at which the
fluorescence generated in the reaction crosses the fluorescence threshold above
the background signal. It usually is the middle of exponential phase of reaction. The
expression levels of the seven reference genes tested varied widely between the
genes studied with Cq values ranging from 9 to 38 cycles (Figure 5.2) and most of
the Cq values were between 18 and 31 cycles. The r28S gene was most abundantly
transcribed with Cq values of less than 17 cycles and ACTB, B2M and GAPDH were
moderately expressed with average Cq values between 18 and 23 cycles. GUSB, TBP
and TUBAT showed average Cq values between 27 and 31 cycles. The lowest
expression level was observed in TUBAT with Cq value as high as 38 cycles. The
inspection of raw Cq values alone is not sufficient for determining gene expression
stability. The data obtained from qPCR were further analysed using NormFinder,
geNorm and BestKeeper. Only the last algorithm allows for input of raw Cq data
from qPCR. For the others, data was transformed into relative quantities. The
transformation process is described in paragraph 5.3.3.
Figure 5.2. Quantification cycles (Cq) values reflecting expression levels of seven reference genes in all tissues tested. Data points represent single sample (n=50, 10 birds, 5 tissues) Cq value for particular reference gene.
0
5
10
15
20
25
30
35
40
Qu
nat
ific
atio
n c
ycle
(C
q) ACTB
B2M
GAPDH
GUSB
TBP
28S
TUBAT

109
Transformation of Cq values to quantities (Q) 5.3.3
Quantification cycle values were generated in qPCRs for each gene tested
and in each tissue sample derived from birds reared on the pedigree and sib ling test
farms. In order to optimise qPCRs for each reference gene, 10-fold serial dilutions of
pooled cDNA samples (n=50) were tested on the same plate to avoid run-to-run
differences and results were used to generate standard curves. To calculate the
efficiency of reaction, the slope value was calculated from serial dilutions for each
gene, which was then used to determine the efficiency of reaction (Equation 2).
Complete calculations for all reference genes are presented in Appendix 1, Table 7
for the sibling-test farm and Table 8 for the pedigree farm. In order to obtain
accurate and reproducible results, reactions should have efficiency close to 2
(100%), which means that the template doubles with each cycle during exponential
amplification. A slope of - 3.32 indicates optimal PCR efficiency.
𝑬 = 𝟏𝟎(− 𝟏/𝒔𝒍𝒐𝒑𝒆)
alternative [%] 𝑬 = (𝟏𝟎(−𝟏/𝒔𝒍𝒐𝒑𝒆) − 𝟏) x 100
Equation 2. Calculation of efficiency (E) of reaction
Mean quantification cycle (Cq) values were transformed into quantities (Q) by the
deltaCq (ΔCq) method where the Cq value of a particular sample was related to the
control/calibrator. In this experiment, the control/calibrator was the sample with
the highest expression (lowest Cq value). Relative quantities were generated by the
ΔCq formula for transforming Cq values to relative quantities with the highest
expression level set to one (Equation 3).
𝑸 = 𝑬−𝜟𝑪𝒒
Equation 3. Relative quantities formula
The ΔCq method generated raw, non-normalised expression values, which required
normalisation if used for gene expression studies, by dividing with the normalisation

110
factor. The Q values were used as input data in NormFinder and geNorm
programmes.
NormFinder analysis 5.3.4
The analysis with NormFinder software identified ACTB and TBP as the best
combination of genes for all tissues with a stability value across all tissues of 0.076,
where TBP (0.110) was ranked the most stable gene. The TUBAT gene (0.596) was
ranked the most unstable gene in tissue panel tested. The stability of the genes
varied depending on the tissue tested. Analysis was also performed for each tissue
type separately. TBP was ranked the most stable gene in bursa (0.188), spleen
(0.052) and caecal tonsils (0.157). In the Peyer’s patches region of the ileum, GUSB
(0.220) was ranked the most stable. In blood samples, GAPDH (0.137) was selected
as the best gene. In spleen and blood TBP was paired with GUSB (0.037 and 0.147),
in bursa samples with GUSB (0.171), in caecal tonsils with r28S (0.125) and in ileum
with ACTB (0.194) as the best pair of genes. Results showing the most stable genes
and their stability values as predicted by NormFinder are shown in Table 5.2.
Table 5.2. NormFinder (NF) analysis of the most stable reference genes and their stability values for all sample tested.
Tissue Best gene NF stability value Combination of two genes NF stability value
Bursa TBP 0.188 GUSB, TBP 0.171
Spleen TBP 0.052 GAPDH, TBP 0.037
Caecal tonsils TBP 0.157 r28S, TBP 0.125
Ileum GUSB 0.22 ACTB, TBP 0.194
Blood GAPDH 0.137 B2M, GAPDH 0.147
All tissues TBP 0.11 ACTB, TBP 0.076
Legend: ACTB - β-actin; b2m - β-2-microglobulin; GAPDH - glyceraldehyde-3-phosphate dehydrogenase; GUSB - β-glucuronidase; TBP - TATA box binding protein; TUBAT - α-tubulin; r28S - r28S ribosomal RNA.
Overall, the TBP gene was selected as the most stable gene in most of the
tissues either as the best gene or paired with a second gene as the best reference
gene combination in given tissue panel. When samples from two different farms

111
were examined separately, TBP was selected as the best gene for tissues from birds
raised on the pedigree farm and the best combination of two genes was TBP and
GAPDH (0.154). For the sibling test farm GAPDH was paired with GUSB (0.096) and
GUSB was ranked the most stable.
geNorm analysis 5.3.5
Reference gene normalisation was also performed using geNorm, a visual
basic application (VBA) for Excel. The analysis of all samples from both farms using
geNorm identified TBP and B2M (M = 0.73) as the most stable pair of genes (Table
5.3). Similar to analysis with NormFinder, ranking of genes was performed on
separate tissues. For both bursa and spleen tissues GAPDH and TBP were selected
the best pair of genes with stability M values of 0.4 and 0.34, respectively. Ileum
and blood tissues shared B2M as one of the most stable genes that was paired with
TBP (M = 0.79) and GAPDH (M = 0.4), respectively. Caecal tonsils analysis resulted in
ACTB and r28S (M = 0.42) being the best pair of reference genes. Results are shown
in Table 5.3.
Table 5.3. geNorm analysis showing the pairs of most stable reference genes for each tissue sample tested and their stability expression M value.
Tissue Combination of two genes geNorm M value
Bursa GAPDH, TBP 0.4
Spleen GAPDH, TBP 0.34
Caecal tonsils ACTB, r28S 0.42
Ileum B2M, TBP 0.79
Blood B2M, GAPDH 0.4
All tissues B2M, TBP 0.73
Legend: ACTB - β-actin; b2m - β-2-microglobulin; GAPDH - glyceraldehyde-3-phosphate dehydrogenase; GUSB - β-glucuronidase; TBP - TATA box binding protein; TUBAT - α-tubulin; r28S - r28S ribosomal RNA.
The geNorm algorithm proposes the optimal number of reference genes in
studied samples. The levels of variation in average reference gene stability are

112
calculated based on the stepwise inclusion of a subsequent gene or genes. The
geNorm software calculates normalisation factor (NF) from at least two genes. The
pairwise variation (V) between two sequential NFs is determined. The additional NF
for reference gene should decrease the variation, preferably below the cut-off point
of 0.15 in order to include it in the panel of final reference genes for given samples.
In this study, addition of a fourth gene caused the decrease in variation in stability
in all types of tissues. For bursa and spleen tissues, ACTB and B2M were included,
which decreased variation in stability to 0.13 and 0.14 respectively. For caecal
tonsils, TBP and GAPDH addition had similar effect (V = 0.14). In case of ileum ACTB
and r28S, decreased variation in stability from 0.25 to 0.22 and in blood ACTB and
TBP reduced the variation to 0.17. When all tissues were analysed together,
addition of ACTB and GAPDH to the calculation caused the decrease in variation to
an almost ideal point of 0.16 (Figure 5.3).
Figure 5.3. The pairwise variation (Vn/Vn + 1) between the normalisation factors NFn and NFn+1 to determine the optimal number of reference genes for normalisation.
0.23
0.16 0.16 0.16
0.28
0
0.15
0.3
V2/3 V3/4 V4/5 V5/6 V6/7
pai
rwis
e v
aria
tio
n
Normalisation factor

113
BestKeeper analysis 5.3.6
In this study, Cq values of all tissues for each reference gene tested were
combined. The first step of analysis showed that none of the genes passed the
ranking based on standard deviation (SD) and coefficient of variance (CV) levels.
According to BestKeeper developers, the standard deviation for any given gene
should be below value of 1. Genes with this parameter higher than 1 can be
considered inconsistent. Standard deviations for all of the analysed genes were
higher than 1, with TUBAT SD of 3.03. The lowest SD were calculated for ACTB
(1.27) and r28S (1.22). Based on the results from descriptive statistics for all tissues
combined, ranking of reference genes using BestKeeper was impossible.
The Cq values for tissues were tested separately. Results are presented in
Table 5.4. Standard deviation of Cq values from bursa (Table 5.4a) were below value
of 1 for ACTB, GAPDH, TBP and r28S. The lowest CV was calculated for TBP. Based
on those rankings B2M, GUSB and TUBAT were excluded from the analysis.
BestKeeper Index calculated based on the remaining four reference genes was then
correlated with each gene separately. The highest correlation was for ACTB,
followed by GAPDH, TBP and r28S.
The same approach was used to analyse Cq data from caecal tonsils (Table
5.4b). Standard deviation for B2M and TUBAT were above 1 and genes were
excluded from the analysis. This resulted in high correlations, with p values lower
than 0.001, for all remaining genes: r28S, TBP, GUSB, GAPDH and ACTB.
In BestKeeper analysis of ileum tissues (Table 5.4c) three reference genes
(B2M, TUBAT and r28S), were excluded from further calculations based on their
high SD. Further analysis with four remaining genes showed the highest correlation
for TBP, GUSB and ACTB, with GAPDH having the lowest correlation among tested
genes.
Based on descriptive statistics calculations performed on Cq values from
spleen, TBP and TUBAT did not pass the ranking (Table 5.4d). After exclusion of TBP
and TUBAT from the analysis, calculations of correlation showed that ACTB was the
most stable gene, followed by GAPDH, B2M, r28S and GUSB.
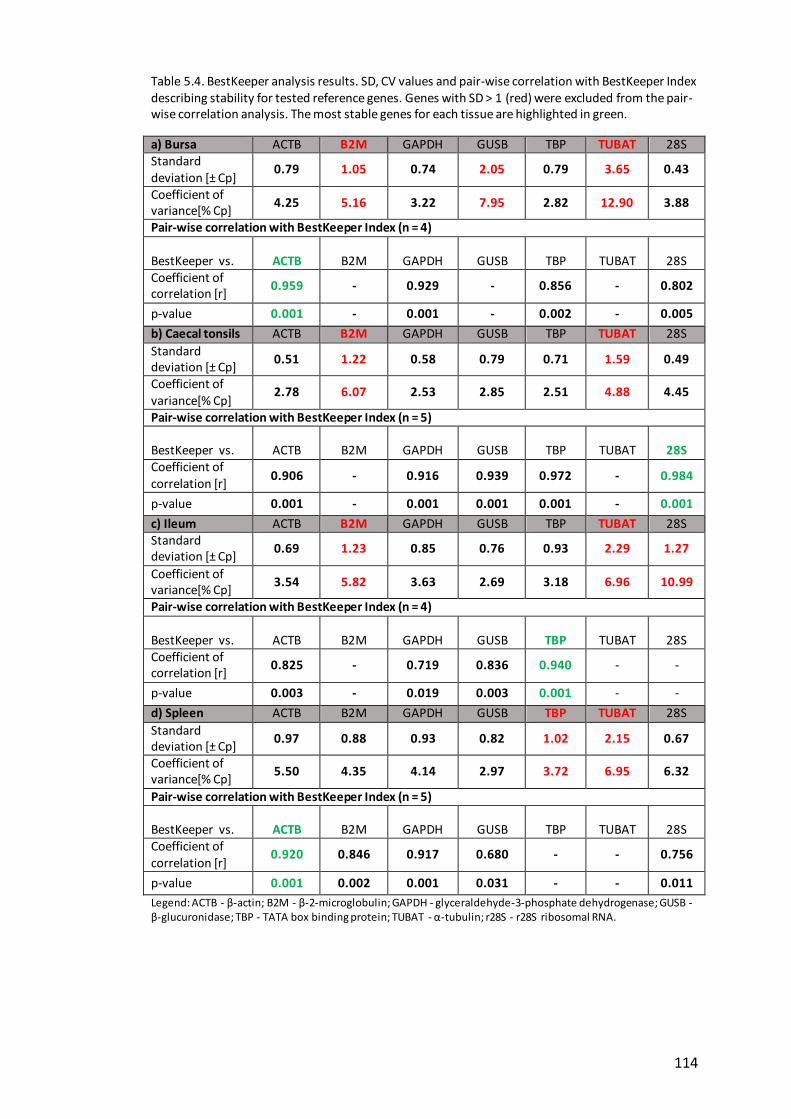
114
Table 5.4. BestKeeper analysis results. SD, CV values and pair-wise correlation with BestKeeper Index describing stability for tested reference genes. Genes with SD > 1 (red) were excluded from the pair-wise correlation analysis. The most stable genes for each tissue are highlighted in green.
a) Bursa ACTB B2M GAPDH GUSB TBP TUBAT 28S Standard deviation [± Cp]
0.79 1.05 0.74 2.05 0.79 3.65 0.43
Coefficient of variance[% Cp]
4.25 5.16 3.22 7.95 2.82 12.90 3.88
Pair-wise correlation with BestKeeper Index (n = 4) BestKeeper vs. ACTB B2M GAPDH GUSB TBP TUBAT 28S Coefficient of correlation [r]
0.959 - 0.929 - 0.856 - 0.802
p-value 0.001 - 0.001 - 0.002 - 0.005
b) Caecal tonsils ACTB B2M GAPDH GUSB TBP TUBAT 28S
Standard deviation [± Cp]
0.51 1.22 0.58 0.79 0.71 1.59 0.49
Coefficient of variance[% Cp]
2.78 6.07 2.53 2.85 2.51 4.88 4.45
Pair-wise correlation with BestKeeper Index (n = 5) BestKeeper vs. ACTB B2M GAPDH GUSB TBP TUBAT 28S Coefficient of correlation [r]
0.906 - 0.916 0.939 0.972 - 0.984
p-value 0.001 - 0.001 0.001 0.001 - 0.001
c) Ileum ACTB B2M GAPDH GUSB TBP TUBAT 28S Standard deviation [± Cp]
0.69 1.23 0.85 0.76 0.93 2.29 1.27
Coefficient of variance[% Cp]
3.54 5.82 3.63 2.69 3.18 6.96 10.99
Pair-wise correlation with BestKeeper Index (n = 4) BestKeeper vs. ACTB B2M GAPDH GUSB TBP TUBAT 28S Coefficient of correlation [r]
0.825 - 0.719 0.836 0.940 - -
p-value 0.003 - 0.019 0.003 0.001 - -
d) Spleen ACTB B2M GAPDH GUSB TBP TUBAT 28S
Standard deviation [± Cp]
0.97 0.88 0.93 0.82 1.02 2.15 0.67
Coefficient of variance[% Cp]
5.50 4.35 4.14 2.97 3.72 6.95 6.32
Pair-wise correlation with BestKeeper Index (n = 5) BestKeeper vs. ACTB B2M GAPDH GUSB TBP TUBAT 28S Coefficient of correlation [r]
0.920 0.846 0.917 0.680 - - 0.756
p-value 0.001 0.002 0.001 0.031 - - 0.011
Legend: ACTB - β-actin; B2M - β-2-microglobulin; GAPDH - glyceraldehyde-3-phosphate dehydrogenase; GUSB - β-glucuronidase; TBP - TATA box binding protein; TUBAT - α-tubulin; r28S - r28S ribosomal RNA.

115
Blood samples Cq values were also tested in BestKeeper. Results were similar
to the test performed on all tissues. All reference gene standard deviation values
were higher than one, which excluded them from analysis.

116
Discussion 5.4
The present study simultaneously investigated a panel of seven commonly
used reference genes in order to establish their expression stability in varied tissue
samples and birds. NormFinder and geNorm results differed slightly. BestKeeper
ranking only agreed with NormFinder when caecal tonsil samples were analysed.
The results for all tissues combined in one analysis were available only from
NormFinder and geNorm. Three out of four most stable genes were common for
both analyses: TBP, GAPDH and ACTB. In separate tissues, TBP was the most
common gene selected by NormFinder and geNorm. There are no published studies
that use TBP as a reference gene in chicken mRNA expression experiments. Recent
investigation of five candidate genes in tissues related to growth and fat deposition
showed that TBP was the most stably expressed in chicken thigh muscle and second
most stable in liver but its expression varied in breast muscle and fat tissue (Bages
et al., 2015). TBP was stably expressed together with B2M in bovine granulosa cells
subjected to different plating densities, oxygen concentrations and follicle
stimulating hormone (FSH) stimulation (Baddela et al., 2014). The geNorm software
selected B2M and ACTB as the most optimal reference genes in qPCR studies on
human mesenchymal stem cells where other programs did not agree and ranked
ACTB, GAPDH and TBP as the most unstable for that type of cells (Li et al., 2015).
The variation of expression of a particular candidate gene may be due to its role in
the tested tissue which has been shown in case of GAPDH where 72 human cells
and tissues where used. The results exposed up to 14-fold difference of expression
between some of the samples used (Barber et al., 2005). In this study, GAPDH and
ACTB surprisingly were ranked as the second or third stable reference genes in
some chicken lymphoid tissues. A different study on human bone marrow-derived
mesenchymal stromal cells showed that TBP is the most stably expressed together
with TFRC and HPRT1 (Rauh et al., 2015).
There are few published studies on results of reference gene normalisation in
chicken tissues or cells but all of the existing results differ in ranking of the genes.
Most of the studies focused on chicken embryo fibroblasts (CEFs) as a virus

117
infection model. Yin et al. (2011) indicated ACTB as the most stably expressed gene
in CEFs infected with Newcastle disease virus (NDV) and GAPDH with 18S as the
least stable genes based on their transcriptional profiles only. Yue et al. (2010) used
CEFs infected with avian influenza virus (AIV) and showed in cell response studies
that YWHAZ is the most stable gene, where in virus replication studies ACTB and
RPL4 were most reliable controls according to geNorm calculations. The same
software was used to determine the best reference gene in CEFs infected with
subgroup J avian leukosis virus (ALV-J). The geNorm ranked RPL30 and SDHA as the
best candidates and ACTB and GAPDH as the least stable genes (Yang et al., 2013).
Studies by the de Boever et al. (2008) on LPS inflammation in chickens resulted in
GAPDH and UBC being the best pair of internal controls. In duck and chicken
primary lung cells, infected with low pathogenic AIV and high pathogenic AIV,
GAPDH was ranked as the second best reference gene after 18S (Kuchipudi et al.,
2012). The use of ribosomal RNA as normaliser has been controversial based on its
technical limitations and led to exclusion from the analysis (Lu et al., 2013).
Nevertheless, ribosomal RNA, including r28S and r18S has been shown to be a
stably expressed reference (Wang et al., 2011; Roge et al., 2007). Li et al. (2007)
reported that r28S was among few genes with stable expression in chicken embryo
cells (CEs) infected with infectious bursal disease virus (IBDV) but in the same
experiment, B2M and TBP were the least stable according to gene fold changes. In
in vitro stimulation of human blood cells, TBP was shown to be good reference gene
in studies on T lymphocytes, neutrophils and total blood leukocytes (Ledderose et
al., 2011). In the current study r28S ranked as the most stable gene in caecal tissues
together with TBP according to NormFinder and geNorm. After including additional
genes to the best combination in geNorm analysis, r28S was the fourth most stable
reference gene in ileum tissue. Although all tissues were normalised with genes
selected by analysing values from all samples together it would be advantageous to
select different panel for each tissue in separate calculations.

118
This study is the first report of reference gene normalisation in chicken
lymphoid tissues. These results demonstrate the need to carefully select reference
genes for immune gene expression studies as the frequently used genes and
ribosomal RNA are not always appropriate internal controls. Although this
experiment showed that TBP, GAPDH and ACTB are the suitable gene expression
normalisers it is strongly recommended to test internal controls as a first
experiment in gene expression studies. The selected reference genes will be used in
the high-throughput qPCR experiment described in Chapter 6.

119
Optimisation and validation of 96.96 Dynamic Chapter 6
Array as a diagnostic tool
Introduction 6.1
The main objectives for this chapter were to develop and validate a custom
Fluidigm qPCR array for analysis of the transcription of immune-related genes as a
tool for rapid screening of immune robustness in chickens. Working with our
partners in Aviagen, the aim was to compare gene expression in related birds in
high biosecurity clean housing (‘pedigree farm’) and an environment with lower
biosecurity akin to commercial broiler farms (‘sibling test farm’), as well as to define
the extent of variance between animals in a given environment. A further goal for
this study was to compare responses in peripheral blood compared to internal
organs as a predictor of the robustness of immune responses in the chicken, as non-
lethal methods would allow selective breeding from the live birds screened.
Immune responses to encountered microorganisms are coordinated on
cellular and molecular levels. The most exhaustive analysis of tissues and cells can
be achieved by studying RNA expression. For many years researchers focused their
efforts on nucleic-acid based tools to detect transcripts, with microarrays being the
most widely used tool (Germain et al., 2011). Although the levels of mRNA inside
the cells do not always correspond with the amount of proteins that will be
produced, exploring immune responses at transcript levels is more accessible.
Large-scale gene expression analyses are widely used in biological and medical
studies (Zhong et al., 2008; Nie et al., 2010; Zheng-Bradley et al., 2010). Depending
on the aim of the study, different tools can be implemented, such as RNA
sequencing, microarrays or qPCR-based platforms, to analyse changes in the
transcriptome (Svec et al., 2013). Screening hundreds of targets and samples in
parallel qPCR for gene expression is possible with high throughput qPCR tools, for
example the 96.96 Dynamic Array from Fluidigm (Spurgeon et al., 2008). This type
of gene expression platform supports the effort of broad, unbiased explorations of
biological systems in comparison to studying a single component in much detail
with previously set hypotheses (Benoist et al., 2006).

120
The Fluidigm chip has been used to study mRNA and miRNA gene expression
in different species, for example in pig lung tissues infected with influenza virus
H1N2 (Skovgaard et al., 2013) or bovine mammary epithelial cells from mastitis
infections (Sorg et al., 2013). There are also Fluidigm platforms available for single-
cell gene expression analysis (Pieprzyk and High, 2009). The Fluidigm 96.96 chip
produces data for 96 transcripts in each of 96 total RNA samples (9,216 reactions in
total). Optimisation of primers, reverse transcription and preamplification, prior the
use of chip is essential in order to obtain reliable data. The integration of results
from such a high-throughput qPCR platform with confirmed biological networks is a
useful approach for gene expression studies.
In this study, transcription of immune-related genes defined in Chapter 4 was
compared in a genotypically similar commercial line of chickens housed separately
at two different levels of biosecurity. The organs that were sampled included: gut-
associated lymphoid tissues (caecal tonsils, ileum part with Peyer’s Patches), bursa,
spleen and peripheral blood leukocytes. All of these tissues are well known to play a
role in immune responses. Gene expression responses to viral infections have been
studied in the bursa (Smith et al., 2015; Rasoli et al., 2015; Smith et al., 2014). Gene
expression in caecal tonsils has been studied in response to bacterial infections,
mainly with Salmonella and Campylobacter (Akbari et al., 2008; Shaughnessy et al.,
2009) but also to viral (Heidari et al., 2015) and parasitic infections (Wils-Plotz et al.,
2013). The spleen is very important in mounting both innate and adaptive immune
responses and is crucial for immune regulation, therefore its responses to different
stimuli, including parasites and viruses, have been widely studied (Pleidrup et al.,
2014; Lian et al., 2012; Hong et al., 2012). The most frequently studied chicken
blood cells are lymphocytes but heterophils and peripheral blood leukocytes as a
whole population were also examined during infections (Chiang et al., 2008;
Sandford et al., 2012).
The high-biosecurity ‘pedigree’ farm sampled herein resembles a specific-
pathogen free setting and the ‘sibling-test’ farm mimics the commercial farm

121
environment. The populations received different vaccines (in detail 6.2.1 section). It
cannot be said with precision what types of pathogens and microflora were acting
on the immune system of birds in the different environments but there were
certainly pathogens present on sibling-test farm, including E. coli and Eimeria
species. From a breeder point of view, identifying transcriptional signatures
associated with immune robustness in a basal state, or improved responses to
exposure to pathogen challenge, would only be valid if birds with desirable
characteristics could be further used in breeding programme, hence a blood test
would be the ideal tool.

122
Materials and methods 6.2
Tissue collection and sample preparation 6.2.1
Tissues and blood samples were obtained from eight Aviagen broilers from
the same hatch. Four birds were raised in a high-biosecurity environment (the
pedigree farm), and four birds were raised in an experimental, pathogen-
challenged, sibling-test farm. The pedigree farm birds were vaccinated at hatchery
against MDV and IBV then against coccidiosis at day 5, against avian rhinotracheitis
(TRT) at day 11 and against IBDV at day 15. Birds housed at the sibling-test farm
were vaccinated against TRT, NDV and IBV at hatch and only received IBDV vaccine
at day 19. The samples were collected at three weeks of age. Fragments
(0.5 x 0.5 cm) of four tissues (bursa, spleen, caecal tonsils and ileum with Peyer’s
patches) were collected aseptically from the same locations in each bird and stored
in RNAlater until further use. Peripheral blood (1 ml) was collected into tubes
containing EDTA. Peripheral blood leukocytes (PBLs) were isolated on the same day,
as described in Chapter 2, section 2.5.4. RNA extractions for PBLs and tissues were
performed as described in Chapter 2 section 2.6.1 and 2.6.2 with an additional
DNase digestion step in the cell extraction protocol.
cDNA synthesis 6.2.2
Reverse transcription was performed using SuperScript III (Invitrogen) as
described in Chapter 2, section 2.7.2. In the first strand reaction, one μg of total
RNA was used. Synthesised cDNA was diluted 1:5 in nuclease-free water prior to
preamplification. Reverse transcription using a High Capacity Reverse Transcription
Kit (Applied Biosystems, UK) was performed as described in Chapter 2, section 2.7.3.
Primer design and optimisation 6.2.3
The qPCR primer design is described in Chapter 2, section 2.7.5. Final primer
sequences are presented in Appendix 1, Table 5. The primer pairs were tested in
qPCR reactions with serial dilutions of pooled cDNA obtained from RNA isolated
from tissues and cells from various infection studies. A melting curve step was
performed to evaluate the specificity of primer pairs. The selected products were

123
purified using Nucleo-Spin Gel and a PCR Clean-up kit (Macherey-Nagel, UK) before
sequencing. The primer pairs were screened for potential cross-reactivity using the
AutoDimer algorithm.
The BioMark System qPCR 6.2.4
The BioMark System with 96.96 Dynamic Array platform allows to
simultaneously perform 9,216 reactions, as described in Chapter 1, section 1.5.4
and Chapter 2, section 2.10. A stock of primer mix was prepared by mixing one μl of
each primer pair, excluding r28S and ENSGALG00000015395 primers, to the final
concentration of 200 nM. Preamplification was performed as described in Chapter
2; section 2.10.4. Unincorporated primers were digested with exonuclease I
enzyme, as described in Chapter 2, section 2.10.5. To optimise the preamplification,
different volumes of PreAmp Master Mix and different dilutions of template cDNA
were used to test optimal concentrations. The qPCR was performed using the
Applied Biosystems 7500 Fast Real-Time PCR System. Thermal cycling conditions are
described in Chapter 2, section 2.7.6. Sample and assay mixes were prepared as
described in Chapter 2, section 2.10.6 and stored in 4°C until further use. The
priming and loading of 96.96 chip was performed as described in Chapter 2, section
2.10.7 and 2.10.8. The BioMark HD system Data Collection Software was used to
perform the qPCR as described in Chapter 2, section 2.10.9.
Data analysis settings and visualisation 6.2.5
To analyse the data from 96.96 Dynamic Array Real-Time PCR Analysis
Software was used as described in Chapter 2, section 2.10.9. The raw Cq values in a
.csv file were used as an input data in GenEx5 software. Pre-processing, statistical
analysis and visualisation was performed as described in Chapter 2, section 2.10.10
and 2.10.11.

124
Results 6.3
Primer optimisation 6.3.1
The designed primer pairs were tested in qPCR using serial dilutions of pooled
cDNA samples isolated from tissues from various infection studies as a template.
The same cDNA pool was used throughout. The melting curve of each primer pair
was examined to evaluate their specificity. Examples of melting curves and their
interpretation are shown in Figure 6.1. Each primer pair in this study was set to
work efficiently at the concentration of 1.15 μM in the final reaction mix to avoid
mistakes in the qPCR workflow.
a)
b)
c)
CCL19 IL19 NOS2
d)
e)
f)
CD40 STEAP1 TLR4
Figure 6.1. Examples of optimisation of primer pairs based on melting curve analysis. The melting curves for each primer pair were investigated; a) two peaks reflects two amplicons; b) one distinctive peak corresponds to a single amplicon and additional peaks to genomic DNA products; c) one peak with a shoulder corresponds to genomic DNA amplification; d) no peak corresponds to no amplification; panels e) and f) show further examples of the desired melting curve.

125
The use of DNA binding dye – EvaGreen, as an amplification detector, instead of
internal oligonucleotide probes, allowed to design and test several primer pairs
around the transcript of interest. The design of primer pairs was considered
successful once the melting curve analysis showed a single sharp peak with no
additional peaks or shoulders and when single band was visualised by agarose gel
electrophoresis. The qPCR products with many peaks in the melting curves
presented in Figure 6.1 produced multiple species on agarose gels, as shown in
Figure 6.2.
Figure 6.2. Examples of primer specificity confirmation by agarose gel electrophoresis. Selected qPCR products were tested; 1 – CCL19; 2 – IL19; 3 – CD40; 4 – NOS2.
Amplicons from a subset of 10 qPCR reactions that produced only a single species
were excised from the agarose gel, cleaned-up and sequenced. Results for selected
alignments are shown in Figure 6.3.
1
2
3 4 100 bp
100 bp
100 bp
2
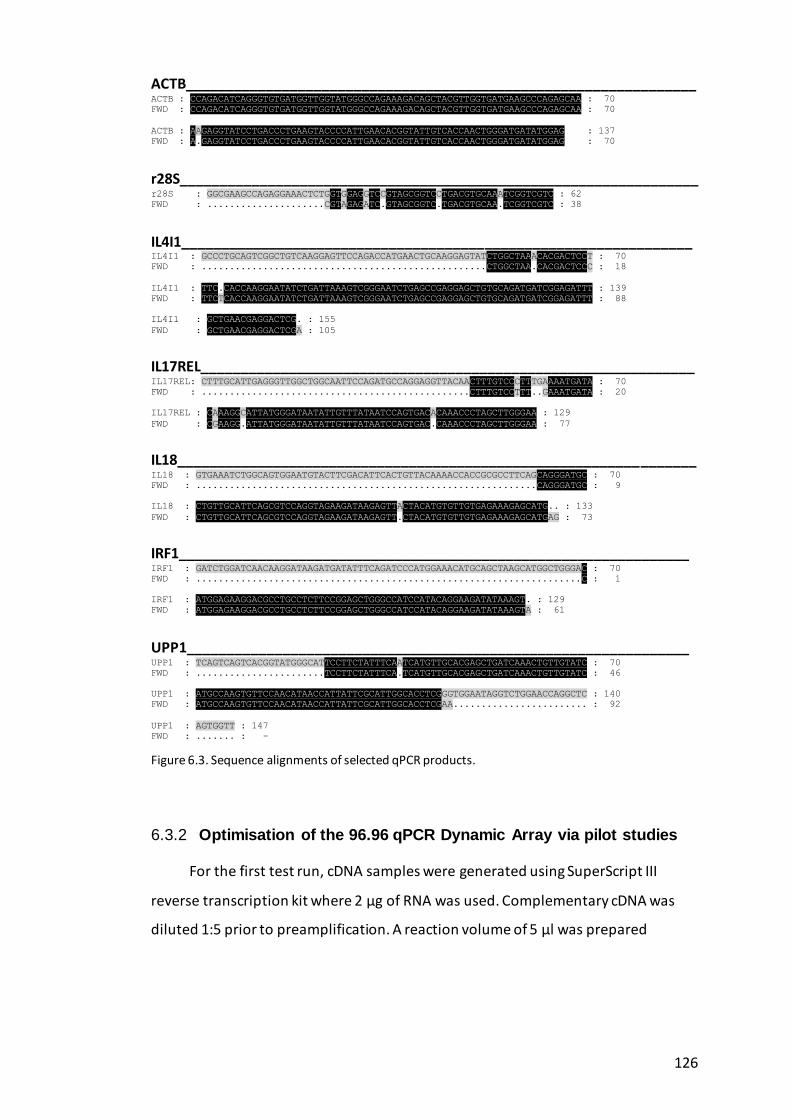
126
ACTB________________________________________________________________ ACTB : CCAGACATCAGGGTGTGATGGTTGGTATGGGCCAGAAAGACAGCTACGTTGGTGATGAAGCCCAGAGCAA : 70
FWD : CCAGACATCAGGGTGTGATGGTTGGTATGGGCCAGAAAGACAGCTACGTTGGTGATGAAGCCCAGAGCAA : 70
ACTB : AAGAGGTATCCTGACCCTGAAGTACCCCATTGAACACGGTATTGTCACCAACTGGGATGATATGGAG : 137
FWD : A.GAGGTATCCTGACCCTGAAGTACCCCATTGAACACGGTATTGTCACCAACTGGGATGATATGGAG : 70
r28S_________________________________________________________________ r28S : GGCGAAGCCAGAGGAAACTCTGGTGGAGGTCCGTAGCGGTCCTGACGTGCAAATCGGTCGTC : 62
FWD : .....................CGTAGAGATC.GTAGCGGTC.TGACGTGCAA.TCGGTCGTC : 38
IL4I1________________________________________________________________ IL4I1 : GCCCTGCAGTCGGCTGTCAAGGAGTTCCAGACCATGAACTGCAAGGAGTATCTGGCTAAACACGACTCCT : 70
FWD : ...................................................CTGGCTAA.CACGACTCCC : 18
IL4I1 : TTC.CACCAAGGAATATCTGATTAAAGTCGGGAATCTGAGCCGAGGAGCTGTGCAGATGATCGGAGATTT : 139
FWD : TTCTCACCAAGGAATATCTGATTAAAGTCGGGAATCTGAGCCGAGGAGCTGTGCAGATGATCGGAGATTT : 88
IL4I1 : GCTGAACGAGGACTCG. : 155
FWD : GCTGAACGAGGACTCGA : 105
IL17REL______________________________________________________________ IL17REL: CTTTGCATTGAGGGTTGGCTGGCAATTCCAGATGCCAGGAGGTTACAACTTTGTCCCTTTGAAAATGATA : 70
FWD : ................................................CTTTGTCCTTT..GAAATGATA : 20
IL17REL : CAAAGGCATTATGGGATAATATTGTTTATAATCCAGTGACACAAACCCTAGCTTGGGAA : 129
FWD : CGAAGG.ATTATGGGATAATATTGTTTATAATCCAGTGAC.CAAACCCTAGCTTGGGAA : 77
IL18_________________________________________________________________ IL18 : GTGAAATCTGGCAGTGGAATGTACTTCGACATTCACTGTTACAAAACCACCGCGCCTTCAGCAGGGATGC : 70
FWD : .............................................................CAGGGATGC : 9
IL18 : CTGTTGCATTCAGCGTCCAGGTAGAAGATAAGAGTTACTACATGTGTTGTGAGAAAGAGCATG.. : 133
FWD : CTGTTGCATTCAGCGTCCAGGTAGAAGATAAGAGTT.CTACATGTGTTGTGAGAAAGAGCATGAG : 73
IRF1________________________________________________________________ IRF1 : GATCTGGATCAACAAGGATAAGATGATATTTCAGATCCCATGGAAACATGCAGCTAAGCATGGCTGGGAC : 70
FWD : .....................................................................C : 1
IRF1 : ATGGAGAAGGACGCCTGCCTCTTCCGGAGCTGGGCCATCCATACAGGAAGATATAAAGT. : 129
FWD : ATGGAGAAGGACGCCTGCCTCTTCCGGAGCTGGGCCATCCATACAGGAAGATATAAAGTA : 61
UPP1_______________________________________________________________ UPP1 : TCAGTCAGTCACGGTATGGGCATTCCTTCTATTTCAATCATGTTGCACGAGCTGATCAAACTGTTGTATC : 70
FWD : .......................TCCTTCTATTTCA.TCATGTTGCACGAGCTGATCAAACTGTTGTATC : 46
UPP1 : ATGCCAAGTGTTCCAACATAACCATTATTCGCATTGGCACCTCGGGTGGAATAGGTCTGGAACCAGGCTC : 140
FWD : ATGCCAAGTGTTCCAACATAACCATTATTCGCATTGGCACCTCGAA........................ : 92
UPP1 : AGTGGTT : 147
FWD : ....... : -
Figure 6.3. Sequence alignments of selected qPCR products.
Optimisation of the 96.96 qPCR Dynamic Array via pilot studies 6.3.2
For the first test run, cDNA samples were generated using SuperScript III
reverse transcription kit where 2 μg of RNA was used. Complementary cDNA was
diluted 1:5 prior to preamplification. A reaction volume of 5 μl was prepared

127
comprising 2.5 μl of PreAmp Mix and 2.5 μl 200 nM primer mix stock which included
primers for r28S and ENSGALG00000015395 genes. The thermal reaction consisted
of 16 cycles. Preamplified cDNA was diluted 1:4 in low EDTA-TE buffer without
Exonuclease I treatment. Results are presented as a heat map in Figure 6.4.
Figure 6.4. Heat map view of qPCR results from first optimisation of 96.96 Dynamic Array. Reactions were performed with 95 genes including 6 reference genes, in columns and 40 samples from Aviagen broilers in rows (technical duplicates). Each square represents one of the 9,216 chambers with contained qPCR reactions with colour-coded level of Cq values.
Examination of amplification curves for all genes indicated that many target
transcripts were only detected very late in the qPCR cycling programme, (around
26-27 cycles, which is near the completion of qPCR reaction), as indicated by navy
blue colour on the heat map. In case of genes that were amplified early in the qPCR
reaction (e.g. r28S, ENSGALG00000015395) the melting curve examination showed
specific amplification. For most of the genes with an amplification signal, melting
Cq value

128
curve analysis showed non-specific products caused by residual primers. The first
96.96 Dynamic Array run using preamplified cDNA did not produce positive results
in the case of most of the genes tested, as it was not properly optimised. Although
the preamplification step was performed as described in Rødgaard et al. (2012),
where PreAmp mix volume was 5 μl and DNA used was diluted 1:5, not many genes
were expressed.
Several changes in sample preparation were applied to resolve the problems
encountered during first run. In the next pilot study, the complementary DNA was
reversely transcribed from not more than 100 ng/μl of total RNA. Newly made cDNA
was not diluted before preamplification. The primer mix (200 nM) did not contain
primers for r28S and ENSGALG00000015395 transcripts, as these genes proved to
be highly abundant and could bias the efficiency of the preamplification reaction.
The crucial step in multiplex PCR is the removal of unincorporated primers. In this
study exonuclease I, from Escherichia coli (Lehman and Nussbaum, 1964) was used
to digest primers that were not incorporated into newly made amplicons. The
changes in sample preparation in this second pilot study did not result in useable
qPCR data. Only r28S and ENSGALG00000015395 transcripts were amplified,
despite absence of their primer pairs in the preamplification mix (data not shown).
To test the hypothesis of preamplification inhibition, a third test run was performed
where cDNA without preamplification was used. The cDNA from samples predicted
to have high levels of the target transcripts was selected to make serial dilutions,
specifically from the HD11 cell line stimulated with LPS and CD40 ligand, heterophils
stimulated with Salmonella Enteritidis, or spleens from IBDV and MDV infected
birds and splenocytes stimulated with LPS. The results of the third pilot trial are
presented in Figure 6.5. Non-preamplified cDNA qPCR resulted in stronger
fluorescence signals than preamplified samples in previous tests. Although this third
pilot experiment confirmed that the RNA is reverse transcribed there was a need to
confirm if different samples from infection studies would yield similar results with
and without preamplification.
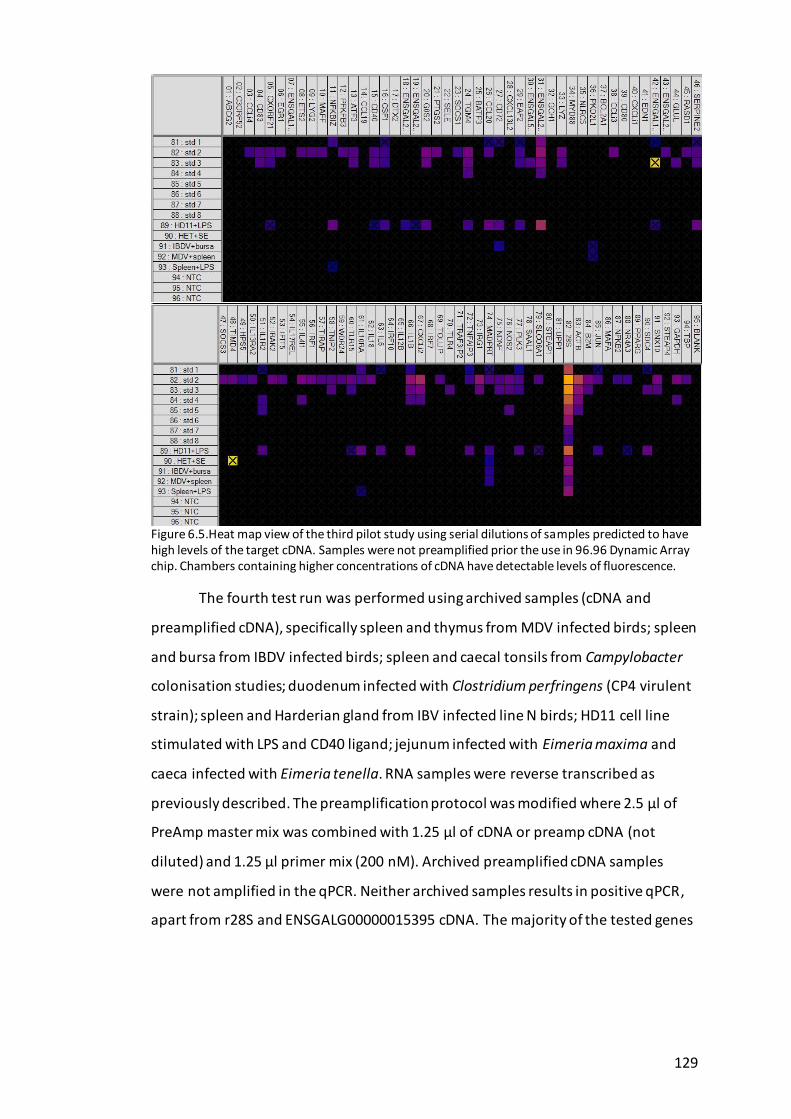
129
Figure 6.5.Heat map view of the third pilot study using serial dilutions of samples predicted to have high levels of the target cDNA. Samples were not preamplified prior the use in 96.96 Dynamic Array chip. Chambers containing higher concentrations of cDNA have detectable levels of fluorescence.
The fourth test run was performed using archived samples (cDNA and
preamplified cDNA), specifically spleen and thymus from MDV infected birds; spleen
and bursa from IBDV infected birds; spleen and caecal tonsils from Campylobacter
colonisation studies; duodenum infected with Clostridium perfringens (CP4 virulent
strain); spleen and Harderian gland from IBV infected line N birds; HD11 cell line
stimulated with LPS and CD40 ligand; jejunum infected with Eimeria maxima and
caeca infected with Eimeria tenella. RNA samples were reverse transcribed as
previously described. The preamplification protocol was modified where 2.5 μl of
PreAmp master mix was combined with 1.25 μl of cDNA or preamp cDNA (not
diluted) and 1.25 μl primer mix (200 nM). Archived preamplified cDNA samples
were not amplified in the qPCR. Neither archived samples results in positive qPCR,
apart from r28S and ENSGALG00000015395 cDNA. The majority of the tested genes

130
were not amplified in selected samples from infection studies and most of the
fluorescence signal recovered was very weak (data not shown).
The preamplification step is claimed to be crucial for use of 96.96 chip as the
volumes of the reactions are very small (6 nl) and low expressed genes may not be
detected. The qPCR performed on cDNA returned positive results but only in case of
genes with high mRNA levels. Preamplified cDNA produced positive outcomes only
for genes that were not included in preamplification primer mix. Therefore, there is
a need to optimise the protocol for preamplification, as the recommended
guidelines did not yield positive results.
Preamplification optimisation 6.3.3
The preamplification or specific target amplification is a multiplex PCR with a
limited number of cycles where simultaneous gene expression of many targets
occurs (Mengual et al., 2008). As only primers for genes of interest are used in the
PCR, no other target is amplified and the relationship between targets is preserved
(Korenkova et al., 2015). Although is it the essential part of the workflow in these
type of applications it is the least studied step in qPCR. Preamplification should
increase the yield of qPCR and highly expressed samples should have Cq ~ 5-15
cycles, where low expressed targets are characterised by Cq values around cycle 20.
The cDNA for two samples – caecal tonsils and bursa from Aviagen broilers were
prepared using 500 ng of total RNA and the SuperScript III kit. β-actin (ACTB) mRNA
gene expression was examined in selected samples. Three preamplification mixes
ranging from 2.5 μl (Mix 1), 5 μl (Mix 2) to 7.5 μl (Mix 3) of PreAmp master mix and
different concentrations of cDNA were tested in conventional qPCR machine. Two
cycle numbers for thermal cycling were tested and preamplified cDNA was diluted
ten times after exonuclease I treatment. Results are shown in Figure 6.6. Non-
preamplified cDNA was amplified earlier in reaction cycle compared to preamplified
cDNA. Both caecal tonsils and bursa samples preamplified in three different
reactions resulted in Cq values higher than 25 for 15-cycle PreAmp and Cq equal or

131
higher than 30 for 18-cycle PreAmp. The lowest Cq values was observed for 15-cycle
mix 3 where the highest volume of PreAmp master mix was used.
a)
b)
Figure 6.6. Preamplification test in 5 μl performed using a standard qPCR machine ; expression of ACTB in a) cDNA of caecal tonsils and b) cDNA of bursa. Three master mixes tested in two reactions using bursa and caecal tissues. Non-preamplified cDNA (1/5 dilution) used as a control in qPCR. The error bars represent SD from three technical replicates.
The next optimisation attempt involved increasing the volume of PreAmp Master
mix to 20 μl and decreasing cycle numbers to 10. Samples were treated with
exonuclease I. Different concentrations of RNA were used in reverse transcription
reaction. Results are shown in Figure 6.7. Increasing the reaction volume to 20 μl
resulted in positive preamplification despite the lower number of thermal cycling.
Preamplified samples, reverse transcribed from 250 ng of total RNA and both neat
and diluted 1/10 were amplified earlier than non-preamplified cDNA. Only bursa
cDNA made from 125 ng of total RNA, preamplified and diluted 10 times resulted in
a Cq value being higher than non-preamplified cDNA.
According to the manufacturer’s description the PreAmp Master Mix was
optimised on total RNA reverse transcribed using a High Capacity Reverse
Transcription Kit. The next step was to use the same RT kit and test newly made
preamplified cDNA and diluted 10 times in qPCR. The test was performed using
cDNA made from 100 ng/μl RNA, as recommended by the manufacturer. Two RT
reaction volumes were made, 10 μl and 20 μl, to test the same RNA concentration.
0
5
10
15
20
25
30
35
40
Mix 1 Mix 2 Mix 3 cDNA
Cq
th
resh
old
15 cycles
18 cycles
cDNA
0
5
10
15
20
25
30
35
40
Mix 1 Mix 2 Mix 3 cDNA
Cq
th
resh
old
15 cycles
18cycles
cDNA

132
Preamplification mix consisted of 2.5 μl PreAmp Master Mix, 1.25 μl of primer mix
(200 nM) and 1.25 μl of neat cDNA. Samples were treated with exonuclease I.
Results are shown in Figure 6.8.
a)
b)
Figure 6.7. Preamplification test in 20 μl reaction volume and 10-cycle PCR ; expression of ACTB in a) caecal tonsils cDNA; b) bursa cDNA. Two concentrations, 250 ng and 125 ng, of RNA were used to make cDNA. Non-preamplified cDNA (1/5 dilution) was used as a control in the qPCR. The error bars represent SD from three technical replicates.
There was no difference observed in Cq values between different volumes of RT
reactions. Both, 10 μl and 20 μl reactions resulted in similar Cq values and
concentrations of cDNA (~2400 ng/μl). The mRNA expression of ACTB in both
samples was at similar levels when cDNA and preamplified cDNA was used as
template in qPCR. Preamplified cDNA had higher Cq values than non-preamplified
cDNA but lower than previously reversely transcribed samples using SuperScript III
kit, as shown in Figure 6.6 (Mix 1). Therefore, the High Capacity Reverse
Transcription kit was used in further experiments to generate cDNA.
0.0
5.0
10.0
15.0
20.0
25.025
0 n
gR
NA
125
ng
RN
A
cDN
A
Cq
th
resh
old
neat
1/10 dilution
cDNA
0
5
10
15
20
250
ng
RN
A
125
ng
RN
A
cDN
A
Cq
th
resh
old
neat
1/10 dilution
cDNA

133
Figure 6.8. Preamplification test of cDNA made using a High Capacity Reverse Transcription Kit and 100 ng/μl total RNA in 10 ul and 20 ul reactions. Ceacal tonsils (CT) and bursa (B) tissue RNA was tested. Non-preamplified cDNA was diluted 1/5. The error bars represent SD from replicates (n=3).
The next step was to examine if standard RNA isolated from COS-7 cells
transfected with plasmids containing IL-1β, IL-6, IL-8, IL-12β, IL-18 and CXCLi2
inserts will produce positive signals with and without preamplification when tested
using 96.96 Dynamic Array. To make cDNA, High Capacity Reverse Transcription in
10 μl reaction, using 100 ng/μl was performed. Newly synthesised cDNA, in final
concentration of 5 ng/μl of reaction, was used in 5 μl preamplification reaction.
Preamplified cDNA was then serially diluted (1:2) and used as a template in 96.96
Dynamic Array along with non-preamplified cDNA in serial dilutions.
0
5
10
15
20
25
10 ul RT reaction 20 ul RT reactionC
q t
hre
sho
ld CT preamp
B preamp
CT cDNA
B cDNA

134
a)
b)
Figure 6.9. Heat map view of a) non-preamplified cDNA and b) preamplified cDNA corresponding to control transcripts. Samples were reverse transcribed from standard IL-1β, IL-6, IL-8, IL-12β, IL-18 and CXCLi2 RNA, serially diluted 1:2. Increase in dilution caused decrease in detected fluoresce of qPCR reaction in non-preamplified samples (a). Preamplified samples did not resulted in positive qPCR for most of the genes, apart from IL-12β (b).
As shown in Figure 6.9a, serial dilutions of cDNA without preamplification resulted
in specific and efficient detection of the target cDNAs with decreasing fluorescence
signal in qPCRs with each two fold serial dilution, which is characterised by change
in colour that corresponded with higher cycle number. Amplification of
preamplified cDNA in 96.96 Dynamic Array qPCR was unsuccessful, as shown in
Figure 6.9b. For most of the samples tested the concentration of cDNA after
preamplification was too low due to possible inhibition of reaction. It can be
therefore concluded that use of higher concentrations of cDNA in higher than
recommended volumes of PreAmp master mix would give positive results.
A very important aspect of PCR setup is a dilution of the original sample.
Lowering the concentration of a template is common practice in single-template
assays but in the case of mixed templates, dilutions may lead to loss of low or
Cq values

135
moderately concentrated targets. Another test of the preamplification reaction was
performed using final concentration of cDNA in the preamplification reaction 185
ng/μl in 20 μl volume. Ten samples from two chickens, each representing a different
farm, were selected and pooled for cDNA synthesis using High Capacity Reverse
Transcription Kit where 100 ng/μl of total RNA was used. As the RT reaction
produces ~2500 – 3500 ng/μl of cDNA, samples were diluted 1:5 before the
preamplification reaction. Results are shown in Figure 6.10. The increase in volume
of the reaction and concentration of cDNA resulted in successful preamplification.
In the preamplification optimisation, both template dilutions and concentration of
PreAmp master mix were changed in order to eliminate inhibition. The greater
reaction volume with appropriate cDNA concentration worked but the reason for
inhibition of reaction in previous optimisation attempts is unknown. Having
optimised the reaction, the next step involved testing the same settings in 96.96
Dynamic Array chip.
Figure 6.10. Preamplification test with the use of higher cDNA concentration and higher reaction volume. The mRNA expression of ACTB in ten samples from sibling test and pedigree farms was tested. Higher concentrations of cDNA (185 ng/μl) were used in 20 μl preamplification reactions. Non-preamplified cDNA used as a control. The error bars represent SD from four replicates.

136
Application of the optimised qPCR protocol to RNA from tissues 6.3.4from Aviagen broilers on pedigree and sibling test farms
Having optimised the preamplification protocol (Figure 6.10), samples from
the remaining Aviagen broilers were prepared in the same manner to be used as a
template in 96.96 Dynamic Array qPCR. Samples were treated with exonuclease I
before qPCR in 96.96 Dynamic Array. Results are shown in Figure 6.11. The
expression of 89 genes related to immune responses, as well as 6 reference genes
was detected, as shown in the heat map based on colour coding of the expression
level before pre-processing. The majority of the data fell in the of range about Cq =
5 – 23. Melting curves for all the primer pair were examined. Melting curves for ‘no
template’ controls, for reference genes, for genes where primers did not span exon-
intron boundaries are shown in Appendix 1, Figure 2-5. The same reaction settings
were implemented in an additional 96.96 Dynamic Array to confirm whether all
steps, from RNA extraction, reverse transcription to preamplification, results in
reproducible data. RNA from eight tissues (four per farm) was isolated and reversely
transcribed as previously described. Newly synthesised cDNA was preamplified in
20 μl reactions using 185 ng/μl of the template.

137
Figure 6.11. Heat map view of 96.96 Dynamic Array qPCR for immune-related genes in broilers on pedigree and sibling test farms. cDNA (185 ng/μl) preamplified in 20 μl was used as a template. Samples (blood, spleen, bursa, caecal tonsils and ileum) were collected from 8 chickens (4 per farm). 40 samples were used in a duplicate as the templates for amplification of 89 genes of interest and 6 reference genes. The bottom part of the heat map corresponds to serial dilutions for standard curve calculation, no template control (NTC) and positive control chambers.
PBL samples were not available for RNA extraction. Whole PBL samples were used
in RNA extraction for the first run in Figure 6.11. Preamplified cDNA from eight
tissues was tested in quadruplicates on the 96.96 Dynamic Array chip. Results of
this experiment are shown in Figure 6.12. Most of the genes were amplified
similarly to the previous run (Figure 6.11). Only the column designated for IL-12β
did not show amplification as the primer pair for this gene was missed in
preparation of assay mixes. All replicates of the same sample showed Cq values
reaching the same level with minimal differences (~0.5 Cq) between individual
repeats. Missing data were likely to be a result of the genes being expressed at very
Cq values

138
low levels, which can be seen as lack of fluorescence detection in most of the
replicates. The last column of the chip did not produce results as water, instead of
primers, was added to the assay mix as a negative control. Overall the data from
this repeated study show that the optimised protocol and qPCR platform is capable
of reliably reporting transcript levels across repeated studies.
Figure 6.12. Heat map view of 89 genes mRNA expression detected by 96.96 Dynamic Array qPCR in 8 tissue samples tested in quadruplicates. The test established the reproducibility of the settings used. The maximum difference between quadruplicate Cq values did not exceed ~0.5 Cq confirming accuracy of measured mRNA gene expression within the chip.
Data pre-processing 6.3.5
Data that did not give rise to any Cq value was represented by 999 which
was then translated to NAN (not a number) by GenEx software. Missing data were
rare, as evident from the reliable repetition of values across Figure 6.11 and Figure
6.12, however rarely failed reactions were detected, possibly owing to the nano-
scale volumes handled, bubbles in microfluidic channels or issues with the quantity
or integrity of the samples or reagents loaded. Missing data due to PCR failure were
restored based on replicate information. Out of 9,216 reactions, 84 were filled in
with replicate mean value. The rest of the missing (54 reactions) data were filled in
with values calculated by imputation.
Cq values

139
The analysis of tissue gene expression from Aviagen broilers 6.3.6raised in two hygienic settings
The normalised data were analysed in GenEx software using principal
component analysis and t-test statistical methods to explore the differences in gene
expression between two housing environments (pedigree and sibling test farms)
and within farms based on gene expression between organs.
Principal Components Analysis (PCA) is a useful, explanatory technique for
simplifying complex and multivariable data sets (Basilevsky, 1994; Pearson, 1901).
The whole data set from both farms was analysed using PCA statistical test in GenEx
Enterprise to compare the global gene expression profiles of five chicken tissues.
The preliminary PCA plot indicated broad differences between the PBL samples and
the rest of the tissues (Figure 6.13).
Figure 6.13. Principal component analysis indicating broad similarities and differences in transcription of immune-related genes in analysed tissues. Data points represent individual samples of sibling test and pedigree farms; A – bursa (circles), caecal tonsils (diamonds), spleen (squares), ileum (up-pointing triangles) from sibling test and pedigree farms; B – PBL (down-pointing triangles) collected from chickens raised on sibling test farm; C – PBL collected from chickens raised on pedigree farm.
The PCA results of the whole data showed the difference between PBL
samples from two farms (zones B and C in Figure 6.13). The rest of the samples
were clustered together and there were no clear sets consisting of tissues from a
particular farm but there was visible grouping of samples depending on the tissue
type. PCA was also performed on the same data set with PBL samples removed. This
second analysis showed heterogeneity within the subset where bursa and spleen
A
B
C

140
samples grouped together and caecal tonsils group slightly overlapped with ileum
group but there was no separation based on the farm type (Figure 6.14).
Figure 6.14. Principal component analysis of qPCR data for immune-related genes across tissues of birds reared on the pedigree and sibling test farms without PBL samples ; bursa (dark blue), spleen (orange), caecal tonsils (green), ileum (red). Circles represent samples from sibling test farm and squares represents samples from pedigree farm.
Differences in gene expression between and within the farms
The data from the 96.96 dynamic array was analysed in GenEx to explore the
differences in expression of the selected immune-related genes between farms.
When comparing the levels of gene expression between the farms where all tissues
were taken under consideration, only 13 genes out of 92 tested proved to be
significantly differentially expressed (P ≤ 0.05). The expression levels of all genes
tested at both farms are shown in Figure 6.15.

141
Figure 6.15. Relative expression (mean ± SEM) of genes expressed in tissues collected from pedigree (green) and sibling test (blue) farms. The significantly differentially expressed genes are indicated with * P ≤ 0.05 or ** P ≤ 0.0005; the data point represents all 20 tissue samples per farm type.

142
To explore the differences between farms, individual tissues were analysed and
compared. As PCA results previously showed, the biggest differences between the
two farms were observed in PBL samples. When PBL samples from pedigree (n = 4)
and sibling test (n = 4) farms were compared, 51 genes were shown to be
significantly differentially expressed (DE) with 10 genes highly significantly DE
(P ≤ 0.0005) and 41 significantly DE (p ≤ 0.05) (Figure 6.16).
Figure 6.16. Volcano plot of genes expressed in chicken blood (PBL) collected from pedigree and sibling test farms. Scattered points represent genes; the x-axis is the log2 fold change for the ratio sibling test vs pedigree farm, whereas y-axis is the log10 p-value. Green colour represents genes that are highly significantly DE (p value ≤ 0.0005) and yellow colour represents gene that are significantly DE (p value ≤ 0.05).
The number of differentially expressed genes was substantially lower in other
tissues tested. The same analysis which compared gene expression between the
two farms resulted in 19 genes significantly DE with 2 highly significantly DE in the
bursa (Figure 6.17a), 12 genes significantly DE with 1 highly significantly DE in the
spleen (Figure 6.17b), 9 genes significantly DE in the caecal tonsils (Figure 6.17c) and
23 genes significantly DE with 1 highly significantly DE in the ileum (Figure 6.17d).
Based on the number of genes that are differentially expressed at different levels of
biosecurity in housing environment, PBL could potentially be used as the indicator
of immune functions.
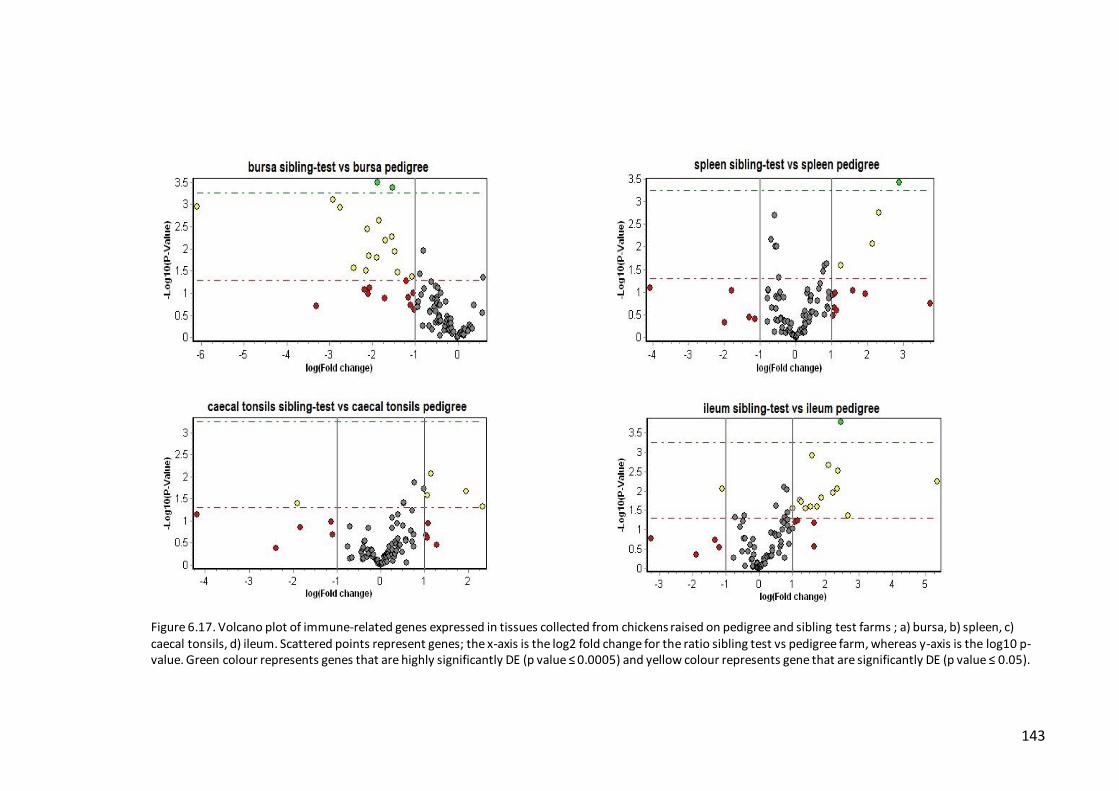
143
Figure 6.17. Volcano plot of immune-related genes expressed in tissues collected from chickens raised on pedigree and sibling test farms ; a) bursa, b) spleen, c) caecal tonsils, d) ileum. Scattered points represent genes; the x-axis is the log2 fold change for the ratio sibling test vs pedigree farm, whereas y-axis is the log10 p-value. Green colour represents genes that are highly significantly DE (p value ≤ 0.0005) and yellow colour represents gene that are significantly DE (p value ≤ 0.05).

144
The analysis of tissues from different farms showed that samples of bursa, spleen,
caecal tonsils and ileum (Figure 6.18 a-d) were highly positively correlated between
farms whereas PBL responses were characterised by a lack of correlation (Figure
6.18e).
Figure 6.18. Correlation of the magnitude and direction of gene expression in tissues from chickens raised on pedigree (y axis) and sibling test (x axis) farms a) bursa, b) spleen, c) caecal tonsils, d) ileum and e) blood (PBL).
a) b)
c) d)
e)

145
The variation between birds within an organ was analysed to determine whether
the differences seen in an organ originates from particular bird being higher
responder to pathogens present in the environment. Out of 92 genes expressed at
different levels, 25 were significantly DE with five of them being highly significant
(Figure 6.19). The significance of gene expression was due to the differential
response of just one or two of birds regardless of farm type they were housed in. In
many cases the level of expression of a particular gene varied significantly between
the birds from the same farm, for example expression of DTX2 gene was very high
in birds 7 and 8, both from pedigree farm whereas bird 5 and 6 showed a level of
expression similar to their siblings raised on sibling test farm (birds 1-4). Another
example is the CD80 gene, which was expressed on higher levels in birds 2, 3, 4, 6, 7
and 8 but not in birds 1 and 5 which were housed in different environments. The
three reference genes that were not selected as normalisers (ribosomal r28S, B2M
and GUSB), had levels of mRNA expression that were significantly different across
birds, confirming that they were not a good control of gene expression in this
sample set. For the bird vs bird analysis all tissues were combined therefore the
differences seen between birds stem from differential responses detected in
particular tissues.
Overall, the sample group (four birds per farm) is not enough to overcome
variance within the group (environment). There was no clear variation in gene
expression observed between birds. The gene expression resulted is small number
of differentially expressed genes and the level of variation changed within and
between farms.

146
Figure 6.19. Relative expression (mean ± SEM) of significantly DE genes between birds from the sibling test farm (1-4) and pedigree farm (5-8) ; ** p ≤ 0.0005.

147
PBL gene expression analysis
The PBL proved to have the highest number of differentially expressed genes
and differed between farms (Figure 6.20). Among the 51 genes with expression
significantly different between farms, 46 had higher mRNA levels in PBL samples
collected from birds from the sibling test farm. The lower level of biosecurity at the
sibling test farm may be associated with the observed upregulation of genes
involved in immune responses: e.g. toll-like receptors (TLR4, TLR15), cytokines (IL-
1β, IL-6,IL-12β, IL-18), and chemokines (CCLi4, CXCLi2, CCL20). Other genes that
were expressed at significantly higher levels are also known to be regulated during
infections.

148
Figure 6.20. Relative expression (mean ± SEM) of genes expressed in PBL collected from pedigree (blue) and sibling test (green) farms. Genes expressed significantly different (* p ≤ 0.05; ** - p ≤ 0.0005)

149
Validation of differentially expressed genes by qPCR 6.4
To validate the 96.96 Dynamic Array results, three transcripts (DTX2, IRG1, SAAL1)
were analysed by qPCR in a conventional 96 well format. These genes were selected
because of their significantly different regulation (DTX2 downregulated and IRG1
upregulated) and no change in expression (SAAL1) when gene expression in all
tissues from both farms was compared. Results showed that SAAL1 and IRG1
exhibited a similar transcriptional profile to that of 96.96 array. The down-
regulation of DTX2 was not detected, as it was observed in data generated using the
96.96 Dynamic Array. Comparison of both 96.96 array and qPCR statistical test is
shown in Figure 6.21.
a)
b)
Figure 6.21. Validation of 96.96 Dynamic Array qPCR results for selected 3 transcripts : DTX2, SAAL1, IRG1; a) fold change in expression of three genes tested between sibling test and pedigree farm in 96.96 Dynamic Array, b) results of fold change calculation for three genes of interest, as measured in conventional 96 well format; each bar represent average of 40 biological replicates ± SEM * - level of significance p ≤ 0.05.
0
1
2
3
4
5
6
7
8
DTX2 IRG1 SAAL1
fold
ch
ange
pedigree
sibling-test * *
0
2
4
6
8
10
12
14
DTX2 IRG1 SAAL1
fold
ch
ange
pedigree
sibling-test*
150
Discussion 6.5
Poultry breeders have to overcome many challenges caused by diseases that
lead to decreased yield and bird welfare. Chickens with improved innate resistance
could be introduced in breeding programs to minimise the losses but there are no
methods available that would select the chickens with superior immune
responsiveness to pathogens. Therefore, the idea to develop a cost-effective and
rapid technique to select birds characterised with higher level of immune
performance seemed reasonable. The work presented in this chapter was
performed in order to develop and validate a new diagnostic tool for immune gene
expression in the chicken. The 96.96 Dynamic Array from Fluidigm was selected as
the platform of choice.
As with any qPCR method, each step for the BioMark System had to be
optimised. Without intensive quality control, several steps in qPCR workflow could
influence the accuracy of the results. The use of a dye-based technique of DNA
detection required extensive primer design and optimisation. Although the design
of primers to span intron-exon boundaries is recommended (Wang and Seed, 2003)
it does not guarantee that pseudogenes as intronless copies will not be amplified. In
this study, contamination with DNA was avoided by applying the DNase treatment
during the RNA extraction process. This is the most efficient strategy to remove or
decrease the number of gDNA copies (Derveaux et al., 2010) to the level where
abundance of gDNA does not interfere significantly with quantification of mRNA
(Bustin and Nolan, 2013). Melting curve analysis was performed at the end of the
PCR cycles and confirmed the specificity of primer annealing with perfect melting
curves having a single sharp peak (Taylor et al., 2010). All of the primers used in this
study were successfully validated. The stability of reference genes selected in
Chapter 5 was also confirmed based on the Cq values generated during high-
throughput qPCR.
The use of the Fluidigm platform requires a preamplification step. The
samples need to be highly concentrated to ensure the template DNA for
151
amplification is present in the mix. This method of enrichment of samples has been
used in many studies (Noutsias et al., 2008; Sindelka et al., 2010). The process of
preamplification should be optimised before the main experiment using high
throughput qPCR platforms (Rusnakova et al., 2013). In experiments presented in
this chapter, samples were tested with and without preamplification where
different concentrations of cDNA were used with various volumes of TaqMan
PreAmp master mix. Three cycle numbers of PCR reactions were tested to
determine if the length of reaction changes the amount of amplification. As
described in Korenkova et al. (2015), different concentrations of RNA, number of
cycles and dilutions of cDNA were all very crucial for the preamplification reaction.
These studies using various combinations showed that for the BioMark System
preamplification works most efficiently in 15-18 reaction cycles and with higher
concentrations of cDNA samples diluted either 20x or 40x. In experiments
presented in this chapter, neither higher number of cycles of PCR reaction nor the
different concentrations of cDNA used resulted in preamplified samples having
lower Cq values that non-preamplified cDNA. Korenkova et al. (2015) observed that
increase of number of cycles (21 and 24) caused exhaustion of primers and reagents
by high abundant templates and lower level of success of reaction, therefore it is
not recommended, especially if the targets have unknown level of abundance.
To validate the utility of 96.96 Dynamic Array chip as a diagnostic tool a
number of samples from Aviagen broilers were used. In this study, the differences
in immune responses between chickens raised on two farms with high and low
levels of biosecurity were analysed. Detection of differences in immune
performance between birds within and between the farms, were performed to
establish which tissue delivers the most informative data.
The study consisted of two different farms, where four birds were random
selected from the population and five tissues were sampled. PCA analysis of the
qPCR results transformed the data into easily visualised two-dimensional plots.
Although birds were not infected with any particular pathogen, they were

152
vaccinated, the hygiene levels differed between farms with presence of common
pathogens such as Campylobacter, Eimeria species and E. coli was known at the
sibling test farm. The difference in gene expression profiles were most obvious in
blood samples when the complete data sets, including all tissues from both farms,
was analysed in PCA. The lists of genes that were significantly differentially
expressed in individual tissues were not common for all tissues. Most of the genes
DE in blood were also DE in other tissues but there was no pattern characterised by
the same profile of expression with any particular tissue. That is the reason why
blood samples were separated from other tissues when visualised in the PCA. The
analysis of the data set with exclusion of the blood samples revealed the similarities
between the gene expression profiles in bursa and spleen and between caecal
tonsils and ileum. Surprisingly a stronger concordance was observed between bursa
and spleen. The caecal tonsils and ileum are closely related and are part of the gut-
associated lymphoid tissue (GALT) system together with the bursa of Fabricius
(Befus et al., 1980). Nevertheless, gene expression profiles in caecal tonsils and
ileum separated from bursa samples that were assembled in cluster with the
spleen. All tissues were equally exposed to the same biotic stimuli, yet there in no
indication that any of the tissues showed significant changes in the transcription of
immune-related genes.
The birds used in this experiment were three-weeks of age and their
immunological responses were coordinated by a nearly mature immune system. As
the birds were sampled at only one timepoint it is difficult to speculate if the gene
expression observed at this particular level was triggered by matured cells and
organs involved and if the response would differ if the birds were sampled earlier
and later in their life. The cytokine expression in the caecum was studied
throughout the chicken’s life span in the experiments done by Crhanova et al.
(2011) which revealed that IL-8, IL-17 and partially IFN-γ expression changed with
gut flora development. The relative expression of other genes tested IL-1β, IL-18
and iNOS was unstable up to day 25 after which the low levels of expression
continued to be unchanged. The same study involved infections with Salmonella

153
Enteritidis and showed that the level of response to the pathogenic bacteria was
dependent on the age of the birds infected. The stimulation of younger chickens
caused higher levels of cytokine gene expression and although those levels
continued to decrease they were higher at day 42 compared to the gene expression
in birds infected later in their life. The patterns of immune response to gut
microflora and pathogenic microorganisms may include overlapping pathways,
therefore it is difficult to say whether the responses observed in sibling test farm
birds were activated by only commensal microbes. The levels of the gene
expression may not give the clear answer as the microflora of the environment is
unknown but it could be speculated that the responses triggered at the sibling test
farm reached higher levels compared to pedigree farm owing to presence of
common pathogenic microorganisms.
It could be expected that PBL and spleen tissue gene expression would have
more genes in common, as the spleen is very rich in blood. Spleen accumulates
leukocytes and is the main site of antigen presentation and processing. However in
the present study principal component analysis reliably found differences in the
profile of expression of the immune-related genes expressed at these sites. A
microarray study by Nie et al. (2010) on basal expression of genes in eight tissues,
including bursa and small intestine, found that nearly half of the genes were
expressed in all tissues and small percentage were tissue-specific.
It is difficult to establish if the blood is the best estimator of immune vigour
compared to other tissues, based on the initial data. The PBL showed the highest
number of the DE genes that included genes with proinflammatory functions. In the
same samples, many significantly DE genes were involved in diminishing the
inflammation by regulating the overexpression of the proinflammatory genes. The
PBL consist of many cells programmed to confer microorganisms as the first line of
innate defence, where cell populations in other tissues are also involved in later
stages. It would be preferential to select the PBL for developing a diagnostic test for
154
immune robustness in chickens as the circulating cells detect inflammatory state in
whole organism.
The test of mRNA gene expression in samples from both farms was not
performed using whole transcriptome gene expression platform and only eighty-
nine genes were included. Many of the immune-related genes, listed in Chapter 4,
were selected based on upregulation during infection or stimulation with
constituents of pathogens. Therefore, it is difficult to differentiate between immune
responsiveness of healthy chickens and chickens responding to infection using the
selected genes, as the phenotype of immune robustness at mRNA level are not
known. It could be assumed that the selected panel of genes was not appropriate to
detect differences in immune responses in other tissues, apart from blood
leukocytes. It would be feasible to test the same hypotheses in additional
timepoints and examine the outcomes from different immune/colonisation stages.
The low numbers of significantly expressed genes between individual birds from
both farms could suggest that the level of variation did not depend on the level of
biosecurity. This could be explained by the individual ability of bird to detect the
invading microbes but also by the unequal level of immune responses within the
bird, between organs. Another obstacle in interpretation of the results is the
differences in the vaccination schemes used at the two farms. The differences in the
gene expression in PBL may plausibly be due to different vaccines and times of
administration. Therefore, the farm settings are not adequately controlled for
measuring the innate immune robustness of healthy birds.
The results showed that there are differences in immune responses between
farms but the number of birds used in this experiment was too low to select the
birds characterised by improved immunity. The PBL isolated from the blood showed
to be promising indicator of immune gene expression differences between farms
but the variation between birds, based on only the blood samples, was impossible
to estimate. Nevertheless, the Fluidigm chip with the proposed set of genes could
be a convenient diagnostic tool for measuring the differential responses in the

155
future experiments. It has been optimised and verified in the field experiment but
the experimental setup needs to be adjusted to avoid future problems with the data
interpretation.
156
General discussion Chapter 7
Overview of this study 7.1
The main aim of this project was to design and optimise a diagnostic tool for
assessing innate immune responses in commercial chickens. All objectives stated in
Chapter 1 were met and the tool has been optimised and validated. The 96.96
Dynamic Array IFC within the BioMark system (Fluidigm Corporation) was used in
preliminary experiments involving 89 innate immune-related genes. Lymphoid
tissues and blood were isolated from an Aviagen broiler line housed on their
pedigree and sibling test farms that differ in levels of hygiene. The test validated the
usability of the chip and evaluated immune performance based on expression of
selected genes. Crucial steps in the workflow were also optimised. The optimisation
of preamplification reaction was the first major challenge, as the recommended
and/or published protocols did not produce useable data. Reference gene
normalisation was also performed before the final high-throughput qPCR analysis
and the data from the Fluidigm chip confirmed the stability of transcription of the
selected reference genes across animals and tissues. The importance of proper
selection and validation of reference genes has been underlined several times in
Chapter 5 and supported with numerous published examples.
Supplementary to the studies presented, a first author manuscript has been
accepted for publication in the Journal of Veterinary Immunology and
Immunopathology to select reference genes for qPCR analysis of chicken gene
expression, this time using lymphoid tissue isolated from the RI-J line. This study
confirmed that TBP is the most stable gene in bursal cells, thymocytes and
splenocytes, consistent with findings presented in Chapters 5 and 6. The selection
of genes used in Chapter 6 was performed based on published studies and the RNA-
seq analysis of chicken effector cells stimulated with LPS. The cloning and
sequencing of selected candidate genes confirmed their presence in the chicken
genome and made the design of assays more accurate. The design and validation of
a new diagnostic tool has been performed successfully and according to the MIQE
guidelines for qPCR analysis.

157
Challenges and limitations of the study 7.2
The project started by evaluating effector cell phenotypes and their mRNA
gene expression as screening methods for innate immune function to be used in
breeding programmes. The techniques presented in this work involved weeklong
cell cultures. These methods were confirmed to be time-consuming and together
with the requirement for greater number of birds to perform heterophil
experiments, they were not considered as viable future diagnostic tools. Although
previous studies on commercial and inbred lines showed that resistance to one
pathogen could be associated with resistance to other pathogens, the birds used in
the experiments presented in this thesis were not challenged with multiple
pathogens simultaneously as occurs in commercial settings. The mRNA levels of
only a few cytokines and chemokines is unlikely to be sufficient to select birds with
higher immune responsiveness. Therefore, the decision was made to select genes
that are involved in innate immune responses to a plethora of infections and
implement them in new high-throughput qPCR diagnostic tool.
The selection of genes to be used in the qPCR platform was based on
published experiments with widely different design. Most of the studies used to
generate the list utilised microarray platforms to distinguish the genes significantly
differentially expressed in infected cells or tissues. The comparison of the data from
different platforms is difficult as they are based on diverse protocols, from
manufacturing, hybridisation and final analysis (Brazma et al., 2001). Therefore,
direction, magnitude and significance of gene expression in a particular infection
study may differ when analysed using different platforms.
The current study design did not result in detection of birds characterised
with overall greater responses in any of the farms tested. The intensity of immune
responses differed between farms as shown in Figure 6.15, which is not surprising
as the level of hygiene varied greatly. The analysis of all datasets showed that the
greatest difference between farms is visible in blood samples (Figure 6.13). The
analysis of immune responses based on lymphoid tissues did not show any of the

158
organs to be more responsive to the environmental challenges. Therefore, it
suggests that the blood would yield the most information about the immune state
of each bird sampled. That hypothesis needs to be tested in future experiments
with larger numbers of birds and more defined challenge at a given timepoint.
The genes used to characterise immune function in this study were selected
based on their activation upon infection or stimulation of effector cells with
pathogen-associated molecular patterns. This makes the analysis of results
problematic. The elevated expression of particular genes may not be a result of a
high state of innate immune readiness in healthy birds, but rather could be a
reflection of disease. Moreover, it is not possible to fully interpret the meaning of
responses detected when the nature of pathogen challenge, time of measurement
relative to time of infection and the relative exposure (pathogen load) is not
precisely controlled.
A further challenge in evaluating immune responses is interpretation of gene
expression as a being indicative of robustness, resistance or tolerance. The
definition of robustness in farm animals was explained by Knap (2005) as “the
ability to combine high production potential with resilience to stressors, allowing
for unproblematic expression of high production potential in wide variety of
environmental conditions”. Disease resistance could be defined as the ability to
reduce the pathogen occurrence by inhibiting infection and pathogen growth (Best
et al., 2008). Tolerance to pathogen may be described as the ability to limit the
damage by counteracting the detrimental impact (Rohr et al., 2010). The tolerant
animal would be able to maintain productivity despite increasing load of pathogens.
For breeders, both, maintenance of productivity and ability to reduce pathogen
burden, are equally important. Previous studies on lines selected for higher
heterophils mRNA gene expression showed that the parental and F1 progeny with
higher resistance resulted in fewer Campylobacter jejuni colonies from cloacal
swabs (Li et al., 2008c). This could suggest that selection based on mRNA gene
expression levels may lead to generation of a line that is robust, as it not only

159
maintains the expected phenotype but also reduces the prevalence of pathogens.
The use of gene expression data simultaneously with information about other traits,
for example weight gain and feed conversion ratio, could help to refine the
phenotype of robustness and ensure it does not come at the expense of other
production-relevant traits.
Future applications 7.3
In addition to previously used pro-inflammatory cytokines and chemokines to
evaluate innate immune responses of inbred and commercial lines (Wigley et al.,
2006; Swaggerty et al., 2008) the panel of immune-related genes selected for this
project includes various genes involved in downstream signalling after
pathogen/agonist recognition. The additional carefully selected genes in the panel
could result in more precise selection of chickens based on their immune responses,
once the immune robustness phenotype is better understood. Collection of samples
at different timepoints would be practical to examine different maturity stages of
immune system and changes in responses. This approach could clarify if the
expression of the selected panel of genes is dependent on the age of the birds. In
the future, when the chip is used as a diagnostic tool, only one appropriate time-
point may be necessary to predict the robustness. Apart from additional time-
points, vaccination schedules would have to be standardised. Birds used in the
preliminary chip test, housed on the pedigree farm or sibling test farm received
different vaccines at hatch and on different days throughout their lives, which had
the potential to change the nature and magnitude of immune responses and
explain some of the differences detected.
The chip could also be used as a tool to study immune readiness at the point
of hatch or even during late stages of embryo development. Mortality in the first
week post-hatch is an important aspect of chicken breeding and is used as an
indicator of the occurrence of welfare problems. The transitional period from
embryonic stage to the post-hatch chick and further to the broiler farm is a major
challenge to the digestive, immune and thermoregulatory systems. The

160
performance of the newly hatched chickens in the first days is indicative of the
performance during rearing weeks at the farm (Yassin et al., 2009). Therefore, the
gene expression screening of newly-hatched chicks, yet to have significant contact
with pathogens or acquired microbiota could help to predict how the flock will
perform in later stages.
The value of the multiplex PCR platform for immune-related genes could also
be tested in a wider range of environmental settings, for example on test farms
using birds of the same genotype but reared in cold and hot environments, at
different stocking densities, intensive indoor vs. outdoor free-range systems and so
on. This will be important to improving the performance of poultry to meet fast
increasing demand owing to growth of the human population and rising affluence
and urbanisation in developing countries. Expansion of breeding under hot
temperatures is also very important because of global climate change. Heat stress is
known to result in decreased productivity and increased mortality (Turnpenny et al.,
2001). It has been shown that diverse lines demonstrate different, heritable
responses to chronic heat exposure (Lu et al., 2007). Several heat shock proteins
and genes responsible for glucose transportation have been shown to be involved in
responses to heat stress (Garriga et al., 2006; Lei et al., 2009; Yan et al., 2009).
These, and many other expression quantitative trait loci (eQTL) associated with
heritable resistance to other production-relevant phenotypes, could be added to
the qPCR panel to test differences in transcript expression between farms as a guide
to selection.
Apart from commercial lines tests, the optimised diagnostic tool could be
applied in studies of inbred lines when challenged with pathogens. That could help
to select genes that carry the information about resistance or susceptibility to
disease, for example in the inbred lines housed by the National Avian Research
Facility that differ in resistance to Eimeria, Salmonella, Campylobacter and other
agents. Results could narrow down the list of candidate genes associated with
differential resistance. The limited number of genes tested, compared to whole

161
transcriptome analysis, would lower the costs of experiments even further.
However, it would not allow for the discovery of novel genes or transcript variants
associated with resistance, as happens in RNA-seq differential expression studies.
Projects involving a vaccine challenge or infection could also benefit from applying
this platform by adding to knowledge of the nature, magnitude and timing of
responses to vaccination and pathogen challenge. Gene expression studies offer
very exciting avenues for solving the problems of existing and emerging diseases.
Blood transcriptome analysis as a diagnostic tool has been successfully used to
profile human patients with sepsis, where candidate transcriptional signatures of
differential diagnosis were identified (Pankla et al., 2009). Microarrays and other
gene expression platforms that measure host responses to infections could serve as
a disease progression monitoring systems. It has become obvious that genomic and
transcriptomics approaches cannot elucidate all the problems but play a part in
selection programs. The complexity of biology and host interaction with the
environment make the selection for immune robustness difficult. In-depth
information of fields such as epigenetics, alternative splicing, miRNA regulation
would add to knowledge of candidate biomarkers at multiple levels. The Chicken
genome is still in draft version and lacks much genetic and functional annotation,
therefore it would be advantageous to annotate the genome at similar levels to that
of human (Cheng et al., 2013).
Future challenges of poultry breeding 7.4
Breeding for disease resistance in farmed animals has made remarkable
progress. Despite the advances, difficulties still exist (Jie et al., 2011). The costs of
breeding for disease resistance are still high as challenging chicken flocks with
pathogens to select resistant individuals leads to death of susceptible birds and the
number of birds used need to be very high. Identification of the disease resistance
phenotype can also be problematic, as the disease may not affect each bird to the
same level. Therefore, susceptible animals may not have been identified as they are
not exposed to the pathogen, resistant birds may have sub-clinical infections and
play a role of pathogen reservoir/carrier. In addition, the interaction between

162
pathogens makes the breeding of multi-resistant lines difficult and secondary
infections can cause higher mortality than the primary infection (Jie et al., 2011).
Knowledge of genes involved in disease resistance can be implemented in
creating transgenic chickens, e.g. inactivating viral receptors or introducing or
upregulating resistance-associated genes. Recently, genetically modified chickens
able to suppress avian influenza A virus transmission have been generated by
constitutive expression of a decoy RNA resembling a viral vRNA segement to
interfere with virus replication (Lyall et al., 2011). The creation of birds resistant to
AI could lead to reduced costs of production caused by AI outbreaks and lower risk
of transmission of the virus to human population. The chickens resistant to AI
phenotypes do not show significant differences in hatching weights. Future
transgenic chicken lines overexpressing particular immune-related genes, or indeed
birds given immuno-modulatory substances to boost immune function, could be
screened using the qPCR panel with Fluidigm chip to understand the basis of any
beneficial phenotypes. For decades it has proved challenge to introduce disease
resistance by selection without affecting other production traits, therefore
transgenesis may aid the fight against the diseases (Whitelaw and Sang, 2005).
Conclusions 7.5
The research described here could potentially aid the selection for improved
immune robustness. The technical optimisation and validation of a new tool to
simultaneously quantify expression of tens of relevant immune-related genes will
prime research in many areas of avian biology, especially to define baseline immune
gene expression for selection, the basis of differential resistance, and host
responses to infection, vaccination or immuno-modulatory substances. The chip
with the selected panel of genes now needs to be tested at different time-points in
experiments where genotypically identical chickens are placed in different
environments in which more variables are defined and controlled. Results from
mRNA gene expression studies, together with information about other phenotypes
could help to distinguish birds that are more robust.

163
References
Abasht B, Kaiser MG, van der Poel J, Lamont SJ. 2009. Genetic lines differ in Toll-like receptor gene expression in spleens of chicks inoculated with Salmonella enterica serovar Enteritidis. Poultry Science 88, 744-749.
Ackerman MW. 2011. Single-nucleotide polymorphisms (SNPs) under diversifying
selection provide increased accuracy and precision in mixed-stock analyses of sockeye salmon from the Copper River, Alaska. Transactions of the American Fisheries Society 140, 865-881.
Adams SC, Xing Z, Li J, Cardona CJ. 2009. Immune-related gene expression in response to H11N9 low pathogenic avian influenza virus infection in chicken and Pekin duck peripheral blood mononuclear cells. Molecular Immunology 46, 1744-
1749.
Akbari MR, Haghighi HR, Chambers JR, Brisbin J, Read LR, Sharif S. 2008. Expression of antimicrobial peptides in cecal tonsils of chickens treated with probiotics and infected with Salmonella enterica serovar Typhimurium. Clinical and Vaccine Immunology 15, 1689-1693.
Altschul SF, Gish W, Miller W, Myers EW, Lipman DJ. 1990. Basic local alignment
search tool. Journal of Molecular Biology, 215;403-410.
Andersen CL, Jensen JL, Ørntoft TF. 2004. Normalization of real-time quantitative reverse transcription-PCR data: A model-based variance estimation approach to identify genes suited for normalization, applied to bladder and colon cancer data sets. Cancer Research 64; 5245-5250.
Bages S, Estany M, Tor M, Pena RN. 2015. Investigating reference genes for quantitative real-time PCR analysis across four chicken tissues. Gene 561, 82-87.
Banskota S, Regmi SC, Kim JA. 2015. NOX1 to NOX2 switch deactivates AMPK and induces invasive phenotype in colon cancer cells through overexpression of MMP-7. Molecular Cancer 14:123.
Bär M, Bär D, Lehman B. 2009. Selection and validation of candidate housekeeping
genes for studies of human keratinocytes – review and recommendations. The Journal of Investigative Dermatology 129; 535-537.
Barber RD, Harmer DW, Coleman RA, Clark BJ. 2005. GAPDH as a housekeeping gene: analysis of GAPPDH mRNA expression in a panel of 72 human tissues. Physiological Genomics 21, 389-395.
Barber MR, Aldridge Jr JR, Webster RG, Magor KE. 2010. Association of RIG-I with
innate immunity of ducks to influenza. Proceedings of the National Academy of Sciences 107, 5913-5918.
164
Barnes SJ. 2001. Hemic system. In: Riddel C. (Ed). Avian histopathology, 2nd Edition. American Association of Avian Pathologists, Kennett square, PA.p. 18-34
Basilevsky A. 1994. Statistical Factor Analysis and Related Methods. Theory and Applications. John Wiley & Sons; New York, NY
Bas A, Forsberg G, Hammarström S, Hammarström M-L. 2004. Utility of the
housekeeping genes 18S rRNA, beta-actin and glyceraldehyde-3-phosphate-dehydrogenase for normalization in real-time quantitative reverse transcriptase-
polymerase chain reaction analysis of gene expression in human T lymphocytes. Scandinavian Journal of Immunology 59; 566-573.
Batista FD, Harwood NE. 2009. The who, how and where of antigen presentation to B cells. NatureReviews Immunology 9, 15-27.
Beal RK, Powers C, Wigley P, Barrow PA, Smith AL. 2004. Temporal dynamics of the cellular, humoral and cytokine responses in chickens during primary and secondary
infection with Salmonella enterica serovar Typhimurium. Avian Pathology 33, 25-33.
Beaumont C, Protais J, Pitel F, Leveque G, Malo D, Lantier F, Plisson-Petit F, Colin P, Protais M, Le Roy P, Elsen JM, Milan D, Lantier I, Neau A, Salvat G, Vignal A. 2003. Effect of two candidate genes on the Salmonella carrier state in fowl. Poultry
Science 82, 721-726.
Befus D, Johnston N, Leslie A, Bienenstock J. 1980. Gut-asociated lymphoid tissue in the chicken. The Journal of Immunology 125, 2626-2632.
Benoist C, Germain RN, Mathis D. 2006. A plaidoyer for “systems immunology”.
Immunological Reviews 210, 229-234.
Bevan MJ. 1976. Cross-priming for a secondary cytotoxic response to minor H antigens with H-2 congenic cells which do not cross-react in the cytotoxic assay. The Journal of Experimental Medicine 143, 1283-1288.
Best S, White A, Boots M. 2008. Maintenance of host variation in tolerance to pathogens and parasites. Proceedings of the National Academy of Sciences 105, 20786-20791.
Biozzi G, Mouton D, Sant’Anna OA, Passons HC, Gennari M, Reis MH, Fereira VCA, Heumann AM, Bouthillier Y, Ibanez OM, Kleinschmidt A. 1979. Genetics of
immunoresponsiveness to natural antigens in the mouse. Current Topics in Microbiology and Immunology 85, 31-98.
Blake D, Tomley FM. 2014. Securing poultry production from the ever-present Eimeria challenge. Trends in Parasitology 30, 12-19.
Bliss TW, Dohms JE, Emara MG, Keeler Jr. CL. 2005. Gene expression profiling of avian macrophage activation. Veterinary Immunology and Immunopathology 105, 289-299.

165
Bohlenius H, Eriksson S, Parcy F, Nilsson O. 2007. Retraction. Science, 316:367.
Bojesen AM, Nielsen OL, Christensen JP, Bisgaard M. 2004. In vivo studies of Gallibacterium anatis infection in chickens. Avian Pathology: Journal of the WVPA 33; 145-152.
Borregaard N. 2010. Neutrophils, from marrow to microbes. Immunity 33, 5, 657-
670.
Boyd Y, Goodchild M, Morroll S, Bumstead N. 2001. Mapping of the chicken and mouse genes for toll-like receptor 2 (TLR2) to an evolutionarily conserved chromosomal segment. Immunogenetics 52, 294-298.
Boyd Y, Herbert EG, Marston KL, Jones MA, Barrow PA. 2005. Host genes affect intestinal colonisation of newly hatched chickens by Campylobacter jejuni.
Immunogenetics 57, 248-253.
Boyd AC, Peroval MY, Hammond JA, Prickett MD, Young JR, Smith AL. 2013. TLR15 is unique to avian and reptilian lineages and recognises a yeast-derived agonist. Journal of Immunology 189, 4930-4938.
Bradley XZ, Rung J, Parkinson H, Brazma A. 2010. Large scale comparison of global gene expression patterns in human and mouse. Genome Biology 11, R124.
Brazma A, Hingamp P, Quackenbush J, Sherlock G, Spellman P, Stoeckert C, Aach J,
Ansorge W, Ball CA, Causton HC, Gaasterland T, Glenisson P, Holstege FCP, Kim IF, Markowitz V, Matese JC, Parkinson H, Robinson A, Sarkans U, Schulze-Kremer S, Stewart J, Taylor R, Vilo J, Vingron M. 2001. Minimum information about a
microarray experiment (MIAME)—towards standards for microarray data. Nature Genetics 29 365-371.
Brisbin J, Gong J, Parvizi P, Sharif S. 2010. Effect of Lactobacilli on cytokine expression by chicken spleen and cecal tonsil cells. Clinical and Vaccine Immunology 17, 1337-1343.
Brune K, Leffell MS, Spitznagel JK. 1972. Microbial activity of peroxidaseless chicken heterophil leukocytes. Infection and Immunity 5, 283-287.
Bustin SA. 2002. Quantification of mRNA using real-time reverse transcription PCR (RT-PCR): trends and problems. Journal of Molecular Endocrinology 29; 23-29.
Bustin SA, Benes V, Garson JA, Hellemans J, Huggett J, Kubista M, Mueller R, Nolan T, Pfaffl MW, Shipley GL, Vandesompele J, Wittwer CT. 2009. The MIQE Guidelines: Minimum information for publication of quantitative real-time PCR experiments. Clinical Chemistry 55, 4.
Bustin SA, Nolan T. 2013. Analysis of mRNA expression by real-time PCR. Real-Time PCR: Advanced Technologies and Applications. Horizon Scientific Press.

166
Calenge F, Lecerf F, Demars J, Feve K, Vignoles F, Pitel F, Vignal A, Velge P, Sellier N, Beaumont C. 2009. QTL for resistance to Salmonella carrier state confirmed in both experimental and commercial chicken lines. Animal Genetics 40, 590-597.
Calenge F, Kaiser P, Vignal A, Beaumont C. 2010. Genetic control of resistance to salmonellosis and to Salmonella carrier-state in fowl: a review. Genetics Selection Evolution 42, 11.
Carrell A, Ebeling AH. 1922. Pure culture of large mononuclear leukocytes. The Journal of Experimental Medicine 36, 365-386.
Cavero D, Schmutz M, Philipp HC, Preisinger R. 2008. Breeding to reduce
susceptibility to Escherichia coli in layers. Poultry Science 88, 2063-2068.
Chang E, Shi S, Liu J, Cheng T, Xue L, ang X, Yang W, Lan Q, Jiang Z. 2012. Selection if reference genes for quantitative gene expression studies in Platycladus orientalis (cupressaceae) using real-time PCR. PLoS ONE 7; e33278.
Chaussabel D, Semnani RT, McDowell MA, Sacks D, Sher A, Nutman TB. 2003. Unique gene expression profiles of human macrophages and dendritic cells to phylogenetically distinct parasites. Blood 102, 672-681.
Cheema MA, Qureshi MA, Havenstein GB. 2003. A comparison of the immune profile of commercial broiler strains when raised on marginal and high protein diets. International Journal of Poultry Science 2, 300-312.
Cheeseman JH, Kaiser MG, Ciraci C, Kaiser P, Lamont SJ. 2007. Breed effect on early cytokine mRNA expression in spleen and cecum of chickens with and without Salmonella Enteritidis infection. Developmental and Comparative Immunology 31, 52-60.
Cheng HH, Kaiser P, Lamont SJ. 2013. Integrated genomic approaches to enhance genetic resistance in chickens. Annual Reviews of Animal Biosciences 1, 239-260.
Chiang H-I, Swaggerty C, Kogut M, Dowd SE, Li X, Pevzner IY, Zhou H. 2008. Gene expression profiling in chicken heterophils with Salmonella Enteritidis stimulation using a chicken 44 K Agilent microarray. BMC Genomics 9, 526.
Chuammitri P, Ostojic J, Andreasen CB, Redmond SB, Lamont SJ, Palic D. 2009.
Chicken heterophil extracellular traps (HETs): Novel defense mechanism of chicken heterophils. Veterinary Immunology and Immunopathology 129, 126-131.
Ciraci C, Tuggle C, Mannemuehler MJ, Nettleton D, Lamont S. 2010. Unique genome-wide transcriptome profiles of chicken macrophages exposed to Salmonella derived endotoxin. BMC Genomics 11, 545.
167
Ciraci C, Lamont SJ. 2011. Avian-specific TLRs and downstream effector responses to CpG-induction in the chicken macrophages. Developmental and Comparative Immunology 35, 392-398.
Citri A, Pang ZP, Sudhof TC, Wernig M, Malenka RC. 2013. Comprehensive qPCR profiling of gene expression in single neuronal cells. Nature Protocols 7, 118-127.
Cloeckaert A, Praud K, Doublet B, Bertini A, Carattoli A, Butaye P, Imberechts H, Bertrand S, Collard J-M, Arlet G, Weill F-X. 2007. Dissemination of an extended-
spectrum lactamase blaTEM-52 gene-carrying IncI1 plasmid in various Salmonella enterica serovars isolated from poultry and humans in Belgium and France between 2001 and 2005. Antimicrobial Agents and Chemotherapy 51, 1872–1875.
Coble DJ, Redmond SB, Hale B, Lamont SJ. 2011. Distinct lines of chickens express different splenic cytokine profiles in response to Salmonella Enteritidis challenge. Poultry Science 90, 1659-1663.
Coble DJ, Sandford EE, Ji T, Abernathy J, Fleming D, Zhou H, Lamont SJ. 2013. Impacts of Salmonella Enteritidis infection on liver transcriptome in broilers. Genesis 51, 357-364.
Cogburn LA, Wang X, Carre W, Rejto L, Porter TE, Aggrey SE, Simon J. 2003.
Systems-wide chicken DNA microarrays, gene expression profiling, and discovery of functional genes. Poultry Science 82, 939–951.
Cogburn LA, Porter TE, Duclos MJ, Simon J, Burgess SC, Zhu JJ, Cheng HH, Dodgson JB, Burnside J. 2007. Functional genomics of the chicken – a model organism. Poultry Science 86, 2059-2094.
Collier CT, Hofacre CL, Payne AM, Anderson DB, Kaiser P, Mackie RI, Gaskins HR.
2008. Coccidia-induced mucogenesis promotes the onset of necrotic enteritis by supporting Clostridium perfringens growth. Veterinary Immunology and
Immunopathology 122, 104–115.
Connell S, Meade KG, Allan B, Lloyd AT, Kenny E, Cormican P, Morris DW, Bradley DG, O’Farrelly C. 2012. Avian resistance to Campylobacter jejuni colonisation is associated with an intestinal immunogene expression signature identified by mRNA
sequencing. PLoS One 7, e40409.
Conrad DF,Bird C, Blackburne B, Lindsay S, Mamanova L, Lee C, Tumer DJ, Hurles ME. 2010. Mutation spectrum revealed by breakpoint sequencing of human germline CNVs. Nature Genetics 42, 385-391.
Coulson DTR, Brockbank S, Quinn JG, Murphy S, Ravid R, Irvine GB, Johnston J. 2008. Identification of valid reference genes for the normalization of RT qPCR gene expression data in human brain tissue. BMC Molecular Biology 9; 46.
Coussens PM, Verman N, Coussens MA, Elftman MD, McNulty AM. 2004. Cytokine gene expression in peripheral blood mononuclear cells and tissues of cattle infected

168
with Mycobacterium avium subsp. paratuberculosis: evidence for an inherent proinflammatory gene expression pattern. Infection and Immunity 72, 1409-1422.
Crhanova M, Hradecka H, Faldynova M, Matulova M, Havlickova H, Sisak F, Rychlik I. 2011. Immune response of chicken gut to natural colonisation by gut microflora and to Salmonella enterica serovar Enteritidis infection. Infection and Immunity 79, 2755–2763.
Crawford RD. 1990. Poultry genetic resources: evolution, diversity and
conservation. p. 43-60. In: Poultry Breeding and Genetics (Crawford RD ed.), Elsevier, New York
de Boever S, Vangestel C, de Backer P, Croubels S, Sys SU. 2008. Identification and validation of housekeeping genes as internal control for gene expression in an intravenous LPS inflammation model in chickens. Veterinary Immunology and Immunopathology 122; 312-317.
del Cacho E, Gallego M, López-Bernard F, Sánchez-Acedo C, Lillehoj HS. 2008. Isolation of chicken follicular dendritic cells. Journal of Immunological Methods, 334, 59–69.
Degen WGJ, van Daal N, Rothwell L, Kaiser P, Schijns VEJC. 2005. Th1/Th2
polarisation by viral and helminths infection in birds. Veterinary Microbiology 105, 163-167.
de Kleijn S, Kox M, Sama IE, Pillay J, van Diepen A, Huijnen MA, van der Hoeven JG, Ferwerda G, Hermans PWM. 2012. Transcriptome kinetics of circulating neutrophils during human experimental endotoxemia. PLoS ONE 7, e38255.
de Zoete MR, Bouwman LI, Keestra AM, Putten JPM. 2011. Cleavage and activation
of a toll-like receptor by microbial proteases. Developmental and Comparative Immunology 35, 392-398.
Dheda K, Huggett JF, Bustin SA, Johnson MA, Rook G, Zumla A. 2004. Validation of housekeeping genes for normalization RNA expression in real-time PCR. BioTechniques 37; 112-114.
Dheda K, Huggett JF, Chang JS, Kim LU, Bustin SA, Johnson MA, Rook GA, Zumla A.
2005. The implications of using an inappropriate reference gene for real-time reverse transcription PCR data normalization. Analytical Biochemistry 344, 141–143.
Dodgson JB, Delany ME, Cheng HH. 2011. Poultry genome sequences: progress and outstanding challenges. Cytogenetic and Genome Research 134, 19-26.
Dranoff G. 2004. Cytokines in cancer pathogenesis and cancer therapy. Nature
Reviews Cancer 4, 11-22.
Dundas J, Ling M. 2012. Reference genes for measuring mRNA expression. Theory in Biosciences 131; 215-223.

169
Dunnington EA, Martin A, Briles WE, Briles RW, Siegel PB. 1986. Resistance to Marek’s disease in chickens selected for high and low antibody responses to sheep red blood cells. Archive fur Geflugelk 50, 94 – 96.
Dunnington EA, Siegel PB, Gross WB. 1991. Escherichia coli challenge in chickens selected for high or low antibody response and differing in haplotypes at the major histocompatibility complex. Avian Diseases 35, 937 – 940.
Dutil L, Irwin R, Finley R, King Ng L, Avery B, Boerlin P, Bourgault A-M, Cole L,
Daignault D, Desruisseau A, Demczuk W, Hoang L, Horsman GB, Ismail J, Jamieson F, Maki A, Pacagnella A, Pillai DR. 2010. Ceftiofur resistance in Salmonella enterica serovar Heidelberg from chicken meat and humans, Canada. Emerging Infectious Diseases 16, 48-54.
Derveaux S, Vandesompele J, Hellemans J. 2010. How to do successful gene expression analysis using real-time PCR. Methods 50, 227-230.
Edwards DR, Denhardt DT. 1985. A study of mitochondrial and nuclear transcription with cloned cDNA probes. Changes in the relative abundance of mitochondrial transcripts after stimulation of quiescent mouse fibroblasts. Experimental Cell
Research 157, 127-143.
Eldaghayes I, Rothwell L, Williams A, Withers D, Balu S, Davison F, Kaiser P. 2006. Infectious bursal disease virus: strains that differ in virulence differentially modulate the innate immune response to infection in the chicken bursa. Viral Immunology 19, 83-91.
Elferink MG, Vallee AAA, Jungerius AP, Crooijmans RPMA, Groenen MAM. 2008. Partial duplication of the PRLR and SPEF2 genes at the late feathering locus in chicken. BMC Genomics 9, 391-400.
Farnell M, Crippen TL, Swaggerty CL, Kogut MH. 2003. Oxidative burst mediated by
toll loke receptors (TLR) and CD14 on avian heterophils stimulated with bacterial toll agonists. Developmental and Comparative Immunology 27, 423-429.
Ferro PJ, Swaggerty CL, Kaiser P, Pevzner Y, Kogut MH. 2004. Heterophils isolated from chickens resistant to extra-intestinal Salmonella enteritidis infection express
higher levels of pro-inflamatory cytokine mRNA following infection than heterophils from susceptible chickens. Epidemiology and Infection 132, 1029-1037.
Fife MS, Salmon N, Hocking PM, Kaiser P. 2009. Fine mapping of the chicken salmonellosis resistance locus (SAL1). Animal Genetics 40, 871-877.
Fife MS, Howell JS, Salmon N, Hocking PM, van Diemen PM, Jones MA, Stevens
MP, Kaiser P. 2010. Genome-wide SNP analysis identifies major QTL for Salmonella colonization in the chicken. Animal Genetics 42, 134-140.

170
Flicek P, Amode MR, Barrell D, Beal K, Billis K, Brent S, Carvalho-Silva D, Clapham P, Coates G, Fitzgerald S, Gil L, Giron CG, Gordon L, Hourlier T, Hunt S, Johnson N, Juettemann T, Kahari AK, Keenan S, Kulesha E, Martin FJ, Maurel T, McLAren WM, Murphy DN Nag R, Overduin B, Pignatelli M, Pritchard B, Pritchard E, Riat HS, Ruffier M, Shepperd D, Taylor K, Thormann A, Trevanion SJ, Vullo A, Wilder SP, Wilson M, Zadissa A, Aken BL, Birney E, Cunningham F, Harrow J, Herrero J, Hubbard TJ, Kinsella R, Muffato M, Parker A, Spudich G, Yates A, Zerbino DR, Searle SM. 2013. Ensembl 2014. Nucleic Acid Research 42, 749-755.
Floreza M, Kaiser T, Savelkoul HFJ, Wiegertjes GF. 2012. The use of real-time quantitative PCR for the analysis of cytokine mRNA levels. In: de Ley M. (Ed).
Cytokine Protocols, Methods in molecular biology. Springer Science+Business Media, LLC., p.7.
Fossum O, Jansson DS, Etterlin PE, Vagsholm I. 2009. Causes of mortality in laying hens in different housing systems in 2001 to 2004. Acta Veterinaria Scandinavica. 51, 3.
Fukui A, Inoue N, Matsumoto M, Nomura M, Yamada K, Matsuda Y, Toyoshima K, Seya T. 2001. Molecular cloning and functional characterisation of chicken toll-like receptors. A single chicken toll covers multiple molecular patterns. The Journal of Biological Chemistry 276, 47143-47149.
Fulton JE. 2004. Selection for avian immune response: A commercial breeding
company challenge. Poultry Science 83, 658–661.
Garceau V, Smith J, Paton IR, Davey M, Fares MA, Sester DP, Burt DW, Hume DA. 2010. Pivotal advance: avian colony-stimulating factor 1 (CSF-1), interleukin-34 (IL-34) and CSF-1 receptor genes and gene products. Journal of Leukocyte Biology 87, 753-764.
Garceau V, Balic A, Garcia-Morales C, Sauter KA, McGrew MJ, Smith J, Vervelde L,
Sherman A, Fuller TE, Oliphant T, Shelley JA, Tiwari R, Wilson TL, Chintoan-Uta C, Burt DW, Stevens MP, Sang HM, Hume DA. 2015. The development and maintenance of the mononuclear phagocyte system of the chick is controlled by signals from the macrophage colony stimulating factor receptor. BMC Biology 13:12.
Garriga C, Hunter RP, Amat C, Planas JM, Mitchell MA, Moreto M. 2006. Heat stress increases apical glucose transport in the chicken jejunum. American Journal of Physiology 290, R195-R201.
Genovese KJ, He H, Swaggerty CL, Kogut MH. 2013. The avian heterophil. Developmental and Comparative Immunology 41, 334-340.
Germain RN, Meier-Schellersheim M, Nita-Lazar A, Fraser IDC. 2011. Systems biology in immunology – a computational modelling prespective. Annual Review of
Immunology 29, 527-585.
171
Gilsbach, R., Kouta, M., Bonisch, H., and Bruss, M. 2006. Comparison of in vitro and in vivo reference genes for internal standardization of real-time PCR data. BioTechniques 40, 173-177.
Glick B, Chang TS, Jaap RG. 1956. The bursa of Fabricius and antibody formation. Poultry Science, 35: 224-225.
Glick B. 1977. The bursa of Fabricius and immunoglobulin synthesis. International Review of Cytology 48, 345-402.
Glick, B. 1988. Bursa of Fabricius: development, growth, modulation, and endocrine functions. CRC Critical Reviews in Poultry Biology 1:107-132.
Goddard ME, Hayes BJ. 2009. Mapping genes for complex traits in domestic animals and their use in breeding programmes. Nature Reviews Genetics 10, 381-
391.
Gou Z, Liu R, Zhao G, Zheng M, Li P, Wang H, Zhu Y, Chen J, Wen J. 2012. Epigenetic modification of TLRs in leukocytes is associated with increased susceptibility to Salmonella Enteritidis in chickens. PLoS ONE 7, e33627.
Gross WB, Siegel PB, Hall RW, Domermuth CH, Dubose RT. 1980. Production and persistence of antibodies in chickens to sheep erythrocytes. 2. Resistance to infectious diseases. Poultry Science 59, 205 – 210.
Guo X, Wang L, Cui D, Ruan W, Liu F, Li H. 2012. Differential expression of the toll-like receptor pathway and related genes of chicken bursa after experimental infection with infectious bursa disease virus. Archives of Virology 157, 2189-2199.
Hartmann W, van der Hagen D, Heil G. 1984. Genetic resistance to leukosis virus infection: effects on mortality and egg production in Leghorn hens. British Poultry Science25, 43 – 52.
Havenstein GB, Ferket PR, Qureshi MA. 2003. Growth, Livability and feed
conversion of 1957 versus 2001 broilers when fed representative 1957 and 2001 broiler diets. Poultry Science 82, 1500-1508.
Heams T, Bed’hom B, Revbours E, Jaffrezic F, Pinard-van der Laan M-H. 2011.
Insights into gene expression profiling of natural resistance to coccidiosis in contrasting chicken lines. BMC Proceedings 5:S26
Hartmann W, van der Hagen D, Heil G. 1984. Genetic resistance to leukosis virus infection: effects on mortality and egg production in Leghorn hens. British Poultry Science 25, 43-52.
Health Protection Report: latest infection reports. www.gov.uk. August 2014.
Accessed November 2015

172
He H, Farnell MB, Kogut MH. 2003. Inflammatory agonist stimulation and signal pathway of oxidative burst in neonatal chicken heterophils. Comparative Biochemistry and Physiology 135, 177-184. He H, Lowry VK, Swaggerty CL, Ferro PJ, Kogut MH. 2005. In vitro activation of chicken leukocytes and in vivo protection against Salmonella Enteritidis organ invasion and peritoneal S. Enteritidis infection-induced mortality in neonatal chickens by immunostimulatory CpG oligodeoxynucleotide. Immunology and Medical Microbiology 43, 81-89.
He H, Genovese KJ, Swaggerty CL, Nisbet DJ, Kogut MH. 2007. In vivo priming heterophil innate immune functions and increasing resistance to Salmonella Enteritidis infection in neonatal chickens by immune stimulatory CpG
oligodeoxynucleotides. Veterinary Immunology and Immunopathology 117, 275-283.
He J-Q, Sandford AJ, Wang I-M, Stepaniants S, Knight DA, Kicic A, Stick SM, Paré PD. 2008. Selection of housekeeping genes for real-time PCR in atopic human
bronchial epithelial cells. The European Respiratory Journal 32;755-762.
He H, Genovese KJ, Swaggerty CL, Nisbet DJ, Kogut MH. 2012. A comparative study on invasion, survival, modulation of oxidative burst and nitric oxide responses of macrophages (HD11) and systemic infection in chickens by prevalent poultry Salmonella serovars. Foodborne Pathogens and Disease 9, 1-7.
Heidari M, Fitzgerald SD, Zhang H. 2015. Immune responses in cecal tonsils of
Marek’s Disease Virus-infected chickens. Avian Diseases 59, 213-226.
Heifetz EM, Fulton JE, O’Sullivan NP, Arthur JA, Wang J, DEkkers JCM, SOller M. 2007. Mapping quantitative trait loci affecting susceptibility to Marek’s Disease Virus in backcross population of layer chickens. Genetics 177, 2417-2431.
Higgs R, Cormican P, Cahalane S, Allan B, Lloyd AT, Meade K, James T, Lynn DJ, Babiuk LA, O’Farrelly C. 2006. Induction of a novel chicken toll-like receptor following Salmonella enterica serovar Typhimurium infection. Infection and Immunity 74, 1692-1698.
Higuchi M, Matsuo A, Shingai M, Shida K, Ishii A, Funami K, Suzuki Y, Oshiumi H, Matsumoto M, Seya T. 2008. Combinational recognition of bacterial lipoproteins and peptidoglycan by chicken toll-like receptor 2 subfamily. Developmental and Comparative Immunology 32, 147-155.
Hillier et al., 2004. International chicken genome sequencing consortium: Sequence
and comparative analysis of the chicken genome provide unique perspectives on vertebrate evolution. Nature 432, 695-716.

173
Hocking PM. 2010. Developments in poultry genetic research 1960-2009. British Poultry Science 1, 44-51.
Hodek P, Stiborova M. 2003. Chickens antibodies – superior alternative for conventional immunoglobulins. Proceedings of the National Academy of Sciences, India B69, 461-468.
Hong YH, Song W, Lee SH, Lillehoj HS. 2012. Differential gene expression profiles of β-defensins in the crop, intestine and spleen using a necrotic enteritis model in 2
commercial broiler chicken lines. Poultry Science 91, 1081-1088.
Huang Q, Liu D, Majewski P, Schulte LC, Korn JM, Young RA, Lander ES, Hacohen N. 2001. The plasticity of dendritic cell responses to pathogens and their components. Science 294, 870-875.
Huggett J, Dheda K, Bustin S, Zumla A. 2005. Real-time RT-PCR normalisation; strategies and considerations. Genes and Immunity 6; 279-284.
Igyarto BZ, Lacko E, Olah I, Magyar A. 2006. Characterisation of chicken epidermal dendritic cells. Immunology, 119, 278–288.
Igyarto B-Z, Magyar A, Olah I. 2007. Origin of follicular dendritic cell in the chicken spleen. Cell and Tissue Research 327, 83-92.
Iqbal M, Philbin VJ, Withanage GS, Wigley P, Beal RK, Goodchild MJ, Barrow P,
McConnell I, Maskell DJ, Young J, Bumstead N, Boyd Y, Smith AL. 2005. Identification and functional characterisation of chicken toll-like receptor 5 reveals a fundamental role in the biology of infection with Salmonella enterica serovar
Typhimurium. Infection and Immunity 73, 2344-2350.
Ivanov II, McKenzie BS, Zhou L, Tadokoro CE, Lepelley A, Lafaille JJ, Cua D, Littman DR. 2006. The orphan nuclear receptor RORγt directs the differentiation program of proinflammatory IL-17+ T helper cells. Cell 126, 1121-1133.
Jang JS, Simon VA, Feddersen RM, Rakhshan F, Schultz DA, Zschunke MA, Lingle WL, Kolbert CP, Jen J. 2011. Quantitative mRNA expression analysis using Fluidigm microfluidics dynamic arrays. BMC Genomics 12, 144.
Jensen K, Talbot R, Paxton E, Waddington D, Glass EJ. 2006. Development and validation of bovine macrophage specific cDNA microarray. BMC Genomics 7, 224.
Ji S, Yang R, Lu C, Qiu Z, Yan C, Zhao Z. 2014. Differential expression of PPARγ, FASN and ACADM genes in various adipose tissues and Longissimus dorsi muscle from yanbian yellow cattle and yan yellow cattle. Asian-Australasian Journal of Animal Sciences 27, 10-18. doi.org/10.5713/ajas.2013.13422
Jie H, Liu YP. 2011. Breeding for disease resistance in poultry: opportunities with challenges. World’s Poultry Science Journal 67, 687-695.

174
Joffre OP, Segura E, Savina A, Amigorena S. 2012. Cross-presentation by dendritic cells. Nature Reviews Immunology 12, 557-569.
Jung D, Giallourakis C, Mostoslavsky R, Alt FW. 2006. Mechanism and control of V(D)J recombination at the immunoglobulin heany chain locus. Annual Review of Immunology 24, 541-570.
Kaiser P, Rothwell L, Galyov EE, Barrow PA, Burnside J, Wigley P. 2000. Differential cytokine expression in avian cells in response to invasion by Salmonella
Typhimurium, Enteritidis and Salmonella Gallinarum. Microbiology 146, 3217-3226.
Kaiser P, Underwood G, Davison F. 2003. Differential cytokine responses following Marek’s disease virus infection of chickens differing in resistance to Marek’s disease. Journal of Virology 77, 762-768.
Kaiser P, Poh TY, Rothwell L, Avery S, Balu S, Pathania U, Hughes S, Goodchild M, Morrell S, Watson M, Bumstead N, Kaufman J, Young JR. 2005. A genomic analysis
of chicken cytokines and chemokines. Journal of Interferon & Cytokine Research 25, 467-484.
Kaiser MG, Cheeseman J, Kaiser P, Lamont SJ. 2006. Cytokine expression in chicken peripheral blood mononuclear cells after in vitro exposure to Salmonella enterica
serovar Enteritidis. Poultry Science 85, 1907-1911.
Kaiser P, Howell J, Fife M, Sadeyen J-R, Salmon N, Rothwell L, Young J, van Diemen P, Stevens M, Poh T-Y, Jones M, Barrow P, Wigley P, He H, Swaggerty C, Kogut M, Smith J, Burt D. 2008. Integrated immunogenomics in the chicken: deciphering the
immune response to identify disease resistance genes. Animal Genomics for Animal Health 132, 57-66.
Kaiser P. 2010. Advances in avian immunology – prospects for disease control: a review. Avian Pathology 39, 309-324.
Kaiser P. 2012. The long view: a bright past, a brighter future? Forty years of
chicken immunology pre- and post-genome. Avian Pathology 41, 511-518.
Kapetanovic R, Fairnbairn L, Beraldi D, Sester DP, Archibald AL, Tuggle CK, Hume DA. 2012. Pig bone marrow-derived macrophages resemble human macrophages in their response to bacterial lipopolysaccharide. Journal of Immunology 188, 3382-
3394.
Karpala AJ, Stewart C, McKay J, Lowenthal JW, Bean AG. 2011. Characterisation of chicken Mda5 activity regulation of IFN-beta in the absence of RIG-I functionality. Journal of Immunology 186, 5397-5405.
Kaufman J, Völk H, Wallny H-J. 1995. A “minimal essential MHC” and an “unrecognised MHC”: two extremes in selection for polymorphism. Immunological reviews 143, 65-88.
175
Kaufmann-Bart M, Hoop RK. 2009. Diseases in chicks and laying hens during the first 12 years after battery cages were banned in Switzerland. Veterinary Record 164, 203–207.
Kaufman J. 2013. Antigen processing and presentation: Evolution from a bird's eye view. Molecular Immunology 55, 159–161.
Killick KE, Browne JA, Park SDE, Magee DA, Martin I, Meade KG, Gordon SV, Gormley E, O’Farrelly C, Hokamp K, MacHugh DE. 2011. Genome-wide
transcriptional profiling of peripheral blood leukocytes from cattle infected with Mycobacterium bovis reveals suppression of host immune genes. BMC Genomics 12, 611.
Kim C-H, Lillehoj HS, Hong Y-H, Keeler Jr. CL, Lillehoj EP. 2011. Analysis of global transcriptional responses of chicken following primary and secondary Eimeria acervulina infections. BMC Proceedings 5 (Suppl 4):S12.
Knap PW. 2005. Breeding robust pigs. Australian Journal of Experimental Agriculture 45, 763-773.
Koenen ME, Boonstra-Blom AG, Jeurissen SHM. 2002. Immunological differences between layer- and broiler-type chickens. Veterinary Immunology and
Immunopathology 89, 47-56.
Kogut MH, Genovese KJ, Lowry VK. 2001. Differential activation of signal transduction pathways mediating phagocytosis, oxidative burst, and degranulation by chicken heterophils in response to stimulation with opsonised Salmonella Enteritidis. Inflammation 25, 7-15. Kogut MH, Rothwell L, Kaiser P. 2003. Differential regulation of cytokine gene expression by avian heterophils during receptor-mediated phagocytosis of opsonised and nonopsonized Salmonella enteritidis. Journal of Interferon and Cytokine Research 23, 319-327.
Kogut MH, Iqgal M, He H, Philbin V, Kaiser P, Smith A. 2005. Expression and
function of toll-like receptors in chicken heterophils. Developmental and Comparative Immunology 29, 791-807.
Kogut MH, Swaggerty C, He H, Pevzner I, Kaiser P. 2006. Toll-like receptor agonists stimulate differential functional activation and cytokine and chemokines gene expression in heterophils isolated from chickens with differential innate responses. Microbes and Infections 8, 1866-1874.
Korenkova V, Scott J, Novosadova V, Jindrichova M, Langerowa L, Svec D, Sidova M, Sjoback R. 2015. Pre-amplification in the context of high-throughput qPCR gene expression experiment. BMC Molecular Biology 16:5.
Korn T, Bettelli E, Oukka M, Kuchroo VK. 2009. IL-17 and Th17 cells. Annual Review of Immunology 27, 485-517.
176
Kramer J, Visscher AH, Wagenaar JA, Cornelissen JBJW, Jeurissen SHM. 2003. Comparison of natural resistance in seven genetic groups of meat-type chicken. British Poultry Science 44, 577–585.
Kuchipudi SV, Tellabati M, Nelli RK, White GA, Baquero Perez B, Sebastian S, Slomka MJ, Brookes SM, Brown IH, Dunham SP, Chang K-C. 2012. 18S rRNA is a reliable normalisation gene for real time PCR based on influenza virus infected cells.
Virology Journal 9:230.
Ladman BS, Rosenberger SC, Rosenberger JK, Pope CR, Gelb J. 2008. Virulence of low pathogenicity H7N2 avian influenza viruses from the Delmarva peninsula for broiler and leghorn. Avian Diseases 52, 623-631.
Lamont SJ, Pinard-van der Laan MH, Cahaner A, van der Poel JJ, Parmentier HK. 2003. Selection for disease resistance: Direct selection on the immune response. In: Muir WM, Aggrey SE. (ed.) Poultry Genetics, Breeding and Biotechnology. 1st Edition. CABI Publishing.
Lamont S, Dekkers JCM, Burnside J. 2008. Immunogenetics and mapping immunological functions. In: Davison F, Kaspers B, Schat KA (Eds.), Avian
Immunology, Elsevier Ltd., p. 225
Langmead B, Trapnell C, Pop M, Salzberg SL. 2009. Ultrafast and memory-efficient alignment of short DNA sequences to the human genome. Genome Biology 10:R25. doi:10.1186/gb-2009-10-3-r25
Larkin MA, Blackshields G, Brown NP, Chenna R, McGettigan PA, McWilliam H, Valentin F, Wallace IM, Wilm A, Lopez R, Thompson JD, Gibson TJ, Higgins DG. 2007. Clustal W and Clustal X version 2.0. Bioinformatics, 23, 2947-2948
Lavric M, Maughan MN, Bliss TW, Dohms JE, Bencina D, Keeler Jr CL, Narat M. 2008. Gene expression modulation in chicken macrophages exposed to
Mycoplasma synovie or Escherichia coli. Veterinary Microbiology 126, 111-121.
Lebman DA, Coffman RL. 1988. Interleukin 4 causes isotype switching to IgE in T cell-stimulated clonal B cell cultures. Journal of Experimental Medicine 168, 853-862.
Ledderose C, Heyn J, Limbeck E, Kreth S. 2011. Selection of reliable reference genes for quantitative real-time PCR in human T cells and neutrophils. BMC Research Notes 4, 427.
Lee JY, Song JJ, Wooming A, Li X, Zhou H, Bottje WG, Kong B-W. 2010.
Transcriptional profiling of host gene expression in chicken embryo lung cells infected with laryngotracheitis virus. BMC Genomics 11, 445.
Lehman IR, Nussbaum AL. 1964. The deoxyribonucleases of Escherichia coli V. On the specificity of exonuclease I (phosphodiesterase). The Journal of Biological Chemistry 239, 2629-2636.

177
Lei L, Yu J, Bao E. 2009. Expression of the heat shock protein 90 (Hsp90) and transcription of its corresponding mRNA in broilers exposed to high temperature. British Poultry Science 50, 504-511.
Leslie GA, Clem LW. 1969. Phylogeny of immunoglobulin structure and function. III. Immunoglobulins of the chicken. Journal of Experimental Medicine 130, 1337–1352.
Leveque G, Forgetta V, Morroll S, Smith AL, Bumstead N, Barrow P, Loredo-Osti JC, Morgan K, Malo D. 2003. Allelic variation in TLR4 is linked to susceptibility to Salmonella enterica serovar Typhimurium infection in chickens. Infection and Immunity 71, 1116-1124.
Li YP, Handberg KJ, Juul-Madsen HR, Zhang MF, Jorgensen PH. 2007. Transcriptional profiles of chicken embryo cell cultures following infection with infectious bursal disease virus. Archives Virology 152, 463-478.
Li X, Chiang HI, Zhu J, Dowd SE, Zhou H. 2008a. Characterisation of a newly developed chicken 44k Agilent microarray. BMC Genomics 9, 60.
Li S, Gowans EJ, Chougnet C, Plebanski M, Dittmer U. 2008b. Natural regulatory T
cells and persistent viral infection. Journal of Virology 82, 21-30.
Li X, Swaggerty CL, Kogut MH, Chiang H, Wang Y, Genovese KJ, He H, Stern NJ, Pevzner IY, Zhou H. 2008c. The paternal effect of Campylobacter jejuni colonisation in ceca in broilers. Poultry Science 87, 1742-1747.
Li X, Swaggerty CL, Kogut MH, Chiang H-I, Wang Y, Genovese KJ, He H, Zhou H. 2010. Gene expression profiling of the local cecal response of genetic chicken lines
that differ in their susceptibility to Campylobacter jejuni colonisation. PLoS ONE 5, e11827.
Li X, Swaggerty CL, Kogut MH, Chaing H-I, Wang Y, Genovese KJ, He H, McCarthy FM, Burgess SC, Pevzner IY, Zhou H. 2012. Systemic response to Campylobacter jejuni infection by profiling gene transcription in the spleens of two genetic lines of chickens. Immunogenetics 64, 59-69.
Li X, Yang Q, Bai J, Xuan Y, Wang Y. 2015. Identification of appropriate reference genes for human mesenchymal stem cell analysis by quantitative real-time PCR. Biotechnology Letters 37, 67-73.
Lian L, Qu LJ, Sun HY, Chen YM, Lamont SJ, Liu CJ, Yang N. 2012. Gene expression
analysis of host spleen responses to Marek’s disease virus infection at late tumor transformation phase. Poultry Science 91, 2130-2138.
Liang J, Fu J, Kang H, Lin J, Yu Q, Yang Q. 2013. The stimulatory effect of TLRs ligands on maturation of chicken bone marrow-derived dendritic cells. Veterinary Immunology and Immunopathology 155, 205-210.

178
Liang J, Yin Y, Qin T, Yang Q. 2015. Chicken bone marrow-derived dendritic cells maturation in response to infectious bursal disease virus. Veterinary Immunology and Immunopathology 164, 51–55.
Lu Q, Wen J, Zhang H. 2007. Effect of Chronic Heat Exposure on Fat Deposition and Meat Quality in Two Genetic Types of Chicken. Poultry Science 86, 1059‐ 1064.
Lupberger J, Kreuser KA, Baskaynak G, Peters UR, le Coutre P, Schmidt CA. 2002. Quantitative analysis of beta-actin, beta-2-microglobulin and porphobilinogen
deaminase mRNA and their comparison as control transcripts for RT-PCR. Molecular and Cellular Probes 16; 25-30.
Lyall J, Irvine RM, Sherman A, McKinley TJ, Nunez A, Purdie A, Outtrim L, Brown IH, Rolleston-Smith G, Sang H, Titley L. 2011. Suppression of avian influenza transmission in genetically modified chickens. Science 331, 223-226.
Maltseva DV, Khaustova NA, Fedotov NN, Matveeva EO, Lebedev AE, Shkurnikov
MU, Galatenko VV, Schumacher U, Tonevitsky AG. 2013. High-throughput identification of reference genes for research and clinical RT-qPCR analysis of breast cancer samples. Journal of Clinical Bioinformatics 3; 13.
Mariani P, Barrow PA, Cheng HH, Groenen MAM, Negrini R, Bumstead N. 2001.
Localization to chicken Chromosome 5 of a novel locus determining salmonellosis resistance. Immunogenetics 53, 786-791.
Martin A, Gross WB, Dunnington EA, Briles RW, Briles WE. 1986. Resistance to natural and controlled exposures to Eimeria tenella: genetic variation and alloantigen systems. Poultry Science 65, 1847 – 1852.
Martins RP, Aquilar C, Graham JE, Carvajal A, Bautista R, Claros MG, Garrido JJ.
2013. Pyroptosis and adaptive immunity mechanisms are promptly engendered in mesenteric lymph-nodes during pig infections with Salmonella enterica serovar
Typhimurium. Veterinary Research, 44, 120
Matulova M, Vermozova K, Sisak F, Havlickova H, Babak V, Stejskal K, Zdrahal Z, Rychlik I. 2013. Chicken innate immune response to oral infection with Salmonella enterica serovar Enteritidis. Veterinary Research 44; 37.
Maxwell MH. 1987. The avian eosinophil – A review. World’s Poultry Science Journal 43, 190-207.
McElroy JP, Dekkers JCM, Fulton JE, O’Sullivan NP, Soller M, Lipkin E, Zhang W, Koehler KJ, Lamont SJ, Cheng HH. 2005. Microsatellites markers associated with
resistance to Marek’s Disease in commercial layer chickens. Poultry Science 84, 1678–1688.
Mellits KH, Connerton IF, Loughlin MF, Clarke P, Smith J, Dillon E, Connerton PL, Mulholland F, Hakey CJ. 2009. Induction of a Chemoattractant transcriptional

179
response by a Camylobacter jejuni boiled cell extract in colonocytes. BMC Microbiology 9, 28.
Mengual L, Burset M, Marin-Aguilera, Ribal MJ, Alcaraz A. 2008. Multiplex preamplification of specific cDNA targets prior to gene expression analysis by TaqMan Arrays. BMC Research Notes, 1:21.
Meyer-Siegler K, Mauro DJ, Seal G, Wurzer J, Deriel JK, Sirover MA. 1991. A human nuclear uracil DNA glycosylase in the 37-kDa subunit of glyceraldehydes-3-
phosphate dehydrogenase. PNAS 88, 8460-8464.
Mighell AJ, Smith NR, Robinson PA, Markham AF. 2000. Vertabrate pseudogenes. FEBS Letters 468; 109-114.
Mortazavi A, Williams BA, McCue K, Schaeffer L, Wold B. 2008. Mapping and
quantifying mammalian transcriptomes by RNA-Seq. Nature Methods 5, 621 – 628.
Mosmann TR, Coffman RL. 1989. Th1 and Th2 cells: different patterns of lymphokine secretion lead to different functional properties. Annual Review of Immunology 7, 145-173.
Munir S, Singh S, Kaur K, Kapur V. 2004. Suppression substractive hybridisation coupled with microarray analysis to examine differential expression of genes in virus infected cells. Biological Procedures Online 6, 94-104.
Murphy D. 2002. Gene expression studies using microarrays: Principles, problems, and prospects. Advances in Physiology Education 26, 256–270.
Nakayama M. 2015. Antigen presentation by MHC-dressed cells. Frontiers of Immunology 5, 672.
Nau GJ, Richmond JFL, Schlesinger A, Jennings EG, Lander ES, Young RA. 2002. Human macrophage activation programs induced by bacterial pathogens. Proceedings of the National Academy of Sciences 99, 1503-1508.
Nerren JR, Swaggerty CL, MacKinnon KM, Genovese KJ, He H, Pevzner I. 2009. Differential mRNA expression of the avian-specific toll-like receptor 15 between heterophils from Salmonella-susceptible and –resistant chickens. Immunogenetics
61, 71-77.
Nerren JR, He H, Genovese K, Kogut MH. 2010. Expression of the avian-specific toll-like receptor 15 in chicken heterophils is mediated by Gram-negative and Gram-positive bacteria, but not TLR agonists. Veterinary Immunology and Immunopathology 136, 151-156.
Nicholas KB, Nicholas HB Jr, Deerfield DW II. 1997. GeneDoc: Analysis and Visualization of Genetic Variation, EMBNEW.NEWS 4:14

180
Nikolich_Zugich J, Slifka MK, Messaoudi I. 2004. The many important facets of T-cell repertoire diversity. Nature Reviews Immunology 4, 123-132.
Nie H, Crooijmans RPMA, Lammers A, van Schothorst EM, Keijer J, Neerincx PBT, Leunissen JAM, Megens HJ, Groenen MAM. 2010. Gene Expression in Chicken Reveals Correlation with Structural Genomic Features and Conserved Patterns of Transcription in the Terrestrial Vertebrates. PLoS ONE 5, e11990.
Noutsias M, Rohde M, Block A, Klippert K, Lettau O, Blunert K, Hummel M, Kuhl U,
Lehmkuh H, Hetzer R, Rauch U, Poller W, Pauschinger M, Schultheiss HP, Volk HD, Ouyang W, Kolls JK, Zheng Y. 2008. The biological functions of T helper 17 cell effector cytokines in inflammation. Immunity 28, 454-467.
Olah I, Nagy N. 2013. Retrospection to discovery of bursal function and recognition of avian dendritic cells: past and present. Developmental and Comparative Immunology 58, 47-59.
O’Neill LA, Bowie AG. 2007. The family of five: TIR-domain-containing adaptors in Toll-like receptor signalling. Nature Reviews Immunology 7, 353-364.
Ozinsky A, Underhill DM, Fontenot JD, Hajjar AM, Smith KD, Wilson CB, Schroeder L, Aderem A. 2000. The repertoire for pattern recognition of pathogens by the
innate immune system is defined by cooperation between toll-like receptors. Proceedings of the National Academy of Sciences 97, 13766-13771.
Pankla R, Buddhisa S, Berry M, Blankenship DM, Bancroft GJ, Banchereau J, Lertmemongkolchai G, Chaussabel D. 2009. Genomic transcriptional profiling identifies a candidate blood biomarker signature for the diagnosis of septicemic melioidosis. Genome Biology, 10:R127.
Parkhurst C, Mountney GJ. Pultry meat and egg production. Springer Science & Business Media, 2012. Google books. 15 November 2015. http://books.google.com
Parmentier HK, de Vries Reilingh G, Freke P, Koopmanschap, RE, Lammers A. 2010. Immunological and physiological differences between layer and broiler chickens after concurrent intratracheal administration of lipopolysaccharide and human serum albumin. International Journal of Poultry Science 9, 574-583.
Pearson K. 1901. On Lines and Planes of Closest Fit to Systems of Points in Space. Philosophical Magazine 2:559– 572.
Peck R, Murthy KK, Vainio O. 1982. Expression of B-L (Ia-like) antigens on macrophages from chicken lymphoid organs. Journal of Immunology 129, 4-5.
Perez R, Tupac-Yupanqui I, Dunner S. 2008. Evaluation of suitable reference genes
for gene expression studies in bovine muscular tissue. BMC Molecular Biology 9; 79.
Pfaffl MW, Tichopad A, Prgomet C, Neuvians TP. 2004. Determination of stable housekeeping genes, differentially regulated target genes and sample integrity:

181
BestKeeper – Excel-based tool using pair-wise correlations. Biotechnology Letters 26; 509-515.
Philbin VJ, Iqbal M, Boyd Y, Goodchild MJ, Beal RK, Bumstead N, Young J, Smith AL. 2005. Identification and characterisation of a functional alternatively spliced toll-like receptor 7(TLR7) and genomic disruption of TLR8 in chickens. Immunology 114, 507-521.
Pieprzyk M, High H. 2009. Fluidigm dynamic arrays provide a platform for single-cell
gene expression analysis. Nature Methods 6.
Pleidrup AJ, Norup LR, Dalgaard TS, Kaiser P, Permin A, Schou TW, Vadekaer DF, Jungersen G, Sorensen P, Juul-Madsen HR. 2014. Cytokine gene expression profiles in chicken spleen and intestinal tissues during Ascardia galli infection. Veterinary Parasitology 206, 317-321.
Pope CR. 2001. Lymphoid system. In Avian histopathology, 2nd Edition. C. Riddel
(ed.). American Association of Avian Pathologists, Kennett square, PA, p. 18-34.
Qin Z, Arakawa A, Baba E, Fukata T, Sasai K. 1996. Effect of Eimeria tenella infection on the production of Salmonella Enteritidis-contaminated eggs. Avian Diseases 40, 361-267.
Quake SR, Taylor CR, Weiner LP. 2008. A microfluidic processor for gene expression profiling of single human embryonic stem cells. Lab Chip 8, 68-74.
Radonić A. Thulke S, Mackay IM, Landt O, Siegert W, Nitsche A. 2004. Guideline to
reference gene selection for quantitative real-time PCR. Biochemical and Biophysical Research Communications 313; 856-862.
Ratcliffe MJH. 1989. Development of the avian B lymphocyte lineage. C R C Critical Reviews in Poultry Biology 2, 207-234.
Ratcliffe MJ, Jacobsen KA. 1994. Rearrangement of immunoglobulin genes in
chicken B cell development. Seminars in Immunology, 6, 175-184.
Rajput IR, Hussain A, Li YL, Zhang X, Xu X, Long MY, You DY, Li WF. 2014.
Saccharomyces boulardii and Bacillus subtilis B10 modulate TLRs mediated signalling to induce immunity by chicken BMDCs. Journal of Cell Biochemistry 115,
189-198.
Rasoli M, Yeap SK, Tan SW, Roohani K, Kristeen-Teo YW, Alitheen NB, Rahaman YA, Aini I, Bejo MH, Kaiser P, Omar AR. 2015. Differential modulation of immune response and cytokine profiles in the bursae and spleen of chickens infected with very virulent infectious bursal disease virus. BMC Veterinary Research 11, 75.
Reemers SS, van Leenen D, Groot Koerkamp MJ, van Haarlem D, van der Haar P,
van Eden W, Vervelde L. 2010. Early host responses to avian influenza A virus are

182
prolonged and enhanced at transcriptional level depending on maturation of the immune system. Molecular Immunology 47, 1675-1685.
Reynaud CA, Anquez V, Dahan A, Weill JC. 1985. A single rearrangement event
generates most of the chicken immunoglobulin light chain diversity. Cell 40, 283-291.
Reynaud CA, Anquez V, Grimal H, Weill JC. 1987. A hyperconversion mechanism generates the chicken light chain preimmune repertoire. Cell 48, 379-388.
Reynaud CA, Dahan A, Anquez V, Weill JC. 1989. Somatic hyperconversion diversifies the single vh-gene of the chicken with a high-incidence in the d-region. Cell 59, 171-183.
Read A, Baigent SJ, Powers C, Kgosana LB, Blackwell L, Smith LP, Kennedy DA, Walkden-Brown SW, Nair VK. 2015. Imperfect vaccination can enhance the transmission of highly virulent pathogens. PLoS Biology 13: e1002198.
Redmond SB, Chuammitri P, Andreasen CB, Palic D, Lamont SJ. 2009. Chicken
heterophils from commercially selected and non-selected genetic lines express cytokines differently after in vitro exposure to Salmonella Enteritidis. Veterinary Immunology and Immunopathology 132, 129-134.
Redmond SB, Chuammitri P, Andreasen CB, Palic D, Lamont SJ 2011. Genetic control of chicken heterophil function in advanced intercross lines: associations with novel and with known Salmonella resistance loci and likely mechanism for cell death in extracellular trap production. Immunogenetics 63, 449-458.
Riemer AB, Keskin DB, Reinherz EL. 2012. Identification and validation of reference genes for expression studies in human keratinocyte cell lines treated with and without interferon-γ - a method for qRT-PCR reference gene determination. Experimental Dermatology 21; 625-629.
Roach JC, Smith KD, Strobe KL, Nissen SM, Haudenschild CD, Zhou D, Vasicek TJ, Held GA, Stolovitzky GA, Hood LE, Aderem A. 2007. Transcription factor expression in lipopolysaccharide-acitivated peripheral-blood-derived mononuclear cells. Proceedings of the National Academy of Sciences 104, 16245–16250.
Rødgaard T, Skovgaard K, Stagsted J, Heegaard PMH. 2012. Expression of innate
immune response genes in liver and three types of adipose tissue in cloned pigs. Cellular Reprograming 14, 407-417.
Rohr JR, Raffel TR, Hall CA. 2010. Developmental variation in resistance and tolerance in a multi-host-parasite system. Functional Ecology 24, 1110-1121.
Rubin CJ, Zody MC, Eriksson J, Meadows JRS, Sherwood E, Webster MT, Jiang L, Ingman M, Sharpe T, Ka, S, Hallbook F, Besnier F, Carlborg O, Bed'hom B, Tixier-
Boichard M, Jensen P, Siegel P, Lindbald-Toh K, Andersson L. 2010. Whole genome

183
resequencing reveals loci under selection during chicken domestication. Nature 464, 587-591.
Ruby T, Whittaker C, Withers DR, Chelbi-Alix MK, Morin V, Oudin A, Young JR,
Zoorob R. 2006. Transcriptional profiling reveals a possible role for the timing of the inflammatory response in determining susceptibility to a viral infection. Journal of Virology 80, 9207-9216.
Rue CA, Susta L, Cornax I, Brown CC, Kapczynski DR, Suarez DL, King DJ, Miller PJ, Afonso CL. 2011. Virulent Newcastle disease virus elicits a strong innate immune response in chicken. Journal of General Virology 92, 931-939.
Rusnakova V, Honsa P, Dzamba D, Stahlberg A, Kubista M, Anderova M. 2013. Heterogeneity of astrocytes: from development to injury - single cell gene expression. PLoS One 8, e69734.
Sandford EE, Orr M, Li X, Zhou H, Johnson TJ, Kariyawasam S, Liu P, Nolan LK,
Lamont SJ. 2012. Strong concordance between transcriptomic patterns of spleen and peripheral blood leukocytes in response to avian pathogenic Escherichia coli
infection. Avian Diseases 56; 732-736.
Sanz-Santos G, Jimenez-Marin A, Bautista R, Fernandez N, Claros GM, Garrido JJ. 2011. Gene expression pattern in swine neutrophils after lipopolysaccharide exposure: a time course comparison. BMC Proceedings 5(Suppl 4): S11.
Schijns VEJ, van de Zande S, Lupiani B, Reddy SM. 2014. Practical Aspects of Poultry
Vaccination. In: Schat KA, Kaspers B, Kaiser P. (ed.) Avian Immunology. 2nd ed.: Elsevier.
Schokker D, Peters THF, Hoekman AJW, Rebel JMJ, Smits MA. 2012. Differences in the early response of hatchlings of different chicken breeding lines to Salmonella enterica serovar Enteritidis infection. Poultry Science 91, 346-353.
Schmittgen TD, Zakrajsek BA. 2000. Effect of experimental treatment on housekeeping gene expression: validation by real-time quantitative RT-PCR. Journal of Biochemical and Biophysical Methods 46; 69-81.
Schreiber J, Jenner RG< Murray HL, Gerber GK, Gifford DK, Young RA. 2006. Coordinated binding of NF-kappaB family members in the response of human cells to lipopolysaccharide. Proceedings of the National Academy of Sciences 103, 5899-5904.
Schwarz H, Schneider K, Ohnemus A, Lavric M, Kothlow S, Bauer S, Kaspers B, Staeheli P. 2007. Chicken Toll-like receptor 3 recognises its cognate ligand when ectopically expressed in human cells. Journal of Interferon and Cytokine Research 27, 97-101.

184
Shanmugasundaram R, Selvaraj RK. 2011. Regulatory T cell properties of chicken CD4+CD25+ cells. Journal of Immunology 186, 1997-2002
Shaughnessy RG, Meade KG, Cahalane S, Allan B, Reiman C, Callanan JJ, O ’Farrelly C. 2009. Innate immune gene expression differentiates the early avian intestinal response between Salmonella and Campylobacter. Veterinary Immunology and
Immunopathology 132, 191-198.
Sheppard SK, Dallas JF, Strachan NJC, MacRae M, McCarthy ND, Wilson D, Gormley FJ, Falush D, Ogden ID, MAiden MCJ, Forbes KJ. 2009. Campylobacter genotyping to determine the source of human infection. Clinical Infectious Diseases;
48, 1072–1078.
Sindelka R, Sidova M, Svec D, Kubista M. 2010. Spatial expression profiles in the Xenopus laevis oocytes measured with qPCR tomography. Methods 51, 87-91.
Skovgaard K, Cirer S, Vasby D, Podolska A, Breum SØ, Durrwald R, Schlegel M, Heegaard PMH. 2013. Expression of innate immune genes, proteins and microRNAs
in lung tissue of pigs infected experimentally with influenza virus (H1N2). Innate Immunity 19, 531-544.
Smith HW, Cook JK, Parsell ZE. 1985. The experimental infection of chickens with mixtures of infectious bronchitis virus and Escherichia coli. Journal of General
Virology 66, 777-786.
Smith RD, Ogden CW, Penny MA. 2001. Exclusive amplification of cDNA template
(EXACT) RT-PCR to avoid amplifying contaminating genomic pseudogenes. BioTechniques 31; 776-778.
Smith CK, Kaiser P, Rothwell L, Humphrey T, Barrow PA, Jones MA. 2005. Campylobacter jejuni –induced cytokine responses in avian cells. Infection and Immunity 73, 2094-2100.
Smith J, Speed D, Hocking PM, Talbot RT, Degen WGJ, Schijns VEJC, Glass EJ, Burt DW. 2006. Development of a chicken 5K microarray targeted towards immune function. BMC Genomics 7:49.
Smith J, Sadeyen J-R, Paton IR, Hocking PM, Salmon N, Fife M, Nair V, Burt DW, Kaiser P. 2011. Systems analysis of immune responses in Marek's disease virus-infected chickens identifies a gene involved in susceptibility and highlights a possible novel pathogenicity mechanism. Journal of Virology 85, 11146-11158.
Smith J, Sadeyen J-R, Butter C, Kaiser P, Burt DW. 2014. Analysis of the early immune response to infection by infectious bursal disease virus (IBDV) in chickens differing in their resistance to the disease. Journal of Virology 89, 5 2469-2482.

185
Smith J, Sadeyen JR, Butter C, Kaiser P, Burt DW. 2015. Analysis of the early immune response to infection by infectious bursal disease virus in chickens differing in their resistance to the disease. Journal of Virology 89, 2469-2482.
Soller M, Weigend S, Romanov MN, Dekkers JC, Lamont SJ. 2006. Strategies to assess structural variation in the chicken genome and its associations with
biodiversity and biological performance. Poltry Science 85, 2061-2078.
Sorg D, Danowski K, Korenkova V, Rusnakova V, Kuffner R, Zimmer R, Meyer HHD, Kliem H. 2013. Microfluidic high-throughput RT-qPCR measurements of the immune response of primary bovine mammary epithelial cells cultured from milk to mastitis
pathogens. Animal 7, 799-805.
Spurgeon SL, Jones RC, Ramakrishnan R. 2008. High throughput gene expression measurment with real time PCR in a microfluidic dynamic array. PLoS ONE 3, e1662.
Star L, Ellen ED, Uitdehaag K, Brom FWA. 2008. A plea to implement robustness into breeding goal: Poultry as an example. Journal of Agricultural and Environmental
Ethics 21, 109-125.
Ståhlberg A, Aman P, Ridell B, Mostad P, Kubista M. 2003. Quantitative real-time
PCR method for detection of B lymphocyte monoclonality by comparison of kappa and lambda immunoglobulin light chain expression. Clinical Chemistry 49; 51-59.
Steinman RM, Adams JC, Cohn ZA. 1975. Identification of a novel cell type in peripheral lymphoid organs of mice. IV Identification and distribution mouse spleen.
Journal of Experimental Medicine 141, 804-820.
Stone HA. 1975. Use of highly inbred chickens in research. USDA Agricultural Research Service Technical Bulletin 1514, Washington, DC.
Støy ACF, Heegaard PMH, Sangild PT, Ostergaard MV, Skovgaard K. 2013. Gene expression analysis of the IPEC-J2 cell line: a simple model for the inflammation-
sensitive preterm intestine. ISRN Genomics 2013, ID 980651.
Stűrzenbaum SR, Kille P. 2001. Control genes in quantitative molecular biological techniques: the variability of invariance. Comparative Biochemistry and Physiology Part B: Biochemistry and Molecular Biology 130, 281-289.
Sugden K, Pariante CM, McGuffin P, Aitchison KJ, D'Souza UM. 2010. Housekeeping gene expression is affected by antidepressant treatment in a mouse fibroblast cell line. Journal of Psychopharmacology 24; 1253-1259.
Sun W. 2012. A statistical framework for eQTL mapping using RNA-seq data. Biometrics 68, 1-11.

186
Sun Y, Ding N, Ding SS, Yu S, Meng C, Chen H, Qiu X, Zhang S, Yu Y, Zhan Y, Ding C. 2013. Goose RIG-I functions in innate immunity against Newcastle disease virus infections. Molecular Immunology 53, 321-327.
Sun H, Liu P, Nolan LK, Lamont SJ. 2015. Avian pathogenic Escherichia coli (APEC) infection alters bone marrow transcriptome in chickens. BMC Genomics 16, 690.
Suzuki T, Higgins PJ, Crawford DR. 2000. Control selection for RNA quantitation. BioTechniques 29, 332–337.
Svec D, Rusnakova V, Korenkova V, Kubista M. 2013. In: PCR Technology Current Innovations, 3rd edition, CRC Press.
Swaggerty CL, Pevzner IY, Lowry VK, Farnell MB, Kogut MH. 2003. Functional comparison of heterophils isolated from commercial broiler chickens. Avian Pathology 32, 95-102.
Swaggerty CL, Kogut MH, Ferro PJ, Rothwell Lisa, Pevzner IY, Kaiser P. 2004. Differential cytokine mRNA expression in heterophils isolated from Salmonella-resistant and –susceptible chickens. Immunology 113, 139-148.
Swaggerty CL, Ferro PJ, Pevzner IY, Kogut MH. 2005. Hetrophils are associated with
resistance to systemic Salmonella enteritidis infections in genetically distinct chicken lines. FEMS Immunology and Medical Microbiology 43, 149-154.
Swaggerty CL, Kaiser P, Rothwell L, Pevzner IY, Kogut MH. 2006. Heterophil cytokine mRNA profile from genetically distinct lines of chickens with differential heterophils-mediated innate immune responses. Avian Pathology 35, 102-108.
Swaggerty CL, Pevzner IY, Kaiser P, Kogut MH. 2008. Profiling pro-inflamatory
cytokine and chemokines mRNA expression levels as a novel method for selection of increased innate immune responsiveness. Veterinary Immunology and Immunopathology 126, 35-42.
Swaggerty CL, Pevzner IY, He H, Genovese KJ, Nisbet DJ, Kaiser P, Kogut MH. 2009. Selection of broilers with improved innate immune responsiveness to reduce on-farm infection by food-borne pathogens. Food-borne Pathogens and Diseases 6, 777-783.
Swaggerty CL, Genovese KJ, He H, Duke SE, Pevzner IY, Kogut MH. 2011. Broiler breeders with an efficient innate immune response are more resistant to Eimeria tenella. Poultry Science 90, 1014-1019.
Swaggerty CL, Pevzner IY, Kogut MH. 2015. Selection for pro-inflammatory mediatiors produces chickens more resistant to Eimeria tenella. Poultry Science 94, 37-42.

187
Taylor S, Wakem M, Dijkman G, Alsarraj M, Nguyen M. 2010. A practical approach to RT-qPCR-publishing data that conform to the MIQE guidelines. Methods 50, S1-S5.
Tilquin P, Barrow PA, Marly J, Pitel F, Plisson-Petit F, Velge P, Vignal A, Baret PV, Bumstead N, Beaumont C. 2005. A genome scan for quantitative trait loci affecting
the Salmonella carrier-state in the chicken. Genetics Selection Evolution 37, 539-561.
Trapnell C, Pachter L, Salzberg SL. 2009. TopHat: discovering splice junctions with RNA-seq. Bioinformatics 25, 1105-1111.
Trapnell C, Williams B, Pertea G, Mortazavi A, Kwan G, van Baren MJ, Salzberg S, Wold BJ, Patcher L. 2010. Transcript assembly and quantification by RNA-seq
reveals unannotated transcripts and isoform switching during cell differentiation. Nature Biotechnology 28, 511-515.
Truong AD, Hong YH, Lillehoj HS. 2015. High throughput sequencing reveals differing immune responses in the intestinal mucosa of two inbred lines afflicted with necrotic enteritis. Veterinary Immunology and Immunopathology 166, 116-124.
Turnpenny JR, Parsons DJ, Armstrong AC, Clark JA, Cooper K, Matthews AM. 2001. Integrated models of livestock systems for climate change studies. 2 intensive systems. Global Change Biology 7, 163-170.
Xiao Y, An T-Q, Tian Z-J, Wei T-C, Jiang Y-F, Peng J-M, Zhou Y-J, Cai X-H, Tong G-Z.
2015. The gene expression profile of porcine alveolar macrophages infected with highly pathogenic porcine reproductive and respiratory syndrome virus indicates overstimulation of the innate immune system by the virus. Archives of Virology 160, 649-662.
Vallone PM, Butler JM. 2004. AutoDimer: a screening tool for primer-dimer and hairpin structures. BioTechniques 37, 226-231.
van der Most PJ, de Jong B, Parmentier HK, Verhulst S. 2011. Trade-off between growth and immune function: a meta-analysis of selection experiments. Functional Ecology 25, 74–80
van Dijk A, Tersteeg-Zijderveld MH, Tjeerdsma-van Bokhoven JL, Jansman AJ, Veldhuizen EJ, Haagsman HP. 2009. Chicken heterophils are recruited to the site of Salmonella infection and release antibacterial mature Cathelicidin-2 upon stimulation with LPS. Molecular Immunology 46, 1517-1526.
Vandesompele J, de Preter K, Pattyn F, Poppe B, van Roy N, de Paepe A, Speleman F. 2002. Accurate normalization of real-time quantitative RT-PCR data by geometric averaging of multiple internal control genes. Genome Biology 3; research 0034.

188
Vandesompele J, Kubista M, Pfaffl M. 2009. Reference gene validation software for improved normalization. In: Real-Time PCR: Current Technology and Applications. Logan J, Edwards K, Saunders N. (Eds). Caister Academic Press. p. 47–83.
Vervelde L, Reemers SS, van Haarlem DA, Post J, Claassen E, Jansen CA. 2013. Chicken dendritic cells are susceptible to highly pathogenic avian influenza viruses which induce strong cytokine responses. Developmental and Comparative
Immunology, 39, 198-206.
Yan J, Bao E, Yu J. 2009. Heat shock protein 60 expression in heart, liver and kidney of broilers exposed to high temperature. Research in Veterinary Science 86, 533-538.
Yang F, Lei X, Rodriguez-Palacios A, Tang C, Yue H. 2013. Selection of reference
gene for quantitative real-time PCR analysis in chciken embryo fibroblasts infected with Avian Leukosis Virus subgroup J. BMC Research Notes 6; 402.
Yassin H, Velthuis AGJ, Boerjan M, van Riel J. 2009. Field study on broilers' first-week mortality. Poultry Science 88, 798-804.
Yin R, Liu X, Liu C, Ding Z, Zhang X, Tian F, Liu W, Yu J, Li L, de Angelis H, Stoeger T.
2011. Systemic selection of housekeeping genes for gene expression normalization in chicken embryo fibroblasts infected with Newcastle Disease Virus. Biochemical and Biophysical Research Communications 413; 537-540.
Yonash N, Bacon LD, Witter RL, Cheng HH. 1999. High resolution mapping and
identification of new quantitative trait loci (QTL) affecting susceptibility to Marek’s disease. Animal Genetics 30, 126–135
Yue H, Lei XW, Yang FL, Li MY, Tang C. 2010. Reference gene selection for normalization of PCR analysis in chicken embryo fibroblast infected with H5N1 AIV.
Virologica Sinica 25; 425-431.
Vallejo RL, Bacon LD, Liu HC, Witter RL, Groenen MA, Hillel J, Cheng HH. 1998. Genetic mapping of quantitative trait loci affecting susceptibility to MArek's disease virus induced tumors in F2 intercross chickens. Genetics 148, 349-360.
Vyas JM, van der Veen AG, Ploegh HL. 2008. The known and unkowns of antigen
processing and presentation. Nature Reviews Immunology 8, 607-618.
Wallny HJ, Avila D, Hunt LG, Powell TJ, Riegert P, Salmonsen J. 2006. Peptide motifs of the single dominantly expressed class I molecule explain the striking MHC-determined response to Rous sarcoma virus in chickens. Proceedings of the National Academy of Science 103, 1434-1439.
189
Wang X, Seed B. 2003. A PCR primer bank for quantitative gene expression analysis. Nucleic Acid Research 31, e154.
Wang Z, Gerstein M, Snyder M. 2009. RNA-Seq: a revolutionary tool for transcriptomics. Nature Reviews Genetics 10, 57-63.
Wang X, Nahashon S, Feaster TK, Bohannon-Stewart A, Adefope N. 2010. An initial map of chromosomal segmental copy number variations in the chicken. BMC Genomics 11, 351.
Wang Y, Ghaffari N, Johnson CD, Braga-Neto UM, Wang H, Chen R, Zhou H. 2011.
Evaluation of the covereage and depth of transcriptome by RNA-seq in chickens. BMC Bioinformatics 12(Suppl 10):S5.
Wang X, Feng GC, Song C, Hu X, Li N. 2012a. A genome-wide survey of copy number variation regions in various chicken breeds by array comparative genomic
hybridization method. Animal Genetics 43, 282-289.
Wang Y, Liu C, Fang Y, Liu X, Li W, Liu S, Liu Y, Liu Y, Charreyre C, Audonnet J -C, Chen P, He Q. 2012b. Transcription analysis on response of porcine alveolar macrophages to Haemophilus parasuis. BMC Genomics 13, 68.
Wang Y, Lupiani B, Reddy SM, Lamont SJ, Zhou H 2014. RNA-seq analysis revealed
novel genes and signalling pathoway associated with disease resistance to avian influenza virus infection in chickens. Poultry Science 93, 485-493.
Weaver S, Dube S, Mir A, Qin J, Sun G, Ramakrishnan R, Jones RC, Livak KJ. 2010. Taking qPCR to a higher level: Analysis of CNV reveals the power of high throughput
qPCR to enhance quantitative resolution. Methods 50, 271-276.
Wells LL, Lowry VK, DeLoacht JR, Kogut MH. 1998. Age-dependent phagocytosis and bactericidal activities of the chicken heterophil. Developmental and Comparative Immunology 22, 103-109.
Whitelaw CBA, Sang H. 2005. Disease-resistant geneticall modified animals. Scientific and Technical Review of the Office International des Epizooties (Paris) 24, 275-283.
Wigley P, Hulme SD, Bumstead N, Barrow PA. 2002. In vivo and in vitro studies of genetic resistance to systemic salmonellosis in the chicken encoded by SAL1 locus. Microbes and Infection 4, 1111-1120.
Wigley P, Hulme S, Rothwell L, Bumstead N, Kaiser P, Barrow P. 2006. Macrophages isolated from chickens genetically resistant or susceptible to systemic salmonellosis show magnitudinal and temporal differential expression of cytokines
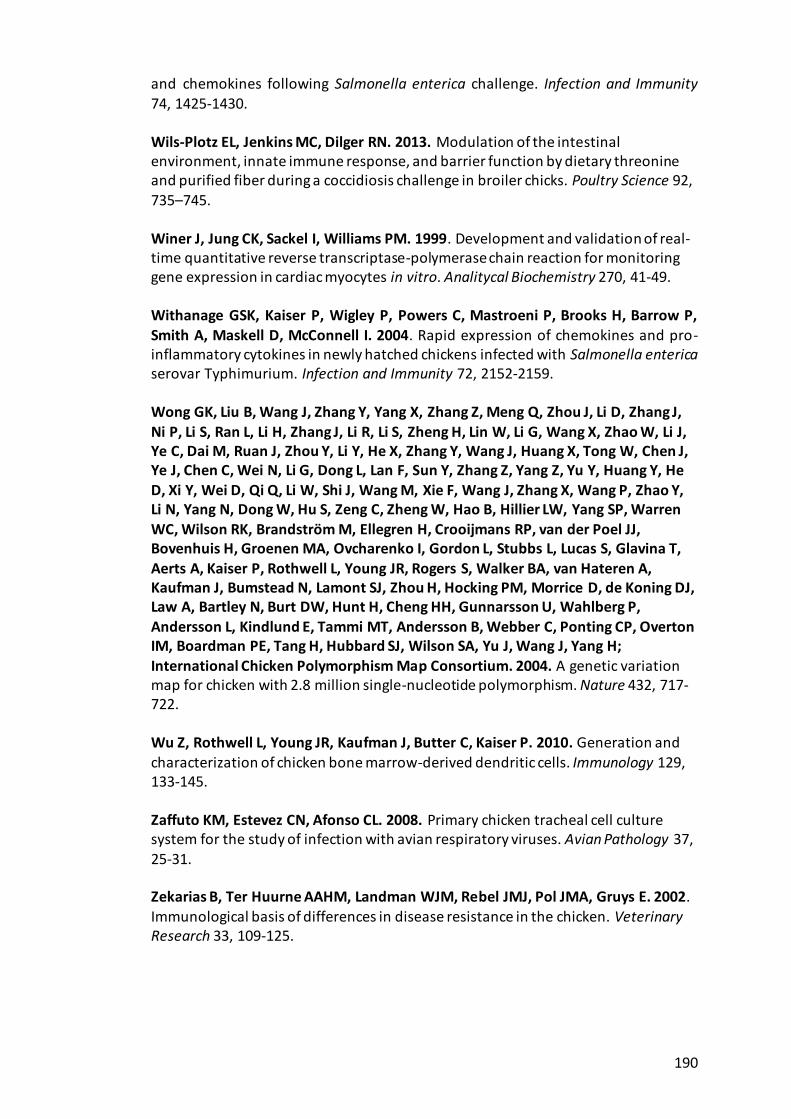
190
and chemokines following Salmonella enterica challenge. Infection and Immunity 74, 1425-1430.
Wils-Plotz EL, Jenkins MC, Dilger RN. 2013. Modulation of the intestinal environment, innate immune response, and barrier function by dietary threonine and purified fiber during a coccidiosis challenge in broiler chicks. Poultry Science 92,
735–745.
Winer J, Jung CK, Sackel I, Williams PM. 1999. Development and validation of real-time quantitative reverse transcriptase-polymerase chain reaction for monitoring gene expression in cardiac myocytes in vitro. Analitycal Biochemistry 270, 41-49.
Withanage GSK, Kaiser P, Wigley P, Powers C, Mastroeni P, Brooks H, Barrow P, Smith A, Maskell D, McConnell I. 2004. Rapid expression of chemokines and pro-inflammatory cytokines in newly hatched chickens infected with Salmonella enterica serovar Typhimurium. Infection and Immunity 72, 2152-2159.
Wong GK, Liu B, Wang J, Zhang Y, Yang X, Zhang Z, Meng Q, Zhou J, Li D, Zhang J,
Ni P, Li S, Ran L, Li H, Zhang J, Li R, Li S, Zheng H, Lin W, Li G, Wang X, Zhao W, Li J, Ye C, Dai M, Ruan J, Zhou Y, Li Y, He X, Zhang Y, Wang J, Huang X, Tong W, Chen J, Ye J, Chen C, Wei N, Li G, Dong L, Lan F, Sun Y, Zhang Z, Yang Z, Yu Y, Huang Y, He
D, Xi Y, Wei D, Qi Q, Li W, Shi J, Wang M, Xie F, Wang J, Zhang X, Wang P, Zhao Y, Li N, Yang N, Dong W, Hu S, Zeng C, Zheng W, Hao B, Hillier LW, Yang SP, Warren
WC, Wilson RK, Brandström M, Ellegren H, Crooijmans RP, van der Poel JJ, Bovenhuis H, Groenen MA, Ovcharenko I, Gordon L, Stubbs L, Lucas S, Glavina T,
Aerts A, Kaiser P, Rothwell L, Young JR, Rogers S, Walker BA, van Hateren A, Kaufman J, Bumstead N, Lamont SJ, Zhou H, Hocking PM, Morrice D, de Koning DJ, Law A, Bartley N, Burt DW, Hunt H, Cheng HH, Gunnarsson U, Wahlberg P,
Andersson L, Kindlund E, Tammi MT, Andersson B, Webber C, Ponting CP, Overton IM, Boardman PE, Tang H, Hubbard SJ, Wilson SA, Yu J, Wang J, Yang H;
International Chicken Polymorphism Map Consortium. 2004. A genetic variation map for chicken with 2.8 million single-nucleotide polymorphism. Nature 432, 717-722.
Wu Z, Rothwell L, Young JR, Kaufman J, Butter C, Kaiser P. 2010. Generation and
characterization of chicken bone marrow-derived dendritic cells. Immunology 129, 133-145.
Zaffuto KM, Estevez CN, Afonso CL. 2008. Primary chicken tracheal cell culture system for the study of infection with avian respiratory viruses. Avian Pathology 37,
25-31.
Zekarias B, Ter Huurne AAHM, Landman WJM, Rebel JMJ, Pol JMA, Gruys E. 2002. Immunological basis of differences in disease resistance in the chicken. Veterinary Research 33, 109-125.

191
Zhang GS, Darius S, Smith SR, Ritchie SJ. 2006. In vitro inhibitory effect of hen egg white lysozyme on Clostridium perfringens type A associated with broiler necrotic enteritis and its a-toxin production. Letters in Applied Microbiology 42, 138–143.
Zhang HM, Hunt HD, Kulkarni GB, Palmquist DE, BAcon LD. 2006. Lymphoid organ size varies among inbred lines 63 and 72 and their thirteen recombinant congenic
strains of chickens with the same major histocompatibility complex. Poultry Science 85, 844-853.
Zhong JF, Chen Y, Marcus JS, Scherer A, Quake SR, Taylor CR, Weiner LP. 2007. A microfluidic processor for gene expression profiling of single human embryonic
stem cells. Lab Chip 8, 68-74.
Zhou Z, Wang Z, Cao L, Hu S, Zhang Z, Qin B, Guo Z, Nie K. 2013. Upregulation of chicken TLR4, TLR15 and MyD88 in heterophils and monocyte-derived macrophages stimulated with Eimeria tenella in vitro. Experimental Parasitology 133, 427–433.
Zhu J, He F, Hu S, Yu J. 2008. On the nature of human housekeeping genes. Trends
in Genetics 24, 481-484.
Zhu J, Paul WE. 2008. CD4 T cells: fates, functions, and faults. Blood 112, 1557-
1569.
Zou W, Restifo NP. 2010. Th17 cells in tomour immunity and immunotherapy. Nature Reviews Immunology 10, 248–256.
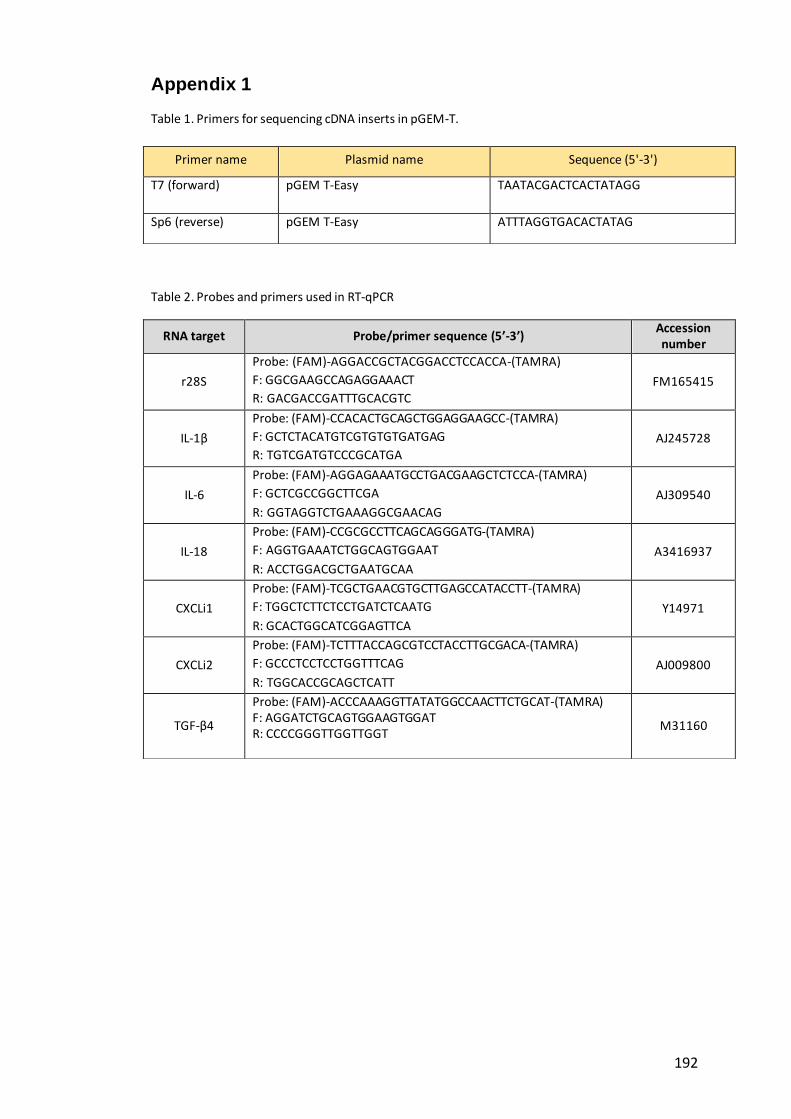
192
Appendix 1
Table 1. Primers for sequencing cDNA inserts in pGEM-T.
Table 2. Probes and primers used in RT-qPCR
Primer name Plasmid name Sequence (5'-3')
T7 (forward) pGEM T-Easy TAATACGACTCACTATAGG
Sp6 (reverse) pGEM T-Easy ATTTAGGTGACACTATAG
RNA target Probe/primer sequence (5’-3’) Accession number
r28S
Probe: (FAM)-AGGACCGCTACGGACCTCCACCA-(TAMRA)
F: GGCGAAGCCAGAGGAAACT
R: GACGACCGATTTGCACGTC FM165415
IL-1β
Probe: (FAM)-CCACACTGCAGCTGGAGGAAGCC-(TAMRA)
F: GCTCTACATGTCGTGTGTGATGAG
R: TGTCGATGTCCCGCATGA AJ245728
IL-6
Probe: (FAM)-AGGAGAAATGCCTGACGAAGCTCTCCA-(TAMRA)
F: GCTCGCCGGCTTCGA
R: GGTAGGTCTGAAAGGCGAACAG
AJ309540
IL-18
Probe: (FAM)-CCGCGCCTTCAGCAGGGATG-(TAMRA)
F: AGGTGAAATCTGGCAGTGGAAT
R: ACCTGGACGCTGAATGCAA
A3416937
CXCLi1
Probe: (FAM)-TCGCTGAACGTGCTTGAGCCATACCTT-(TAMRA)
F: TGGCTCTTCTCCTGATCTCAATG
R: GCACTGGCATCGGAGTTCA
Y14971
CXCLi2
Probe: (FAM)-TCTTTACCAGCGTCCTACCTTGCGACA-(TAMRA)
F: GCCCTCCTCCTGGTTTCAG
R: TGGCACCGCAGCTCATT
AJ009800
TGF-β4
Probe: (FAM)-ACCCAAAGGTTATATGGCCAACTTCTGCAT-(TAMRA) F: AGGATCTGCAGTGGAAGTGGAT R: CCCCGGGTTGGTTGGT
M31160
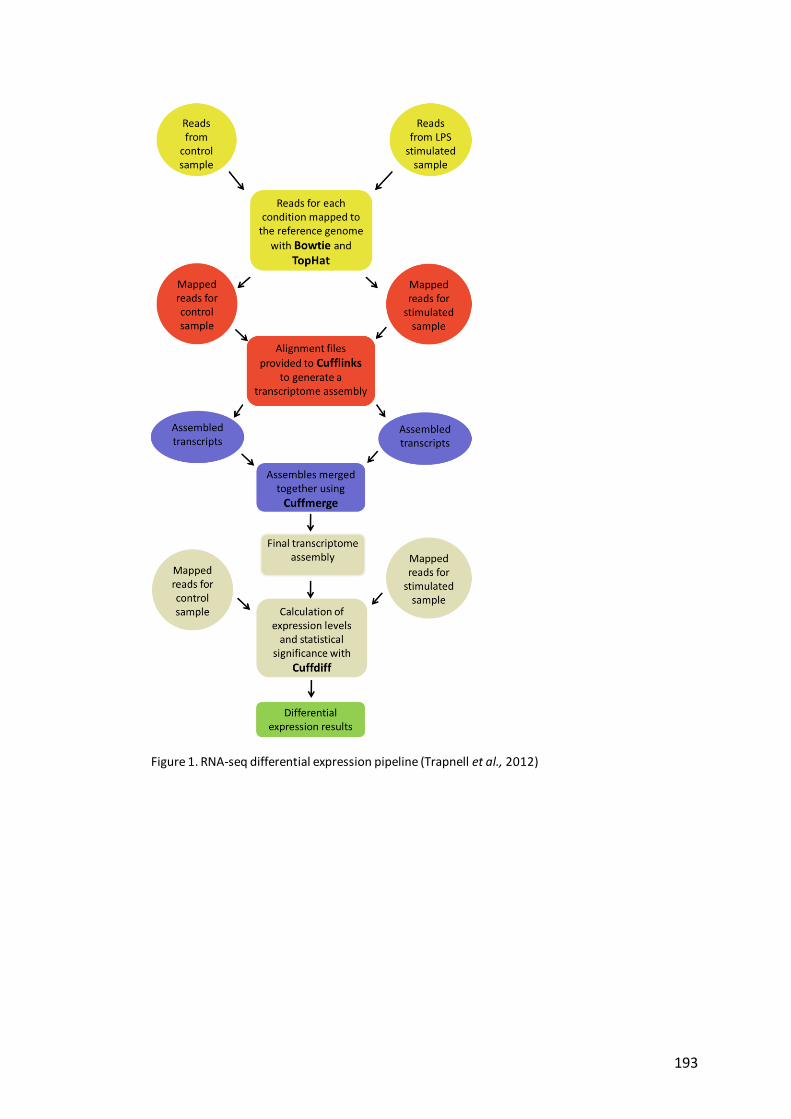
193
Figure 1. RNA-seq differential expression pipeline (Trapnell et al., 2012)

194
Table 3. Primers designed to clone genes of interest
Gene Forward Tm [°C] Reverse Tm [°C] length (bp)
ABCG2 ATGGGAACTGCTCAAAACAACAG 56.1 TTATGTGAACTTCCTCATAAACCGGAG 56.6 2106
ATF3 GAGGAACTTAGATTCGCCATC 53 TTAACCTTGTAATGTTCCTTCTTTGATC 53.8 419
BATF3 GAGCCACGAAGAAGACGATAAGAAGG 58.8 TCATCTGGGCAGGCAGC 58.2 292
BCL2A1 ATGGAAACTGCTGAGTTCTATTACG 54.9 TCAGTGGTACTCTCTGAACAAG 53.9 524
C3ORF52 ATGAGCTGGCTCCGTGC 58.4 CATGTTGATGTGAGAGAAACTGGGTC 57.6 700
CD40 ATGGGGCGGCTCGGGC 65 TCACAGCTGCTCCTGCTCGGC 64.5 831
CD72 ATGGCCCAGAGCGTGCTCTAC 61.8 TCACCCTTCGGCCAGCAGA 61.6 972
CD80 ATGAAGATGGGGTGCCTGAAGAG 58 TCATAGAGATGACATTTCACATGTCAATTTACAGC 58 950
CD83 ATGGCTTCAGCAGCCTAC 53 TTAGATAGAACTTGAAGTAAGTCCAC 52 648
CXORF21 ATGCTGTCAGAAGGTTACCTTTACAG 56.7 CTATGCATTAGTGTTGCTATACTGAGAAATATG 57 870
DTX2 ATGGCAGCAGCTCAGGGAGCAG 64.2 CTGTTCCAGGCCACCTTCAGGAGCTC 64.7 1475
EAF2 ATGAACGGGATGGCCCCG 60.8 TCAGTCATCACTATCGCTTCCAGATTCAC 59.6 795
EDN1 ATGGATTGCAGCCGCCTG 58.9 CTAGAATGTTTTCAGGCTTTTCCAGATGC 58.2 618
EGR1 ATGGCTGCGGCCAAG 56.5 TTAGCAAATCTCAATTGTCCTTGGAGA 56.5 1532
ENSGALG00000002955 ATGAAGATGTTCAGGTGGAGGTG 56.8 CAAGTCTATCCTTTCCCTGGAGATC 56.4 1167
ENSGALG00000005747 ATGACTCGCTGCCAGGTG 57.8 TCATTCATTCTGGCAGCTTTTATAGTCC 57 1056

195
Gene Forward Tm [°C] Reverse Tm [°C] length (bp)
ENSGALG00000011172 ATGCACCAGAGCAGCATCAATGG 60.2 GGTCCAGGCACTCCGC 59.3 1315
ENSGALG00000015395 ATGCTTCTGCTTCAGGCCTGC 60.6 TCAGTGTTCCTCTGGACTTGTAGAGACAG 60.5 1056
ENSGALG00000022324 ATGAGGATGCCGCTTCC 55.1 TTAAACATTCACTGTGCTTTCTTGTGG 56.4 1008
ENSGALG00000025905 ATGAAGATGGAGACAGGGGAT 55.3 TTAAATTTGTGATATCATTCTCAGTGCAGG 55.9 933
ENSGALG00000027419 ATGATGGTTACTTGCCTGCTCCTCTC 60.3 TCACGTGTTGGGCACTGCAG 60.7 918
ETS2 ATGAGTGAATTTGCGATCAGAAACATG 56.3 TCAGTCCTCGGTGTCAGG 56.2 1440
G0S2 ATGGAAACCATGCACGAGCTG 58.3 TTAGGATGCATGCTGCCTGG 57.8 299
GCH1 TACGCACGGCGGGAGGG 63.5 TCAGCTCCTGATGAGCGTCAAGAACTCTTC 62.6 711
GLUL ATGGCCACCTCGGC 55.5 TTAGTTCTTGTACTCAAAAGGCTCGTC 56.8 1122
HPS5 ATGAGGCTCTGTATCTGCTTCGTG 58.6 TCAGTATTTGTTAGGAAGTCCTGCGG 58.4 384
IFIT5 ATGAGTACCATTTCCAAGAATTCC 53 TCAGCTTGAGAGGGAAAGTCG 52 1440
IL10RA ATGGCCCTCTGCGCTGC 61.9 CTTCTGGCACAGGAACAGCTGCT 61.8 900
IL17REL ATGATAAGTGTTCATGTTCTGATTCTTC 53.7 GTGGAACTGAATAATCTACATCTGTC 53.3 1266
IL1R2 ATTTCAAGACACTTTCCCTCGCTCTTC 58.9 CCTGCCAGGATGACACAGG 58.1 1149
IL4I1 ATGGCTGCGATGGTTCTCTTCC 59.7 TCAGAGCTCTCCCTTCTCCACG 60.1 1572
IRAK2 GTGTGGTCTTAGCAGAGATA 51 TTATCTACATTTACCTTGGGATG 50 803
IRF1 ATGCCCGTCTCAAGGATGCG 65 TTACAAGCTGCAGGAGATGGC 60 942

196
Gene Forward Tm [°C] Reverse Tm [°C] length (bp)
IRF10 ATGGCGGAGCCGGGGTC 63 GCCAGCAGTCTGAGTGATTGACATCCTCA 63 620
JUN (AP1) ATGGAGCCTACTTTCTACGAGGATG 58 TCAAAACGTTTGCAACTGTTGTGTTAG 58 932
LYG2 GAACATAGCAAATGTTGAAACAACTGG 55.5 TCAGTATCCATTTCTCTGAAAGAACTTG 55 541
LYZ ATGGGTCTTTGCTAATCTTGGTGCTTTGC 62 TCACAGCCGGCAGCCTCTG 63 444
MADPRT ATGGAGCACGCCATTCTGG 58.1 CACGGAAGACATTGTGGCATCG 58.2 481
MAFA ATGGCCTCGGAGTTGGCC 60.7 TCACATGAAGAAGTCAGCGGCAGTAG 60.4 861
MAFF ATGGCTGCGGATGGGCTG 61.4 CTAGGAGTAGGCGGCCTGGTTG 61.5 450
MYD88 ATGGCTACGGTACCCGTGGGTG 64 TCACCAAGTGCTGGATGCTATTGCTCGC 64 1131
NDNF ATGCAGAAGCTGCCTACC 55.1 CTAACAGAACTTCCTCGTTTTCACC 55.7 1651
NFKB2 ATGGTGGAGCAGAAGGAGCC 59.6 GCTTGTCGCTGACGTCCC 59.1 2646
NFKBIZ ATGGGGGGAGGAAAGCAGCACA 58 TCAAAACAGCGACGCTCTCTGC 65 1192
NLRC5 CTGGCAGAACTAGATCTCTCCAGGAATCAG 60.8 TCACTCAATCTTCCGGAGGTGCTC 60.5 1263
NOS2 ATGCTGTGCCCATGGCAG 59 TTATATTCTTTTGACTTCATGTGGGAACACAG 57 3411
NR4A3 ATGCCCTGTGTGCAAGCGCAG 63.6 TCAGAAGGGCAAGGTGTCCAGAAACAGC 64 1829
PFKFB3 GCCAATTCCCCCACTGTGATAG 57.9 CGGCAGCCATAAGCCACTG 59.2 1189
PKD2L1 ATGGAGGGGAAGTGCTGCTTCTAC 60.7 GCTGCAGCTCATCCTTCTGGC 61 1558
PLA2G5 ATGAATGCTCTCCTTGCATTGGC 58.3 TCACCTGCACTTGCACCTG 58.2 417

197
Gene Forward Tm [°C] Reverse Tm [°C] length (bp)
PLK3 ATGACGGACCTCTCCAGCAACAAAAC 61.1 CTAGGCATCAGCCCACTCCTGG 61.6 1734
PPARG ATGGTTGACACAGAAATGC 51 CGCCATTAATATAAGTCTTTATAGATTTC 51 1433
PTGS2 ATGACAACAGGATTTGATCGGTATG 55.2 CCTGGATACAGTTCCATAGCATCTAT 55.8 1379
RASD1 ATGAAACTGGCAGCGATGATCAAGAAG 59.4 CTAGCTGATCACACAGCGGTCC 59.7 836
SAAL1 ATGGATCGCAACCCCTCGC 60.6 TTAGGTAGGGACCTTCAGGCTCGG 61.7 1407
SDC4 ATGCCGCTGCCCCGC 63.6 CCAAGGTCGTAGCTGCCCTCGTC 63.6 545
SELE ATGGTGAATTGTTGGACATACC 53.2 TTAGACATTCTGGCATTCAGTAGT 53.8 1562
SERPINE2 ATGAACTGGCACTTCTCGC 55.5 TCAAGGTTTGTTTATTTGTCCCATAAAC 54.6 1329
SLCO6A1 ATGAAGGGCAACGACGGTAT 56.6 TTACGCATGTATAGCAGATACCATTTCTG 56.7 2037
SNX10 ATGACACCAAAACACGAA 49.5 TCACGATTCTTCAGAAGC 49.4 606
SOCS1 ATGGTAGCGCACAGCAAGGTGTCAGC 61 TTAGATCTGAAACGGGAAGGATT 59 624
SOCS3 ATGGTCACCCACAGCAAGTTCC 63 TTAGAGGGGGGCATCGTACTG 61 626
STEAP1 ATGGAGAAGAGAGAAGGTGATAGTC 55.3 GAACTCTCTCCAGGTCAAAGAG 54.5 759
STEAP4 ATGAATAAAAATTCTTCCAACATAATGGC 53.4 TTACACAGCAGACTTGTTGATAAC 53.3 1418
TGM4 ATGAGCCAAGACAGCGACCTGAAAG 61.1 CTAGTGGGTGACCGTGATGGCC 61.9 2129
TIRAP ATGGCCGGATGGTTTAGGCGG 62 CTACTGCATTCCACTCGTGGAGCTCC 62.5 666
TNFAIP3 ATGGCTGGCCAACACATCCT 59.7 CTAGCCGTAGATCTGGGGGAACTG 60.4 2421
198
Gene Forward Tm [°C] Reverse Tm [°C] length (bp)
TNIP2 ATGCACCTGGCCGG 55.8 TCATACAGTGAGGACATCTAAGTTCAC 55.9 1506
TOLLIP ATGGCGACCACCGTCAGTAC 59 CTATGATTCTTCAGTCATCTGAAGCAAGGAG 58 824
TRAF3IP2 ATGGCTTCTGTGTCAGGCACTTTTGTG 61.5 TCATAACGGCACAACCTGGAGTGTTG 61 1598
UPP1 ATGGCTCCTGGTGTCT 52.8 TTATACTTTCCCAAGACTTTTCTTAATG 51.9 942
WDR24 ATGGATGAGAACCTGCTGGCC 59.8 TCAGGTGTACTCGCAGAGGTGG 60.6 2118

199
Table 4. Gene symbols and transcripts accession numbers for the final 89 genes.
Gene symbol Database number
1 ABCG2 ENSGALT00000009304
2 ATF3 XM_004935334.1(X1) XM_419429.4 (X2)
3 BATF3 XM_004935335.1; XM_419428.4
4 BCL2A1 ENSGALG00000006511
5 C3ORF52 XM_004938298.1 (x4); XM_416636.4 (x3); XM_004938299.1 (x5)
6 CCL19 XM_424980.4
7 CCL20 NM_204438.2
8 CCL4 (CCLi3) NM_204720
9 CCL5 (CCLi4; ah294) NM_001045832.1
10 CD40 ENSGALT00000039105 NM_204665.2
11 CD72 ENSGALT00000003752
12 CD80 NM_001079739
13 CD83 XM_418929.3
14 CSF1 NM_001193295.1
15 CXCL13L2
XM_420474.4 (X3); XM_004941025.1 (X5); XM_004941024.1 (X4); ENSGALT00000016832
16 CXCLi1 ENSGALT00000019072; NM_205018
17 CXORF21 ENSGALG00000016286
18 DTX2 XM_415763.4
19 EAF2 NM_001006525.1
20 EDN1 XM_418943.4
21 EGR1 ENSGALG00000007669
22 ENSGALG00000002955 ENSGALT00000004669
23 ENSGALG00000005747 ENSGALT00000009229
24 ENSGALG00000011172 ENSGALT00000018214
25 ENSGALG00000015395 ENSGALT00000030421
26 ENSGALG00000022324 ENSGALT00000035899
27 ENSGALG00000025905 ENSGALT00000042716
28 ENSGALG00000027419 ENSGALT00000046220
29 ETS2 NM_205312.1
30 G0S2 ENSGALG00000023933 NM_001190924.3
31 GCH1 NM_205223.1
32 GLUL NM_205493.1
33 HPS5 XM_004941433.1 (X4); XM_421011.4 (X3); ENSGALT00000010127
34 IFIT5 XM_421662.3
35 IL10RA NM_001039597.1
36 IL12B NM_213571.1
37 IL13RA2 ENSGALT00000032399
38 IL17REL XM_001232492.3 (X1); XM_004937501.1 (X2)
39 IL18 ENSGALG00000007874
40 IL1B ENSGALG00000000534

200
Gene symbol Database number
41 IL1R2 XM_416914.4
42 IL4I1 ENSGALG00000000081
43 IL6 ENSGALG00000010915
44 IL8 (IL8L2; CXCLi2) ENSGALG00000026098
45 IRAK2 NM_001030605.1
46 IRF1 NM_205415.1
47 IRF10 NM_204558.1
48 IRF7 ENSGALG00000014297
49 IRG1 ENSGALG00000016919
50 JUN (AP1) NM_001031289.1
51 LYG2 ENSGALT00000027062; XM_416896.4
52 LYZ NM_205281.1
53 MADPRT NM_001033646.1
54 MAFA NM_205025.1
55 MAFF ENSGALT00000020063
56 MYD88 NM_001030962.1
57
NDNF
ENSGALT00000019508; XM_004941227.1; XM_004941228.1;
XM_004941225.1; XM_420627.4; XM_004941226.1
58 NFKB2 ENSGALT00000009068
59 NFKBIZ NM_001006254
60 NLRC5 XM_003641889
61 NOS2 NM_204961.1
62 NR4A3 XM_419081.4
63 PFKFB3
XM_004937473.1 (x11); XM_416472.4 (x7); XM_004937470.1 (x8); XM_004937472.1 (x10); XM_004937471.1 (x9)
64 PKD2L1 ENSGALT00000009261
65 PLK3 ENSGALG00000010129
66 PPARG NM_001001460.1
67 PTGS2 NM_001167718.1; ENSGALT00000008125; ENSGALT00000044290
68 RASD1 ENSGALG00000004860; NM_001044636.1
69 SAAL1 ENSGALT00000045705
70 SDC4 NM_001007869.1
71 SELE NCBI XM_422246.4
72 SERPINE2 NM_001083920.1
73 SLCO6A1 ENSGALT00000044226
74 SNX10 NM_001030986.1
75 SOCS1 NM_001137648.1
76 SOCS3 NM_204600.1
77 STEAP1 XM_418642.3 (X4); XM_004939274.1 (X6); XM_004939273.1 (X5
78 STEAP4 ENSGALG00000008997; XM_001235256.3
79 TGM4 ENSGALG00000011888
80 TIMD4 NM_001006149.1
81 TIRAP NM_001024829.1

201
Gene symbol Database number
82 TLR15 NM_001037835.1
83 TLR4 NM_001030693.1
84 TNFAIP3 XM_003640919.2
85 TNIP2 NM_001031166.1
86 TOLLIP NM_001006471.1
87 TRAF3IP2 XM_419782.2
88 UPP1 ENSGALT00000031003
89 WDR24 ENSGALT00000003862; NM_001030628.1

202
Table 5. Primers, alignment site and amplicon length for qPCR detection of transcripts of genes of interest using the 96.96 Dynamic Array in BioMark System
(Fluidigm).
Gene Forward Reverse exon-intron
amplicon
length (bp)
ABCG2 GGAGTAAGGTGCTCTGGTGAAGA TCTCCCACATTGCCATGTTAGT fwd 13-14 ex 73
ATF3 CATGAAAACGGAGTTTTCTCCTG GTCTCCAGCTTTTCTGATTCTTTCTG fwd 1-2 ex 141
BATF3 GGACAAACTTCACGAGGAATATGAAT CCTTGGTATGGTCACAAAGTTCAT fwd 1-2 ex 169
BCL2A1 ACCATATTTACTTTTGGAGGTCTTCTCA ACCGTTTTCCCAGCCACC fwd 1-2 ex 159
C3ORF52 GCAACGAGCAAGGAGAGAGATC AGAGCTAGACTGATGAGAATGACCAG fwd 1-2 ex 128
CCL19 TGAGATGTGTCCTGCATGTGTATG GCCATGGGATGGGCTTCT not ex-in 80
CCL20 AGCTGTCTGGTGAAGTCTGTGATATT AGGATTTACGCAGGCTTTCAGT rev 1-2 ex 77
CCL4 (CCLi3) CTCTGCCCCAGTGGGACC GACTTCGCGCTCCTTCTTTGT fwd 1-2 ex 151
CCL5 (CCLi4; ah294) CTCCGTTTGGGGCTGATACA TGCTGCCTGTGGGCATTT rev 2-3 ex 113
CD40 AAAACTGAGCCATGCCACTTCT CCGGCTTGACTCACAGATCAC fwd 1-2 ex 102
CD72 GCATGTCTGTCTGAACGGAGACT AAGATGCACTTGCCATGGTAGA fwd 4-5 ex 66
CD80 CCCTCTTTGTTACCGCTGACTT CACACGTTCGTCGTTGAGGA fwd 1-2 ex 152
CD83 ACCTGAGTGGCATCATCACATTAA CACGTACAGGTAAAGAAGATGAGCAG rev 3-4 ex 142
CSF1 TCGTCTGCAGCATCCATGAG GTGCCGCTCGGTGATGAT not ex-in 65
CXCL13L2 CCAACGGCAACCTGAACTG CATATTTCCGCAAGGGAATGA not ex-in 66
CXCLI1 AAGAGATCATCCTCACCCTGAAGA GCTTCTTTTTTGCTGACATCCG fwd 2-3 ex 115
CXORF21 CGCAGATATCACGAGAGAGGAA TGCAAGAAGCGGCTGATG one exon gene 70
DTX2 AATGGAGTCAGTGCTCTAAACCTCC CCTCATCCACAGGAGTACCCTTC fwd 2-3 ex 138
EAF2 AGGAGACCTTGAAGTTGGCA GTGGAGTCGAGCCCTCAATA not ex-in 71

203
Gene Forward Reverse exon-intron
amplicon
length (bp)
EDN1 CGTGTATTTCTGCCACCTGGAT AGGGCCTCCAAGACCATAGG not ex-in 76
EGR1 CCTTGCGGCAGACACTTTTC CTACCATTTGGGGCTGGCT fwd 1-2 ex 141
ENSGALG00000002955 GGAAACGCTCATCTGGGCTAT TTTTTTCCGTTCCACTATCTGGAT fwd 6-7 ex 81
ENSGALG00000005747 TGGATCCGGAGCCTCAAC GGTCTGCGCAGCTCCAAA one exon gene 65
ENSGALG00000011172 GGGAGACCTGCACGAAGCT GCCAATGTTGGTGTAGATGTTACC rev 1-2 ex 79
ENSGALG00000015395 GGAGACAACTGCAGAAACACAGAG GAAGATCCTGGTGTCTGCCTCT fwd 4-5 ex 148
ENSGALG00000022324 TCTCCCCACCGATGCTAGTG GGCTAAACCAGAGAGAATGAGGAT one exon gene 77
ENSGALG00000025905 TGACACTGCTTGTTCATCATTTCTT GCCTCACAGTCTCCTGATTTAATTG rev 4-5 ex 75
ENSGALG00000027419 GCATCAGGCTCTGTGCAGG GTTGTCTTCAGCCCCATCCAT fwd 1-2 ex 144
ETS2 GGAATGCTCAAGCGGCAA TTCACAGTTGTTGGACTCGTAAGAAG fwd 1-2 ex 150
G0S2 GAAGGGAATATAGAGGAGGAGAAGAGA CTCCCGCTTCCGAGGAA one exon gene 69
GCH1 GACTACAAGTCCAGGAACGCCT TACCCCACGCATTACCATACAC not ex-in 122
GLUL GCCAGTCTGCAGACACAAATCT GCCAGCCAAACGGATGAC fwd 2-3 ex 132
HPS5 TCTGTATCTGCTTCGTGTTGCTCT GCGCCTCCAGCTGCAT fwd 1-2 ex 100
IFIT5 ATGAGTACCATTTCCAAGAATTCCTT CAATCTGATCCTCTATTGATTCTTCCA fwd 1-2 ex 127
IL10RA CACAAAATCTATGGCACCAACAG GTGCCCGTGGATCTTCATG fwd 1-2 ex 66
IL12B TGGGCAAATGATACGGTCAA CAGAGTAGTTCTTTGCCTCACATTTT not ex-in 83
IL13RA2 CTGCAAGGGAAACTGGAATCC CGTGTGCTCCAGACCCTCATA fwd 2-3 ex 150
IL17REL CTTTGCATTGAGGGTTGGCT TTCCCAAGCTAGGGTTTGTGTC fwd 7-8 ex 129
IL18 GTGAAATCTGGCAGTGGAATGTACT CATGCTCTTTCTCACAACACATGTAG fwd 2-3 ex 133
IL1B CAGCAGCCTCAGCGAAGAG CTGTGGTGTGCTCAGAATCCA fwd 1-2 ex 86
IL1R2 CCAAGAATCTGGGCAAAAGG CTGGTACAGATATACACTCCTGAGTCTTC rev 6-7 ex 69

204
Gene Forward Reverse exon-intron
amplicon
length (bp)
IL4I1 GCCCTGCAGTCGGCTGT CGAGTCCTCGTTCAGCAAATCT fwd 3-4 ex 155
IL6 GCTTCGACGAGGAGAAATGC TGAATTCCAGGTAGGTCTGAAAGG fwd 2-3 ex 72
IL8 (IL8L2; CXCLi2) CTGTCGCAAGGTAGGACGCT GCTATGATTTCAACATTCTTGCAGTG fwd 1-2 ex 149
IRAK2 TGGAAGAGGTTGCCATTGATT TGTTTCCATAATTTCCAGTACCTCTGT rev 2-3 ex 95
IRF1 GATCTGGATCAACAAGGATAAGATGATAT ACTTTATATCTTCCTGTATGGATGGCC fwd 1-2 ex 129
IRF10 GGGATGCAGAGAAGGATGAGAA GCTCTCCTCGGCCACATG fwd 2-3 ex 83
IRF7 GCCTGAAGAAGTGCAAGGTCTT TGCAAAACACCCTGAAGTCG not ex-in 123
IRG1 AGTGGCTGTGCACTCAATGG CACATTGAAAGCTAAGAGCAGGTC fwd 2-3 ex 151
JUN (AP1) CGAGCCCCCGGTGTATG TTGTAGTTGGGTGCAGAGTTGAG one exon gene 69
LYG2 GTTTAATGCAGGTTGACAAACGG TGCTGTTCCTTACTCCATGTTGG fwd 2-3 ex 142
LYZ TACAGCCTGGGAAACTGGGT TTCCTGGAGCCTGGGGTC fwd 1-2 ex 155
MADPRT ATAAAGGAGGTGGCGATGGA GTGGATGCAGCCCTGGTACT one exon gene 66
MAFA GCAGAACAGGAGGACCTTGAAG TCTGCTGGACCCGCTTGTAG one exon gene 68
MAFF AGCAGAAGATGGAGCTGGAATG CTGCAGGGCCTCGTACTTG fwd 1-2 ex 150
MYD88 GGCAGCGTGGAGGAGGA TCCATGCCCATACGGATCAT fwd 1-2 ex 150
NDNF CACCCTGTGATGCTCCCCT GTTCTCCTGAACCTTCTCCACTG rev 2-3 ex 81
NFKB2 TGAGGTGCGGTTCTATGAGGAT GGACGGTCAATTTTGGGCTT not ex-in 132
NFKBIZ GGAGCTCATCCGTCTCTTCTTG GTTGCCATTGTAAGCCTTTGC rev 9-10 ex 74
NLRC5 AGAGCCCTGGGTATGTAAGTTGAG TTGCATATCATGATCGCAGTGA rev 6-7 ex 90
NOS2 CAGCGGAAGGAGACAAACAGAG AACTCTTCCAGGACCTCCAGG not ex-in 109
NR4A3 CCAGCTTCAGCACCTTCATG GAGGCGGATTGCATTTGG not ex-in 82
PFKFB3 AACAAAAGTTTTCAATGTAGGGGAGT CATCCCTCAGGGCAGCC fwd 1-2 ex 134
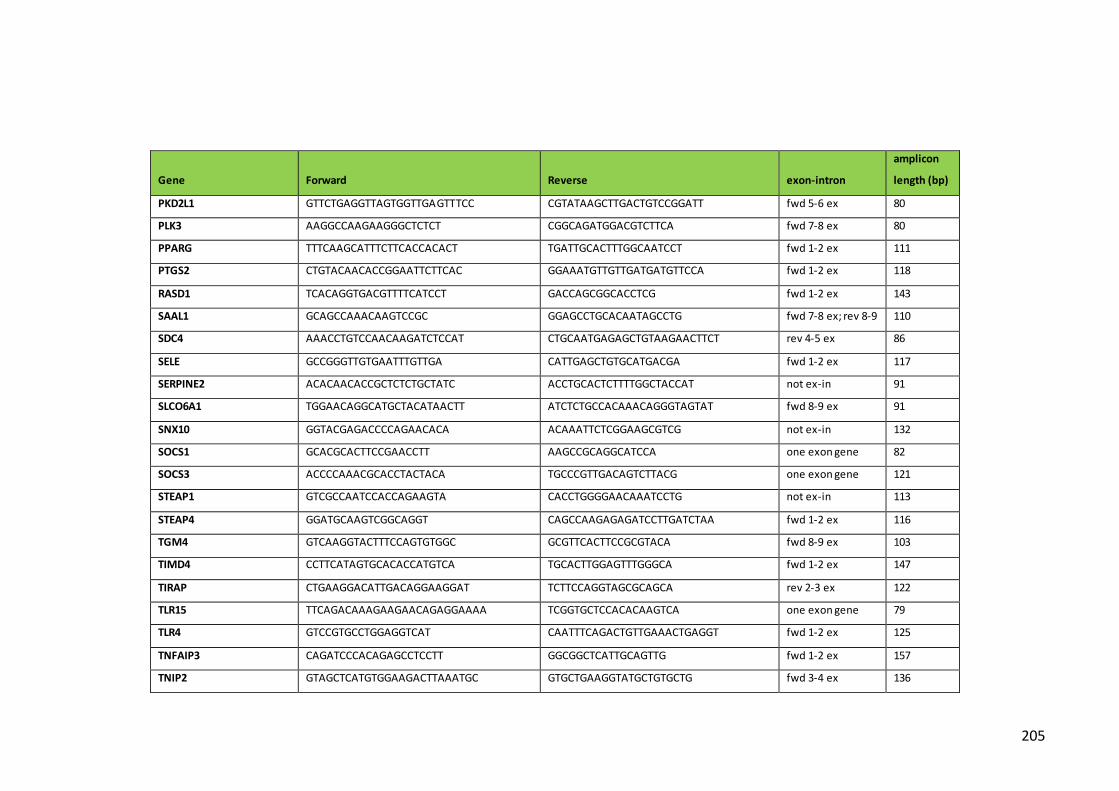
205
Gene Forward Reverse exon-intron
amplicon
length (bp)
PKD2L1 GTTCTGAGGTTAGTGGTTGAGTTTCC CGTATAAGCTTGACTGTCCGGATT fwd 5-6 ex 80
PLK3 AAGGCCAAGAAGGGCTCTCT CGGCAGATGGACGTCTTCA fwd 7-8 ex 80
PPARG TTTCAAGCATTTCTTCACCACACT TGATTGCACTTTGGCAATCCT fwd 1-2 ex 111
PTGS2 CTGTACAACACCGGAATTCTTCAC GGAAATGTTGTTGATGATGTTCCA fwd 1-2 ex 118
RASD1 TCACAGGTGACGTTTTCATCCT GACCAGCGGCACCTCG fwd 1-2 ex 143
SAAL1 GCAGCCAAACAAGTCCGC GGAGCCTGCACAATAGCCTG fwd 7-8 ex; rev 8-9 110
SDC4 AAACCTGTCCAACAAGATCTCCAT CTGCAATGAGAGCTGTAAGAACTTCT rev 4-5 ex 86
SELE GCCGGGTTGTGAATTTGTTGA CATTGAGCTGTGCATGACGA fwd 1-2 ex 117
SERPINE2 ACACAACACCGCTCTCTGCTATC ACCTGCACTCTTTTGGCTACCAT not ex-in 91
SLCO6A1 TGGAACAGGCATGCTACATAACTT ATCTCTGCCACAAACAGGGTAGTAT fwd 8-9 ex 91
SNX10 GGTACGAGACCCCAGAACACA ACAAATTCTCGGAAGCGTCG not ex-in 132
SOCS1 GCACGCACTTCCGAACCTT AAGCCGCAGGCATCCA one exon gene 82
SOCS3 ACCCCAAACGCACCTACTACA TGCCCGTTGACAGTCTTACG one exon gene 121
STEAP1 GTCGCCAATCCACCAGAAGTA CACCTGGGGAACAAATCCTG not ex-in 113
STEAP4 GGATGCAAGTCGGCAGGT CAGCCAAGAGAGATCCTTGATCTAA fwd 1-2 ex 116
TGM4 GTCAAGGTACTTTCCAGTGTGGC GCGTTCACTTCCGCGTACA fwd 8-9 ex 103
TIMD4 CCTTCATAGTGCACACCATGTCA TGCACTTGGAGTTTGGGCA fwd 1-2 ex 147
TIRAP CTGAAGGACATTGACAGGAAGGAT TCTTCCAGGTAGCGCAGCA rev 2-3 ex 122
TLR15 TTCAGACAAAGAAGAACAGAGGAAAA TCGGTGCTCCACACAAGTCA one exon gene 79
TLR4 GTCCGTGCCTGGAGGTCAT CAATTTCAGACTGTTGAAACTGAGGT fwd 1-2 ex 125
TNFAIP3 CAGATCCCACAGAGCCTCCTT GGCGGCTCATTGCAGTTG fwd 1-2 ex 157
TNIP2 GTAGCTCATGTGGAAGACTTAAATGC GTGCTGAAGGTATGCTGTGCTG fwd 3-4 ex 136
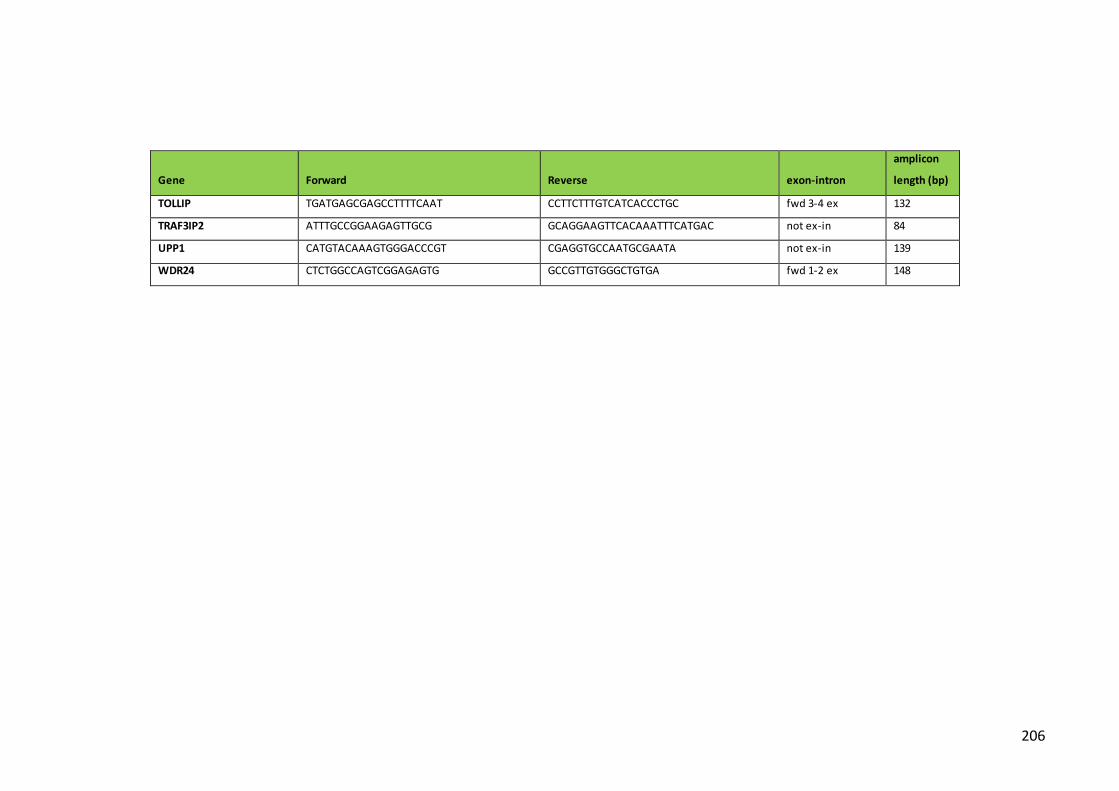
206
Gene Forward Reverse exon-intron
amplicon
length (bp)
TOLLIP TGATGAGCGAGCCTTTTCAAT CCTTCTTTGTCATCACCCTGC fwd 3-4 ex 132
TRAF3IP2 ATTTGCCGGAAGAGTTGCG GCAGGAAGTTCACAAATTTCATGAC not ex-in 84
UPP1 CATGTACAAAGTGGGACCCGT CGAGGTGCCAATGCGAATA not ex-in 139
WDR24 CTCTGGCCAGTCGGAGAGTG GCCGTTGTGGGCTGTGA fwd 1-2 ex 148
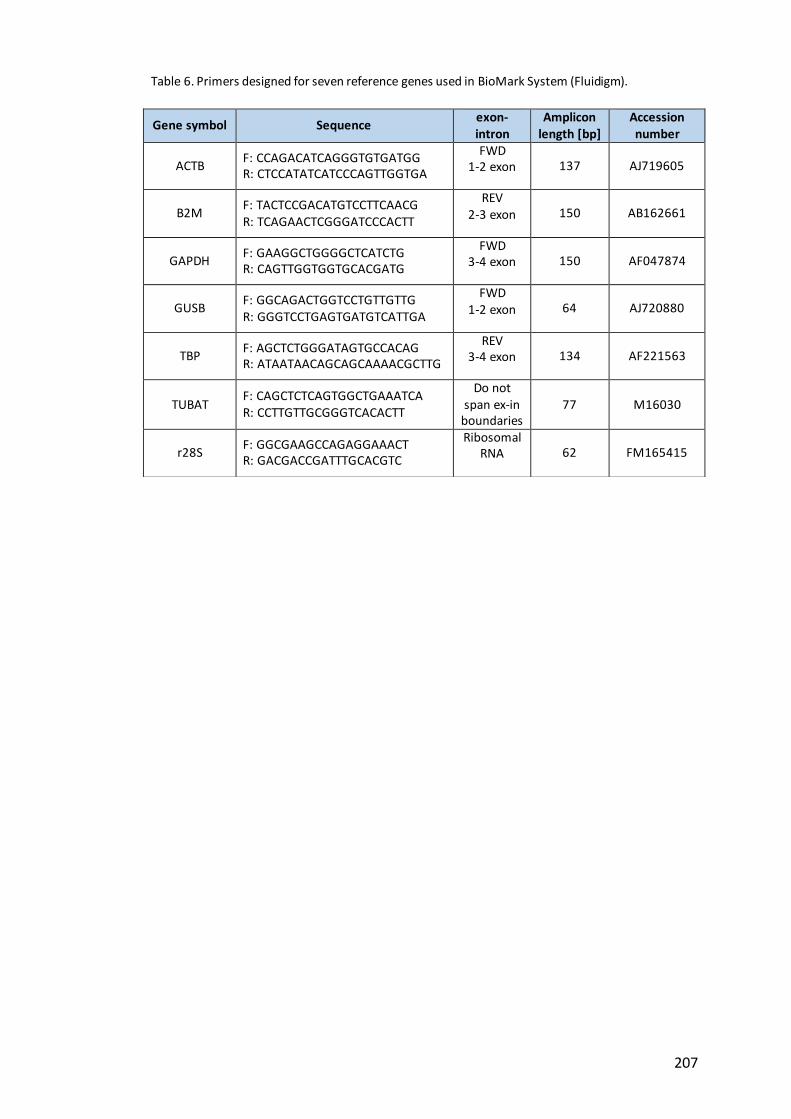
207
Table 6. Primers designed for seven reference genes used in BioMark System (Fluidigm).
Gene symbol Sequence exon-intron
Amplicon length [bp]
Accession number
ACTB F: CCAGACATCAGGGTGTGATGG R: CTCCATATCATCCCAGTTGGTGA
FWD 1-2 exon 137 AJ719605
B2M F: TACTCCGACATGTCCTTCAACG R: TCAGAACTCGGGATCCCACTT
REV 2-3 exon 150 AB162661
GAPDH F: GAAGGCTGGGGCTCATCTG R: CAGTTGGTGGTGCACGATG
FWD 3-4 exon 150 AF047874
GUSB F: GGCAGACTGGTCCTGTTGTTG R: GGGTCCTGAGTGATGTCATTGA
FWD 1-2 exon 64 AJ720880
TBP F: AGCTCTGGGATAGTGCCACAG R: ATAATAACAGCAGCAAAACGCTTG
REV 3-4 exon 134 AF221563
TUBAT F: CAGCTCTCAGTGGCTGAAATCA R: CCTTGTTGCGGGTCACACTT
Do not span ex-in
boundaries 77 M16030
r28S F: GGCGAAGCCAGAGGAAACT R: GACGACCGATTTGCACGTC
Ribosomal RNA 62 FM165415

208
Table 7. Slope and reaction efficiencies for reference genes tested in tissue samples from birds reared on the pedigree farm.
Mean quantification cycle (Cq) values
ACTB Bursa Spleen CT I leum Blood Dilution factor Cq Log10 (dilution factor) Slope Efficiency
Bird 1 19.9 16.2 18.3 19.6 23.6 1 19.5 0 -3.92 1.80
Bird 2 18.1 16.4 18.9 19.4 22.4 0.1 23.4 -1
Bird 3 17.4 16.6 18.1 18.8 21.7 0.01 26.5 -2
Bird 4 19.8 18.8 18.4 20.1 22.0 0.001 30.2 -3
Bird 5 19.3 17.0 18.4 19.9 22.1 0.0001 35.8 -4
B2M Bursa Spleen CT Ileum Blood Dilution factor Cq Log10 (dilution factor) Slope Efficiency
Bird 1 22.4 20.0 18.9 21.0 26.0 1 21.3 0 -3.58 1.90
Bird 2 20.8 19.4 21.0 21.4 24.8 0.1 24.9 -1
Bird 3 19.4 19.5 20.4 20.3 25.0 0.01 28.7 -2
Bird 4 20.7 21.5 20.6 22.2 24.8 0.001 32.3 -3
Bird 5 21.4 20.3 21.0 21.8 25.5 0.0001 35.5 -4
GAPDH Bursa Spleen CT Ileum Blood Dilution factor Cq Log10 (dilution factor) Slope Efficiency
Bird 1 24.0 21.0 22.6 22.4 28.1 1 23.5 0 -3.60 1.89
Bird 2 22.7 21.5 22.7 22.4 27.5 0.1 27.4 -1
Bird 3 22.5 21.8 22.4 21.8 26.9 0.01 30.8 -2
Bird 4 23.7 23.8 22.7 23.5 26.9 0.001 34.4 -3
Bird 5 23.8 21.9 23.1 23.0 27.4
GUSB Bursa Spleen CT Ileum Blood Dilution factor Cq Log10 (dilution factor) Slope Efficiency
Bird 1 23.0 26.2 27.7 28.3 31.9 1 27.2 0 -3.36 1.98
Bird 2 23.1 27.3 27.7 28.0 34.0 0.1 30.6 -1
Bird 3 24.0 27.1 27.0 28.2 32.7 0.01 34.0 -2
Bird 4 25.5 28.4 27.5 28.8 32.6 0.001
-3
Bird 5 22.9 27.7 28.1 28.5 35.5

209
TBP Bursa Spleen CT Ileum Blood Dilution factor Cq Log10 (dilution factor) Slope Efficiency
Bird 1 28.7 25.7 28.0 28.9 33.3 1 28.9 0 -3.83 1.82
Bird 2 27.3 26.3 28.2 29.0 32.6 0.1 32.8 -1
Bird 3 27.1 26.7 27.9 28.1 31.5
Bird 4 28.4 28.7 28.0 29.5 31.7
Bird 5 28.4 26.7 28.5 29.2 32.1
TUBAT Bursa Spleen CT Ileum Blood Dilution factor Cq Log10 (dilution factor) Slope Efficiency
Bird 1 24.7 28.6 33.0 34.2 36.5 1 28.5 0 -3.23 2.04
Bird 2 23.9 31.5 33.9 34.2 38.1 0.1 31.8 -1
Bird 3 25.2 31.3 33.7 33.8 35.3 0.01 35.0 -2
Bird 4 27.0 32.6 31.9 35.2 36.0
Bird 5 23.7 31.7 33.6 34.2 38.2
r28S Bursa Spleen CT Ileum Blood Dilution factor Cq Log10 (dilution factor) Slope Efficiency
Bird 1 11.9 9.8 10.8 10.5 16.6 1 11.7 0 -3.67 1.87
Bird 2 10.8 9.8 10.9 10.9 15.5 0.1 15.5 -1
Bird 3 10.7 10.0 10.8 10.4 14.6 0.01 18.9 -2
Bird 4 11.7 11.2 11.0 12.2 15.3 0.001 22.9 -3
Bird 5 11.8 10.3 11.1 10.7 14.5
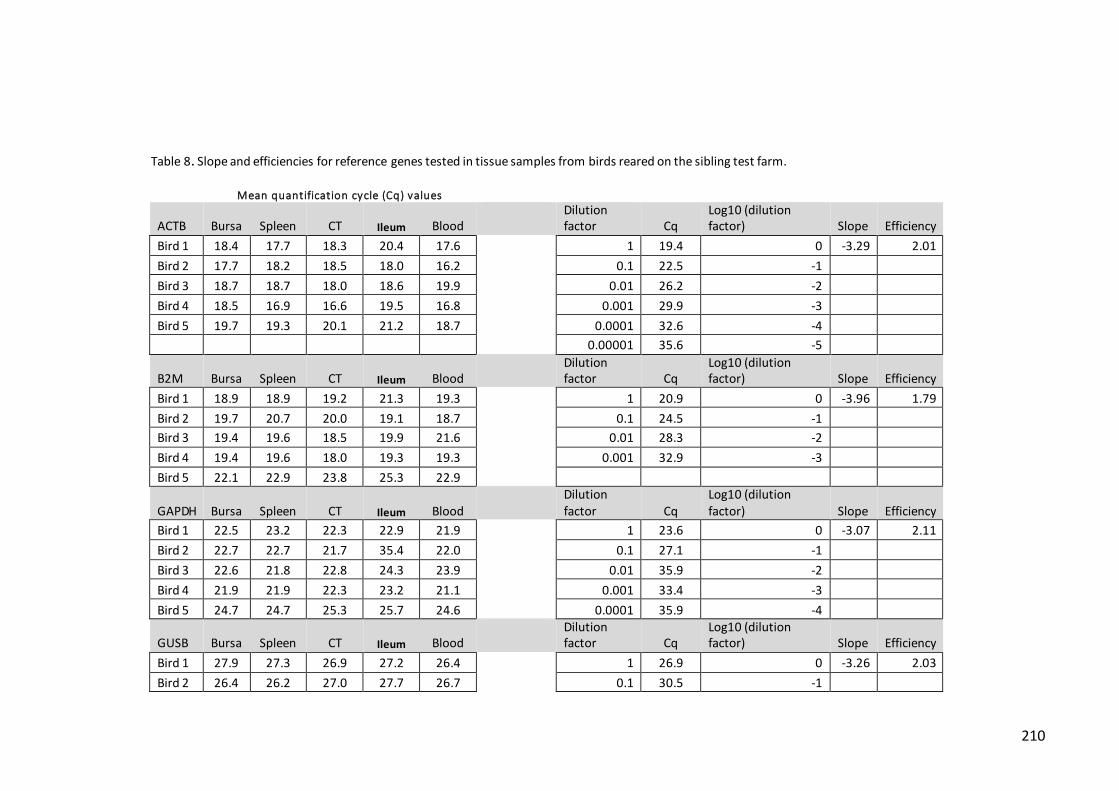
210
Table 8. Slope and efficiencies for reference genes tested in tissue samples from birds reared on the sibling test farm.
Mean quantification cycle (Cq) values
ACTB Bursa Spleen CT Ileum Blood Dilution
factor Cq Log10 (dilution factor) Slope Efficiency
Bird 1 18.4 17.7 18.3 20.4 17.6 1 19.4 0 -3.29 2.01
Bird 2 17.7 18.2 18.5 18.0 16.2 0.1 22.5 -1 Bird 3 18.7 18.7 18.0 18.6 19.9 0.01 26.2 -2 Bird 4 18.5 16.9 16.6 19.5 16.8 0.001 29.9 -3 Bird 5 19.7 19.3 20.1 21.2 18.7 0.0001 32.6 -4
0.00001 35.6 -5
B2M Bursa Spleen CT Ileum Blood Dilution
factor Cq Log10 (dilution factor) Slope Efficiency
Bird 1 18.9 18.9 19.2 21.3 19.3 1 20.9 0 -3.96 1.79
Bird 2 19.7 20.7 20.0 19.1 18.7 0.1 24.5 -1 Bird 3 19.4 19.6 18.5 19.9 21.6 0.01 28.3 -2 Bird 4 19.4 19.6 18.0 19.3 19.3 0.001 32.9 -3 Bird 5 22.1 22.9 23.8 25.3 22.9
GAPDH Bursa Spleen CT Ileum Blood Dilution
factor Cq Log10 (dilution factor) Slope Efficiency
Bird 1 22.5 23.2 22.3 22.9 21.9 1 23.6 0 -3.07 2.11
Bird 2 22.7 22.7 21.7 35.4 22.0 0.1 27.1 -1 Bird 3 22.6 21.8 22.8 24.3 23.9 0.01 35.9 -2 Bird 4 21.9 21.9 22.3 23.2 21.1 0.001 33.4 -3 Bird 5 24.7 24.7 25.3 25.7 24.6 0.0001 35.9 -4
GUSB Bursa Spleen CT Ileum Blood Dilution
factor Cq Log10 (dilution factor) Slope Efficiency
Bird 1 27.9 27.3 26.9 27.2 26.4 1 26.9 0 -3.26 2.03
Bird 2 26.4 26.2 27.0 27.7 26.7 0.1 30.5 -1

211
Bird 3 27.1 26.8 28.2 28.2 28.7 0.01 33.6 -2 Bird 4 27.4 27.6 26.6 26.5 27.0 0.001 36.7 -3 Bird 5 30.1 30.3 30.8 31.4 29.2
TBP Bursa Spleen CT Ileum Blood Dilution
factor Cq Log10 (dilution factor) Slope Efficiency
Bird 1 27.1 27.9 27.8 29.8 26.6 1 29.1 0 -3.24 2.03
Bird 2 27.3 28.4 28.1 26.9 26.7 0.1 32.1 -1 Bird 3 27.7 27.5 26.9 28.3 29.3 0.01 35.5 -2 Bird 4 27.5 27.0 26.9 29.3 27.4
Bird 5 30.3 30.1 31.3 32.6 31.3
TUBAT Bursa Spleen CT Ileum Blood
Dilution factor Cq
Log10 (dilution factor) Slope Efficiency
Bird 1 32.5 32.5 30.1 27.3 27.7 1 28.4 0 -3.68 1.87
Bird 2 26.9 27.0 27.7 30.2 31.2 0.1 31.8 -1 Bird 3 30.2 26.9 33.5 33.3 33.9 0.01 35.7 -2 Bird 4 33.2 30.1 32.8 29.6 30.0
Bird 5 35.5 36.4 35.4 36.6 34.4
r28S Bursa Spleen CT Ileum Blood
Dilution factor Cq
Log10 (dilution factor) Slope Efficiency
Bird 1 10.7 10.7 10.9 13.4 11.0 1 11.7 0 -3.67 1.87
Bird 2 10.8 12.7 11.2 10.6 10.4 0.1 15.5 -1 Bird 3 10.8 11.0 10.5 10.8 12.8 0.01 18.9 -2 Bird 4 10.6 10.1 10.0 13.4 10.7 0.001 22.8 -3 Bird 5 10.8 11.2 13.4 13.8 10.3
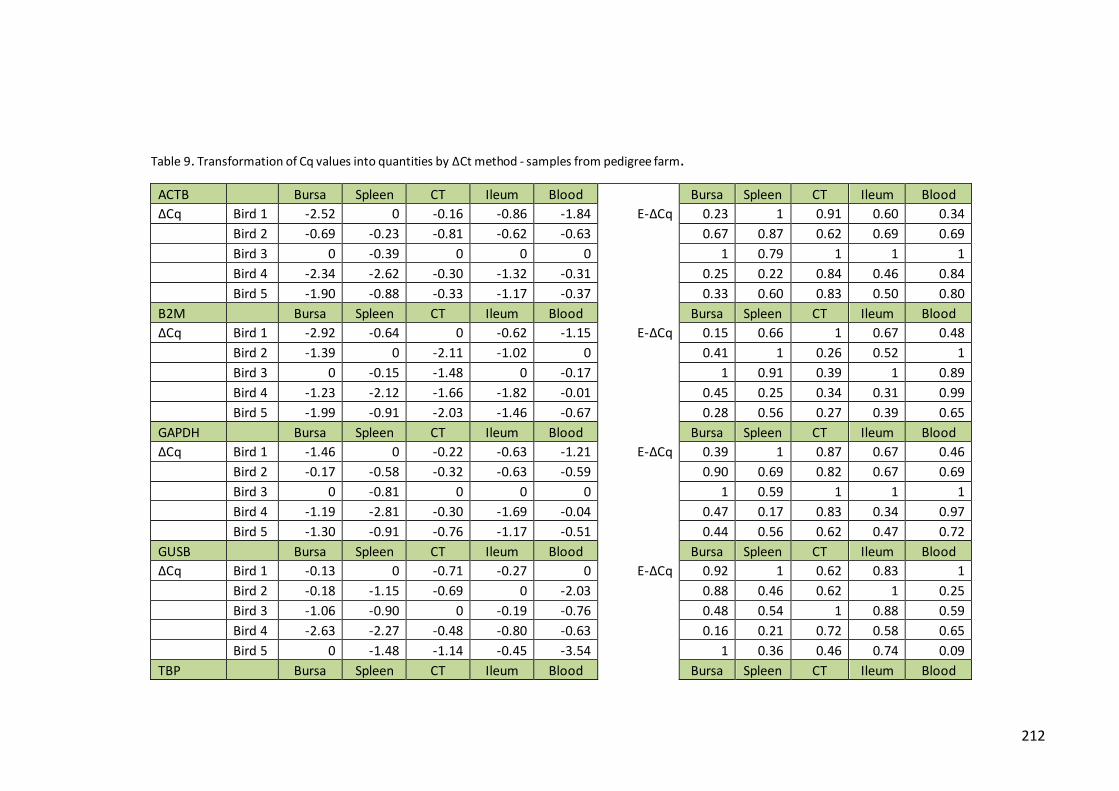
212
Table 9. Transformation of Cq values into quantities by ΔCt method - samples from pedigree farm.
ACTB Bursa Spleen CT Ileum Blood
Bursa Spleen CT Ileum Blood
ΔCq Bird 1 -2.52 0 -0.16 -0.86 -1.84 E-ΔCq 0.23 1 0.91 0.60 0.34
Bird 2 -0.69 -0.23 -0.81 -0.62 -0.63
0.67 0.87 0.62 0.69 0.69
Bird 3 0 -0.39 0 0 0
1 0.79 1 1 1
Bird 4 -2.34 -2.62 -0.30 -1.32 -0.31
0.25 0.22 0.84 0.46 0.84
Bird 5 -1.90 -0.88 -0.33 -1.17 -0.37
0.33 0.60 0.83 0.50 0.80
B2M Bursa Spleen CT Ileum Blood
Bursa Spleen CT Ileum Blood
ΔCq Bird 1 -2.92 -0.64 0 -0.62 -1.15 E-ΔCq 0.15 0.66 1 0.67 0.48
Bird 2 -1.39 0 -2.11 -1.02 0
0.41 1 0.26 0.52 1
Bird 3 0 -0.15 -1.48 0 -0.17
1 0.91 0.39 1 0.89
Bird 4 -1.23 -2.12 -1.66 -1.82 -0.01
0.45 0.25 0.34 0.31 0.99
Bird 5 -1.99 -0.91 -2.03 -1.46 -0.67
0.28 0.56 0.27 0.39 0.65
GAPDH Bursa Spleen CT Ileum Blood
Bursa Spleen CT Ileum Blood
ΔCq Bird 1 -1.46 0 -0.22 -0.63 -1.21 E-ΔCq 0.39 1 0.87 0.67 0.46
Bird 2 -0.17 -0.58 -0.32 -0.63 -0.59
0.90 0.69 0.82 0.67 0.69
Bird 3 0 -0.81 0 0 0
1 0.59 1 1 1
Bird 4 -1.19 -2.81 -0.30 -1.69 -0.04
0.47 0.17 0.83 0.34 0.97
Bird 5 -1.30 -0.91 -0.76 -1.17 -0.51
0.44 0.56 0.62 0.47 0.72
GUSB Bursa Spleen CT Ileum Blood
Bursa Spleen CT Ileum Blood
ΔCq Bird 1 -0.13 0 -0.71 -0.27 0 E-ΔCq 0.92 1 0.62 0.83 1
Bird 2 -0.18 -1.15 -0.69 0 -2.03
0.88 0.46 0.62 1 0.25
Bird 3 -1.06 -0.90 0 -0.19 -0.76
0.48 0.54 1 0.88 0.59
Bird 4 -2.63 -2.27 -0.48 -0.80 -0.63
0.16 0.21 0.72 0.58 0.65
Bird 5 0 -1.48 -1.14 -0.45 -3.54
1 0.36 0.46 0.74 0.09
TBP Bursa Spleen CT Ileum Blood
Bursa Spleen CT Ileum Blood

213
ΔCq Bird 1 -1.66 0 -0.13 -0.79 -1.76 E-ΔCq 0.37 1 0.92 0.62 0.35
Bird 2 -0.17 -0.65 -0.33 -0.93 -1.04
0.90 0.68 0.82 0.57 0.54
Bird 3 0 -0.95 0 0 0
1 0.56 1 1 1
Bird 4 -1.28 -3.03 -0.10 -1.45 -0.20
0.46 0.16 0.94 0.42 0.88
Bird 5 -1.31 -1.02 -0.64 -1.13 -0.60
0.45 0.54 0.68 0.51 0.70
TUBAT Bursa Spleen CT Ileum Blood
Bursa Spleen CT Ileum Blood
ΔCq Bird 1 -1.08 0 -1.13 -0.41 -1.23 E-ΔCq 0.46 1 0.45 0.75 0.42
Bird 2 -0.26 -2.88 -1.95 -0.39 -2.89
0.83 0.13 0.25 0.76 0.13
Bird 3 -1.56 -2.65 -1.76 0 0
0.33 0.15 0.29 1 1
Bird 4 -3.35 -3.92 0 -1.41 -0.74
0.09 0.06 1 0.37 0.59
Bird 5 0 -3.02 -1.68 -0.33 -2.98
1 0.12 0.30 0.79 0.12
r28S Bursa Spleen CT Ileum Blood
Bursa Spleen CT Ileum Blood
ΔCq Bird 1 -1.20 -0.01 -0.05 -0.10 -2.08 E-ΔCq 0.47 0.995 0.97 0.94 0.27
Bird 2 -0.13 0 -0.17 -0.53 -0.99
0.92 1 0.90 0.72 0.54
Bird 3 0 -0.19 0 0 -0.07
1 0.89 1 1 0.96
Bird 4 -1.00 -1.40 -0.22 -1.77 -0.76
0.54 0.41 0.87 0.33 0.62
Bird 5 -1.08 -0.58 -0.34 -0.24 0
0.51 0.70 0.81 0.86 1

214
Table 10. Transformation of Cq values into quantities by ΔCt method - samples from sibling test farm.
ACTB Bursa Spleen CT Ileum Blood
Bursa Spleen CT Ileum Blood
ΔCq Bird 1 -0.63 -0.87 -1.69 -2.40 -1.39 E-ΔCq 0.65 0.545 0.31 0.19 0.38
Bird 2 0 -1.27 -1.93 0 0
1 0.41 0.26 1 1
Bird 3 -0.83 -1.87 -1.43 -0.56 -3.72
0.56 0.27 0.37 0.68 0.07
Bird 4 -0.73 0 0 -1.51 -0.60
0.60 1 1 0.35 0.66
Bird 5 -1.94 -2.38 -3.50 -3.12 -2.49
0.26 0.19 0.09 0.11 0.18
B2M Bursa Spleen CT Ileum Blood
Bursa Spleen CT Ileum Blood
ΔCq Bird 1 0 0 -1.19 -2.21 -0.61 E-ΔCq 1 1 0.50 0.28 0.70
Bird 2 -0.82 -1.79 -1.94 0 0
0.62 0.35 0.32 1 1
Bird 3 -0.43 -0.69 -0.44 -0.87 -2.88
0.78 0.67 0.78 0.60 0.19
Bird 4 -0.44 -0.76 0 -0.29 -0.60
0.77 0.64 1 0.85 0.70
Bird 5 -3.16 -4.01 -5.80 -6.30 -4.23
0.16 0.10 0.03 0.03 0.09
GAPDH Bursa Spleen CT Ileum Blood
Bursa Spleen CT Ileum Blood
ΔCq Bird 1 -0.62 -1.44 -0.58 0 -0.88 E-ΔCq 0.69 0.42 0.70 1 0.59
Bird 2 -0.75 -0.91 0 -1.11 -0.90
0.63 0.58 1 0.51 0.58
Bird 3 -0.72 0 -1.09 -1.46 -2.84
0.65 1 0.52 0.41 0.18
Bird 4 0 -0.15 -0.58 -0.31 0
1 0.91 0.70 0.83 1
Bird 5 -2.77 -2.90 -3.59 -2.80 -3.56
0.19 0.17 0.11 0.18 0.12
GUSB Bursa Spleen CT Ileum Blood
Bursa Spleen CT Ileum Blood
ΔCq Bird 1 -1.51 -1.09 -0.29 -0.74 0 E-ΔCq 0.34 0.46 0.81 0.59 1
Bird 2 0 0 -0.39 -1.24 -0.28
1 1 0.76 0.42 0.82
Bird 3 -0.68 -0.61 -1.66 -1.72 -2.23
0.62 0.65 0.31 0.30 0.21
Bird 4 -0.97 -1.46 0 0 -0.57
0.50 0.36 1 1 0.67
Bird 5 -3.69 -4.08 -4.25 -4.88 -2.75
0.07 0.06 0.05 0.03 0.14
TBP Bursa Spleen CT Ileum Blood
Bursa Spleen CT Ileum Blood
ΔCq Bird 1 0 -0.80 -0.93 -2.83 0 E-ΔCq 1 0.57 0.52 0.13 1
Bird 2 -0.22 -1.38 -1.18 0 -0.19
0.86 0.37 0.43 1 0.87
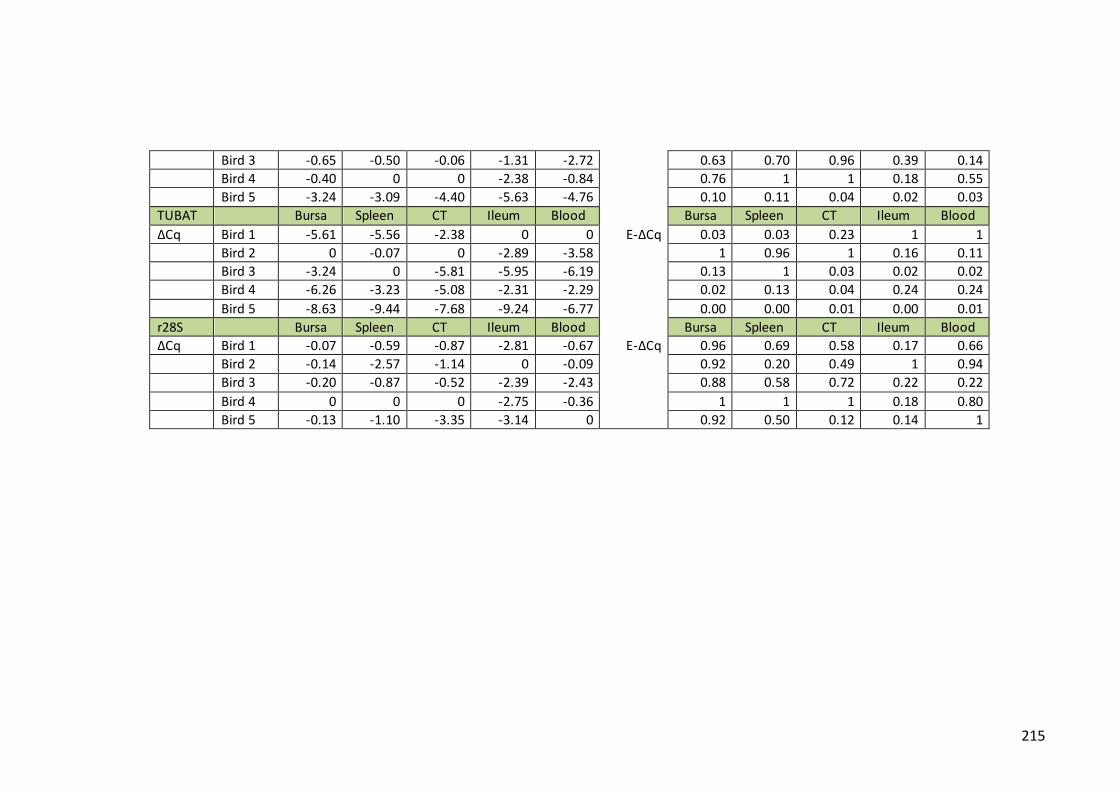
215
Bird 3 -0.65 -0.50 -0.06 -1.31 -2.72
0.63 0.70 0.96 0.39 0.14
Bird 4 -0.40 0 0 -2.38 -0.84
0.76 1 1 0.18 0.55
Bird 5 -3.24 -3.09 -4.40 -5.63 -4.76
0.10 0.11 0.04 0.02 0.03
TUBAT Bursa Spleen CT Ileum Blood
Bursa Spleen CT Ileum Blood
ΔCq Bird 1 -5.61 -5.56 -2.38 0 0 E-ΔCq 0.03 0.03 0.23 1 1
Bird 2 0 -0.07 0 -2.89 -3.58
1 0.96 1 0.16 0.11
Bird 3 -3.24 0 -5.81 -5.95 -6.19
0.13 1 0.03 0.02 0.02
Bird 4 -6.26 -3.23 -5.08 -2.31 -2.29
0.02 0.13 0.04 0.24 0.24
Bird 5 -8.63 -9.44 -7.68 -9.24 -6.77
0.00 0.00 0.01 0.00 0.01
r28S Bursa Spleen CT Ileum Blood
Bursa Spleen CT Ileum Blood
ΔCq Bird 1 -0.07 -0.59 -0.87 -2.81 -0.67 E-ΔCq 0.96 0.69 0.58 0.17 0.66
Bird 2 -0.14 -2.57 -1.14 0 -0.09
0.92 0.20 0.49 1 0.94
Bird 3 -0.20 -0.87 -0.52 -2.39 -2.43
0.88 0.58 0.72 0.22 0.22
Bird 4 0 0 0 -2.75 -0.36
1 1 1 0.18 0.80
Bird 5 -0.13 -1.10 -3.35 -3.14 0
0.92 0.50 0.12 0.14 1

216
a)
Reference genes NTC
b)
All test genes NTC
Figure 2. Melting curves for No Template Control (NTC) samples from qPCR analysis using 96.96
Dynamic Array platform; a) for reference genes, b) all genes tested.

217
ACTB B2M
GAPDH GUSB
TBP r28S
Figure 3. Melting curves for all reference genes for all conditions from analysis using 96.96 Dynamic
Array.

218
C3ORF52 CCL19
CSF1 CXCL13L2
CXORF21 EAF2
Figure 4. Melting curves for genes where primers do not span exon/exon boundaries and with introns < 500 bp.

219
EDN1 ENSGALG00000005747
ENSGALG00000022324 G0S2
GCH1 IL12B Figure 4 continued

220
IRF7 JUN
MADPRT MAFA
NFKB2 NOS2
Figure 4 continued
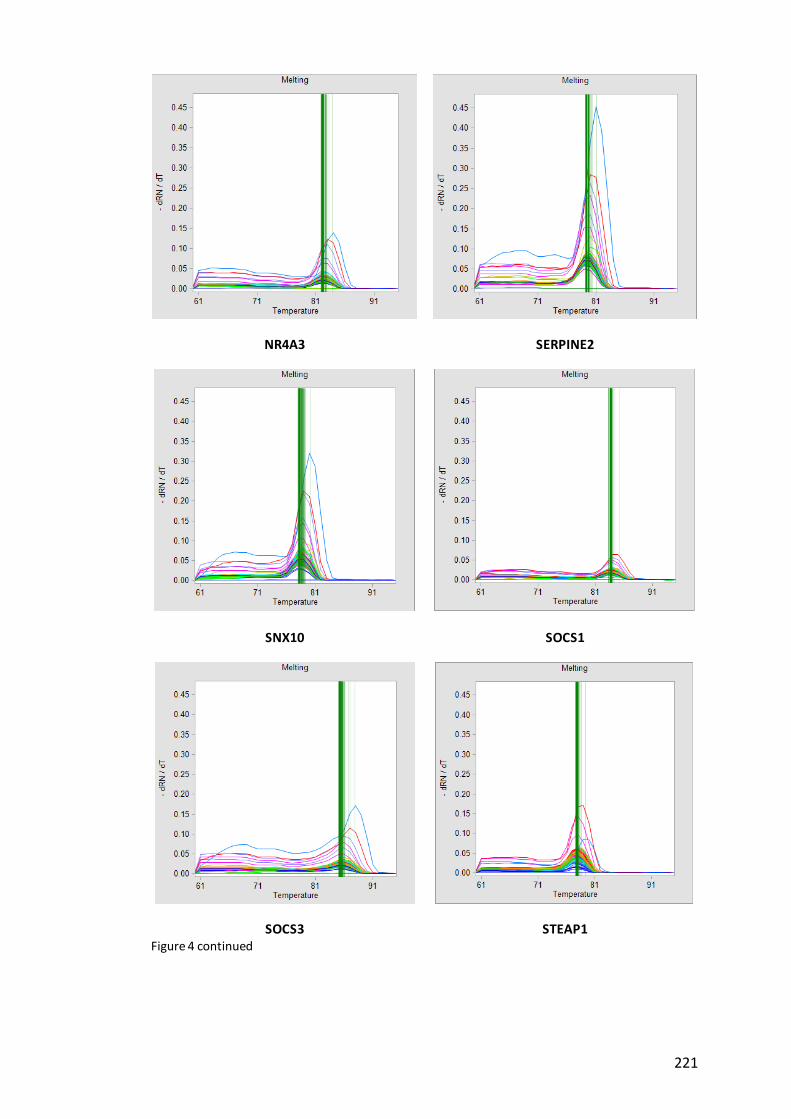
221
NR4A3 SERPINE2
SNX10 SOCS1
SOCS3 STEAP1 Figure 4 continued
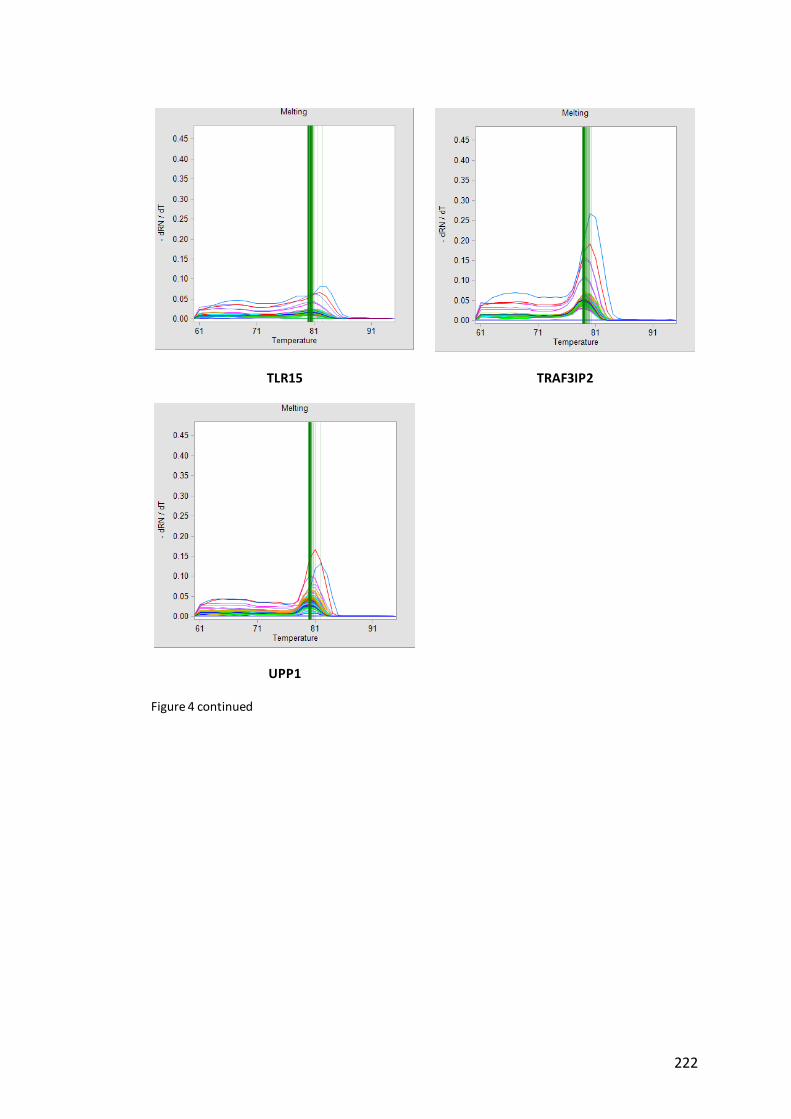
222
TLR15 TRAF3IP2
UPP1
Figure 4 continued
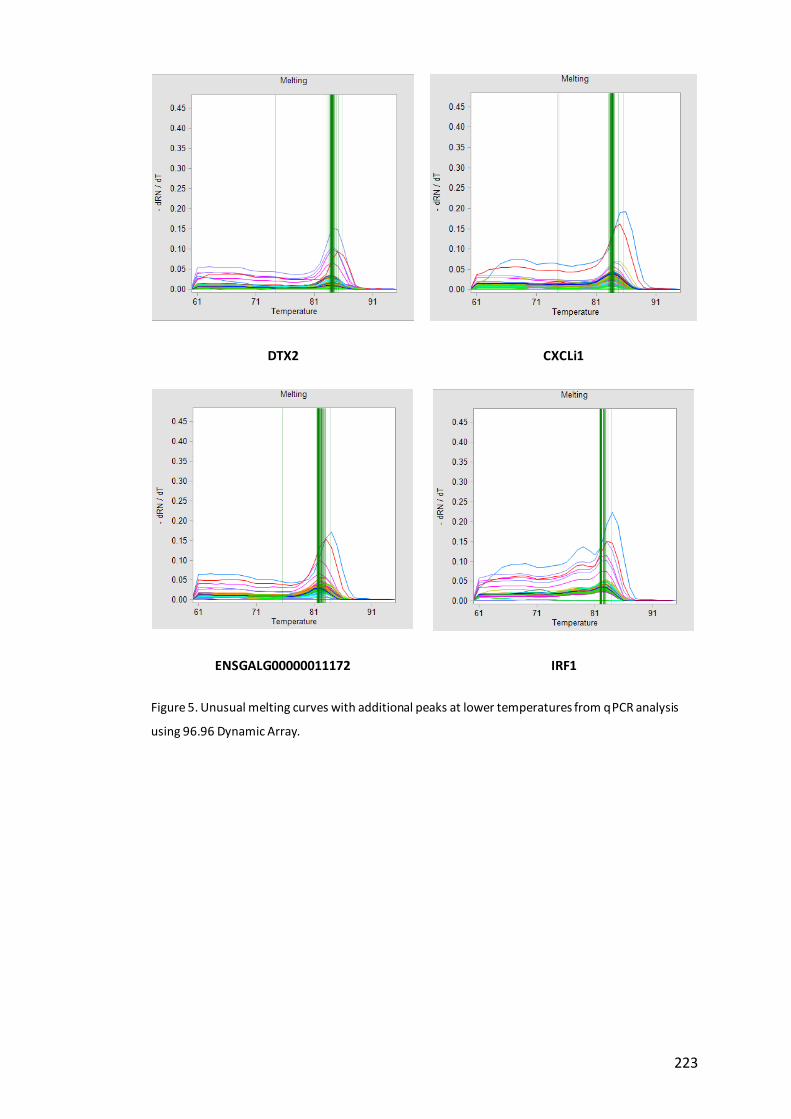
223
DTX2 CXCLi1
ENSGALG00000011172 IRF1
Figure 5. Unusual melting curves with additional peaks at lower temperatures from qPCR analysis
using 96.96 Dynamic Array.

224
IL12B MAFA
STEAP4 GUSB
Figure 5 continued