Embed Size (px)
Citation preview
ABSTRACT: A three-dimensional fractured medium flow modelwas developed for the Bear Creek Valley (BCV) S-3 site of the OakRidge Reservation (ORR) using SWIFT III. The numerical model-ing for this site focused on a conceptual model established throughthe analysis of heterogeneous geologic units and matrix fractureproperties of the subsurface in the BCV area. The SWIFT III mod-eling analysis was based on the previous modeling studies thatused MODFLOW and MODPATH. A rigorous calibration wasobtained first by comparing simulated results with the existingdata on ground water levels and then by comparing pumping testresults with the simulated ground water levels. A satisfactoryagreement between observed and simulated results was obtained.The calibrated model was used to determine sustained yield from aground water interceptor trench. Different withdrawal rates wereused to simulate the performance of the trench for the sustainedwithdrawal of ground water.(KEY TERMS: ground water modeling; dual porosity; fracturedmedia; pumping test analysis; trench evaluation.)
Ahmed, Shabbir, Alauddin Khan, and Peter Salpas, 2003. Development of aFractured Medium Flow Model for a Waste Site. Journal of the American WaterResources Association (JAWRA) 39(5):1127-1142.
INTRODUCTION
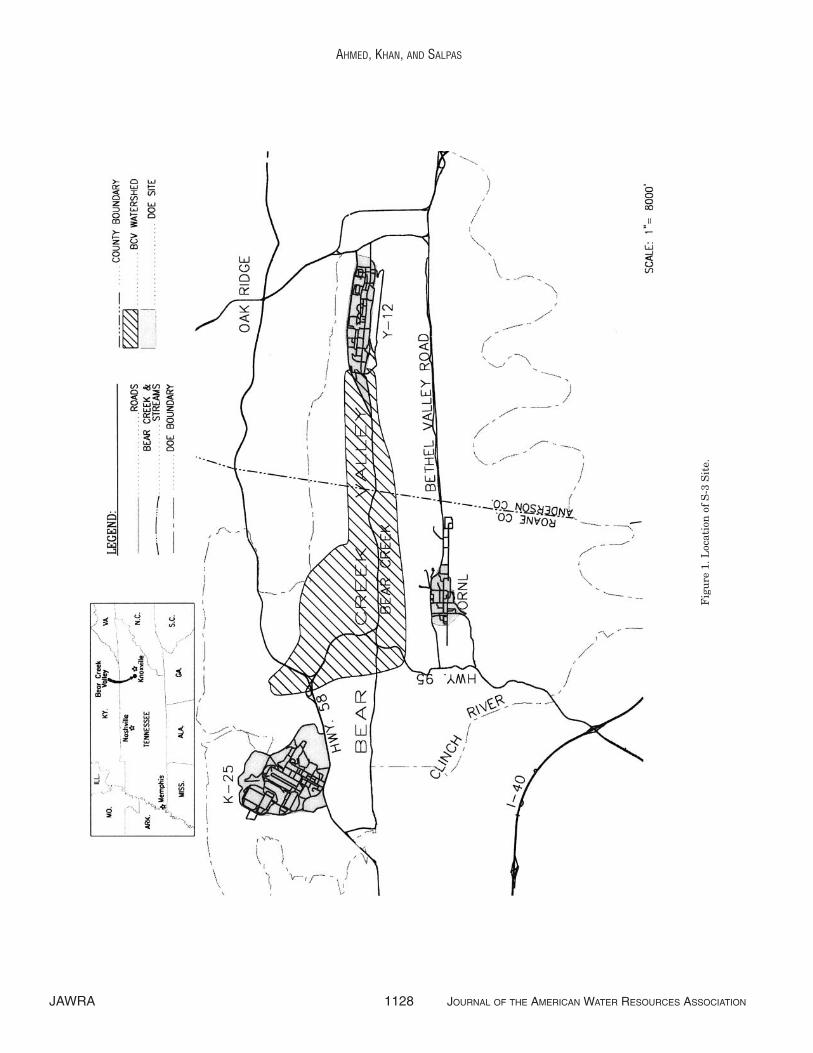
Among the waste sites in the Bear Creek Valley(BCV) area of the U. S. Department of Energy’s(DOE’s) Oak Ridge Reservation (ORR) in Tennessee,the BCV S-3 site, constructed in 1951, consisted offour unlined ponds for discharging liquid wastes.Ground water beneath the site is contaminated withnitrate, radionuclides, and metals. Several groundwater models have been developed to study flow andcontaminant transport in the BCV area (Figure 1). Ofthem, the three-dimensional models developed by the
U.S. Geological Survey (USGS) (Bailey and Lee, 1991)and Geraghty and Miller Inc. (1989) were found to beapplicable on a regional scale for simulating thehydrogeologic conditions in the whole BCV area.These models provided valuable information on theground water flow system but were based on a coarsenumerical grid of the domain because high capacitycomputers were unavailable when the models weredeveloped. The coarse grid excluded detailed informa-tion relating to seeps and tributaries. The JacobsEngineering (JE) Environmental Restoration teamcompiled a detailed summary of the previous groundwater flow and contaminant transport modeling forBCV (JE, 1996).
A regional ground water flow model using MODFLOW (McDonald and Harbaugh, 1988) wasdeveloped by JE (1996) to support the RemedialInvestigation/Feasibility Study (RI/FS) for the BCVsite. The model was based on a relatively fine numeri-cal grid consisting of 335 rows, 78 columns, and 5 lay-ers. The grid spacing varied from 100 to 200 ft with atotal of 130,650 cells covering an area of 8,000 acres.The regional model was later refined with supportfrom Science Applications International Corporation(SAIC) for the Upper East Fork Poplar Creek(UEFPC) RI (SAIC, 1998). The refined model consistsof 577 rows, 127 columns, and 5 layers and has a totalof 366,395 cells. The grid spacing was refined for theUEFPC area to vary from 50 to 200 ft. The output ofthe refined model was used in MODPATH, a particletracking program developed by Pollock (1989) to eval-uate contaminant migration pathways in groundwater.
1Paper No. 99002 of the Journal of the American Water Resources Association. Discussions are open until April 1, 2004.2Respectively, Senior Engineer, Big Cypress Basin, South Florida Water Management District, 6089 Janes Lane, Naples, Florida 34109;
and Senior Environmental Scientist and Project Manager, Science Applications International Corporation (SAIC), 151 Lafayette Drive, OakRidge, Tennessee 37830 (E-Mail/Ahmed: [email protected]).
JOURNAL OF THE AMERICAN WATER RESOURCES ASSOCIATION 1127 JAWRA
JOURNAL OF THE AMERICAN WATER RESOURCES ASSOCIATIONOCTOBER AMERICAN WATER RESOURCES ASSOCIATION 2003
DEVELOPMENT OF A FRACTURED MEDIUMFLOW MODEL FOR A WASTE SITE1
Shabbir Ahmed, Alauddin Khan, and Peter Salpas2
JAWRA 1128 JOURNAL OF THE AMERICAN WATER RESOURCES ASSOCIATION
AHMED, KHAN, AND SALPAS
Fig
ure
1. L
ocat
ion
of
S-3
Sit
e.
Later, a variable density flow model for BCV wasdeveloped by Jones et al. (1996) using SWIFT III(Reeves et al., 1986). The flow and contaminant trans-port modeling was done in a two-dimensional domainconsisting only of the Nolichucky Shale. The modelwas used to understand a pressure bulge and contam-inant migration in the vicinity of a monitoring well inthe BCV S-3 site.
The three-dimensional models that were developedfor the site assumed heterogeneous, density indepen-dent, equivalent porous media. The two-dimensionalvariable density model developed by Jones et al.(1996) only simulated the conditions in one geologicunit, the Nolichucky Shale. Also, fractured media con-taminant transport modeling was done using a one-dimensional model (SAIC, 1996). However, theunderlying geology in BCV consists of fractures withstrong heterogeneity in a three-dimensional domain.The orientation of the shallow and deep plumes indi-cates strong along strike anisotropy of the hydraulicconductivity in the media. In addition, the density ofground water is variable due to disposal of varioussolid and liquid wastes. It was conceptualized basedon the field data that a pressure bulge in theNolichucky Shale developed because of the migrationof liquid wastes of variable density. The presentSWIFT III modeling study entails simulation of thepressure bulge in the Nolichucky Shale, but is notpresented in this paper. The focus of this paper is torefine the model calibration at the S-3 site, representpump test data using the model, and evaluate theeffectiveness of the collection trench.
S-3 SITE MODEL
The local geology consists of weathered rock withunderlying bedrock in layers inclined from Pine Ridgeon the north to Chestnut Ridge on the south. Theexistence of fractures with inclined water bearing geo-logic formations in three-dimensional space dictatesthe need for a transient model to attain an equilibri-um condition based on long term simulations. Theneed for a new fractured media transient model arisesbecause no steady or transient model has been devel-oped in three dimensions to evaluate the fracturedand variable density flow conditions at the site thatare essential for determining appropriate remedialactions. The criteria for selecting a numerical modelfor modeling the S-3 site include the capability of sim-ulating three-dimensional, variable density, fracturedmedia flow and contaminant transport, and the capa-bility of representing fractured media using dualporosity. The SWIFT III code was selected for the S-3site because it met all these criteria.
The objective of the study presented here was todevelop a detailed, three-dimensional, fracturedmedia flow model that could be used to investigatedifferent scenarios for the BCV Treatability Studyand to implement remedial action programs at the S-3 site. This modeling study investigates the physi-cal conditions at the site and simulates future condi-tions associated with various alternatives forremedial action programs.
The present numerical modeling describes frac-tures, heterogeneity, and anisotropy in the subsur-face. The study incorporates the S-3 site hydro-geologic data and the BCV regional model data (JE,1996) to develop a conceptual physical model for theS-3 site that can be simulated using SWIFT III. Thestudy uses the BCV regional model data along withadditional SWIFT III data for the S-3 site. The addi-tional data include fracture characteristics (porosityand fracture hydraulic conductivity) of the media andvariable density of the contaminated liquid. The tasksperformed include: refinement of the BCV regionalmodel grid in the S-3 area in both horizontal and ver-tical directions; inclusion of the BCV regional modeloutput to assign initial and boundary conditions;inclusion of fracture characteristics in the three-dimensional model domain; pumping test analysis todetermine a representative hydraulic conductivity forthe Nolichucky Shale; and simulation of a pumpingscenario for the trench at the S-3 site. In this paperwe describe the existing hydrogeologic characteristicsof the S-3 site and the model simulation results.
MODEL DOMAIN
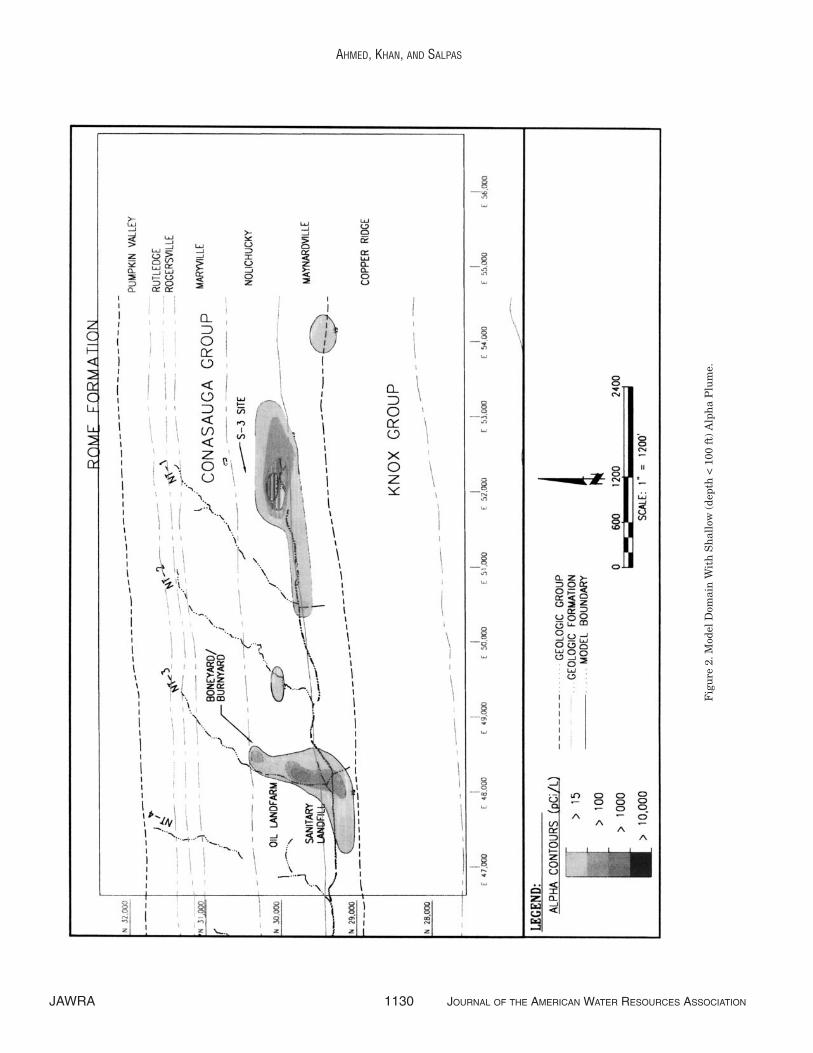
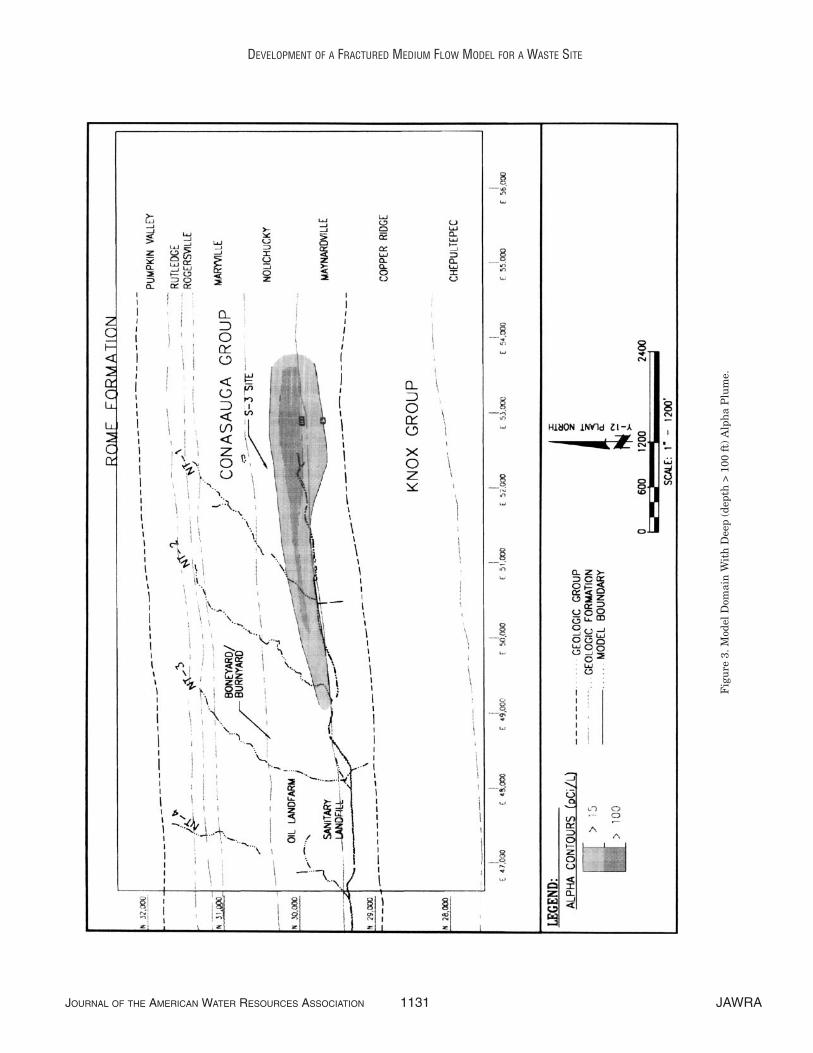
An understanding of the hydrogeologic system inthe S-3 area was needed to select the appropriateboundaries for the model. The main goal was to modelwith a refined grid at the S-3 site, which has a urani-um contaminated ground water plume. The north andsouth boundaries on the Pine and Chestnut Ridgeswere kept the same as in the BCV regional modeldomain. The horizontal boundaries in the east andwest were selected based on the alpha plume asshown in Figures 2 and 3; which corresponds to shal-low (<100 ft) and deep (>100 ft) conditions, respective-ly.
The local geologic units described in the BCV reme-dial investigation (SAIC, 1997) extending from PineRidge to Chestnut Ridge consist of: Pumpkin ValleyShale, Rutledge Limestone, Rogersville Shale,Maryville Limestone, Nolichucky Shale, MaynardvilleLimestone, and Knox Formation. The geologic unitsare shown on Figures 2 and 3. The geologic strike isin an east-west direction with a steep dip angle of 45
JOURNAL OF THE AMERICAN WATER RESOURCES ASSOCIATION 1129 JAWRA
DEVELOPMENT OF A FRACTURED MEDIUM FLOW MODEL FOR A WASTE SITE
JAWRA 1130 JOURNAL OF THE AMERICAN WATER RESOURCES ASSOCIATION
AHMED, KHAN, AND SALPAS
Fig
ure
2. M
odel
Dom
ain
Wit
h S
hal
low
(de
pth
< 1
00 f
t) A
lph
a P
lum
e.
JOURNAL OF THE AMERICAN WATER RESOURCES ASSOCIATION 1131 JAWRA
DEVELOPMENT OF A FRACTURED MEDIUM FLOW MODEL FOR A WASTE SITE
Fig
ure
3. M
odel
Dom
ain
Wit
h D
eep
(dep
th >
100
ft)
Alp
ha
Plu
me.
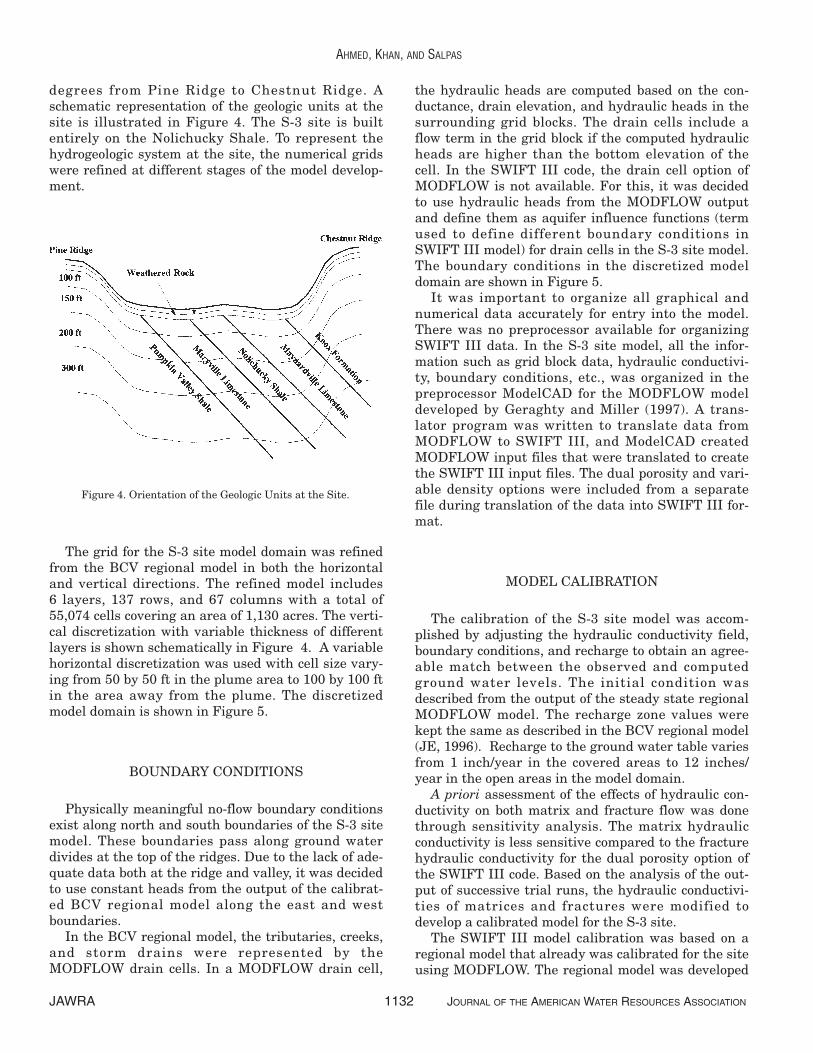
degrees from Pine Ridge to Chestnut Ridge. Aschematic representation of the geologic units at thesite is illustrated in Figure 4. The S-3 site is builtentirely on the Nolichucky Shale. To represent thehydrogeologic system at the site, the numerical gridswere refined at different stages of the model develop-ment.
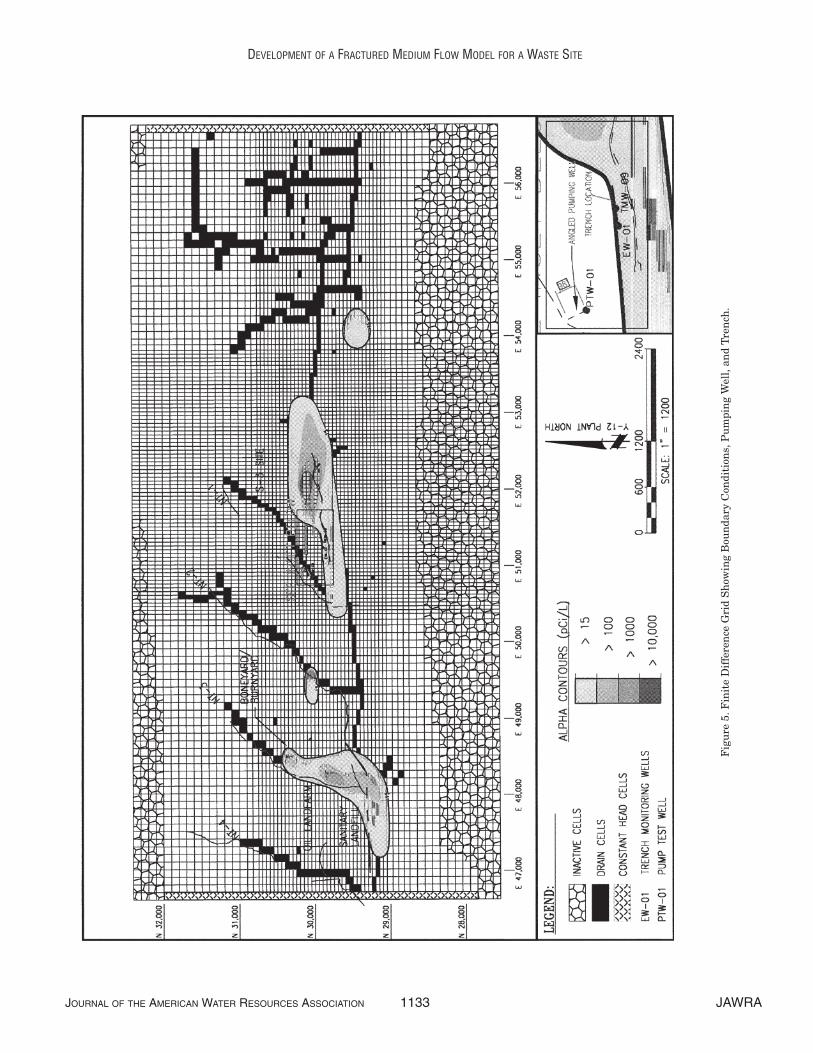
The grid for the S-3 site model domain was refinedfrom the BCV regional model in both the horizontaland vertical directions. The refined model includes 6 layers, 137 rows, and 67 columns with a total of55,074 cells covering an area of 1,130 acres. The verti-cal discretization with variable thickness of differentlayers is shown schematically in Figure 4. A variablehorizontal discretization was used with cell size vary-ing from 50 by 50 ft in the plume area to 100 by 100 ftin the area away from the plume. The discretizedmodel domain is shown in Figure 5.
BOUNDARY CONDITIONS
Physically meaningful no-flow boundary conditionsexist along north and south boundaries of the S-3 sitemodel. These boundaries pass along ground waterdivides at the top of the ridges. Due to the lack of ade-quate data both at the ridge and valley, it was decidedto use constant heads from the output of the calibrat-ed BCV regional model along the east and westboundaries.
In the BCV regional model, the tributaries, creeks,and storm drains were represented by the MODFLOW drain cells. In a MODFLOW drain cell,
the hydraulic heads are computed based on the con-ductance, drain elevation, and hydraulic heads in thesurrounding grid blocks. The drain cells include aflow term in the grid block if the computed hydraulicheads are higher than the bottom elevation of the cell. In the SWIFT III code, the drain cell option ofMODFLOW is not available. For this, it was decidedto use hydraulic heads from the MODFLOW outputand define them as aquifer influence functions (termused to define different boundary conditions inSWIFT III model) for drain cells in the S-3 site model.The boundary conditions in the discretized modeldomain are shown in Figure 5.
It was important to organize all graphical andnumerical data accurately for entry into the model.There was no preprocessor available for organizingSWIFT III data. In the S-3 site model, all the infor-mation such as grid block data, hydraulic conductivi-ty, boundary conditions, etc., was organized in thepreprocessor ModelCAD for the MODFLOW modeldeveloped by Geraghty and Miller (1997). A trans-lator program was written to translate data from MODFLOW to SWIFT III, and ModelCAD createdMODFLOW input files that were translated to createthe SWIFT III input files. The dual porosity and vari-able density options were included from a separatefile during translation of the data into SWIFT III for-mat.
MODEL CALIBRATION
The calibration of the S-3 site model was accom-plished by adjusting the hydraulic conductivity field,boundary conditions, and recharge to obtain an agree-able match between the observed and computedground water levels. The initial condition wasdescribed from the output of the steady state regionalMODFLOW model. The recharge zone values werekept the same as described in the BCV regional model(JE, 1996). Recharge to the ground water table variesfrom 1 inch/year in the covered areas to 12 inches/year in the open areas in the model domain.
A priori assessment of the effects of hydraulic con-ductivity on both matrix and fracture flow was donethrough sensitivity analysis. The matrix hydraulicconductivity is less sensitive compared to the fracturehydraulic conductivity for the dual porosity option ofthe SWIFT III code. Based on the analysis of the out-put of successive trial runs, the hydraulic conductivi-ties of matrices and fractures were modified todevelop a calibrated model for the S-3 site.
The SWIFT III model calibration was based on aregional model that already was calibrated for the siteusing MODFLOW. The regional model was developed
JAWRA 1132 JOURNAL OF THE AMERICAN WATER RESOURCES ASSOCIATION
AHMED, KHAN, AND SALPAS
Figure 4. Orientation of the Geologic Units at the Site.
JOURNAL OF THE AMERICAN WATER RESOURCES ASSOCIATION 1133 JAWRA
DEVELOPMENT OF A FRACTURED MEDIUM FLOW MODEL FOR A WASTE SITE
Fig
ure
5. F
init
e D
iffe
ren
ce G
rid
Sh
owin
g B
oun
dary
Con
diti
ons,
Pu
mpi
ng
Wel
l, an
d Tr
ench
.
using an equivalent porous medium MODFLOWmodel that represented hydraulic conductivities thatwere higher than the matrix hydraulic conductivitiesbut lower than the fracture hydraulic conductivities.In the SWIFT III model, adjustments were made torepresent the hydraulic conductivities of matrix andfracture separately. A refinement of the calibrationwas done by describing the fracture and matrixhydraulic conductivities using SWIFT III. Theobserved data for the wells were compared to gainconfidence in the model results. The hydraulic con-ductivity values were adjusted in the layers by com-paring the predicted and observed water levels of thewells screened in those layers. The hydraulic conduc-tivity values in different formations were adjusted inthe upper layers, where most of the observed datawere available. It is a general practice in modeling tocompare simulated results with as many data as pos-sible.
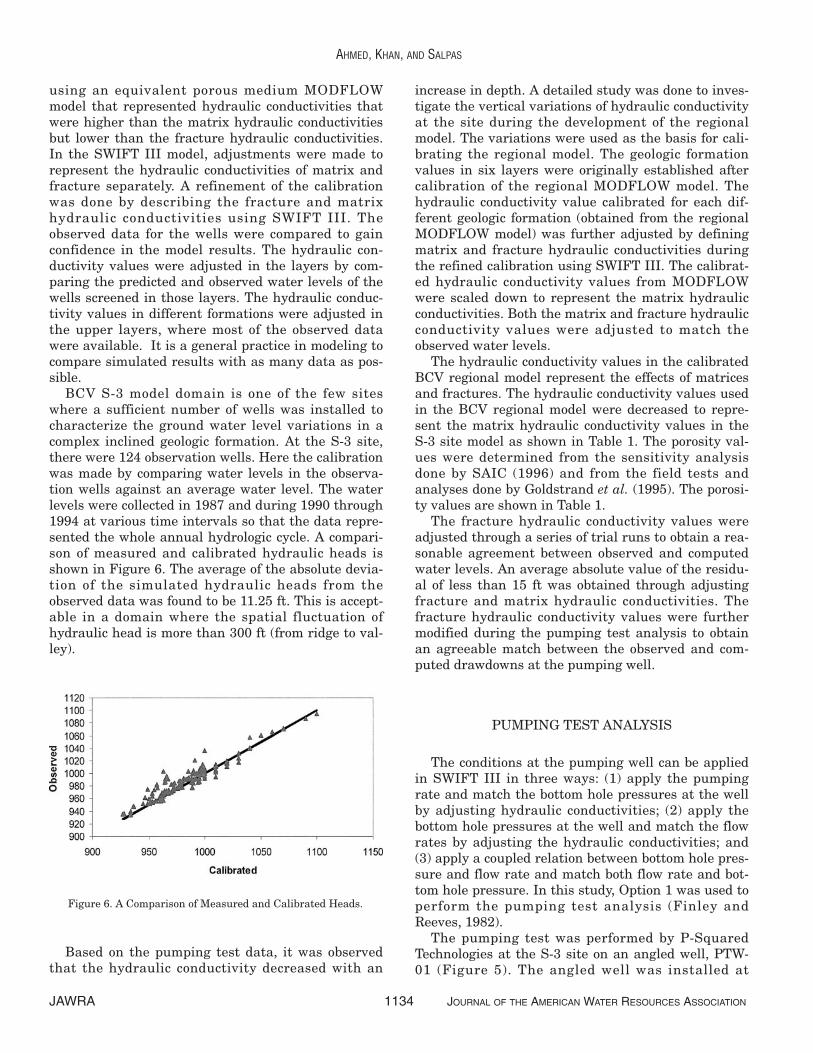
BCV S-3 model domain is one of the few siteswhere a sufficient number of wells was installed tocharacterize the ground water level variations in acomplex inclined geologic formation. At the S-3 site,there were 124 observation wells. Here the calibrationwas made by comparing water levels in the observa-tion wells against an average water level. The waterlevels were collected in 1987 and during 1990 through1994 at various time intervals so that the data repre-sented the whole annual hydrologic cycle. A compari-son of measured and calibrated hydraulic heads isshown in Figure 6. The average of the absolute devia-tion of the simulated hydraulic heads from theobserved data was found to be 11.25 ft. This is accept-able in a domain where the spatial fluctuation ofhydraulic head is more than 300 ft (from ridge to val-ley).
Based on the pumping test data, it was observedthat the hydraulic conductivity decreased with an
increase in depth. A detailed study was done to inves-tigate the vertical variations of hydraulic conductivityat the site during the development of the regionalmodel. The variations were used as the basis for cali-brating the regional model. The geologic formationvalues in six layers were originally established aftercalibration of the regional MODFLOW model. Thehydraulic conductivity value calibrated for each dif-ferent geologic formation (obtained from the regionalMODFLOW model) was further adjusted by definingmatrix and fracture hydraulic conductivities duringthe refined calibration using SWIFT III. The calibrat-ed hydraulic conductivity values from MODFLOWwere scaled down to represent the matrix hydraulicconductivities. Both the matrix and fracture hydraulicconductivity values were adjusted to match theobserved water levels.
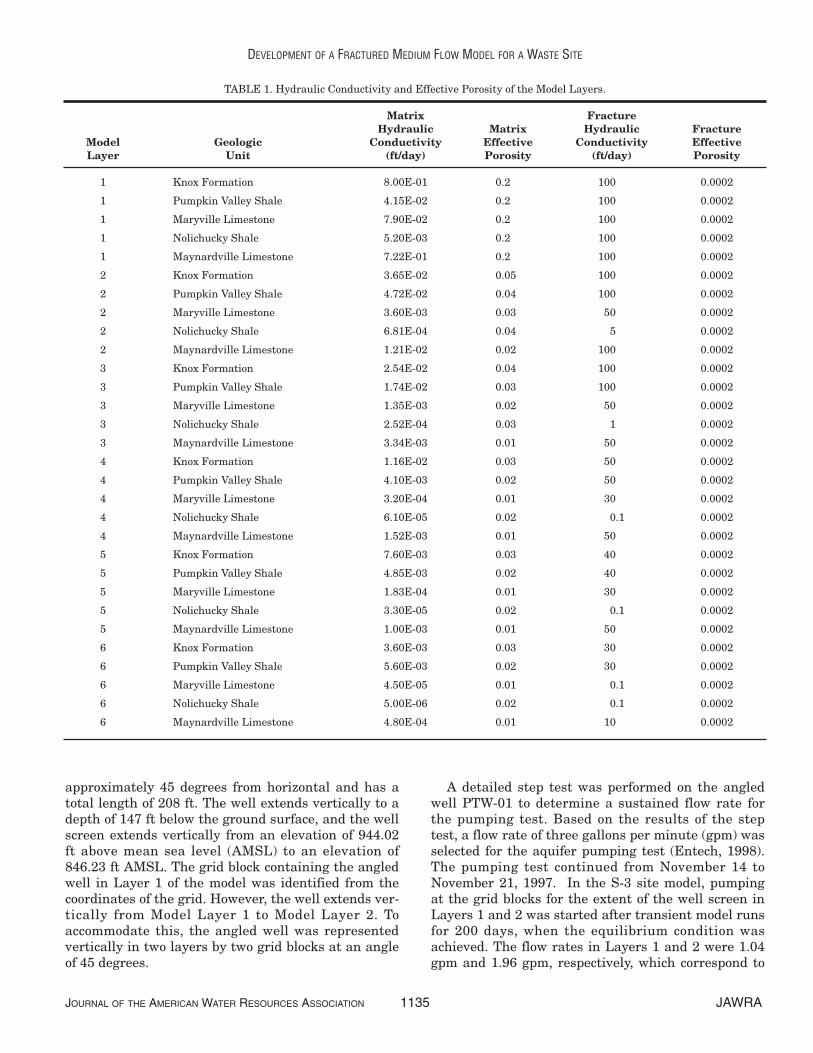
The hydraulic conductivity values in the calibratedBCV regional model represent the effects of matricesand fractures. The hydraulic conductivity values usedin the BCV regional model were decreased to repre-sent the matrix hydraulic conductivity values in theS-3 site model as shown in Table 1. The porosity val-ues were determined from the sensitivity analysisdone by SAIC (1996) and from the field tests andanalyses done by Goldstrand et al. (1995). The porosi-ty values are shown in Table 1.
The fracture hydraulic conductivity values wereadjusted through a series of trial runs to obtain a rea-sonable agreement between observed and computedwater levels. An average absolute value of the residu-al of less than 15 ft was obtained through adjustingfracture and matrix hydraulic conductivities. Thefracture hydraulic conductivity values were furthermodified during the pumping test analysis to obtainan agreeable match between the observed and com-puted drawdowns at the pumping well.
PUMPING TEST ANALYSIS
The conditions at the pumping well can be appliedin SWIFT III in three ways: (1) apply the pumpingrate and match the bottom hole pressures at the wellby adjusting hydraulic conductivities; (2) apply thebottom hole pressures at the well and match the flowrates by adjusting the hydraulic conductivities; and(3) apply a coupled relation between bottom hole pres-sure and flow rate and match both flow rate and bot-tom hole pressure. In this study, Option 1 was used toperform the pumping test analysis (Finley andReeves, 1982).
The pumping test was performed by P-SquaredTechnologies at the S-3 site on an angled well, PTW-01 (Figure 5). The angled well was installed at
JAWRA 1134 JOURNAL OF THE AMERICAN WATER RESOURCES ASSOCIATION
AHMED, KHAN, AND SALPAS
Figure 6. A Comparison of Measured and Calibrated Heads.
approximately 45 degrees from horizontal and has atotal length of 208 ft. The well extends vertically to adepth of 147 ft below the ground surface, and the wellscreen extends vertically from an elevation of 944.02ft above mean sea level (AMSL) to an elevation of846.23 ft AMSL. The grid block containing the angledwell in Layer 1 of the model was identified from thecoordinates of the grid. However, the well extends ver-tically from Model Layer 1 to Model Layer 2. Toaccommodate this, the angled well was representedvertically in two layers by two grid blocks at an angleof 45 degrees.
A detailed step test was performed on the angledwell PTW-01 to determine a sustained flow rate forthe pumping test. Based on the results of the steptest, a flow rate of three gallons per minute (gpm) wasselected for the aquifer pumping test (Entech, 1998).The pumping test continued from November 14 toNovember 21, 1997. In the S-3 site model, pumpingat the grid blocks for the extent of the well screen inLayers 1 and 2 was started after transient model runsfor 200 days, when the equilibrium condition wasachieved. The flow rates in Layers 1 and 2 were 1.04gpm and 1.96 gpm, respectively, which correspond to
JOURNAL OF THE AMERICAN WATER RESOURCES ASSOCIATION 1135 JAWRA
DEVELOPMENT OF A FRACTURED MEDIUM FLOW MODEL FOR A WASTE SITE
TABLE 1. Hydraulic Conductivity and Effective Porosity of the Model Layers.
Matrix FractureHydraulic Matrix Hydraulic Fracture
Model Geologic Conductivity Effective Conductivity EffectiveLayer Unit (ft/day) Porosity (ft/day) Porosity
1 Knox Formation 8.00E-01 0.2 100 0.0002
1 Pumpkin Valley Shale 4.15E-02 0.2 100 0.0002
1 Maryville Limestone 7.90E-02 0.2 100 0.0002
1 Nolichucky Shale 5.20E-03 0.2 100 0.0002
1 Maynardville Limestone 7.22E-01 0.2 100 0.0002
2 Knox Formation 3.65E-02 0.05 100 0.0002
2 Pumpkin Valley Shale 4.72E-02 0.04 100 0.0002
2 Maryville Limestone 3.60E-03 0.03 50 0.0002
2 Nolichucky Shale 6.81E-04 0.04 5 0.0002
2 Maynardville Limestone 1.21E-02 0.02 100 0.0002
3 Knox Formation 2.54E-02 0.04 100 0.0002
3 Pumpkin Valley Shale 1.74E-02 0.03 100 0.0002
3 Maryville Limestone 1.35E-03 0.02 50 0.0002
3 Nolichucky Shale 2.52E-04 0.03 1 0.0002
3 Maynardville Limestone 3.34E-03 0.01 50 0.0002
4 Knox Formation 1.16E-02 0.03 50 0.0002
4 Pumpkin Valley Shale 4.10E-03 0.02 50 0.0002
4 Maryville Limestone 3.20E-04 0.01 30 0.0002
4 Nolichucky Shale 6.10E-05 0.02 0.1 0.0002
4 Maynardville Limestone 1.52E-03 0.01 50 0.0002
5 Knox Formation 7.60E-03 0.03 40 0.0002
5 Pumpkin Valley Shale 4.85E-03 0.02 40 0.0002
5 Maryville Limestone 1.83E-04 0.01 30 0.0002
5 Nolichucky Shale 3.30E-05 0.02 0.1 0.0002
5 Maynardville Limestone 1.00E-03 0.01 50 0.0002
6 Knox Formation 3.60E-03 0.03 30 0.0002
6 Pumpkin Valley Shale 5.60E-03 0.02 30 0.0002
6 Maryville Limestone 4.50E-05 0.01 0.1 0.0002
6 Nolichucky Shale 5.00E-06 0.02 0.1 0.0002
6 Maynardville Limestone 4.80E-04 0.01 10 0.0002
the proportion of screen lengths in each of the gridblocks.
The fracture hydraulic conductivity values in dif-ferent zones were changed through a series of trialruns. The objective was to obtain a reasonable steadystate hydraulic head distribution in the model domainand to obtain a reasonable agreement between theobserved and computed drawdowns. The calibratedfracture hydraulic conductivity values are shown inTable 1. An effective porosity value of 0.0002 wasused to simulate fractures in the model, based on thesensitivity study conducted by SAIC (1996).
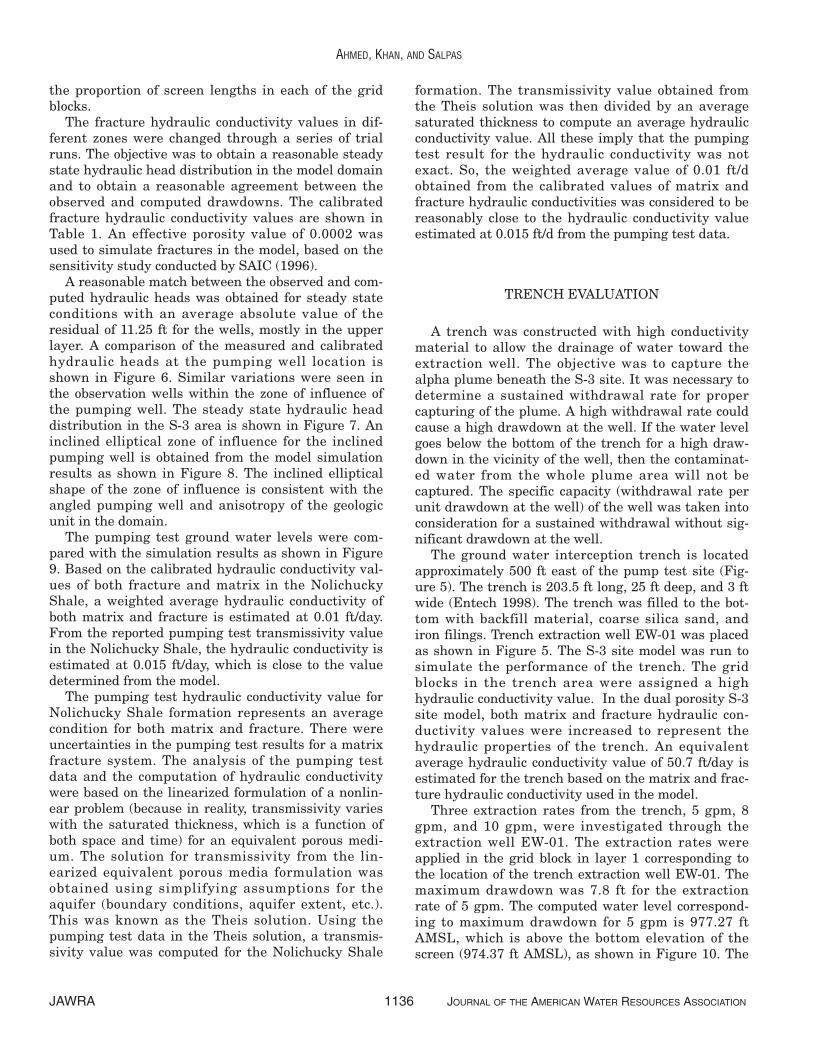
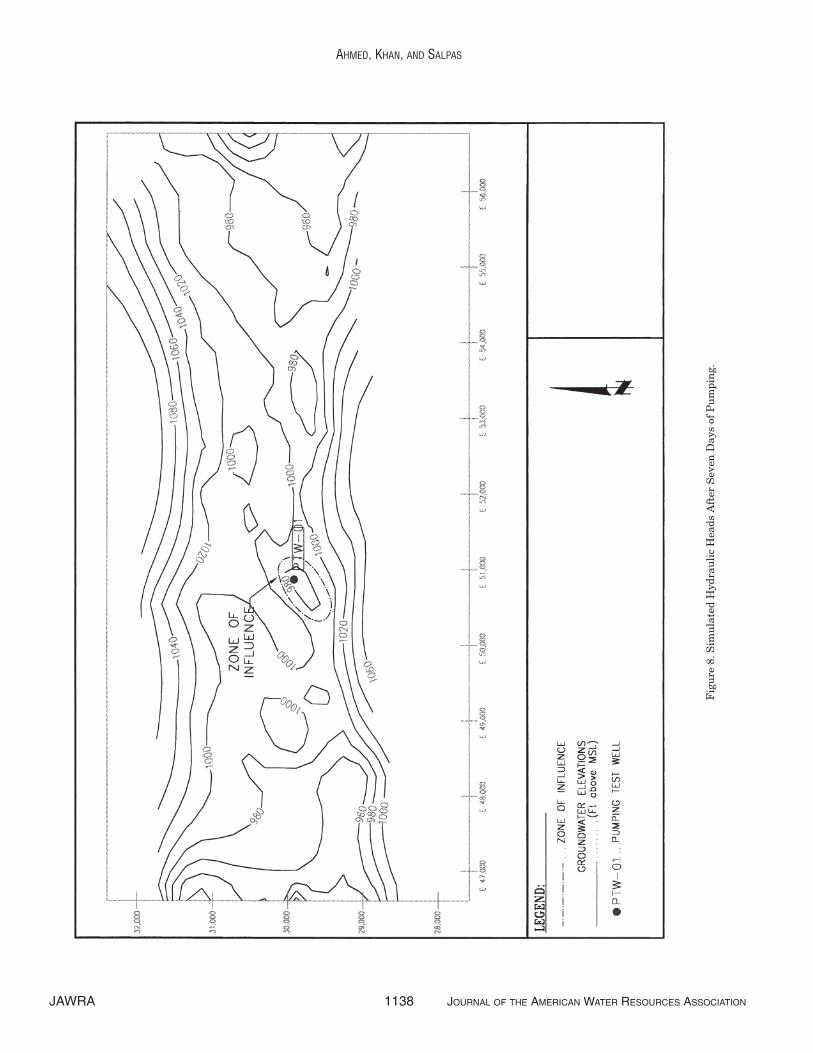
A reasonable match between the observed and com-puted hydraulic heads was obtained for steady stateconditions with an average absolute value of theresidual of 11.25 ft for the wells, mostly in the upperlayer. A comparison of the measured and calibratedhydraulic heads at the pumping well location isshown in Figure 6. Similar variations were seen inthe observation wells within the zone of influence ofthe pumping well. The steady state hydraulic headdistribution in the S-3 area is shown in Figure 7. Aninclined elliptical zone of influence for the inclinedpumping well is obtained from the model simulationresults as shown in Figure 8. The inclined ellipticalshape of the zone of influence is consistent with theangled pumping well and anisotropy of the geologicunit in the domain.
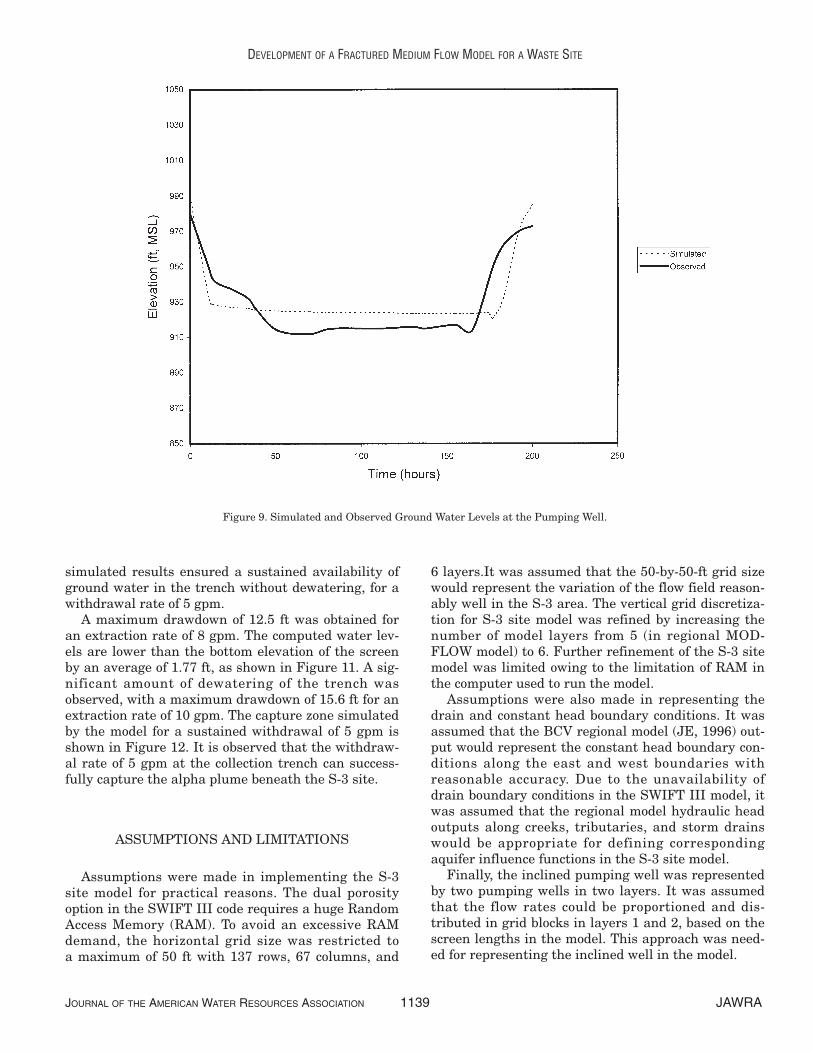
The pumping test ground water levels were com-pared with the simulation results as shown in Figure9. Based on the calibrated hydraulic conductivity val-ues of both fracture and matrix in the NolichuckyShale, a weighted average hydraulic conductivity ofboth matrix and fracture is estimated at 0.01 ft/day.From the reported pumping test transmissivity valuein the Nolichucky Shale, the hydraulic conductivity isestimated at 0.015 ft/day, which is close to the valuedetermined from the model.
The pumping test hydraulic conductivity value forNolichucky Shale formation represents an averagecondition for both matrix and fracture. There wereuncertainties in the pumping test results for a matrixfracture system. The analysis of the pumping testdata and the computation of hydraulic conductivitywere based on the linearized formulation of a nonlin-ear problem (because in reality, transmissivity varieswith the saturated thickness, which is a function ofboth space and time) for an equivalent porous medi-um. The solution for transmissivity from the lin-earized equivalent porous media formulation wasobtained using simplifying assumptions for theaquifer (boundary conditions, aquifer extent, etc.).This was known as the Theis solution. Using thepumping test data in the Theis solution, a transmis-sivity value was computed for the Nolichucky Shale
formation. The transmissivity value obtained fromthe Theis solution was then divided by an averagesaturated thickness to compute an average hydraulicconductivity value. All these imply that the pumpingtest result for the hydraulic conductivity was notexact. So, the weighted average value of 0.01 ft/dobtained from the calibrated values of matrix andfracture hydraulic conductivities was considered to bereasonably close to the hydraulic conductivity valueestimated at 0.015 ft/d from the pumping test data.
TRENCH EVALUATION
A trench was constructed with high conductivitymaterial to allow the drainage of water toward theextraction well. The objective was to capture thealpha plume beneath the S-3 site. It was necessary todetermine a sustained withdrawal rate for propercapturing of the plume. A high withdrawal rate couldcause a high drawdown at the well. If the water levelgoes below the bottom of the trench for a high draw-down in the vicinity of the well, then the contaminat-ed water from the whole plume area will not becaptured. The specific capacity (withdrawal rate perunit drawdown at the well) of the well was taken intoconsideration for a sustained withdrawal without sig-nificant drawdown at the well.
The ground water interception trench is locatedapproximately 500 ft east of the pump test site (Fig-ure 5). The trench is 203.5 ft long, 25 ft deep, and 3 ftwide (Entech 1998). The trench was filled to the bot-tom with backfill material, coarse silica sand, andiron filings. Trench extraction well EW-01 was placedas shown in Figure 5. The S-3 site model was run tosimulate the performance of the trench. The gridblocks in the trench area were assigned a highhydraulic conductivity value. In the dual porosity S-3site model, both matrix and fracture hydraulic con-ductivity values were increased to represent thehydraulic properties of the trench. An equivalentaverage hydraulic conductivity value of 50.7 ft/day isestimated for the trench based on the matrix and frac-ture hydraulic conductivity used in the model.
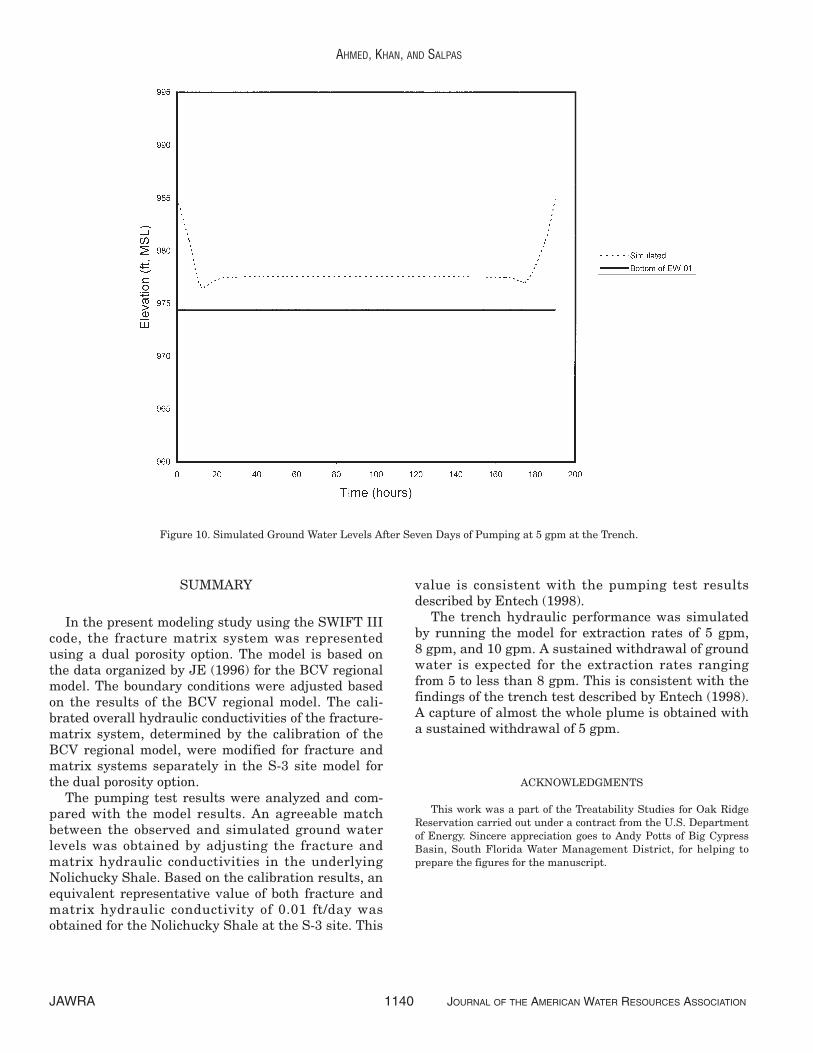
Three extraction rates from the trench, 5 gpm, 8gpm, and 10 gpm, were investigated through theextraction well EW-01. The extraction rates wereapplied in the grid block in layer 1 corresponding tothe location of the trench extraction well EW-01. Themaximum drawdown was 7.8 ft for the extraction rate of 5 gpm. The computed water level correspond-ing to maximum drawdown for 5 gpm is 977.27 ftAMSL, which is above the bottom elevation of thescreen (974.37 ft AMSL), as shown in Figure 10. The
JAWRA 1136 JOURNAL OF THE AMERICAN WATER RESOURCES ASSOCIATION
AHMED, KHAN, AND SALPAS
JOURNAL OF THE AMERICAN WATER RESOURCES ASSOCIATION 1137 JAWRA
DEVELOPMENT OF A FRACTURED MEDIUM FLOW MODEL FOR A WASTE SITE
Fig
ure
7. S
imu
late
d S
tead
y S
tate
Hyd
rau
lic
Hea
ds in
th
e S
-3 S
ite.
JAWRA 1138 JOURNAL OF THE AMERICAN WATER RESOURCES ASSOCIATION
AHMED, KHAN, AND SALPAS
Fig
ure
8. S
imu
late
d H
ydra
uli
c H
eads
Aft
er S
even
Day
s of
Pu
mpi
ng.
simulated results ensured a sustained availability ofground water in the trench without dewatering, for awithdrawal rate of 5 gpm.
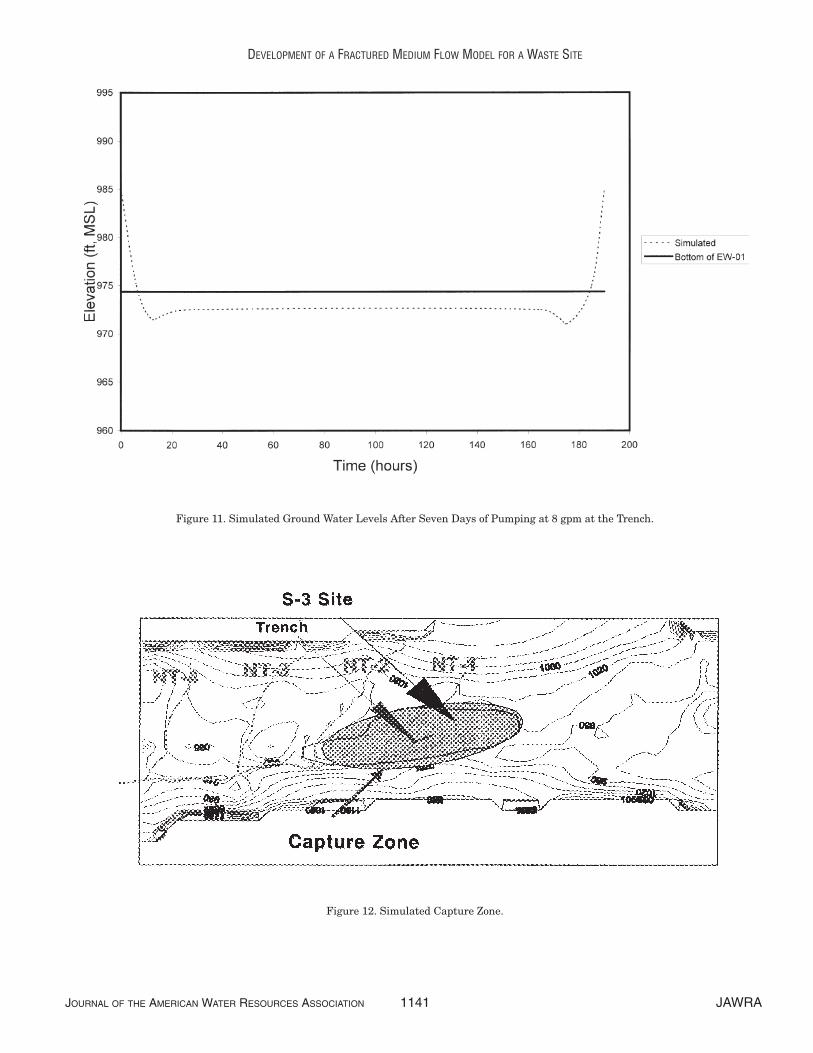
A maximum drawdown of 12.5 ft was obtained foran extraction rate of 8 gpm. The computed water lev-els are lower than the bottom elevation of the screenby an average of 1.77 ft, as shown in Figure 11. A sig-nificant amount of dewatering of the trench wasobserved, with a maximum drawdown of 15.6 ft for anextraction rate of 10 gpm. The capture zone simulatedby the model for a sustained withdrawal of 5 gpm isshown in Figure 12. It is observed that the withdraw-al rate of 5 gpm at the collection trench can success-fully capture the alpha plume beneath the S-3 site.
ASSUMPTIONS AND LIMITATIONS
Assumptions were made in implementing the S-3site model for practical reasons. The dual porosityoption in the SWIFT III code requires a huge RandomAccess Memory (RAM). To avoid an excessive RAMdemand, the horizontal grid size was restricted to a maximum of 50 ft with 137 rows, 67 columns, and
6 layers.It was assumed that the 50-by-50-ft grid sizewould represent the variation of the flow field reason-ably well in the S-3 area. The vertical grid discretiza-tion for S-3 site model was refined by increasing thenumber of model layers from 5 (in regional MOD-FLOW model) to 6. Further refinement of the S-3 sitemodel was limited owing to the limitation of RAM inthe computer used to run the model.
Assumptions were also made in representing thedrain and constant head boundary conditions. It wasassumed that the BCV regional model (JE, 1996) out-put would represent the constant head boundary con-ditions along the east and west boundaries withreasonable accuracy. Due to the unavailability ofdrain boundary conditions in the SWIFT III model, itwas assumed that the regional model hydraulic headoutputs along creeks, tributaries, and storm drainswould be appropriate for defining correspondingaquifer influence functions in the S-3 site model.
Finally, the inclined pumping well was representedby two pumping wells in two layers. It was assumedthat the flow rates could be proportioned and dis-tributed in grid blocks in layers 1 and 2, based on thescreen lengths in the model. This approach was need-ed for representing the inclined well in the model.
JOURNAL OF THE AMERICAN WATER RESOURCES ASSOCIATION 1139 JAWRA
DEVELOPMENT OF A FRACTURED MEDIUM FLOW MODEL FOR A WASTE SITE
Figure 9. Simulated and Observed Ground Water Levels at the Pumping Well.
SUMMARY
In the present modeling study using the SWIFT IIIcode, the fracture matrix system was representedusing a dual porosity option. The model is based onthe data organized by JE (1996) for the BCV regionalmodel. The boundary conditions were adjusted basedon the results of the BCV regional model. The cali-brated overall hydraulic conductivities of the fracture-matrix system, determined by the calibration of theBCV regional model, were modified for fracture andmatrix systems separately in the S-3 site model forthe dual porosity option.
The pumping test results were analyzed and com-pared with the model results. An agreeable matchbetween the observed and simulated ground waterlevels was obtained by adjusting the fracture andmatrix hydraulic conductivities in the underlyingNolichucky Shale. Based on the calibration results, anequivalent representative value of both fracture andmatrix hydraulic conductivity of 0.01 ft/day wasobtained for the Nolichucky Shale at the S-3 site. This
value is consistent with the pumping test resultsdescribed by Entech (1998).
The trench hydraulic performance was simulatedby running the model for extraction rates of 5 gpm, 8 gpm, and 10 gpm. A sustained withdrawal of groundwater is expected for the extraction rates rangingfrom 5 to less than 8 gpm. This is consistent with thefindings of the trench test described by Entech (1998).A capture of almost the whole plume is obtained witha sustained withdrawal of 5 gpm.
ACKNOWLEDGMENTS
This work was a part of the Treatability Studies for Oak RidgeReservation carried out under a contract from the U.S. Departmentof Energy. Sincere appreciation goes to Andy Potts of Big CypressBasin, South Florida Water Management District, for helping toprepare the figures for the manuscript.
JAWRA 1140 JOURNAL OF THE AMERICAN WATER RESOURCES ASSOCIATION
AHMED, KHAN, AND SALPAS
Figure 10. Simulated Ground Water Levels After Seven Days of Pumping at 5 gpm at the Trench.
JOURNAL OF THE AMERICAN WATER RESOURCES ASSOCIATION 1141 JAWRA
DEVELOPMENT OF A FRACTURED MEDIUM FLOW MODEL FOR A WASTE SITE
Figure 11. Simulated Ground Water Levels After Seven Days of Pumping at 8 gpm at the Trench.
Figure 12. Simulated Capture Zone.
LITERATURE CITED
Bailey, Z. C. and R. W. Lee, 1991. Hydrogeology and Geochemistryin Bear Creek and Union Valleys Near Oak Ridge, Tennessee.USGS WRIR 90-4008, Oak Ridge, Tennessee.
Entech, Inc., 1998. Bear Creek Valley (BCV) Treatability StudyPhase II, Hydraulic Performance Testing (draft).
Finley, N. C. and M. Reeves, 1982. SWIFT Self-Teaching Curricu-lum Illustrative Problems to Supplement the User’s manual forthe Sandia Waste-Isolation Flow and Transport MODEL(SWIFT). Sandia National Laboratories, Albuquerque, NewMexico.
Geraghty and Miller Inc., 1989. Development of a Ground-WaterFlow Model for the S-3 Waste Management Area, Y-12 Plant,Oak Ridge, Tennessee.
Geraghty and Miller Inc., 1997. ModelCAD for WindowsTM User’sGuide. Developed by HydroTrak, Inc.
Goldstrand, P. M., L. S. Menefee, and R. B. Dreier, 1995. PorosityDevelopment in the Copper Ridge Dolomite and MaynardvilleLimestone, BCV and Chestnut Ridge, Tennessee. Prepared forthe Environmental Management Department, Health, Safety,Environment, and Accountability Organization. Oak Ridge Y-12Plant. Oak Ridge, Tennessee.
JE (Jacobs Engineering), 1996. Appendix F: Regional Ground-Water Flow Model Construction and Calibration. Bear CreekValley Feasibility Study. Oak Ridge Y-12 Plant, Oak Ridge, Ten-nessee.
Jones, T. L., L. E. Toran, D. B. Watson, 1996. Variable-Density Flowand Transport Modeling to Evaluate Anomalous Nitrate Con-centrations and Pressures in GW-134. Environmental SciencesDivision, Oak Ridge National Laboratories. ORNL/GWPO-0024.
McDonald, M. G. and A. W. Harbaugh, 1988. Techniques of Water-Resources Investigations of the United States Geological Survey.Chapter A1: A Modular Three-Dimensional Finite-DifferenceGround-Water Flow Model. Open File Report 83-875.
Pollock, D. W., 1989. Documentation of Computer Programs toCompute and Display Pathlines Using Results from the U.S.geological Survey Modular Three-Dimensional Finite-DifferenceGround-Water Flow Model. U.S. Geological Survey Open-FileReport 89-622, 49 pp.
Reeves, M., D. S. Ward, and N. D. Johns, 1986. Theory and Imple-mentation for SWIFT II. The Sandia Waste-Isolation Flow andTransport Model for Fractured Media. Release 4.84, SandiaNational Laboratories. Albuquerque, New Mexico.
SAIC (Science Applications International Corporation), 1996. ALetter Report on the Modeling Tasks for the Bear Creek Valleyat the Oak Ridge Y-12 Plant, Oak Ridge, Tennessee.
SAIC (Science Applications International Corporation), 1997.Report on the Remedial Investigation at the Oak Ridge Y-12Plant, Oak Ridge, Tennessee. DOE/OR/01-1455/v2&d2.
SAIC (Science Applications International Corporation), 1998.Report on the Remedial Investigation of the Upper EFPC Char-acterization Area at the Oak Ridge Y-12 Plant, Oak Ridge, Ten-nessee. Prepared for U.S. Department of Energy under contractDE-AC05-98OR 22700.
JAWRA 1142 JOURNAL OF THE AMERICAN WATER RESOURCES ASSOCIATION
AHMED, KHAN, AND SALPAS


![Characterization of Natural Vuggy Fractured Porous Medium ... · movement which impact reservoir characterization, and ultimately, production performance and total recovery [4]. Naturally](https://img.pdfslide.us/doc/110x75/5f169d8344dd477bcf4379c9/characterization-of-natural-vuggy-fractured-porous-medium-movement-which-impact.jpg)