Embed Size (px)
Citation preview

Development of a FBG based distributed strain sensor system for wind turbine structural
health monitoring
This content has been downloaded from IOPscience. Please scroll down to see the full text.
Download details:
IP Address: 132.170.219.53
This content was downloaded on 01/10/2013 at 11:57
Please note that terms and conditions apply.
2013 Smart Mater. Struct. 22 075027
(http://iopscience.iop.org/0964-1726/22/7/075027)
View the table of contents for this issue, or go to the journal homepage for more
Home Search Collections Journals About Contact us My IOPscience

IOP PUBLISHING SMART MATERIALS AND STRUCTURES
Smart Mater. Struct. 22 (2013) 075027 (11pp) doi:10.1088/0964-1726/22/7/075027
Development of a FBG based distributedstrain sensor system for wind turbinestructural health monitoring
Tyler J Arsenault1, Ajit Achuthan1, Pier Marzocca1,Chiara Grappasonni2 and Giuliano Coppotelli2
1 Mechanical and Aeronautical Engineering Department, Clarkson University, 8 Clarkson Avenue,Box 5725, Potsdam, NY 13699, USA2 Dipartimento di Ingegneria Meccanica e Aerospaziale, Universita’ di Roma ‘La Sapienza’,Via Eudossiana, 18, I-00184 Roma, Italy
E-mail: [email protected]
Received 9 February 2013, in final form 21 April 2013Published 14 June 2013Online at stacks.iop.org/SMS/22/075027
AbstractThe development of a fiber Bragg grating (FBG) based distributed strain sensor system for realtime structural health monitoring of a wind turbine rotor and its validation under a laboratoryscale test setup is discussed in this paper. A 1 kW, 1.6 m diameter rotor, horizontal axis windturbine with three instrumented blades is used in this study. The sensor system consists ofstrain sensors, surface mounted at various locations on the blade. At first the sensors arecalibrated under static loading conditions to validate the FBG mounting and the proposed datacollection techniques. Then, the capability of the sensor system coupled with the operationalmodal analysis (OMA) methods to capture natural frequencies and corresponding modeshapes in terms of distributed strains are validated under various non-rotating dynamic loadingconditions. Finally, the sensor system is tested under rotating conditions using the wind flowfrom an open-jet wind tunnel, for both a baseline wind turbine and a wind turbine with astructurally modified blade. The blade was modified by attaching a lumped mass at the bladetip simulating structural damage or ice accretion. The dynamic characteristics of the baseline(healthy) blade and modified (altered) blade are compared to validate the sensor system’sability for real time structural health monitoring of the rotor.
(Some figures may appear in colour only in the online journal)
1. Introduction
Structural health monitoring (SHM) systems are expected toplay a major role in the development of large wind turbineswith higher efficiency and lower cost-of-energy (COE) [1].Those turbines are usually subjected to severe operationalloads requiring stringent safety measures and more frequentmaintenance. It is quite difficult and costly to performinspection and maintenance work on these large turbines,primarily due to their height and often due to the limitationsassociated with the remoteness of the installation locations,such as in offshore wind farms. Clearly, obtaining precise andreal time information on the system performance using SHM
systems can be invaluable for improving safety, loweringthe frequency of sudden breakdowns and more importantly,for moving away from a costly schedule based maintenancetoward a cost-effective condition based maintenance, allfactors leading to significant reduction in the operational costof wind turbines [2, 3]. On the other hand, the capabilitiesto monitor the performance and health of the structuremay relax some of the overly conservative safety margins,leading to lighter and/or larger blades to further improve theirefficiencies [4, 5].
A SHM system using a distributed FBG sensor networkhas many advantages over a conventional resistive straingauge type system, especially in large outdoor structural
10964-1726/13/075027+11$33.00 c© 2013 IOP Publishing Ltd Printed in the UK & the USA
Smart Mater. Struct. 22 (2013) 075027 T J Arsenault et al
applications such as wind turbines. The signal to noise ratiois significantly higher for FBGs and the signal transmittancedistance is greater than traditional resistive sensors, reducingthe need for localized signal amplification and signalconditioning [1]. The very low electrical conductivity ofthe optic fibers make it safer against lightning, which isan important feature required for these systems from theindustrial perspective [6]. FBGs being etched on the fiber,any changes in structural properties due to FBG mountingis minimal and can be ignored [7]. In addition, the responseof the FBG to strain and temperature has a wide linearrange, making the calibration a simple step. Another majoradvantage of the FBG array system is their ability to be used ina wavelength division multiplexed (WDM) mode, where eachFBG in a fiber has its own characteristic wavelength rangethat is different from others in the same fiber, allowing foreasy identification of the FBG corresponding to a particularsignal [7]. This scheme of sensing can accommodate alarge number of sensors on the same fiber per channelof an interrogator, limited only by the specifications ofthe FBG interrogator [8]. The development of FBG baseddistributed strain sensor systems has been studied for variousapplications. For example, a distributed FBG strain sensorsystem was successfully used to detect transverse crackevolution and impact damage in a composite structure [9].
The development of wind turbine SHM using FBG strainsensors has been recently receiving wide attention due tothe increasing interest in renewable energy. Zhang et alreported the static testing of a small, 300 W turbine bladeinstrumented with FBG strain transducers. The experimentalresults were found to be in good agreement with theFEM results [10]. FBG based distributed strain sensorsystems have also been used in a laboratory bench testof a wind turbine blade manufactured of a foam coreand fiber reinforced face sheets, to determine the loadingdirection, location and magnitude of the imposed loads [11].Similarly, FBGs and strain gauges have been successfullyused to determine the natural frequencies and mode shapesin terms of distributed strain of a turbine blade clampedat the root [12]. In addition to surface mounted FBGs,studies on determining the capabilities of embedded FBGsas strain sensors have also been reported. For example,Bang et al measured the residual strains developed duringthe composite manufacturing processes, natural frequenciesand mode shapes in terms of distributed strain from bladetesting. The results were verified using finite element analysisand conventional accelerometer measurements [13]. Thedevelopment of a real time blade monitoring system using afiber-optic rotary joint (FORJ) to monitor the blades of a small600 W turbine has also been reported [14].
All these recent studies reported in the literature showsignificant promise of FBG distributed strain sensor systemsfor wind turbine SHM applications. However, the successfulimplementation of this technology in the field requiresaddressing further challenges, including real time collectionand interpretation of the data under rotating conditions.
In the present paper, the development of a FBG baseddistributed sensor system for SHM of a horizontal axis wind
turbine blade is reported. Various experiments were conductedon a 1.6 m laboratory scale wind turbine instrumentedwith surface mounted sensors and other associated hardwareto characterize the FBG sensor system and to investigateits effectiveness for real time turbine structural health andload monitoring. The experiments include testing a singleinstrumented blade under non-rotating conditions, and athree-bladed turbine under rotating conditions. A turbine witha damaged blade under rotating condition was simulatedby attaching a lumped mass at the blade. Some earlydevelopments of the study, mainly the basic experimentalsetup and some preliminary results, especially on the dynamicbench loading tests, have been reported [18, 19]. In thepresent paper the focus is mainly on the analysis of straininformation under the rotating turbine condition and themodified blade condition. The rest of the paper is organized asfollows. The methodology adopted in this study is discussedin section 2. The principle of FBG strain sensing is brieflydiscussed, followed by a discussion on the experimental setupand frequency domain decomposition (FDD) technique. Theresults are discussed in section 3 and the conclusions from thestudy are reported in section 4.
2. Methodology
The ability of a distributed FBG strain sensor system toaccurately measure static and dynamic strains is evaluated bycharacterizing the system under various loading conditions.First, the sensor system mounted on each blade of the windturbine rotor is tested under static loading conditions in orderto determine the consistency in strain measurements. Thiswas followed by the characterization under dynamic loading,where an instrumented single blade was subjected to variousvibrational loads. Apart from evaluating the FBG strain sensorsystem’s ability to detect natural frequencies and mode shapesin terms of the distributed strain of the blades, this informationwas used as a baseline data for the characterization of the rotorunder operational loading conditions. The modal parameterswere estimated using two operational modal analysis (OMA)methods, namely the frequency domain decomposition (FDD)method [15] and the Hilbert transform method (HTM) [16].The static and vibration (dynamic, but not rotating) benchtests were followed by rotating dynamic experiments underoperational conditions using wind flow from a wind tunnelsetup. The wind tunnel test facility allows the rotation ofthe blades at different angular speeds in order to achievedifferent operating conditions of the rotating structure aswell as different upstream wind velocities, which in turncorrespond to different angle-of-attack sweep and bladeloading conditions. Two sets of blade conditions were usedduring these tests. For the baseline experiment, a windturbine with three instrumented blades was operated under theairflow from the wind tunnel. The second set of experimentsconsisted of the addition of a lumped mass to the tip of oneof the three blades, simulating a damaged blade. Both thewind tunnel experiments were run for the same set of flowvelocities, and electrical loads, as detailed in tables 1 and 2.
2

Smart Mater. Struct. 22 (2013) 075027 T J Arsenault et al
Table 1. Baseline rotor operational conditions.
CaseVelocity(m s−1) Current (A) Voltage (V)
Rotor speed(ωR) (Hz)
1 5.2 0.29 24.6 7.322 6.1 0.29 30.6 5.953 7.0 0.29 36.1 8.574 5.2 1.00 22.4 5.505 6.1 1.00 28.5 6.976 7.0 1.00 37.8 8.267 5.2 2.00 18.4 4.788 6.1 2.00 25.6 6.409 7.0 2.00 31.6 7.79
Table 2. Modified rotor (35 g added to one blade) operationalconditions.
CaseVelocity(m s−1) Current (A) Voltage (V)
Rotor speed(ωR) (Hz)
1 5.2 0.29 23.8 5.732 6.1 0.29 28.7 6.903 7.0 0.29 33.5 7.904 5.2 1.00 20.3 5.075 6.1 1.00 26.1 6.406 7.0 1.00 31.2 7.527 5.2 2.00 16.2 4.288 6.1 2.00 22.8 5.789 7.0 2.00 28.3 7.02
Natural frequencies and mode shapes in terms of strains wereestimated with the FDD approach from the strain data.
Identification of the changes in modal characteristics dueto structural damage progression is of utmost importance forthe successful implementation of a SHM system based onoperational modal analysis (OMA). It is important to notethat the addition of a lumped mass to one of the bladesrepresents a sudden change in the dynamic properties of theblade, quite different from the progressive damage failure thatis usually of interest in standard SHM applications. However,this simple approach adopted in the present study is adequateto demonstrate the capability of a FBG based strain sensornetwork to identify changes in modal parameters, which isthe most critical step for progressive damage detection. Inaddition, sudden changes in the blade and turbine dynamicscan be significant important events in practice, as in icebuild-up on blades or incidents of catastrophic structuralfailure, such as damage due to lightning strikes, where strainsensor information is very useful for post-failure analysis.
A brief description of the fundamentals of FBG strainsensors, details of the experiments and the key aspects of theFDD method are discussed in the following subsections. Sinceboth the OMA methods, namely FDD and HTM, providedvirtually identical results, only the FDD method is discussedin detail. The details of the HTM can be found elsewhere [16].
2.1. Fiber Bragg grating principles of operation
The principle of FBG sensors is briefly discussed in thissection. The FBGs are made by etching the optic fiber,resulting in a change in the refractive index at these locations
Figure 1. Schematic representation of the FBG working principle.
compared to the remaining silica glass fiber [8]. Controlledetching produces the desired geometric pattern and hence thedesired refractive index for individual gratings. Depending onits refractive index, each grating will act as a filter for specificwavelengths, as given below (figure 1).
λB = 2ne3 (1)
where λB is the characteristic wavelength, ne is the effectiverefractive index of fiber core and 3 is the grating period. Thewavelength, λB, filtered by the FBG, is also reflected backtoward the light source.
The host structure, when deformed under variousloadings, induces strain in the FBG and changes in thegrating period. The change in grating period changes thecharacteristic wavelength. This change in wavelength can becorrelated with the strain and temperature effects as
1λB = λB[(αf − ξf)1T + (1− pe)ε] (2)
where αf is the coefficient of thermal expansion, ξf is thethermo-optic coefficient,1T is the change in temperature andε is the strain. The strain-optic coefficient of the optical fiberpe is given as
pe =
(n2
e
2
)[p12 − ν(p11 + p12)] (3)
where p11 and p12 are the components of the strain-optictensor, and ν is Poisson’s ratio. Generally, germano-silicateglass has a strain-optic coefficient pe = 0.22 [17]. During ourexperiment there was no notable change in temperature, thusthe change of temperature term (1T) can be assumed to bezero. Then the strain can be written as
ε =1
1− pe
1λB
λB. (4)
2.2. Experimental setup
A laboratory scale experimental setup to collect strain datafrom a wind turbine rotor while in operation was developed.A 1 kW horizontal axis wind turbine with a 1.6 m in rotordiameter was used for this study. The turbine consists ofthree twisted and tapered blades with fixed pitch, 0.76 min length and with a mass of 1.515 kg. The blades aremolded of a short glass fiber reinforced resin. This turbine
3

Smart Mater. Struct. 22 (2013) 075027 T J Arsenault et al
Figure 2. Static blade test experimental setup.
was chosen for its low cost, simplicity of operation, and scale.The scale of the turbine allows usage in the open-jet windtunnel facility, and the 0.76 m blade length allows simpleand rapid instrumentation. The low cost involved with theacquisition of the turbine allowed multiple design iterationsof the strain sensing systems as experiments developed fromthe static, to the dynamic bench, and to the final wind tunnelexperiments. The FBGs are mounted onto the blade surfaceusing 3M Dp-460 ns high strength epoxy resin. Further detailsof the FBG sensors and data acquisition methods used in thisstudy can be found elsewhere [18, 19].
2.2.1. Single-blade static bench tests. In order to validatethe implementation of the FBG as a strain transducer on thewind turbine blades, a static loading test was performed onthe three instrumented blades. Five FBGs were mounted oneach blade at various locations, one very close to the root,and the rest 0.15, 0.3, 0.45 and 0.6 m from the root. Thestatic test was performed by clamping the root of the bladerigidly on a laboratory bench and applying a suspended massat the tip of the blade, as pictured in figure 2. The FBG strainmeasurements were recorded for four different values for thesuspended mass. For each case of mass addition, the bladewas allowed to reach steady state, after which data recordingfrom the FBG was conducted at 625 Hz for 50 s. This testwas performed on all the three blades of the wind turbinerotor used in this study. Comparing strain data measured fromidentical locations on the three blades will aid in determiningconsistency between FBG’s and inferences about the qualityof the surface mounting techniques.
2.2.2. Single-blade dynamic bench test. Dynamic testingcomprised of two forms of excitation, a white noise inputforce using a signal from a function generator amplifiedto power a BK precision shaker and arbitrary excitationby means of finger tapping. For each of these cases weused various methods to analyze the data and validate theFBG measurements. During the shaker loading experiments,the stinger of the shaker was attached to the leading edge,approximately one third of the total blade length from the
Figure 3. Dynamic bench test setup.
root (figure 3). The effect of coupling between the shakerand the blade on the dynamic characteristics is secondary andexpected to be very small because of the stinger design thatminimizes the insertion error. The root of the blade was fixedto the factory supplied hub. The mock shaft holding the hubis held with a lathe chuck, which is clamped to the bench.Four FBGs, one each at locations 15.24, 30.48, 45.72 and60.96 cm from the root were sampled during the dynamicbench experiments.
2.2.3. Turbine dynamic tests. Information on the dynamiccharacteristics of the whole turbine, consisting of the rotorand the tower, is important to provide insight into the couplingbetween the natural frequencies of blades/rotor and the towerassembly. To determine the dynamic characteristic the wholeturbine was subjected to arbitrary excitation with the towerbolted to the floor and the rotors locked to prevent theirrotation. Special care was given not to restrict any otherdegrees of freedom of the motion of the whole turbineassembly. The tower supporting the wind turbine generatorand rotor assembly was instrumented with accelerometers tocollect dynamic data. Accelerometers were placed at threelocations on the tower; (1) parallel to the axis of rotation belowthe center of the axis of rotation on the generator, (2) normalto the axis of rotation while parallel to the floor surface on thegenerator, and (3) parallel to the axis of rotation at half thetotal height of the tower assembly.
2.2.4. Operational wind turbine tests. For the operationalwind turbine experiments, a wind turbine was formed byassembling the same three blades instrumented with a networkof surface mounted FBG sensors used for static and dynamicbench experiments. As discussed above, each blade has asingle fiber running from the root to the tip. Four FBGswere used on each blade, mounted at the same locations asin the single-blade dynamic bench experiment. The fiberswere connected to the ports of a fiber-optic interrogator that
4

Smart Mater. Struct. 22 (2013) 075027 T J Arsenault et al
Figure 4. Instrumented hub of wind turbine. (a) Front of wind turbine hub. (b) Side of wind turbine hub.
Figure 5. FBG instrumented rotor distribution.
was mounted in the hub of the wind turbine (figure 4).The locations of the FBG sensors and their configurationare shown in figure 5. A patch-cord section was used tosupport the segment of fiber that connects the blade to theinterrogator. The patch cord was glued to the root of theblade to provide strain relief to the fiber during installationand operation. The fiber-optic interrogator (SmartScan FBGinterrogator by Smart Fibers) mounted in the hub convertedoptical signals to electrical signals, and temporarily storedthe data. The stored data was then wirelessly transmitted toa ground station using a wireless network system includingantennas housed in the hub (figure 4). Supplying power to theinstruments in the rotating hub of the rotor was accomplishedby a 22VDC, 1 A power supply. The power supply wasconnected to slip rings to enable power to be transferred fromthe non-rotating power supply to the rotating hub. Since thequality of power from the slip rings was insufficient to power
the instruments in the hub, a set of two rechargeable 7.2 V,750 mAh battery packs were installed in the hub as a bufferfor power from the slip rings. The batteries were mountedsymmetrically with an appropriate offset, thereby balancingany effect due to their weight on the rotation. The electricalbus in the hub was maintained at a stable 17 V duringoperation. Standard wireless networking hardware commonlyused in residential applications was modified to fit into thehub of the rotor. The 12 V at 1 A power required by thewireless networking hardware was supplied by regulating the17 V bus down to 12 V. All the hardware housed in the hubwas securely mounted considering the high rotational speed(up to 500 rpm). The interrogator unit was secured tightlyonto an aluminum cage which was mounted directly to thewind turbine hub. Set screws in the plates of the interrogatorcage held the unit in place while the turbine is operational.The wireless hardware was mounted outside of the aluminumstructural cage that holds the FBG interrogator.
For the non-rotating case the turbine was placed with thetower bolted to the floor in its operational configuration andthe rotor locked with a pin connecting the generator housingto the rotor’s hub to prevent rotation without restricting anyother degrees of freedom. The entire wind turbine system wassubjected to arbitrary excitation by means of finger tappingwhich may be considered random in time and space. Thetower was instrumented with accelerometers in three mutuallyperpendicular directions, with one parallel to the rotor.
The exhaust flow from an open-jet wind tunnel wasused to power the wind turbine (figure 6). To improve thequality of the flow from the wind tunnel exhaust, an aluminumhoneycomb structure, 0.1 m in thickness, was placed behindthe wind tunnel exhaust at a distance of 2.6 m from it,directing the flow uniformly into the wind turbine rotor. Theraw AC output of the generator was rectified to a directcurrent. After rectification, a BK Precision 8522 electronicload was used to dissipate power from the turbine in acontrolled fashion, thereby allowing variability of the load onthe wind turbine rotor as needed. To study the effect of flowon the dynamic characteristics, three different flow velocities(5.2, 6.1, 7.0 m s−1) were considered. For each of thesedifferent velocities three different electronic loads were alsoapplied by imposing appropriate constant current draws (0.29,1.00, 2.00 A). For each of the constant current draws, the
5

Smart Mater. Struct. 22 (2013) 075027 T J Arsenault et al
Figure 6. Wind tunnel setup.
voltage was allowed to stabilize to a stationary level, whereit was recorded. The details of voltage and current draws aresummarized in tables 1 and 2. The rotational speeds collectedusing the hub mounted Hall-effect sensor are also provided.To simulate damage on the blade a lumped mass of 35 g wasattached near the tip of one blade, as pictured in figure 7.
2.3. Frequency domain decomposition (FDD)
The strain data from the single-blade dynamic bench testand the operational wind turbine experiments were analyzedusing the frequency domain decomposition (FDD) technique,which is briefly discussed in this section. The results obtainedfrom the FDD technique were also verified with the Hilberttransform method (HTM) for further validation and werefound to be in excellent agreement [16].
From the measurements of output responses, yi, i =1, 2, . . . ,No, (No being the number of measurement points)over Nt time samples, the output spectral density functionmatrix, Gyy(ωk) ∈ C No×No , k = 1, . . . ,Nt/2 can be built byevaluating the spectral density functions, Gyiyj(ωk), definedbetween the ith and jth output responses, at the kth spectralline, as:
Gyy (ωk) =
Gy1y1(ωk) · · · Gy1yNo
(ωk)
.... . .
...
GyNo y1(ωk) · · · GyNo yNo(ωk)
. (5)
Because such a response spectral matrix is Hermitian,G∗yiyj
(ωk) = Gyjyi(ωk), with real positive diagonal elements,the singular value decomposition of the output spectraldensity matrix, for each of the kth available spectral lines,could be written as [20]:
Gyy(ωk) = Uk(ωk)Σk(ωk)UHk (ωk) (6)
in which Uk(ωk) ∈ C No×No is the matrix of left singularvectors and Σk(ωk) ∈ R+(No×No) is the diagonal matrix ofsingular values. If the excitation is a broadband white noise,the output spectral density matrix can be expressed in terms
Figure 7. Detailed view of the mass added to blade.
of the modal components as [15]:
Gyy(ωk) =
Nm∑i=1
(ψ(i)ϕ̄(i)T
jωk − λi+ψ(i)∗ϕ̄(i)H
jωk − λ∗i
+ϕ̄(i)ψ(i)T
−jωk − λi+ϕ̄(i)∗ψ(i)H
−jωk − λ∗i
)(7)
with Nm being the number of modes. ϕ̄(i) takes into accountthe contribution of the input excitation to the ith participationfactor and, finally, ψ(i) and λi are the ith eigenvector and pole,respectively. Under the hypothesis that the structure behavesas a single degree of freedom system around the peak ofresonance, ωn, the rank of Gyy(ωk) tends to one as the currentfrequency ωk approaches one of the natural frequencies ofthe structure, ωn. By comparing equations (7) and (6) whenωk = ωn, a good estimate of the mode shapes in terms ofdistributed strain can be achieved from the singular vectorcorresponding to the only non-zero singular value.
3. Results and discussion
3.1. Single-blade static bench test
The measured strain against applied tip load is shown infigure 8. The results are presented for three different locationson the blade, namely at 0, 0.15 and 0.45 m distancesfrom the root and all located in the flap-wise direction. Ineach of these cases, the measured strain shows very goodagreement between the blades, verifying consistency betweenthe different FBG sensors, sensor mounting techniques anddata collection methods. Results from the other locations onthe blade (not shown here) also showed excellent agreementbetween blades, demonstrating the potential of FBGs for useas strain sensors.
3.2. Single-blade dynamic bench test
Using the FDD approach, the dynamic behavior of a singleblade is examined. The power spectra of the measured strain
6

Smart Mater. Struct. 22 (2013) 075027 T J Arsenault et al
Figure 8. Static loading experiment comparison result.
Figure 9. Dynamic bench test power spectra.
from finger tapping is shown in figure 9, which showsvery good agreement between the FBG sensors. The naturalfrequencies obtained from the peaks of the power spectraare shown in the table 3 both for the white noise excitationusing the shaker and finger tapping. The obtained naturalfrequencies from both these excitations agree very well,with natural frequencies from finger tapping showing slightlyhigher values. In both these cases, 217 sampling points, ata sampling frequency of 1250 Hz were used. The energycorresponding to each mode of vibration decreases withincreasing frequency, as expected. The fourth peak with afrequency of 110.34 Hz shows relatively low energy. It isimportant to note that all the FBGs were mounted in the spanwise direction and hence the estimated eigenvectors in termsof strain and the corresponding natural frequencies from themeasured data represent those vibrational modes that have acomponent of strain in the axial direction.
The small difference in results between the finger tappingand white noise excitation could be due to the slight differencein the boundary conditions. When compared to the fingertapping configuration, the white noise excitation configuration
Table 3. Dynamic bench test results.
Mode # f noisen (Hz) f tapping
n (Hz)
1 8.09 9.572 26.58 26.823 44.99 45.334 110.34 111.025 123.81 124.56
where the stinger of the shaker is in contact with the bladeintroduces a small coupling between the shaker system andthe blade. In addition, the ideal condition for the OMAimplementation is a multiple-input multiple-output test setupwith uncorrelated random noise excitation in time and space.Hence only the natural frequencies captured from the fingertapping excitation were considered for further investigation.
The structural mode strain correlation vectors in termsof strain values are shown in figure 10. Each mode shape interms of strain is normalized with the maximum strain valuecorresponding to that mode. The identified first mode showsthe same sign for the strain values at all the four locations,with the largest strain corresponding to the FBG closer to theroot, as expected (figure 10). Hence, the identified first modecould be the first bending mode of the blade. Similarly, theidentified second and third modes were characterized by thepresence of one and two nodes, respectively, as expected insecond and third bending modes. These characteristics of allthe three modes are present in both the white noise excitationand the finger tapping cases. It is important to note thatidentifying higher modes accurately is difficult in the contextof our laboratory scale study due to the limited numberof FBGs per blade (five per blade). Also, it is importantto note that the measured quantities are strains, rather thandisplacements, and determining even the lower mode shapesin terms of displacement from the strain data is not a trivialtask due to the complex blade geometry.
3.3. Turbine dynamic test
The data collected from the wind turbine tower accelerometermounted on the tower–generator assembly under arbitraryexcitation was analyzed to decouple tower–rotor coupledstructural modes. A power spectrum from the strain measuredon a generator parallel to the plane of the rotor and the flooris shown figure 11. The natural frequencies obtained from thepower spectra are provided in table 4. By comparing thesenatural frequencies to that of the blade natural frequenciesobtained from the single-blade dynamic bench test we canidentify that the frequencies 9.38 and 26.85 Hz are due to therotor–tower coupling and the remaining frequencies are thenatural frequencies of the whole turbine, referred to as towerfrequencies hereafter.
3.4. Operational wind turbine tests
The strain measured from a wind turbine with healthy bladesand a wind turbine with one of the blades having a mass
7

Smart Mater. Struct. 22 (2013) 075027 T J Arsenault et al
Figure 10. Comparison between eigenvectors from dynamic bench testing. (a) White noise excitation-shaker coupled. (b) Finger tappingexcitation.
Figure 11. PSD of the tower–generator when subject to arbitraryexcitation and no rotation, measured on a generator parallel to theplane of rotor and the floor.
attached to its tip simulating damage (referred to as baselinewind turbine and modified wind turbine, respectively), underoperational conditions is reported in this subsection. Theoperational conditions were simulated using air flow from awind tunnel.
3.4.1. Baseline wind turbine test. The strain data collectedfrom the operational wind turbine experiments providesinsight into the dynamic characteristics of the wind turbinewhile subject to operational conditions. The dynamic natureof the data collected from the operational experiment lendsitself to comparison with the single-blade dynamic bench testand the turbine dynamic test, as the blades used in all thesetests were the same, and the data collection and analysismethodology adopted were nearly identical.
A typical data set collected during one of the wind tunnelexperiments is presented in figure 12. A snapshot of thetime series and the power spectral density is provided. Infigure 12 the red squares denote rotational harmonics due tothe rotational frequency and the blue circles denote naturalfrequencies. The specific natural frequencies are presented intable 6.
Table 4. Wind turbine dynamic test—tower/rotor coupling.
Mode #Singleblade (Hz) Tower (Hz) Coupling
1 — 5.2 Tower2 9.57 9.38 Tower/rotor3 — 12.89 Tower4 26.82 26.85 Tower/rotor5 — 29.46 Tower6 — 39.99 Tower7 44.99 — Blade8 — 79.39 Tower9 — 103.34 Tower
10 111.02 — Blade11 124.56 — Blade
The first mode of the single-blade dynamic test (9.57 Hz)is 0.54 Hz higher than the first mode of the baselineoperational experiment (table 6). However, as presented infigure 11, there is a natural frequency (9.38 Hz) occurringin the output power spectra of the turbine dynamic test,which is approximately equal to the natural frequency ofthe blade found during the single-blade dynamic benchexperiment. Due to the similarity of natural frequenciesbetween the single-blade dynamic bench test and the baselineoperational wind turbine test, it is concluded that the firstmode found from the operational experiment is a rotormode and not a tower mode. That is, the 9.38 Hz modefound in the tower is due to the vibration transmitted fromthe rotor into the tower–generator structure baseline. Thesecond mode of the single-blade dynamic bench experimentis 0.38 Hz higher than the third baseline operationalnatural frequency (26.44 Hz). This natural frequency alsoappears as a natural frequency (26.85 Hz) in the outputPSD of the tower–generator accelerometer measurementduring a non-rotating test (figure 11). The similarity ofnatural frequencies between the FBG measured third rotormode (26.83 Hz) and the 26.85 Hz natural frequencyin the tower–generator output PSD suggests that there istransmittance of the mode between the tower and rotor. Hence,this natural frequency can also be considered transmittance ofrotor vibration to the tower–generator structure.
8

Smart Mater. Struct. 22 (2013) 075027 T J Arsenault et al
Figure 12. Typical data from wind tunnel test. (a) Reference rotor PSD (squares = n/rev, circles = modes). (b) Normal rotor time series.
Table 5. Comparison of natural frequencies measured underoperational conditions with blade dynamic bench test (gray rowsdenote tower modes).
The third mode from the single-blade dynamic benchexperiment (45.33 Hz) is less precisely matched with anatural frequency found in the baseline operational test,falling between the fifth and sixth natural frequencies,42.86 Hz and 50.13 Hz, respectively. The output PSD ofthe tower–generator for the non-rotating case possesses anatural frequency of 50 Hz, but there was no significantnatural frequency around the 42.86 Hz frequency. Hence, itcan be concluded that the fifth natural frequency obtained inthe baseline operational test is the natural frequency of therotor, while the sixth natural frequency is a tower–generatormode as captured as the 50 Hz in the turbine dynamictest. The discrepancy between the fifth mode from theoperational conditions and the 45.33 Hz mode (table 3) isattributed to the difference in boundary conditions betweenthe two experiments and the complexity of the system in theoperational wind turbine experiment.
The mode from the dynamic bench experiment occurringat approximately 110 Hz is not included in table 5 becauseit was not consistently captured in the baseline operationalwind turbine experimental results. In addition, the energyassociated with this frequency was very small in thesingle-blade PSD. The second and fourth operationally foundnatural frequencies were determined to be rotor modesbecause they were not present in the power spectra of thetower mounted accelerometer data. These natural frequenciesexist in the baseline operational wind turbine test, but not inthe single-blade dynamic bench test. This could be attributed
Table 6. Natural frequencies of baseline and mass-added bladesobtained under operational conditions, with a rotational speed of4.4 ± 0.4 Hz.
to the complex dynamics involved in a full turbine systemcompared to single-blade dynamic bench test.
The overall agreement between the natural frequenciesobtained from the single-blade dynamic bench test andthe baseline operational test demonstrates that the FBGstrain sensing system is capable of detecting the dynamiccharacteristics under operational conditions, and hence has thepotential to be used as a real time health monitoring tool forwind turbines.
3.4.2. Modified blade configuration. The natural frequenciesobtained for the modified blade configuration is compared tothat of the baseline case in table 6. To minimize the differencesdue to n/rev-structural coupling on the results the mass-addedand the baseline cases were operated at the same rotationalfrequency of 4.4 (±0.4) Hz.
Overall, a decrease in natural frequencies due to massaddition can be seen for all the modes. An estimate of thechange in frequency due to the addition of a 35 g mass on theblade tip based on a single degree of freedom analysis showsa reduction of the same order as observed in the experiment.Interestingly, there was a significant reduction in frequenciescorresponding to second and fourth baseline modes, thesemodes have been identified in the single-blade dynamic benchtest. In contrast, the natural frequencies corresponding tosixth and seventh baseline operational modes did not showany significant impact due to modification of the blade,
9
Smart Mater. Struct. 22 (2013) 075027 T J Arsenault et al
Figure 13. Comparison of mass-added blade power spectra withthat of the baseline case (FBG on root of Blade 1).
which agrees well with the identification of these modes astower modes transmitting vibrational energy to the rotor, asdiscussed in section 3.4.1. The effect of the tip mass on theblade is negligible on the dynamics of the whole turbinesystem.
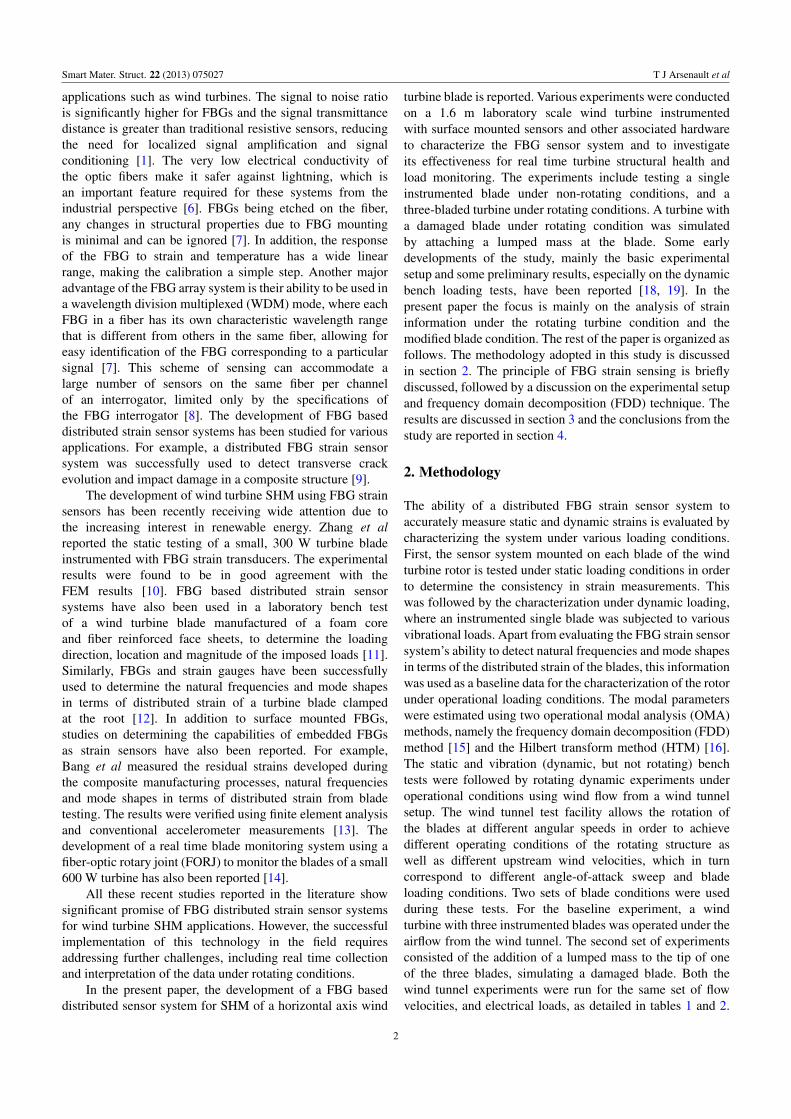
The power spectra of the FBG sensor attached closerto the root on the damaged blade is shown along with thatof a healthy blade for comparison in figure 13. An increasein the first rotational harmonic (1/rev) power due to therotational imbalance imposed by the extra mass being placedonly on one blade is evident in the data. The increase inpower associated with the rotational harmonics due to thesingle-blade mass addition was estimated to be about 14.38%using experimental data collected from the flap-wise root FBGof the modified blade. Similarly, the change in the naturalfrequency of the blade due to addition of mass is also evidentin the power spectra comparison between three blades, asshown in figure 14. The change in natural frequency shownbased on the strain measured near the roots, though small dueto the relatively small mass considered in the study, could bemore sensitive to real damage in the field. Thus the changein the power associated with the 1/rev, which is a measureof the loading imbalance of the rotor [21], associated withstructural damage on one of the blades, and the shift in thenatural frequencies are potential candidates that could be usedfor tracking both sudden or progressive damage failure.
It is important to note that due to limitationsassociated with the small-scale test setup used in thisstudy the development of a quantitative relationship betweenmeasured strains and the changes in system parametersis not feasible. Such development requires computationalsimulations along with experimental verification throughsystem characterization under a large-scale wind turbinesetup.
4. Conclusions
The development of a FBG based distributed strain sensorsystem for health monitoring of a wind turbine and its
Figure 14. Mass-added power spectra showing modal shift.
evaluation under various loading conditions are discussedin this paper. First, the FBG system was evaluated underthe static loading of wind turbine rotor blades. The goodagreement with the data obtained from the strain gagesvalidated the FBG mounting and data acquiring techniquesused in this study. The FBG sensor system was thenevaluated under vibrational loading of a blade in terms ofthe determination of the blade natural frequencies and modeshapes in terms of strain. Under two different input loadingconditions, namely finger tapping and shaker testing, themeasured natural frequencies showed excellent agreement.Finally, the FBG strain sensor system was tested underoperational conditions with the aid of a rotor with threeinstrumented blades subjected to wind flow from an open-jetwind tunnel. Analysis of the strain data obtained showed thatthe FBG strain sensor system can capture various dynamiccharacteristics of the rotor such as the natural frequenciesof the blade, n/rev rotational frequencies, tower naturalfrequencies and coupling between all the three of them.Experiments with a lumped tip mass attached on one of theblades, simulating ice accretion or damage, showed that theFBG sensors detected an increase in power corresponding ton/rev frequencies as the damage accentuates the imbalance inthe rotor. Similarly, the natural frequencies of the blades werealso found to be very sensitive to damage and the FBG sensorswere able to detect the shift in the natural frequencies. Hence,the present study demonstrates that an effective approach forSHM of wind turbines can be developed by tracking these twoparameters.
Acknowledgments
The authors would like to thank New York State EnergyResearch and Development Authority (NYSERDA) forfunding this research project (Grant No. 18812). Theywould also like to thank Dr M Seaver at NRL for fruitfuldiscussions.
10
Smart Mater. Struct. 22 (2013) 075027 T J Arsenault et al
References
[1] Schroeder K, Eche W, Apitz J, Lembke E and Lenschow G2006 A fiber Bragg grating sensor system monitorsoperational load in a wind turbine rotor blade Meas. Sci.Technol. 17 1167–72
[2] Hameed Z, Hong Y S, Cho Y M, Ahn S H and Song C K 2009Condition monitoring and fault detection of wind turbinesand related algorithms: a review Renew. Sustain. EnergyRev. 13 1–39
[3] Adams D, White J, Rumsey M and Farrar C 2011 Structuralhealth monitoring of wind turbines: method and applicationto a HAWT Papers Presented at AWEA Windpower 2010
[4] Schulz M J and Sundaresan M J 2006 Smart sensor system forstructural condition monitoring of wind turbines:subcontract report Technical Report NREL/SR-500-40089(National Renewable Energy Laboratory, CO)
[5] Sundaresan M J, Schulz M J and Goshal A 2002 Structuralhealth monitoring static test of a wind turbine blade:subcontract report Technical Report (National RenewableEnergy Laboratory)
[6] Wernicke J, Shadden J, Kuhnt S, Byars R, Rhead P andDamaschke M 2004 Field experience of fibre optical strainssensors for providing real time load information from windturbine blades during operation Papers Presented at theEuropean Wind Energy Conf.
[7] Takeda N 2002 Characterization of microscopic damage incomposite laminates and real-time monitoring by embeddedoptical fiber sensors Int. J. Fatigue 24 281–9
[8] Fixter L and Williamson C 2006 State of the artreview—structural health monitoring Smart Materials,Surfaces and Structures Network (Smart. Mat) Report
[9] Ciang C C, Lee J R and Bang H J 2008 Structural healthmonitoring for a wind turbine system: a review of damagedetection methods Meas. Sci. Technol. 19 122001
[10] Zhang Z, Huang Z, Liu Y and Leng J 2011 Static test of theembedded fiber Bragg gratings composite wind turbineblades Nondestructive Characterization for CompositeMaterials, Aerospace Engineering, Civil Infrastructure andHomeland Security p 79833F
[11] Kim C, Kim K, Kim H, Paek I, Yoo N, Nam Y, Campagnolo Fand Bottasso C 2012 A method to estimate bendingmoments acting on a wind turbine blade specimen usingFBG sensors Int. J. Precis. Eng. Manuf. 13 1247–50
[12] Kim C H, Paek I and Yoo N 2010 Monitoring of small windturbine blade using FBG sensors ICCAS: 2010 Int. Conf. onControl Automation and Systems pp 1059–61
[13] Bang H J, Shin H and Ju Y 2010 Structural health monitoringof a composite wind turbine blade using fiber Bragg gratingsensors Sensors and Smart Structures Technologies forCivil, Mechanical, and Aerospace Systems 2010 p 76474H
[14] Chen Y, Ni Y Q, Ye X W, Yang H X and Zhu S 2012Structural health monitoring of wind turbine blade usingfiber Bragg grating sensors and fiber optic rotary jointProc. SPIE 8345 834534
[15] Brincker R, Zhang L and Andersen P 2001 Modalidentification of output-only system using frequencydomain decomposition Smart Mater. Struct. 10 441
[16] Agneni A, Crema L B and Coppotelli G 2010 Output-onlyanalysis of structures with closely spaced poles Mech. Syst.Signal Process. 24 1240–9
[17] Doyle C 2003 Fibre Bragg grating sensors an introduction toBragg gratings and interrogation techniques TechnicalReport (Bracknell: Smart Fibres)
[18] Arsenault T J, Achuthan A, Marzocca P, Anguiano D,Cardenas D, Elizalde H, Probst O and Coppotelli G 2011Integrated sensor system for structural integrity and loadmonitoring of wind turbines 8th Int. Workshop onStructural Health Monitoring 2011 (Stanford, CA, Sept.2011) IWSHM, pp 2647–55
[19] Achuthan A, Arsenault T J, Marzocca P, Grappasonni C andCoppotelli G 2012 Dynamic identification of wind turbinesystem under operational conditions using FBG transducers53rd AIAA/ASME/ASCE/AHS/ASC Structures, StructuralDynamics and Materials Conf. (April)
[20] Brincker R, Ventura C E and Andersen P 2001 Dampingestimation by frequency domain decomposition 19th Int.Modal Analysis Conf. (IMAC XIX) (Kissimee, FL, Feb. 5–8)
[21] Kirchhoff R H 1993 Wind turbine rotor mass imbalance; theconnection to 1p 16th Annual Energy-Sources TechnologyConf. and Exhibition
11


![Application of Multiplexed FBG and PZT Impedance · FBG based sensors for sensing applications in civil and structural engineering [7-9]. FBG sensors offer a wide number of advantages](https://img.pdfslide.us/doc/110x75/5f0c25797e708231d433f797/application-of-multiplexed-fbg-and-pzt-impedance-fbg-based-sensors-for-sensing-applications.jpg)