Embed Size (px)
Citation preview
Development of a dimensionless parameterfor characterization of dielectric barrierdischarge devices with respect togeometrical features
Mook Tzeng LIM (林木森)1,3, Ahmad Zulazlan SHAH ZULKIFLI1,Kanesh Kumar JAYAPALAN2 and Oihoong CHIN2
1 Fuels and Combustion, Generation Unit, TNB Research Sdn. Bhd., Malaysia2 Plasma Technology Research Center, Physics Department, Universiti Malaya, Malaysia
E-mail: [email protected] and [email protected]
Received 17 January 2017, revised 12 May 2017Accepted for publication 16 May 2017Published 26 July 2017
AbstractNon-thermal plasma (NTP) devices produce excited and radical species that have higher energylevels than their ground state and are utilized for various applications. There are various types ofNTP devices, with dielectric barrier discharge (DBD) reactors being widely used. These DBDdevices vary in geometrical configuration and operating parameters, making a comparison oftheir performance in terms of discharge power characteristics difficult. Therefore, this studyproposes a dimensionless parameter that is related to the geometrical features, and is a functionof the discharge power with respect to the frequency, voltage, and capacitance of a DBD. Thedimensionless parameter, in the form of a ratio of the discharge energy per cycle to the gapcapacitive energy, will be useful for engineers and designers to compare the energycharacteristics of devices systematically, and could also be used for scaling up DBD devices.From the results in this experiment and from the literature, different DBD devices arecategorized into three separate groups according to different levels of the energy ratio. The largerDBD devices have lower energy ratios due to their lower estimated surface discharge areas andcapacitive reactance. Therefore, the devices can be categorized according to the energy ratio dueto the effects of the geometrical features of the DBD devices, since it affects the surfacedischarge area and capacitance of the DBD. The DBD devices are also categorized into threeseparate groups using the Kriegseis factor, but the categorization is different from that of theenergy ratio.
Keywords: low temperature plasma, discharge power, energy ratio, dimensionless parameter,scaling factor, dielectric barrier discharge, geometrical effects
(Some figures may appear in colour only in the online journal)
1. Introduction
Non-thermal plasma (NTP) devices produce excited andradical species that have higher energy levels than theirground state [1, 2] and are utilized in various fields, includingcombustion [3–5], gasification [6], surface modification
[7–10], particulate matter mitigation [11–14] and wastewatertreatment [15–18]. There are various types of NTP devices,with dielectric barrier discharge (DBD) reactors being widelyused. The solid dielectric barrier is placed in the gap betweenthe live and the ground electrode and the electrical dischargeis maintained in the gas gap. When a sufficiently high electricfield is applied between the two electrodes, the gas atoms/molecules participate in collisional processes resulting in
© 2017 Hefei Institutes of Physical Science, Chinese Academy of Sciences and IOP Publishing Printed in China and the UK Plasma Science and Technology
Plasma Sci. Technol. 19 (2017) 095402 (10pp) https://doi.org/10.1088/2058-6272/aa7382
3 Author to whom any correspondence should be addressed.
1009-0630/17/095402+10$33.00 1
ionization, excitation, and/or dissociation to produce chargedand excited chemical species. When the charged and excitedchemical species recombine and de-excite, respectively,energy is released in the form of radiation ranging fromultraviolet to the near infrared wavelength region.
Currently, there are various designs for DBD reactors.The discharge power from these reactors characterizes theirability and energy efficiency to produce charged and excitedchemical species. The discharge power or energy is affectedby various factors such as the voltage, frequency, geometricalfeatures and capacitance of the device. The voltages used inthese devices have been reported to vary from 10 to 20 kV.Similarly, the discharge gap varies from 1 to 5 mm, while thesize of the electrodes are also different, all of which affect thecapacitance of the system [19–22]. The type of the powersource, either in the form of alternating current (AC) or pulseddirect current (DC), are known to affect the discharge andhence the energy characteristics of the DBD devices [23–27].Due to the varying parameters and power sources, a directcomparison of the DBDs is usually not possible, makingit difficult to discern their energy characteristics. Thereare existing parameters that can be used to describe thedischarge characteristics and therefore differentiate one DBDdevice from another, such as the electron number density andthe electron temperature [28–32], but these parameters are notavailable during the design stage of the NTP, when therelation between the diameter, discharge gap and the dis-charge power are required.
Thus, the present study proposes a dimensionless para-meter that relates the discharge power to the frequency,voltage, and capacitance of a DBD. The dimensionless
parameter could be useful for engineers and designers tocompare the energy characteristics of DBD devices system-atically, and could also be used for scaling up of the devices.Such dimensionless parameters have been used in other fieldsof engineering, e.g. in fluid mechanics, heat transfer, and thescaling up of fluidized beds [33–35]. The dimensionlessparameter for the devices in this study is then used forcharacterizing other DBD devices in the literature. The cur-rent study encompasses DBD devices that are connected toAC power supplies and sinusoidal power sources, so as tofocus on the effects of geometrical features on the dimen-sionless parameter. The dimensionless parameter is also cor-related with another factor in the literature (proposed byKriegseis et al [36]) for further comparison, although theKriegseis factor is a scaling factor and is not dimensionless.The Reynolds, Archimedes, Biot and Fourier numbers are justsome examples of dimensionless parameters that describe thephenomena in fluid mechanics and heat transfer. The factordeveloped by Kriegseis et al does not include the effectsof the geometrical features of the DBD devices, which canaffect the capacitance of the system, as will be discussedfurther in the manuscript.
2. Methodology
The present study investigates the discharge power from threedifferent DBD set-ups: concentric (CC), tri-concentric (TCC)and non-concentric (NCC) DBD reactors. Operating data andgeometrical features from other DBD devices in the literatureare used for comparison.
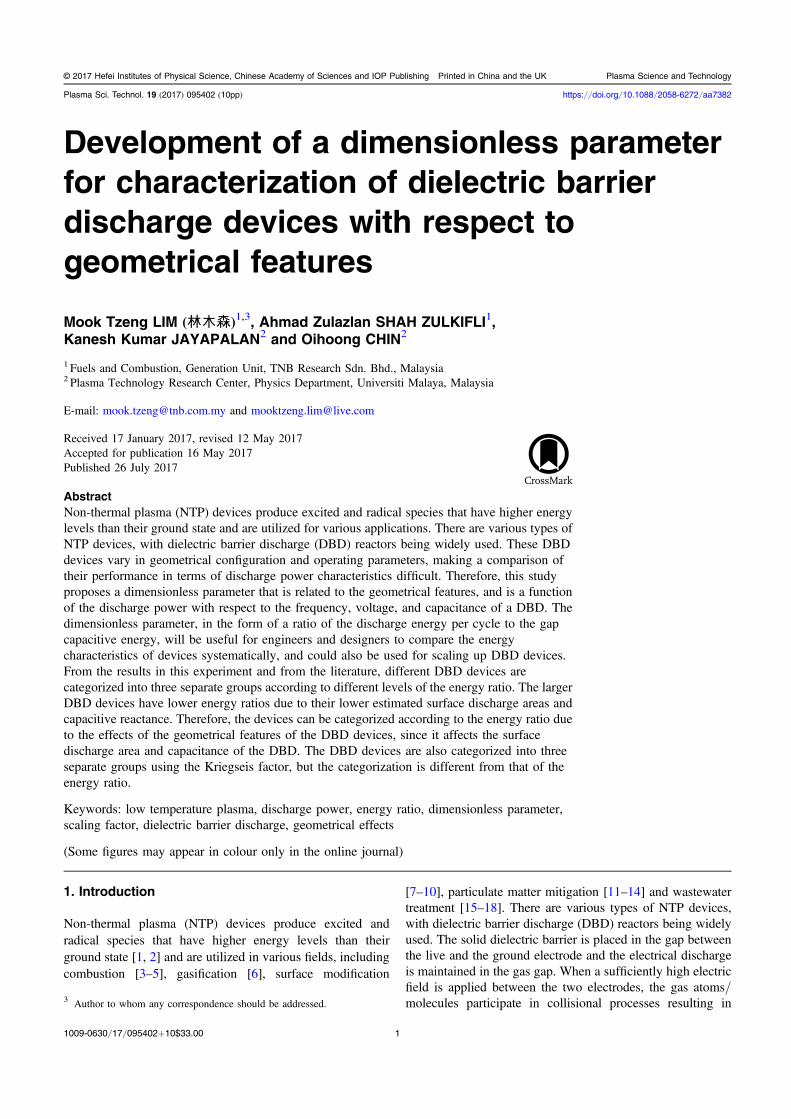
Figure 1. (a) Schematic diagram of the a NTP test rig; (b) sketch of the front view of an NCC NTP device; (c) sketch of the CC DBD reactor;(d) sketch of the TCC DBD reactor. The TCC reactor consists of three CC reactors.
2
Plasma Sci. Technol. 19 (2017) 095402 M T Lim et al
2.1. Dielectric barrier discharge reactor system set-up
Figures 1(a) and (b) show a schematic diagram of a DBDdevice and the system set-up. The input power into the DBDdevice is supplied by a high voltage (HV) supply. The HVsupply consists of a 2 kW VARIAC that controls the amountof power that is imparted to the load, while the duration of thepower pulses is controlled by the duty cycle, which waslimited to 60%. The frequency is tuned to the resonanceoperating frequency (27–36 kHz) of each set-up.
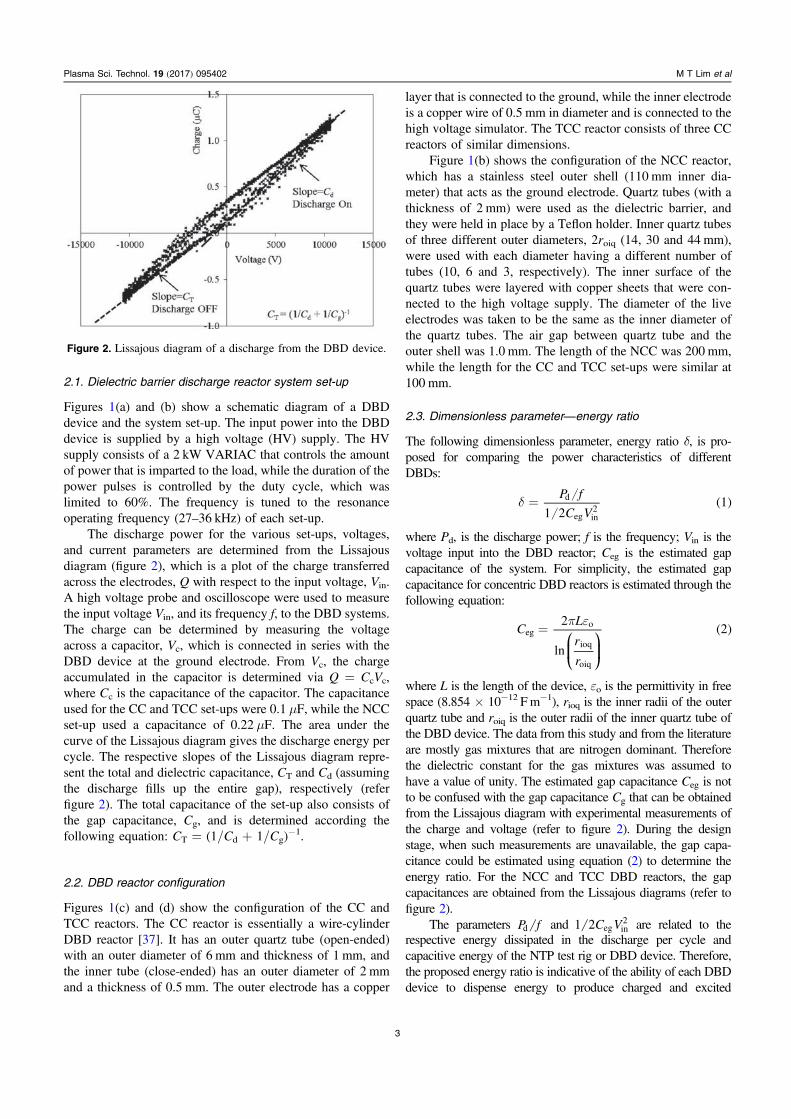
The discharge power for the various set-ups, voltages,and current parameters are determined from the Lissajousdiagram (figure 2), which is a plot of the charge transferredacross the electrodes, Q with respect to the input voltage, Vin.A high voltage probe and oscilloscope were used to measurethe input voltage Vin, and its frequency f, to the DBD systems.The charge can be determined by measuring the voltageacross a capacitor, Vc, which is connected in series with theDBD device at the ground electrode. From Vc, the chargeaccumulated in the capacitor is determined via Q = CcVc,where Cc is the capacitance of the capacitor. The capacitanceused for the CC and TCC set-ups were 0.1 μF, while the NCCset-up used a capacitance of 0.22 μF. The area under thecurve of the Lissajous diagram gives the discharge energy percycle. The respective slopes of the Lissajous diagram repre-sent the total and dielectric capacitance, CT and Cd (assumingthe discharge fills up the entire gap), respectively (referfigure 2). The total capacitance of the set-up also consists ofthe gap capacitance, Cg, and is determined according thefollowing equation: CT = (1/Cd + 1/Cg)
−1.
2.2. DBD reactor configuration
Figures 1(c) and (d) show the configuration of the CC andTCC reactors. The CC reactor is essentially a wire-cylinderDBD reactor [37]. It has an outer quartz tube (open-ended)with an outer diameter of 6 mm and thickness of 1 mm, andthe inner tube (close-ended) has an outer diameter of 2 mmand a thickness of 0.5 mm. The outer electrode has a copper
layer that is connected to the ground, while the inner electrodeis a copper wire of 0.5 mm in diameter and is connected to thehigh voltage simulator. The TCC reactor consists of three CCreactors of similar dimensions.
Figure 1(b) shows the configuration of the NCC reactor,which has a stainless steel outer shell (110 mm inner dia-meter) that acts as the ground electrode. Quartz tubes (with athickness of 2 mm) were used as the dielectric barrier, andthey were held in place by a Teflon holder. Inner quartz tubesof three different outer diameters, 2roiq (14, 30 and 44 mm),were used with each diameter having a different number oftubes (10, 6 and 3, respectively). The inner surface of thequartz tubes were layered with copper sheets that were con-nected to the high voltage supply. The diameter of the liveelectrodes was taken to be the same as the inner diameter ofthe quartz tubes. The air gap between quartz tube and theouter shell was 1.0 mm. The length of the NCC was 200 mm,while the length for the CC and TCC set-ups were similar at100 mm.
2.3. Dimensionless parameter—energy ratio
The following dimensionless parameter, energy ratio δ, is pro-posed for comparing the power characteristics of differentDBDs:
P f
C V1 21d
eg in2
d = ( )
where Pd, is the discharge power; f is the frequency; Vin is thevoltage input into the DBD reactor; Ceg is the estimated gapcapacitance of the system. For simplicity, the estimated gapcapacitance for concentric DBD reactors is estimated through thefollowing equation:
CL
r
r
2
ln
2ego
ioq
oiq
p e= ⎛
⎝⎜⎞⎠⎟
( )
where L is the length of the device, εo is the permittivity in freespace (8.854 × 10⁻¹² Fm−1), rioq is the inner radii of the outerquartz tube and roiq is the outer radii of the inner quartz tube ofthe DBD device. The data from this study and from the literatureare mostly gas mixtures that are nitrogen dominant. Thereforethe dielectric constant for the gas mixtures was assumed tohave a value of unity. The estimated gap capacitance Ceg is notto be confused with the gap capacitance Cg that can be obtainedfrom the Lissajous diagram with experimental measurements ofthe charge and voltage (refer to figure 2). During the designstage, when such measurements are unavailable, the gap capa-citance could be estimated using equation (2) to determine theenergy ratio. For the NCC and TCC DBD reactors, the gapcapacitances are obtained from the Lissajous diagrams (refer tofigure 2).
The parameters P fd and C V1 2 eg in2 are related to the
respective energy dissipated in the discharge per cycle andcapacitive energy of the NTP test rig or DBD device. Therefore,the proposed energy ratio is indicative of the ability of each DBDdevice to dispense energy to produce charged and excited
Figure 2. Lissajous diagram of a discharge from the DBD device.
3
Plasma Sci. Technol. 19 (2017) 095402 M T Lim et al
species, as compared to the total amount of energy that could bestored within the capacitive gap of the DBD.
Kriegseis et al [36] proposed the following factor for aplasma actuator:
P L
V f3A
d
in3.5 1.5
Q = ( )
where L is the length of the device.A dimensional analysis of equation (3) shows that the
unit of factor Θ is W s1.5 m−1 V−3.5 and it is not dimen-sionless, as the parameters used to describe phenomena influid mechanics and heat transfer mentioned earlier.Equation (3) is still applicable as a scaling factor, but islimited in its function to describe the characteristics of DBDdevices. A dimensionless analysis of equation (1) shows thatit is dimensionless and thus could be used for both scaling upand to describe the characteristics.
Equations (1) and (3) were used to determine the energyratio and the Kriegseis factor for the DBD devices in thisstudy and those in the literature [14, 38–40]. A comparisonwas then made between the two factors. Table 1 shows asummary of the operating conditions of the DBD devices inthis study and in the literature.
3. Results
3.1. Dimensionless parameter—energy ratio
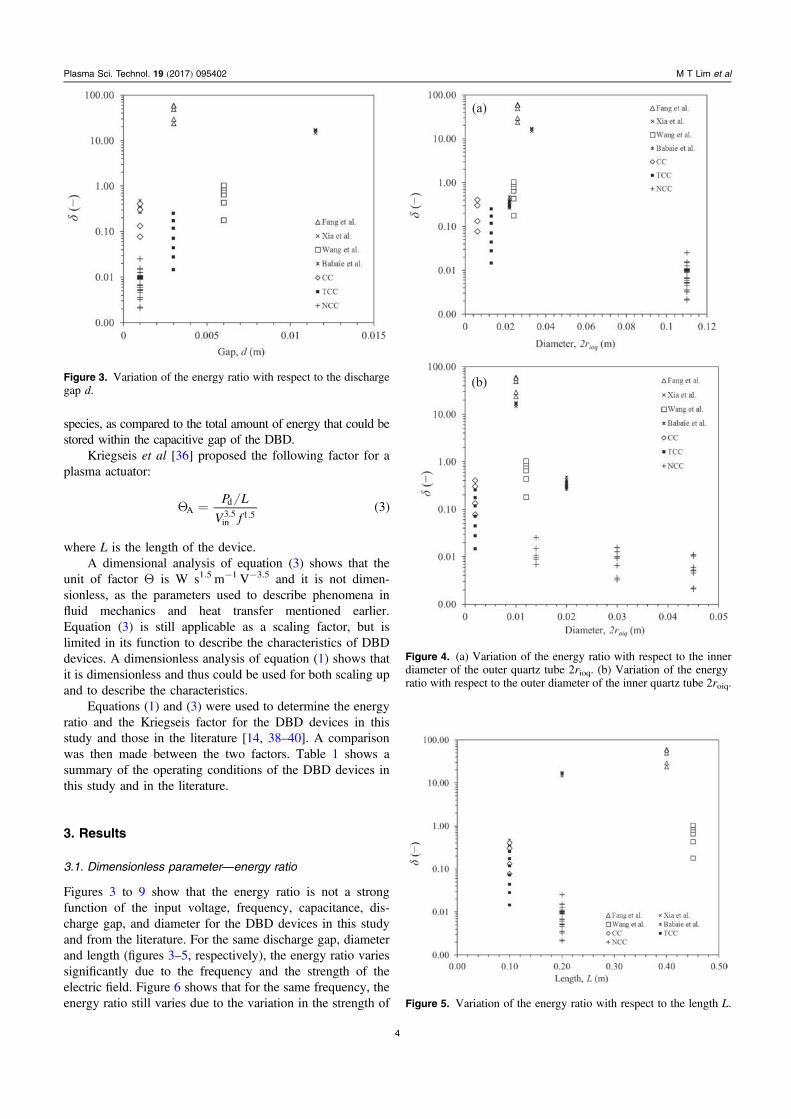
Figures 3 to 9 show that the energy ratio is not a strongfunction of the input voltage, frequency, capacitance, dis-charge gap, and diameter for the DBD devices in this studyand from the literature. For the same discharge gap, diameterand length (figures 3–5, respectively), the energy ratio variessignificantly due to the frequency and the strength of theelectric field. Figure 6 shows that for the same frequency, theenergy ratio still varies due to the variation in the strength of
Figure 3. Variation of the energy ratio with respect to the dischargegap d.
Figure 4. (a) Variation of the energy ratio with respect to the innerdiameter of the outer quartz tube 2rioq. (b) Variation of the energyratio with respect to the outer diameter of the inner quartz tube 2roiq.
Figure 5. Variation of the energy ratio with respect to the length L.
4
Plasma Sci. Technol. 19 (2017) 095402 M T Lim et al
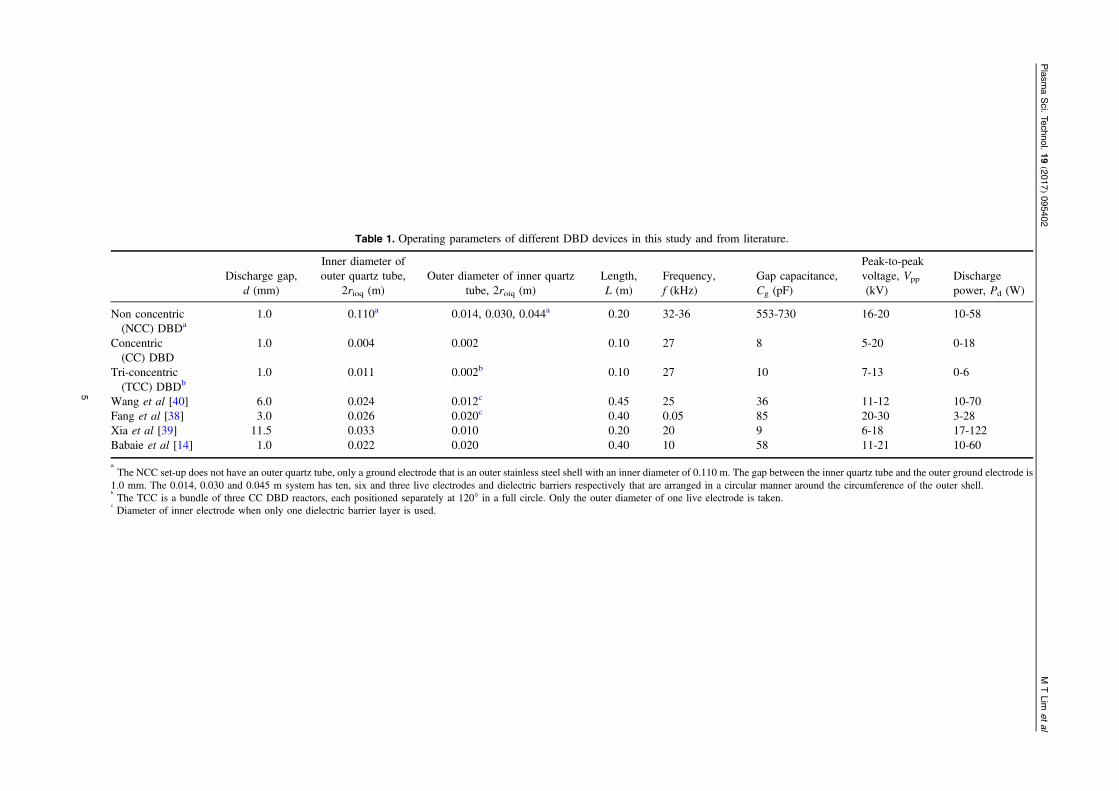
Table 1. Operating parameters of different DBD devices in this study and from literature.
Discharge gap,d (mm)
Inner diameter ofouter quartz tube,
2rioq (m)Outer diameter of inner quartz
tube, 2roiq (m)Length,L (m)
Frequency,f (kHz)
Gap capacitance,Cg (pF)
Peak-to-peakvoltage, Vpp
(kV)Dischargepower, Pd (W)
Non concentric(NCC) DBDa
1.0 0.110a 0.014, 0.030, 0.044a 0.20 32-36 553-730 16-20 10-58
Concentric(CC) DBD
1.0 0.004 0.002 0.10 27 8 5-20 0-18
Tri-concentric(TCC) DBDb
1.0 0.011 0.002b 0.10 27 10 7-13 0-6
Wang et al [40] 6.0 0.024 0.012c 0.45 25 36 11-12 10-70Fang et al [38] 3.0 0.026 0.020c 0.40 0.05 85 20-30 3-28Xia et al [39] 11.5 0.033 0.010 0.20 20 9 6-18 17-122Babaie et al [14] 1.0 0.022 0.020 0.40 10 58 11-21 10-60
a
The NCC set-up does not have an outer quartz tube, only a ground electrode that is an outer stainless steel shell with an inner diameter of 0.110 m. The gap between the inner quartz tube and the outer ground electrode is1.0 mm. The 0.014, 0.030 and 0.045 m system has ten, six and three live electrodes and dielectric barriers respectively that are arranged in a circular manner around the circumference of the outer shell.b
The TCC is a bundle of three CC DBD reactors, each positioned separately at 120° in a full circle. Only the outer diameter of one live electrode is taken.c
Diameter of inner electrode when only one dielectric barrier layer is used.
5
Plasm
aSci.
Technol.19
(2017)095402
MTLim
etal
the electric field that is controlled by the voltage. When theenergy ratio is plotted against the voltage, as shown infigure 7, the different DBD devices can be categorized intothree different ranges. The distinction between the three dif-ferent groups of DBD devices is also evident with respect tothe discharge power, as shown in figure 8.
Figure 8 shows that in group 1, the DBD devices from[38, 39] have energy ratios ranging from 16 to 58. In group 2, theCC and TCC reactors, and the DBD devices from [14, 40] haveenergy ratios that are lower, ranging from 0.01 to 1.04. In group3, the DBDs with NCC construction have the lowest energyratios, which ranged from 0.0021 to 0.0254. The same categor-ization could also be observed in figure 7, where the energy ratiois different for similar voltages for different DBD devices. Theenergy ratios of group 1 devices (and from group 2) exceeds avalue of unity, but does not indicate that more energy is dis-charged compared to the energy stored. This is because theestimated gap capacitance is used to estimate the energy stored in
the gap, and not the total capacitance of the system. The totalcapacitance of the system was not considered in formulatingequations (1) and (2) since information such as the capacitance ofthe electrical circuits is usually not available in the literature orduring the design stage.
The data in all three groups are correlated as power func-tions (in the form of y = axb), with groups 3 and 2 showingcorrelation coefficients (R2) of 0.7219 and 0.9465, respectively.There is a significant scatter of data in group 1, although theirenergy ratio was in the same range. Additional data for DBDdevices in group 1 in the future may improve the correlationcoefficient.
The slopes of the curve (exponent b) of groups 3 and 2 are0.9637 and 0.5647, respectively, while the two devices in group 1from [38, 39] have values of 0.5602 and 0.0362, respectively.The value of the slope indicates the variation rate of the energyratio with respect to the discharge power, and is related to the
Figure 6. Variation of the energy ratio with respect to thefrequency f.
Figure 7. Variation of the energy ratio with respect to the inputvoltage Vin.
Figure 8. Variation of the energy ratio with respect to the dischargepower.
Figure 9. Variation of the energy ratio with respect to the effectivedischarge area.
6
Plasma Sci. Technol. 19 (2017) 095402 M T Lim et al
capacitance of the system. Group 3 devices have higher gapcapacitances (553–730 pF, see table 1), thus allowing the capa-city for the device to have a higher rate of increase in energy ratioas the discharge power increases. Group 1 and 2 devices havecapacitances that are lower than 85 pF, and the rate of energyratio increase is slower. Figure 8 shows that group 1 DBDdevices have the lowest energy ratio increase with regards to thedischarge power, especially the device of Xia et al [38, 39] wherethe slope is only 0.0362.
Exponent a of the power function increases from 0.0030and 0.0652 to more than 9 for groups 3, 2 and 1, respectively.The increase in exponent a indicates that the energy ratio δ isincreasing from groups 3 to 1. In group 1 the exponent a for[38, 39] was 9.73 and 14.11, respectively. The variation inexponent a with respect to each group is possibly due to thesurface areas (as shown in figure 9 based on the length andinner diameter of the outer quartz tube, 2rioq) and capaci-tances. Group 1 DBD devices have solid surface electrodesthat are wrapped, foiled or coated on the outer quartz tube,allowing the whole cylindrical surface area of the outerelectrodes to have a larger discharge area, hence the higherenergy ratios. By contrast, group 2 DBD devices consisting ofthose from [14] and [40] have wire meshes on the outerquartz tubes, and the cylindrical surface area is only frac-tional, thus the potential discharge area is reduced. The factorof reduction is estimated to be lower than 0.5, based oncomparisons with the energy ratio and surface areas of theDBD devices in group 1 (see table 2). The CC the TCCreactors have copper foils as outer electrodes, but have lowersurface areas compared to the DBD devices in group 1,therefore their respective energy ratios are lower in group 2.Figure 9 shows where group 3 devices have smaller areas (4to 7 cm2) compared to those in group 1 (207 to 327 cm2). Asthe surface discharge area increases, the energy ratio δ
increases and so does exponent a.The TCC reactor has a larger diameter and surface area
compared to the CC, but the TCC reactor has three sets of
parallel quartz tubes and electrodes tubes instead of one set inthe CC reactor. The higher number of parallel tubes increasesthe capacitance, and with the capacitance being the denomi-nator in equation (1) the increase in capacitance offsets thehigher surface area of the TCC reactor, and the resultingenergy ratio δ is not significantly higher than that of the CCreactor.
The DBD devices in group 3 (the NCC reactors) arelarger in diameter, with a 2rioq of 0.110 m and inner quartztube outer diameters (2roiq) of 0.014, 0.030 and 0.044 m.Although the size and surface areas are larger, the NCCreactors have a non-concentric configuration, thus restrictingthe potential surface area for discharge to the proximitiesbetween the inner quartz tube and the outer ground electrodealong the length of the reactor (see figure 1(b)). Based on theenergy and surface areas, the resulting reduction factors are<0.006, 0.006–0.010, and 0.010–0.014, respectively for 2roiqof 0.014, 0.030 and 0.044 m for the NCC reactors. In addi-tion, the NCC reactors consist of 3–10 quartz tubes, resultingin higher gap capacitances than the DBD devices in groups 1and 2. Figure 9 shows that the energy ratio for the NCCreactors decreases with an increase in surface area, which issimilar to that of the TCC reactor. As the diameter increases,the NCC reactors’ capacitances increase and offset theincrease in the surface area, decreasing the energy ratio δ.
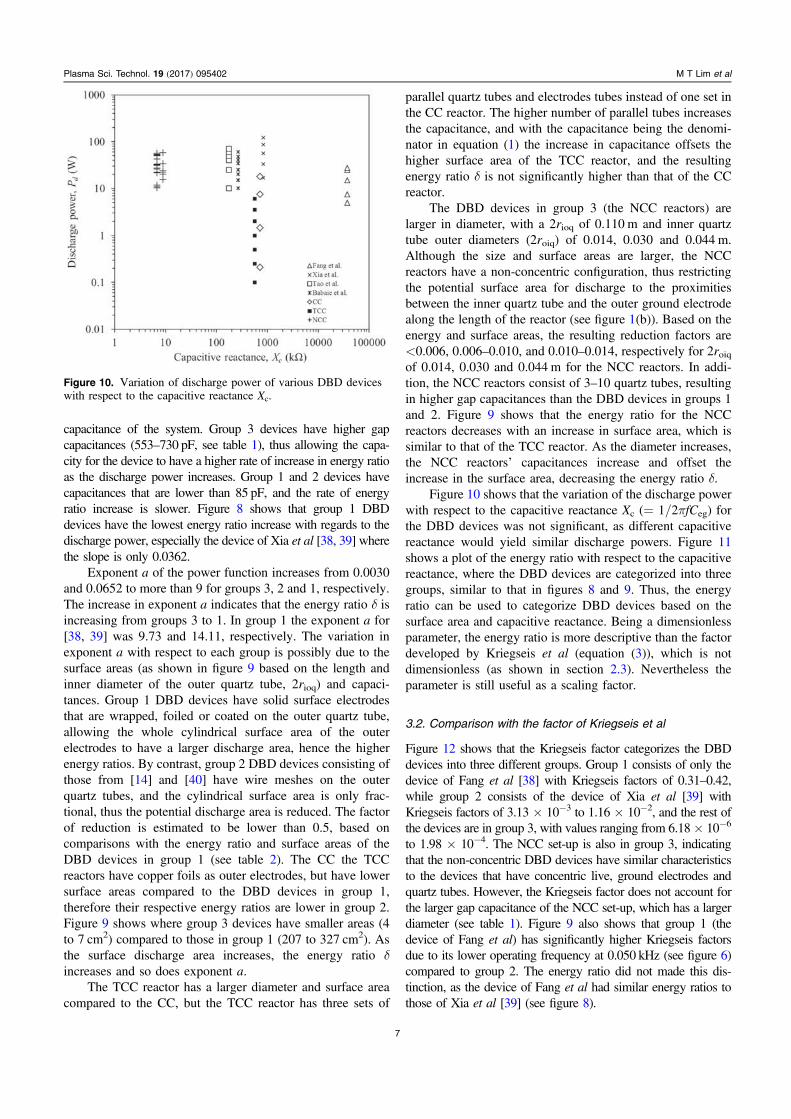
Figure 10 shows that the variation of the discharge powerwith respect to the capacitive reactance Xc (= 1/2πfCeg) forthe DBD devices was not significant, as different capacitivereactance would yield similar discharge powers. Figure 11shows a plot of the energy ratio with respect to the capacitivereactance, where the DBD devices are categorized into threegroups, similar to that in figures 8 and 9. Thus, the energyratio can be used to categorize DBD devices based on thesurface area and capacitive reactance. Being a dimensionlessparameter, the energy ratio is more descriptive than the factordeveloped by Kriegseis et al (equation (3)), which is notdimensionless (as shown in section 2.3). Nevertheless theparameter is still useful as a scaling factor.
3.2. Comparison with the factor of Kriegseis et al
Figure 12 shows that the Kriegseis factor categorizes the DBDdevices into three different groups. Group 1 consists of only thedevice of Fang et al [38] with Kriegseis factors of 0.31–0.42,while group 2 consists of the device of Xia et al [39] withKriegseis factors of 3.13 × 10⁻³ to 1.16 × 10⁻², and the rest ofthe devices are in group 3, with values ranging from 6.18× 10⁻⁶
to 1.98 × 10⁻⁴. The NCC set-up is also in group 3, indicatingthat the non-concentric DBD devices have similar characteristicsto the devices that have concentric live, ground electrodes andquartz tubes. However, the Kriegseis factor does not account forthe larger gap capacitance of the NCC set-up, which has a largerdiameter (see table 1). Figure 9 also shows that group 1 (thedevice of Fang et al) has significantly higher Kriegseis factorsdue to its lower operating frequency at 0.050 kHz (see figure 6)compared to group 2. The energy ratio did not made this dis-tinction, as the device of Fang et al had similar energy ratios tothose of Xia et al [39] (see figure 8).
Figure 10. Variation of discharge power of various DBD deviceswith respect to the capacitive reactance Xc.
7
Plasma Sci. Technol. 19 (2017) 095402 M T Lim et al
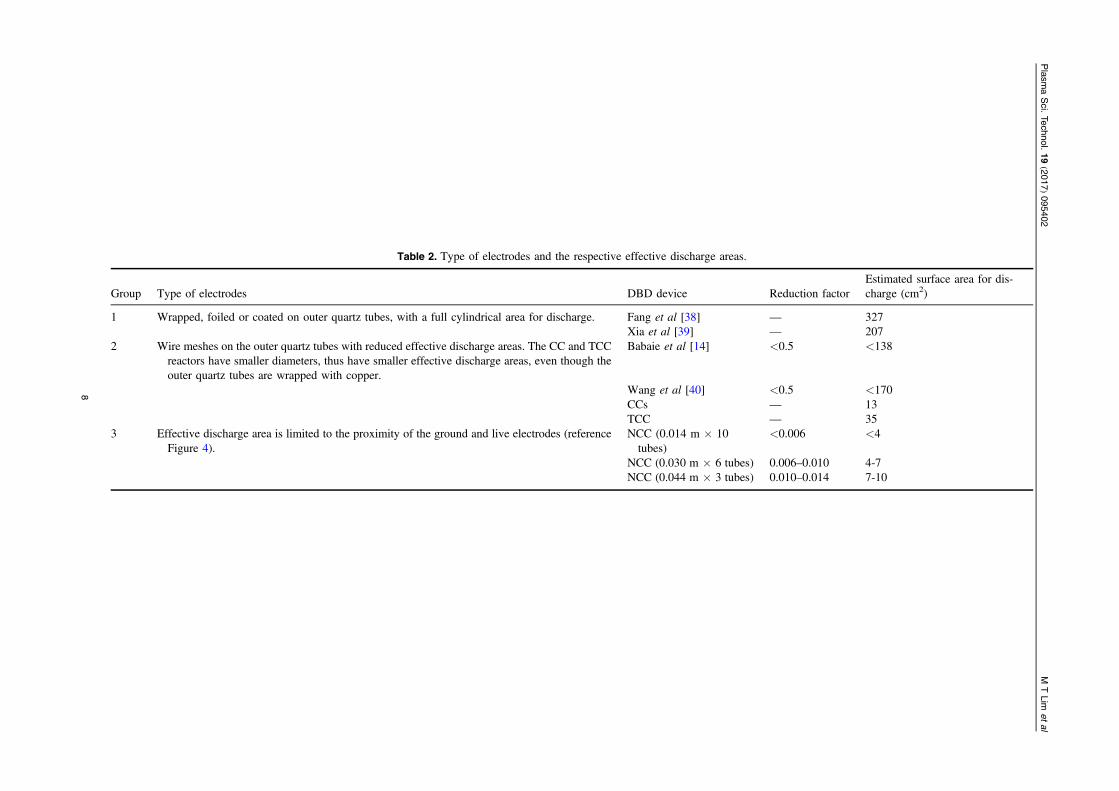
Table 2. Type of electrodes and the respective effective discharge areas.
Group Type of electrodes DBD device Reduction factorEstimated surface area for dis-charge (cm2)
1 Wrapped, foiled or coated on outer quartz tubes, with a full cylindrical area for discharge. Fang et al [38] — 327Xia et al [39] — 207
2 Wire meshes on the outer quartz tubes with reduced effective discharge areas. The CC and TCCreactors have smaller diameters, thus have smaller effective discharge areas, even though theouter quartz tubes are wrapped with copper.
Babaie et al [14] <0.5 <138
Wang et al [40] <0.5 <170CCs — 13TCC — 35
3 Effective discharge area is limited to the proximity of the ground and live electrodes (referenceFigure 4).
NCC (0.014 m×10tubes)
<0.006 <4
NCC (0.030 m×6 tubes) 0.006–0.010 4-7NCC (0.044 m×3 tubes) 0.010–0.014 7-10
8
Plasm
aSci.
Technol.19
(2017)095402
MTLim
etal
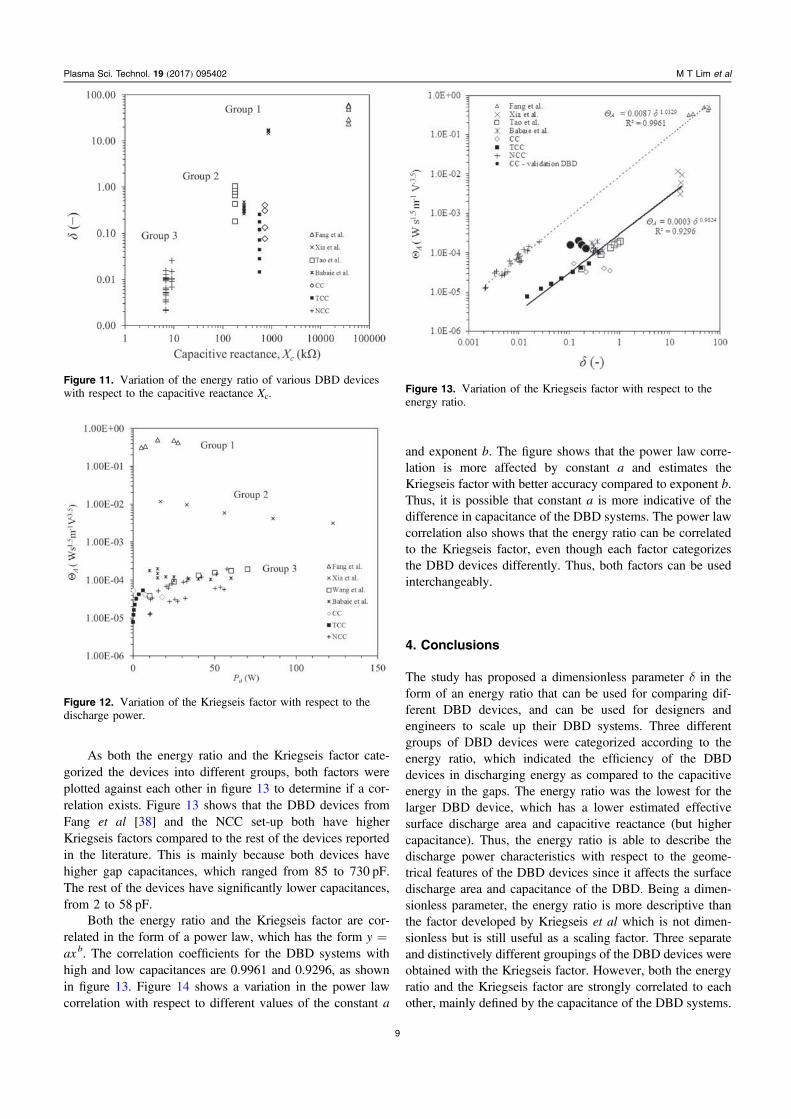
As both the energy ratio and the Kriegseis factor cate-gorized the devices into different groups, both factors wereplotted against each other in figure 13 to determine if a cor-relation exists. Figure 13 shows that the DBD devices fromFang et al [38] and the NCC set-up both have higherKriegseis factors compared to the rest of the devices reportedin the literature. This is mainly because both devices havehigher gap capacitances, which ranged from 85 to 730 pF.The rest of the devices have significantly lower capacitances,from 2 to 58 pF.
Both the energy ratio and the Kriegseis factor are cor-related in the form of a power law, which has the form y =axb. The correlation coefficients for the DBD systems withhigh and low capacitances are 0.9961 and 0.9296, as shownin figure 13. Figure 14 shows a variation in the power lawcorrelation with respect to different values of the constant a
and exponent b. The figure shows that the power law corre-lation is more affected by constant a and estimates theKriegseis factor with better accuracy compared to exponent b.Thus, it is possible that constant a is more indicative of thedifference in capacitance of the DBD systems. The power lawcorrelation also shows that the energy ratio can be correlatedto the Kriegseis factor, even though each factor categorizesthe DBD devices differently. Thus, both factors can be usedinterchangeably.
4. Conclusions
The study has proposed a dimensionless parameter δ in theform of an energy ratio that can be used for comparing dif-ferent DBD devices, and can be used for designers andengineers to scale up their DBD systems. Three differentgroups of DBD devices were categorized according to theenergy ratio, which indicated the efficiency of the DBDdevices in discharging energy as compared to the capacitiveenergy in the gaps. The energy ratio was the lowest for thelarger DBD device, which has a lower estimated effectivesurface discharge area and capacitive reactance (but highercapacitance). Thus, the energy ratio is able to describe thedischarge power characteristics with respect to the geome-trical features of the DBD devices since it affects the surfacedischarge area and capacitance of the DBD. Being a dimen-sionless parameter, the energy ratio is more descriptive thanthe factor developed by Kriegseis et al which is not dimen-sionless but is still useful as a scaling factor. Three separateand distinctively different groupings of the DBD devices wereobtained with the Kriegseis factor. However, both the energyratio and the Kriegseis factor are strongly correlated to eachother, mainly defined by the capacitance of the DBD systems.
Figure 11. Variation of the energy ratio of various DBD deviceswith respect to the capacitive reactance Xc.
Figure 12. Variation of the Kriegseis factor with respect to thedischarge power.
Figure 13. Variation of the Kriegseis factor with respect to theenergy ratio.
9
Plasma Sci. Technol. 19 (2017) 095402 M T Lim et al
The correlation between both factors means that they can beused interchangeably.
Acknowledgments
The authors would like to thank Tenaga Nasional Berhad(Malaysia) for funding of this research (TNBR/SF195/2015and TNBR/SF240/2016) and would like to acknowledge thosewho have contributed directly or indirectly towards the project.
References
[1] Sjöberg M et al 2003 J. Electrostat. 59 87[2] Starikovskiy A and Aleksandrov N 2013 Prog. Energy
Combust. Sci. 39 61[3] Ombrello T et al 2010 Combust. Flame 157 1906[4] Ombrello T et al 2010 Combust. Flame 157 1916[5] Hu H B et al 2013 J. Therm. Sci. 22 275[6] Du C M et al 2015 Int. J. Hydrogen Energy 40 12634[7] Wascher R et al 2014 Surf. Coat. Technol. 259 62[8] Vaswani S, Koskinen J and Hess D W 2005 Surf. Coat.
Technol. 195 121[9] Podgorski L et al 2000 Int. J. Adhes. Adhes. 20 103[10] Han Y et al 2011 Carbohydr. Polym. 86 1031[11] Ye D et al 2005 J. Hazard. Mater. 127 149[12] Wang P et al 2015 Appl. Therm. Eng. 91 1[13] Talebizadeh P et al 2014 Renew. Sustain. Energy Rev. 40 886[14] Babaie M et al 2015 Chem. Eng. J. 276 240[15] Wang X Y, Zhou M H and Jin X H 2012 Electrochim. Acta
83 501[16] Wang N, Chen D Z and Zou L S 2015 Appl. Therm. Eng.
75 779[17] Tichonovas M et al 2013 Chem. Eng. J. 229 9[18] Jiang B et al 2014 Chem. Eng. J. 236 348[19] Petitpas G et al 2007 Int. J. Hydrogen Energy 32 2848[20] Nozaki T and Okazaki K 2013 Catal. Today 211 29[21] Stepanyan S A, Soloviev V R and Starikovskaia S M 2014
J. Phys. D: Appl. Phys. 47 485201[22] Nunnally T et al 2014 Int. J. Hydrogen Energy 39 11976[23] Laroussi M et al 2004 J. Appl. Phys. 96 3028[24] Liu S H and Neiger M 2001 J. Phys. D: Appl. Phys. 34 1632[25] Lu X P and Laroussi M 2005 J. Appl. Phys. 98 023301[26] Liu S H and Neiger M 2003 J. Phys. D: Appl. Phys. 36 3144[27] Fang Z et al 2009 J. Phys. D: Appl. Phys. 42 085203[28] Kühn S et al 2010 Plasma Sources Sci. Technol. 19 015013[29] Rajasekaran P 2011 Atmospheric-pressure Dielectric barrier
discharge (DBD) in air: plasma characterization for skintherapy PhD Thesis Institute for Electrical Engineering andPlasma Technology, Ruhr-Universität Bochum
[30] Rajasekaran P, Bibinov N and Awakowicz P 2012 Meas. Sci.Technol. 23 085605
[31] Rajasekaran P et al 2009 J. Phys. D: Appl. Phys. 42 225201[32] Tendero C et al 2006 Spectrochim. Acta Part B 61 2[33] Glicksman L R, Hyre M and Woloshun K 1993 Powder
Technol. 77 177[34] Horio M et al 1989 J. Chem. Eng. Jpn. 22 587[35] Kehlenbeck R et al 2001 AIChE J. 47 582[36] Kriegseis J et al 2011 J. Electrostat. 69 302[37] Zulazlan A et al 2016 J. Telecommunic. Electron. Comput.
Eng. 8 63[38] Fang Z et al 2008 J. Electrostat. 66 421[39] Xia L Y et al 2008 J. Hazard. Mater. 152 113[40] Wang T and Sun B M 2016 Fuel Process. Technol. 144 109
Figure 14. Variation of the factors from equations (1) and (3) as aresult of a variation in exponent a with (a) exponent b = 0.7. (b)b = 1.1. (c) b =1.5.
10
Plasma Sci. Technol. 19 (2017) 095402 M T Lim et al

![FILM THICKNESS MAPPING IN LUBRICATED … film thickness determination as a function of dimensionless speed and load parameter [Hamrock 1978]. Later, the equation based on](https://img.pdfslide.us/doc/110x75/5aab4ba67f8b9a693f8bb991/film-thickness-mapping-in-lubricated-film-thickness-determination-as-a-function.jpg)