Embed Size (px)
Citation preview
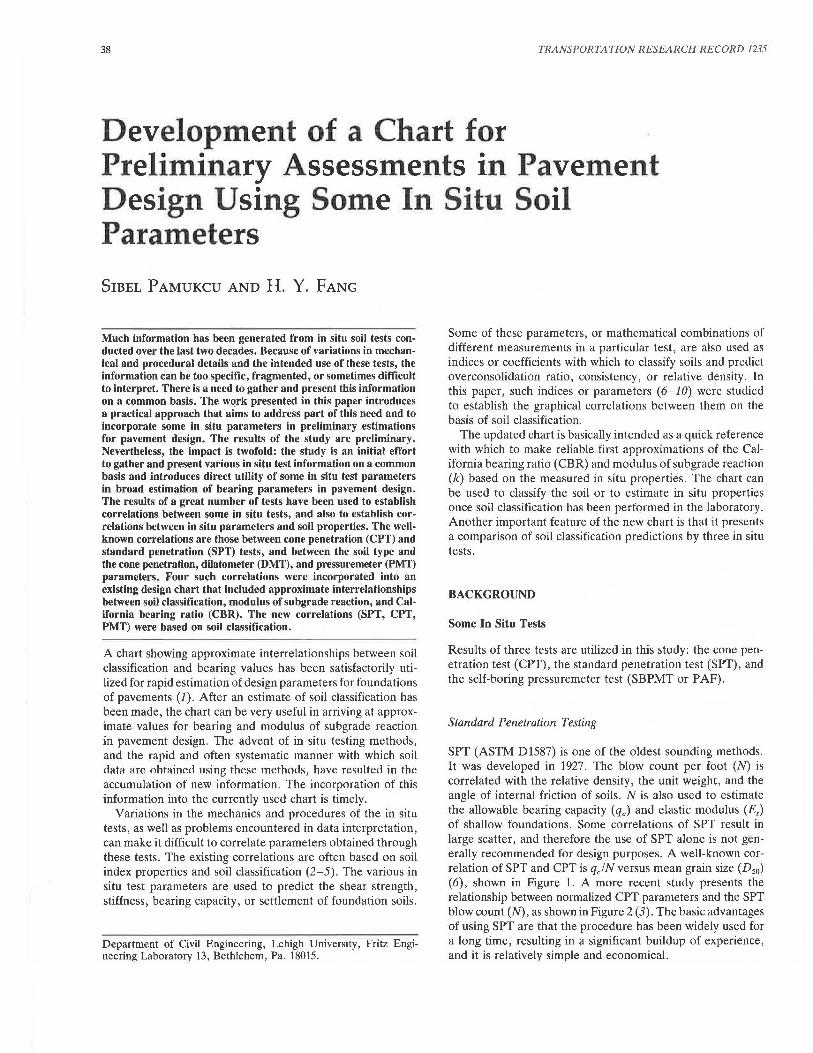
38 TRANSPORTATION RESEARCH RECORD 1235
Development of a Chart for Preliminary Assessments in Pavement Design Using Some In Situ Soil Parameters
SIBEL PAMUKCU AND H. Y. FANG
Much information has been generated from in situ soil tests conducted over the last two decades. Because of variations in mechanical and procedural details and the intended use of these tests, the information can be too specific, fragmented, or sometimes difficult to interpret. There is a need to gather and present this information on a common basis. The work presented in this paper introduces a practical approach that aims to address part of this need and to incorporate some in situ parameters in preliminary estimations for pavement design. The results of the study are preliminary. Nevertheless, the impact is twofold: the study is an initial effort to gather and present various in situ test information on a common basis and introduces direct utility of some in situ test parameters in broad estimation of bearing parameters in pavement design. The results of a great number of tests have been used to establish correlations between some in situ tests, and also to establish correlations between in situ parameters and soil properties. The wellknown correlations are those between cone penetration (CPT) and standard penetration (SPT) tests, and between the soil type and the cone penetration, dilatometer (DMT), and pressuremeter (PMT) parameters. Four such correlations were incorporated into an existing design chart that included approximate interrelationships between soil classification, modulus of subgrade reaction, and California bearing ratio (CBR). The new correlations (SPT, CPT, PMT) were based on soil classification.
A chart showing approximate interrelationships between soil classification and bearing values has been satisfactorily utilized for rapid estimation of design parameters for foundations of pavements (1). After an estimate of soil classification has been made, the chart can be very useful in arriving at approximate values for bearing and modulus of subgrade reaction in pavement design. The advent of in situ testing methods, and the rapid and often systematic manner with which soil cfatil ilre ohtilined using these methods, hilve resulted in the accumulation of new information. The incorporation of this information into the currently used chart is timely.
Variations in the mechanics and procedures of the in situ tests, as well as problems encountered in data interpretation, can make it difficult to correlate parameters obtained through these tests. The existing correlations are often based on soil index properties and soil classification (2-5). The various in situ test parameters are used to predict the shear strength, stiffness, bearing capacity, or settlement of foundation soils.
Department of Civil Engineering, Lehigh University, Fritz Engineering Laboratory 13, Bethlehem, Pa. 18015.
Some of these parameters, or mathematical combinations of different measurements in a particular test, are also used as indices or coefficients with which to classify soils and predict overconsolidation ratio, consistency, or relative density. In this paper, such indices or parameters ( 6-10) were studied to establish the graphical correlations between them on the basis of soil classification.
The updated chart is basically intended as a quick reference with which to make reliable first approximations of the California bearing ratio (CBR) and modulus of subgrade reaction (k) based on the measured in situ properties. The chart can be used to classify the soil or to estimate in situ properties once soil classification has been performed in the laboratory. Another important feature of the new chart is that it presents a comparison of soil classification predictions by three in situ tests.
BACKGROUND
Some In Situ Tests
Results of three tests are utilized in this study: the cone penetration test (CPT), the standard penetration test (SPT), and the self-boring pressuremeter test (SBPMT or PAF).
Standard Penetration Testing
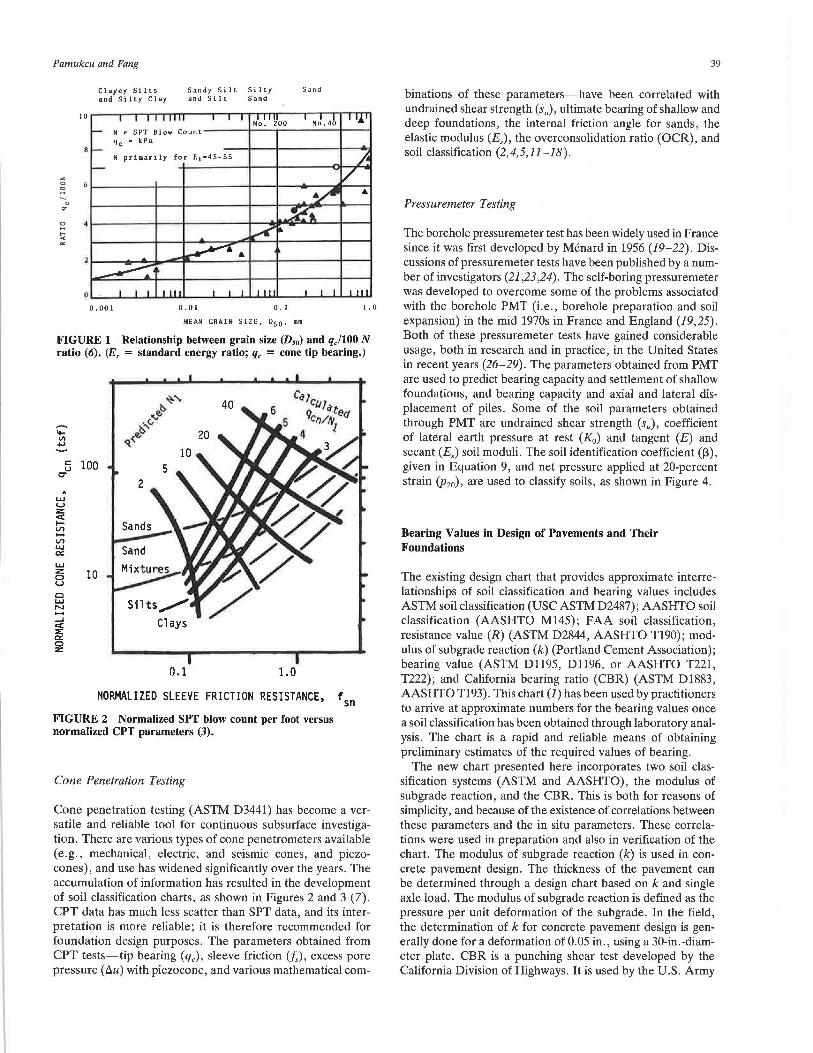
SPT (ASTM D1587) is one of the oldest sounding methods. It was developed in 1927. The blow count per foot (N) is correlated with the relative density, the unit weight, and the angle of internal friction of soils. N is also used to estimate the allowable bearing capacity (qa) and elastic modulus (Es) of shallow foundations. Some correlations of SPT result in large scatter, and therefore the use of SPT alone is not generally recommended for design purposes. A well-known correlation of SPT and CPT is qJN versus mean grain size (D50)
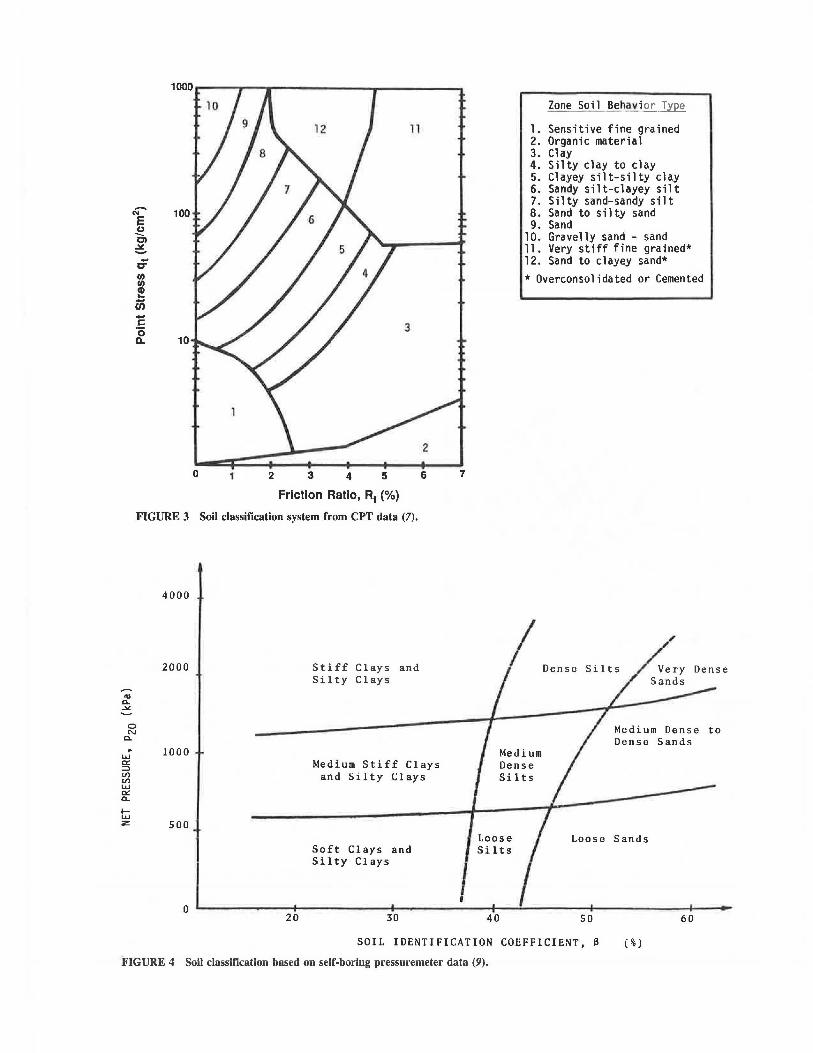
(6), shown in Figure 1. A more recent study presents the relationship between normalized CPT parameters and the SPT blow count (N), as shown in Figure 2 (3). The basic advantages of using SPT are that the procedure has been widely used for a long time, resulting in a significant buildup of experience, and it is relatively simple and economical.
Pamukcu and Fang
z 0 0
' u
"
Clayey Silts and Silty Clay
Sandy Silt and Silt
0 .
0 .00 I
N 5 SPT Blow Count qc • kPa
N primarily for Er:4S-55
0.01
Silty Sand
0. I
MEAN GRAIN SIZE, Dso· mm
Sand
I. 0
FIGURE 1 Relationship between grain size (D50) and q)lOO N ratio (6). (E, = standard energy ratio; qc = cone tip bearing.)
~
~ VI ...,
c: 100 u c:::r
~
LLJ u z: <C I-V') ..... V') LLJ ex: LLJ z: 10 0 u c LLJ N ..... ...J <C ::i;: ex: 0 z:
0.1 1.0
NORMALIZED SLEEVE FRICTION RESISTANCE, f sn
FIGURE 2 Normalized SPT blow count per foot versus normalized CPT parameters (3).
Cone Penetration Testing
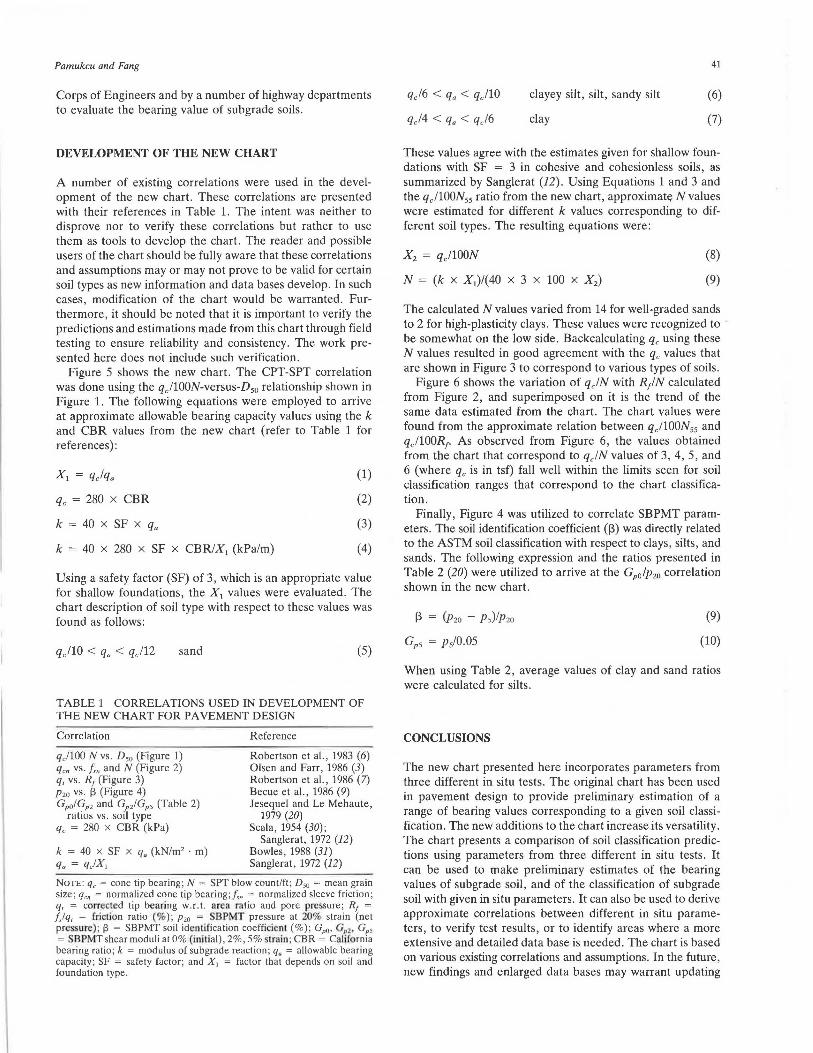
Cone penetration testing (ASTM D3441) has become aversatile and reliable tool for continuous subsurface investigation. There are various types of cone penetrometers available (e.g., mechanical, electric, and seismic cones, and piezocones), and use has widened significantly over the years. The accumulation of information has resulted in the development of soil classification charts, as shown in Figures 2 and 3 (7). CPT data has much less scatter than SPT data, and its interpretation is more reliable; it is therefore recommended for foundation design purposes. The parameters obtained from CPT tests-tip bearing (qc), sleeve friction Us), excess pore pressure (liu) with piezocone, and various mathematical com-
39
binations of these parameters-have been correlated with undrained shear strength (s u), ultimate bearing of shallow and deep foundations, the internal friction angle for sands, the elastic modulus (Es), the overconsolidation ratio (OCR), and soil classification (2,4,5,11-18).
Pressuremeter Testing
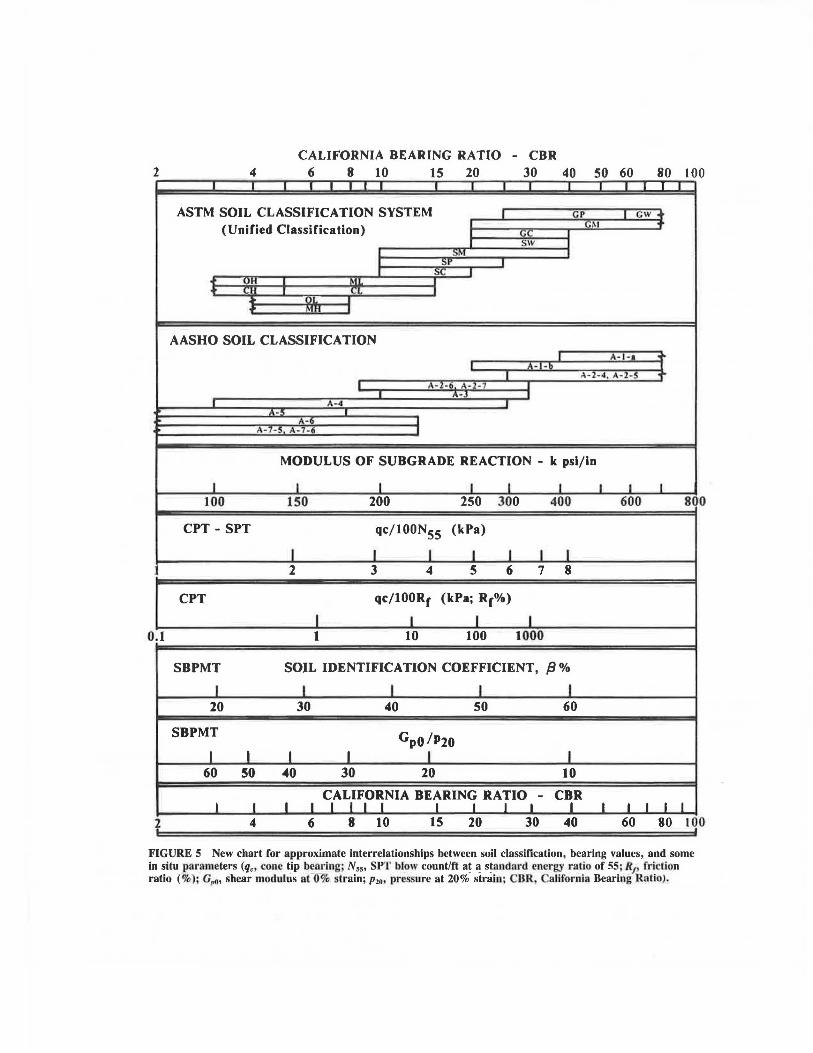
The borehole pressuremeter test has been widely used in France since it was first developed by Menard in 1956 (19-22). Discussions of pressuremeter tests have been published by a number of investigators (21,23,24). The self-boring pressuremeter was developed to overcome some of the problems associated with the borehole PMT (i.e., borehole preparation and soil expansion) in the mid 1970s in France and England (19,25). Both of these pressuremeter tests have gained considerable usage, both in research and in practice, in the United States in recent years (26-29). The parameters obtained from PMT are used to predict bearing capacity and settlement of shallow foundations, and bearing capacity and axial and lateral displacement of piles. Some of the soil parameters obtained through PMT are undrained shear strength (sJ, coefficient of lateral earth pressure at rest (K0 ) and tangent (E) and secant (Es) soil moduli. The soil identification coefficient (f3), given in Equation 9, and net pressure applied at 20-percent strain (p20), are used to classify soils, as shown in Figure 4.
Bearing Values in Design of Pavements and Their Foundations
The existing design chart that provides approximate interrelationships of soil classification and bearing values includes ASTM soil classification (USC ASTM D2487); AASHTO soil classification (AASHTO M145); FAA soil classification, resistance value (R) (ASTM D2844, AASHTO T190); modulus of sub grade reaction ( k) (Portland Cement Association); bearing value (ASTM D1195, D1196, or AASHTO T221, T222); and California bearing ratio (CBR) (ASTM D1883, AASHTO T193). This chart (1) has been used by practitioners to arrive at approximate numbers for the bearing values once a soil classification has been obtained through laboratory analysis. The chart is a rapid and reliable means of obtaining preliminary estimates of the required values of bearing.
The new chart presented here incorporates two soil classification systems (ASTM and AASHTO), the modulus of subgrade reaction, and the CBR. This is both for reasons of simplicity, and because of the existence of correlations between these parameters and the in situ parameters. These correlations were used in preparation and also in verification of the chart. The modulus of subgrade reaction (k) is used in concrete pavement design. The thickness of the pavement can be determined through a design chart based on k and single axle load. The modulus of subgrade reaction is defined as the pressure per unit deformation of the subgrade. In the field, the determination of k for concrete pavement design is generally done for a deformation of 0.05 in., using a 30-in.-diameter plate. CBR is a punching shear test developed by the California Division of Highways. It is used by the U.S. Army
Zone Soil Beh~_yi or ~
1. Sensitive fine grained 2. Organic material 3. Clay 4. Silty clay to clay 5. Clayey silt-silty clay 6. Sandy silt-clayey silt 7. Silty sand-sandy silt
100 8. Sand to silty sand 9. Sand
10. Gravelly sand - sand 11. Very stiff fine grained* 12. Sand to clayey sand* * Overconsolidated or Cemented
-c "() ll. 10
0 2 3 4 5
Friction Ratio, R1 (%)
FIGURE 3 Soil classification system from CPT data (7).
4000
2000 Stiff Clays and Silty Clays
6 7
I "'"" Silt'
0 N
a. Dense Sands . ..... er: :::> V) V) ..... er: a.. 1-.....
1000
z 500
0 20
Medium Stiff Clays and Silty Clays
Soft Clays and Silty Clays
30
Medium Dense Silts
Loose Silts
40
Loose Sands
so
SOIL IDENTIFICATION COEFFICIENT, a (%)
FIGURE 4 Soil classification based on self-boring pressure1neter data (9).
60
Dense
to
Pamukcu and Fang
Corps of Engineers and by a number of highway departments to evaluate the bearing value of subgrade soils.
DEVELOPMENT OF THE NEW CHART
A number of existing correlations were used in the development of the new chart. These correlations are presented with their references in Table 1. The intent was neither to disprove nor to verify these correlations but rather to use them as tools to develop the chart. The reader and possible users of the chart should be fully aware that these correlations and assumptions may or may not prove to be valid for certain soil types as new information and data bases develop. In such cases, modification of the chart would be warranted. Furthermore, it should be noted that it is important to verify the predictions and estimations made from this chart through field testing to ensure reliability and consistency. The work presented here does not include such verification.
Figure 5 shows the new chart. The CPT-SPT correlation was done using the qJ100N-versus-D50 relationship shown in Figure 1. The following equations were employed to arrive at approximate allowable bearing capacity values using the k and CBR values from the new chart (refer to Table 1 for references) :
qc = 280 x CBR
k = 40 x SF x q0
k = 40 x 280 x SF x CBR/X1 (kPa/m)
(1)
(2)
(3)
(4)
Using a safety factor (SF) of 3, which is an appropriate value for shallow foundations, the X 1 values were evaluated. The chart description of soil type with respect to these values was found as follows:
qJlO < q0 < qJl2 sand (5)
TABLE 1 CORRELATIONS USED IN DEVELOPMENT OF THE NEW CHART FOR PAVEMENT DESIGN
Correlation
qJlOO N vs. D50 (Figure 1) qcn vs. Is .. and N (Figure 2) q, vs. Rr (Figure 3) P20 vs. 13 (Figure 4) GpolGP2 and GP2 /GP5 (Table 2)
ratios vs. soil type qc = 280 x CBR (kPa)
k = 40 x SF x q0 (kN/m2 • m) q. = qJX1
Reference
Robertson et al., 1983 (6) Olsen and Farr, 1986 (3) Robertson et al., 1986 (7) Becue et al., 1986 (9) Jesequel and Le Mehaute,
1979 (20) Scala, 1954 (30);
Sanglerat, 1972 (12) Bowles, 1988 (31) Sanglerat, 1972 (12)
NoTE: q, = cone tip bearing; N = SPT blow count/ft; D50 = mean grain size; q'" = normalized cone tip bearing;f,,, = normalized sleeve friction; q, = corrected tip bearing w.r.t. area ratio and pore pressure; R1 = f,lq, = friction ratio (%); p 20 = BPMT pressure at 20% strain (net pressure); 13 = SBPMT soil iden tifi cation coefficient (%); Gp-0, Gp2 , Cps = SBPMTshear moduli at 0% (initial) , 2%, 5% train; CBR = California bearing ratio; k = modulus of subgrade reaction; q0 = allowable bearing capacity; SF = safety factor; and X, = factor that depends on soil and foundation type .
qc/6 < qa < qJlO
qc/4 < q. < qJ6
clayey silt, silt, sandy silt
clay
41
(6)
(7)
These values agree with the estimates given for shallow foundations with SF = 3 in cohesive and cohesionless soils, as summarized by Sanglerat (12). Using Equations 1 and 3 and the qJ100N55 ratio from the new chart, approximat<; N values were estimated for different k values corresponding to different soil types. The resulting equations were:
X 2 = qJlOON
N = (k x X1)/(40 x 3 x 100 x X 2 )
(8)
(9)
The calculated N values varied from 14 for well-graded sands to 2 for high-plasticity clays. These values were recognized to be somewhat on the low side. Backcalculating qc using these N values resulted in good agreement with the qc values that are shown in Figure 3 to correspond to various types of soils.
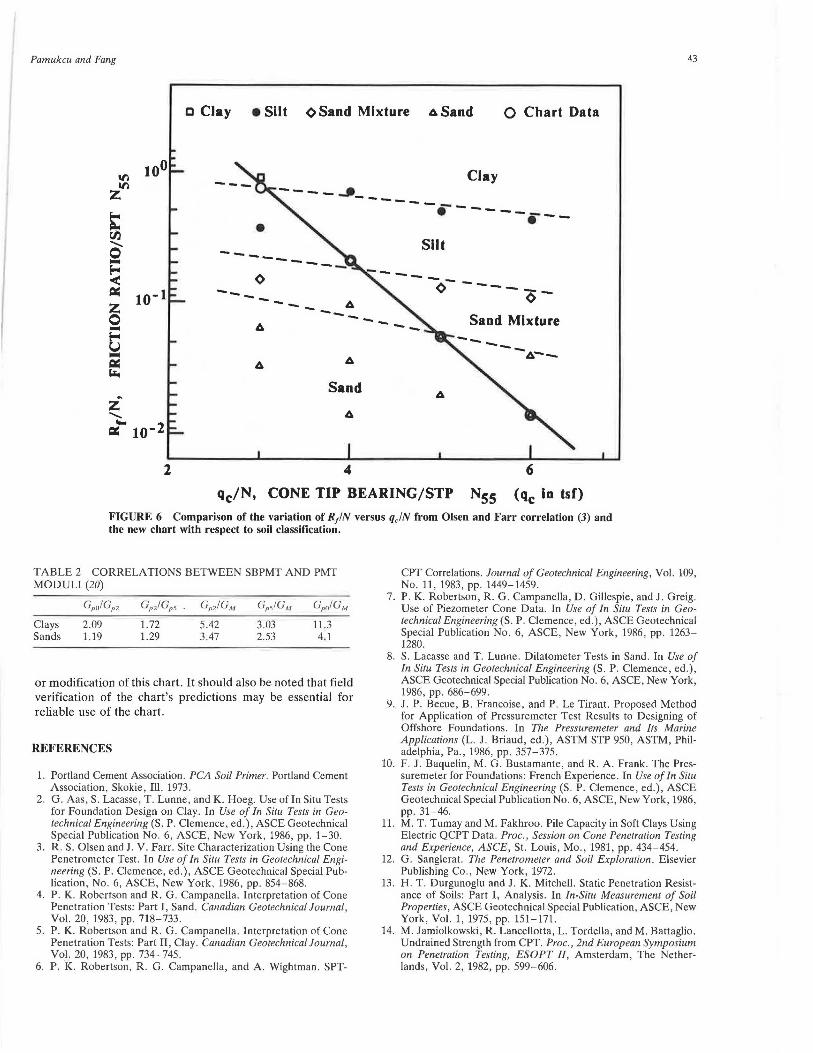
Figure 6 shows the variation of qc/N with R1/N calculated from Figure 2, and superimposed on it is the trend of the same data estimated from the chart. The chart values were found from the approximate relation between qJ100N55 and qJlOOR1. As observed from Figure 6, the values obtained from the chart that correspond to qJN values of 3, 4, 5, and 6 (where qc is in tsf) fall well within the limits seen for soil classification ranges that correspond to the chart classification.
Finally, Figure 4 was utilized to correlate SBPMT parameters. The soil identification coefficient(~) was directly related to the ASTM soil classification with respect to clays, silts, and sands. The following expression and the ratios presented in Table 2 (20) were utilized to arrive at the GP0/p 20 correlation shown in the new chart.
~ = (p20 - Ps)/P20
Gps = p5/0 .05
(9)
(10)
When using Table 2, average values of clay and sand ratios were calculated for silts.
CONCLUSIONS
The new chart presented here incorporates parameters from three different in situ tests. The original chart has been used in pavement design to provide preliminary estimation of a range of bearing values corresponding to a given soil classification. The new additions to the chart increase its versatility. The chart presents a comparison of soil classification predictions using parameters from three different in situ tests . It can be used to make preliminary estimates of the bearing values of subgrade soil, and of the classification of subgrade soil with given in situ parameters. It can also be used to derive approximate correlations between different in situ parameters, to verify test results, or to identify areas where a more extensive and detailed data base is needed. The chart is based on various existing correlations and assumptions. In the future, new findings and enlarged data bases may warrant updating
CALIFORNIA BEARING RATIO - CBR 2 4 6 8 10 1 s 20 30 40 so 60 80 100
I I I I I I I I I I I I I I I I I I
ASTM SOIL CLASSIFICATION SYSTEM I CP I CW of'
(Unified Classification) I GM .. I GC I
I SW I
""'" I I :>Y I I sc I
• L I M I .p L I l:I. I
nt I
~·- I
AASHO SOIL CLASSIFICATION I A-l-1 +
I A-1-b I
I A-2-4, A-2-S ~ I A-1·6 A· 2. 7 I
A · .3 I I A-4 I ... ,. I
A • I> I A-7-S A·7-6 I
MODULUS OF SUBGRADE REACTION - k psi/In
I I I I I I I I I
100 lSO 200 2SO 300 400 600 80 0
CPT - SPT qc/IOONss (kPa)
I I I I I I I J 2 3 4 s 6 7 8
CPT qc/lOORr (kPa; Rr0/o)
I I I I 0 .I 1 10 100 1000
SBPMT SOIL IDENTIFICATION COEFFICIENT, /3% I I I I I
20 30 40 so 60
SBPMT Gpo/P20
I I I I I I 60 so •o 30 20 10
CALIFORNIA BEARING RA TIO - CBR I I I I I I I I I I I I I I I I I I
2 4 6 8 10 IS 20 30 40 60 80 100
FIGURE 5 New chart for approximate interrelationships between soil classification, bearing values, and some in situ parameters (q., cone tip bearing; N550 SPT blow count/ft at a standard energy raiio of 55; R1, friction ratio (%); Gro• shear modulus a(O-% strain; p20 , pressure at 20%- strain; BR, alifornia Bearing Ratio).
Pamukcu and Fang 43
c Clay • Silt ¢Sand Mixture .t.Sand 0 Chart Data
VI 100
VI z ~ rJj ......... 0 .. ~
Clay
• -------------.---------
Silt --------< ~ 10-l z 0
--- -- <>---- ---- ....... __ A ----- Sand Mixture .. ~ u ... =i:: ~
Sand ~ z
......... .... 10-2 =i::
2 4 6
qc/N, CONE TIP BEARING/STP Nss (qc In tsf)
FIGURE 6 Comparison of the variation of R1/N versus qc/N from Olsen and Farr correlation (3) and the new chart with respect to soil classification.
TABLE 2 CORRELATIONS BETWEEN SBPMT AND PMT MODULI (20)
Gp0 /Gp2 Gp2!Gps GP2/GM GP5/GM GP0 /GM
Clays 2.09 1.72 5.42 3.03 11.3 Sands 1.19 1.29 3.47 2.53 4.1
or modification of this chart. It should also be noted that fie ld verification of the chart's predictions may be essential fo r reliable use of the chart.
REFERENCES
1. Portland Cement Association . PCA Soil Primer. Portland Cement Association, Skokie, Ill. 1973.
2. G. Aas, S. Lacasse, T. Lunne, and K. Hoeg. Use of In Situ Tests for Foundation Design on Clay. In Use of In Situ Tests in Geotechnical Engineering (S. P. Clemence, ed.), ASCE Geotechnical Special Publication No. 6, ASCE, New York, 1986, pp. 1-30.
3. R. S. Olsen and J. V. Farr. Site Characterization Using the Cone Penetrometer Test. In Use of In Situ Tests in Geotechnical Engineering (S. P. Clemence, ed.), ASCE Geotechnical Special Publication, No. 6, ASCE, New York, 1986, pp. 854-868.
4. P. K. Robertson and R. G . Campanella. Interpretation of Cone Penetration Tests: Part I, Sand. Canadian Geotechnical Journal, Vol. 20, 1983, pp. 718-733.
5. P. K. Robertson and R. G . Campanella. Interpretation of Cone Penetration Tests: Part II, Clay. Canadian Geotechnical Journal, VoL 20, 1983, pp . 734-745.
6. P. K. Robertson, R. G. Campanella, and A. Wightman. SPT-
7.
CPT Correlations. Journal uf Geotechnical Engineering, Vol. 109, No . 11, 1983, pp. 1449-1459. P. K. Robertson, R. G. Campanella, D. Gillespie, and J. Greig. Use of Piezometer Cone Data. In Use of In Situ Tests in Geotechnical Engineering (S . P. Clemence, ed.), ASCE Geotechnical Special Publication No. 6, ASCE, New York, 1986, pp . 1263-1280.
8. S. Lacasse and T. Lunne. Dilatometer Tests in Sand. In Use of In Situ Tests in Geotechnical Engineering (S. P. Clemence, ed.), ASCE Geotechnical Special Publication No. 6, ASCE, New York, 1986, pp. 686-699.
9. J. P. Becue, B. Francoise, and P. Le Tirant. Proposed Method for Application of Pressuremeter Test Results to Designing of Offshore Foundations. In The Pressuremeter and Its Marine Applications (L. J. Briaud, ed.), ASTM STP 950, ASTM, Philadelphia, Pa., 1986, pp. 357-375.
10. F. J. Baquelin, M. G. Bustamante, and R. A. Frank. The Pressuremeter for Foundations: French Experience. In Use of In Situ Tests in Geotechnical Engineering (S. P. Clemence, ed.), ASCE Geotechnical Special Publication No. 6, ASCE, New York, 1986, pp. 31-46.
11. M. T. Tumay and M. Fakhroo. Pile Capacity in Soft Clays Using Electric QCPT Data. Proc., Session on Cone Penetration Testing and Experience, ASCE, St . Louis, Mo., 1981 , pp. 434-454.
12. G. Sanglerat. The Penetrometer and Soil Exploration. Elsevier Publishing Co., New York, 1972.
13. H. T. Durgunoglu and J. K. Mitchell. Static Penetration Resistance of Soils: Part I, Analysis. In In-Situ Measurement of Soil Properties, ASCE Geotechnical Special Publication, ASCE, New York, Vol. 1, 1975, pp. 151-171.
14. M. Jamiolkowski, R. Lancellotta, L. Tordella, and M. Battaglio. Undrained Strength from CPT. Proc., 2nd European Symposium on Penetration Testing, ESOPT II, Amsterdam, The Netherlands, Vol. 2, 1982, pp. 599-606.
44
15. B. J. Douglas and R. S. Olsen. Soil Classification Using Electric Cone Penetrometer. Proc., Session on Cone Penetration Testing and Experience, ASCE, St. Louis, Mo., 1981, pp. 209-227.
16. M. M. Baligh, V. Vivatrat, and C. C. Ladd. Cone Penetration in Soil Profiling. Journal of the Geotechnical Engineering Division, ASCE, Vol. 106, No. GT4, 1980, pp. 447-461.
17. P. W. Mayne. CPT Indexing of In Situ OCR in Clays. In Use of In Situ Tests in Geotechnical Engineering (S. P. Clemence, ed.), ASCE Geotechnical Special Publication No. 6, 1986, pp. 780-793.
18. J. H. Schmertmann. Guidelines for Cone Penetration Test, Performance and Design. Report 5 No. FHWA-TS-78-209. FHWA, U.S. Department of Transportation, 1978.
19. F. Baquelin et al. Self-Boring Placement Method of Soil Characteristics Measurement. Proc., Conference on Subsurface Exploration for Underground Excavation and Heavy Construction, ASCE, 1974, pp. 312-322.
20. J. F. Jezequel and A. Le Mahute. The Self-Boring Pressuremeter Model 76 (PAF 76) User's Manual. (J. Canou, translator; M. T. Tumay, ed.). Geotechnical Engineering Report No. GE-84/05. Louisiana State University, Department of Civil Engineering, November 1984 (original publication, 1979), 104 pp.
21. E . Winter. Suggested Practice for Pressuremeter Testing in Soils. Geotechnical Testing Journal, Vol. 5, No. 3, 1982, pp. 85-88.
22. J. L. Briaud and M. Gambin. Suggested Practice for Drilling Boreholes for Pressuremeter Testing. Geotechnical Testing Journal, Vol. 7, No. 1, 1984, pp. 36-40.
23. H. Y. Fang. Discussion of Pressuremeter Correlation Study. In Highway Research Record 284, HRB, National Research Council, Washington, D.C., 1969, pp. 61-62.
24. J. H. Schmertmann. Measurement of In Situ Shear Strength. Stateof-tbe Art Paper to Session III, Proc., Conference on In Situ
TRANSPORTATION RESEARCH RECORD 1235
Mea.mreml'ntofSoi! Properties, Raleigh, N.C., Vol. 2, 1975, pp. 57- 139.
25. C. P. Wroth. Tn Situ Me~smem1>nt nf Initial Stresses and Deformation Characteristics. Proc., Conference on In Situ Measurementof Soil Properties, Raleigh, N.C., Vol. 2, ASCE, New York, pp. 181-230.
26. J. L . Briaud. Pressureme1cr and Foundati n De ign. ln Use of /11 ilu Tes1s in Geoteclmical E11gi11eeri11g (S. P . Clemence, ed .). ASCE Gcotechnical Special Publica1ion No. 6, A CE, New ork, 1986, pp. 74-115.
27. J. Canou and M. T. Tumay. Field Evaluation of French SelfBoring Pressuremcter PAF 76 in oft Deltaic Louisiana lay. In The Pressuremeter and !IS Marine Applications (L. J . Briaud and M. . Audibert eds.), ASTM STP 950, ASTM. Philadelphia, Pa., 1986, pp. 97-118.
28. G. W. Clough and G. M. Denby . eH-Boring Pressuremcl'er Study on San Franci e Bay-Mud. Journal of 1he Geo1ec/111ical E11gi11eeri11g Divisio11, AS E Vol. 106, No. GT1, January 1980, pp. 45-63.
29 . I. Benoit and G. W. Clough. Self-Boring Pre uremeter Tests in Soft lay. Jo1m1<1l of Geo1echnical E11gi11eerlng, Vol. 112, No. 1, 1986, pp. 60- 78.
30. A. J. cala . The Use of Cone Penetration in Determining the Bearing Capacity of Soils: .imple Methods of Flexible Pavement Design Using Cone Penetrometers. Proc., Australia-New Zea/a11d 011fere11ce on Soil Mecha11ic~ and Fo1111dation Engineering, 2nd , anterbury Univer ity, L954 pp. 73-84.
31. J. E . Bowles. Foundation Analysis and Design, 4th ed., McGrawHill Book Company, New York, 1988.
Publication of this paper sponsored by Committee on Soil and Rock Properties.