Embed Size (px)
Citation preview

University of Massachusetts Amherst University of Massachusetts Amherst
ScholarWorks@UMass Amherst ScholarWorks@UMass Amherst
Open Access Dissertations
5-2010
Development of a Brief Rating Scale for the Formative Development of a Brief Rating Scale for the Formative
Assessment of Positive Behaviors Assessment of Positive Behaviors
James Cressey University of Massachusetts Amherst
Follow this and additional works at: https://scholarworks.umass.edu/open_access_dissertations
Part of the Psychology Commons
Recommended Citation Recommended Citation Cressey, James, "Development of a Brief Rating Scale for the Formative Assessment of Positive Behaviors" (2010). Open Access Dissertations. 248. https://scholarworks.umass.edu/open_access_dissertations/248
This Open Access Dissertation is brought to you for free and open access by ScholarWorks@UMass Amherst. It has been accepted for inclusion in Open Access Dissertations by an authorized administrator of ScholarWorks@UMass Amherst. For more information, please contact [email protected].

DEVELOPMENT OF A BRIEF RATING SCALE FOR THE
FORMATIVE ASSESSMENT OF POSITIVE BEHAVIORS
A Dissertation Presented
by
JAMES M. CRESSEY
Submitted to the Graduate School of the University of Massachusetts Amherst in partial fulfillment
of the requirements for the degree of
DOCTOR OF PHILOSOPHY
May 2010
School Psychology

© Copyright by James M. Cressey 2010
All Rights Reserved
DEVELOPMENT OF A BRIEF RATING SCALE FOR THE
FORMATIVE ASSESSMENT OF POSITIVE BEHAVIORS
A Dissertation Presented
by
JAMES M. CRESSEY
Approved as to style and content by: _______________________________________ John M. Hintze, Chairperson _______________________________________ Craig S. Wells, Member _______________________________________ Richard P. Halgin, Member
____________________________________ Christine B. McCormick, Dean School of Education

DEDICATION
To my loving partner, Brian, who always inspires me to look towards the positive, and to
my parents who instilled in me a love of learning.

v
ACKNOWLEDGMENTS
My utmost thanks go to my advisor and dissertation committee chair, John
Hintze. Thank you for your mentorship, encouragement, and the high standards to which
you have held me throughout my training. Your thoughtfulness and sense of humor have
also made this process more than just a good education. Thank you to committee member
Craig Wells, an excellent teacher and my first real guide into the infinite world of
statistics. Thank you to Rich Halgin, who served as the perfect outside committee
member, asking the questions that are impossible to think of when you are on the inside
of your own research. This dissertation was also strongly influenced by my work with
faculty members Amanda Marcotte, Bill Matthews, and Gary Stoner whose teaching and
mentorship inspire me to keep a scientific mindset while staying passionate about service
to others. My colleagues in the school psychology program have been essential supports,
particularly Lin Tang and Ben Solomon who both helped me get over speed bumps in the
road to completion, and Kristin Ezbicki who inspired me to start at all.
Many colleagues at Wediko Children’s Services also made it possible for me to
conduct this study, facilitating and supporting my access to schools and providing a
valuable outside perspective on my research. Thank you to Jim Wade, Harry Parad, and
my supervisors and colleagues who were so accommodating and supportive.
Acknowledgements are also due to Dave Beauchamp, Jean Kenney, and the other school
administrators who allowed me to collect data in their schools amidst many other duties
and tough economic times. Thank you to the many teachers who donated their valuable
time and thoughtfulness to participate in my study.

vi
ABSTRACT
DEVELOPMENT OF A BRIEF RATING SCALE FOR THE
FORMATIVE ASSESSMENT OF POSITIVE BEHAVIORS
MAY 2010
JAMES M. CRESSEY, B.A., GEORGETOWN UNIVERSITY
M.Ed., PLYMOUTH STATE UNIVERSITY
Ph.D., UNIVERSITY OF MASSACHUSETTS AMHERST
Directed by: Professor John M. Hintze
In order to provide effective social, emotional, and behavioral supports to all students,
there is a need for formative assessment tools that can help determine the responsiveness
of students to intervention. Schoolwide positive behavior support (SWPBS) is one
framework that can provide evidence-based intervention within a 3-tiered model to reach
students at all levels of risk. This dissertation begins the process of developing a brief,
teacher-completed rating scale, intended to be used with students in grades K-8 for the
formative assessment of positive classroom behavior. An item pool of 93 positively
worded rating scale items was drawn from or adapted from existing rating scales.
Teachers (n = 142) rated the importance of each item to their concept of “positive
classroom behavior.” This survey yielded 30 positively worded items for inclusion on the
pilot rating scale. The pilot scale was used by teachers to rate students in two samples
drawn from general education K-8 classrooms: a universal tier group of randomly
selected students (n = 80) and a targeted tier group of students with mild to moderate
behavior problems (n = 82). Pilot scale ratings were significantly higher in the universal
group than the targeted group by about one standard deviation, with no significant group

vii
by gender interaction. Strong results were found for the split-half reliability (.94) and the
internal consistency (.98) of the pilot scale. All but two items showed medium to large
item-total correlations (> .5). Factor analysis indicated a unidimensional factor structure,
with 59.87% of the variance accounted for by a single factor, and high item loadings
(> .4) from 26 of the 30 factors. The unidimensional factor structure of the rating scale
indicates its promise for potential use as a general outcome measure (GOM), with items
reflecting a range of social, emotional, and behavioral competencies. Future research is
suggested in order to continue development and revision of the rating scale with a larger,
more diverse sample, and to begin exploring its suitability for screening and formative
assessment purposes.

viii
TABLE OF CONTENTS Page ACKNOWLEDGMENTS ...................................................................................................v ABSTRACT ....................................................................................................................... vi LIST OF TABLES ...............................................................................................................x LIST OF FIGURES ........................................................................................................... xi CHAPTER 1. PROBLEM BACKGROUND AND LITERATURE REVIEW......................................1
Introduction ..............................................................................................................1 Theoretical Foundations...........................................................................................1 Positive Behavior Support .......................................................................................4
History of Positive Behavior Support ..........................................................4 Schoolwide Positive Behavior Support .......................................................6
Where is the Positive Behavioral Assessment? .....................................................13 Check-In Check-Out ..............................................................................................14
CICO Ratings as a Source of Assessment Data .........................................15 Shifting Assessment Paradigms .............................................................................18 Current Reforms in School-Based Assessment .....................................................18 What is Formative Assessment? ............................................................................19 Academic Formative Assessment ..........................................................................20
Curriculum-Based Measurement ...............................................................20 GOM and SSMM .......................................................................................21
Behavioral Assessment Methods ...........................................................................24 Behavioral vs. Traditional Assessment ......................................................24 Rating Scales ..............................................................................................26 Systematic Direct Observation ..................................................................30 Direct Behavior Ratings (DBRs) ...............................................................34
Purpose of the Dissertation ....................................................................................40 Research Questions ................................................................................................44
2. METHODOLOGY ........................................................................................................45
Setting and Participants..........................................................................................45 Sample Size ................................................................................................45 Recruitment Methods .................................................................................45 Incentives for Participation ........................................................................46 Teacher Respondents .................................................................................47 Target Students ..........................................................................................47

ix
Procedure ...............................................................................................................48 Item Pool Development .............................................................................48 Teacher Survey: Judicial Review of Items ................................................49 Professional Review of Pilot Rating Scale ................................................51 Pilot Rating Scale Administration .............................................................51
Data Collection Materials ......................................................................................56 Data Analytic Plan .................................................................................................57
Ordinal or Interval Scale Data? ..................................................................57 Teacher Survey Data Analysis ...................................................................58 Pilot Rating Scale Reliability and Factor Analysis ....................................59
3. RESULTS ......................................................................................................................62
Setting and Participants..........................................................................................62 Teacher Survey Results..........................................................................................64 Pilot Rating Scale Results ......................................................................................70
Student Sample Characteristics..................................................................70 Pilot Rating Scale Item Descriptive Statistics ...........................................71 Classical Item Analysis ..............................................................................75 Testing for Group Differences ...................................................................77 Testing for Group by Gender Interaction...................................................78 Factor Analytic Results ..............................................................................79 Teacher Ratings of Scale Feasibility ..........................................................83
4. DISCUSSION ................................................................................................................84
Summary of the Present Study ...............................................................................84 Teacher Survey Conclusions..................................................................................85 Pilot Rating Scale Conclusions ..............................................................................86 Links to Positive Behavior Support (PBS) Research .............................................90 Links to Response to Intervention (RTI) Research ................................................93 Limitations .............................................................................................................94 Implications for Practice ........................................................................................98 Future Research Directions ..................................................................................100
APPENDICES A. TEACHER SURVEY .................................................................................................103 B. PILOT RATING SCALE ............................................................................................111 C. LIST OF ACRONYMS ...............................................................................................118 REFERENCES ................................................................................................................120

x
LIST OF TABLES Table Page 1. Reliability and Validity as Determined in Generalizability Theory ........................... 32
2. Steps in Affective-Instrument Development (Gable & Wolf, 1993) .......................... 41
3. Sources of Rating Scale Items Used in Preliminary Item Pool .................................. 49
4. Student Demographics of Sampled Districts and Massachusetts ............................... 63
5. Descriptive Statistics for the 36 Top-Rated Items ...................................................... 66
6. Items Disqualified From the Pilot Rating Scale ......................................................... 69
7. Demographic Characteristics of Student Ratees ......................................................... 70
8. Descriptive Statistics for Pilot Rating Scale Items ..................................................... 73
9. Split-half Reliability (r) and Internal Consistency (α) ............................................... 75
10. Corrected Item-Total Correlations for Pilot Rating Scale ........................................ 76
11. Two-way ANOVA Test for Group x Gender Interaction in Summary Scores ......... 79
12. Total Variance Explained by Primary Factor ........................................................... 80
13. Item Loadings onto Primary Factor .......................................................................... 81

xi
LIST OF FIGURES
Figure Page 1. Three-tiered model of SWPBS with concentric triangles. .......................................... 10
2. Sample graph of daily progress report scores. ............................................................ 16
3. CICO-SWIS report...................................................................................................... 17
4. DBR scale (Chafouleas, McDougal, Riley-Tillman, Panahon, & Hilt, 2005). ........... 35
5. DBR using a continuous line scaling method (Chafouleas, Christ, Riley-Tillman, Briesch, & Chanese, 2007). ................................................................ 37
6. Universal and targeted groups sampled for pilot rating scale administration. ............ 43
7. Online survey format for teacher survey. ................................................................... 57
8. Online format for pilot rating scale. ............................................................................ 57
9. Scree plot representing eigenvalues for all calculated factors using total sample. ..... 80

1
CHAPTER 1
PROBLEM BACKGROUND AND LITERATURE REVIEW
Introduction
This chapter will begin by establishing the theoretical foundations of this
dissertation in behavioral assessment and positive behavior support (PBS). Next, a review
of the relevant literature will be outlined and synthesized to describe formative
assessment, its purposes, and its utility across academic and behavioral domains. The
need for reliable, valid, and feasible tools for the formative assessment of positive school
behaviors will be illustrated. Literature will also be reviewed that can provide guidance in
the development and evaluation of proposed formative behavioral assessment tools. Last,
the specific purposes of the study will be outlined and testable research questions will be
stated.
Theoretical Foundations
School psychologists are faced with a diverse set of assessment methods, tools,
and tests for the purpose of social, emotional, and behavioral assessment. The available
resources for practitioners come from an equally diverse array of theoretical perspectives,
including sub-fields of psychology and education that do not always converge in
agreement. For example, social-emotional learning exists as its own research area with
published assessment tools and interventions. Social skills, social competence, and
social-emotional learning are all terms which share common ground and common history
in the research literature and in school-based assessment practices. Likewise, functional
behavioral assessment, applied behavioral analysis, and positive behavior support share
their own common research lines, assessment tools, and intervention methods which are

2
somewhat different from the social-emotional learning approach. These two theoretical
backgrounds are also represented by separate professional organizations. The
Collaborative for Academic, Social, and Emotional Learning (CASEL) is one
professional organization that represents the theoretical foundations of emotional
intelligence and social-emotional learning which seeks to promote their perspective on
assessment and intervention in schools. Likewise, the Association for Positive Behavior
Support (APBS) represents the theoretical foundations of applied behavior analysis and
positive behavior support, bringing their perspective to school-based assessment and
intervention practices as well.
In reviewing the PBS and SEL literature bases, it is rare to find cross-referencing,
collaboration, or dialogue that addresses the other perspective or body of research.
School-based practitioners, however, are most likely to work with a combination of
assessment tools and interventions in the field. They are faced with the need for
assessments and interventions that will address the whole picture of students’ skills and
performance in these interconnected competencies. While researchers are more likely to
stay within narrower lines of study and maintain a stricter theoretical perspective,
practitioners are more likely to follow a pragmatic approach, combining tools and
programs that work for their settings and populations. Current models of training for
school psychologists encourage them to approach the practice of social, emotional and
behavioral assessment from a clearly articulated theoretical foundation, through synthesis
rather than eclecticism (Merrell, 2008a). In other words, with such diverse resources
available, practitioners should combine methods and tools in a thoughtful way, not with a
random or simply convenient approach. One purpose of this dissertation is to draw from

3
research from PBS and SEL backgrounds and to make use of existing assessment tools
from both areas in order to begin development of a new instrument to measure positive
classroom behavior.
That being stated, it seems necessary to choose one clearly articulated and
cohesive body of research to review for this dissertation. Behaviorally-oriented
assessment has established a strong record of success in schools, in particular over the
past 35 years since special education services became federally mandated. Because
federal laws required the use of Functional Behavioral Assessments (FBA), and later
positive behavioral interventions and supports (PBS) for special education students, these
practices became an important part of the practice of school psychology. More recently,
PBS has been expanded into prevention-level services for all students, in general and
special education, with the development of Schoolwide Positive Behavior Support
(SWPBS). The key intervention practices of PBS are squarely oriented to behavioral
intervention and assessment, but with a great deal of flexibility that allows for social-
emotional learning (SEL) to be incorporated into its comprehensive system. PBS is also
an area in which intervention practices are numerous and have demonstrated
effectiveness, but where a need exists for continued research and development of reliable,
valid, and feasible assessment methods and tools.
This dissertation will be grounded in a theoretical foundation of behavioral
assessment and positive behavior support and will aim to provide some contribution to
these areas of research. The purpose of the dissertation is to conduct an empirical
investigation of positive behavioral formative assessment methods. Efforts will also be

4
made to synthesize assessment methods from social-emotional, social skills, and
behavioral backgrounds in order to maintain a pragmatic approach to assessment.
Positive Behavior Support
Before reviewing the evidence and research related to formative assessment and
behavioral assessment, some background information on positive behavioral
interventions and supports (PBS) will be helpful. A thorough understanding of the PBS
intervention approach is desirable before attempting to investigate the options for
effective formative assessment methodologies.
History of Positive Behavior Support
Positive behavior support (PBS) describes an approach to behavioral intervention
that focuses on the use of positive reinforcement, acknowledgement, and rewards, while
eschewing the use of aversive behavior modification techniques, particularly for
individuals with disabilities. PBS originally was developed as a movement that was
started within the practice of applied behavior analysis (ABA). Singer and Wang (2009)
characterize the initial PBS work as “a breakaway movement from ABA based on moral
objections” (p. 21). During the 1980s, behavioral psychologists, special educators, and
other mental health professionals were engaged in ongoing debates and controversies
over the use of aversive behavioral interventions that included the delivery of punishment
and pain. On one side of the debate was a group who felt strongly that aversive
treatments were inappropriate and inhumane for individuals with severe developmental
disabilities. The PBS approach was initiated during the late 1980s and became a distinct
approach by 1987, when a federal research grant was issued by the U.S. Department of
Education to fund a center to study the use of nonaversive behavioral support, soon to be

5
termed “positive behavior support” by the researchers (Dunlap, Sailor, Horner, & Sugai,
2009). During the 1990s, the PBS approach was applied widely with students with
developmental disabilities, and expanded into use with other populations as well. It was a
decade or so later that PBS began to be applied as a preventative, whole-school measure
with general education students as well.
In response to the success of PBS with students across a range of special
education categories, the 1997 reauthorization of the Individuals with Disabilities
Education Act (IDEA) included new language requiring the use of “positive behavioral
intervention strategies and supports” (PBIS) for any child in special education with
emotional and behavioral problems (IDEA, 1997). The following year, in 1998, in
response to this new call for more formal and widespread use of PBS, the U.S. Office of
Special Education Programs (OSEP) created an online technical assistance center with
resources for educators and administrators who are implementing PBS (Sugai et al.,
2000). The Journal for Positive Behavioral Interventions emerged in 1999 as a dedicated
publication to the research and practice of PBS. In 2003, an international professional
organization called the Association for PBS (APBS) was formed and began to sponsor
national conferences. As a critical mass of PBS-oriented researchers and practitioners
began to form, so did the expansion of PBS into more preventative, school-wide systems.
Subsequently, the first efforts to develop and implement SWPBS were begun in the late
1980s and early 1990s (Colvin, Kame’enui, & Sugai, 1993; Sugai & Horner, 2009;
Walker, Horner, Sugai, Bullis, 1996).

6
Schoolwide Positive Behavior Support
Concurrent with the progression of interest in PBS during the 1990s and 2000s, a
shift in education has taken place toward prevention, response-to-intervention (RTI)
methods, and a 3-tiered model of service delivery in academic as well as behavioral
systems. SWPBS is an approach that combines the methods and principles of PBS with
this emerging focus on universal prevention as well as the need for evidence-based
practices in schools (Sugai, 2007). This alignment between SWPBS, prevention, and RTI
helped to promulgate the potential of SWPBS as an effective system for schools and
school districts to adopt. State-wide SWPBS initiatives have begun to emerge as the
approach has demonstrated its effectiveness and efficiency, making it an attractive option
for universal implementation. As of October 2008, a nationwide survey found that
SWPBS is being implemented in 7,953 schools in the United States, more than half of
which are elementary schools. There are 31 states with a statewide SWPBS team, and 47
states with some level of SWPBS implementation reported (Spaulding, Horner, May, &
Vincent, 2008).
SWPBS is still a young, developing model of prevention and intervention, which
continues to be refined through research. Sugai and Horner (2009) remind us that “SW-
PBS is not a curriculum, intervention, or program. However, it is an approach designed to
improve the adoption, accurate implementation, and sustained use of evidence-based
practices related to behavior and classroom management and school discipline systems.”
(Sugai & Horner, 2009, p. 309). They go on to summarize the key theoretical and
conceptual components of SWPBS in its present form. Five core components can be
described as forming the foundation of SWPBS. Behavioral theory and applied

7
behavioral analysis (ABA) are the first and earliest influences on SWPBS. The use of
positive reinforcement and functional behavioral assessment (FBA) are perhaps the
strongest underlying influences of SWPBS in practice. Second, the focus on prevention is
a key feature that distinguishes SWPBS from individually applied PBS. Third, an
instructional focus permeates the interventions and behavioral teaching practices that
comprise SWPBS. Fourth, SWPBS draws from evidence-based behavioral practices to
ensure that effective, tested strategies are used in schools. Last, the tactic of a systems
approach is a defining feature of SWPBS, making use of existing school resources and
structures to infuse the culture and practices of the school system with the SWPBS
approach (Sugai & Horner, 2009). Given these theoretical features of SWPBS, we now
must describe the key features of SWPBS as it is implemented in practice.
Establishing Positive Behavioral Expectations
In SWPBS, rules for student behavior are made explicit, simple, and consistent.
Three to five core expectations are chosen for the entire school. McCurdy, Manella, and
Eldridge (2003) list, “Be Responsible, Be Respectful, Be Ready” as the core expectations
of an urban elementary school that used SWPBS to reduce disruptive and anti-social
behavior. These core expectations were established by the SWPBS team in collaboration,
prior to the start of the first school year of SWPBS implementation. “Be Responsible, Be
Respectful, Be Ready” was selected as the overarching set of expectations for the school.
Then, each of these 3 expectations was explicitly defined in a matrix target behaviors for
each environment of the school, such as the cafeteria, classroom, hallways, playground,
etc. Specific behaviors such as “Use a quiet voice at all times” were phrased in the
positive voice, rather than the use of “Do not” phrasing (e.g., “do not talk in a loud
8
voice”). Target behaviors were clearly posted in each school environment so that students
know how and when to follow them.
Teaching Specific Target Behaviors
Posting a matrix of behavioral expectations on the wall alone is not a strong
enough intervention to produce behavioral change and promote learning. Teachers must
explicitly teach the target behaviors to their students, often at the beginning of the school
year and in follow-up sessions throughout the year. Teachers in the school reported by
McCurdy et al., (2003) planned behavioral lessons to be taught at the beginning of the
school year, and booster sessions to follow-up at key times throughout the year. The
expectations and target behaviors were taught by teachers to their students, in classroom
settings as well as in other target environments of the school.
System to Acknowledge and Reinforce Positive Behavior
SWPBS provides acknowledgement or positive reinforcement for successfully
meeting behavioral expectations. Acknowledgement systems can be similar to a
traditional token economy historically used in behavioral intervention systems. In
addition to tokens or tickets, acknowledgement is also provided to capitalize and
emphasize positive social attention from teachers as an important prosocial source of
positive reinforcement. “Top Dawg” tickets and “T.N.T.” (teachers noticing talent)
tickets are two examples of acknowledgement systems that have been used in middle
schools (Metzler, Biglan, Rusby & Sprague, 2001). Students are then able to exchange
their tickets to purchase prizes or use such in a school-wide raffle. A student who exhibits
more serious problem behaviors or rule violations could be a candidate for individualized

9
intervention, which often consists of higher levels of positive reinforcement, explicit
instruction, and modeling.
Procedures to Correct Misbehaviors
Equally important to a consistent system of acknowledgment is a consistent
system of correction procedures that teachers and staff use to respond to problem
behaviors. When SWPBS is implemented in a school, the existing policies for office
discipline referrals, detentions and suspensions may still be kept as part of the system.
However, teachers are encouraged and supported in their use of immediate corrective
feedback after a behavioral problem has occurred. The instructional focus of SWPBS
indicates that students should be provided with corrective feedback and reminders of the
correct target behaviors they should be using in that time and place. Teachers are
encouraged to respond to behavioral problems in a similar fashion as they respond to
academic problems: with correction and teaching.
Three-tiered Model of SWPBS
As positive behavior support has expanded from use with individual students to a
school-wide model of prevention and intervention, it has often been incorporated into a 3-
tiered model of service delivery. The 3-tiered model was adapted from the field of public
health and uses a population based framework for providing both academic and
behavioral prevention and intervention programming. The graphic representation of the
3-tiered model of intervention is often presented as a triangle with three horizontal levels
representing the three tiers. Figure 1 presents an alternative graphic, showing the tiers as
concentric triangles, with the universal tier encompassing all students, the targeted tier as
a subset of the universal, and the individualized tier at the center. This was designed in

10
order to emphasize the fact that universal interventions are provided to all students, with
targeted and individualized interventions being added on as additional supports to the
students who are identified as being in need of them.
Figure 1. Three-tiered model of SWPBS with concentric triangles.
Thus, in a school using SWPBS, all students are served at the primary prevention
level with universal programming and interventions. This tier of intervention is referred
to as Tier I, the universal tier, or the primary tier in current literature. SWPBS seeks to
focus a significant amount of effort into these primary levels of prevention, as described
in the components above, in order to reach as many students as possible with a supportive
and positive system.

11
Students who receive the universal tier of interventions but still exhibit mild to
moderate levels of behavior problems are identified as being in need of targeted
interventions, also referred to as Tier II or secondary tier interventions. The targeted tier
of SWPBS interventions will be the primary focus of the literature review, and in
particular, the assessment tools and methods which can be used to monitor the
effectiveness of these interventions. Targeted interventions and assessment tools are
typically of a more intense frequency, duration, and specificity than in the universal tier.
For example, additional explicit teaching and reinforcement of target behaviors may be
provided to small groups of selected students who demonstrate the need for additional
repetitions. However, the interventions are not fully individualized for each student
(Crone, Horner, & Hawken, 2004).
Students who are not successful with universal and targeted tiers of intervention
are typically those presenting with the most severe, high-risk behavior problems. These
students are in need of an individualized tier of support, also referred to as Tier III or
tertiary intervention (Sugai, 2007). These students are typically in need of more
comprehensive, individualized assessments. They are also more likely to be provided
with more restrictive educational placements and special education services.
Data-Based Decision Making
Another important feature of SWPBS is the use of data collection to inform
decisions about how to meet the needs of all students along the 3-tier continuum of
service delivery. Data collection is often done using two systems generated specifically
for use in SWPBS schools: the School-Wide Evaluation Tool (SET; Horner et al., 2004)
and the School-Wide Information System (SWIS; Educational and Community Supports,

12
2007). The SET is used to measure the treatment integrity of SWPBS practices in
teachers and staff. The SWIS is an online database that is used to record office discipline
referrals (ODRs), suspensions, detentions, and other office records of student conduct
problems. Once collected, data can be summarized detailed by student, by grade level, by
referring teacher, by location in the school, by type of infraction, by time of day, and by
time of year (month) (e.g., Clonan, McDougal, Clark & Davison, 2007). Data summaries
are then used by a SWPBS team on a monthly basis to review overall progress toward
desired goals and/or for formative intervention planning. (e.g., increase hallway
supervision after meals, provision of additional support staff in particular grades, altering
the bus dismissal routine to improve student behavior, etc.).
The emphasis that is placed on data-based decision making and formative
assessment in a SWPBS approach is the reason that more research is needed to
investigate and develop assessment methods and tools with reliability, validity, and
feasibility. Applying the steps of the problem-solving model as articulated by Bransford
and Stein (1984) and Deno (2002) requires practitioners to use measurement and
assessment information at each step of the way. However, SWPBS teams apparently
place most of their focus on the measurement of problem behaviors, via office discipline
referrals (ODRs) and the analyses made possible by the SWIS database (Newton, Horner,
Algozzine, Todd, & Algozzine, 2009). While ODRs provide appropriate information for
the problem-solving process, there seems to be a missing correlate that measures the
existence of positive behavior. For an approach that is focused squarely on establishing,
teaching, and acknowledging the use of positive target behaviors and expectations, it is
puzzling that the assessment methodologies of PBS are so oriented around negative

13
behaviors and problems. In the recently published Handbook of Positive Behavior
Support, only one chapter out of 29 total chapters is devoted to assessment, and this
chapter focuses on the data-based problem solving methods using ODRs that are
described above (Newton et al., 2009). Other chapters in this volume incorporate the use
of measurement and data collection for formative assessment purposes, however there is
little emphasis placed on measuring positive behaviors. One example, Check-In, Check-
Out (CICO; Crone et al., 2004) is presented next.
Where is the Positive Behavioral Assessment?
This dissertation proposed the question: Where is the “positive behavioral
assessment” that one might assume to exist in tandem with the PBS intervention
paradigm outlined thus far? As stated, PBS places a strong emphasis on formative
assessment and data-based decision making, but this is done primarily with the use of
problem-solving around conduct problems and ODRs in a school. To be sure, the clear
identification of problem behaviors is important, particularly within the scope of a
functional behavioral assessment. Problem behaviors must be operationally defined, and
their antecedents and consequences identified in order to design behavioral interventions
that will be successful. However, within the FBA process, once a replacement behavior is
selected and the intervention begins, it is crucial to measure the student’s performance of
the positive replacement behavior. This step in the process seems to be marginalized
within many systems of school-based assessment and intervention. When positive
behaviors are measured formatively, the tools that are used have unknown reliability or
dependability for the purposes of decision-making.

14
One supportive intervention, typically used at Tier II or III of a tiered model, that
focuses on assessing and measuring positive behaviors, is called the Behavior Education
Program (BEP), and more specifically, Check-In Check-Out (CICO), as defined in
Crone, et al. (2004). Numerous studies are in publication that demonstrate the
effectiveness of CICO as an intervention that can improve student behavior (Fairbanks,
Sugai, Guardino, & Lathrop, 2007; Hawken & Horner, 2003; Hawken, 2006; March &
Horner, 2002). However, to date, studies were not found that investigate the assessment
component of CICO, by examining the psychometric properties of the measurement
methods, termed Daily Progress Reports (DPRs). The assessment component of DPRs
will be described below.
Check-In Check-Out
The CICO program, or BEP, (Crone et al., 2004) is a targeted intervention for
students who are consistently identified as in need of behavioral support in a school, but
who do not have more serious conduct problems that warrant an individualized, more
intensive intervention. Students in CICO begin their day by checking in with an identified
adult in the school. The adult gives them a Daily Progress Report (DPR) which they will
carry with them throughout the day. The DPR is a feedback mechanism by which the
student’s teachers can rate his or her behavior throughout the day, at the end of each
academic period. The DPR will typically have a place for each school period, and space
for ratings on each of the 3-5 key behavioral expectations of the school (as part of
SWPBS). The student is responsible for bringing his or her DPR to all classes and asking
the teacher to fill it out for each time period. The DPR ratings shown in Crone et al.

15
(2004) typically follow a three-level Likert scale from 0 to 2 or from 1 to 3, although one
example shown has a two-level scale instead of three.
Teachers are trained to provide only positive feedback when filling out the DPR,
finding some positive behavior the student did and make a positive, behavior, specific
comment acknowledging the student’s success. At the end of the day, the student checks
out with the same identified adult from the check in. This staff member reviews the
student’ day briefly and also provide verbal positive feedback, and in some cases a
reward would be part of the intervention as well. The student may also be assigned to
bring the DPR home to show a parent or guardian and have it signed by them, providing a
third potential for positive comments and acknowledgement of positive behaviors. The
next morning, the signed DPR is brought to the check-in to be returned to the staff
member.
CICO Ratings as Source of Assessment Data
The BEP approach suggests that CICO ratings from students DPRs should be
entered into a database or spreadsheet program each day and translated into graph
formats. CICO ratings are thereby recommended for use as a formative assessment of
students’ demonstration of positive behaviors. As shown in Figure 2 below (Hawken,
2006), the percent earned out of the total possible DPR points for a student is entered
each day. A goal of 80% is typically set as a benchmark. Thus, in the example below,
Jameson is consistently achieving above the goal line for the 9 days shown.

16
Figure 2. Sample graph of daily progress report scores.
Procedures are outlined for staff teams to use these data in monitoring students’
progress. Interventions may be changed by the team when a student is not responding.
Recently, an online data management system has been developed so that, instead of using
a local spreadsheet to compile data and generate graphs, staff members can enter DPR
ratings into the SWIS database through a web interface. As described earlier with respect
to ODRs, the SWIS tool can provide reports across groups of students, or individual
student reports. When an intervention change is made, that can be noted in the student’s
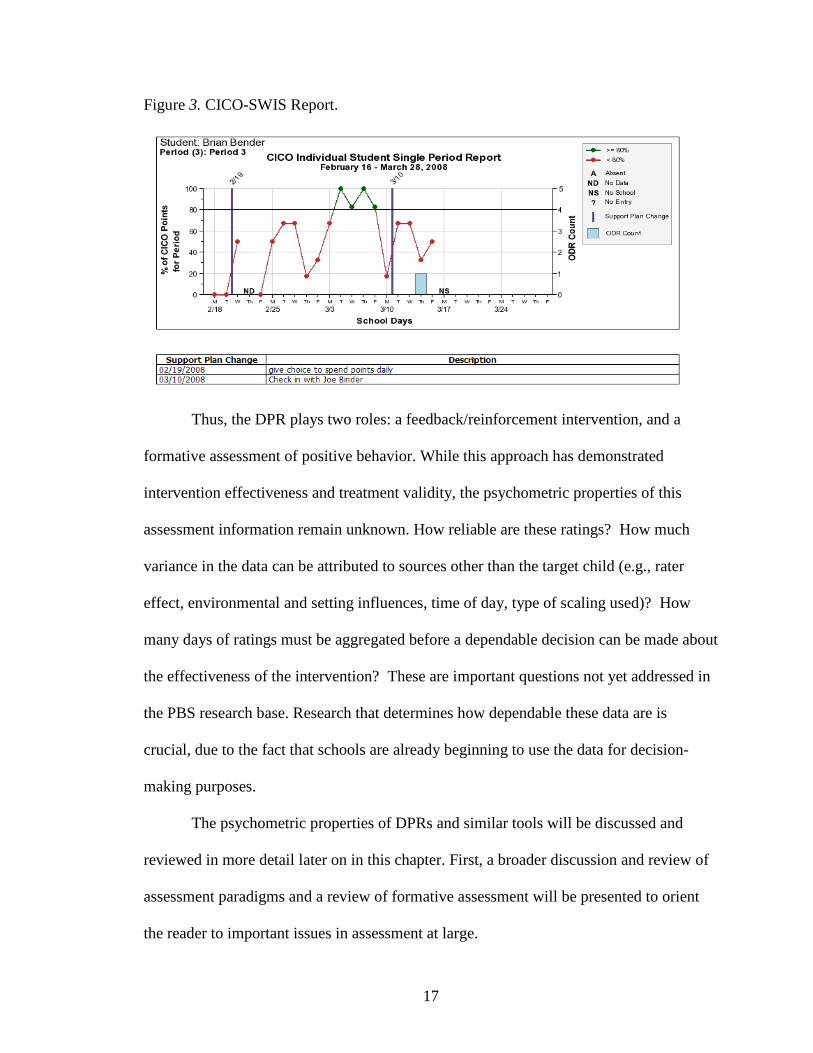
online file as well. Graphs such as the example in Figure 3 can be more comprehensive
than in the Figure 2 rendition, with support plan changes noted with vertical lines, color
coded data points to show scores above or below the goal line, and ODR data included as
a bar graph oriented to the right hand y-axis.
17
Figure 3. CICO-SWIS Report.
Thus, the DPR plays two roles: a feedback/reinforcement intervention, and a
formative assessment of positive behavior. While this approach has demonstrated
intervention effectiveness and treatment validity, the psychometric properties of this
assessment information remain unknown. How reliable are these ratings? How much
variance in the data can be attributed to sources other than the target child (e.g., rater
effect, environmental and setting influences, time of day, type of scaling used)? How
many days of ratings must be aggregated before a dependable decision can be made about
the effectiveness of the intervention? These are important questions not yet addressed in
the PBS research base. Research that determines how dependable these data are is
crucial, due to the fact that schools are already beginning to use the data for decision-
making purposes.
The psychometric properties of DPRs and similar tools will be discussed and
reviewed in more detail later on in this chapter. First, a broader discussion and review of
assessment paradigms and a review of formative assessment will be presented to orient
the reader to important issues in assessment at large.

18
Shifting Assessment Paradigms
Within the framework of school-based behavioral assessment, there are several
important purposes and perspectives to acknowledge. As has been true with academic,
cognitive, and intellectual assessments, there is a renewed emphasis on linking behavioral
assessment to research-based, effective intervention practices. School psychology has
been undergoing a period of reform in recent decades that has shifted our assessment
practices away from a sole focus on classification and diagnosis, and towards a focus on
prevention and intervention (Ysseldyke, 2006). Increasingly, school psychologists are
now trained to view themselves as data-oriented problem solvers (Merrell, 2008a).
However, these reforms are still in progress, and traditional approaches to assessment are
still in place that do not share this emphasis on prevention, intervention, and problem-
solving.
Current Reforms in School-Based Assessment
When special education became a part of federal law in the 1970s, the role of the
school psychologist became crystallized and married to the special education eligibility
determination process. Under this new legal and procedural system, the purpose of a
school psychologist’s assessment was to classify students into eligible and non-eligible
groups. The primary purpose of social-emotional and behavioral assessment was to
determine whether or not a student met the criteria for an emotional and behavioral
disorder (EBD), and was thereby eligible for special education. For a suspected learning
disability, school psychologists’ assessments were oriented around the determination of
whether or not there existed a discrepancy between the student’s IQ scores and academic
achievement test scores. If eligibility is determined based on the assessment results,

19
placement in a special education setting is the final step in this process. While a school
psychologist may make recommendations for treatment and intervention, this was not
traditionally the focus of the assessment paradigm (Reschly, 1988).
This disconnect between assessment and intervention has been a key concern
targeted for reform in recent years. School psychologists today are being trained under an
evolving model that places a stronger focus on intervention than ever before. The most
recent edition of School Psychology: A Blueprint for Training and Practice III from the
National Association of School Psychologists (NASP; Ysseldyke, et al., 2006) reflects
many of the reforms that have taken place in the field in the past decade or so. In the new
paradigm of school psychology, all assessment activities should be linked to prevention
and intervention. School psychologists, along with educators, are responsible for helping
to improve academic and behavioral outcomes for students. Assessment methods are
shifting to reflect a new emphasis on what has been termed “treatment validity” (Fuchs &
Fuchs, 1998). When assessment is geared around treatment validity and intervention
planning, we can say that the goal is assessment for learning, rather than the assessment
of learning. This leads us to the difference between formative and summative
assessment.
What is Formative Assessment?
Rather than describing specific methods or tools, the terms formative and
summative refer to two different purposes of assessment. The purpose of formative
assessment is to plan a course of instruction or intervention based on the current level of
performance of a student or group of students. Measurement is used before the
intervention begins, and/or throughout the intervention, to monitor students’ progress

20
towards learning or behavioral targets (Deno, 2002; Thorndike, 2005). The purpose of
summative assessment, on the other hand, is to determine the level of skill, achievement,
or behavior that has been reached after instruction or intervention.
When prevention is a primary goal, formative assessment must be a primary
assessment strategy. In both academic and behavioral areas, intervention decisions must
be made early and often when students are struggling. While there are fewer models for
formative assessment of behavioral progress, academic assessment methods have been
developed more thoroughly. A review of the literature on academic formative assessment
will provide us with useful and effective models that could be adapted for behavioral
application.
Academic Formative Assessment
Curriculum-Based Measurement
Formative assessment has become increasingly acceptable and useful for teachers
in the academic sphere of assessment and intervention. Since the 1970s, curriculum-
based measurement (CBM) has been used as a formative assessment tool for the basic
academic skills of oral reading, spelling, writing, and math computation Deno (2002).
The original focus of CBM as applied to formative assessment was in special education.
Educators were in need of progress monitoring tools for students who were working
towards basic academic skill goals as part of an Individualized Education Program (IEP).
The early work of Deno (1985) and colleagues (Shinn, 1989) sought to develop
assessments that met certain criteria for monitoring student progress. The measures were
designed to have: (1) links to the curriculum, (2) brief administration time, (3) multiple
parallel forms, (4) low production cost, and (5) sensitivity to academic skill improvement

21
over time (Shinn, 1989). Other key characteristics of CBM include the use of active,
production-type responses from students, such as oral reading or written text. This
illustrates the conceptual and procedural link between CBM and behavioral assessment.
In many ways, CBM is a direct measurement of academic behavior, in the natural context
of the classroom. Some behavioral assessment methods reviewed in a later section will be
quite similar in nature and will meet many of the above criteria for effective progress
monitoring tools.
A more recent development in academic formative assessment is the Dynamic
Indicators of Basic Early Literacy Skills (DIBELS; Kaminski & Good, 1998). Like the
original CBM measures described above, the DIBELS measure production-type
responses with early literacy skills. DIBELS also meets the criteria for curriculum
relevance, brevity, parallel forms, low cost, and sensitivity to change over time. DIBELS,
CBM, and other measures that are well-suited for formative assessment in academic
skills are increasingly finding favor in the development of response-to-intervention (RTI)
service delivery models (Shapiro, 2009). Their usefulness as progress monitoring tools in
the growing RTI approach has brought CBM measures further into the realms of general
education and prevention than ever before. Measures of early academic skills such as
DIBELS are uniquely geared towards prevention, focusing on screening as a formative
assessment method and a strategy for finding at-risk students in need of support as early
as Kindergarten (Kaminski & Good, 1998).
GOM and SSMM
Curriculum-based measurement is an example of General Outcome Measurement
(GOM), which will be distinguished as a different, albeit related method from Specific

22
Subskill Mastery Measurement (SSMM). Fuchs and Deno (1991) outline the two
methods of assessment and make a case for the use of GOMs when there is a need for
measurement of progress towards long-term goals and global outcomes, and a need for
standardized measurement that produces critical indicators of performance.
According to Fuchs and Deno (1991), SSMM was born out of the behaviorally-
oriented measurement systems of the 1960s. SSMM, while instructionally relevant,
focuses on formatively assessing the mastery of individual, discrete skills. Like a CBM,
SSMM probes would be brief and easy to use in a classroom. However, the scope of what
the probe measures is narrow and specific, focusing on a skill that is being taught. When
a skill (such as decoding vowel pairs) is mastered, the next skill is measured and taught
with a new SSMM test. While this type of formative assessment is instructionally
relevant in the short run, it is suggested that there may be problems associated with the
lack of measurement of long-term goals and global outcomes. GOM was introduced in
response to this concern with SSMM. GOM was developed as a formative assessment
method that would, like SSMM, measure change over time on important, instructionally
relevant skills. However two key features distinguish GOM as a different approach than
SSMM. First, GOMs seek to measure long-term goals and global outcomes. Instead of
measuring a student’s skills only with the academic skills being taught at present
(decoding vowel pairs in the SSMM example), a GOM may sample word reading and
decoding skills from across the year-long curriculum. For example, students may be
given a list of words to decode with vowel pairs, r-controlled vowel, short, and long
vowels. For second or third grades, GOM may seek to measure their ability to read
sentences and paragraphs using the subskills of word decoding. In this way, repeated use

23
of a GOM as a formative assessment measure would provide a consistent indicator of the
student’s progress towards global, long-term goals. Fuchs and Deno (1991) suggest that
GOMs can provide a piece of relevant instructional planning information that SSMM
cannot.
The second characteristic differentiating GOM from SSMM is the standardization
of equivalent, parallel forms that can be used for repeated formative assessment of the
aforementioned global outcomes. The repeated use of a standard measure avoids the
measurement shifts that come with SSMM, which must frequently change its items and
scope to match the current specific skill being taught (Fuchs & Deno, 1991). Much of the
research that has been conducted in the development and research of CBM and DIBELS
has addressed the importance of equivalent parallel forms. Research has focused on the
psychometric properties of GOMs, seeking to achieve the goal of showing growth over
time with a minimum of erroneous measurement shifts (Fuchs, Fuchs, Hamlett, Walz, &
Germann, 1993; Hintze & Shapiro, 1997; Hintze, Daly, & Shapiro, 1998; Hintze,
Shapiro, & Lutz, 1994).
The link between these academic formative assessments and intervention
planning is strong, because they are generated with the curriculum and the classroom in
mind. More importantly, empirical research has directly demonstrated the treatment
utility of CBM measures and their ability to improve educational outcomes for students
(Fuchs, 1989; Fuchs & Fuchs, 1986, 1998). While researchers continue to calibrate and
improve the technical adequacy and treatment validity of these academic measures, there
exists a strong base of converging evidence that they are effective and useful. Less
definitive is the research and evidence surrounding the use of formative assessment
24
measures for behavior. More research is needed that seeks to accomplish some of the
goals reached through the lines of research described above in the area of academic
formative assessment.
Behavioral Assessment Methods
Merrell (2008a) summarizes the methods that are most commonly used by school
psychologists when conducting a comprehensive, broad-band assessment of a student’s
behavior. It is recommended that a comprehensive assessment should be multimethod,
multisource, and multisetting in scope. This review, however, will focus on the setting of
the classroom, and the teacher as the source of information. Some of the most common
behavioral assessment methods will be reviewed. Methods will be highlighted that are
well-suited for the formative assessment of positive behaviors. Empirical research will be
reviewed that provides guidance for researchers and practitioners who seek reliable and
valid methods for formative assessment purposes. Before outlining these specific
methods, a brief discussion of theoretical issues in traditional and behavioral assessment
will be introduced.
Behavioral vs. Traditional Assessment
In an article by Goldfried and Kent (1972), differences are outlined between
behavioral and traditional personality assessment paradigms. A key feature of traditional
personality assessment is the attempt to measure underlying, consistent personality traits
that are believed to be stable characteristics of individual persons. In this perspective, a
person’s behavior is expected to be consistent and stable, shaped by underlying
personality traits, regardless of contextual and situational variables. Behavioral
assessment, on the other hand, seeks to measure behavior in context, with the recognition

25
that environmental variables play an important role in shaping behavior. Thus, traditional
assessment places more emphasis on nomothetic comparisons between students (inter-
individual), while behavioral assessment emphasizes idiographic comparisons of a
student’s current performance with their own past and future performance (intra-
individual). Traditional assessment is also more highly inferential than behavioral
assessment.
The three aspects of traditional and behavioral assessment that may be most
relevant for the purposes of this review are the purpose, the directness and the timing of
the assessment. Regarding purpose, it is suggested that traditional personality assessment
is oriented to the diagnosis and classification of students, whereas behavioral intervention
is more focused on describing the target behaviors and maintaining conditions, in order to
plan for intervention. Regarding directness, the methods associated most closely with
traditional assessment are indirect, such as informant reports and self reports including
interviews and rating scales. Behavioral assessment methods are more likely to be direct,
such as direct observations of a student’s behavior in the natural context. Regarding
timing, traditional assessment is typically conducted pre-intervention, for diagnostic
purposes, and sometimes post-intervention. Behavioral assessment is more likely to be
ongoing and use repeated measurement throughout the course of an intervention.
(Goldfried & Kent, 1972).
To be certain, important changes in the dominant paradigms of school-based
assessment have occurred since the era during which Goldfried and Kent wrote the
aforementioned article. The use of behavioral assessment has been codified into special
education procedures with the mandate for FBA and PBIS in law (IDEA). In a

26
comprehensive assessment of a student’s behavior that might be conducted by a
contemporary school psychologist, the use of both indirect and direct assessment methods
would always be used. A combination of the above perspectives and methods is most
common in the present day (Merrell, 2008a). However, the theoretical disagreements
mentioned above with regard to etiology and inference are still not resolved in our field.
For this review, the focus will be on assessment methods which are most suitable
for the formative assessment of positive behavior. Rating scales, systematic direct
observation, and direct behavior ratings will be reviewed from a behavioral assessment
perspective.
Rating Scales
Behavior rating scales are a prominent source of information used by school
psychologists in conducting comprehensive evaluations (Merrell, 2008a). With respect to
the above discussion of traditional versus behavioral assessment, rating scales have most
often been developed with a traditional perspective, following the assumption that parents
and teachers will provide ratings that represent stable “traits” in a child’s personality.
However, the information gathered from rating scales may be used by psychologists
within a more behaviorally oriented framework. Rating scales can be used to estimate a
student’s behavior within a certain context and plan for intervention around that pattern
of environmental and behavioral variables (Chafouleas, Riley-Tillman, & Sugai, 2007).
Most rating scales also focus on negative problem behaviors, symptoms,
syndromes, and pathologies. The subscales and summary scores of most rating scales are
geared around diagnosing a disorder or representing a syndrome. Some positively worded
items and subscales are present in published rating scales, and these items will be our
27
focus for the purposes of positive behavioral assessment. Another important
characteristic of most published rating scales is their level of usefulness for repeated
measurement. The majority of scales are geared around a single administration, for the
purposes of a comprehensive assessment by a psychologist. Few published scales are
designed specifically for repeated measurement or formative assessment. Some
publishers do report the validity of their scales for repeated measurement, and these will
be presented below as well.
Rating scales are one type of informant report, meaning that a rater close to the
target student (parent, teacher, therapist, or other service provider) completes the rating
scale and returns it to a school psychologist who summarizes the ratings. Students who
are old enough may sometimes complete a self-rating. For our purposes, we are interested
in teacher-completed rating scales. Rating scales that are meant to assess a student’s
overall functioning are referred to as broad-band scales, while other scales that are meant
to assess a more specific area of social, emotional, or behavioral functioning are referred
to as narrow-band scales. Both types of rating scales will be reviewed and examples will
be provided.
Broad-band Rating Scales
Two popular broad-band teacher-completed rating scales include the Achenbach
System of Empirically Based Assessment (ASEBA; Achenbach & Rescorla, 2001) and
the Behavior Assessment Scale for Children, Second Edition (BASC-2; Reynolds &
Kamphaus 2004). The BASC-2 provides a general level of adaptive and maladaptive
functioning, and is not meant for frequent, repeated use (Riley-Tillman, Chafouleas, &
Briesch 2007; Salvia & Ysseldyke, 2001). Most of the scales that the BASC-2 yields
28
when scored are negative and symptom-oriented in nature (e.g., Hyperactivity,
Depression, Aggression). However, the BASC-2 does yield three scale scores that are
positive (Adaptability, Functional Communication, and Social Skills) and are based on
sets of 6 to 9 positively worded items (e.g., “Encourages others to do their best”).
The ASEBA does purport to be sensitive enough for repeated administrations
over time, in order to detect changes in behavior as a response to intervention, for
example (Edelbrock & Achenbach, 1984; Salvia & Ysseldyke, 2001). The scales given
by the Teacher Report Form (TRF) of the ASEBA when scored are either syndromal and
negative (e.g., Social Problems, Attention Problems) or based on DSM diagnoses (e.g.,
AD/HD, Oppositional Defiant Disorder). All of these scales are based on negatively
worded items, such as “Disrupts class discipline” and “Destroys his/her own things”.
There is one brief positively presented scale on the TRF, called the Adaptive Functioning
Scale, which is based on just 4 positively worded questions.
Narrow-band Rating Scales
The Conners Rating Scale-Revised (Conners, 1997), is one example of a narrow-
band rating scale that specifically seeks to assess the presence of problem behaviors as
symptoms of ADHD. The Conners has been used extensively as a pre- and post-
intervention measure of the effects of medication on ADHD symptoms (McMahon,
Wells, & Kotler, 2006). Frequent, multiple administrations have been researched, with
results indicating that scores seem to drift upward over time, indicating higher levels of
symptoms over time that probably do not exist; however, teachers’ rank ordering of
students remained consistent (Diamond & Deane, 1990).

29
A narrow-band scale that does have a focus on positive behaviors is the Social
Skills Improvement System (SSIS; Gresham & Elliott, 2008). While there is a Problem
Behaviors scale on the SSIS, the primary focus of the assessment is on the existence of
positive behaviors, which are summarized by the Social Skills subscales
(Communication, Cooperation, Assertion, Responsibility, Empathy, Engagement, and
Self-Control). The items that make up these subscales are positively worded; for
example, “Shows concern for others” and “Follows your directions”. The SSIS is also
linked to an intervention program and the rating scales are meant to be used as a repeated
measurement of social skills growth over time.
The School Social Behavior Scales, Second Edition (SSBS-2; Merrell, 2002) is a
similar assessment tool to the SSIS, with both a positive scale (Social Competence) and a
negative scale (Antisocial Behavior). Under the Social Competence scale are three
subscales: Interpersonal Skills, Self-Management Skills, and Academic Skills, each of
which is based on 8-14 positively worded items such as “Will give in or compromise
with peers when appropriate” and “Makes appropriate transitions between different
activities”. Research was not found that investigated the use of the SSBS as a repeated
measure of change over time.
The Social-Emotional Assets and Resiliency Scales (SEARS; Merrell, 2008b) is a
set of rating scales that is currently in development at the University of Oregon. While
subscales have not yet been identified, 54 positively worded items are included in the
pilot version of the teacher scale. Examples include “Works well with other students on
group projects” and “Stays in control when he/she gets angry”.

30
Psychometric Properties of Rating Scales
Published rating scales such as those reviewed here are generally found to
demonstrate adequate levels of reliability (test-retest, internal consistency, and interrater
reliability being the most common), particularly when compared with assessment
methods such as unstructured interviews and projective-expressive techniques (Merrell,
2008a). This is most likely due to the scale construction process that is followed by most
developers, in which multiple quantitative analyses are used to produce a reliable end
result (Gable & Wolf, 1993).
Systematic Direct Observation
One of the most common behavioral assessment methods is systematic direct
observation (SDO), which actually includes several methods of observing student
behavior. Volpe, DiPerna, Hintze, and Shapiro (2005) outline some of the published and
established observation codes, and their psychometric properties. These SDO assessment
tools use both positively and negatively worded target behaviors. As a method, SDO is
not inherently geared towards a focus on positive or negative behaviors. The Behavioral
Observation of Students in School (BOSS; Shapiro, 2004), for example, includes target
behaviors such as Active and Passive Engaged Time, as well as Off-Task Passive, Motor,
and Verbal.
The psychometric properties of behavioral assessment methods, particularly
systematic direct observation, have been a topic of recent research in school psychology
(Clark, 2008; Hintze & Matthews, 2004). The debate between traditional and behavioral
approaches is discussed with respect to SDO in particular. According to Hintze (2005),
some behaviorists might argue that, because behavioral assessment methods are oriented

31
to idiographic, context-specific measurement, we should not apply the same standards for
psychometric accuracy (i.e., reliability and validity) that are applied to traditional tests
and measures meant for nomothetic comparisons. However, Cone (1977, 1978) argues
that the measurement methods used in behavioral assessment, e.g., systematic direct
observation, should have these psychometric standards applied to them, because they are
measurement methods, regardless of the theoretical and conceptual differences that
surround these issues. Generalizability theory (Cronbach, Gleser, Nanda, & Rajaratnam,
1972) was proposed as a suitable alternative to classical test theory in assessing the
psychometric properties of behavioral assessment methods. Since that time, only a few
studies have used generalizability theory in this way (Clark, 2008; Hintze & Matthews,
2004).
The Behavioral Assessment Grid (BAG)
Cone’s (1978) Behavioral Assessment Grid (BAG) is illustrated as a three-
dimensional cube representing three aspects of the behavioral assessment process: the
content measured, the methods used, and the types of generalizability (reliability or
validity) being established. Six universes of generalization are defined along this third
axis: (1) scorer, (2) item, (3) time, (4) setting, (5) method, and (6) dimension. Each of
these may be considered as generalizability theory’s answer to one particular aspect of
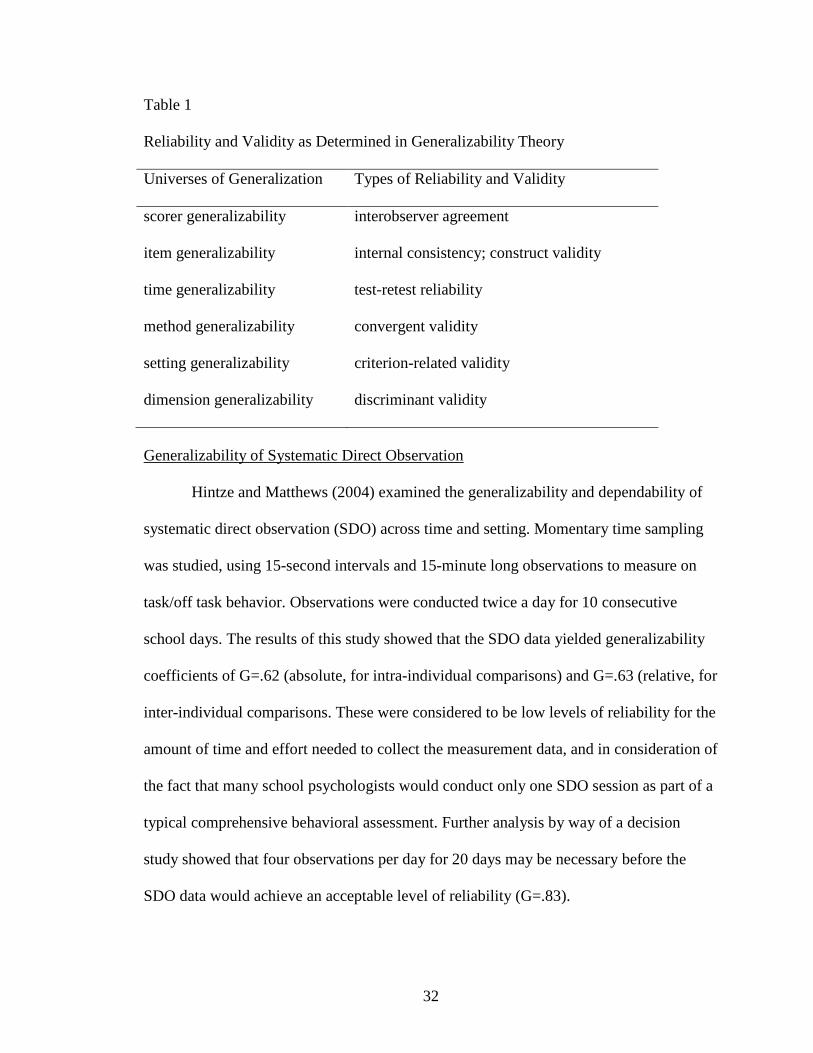
traditional concepts of reliability and validity (Cone, 1977). Table 1 illustrates these
corresponding terms.
32
Table 1
Reliability and Validity as Determined in Generalizability Theory
Universes of Generalization Types of Reliability and Validity
scorer generalizability interobserver agreement
item generalizability internal consistency; construct validity
time generalizability test-retest reliability
method generalizability convergent validity
setting generalizability criterion-related validity
dimension generalizability discriminant validity
Generalizability of Systematic Direct Observation
Hintze and Matthews (2004) examined the generalizability and dependability of
systematic direct observation (SDO) across time and setting. Momentary time sampling
was studied, using 15-second intervals and 15-minute long observations to measure on
task/off task behavior. Observations were conducted twice a day for 10 consecutive
school days. The results of this study showed that the SDO data yielded generalizability
coefficients of G=.62 (absolute, for intra-individual comparisons) and G=.63 (relative, for
inter-individual comparisons. These were considered to be low levels of reliability for the
amount of time and effort needed to collect the measurement data, and in consideration of
the fact that many school psychologists would conduct only one SDO session as part of a
typical comprehensive behavioral assessment. Further analysis by way of a decision
study showed that four observations per day for 20 days may be necessary before the
SDO data would achieve an acceptable level of reliability (G=.83).

33
The Hintze and Matthews (2004) results were only applicable to the measurement
of on task/off task behavior, and the target behavior was not operationally defined. Clark
(2008) expanded on this work by using a more explicit definition of the behavior in her
study. This study also examined the generalizability of SDO, but instead of selecting time
of day and setting as the facets of interest, Clark (2008) studied the variability that would
be attributable to the number of items (15 second time intervals) in each observation,
holding scorer, time, setting, method, and dimension constant. With n=102 second grade
students, and 60 consecutive 15 second time intervals recorded during Math instruction,
88% of the variability was found to be attributable to measurement error, while only 12%
was caused by person variability. Number of items was not a significant source of
variability. While the generalizability coefficients yielded by the study (G=.88) showed
evidence of reliable data, the high amount of unexplained variability indicated that these
SDO data should not be viewed as generalizable or dependable in the final analysis of
their validity (Clark, 2008).
The findings of Hintze and Matthews (2004) and Clark (2008) are relevant to the
present study, because SDO is often considered to be a reliable and dependable option for
the formative assessment of behavior in schools. However, the empirical research
described here indicates that caution is warranted when interpreting SDO data for
decision-making purposes. Further research on the generalizability of SDO is also desired
to investigate other target behaviors and other facets that may contribute to the identified
patterns of variability.

34
Direct Behavior Ratings (DBRs)
Another method of school-based behavioral assessment that can be used for
formative assessment with positive behaviors is the Direct Behavior Rating (DBR). This
is a term proposed by researchers (Chafouleas, Christ, Riley-Tillman, Briesch, &
Chanese, 2007) to describe a class of tools that are often used by classroom teachers to
monitor student behavior, give feedback, and/or organize positive reinforcement plans.
Teachers typically use a DBR to rate a student’s behavior directly after a certain time
period (an hour long academic period, for example), to which the rating applies. In this
way, a DBR lies in between a rating scale and a behavioral observation in its level of
directness (Chafouleas et al., 2007).
The Daily Progress Reports (DPRs) described earlier as part of Check In/Check
Out in the Behavior Education Program (Crone et al., 2004) are one example of a DBR
tool that is being used for the formative assessment of positive behaviors. In addition to
Daily Progress Report and Direct Behavior Rating, similar measurement tools have been
termed Home Notes (Blechman, Taylor, & Schrader, 1981), Daily Report Cards (Drew,
Evans, Bostow, Geiger, & Drash, 1982; Pelham, 1993; Schumaker, Hovell, & Sherman,
1977), Performance-based Behavioral Recording (Steege, Davin, & Hathaway, 2001),
and Daily Behavior Report Cards (Chafouleas, McDougal, Riley-Tillman, Panahon, &
Hilt, 2005; Chafouleas, Riley-Tillman, & MacDougal, 2002; Chafouleas, Riley-Tillman,
& Sassu, 2006; Riley-Tillman et al, 2007; Wright, 2002). Technology has been used in
order to record these ratings as shown in the SWIS tool, and additionally, online
resources from www.interventioncentral.org are available for creating DBRs and
downloading spreadsheet templates to monitor a student’s progress (Wright, 2002). Most

35
of this research has focused on the effectiveness of DBRs when used as a positive
behavioral intervention, as described in the CICO/BEP intervention. The converging
evidence from this area of research indicates that when students are given frequent
behavioral feedback and positive reinforcement by their teachers using DBRs, there is an
increase in their use of positive behaviors.
Psychometric Properties of DBR Data
Recently, it has been suggested that DBRs have the potential to provide data for
school psychologists and educators who wish to use them as assessment tools
(Chafouleas et al., 2002). Consequently, researchers have begun to examine the
psychometric properties of DBRs. One of the first studies of this kind (Chafouleas et al.,
2005) found a moderate association between the DBR ratings of teachers and SDO
measurement by an outside observer. This study used one target behavior (off-task
behavior) and compared the results of the two methods of measurement. The DBR format
used in this study included a 0-5 scale with the following descriptors:
Figure 4. DBR scale (Chafouleas et al., 2005.)
In addition to DBR ratings, SDO was conducted using the same target behavior.
SDO results were then converted into 0-5 DBR ratings in order to calculate agreement
36
between the methods. Using this scale, and with this target behavior, a moderate
association was found between DBR and SDO methods. Between 82 and 87% of the
ratings were within a 1 point difference of each other across methods. Overall, between
23 and 45% of the variance was shared across methods.
A subsequent study (Chafouleas, Riley-Tillman, Sassu, LaFrance, & Patwa, 2007)
was conducted using similar methods, but measuring on-task instead of off-task behavior.
In this study, there were also two phases: baseline and intervention, which involved a
positive behavioral intervention being linked to the students’ performance as rated by the
DBR. Three raters were used: one teacher using DBR, an observer using DBR, and an
observer using SDO. Agreement between the DBR results between the teacher and the
observer was determined by comparing the effect sizes that would be calculated from
baseline to intervention phases for the three students in the study. Effect sizes based on
the DBR ratings by the two raters were similar for all students, (differences were .01, .10,
and .15), indicating that similar decisions might be made based on either data. The effect
size due to SDO, however, was not similar to the DBR ratings (differences ranging from
.28 to .54) and would likely result in different decisions in practice.
Further research is still needed to determine under what conditions, if any, DBR
data might be reliable and valid. As was reviewed with SDO studies, generalizability
theory has been applied in DBR studies to learn more about the sources of variability in
the data. Chafouleas et al., (2007) used generalizability theory to investigate how many
repeated DBR ratings might be required to produce dependable results using DBRs. The
researchers also took a new direction in this study by measuring social behaviors, rather
than on off task behavior, and focusing on preschoolers. The target behaviors (Works to

37
Resolve Conflicts and Interacts Cooperatively) were defined and behavioral examples
and non-examples were given. The DBR ratings were conducted on a different scale than
in previous studies. Raters were asked to make a mark anywhere on a continuous line
which had 15 intervals, but only descriptors anchoring the points 0%, 50%, and 100%. A
percentage was drawn from these ratings by measuring the distance from zero in
millimeters that the rater marked with an X.
Figure 5. DBR using a continuous line scaling method (Chafouleas et al., 2007).
This method of scaling was chosen to avoid any psychometric problems that might be
associated with the use of an ordinal scale. Four teachers completed DBR ratings of 15
students at the end of each 30-minute observation period, twice a day, for 13 days. Thus,
generalizability studies were able to estimate the variance associated with person, rater,
day, setting, and the interactions of those facets, for each of the two target behaviors. In
their full-scale analysis, a large effect was found attributable to rater variability (41% and
20% of the variance on Works to Resolve Conflicts and Interacts Cooperatively). In
looking at the four raters individually, different profiles emerged, with two of the raters
appearing to use overall higher ratings, and two of the raters tending to use overall lower
ratings. The amounts of variability associated with Day and Setting facets were small
(below 8%), as were the many interactions that were estimated (e.g., Day x Setting,
Person x Rater x Day). Dependability studies showed a projection that it would take 7 to

38
10 DBR ratings before these data would yield a reliable set of information for screening
or other decision making purposes, with a reliability level equal to or greater than .70 (7
ratings) and .90 (10 ratings).
This study (Chafouleas et al., 2007) was reviewed in detail, in order to provide
background information about the use of generalizability theory in estimating the
psychometric properties of a formative assessment tool for positive behaviors. The results
are of interest because they indicate the possibility of gathering dependable data from this
assessment method. Strengths include the fact that preschool teachers completed the
ratings while performing their other duties during a typical day. The measurement of
positive behaviors and the feasibility of the method are also strengths. However, more
research is needed to determine how generalizable and dependable DBR ratings are when
different scaling methods are used. The use of a 105 mm continuous line scale, with only
3 anchors (0%, 50%, and 100%) may have been suitable for a research program, but may
be less appropriate for practitioners who wish to use the data. Typical DBRs used in
schools are more likely to be rated on Likert scales of 0-2, 1-3, or 1-5. It remains to be
seen whether or not the findings of these generalizability and dependability studies would
hold true for the DBRs most frequently used in the field.
Item wording was the target of investigation in another DBR study (Riley-
Tillman, Chafouleas, Christ, Briesch, & LeBel, 2009). Two factors of item wording were
studied: positive versus negative, and global versus specific. Two behaviors were rated
using DBRs: Academic Engagement/Disengagement and Well-behaved/Disruptive. The
raters in this study were 145 undergraduates who were presented with four 3-minute
video clips of a second grade target student to observe. As in the previous study, raters

39
marked a continuous line at the point which they felt best represented the amount of
behavior that was observed, with anchors at 0%, 50%, and 100%. The videos had also
been observed and coded by graduate students using the Multi-Option Observation
System for Experimental Studies (MOOSES; Tapp, 2004), which uses real-time coding
in 1 second intervals to calculate a “true score” for percentage of each behavior in each
clip. Agreement between DBR ratings and the true score was calculated to analyze the
data for this study. For Academic Engagement, the most accurate ratings were those
using a positive item wording, and a global definition of the behavior. For Well-
behaved/Disruptive, the most accurate ratings were found with either positive or negative
wordings, and a global definition of the behavior.
Summarizing the DBR Research
If DBR research continues along these lines, and provides more supportive
evidence for the reliability and validity of DBRs, they may become a dependable tool for
formative assessment purposes. In a nationwide study (Chafouleas et al., 2006) surveying
teachers who use DBRs, 60% of teachers rated student behaviors at least once daily, but
only 32% used the data from their DBRs to monitor behavior over time. There appears to
be a great deal of data that is already being collected in schools that shows initial promise
for formative assessment, if that data proves reliable, and if systems are developed to
summarize the data in meaningful ways. In a book chapter that makes recommendations
to practitioners using DBRs, Chafouleas et al., (2007) suggest that only assessment data
from “systematic DBRs” should be treated as reliable sources of information. As Hintze
and Matthews (2004) delimited systematic direct observation as a different method from
other, less structured types of direct observation, the authors of the book chapter seek to

40
provide standards for what should constitute a “systematic DBR”. The four criteria are as
follows: (1) the behavior of interest is operationally defined, (2) observations conducted
using standardized procedures, (3) DBR is used at a specific time and place and
predetermined frequency, and (4) data are scored and summarized in a consistent manner.
The purpose of the present study will be discussed next, outlining the specific
contributions that will be made to the research area of formative behavioral assessment.
Purpose of the Dissertation
The overall purpose of this dissertation was to begin development of a General
Outcome Measure (GOM) for the formative assessment of positive classroom behaviors.
The need for a GOM that can demonstrate progress towards important behavioral
outcomes has been established. Likewise, the need for assessment tools that focus on
positive behaviors has also been demonstrated. The desired final product of this research
is an assessment tool that can be used by teachers for frequent progress monitoring of
their students’ use of positive behaviors.
However, before determining if an assessment tool will be appropriate for
formative assessment purposes, the tool must be developed methodically and its
psychometric properties must be understood. It is necessary to develop the pilot rating
scale and conduct a single administration to a group of students, allowing analyses to be
performed that will fine-tune the instrument before it is piloted again as a formative
assessment tool, with repeated administrations over time.
Thus, the scope of this dissertation could not encapsulate the full process of scale
development from start to finish, if the desired final outcome is an effective progress
monitoring tool. Rather, the present study sought to begin the process of creating an

41
instrument using the first ten steps of Gable and Wolf’s (1993) model as a guide (Table
2). This resource was used to guide the process of scale development for this dissertation.
Based on the results of the present study, further iterations of the pilot scale may be
studied and the remaining steps of scale development may be applied in future studies.
Table 2
Steps in Affective-Instrument Development (Gable & Wolf, 1993)
As outlined in the literature review, many positively worded rating scale items
have already been researched and utilized in existing rating scales. However, a more
thorough investigation was warranted to determine which items are most representative
of how teachers and school staff conceptualize “positive classroom behavior.” Thus, one
primary purpose of the dissertation was to collect empirical evidence from educators and
Step Activity
1 Develop conceptual definitions
2 Develop operational definitions
3 Select a scaling technique
4 Conduct a judgmental review of items
5 Select a response format
6 Develop directions for responding
7 Prepare a draft of the instrument and gather preliminary pilot data
8 Prepare the final instrument
9 Gather final pilot data
10 Analyze final pilot data
11 Revise the instrument
12 Conduct a final pilot study
13 Produce the instrument
14 Conduct additional reliability and validity analyses
15 Prepare a test manual

42
other school-based practitioners about their conceptual and operational definitions of the
construct at hand. There is a large item pool in the existing literature which was narrowed
down to a smaller number of selected items. The first phase of the dissertation
accomplished the first four steps in the scale development model, resulting in a small
item pool for the development of a new rating scale.
The second purpose of the dissertation was to conduct a pilot administration of
the newly conducted rating scale and determine the psychometric properties of the data.
This entailed following steps 5-10 of the Gable and Wolf (1993) model. The purposes of
these analyses were to identify outlier items that may need to eliminated from the scale,
to identify the reliability of the scale, and to investigate the factor structure of the rating
scale data. A general outcome measure (GOM) typically seeks to measure a global,
general construct like “positive classroom behavior.” This raises the question of whether
or not the rating scale data would be unidimensional or multidimensional in terms of its
factor structure. In other words, do the ratings of the items tend to cluster together into
one general factor, or do they tend to cluster into multiple, smaller factors? Exploratory
factor analysis was used to determine whether responses to the rating scale yield a
unidimensional or a multidimensional factor structure. Individual item loadings also
provided meaningful information about the properties of the scale.
A final purpose of the dissertation was to examine the ratings of students from
two different samples. It was important to determine if the rating scale will reflect the
differences between these two groups of students: one group consisting of randomly
selected students from general education classrooms, and a second group consisting of
students in general education classrooms whose teachers identify as having mild to

43
moderate classroom behavior problems. These populations of students are often
described with respect to the level of intervention they require within a 3-tiered model,
namely the universal tier and the targeted tier (Figure 6). Thus, the two student
populations being sampled and compared in this study were students who are adequately
served by universal intervention and students who may be in need of targeted
intervention.
Figure 6. Universal and targeted groups sampled for pilot rating scale administration.

44
Research Questions
To achieve the aforementioned purposes, this dissertation sought to address the
following research questions:
1. What positively worded rating scale items will teachers and other school staff identify
as being most representative of their concept of “positive classroom behavior”?
a. Which items will most teachers rate with the highest level of importance?
b. Will teachers demonstrate significant consensus in their responses?
2. Using the newly formed pilot version of this scale, what do the results of a pilot study
show in terms of factor structure and psychometric properties?
a. Are there any outlier items associated with very high or low mean ratings,
standard deviations, or item-total correlations?
b. How strong is the internal-consistency reliability of the scale?
c. Are there significant differences in the ratings of students from the randomly
selected group versus the group of students identified as having mild to moderate
behavior problems?
d. Do the data have a unidimensional or multidimensional factor structure?
e. What are the item loadings of the rating scale items?
3. What is the maximum number of rating scale items that teachers would be willing to
complete for one or two students in their class, once or twice a week?

45
CHAPTER 2
METHODOLOGY
Setting and Participants
Sample Size
The participants for the present study (n=162) were teachers and other school staff
members from several school districts in the northeast United States. The secondary
participants were the target students assessed using the pilot rating scale (n=162). More
than 300 teachers were provided with the opportunity to participate in the surveys, either
using a paper survey format or an email link to the online survey. Voluntary participation
at some schools resulted in a low response rate to the online surveys, whereas other
schools had close to 100% response rates using both paper and online versions of the
survey. Thus, the final number of participants yielded a smaller sample than was desired.
Gable and Wolf (1993) recommend that instruments be piloted with a sample size of at
least 6 times the number of items on the instrument, and at most 10 times the number of
items. With a pool of 30 initial rating scale items, between 180 and 300 teacher
respondents would be the target sample size range. However, Bryant and Yarnold (1995)
also conducted research to estimate the effects of sample size on factor analytic results.
Their results suggest that the minimum sample size for effective factor analysis is 5 times
the number of items. Based on this lower recommendation, the present study would be
just above the minimum sample size of 150.
Recruitment Methods
A sample of teachers and other school staff members was recruited from public
elementary, middle, and K-8 schools in the Northeast US. School districts were invited to
46
participate through principals, special education administrators, and other contact persons
at the target districts or schools. Contact persons were provided with a summary of the
research proposal, a sample of the teacher survey, and a written statement of informed
consent, privacy, and confidentiality. School districts were recruited and invited to
participate with efforts being made to obtain a sample that is diverse with respect to
student variables such as race/ethnicity, socioeconomic status, and urban/rural/suburban
areas. Districts were contacted through professional email lists, professional
organizations, and the professional contacts of the primary researcher. Sponsorship for
the study was also provided by Wediko Children’s Services, a nonprofit organization
based in Boston, MA that provides clinical, educational, and assessment services to
schools and families. Wediko was also the internship placement of the primary researcher
during the data collection phase of the study. Several school districts whose students
receive services through the Wediko agency were contacted with a research invitation
and a letter explaining that the study would be used for a dissertation in school
psychology being completed by a doctoral intern working with the agency.
Incentives for Participation
School administrators, district-level research offices, and survey participants were
informed of two incentives for participation. School districts and school buildings whose
staff members participated in significant numbers were offered the results of the teacher
survey individually prepared based on their data alone. Schools who are interested in
collecting data to plan or review their schoolwide positive behavior support systems may
find the results of this survey helpful. They would receive a short summary of the
positive target behaviors which the faculty of their school consider to be the most

47
important behaviors. Participating schools would also receive a copy of the full results
and the pilot rating scale at the end of the study. Individual participants were also
provided with an incentive to participate. Participants who completed both phases of data
collection would have their email addresses entered into a raffle to win a gift card to
Border’s bookstore worth $25, $75, or $100.
Teacher Respondents
Teachers and other school staff working with students in grades Kindergarten to
eighth grade were asked to participate in the study by completing surveys. Classroom
teachers were the primary target participants of the study, however all other school staff
members were invited to participate as well, including paraprofessionals, special
educators, related service providers, and administrators. This was done in order to gather
thorough empirical data about how teachers and other school staff would perceive and
rate positive student classroom behaviors. In planning for the pilot scale administration,
this teacher sample also allowed for a representative sample of student ratees from
general education classrooms in grades Kindergarten to 8.
Target Students
Students were sampled from two populations, forming two groups of ratees, the
universal group and the targeted group. The first group, which may be referred to as the
universal group, was randomly sampled from general education classrooms. A second
group, which may be referred to as the targeted group, was sampled using a prescribed
teacher nomination procedure (described fully in a later section). Students were only
rated in the second phase of data collection, whereas the first teacher survey was only
concerned with teachers’ attitudes and perspectives about classroom behavior. These two

48
groups were sampled in order to evaluate the research questions and determine how the
pilot rating scale would function when different types of students were rated. The
potential use of the finished scale as a screening or progress monitoring tool depends on
the exploration of these two groups during scale development. However, students with
more serious behavior problems, who are in need of individualized intervention, would
typically require more comprehensive and individualized assessment tools. Thus, the
study does not include a sample from this population of students as part of the
comparison.
Procedure
Item Pool Development
The first phase of this dissertation consisted of compiling rating scale items drawn
from existing, published rating scales. A large preliminary item pool was developed, with
efforts being made to include rating scale items that reflect social-emotional, social skill,
and behavioral approaches to assessment. The initial pool consisted of 173 positively
worded rating scale items. Table 3 shows the sources of the rating scale items.
Items were then eliminated from the original pool for several possible reasons.
First, 46 duplicate or near duplicate items were identified and eliminated. Three items
were eliminated because they were irrelevant to the construct of positive classroom
behavior or to the school setting. There were nine items which required the rater to make
high-level inferences or indirect judgments of the target students and were therefore
eliminated. Next, 22 items were eliminated based on the fact that they were too vague or
potentially confusing to the rater. This left 93 items to be included in the item pool. Items
were then revised in order to create consistent language, pronouns, and item formatting.

49
Thirty-nine items were reworded in some way, leaving 54 items unchanged. These 93
items were then prepared for judicial review by teachers and other school staff members.
Table 3
Sources of Rating Scale Items Used in Preliminary Item Pool
Original Source # items
The Social-Emotional Assets and Resiliency Scales (SEARS; Merrell, 2008b) 54
Skills Improvement System (SSIS; Gresham & Elliott, 2008) 43
Behavior Assessment Scale for Children, Second Edition (BASC-2; Reynolds & Kamphaus 2004), Teacher Rating Scale for Children (TRS-C), ages 6-11
40
School Social Behavior Scales, Second Edition (SSBS-2; Merrell, 2002) 32
Achenbach System of Empirically Based Assessment (ASEBA; Achenbach & Rescorla, 2001), Teacher Report Form (TRF), ages 6-18
4
Teacher Survey: Judicial Review of Items
The goal of the first phase of data collection was to determine which items are
most representative of the concept of “positive classroom behavior”, from the perspective
of classroom teachers. Teachers were asked to rate the importance of each of the 93
rating scale items according to how representative the item is of their concept of “positive
classroom behavior.” The introduction to the survey included a statement of the purpose
of the study, the time commitment for participants, and a statement about voluntary
participation as required by the institutional review board (see Appendix A for sample
survey). Six demographic questions followed, in which participants were asked to
describe their role in the school, grade levels taught, levels of education and experience,
school district and school building.

50
The instructions were then given for teachers to rate importance of the 93 rating
scale items. The instructions were stated as follows:
Please read each behavioral item and think about how important the item is to your concept of ‘positive classroom behavior.’ Your responses will help to decide which items should go on the new rating scale. Items that you rate as more important will be more likely to be included on the pilot rating scale. Items you rate as less important will be more likely to be eliminated.
For this survey, a 5-point Likert scale measuring the respondent’s opinion about
the importance of each item was used, selected from Gable and Wolf (1993). The chosen
Likert scale did not include numerical descriptors, but listed five options from left to
right, reading “Unimportant,” “Of Little importance,” “Moderately important,”
“Important,” and “Very important.” The rating scale items were presented in random
order, subdivided into groups of fifteen in order to break up the survey among pages. The
directions were repeated once in the middle of the survey as a reminder.
The survey was administered using the online survey tool SurveyMonkey, found
at www.surveymonkey.com. SurveyMonkey is a web-based tool that allows a researcher
to input questions of various types to create a survey. Likert-type questions can be
designed with various scaling methods and response formats. Open-ended questions may
also be created. The survey is then made available to respondents through an email link.
Data are aggregated by the SurveyMonkey website and may be downloaded as an Excel
spreadsheet or comma-separated value file for use with SPSS and other statistical
programs.
Paper versions of the survey were also made available to schools or individuals
who requested them. Responses to the first survey were collected between September
18th, 2009 and November 23rd, 2009. Results were then analyzed according to the data

51
analytic plan and used to develop the second survey, consisting of the pilot rating scale,
which will be described below.
Professional Review of Pilot Rating Scale
Efforts were made to conduct an expert review of the pilot rating scale before
administering it to students for the first time. This procedure is recommended (Gable &
Wolf, 1993) in order to build the content validity of a pilot scale and fine-tune the
selected items. The teacher survey provided information about how teachers would
respond to the rating scale items, but it was still considered important to get the
perspectives of experts in the field of positive behavior support, including researchers in
special education and school psychology. Four individuals were contacted by email with
a copy of the pilot scale and asked to provide feedback. The professionals who were
contacted were researchers associated with university-based centers, school-based
consulting groups, and state-wide centers for positive behavior support technical
assistance. However, none of these contacts had responded as of the data analysis phase
of this study. In the absence of their responses, and in order to gather some informal
feedback before administering the pilot scale, several practicing school psychology
interns, school psychologists, and special education teachers familiar with positive
behavior support did agree to review the rating scale and provide feedback. No items
were changed or deleted based on their reviews, but formatting changes to the scale were
made.
Pilot Rating Scale Administration
The second phase of data was collected between December 14th, 2009 and
January 8th, 2010. In this phase, teachers were asked to rate students using the newly

52
constructed pilot rating scale. This part of the study was also administered online using
SurveyMonkey. When participants entered the survey program, they were provided with
a similar introduction to the teacher survey, explaining the purpose of the study and
providing a statement about voluntary participation. Participants were also informed that
no teacher or student names or other identifying information would be requested as part
of the study. Demographic information was collected about the teacher participant, and
then each respondent was randomly assigned to “Group 1” (the universal group) or
“Group 2” (the targeted group). The following page instructed the respondent on how to
select a student to rate using the pilot rating scale. Student selection procedures for both
groups are described below.
Universal Group Student Selection Procedure
Universal group teachers were assigned to rate students from the overall student
population. A random student selection procedure was created using the available
features in SurveyMonkey. Teachers were guided through a process of randomly
selecting a student to rate according to the following steps. Teachers were asked to obtain
a class list from the class group they work with at 10:30 A.M. on Mondays. Teachers
who do not see a class group at that time were instructed to choose the group they see
closest to that time. A specific time and day was chosen in order to narrow down the
number of students each teacher would have to select from to just one class group. While
elementary school teachers often teach the same group of children all day, middle school
teachers are likely to see multiple groups throughout the day. This procedure also reduced
the likelihood that two teachers in a school would select the same student to rate, which
would contribute undesirable intercorrelation into the data set.

53
Teachers were then provided with a randomly generated number between 1 and
30. They were asked to reference their class list, alphabetized by last name, and select the
student who falls at that place in the list. If the respondent was assigned a number higher
than the number of students in the class, they were instructed to select the last student on
the list.
For administrators and other support staff who do not work with individual
classroom groups, a variation of this random selection procedure was given. They were
asked to view a student roster for the whole school. Respondents were then provided with
a random letter of the alphabet and asked to narrow down their selection to students
whose last name begins with that letter. Then, they were given a randomly generated
number and asked to count down their list to choose a student to rate.
Targeted Group Student Selection Procedure
Targeted group teachers were assigned to rate students with mild to moderate
classroom behavior problems. In order to sample students from this specific population, a
prescribed teacher nomination process was used to select the students. This procedure is a
modification of part of the screening process used in the Systematic Screening for
Behavior Disorders (SSBD; Walker & Severson, 1992). As in the universal group,
teachers were asked to begin by obtaining an alphabetized class list from the class group
they work with at 10:30 AM on Mondays. Teachers were then asked to write down on a
piece of paper the names of five students in their class whom they would describe as
having mild to moderate externalizing behavior problems. Externalizing behavior
problems were defined for teachers using the definition provided in the SSBD:
Externalizing behavior problems are defined as behavior problems directed outwardly by the student toward the social environment and usually involving

54
behavioral excesses, for example: aggression, noncompliance, rule-breaking, hyperactivity, extreme distractibility, defying the teacher, not following school-imposed rules, having tantrums, stealing, etc. Teachers were asked to rank order these five students from most serious (1) to
least serious (5) behavior problems. Respondents were then randomly assigned to rate
one of these five students using a feature of SurveyMonkey that would generate a random
number between one and five. This procedure was created in order to obtain a random
distribution of students at the first, second, third, fourth, and fifth positions on teachers’
lists. This allowed for the sampling of students at each level of severity within the top
five most concerning students of each class.
This ranking and random selection procedure was intended to generate a sample
of students with mild to moderate behavior problems for the targeted group. If teachers
were asked to simply choose one student from their class that fit the description of
externalizing behavior problems, it would be likely to result in a sample of students with
more serious behavior problems. These students would be more likely to require
individualized assessment and intervention services, skewing the sample away from the
targeted tier and more towards the individualized tier. The procedure used for the targeted
group was intended to avoid this problem and include students with milder behavior
problems into the sample.
As in the universal group, a variation of the sampling procedure was provided for
administrators and other support staff in the school who could not select from a class
group. These staff were allowed to create a rank-ordered list of five students who they
encounter or work with on a regular basis and were randomly assigned to choose one of
these five students.

55
Pilot Rating Scale Items
After a student had been selected for each participant to rate, respondents were
asked to begin completing the pilot rating scale. Respondents were first asked to identify
the target student’s gender, grade level, and whether or not the student was categorized as
general education, special education with IEP, or a student with a 504 plan. Directions
were then given for rating the target student:
Instructions: Please read the following list of behaviors and think about the student whose behavior you are rating. Based on the student's behavior over the past several months, mark a response for every item. You must answer every item, so give your best estimate if you are unsure about an item.
The 30 rating scale items were then presented, along with a 4-point Likert scale.
Consistent with other published rating scales such as the BASC-2 and ASEBA, the levels
of the Likert scale were presented without numerical descriptors, reading from left to
right, “Almost Never,” “Sometimes,” “Often,” and “Almost Always.”
Feasibility Ratings and Teacher Feedback
At the end of the rating scale, respondents were asked three questions to help
evaluate the feasibility and face validity of the pilot rating scale. First, teachers were
asked whether or not it would be a reasonable time commitment for them to complete a
rating scale like this one a weekly basis for one or two students with mild to moderate
behavior problems. Teachers could respond yes or no regarding the feasibility of the time
commitment. Then, teachers were asked to state the maximum number of rating scale
items they would be willing to complete for 1-2 students on a weekly basis. This question
was provided with the entry format of a numerical text box and no given range. Last,
teachers were asked to add any qualitative comments they wished to make about this
project in a text box.

56
Data Collection Materials
The initial materials that were obtained for this study were the published rating
scales and pilot instruments that could be found in order to create the initial item pool.
Rating scales were obtained through practicing school psychologists, school psychology
training programs, conference presentations, and from the websites of the developers and
publishers of the rating scales.
The first survey was administered in two formats. The online version of the
survey was administered using SurveyMonkey (Figure 7). Schools or individuals who
requested a paper version of the survey were provided with hard copies generated
through SurveyMonkey. Data from these hard copy surveys were then entered into the
SurveyMonkey website in order to aggregate the data into one database. The hard copy
version of the first survey is found in Appendix A which includes all questions and
responses that were included in the online version as well. Appendix A also includes the
introductory statements of privacy, confidentiality, informed consent, and voluntary
participation.
The second phase of data collection, consisting of the pilot rating scale
administration, was administered exclusively online, again through the SurveyMonkey
online tool (Figure 8). The capability of the online tool to provide random assignment of
the participants to groups, as well as random assignment of numbers and letters for the
selection of target students was a major factor in restricting the administration to the
online format only. Appendix B provides the full format of the pilot rating scale,
including the instructions and procedures for both groups to select a target student, the
rating scale items, and the final teacher survey questions.

57
Figure 7. Online survey format for teacher survey.
Figure 8. Online format for pilot rating scale.
A membership with the SurveyMonkey online tool was purchased for the
purposes of this study. Also, three gift cards worth $25, $75, and $100 were purchased
from Borders bookstore for the raffle. Data analysis, which will be outlined below,
required the use of several computer programs, including the SurveyMonkey online tool,
Microsoft Excel, SPSS, LISREL, and R.
Data Analytic Plan
Ordinal or Interval Scale Data?
Likert-type scales were used in both phases of data collection, one with four
levels and one with five (Figures 7 and 8). Before specifying the data analytic plan, it was
necessary to make a decision about how to treat the data from these scales. Likert scales

58
can be created that are nominal, ordinal, interval, or ratio scales. Both scales used in this
study were best described as falling somewhere between the ordinal and interval levels of
measurement. There was no clear numerical distance specified between the levels of the
scales, preventing them from being purely interval scales. However, the semantic
wording of the levels was designed to create intervals as equal as possible, resulting in
scales that were not purely ordinal in nature either. For the purposes of item-level
analyses, an examination of the frequency ratios and mode scores in addition to mean,
standard deviation, skewness, and kurtosis, suggested that parametric statistics could be
appropriately used.
Teacher Survey Data Analysis
After the teacher survey data were collected, the results were analyzed in order to
answer the first research question. This question asked, “What positively worded rating
scale items will teachers and other school staff identify as being most representative of
their concept of “positive classroom behavior”? The question also asked whether or not
respondents would demonstrate significant consensus in their responses. Frequency
distributions were calculated for each item to illustrate the number of participants who
rated that item at each level of the 5-point Likert scale. Mean, standard deviation, mode,
skewness, and kurtosis were also calculated to illustrate levels of consensus or dispersion
of responses for each item.
The 93 items were sorted and analyzed to determine which items were
consistently rated as most important by the respondents. The results of these analyses
were then used in order to choose the items for the pilot rating scale. While a specific
number of items was not targeted before the data collection phase began, it was

59
hypothesized that between 10 and 30 items would emerge as strong candidates for
inclusion.
Pilot Rating Scale Reliability and Factor Analysis
In order to answer the second research question, item-level descriptive statistics
(mean, standard deviation, skewness, and kurtosis) were calculated for each of the 30
items on the pilot rating scale. Subsequently, classical item analysis was used to
determine if there are any outlier items with outstanding means, standard deviations, or
item-total correlations. To begin investigating the psychometric properties of the scale,
split-half reliability was calculated, and internal consistency was calculated using
Cronbach’s alpha.
Next, the universal group and targeted groups were compared to determine the
answer to the research question, “ Are there significant differences in the ratings of
students from the randomly selected group versus the group of students identified as
having mild to moderate behavior problems?” In order to compare the universal and
targeted groups, a summary score was calculated for each student. Then, the mean
summary scores were compared for the two groups using an independent samples t-test.
This determined whether or not there was a significant main effect for group
membership. Additionally, a 2-way ANOVA was conducted to test for a group by gender
interaction, which would be crucial information to have when interpreting a main effect
for group.
Exploratory factor analysis was the next phase of data analysis, specifically for
the purpose of a dimensionality analysis, to determine the number of meaningful factors
in the pilot rating scale data structure. Factor analysis allows researchers to describe data
60
with many variables in a parsimonious format, combining and reducing the number of
variables to as few factors as possible while extracting the maximum amount of
information possible from the original variables. Exploratory factor analytic procedures
are based on examining the correlations between the measured variables, determining the
number of factors which emerge as meaningful combinations of these variables, as well
as the magnitudes of variability which each variable contributes to these factors (factor
loadings). Thus, factor analysis also proves useful for theory development, allowing a
researcher to explore the complexities and simpler features of a target construct.
The principal axis factoring (PAF) procedure was selected for this study over
other widely used factor analytic methods such as principal components analysis (PCA).
A key difference between these two procedures lies in the diagonal of the correlation
matrix that is calculated in order to prepare for factor analysis. In preparing for PCA, a
correlation matrix is calculated from the variables which has unities (1s) along the
diagonal of the matrix. This represents the assumption that all variance within each
variable is relevant and should be included in the determination of relevant factors. PAF,
on the other hand, takes into consideration that fact that each unit of datum is likely to
possess some amount of unique error variance. Because the target of the analysis is the
shared variance of the variables, a change is made to the diagonal of the correlation
matrix used for PAF. The diagonal row of unities (1s) is replaced with communalities.
For each variable, its communality is the proportion of its variance that is explained by
the factors, calculated by combining the sums of squares of its factor loadings on each
factor.

61
Principal axis factoring allows for the determination of the number of factors in
the factor structure, the factor loadings of the rating scale items, and which items
contribute meaningful amounts of variance to the factor structure. This provides more
information about potentially extraneous items that do not contribute meaningful
information to the pilot rating scale. Comparisons between the factor analytic results
from the universal group, the targeted group, and the total aggregated data set also
allowed for a second look at the differences between the groups.
The final research question asks, “What is the maximum number of rating scale
items that teachers would be willing to complete for one or two students in their class,
once or twice a week?” Using the results of the final two questions that were asked of
teachers, this question was answered and reported on as well. Finally, the participants’
qualitative comments about the face validity and feasibility of the rating scale for
classroom use will be reported.

62
CHAPTER 3
RESULTS
Setting and Participants
Over 300 teachers received email invitations to participate in the study, counting
all school districts which participated. The samples of teacher survey participants (n=142)
and pilot rating scale participants (n=162) were slightly different in composition due to
attrition and because some teachers who declined to participate in the first study did
complete the second study.
The majority of participants came from two school districts: Jaffrey-Rindge
Cooperative School District in New Hampshire (71 participants) and Walpole Public
Schools in Massachusetts (63 participants). The remaining participants were drawn from
schools in Brookline, MA (11), Keene, NH (9), Framingham, MA (4), Medford, MA (2),
and Gilbertville, MA (2). The demographic characteristics of the top four districts in the
sample are shown in Table 4, along with the characteristics of the public school
population of Massachusetts as a comparison population.
The school districts which agreed to participate in the study in significant
numbers yielded a somewhat more racially homogeneous sample than the overall
population of Massachusetts. The sampled districts also contain a lower percentage of
low income students than the population of Massachusetts. Efforts were made to recruit
teachers from schools in urban districts in order to reach a more diverse sample.
Administrators from two schools in a large urban school district expressed a willingness
to have their teachers participate in the study. However, the district level office of
research and evaluation was unable to complete a review of the research proposal in time

63
to approve the study. These data may be collected in future iterations of the research if
the district approves the proposal later in the school year.
Table 4
Student Demographics of Sampled Districts and Massachusetts
MA Walpole,
MA Jaffrey,
NH Brookline,
MA Keene,
NH
Race
African American 8.2% 3.4% 1.5% 7.8% 1.4%
Asian 5.1% 2.4% 1.8% 18.5% 2.1%
Hispanic 14.3% 2.7% 1.2% 9.3% 1.4%
Native American 0.3% 0.3% 0.8% 0.1% 0.3%
White 69.9% 90.6% 94.2% 58.9% 94.6%
Native Hawaiian, Pacific Islander
0.1% 0.0% –– 0.1% ––
Multi-Race, Non-Hispanic 2.0% 0.6% –– 5.2% ––
Low-income (Eligible for Free or Reduced Lunch)
30% 5.9% 26.2% 11.8% 22.7%
Note. NH Department of Education statistics combine Pacific Islanders with the Asian population and do not report Native Hawaiian or Multi-Race populations.
While data were not collected on the racial/ethnic identities of the teacher
respondents, several other pieces of demographic information were gathered to determine
the level of education and experience of the participants, as well as their teaching
assignments. Teachers reported working with grades Kindergarten to 8 in nearly equal
numbers, and many participants worked with multiple grades: 45 taught Kindergarten, 46
taught first grade, 53 taught second grade, 48 taught third grade, 54 taught fourth grade,
48 taught fifth grade, 48 taught sixth grade, 39 taught seventh grade, and 38 taught eighth
grade.

64
The respondents included school staff members from nearly all areas and levels of
the schools, from administrators to paraprofessionals. When asked to indicate their
current role or teaching assignment, 93 respondents were general education classroom
teachers, 23 respondents were special education teachers or behavior specialists, 12
respondents were teachers of art, music, physical education, library/technology or other
specials, 10 respondents were Title I, Tier II, or ESL teachers, 7 respondents were school
counselors, 7 respondents were administrators, 5 respondents were paraprofessionals or
associates, 2 respondents were school psychologists, 1 respondent was a speech/language
therapist, 1 respondent was an occupational therapist, and 1 was a nurse.
With regard to levels of education and experience, most respondents (62.3%) had
earned a Master’s degree, 30.2% had earned a Bachelor’s degree, 6.8% had earned a
CAGS or Specialist level degree, and one respondent had earned a Doctoral degree.
Many respondents (44.4%) had over 15 years of experience in the field of education,
18.5% had 11-15 years, 20.4% had 5-10 years, and 16.7% had 0-4 years of experience.
Teacher Survey Results
The 36 highest rated items from the teacher survey are presented in Table 5,
sorted in decreasing order of importance according to mean ratings of the participants.
These results were calculated by first obtaining a frequency count for each of the 93
items indicating how many of the 142 respondents rated each item at each of the five
levels of the Likert scale, from “Unimportant” (1) to “Very Important”(5). Mode, mean,
standard deviation, skewness, and kurtosis were calculated for each item. The list of 93
items was sorted in decreasing order according to mean rating scores. Thirty-six items

65
yielded mean scores of 4.0 or higher and mode scores of 4 or 5. These results (Table 5)
were then examined in order to begin selecting rating scale items for the pilot scale.
Means for the 36 top-rated items ranged from 4.0 to 4.75. Standard deviations
ranged from .464 to .889. Lower-rated items (not listed in Table 5) included items with
means as low as 2.54 and standard deviations within a similar range to the top-rated
items. Skewness estimates for the top-rated items ranged from -.043 to -1.613, with all
items displaying a negative skew. This negative skewness reflects the overall tendency of
respondents to rate all items on the higher end of the scale. Kurtosis estimates for the top
rated items ranged from -.797 to 2.289, indicating that some items were distributed
closely around the mean, while others were dispersed more widely.

Table 5
Descriptive Statistics for the 36 Top-Rated Items
Frequency Counts (N=142)
Item #
Item Wording 1 2 3 4 5 Mode M SD Skew. Kurt.
63 Follows school and classroom rules
0 0 2 31 109 5 4.75 .464 -1.613 1.609
6 Takes responsibility for own actions
0 0 3 33 106 5 4.73 .493 -1.548 1.481
62 Follows directions 0 0 3 46 93 5 4.63 .526 -1.002 -.111
86 Listens to directions 0 0 5 45 92 5 4.61 .557 -1.083 .189
70 Accepts responsibility for own actions
0 1 10 37 94 5 4.58 .656 -1.438 1.462
1 Is a good listener 0 0 6 55 81 5 4.53 .580 -.776 -.377
54 Pays attention to instructions 0 1 10 44 87 5 4.53 .660 -1.232 .961
14 Respects the property of others 0 0 10 49 83 5 4.51 .627 -.928 -.167
21 Stays in control when angry 0 0 7 62 73 5 4.46 .591 -.592 -.579
72 Pays attention 0 2 10 53 77 5 4.44 .690 -1.111 .999
12 Thinks before she/he acts 0 0 9 63 70 5 4.43 .612 -.574 -.576
66

Frequency Counts (N=142)
Item #
Item Wording 1 2 3 4 5 Mode M SD Skew. Kurt.
93 Asks for clarification of instructions when confused
0 1 11 56 74 5 4.43 .667 -.900 .313
25 Is well-behaved when unsupervised
0 1 9 62 70 5 4.42 .644 -.810 .384
59 Feels good about himself/herself 1 1 15 48 77 5 4.40 .763 -1.312 2.086
8 Is trustworthy 0 3 13 51 75 5 4.39 .743 -1.101 .790
9 Appears to feel accepted and comfortable at school
1 1 19 45 76 5 4.37 .794 -1.187 1.379
34 Acts responsibly when with others 0 0 12 69 61 4 4.35 .631 -.427 -.658
45 Responds respectfully when corrected by teachers
0 1 15 59 67 5 4.35 .696 -.733 -.125
80 Is accepting of other students 0 2 14 58 68 5 4.35 .717 -.873 .329
78 Knows how to calm down 0 0 17 66 59 4 4.30 .671 -.430 -.774
5 Shows concern for others 0 2 19 60 61 5 4.27 .743 -.688 -.155
66 Completes tasks without bothering others
0 0 16 72 54 4 4.27 .651 -.332 -.713
47 Completes school assignments 0 3 14 73 52 4 4.23 .709 -.718 .577
53 Responds safely when pushed or hit
0 2 22 61 57 4 4.22 .754 -.587 -.361
67

Frequency Counts (N=142)
Item #
Item Wording 1 2 3 4 5 Mode M SD Skew. Kurt.
27 Resolves disagreements calmly 0 1 22 72 47 4 4.16 .701 -.361 -.453
74 Uses safe language when upset 1 1 22 70 48 4 4.15 .753 -.757 1.153
36 Asks others for help when needed 0 1 28 65 48 4 4.13 .742 -.314 -.787
3 Participates effectively in group discussions and activities
1 1 25 69 46 4 4.11 .764 -.679 .869
24 Enjoys school 1 5 28 52 56 5 4.11 .889 -.763 .123
65 Stands up for self when treated unfairly
0 0 25 79 38 4 4.09 .662 -.101 -.701
83 Stays calm during disagreements 1 1 22 78 40 4 4.09 .724 -.710 1.498
64 Is sensitive to feelings of other students
0 3 22 78 39 4 4.08 .715 -.468 .151
68 Likes to be successful in school 1 2 25 70 44 4 4.08 .776 -.701 .882
88 Will give in or compromise with peers when appropriate
0 0 30 77 35 4 4.04 .678 -.043 -.797
84 Adjusts to different behavioral expectations across settings
2 1 24 79 36 4 4.03 .762 -.925 2.289
16 Cares what happens to other people
0 4 25 77 36 4 4.02 .739 -.462 .091
Note. Likert scale ratings: 1 = Unimportant, 2 = Of little importance, 3 = Moderately important, 4 = Important, 5 = Very important.
68

69
This initial sorting process allowed for the pool of 93 items to be reduced to 36
potential rating scale items by eliminating items which were not consistently rated as
important or very important by the respondents. Next, 30 of these 36 top-rated items were
selected for the pilot rating scale. The six items from Table 5 which were not included in
the scale were eliminated for two reasons. Four items were very similar to another item
selected for inclusion or were addressed by multiple other items selected for inclusion.
Two of the top-rated items were eliminated because their wording remained vague or
potentially difficult to rate, using language such as “is well-behaved” and “acts
responsibly.” These six eliminated items and the reasons for their elimination are
presented in Table 6.
Table 6
Items Disqualified From the Pilot Rating Scale
Item # Item Wording Reason for Elimination
25 Is well-behaved when unsupervised Difficult to rate (vague)
34 Acts responsibly when with others Difficult to rate (vague)
54 Pays attention to instructions Addressed by item 72
70 Accepts responsibility for own actions Addressed by item 6
83 Stays calm during disagreements Addressed by item 27
86 Listens to directions Addressed by items 1, 62, and 72
After this process of elimination was completed, 30 items remained for inclusion
in the pilot rating scale. These items were entered into the SurveyMonkey website in
preparation for administration. The 30 items selected for inclusion are shown in
Appendix B.

70
Pilot Rating Scale Results
Student Sample Characteristics
The 162 teacher and staff respondents who completed the pilot rating scale
provided ratings for 162 students. The random assignment procedure resulted in 80
students being rated from the general population (the universal group), and 82 students
being rated from the population of children with mild to moderate behavior problems (the
targeted group).
Table 7
Demographic Characteristics of Student Ratees
Universal
Group (n = 80)
Targeted Group
(n = 82)
Total (n = 162)
Gender
Male 41 60 101
Female 39 22 61
Grade Level
K 5 7 12
1 8 9 17
2 14 7 21
3 8 9 17
4 10 10 20
5 11 9 20
6 8 10 18
7 5 10 15
8 11 11 22
Educational Category
General Education 57 42 99
Special Education (IEP) 21 37 58
Student with 504 Plan 2 3 5

71
There was a higher proportion of male to female students in the targeted group
than in the universal group (Table 7). The grade level distributions were similar in the
two groups, with no discernible pattern of differences and a well distributed group of
students from all grades. The targeted group included a higher proportion of students with
disabilities than the universal group, with close to 50% of the targeted group having
either an IEP or a 504 plan, but only 36% of the universal group having a documented
disability status.
Within the targeted group, teachers were randomly assigned to students at the
first, second, third, fourth, and fifth positions on their ranked lists of students with
behavior problems. This procedure, modified from the Systematic Screening for Behavior
Disorders (SSBD), was intended to obtain a stratified sample with respect to the severity
of behavior problems.. While the random assignment process did not yield a fully equally
distributed sample across the levels, this result is attributed to chance and still resulted in
a sample of students with various levels of severity of behavior problems. Twenty-five
students in the sample were at the first place rank, indicating that these were the students
with the most serious externalizing behavior problems in the classroom. Fourteen
students were at the second place rank, twelve at third place, seventeen at fourth place,
and fourteen at fifth place.
Pilot Rating Scale Item Descriptive Statistics
Before calculating descriptive statistics for the pilot rating scale data, a procedure
was followed in order to account for missing data points. Twelve cases included missing
data. To account for these missing data, a multiple imputation procedure was followed
using statistical software (LISREL 8.80). Multiple imputation is a regression-based

72
procedure that accounts for error in imputing values by drawing from a predictive
distribution as opposed to calculating a single dependent value, and then combining
results from multiple iterations of the procedure.
Mean, standard deviation, skewness, and kurtosis were calculated for each item,
using the two separate group samples and then using the total aggregated sample (Table
8). Mean scores in the universal group ranged from 2.79 to 3.41 with standard deviations
between 0.769 and 1.052. In the targeted group, mean scores were lower, ranging from
1.95 to 2.79 and standard deviations ranged from 0.616 to 0.974. In the aggregated
sample, item means ranged from 2.41 to 3.08 with standard deviations ranging from
0.867 to 1.078.
Skewness estimates for the universal group were all in the negative, ranging from
-1.376 to -0.305. These negatively skewed distributions reflect the high frequency of
ratings at level 3 (Often) and level 4 (Almost Always) of the Likert scale for students in
this group. For the targeted group, however, most items demonstrated a positive
skewness, with only three items having a negative skewness. Targeted group skewness
estimates ranged from -0.189 to 1.231. The positively skewed items reflect the frequency
of ratings at the lower half of the Likert scale (0: Almost Never, and 1: Sometimes) for
this group of students. Skewness estimates for the total sample ranged from -0.571 to
0.375.
Kurtosis estimates ranged from -1.36 to 1.083 for the universal group, from -
1.029 to 1.356 for the targeted group, and from -1.484 to -0.461 for the total sample. The
majority of items had a negative kurtosis within the groups and the as a total sample,
indicating somewhat platokurtic, flatter distributions than the normal curve.

Table 8
Descriptive Statistics for Pilot Rating Scale Items
Mean (Standard Deviation) Skewness Kurtosis
Item Universal
Group Targeted Group
Total Universal
Group Targeted Group
Total Universal
Group Targeted Group
Total
1 3.28 (.842) 2.35 (.616) 2.81 (.867) -.562 1.231 .324 -1.360 .988 -1.484
2 3.06 (.972) 2.09 (.820) 2.57 (1.021) -.466 .805 .204 -1.139 .560 -1.180
3 3.01 (.921) 2.32 (.664) 2.66 (.872) -.424 1.095 .322 -.910 1.076 -.998
4 2.87 (1.036) 2.00 (.685) 2.43 (.977) -.305 .709 .375 -1.207 1.356 -.894
5 3.38 (.832) 2.79 (.828) 3.08 (.877) -1.076 .139 -.381 .123 -1.025 -1.084
6 3.40 (.851) 2.50 (.920) 2.94 (.992) -1.133 .098 -.390 .088 -.788 -1.070
7 2.90 (.963) 2.09 (.706) 2.49 (.934) -.320 .740 .314 -1.005 1.171 -.838
8 2.79 (1.052) 2.04 (.974) 2.41 (1.078) -.363 .664 .152 -1.069 -.499 -1.235
9 2.95 (1.042) 2.00 (.720) 2.47 (1.010) -.586 .813 .232 -.866 1.336 -1.053
10 3.00 (.871) 2.40 (.783) 2.70 (.878) -.471 .095 -.091 -.560 -.338 -.742
11 3.23 (.968) 2.30 (.912) 2.76 (1.044) -.815 .351 -.132 -.710 -.596 -1.277
12 3.22 (.871) 2.60 (.799) 2.91 (.890) -.695 .416 -.084 -.712 -.649 -1.220
13 3.28 (.795) 2.56 (.833) 2.91 (.887) -.694 -.067 -.315 -.574 -.501 -.788
14 3.30 (.933) 2.30 (.842) 2.80 (1.016) -1.024 .386 -.156 -.181 -.303 -1.231
73

Mean (Standard Deviation) Skewness Kurtosis
Item Universal
Group Targeted Group
Total Universal
Group Targeted Group
Total Universal
Group Targeted Group
Total
15 3.11 (.968) 2.17 (.717) 2.64 (.970) -.746 .353 .044 -.551 .192 -1.056
16 3.20 (.877) 2.38 (.884) 2.78 (.970) -.752 .381 -.132 -.429 -.509 -1.107
17 3.09 (.983) 1.95 (.815) 2.51 (1.065) -.752 .652 .077 -.535 .100 -1.229
18 3.19 (.956) 2.44 (.862) 2.81 (.981) -.924 .312 -.205 -.201 -.523 -1.089
19 3.18 (1.003) 2.29 (.949) 2.73 (1.069) -.825 .176 -.210 -.636 -.887 -1.235
20 3.06 (1.048) 2.15 (.918) 2.60 (1.063) -.669 .389 -.035 -.897 -.656 -1.292
21 3.35 (.828) 2.59 (.888) 2.96 (.938) -1.013 .169 -.337 .046 -.783 -1.042
22 3.04 (.934) 2.13 (.813) 2.58 (.983) -.554 .171 -.028 -.717 -.639 -1.013
23 3.24 (.799) 2.61 (.871) 2.92 (.891) -1.068 .170 -.374 1.083 -.768 -.704
24 2.95 (.967) 2.17 (.829) 2.56 (.978) -.330 .603 .185 -1.109 .092 -1.040
25 3.06 (.769) 2.73 (.930) 2.90 (.868) -.622 -.189 -.430 .298 -.835 -.461
26 3.09 (.983) 2.20 (.922) 2.64 (1.050) -.671 .469 -.039 -.741 -.514 -1.230
27 3.41 (.882) 2.72 (.946) 3.06 (.976) -1.376 -.032 -.571 .903 -1.029 -.902
28 3.04 (.934) 2.13 (.828) 2.58 (.989) -.554 .412 .028 -.717 -.255 -1.050
29 3.11 (.914) 2.11 (.770) 2.60 (.980) -.534 .640 .143 -.923 .495 -1.096
30 3.34 (.826) 2.39 (.857) 2.86 (.964) -1.121 .351 -.258 .604 -.443 -1.045
74

75
Classical Item Analysis
Reliability analyses were performed to investigate the psychometric properties of
the pilot rating scale. Split-half reliability and internal consistency estimates (Table 9)
were calculated for each of the two groups and for the aggregate sample. Strong
reliability coefficients were found for all samples, with a higher level of reliability found
in the group of randomly selected students (.95) than in the group of targeted students
(.86). Overall reliability for the scale using both groups was high (.94). Likewise, internal
consistency was higher in the universal group (.98) than the targeted group (.95), with a
strong level of internal consistency using the full sample (.98).
Table 9
Split-half Reliability (r) and Internal Consistency (α)
Universal
Group Targeted Group
Total
r = .95 .86 .94
α = .98 .95 .98
In order to perform classical item discrimination, polyserial correlations were
calculated between each ordinal item and the total scale. These results (Table 10) are also
presented for the two individual groups and for the total sample. In the results for the full
sample of 162 student ratees, all items were positively correlated with the total scale.
Strong item-total correlations (between .75 and .85) were found for the majority of the
items. In the total and individual group samples, all item-total correlations were above .5
with the exception of items 7 and 25. As would be expected based on the split-half
reliability estimates, ratings of students from the universal group yielded stronger item-
total correlations than ratings of students from the targeted group.

76
Table 10
Corrected Item-Total Correlations for Pilot Rating Scale
Item Universal
Group Targeted Group
Total
1 .813 .644 .825
2 .851 .613 .819
3 .799 .613 .782
4 .853 .546 .807
5 .815 .611 .750
6 .747 .506 .716
7 .801 .493 .760
8 .634 .554 .659
9 .832 .551 .801
10 .650 .556 .666
11 .825 .721 .824
12 .677 .585 .691
13 .764 .526 .718
14 .840 .765 .856
15 .805 .600 .801
16 .836 .621 .789
17 .822 .577 .806
18 .711 .604 .723
19 .831 .591 .779
20 .832 .660 .809
21 .834 .615 .776
22 .645 .536 .697
23 .785 .680 .759
24 .686 .619 .723
25 .490 .422 .468
26 .814 .588 .775
27 .733 .515 .683
28 .857 .675 .832
29 .832 .723 .847
30 .843 .646 .812

77
Testing for Group Differences
Subsequently, the two groups were tested for statistically significant differences
in their ratings using the pilot scale. To perform this analysis, a sum score was created for
each student by summing the ratings for that student, yielding a potential range of scores
between 30 and 120. This sum score was used as the dependent variable and group
membership was treated as the independent variable in order to perform an independent
samples t-test. This test was used to evaluate the null hypothesis that the groups are
equal. Because there was reason to hypothesize that the groups will be different, based on
the sampling method, the results of the t-test were evaluated using one-tailed significance
levels. A priori power analysis using the G*Power 3 software program (Faul, Erdfelder,
Lang, & Buchner, 2007) was conducted before performing the t-test. The power analysis
indicated that with the sample sizes of n = 80 (universal group) and n = 82 (targeted
group), with an alpha level of .05, and with a desired sensitivity to effect sizes as small as
0.5, the power of the test would be .94. This was deemed an adequate level of power and
sample size to perform the test with accurate results.
Sum scores for students in the universal group (M = 93.71, SD = 22.15) were
higher than students in the targeted group (M = 68.99, SD = 15.53). Comparing the group
means yielded a difference score somewhere between 18.8 and 30.65, estimated with
95% confidence. The fact that this confidence interval does not include zero, and the
results of the t-test (t = 8.421, p < .001) allow us to reject the null hypothesis and
conclude that there is a significantly different level of ratings between the two groups. An
effect size was also calculated to represent the magnitude of the difference between
groups, using Cohen’s d and yielding a result of d = 1.29, falling between d = 0.95 and

78
d = 1.63 with 95% confidence. In other words, the difference in ratings between the
groups has a magnitude of close to one standard deviation.
Testing for Group by Gender Interaction
The sampling methods yielded a smaller number of males in the randomly
selected group (n = 41) than in the targeted group (n = 60). This result was expected and
falls in line with the disproportionate number of males who are identified for targeted and
individualized behavioral intervention in schools. However, a significant group by gender
interaction would not be desirable, because it would threaten the validity of the
significant main effect for group differences. A group by gender interaction may also
suggest that the pilot rating scale has items that are more biased for males or females
depending on their level of behavior problems, which would impair the functioning of the
scale in practice.
Thus, it was deemed necessary to test the results of the pilot scale ratings for
interactions between group and gender. Two-way analysis of variance (ANOVA) was
selected in order to perform an omnibus test of the null hypothesis, which would state
that there is no interaction between group and gender in the pilot rating scale data. This
test (Table 11) resulted in a nonsignificant finding for the interaction (F(1,158) = 3.242, p =
.074). This result suggests that the differences between the ratings of girls and boys are
not significantly different between the two groups. Thus, in the absence of a significant
interaction, we can continue to accept the main effect for group differences as significant
and meaningful.

79
Table 11
Two-way ANOVA Test for Group x Gender Interaction in Summary Scores
Source SS df MS F p
Group 20429.854 1 20429.854 60.520 .000
Gender 3411.757 1 3411.757 10.107 .002
Group x Gender Interaction 1094.498 1 1094.498 3.242 .074
Within (Error) 53336.619 158 337.574
Total 1151144.00
0 162
Factor Analytic Results
Principal axis factoring (PAF) was performed using the 30 pilot scale items. PAF
was performed three times: with the total sample, with the universal group data, and with
the targeted group data. The total sample (n = 162) is the only group with a large enough
sample size to conduct a meaningful factor analysis on the 30-item pilot scale. However,
it was deemed important to calculate estimates of the factor structure within the
individual groups as well in order to begin planning for future iterations of the research.
For each sample, the PAF procedure yielded the number of meaningful factors and the
percent of variance associated with each factor. Next, the item loadings were provided for
each item onto each of the factors of meaningful size.
Dimensionality
One single factor of meaningful size emerged when the total sample was
analyzed, accounting for 59.87% of the variance, and with an initial eiegenvalue of 18.23.
All other potential factors calculated by the analysis were significantly smaller than this
primary factor (see Figure 9).

80
Figure 9. Scree plot representing eigenvalues for all calculated factors using total sample.
When the subsamples were analyzed using the same methods, similar results were
found, with one strong factor emerging. The magnitude of the eigenvalue and percent of
variance explained by the primary factor was largest in the universal group, and
somewhat smaller in the targeted group (Table 12).
Table 12
Total Variance Explained by Primary Factor
Sample Eigenvalue % of Variance
Universal Group 19.00 62.46
Targeted Group 12.12 39.25
Total Sample 18.23 59.87
Item Loadings
For the total sample, item loadings for the 30 rating scale items (Table 13) were
all strong positive loadings, falling between .463 and .864, with most items loading

81
between .7 and .8. As found in the item-total correlations, item loadings in the targeted
group were smaller than in the universal group. This result was not surprising, based on
the fact that the targeted group was a more homogeneous sample than the universal
group. The increased heterogeneity of the universal group allowed for higher item-total
correlations and higher item loadings in the present analysis. Furthermore, the
heterogeneity of the total sample was an important factor contributing to the high item
loadings onto the primary factor when PAF was performed using the total sample. Item
25 displayed the weakest factor loadings, remaining the only item with loadings of less
than 0.5. Items 8, 10, 12, 22, and 27 yielded the next lowest item loadings.
Table 13
Item Loadings onto Primary Factor
Item Loading
Item #
Item Wording Universal
Group Targeted Group
Total
1 Follows school and classroom rules 0.830 0.665 0.837
2 Takes responsibility for own actions 0.863 0.632 0.830
3 Follows directions 0.812 0.645 0.797
4 Is a good listener 0.862 0.582 0.820
5 Respects the property of others 0.830 0.628 0.761
6 Stays in control when angry 0.760 0.543 0.734
7 Pays attention 0.807 0.535 0.774
8 Asks for clarification of instructions when confused
0.636 0.586 0.665
9 Thinks before she/he acts 0.842 0.567 0.811
10 Feels good about himself/herself 0.658 0.574 0.674
11 Is trustworthy. 0.837 0.734 0.833
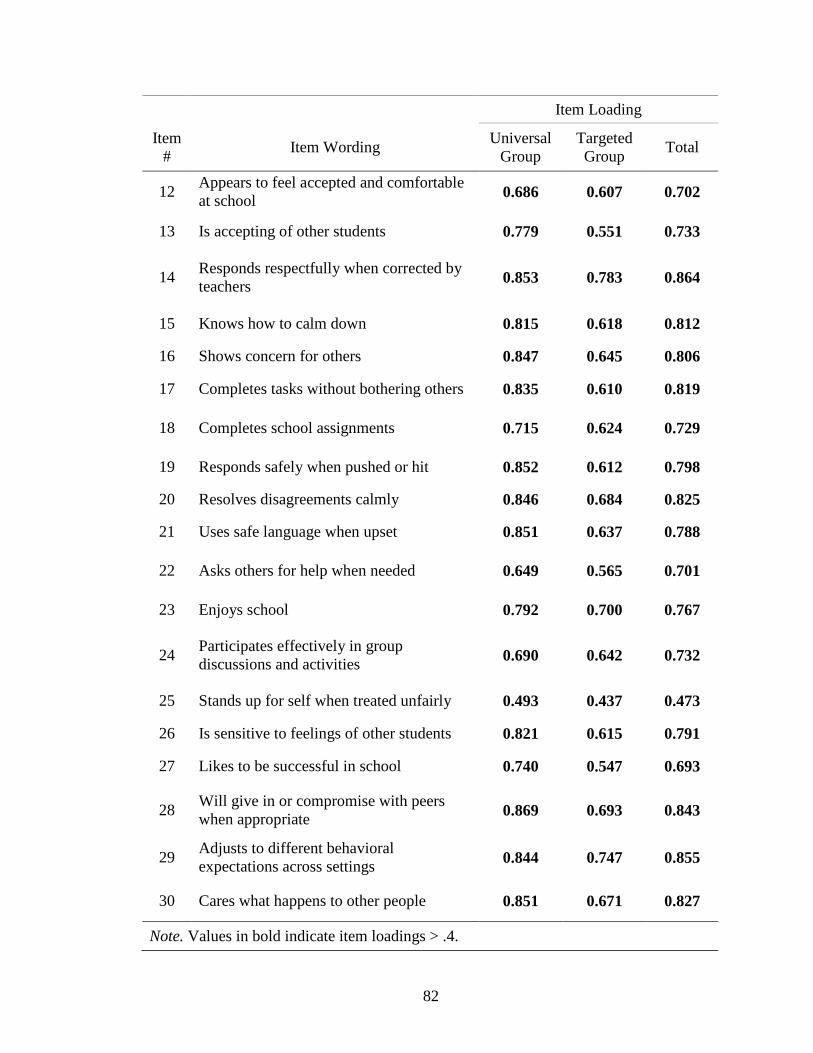
82
Item Loading
Item #
Item Wording Universal
Group Targeted Group
Total
12 Appears to feel accepted and comfortable at school 0.686 0.607 0.702
13 Is accepting of other students 0.779 0.551 0.733
14 Responds respectfully when corrected by teachers
0.853 0.783 0.864
15 Knows how to calm down 0.815 0.618 0.812
16 Shows concern for others 0.847 0.645 0.806
17 Completes tasks without bothering others 0.835 0.610 0.819
18 Completes school assignments 0.715 0.624 0.729
19 Responds safely when pushed or hit 0.852 0.612 0.798
20 Resolves disagreements calmly 0.846 0.684 0.825
21 Uses safe language when upset 0.851 0.637 0.788
22 Asks others for help when needed 0.649 0.565 0.701
23 Enjoys school 0.792 0.700 0.767
24 Participates effectively in group discussions and activities 0.690 0.642 0.732
25 Stands up for self when treated unfairly 0.493 0.437 0.473
26 Is sensitive to feelings of other students 0.821 0.615 0.791
27 Likes to be successful in school 0.740 0.547 0.693
28 Will give in or compromise with peers when appropriate 0.869 0.693 0.843
29 Adjusts to different behavioral expectations across settings 0.844 0.747 0.855
30 Cares what happens to other people 0.851 0.671 0.827
Note. Values in bold indicate item loadings > .4.

83
Teacher Ratings of Scale Feasibility
Approximately two-thirds of the respondents (66%) indicated that the rating scale
would be a reasonable time commitment, if asked to complete the scale on a weekly basis
for one or two students with mild to moderate behavior problems. The remaining 34%
replied that it would not be a reasonable time commitment. In response to the next
question, which asked how many items, at a maximum, the respondent would be willing
to complete, there was a wide range of responses (0 to 50 items). In the subgroup of
teachers (34%) who said that the rating scale was not a reasonable time commitment, the
range of maximum items was between 0 and 20, with a mean response of about 9 items
maximum (M = 8.96, SD = 5.59). When the full sample of all respondents was analyzed,
the mean response for maximum number of items was about 17.
Comments from the respondents were solicited at the end of the survey. Several
specific comments were made repeatedly, one of which was the request for a “Not
Applicable” (N/A) option on the Likert scale. Respondents stated that it was difficult to
rate certain items, such as item 6 (Stays in control when angry), item 15 (Knows how to
calm down), and item 25 (Stands up for self when treated unfairly), if the teacher had
never seen the student in these situations.
Another recurring comment from participants was the desire to know how the
data would be used. Teachers indicated that they would be more willing to commit to
using the rating scale if they understood the purpose of the tool. Other respondents stated
that the length of the survey was prohibitive based on the many time constraints in their
schedule each week.

84
CHAPTER 4
DISCUSSION
Summary of the Present Study
The purpose of this dissertation was to begin development of a brief, teacher-
completed rating scale, intended to be used with students in grades K-8 for the formative
assessment of positive classroom behavior. Positively worded rating scale items were
drawn from and adapted from existing published rating scales. Sources included social-
emotional, social skill, and broadband behavior rating scales. A preliminary item pool of
173 items was revised and narrowed down to 93 potential items for inclusion on the pilot
rating scale. Teachers and school staff were asked to rate the importance of these 93
rating scale items, based on their concept of “positive classroom behavior.” Based on this
survey, 30 of the rating scale items emerged as the most important and most appropriate
items to include on the pilot rating scale.
The pilot rating scale was then used by teachers to rate students from two
samples: a universal group and a targeted group. Students in the universal group were
randomly selected from general education classrooms, and students in the targeted group
were selected using a teacher nomination procedure intended to sample students with
mild to moderate externalizing behavior problems. Pilot scale ratings were significantly
higher in the universal group than the targeted group, by about one standard deviation,
with no significant group by gender interaction. The pilot scale demonstrated strong
levels of split-half reliability (.94) and internal consistency (.98). Medium to large item-
total correlations (> .5) were found for all but two items. Factor analysis indicated a
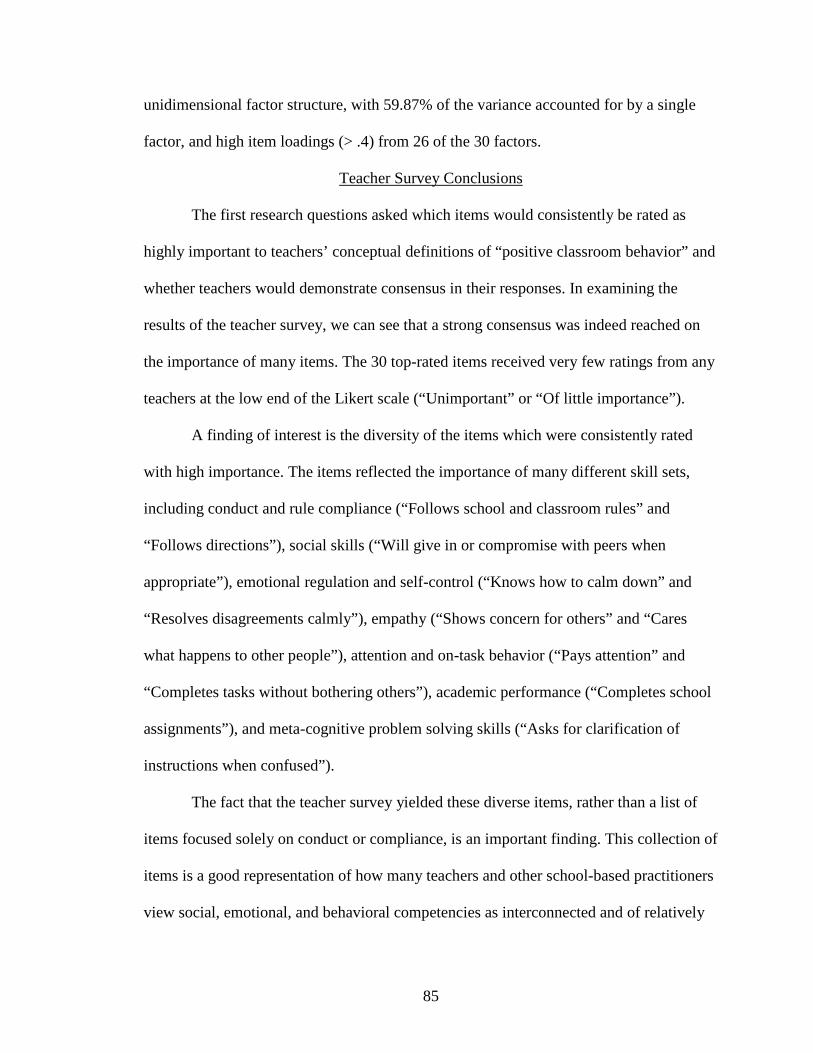
85
unidimensional factor structure, with 59.87% of the variance accounted for by a single
factor, and high item loadings (> .4) from 26 of the 30 factors.
Teacher Survey Conclusions
The first research questions asked which items would consistently be rated as
highly important to teachers’ conceptual definitions of “positive classroom behavior” and
whether teachers would demonstrate consensus in their responses. In examining the
results of the teacher survey, we can see that a strong consensus was indeed reached on
the importance of many items. The 30 top-rated items received very few ratings from any
teachers at the low end of the Likert scale (“Unimportant” or “Of little importance”).
A finding of interest is the diversity of the items which were consistently rated
with high importance. The items reflected the importance of many different skill sets,
including conduct and rule compliance (“Follows school and classroom rules” and
“Follows directions”), social skills (“Will give in or compromise with peers when
appropriate”), emotional regulation and self-control (“Knows how to calm down” and
“Resolves disagreements calmly”), empathy (“Shows concern for others” and “Cares
what happens to other people”), attention and on-task behavior (“Pays attention” and
“Completes tasks without bothering others”), academic performance (“Completes school
assignments”), and meta-cognitive problem solving skills (“Asks for clarification of
instructions when confused”).
The fact that the teacher survey yielded these diverse items, rather than a list of
items focused solely on conduct or compliance, is an important finding. This collection of
items is a good representation of how many teachers and other school-based practitioners
view social, emotional, and behavioral competencies as interconnected and of relatively

86
equal importance to school success. Thus, the revised pool of 30 items for the pilot rating
scale included a range of skills and behaviors from social, emotional, and behavioral
areas of competence. This diversity of rating scale items is also an important result to
consider as we move forward to look at the factor structure of the pilot scale data.
Pilot Rating Scale Conclusions
The second research question addressed several aspects of the psychometric
properties of the pilot rating scale data. Results showed that there were no clear outlier
items associated with very high or low means or standard deviations. Classical item
analysis showed just one item with an outlying item-total correlation. Items 25 (“Stands
up for self when treated unfairly”) was the only item with an item-total correlation falling
below .65, when calculated using the total sample. When item-total correlations were
calculated separately for the universal and targeted groups, there were more items with
lower item-total correlations in the targeted sample than the universal sample. Only one
other item in addition to item 25 had an item-total correlation below .5, which was item 7
(“Pays attention”). However, given the smaller sample sizes of the separate groups,
interpreting these results is less meaningful than interpreting the results from the total
sample.
It was not surprising, given the high item-total correlations, that the split-half
reliability was also high (.94). Again, we see a slightly lower level of reliability in the
targeted group (.86) than in the universal group (.95). This difference may be attributed to
several potential causes. It is likely that the true behavior of students from the targeted
tier population is quite variable in comparison to students from the general population.
Students who were nominated for the targeted group by teachers are likely to display

87
weaknesses and problems in some of the target behaviors, but not others. However, a
reliability of .86 is still relatively strong and also indicates a good deal of continuity of
behavior within this group. Students in the universal group, on the other hand, were much
more likely to have high ratings across all items on the scale, resulting in the higher
reliability for this group.
The significant difference between the groups, with an effect size close to one
standard deviation, was a promising finding for the potential usefulness of the pilot scale.
In some ways, there is also little surprise in this finding. Teachers who nominated
students for the targeted group were the same ones to complete the pilot scale. There was
a predisposition among those raters to view the students as struggling with behavioral,
and perhaps social-emotional issues. It would have been strange for the groups to appear
similar on the pilot scale, given the sampling and nomination procedures. However, there
was no guarantee from these sampling methods that the specific rating scale items chosen
for the pilot scale would be able to measure and reflect the magnitude of the difference
between groups. The targeted group was nominated based on a definition of externalizing
behavior disorders which is entirely based on negative behaviors and symptoms. The
pilot scale, however, used only positively worded items reflecting target skills,
competencies, and behaviors. These results establish an initial estimate of concurrent
validity between the pilot rating scale and the teacher nomination procedure adapted from
the SSBD. We can conclude from these findings that the pilot rating scale is likely to
yield significantly higher scores for students at a universal tier of support, and lower
scores for students in need of targeted tier support.

88
It was important to determine that there was no evidence of a significant group by
gender interaction in the pilot scale data. Finding ways to identify female students who
are in need of targeted intervention for social, emotional, or behavioral concerns is often
a challenge, because their problems are more likely to be internalizing than externalizing.
While the present study did not address that issue directly, we did produce a targeted
sample with less females than males (22 females out of 82). Given that the nomination
procedure was oriented to externalizing behavior problems, but the pilot scale included
many social-emotional items without a clear link to externalized behavior, there was a
danger of creating a group by gender interaction. Females were rated higher on the pilot
rating scale in both groups, and it would not have been a surprise if the difference
between females and males was greater in the targeted group than in the universal group.
If that interaction had been found to be significant, it would have complicated our ability
to interpret the main effect for group difference.
The factor analysis of the pilot rating scale data allows for another set of
conclusions. Differences were observable in the magnitudes of item loading between the
universal and targeted groups. Items loaded more strongly onto the primary factor in the
universal group than in the targeted group. This result was expected, based on the
homogeneity of the targeted group sample. Students from the universal group were
randomly selected, generating more heterogeneity into that group’s sample, and therefore
into the aggregated total sample as well. Targeted group students shared common
behavioral features because of the selection criteria for that group, yielding a more
homogeneous sample with more intercorrelation among the individual students in the
data set. However, targeted group item loadings were still greater than 0.4 for all items.

89
To address the stated research question, there was evidence of a unidimensional
factor structure, with all items having a relatively strong item loading onto this single
factor. We can interpret this as preliminary evidence that the rating scale being developed
may indeed be viewed as a general outcome measure (GOM) of positive classroom
behavior. If two or three separate factors had emerged, with different sets of items
clustering together into subgroups, then the rating scale might not be appropriate for use
as a general outcome measure. However, in this case, the items seem to cluster together
as one unit. If a student was rated highly for one item, such as “Follows directions,” then
the student was also likely to have been rated highly on other items, such as “Likes to be
successful in school” and “Asks others for help when needed.” This congruence of
ratings is important to note, especially considering the mixture of items from social,
emotional, and conduct-related domains of competence.
Looking more closely at the individual item loadings, we may begin to think
ahead to revising the pilot rating scale. Item 25 (“Stands up for self when treated
unfairly”) is a likely candidate for deletion. If future iterations of the pilot scale are
created with an attempt made to shorten the scale, then we could begin looking at the
other items with the lowest item loadings. Item 8 (“Asks for clarification of instructions
when confused”) and item 10 (“Feels good about himself/herself”) have the next lowest
item loadings on the scale.
Another source of information for revising the scale would be the final survey
questions asked of teachers at the end of the pilot rating scale administration. While the
majority of respondents (66%) believed that it was a reasonable commitment to complete
the rating scale on a weekly basis for one or two students, it was still not up to a higher
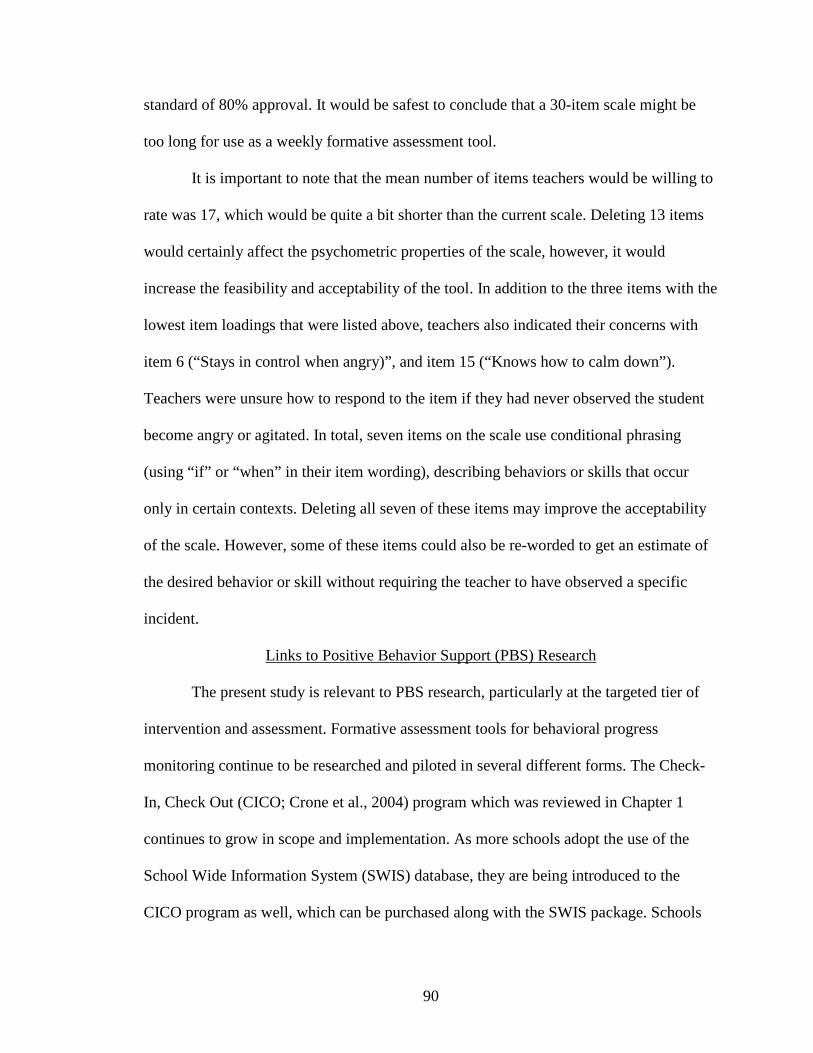
90
standard of 80% approval. It would be safest to conclude that a 30-item scale might be
too long for use as a weekly formative assessment tool.
It is important to note that the mean number of items teachers would be willing to
rate was 17, which would be quite a bit shorter than the current scale. Deleting 13 items
would certainly affect the psychometric properties of the scale, however, it would
increase the feasibility and acceptability of the tool. In addition to the three items with the
lowest item loadings that were listed above, teachers also indicated their concerns with
item 6 (“Stays in control when angry)”, and item 15 (“Knows how to calm down”).
Teachers were unsure how to respond to the item if they had never observed the student
become angry or agitated. In total, seven items on the scale use conditional phrasing
(using “if” or “when” in their item wording), describing behaviors or skills that occur
only in certain contexts. Deleting all seven of these items may improve the acceptability
of the scale. However, some of these items could also be re-worded to get an estimate of
the desired behavior or skill without requiring the teacher to have observed a specific
incident.
Links to Positive Behavior Support (PBS) Research
The present study is relevant to PBS research, particularly at the targeted tier of
intervention and assessment. Formative assessment tools for behavioral progress
monitoring continue to be researched and piloted in several different forms. The Check-
In, Check Out (CICO; Crone et al., 2004) program which was reviewed in Chapter 1
continues to grow in scope and implementation. As more schools adopt the use of the
School Wide Information System (SWIS) database, they are being introduced to the
CICO program as well, which can be purchased along with the SWIS package. Schools

91
are using formative assessment data from CICO in order to monitor the progress of their
students in targeted tiers of support. Thus, within the current trends and best practices of
SWPBS, CICO remains at the forefront of formative assessment for targeted tier students.
This dissertation and future studies along this line, may provide some needed information
about which target behaviors and skills should be emphasized and measured at the
targeted tier. The development of a formative assessment tool with more established
psychometric properties will also strengthen the ability of schools to provide effective
and evidence-based services.
Research investigating the psychometric properties features of direct behavior
ratings (DBRs) continues to provide new information about formative assessment for
school and classroom behaviors. One recent study (Riley-Tillman et al., 2009) examined
the differences between target behaviors with global and specific wordings, as well as
positive and negative item wordings. DBR ratings were compared with a computerized
systematic direct observation system in order to examine the accuracy of the DBR ratings
using the different item wordings. While current practices in behavioral assessment and
intervention value the importance of specific, operationally defined target behaviors, the
outcome of the DBR study suggested that sometimes general item wordings can yield
more accurate results than specific item wordings. Furthermore, the study found that
positively worded items were rated more accurately than negatively worded items with
the target behavior of academic engagement. The present dissertation provides some
preliminary information about positively worded target behaviors and skills, many of
which are generally worded rather than specific and operationally defined.

92
The pilot rating scale will most likely be used to rate student behavior over the
course of at least a week’s time, distinguishing it from tools like the DBR. While the
specificity of a rating scale that targets a week of behavior is much lower than a tool that
measures an hour-long sample or shorter, there is value in capturing this general estimate
of behavior as well. Using both short-term and long-term assessment tools may be needed
for effective progress monitoring at the targeted tier of intervention. The idea of using
more than one type of assessment tool is also in line with the need for multi-method,
multi-source assessment that is recommended for more comprehensive individual
assessments (Merrell, 2008a).
Links to research on universal tier PBS can also be drawn, although the universal
tier was not the primary focus of the dissertation. In a conference presentation to the
National Association of School Psychologists, Bear and Minke (2007) described some of
their research and school-based practice in Delaware schools, in which they have begun
to infuse social-emotional learning into a system of schoolwide positive behavior
supports. They posited the notion that SWPBS can be less successful when it is
implemented with a narrowly behavioral approach and without an awareness of student-
teacher relationships, social-emotional competencies, and social cognition. The research
of Bear and colleagues has examined the social cognitive skills that lead to students’ use
of positive behaviors (Bear, Manning, & Izard, 2003). In the present dissertation, the fact
that teachers rated social-emotional and social-cognitive items with high levels of
importance to positive classroom behavior corroborates this existing area of research.
Furthermore, the unidimensional factor structure of the pilot scale adds support to the
idea that these social-cognitive skills and target behaviors may all be viewed as part of
93
one large construct. Although the present study focused primarily on developing a tool to
be used with students at a targeted tier of intervention, there are implications for the
universal, whole-school tier of PBS implementation. Because teachers indicated a high
level of importance for many social-emotional skills in general education classrooms,
there is an opportunity to provide preventative, universal supports to all students.
Links to Response to Intervention (RTI) Research
Severson, Walker, Hope-Doolittle, Kratochwill, and Gresham (2007) outlined the
best practices, recent innovations, and future research directions for screening and early
identification of emotional and behavioral problems. Within a response to intervention
model of social, emotional, and behavioral assessment, there are few existing tools with
extensive research and field testing. There are also numerous options for the format,
sophistication, purpose, and outcomes of the assessment process in such an RTI
framework. These authors suggest that before researchers begin to invest large amounts
of time and money into developing assessment tools with adequate psychometric
properties, preliminary studies must determine how to align the assessment needs of the
RTI model with the needs and priorities of educators who are on the front lines of
classroom teaching. The social validity and acceptability of new assessment tools is an
important piece of the research agenda these authors suggest. Specifically, they
recommend the following:
“Another critical line of research could focus on the characteristics and forms of screening approaches that vary in their acceptability to educators who participate in and consume the results of such screening. Our experience suggests that educators are more accepting of generic approaches that are cost efficient, solve a high priority problem, do not require excessive effort, and are central to the core mission of schooling. Systematic screening approaches and procedures that meet these criteria and that have acceptable specificity and sensitivity likely do not

94
currently exist” (Severson, Walker, Hope-Doolittle, Kratochwill, & Gresham, 2007, p.219).
While the present study was originally designed with the desire to develop a formative
assessment tool, not a screening tool, future research that builds on the current study
could also apply these findings to screening practices. One strength of the design of this
dissertation is its inclusion of teacher feedback and teachers’ beliefs in the development
of the rating scale. With at least one more phase of revision based on teacher feedback,
the resulting final product should yield high feasibility and acceptability ratings from the
teachers who are asked to use it.
The above quote also suggests that educators respond best to assessment tools that
are generic and solve a high priority problem. As a general outcome measure (GOM), this
pilot rating scale may be generic and general enough to meet this standard. Its ability to
solve high priority problems of classroom teachers is unknown. However, it does have
the potential to be low-cost, low-effort, and central to the mission of schooling (namely,
promoting the development of academic and social skill competencies).
Limitations
Cook and Campbell (1979) outlined the major threats to validity in social science
research. While many of their categories apply to experimental designs with an
independent variable that is manipulated and a dependent outcome variable that is
measured, their framework still serves as a useful reference to discuss limitations of the
present study, which is based on correlational methods. Internal validity, external
validity, statistical conclusion validity, and the putative validity of causes and effects are
the four broad categories in this framework. Several specific threats to validity from these
four categories are of concern in the present study.

95
Foremost, the limitation of statistical power is of concern for the pilot rating scale,
particularly in the factor analysis portion of the study. The sample size of 142 survey
participants was adequate for the first phase of the study, because no statistical testing
was needed to analyze the survey responses. The sample size of 162 students rated using
the pilot scale was large enough to adequately power the statistical tests used to evaluate
the main effect for group and the group by gender interaction. However, this sample size
is considered low for powering a factor analysis. While methodologists differ in
recommending sample sizes for factor analysis, the recommendations in Gable and Wolf
(1993) indicate that a sample size of somewhere between 6 and 10 times the number of
items is ideal, which would be between 180 and 300 participants for the 30-item pilot
rating scale. A lower minimum sample size was suggested by other researchers in factor
analysis (Bryant & Yarnold, 1995), who recommended a minimum sample size of 5
times the number of items. Based on this lower recommendation, the present study would
be just above the minimum sample size of 150.
Another potential threat to statistical conclusion validity concerns the process of
random assignment to groups and random selection of students to be rated in the
universal group. Overall, the use of randomization in a school-based study is rarely found
and is challenging to implement. The use of SurveyMonkey technology and the design of
the study allowed randomization to be implemented successfully with few threats to
validity, making this feature a strength of the design. However, one sacrifice that was
made in order to facilitate the random selection of students was the procedure allowing
participants to rate a student anonymously after selecting him or her randomly from the
class roster. This procedure sacrificed the ability of the researcher to oversee the random

96
selection directly and provide any quality control at the school sites. In other words,
participants were on an honor system to truly follow the random selection procedure.
This allowed for the chance that some participants did not pick a student at random,
instead choosing to rate whomever they could think of easily without referencing a class
list.
Assuring independence of the participants in the universal group and the targeted
group was another aspect of the design intended to reduce threats to statistical conclusion
validity. However, there were limitations to this procedure as well. Teachers were
assigned to rate one student from the class they teach at 10:30 AM on Mondays. This
direction was given to avoid multiple students being rated more than once by different
teachers. The desired sample was 162 different students, each rated independently by a
different teacher. However, because we included related service providers,
administrators, and paraprofessionals in the study, there is a chance that some students
may have been rated more than once by chance. Data were not collected on the identities
of the students so there is no way to check this, and it is assumed that very few, if any
students would have been randomly selected by a teacher twice.
There is also a lack of independence in the design between the teacher nomination
procedure for the targeted group and the teacher ratings of those students using the pilot
rating scale. Because it was the same teachers who nominated students to be in that group
who then rated them using the pilot rating scale, we should understand that perhaps those
teachers were predisposed to rate those students lower. While we can still draw
conclusions about the properties of the pilot scale based on the significant difference
between the groups, there is a threat to the validity of these results that would have been

97
eliminated if two groups of teachers were used for this procedure: one group to nominate
the students for membership in the targeted group, and another group to rate those
students using the pilot scale.
As stated, the actual sample of schools who participated in the study was not as
diverse as the intended sample, with consideration for racial/ethnic, geographic, and
socioeconomic variables. The somewhat limited demographics of the sample require that
we only generalize the results to demographically similar populations, until such a time
when additional data may be collected from schools with a more diverse demographic.
Another limitation of the study was the lack of expert panel review of the pilot
rating scale. As stated, participants were solicited for this aspect of the design but none
were willing or able to respond. While an informal review of the scale by teachers,
counselors, and school psychologists familiar with SWPBS was conducted, the study
would have been stronger if expert researchers and practitioners had reviewed the pilot
scale before data collection occurred.
Another potential area of concern in the study is its generality. While the desired
end product is a general outcome measure (GOM), questions may be raised about the
meaningfulness of summarizing behavior over time. Traditional assessment, rooted in a
theoretical background of personality assessment, often asks the rater to summarize a
student’s behavior over a period of time, assuming that a stable and valid assessment of
the student’s typical performance can be gathered this way. Behavioral assessment, on
the other hand, is more likely to measure behavior in context and comes from a
theoretical perspective that behavior is environmentally specific and highly variable
(Goldfried & Kent, 1972). The pilot rating scale administered in this study asked raters to
98
consider the student’s behavior over the past several months, indicating a more traditional
and general approach to assessment. Again, while there are different perspectives in the
research literature and in the practice of assessment, this generality of the study may be
viewed as a limitation, because environmental and contextual variables were not
measured as part of the assessment.
Implications for Practice
Because this pilot rating scale is still in development, recommendations for
practice based on these results are made with caution. There are few immediate
implications for practitioners. However, based on the promising results of the study, we
can look ahead to several potential outcomes that may be applicable in schools.
The teacher survey results have implications for the planning of SWPBS
initiatives, including universal tier supports for all students. These results support the
SWPBS work of Bear and Minke (2007) and other practitioners who are working to
synthesize interventions and assessments that address positive behaviors as well as
social-emotional competencies. While it is possible to implement SWPBS without an
intentional focus on social-emotional learning, the results of this study suggest that
teachers place a high value on behaviors and skills that are closely oriented to social-
emotional competence, as well as traditional classroom conduct and compliance
behaviors.
At the targeted tier level, based on the high item-total correlations and the
unidimensional factor structure of the data, we can observe that students who struggle
with conduct-focused behaviors such as following directions and following rules also are
likely to struggle with social behaviors like cooperating with classmates and emotional

99
regulation skills like calming down when provoked by a peer. This means that there are
quite a few different areas of intervention that might be targeted for students who are
struggling. While safety and conduct are utmost importance in the school setting, the
other behaviors and skills measured by the rating scale are also important and highly
correlated with the rest of the items. Practitioners of SWPBS who are planning targeted
tier interventions may find it useful to refer to this collection of rating scale items when
designing the system of supports that are offered to students at this level of need.
One strength of the pilot rating scale that is suggested by the results is its
treatment validity. Because it uses positively worded target behaviors and skills, all of
which have been reported as highly important by teachers, there is a strong likelihood
that teachers would find a tool like this one to be very useful in their day-to-day work.
The emphasis on positively worded behaviors is an important influence on how teachers
might use the results of the assessment tool. Within a system of SWPBS, teachers are
asked to devote significant amounts of time and effort to teaching, noticing,
acknowledging, and reinforcing positive behaviors. However, when most of the
assessment tools that are used by teachers focus on negative problem behaviors, and
when teachers are asked to specifically look for, observe, rate, track, and measure
negative behaviors, there is a danger that their emphasis will be drawn to negative
behaviors when they intervene with students as well. Using assessment tools that require
teachers to look for, rate, track, and measure positive behaviors might be more helpful
and consistent with the intervention strategies emphasized by positive behavior support.
In this way, the proposed rating scale has promising treatment validity within a positive
behavior support approach to intervention.

100
Future Research Directions
Before continuing the process of developing this rating scale, it would be wise to
repeat the present study with a larger and more diverse sample. Specifically, there is still
one large urban school district in the Northeast US whose office of research, evaluation,
and assessment is reviewing the research proposal. It would be useful to have this sample,
or one with similar demographic features, in order to administer the original teacher
survey and a pilot rating scale as well. Teachers from urban schools may actually respond
to the survey with different rating scale items being indicated as the most important for
positive classroom behavior. This hypothesis would be important to test, and a decision
would have to be made at this point in time. Should separate rating scales be developed
for the different school settings, or should a combined scale be created that incorporates
the results of urban and rural/suburban samples? If it seems feasible to re-administer a
pilot version of the rating scale to all participants based on the full sample, then a
universal group and a targeted group may be sampled again using the same methods as in
the present study. Factor analysis should be recalculated using the larger, more diverse
sample and the dimensionality of the results can be analyzed once again. It will also be
important to ask the same questions again about the feasibility of the scale and the
maximum number of items teachers are willing to rate.
Following Gable and Wolf’s (1993) steps of scale development, another pilot
scale administration may be administered after items are revised, eliminated, or added.
This could be a future study implemented on a similar scale to the present study, with an
additional purpose of measuring reliability and validity. While split-half reliability has
been calculated, it would be wise to measure test-retest reliability as well as inter-rater

101
reliability in future studies. A study could be designed that combines these needs, as well
as the need to establish more concurrent validity with other methods of measurement.
Next, to investigate its promise as a screening tool, predictive validity could be
measured using the rating scale in the beginning of the school year and using outcome
variables such as office discipline referrals, suspensions, and other measures of behavior
over the course of the school year. A regression design may be used to establish the
power of the rating scale to predict future behavioral successes and problems. Is there a
certain cut score on the rating scale below which students can be identified as at-risk for
future problems in social, emotional, and behavioral areas? If so, that would provide
evidence of the predictive validity of this scale and its usefulness in identifying students
for targeted tier interventions.
The stated final goal of this research line is to develop a formative assessment tool
for positive classroom behavior. Future studies may begin to address this goal by
administering the scale repeatedly (on a weekly basis) to students who are identified as
having mild to moderate classroom behavior problems. For students who are receiving a
targeted intervention, the rating scale may be used to measure the effectiveness of the
intervention. Concurrent validity and usefulness for progress monitoring may be
established by comparing the rating scale data with other measures of effectiveness (e.g.,
office discipline referrals, rating scales, systematic direct observations, direct behavior
ratings).
The use of SurveyMonkey was effective for the present study. Based on the ease
of collecting and analyzing data for this study, SurveyMonkey is recommended as a
useful tool for future research in this area. Rating scales are easy to enter into the website,

102
and teachers can complete the rating scale easily and quickly as long as they have
adequate computer technology and access. Furthermore, the ability of SurveyMonkey to
present numbers and letters in randomized order to participants was a key feature
allowing this study to use random assignment and selection. One weakness of
SurveyMonkey that would become a hindrance to future studies is the issue of
confidentiality. While the website can keep information private, there may be regulations
that would not allow teachers to enter student names or other identifying information into
such a website. If future studies seek to track the changes in student performance over
time, or compare students’ ratings with concurrent measures, it will become necessary to
associate each student’s ratings with a name or at least an identification number.
Research designs will have to account for these policies and protections if SurveyMonkey
is used. Other options for administering the rating scale online should be explored in
future implementations.
In sum, continued research that seeks to develop formative assessment tools for
social, emotional, and behavioral competencies is in high need. As K-12 public schools
become more willing and able to provide intervention for students in these areas, there
also comes a growing need for tools that help to measure student progress and
intervention effectiveness. The development of formative assessment tools that are
simple, low-cost, valid, and reliable is an important contribution that researchers can
make to support the effective work of educators and to support the positive development
and learning of all students.

103
APPENDIX A
TEACHER SURVEY

104
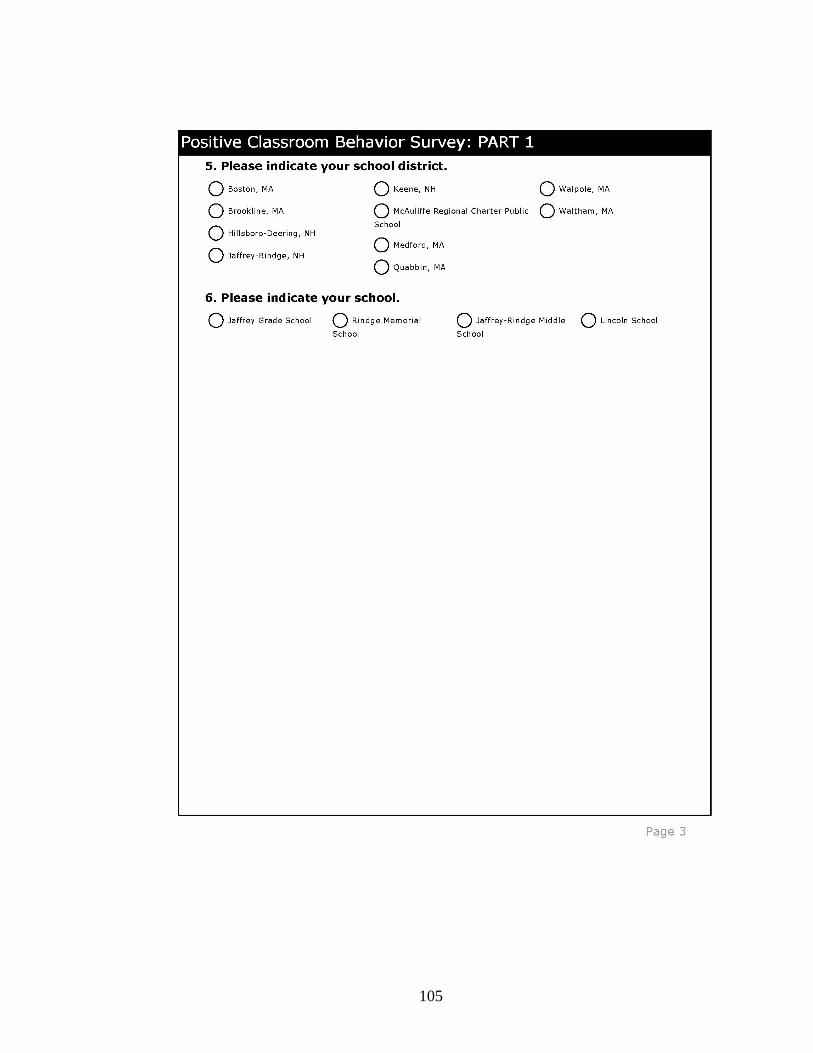
105
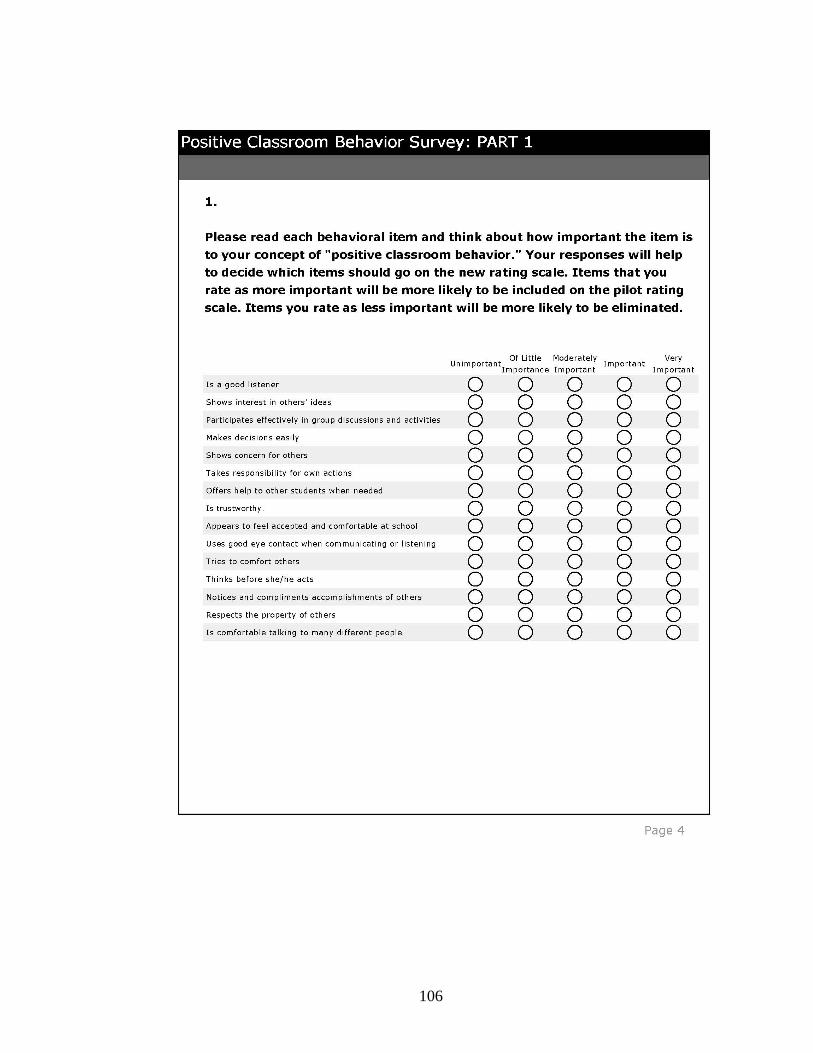
106

107

108

109

110
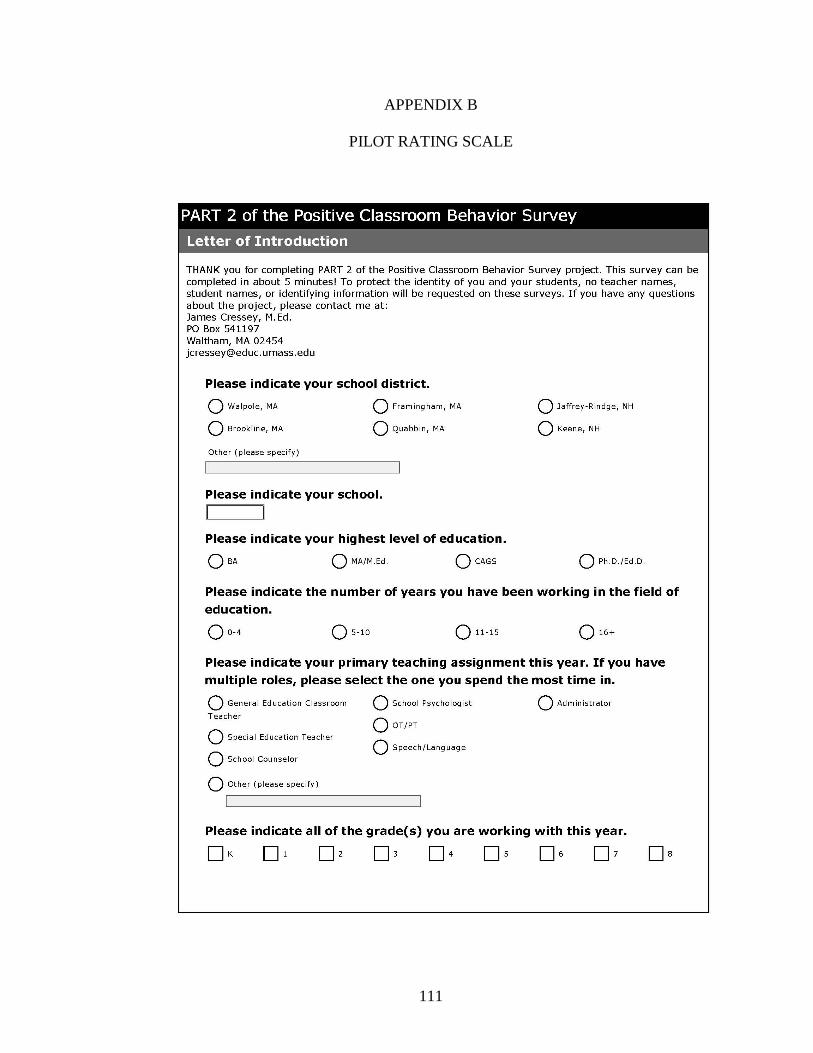
111
APPENDIX B
PILOT RATING SCALE

112

113

114
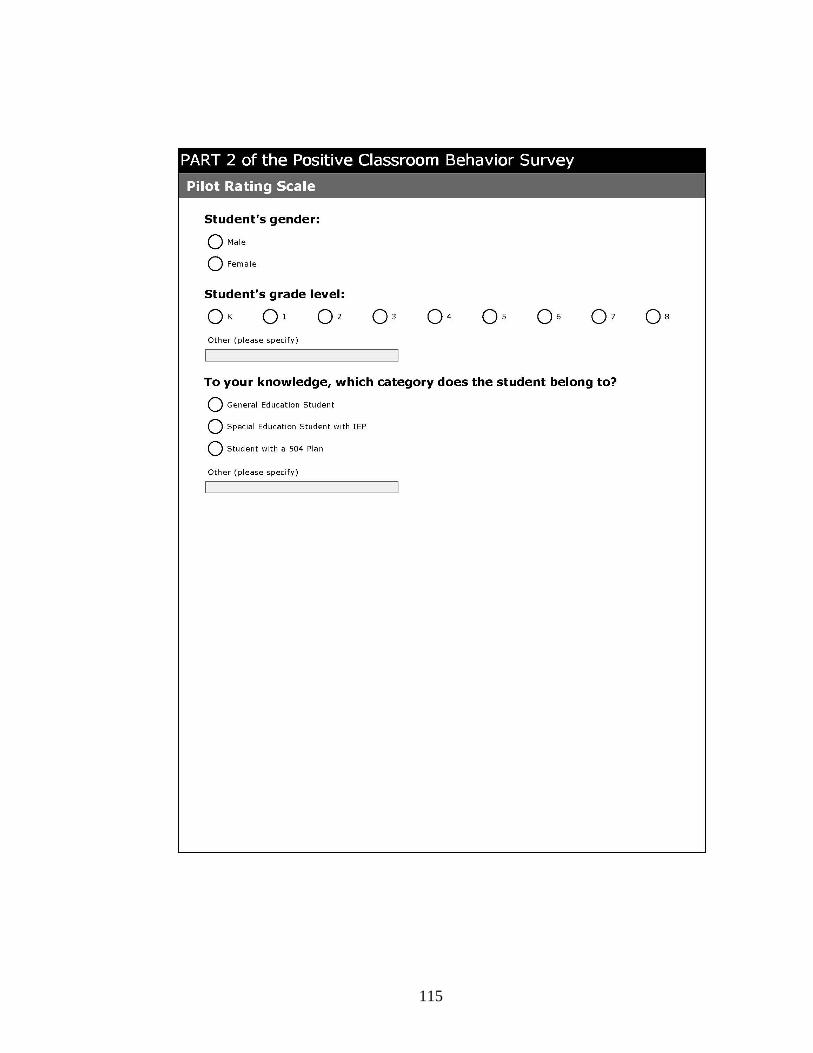
115

116
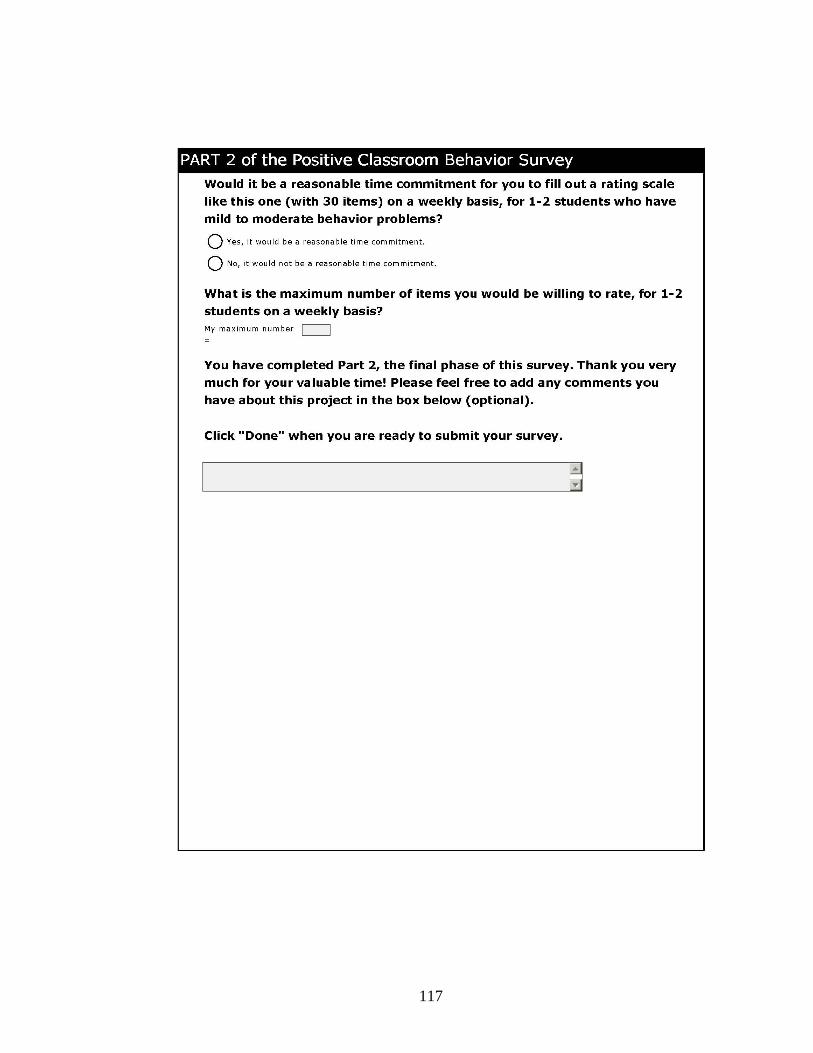
117
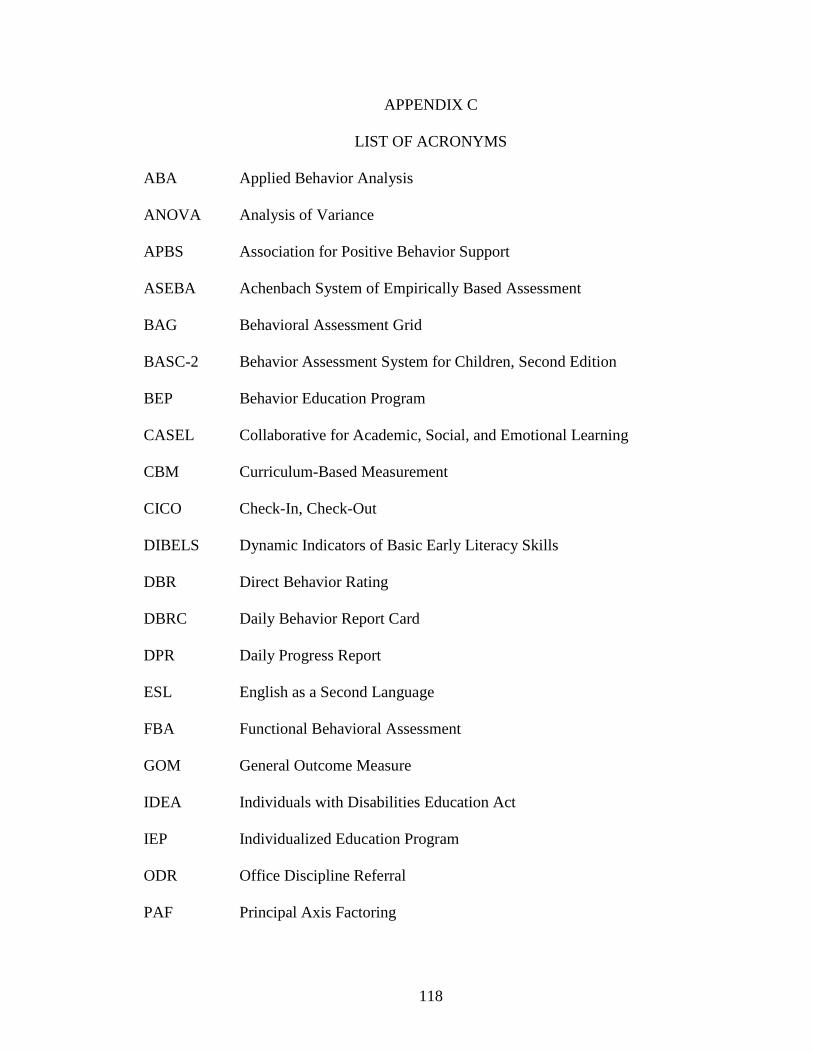
118
APPENDIX C
LIST OF ACRONYMS
ABA Applied Behavior Analysis
ANOVA Analysis of Variance
APBS Association for Positive Behavior Support
ASEBA Achenbach System of Empirically Based Assessment
BAG Behavioral Assessment Grid
BASC-2 Behavior Assessment System for Children, Second Edition
BEP Behavior Education Program
CASEL Collaborative for Academic, Social, and Emotional Learning
CBM Curriculum-Based Measurement
CICO Check-In, Check-Out
DIBELS Dynamic Indicators of Basic Early Literacy Skills
DBR Direct Behavior Rating
DBRC Daily Behavior Report Card
DPR Daily Progress Report
ESL English as a Second Language
FBA Functional Behavioral Assessment
GOM General Outcome Measure
IDEA Individuals with Disabilities Education Act
IEP Individualized Education Program
ODR Office Discipline Referral
PAF Principal Axis Factoring

119
PCA Principal Components Analysis
PBIS Positive Behavioral Interventions and Supports
PBS Positive Behavior Support
RTI Response to Intervention
SDO Systematic Direct Observation
SBSS School Social Behavior Scales
SEARS Social-Emotional Assets and Resiliency Scales
SEL Social-Emotional Learning
SET Schoolwide Evaluation Tool
SSMM Specific Subskill Mastery Measurement
SSBD Systematic Screening for Behavior Disorders
SSIS Social Skills Improvement System
SWIS Schoolwide Information System
SWPBS Schoolwide Positive Behavior Support

120
REFERENCES
Achenbach, T. M. & Rescorla, L. A. (2001). Manual for ASEBA school-age forms and profiles. Burlington, VT: University of Vermont, Research Center for Children, Youth, and Families.
Bear, G. G., Manning, M. A., & Izard, C. E. (2003). Responsible behavior: The importance of social cognition and emotion. School Psychology Quarterly, 18(2), 140-157.
Bear, G.G., & Minke, K.M. (2007, April). Schoolwide PBS: What’s missing and how to fix it. Paper presented at the National Association of School Psychologists Annual Convention, New York, NY.
Blechman, E.A., Schrader, S.M., & Taylor, C.J. (1981). Family problem solving versus home notes as early intervention with high-risk children. Journal of Counseling and Clinical Psychology, 49, 919–926.
Bransford, J. D., & Stein, B. S. (1984). The IDEAL problem solver. New York: W.H. Freeman.
Bryant, F. B., & Yarnold, P. R. (1995). Principal components analysis and exploratory and confirmatory factor analysis. In L. G. Grimm & R.R. Yarnold (Eds.), Reading and understanding multivariate statistics (pp. 99-136). Washington, DC: American Psychological Association.
Chafouleas, S.M., Christ, T.J., Riley-Tillman, T.C., Briesch, A.M., & Chanese, J.A. (2007). Generalizbility and dependability of direct behavior ratings to assess social behavior of preschoolers. School Psychology Review, 36(1), 63-79.
Chafouleas, S. M., McDougal, J. L., Riley-Tillman, T. C., Panahon, C. J., & Hilt, A. M. (2005). What do daily behavior report cards (DBRCs) measure? an initial comparison of DBRCs with direct observation for off-task behavior. Psychology in the Schools, 42, 669-676.
Chafouleas, S. M., Riley-Tillman, T. C., & McDougal, J. L. (2002). Good, bad, or in-between: How does the daily behavior report card rate? Psychology in the Schools, 39, 157-169.
Chafouleas, S. M., Riley-Tillman, T. C., & Sassu, K. A. (2006). Acceptability and reported use of daily behavior report cards among teachers. Journal of Positive Behavior Interventions, 8, 174-182.

121
Chafouleas, S. M., Riley-Tillman, T. C., Sassu, K. A., LaFrance, M. J., & Patwa, S. S. (2007). Daily behavior report cards: An investigation of the consistency of on-task data across raters and methods. Journal of Positive Behavior Interventions, 9, 30-37.
Chafouleas, S.M., Riley-Tillman, T.C., & Sugai, G.S. (2007). School-based behavioral
assessment. New York: The Guilford Press. Clark, T.M. (2008). The generalizability of systematic direct observations across items:
Exploring the psychometric properties of behavioral observation. Dissertation Abstracts International: Section B: The Sciences and Engineering, Vol 69(9-B), 2009. pp. 5826.
Clonan, S.M., McDougal, J.L., & Clark, K., Davison, S. (2007). Use of office discipline
referrals in school-wide decision making: A practical example. Psychology in the Schools, 44(1), 19-27.
Colvin, G., Kame’enui, E. J., & Sugai, G. (1993). School-wide and classroom management: Reconceptualizing the integration and management of students with behavior problems in general education. Education and Treatment of Children, 16, 361-381.
Cone, J.D. (1977). The relevance of reliability and validity for behavioral assessment. Behavior Therapy, 8, 411-426. Cone, J.D. (1978). The behavioral assessment grid (BAG): A conceptual framework and
taxonomy. Behavior Therapy, 9, 882-888. Conners, C.K. (1997). Conners Rating Scales-Revised Manual. Tonawanda, NY: Multi-
Health Systems. Cook, T.D. & Campbell, D.T. (1979). Quasi-experimental design and analysis issues
for field settings. Boston, MA: Houghton-Mifflin Company. Cronbach, L.J., Gleser, G.C., Nanda, H., & Rajaratnam, N. (1972). The dependability of
behavioral measurements. New York: Wiley.
Crone, D. A., Horner, R. H., & Hawken, L. S. (2004). Responding to problem behavior in schools: The behavior education program. Guilford Press.
Deno, S.L. (1985). Curriculum based measurement: The emerging alternative. Exceptional Children, 52, 219-232. Deno, S.L. (2002). The school psychologist as problem solver. In Thomas & Grimes,
(Eds.) Best practices in school psychology III. (pp.471-484). Bethesda: National Association of School Psychologists.

122
Diamond, J.M., & Deane, F.P. (1990). Conners’ Teachers Questionnaire: Effects and implications of frequent adminstrations. Journal of Child Clinical Psychology 19(3), 202-204.
Dunlap, G., Sailor, W., Horner, R.H. & Sugai, G.S. (2009). Overview and history of positive behavior support. In W. Sailor, G. Dunlap, G. Sugai, & R. Horner, (Eds.), Handbook of Positive Behavior Support. pp. 3-16. New York: Springer.
Drew, B.M., Evans, J.H., Bostow, D.E., Geiger, G., & Drash, P.W. (1982). Increasing assignment completion and accuracy using a daily report card procedure. Psychology in the Schools 19, 540-547.
Edelbrock, C. S., & Achenbach, T. M. (1984). The teacher version of the child behavior profile: I. boys aged 6-11. Journal of consulting and clinical psychology, 52, 207-217.
Educational and Community Supports (2007). School-Wide Information System. Retrieved December 5th, 2008, from Educational and Community supports Web site: http://www.swis.org/.
Faul, F., Erdfelder, E., Lang, A.-G., & Buchner, A. (2007). G*Power 3: A flexible statistical power analysis program for the social, behavioral, and biomedical sciences. Behavior Research Methods, 39, 175-191.
Fairbanks, S., Sugai, G., Guardino, D., & Lathrop, M. (2007). Response to intervention: Examining classroom behavior support in second grade. Exceptional Children 73, 288-310.
Fuchs, L. S. (1989). Evaluating Solutions, monitoring progress and revising intervention plans. In Shinn, M.R., Curriculum-Based Measurement: Assessing Special Children. New York: The Guilford Press.
Fuchs, L. S., & Deno, S. L. (1991). Paradigmatic distinctions between instructionally
relevant measurement models. Exceptional Children, 57, 488-500. Fuchs, L.S., & Fuchs, D. (1986). Effects of systematic formative evaluation: A meta-
analysis. Exceptional Children, 53, 3-14. Fuchs, L.S., & Fuchs, D. (1998) Treatment validity: A unifying concept for
reconceptualizing the identification of learning disabilities. Learning Disabilities Research and Practice, 13(4), 204-219.
Fuchs, L.S., Fuchs, D., Hamlett, C.L., Walz, L., & Germann, G. (1993). Formative
evaluation of academic progress: How much growth can we expect? School Psychology Review, 22, 27-48.
123
Gable, R.K., & Wolf, M.B. (1993). Instrument development in the affective domain (2nd ed.). Boston, MA: Kluwer Academic Publishers.
Goldfried, M. R., & Kent, R. N. (1972). Traditional versus behavioral personality
assessment: A comparison of methodological and theoretical assumptions. Psychological Bulletin, 77, 409-420.
Gresham, F. M., & Elliott, S. N. (2008). Social Skills Improvement System. Bloomington,
MN: Pearson Education, Inc.
Hawken, L.S. (2006). School psychologists as leaders in the implementation of a targeted intervention. School Psychology Quarterly 21, 91-111.
Hawken, L.S., & Horner, R. H. (2003). Evaluation of a targeted intervention within a school-wide system of positive behavior support. Journal of Behavioral Education 12, 225-240.
Hintze, J.M. (2005). Psychometrics of direct observation. School Psychology Review, 33, 507-519.
Hintze, J.M., Daly, E.J., & Shapiro, E.S. (1998). An investigation of the effects of
passage difficulty level on outcomes of oral reading fluency progress monitoring. School Psychology Review, 27(3), 433-445.
Hintze, J. M., & Matthews, W. J. (2004). The generalizability of systematic direct observations across time and setting: A preliminary investigation of the psychometrics of behavioral observation. School Psychology Review, 33(2), 258-270.
Hintze, J.M., & Shapiro, E.S. (1995). Systematic Observation of classroom behavior. In A. Thomas & J. Grimes (Eds.), Best Practices in School Psychology III (pp. 651-660). Bethesda, MD: National Association of School Psychologists.
Hintze, J. M., & Shapiro, E. S. (1997). Curriculum-based measurement and literature
based reading: Is curriculum-based measurement meeting the needs of changing reading curricula? Journal of School Psychology, 35, 351-375.
Hintze, J. M., Shapiro, E. S., & Lutz, J. G. (1994). The effects of curriculum on the
sensitivity of curriculum-based measurement in reading. The Journal of Special Education. 28, 188-202.
Horner, R. H., Todd, A. W., Lewis-Palmer, T., Irvin, L. K., Sugai, G., & Boland, J. B.
(2004). The school-wide evaluation tool (SET): A research instrument for assessing school-wide positive behavior support. Journal of Positive Behavior Interventions, 6(1), 3-12.

124
Individuals with Disabilities Education Improvement Act, Pub. L. No. 108-446, 20 U.S.C. § 1415 (2004).
Jöreskog, K.G. & Sörbom, D. (1988). LISREL 7 [Computer software]. Chicago, IL:
Scientific Software International, Inc. Kaminski, R. A., & Good, R. H. (1998). Assessing early literacy skills in a problem
solving model: Dynamic indicators of basic early literacy skills. In M. R. Shinn (Ed.), Advanced applications of curriculum-based measurement (pp. 113-142). New York: Guilford Press.
March, R.E., & Horner, R.H., 2002; Feasibility and contributions of functional behavioral
assessments in schools. Journal of Emotional and Behavioral Disorders 10, 158-170.
McCurdy, B.L., Mannella, M.C., & Eldridge, N. (2003). Positive behavior support in
urban schools: Can we prevent the escalation of antisocial behavior? Journal of Positive Behavior Interventions, 5(3), 158-170.
McMahon, R.J., Wells, K.C., & Kotler, J.S. (2006). Conduct problems. In E.J. Mash &
R.A. Barkley (Eds.), Treatment of childhood disorders (3rd ed., pp. 137-268). New York: The Guilford Press.
Merrell, K.W. (2002). School Social Behavior Scales (2nd Ed.). Eugene, OR: Assessment-
Intervention Resources. Merrell, K.W. (2008a). Behavioral, social, and emotional assessment of children and adolescents (3rd ed.). Mahwah, NJ: Erlbaum. Merrell, K.W. (2008b). The Social-Emotional Assets and Resiliency Scales. Eugene, OR:
School Psychology Program, College of Education. Available at http://strongkids.uoregon.edu/SEARS.html.
Metzler, C.W., Biglan, A., Rusby, J.C., & Sprague, J.R. (2001). Evaluation of a
comprehensive behavior management program to improve school-wide positive behavior support. Education and Treatment of Children, 24(4), 448-479.
Newton, S.J., Horner, R.H., Algozzine, R.F., Todd, A.W., & Algozzine, K.M. (2009).
Using a problem-solving model to enhance data-based decision making in schools. In W. Sailor, G. Dunlap, G. Sugai, & R. Horner, (Eds.), Handbook of Positive Behavior Support. pp. 551-580. New York: Springer.
Pelham, W. E. (1993). Pharmacotherapy for children with attention-deficit hyperactivity disorder. School Psychology Review, 22(2), 199-227.
125
Reschly, D. J. (1988). Special education reform: school psychology revolution. School Psychology Review, 17(3), 459-475.
Reynolds, C.R. & Kamphaus, K.W. (2004). BASC-2: Behavior Assessment Scale for Children, Second Edition. Circle Pines, MN: American Guidance Service.
Riley-Tillman, T. C., Chafouleas, S. M., & Briesch, A. M. (2007). A school practitioner's
guide to using daily behavior report cards to monitor student behavior. Psychology in the Schools, 44, 77-89.
Riley-Tillman, T. C., Christ, T. J., Chafouleas, S. M., Christ, T.J., Briesch, A.M., &
LeBel, T.J. (2009). The impact of item wording and behavioral specificity on the accuracy of direct behavior ratings (DBRs). School Psychology Quarterly, 24(1), 1-12.
Salvia, J., & Ysseldyke, J. E. (2001). Assessment (8th ed.). Boston: Houghton Mifflin.
Severson, H. H., Walker, H. M., Hope-Doolittle, J., Kratochwill, T. R., & Gresham, F. M. (2007). Proactive, early screening to detect behaviorally at-risk students: Issues, approaches, emerging innovations, and professional practices. Journal of School Psychology, 45, 193-223.
Schumaker, J.B., Hovell, M.F., & Sherman, J.A. (1977). An analysis of daily report cards and marent-managed privileges in the improvement of adolescents’ classroom performance. Journal of Applied Behavior Analysis, 10(3), 449-464.
Shapiro, E. S. (2004). Academic skills problems workbook (rev.). New York: The
Guilford Press.
Shapiro, E.S. (2009). Best practices in setting progress monitoring goals for academic skill improvement. In A. Thomas & J. Grimes (Eds.), Best Practices in School Psychology IV (pp. 141-158). Bethesda, MD: National Association of School Psychologists.
Shinn, M. R. (1989). Curriculum-based measurement: Assessing special children. New York: The Guilford Press.
Singer, G.H.S., & Wang, M. (2009). The intellectual roots of positive behavior support and their implications for its development. In W. Sailor, G. Dunlap, G. Sugai, & R. Horner, (Eds.), Handbook of Positive Behavior Support. pp. 17-46. New York: Springer.
Spaulding, S. A., Horner, R. H., May, S. L., & Vincent, C. G. (2008). Evaluation brief:
Implementation of schoolwide PBS across the United States. OSEP Technical Assistance Center on Positive Behavioral Interventions and Supports. Web site: http://pbis.org/evaluation/evaluation_briefs/default.aspx
126
Steege, M.W., Davin, T., & Hathaway, M. (2001). Reliability and accuracy of a
performance-based behavioral recording procedure. School Psychology Review, 30, 252-261.
Sugai, G. (2007). Promoting behavioral competence in schools: A commentary on exemplary practices. Psychology in the Schools, 44(1), 113-118.
Sugai, G.S. & Horner, R.H. (2009). Defining and describing schoolwide positive behavior support. In W. Sailor, G. Dunlap, G. Sugai, & R. Horner, (Eds.), Handbook of Positive Behavior Support. pp. 307-326. New York: Springer.
Sugai, G., Horner, R. H., Dunlap, G., Hieneman, M., Lewis, T. J., Nelson, C. M., et al. (2000). Applying positive behavior support and functional behavioral assessment in schools. Journal of Positive Behavior Interventions, 2(3), 131-143.
Tapp, J. (2004). MOOSES (Multi-Option Observation System for Experimental Studies). Retrieved November 15, 2007, from http://www.kc.vanderbilt.edu/mooses/mooses.html
Thorndike, R.M. (2005). Measurement and evaluation in psychology and education (7th ed.). Columbus, OH: Merrill.
Volpe, R. J., DiPerna, J. C., Hintze, J. M., & Shapiro, E. S. (2005). Observing students in classroom settings: A review of seven coding schemes. School Psychology Review, 34(4), 454-474.
Walker, H. M., Horner, R. H., Sugai, G., & Bullis, M. (1996). Integrated approaches to preventing antisocial behavior patterns among school-age children and youth. Journal of Emotional and Behavioral Disorders, 4(4), 194-209.
Walker, H. M., Irvin, L. K., Noell, J., & Singer, G. H. (1992). A construct score approach to the assessment of social competence: Rationale, technological considerations, and anticipated outcomes. Behavior modification, 16(4), 448-474.
Walker, H.M. & Severson, H.H. (1992). The Systematic Screening for Behavior Disorders: A multiple gating procedure. Longmont, CO: Sopris West.
Wright, J. (2002). Behavior Report Card Generator [computer software]. Retrieved November 15, 2005, from www.jimwrightonline.com/php/tbrc/tbrc.php.
Ysseldyke, J., Burns, M., Dawson, P., Kelly, B., Morrison, D., Ortiz, S., Rosenfield, S., Telzrow, C. (2006). School Psychology: A blueprint for training and practice III. Bethesda, MD: National Association of School Psychologists.