Embed Size (px)
Citation preview
London Borough of Brent’s Local Plan
Development Management Policies Development Plan Documents
Sustainability Appraisal Report Appendices to Part A: Sustainability Context
March 2014
Prepared for London Borough of Brent
and Collingwood Environmental
Planning Collingwood Environmental Planning 1E, The Chandlery 50 Westminster Bridge Road London, SE1 7QY, UK tel: 020 7407 8700 email: [email protected] web: www.cep.co.uk

SA Report
Contents
March 2014
CONTENTS
Brent’s Development Management DPD Preferred
Options – SA Report (Appendices to Part A)
Appendices i
(See separate volumes for the contents of the main SA Report)
APPENDICES APPENDICES TO PART A: SUSTAINABILITY CONTEXT
Appendix 1: Scoping Report Consultees ................................................................. 3
Appendix 2: Summary of Consultees Comments on Sustainability Appraisal Scoping Report .................................................................... 7
Appendix 3: Review of Relevant Plans and Programmes ....................................... 23
Appendix 4: Baseline Data..................................................................................... 47
Appendix 5: Sustainability Objectives, Criteria, Indicators and Targets ................. 99
Appendix 6: Significance Criteria ......................................................................... 109
APPENDICES TO PART B: APPRAISAL OF THE DEVELOPMENT POLICIES
(included in separate volume)
Appendix 7: Initial Sustainability Appraisal Commentary and LB Brent Responses .. 115
SA Report Abbreviations
March 2014
ABBREVIATIONS
Brent’s Development Management DPD Preferred
Options – SA Report (Appendices to Part A)
Appendices ii
AMR Annual Monitoring Report
AQMA Air Quality Management Area
BAP Biodiversity Action Plan
BEA Borough Employment Area
BIW Businesses, Industry and Warehouses
BREEAM BRE (Building Research Establishment) Environmental Assessment Method
CEP Collingwood Environmental Planning
CF Community Facilities
CMS Convention on Migratory Species
CO Carbon Monoxide
CO2 Carbon Dioxide
CP Core Policy
CST Culture Sport and Tourism
db Decibels
DC Development Control
DCLG Department for Communities and Local Government
DCMS Department for Culture Media and Sport
Defra Department for Environment Food and Rural Affairs
DETR Department for Transport, Local Government and the Regions
DfT Department for Transport
DP Development Policy
DPD Development Plan Document
DTI Department of Trade and Industry
EA Environment Agency
EEA Energy Action Area
EEC European Economic Community
EC European Commission
EIA Environmental Impact Assessment
ENV Environment
EU European Union
GPD Gross Domestic Product
GIS Geographical Information System
GLA Greater London Authority
GOL Government Office for London
GP General Practitioner
GQA General Quality Assessment
H Housing
HA Housing Association
Ha Hectare
IEA Industrial Employment Area
IMD Index of Multiple Deprivation
I & O Issues and Options
LA 21 Local Agenda 21
LBB London Borough of Brent LB
Brent London Borough of Brent
LBPN London Bus Priority Network
LCN+ London Cycle Network Plus
LDD Local Development Document
LDF Local Development Framework
LDS Local Development Scheme
LEA Local Education Authority
LES Local Employment Site
LGA Local Government Association
LNR Local Nature Reserve LPA
Local Planning Authority
LIP Local Implementation Plan
MOL Metropolitan Open Land
NDC New Deal for Communities
NO Nitric Oxide
NO2 Nitrogen dioxide
NVQ National Vocational Qualifications
ODPM Office of the Deputy Prime Minister
OS Open Space
ONS Office of National Statistics
PCT Primary Care Trust
PM10 Particles measuring less than 10 microns
PPG Planning Policy Guidance
PPS Planning Policy Statement
PTAL Public Transport Accessibility Level
RSL Registered Social Landlords
SA Sustainability Appraisal
SAP Standard Assessment Procedure
SCI Statement of Community Involvement
SD Sustainable development
SD Sustainable design
SEA Strategic Employment Area
SEA Strategic Environmental Assessment
SFRA Strategic Flood Risk Assessment
SINC Sites of Importance for Nature Conservation
SOA Super Output Areas
SO2 Sulphur dioxide
SPD Supplementary Planning Document
SPG Supplementary Planning Guidance
SRDF Sub Regional Development Framework
SSSI Site of Special Scientific Interest
SUDS Sustainable Urban Drainage
TC Town Centre
TPO Tree Preservation Order
TRN Transport
UD Urban Design
UDP Unitary Development Plan
UNFCCC United Nations Framework Convention on Climate Change
VAT Value Added Tax
WFD Water Framework Directive
WLWDA West London Waste Disposal Authority (known as WestWaste)
ZED Zero Energy Development

March 2014
Brent s Development Management DPD Preferred Options - SA Report (Appendices to Part A)
Appendices
1
APPENDICES

Brent’s Development Management Policies DPD Preferred Options - SA Report (Appendices to Part A)
Appendices
3
APPENDIX 1
SCOPING REPORT CONSULTEES

Appendix
Brent’s Development Management DPD Preferred Options – SA Report (Appendices to Part A)
Appendices 5
1 March 2014
Sustainability Appraisal Scoping Report Consultees
The consultees formally consulted on this Scoping Report (including as part of the SEA
determination process set out in Regulation 9) as required by the SEA Regulations were:
• Natural England (superseded Countryside Agency and English Nature)*
• English Heritage *
• Environment Agency*
Other consultees included internal departments within the Council and the following external
organisations:
• Government Office for London
• Greater London Authority
• London Development Agency
• London Wildlife Trust
• Adjacent London Boroughs (Barnet, Camden, Ealing, Hammersmith & Fulham, Harrow,
Kensington & Chelsea and Westminster)
• Partners for Brent (the Local Strategic Partnership)
• Brent Energy Network
Those that responded are marked with an asterisk. Details of these comments are included in Appendix 2.

Brent’ s Development Management Policies Preferred Options - SA Report (Appendices to Part A)
Appendices
7
March 2014
APPENDIX 2
SUMMARY OF CONSULTEES COMMENTS ON SUSTAINABILITY
APPRAISAL SCOPING REPORT

Appendix
2 March 2014
Brent’s Development Management Policies Preferred Options – SA Report (Appendices to Part A)
Appendices 9
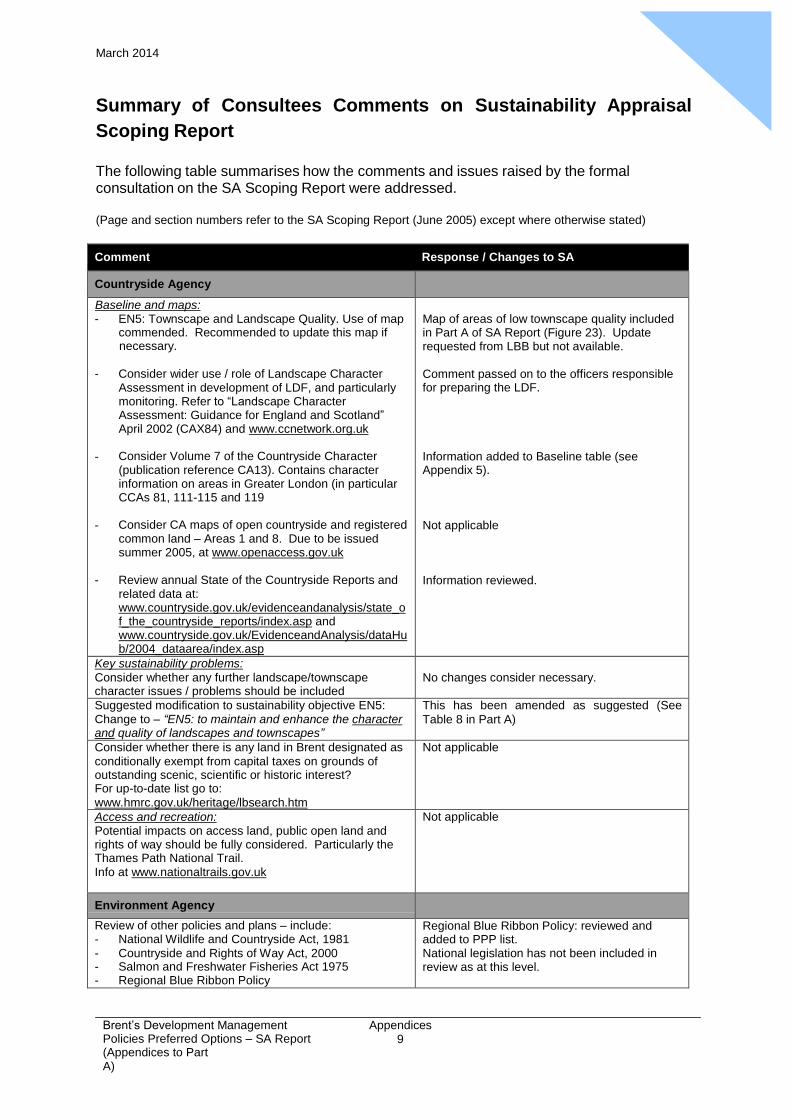
Summary of Consultees Comments on Sustainability Appraisal
Scoping Report
The following table summarises how the comments and issues raised by the formal consultation on the SA Scoping Report were addressed.
(Page and section numbers refer to the SA Scoping Report (June 2005) except where otherwise stated)
Comment Response / Changes to SA
Countryside Agency
Baseline and maps: - EN5: Townscape and Landscape Quality. Use of map
commended. Recommended to update this map if necessary.
- Consider wider use / role of Landscape Character
Assessment in development of LDF, and particularly monitoring. Refer to “Landscape Character Assessment: Guidance for England and Scotland” April 2002 (CAX84) and www.ccnetwork.org.uk
- Consider Volume 7 of the Countryside Character
(publication reference CA13). Contains character information on areas in Greater London (in particular CCAs 81, 111-115 and 119
- Consider CA maps of open countryside and registered
common land – Areas 1 and 8. Due to be issued summer 2005, at www.openaccess.gov.uk
- Review annual State of the Countryside Reports and
related data at: www.countryside.gov.uk/evidenceandanalysis/state_o f_the_countryside_reports/index.asp and www.countryside.gov.uk/EvidenceandAnalysis/dataHu b/2004_dataarea/index.asp
Map of areas of low townscape quality included in Part A of SA Report (Figure 23). Update requested from LBB but not available.
Comment passed on to the officers responsible for preparing the LDF.
Information added to Baseline table (see Appendix 5).
Not applicable
Information reviewed.
Key sustainability problems:
Consider whether any further landscape/townscape character issues / problems should be included
No changes consider necessary.
Suggested modification to sustainability objective EN5: Change to – “EN5: to maintain and enhance the character and quality of landscapes and townscapes”
This has been amended as suggested (See
Table 8 in Part A)
Consider whether there is any land in Brent designated as
conditionally exempt from capital taxes on grounds of outstanding scenic, scientific or historic interest? For up-to-date list go to:
www.hmrc.gov.uk/heritage/lbsearch.htm
Not applicable
Access and recreation: Potential impacts on access land, public open land and rights of way should be fully considered. Particularly the Thames Path National Trail.
Info at www.nationaltrails.gov.uk
Not applicable
Environment Agency
Review of other policies and plans – include: - National Wildlife and Countryside Act, 1981
- Countryside and Rights of Way Act, 2000 - Salmon and Freshwater Fisheries Act 1975 - Regional Blue Ribbon Policy
Regional Blue Ribbon Policy: reviewed and added to PPP list. National legislation has not been included in review as at this level.
Appendix
2 March 2014
Brent’s Development Management Policies Preferred Options – SA Report (Appendices to Part A)
Appendices 10
Comment Response / Changes to SA
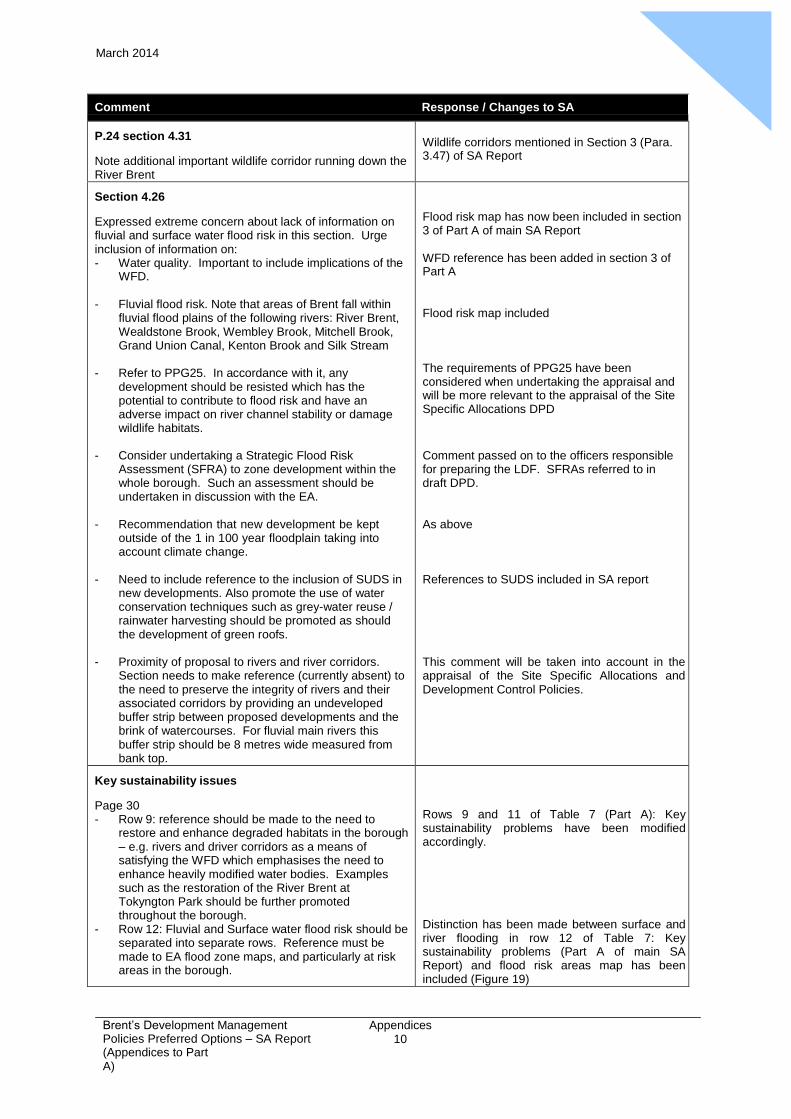
P.24 section 4.31
Note additional important wildlife corridor running down the River Brent
Wildlife corridors mentioned in Section 3 (Para. 3.47) of SA Report
Section 4.26
Expressed extreme concern about lack of information on fluvial and surface water flood risk in this section. Urge inclusion of information on: - Water quality. Important to include implications of the
WFD.
- Fluvial flood risk. Note that areas of Brent fall within
fluvial flood plains of the following rivers: River Brent, Wealdstone Brook, Wembley Brook, Mitchell Brook, Grand Union Canal, Kenton Brook and Silk Stream
- Refer to PPG25. In accordance with it, any
development should be resisted which has the potential to contribute to flood risk and have an adverse impact on river channel stability or damage wildlife habitats.
- Consider undertaking a Strategic Flood Risk
Assessment (SFRA) to zone development within the whole borough. Such an assessment should be undertaken in discussion with the EA.
- Recommendation that new development be kept
outside of the 1 in 100 year floodplain taking into account climate change.
- Need to include reference to the inclusion of SUDS in
new developments. Also promote the use of water conservation techniques such as grey-water reuse / rainwater harvesting should be promoted as should the development of green roofs.
- Proximity of proposal to rivers and river corridors.
Section needs to make reference (currently absent) to the need to preserve the integrity of rivers and their associated corridors by providing an undeveloped buffer strip between proposed developments and the brink of watercourses. For fluvial main rivers this buffer strip should be 8 metres wide measured from bank top.
Flood risk map has now been included in section 3 of Part A of main SA Report
WFD reference has been added in section 3 of Part A
Flood risk map included
The requirements of PPG25 have been considered when undertaking the appraisal and will be more relevant to the appraisal of the Site Specific Allocations DPD
Comment passed on to the officers responsible for preparing the LDF. SFRAs referred to in draft DPD.
As above
References to SUDS included in SA report
This comment will be taken into account in the appraisal of the Site Specific Allocations and Development Control Policies.
Key sustainability issues
Page 30 - Row 9: reference should be made to the need to
restore and enhance degraded habitats in the borough – e.g. rivers and driver corridors as a means of satisfying the WFD which emphasises the need to enhance heavily modified water bodies. Examples such as the restoration of the River Brent at Tokyngton Park should be further promoted throughout the borough.
- Row 12: Fluvial and Surface water flood risk should be separated into separate rows. Reference must be made to EA flood zone maps, and particularly at risk areas in the borough.
Rows 9 and 11 of Table 7 (Part A): Key sustainability problems have been modified accordingly.
Distinction has been made between surface and river flooding in row 12 of Table 7: Key sustainability problems (Part A of main SA Report) and flood risk areas map has been included (Figure 19)
Appendix
2 March 2014
Brent’s Development Management Policies Preferred Options – SA Report (Appendices to Part A)
Appendices 11
Comment Response / Changes to SA
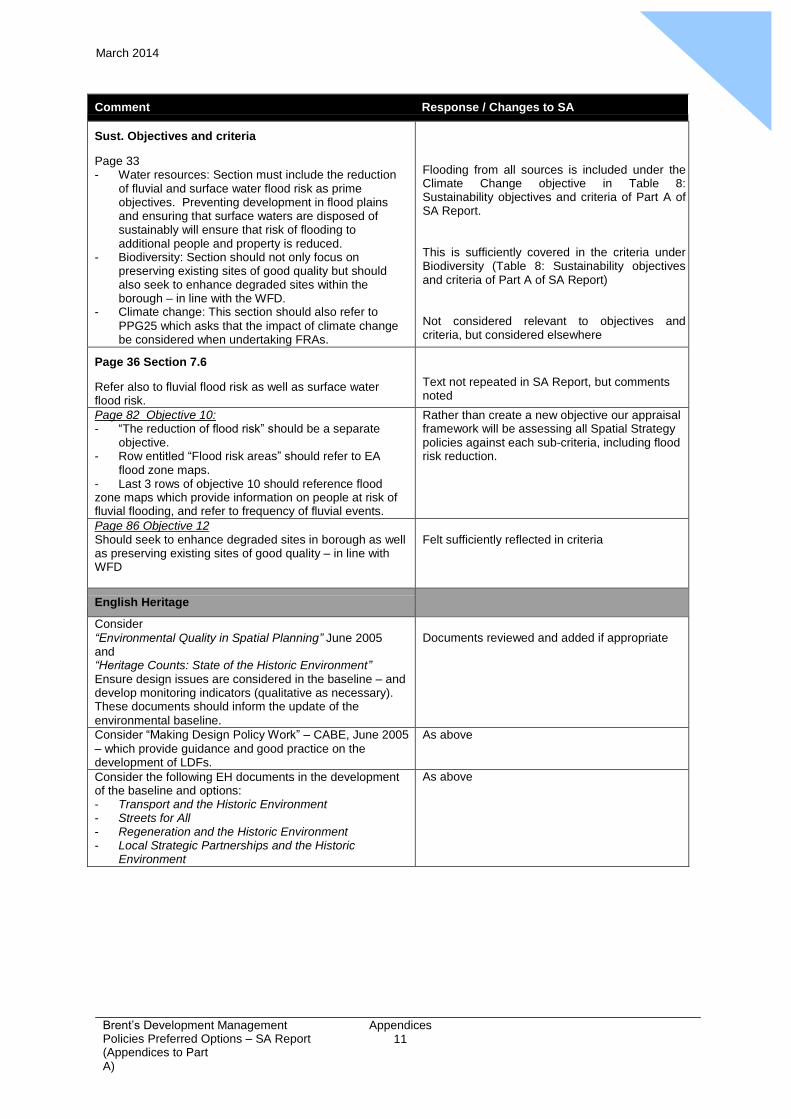
Sust. Objectives and criteria
Page 33 - Water resources: Section must include the reduction
of fluvial and surface water flood risk as prime objectives. Preventing development in flood plains and ensuring that surface waters are disposed of sustainably will ensure that risk of flooding to additional people and property is reduced.
- Biodiversity: Section should not only focus on preserving existing sites of good quality but should also seek to enhance degraded sites within the borough – in line with the WFD.
- Climate change: This section should also refer to
PPG25 which asks that the impact of climate change be considered when undertaking FRAs.
Flooding from all sources is included under the Climate Change objective in Table 8: Sustainability objectives and criteria of Part A of SA Report.
This is sufficiently covered in the criteria under Biodiversity (Table 8: Sustainability objectives and criteria of Part A of SA Report)
Not considered relevant to objectives and criteria, but considered elsewhere
Page 36 Section 7.6
Refer also to fluvial flood risk as well as surface water flood risk.
Text not repeated in SA Report, but comments noted
Page 82 Objective 10: - “The reduction of flood risk” should be a separate
objective. - Row entitled “Flood risk areas” should refer to EA
flood zone maps. - Last 3 rows of objective 10 should reference flood zone maps which provide information on people at risk of fluvial flooding, and refer to frequency of fluvial events.
Rather than create a new objective our appraisal framework will be assessing all Spatial Strategy policies against each sub-criteria, including flood risk reduction.
Page 86 Objective 12 Should seek to enhance degraded sites in borough as well as preserving existing sites of good quality – in line with WFD
Felt sufficiently reflected in criteria
English Heritage
Consider
“Environmental Quality in Spatial Planning” June 2005 and “Heritage Counts: State of the Historic Environment” Ensure design issues are considered in the baseline – and develop monitoring indicators (qualitative as necessary). These documents should inform the update of the
environmental baseline.
Documents reviewed and added if appropriate
Consider “Making Design Policy Work” – CABE, June 2005
– which provide guidance and good practice on the development of LDFs.
As above
Consider the following EH documents in the development of the baseline and options: - Transport and the Historic Environment - Streets for All - Regeneration and the Historic Environment - Local Strategic Partnerships and the Historic
Environment
As above

Appendix
2 March 2014
Brent’s Development Management Policies Preferred Options – SA Report (Appendices to Part A)
Appendices 12
Comment Response / Changes to SA
Review of other policies, plans and programmes, should
also include: National - Planning (listed buildings and conservation areas) act,
1990
- Ancient Monuments and Archaeological Areas Act, 1979
- The Historic Environment: A Force for Our Nature (DCMS 2001)
Regional - The London Plan
- Draft Sub-regional Development Framework – west London (June 2005)
- Draft SPG on Sustainable Design and Construction
(March 2005) Local - Conservation Area Appraisals - Cultural Strategy
As above
Baseline
Consider the following statutory designations and their settings: - World Heritage Sites - Listed Buildings
- Scheduled Ancient Monuments - Archaeological Priority Areas
- Registered Historic Parks and Gardens - Registered Battlefields
- Conservation areas
These have been included when information
was available / relevant
Also consider:
Other archaeological sites, locally listed buildings, parks, character of the wider landscape, historic landscapes and potential for as yet unrecorded archaeology.
Wider historic environment should be considered in assessment of future trends.
As above
Suggested information sources: - Heritage Counts: www.heritagecounts.org.uk
- Greater London Sites and Monuments Record - National Monuments Record Centre, Swindon
- Magic www.magic.gov.uk - English Heritage annual Buildings at Risk Register - Local Authority conservation team for locally listed
buildings - Local History / studies centres
As above
Suggested indicators: - Number of listed buildings under each grade - Number and % of listed buildings at risk - Number of scheduled ancient monuments - Number and % of archaeological sites at risk
- Number of registered historic parks and gardens - Number of conservation areas
- Number and % of Conservation Areas with appraisals - Impact of change on character and appearance of
conservation areas - % or areas of historic buildings, sites and areas
affected whether in adverse or beneficial way - Street / public realm audits, improvement works, de-
cluttering works - % residents content with character and appearance of
local area - Rate of loss of historic landscape features
- Erosion of quality character and distinctiveness
As above
Appendix
2 March 2014
Brent’s Development Management Policies Preferred Options – SA Report (Appendices to Part A)
Appendices 13
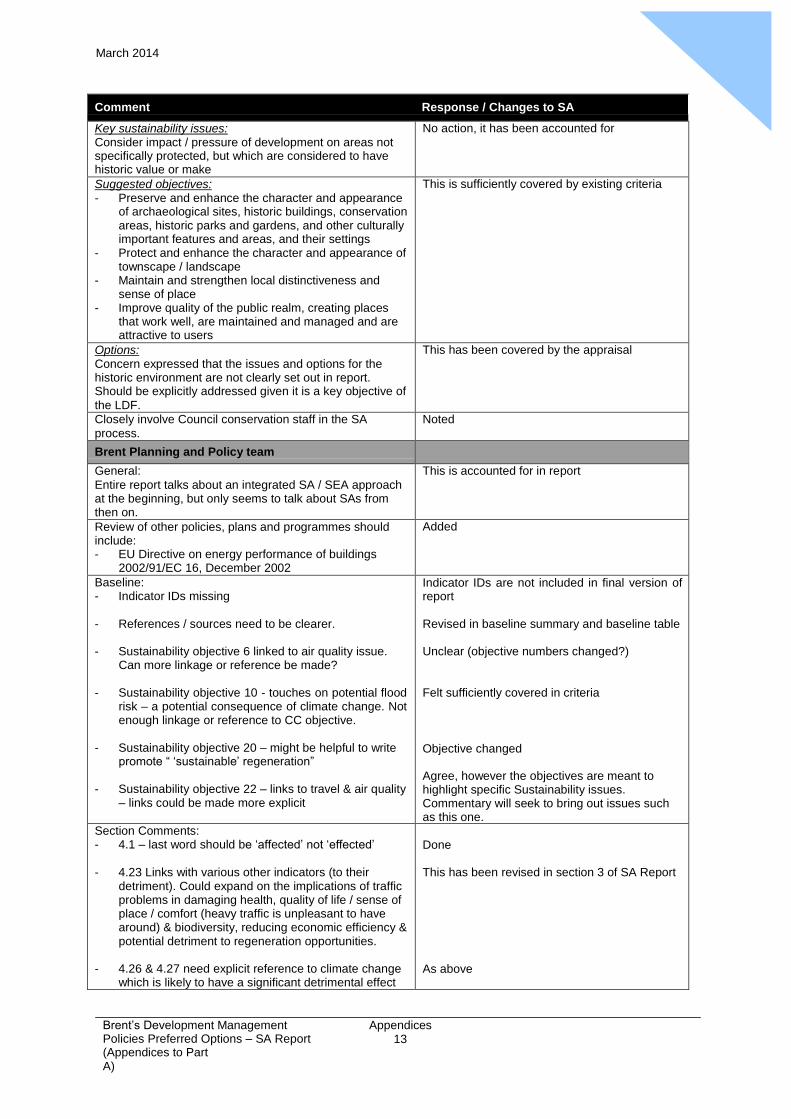
Comment Response / Changes to SA
Key sustainability issues: Consider impact / pressure of development on areas not specifically protected, but which are considered to have historic value or make
No action, it has been accounted for
Suggested objectives: - Preserve and enhance the character and appearance
of archaeological sites, historic buildings, conservation areas, historic parks and gardens, and other culturally important features and areas, and their settings
- Protect and enhance the character and appearance of townscape / landscape
- Maintain and strengthen local distinctiveness and sense of place
- Improve quality of the public realm, creating places that work well, are maintained and managed and are attractive to users
This is sufficiently covered by existing criteria
Options: Concern expressed that the issues and options for the historic environment are not clearly set out in report. Should be explicitly addressed given it is a key objective of
the LDF.
This has been covered by the appraisal
Closely involve Council conservation staff in the SA
process.
Noted
Brent Planning and Policy team
General:
Entire report talks about an integrated SA / SEA approach at the beginning, but only seems to talk about SAs from then on.
This is accounted for in report
Review of other policies, plans and programmes should include: - EU Directive on energy performance of buildings
2002/91/EC 16, December 2002
Added
Baseline: - Indicator IDs missing
- References / sources need to be clearer.
- Sustainability objective 6 linked to air quality issue.
Can more linkage or reference be made?
- Sustainability objective 10 - touches on potential flood risk – a potential consequence of climate change. Not enough linkage or reference to CC objective.
- Sustainability objective 20 – might be helpful to write
promote “ ‘sustainable’ regeneration”
- Sustainability objective 22 – links to travel & air quality – links could be made more explicit
Indicator IDs are not included in final version of report
Revised in baseline summary and baseline table
Unclear (objective numbers changed?)
Felt sufficiently covered in criteria
Objective changed
Agree, however the objectives are meant to highlight specific Sustainability issues. Commentary will seek to bring out issues such as this one.
Section Comments: - 4.1 – last word should be ‘affected’ not ‘effected’
- 4.23 Links with various other indicators (to their
detriment). Could expand on the implications of traffic problems in damaging health, quality of life / sense of place / comfort (heavy traffic is unpleasant to have around) & biodiversity, reducing economic efficiency & potential detriment to regeneration opportunities.
- 4.26 & 4.27 need explicit reference to climate change
which is likely to have a significant detrimental effect
Done
This has been revised in section 3 of SA Report
As above
Appendix
2 March 2014
Brent’s Development Management Policies Preferred Options – SA Report (Appendices to Part A)
Appendices 14
Comment Response / Changes to SA
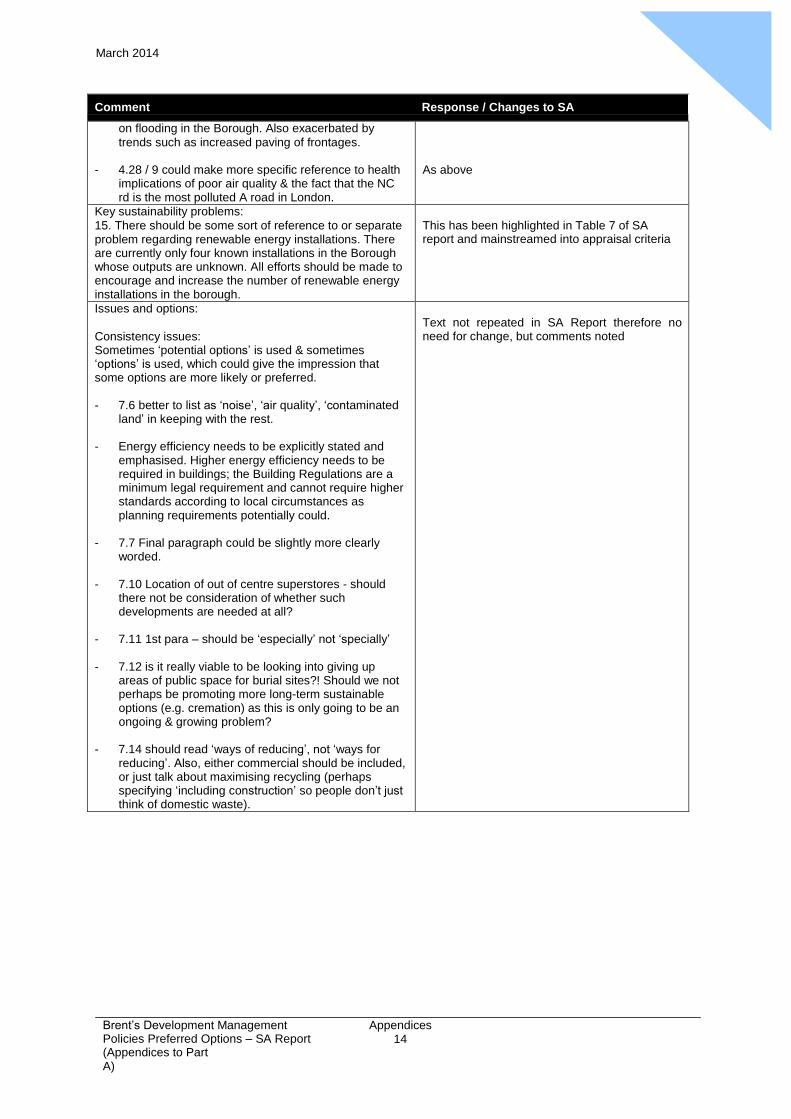
on flooding in the Borough. Also exacerbated by
trends such as increased paving of frontages.
- 4.28 / 9 could make more specific reference to health implications of poor air quality & the fact that the NC rd is the most polluted A road in London.
As above
Key sustainability problems:
15. There should be some sort of reference to or separate problem regarding renewable energy installations. There are currently only four known installations in the Borough whose outputs are unknown. All efforts should be made to encourage and increase the number of renewable energy installations in the borough.
This has been highlighted in Table 7 of SA report and mainstreamed into appraisal criteria
Issues and options:
Consistency issues: Sometimes ‘potential options’ is used & sometimes ‘options’ is used, which could give the impression that some options are more likely or preferred.
- 7.6 better to list as ‘noise’, ‘air quality’, ‘contaminated
land’ in keeping with the rest.
- Energy efficiency needs to be explicitly stated and emphasised. Higher energy efficiency needs to be required in buildings; the Building Regulations are a minimum legal requirement and cannot require higher standards according to local circumstances as planning requirements potentially could.
- 7.7 Final paragraph could be slightly more clearly
worded.
- 7.10 Location of out of centre superstores - should there not be consideration of whether such developments are needed at all?
- 7.11 1st para – should be ‘especially’ not ‘specially’
- 7.12 is it really viable to be looking into giving up
areas of public space for burial sites?! Should we not perhaps be promoting more long-term sustainable options (e.g. cremation) as this is only going to be an ongoing & growing problem?
- 7.14 should read ‘ways of reducing’, not ‘ways for
reducing’. Also, either commercial should be included, or just talk about maximising recycling (perhaps specifying ‘including construction’ so people don’t just think of domestic waste).
Text not repeated in SA Report therefore no need for change, but comments noted
Brent ‘s Development Management Policies Preferred Options - SA Report (Appendices to Part A)
Appendices
23
March 2014
APPENDIX 3
REVIEW OF RELEVANT PLANS AND PROGRAMMES

Appendix
4 March 2014
Brent’s Development Management DPD Preferred Options – SA Report (Appendices to Part A)
Appendices 17
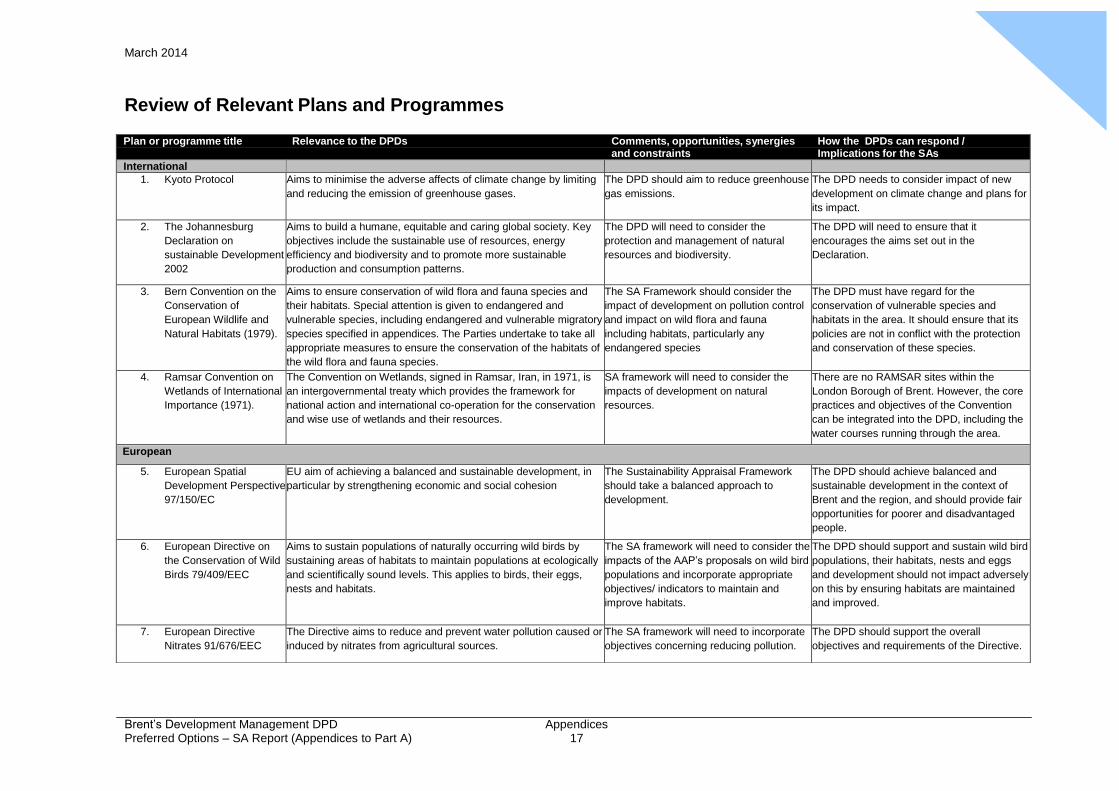
Review of Relevant Plans and Programmes
Plan or programme title Relevance to the DPDs Comments, opportunities, synergies How the DPDs can respond / and constraints Implications for the SAs
International 1. Kyoto Protocol Aims to minimise the adverse affects of climate change by limiting
and reducing the emission of greenhouse gases.
The DPD should aim to reduce greenhouse
gas emissions.
The DPD needs to consider impact of new
development on climate change and plans for
its impact.
2. The Johannesburg
Declaration on
sustainable Development
2002
Aims to build a humane, equitable and caring global society. Key
objectives include the sustainable use of resources, energy
efficiency and biodiversity and to promote more sustainable
production and consumption patterns.
The DPD will need to consider the
protection and management of natural
resources and biodiversity.
The DPD will need to ensure that it
encourages the aims set out in the
Declaration.
3. Bern Convention on the
Conservation of
European Wildlife and
Natural Habitats (1979).
Aims to ensure conservation of wild flora and fauna species and
their habitats. Special attention is given to endangered and
vulnerable species, including endangered and vulnerable migratory
species specified in appendices. The Parties undertake to take all
appropriate measures to ensure the conservation of the habitats of
the wild flora and fauna species.
The SA Framework should consider the
impact of development on pollution control
and impact on wild flora and fauna
including habitats, particularly any
endangered species
The DPD must have regard for the
conservation of vulnerable species and
habitats in the area. It should ensure that its
policies are not in conflict with the protection
and conservation of these species.
4. Ramsar Convention on
Wetlands of International
Importance (1971).
The Convention on Wetlands, signed in Ramsar, Iran, in 1971, is
an intergovernmental treaty which provides the framework for
national action and international co-operation for the conservation
and wise use of wetlands and their resources.
SA framework will need to consider the
impacts of development on natural
resources.
There are no RAMSAR sites within the
London Borough of Brent. However, the core
practices and objectives of the Convention
can be integrated into the DPD, including the
water courses running through the area.
European
5. European Spatial
Development Perspective
97/150/EC
EU aim of achieving a balanced and sustainable development, in
particular by strengthening economic and social cohesion
The Sustainability Appraisal Framework
should take a balanced approach to
development.
The DPD should achieve balanced and
sustainable development in the context of
Brent and the region, and should provide fair
opportunities for poorer and disadvantaged
people.
6. European Directive on
the Conservation of Wild
Birds 79/409/EEC
Aims to sustain populations of naturally occurring wild birds by
sustaining areas of habitats to maintain populations at ecologically
and scientifically sound levels. This applies to birds, their eggs,
nests and habitats.
The SA framework will need to consider the
impacts of the AAP’s proposals on wild bird
populations and incorporate appropriate
objectives/ indicators to maintain and
improve habitats.
The DPD should support and sustain wild bird
populations, their habitats, nests and eggs
and development should not impact adversely
on this by ensuring habitats are maintained
and improved.
7. European Directive
Nitrates 91/676/EEC
The Directive aims to reduce and prevent water pollution caused or
induced by nitrates from agricultural sources.
The SA framework will need to incorporate
objectives concerning reducing pollution.
The DPD should support the overall
objectives and requirements of the Directive.
Appendix
4 March 2014
Brent’s Development Management DPD Preferred Options – SA Report (Appendices to Part A)
Appendices 18
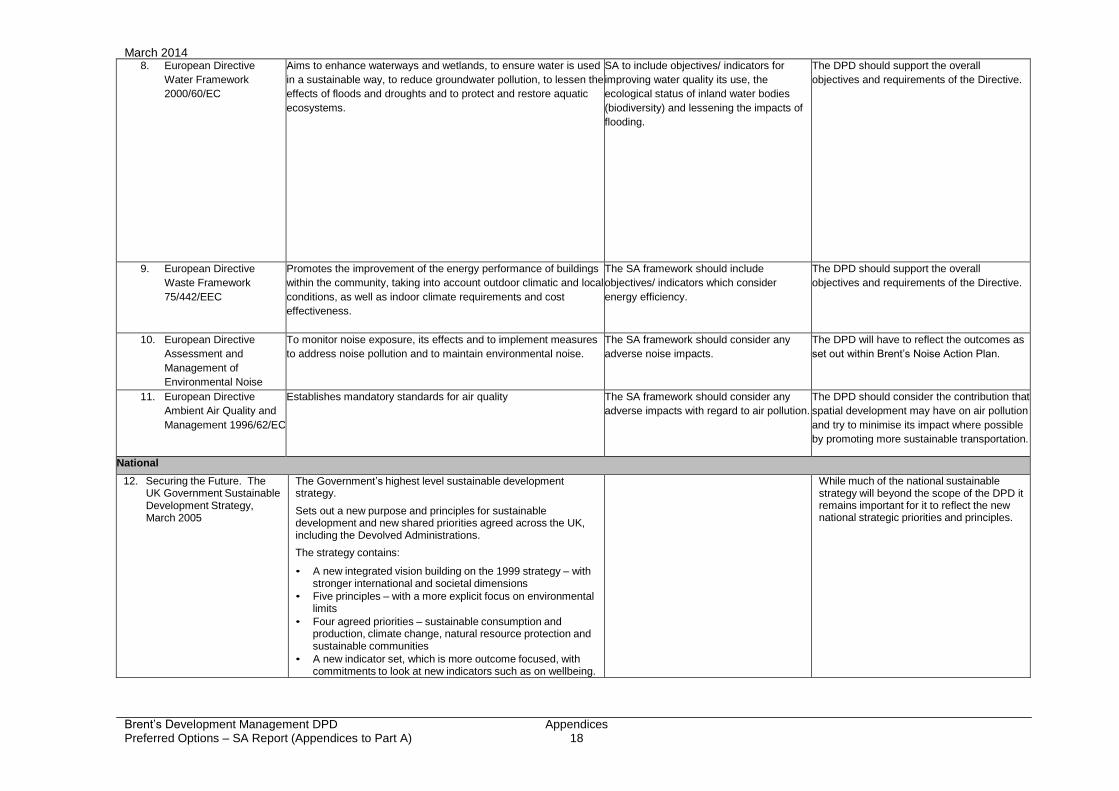
8. European Directive
Water Framework
2000/60/EC
Aims to enhance waterways and wetlands, to ensure water is used
in a sustainable way, to reduce groundwater pollution, to lessen the
effects of floods and droughts and to protect and restore aquatic
ecosystems.
SA to include objectives/ indicators for
improving water quality its use, the
ecological status of inland water bodies
(biodiversity) and lessening the impacts of
flooding.
The DPD should support the overall
objectives and requirements of the Directive.
9. European Directive
Waste Framework
75/442/EEC
Promotes the improvement of the energy performance of buildings
within the community, taking into account outdoor climatic and local
conditions, as well as indoor climate requirements and cost
effectiveness.
The SA framework should include
objectives/ indicators which consider
energy efficiency.
The DPD should support the overall
objectives and requirements of the Directive.
10. European Directive
Assessment and
Management of
Environmental Noise
2002/49/EC
To monitor noise exposure, its effects and to implement measures
to address noise pollution and to maintain environmental noise.
The SA framework should consider any
adverse noise impacts.
The DPD will have to reflect the outcomes as
set out within Brent’s Noise Action Plan.
11. European Directive
Ambient Air Quality and
Management 1996/62/EC
Establishes mandatory standards for air quality The SA framework should consider any
adverse impacts with regard to air pollution.
The DPD should consider the contribution that
spatial development may have on air pollution
and try to minimise its impact where possible
by promoting more sustainable transportation.
National
12. Securing the Future. The UK Government Sustainable Development Strategy, March 2005
The Government’s highest level sustainable development strategy.
Sets out a new purpose and principles for sustainable development and new shared priorities agreed across the UK, including the Devolved Administrations.
The strategy contains:
• A new integrated vision building on the 1999 strategy – with stronger international and societal dimensions
• Five principles – with a more explicit focus on environmental limits
• Four agreed priorities – sustainable consumption and production, climate change, natural resource protection and sustainable communities
• A new indicator set, which is more outcome focused, with commitments to look at new indicators such as on wellbeing.
While much of the national sustainable strategy will beyond the scope of the DPD it remains important for it to reflect the new national strategic priorities and principles.
Appendix
4 March 2014
Brent’s Development Management DPD Preferred Options – SA Report (Appendices to Part A)
Appendices 19
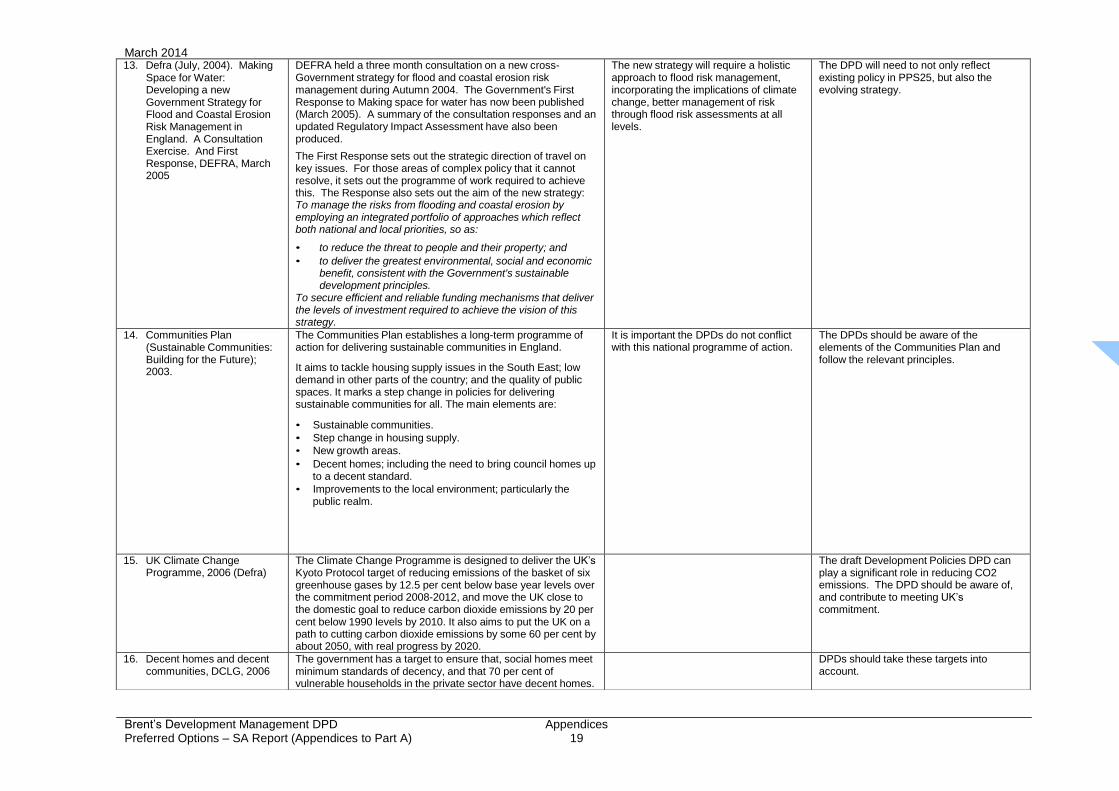
13. Defra (July, 2004). Making Space for Water: Developing a new Government Strategy for Flood and Coastal Erosion Risk Management in England. A Consultation Exercise. And First Response, DEFRA, March 2005
DEFRA held a three month consultation on a new cross- Government strategy for flood and coastal erosion risk management during Autumn 2004. The Government's First Response to Making space for water has now been published (March 2005). A summary of the consultation responses and an updated Regulatory Impact Assessment have also been produced.
The First Response sets out the strategic direction of travel on key issues. For those areas of complex policy that it cannot resolve, it sets out the programme of work required to achieve this. The Response also sets out the aim of the new strategy: To manage the risks from flooding and coastal erosion by employing an integrated portfolio of approaches which reflect both national and local priorities, so as:
• to reduce the threat to people and their property; and
• to deliver the greatest environmental, social and economic benefit, consistent with the Government's sustainable development principles.
To secure efficient and reliable funding mechanisms that deliver the levels of investment required to achieve the vision of this strategy.
The new strategy will require a holistic approach to flood risk management, incorporating the implications of climate change, better management of risk through flood risk assessments at all levels.
The DPD will need to not only reflect existing policy in PPS25, but also the evolving strategy.
14. Communities Plan (Sustainable Communities: Building for the Future); 2003.
The Communities Plan establishes a long-term programme of action for delivering sustainable communities in England.
It aims to tackle housing supply issues in the South East; low demand in other parts of the country; and the quality of public spaces. It marks a step change in policies for delivering sustainable communities for all. The main elements are:
• Sustainable communities.
• Step change in housing supply.
• New growth areas.
• Decent homes; including the need to bring council homes up to a decent standard.
• Improvements to the local environment; particularly the public realm.
It is important the DPDs do not conflict with this national programme of action.
The DPDs should be aware of the elements of the Communities Plan and follow the relevant principles.
15. UK Climate Change Programme, 2006 (Defra)
The Climate Change Programme is designed to deliver the UK’s Kyoto Protocol target of reducing emissions of the basket of six greenhouse gases by 12.5 per cent below base year levels over the commitment period 2008-2012, and move the UK close to the domestic goal to reduce carbon dioxide emissions by 20 per cent below 1990 levels by 2010. It also aims to put the UK on a path to cutting carbon dioxide emissions by some 60 per cent by about 2050, with real progress by 2020.
The draft Development Policies DPD can play a significant role in reducing CO2 emissions. The DPD should be aware of, and contribute to meeting UK’s commitment.
16. Decent homes and decent communities, DCLG, 2006
The government has a target to ensure that, social homes meet minimum standards of decency, and that 70 per cent of vulnerable households in the private sector have decent homes.
DPDs should take these targets into account.
Appendix
4 March 2014
Brent’s Development Management DPD Preferred Options – SA Report (Appendices to Part A)
Appendices 20
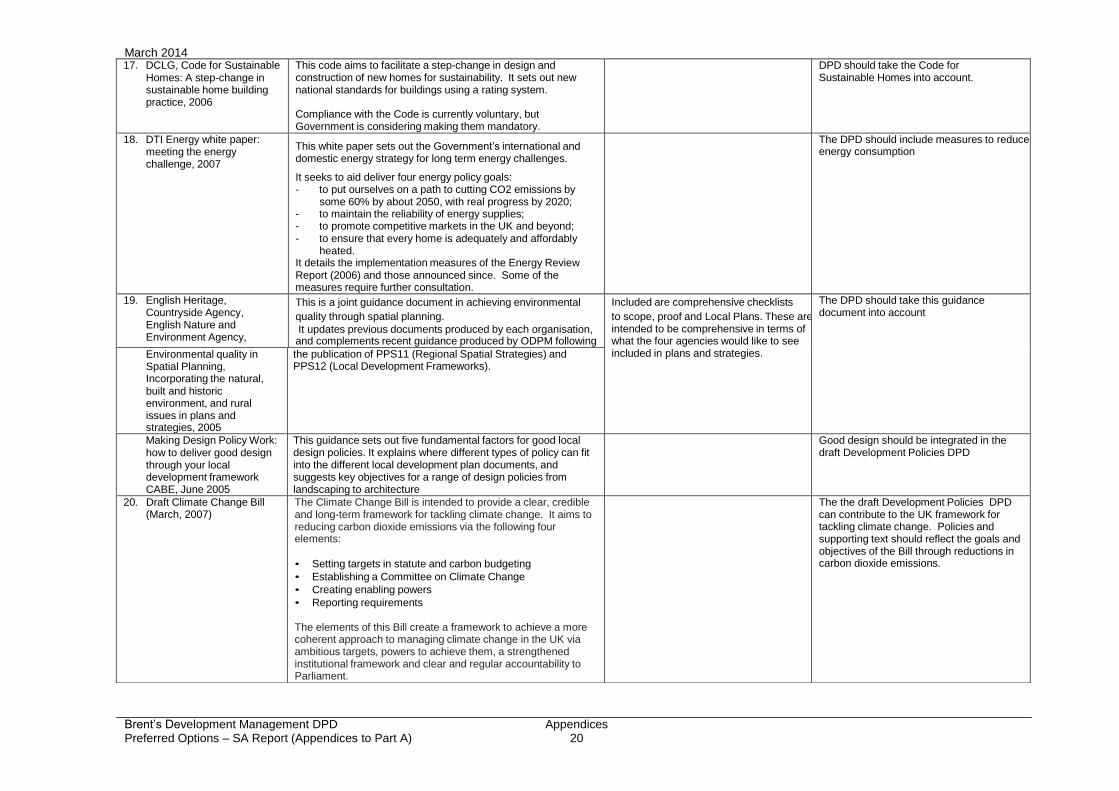
17. DCLG, Code for Sustainable Homes: A step-change in sustainable home building practice, 2006
This code aims to facilitate a step-change in design and construction of new homes for sustainability. It sets out new national standards for buildings using a rating system.
Compliance with the Code is currently voluntary, but Government is considering making them mandatory.
DPD should take the Code for Sustainable Homes into account.
18. DTI Energy white paper: meeting the energy challenge, 2007
This white paper sets out the Government’s international and domestic energy strategy for long term energy challenges.
It seeks to aid deliver four energy policy goals: - to put ourselves on a path to cutting CO2 emissions by
some 60% by about 2050, with real progress by 2020; - to maintain the reliability of energy supplies; - to promote competitive markets in the UK and beyond; - to ensure that every home is adequately and affordably
heated. It details the implementation measures of the Energy Review Report (2006) and those announced since. Some of the measures require further consultation.
The DPD should include measures to reduce energy consumption
19. English Heritage, Countryside Agency, English Nature and Environment Agency,
This is a joint guidance document in achieving environmental
quality through spatial planning.
It updates previous documents produced by each organisation, and complements recent guidance produced by ODPM following
Included are comprehensive checklists
to scope, proof and Local Plans. These are intended to be comprehensive in terms of what the four agencies would like to see included in plans and strategies.
The DPD should take this guidance document into account
Environmental quality in Spatial Planning, Incorporating the natural, built and historic environment, and rural issues in plans and strategies, 2005
the publication of PPS11 (Regional Spatial Strategies) and PPS12 (Local Development Frameworks).
Making Design Policy Work: how to deliver good design through your local development framework CABE, June 2005
This guidance sets out five fundamental factors for good local design policies. It explains where different types of policy can fit into the different local development plan documents, and suggests key objectives for a range of design policies from landscaping to architecture
Good design should be integrated in the draft Development Policies DPD
20. Draft Climate Change Bill (March, 2007)
The Climate Change Bill is intended to provide a clear, credible and long-term framework for tackling climate change. It aims to reducing carbon dioxide emissions via the following four elements:
• Setting targets in statute and carbon budgeting
• Establishing a Committee on Climate Change
• Creating enabling powers
• Reporting requirements
The elements of this Bill create a framework to achieve a more coherent approach to managing climate change in the UK via ambitious targets, powers to achieve them, a strengthened institutional framework and clear and regular accountability to Parliament.
The the draft Development Policies DPD can contribute to the UK framework for tackling climate change. Policies and supporting text should reflect the goals and objectives of the Bill through reductions in carbon dioxide emissions.
Appendix
4 March 2014
Brent’s Development Management DPD Preferred Options – SA Report (Appendices to Part A)
Appendices 21
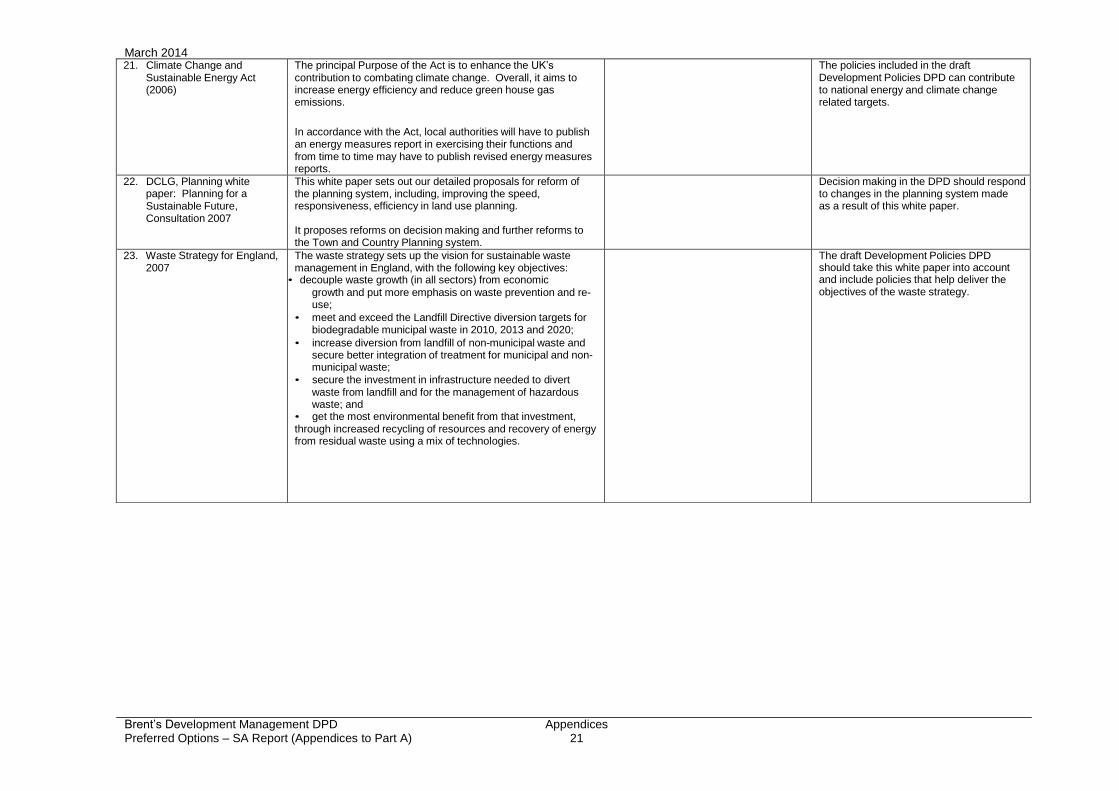
21. Climate Change and Sustainable Energy Act (2006)
The principal Purpose of the Act is to enhance the UK’s contribution to combating climate change. Overall, it aims to increase energy efficiency and reduce green house gas emissions.
In accordance with the Act, local authorities will have to publish an energy measures report in exercising their functions and from time to time may have to publish revised energy measures reports.
The policies included in the draft Development Policies DPD can contribute to national energy and climate change related targets.
22. DCLG, Planning white paper: Planning for a Sustainable Future, Consultation 2007
This white paper sets out our detailed proposals for reform of the planning system, including, improving the speed, responsiveness, efficiency in land use planning.
It proposes reforms on decision making and further reforms to the Town and Country Planning system.
Decision making in the DPD should respond to changes in the planning system made as a result of this white paper.
23. Waste Strategy for England, 2007
The waste strategy sets up the vision for sustainable waste management in England, with the following key objectives:
• decouple waste growth (in all sectors) from economic
growth and put more emphasis on waste prevention and re- use;
• meet and exceed the Landfill Directive diversion targets for biodegradable municipal waste in 2010, 2013 and 2020;
• increase diversion from landfill of non-municipal waste and secure better integration of treatment for municipal and non- municipal waste;
• secure the investment in infrastructure needed to divert waste from landfill and for the management of hazardous waste; and
• get the most environmental benefit from that investment, through increased recycling of resources and recovery of energy from residual waste using a mix of technologies.
The draft Development Policies DPD should take this white paper into account and include policies that help deliver the objectives of the waste strategy.
Appendix
4 March 2014
Brent’s Development Management DPD Preferred Options – SA Report (Appendices to Part A)
Appendices 22
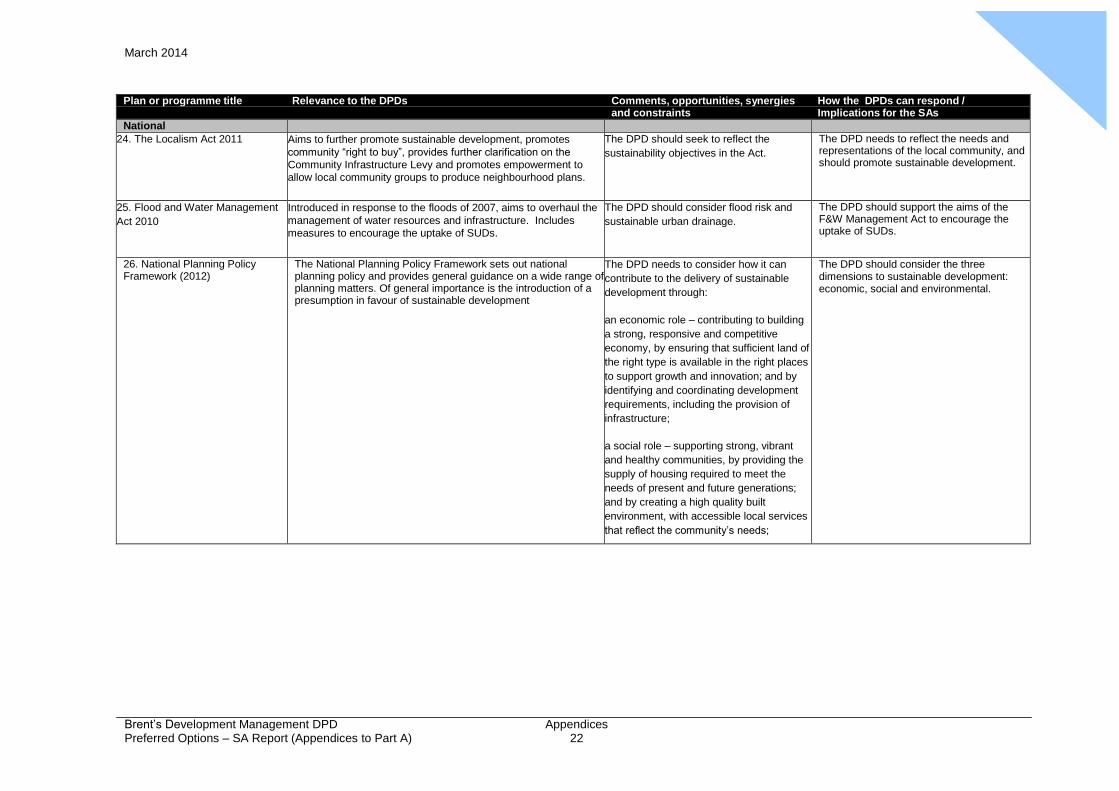
Plan or programme title Relevance to the DPDs Comments, opportunities, synergies How the DPDs can respond / and constraints Implications for the SAs
National 24. The Localism Act 2011 Aims to further promote sustainable development, promotes
community “right to buy”, provides further clarification on the
Community Infrastructure Levy and promotes empowerment to
allow local community groups to produce neighbourhood plans.
The DPD should seek to reflect the
sustainability objectives in the Act.
The DPD needs to reflect the needs and representations of the local community, and should promote sustainable development.
25. Flood and Water Management
Act 2010
Introduced in response to the floods of 2007, aims to overhaul the
management of water resources and infrastructure. Includes
measures to encourage the uptake of SUDs.
The DPD should consider flood risk and
sustainable urban drainage.
The DPD should support the aims of the F&W Management Act to encourage the uptake of SUDs.
26. National Planning Policy Framework (2012)
The National Planning Policy Framework sets out national planning policy and provides general guidance on a wide range of planning matters. Of general importance is the introduction of a presumption in favour of sustainable development
The DPD needs to consider how it can
contribute to the delivery of sustainable
development through:
an economic role – contributing to building
a strong, responsive and competitive
economy, by ensuring that sufficient land of
the right type is available in the right places
to support growth and innovation; and by
identifying and coordinating development
requirements, including the provision of
infrastructure;
a social role – supporting strong, vibrant
and healthy communities, by providing the
supply of housing required to meet the
needs of present and future generations;
and by creating a high quality built
environment, with accessible local services
that reflect the community’s needs;
The DPD should consider the three dimensions to sustainable development: economic, social and environmental.
Appendix
4 March 2014
Brent’s Development Management DPD Preferred Options – SA Report (Appendices to Part A)
Appendices 23
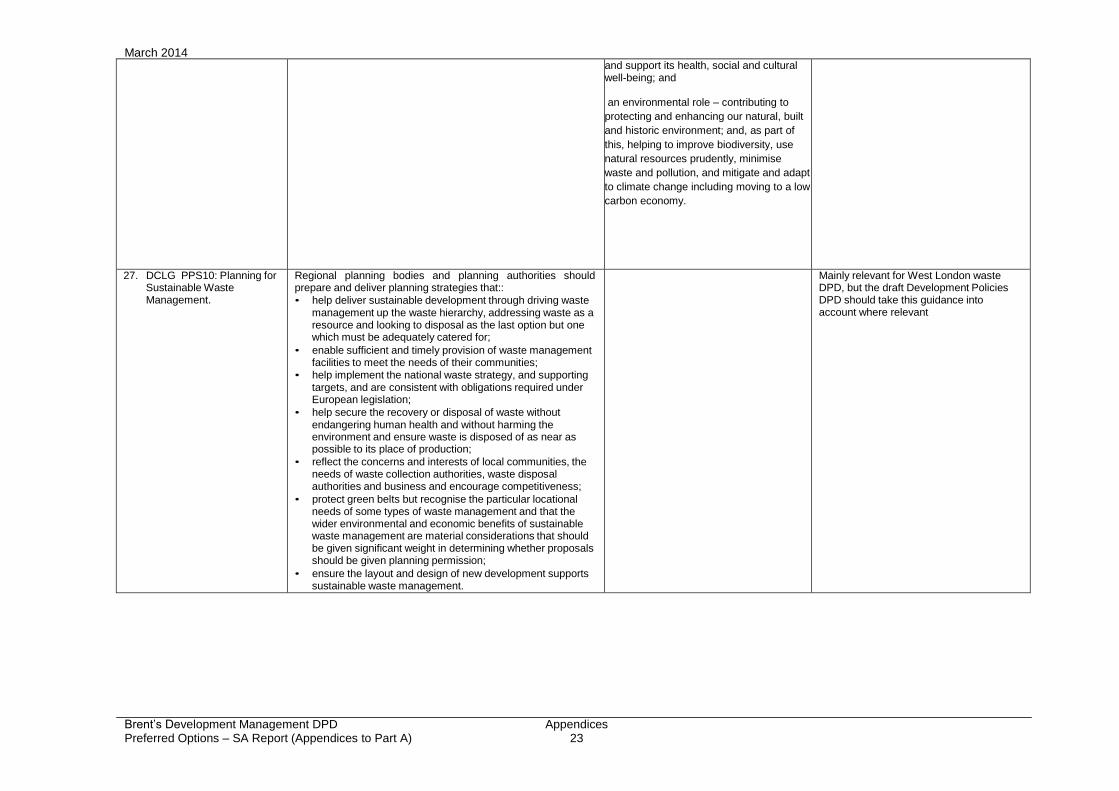
and support its health, social and cultural well-being; and an environmental role – contributing to
protecting and enhancing our natural, built
and historic environment; and, as part of
this, helping to improve biodiversity, use
natural resources prudently, minimise
waste and pollution, and mitigate and adapt
to climate change including moving to a low
carbon economy.
27. DCLG PPS10: Planning for Sustainable Waste Management.
Regional planning bodies and planning authorities should prepare and deliver planning strategies that::
• help deliver sustainable development through driving waste management up the waste hierarchy, addressing waste as a resource and looking to disposal as the last option but one which must be adequately catered for;
• enable sufficient and timely provision of waste management facilities to meet the needs of their communities;
• help implement the national waste strategy, and supporting targets, and are consistent with obligations required under European legislation;
• help secure the recovery or disposal of waste without endangering human health and without harming the environment and ensure waste is disposed of as near as possible to its place of production;
• reflect the concerns and interests of local communities, the needs of waste collection authorities, waste disposal authorities and business and encourage competitiveness;
• protect green belts but recognise the particular locational needs of some types of waste management and that the wider environmental and economic benefits of sustainable waste management are material considerations that should be given significant weight in determining whether proposals should be given planning permission;
• ensure the layout and design of new development supports sustainable waste management.
Mainly relevant for West London waste DPD, but the draft Development Policies DPD should take this guidance into account where relevant
Appendix
4 March 2014
Brent’s Development Management DPD Preferred Options – SA Report (Appendices to Part A)
Appendices 24
Plan or programme title Relevance to the DPDs Comments, opportunities, synergies How the DPDs can respond / and constraints Implications for the SA
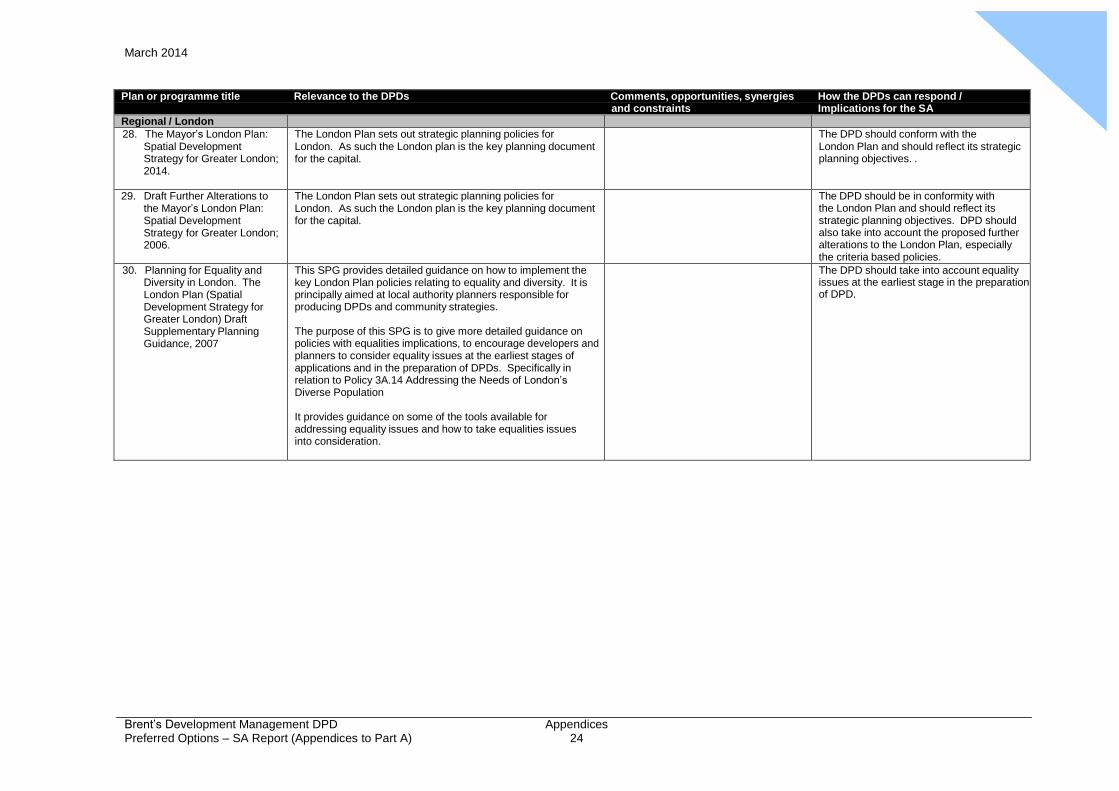
Regional / London 28. The Mayor’s London Plan:
Spatial Development Strategy for Greater London; 2014.
The London Plan sets out strategic planning policies for London. As such the London plan is the key planning document for the capital.
The DPD should conform with the London Plan and should reflect its strategic planning objectives. .
29. Draft Further Alterations to the Mayor’s London Plan: Spatial Development Strategy for Greater London; 2006.
The London Plan sets out strategic planning policies for London. As such the London plan is the key planning document for the capital.
The DPD should be in conformity with the London Plan and should reflect its strategic planning objectives. DPD should also take into account the proposed further alterations to the London Plan, especially the criteria based policies.
30. Planning for Equality and Diversity in London. The London Plan (Spatial Development Strategy for Greater London) Draft Supplementary Planning Guidance, 2007
This SPG provides detailed guidance on how to implement the key London Plan policies relating to equality and diversity. It is principally aimed at local authority planners responsible for producing DPDs and community strategies.
The purpose of this SPG is to give more detailed guidance on policies with equalities implications, to encourage developers and planners to consider equality issues at the earliest stages of applications and in the preparation of DPDs. Specifically in relation to Policy 3A.14 Addressing the Needs of London’s Diverse Population
It provides guidance on some of the tools available for addressing equality issues and how to take equalities issues into consideration.
The DPD should take into account equality issues at the earliest stage in the preparation of DPD.
Appendix
4 March 2014
Brent’s Development Management DPD Preferred Options – SA Report (Appendices to Part A)
Appendices 25
Plan or programme title Relevance to the DPDs Comments, opportunities, synergies How the DPDs can respond / and constraints Implications for the SA
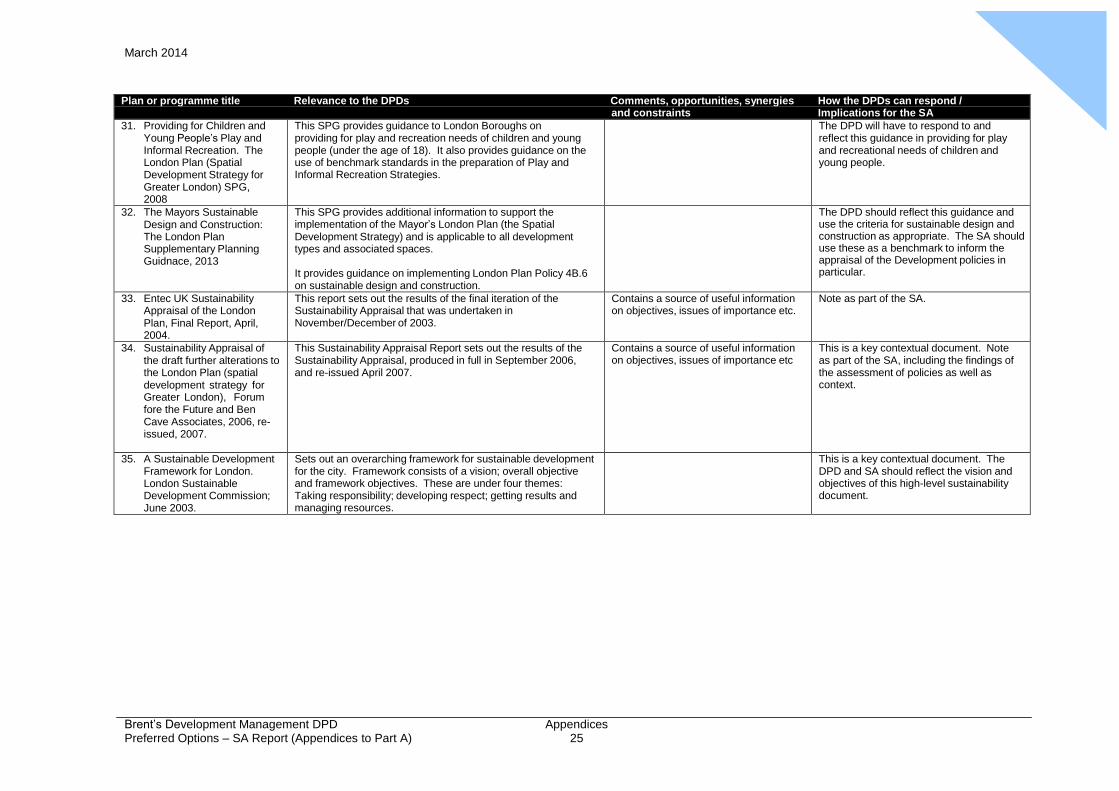
31. Providing for Children and Young People’s Play and Informal Recreation. The London Plan (Spatial Development Strategy for Greater London) SPG, 2008
This SPG provides guidance to London Boroughs on providing for play and recreation needs of children and young people (under the age of 18). It also provides guidance on the use of benchmark standards in the preparation of Play and Informal Recreation Strategies.
The DPD will have to respond to and reflect this guidance in providing for play and recreational needs of children and young people.
32. The Mayors Sustainable Design and Construction: The London Plan Supplementary Planning Guidnace, 2013
This SPG provides additional information to support the implementation of the Mayor’s London Plan (the Spatial Development Strategy) and is applicable to all development types and associated spaces.
It provides guidance on implementing London Plan Policy 4B.6 on sustainable design and construction.
The DPD should reflect this guidance and use the criteria for sustainable design and construction as appropriate. The SA should use these as a benchmark to inform the appraisal of the Development policies in particular.
33. Entec UK Sustainability Appraisal of the London Plan, Final Report, April, 2004.
This report sets out the results of the final iteration of the Sustainability Appraisal that was undertaken in November/December of 2003.
Contains a source of useful information on objectives, issues of importance etc.
Note as part of the SA.
34. Sustainability Appraisal of the draft further alterations to the London Plan (spatial development strategy for Greater London), Forum fore the Future and Ben Cave Associates, 2006, re- issued, 2007.
This Sustainability Appraisal Report sets out the results of the Sustainability Appraisal, produced in full in September 2006, and re-issued April 2007.
Contains a source of useful information on objectives, issues of importance etc
This is a key contextual document. Note as part of the SA, including the findings of the assessment of policies as well as context.
35. A Sustainable Development Framework for London. London Sustainable Development Commission; June 2003.
Sets out an overarching framework for sustainable development for the city. Framework consists of a vision; overall objective and framework objectives. These are under four themes: Taking responsibility; developing respect; getting results and managing resources.
This is a key contextual document. The DPD and SA should reflect the vision and objectives of this high-level sustainability document.
Appendix
4 March 2014
Brent’s Development Management DPD Preferred Options – SA Report (Appendices to Part A)
Appendices 26
Plan or programme title Relevance to the DPDs Comments, opportunities, synergies How the DPDs can respond / and constraints Implications for the SA
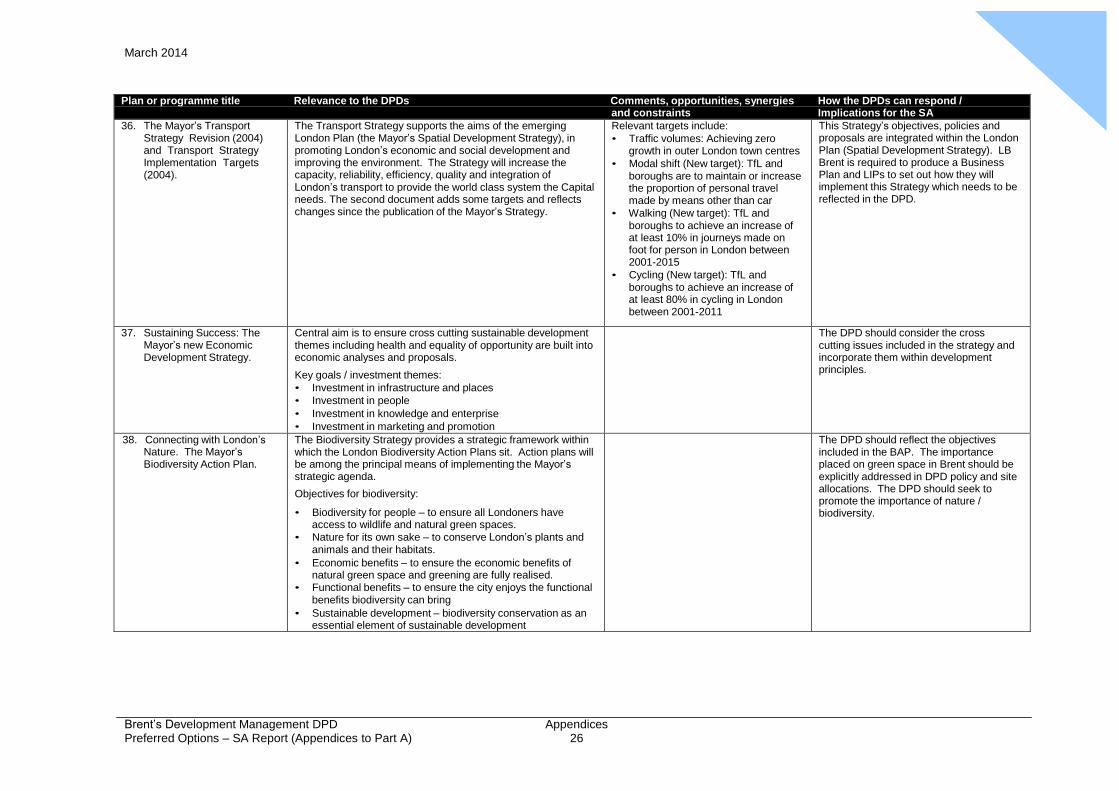
36. The Mayor’s Transport Strategy Revision (2004) and Transport Strategy Implementation Targets (2004).
The Transport Strategy supports the aims of the emerging London Plan (the Mayor’s Spatial Development Strategy), in promoting London’s economic and social development and improving the environment. The Strategy will increase the capacity, reliability, efficiency, quality and integration of London’s transport to provide the world class system the Capital needs. The second document adds some targets and reflects changes since the publication of the Mayor’s Strategy.
Relevant targets include:
• Traffic volumes: Achieving zero growth in outer London town centres
• Modal shift (New target): TfL and boroughs are to maintain or increase the proportion of personal travel made by means other than car
• Walking (New target): TfL and boroughs to achieve an increase of at least 10% in journeys made on foot for person in London between 2001-2015
• Cycling (New target): TfL and boroughs to achieve an increase of at least 80% in cycling in London between 2001-2011
This Strategy’s objectives, policies and proposals are integrated within the London Plan (Spatial Development Strategy). LB Brent is required to produce a Business Plan and LIPs to set out how they will implement this Strategy which needs to be reflected in the DPD.
37. Sustaining Success: The Mayor’s new Economic Development Strategy.
Central aim is to ensure cross cutting sustainable development themes including health and equality of opportunity are built into economic analyses and proposals.
Key goals / investment themes:
• Investment in infrastructure and places
• Investment in people
• Investment in knowledge and enterprise
• Investment in marketing and promotion
The DPD should consider the cross cutting issues included in the strategy and incorporate them within development principles.
38. Connecting with London’s Nature. The Mayor’s Biodiversity Action Plan.
The Biodiversity Strategy provides a strategic framework within which the London Biodiversity Action Plans sit. Action plans will be among the principal means of implementing the Mayor’s strategic agenda.
Objectives for biodiversity:
• Biodiversity for people – to ensure all Londoners have access to wildlife and natural green spaces.
• Nature for its own sake – to conserve London’s plants and animals and their habitats.
• Economic benefits – to ensure the economic benefits of natural green space and greening are fully realised.
• Functional benefits – to ensure the city enjoys the functional benefits biodiversity can bring
• Sustainable development – biodiversity conservation as an essential element of sustainable development
The DPD should reflect the objectives included in the BAP. The importance placed on green space in Brent should be explicitly addressed in DPD policy and site allocations. The DPD should seek to promote the importance of nature / biodiversity.
Appendix
4 March 2014
Brent’s Development Management DPD Preferred Options – SA Report (Appendices to Part A)
Appendices 27
Plan or programme title Relevance to the DPDs Comments, opportunities, synergies How the DPDs can respond / and constraints Implications for the SA
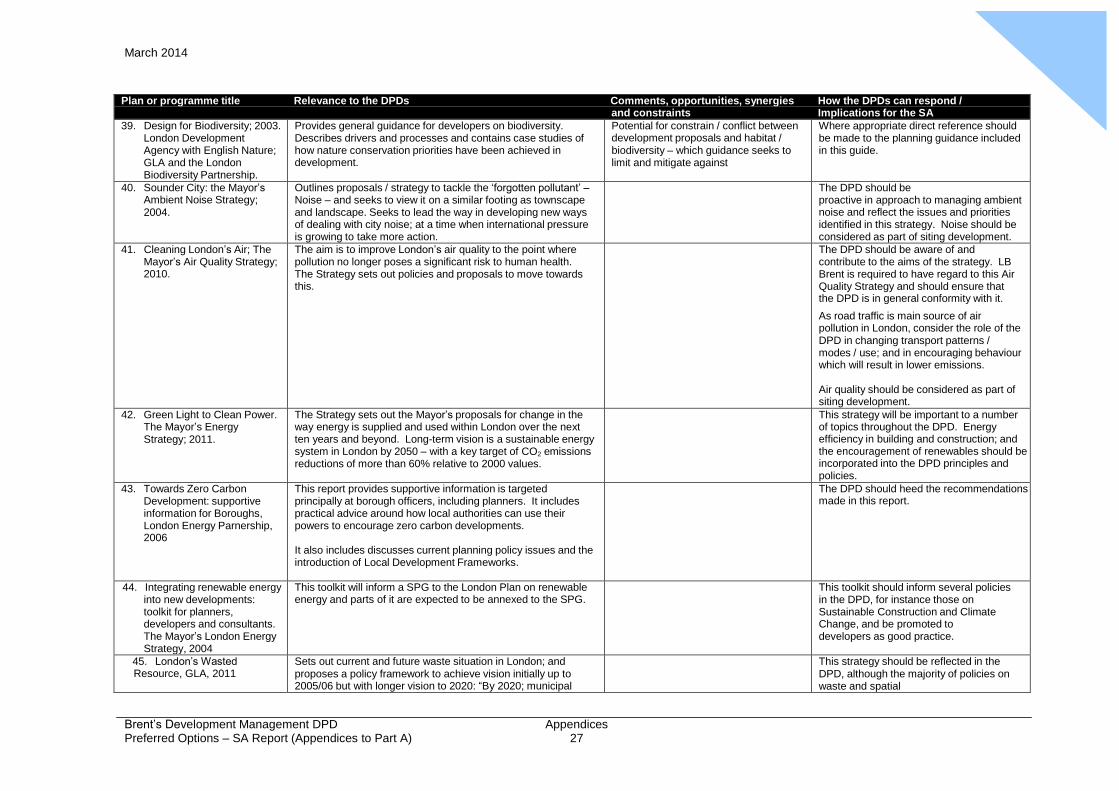
39. Design for Biodiversity; 2003. London Development Agency with English Nature; GLA and the London Biodiversity Partnership.
Provides general guidance for developers on biodiversity. Describes drivers and processes and contains case studies of how nature conservation priorities have been achieved in development.
Potential for constrain / conflict between development proposals and habitat / biodiversity – which guidance seeks to limit and mitigate against
Where appropriate direct reference should be made to the planning guidance included in this guide.
40. Sounder City: the Mayor’s Ambient Noise Strategy; 2004.
Outlines proposals / strategy to tackle the ‘forgotten pollutant’ – Noise – and seeks to view it on a similar footing as townscape and landscape. Seeks to lead the way in developing new ways of dealing with city noise; at a time when international pressure is growing to take more action.
The DPD should be proactive in approach to managing ambient noise and reflect the issues and priorities identified in this strategy. Noise should be considered as part of siting development.
41. Cleaning London’s Air; The Mayor’s Air Quality Strategy; 2010.
The aim is to improve London’s air quality to the point where pollution no longer poses a significant risk to human health. The Strategy sets out policies and proposals to move towards this.
The DPD should be aware of and contribute to the aims of the strategy. LB Brent is required to have regard to this Air Quality Strategy and should ensure that the DPD is in general conformity with it.
As road traffic is main source of air pollution in London, consider the role of the DPD in changing transport patterns / modes / use; and in encouraging behaviour which will result in lower emissions.
Air quality should be considered as part of siting development.
42. Green Light to Clean Power. The Mayor’s Energy Strategy; 2011.
The Strategy sets out the Mayor’s proposals for change in the way energy is supplied and used within London over the next ten years and beyond. Long-term vision is a sustainable energy system in London by 2050 – with a key target of CO2 emissions reductions of more than 60% relative to 2000 values.
This strategy will be important to a number of topics throughout the DPD. Energy efficiency in building and construction; and the encouragement of renewables should be incorporated into the DPD principles and policies.
43. Towards Zero Carbon Development: supportive information for Boroughs, London Energy Parnership, 2006
This report provides supportive information is targeted principally at borough officers, including planners. It includes practical advice around how local authorities can use their powers to encourage zero carbon developments.
It also includes discusses current planning policy issues and the introduction of Local Development Frameworks.
The DPD should heed the recommendations made in this report.
44. Integrating renewable energy into new developments: toolkit for planners, developers and consultants. The Mayor’s London Energy Strategy, 2004
This toolkit will inform a SPG to the London Plan on renewable energy and parts of it are expected to be annexed to the SPG.
This toolkit should inform several policies in the DPD, for instance those on Sustainable Construction and Climate Change, and be promoted to developers as good practice.
45. London’s Wasted Resource, GLA, 2011
Sets out current and future waste situation in London; and proposes a policy framework to achieve vision initially up to 2005/06 but with longer vision to 2020: “By 2020; municipal
This strategy should be reflected in the DPD, although the majority of policies on waste and spatial
Appendix
4 March 2014
Brent’s Development Management DPD Preferred Options – SA Report (Appendices to Part A)
Appendices 28
Plan or programme title Relevance to the DPDs Comments, opportunities, synergies How the DPDs can respond / and constraints Implications for the SA
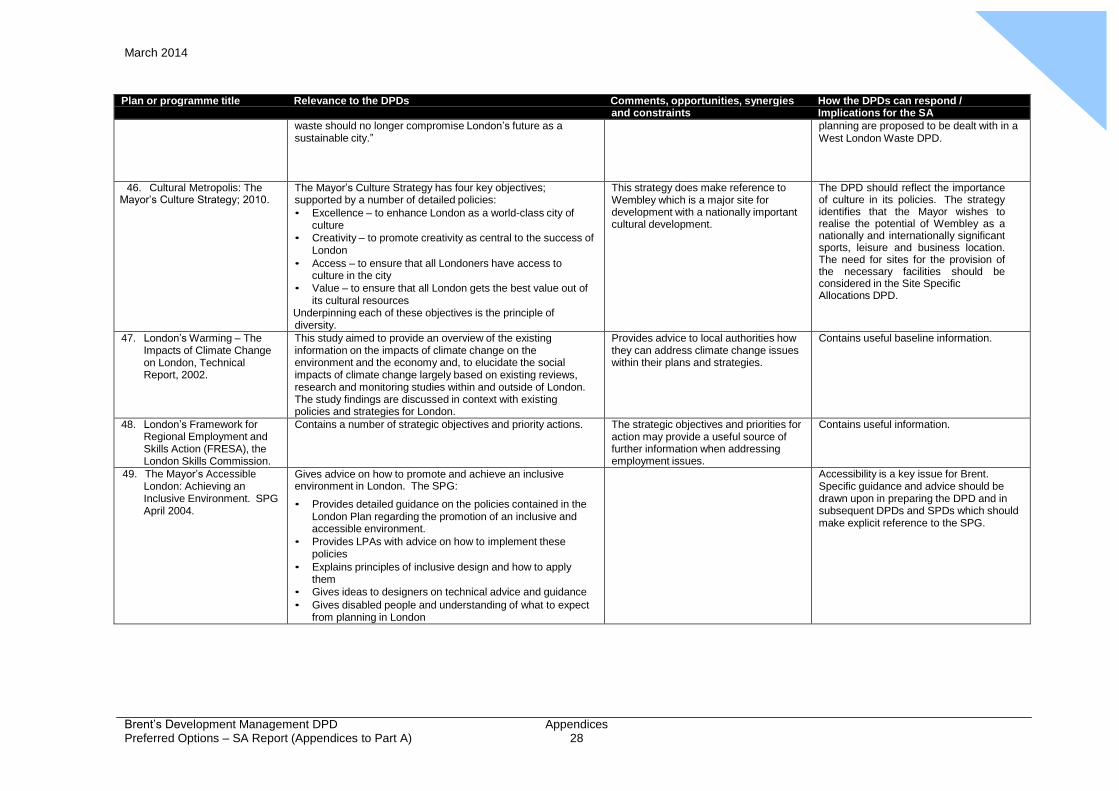
waste should no longer compromise London’s future as a sustainable city.”
planning are proposed to be dealt with in a West London Waste DPD.
46. Cultural Metropolis: The Mayor’s Culture Strategy; 2010.
The Mayor’s Culture Strategy has four key objectives; supported by a number of detailed policies:
• Excellence – to enhance London as a world-class city of culture
• Creativity – to promote creativity as central to the success of London
• Access – to ensure that all Londoners have access to culture in the city
• Value – to ensure that all London gets the best value out of its cultural resources
Underpinning each of these objectives is the principle of diversity.
This strategy does make reference to Wembley which is a major site for development with a nationally important cultural development.
The DPD should reflect the importance of culture in its policies. The strategy identifies that the Mayor wishes to realise the potential of Wembley as a nationally and internationally significant sports, leisure and business location. The need for sites for the provision of the necessary facilities should be considered in the Site Specific Allocations DPD.
47. London’s Warming – The Impacts of Climate Change on London, Technical Report, 2002.
This study aimed to provide an overview of the existing information on the impacts of climate change on the environment and the economy and, to elucidate the social impacts of climate change largely based on existing reviews, research and monitoring studies within and outside of London. The study findings are discussed in context with existing policies and strategies for London.
Provides advice to local authorities how they can address climate change issues within their plans and strategies.
Contains useful baseline information.
48. London’s Framework for Regional Employment and Skills Action (FRESA), the London Skills Commission.
Contains a number of strategic objectives and priority actions. The strategic objectives and priorities for action may provide a useful source of further information when addressing employment issues.
Contains useful information.
49. The Mayor’s Accessible London: Achieving an Inclusive Environment. SPG April 2004.
Gives advice on how to promote and achieve an inclusive environment in London. The SPG:
• Provides detailed guidance on the policies contained in the London Plan regarding the promotion of an inclusive and accessible environment.
• Provides LPAs with advice on how to implement these policies
• Explains principles of inclusive design and how to apply them
• Gives ideas to designers on technical advice and guidance
• Gives disabled people and understanding of what to expect from planning in London
Accessibility is a key issue for Brent. Specific guidance and advice should be drawn upon in preparing the DPD and in subsequent DPDs and SPDs which should make explicit reference to the SPG.
Appendix
4 March 2014
Brent’s Development Management DPD Preferred Options – SA Report (Appendices to Part A)
Appendices 29
Plan or programme title Relevance to the DPDs Comments, opportunities, synergies How the DPDs can respond / and constraints Implications for the SA
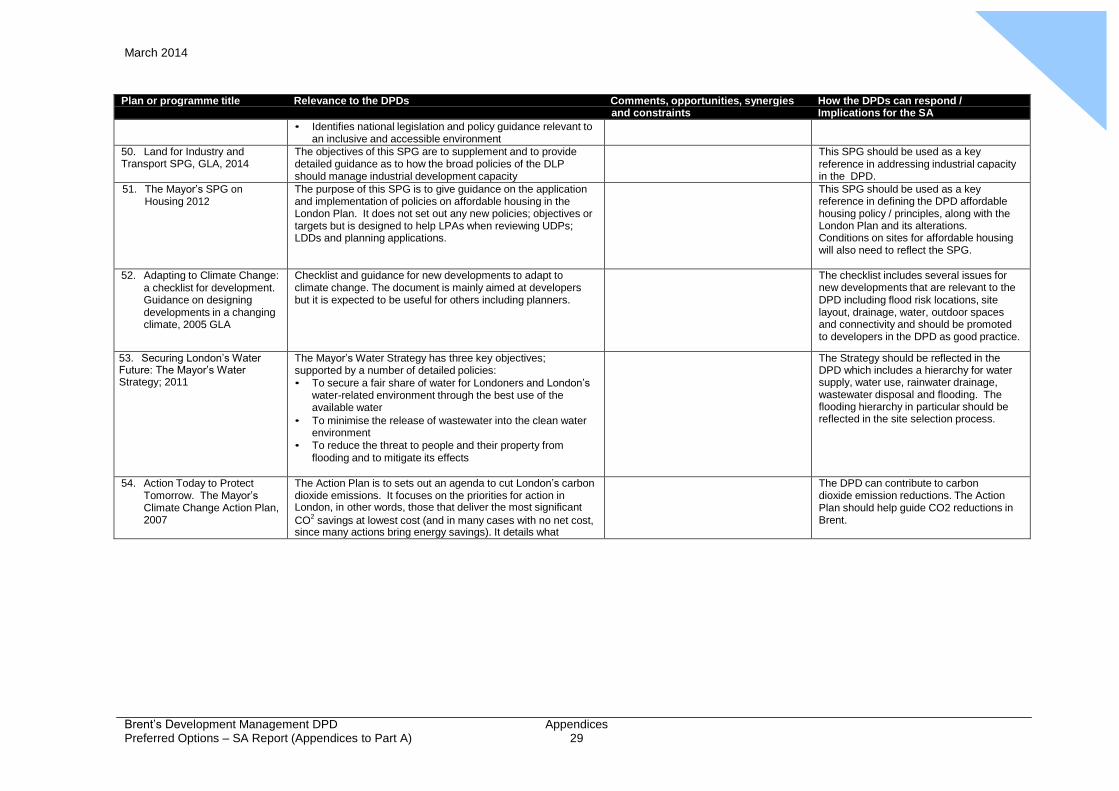
• Identifies national legislation and policy guidance relevant to an inclusive and accessible environment
50. Land for Industry and Transport SPG, GLA, 2014
The objectives of this SPG are to supplement and to provide detailed guidance as to how the broad policies of the DLP should manage industrial development capacity
This SPG should be used as a key reference in addressing industrial capacity in the DPD.
51. The Mayor’s SPG on Housing 2012
The purpose of this SPG is to give guidance on the application and implementation of policies on affordable housing in the London Plan. It does not set out any new policies; objectives or targets but is designed to help LPAs when reviewing UDPs; LDDs and planning applications.
This SPG should be used as a key reference in defining the DPD affordable housing policy / principles, along with the London Plan and its alterations. Conditions on sites for affordable housing will also need to reflect the SPG.
52. Adapting to Climate Change: a checklist for development. Guidance on designing developments in a changing climate, 2005 GLA
Checklist and guidance for new developments to adapt to climate change. The document is mainly aimed at developers but it is expected to be useful for others including planners.
The checklist includes several issues for new developments that are relevant to the DPD including flood risk locations, site layout, drainage, water, outdoor spaces and connectivity and should be promoted to developers in the DPD as good practice.
53. Securing London’s Water Future: The Mayor’s Water Strategy; 2011
The Mayor’s Water Strategy has three key objectives; supported by a number of detailed policies:
• To secure a fair share of water for Londoners and London’s water-related environment through the best use of the available water
• To minimise the release of wastewater into the clean water environment
• To reduce the threat to people and their property from flooding and to mitigate its effects
The Strategy should be reflected in the DPD which includes a hierarchy for water supply, water use, rainwater drainage, wastewater disposal and flooding. The flooding hierarchy in particular should be reflected in the site selection process.
54. Action Today to Protect Tomorrow. The Mayor’s Climate Change Action Plan, 2007
The Action Plan is to sets out an agenda to cut London’s carbon dioxide emissions. It focuses on the priorities for action in London, in other words, those that deliver the most significant
CO2
savings at lowest cost (and in many cases with no net cost, since many actions bring energy savings). It details what
The DPD can contribute to carbon dioxide emission reductions. The Action Plan should help guide CO2 reductions in Brent.
Appendix
4 March 2014
Brent’s Development Management DPD Preferred Options – SA Report (Appendices to Part A)
Appendices 30
Plan or programme title Relevance to the DPDs Comments, opportunities, synergies How the DPDs can respond / and constraints Implications for the SA
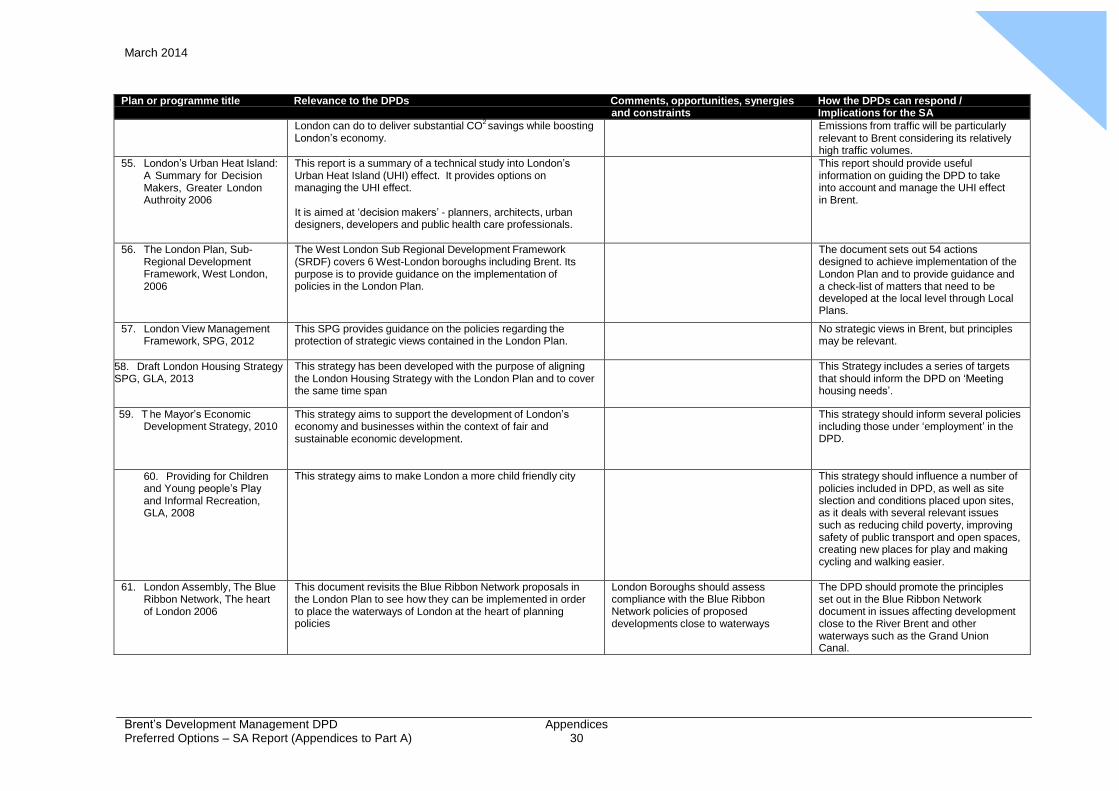
London can do to deliver substantial CO2 savings while boosting
London’s economy. Emissions from traffic will be particularly
relevant to Brent considering its relatively high traffic volumes.
55. London’s Urban Heat Island: A Summary for Decision Makers, Greater London Authroity 2006
This report is a summary of a technical study into London’s Urban Heat Island (UHI) effect. It provides options on managing the UHI effect.
It is aimed at ‘decision makers’ - planners, architects, urban designers, developers and public health care professionals.
This report should provide useful information on guiding the DPD to take into account and manage the UHI effect in Brent.
56. The London Plan, Sub- Regional Development Framework, West London, 2006
The West London Sub Regional Development Framework (SRDF) covers 6 West-London boroughs including Brent. Its purpose is to provide guidance on the implementation of policies in the London Plan.
The document sets out 54 actions designed to achieve implementation of the London Plan and to provide guidance and a check-list of matters that need to be developed at the local level through Local Plans.
57. London View Management Framework, SPG, 2012
This SPG provides guidance on the policies regarding the protection of strategic views contained in the London Plan.
No strategic views in Brent, but principles may be relevant.
58. Draft London Housing Strategy SPG, GLA, 2013
This strategy has been developed with the purpose of aligning the London Housing Strategy with the London Plan and to cover the same time span
This Strategy includes a series of targets that should inform the DPD on ‘Meeting housing needs’.
59. T he Mayor’s Economic Development Strategy, 2010
This strategy aims to support the development of London’s economy and businesses within the context of fair and sustainable economic development.
This strategy should inform several policies including those under ‘employment’ in the DPD.
60. Providing for Children and Young people’s Play and Informal Recreation, GLA, 2008
This strategy aims to make London a more child friendly city This strategy should influence a number of policies included in DPD, as well as site slection and conditions placed upon sites, as it deals with several relevant issues such as reducing child poverty, improving safety of public transport and open spaces, creating new places for play and making cycling and walking easier.
61. London Assembly, The Blue Ribbon Network, The heart of London 2006
This document revisits the Blue Ribbon Network proposals in the London Plan to see how they can be implemented in order to place the waterways of London at the heart of planning policies
London Boroughs should assess compliance with the Blue Ribbon Network policies of proposed developments close to waterways
The DPD should promote the principles set out in the Blue Ribbon Network document in issues affecting development close to the River Brent and other waterways such as the Grand Union Canal.
Appendix
4 March 2014
Brent’s Development Management DPD Preferred Options – SA Report (Appendices to Part A)
Appendices 31
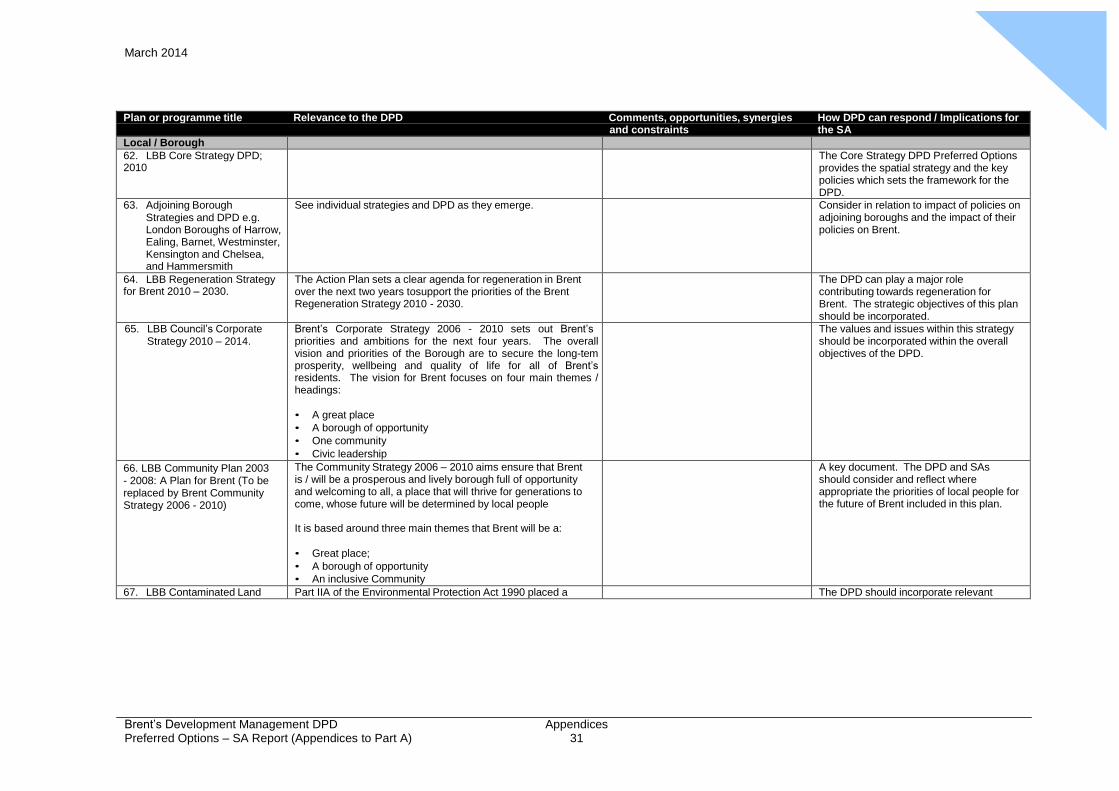
Plan or programme title Relevance to the DPD Comments, opportunities, synergies How DPD can respond / Implications for and constraints the SA
Local / Borough 62. LBB Core Strategy DPD; 2010
The Core Strategy DPD Preferred Options provides the spatial strategy and the key policies which sets the framework for the DPD.
63. Adjoining Borough Strategies and DPD e.g. London Boroughs of Harrow, Ealing, Barnet, Westminster, Kensington and Chelsea, and Hammersmith
See individual strategies and DPD as they emerge. Consider in relation to impact of policies on adjoining boroughs and the impact of their policies on Brent.
64. LBB Regeneration Strategy for Brent 2010 – 2030.
The Action Plan sets a clear agenda for regeneration in Brent over the next two years tosupport the priorities of the Brent Regeneration Strategy 2010 - 2030.
The DPD can play a major role contributing towards regeneration for Brent. The strategic objectives of this plan should be incorporated.
65. LBB Council’s Corporate Strategy 2010 – 2014.
Brent’s Corporate Strategy 2006 - 2010 sets out Brent’s priorities and ambitions for the next four years. The overall vision and priorities of the Borough are to secure the long-tem prosperity, wellbeing and quality of life for all of Brent’s residents. The vision for Brent focuses on four main themes / headings:
• A great place
• A borough of opportunity
• One community
• Civic leadership
The values and issues within this strategy should be incorporated within the overall objectives of the DPD.
66. LBB Community Plan 2003 - 2008: A Plan for Brent (To be replaced by Brent Community Strategy 2006 - 2010)
The Community Strategy 2006 – 2010 aims ensure that Brent is / will be a prosperous and lively borough full of opportunity and welcoming to all, a place that will thrive for generations to come, whose future will be determined by local people
It is based around three main themes that Brent will be a:
• Great place;
• A borough of opportunity
• An inclusive Community
A key document. The DPD and SAs should consider and reflect where appropriate the priorities of local people for the future of Brent included in this plan.
67. LBB Contaminated Land Part IIA of the Environmental Protection Act 1990 placed a The DPD should incorporate relevant
Appendix
4 March 2014
Brent’s Development Management DPD Preferred Options – SA Report (Appendices to Part A)
Appendices 32
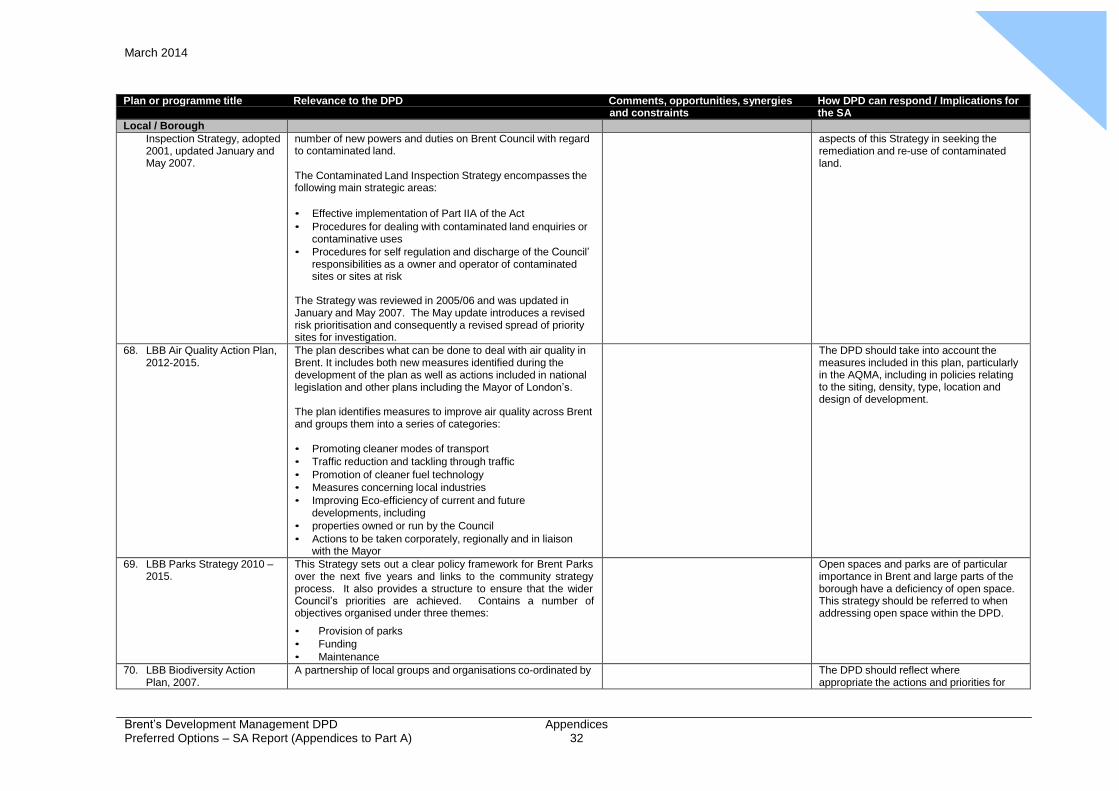
Plan or programme title Relevance to the DPD Comments, opportunities, synergies How DPD can respond / Implications for and constraints the SA
Local / Borough Inspection Strategy, adopted 2001, updated January and May 2007.
number of new powers and duties on Brent Council with regard to contaminated land.
The Contaminated Land Inspection Strategy encompasses the following main strategic areas:
• Effective implementation of Part IIA of the Act
• Procedures for dealing with contaminated land enquiries or contaminative uses
• Procedures for self regulation and discharge of the Council’ responsibilities as a owner and operator of contaminated sites or sites at risk
The Strategy was reviewed in 2005/06 and was updated in January and May 2007. The May update introduces a revised risk prioritisation and consequently a revised spread of priority sites for investigation.
aspects of this Strategy in seeking the remediation and re-use of contaminated land.
68. LBB Air Quality Action Plan, 2012-2015.
The plan describes what can be done to deal with air quality in Brent. It includes both new measures identified during the development of the plan as well as actions included in national legislation and other plans including the Mayor of London’s.
The plan identifies measures to improve air quality across Brent and groups them into a series of categories:
• Promoting cleaner modes of transport
• Traffic reduction and tackling through traffic
• Promotion of cleaner fuel technology
• Measures concerning local industries
• Improving Eco-efficiency of current and future developments, including
• properties owned or run by the Council
• Actions to be taken corporately, regionally and in liaison with the Mayor
The DPD should take into account the measures included in this plan, particularly in the AQMA, including in policies relating to the siting, density, type, location and design of development.
69. LBB Parks Strategy 2010 – 2015.
This Strategy sets out a clear policy framework for Brent Parks over the next five years and links to the community strategy process. It also provides a structure to ensure that the wider Council’s priorities are achieved. Contains a number of objectives organised under three themes:
• Provision of parks
• Funding
• Maintenance
Open spaces and parks are of particular importance in Brent and large parts of the borough have a deficiency of open space. This strategy should be referred to when addressing open space within the DPD.
70. LBB Biodiversity Action Plan, 2007.
A partnership of local groups and organisations co-ordinated by The DPD should reflect where appropriate the actions and priorities for
Appendix
4 March 2014
Brent’s Development Management DPD Preferred Options – SA Report (Appendices to Part A)
Appendices 33
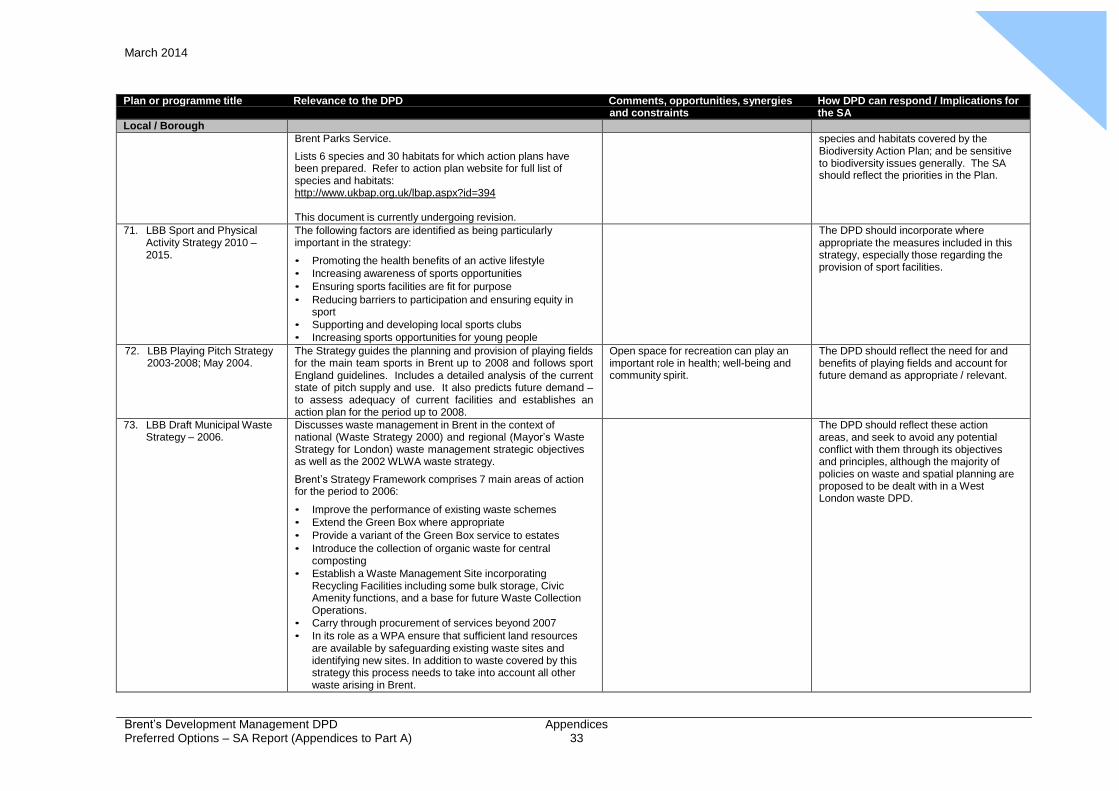
Plan or programme title Relevance to the DPD Comments, opportunities, synergies How DPD can respond / Implications for and constraints the SA
Local / Borough Brent Parks Service.
Lists 6 species and 30 habitats for which action plans have been prepared. Refer to action plan website for full list of species and habitats: http://www.ukbap.org.uk/lbap.aspx?id=394
This document is currently undergoing revision.
species and habitats covered by the Biodiversity Action Plan; and be sensitive to biodiversity issues generally. The SA should reflect the priorities in the Plan.
71. LBB Sport and Physical Activity Strategy 2010 – 2015.
The following factors are identified as being particularly important in the strategy:
• Promoting the health benefits of an active lifestyle
• Increasing awareness of sports opportunities
• Ensuring sports facilities are fit for purpose
• Reducing barriers to participation and ensuring equity in sport
• Supporting and developing local sports clubs
• Increasing sports opportunities for young people
The DPD should incorporate where appropriate the measures included in this strategy, especially those regarding the provision of sport facilities.
72. LBB Playing Pitch Strategy 2003-2008; May 2004.
The Strategy guides the planning and provision of playing fields for the main team sports in Brent up to 2008 and follows sport England guidelines. Includes a detailed analysis of the current state of pitch supply and use. It also predicts future demand – to assess adequacy of current facilities and establishes an action plan for the period up to 2008.
Open space for recreation can play an important role in health; well-being and community spirit.
The DPD should reflect the need for and benefits of playing fields and account for future demand as appropriate / relevant.
73. LBB Draft Municipal Waste Strategy – 2006.
Discusses waste management in Brent in the context of national (Waste Strategy 2000) and regional (Mayor’s Waste Strategy for London) waste management strategic objectives as well as the 2002 WLWA waste strategy.
Brent’s Strategy Framework comprises 7 main areas of action for the period to 2006:
• Improve the performance of existing waste schemes
• Extend the Green Box where appropriate
• Provide a variant of the Green Box service to estates
• Introduce the collection of organic waste for central composting
• Establish a Waste Management Site incorporating Recycling Facilities including some bulk storage, Civic Amenity functions, and a base for future Waste Collection Operations.
• Carry through procurement of services beyond 2007
• In its role as a WPA ensure that sufficient land resources are available by safeguarding existing waste sites and identifying new sites. In addition to waste covered by this strategy this process needs to take into account all other waste arising in Brent.
The DPD should reflect these action areas, and seek to avoid any potential conflict with them through its objectives and principles, although the majority of policies on waste and spatial planning are proposed to be dealt with in a West London waste DPD.
Appendix
4 March 2014
Brent’s Development Management DPD Preferred Options – SA Report (Appendices to Part A)
Appendices 34
Plan or programme title Relevance to the DPD Comments, opportunities, synergies How DPD can respond / Implications for and constraints the SA
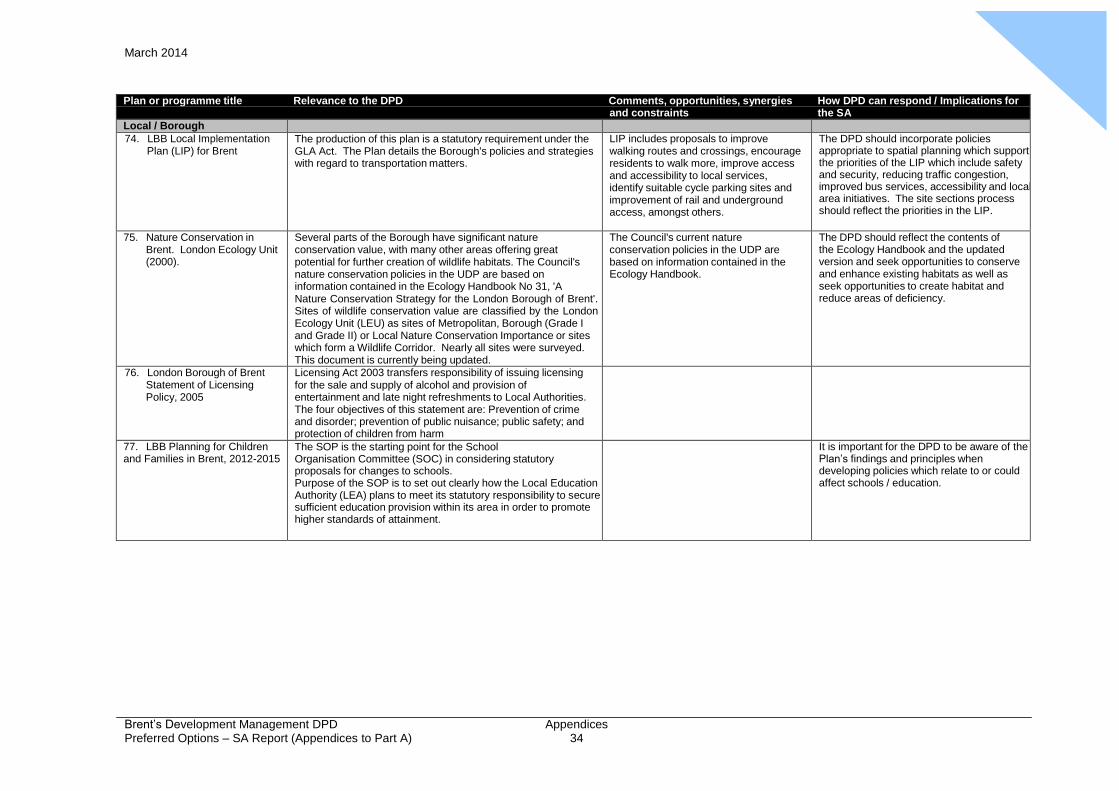
Local / Borough 74. LBB Local Implementation
Plan (LIP) for Brent The production of this plan is a statutory requirement under the GLA Act. The Plan details the Borough's policies and strategies with regard to transportation matters.
LIP includes proposals to improve walking routes and crossings, encourage residents to walk more, improve access and accessibility to local services, identify suitable cycle parking sites and improvement of rail and underground access, amongst others.
The DPD should incorporate policies appropriate to spatial planning which support the priorities of the LIP which include safety and security, reducing traffic congestion, improved bus services, accessibility and local area initiatives. The site sections process should reflect the priorities in the LIP.
75. Nature Conservation in Brent. London Ecology Unit (2000).
Several parts of the Borough have significant nature conservation value, with many other areas offering great potential for further creation of wildlife habitats. The Council's nature conservation policies in the UDP are based on information contained in the Ecology Handbook No 31, 'A Nature Conservation Strategy for the London Borough of Brent'. Sites of wildlife conservation value are classified by the London Ecology Unit (LEU) as sites of Metropolitan, Borough (Grade I and Grade II) or Local Nature Conservation Importance or sites which form a Wildlife Corridor. Nearly all sites were surveyed. This document is currently being updated.
The Council's current nature conservation policies in the UDP are based on information contained in the Ecology Handbook.
The DPD should reflect the contents of the Ecology Handbook and the updated version and seek opportunities to conserve and enhance existing habitats as well as seek opportunities to create habitat and reduce areas of deficiency.
76. London Borough of Brent Statement of Licensing Policy, 2005
Licensing Act 2003 transfers responsibility of issuing licensing for the sale and supply of alcohol and provision of entertainment and late night refreshments to Local Authorities. The four objectives of this statement are: Prevention of crime and disorder; prevention of public nuisance; public safety; and protection of children from harm
77. LBB Planning for Children and Families in Brent, 2012-2015
The SOP is the starting point for the School Organisation Committee (SOC) in considering statutory proposals for changes to schools. Purpose of the SOP is to set out clearly how the Local Education Authority (LEA) plans to meet its statutory responsibility to secure sufficient education provision within its area in order to promote higher standards of attainment.
It is important for the DPD to be aware of the Plan’s findings and principles when developing policies which relate to or could affect schools / education.
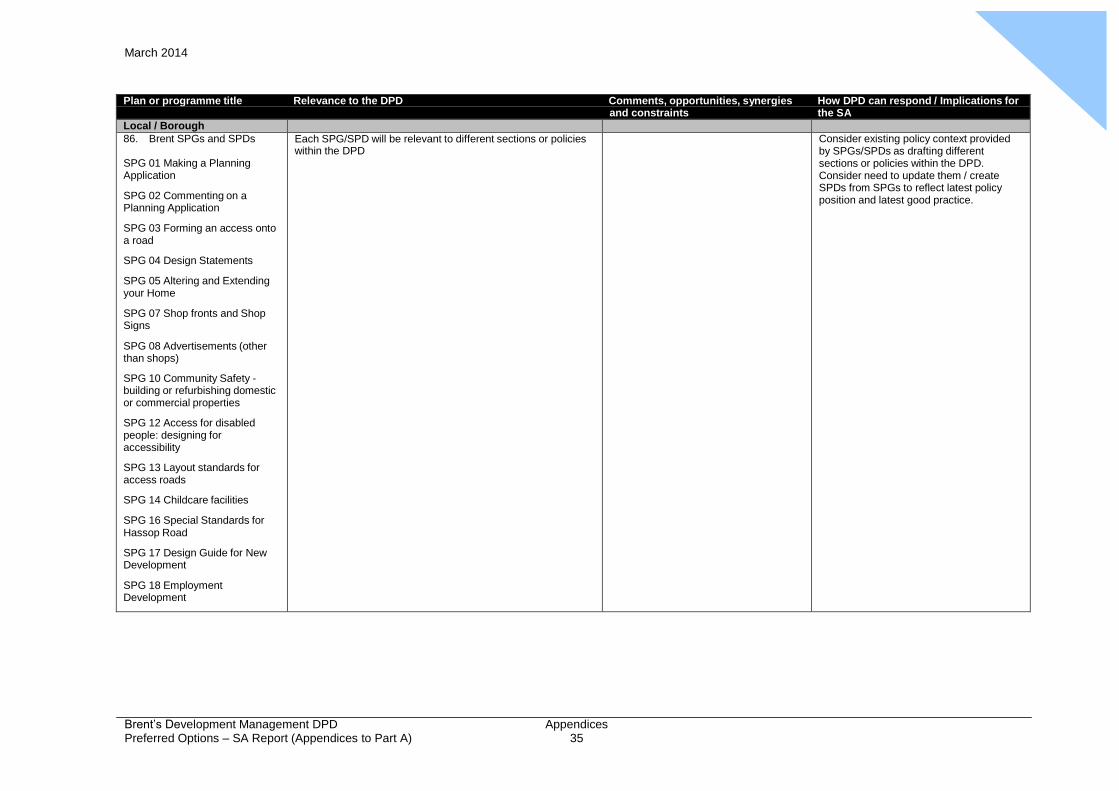
Appendix
4 March 2014
Brent’s Development Management DPD Preferred Options – SA Report (Appendices to Part A)
Appendices 35
Plan or programme title Relevance to the DPD Comments, opportunities, synergies How DPD can respond / Implications for and constraints the SA
Local / Borough 86. Brent SPGs and SPDs
SPG 01 Making a Planning Application
SPG 02 Commenting on a Planning Application
SPG 03 Forming an access onto a road
SPG 04 Design Statements
SPG 05 Altering and Extending your Home
SPG 07 Shop fronts and Shop Signs
SPG 08 Advertisements (other than shops)
SPG 10 Community Safety - building or refurbishing domestic or commercial properties
SPG 12 Access for disabled people: designing for accessibility
SPG 13 Layout standards for access roads
SPG 14 Childcare facilities
SPG 16 Special Standards for Hassop Road
SPG 17 Design Guide for New Development
SPG 18 Employment Development
Each SPG/SPD will be relevant to different sections or policies within the DPD
Consider existing policy context provided by SPGs/SPDs as drafting different sections or policies within the DPD. Consider need to update them / create SPDs from SPGs to reflect latest policy position and latest good practice.
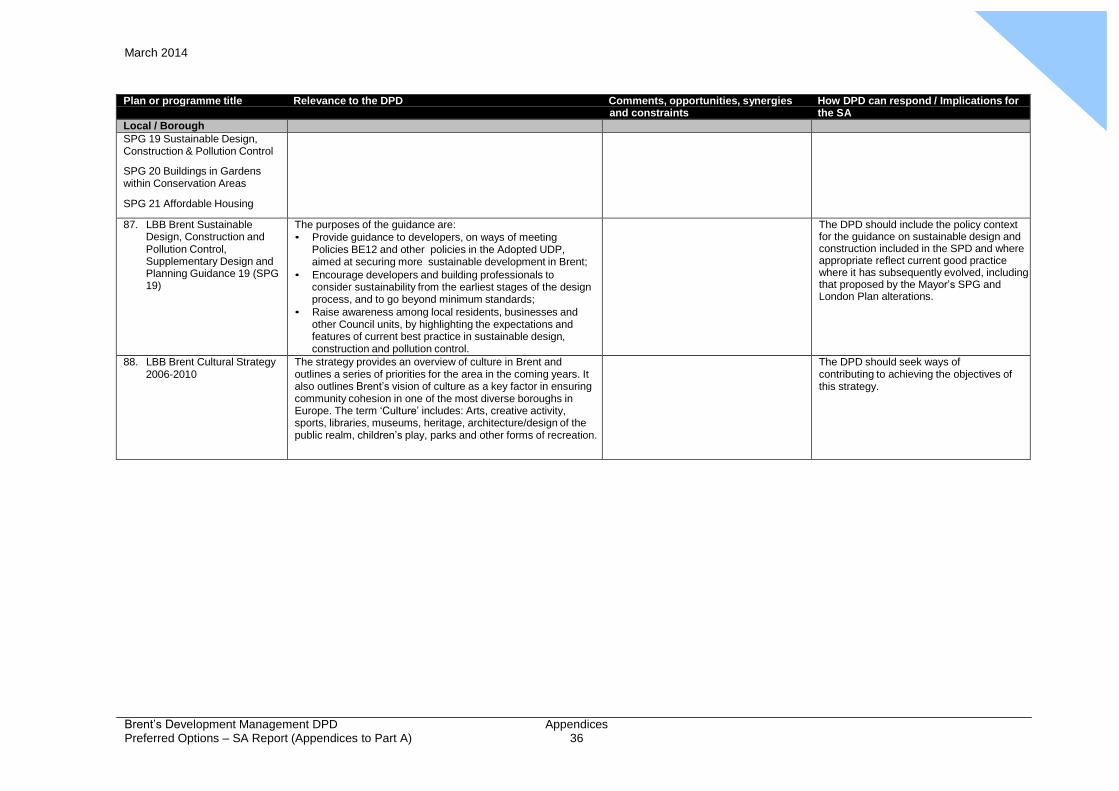
Appendix
4 March 2014
Brent’s Development Management DPD Preferred Options – SA Report (Appendices to Part A)
Appendices 36
Plan or programme title Relevance to the DPD Comments, opportunities, synergies How DPD can respond / Implications for and constraints the SA
Local / Borough SPG 19 Sustainable Design, Construction & Pollution Control
SPG 20 Buildings in Gardens within Conservation Areas
SPG 21 Affordable Housing
87. LBB Brent Sustainable Design, Construction and Pollution Control, Supplementary Design and Planning Guidance 19 (SPG 19)
The purposes of the guidance are:
• Provide guidance to developers, on ways of meeting Policies BE12 and other policies in the Adopted UDP, aimed at securing more sustainable development in Brent;
• Encourage developers and building professionals to consider sustainability from the earliest stages of the design process, and to go beyond minimum standards;
• Raise awareness among local residents, businesses and other Council units, by highlighting the expectations and features of current best practice in sustainable design, construction and pollution control.
The DPD should include the policy context for the guidance on sustainable design and construction included in the SPD and where appropriate reflect current good practice where it has subsequently evolved, including that proposed by the Mayor’s SPG and London Plan alterations.
88. LBB Brent Cultural Strategy 2006-2010
The strategy provides an overview of culture in Brent and outlines a series of priorities for the area in the coming years. It also outlines Brent’s vision of culture as a key factor in ensuring community cohesion in one of the most diverse boroughs in Europe. The term ‘Culture’ includes: Arts, creative activity, sports, libraries, museums, heritage, architecture/design of the public realm, children’s play, parks and other forms of recreation.
The DPD should seek ways of contributing to achieving the objectives of this strategy.

A)
March 2014
APPENDIX 4
BASELINE DATA
Brent ‘s Development Management
Policies Preferred Options - SA Report
(Appendices to Part
Appendices
47
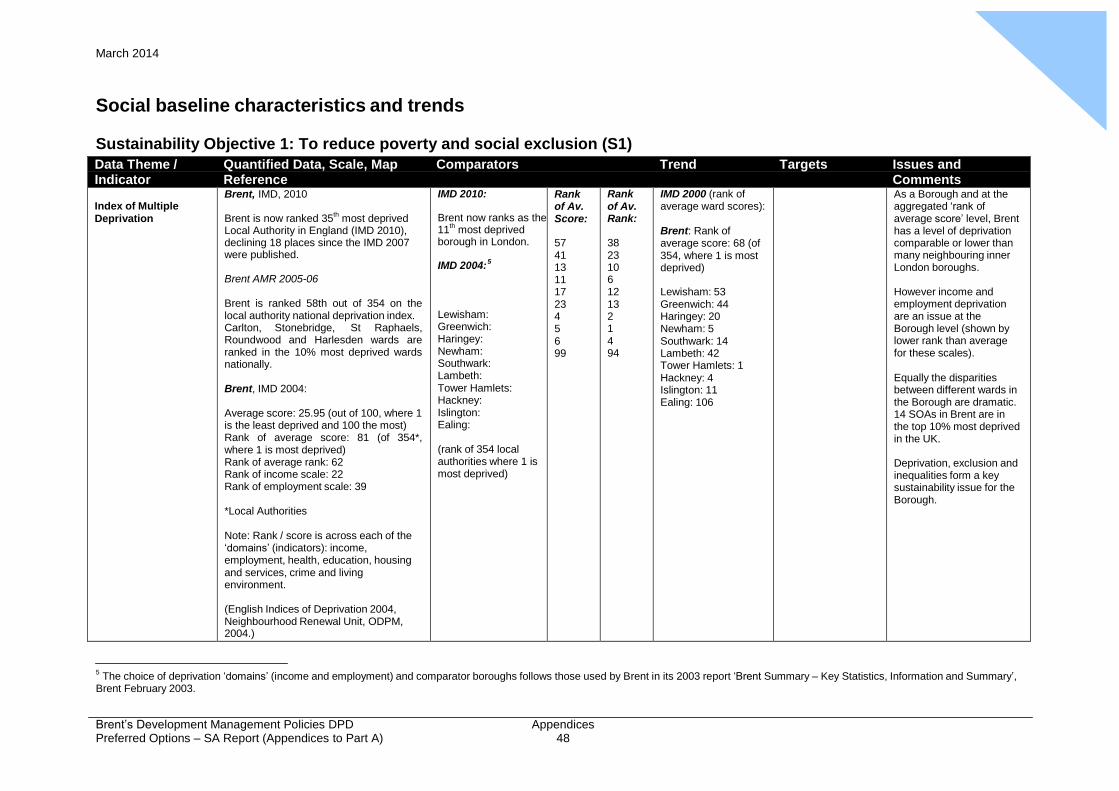
Appendix
5 March 2014
Brent’s Development Management Policies DPD Preferred Options – SA Report (Appendices to Part A)
Appendices 48
Social baseline characteristics and trends
Sustainability Objective 1: To reduce poverty and social exclusion (S1)
Data Theme / Quantified Data, Scale, Map Comparators Trend Targets Issues and Indicator Reference Comments
Index of Multiple Deprivation
Brent, IMD, 2010 Brent is now ranked 35
th most deprived
Local Authority in England (IMD 2010), declining 18 places since the IMD 2007 were published. Brent AMR 2005-06
Brent is ranked 58th out of 354 on the local authority national deprivation index. Carlton, Stonebridge, St Raphaels, Roundwood and Harlesden wards are ranked in the 10% most deprived wards nationally.
Brent, IMD 2004:
Average score: 25.95 (out of 100, where 1 is the least deprived and 100 the most) Rank of average score: 81 (of 354*, where 1 is most deprived) Rank of average rank: 62 Rank of income scale: 22 Rank of employment scale: 39
*Local Authorities
Note: Rank / score is across each of the ‘domains’ (indicators): income, employment, health, education, housing and services, crime and living environment.
(English Indices of Deprivation 2004, Neighbourhood Renewal Unit, ODPM, 2004.)
There are 174 Super Output Areas (SOAs) in Brent, and 14 of those are in the top 10% most deprived in the country. These areas are located in the following wards: Stonebridge, Harlesden, Kensal Green, Willesden Green and Kilburn.
IMD 2010: Brent now ranks as the 11
th most deprived
borough in London. IMD 2004:
5
Lewisham: Greenwich: Haringey: Newham: Southwark: Lambeth: Tower Hamlets: Hackney: Islington: Ealing:
(rank of 354 local authorities where 1 is most deprived)
Rank of Av. Score:
57 41 13 11 17 23 4 5 6 99
Rank of Av. Rank:
38 23 10 6 12 13 2 1 4 94
IMD 2000 (rank of average ward scores):
Brent: Rank of average score: 68 (of 354, where 1 is most deprived)
Lewisham: 53 Greenwich: 44 Haringey: 20 Newham: 5 Southwark: 14 Lambeth: 42 Tower Hamlets: 1 Hackney: 4 Islington: 11 Ealing: 106
As a Borough and at the aggregated ‘rank of average score’ level, Brent has a level of deprivation comparable or lower than many neighbouring inner London boroughs.
However income and employment deprivation are an issue at the Borough level (shown by lower rank than average for these scales).
Equally the disparities between different wards in the Borough are dramatic. 14 SOAs in Brent are in the top 10% most deprived in the UK.
Deprivation, exclusion and inequalities form a key sustainability issue for the Borough.
5
The choice of deprivation ‘domains’ (income and employment) and comparator boroughs follows those used by Brent in its 2003 report ‘Brent Summary – Key Statistics, Information and Summary’, Brent February 2003.
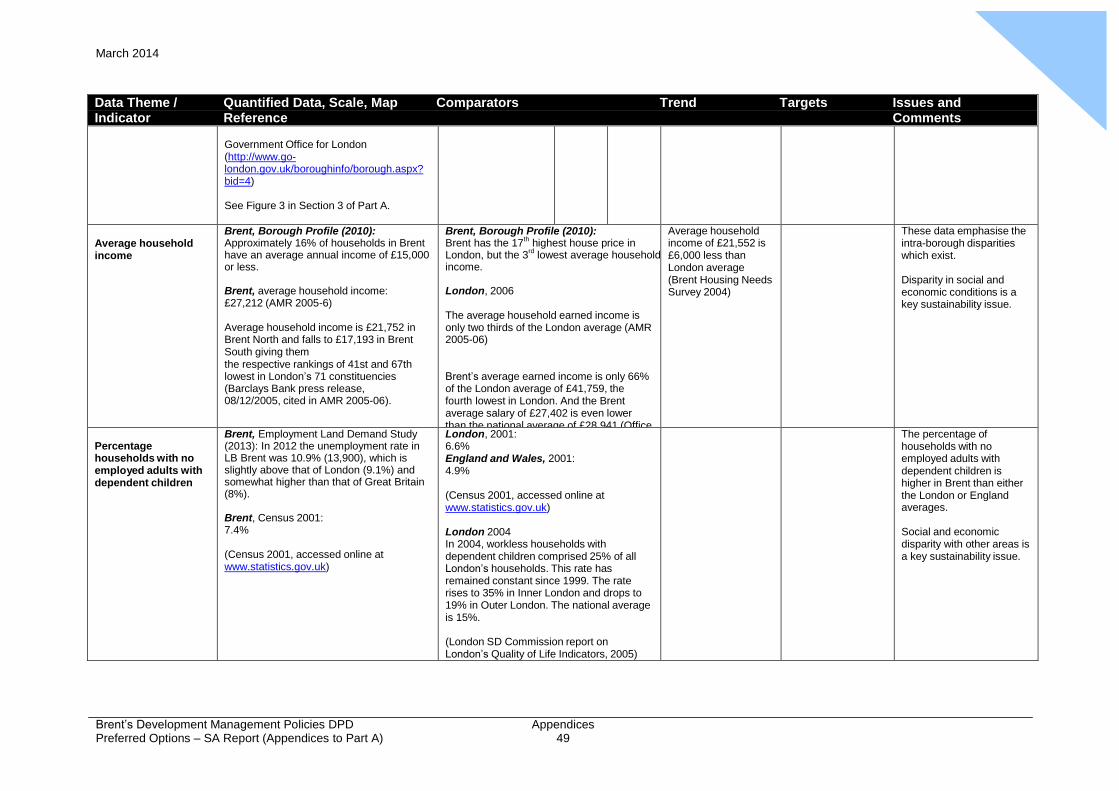
Appendix
5 March 2014
Brent’s Development Management Policies DPD Preferred Options – SA Report (Appendices to Part A)
Appendices 49
Data Theme / Quantified Data, Scale, Map Comparators Trend Targets Issues and Indicator Reference Comments
Government Office for London (http://www.go- london.gov.uk/boroughinfo/borough.aspx? bid=4)
See Figure 3 in Section 3 of Part A.
Average household income
Brent, Borough Profile (2010): Approximately 16% of households in Brent have an average annual income of £15,000 or less. Brent, average household income: £27,212 (AMR 2005-6)
Average household income is £21,752 in Brent North and falls to £17,193 in Brent South giving them the respective rankings of 41st and 67th lowest in London’s 71 constituencies (Barclays Bank press release, 08/12/2005, cited in AMR 2005-06).
Brent, Borough Profile (2010): Brent has the 17
th highest house price in
London, but the 3rd lowest average household
income. London, 2006
The average household earned income is only two thirds of the London average (AMR 2005-06)
Brent’s average earned income is only 66% of the London average of £41,759, the fourth lowest in London. And the Brent average salary of £27,402 is even lower than the national average of £28,941 (Office of National Statistics, 2006, cited in AMR 2005-06).
Average household income of £21,552 is £6,000 less than London average (Brent Housing Needs Survey 2004)
These data emphasise the intra-borough disparities which exist.
Disparity in social and economic conditions is a key sustainability issue.
Percentage households with no employed adults with dependent children
Brent, Employment Land Demand Study (2013): In 2012 the unemployment rate in LB Brent was 10.9% (13,900), which is slightly above that of London (9.1%) and somewhat higher than that of Great Britain (8%). Brent, Census 2001: 7.4%
(Census 2001, accessed online at www.statistics.gov.uk)
London, 2001: 6.6% England and Wales, 2001: 4.9%
(Census 2001, accessed online at www.statistics.gov.uk)
London 2004 In 2004, workless households with dependent children comprised 25% of all London’s households. This rate has remained constant since 1999. The rate rises to 35% in Inner London and drops to 19% in Outer London. The national average is 15%.
(London SD Commission report on London’s Quality of Life Indicators, 2005)
The percentage of households with no employed adults with dependent children is higher in Brent than either the London or England averages.
Social and economic disparity with other areas is a key sustainability issue.
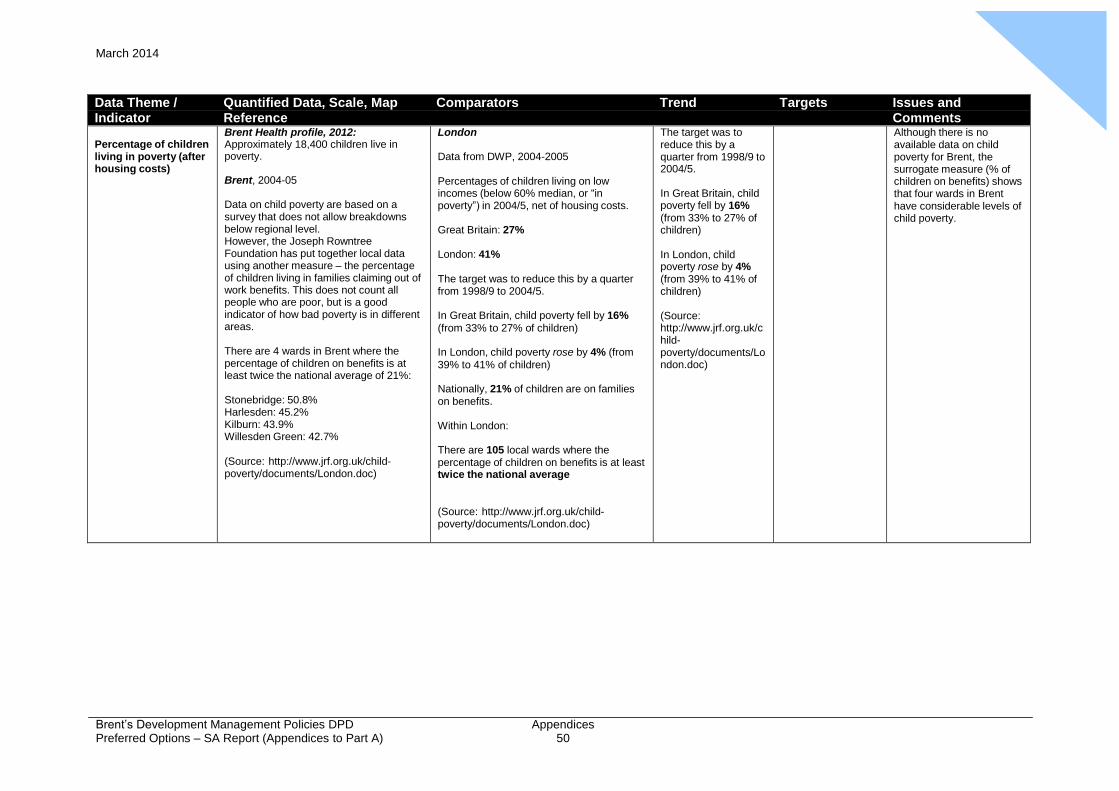
Appendix
5 March 2014
Brent’s Development Management Policies DPD Preferred Options – SA Report (Appendices to Part A)
Appendices 50
Data Theme / Quantified Data, Scale, Map Comparators Trend Targets Issues and Indicator Reference Comments
Percentage of children living in poverty (after housing costs)
Brent Health profile, 2012: Approximately 18,400 children live in poverty. Brent, 2004-05
Data on child poverty are based on a survey that does not allow breakdowns below regional level. However, the Joseph Rowntree Foundation has put together local data using another measure – the percentage of children living in families claiming out of work benefits. This does not count all people who are poor, but is a good indicator of how bad poverty is in different areas.
There are 4 wards in Brent where the percentage of children on benefits is at least twice the national average of 21%:
Stonebridge: 50.8% Harlesden: 45.2% Kilburn: 43.9% Willesden Green: 42.7%
(Source: http://www.jrf.org.uk/child- poverty/documents/London.doc)
London
Data from DWP, 2004-2005
Percentages of children living on low incomes (below 60% median, or “in poverty”) in 2004/5, net of housing costs.
Great Britain: 27%
London: 41%
The target was to reduce this by a quarter from 1998/9 to 2004/5.
In Great Britain, child poverty fell by 16%
(from 33% to 27% of children)
In London, child poverty rose by 4% (from
39% to 41% of children)
Nationally, 21% of children are on families on benefits.
Within London:
There are 105 local wards where the percentage of children on benefits is at least twice the national average
(Source: http://www.jrf.org.uk/child- poverty/documents/London.doc)
The target was to reduce this by a quarter from 1998/9 to 2004/5.
In Great Britain, child poverty fell by 16% (from 33% to 27% of children)
In London, child poverty rose by 4% (from 39% to 41% of children)
(Source: http://www.jrf.org.uk/c hild- poverty/documents/Lo ndon.doc)
Although there is no available data on child poverty for Brent, the surrogate measure (% of children on benefits) shows that four wards in Brent have considerable levels of child poverty.
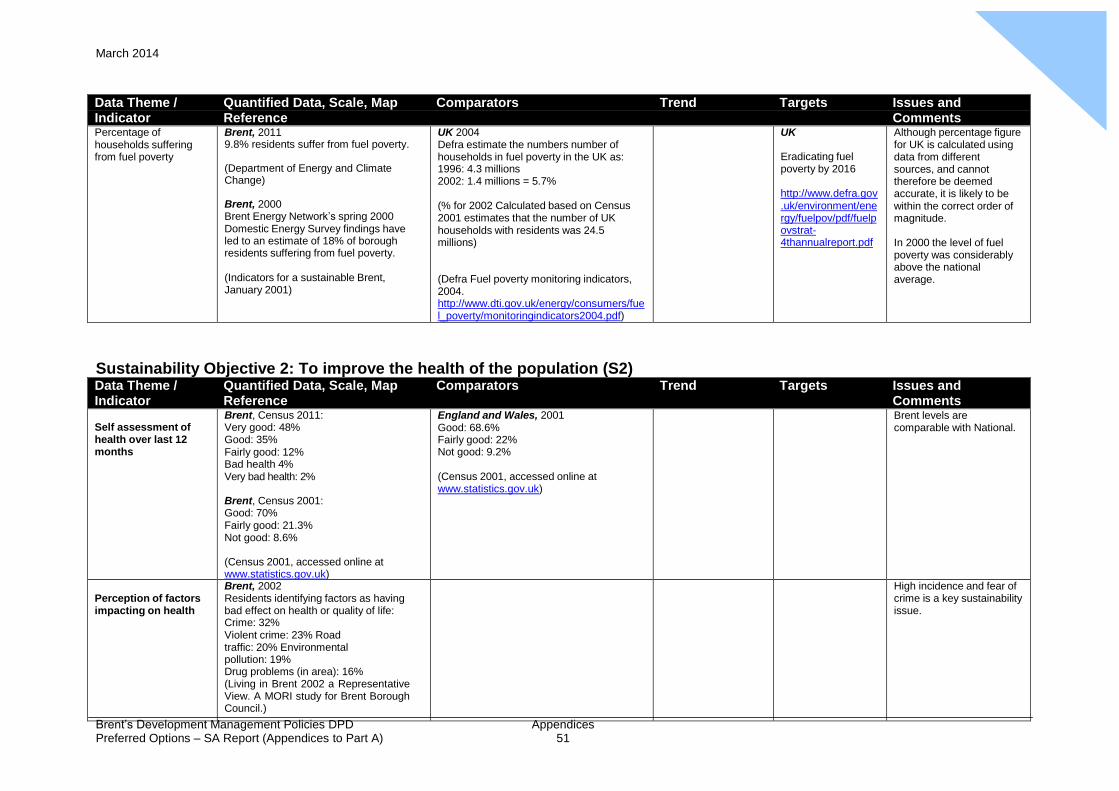
Appendix
5 March 2014
Brent’s Development Management Policies DPD Preferred Options – SA Report (Appendices to Part A)
Appendices 51
Data Theme / Quantified Data, Scale, Map Comparators Trend Targets Issues and Indicator Reference Comments Percentage of households suffering from fuel poverty
Brent, 2011 9.8% residents suffer from fuel poverty. (Department of Energy and Climate Change) Brent, 2000 Brent Energy Network’s spring 2000 Domestic Energy Survey findings have led to an estimate of 18% of borough residents suffering from fuel poverty.
(Indicators for a sustainable Brent, January 2001)
UK 2004 Defra estimate the numbers number of households in fuel poverty in the UK as: 1996: 4.3 millions 2002: 1.4 millions = 5.7%
(% for 2002 Calculated based on Census 2001 estimates that the number of UK households with residents was 24.5 millions)
(Defra Fuel poverty monitoring indicators, 2004. http://www.dti.gov.uk/energy/consumers/fue l_poverty/monitoringindicators2004.pdf)
UK
Eradicating fuel poverty by 2016
http://www.defra.gov .uk/environment/ene rgy/fuelpov/pdf/fuelp ovstrat- 4thannualreport.pdf
Although percentage figure for UK is calculated using data from different sources, and cannot therefore be deemed accurate, it is likely to be within the correct order of magnitude.
In 2000 the level of fuel poverty was considerably above the national average.
Sustainability Objective 2: To improve the health of the population (S2) Data Theme / Quantified Data, Scale, Map Comparators Trend Targets Issues and Indicator Reference Comments
Self assessment of health over last 12 months
Brent, Census 2011: Very good: 48% Good: 35% Fairly good: 12% Bad health 4% Very bad health: 2% Brent, Census 2001: Good: 70% Fairly good: 21.3% Not good: 8.6%
(Census 2001, accessed online at www.statistics.gov.uk)
England and Wales, 2001 Good: 68.6% Fairly good: 22% Not good: 9.2%
(Census 2001, accessed online at www.statistics.gov.uk)
Brent levels are comparable with National.
Perception of factors impacting on health
Brent, 2002 Residents identifying factors as having bad effect on health or quality of life: Crime: 32% Violent crime: 23% Road traffic: 20% Environmental pollution: 19% Drug problems (in area): 16% (Living in Brent 2002 a Representative View. A MORI study for Brent Borough Council.)
High incidence and fear of crime is a key sustainability issue.
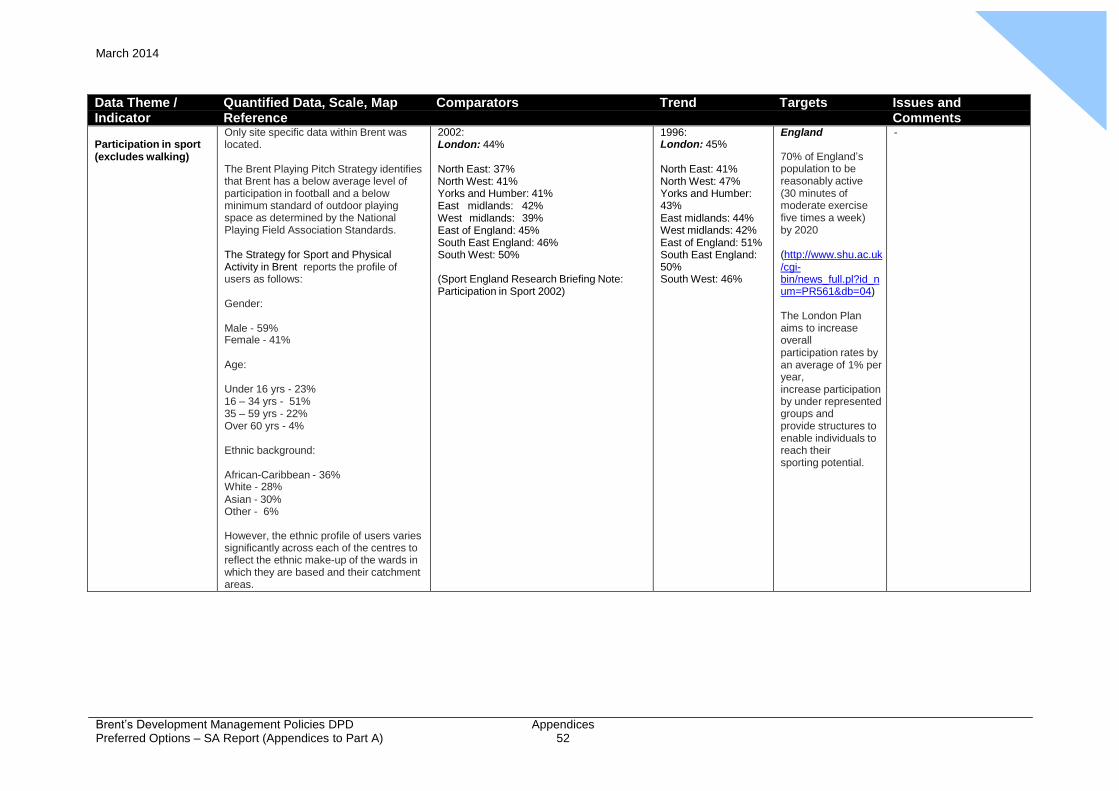
Appendix
5 March 2014
Brent’s Development Management Policies DPD Preferred Options – SA Report (Appendices to Part A)
Appendices 52
Data Theme / Quantified Data, Scale, Map Comparators Trend Targets Issues and Indicator Reference Comments
Participation in sport (excludes walking)
Only site specific data within Brent was located.
The Brent Playing Pitch Strategy identifies that Brent has a below average level of participation in football and a below minimum standard of outdoor playing space as determined by the National Playing Field Association Standards.
The Strategy for Sport and Physical Activity in Brent reports the profile of users as follows:
Gender:
Male - 59% Female - 41%
Age:
Under 16 yrs - 23% 16 – 34 yrs - 51% 35 – 59 yrs - 22% Over 60 yrs - 4%
Ethnic background:
African-Caribbean - 36% White - 28% Asian - 30% Other - 6%
However, the ethnic profile of users varies significantly across each of the centres to reflect the ethnic make-up of the wards in which they are based and their catchment areas.
2002: London: 44%
North East: 37% North West: 41% Yorks and Humber: 41% East midlands: 42% West midlands: 39% East of England: 45% South East England: 46% South West: 50%
(Sport England Research Briefing Note: Participation in Sport 2002)
1996: London: 45%
North East: 41% North West: 47% Yorks and Humber: 43% East midlands: 44% West midlands: 42% East of England: 51% South East England: 50% South West: 46%
England
70% of England’s population to be reasonably active (30 minutes of moderate exercise five times a week) by 2020
(http://www.shu.ac.uk /cgi- bin/news_full.pl?id_n um=PR561&db=04)
The London Plan aims to increase overall participation rates by an average of 1% per year, increase participation by under represented groups and provide structures to enable individuals to reach their sporting potential.
-

Appendix
5 March 2014
Brent’s Development Management Policies DPD Preferred Options – SA Report (Appendices to Part A)
Appendices 53
Data Theme / Quantified Data, Scale, Map Comparators Trend Targets Issues and Indicator Reference Comments
Number of sports facilities by type
Brent Indoor sports: Vale Farm Sports Centre – 25m pool and teaching pool, 5 badminton courts/sports hall, squash courts, dojo and meeting rooms.
Council owned: Charteris Sports Centre – 3 badminton courts, weight / fitness area. Bridge Park Community Leisure Centre – 5 badminton courts/sports hall, dance studio, fitness studio / weights room. Willesden Sports Centre – six lane 25m main pool plus teaching pool, four badminton court sports hall, fitness / weights area, dojo and multi purpose room, athletic s and five-a-side indoor football pitches.
Source: A Strategy for Sport and Physical Activity in Brent
Access to public open spaces
Brent 2001 40% of Brent’s domestic properties are in open space deficiency areas:
These are residential areas more than 400 metres from a public open space of over 2 hectares.
Source: AMR 2004-05
Spatial inequality affects access to public open spaces, with large areas such as Fryent Country Park and the Welsh Harp in the north of Brent while southern areas have insufficient land for recreation and sport (AMR 2005-06).
See Figure 6 in Section 3 (Part A) for areas of open space deficiency.
The net loss of 4.6ha6
of open space during 2000-2006, compares positively to the 28.6ha net loss in the previous six year period. Since the Revised Unitary Development Plan 2001 came into effect, public open space has generally been successfully protected from alternative or inappropriate uses (AMR 2005-06).
Though no comparator data has been identified a figure of 40% is considered to be relatively high.
Quality of access to open spaces and parks is a key sustainability issue.
There are also disparities between north and south Brent.
6
The substantial difference between this figure and the 2005 AMR figure is due to an allotment site (Ref.:00/0751) not being included in the original calculation.
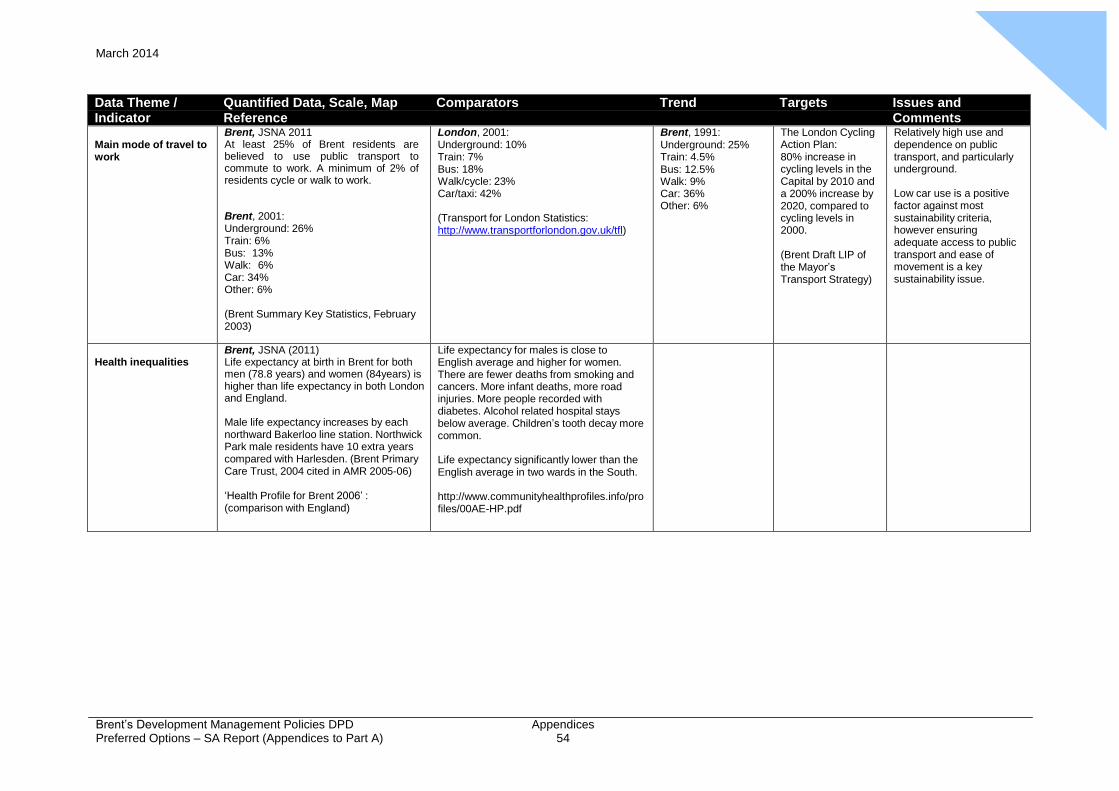
Appendix
5 March 2014
Brent’s Development Management Policies DPD Preferred Options – SA Report (Appendices to Part A)
Appendices 54
Data Theme / Quantified Data, Scale, Map Comparators Trend Targets Issues and Indicator Reference Comments
Main mode of travel to work
Brent, JSNA 2011 At least 25% of Brent residents are believed to use public transport to commute to work. A minimum of 2% of residents cycle or walk to work. Brent, 2001: Underground: 26% Train: 6% Bus: 13% Walk: 6% Car: 34% Other: 6%
(Brent Summary Key Statistics, February 2003)
London, 2001: Underground: 10% Train: 7% Bus: 18% Walk/cycle: 23% Car/taxi: 42%
(Transport for London Statistics: http://www.transportforlondon.gov.uk/tfl)
Brent, 1991: Underground: 25% Train: 4.5% Bus: 12.5% Walk: 9% Car: 36% Other: 6%
The London Cycling Action Plan: 80% increase in cycling levels in the Capital by 2010 and a 200% increase by 2020, compared to cycling levels in 2000.
(Brent Draft LIP of the Mayor’s Transport Strategy)
Relatively high use and dependence on public transport, and particularly underground.
Low car use is a positive factor against most sustainability criteria, however ensuring adequate access to public transport and ease of movement is a key sustainability issue.
Health inequalities
Brent, JSNA (2011) Life expectancy at birth in Brent for both men (78.8 years) and women (84years) is higher than life expectancy in both London and England. Male life expectancy increases by each northward Bakerloo line station. Northwick Park male residents have 10 extra years compared with Harlesden. (Brent Primary Care Trust, 2004 cited in AMR 2005-06)
‘Health Profile for Brent 2006’ : (comparison with England)
Life expectancy for males is close to English average and higher for women. There are fewer deaths from smoking and cancers. More infant deaths, more road injuries. More people recorded with diabetes. Alcohol related hospital stays below average. Children’s tooth decay more common.
Life expectancy significantly lower than the English average in two wards in the South.
http://www.communityhealthprofiles.info/pro files/00AE-HP.pdf
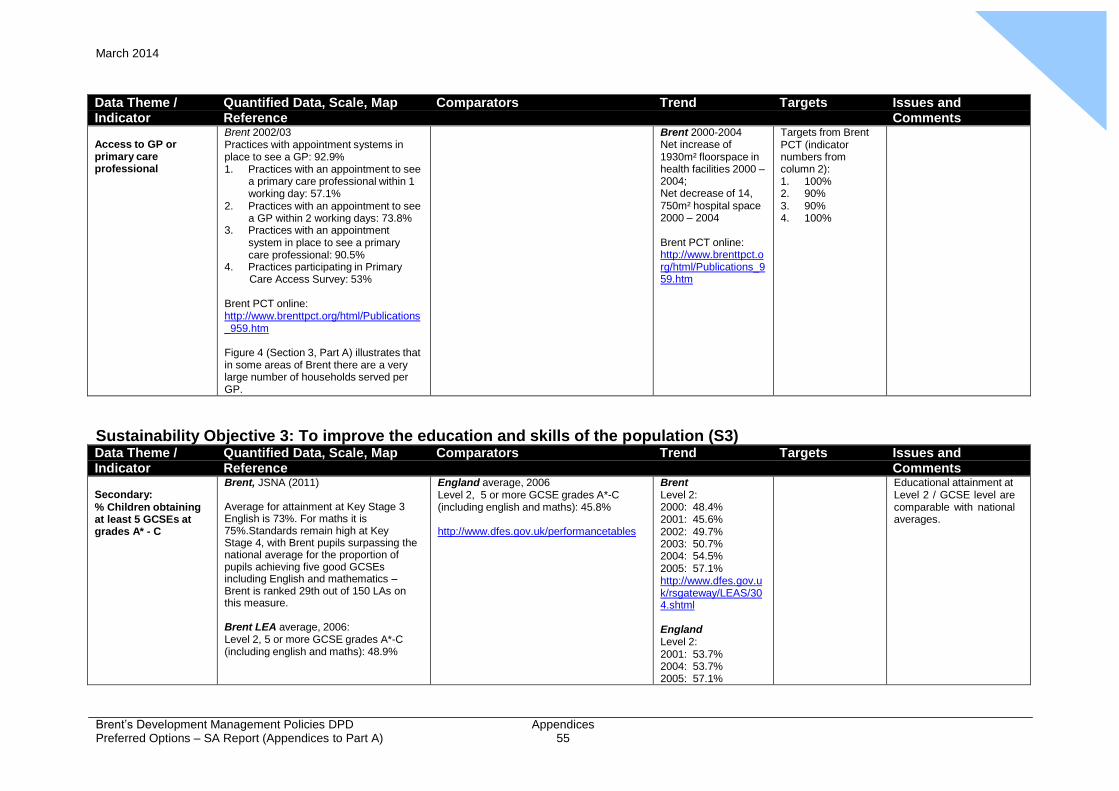
Appendix
5 March 2014
Brent’s Development Management Policies DPD Preferred Options – SA Report (Appendices to Part A)
Appendices 55
Data Theme / Quantified Data, Scale, Map Comparators Trend Targets Issues and Indicator Reference Comments
Access to GP or primary care professional
Brent 2002/03 Practices with appointment systems in place to see a GP: 92.9% 1. Practices with an appointment to see
a primary care professional within 1 working day: 57.1%
2. Practices with an appointment to see a GP within 2 working days: 73.8%
3. Practices with an appointment system in place to see a primary care professional: 90.5%
4. Practices participating in Primary Care Access Survey: 53%
Brent PCT online: http://www.brenttpct.org/html/Publications _959.htm
Figure 4 (Section 3, Part A) illustrates that in some areas of Brent there are a very large number of households served per GP.
Brent 2000-2004 Net increase of 1930m² floorspace in health facilities 2000 – 2004; Net decrease of 14, 750m² hospital space 2000 – 2004
Brent PCT online: http://www.brenttpct.o rg/html/Publications_9 59.htm
Targets from Brent PCT (indicator numbers from column 2): 1. 100% 2. 90% 3. 90% 4. 100%
Sustainability Objective 3: To improve the education and skills of the population (S3) Data Theme / Quantified Data, Scale, Map Comparators Trend Targets Issues and Indicator Reference Comments
Secondary:
% Children obtaining at least 5 GCSEs at grades A* - C
Brent, JSNA (2011) Average for attainment at Key Stage 3 English is 73%. For maths it is 75%.Standards remain high at Key Stage 4, with Brent pupils surpassing the national average for the proportion of pupils achieving five good GCSEs including English and mathematics – Brent is ranked 29th out of 150 LAs on this measure. Brent LEA average, 2006: Level 2, 5 or more GCSE grades A*-C (including english and maths): 48.9%
England average, 2006 Level 2, 5 or more GCSE grades A*-C (including english and maths): 45.8%
http://www.dfes.gov.uk/performancetables
Brent Level 2: 2000: 48.4% 2001: 45.6% 2002: 49.7% 2003: 50.7% 2004: 54.5% 2005: 57.1% http://www.dfes.gov.u k/rsgateway/LEAS/30 4.shtml
England Level 2: 2001: 53.7% 2004: 53.7% 2005: 57.1%
Educational attainment at Level 2 / GCSE level are comparable with national averages.
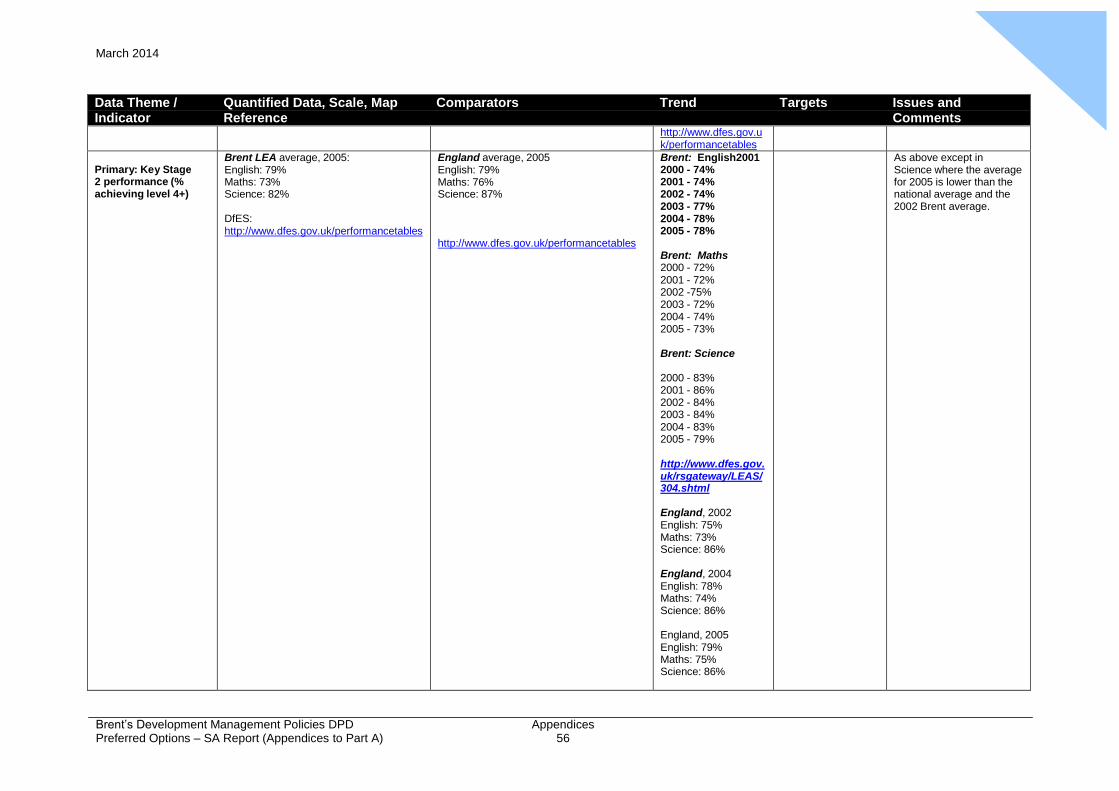
Appendix
5 March 2014
Brent’s Development Management Policies DPD Preferred Options – SA Report (Appendices to Part A)
Appendices 56
Data Theme / Quantified Data, Scale, Map Comparators Trend Targets Issues and Indicator Reference Comments
http://www.dfes.gov.u k/performancetables
Primary: Key Stage 2 performance (% achieving level 4+)
Brent LEA average, 2005: English: 79% Maths: 73% Science: 82%
DfES: http://www.dfes.gov.uk/performancetables
England average, 2005 English: 79% Maths: 76% Science: 87%
http://www.dfes.gov.uk/performancetables
Brent: English2001 2000 - 74% 2001 - 74% 2002 - 74% 2003 - 77% 2004 - 78% 2005 - 78%
Brent: Maths 2000 - 72% 2001 - 72% 2002 -75% 2003 - 72% 2004 - 74% 2005 - 73%
Brent: Science
2000 - 83% 2001 - 86% 2002 - 84% 2003 - 84% 2004 - 83% 2005 - 79%
http://www.dfes.gov. uk/rsgateway/LEAS/ 304.shtml
England, 2002 English: 75% Maths: 73% Science: 86%
England, 2004 English: 78% Maths: 74% Science: 86%
England, 2005 English: 79% Maths: 75% Science: 86%
As above except in Science where the average for 2005 is lower than the national average and the 2002 Brent average.
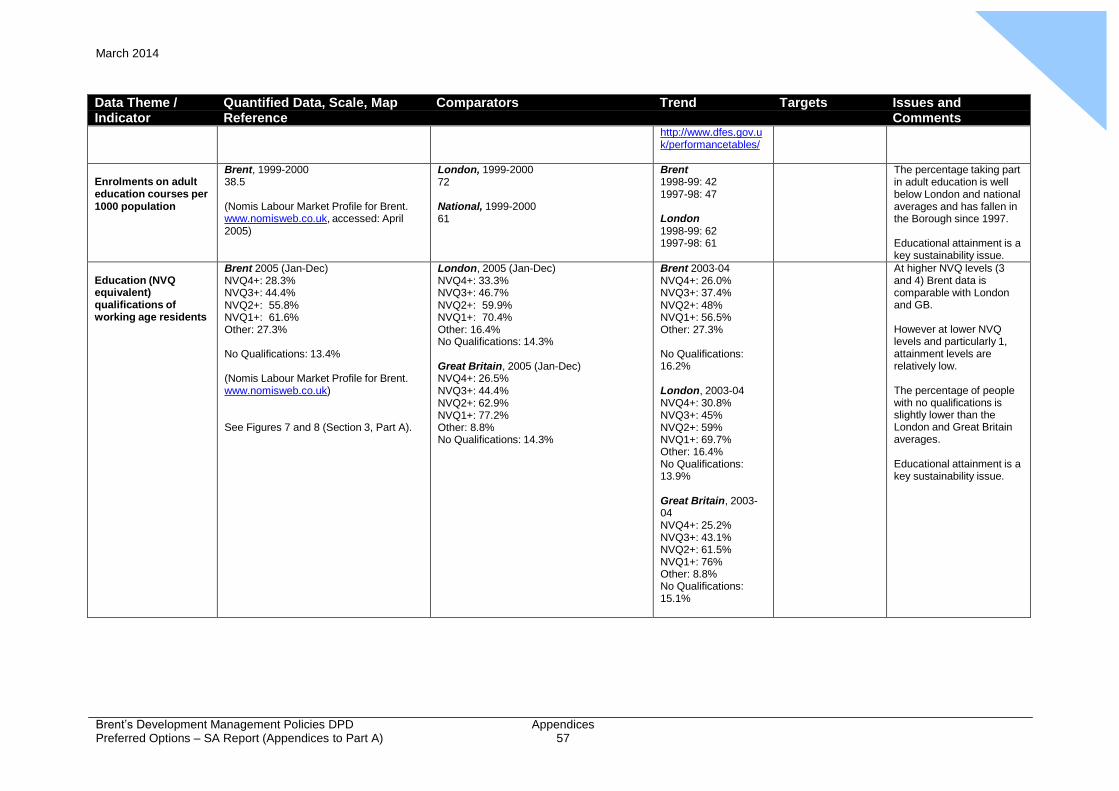
Appendix
5 March 2014
Brent’s Development Management Policies DPD Preferred Options – SA Report (Appendices to Part A)
Appendices 57
Data Theme / Quantified Data, Scale, Map Comparators Trend Targets Issues and Indicator Reference Comments
http://www.dfes.gov.u k/performancetables/
Enrolments on adult education courses per 1000 population
Brent, 1999-2000 38.5
(Nomis Labour Market Profile for Brent. www.nomisweb.co.uk, accessed: April 2005)
London, 1999-2000 72
National, 1999-2000 61
Brent 1998-99: 42 1997-98: 47
London 1998-99: 62 1997-98: 61
The percentage taking part in adult education is well below London and national averages and has fallen in the Borough since 1997.
Educational attainment is a key sustainability issue.
Education (NVQ equivalent) qualifications of working age residents
Brent 2005 (Jan-Dec) NVQ4+: 28.3% NVQ3+: 44.4% NVQ2+: 55.8% NVQ1+: 61.6% Other: 27.3%
No Qualifications: 13.4%
(Nomis Labour Market Profile for Brent. www.nomisweb.co.uk)
See Figures 7 and 8 (Section 3, Part A).
London, 2005 (Jan-Dec) NVQ4+: 33.3% NVQ3+: 46.7% NVQ2+: 59.9% NVQ1+: 70.4% Other: 16.4% No Qualifications: 14.3%
Great Britain, 2005 (Jan-Dec) NVQ4+: 26.5% NVQ3+: 44.4% NVQ2+: 62.9% NVQ1+: 77.2% Other: 8.8% No Qualifications: 14.3%
Brent 2003-04 NVQ4+: 26.0% NVQ3+: 37.4% NVQ2+: 48% NVQ1+: 56.5% Other: 27.3%
No Qualifications: 16.2%
London, 2003-04 NVQ4+: 30.8% NVQ3+: 45% NVQ2+: 59% NVQ1+: 69.7% Other: 16.4% No Qualifications: 13.9%
Great Britain, 2003- 04 NVQ4+: 25.2% NVQ3+: 43.1% NVQ2+: 61.5% NVQ1+: 76% Other: 8.8% No Qualifications: 15.1%
At higher NVQ levels (3 and 4) Brent data is comparable with London and GB.
However at lower NVQ levels and particularly 1, attainment levels are relatively low.
The percentage of people with no qualifications is slightly lower than the London and Great Britain averages.
Educational attainment is a key sustainability issue.
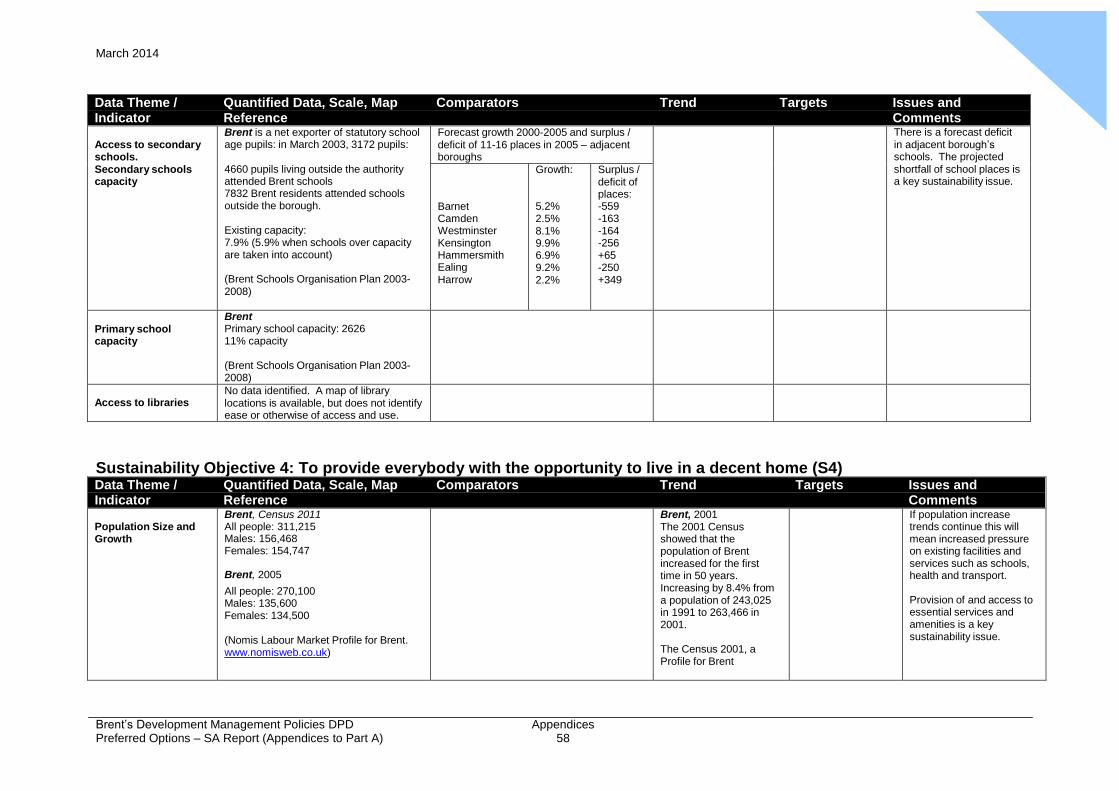
Appendix
5 March 2014
Brent’s Development Management Policies DPD Preferred Options – SA Report (Appendices to Part A)
Appendices 58
Data Theme / Quantified Data, Scale, Map Comparators Trend Targets Issues and Indicator Reference Comments
Access to secondary schools. Secondary schools capacity
Brent is a net exporter of statutory school age pupils: in March 2003, 3172 pupils:
4660 pupils living outside the authority attended Brent schools 7832 Brent residents attended schools outside the borough.
Existing capacity: 7.9% (5.9% when schools over capacity are taken into account)
(Brent Schools Organisation Plan 2003- 2008)
Forecast growth 2000-2005 and surplus / deficit of 11-16 places in 2005 – adjacent boroughs
There is a forecast deficit in adjacent borough’s schools. The projected shortfall of school places is a key sustainability issue.
Barnet Camden Westminster Kensington Hammersmith Ealing Harrow
Growth:
5.2% 2.5% 8.1% 9.9% 6.9% 9.2% 2.2%
Surplus / deficit of places: -559 -163 -164 -256 +65 -250 +349
Primary school capacity
Brent Primary school capacity: 2626 11% capacity
(Brent Schools Organisation Plan 2003- 2008)
Access to libraries
No data identified. A map of library locations is available, but does not identify ease or otherwise of access and use.
Sustainability Objective 4: To provide everybody with the opportunity to live in a decent home (S4) Data Theme / Quantified Data, Scale, Map Comparators Trend Targets Issues and Indicator Reference Comments
Population Size and Growth
Brent, Census 2011 All people: 311,215 Males: 156,468 Females: 154,747 Brent, 2005
All people: 270,100 Males: 135,600 Females: 134,500
(Nomis Labour Market Profile for Brent. www.nomisweb.co.uk)
Brent, 2001 The 2001 Census showed that the population of Brent increased for the first time in 50 years. Increasing by 8.4% from a population of 243,025 in 1991 to 263,466 in 2001.
The Census 2001, a Profile for Brent
If population increase trends continue this will mean increased pressure on existing facilities and services such as schools, health and transport.
Provision of and access to essential services and amenities is a key sustainability issue.
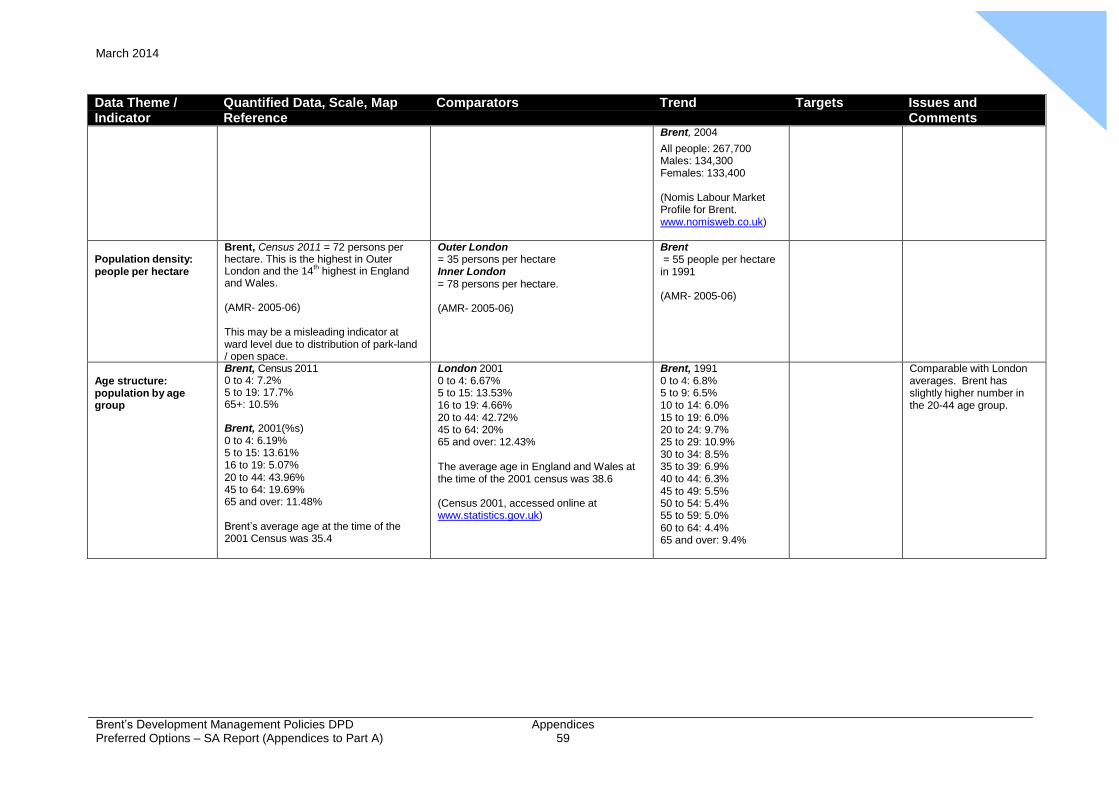
Appendix
5 March 2014
Brent’s Development Management Policies DPD Preferred Options – SA Report (Appendices to Part A)
Appendices 59
Data Theme / Quantified Data, Scale, Map Comparators Trend Targets Issues and Indicator Reference Comments
Brent, 2004
All people: 267,700 Males: 134,300 Females: 133,400
(Nomis Labour Market Profile for Brent. www.nomisweb.co.uk)
Population density: people per hectare
Brent, Census 2011 = 72 persons per hectare. This is the highest in Outer London and the 14
th highest in England
and Wales.
(AMR- 2005-06)
This may be a misleading indicator at ward level due to distribution of park-land / open space.
Outer London = 35 persons per hectare Inner London = 78 persons per hectare.
(AMR- 2005-06)
Brent = 55 people per hectare in 1991
(AMR- 2005-06)
Age structure: population by age group
Brent, Census 2011 0 to 4: 7.2% 5 to 19: 17.7% 65+: 10.5% Brent, 2001(%s) 0 to 4: 6.19% 5 to 15: 13.61% 16 to 19: 5.07% 20 to 44: 43.96% 45 to 64: 19.69% 65 and over: 11.48%
Brent’s average age at the time of the 2001 Census was 35.4
(Census 2001, accessed online at www.statistics.gov.uk)
The ‘age pyramid’ of Brent has been included in Section 3, Part A (Figure 9).
London 2001 0 to 4: 6.67% 5 to 15: 13.53% 16 to 19: 4.66% 20 to 44: 42.72% 45 to 64: 20% 65 and over: 12.43%
The average age in England and Wales at the time of the 2001 census was 38.6
(Census 2001, accessed online at www.statistics.gov.uk)
Brent, 1991 0 to 4: 6.8% 5 to 9: 6.5% 10 to 14: 6.0% 15 to 19: 6.0% 20 to 24: 9.7% 25 to 29: 10.9% 30 to 34: 8.5% 35 to 39: 6.9% 40 to 44: 6.3% 45 to 49: 5.5% 50 to 54: 5.4% 55 to 59: 5.0% 60 to 64: 4.4% 65 and over: 9.4%
Comparable with London averages. Brent has slightly higher number in the 20-44 age group.
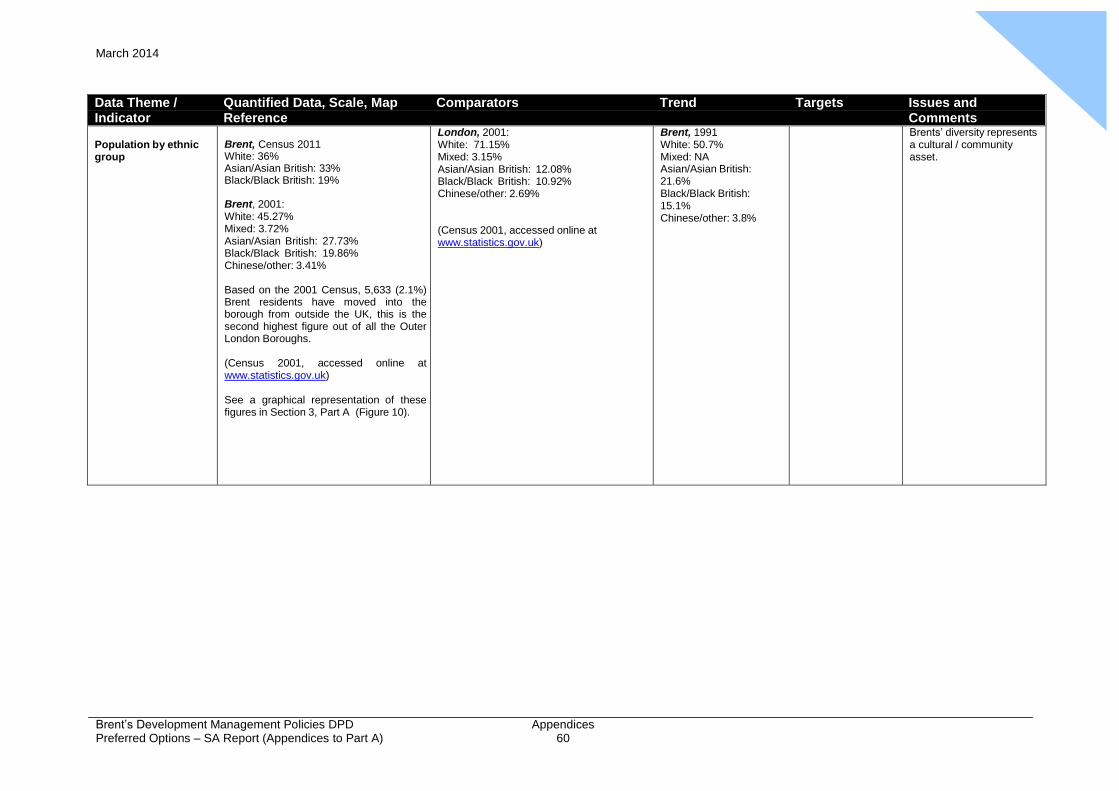
Appendix
5 March 2014
Brent’s Development Management Policies DPD Preferred Options – SA Report (Appendices to Part A)
Appendices 60
Data Theme / Quantified Data, Scale, Map Comparators Trend Targets Issues and Indicator Reference Comments
Population by ethnic group
Brent, Census 2011 White: 36% Asian/Asian British: 33% Black/Black British: 19% Brent, 2001: White: 45.27% Mixed: 3.72% Asian/Asian British: 27.73% Black/Black British: 19.86% Chinese/other: 3.41%
Based on the 2001 Census, 5,633 (2.1%) Brent residents have moved into the borough from outside the UK, this is the second highest figure out of all the Outer London Boroughs.
(Census 2001, accessed online at www.statistics.gov.uk)
See a graphical representation of these figures in Section 3, Part A (Figure 10).
London, 2001: White: 71.15% Mixed: 3.15% Asian/Asian British: 12.08% Black/Black British: 10.92% Chinese/other: 2.69%
(Census 2001, accessed online at www.statistics.gov.uk)
Brent, 1991 White: 50.7% Mixed: NA Asian/Asian British: 21.6% Black/Black British: 15.1% Chinese/other: 3.8%
Brents’ diversity represents a cultural / community asset.
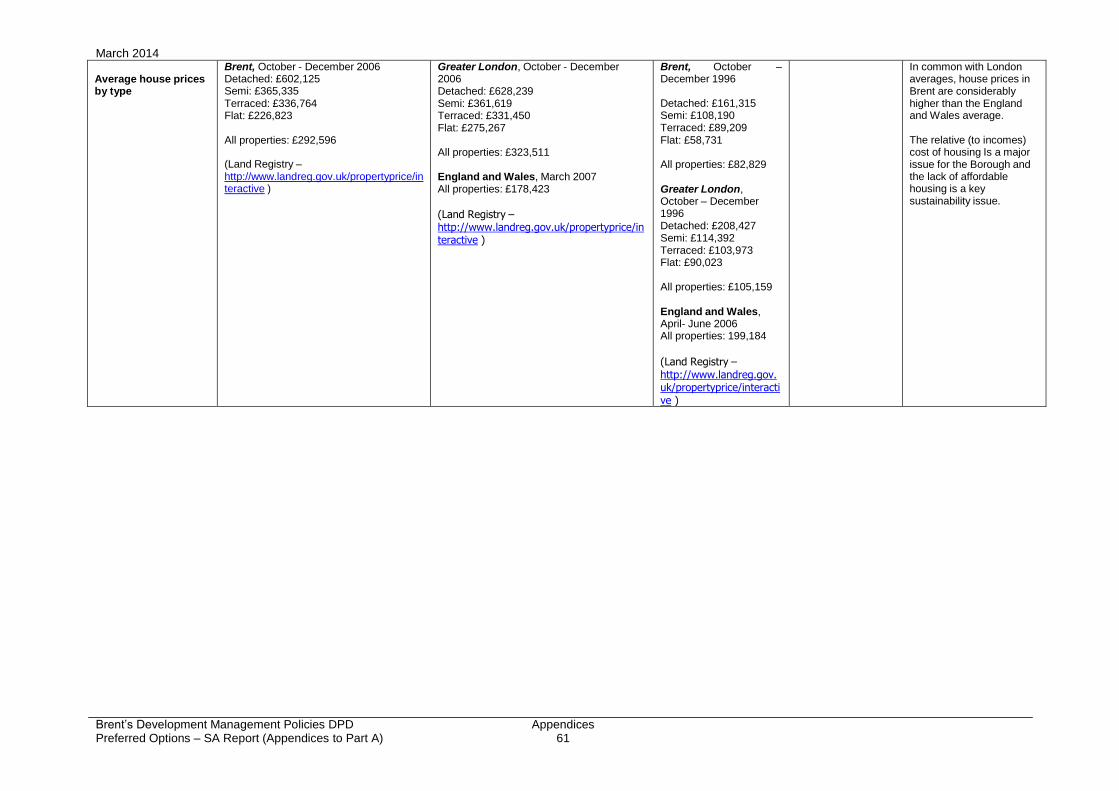
Appendix
5 March 2014
Brent’s Development Management Policies DPD Preferred Options – SA Report (Appendices to Part A)
Appendices 61
Average house prices by type
Brent, October - December 2006 Detached: £602,125 Semi: £365,335 Terraced: £336,764 Flat: £226,823
All properties: £292,596
(Land Registry – http://www.landreg.gov.uk/propertyprice/in teractive )
Greater London, October - December 2006 Detached: £628,239 Semi: £361,619 Terraced: £331,450 Flat: £275,267
All properties: £323,511
England and Wales, March 2007 All properties: £178,423
(Land Registry – http://www.landreg.gov.uk/propertyprice/in teractive )
Brent, October – December 1996
Detached: £161,315 Semi: £108,190 Terraced: £89,209 Flat: £58,731
All properties: £82,829
Greater London, October – December 1996 Detached: £208,427 Semi: £114,392 Terraced: £103,973 Flat: £90,023
All properties: £105,159
England and Wales, April- June 2006 All properties: 199,184
(Land Registry – http://www.landreg.gov. uk/propertyprice/interacti ve )
In common with London averages, house prices in Brent are considerably higher than the England and Wales average.
The relative (to incomes) cost of housing Is a major issue for the Borough and the lack of affordable housing is a key sustainability issue.
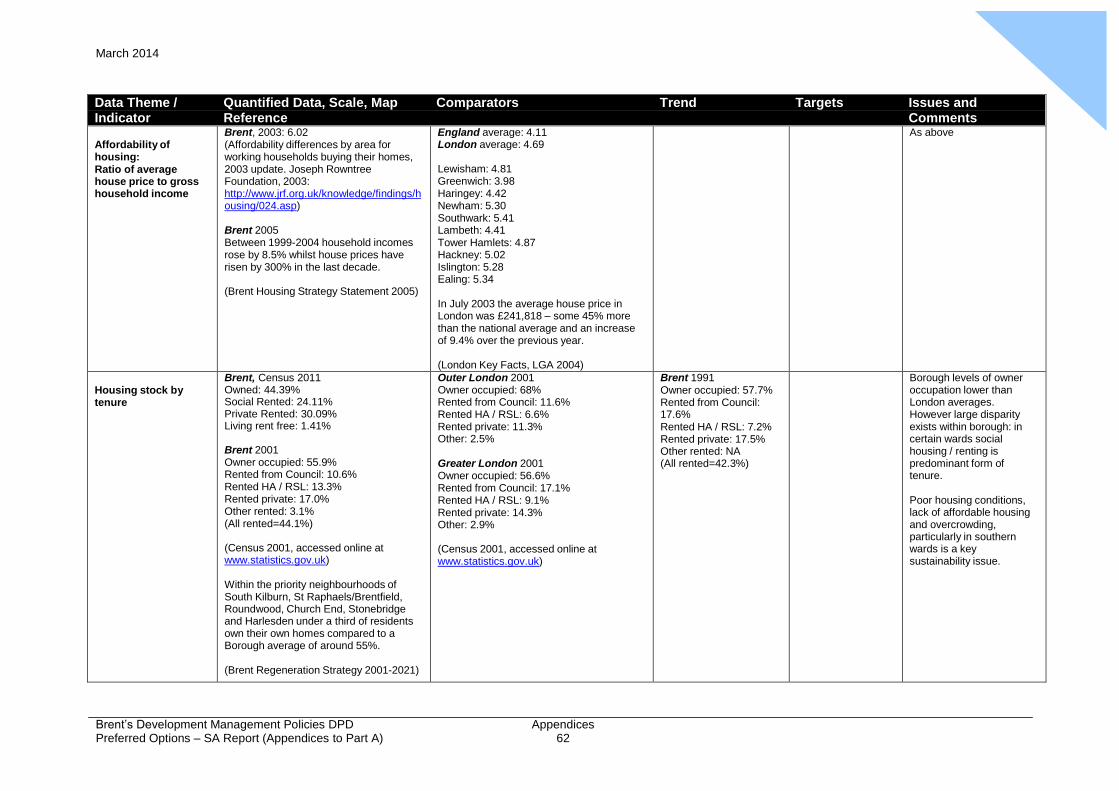
Appendix
5 March 2014
Brent’s Development Management Policies DPD Preferred Options – SA Report (Appendices to Part A)
Appendices 62
Data Theme / Quantified Data, Scale, Map Comparators Trend Targets Issues and Indicator Reference Comments
Affordability of housing: Ratio of average house price to gross household income
Brent, 2003: 6.02 (Affordability differences by area for working households buying their homes, 2003 update. Joseph Rowntree Foundation, 2003: http://www.jrf.org.uk/knowledge/findings/h ousing/024.asp)
Brent 2005 Between 1999-2004 household incomes rose by 8.5% whilst house prices have risen by 300% in the last decade.
(Brent Housing Strategy Statement 2005)
England average: 4.11 London average: 4.69
Lewisham: 4.81 Greenwich: 3.98 Haringey: 4.42 Newham: 5.30 Southwark: 5.41 Lambeth: 4.41 Tower Hamlets: 4.87 Hackney: 5.02 Islington: 5.28 Ealing: 5.34
In July 2003 the average house price in London was £241,818 – some 45% more than the national average and an increase of 9.4% over the previous year.
(London Key Facts, LGA 2004)
As above
Housing stock by tenure
Brent, Census 2011 Owned: 44.39% Social Rented: 24.11% Private Rented: 30.09% Living rent free: 1.41% Brent 2001 Owner occupied: 55.9% Rented from Council: 10.6% Rented HA / RSL: 13.3% Rented private: 17.0% Other rented: 3.1% (All rented=44.1%)
(Census 2001, accessed online at www.statistics.gov.uk)
Within the priority neighbourhoods of South Kilburn, St Raphaels/Brentfield, Roundwood, Church End, Stonebridge and Harlesden under a third of residents own their own homes compared to a Borough average of around 55%.
(Brent Regeneration Strategy 2001-2021)
For maps showing tenure in the Borough see Figures 11, 12 and 13 in Section 3 of Part A.
Outer London 2001 Owner occupied: 68% Rented from Council: 11.6% Rented HA / RSL: 6.6% Rented private: 11.3% Other: 2.5%
Greater London 2001 Owner occupied: 56.6% Rented from Council: 17.1% Rented HA / RSL: 9.1% Rented private: 14.3% Other: 2.9%
(Census 2001, accessed online at www.statistics.gov.uk)
Brent 1991 Owner occupied: 57.7% Rented from Council: 17.6% Rented HA / RSL: 7.2% Rented private: 17.5% Other rented: NA (All rented=42.3%)
Borough levels of owner occupation lower than London averages. However large disparity exists within borough: in certain wards social housing / renting is predominant form of tenure.
Poor housing conditions, lack of affordable housing and overcrowding, particularly in southern wards is a key sustainability issue.
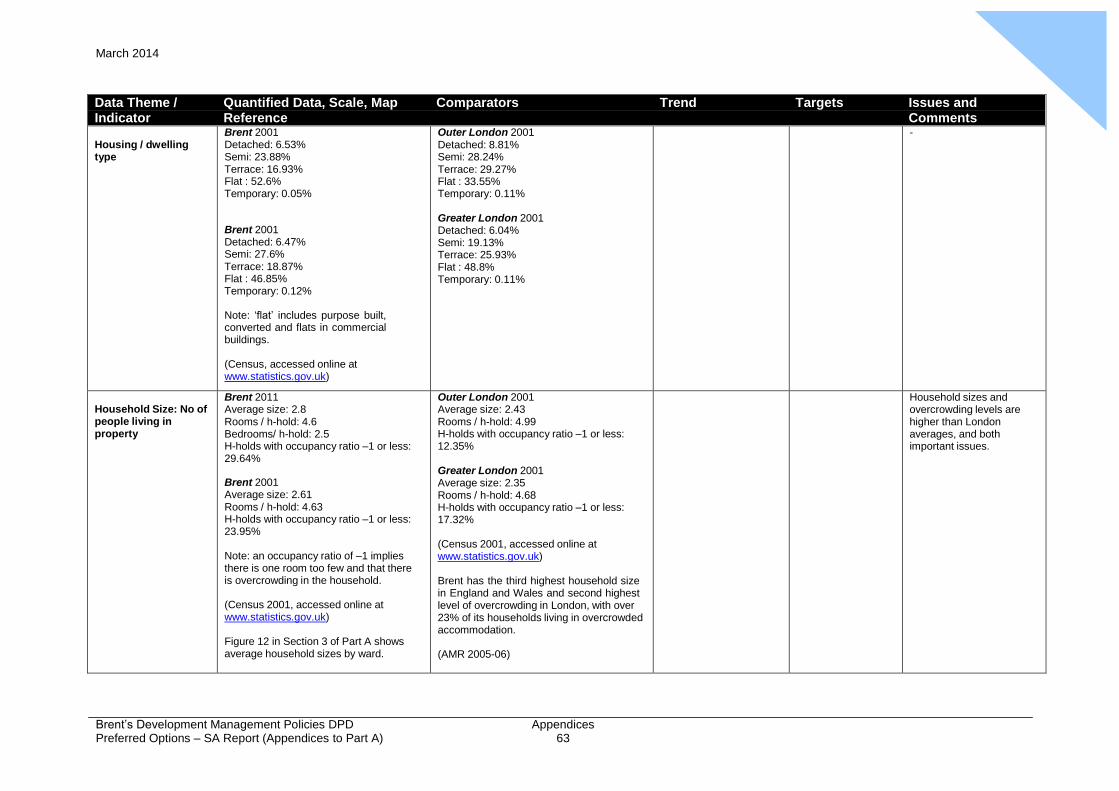
Appendix
5 March 2014
Brent’s Development Management Policies DPD Preferred Options – SA Report (Appendices to Part A)
Appendices 63
Data Theme / Quantified Data, Scale, Map Comparators Trend Targets Issues and Indicator Reference Comments
Housing / dwelling type
Brent 2001 Detached: 6.53% Semi: 23.88% Terrace: 16.93% Flat : 52.6% Temporary: 0.05% Brent 2001 Detached: 6.47% Semi: 27.6% Terrace: 18.87% Flat : 46.85% Temporary: 0.12%
Note: ‘flat’ includes purpose built, converted and flats in commercial buildings.
(Census, accessed online at www.statistics.gov.uk)
Outer London 2001 Detached: 8.81% Semi: 28.24% Terrace: 29.27% Flat : 33.55% Temporary: 0.11%
Greater London 2001 Detached: 6.04% Semi: 19.13% Terrace: 25.93% Flat : 48.8% Temporary: 0.11%
-
Household Size: No of people living in property
Brent 2011 Average size: 2.8 Rooms / h-hold: 4.6 Bedrooms/ h-hold: 2.5 H-holds with occupancy ratio –1 or less: 29.64% Brent 2001 Average size: 2.61 Rooms / h-hold: 4.63 H-holds with occupancy ratio –1 or less: 23.95%
Note: an occupancy ratio of –1 implies there is one room too few and that there is overcrowding in the household.
(Census 2001, accessed online at www.statistics.gov.uk)
Figure 12 in Section 3 of Part A shows average household sizes by ward.
Outer London 2001 Average size: 2.43 Rooms / h-hold: 4.99 H-holds with occupancy ratio –1 or less: 12.35%
Greater London 2001 Average size: 2.35 Rooms / h-hold: 4.68 H-holds with occupancy ratio –1 or less: 17.32%
(Census 2001, accessed online at www.statistics.gov.uk)
Brent has the third highest household size in England and Wales and second highest level of overcrowding in London, with over 23% of its households living in overcrowded accommodation.
(AMR 2005-06)
Household sizes and overcrowding levels are higher than London averages, and both important issues.
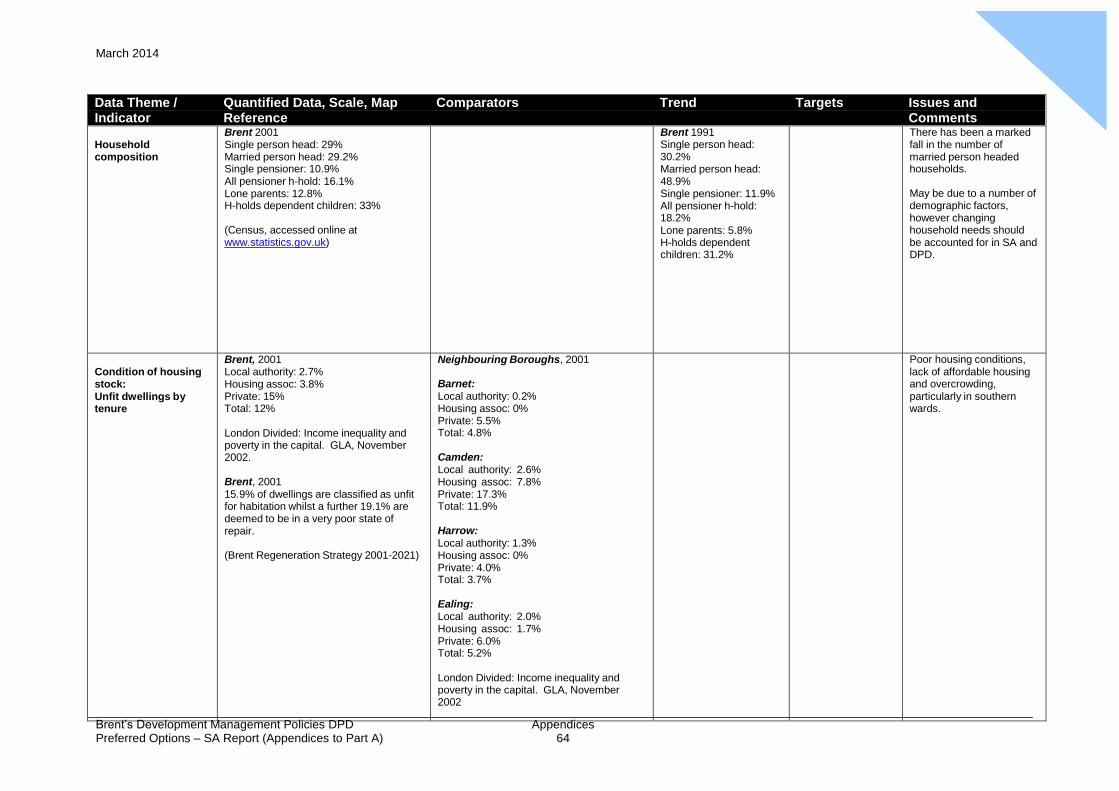
Appendix
5 March 2014
Brent’s Development Management Policies DPD Preferred Options – SA Report (Appendices to Part A)
Appendices 64
Data Theme / Quantified Data, Scale, Map Comparators Trend Targets Issues and Indicator Reference Comments
Household composition
Brent 2001 Single person head: 29% Married person head: 29.2% Single pensioner: 10.9% All pensioner h-hold: 16.1% Lone parents: 12.8% H-holds dependent children: 33%
(Census, accessed online at www.statistics.gov.uk)
Brent 1991 Single person head: 30.2% Married person head: 48.9% Single pensioner: 11.9% All pensioner h-hold: 18.2% Lone parents: 5.8% H-holds dependent children: 31.2%
There has been a marked fall in the number of married person headed households.
May be due to a number of demographic factors, however changing household needs should be accounted for in SA and DPD.
Condition of housing stock: Unfit dwellings by tenure
Brent, 2001 Local authority: 2.7% Housing assoc: 3.8% Private: 15% Total: 12%
London Divided: Income inequality and poverty in the capital. GLA, November 2002.
Brent, 2001 15.9% of dwellings are classified as unfit for habitation whilst a further 19.1% are deemed to be in a very poor state of repair.
(Brent Regeneration Strategy 2001-2021)
Neighbouring Boroughs, 2001
Barnet: Local authority: 0.2% Housing assoc: 0% Private: 5.5% Total: 4.8%
Camden: Local authority: 2.6% Housing assoc: 7.8% Private: 17.3% Total: 11.9%
Harrow: Local authority: 1.3% Housing assoc: 0% Private: 4.0% Total: 3.7%
Ealing: Local authority: 2.0% Housing assoc: 1.7% Private: 6.0% Total: 5.2%
London Divided: Income inequality and poverty in the capital. GLA, November 2002
Poor housing conditions, lack of affordable housing and overcrowding, particularly in southern wards.
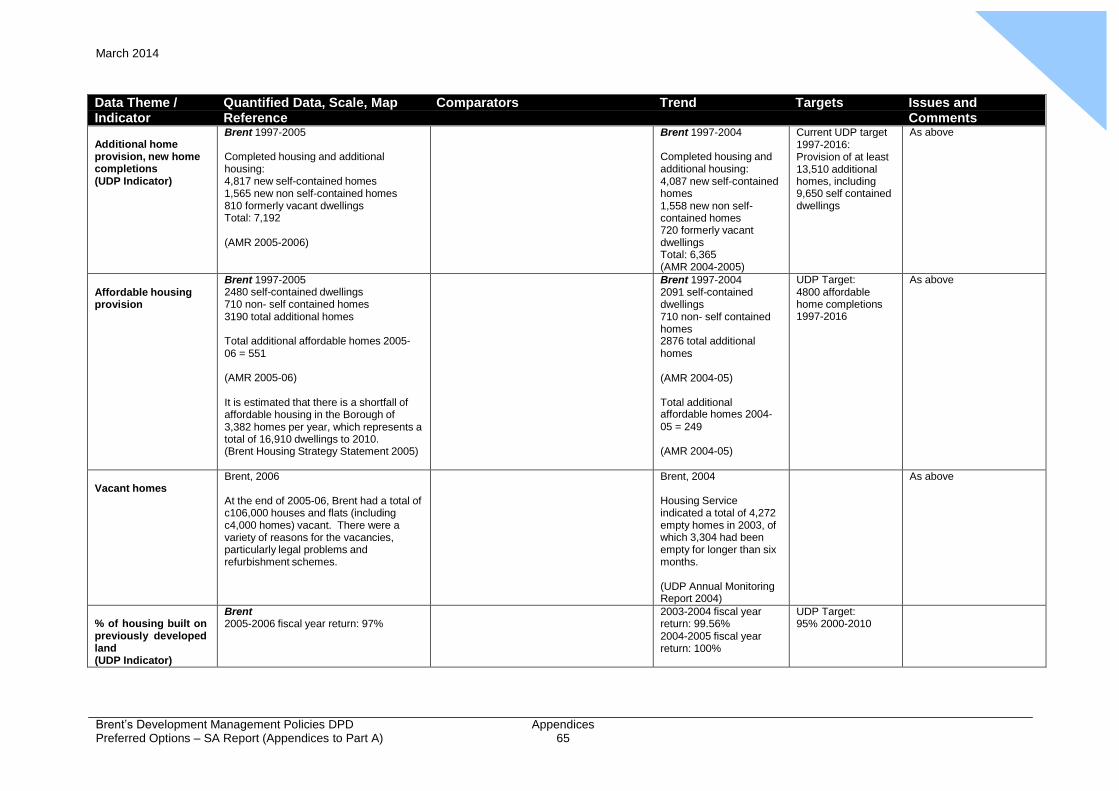
Appendix
5 March 2014
Brent’s Development Management Policies DPD Preferred Options – SA Report (Appendices to Part A)
Appendices 65
Data Theme / Quantified Data, Scale, Map Comparators Trend Targets Issues and Indicator Reference Comments
Additional home provision, new home completions (UDP Indicator)
Brent 1997-2005
Completed housing and additional housing: 4,817 new self-contained homes 1,565 new non self-contained homes 810 formerly vacant dwellings Total: 7,192
(AMR 2005-2006)
Brent 1997-2004
Completed housing and additional housing: 4,087 new self-contained homes 1,558 new non self- contained homes 720 formerly vacant dwellings Total: 6,365 (AMR 2004-2005)
Current UDP target 1997-2016: Provision of at least 13,510 additional homes, including 9,650 self contained dwellings
As above
Affordable housing provision
Brent 1997-2005 2480 self-contained dwellings 710 non- self contained homes 3190 total additional homes
Total additional affordable homes 2005- 06 = 551
(AMR 2005-06)
It is estimated that there is a shortfall of affordable housing in the Borough of 3,382 homes per year, which represents a total of 16,910 dwellings to 2010. (Brent Housing Strategy Statement 2005)
Brent 1997-2004 2091 self-contained dwellings 710 non- self contained homes 2876 total additional homes
(AMR 2004-05)
Total additional affordable homes 2004- 05 = 249
(AMR 2004-05)
UDP Target: 4800 affordable home completions 1997-2016
As above
Vacant homes
Brent, 2006
At the end of 2005-06, Brent had a total of c106,000 houses and flats (including c4,000 homes) vacant. There were a variety of reasons for the vacancies, particularly legal problems and refurbishment schemes.
Brent, 2004
Housing Service indicated a total of 4,272 empty homes in 2003, of which 3,304 had been empty for longer than six months.
(UDP Annual Monitoring Report 2004)
As above
% of housing built on previously developed land (UDP Indicator)
Brent 2005-2006 fiscal year return: 97%
2003-2004 fiscal year return: 99.56% 2004-2005 fiscal year return: 100%
UDP Target: 95% 2000-2010
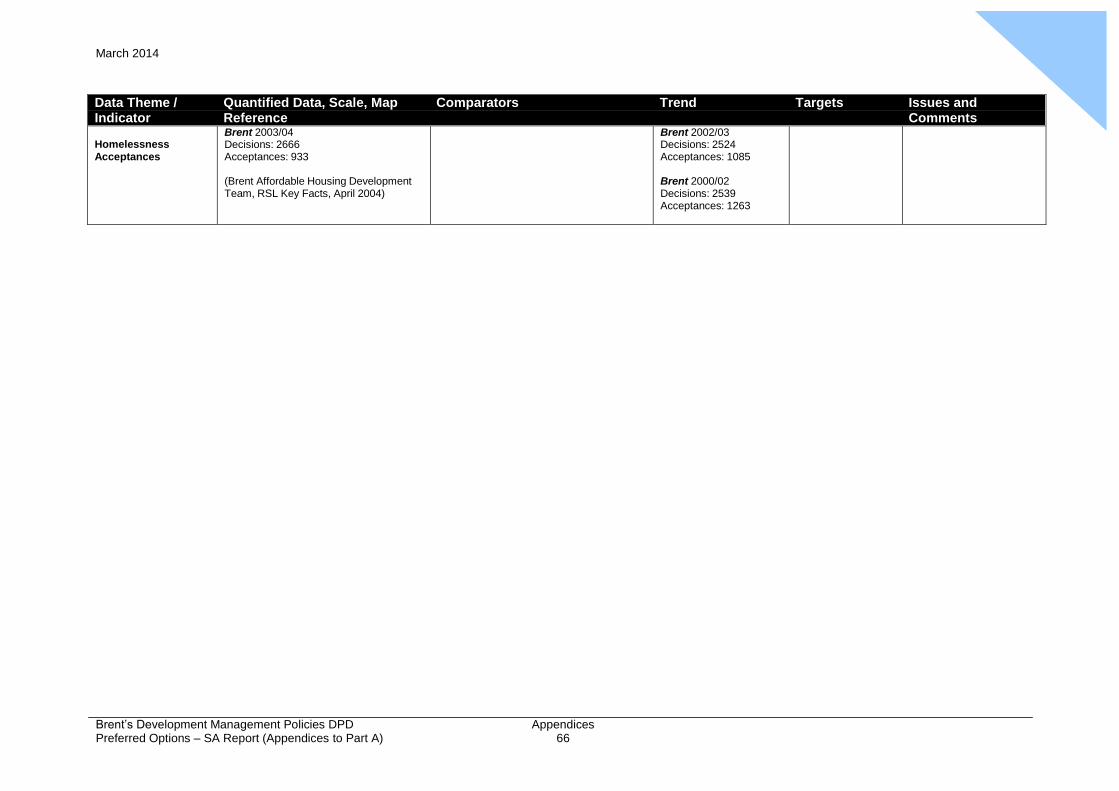
Appendix
5 March 2014
Brent’s Development Management Policies DPD Preferred Options – SA Report (Appendices to Part A)
Appendices 66
Data Theme / Quantified Data, Scale, Map Comparators Trend Targets Issues and Indicator Reference Comments
Homelessness Acceptances
Brent 2003/04 Decisions: 2666 Acceptances: 933
(Brent Affordable Housing Development Team, RSL Key Facts, April 2004)
Brent 2002/03 Decisions: 2524 Acceptances: 1085
Brent 2000/02 Decisions: 2539 Acceptances: 1263
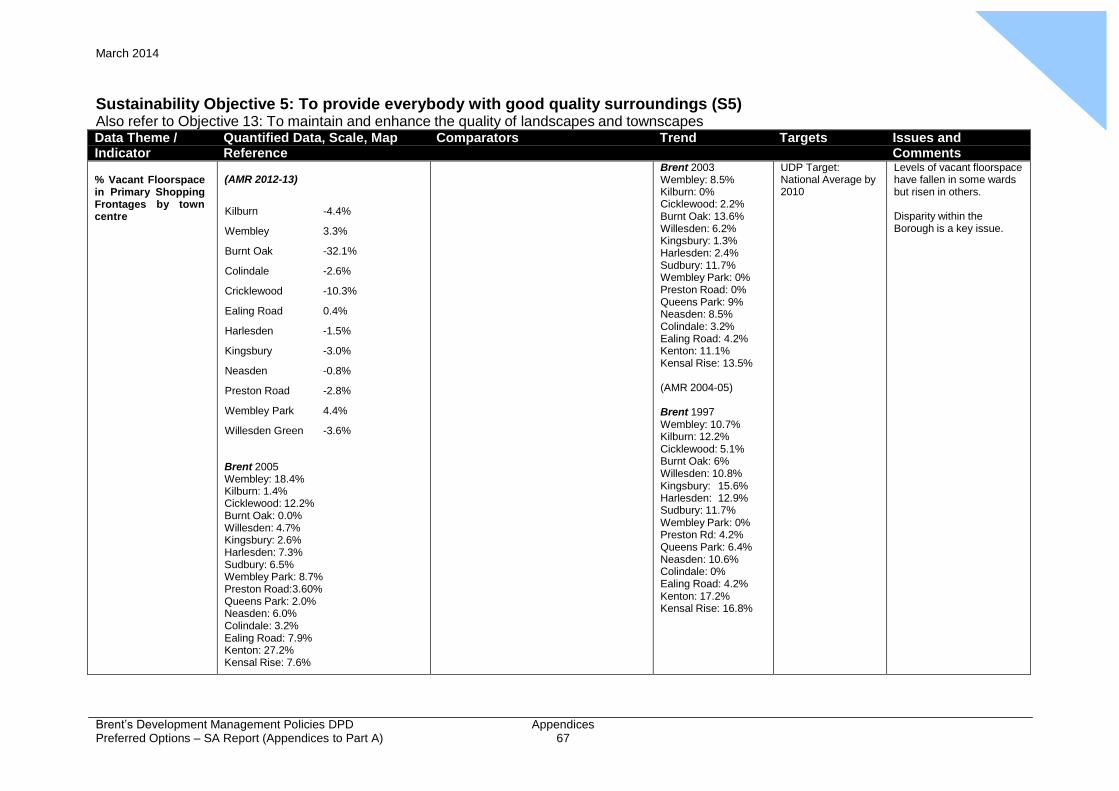
Appendix
5 March 2014
Brent’s Development Management Policies DPD Preferred Options – SA Report (Appendices to Part A)
Appendices 67
Sustainability Objective 5: To provide everybody with good quality surroundings (S5) Also refer to Objective 13: To maintain and enhance the quality of landscapes and townscapes Data Theme / Quantified Data, Scale, Map Comparators Trend Targets Issues and Indicator Reference Comments
% Vacant Floorspace in Primary Shopping Frontages by town centre
(AMR 2012-13)
Kilburn -4.4%
Wembley 3.3%
Burnt Oak -32.1%
Colindale -2.6%
Cricklewood -10.3%
Ealing Road 0.4%
Harlesden -1.5%
Kingsbury -3.0%
Neasden -0.8%
Preston Road -2.8%
Wembley Park 4.4%
Willesden Green -3.6%
Brent 2005 Wembley: 18.4% Kilburn: 1.4% Cicklewood: 12.2% Burnt Oak: 0.0% Willesden: 4.7% Kingsbury: 2.6% Harlesden: 7.3% Sudbury: 6.5% Wembley Park: 8.7% Preston Road:3.60% Queens Park: 2.0% Neasden: 6.0% Colindale: 3.2% Ealing Road: 7.9% Kenton: 27.2% Kensal Rise: 7.6%
(AMR 2005-06)
Brent 2003 Wembley: 8.5% Kilburn: 0% Cicklewood: 2.2% Burnt Oak: 13.6% Willesden: 6.2% Kingsbury: 1.3% Harlesden: 2.4% Sudbury: 11.7% Wembley Park: 0% Preston Road: 0% Queens Park: 9% Neasden: 8.5% Colindale: 3.2% Ealing Road: 4.2% Kenton: 11.1% Kensal Rise: 13.5%
(AMR 2004-05)
Brent 1997 Wembley: 10.7% Kilburn: 12.2% Cicklewood: 5.1% Burnt Oak: 6% Willesden: 10.8% Kingsbury: 15.6% Harlesden: 12.9% Sudbury: 11.7% Wembley Park: 0% Preston Rd: 4.2% Queens Park: 6.4% Neasden: 10.6% Colindale: 0% Ealing Road: 4.2% Kenton: 17.2% Kensal Rise: 16.8%
UDP Target: National Average by 2010
Levels of vacant floorspace have fallen in some wards but risen in others.
Disparity within the Borough is a key issue.
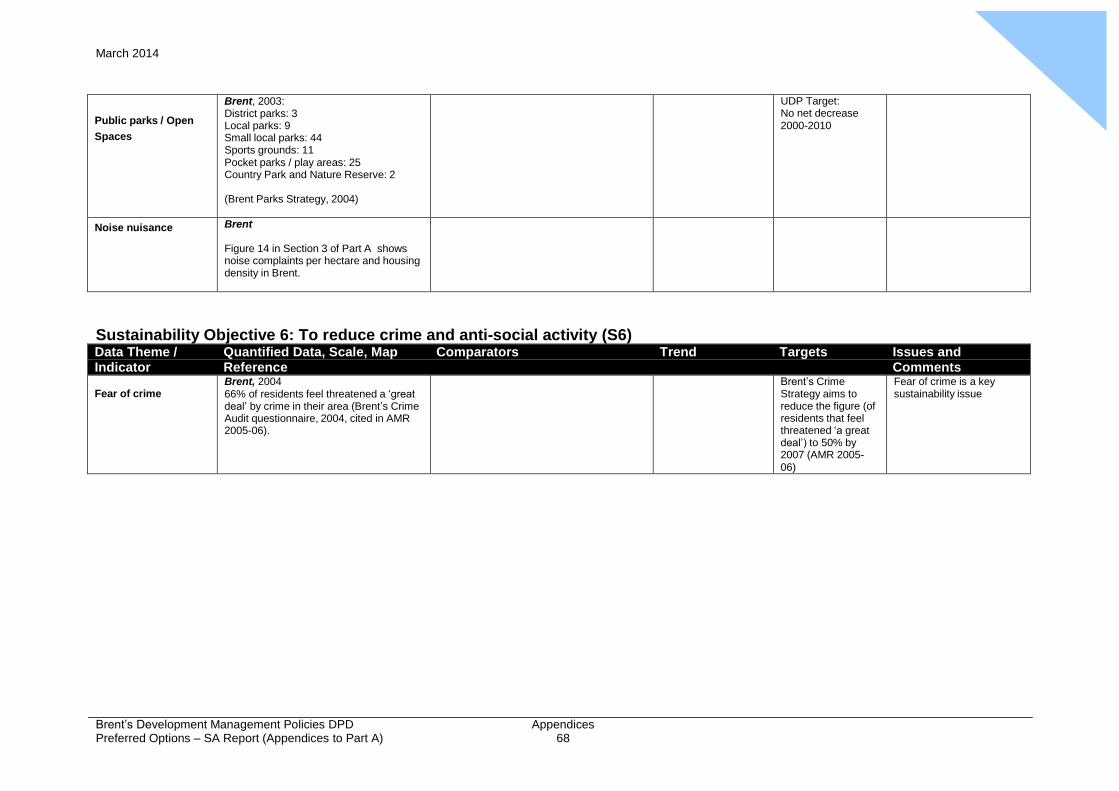
Appendix
5 March 2014
Brent’s Development Management Policies DPD Preferred Options – SA Report (Appendices to Part A)
Appendices 68
Public parks / Open
Spaces
Brent, 2003: District parks: 3 Local parks: 9 Small local parks: 44 Sports grounds: 11 Pocket parks / play areas: 25 Country Park and Nature Reserve: 2
(Brent Parks Strategy, 2004)
UDP Target: No net decrease 2000-2010
Noise nuisance Brent
Figure 14 in Section 3 of Part A shows noise complaints per hectare and housing density in Brent.
Sustainability Objective 6: To reduce crime and anti-social activity (S6) Data Theme / Quantified Data, Scale, Map Comparators Trend Targets Issues and Indicator Reference Comments
Fear of crime
Brent, 2004 66% of residents feel threatened a ‘great deal’ by crime in their area (Brent’s Crime Audit questionnaire, 2004, cited in AMR 2005-06).
Brent’s Crime Strategy aims to reduce the figure (of residents that feel threatened ‘a great deal’) to 50% by 2007 (AMR 2005- 06)
Fear of crime is a key sustainability issue
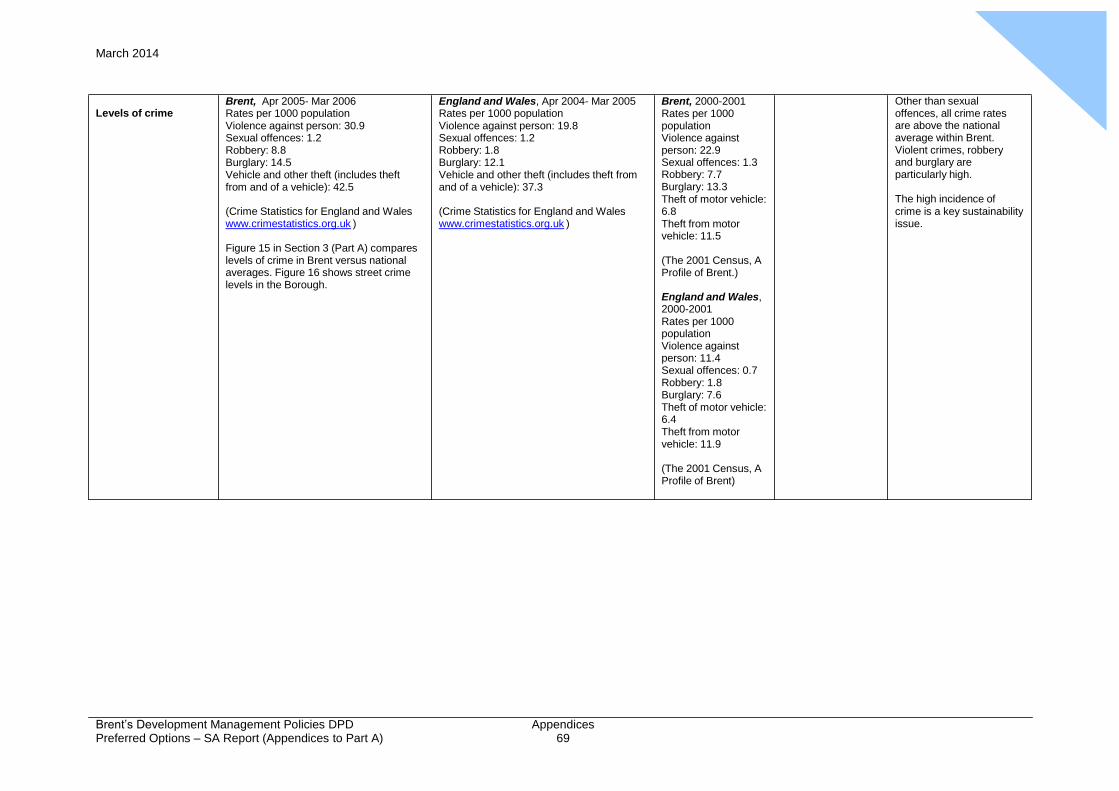
Appendix
5 March 2014
Brent’s Development Management Policies DPD Preferred Options – SA Report (Appendices to Part A)
Appendices 69
Levels of crime Brent, Apr 2005- Mar 2006 Rates per 1000 population Violence against person: 30.9 Sexual offences: 1.2 Robbery: 8.8 Burglary: 14.5 Vehicle and other theft (includes theft from and of a vehicle): 42.5 (Crime Statistics for England and Wales www.crimestatistics.org.uk ) Figure 15 in Section 3 (Part A) compares levels of crime in Brent versus national averages. Figure 16 shows street crime levels in the Borough.
England and Wales, Apr 2004- Mar 2005 Rates per 1000 population Violence against person: 19.8 Sexual offences: 1.2 Robbery: 1.8 Burglary: 12.1 Vehicle and other theft (includes theft from and of a vehicle): 37.3 (Crime Statistics for England and Wales www.crimestatistics.org.uk )
Brent, 2000-2001 Rates per 1000 population Violence against person: 22.9 Sexual offences: 1.3 Robbery: 7.7 Burglary: 13.3 Theft of motor vehicle: 6.8 Theft from motor vehicle: 11.5 (The 2001 Census, A Profile of Brent.) England and Wales, 2000-2001 Rates per 1000 population Violence against person: 11.4 Sexual offences: 0.7 Robbery: 1.8 Burglary: 7.6 Theft of motor vehicle: 6.4 Theft from motor vehicle: 11.9 (The 2001 Census, A Profile of Brent)
Other than sexual offences, all crime rates are above the national average within Brent. Violent crimes, robbery and burglary are particularly high. The high incidence of crime is a key sustainability issue.
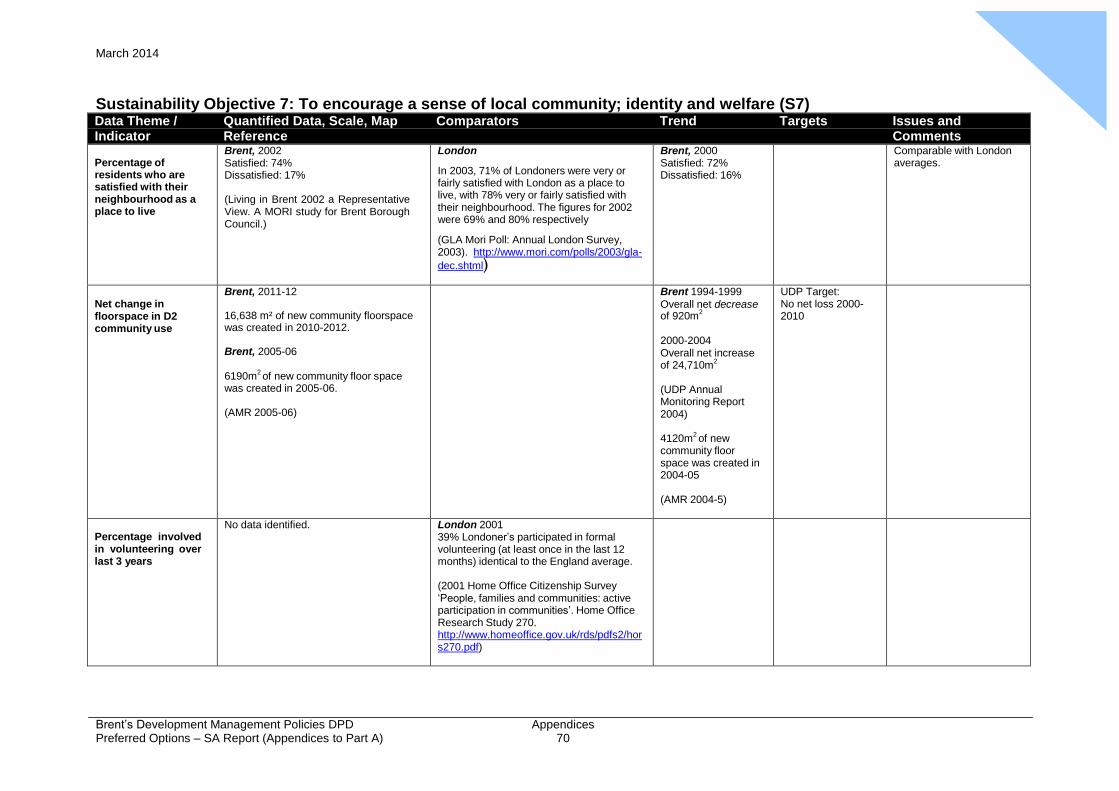
Appendix
5 March 2014
Brent’s Development Management Policies DPD Preferred Options – SA Report (Appendices to Part A)
Appendices 70
Sustainability Objective 7: To encourage a sense of local community; identity and welfare (S7) Data Theme / Quantified Data, Scale, Map Comparators Trend Targets Issues and Indicator Reference Comments
Percentage of residents who are satisfied with their neighbourhood as a place to live
Brent, 2002 Satisfied: 74% Dissatisfied: 17%
(Living in Brent 2002 a Representative View. A MORI study for Brent Borough Council.)
London
In 2003, 71% of Londoners were very or fairly satisfied with London as a place to live, with 78% very or fairly satisfied with their neighbourhood. The figures for 2002 were 69% and 80% respectively
(GLA Mori Poll: Annual London Survey, 2003). http://www.mori.com/polls/2003/gla-
dec.shtml)
Brent, 2000 Satisfied: 72% Dissatisfied: 16%
Comparable with London averages.
Net change in floorspace in D2 community use
Brent, 2011-12 16,638 m² of new community floorspace was created in 2010-2012. Brent, 2005-06
6190m
2 of new community floor space
was created in 2005-06.
(AMR 2005-06)
Brent 1994-1999
Overall net decrease of 920m
2
2000-2004 Overall net increase of 24,710m
2
(UDP Annual Monitoring Report 2004)
4120m2 of new
community floor space was created in 2004-05
(AMR 2004-5)
UDP Target: No net loss 2000- 2010
Percentage involved in volunteering over last 3 years
No data identified. London 2001 39% Londoner’s participated in formal volunteering (at least once in the last 12 months) identical to the England average.
(2001 Home Office Citizenship Survey ‘People, families and communities: active participation in communities’. Home Office Research Study 270. http://www.homeoffice.gov.uk/rds/pdfs2/hor s270.pdf)
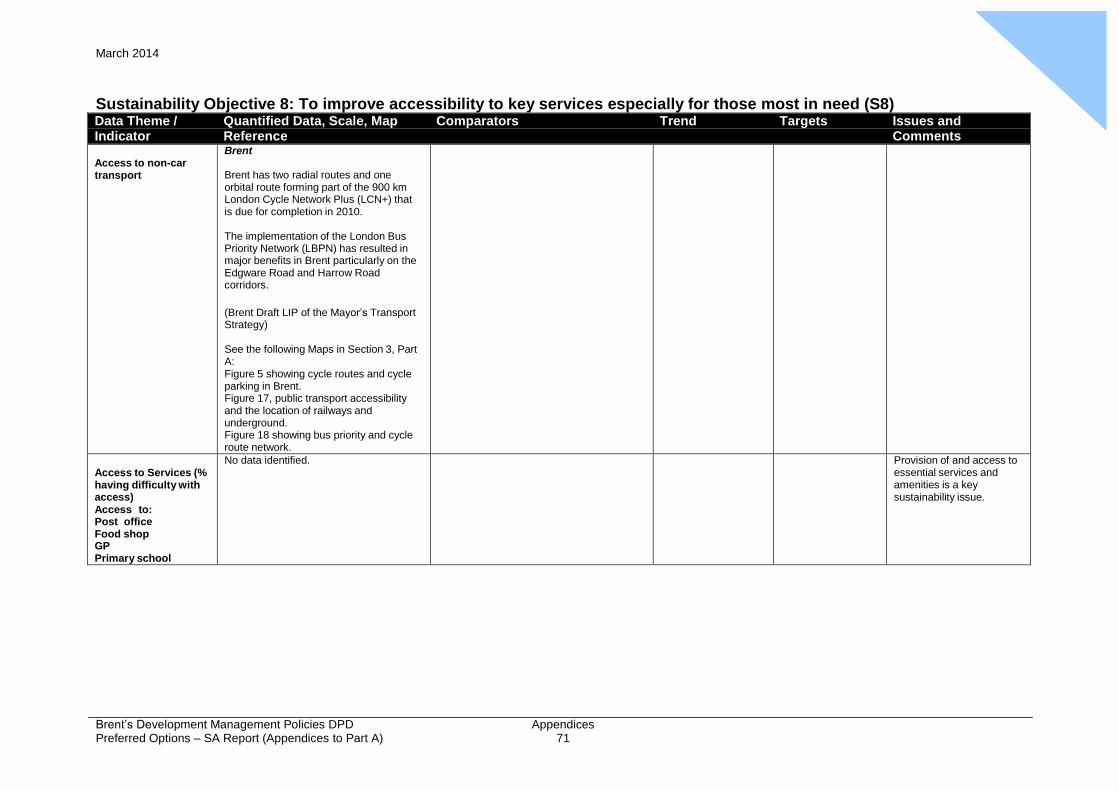
Appendix
5 March 2014
Brent’s Development Management Policies DPD Preferred Options – SA Report (Appendices to Part A)
Appendices 71
Sustainability Objective 8: To improve accessibility to key services especially for those most in need (S8) Data Theme / Quantified Data, Scale, Map Comparators Trend Targets Issues and Indicator Reference Comments
Access to non-car transport
Brent
Brent has two radial routes and one orbital route forming part of the 900 km London Cycle Network Plus (LCN+) that is due for completion in 2010.
The implementation of the London Bus Priority Network (LBPN) has resulted in major benefits in Brent particularly on the Edgware Road and Harrow Road corridors.
(Brent Draft LIP of the Mayor’s Transport Strategy)
See the following Maps in Section 3, Part A: Figure 5 showing cycle routes and cycle parking in Brent. Figure 17, public transport accessibility and the location of railways and underground. Figure 18 showing bus priority and cycle route network.
Access to Services (% having difficulty with access) Access to: Post office Food shop GP Primary school
No data identified. Provision of and access to essential services and amenities is a key sustainability issue.
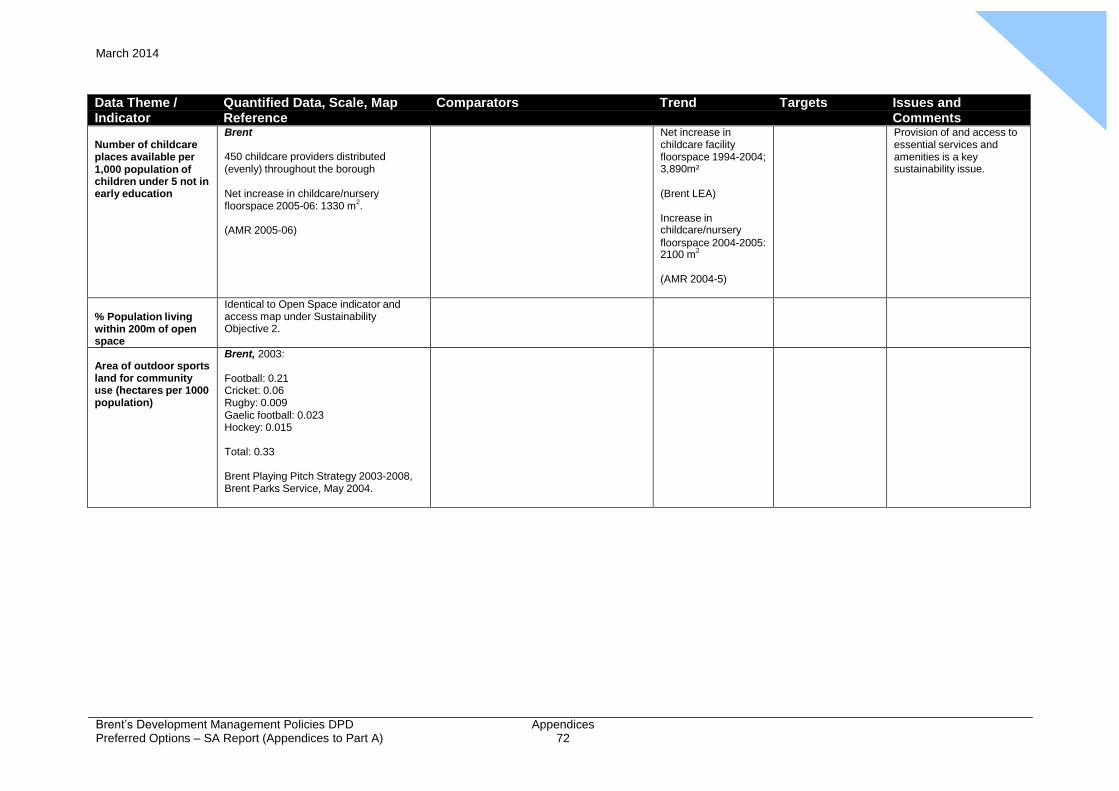
Appendix
5 March 2014
Brent’s Development Management Policies DPD Preferred Options – SA Report (Appendices to Part A)
Appendices 72
Data Theme / Quantified Data, Scale, Map Comparators Trend Targets Issues and Indicator Reference Comments
Number of childcare places available per 1,000 population of children under 5 not in early education
Brent
450 childcare providers distributed (evenly) throughout the borough
Net increase in childcare/nursery floorspace 2005-06: 1330 m
2.
(AMR 2005-06)
Net increase in childcare facility floorspace 1994-2004; 3,890m²
(Brent LEA)
Increase in childcare/nursery floorspace 2004-2005: 2100 m
2
(AMR 2004-5)
Provision of and access to essential services and amenities is a key sustainability issue.
% Population living within 200m of open space
Identical to Open Space indicator and access map under Sustainability Objective 2.
Area of outdoor sports land for community use (hectares per 1000 population)
Brent, 2003:
Football: 0.21 Cricket: 0.06 Rugby: 0.009 Gaelic football: 0.023 Hockey: 0.015
Total: 0.33
Brent Playing Pitch Strategy 2003-2008, Brent Parks Service, May 2004.
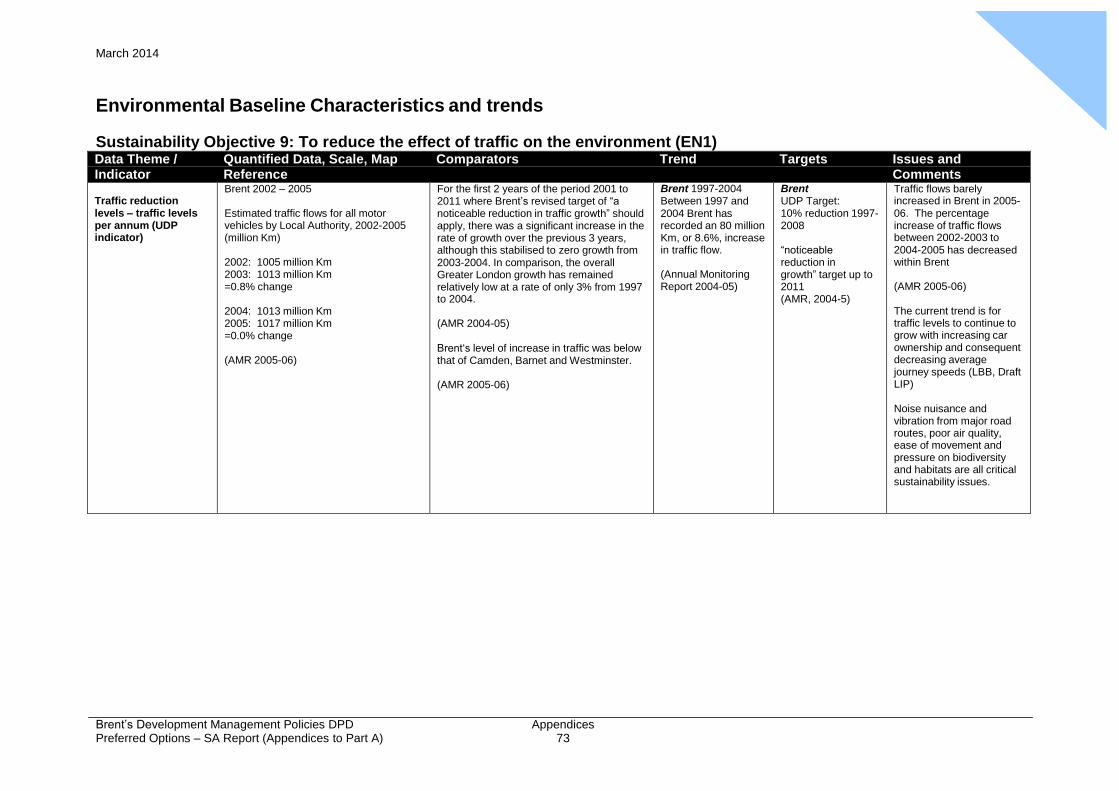
Appendix
5 March 2014
Brent’s Development Management Policies DPD Preferred Options – SA Report (Appendices to Part A)
Appendices 73
Environmental Baseline Characteristics and trends
Sustainability Objective 9: To reduce the effect of traffic on the environment (EN1) Data Theme / Quantified Data, Scale, Map Comparators Trend Targets Issues and Indicator Reference Comments
Traffic reduction levels – traffic levels per annum (UDP indicator)
Brent 2002 – 2005
Estimated traffic flows for all motor vehicles by Local Authority, 2002-2005 (million Km)
2002: 1005 million Km 2003: 1013 million Km =0.8% change
2004: 1013 million Km 2005: 1017 million Km =0.0% change
(AMR 2005-06)
For the first 2 years of the period 2001 to 2011 where Brent’s revised target of “a noticeable reduction in traffic growth” should apply, there was a significant increase in the rate of growth over the previous 3 years, although this stabilised to zero growth from 2003-2004. In comparison, the overall Greater London growth has remained relatively low at a rate of only 3% from 1997 to 2004.
(AMR 2004-05)
Brent‘s level of increase in traffic was below that of Camden, Barnet and Westminster.
(AMR 2005-06)
Brent 1997-2004 Between 1997 and 2004 Brent has recorded an 80 million Km, or 8.6%, increase in traffic flow.
(Annual Monitoring Report 2004-05)
Brent UDP Target: 10% reduction 1997- 2008
“noticeable reduction in growth” target up to 2011 (AMR, 2004-5)
Traffic flows barely increased in Brent in 2005- 06. The percentage increase of traffic flows between 2002-2003 to 2004-2005 has decreased within Brent
(AMR 2005-06)
The current trend is for traffic levels to continue to grow with increasing car ownership and consequent decreasing average journey speeds (LBB, Draft LIP)
Noise nuisance and vibration from major road routes, poor air quality, ease of movement and pressure on biodiversity and habitats are all critical sustainability issues.
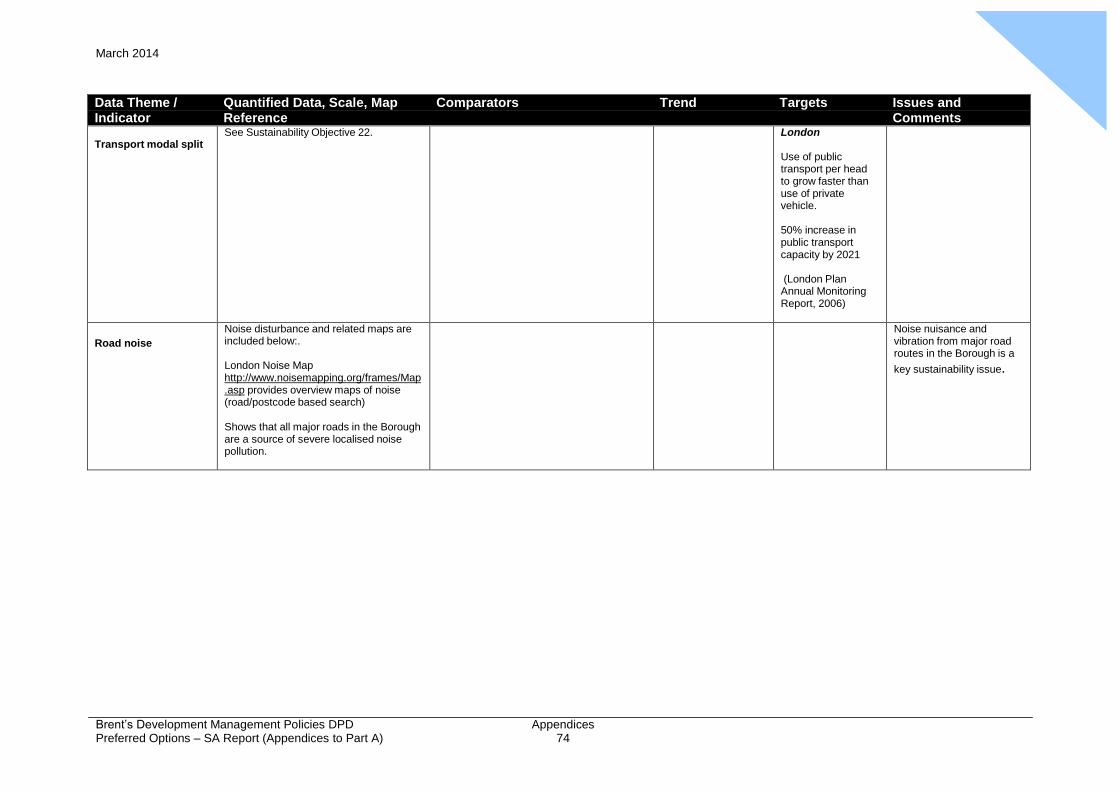
Appendix
5 March 2014
Brent’s Development Management Policies DPD Preferred Options – SA Report (Appendices to Part A)
Appendices 74
Data Theme / Quantified Data, Scale, Map Comparators Trend Targets Issues and Indicator Reference Comments
Transport modal split
See Sustainability Objective 22. London
Use of public transport per head to grow faster than use of private vehicle.
50% increase in public transport capacity by 2021
(London Plan Annual Monitoring Report, 2006)
Road noise
Noise disturbance and related maps are included below:.
London Noise Map http://www.noisemapping.org/frames/Map .asp provides overview maps of noise (road/postcode based search)
Shows that all major roads in the Borough are a source of severe localised noise pollution.
Noise nuisance and vibration from major road routes in the Borough is a
key sustainability issue.
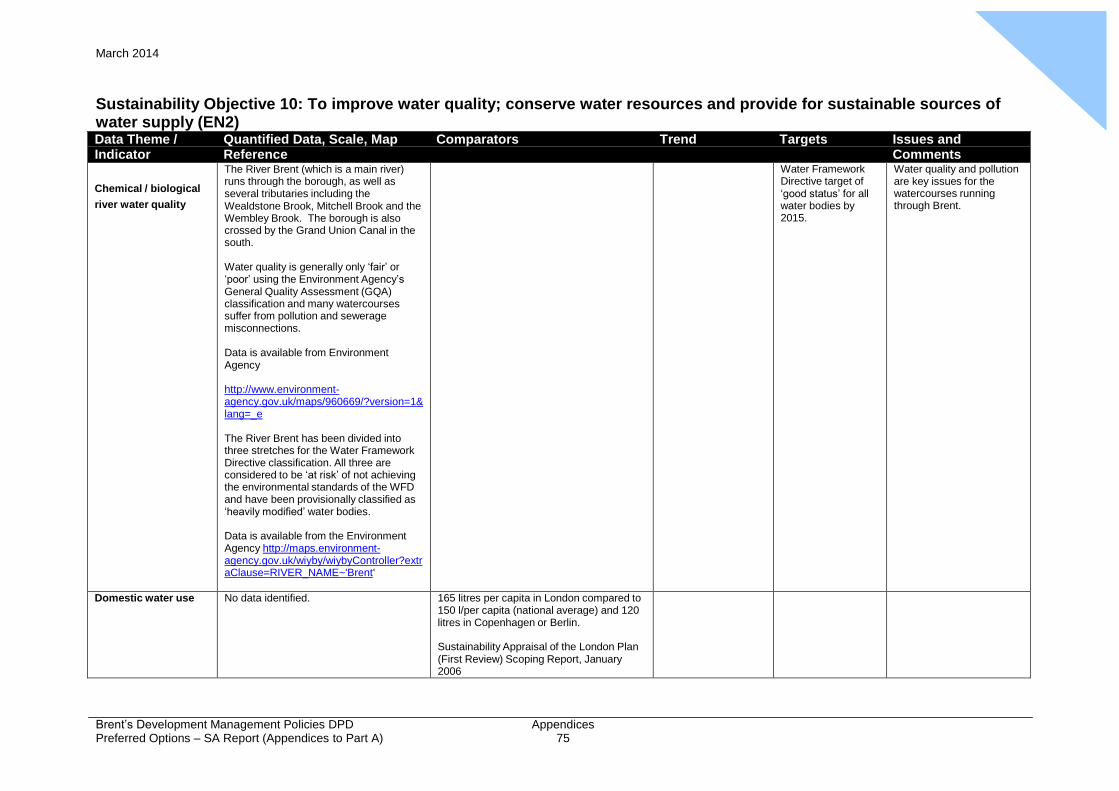
Appendix
5 March 2014
Brent’s Development Management Policies DPD Preferred Options – SA Report (Appendices to Part A)
Appendices 75
Sustainability Objective 10: To improve water quality; conserve water resources and provide for sustainable sources of water supply (EN2) Data Theme / Quantified Data, Scale, Map Comparators Trend Targets Issues and Indicator Reference Comments
Chemical / biological
river water quality
The River Brent (which is a main river) runs through the borough, as well as several tributaries including the Wealdstone Brook, Mitchell Brook and the Wembley Brook. The borough is also crossed by the Grand Union Canal in the south.
Water quality is generally only ‘fair’ or ‘poor’ using the Environment Agency’s General Quality Assessment (GQA) classification and many watercourses suffer from pollution and sewerage misconnections.
Data is available from Environment Agency
http://www.environment- agency.gov.uk/maps/960669/?version=1& lang=_e
The River Brent has been divided into three stretches for the Water Framework Directive classification. All three are considered to be ‘at risk’ of not achieving the environmental standards of the WFD and have been provisionally classified as ‘heavily modified’ water bodies.
Data is available from the Environment Agency http://maps.environment- agency.gov.uk/wiyby/wiybyController?extr aClause=RIVER_NAME~'Brent'
Water Framework Directive target of ‘good status’ for all water bodies by 2015.
Water quality and pollution are key issues for the watercourses running through Brent.
Domestic water use No data identified. 165 litres per capita in London compared to 150 l/per capita (national average) and 120 litres in Copenhagen or Berlin.
Sustainability Appraisal of the London Plan (First Review) Scoping Report, January 2006
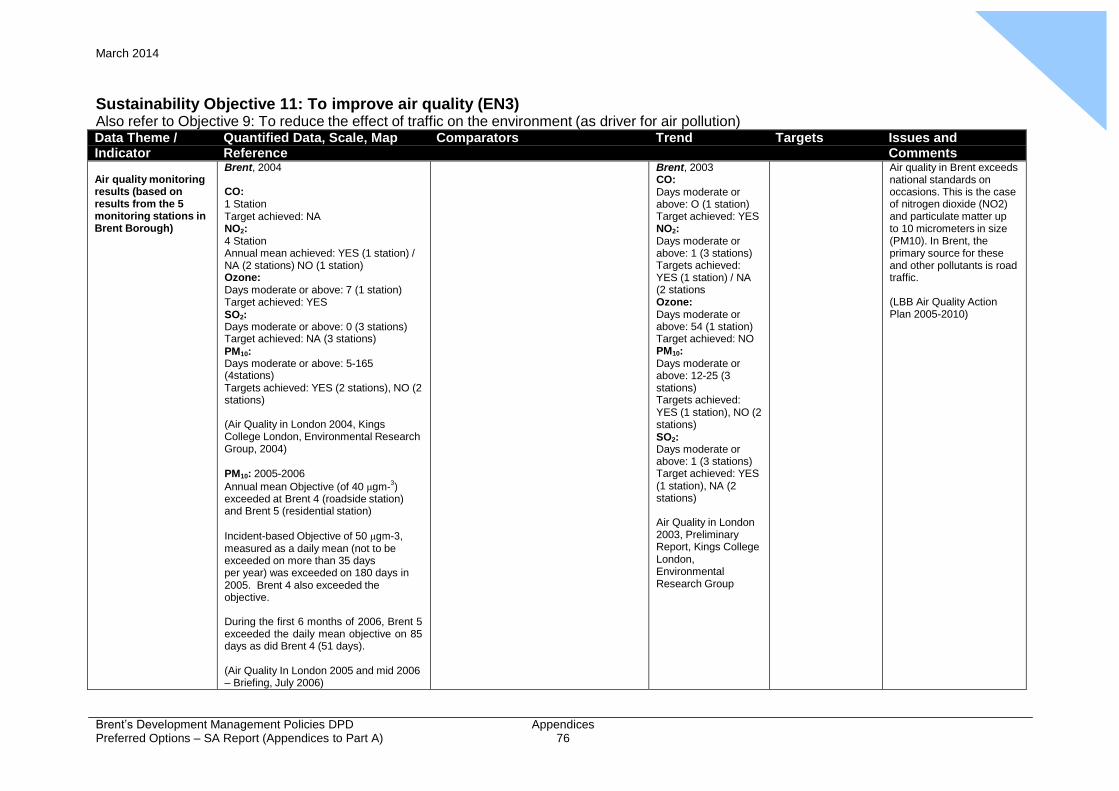
Appendix
5 March 2014
Brent’s Development Management Policies DPD Preferred Options – SA Report (Appendices to Part A)
Appendices 76
Sustainability Objective 11: To improve air quality (EN3) Also refer to Objective 9: To reduce the effect of traffic on the environment (as driver for air pollution) Data Theme / Quantified Data, Scale, Map Comparators Trend Targets Issues and Indicator Reference Comments
Air quality monitoring results (based on results from the 5 monitoring stations in Brent Borough)
Brent, 2004
CO: 1 Station Target achieved: NA NO2: 4 Station Annual mean achieved: YES (1 station) / NA (2 stations) NO (1 station) Ozone: Days moderate or above: 7 (1 station) Target achieved: YES SO2: Days moderate or above: 0 (3 stations) Target achieved: NA (3 stations)
PM10: Days moderate or above: 5-165 (4stations) Targets achieved: YES (2 stations), NO (2 stations)
(Air Quality in London 2004, Kings College London, Environmental Research Group, 2004)
PM10: 2005-2006
Annual mean Objective (of 40 μgm-3)
exceeded at Brent 4 (roadside station) and Brent 5 (residential station)
Incident-based Objective of 50 μgm-3, measured as a daily mean (not to be exceeded on more than 35 days per year) was exceeded on 180 days in 2005. Brent 4 also exceeded the objective.
During the first 6 months of 2006, Brent 5 exceeded the daily mean objective on 85 days as did Brent 4 (51 days).
(Air Quality In London 2005 and mid 2006 – Briefing, July 2006)
Brent, 2003 CO: Days moderate or above: O (1 station) Target achieved: YES NO2: Days moderate or above: 1 (3 stations) Targets achieved: YES (1 station) / NA (2 stations Ozone: Days moderate or above: 54 (1 station) Target achieved: NO PM10:
Days moderate or above: 12-25 (3 stations) Targets achieved: YES (1 station), NO (2 stations) SO2: Days moderate or above: 1 (3 stations) Target achieved: YES (1 station), NA (2 stations)
Air Quality in London 2003, Preliminary Report, Kings College London, Environmental Research Group
Air quality in Brent exceeds national standards on occasions. This is the case of nitrogen dioxide (NO2) and particulate matter up to 10 micrometers in size (PM10). In Brent, the primary source for these and other pollutants is road traffic.
(LBB Air Quality Action Plan 2005-2010)
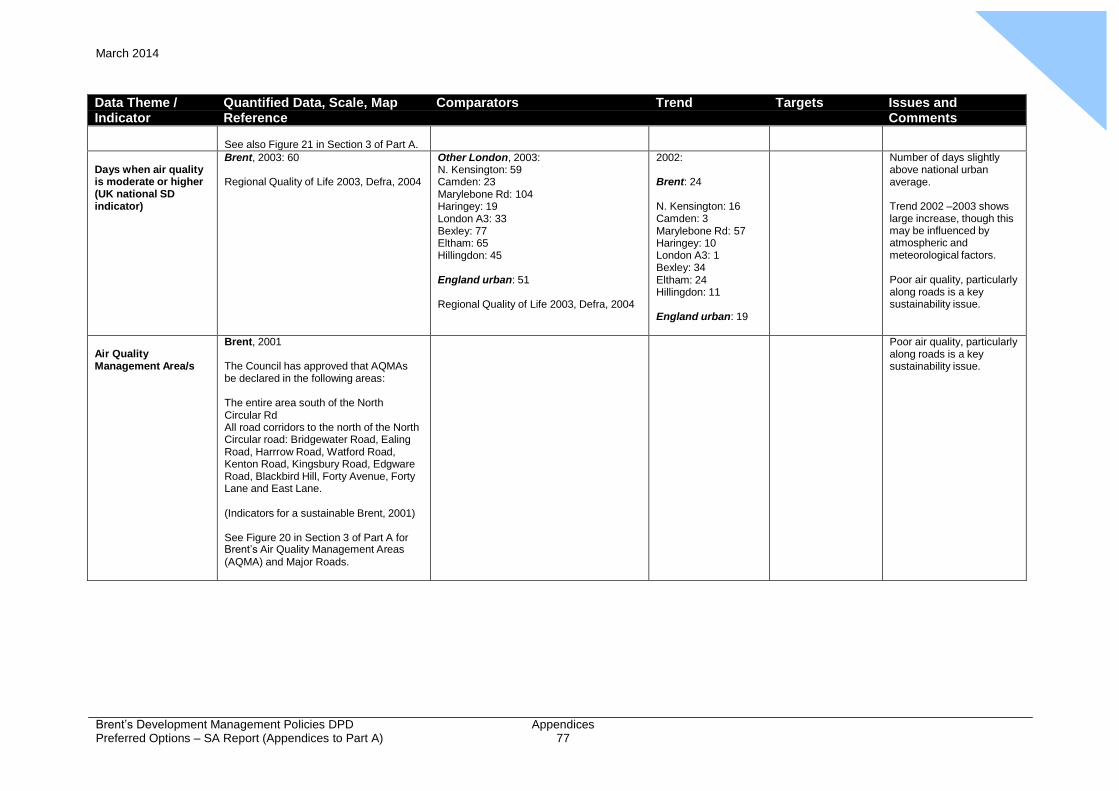
Appendix
5 March 2014
Brent’s Development Management Policies DPD Preferred Options – SA Report (Appendices to Part A)
Appendices 77
Data Theme / Quantified Data, Scale, Map Comparators Trend Targets Issues and Indicator Reference Comments
See also Figure 21 in Section 3 of Part A.
Days when air quality is moderate or higher (UK national SD indicator)
Brent, 2003: 60
Regional Quality of Life 2003, Defra, 2004
Other London, 2003: N. Kensington: 59 Camden: 23 Marylebone Rd: 104 Haringey: 19 London A3: 33 Bexley: 77 Eltham: 65 Hillingdon: 45
England urban: 51
Regional Quality of Life 2003, Defra, 2004
2002:
Brent: 24
N. Kensington: 16 Camden: 3 Marylebone Rd: 57 Haringey: 10 London A3: 1 Bexley: 34 Eltham: 24 Hillingdon: 11
England urban: 19
Number of days slightly above national urban average.
Trend 2002 –2003 shows large increase, though this may be influenced by atmospheric and meteorological factors.
Poor air quality, particularly along roads is a key sustainability issue.
Air Quality Management Area/s
Brent, 2001
The Council has approved that AQMAs be declared in the following areas:
The entire area south of the North Circular Rd All road corridors to the north of the North Circular road: Bridgewater Road, Ealing Road, Harrrow Road, Watford Road, Kenton Road, Kingsbury Road, Edgware Road, Blackbird Hill, Forty Avenue, Forty Lane and East Lane.
(Indicators for a sustainable Brent, 2001)
See Figure 20 in Section 3 of Part A for Brent’s Air Quality Management Areas (AQMA) and Major Roads.
Poor air quality, particularly along roads is a key sustainability issue.
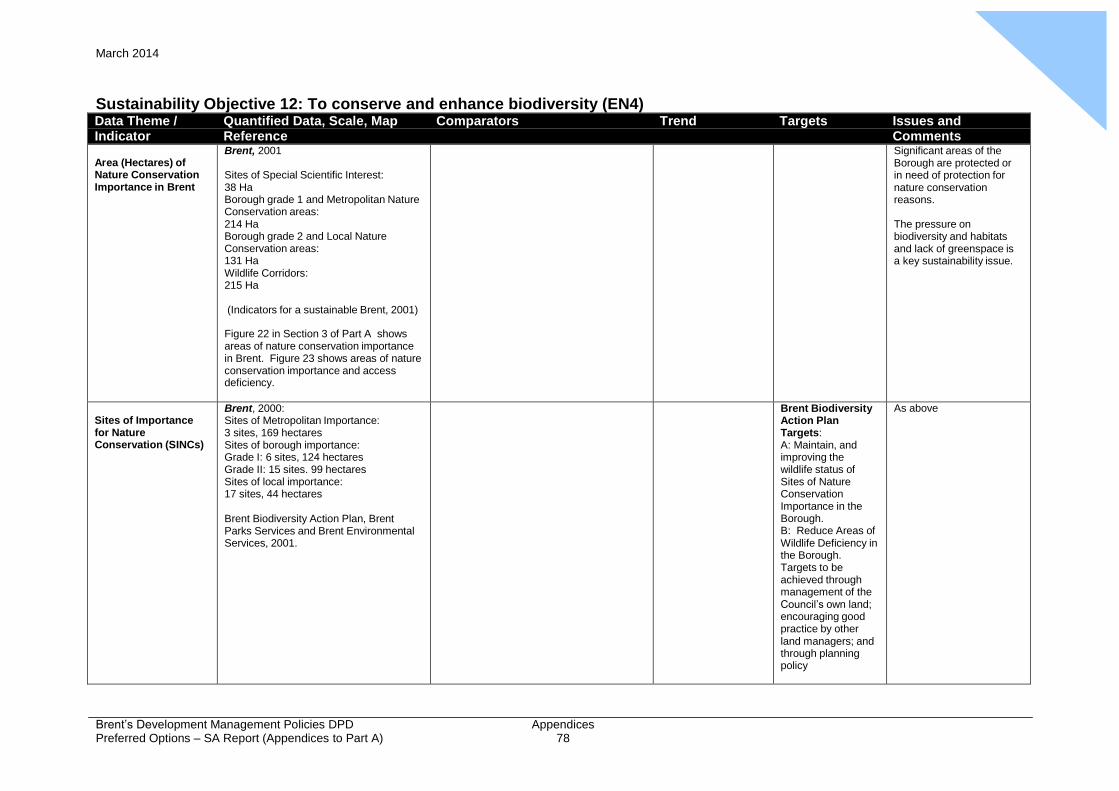
Appendix
5 March 2014
Brent’s Development Management Policies DPD Preferred Options – SA Report (Appendices to Part A)
Appendices 78
Sustainability Objective 12: To conserve and enhance biodiversity (EN4) Data Theme / Quantified Data, Scale, Map Comparators Trend Targets Issues and Indicator Reference Comments
Area (Hectares) of Nature Conservation Importance in Brent
Brent, 2001
Sites of Special Scientific Interest: 38 Ha Borough grade 1 and Metropolitan Nature Conservation areas: 214 Ha Borough grade 2 and Local Nature Conservation areas: 131 Ha Wildlife Corridors: 215 Ha
(Indicators for a sustainable Brent, 2001)
Figure 22 in Section 3 of Part A shows areas of nature conservation importance in Brent. Figure 23 shows areas of nature conservation importance and access deficiency.
Significant areas of the Borough are protected or in need of protection for nature conservation reasons.
The pressure on biodiversity and habitats and lack of greenspace is a key sustainability issue.
Sites of Importance for Nature Conservation (SINCs)
Brent, 2000: Sites of Metropolitan Importance: 3 sites, 169 hectares Sites of borough importance: Grade I: 6 sites, 124 hectares Grade II: 15 sites. 99 hectares Sites of local importance: 17 sites, 44 hectares
Brent Biodiversity Action Plan, Brent Parks Services and Brent Environmental Services, 2001.
Brent Biodiversity Action Plan Targets: A: Maintain, and improving the wildlife status of Sites of Nature Conservation Importance in the Borough. B: Reduce Areas of Wildlife Deficiency in the Borough. Targets to be achieved through management of the Council’s own land; encouraging good practice by other land managers; and through planning policy
As above
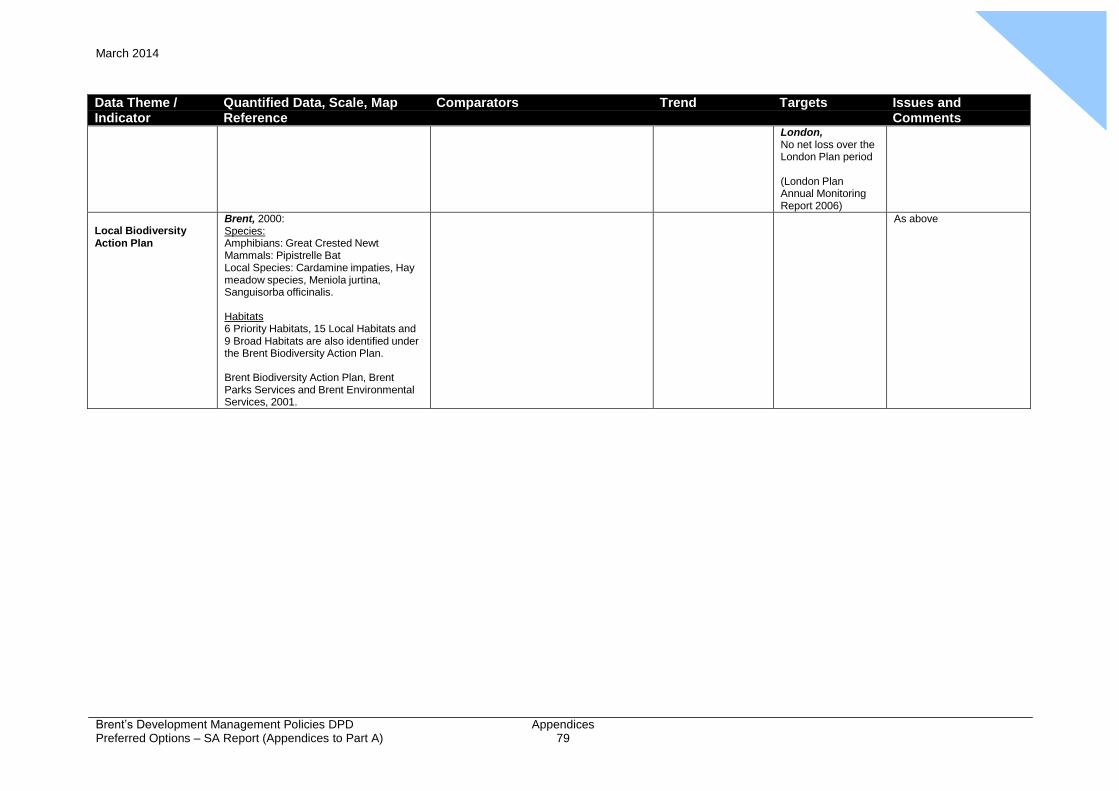
Appendix
5 March 2014
Brent’s Development Management Policies DPD Preferred Options – SA Report (Appendices to Part A)
Appendices 79
Data Theme / Quantified Data, Scale, Map Comparators Trend Targets Issues and Indicator Reference Comments
London, No net loss over the London Plan period
(London Plan Annual Monitoring Report 2006)
Local Biodiversity Action Plan
Brent, 2000: Species: Amphibians: Great Crested Newt Mammals: Pipistrelle Bat Local Species: Cardamine impaties, Hay meadow species, Meniola jurtina, Sanguisorba officinalis.
Habitats 6 Priority Habitats, 15 Local Habitats and 9 Broad Habitats are also identified under the Brent Biodiversity Action Plan.
Brent Biodiversity Action Plan, Brent Parks Services and Brent Environmental Services, 2001.
As above
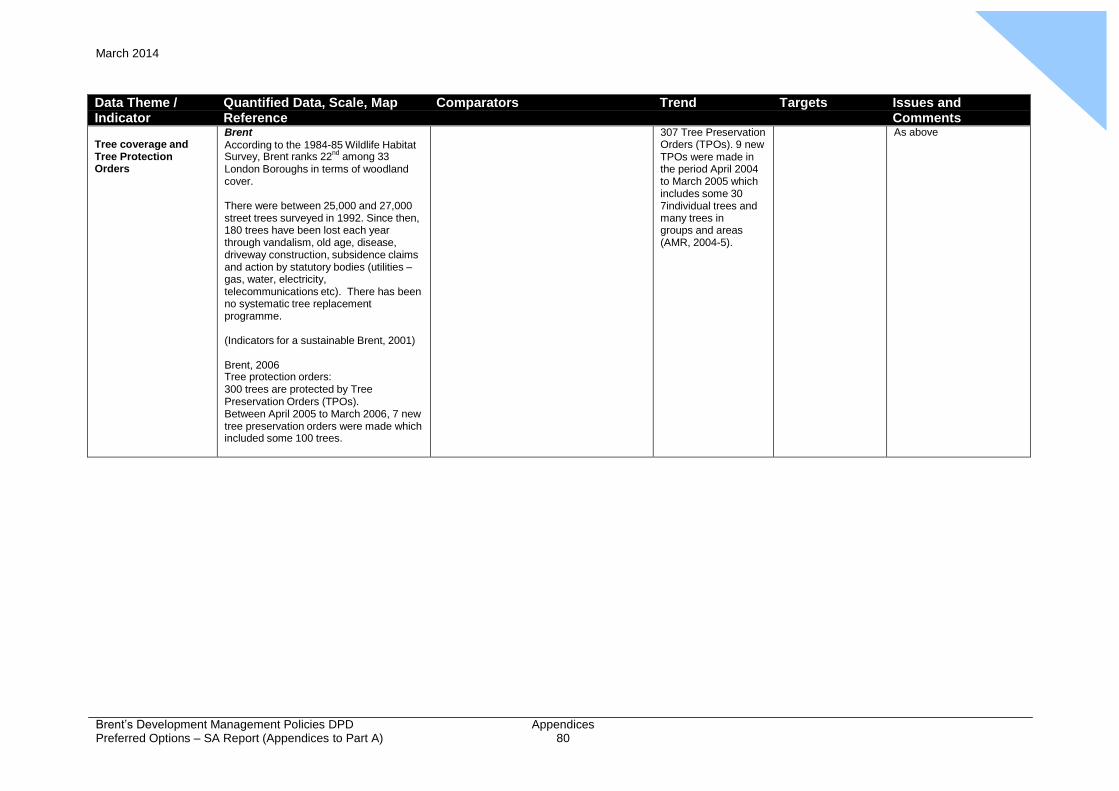
Appendix
5 March 2014
Brent’s Development Management Policies DPD Preferred Options – SA Report (Appendices to Part A)
Appendices 80
Data Theme / Quantified Data, Scale, Map Comparators Trend Targets Issues and Indicator Reference Comments
Tree coverage and Tree Protection Orders
Brent
According to the 1984-85 Wildlife Habitat Survey, Brent ranks 22
nd among 33
London Boroughs in terms of woodland cover.
There were between 25,000 and 27,000 street trees surveyed in 1992. Since then, 180 trees have been lost each year through vandalism, old age, disease, driveway construction, subsidence claims and action by statutory bodies (utilities – gas, water, electricity, telecommunications etc). There has been no systematic tree replacement programme.
(Indicators for a sustainable Brent, 2001)
Brent, 2006 Tree protection orders: 300 trees are protected by Tree Preservation Orders (TPOs). Between April 2005 to March 2006, 7 new tree preservation orders were made which included some 100 trees.
307 Tree Preservation Orders (TPOs). 9 new TPOs were made in the period April 2004 to March 2005 which includes some 30 7individual trees and many trees in groups and areas (AMR, 2004-5).
As above
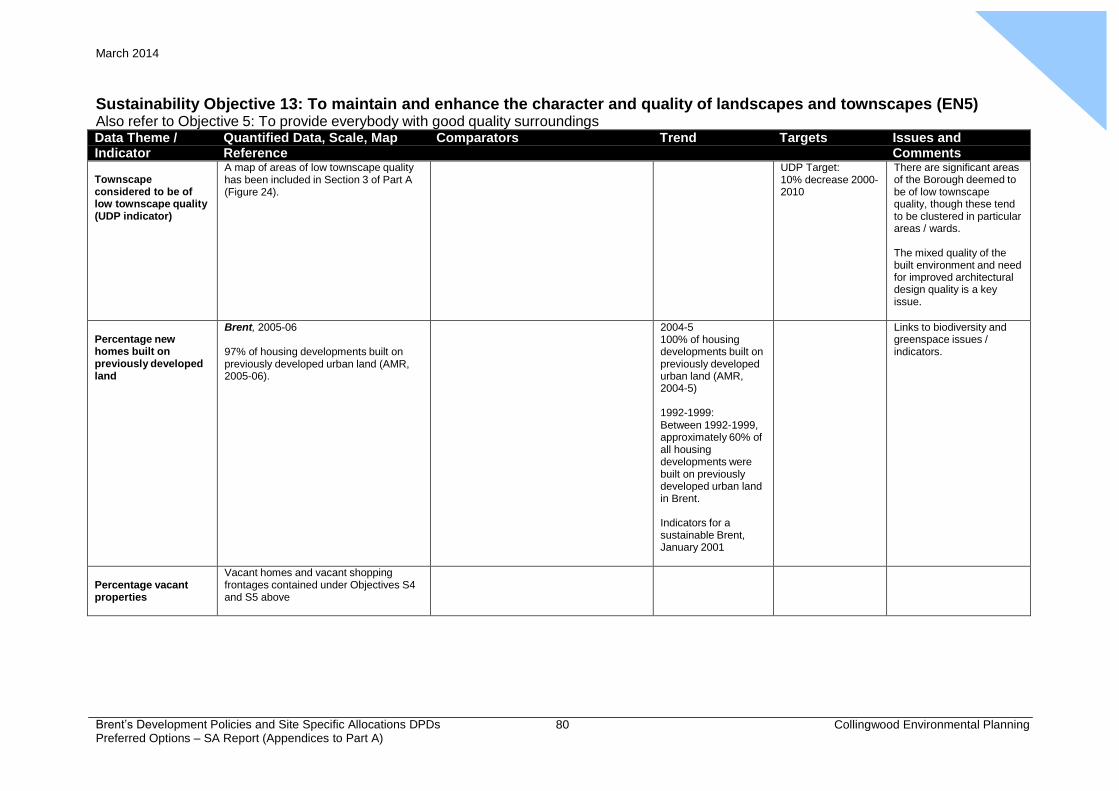
Appendix
5 March 2014
Brent’s Development Policies and Site Specific Allocations DPDs Preferred Options – SA Report (Appendices to Part A)
80 Collingwood Environmental Planning
Sustainability Objective 13: To maintain and enhance the character and quality of landscapes and townscapes (EN5) Also refer to Objective 5: To provide everybody with good quality surroundings Data Theme / Quantified Data, Scale, Map Comparators Trend Targets Issues and Indicator Reference Comments
Townscape considered to be of low townscape quality (UDP indicator)
A map of areas of low townscape quality has been included in Section 3 of Part A (Figure 24).
UDP Target: 10% decrease 2000- 2010
There are significant areas of the Borough deemed to be of low townscape quality, though these tend to be clustered in particular areas / wards.
The mixed quality of the built environment and need for improved architectural design quality is a key issue.
Percentage new homes built on previously developed land
Brent, 2005-06
97% of housing developments built on previously developed urban land (AMR, 2005-06).
2004-5 100% of housing developments built on previously developed urban land (AMR, 2004-5)
1992-1999: Between 1992-1999, approximately 60% of all housing developments were built on previously developed urban land in Brent.
Indicators for a sustainable Brent, January 2001
Links to biodiversity and greenspace issues / indicators.
Percentage vacant properties
Vacant homes and vacant shopping frontages contained under Objectives S4 and S5 above
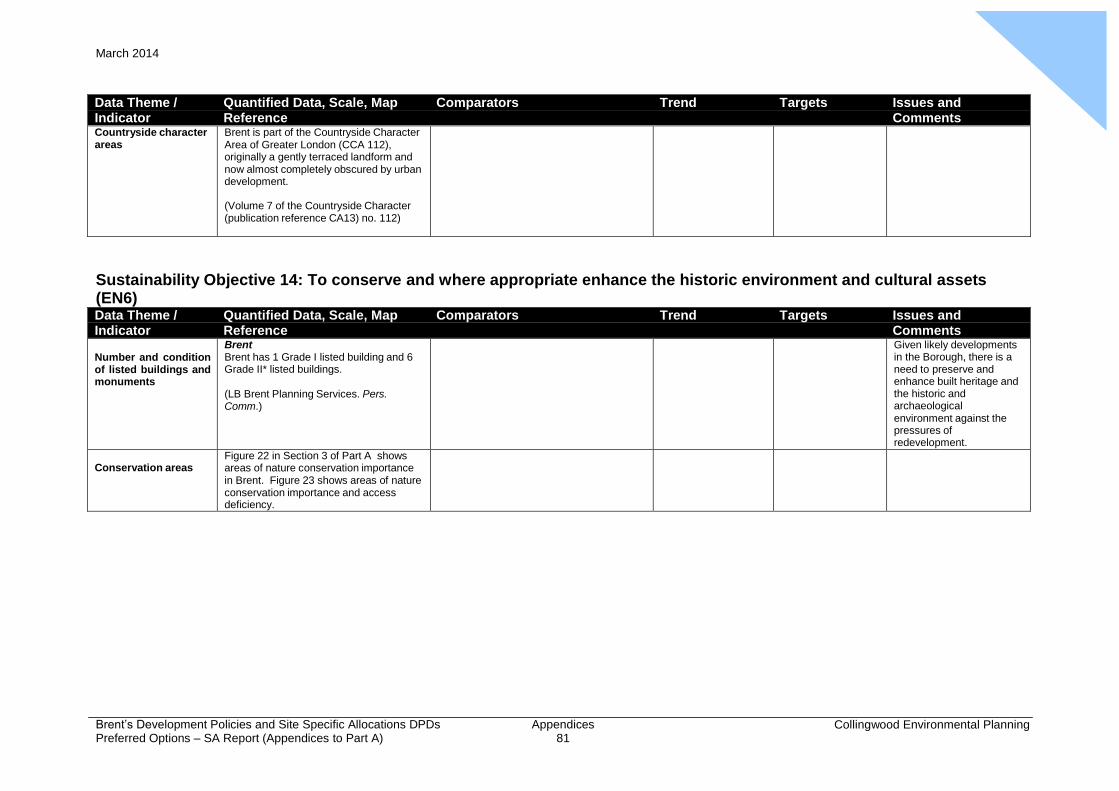
Appendix
5 March 2014
Brent’s Development Policies and Site Specific Allocations DPDs Preferred Options – SA Report (Appendices to Part A)
Appendices 81
Collingwood Environmental Planning
Data Theme / Quantified Data, Scale, Map Comparators Trend Targets Issues and Indicator Reference Comments Countryside character areas
Brent is part of the Countryside Character Area of Greater London (CCA 112), originally a gently terraced landform and now almost completely obscured by urban development.
(Volume 7 of the Countryside Character (publication reference CA13) no. 112)
Sustainability Objective 14: To conserve and where appropriate enhance the historic environment and cultural assets (EN6) Data Theme / Quantified Data, Scale, Map Comparators Trend Targets Issues and Indicator Reference Comments
Number and condition of listed buildings and monuments
Brent Brent has 1 Grade I listed building and 6 Grade II* listed buildings.
(LB Brent Planning Services. Pers. Comm.)
Given likely developments in the Borough, there is a need to preserve and enhance built heritage and the historic and archaeological environment against the pressures of redevelopment.
Conservation areas
Figure 22 in Section 3 of Part A shows areas of nature conservation importance in Brent. Figure 23 shows areas of nature conservation importance and access deficiency.
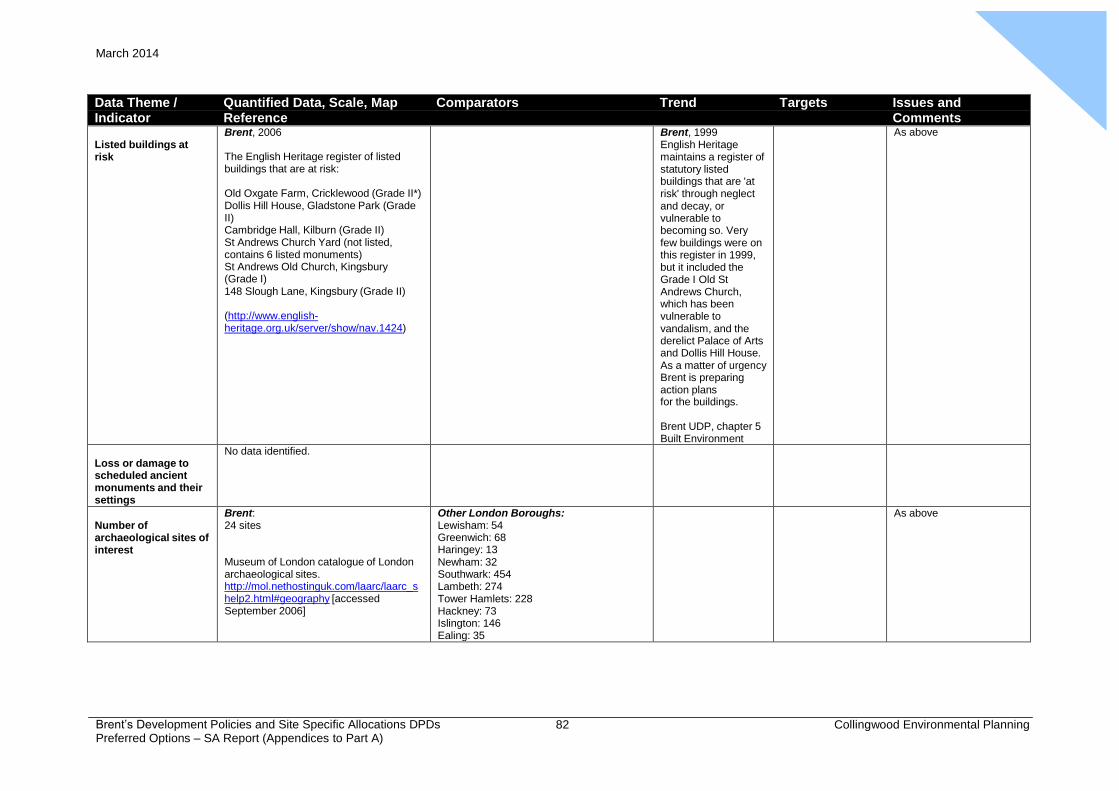
Appendix
5 March 2014
Brent’s Development Policies and Site Specific Allocations DPDs Preferred Options – SA Report (Appendices to Part A)
82 Collingwood Environmental Planning
Data Theme / Quantified Data, Scale, Map Comparators Trend Targets Issues and Indicator Reference Comments
Listed buildings at risk
Brent, 2006
The English Heritage register of listed buildings that are at risk:
Old Oxgate Farm, Cricklewood (Grade II*) Dollis Hill House, Gladstone Park (Grade II) Cambridge Hall, Kilburn (Grade II) St Andrews Church Yard (not listed, contains 6 listed monuments) St Andrews Old Church, Kingsbury (Grade I) 148 Slough Lane, Kingsbury (Grade II)
(http://www.english- heritage.org.uk/server/show/nav.1424)
Brent, 1999 English Heritage maintains a register of statutory listed buildings that are 'at risk' through neglect and decay, or vulnerable to becoming so. Very few buildings were on this register in 1999, but it included the Grade I Old St Andrews Church, which has been vulnerable to vandalism, and the derelict Palace of Arts and Dollis Hill House. As a matter of urgency Brent is preparing action plans for the buildings.
Brent UDP, chapter 5 Built Environment
As above
Loss or damage to scheduled ancient monuments and their settings
No data identified.
Number of archaeological sites of interest
Brent: 24 sites
Museum of London catalogue of London archaeological sites. http://mol.nethostinguk.com/laarc/laarc_s help2.html#geography [accessed September 2006]
Other London Boroughs: Lewisham: 54 Greenwich: 68 Haringey: 13 Newham: 32 Southwark: 454 Lambeth: 274 Tower Hamlets: 228 Hackney: 73 Islington: 146 Ealing: 35
As above
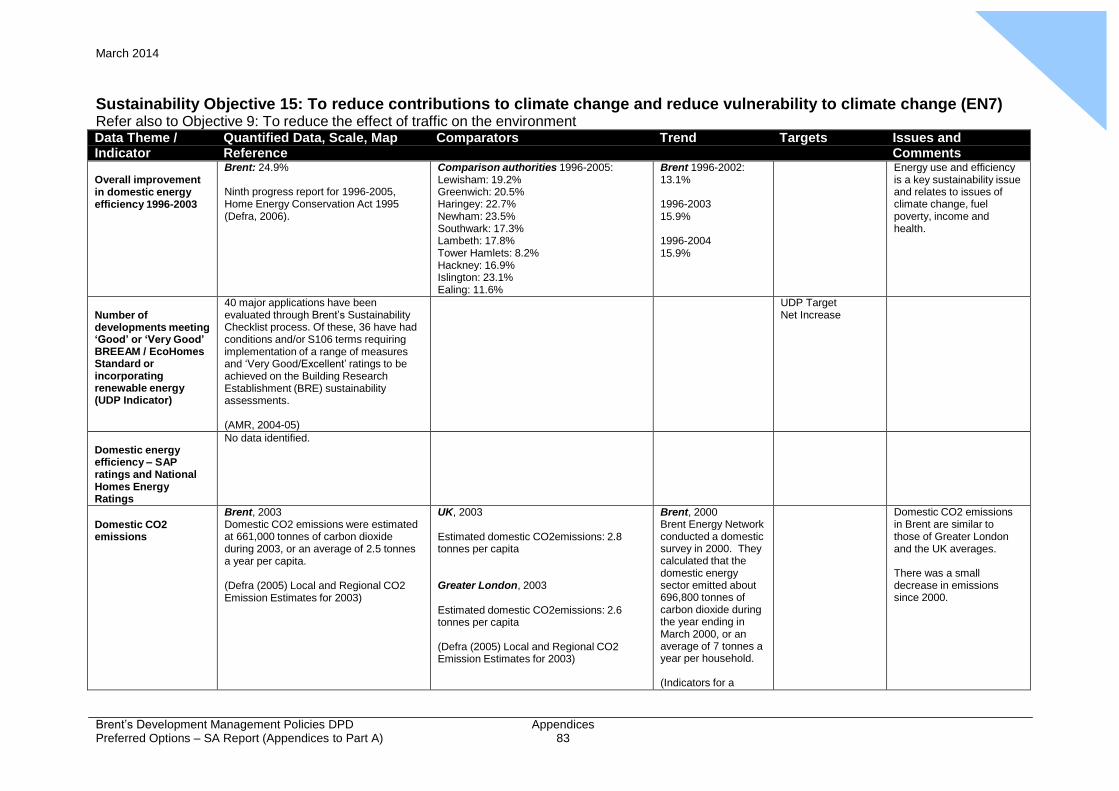
Appendix
5 March 2014
Brent’s Development Management Policies DPD Preferred Options – SA Report (Appendices to Part A)
Appendices 83
Sustainability Objective 15: To reduce contributions to climate change and reduce vulnerability to climate change (EN7) Refer also to Objective 9: To reduce the effect of traffic on the environment Data Theme / Quantified Data, Scale, Map Comparators Trend Targets Issues and Indicator Reference Comments
Overall improvement in domestic energy efficiency 1996-2003
Brent: 24.9%
Ninth progress report for 1996-2005, Home Energy Conservation Act 1995 (Defra, 2006).
Comparison authorities 1996-2005: Lewisham: 19.2% Greenwich: 20.5% Haringey: 22.7% Newham: 23.5% Southwark: 17.3% Lambeth: 17.8% Tower Hamlets: 8.2% Hackney: 16.9% Islington: 23.1% Ealing: 11.6%
Brent 1996-2002: 13.1%
1996-2003 15.9%
1996-2004 15.9%
Energy use and efficiency is a key sustainability issue and relates to issues of climate change, fuel poverty, income and health.
Number of developments meeting ‘Good’ or ‘Very Good’ BREEAM / EcoHomes Standard or incorporating renewable energy (UDP Indicator)
40 major applications have been evaluated through Brent’s Sustainability Checklist process. Of these, 36 have had conditions and/or S106 terms requiring implementation of a range of measures and ‘Very Good/Excellent’ ratings to be achieved on the Building Research Establishment (BRE) sustainability assessments.
(AMR, 2004-05)
UDP Target Net Increase
Domestic energy efficiency – SAP ratings and National Homes Energy Ratings
No data identified.
Domestic CO2 emissions
Brent, 2003 Domestic CO2 emissions were estimated at 661,000 tonnes of carbon dioxide during 2003, or an average of 2.5 tonnes a year per capita.
(Defra (2005) Local and Regional CO2 Emission Estimates for 2003)
UK, 2003
Estimated domestic CO2emissions: 2.8 tonnes per capita
Greater London, 2003
Estimated domestic CO2emissions: 2.6 tonnes per capita
(Defra (2005) Local and Regional CO2 Emission Estimates for 2003)
Brent, 2000 Brent Energy Network conducted a domestic survey in 2000. They calculated that the domestic energy sector emitted about 696,800 tonnes of carbon dioxide during the year ending in March 2000, or an average of 7 tonnes a year per household.
(Indicators for a
Domestic CO2 emissions in Brent are similar to those of Greater London and the UK averages.
There was a small decrease in emissions since 2000.
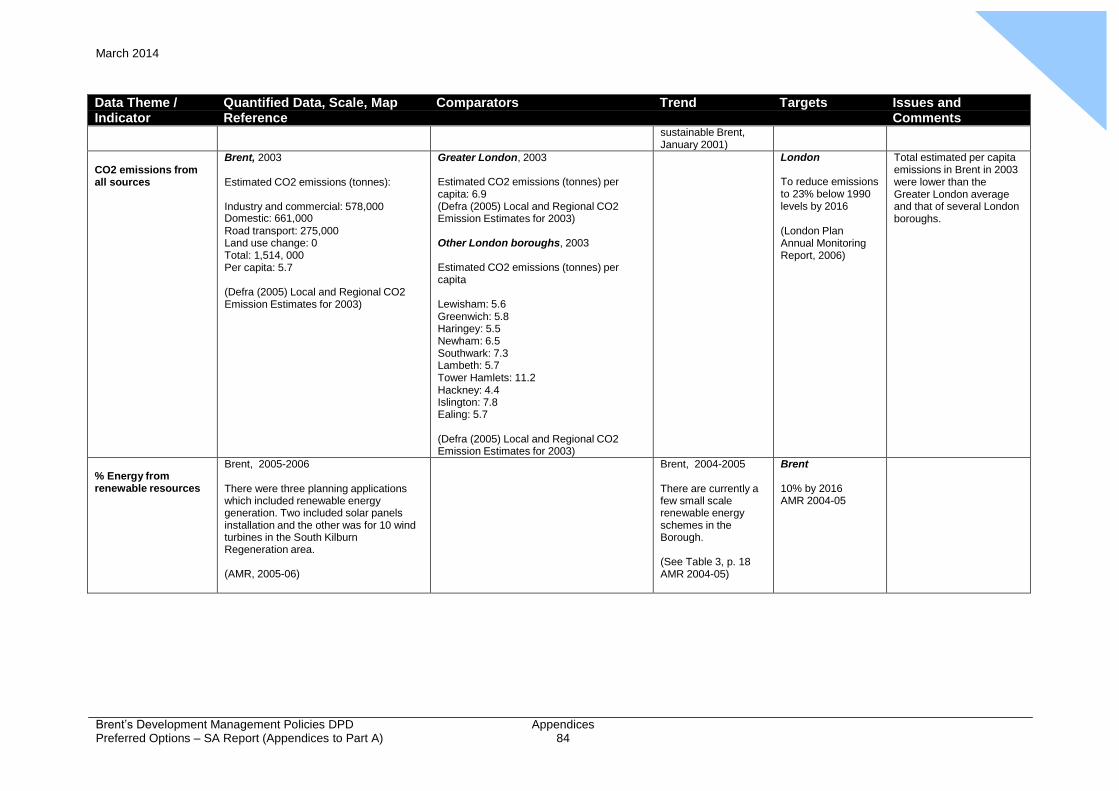
Appendix
5 March 2014
Brent’s Development Management Policies DPD Preferred Options – SA Report (Appendices to Part A)
Appendices 84
Data Theme / Quantified Data, Scale, Map Comparators Trend Targets Issues and Indicator Reference Comments
sustainable Brent, January 2001)
CO2 emissions from all sources
Brent, 2003
Estimated CO2 emissions (tonnes):
Industry and commercial: 578,000 Domestic: 661,000 Road transport: 275,000 Land use change: 0 Total: 1,514, 000 Per capita: 5.7
(Defra (2005) Local and Regional CO2 Emission Estimates for 2003)
Greater London, 2003
Estimated CO2 emissions (tonnes) per capita: 6.9 (Defra (2005) Local and Regional CO2 Emission Estimates for 2003)
Other London boroughs, 2003
Estimated CO2 emissions (tonnes) per capita
Lewisham: 5.6 Greenwich: 5.8 Haringey: 5.5 Newham: 6.5 Southwark: 7.3 Lambeth: 5.7 Tower Hamlets: 11.2 Hackney: 4.4 Islington: 7.8 Ealing: 5.7
(Defra (2005) Local and Regional CO2 Emission Estimates for 2003)
London
To reduce emissions to 23% below 1990 levels by 2016
(London Plan Annual Monitoring Report, 2006)
Total estimated per capita emissions in Brent in 2003 were lower than the Greater London average and that of several London boroughs.
% Energy from renewable resources
Brent, 2005-2006
There were three planning applications which included renewable energy generation. Two included solar panels installation and the other was for 10 wind turbines in the South Kilburn Regeneration area.
(AMR, 2005-06)
Brent, 2004-2005
There are currently a few small scale renewable energy schemes in the Borough.
(See Table 3, p. 18 AMR 2004-05)
Brent
10% by 2016 AMR 2004-05
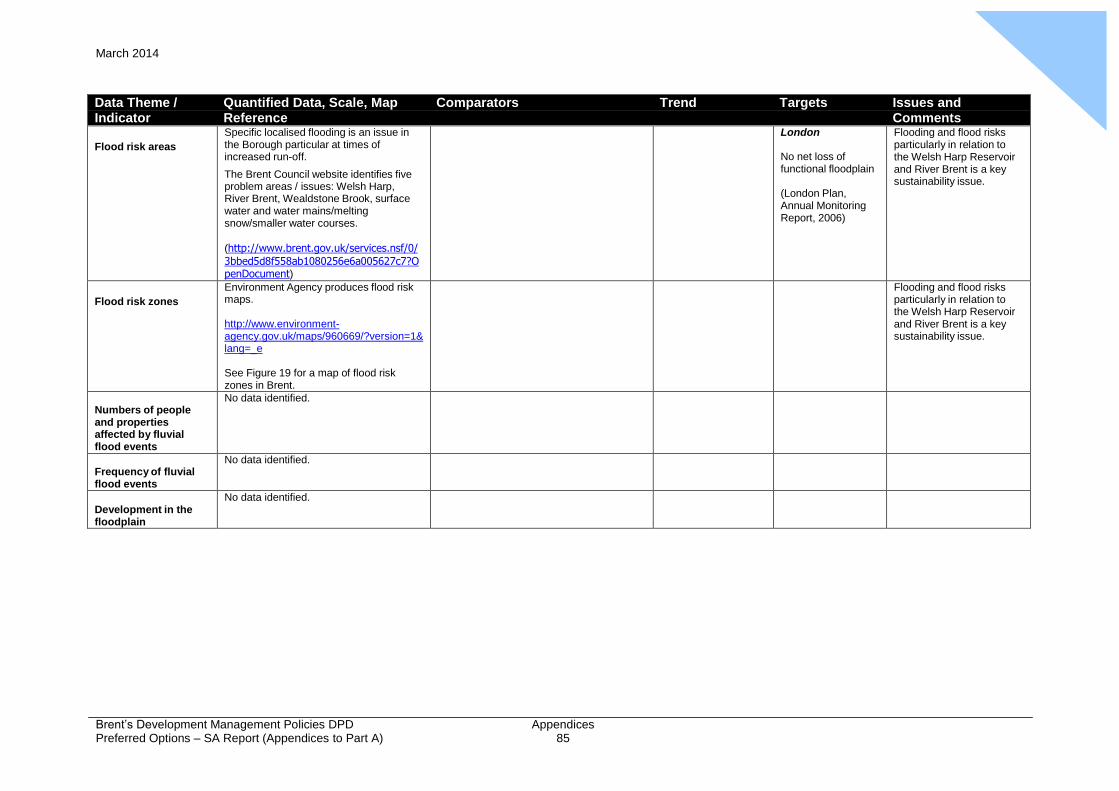
Appendix
5 March 2014
Brent’s Development Management Policies DPD Preferred Options – SA Report (Appendices to Part A)
Appendices 85
Data Theme / Quantified Data, Scale, Map Comparators Trend Targets Issues and Indicator Reference Comments
Flood risk areas
Specific localised flooding is an issue in the Borough particular at times of increased run-off.
The Brent Council website identifies five problem areas / issues: Welsh Harp, River Brent, Wealdstone Brook, surface water and water mains/melting snow/smaller water courses.
(http://www.brent.gov.uk/services.nsf/0/
3bbed5d8f558ab1080256e6a005627c7?O penDocument)
London
No net loss of functional floodplain
(London Plan, Annual Monitoring Report, 2006)
Flooding and flood risks particularly in relation to the Welsh Harp Reservoir and River Brent is a key sustainability issue.
Flood risk zones
Environment Agency produces flood risk maps.
http://www.environment- agency.gov.uk/maps/960669/?version=1& lang=_e
See Figure 19 for a map of flood risk zones in Brent.
Flooding and flood risks particularly in relation to the Welsh Harp Reservoir and River Brent is a key sustainability issue.
Numbers of people and properties affected by fluvial flood events
No data identified.
Frequency of fluvial flood events
No data identified.
Development in the floodplain
No data identified.
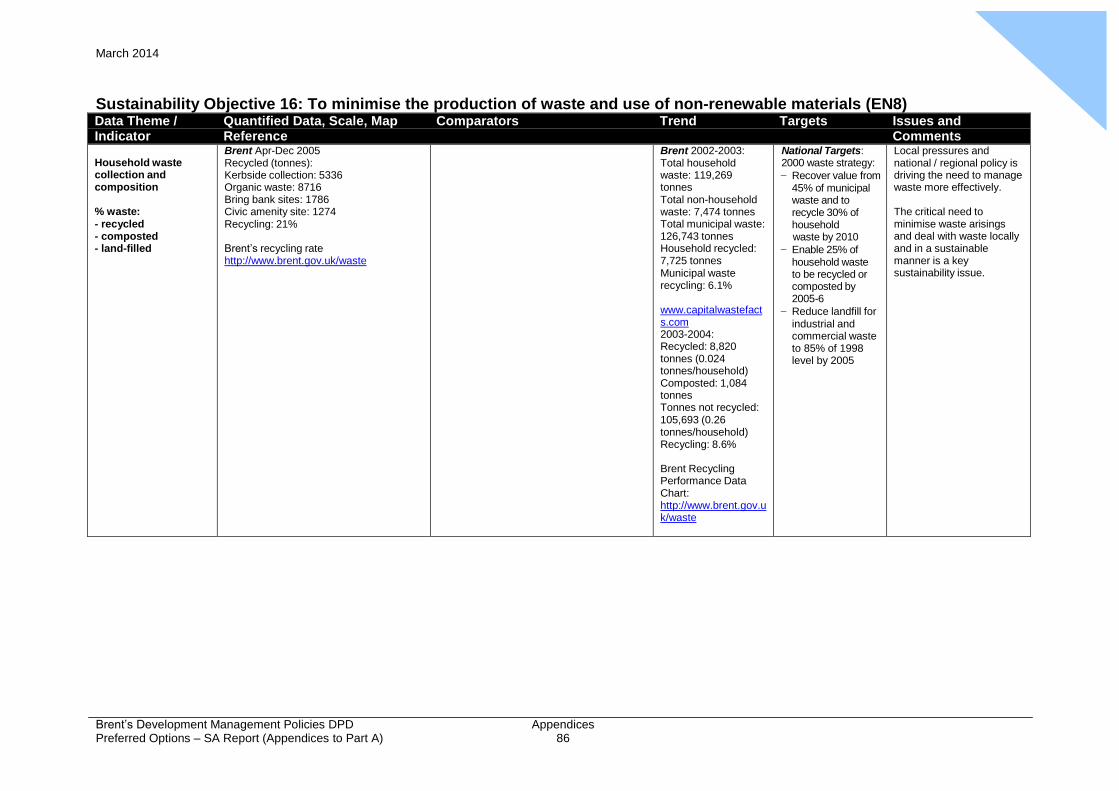
Appendix
5 March 2014
Brent’s Development Management Policies DPD Preferred Options – SA Report (Appendices to Part A)
Appendices 86
Sustainability Objective 16: To minimise the production of waste and use of non-renewable materials (EN8) Data Theme / Quantified Data, Scale, Map Comparators Trend Targets Issues and Indicator Reference Comments
Household waste collection and composition
% waste: - recycled - composted - land-filled
Brent Apr-Dec 2005 Recycled (tonnes): Kerbside collection: 5336 Organic waste: 8716 Bring bank sites: 1786 Civic amenity site: 1274 Recycling: 21%
Brent’s recycling rate http://www.brent.gov.uk/waste
Brent 2002-2003: Total household waste: 119,269 tonnes Total non-household waste: 7,474 tonnes Total municipal waste: 126,743 tonnes Household recycled: 7,725 tonnes Municipal waste recycling: 6.1%
www.capitalwastefact s.com 2003-2004: Recycled: 8,820 tonnes (0.024 tonnes/household) Composted: 1,084 tonnes Tonnes not recycled: 105,693 (0.26 tonnes/household) Recycling: 8.6%
Brent Recycling Performance Data Chart: http://www.brent.gov.u k/waste
National Targets: 2000 waste strategy:
− Recover value from 45% of municipal waste and to recycle 30% of household waste by 2010
− Enable 25% of household waste to be recycled or composted by 2005-6
− Reduce landfill for industrial and commercial waste to 85% of 1998 level by 2005
Local pressures and national / regional policy is driving the need to manage waste more effectively.
The critical need to minimise waste arisings and deal with waste locally and in a sustainable manner is a key sustainability issue.
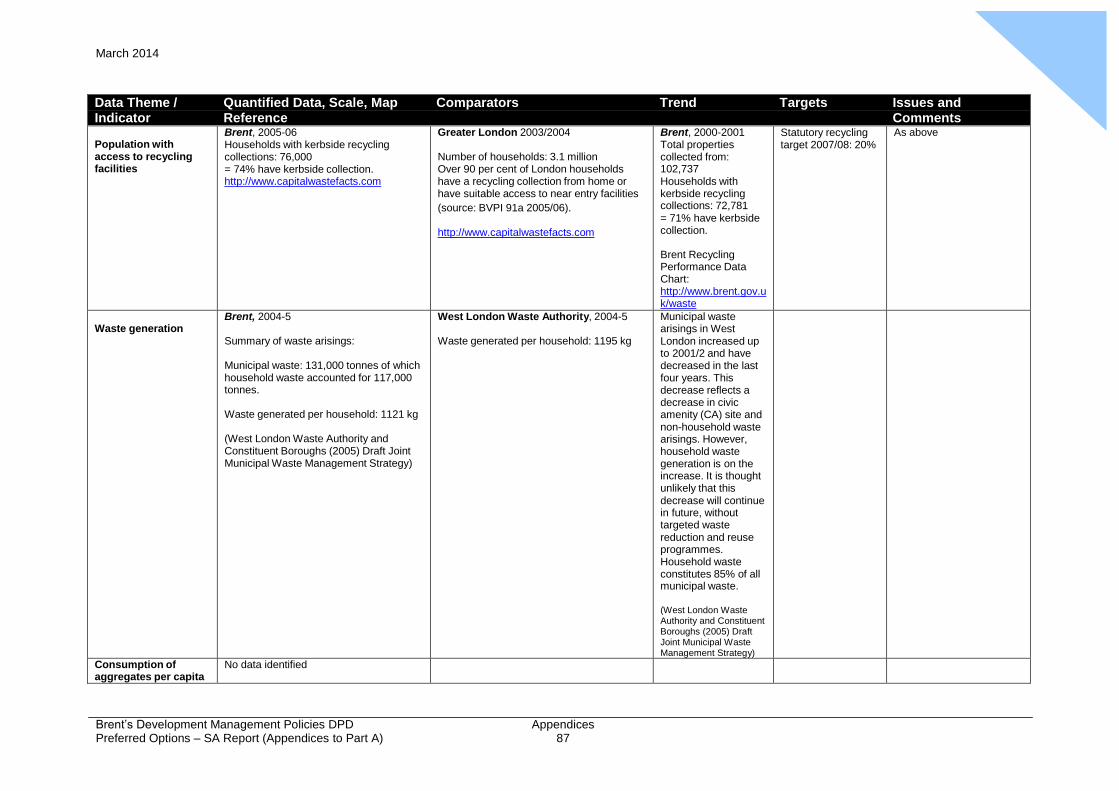
Appendix
5 March 2014
Brent’s Development Management Policies DPD Preferred Options – SA Report (Appendices to Part A)
Appendices 87
Data Theme / Quantified Data, Scale, Map Comparators Trend Targets Issues and Indicator Reference Comments
Population with access to recycling facilities
Brent, 2005-06 Households with kerbside recycling collections: 76,000 = 74% have kerbside collection. http://www.capitalwastefacts.com
Greater London 2003/2004
Number of households: 3.1 million Over 90 per cent of London households have a recycling collection from home or have suitable access to near entry facilities
(source: BVPI 91a 2005/06).
http://www.capitalwastefacts.com
Brent, 2000-2001 Total properties collected from: 102,737 Households with kerbside recycling collections: 72,781 = 71% have kerbside collection.
Brent Recycling Performance Data Chart: http://www.brent.gov.u k/waste
Statutory recycling target 2007/08: 20%
As above
Waste generation
Brent, 2004-5
Summary of waste arisings:
Municipal waste: 131,000 tonnes of which household waste accounted for 117,000 tonnes.
Waste generated per household: 1121 kg
(West London Waste Authority and Constituent Boroughs (2005) Draft Joint Municipal Waste Management Strategy)
West London Waste Authority, 2004-5
Waste generated per household: 1195 kg
Municipal waste arisings in West London increased up to 2001/2 and have decreased in the last four years. This decrease reflects a decrease in civic amenity (CA) site and non-household waste arisings. However, household waste generation is on the increase. It is thought unlikely that this decrease will continue in future, without targeted waste reduction and reuse programmes. Household waste constitutes 85% of all municipal waste.
(West London Waste Authority and Constituent Boroughs (2005) Draft Joint Municipal Waste Management Strategy)
Consumption of aggregates per capita
No data identified
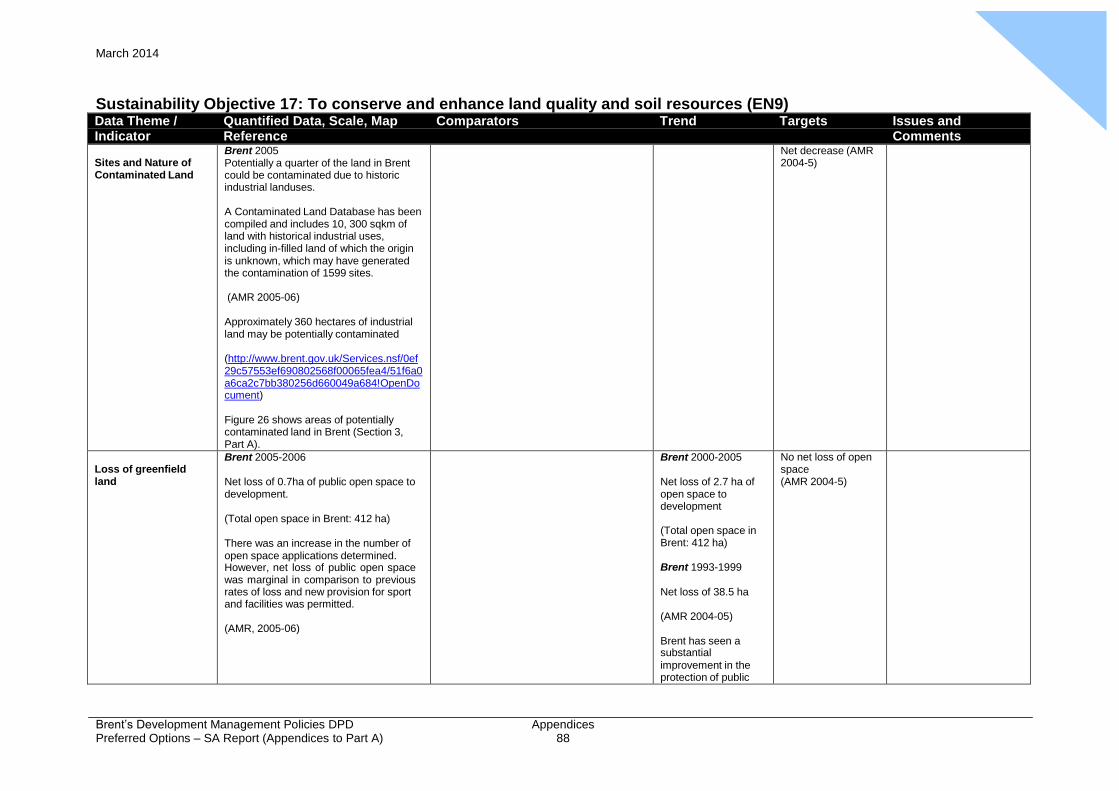
Appendix
5 March 2014
Brent’s Development Management Policies DPD Preferred Options – SA Report (Appendices to Part A)
Appendices 88
Sustainability Objective 17: To conserve and enhance land quality and soil resources (EN9) Data Theme / Quantified Data, Scale, Map Comparators Trend Targets Issues and Indicator Reference Comments
Sites and Nature of Contaminated Land
Brent 2005 Potentially a quarter of the land in Brent could be contaminated due to historic industrial landuses.
A Contaminated Land Database has been compiled and includes 10, 300 sqkm of land with historical industrial uses, including in-filled land of which the origin is unknown, which may have generated the contamination of 1599 sites.
(AMR 2005-06)
Approximately 360 hectares of industrial land may be potentially contaminated
(http://www.brent.gov.uk/Services.nsf/0ef 29c57553ef690802568f00065fea4/51f6a0 a6ca2c7bb380256d660049a684!OpenDo cument)
Figure 26 shows areas of potentially contaminated land in Brent (Section 3, Part A).
Net decrease (AMR 2004-5)
Loss of greenfield land
Brent 2005-2006
Net loss of 0.7ha of public open space to development.
(Total open space in Brent: 412 ha)
There was an increase in the number of open space applications determined. However, net loss of public open space was marginal in comparison to previous rates of loss and new provision for sport and facilities was permitted.
(AMR, 2005-06)
Brent 2000-2005
Net loss of 2.7 ha of open space to development
(Total open space in Brent: 412 ha)
Brent 1993-1999
Net loss of 38.5 ha
(AMR 2004-05)
Brent has seen a substantial improvement in the protection of public
No net loss of open space (AMR 2004-5)
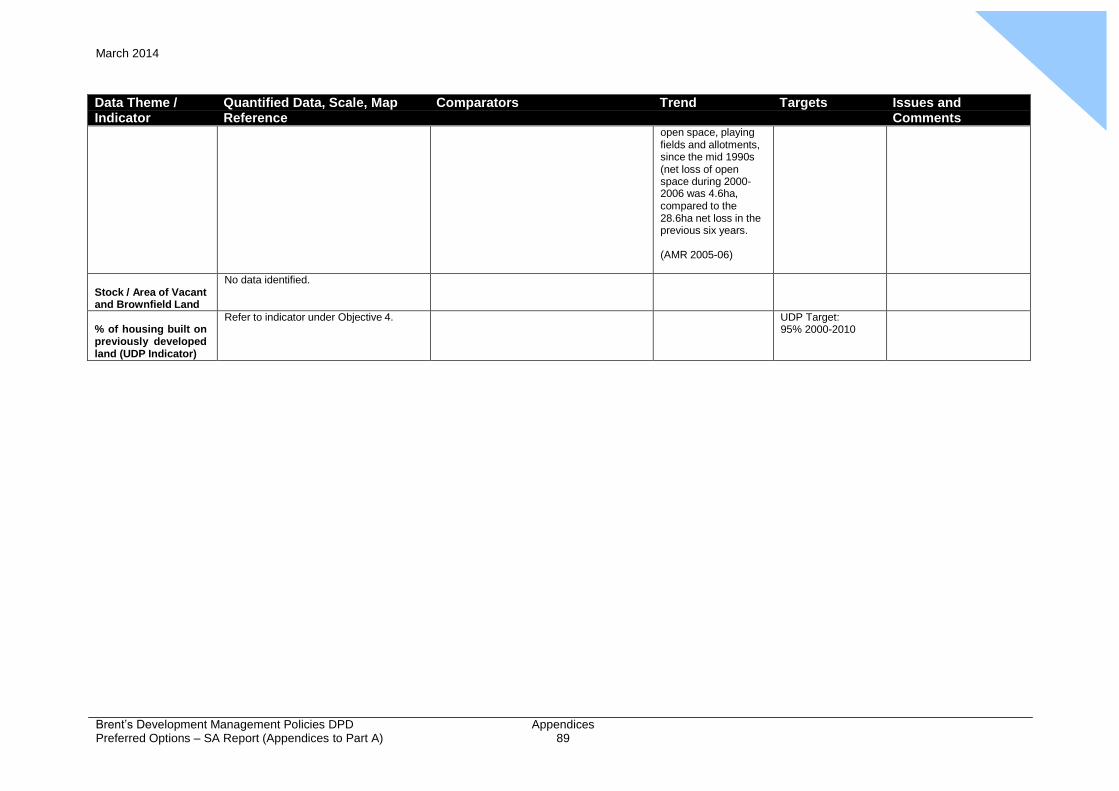
Appendix
5 March 2014
Brent’s Development Management Policies DPD Preferred Options – SA Report (Appendices to Part A)
Appendices 89
Data Theme / Quantified Data, Scale, Map Comparators Trend Targets Issues and Indicator Reference Comments
open space, playing fields and allotments, since the mid 1990s (net loss of open space during 2000- 2006 was 4.6ha, compared to the 28.6ha net loss in the previous six years.
(AMR 2005-06)
Stock / Area of Vacant and Brownfield Land
No data identified.
% of housing built on previously developed land (UDP Indicator)
Refer to indicator under Objective 4. UDP Target: 95% 2000-2010
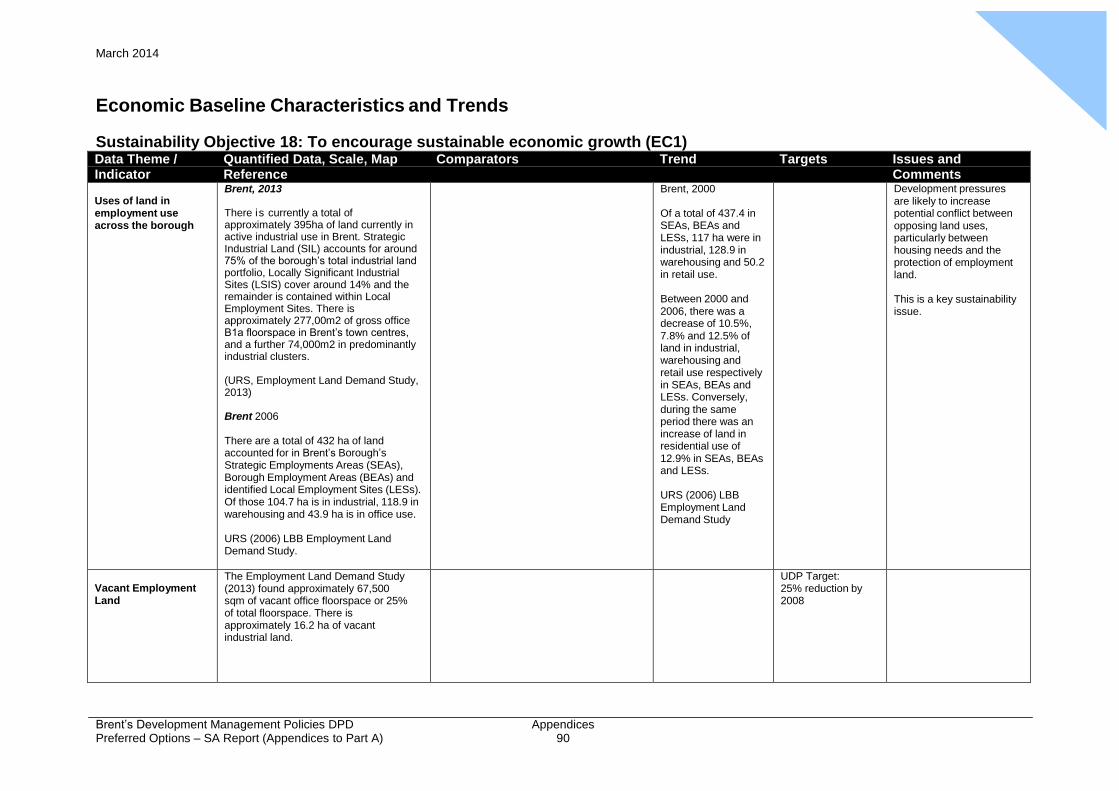
Appendix
5 March 2014
Brent’s Development Management Policies DPD Preferred Options – SA Report (Appendices to Part A)
Appendices 90
Economic Baseline Characteristics and Trends
Sustainability Objective 18: To encourage sustainable economic growth (EC1) Data Theme / Quantified Data, Scale, Map Comparators Trend Targets Issues and Indicator Reference Comments
Uses of land in employment use across the borough
Brent, 2013 There is currently a total of approximately 395ha of land currently in active industrial use in Brent. Strategic Industrial Land (SIL) accounts for around 75% of the borough’s total industrial land portfolio, Locally Significant Industrial Sites (LSIS) cover around 14% and the remainder is contained within Local Employment Sites. There is approximately 277,00m2 of gross office B1a floorspace in Brent’s town centres, and a further 74,000m2 in predominantly industrial clusters. (URS, Employment Land Demand Study, 2013) Brent 2006
There are a total of 432 ha of land accounted for in Brent’s Borough’s Strategic Employments Areas (SEAs), Borough Employment Areas (BEAs) and identified Local Employment Sites (LESs). Of those 104.7 ha is in industrial, 118.9 in warehousing and 43.9 ha is in office use.
URS (2006) LBB Employment Land Demand Study.
Brent, 2000
Of a total of 437.4 in SEAs, BEAs and LESs, 117 ha were in industrial, 128.9 in warehousing and 50.2 in retail use.
Between 2000 and 2006, there was a decrease of 10.5%, 7.8% and 12.5% of land in industrial, warehousing and retail use respectively in SEAs, BEAs and LESs. Conversely, during the same period there was an increase of land in residential use of 12.9% in SEAs, BEAs and LESs.
URS (2006) LBB Employment Land Demand Study
Development pressures are likely to increase potential conflict between opposing land uses, particularly between housing needs and the protection of employment land.
This is a key sustainability issue.
Vacant Employment Land
The Employment Land Demand Study (2013) found approximately 67,500 sqm of vacant office floorspace or 25% of total floorspace. There is approximately 16.2 ha of vacant industrial land.
UDP Target: 25% reduction by 2008
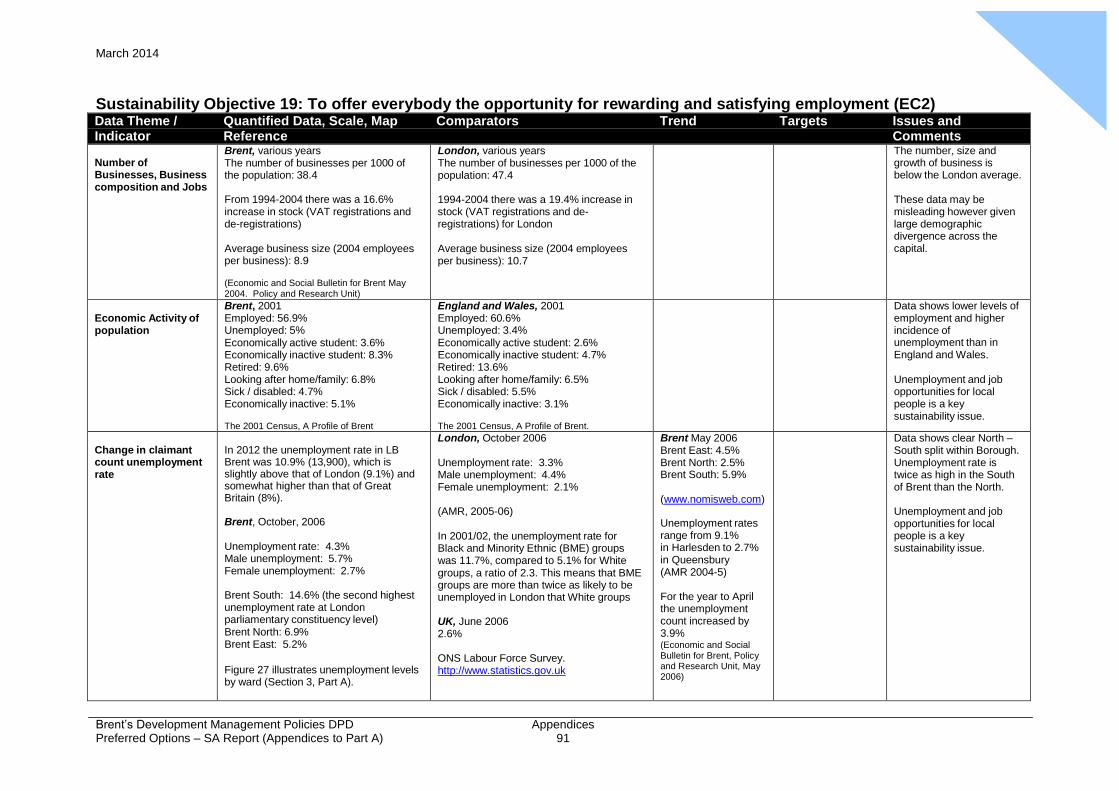
Appendix
5 March 2014
Brent’s Development Management Policies DPD Preferred Options – SA Report (Appendices to Part A)
Appendices 91
Sustainability Objective 19: To offer everybody the opportunity for rewarding and satisfying employment (EC2) Data Theme / Quantified Data, Scale, Map Comparators Trend Targets Issues and Indicator Reference Comments
Number of Businesses, Business composition and Jobs
Brent, various years The number of businesses per 1000 of the population: 38.4
From 1994-2004 there was a 16.6% increase in stock (VAT registrations and de-registrations)
Average business size (2004 employees per business): 8.9
(Economic and Social Bulletin for Brent May 2004. Policy and Research Unit)
London, various years The number of businesses per 1000 of the population: 47.4
1994-2004 there was a 19.4% increase in stock (VAT registrations and de- registrations) for London
Average business size (2004 employees per business): 10.7
The number, size and growth of business is below the London average.
These data may be misleading however given large demographic divergence across the capital.
Economic Activity of population
Brent, 2001 Employed: 56.9% Unemployed: 5% Economically active student: 3.6% Economically inactive student: 8.3% Retired: 9.6% Looking after home/family: 6.8% Sick / disabled: 4.7% Economically inactive: 5.1%
The 2001 Census, A Profile of Brent
England and Wales, 2001 Employed: 60.6% Unemployed: 3.4% Economically active student: 2.6% Economically inactive student: 4.7% Retired: 13.6% Looking after home/family: 6.5% Sick / disabled: 5.5% Economically inactive: 3.1%
The 2001 Census, A Profile of Brent.
Data shows lower levels of employment and higher incidence of unemployment than in England and Wales.
Unemployment and job opportunities for local people is a key sustainability issue.
Change in claimant count unemployment rate
In 2012 the unemployment rate in LB Brent was 10.9% (13,900), which is slightly above that of London (9.1%) and somewhat higher than that of Great Britain (8%). Brent, October, 2006
Unemployment rate: 4.3% Male unemployment: 5.7% Female unemployment: 2.7%
Brent South: 14.6% (the second highest unemployment rate at London parliamentary constituency level) Brent North: 6.9% Brent East: 5.2%
Figure 27 illustrates unemployment levels by ward (Section 3, Part A).
London, October 2006
Unemployment rate: 3.3% Male unemployment: 4.4% Female unemployment: 2.1%
(AMR, 2005-06)
In 2001/02, the unemployment rate for Black and Minority Ethnic (BME) groups was 11.7%, compared to 5.1% for White groups, a ratio of 2.3. This means that BME groups are more than twice as likely to be unemployed in London that White groups
UK, June 2006 2.6%
ONS Labour Force Survey. http://www.statistics.gov.uk
Brent May 2006 Brent East: 4.5% Brent North: 2.5% Brent South: 5.9%
(www.nomisweb.com)
Unemployment rates range from 9.1% in Harlesden to 2.7% in Queensbury (AMR 2004-5)
For the year to April the unemployment count increased by 3.9% (Economic and Social Bulletin for Brent, Policy and Research Unit, May 2006)
Data shows clear North – South split within Borough. Unemployment rate is twice as high in the South of Brent than the North.
Unemployment and job opportunities for local people is a key sustainability issue.

Appendix
5 March 2014
Brent’s Development Management Policies DPD Preferred Options – SA Report (Appendices to Part A)
Appendices 92
Data Theme / Quantified Data, Scale, Map Comparators Trend Targets Issues and Indicator Reference Comments
March 2004 Borough Count: 8213 Borough rate: 4.5%
Brent East: 4.6% Brent North: 2.7% Brent South: 6.1%
(Economic and Social Bulletin for Brent, Policy and Research Unit, May 2004)
Long-term unemployment (percentage of unemployed who have been out of work for over one year)
Brent, April 2007
25.1% of long-term unemployment
Source: claimant count (www.nomisweb.co.uk)
London
20.3% long-term unemployment (April, 2007) 19.5 long-term unemployment (June 2006)
Great Britain
16.7& (April, 2007)
UK
15.7% (June, 2006)
Source: claimant count (www.nomisweb.co.uk)
Brent, June 2006
21.7% of long-term unemployment
Source: claimant count (www.nomisweb.co.uk )
Brent is ranked as the 39
th most employment
deprived district in the country
(IMD 2004)
2001 The proportion of unemployed residents designated as long term unemployed (claiming benefits for more than 52 weeks) was over a third higher than the UK average. Brent was ranked as the 32nd most employment deprived district in the country and within the top 10% most deprived.
Unemployment and job opportunities for local people is a key sustainability issue.
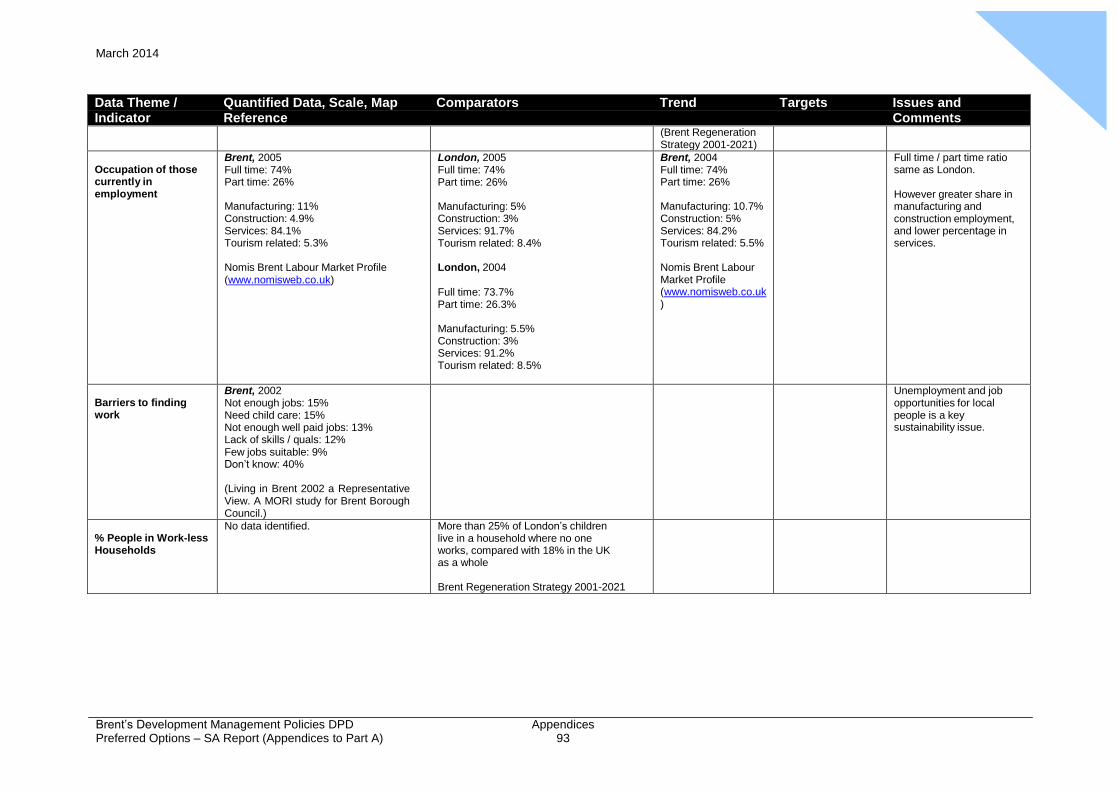
Appendix
5 March 2014
Brent’s Development Management Policies DPD Preferred Options – SA Report (Appendices to Part A)
Appendices 93
Data Theme / Quantified Data, Scale, Map Comparators Trend Targets Issues and Indicator Reference Comments
(Brent Regeneration Strategy 2001-2021)
Occupation of those currently in employment
Brent, 2005 Full time: 74% Part time: 26%
Manufacturing: 11% Construction: 4.9% Services: 84.1% Tourism related: 5.3%
Nomis Brent Labour Market Profile (www.nomisweb.co.uk)
London, 2005 Full time: 74% Part time: 26%
Manufacturing: 5% Construction: 3% Services: 91.7% Tourism related: 8.4%
London, 2004
Full time: 73.7% Part time: 26.3%
Manufacturing: 5.5% Construction: 3% Services: 91.2% Tourism related: 8.5%
Brent, 2004 Full time: 74% Part time: 26%
Manufacturing: 10.7% Construction: 5% Services: 84.2% Tourism related: 5.5%
Nomis Brent Labour Market Profile (www.nomisweb.co.uk )
Full time / part time ratio same as London.
However greater share in manufacturing and construction employment, and lower percentage in services.
Barriers to finding work
Brent, 2002 Not enough jobs: 15% Need child care: 15% Not enough well paid jobs: 13% Lack of skills / quals: 12% Few jobs suitable: 9% Don’t know: 40%
(Living in Brent 2002 a Representative View. A MORI study for Brent Borough Council.)
Unemployment and job opportunities for local people is a key sustainability issue.
% People in Work-less Households
No data identified. More than 25% of London’s children live in a household where no one works, compared with 18% in the UK as a whole
Brent Regeneration Strategy 2001-2021
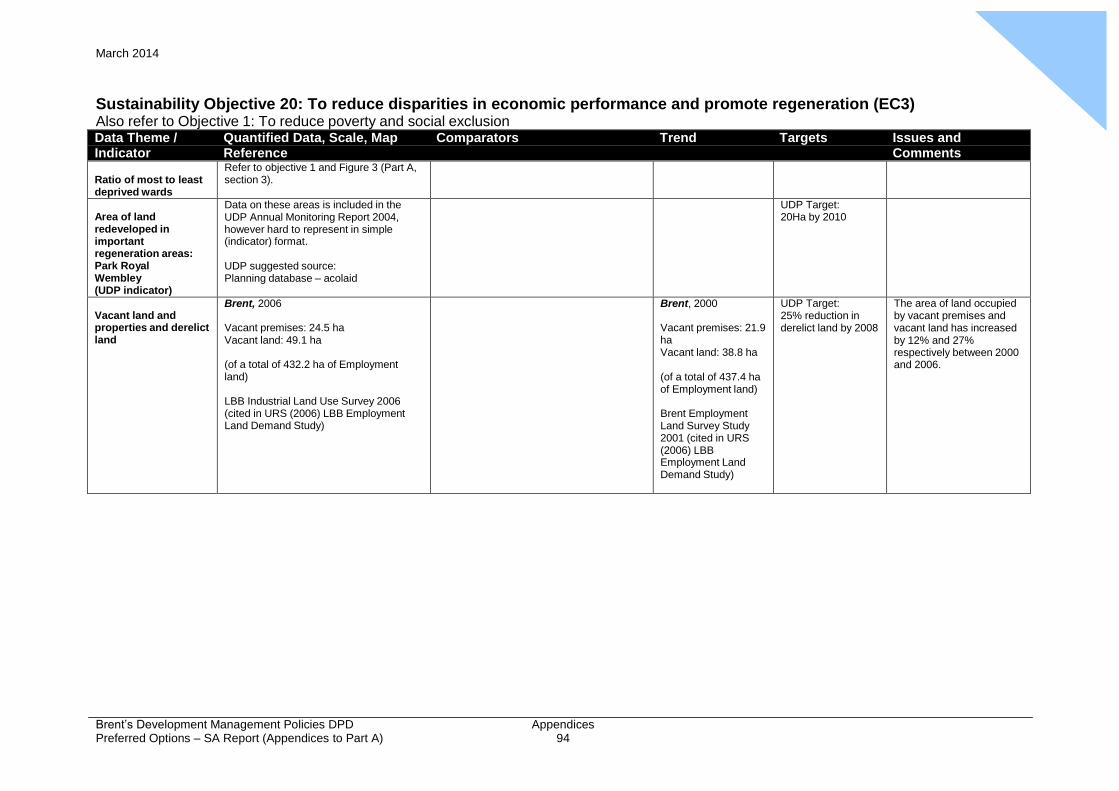
Appendix
5 March 2014
Brent’s Development Management Policies DPD Preferred Options – SA Report (Appendices to Part A)
Appendices 94
Sustainability Objective 20: To reduce disparities in economic performance and promote regeneration (EC3) Also refer to Objective 1: To reduce poverty and social exclusion Data Theme / Quantified Data, Scale, Map Comparators Trend Targets Issues and Indicator Reference Comments
Ratio of most to least deprived wards
Refer to objective 1 and Figure 3 (Part A, section 3).
Area of land redeveloped in important regeneration areas: Park Royal Wembley (UDP indicator)
Data on these areas is included in the UDP Annual Monitoring Report 2004, however hard to represent in simple (indicator) format.
UDP suggested source: Planning database – acolaid
UDP Target: 20Ha by 2010
Vacant land and properties and derelict land
Brent, 2006
Vacant premises: 24.5 ha Vacant land: 49.1 ha
(of a total of 432.2 ha of Employment land)
LBB Industrial Land Use Survey 2006 (cited in URS (2006) LBB Employment Land Demand Study)
Brent, 2000
Vacant premises: 21.9 ha Vacant land: 38.8 ha
(of a total of 437.4 ha of Employment land)
Brent Employment Land Survey Study 2001 (cited in URS (2006) LBB Employment Land Demand Study)
UDP Target: 25% reduction in derelict land by 2008
The area of land occupied by vacant premises and vacant land has increased by 12% and 27% respectively between 2000 and 2006.
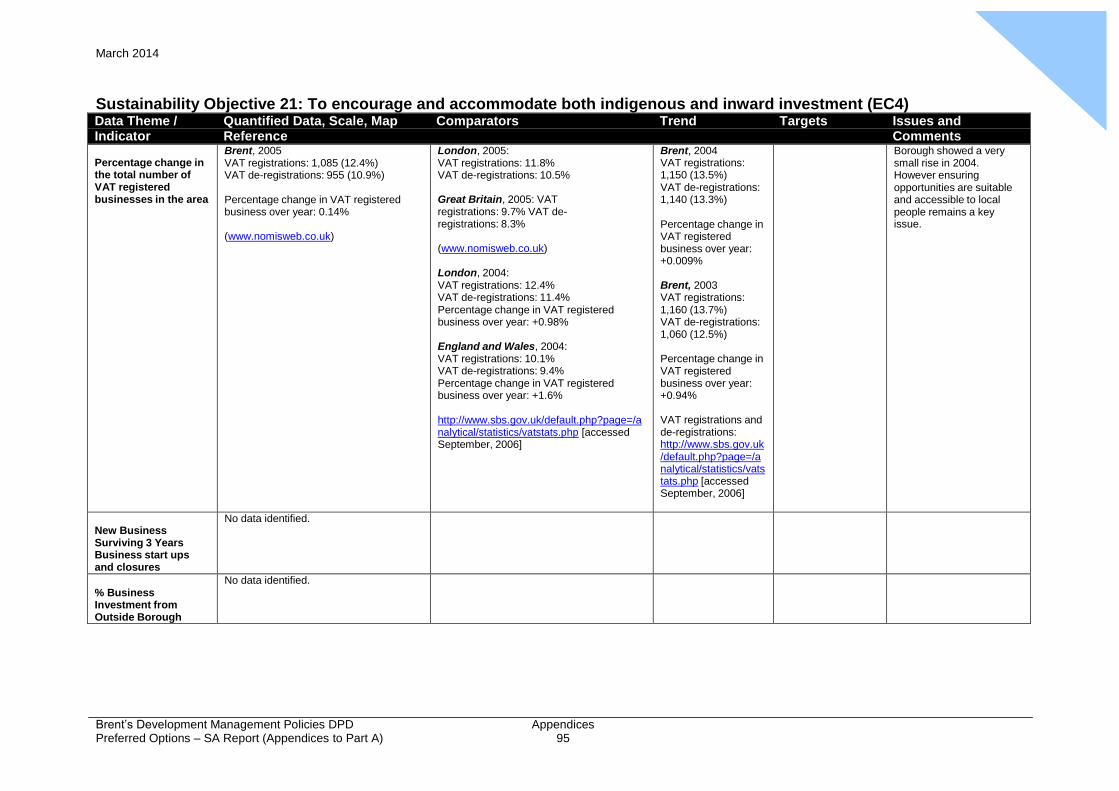
Appendix
5 March 2014
Brent’s Development Management Policies DPD Preferred Options – SA Report (Appendices to Part A)
Appendices 95
Sustainability Objective 21: To encourage and accommodate both indigenous and inward investment (EC4) Data Theme / Quantified Data, Scale, Map Comparators Trend Targets Issues and Indicator Reference Comments
Percentage change in the total number of VAT registered businesses in the area
Brent, 2005 VAT registrations: 1,085 (12.4%) VAT de-registrations: 955 (10.9%)
Percentage change in VAT registered business over year: 0.14%
(www.nomisweb.co.uk)
London, 2005: VAT registrations: 11.8% VAT de-registrations: 10.5%
Great Britain, 2005: VAT registrations: 9.7% VAT de-registrations: 8.3%
(www.nomisweb.co.uk)
London, 2004: VAT registrations: 12.4% VAT de-registrations: 11.4% Percentage change in VAT registered business over year: +0.98%
England and Wales, 2004: VAT registrations: 10.1% VAT de-registrations: 9.4% Percentage change in VAT registered business over year: +1.6%
http://www.sbs.gov.uk/default.php?page=/a nalytical/statistics/vatstats.php [accessed September, 2006]
Brent, 2004 VAT registrations: 1,150 (13.5%) VAT de-registrations: 1,140 (13.3%)
Percentage change in VAT registered business over year: +0.009%
Brent, 2003 VAT registrations: 1,160 (13.7%) VAT de-registrations: 1,060 (12.5%)
Percentage change in VAT registered business over year: +0.94%
VAT registrations and de-registrations: http://www.sbs.gov.uk /default.php?page=/a nalytical/statistics/vats tats.php [accessed September, 2006]
Borough showed a very small rise in 2004. However ensuring opportunities are suitable and accessible to local people remains a key issue.
New Business Surviving 3 Years Business start ups and closures
No data identified.
% Business Investment from Outside Borough
No data identified.
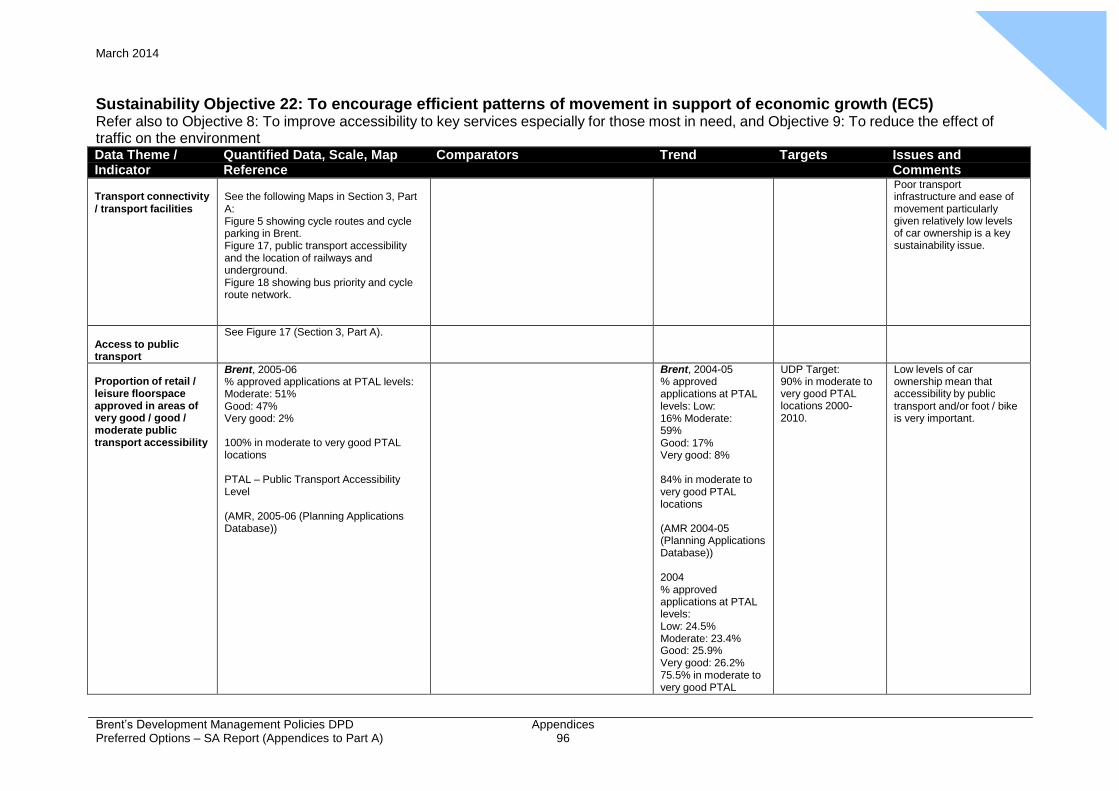
Appendix
5 March 2014
Brent’s Development Management Policies DPD Preferred Options – SA Report (Appendices to Part A)
Appendices 96
Sustainability Objective 22: To encourage efficient patterns of movement in support of economic growth (EC5) Refer also to Objective 8: To improve accessibility to key services especially for those most in need, and Objective 9: To reduce the effect of traffic on the environment Data Theme / Quantified Data, Scale, Map Comparators Trend Targets Issues and Indicator Reference Comments
Transport connectivity / transport facilities
See the following Maps in Section 3, Part A: Figure 5 showing cycle routes and cycle parking in Brent. Figure 17, public transport accessibility and the location of railways and underground. Figure 18 showing bus priority and cycle route network.
Poor transport infrastructure and ease of movement particularly given relatively low levels of car ownership is a key sustainability issue.
Access to public transport
See Figure 17 (Section 3, Part A).
Proportion of retail / leisure floorspace approved in areas of very good / good / moderate public transport accessibility
Brent, 2005-06 % approved applications at PTAL levels: Moderate: 51% Good: 47% Very good: 2%
100% in moderate to very good PTAL locations
PTAL – Public Transport Accessibility Level
(AMR, 2005-06 (Planning Applications Database))
Brent, 2004-05 % approved applications at PTAL levels: Low: 16% Moderate: 59% Good: 17% Very good: 8%
84% in moderate to very good PTAL locations
(AMR 2004-05 (Planning Applications Database))
2004 % approved applications at PTAL levels: Low: 24.5% Moderate: 23.4% Good: 25.9% Very good: 26.2% 75.5% in moderate to very good PTAL
UDP Target: 90% in moderate to very good PTAL locations 2000- 2010.
Low levels of car ownership mean that accessibility by public transport and/or foot / bike is very important.
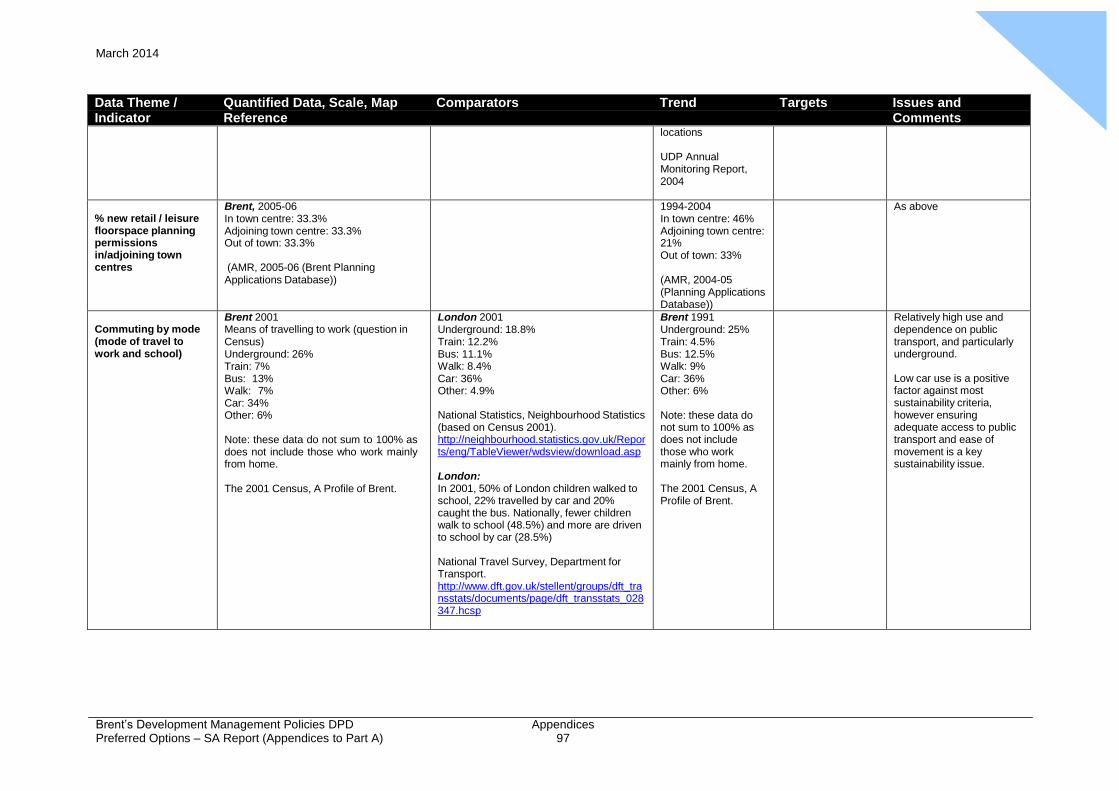
Appendix
5 March 2014
Brent’s Development Management Policies DPD Preferred Options – SA Report (Appendices to Part A)
Appendices 97
Data Theme / Quantified Data, Scale, Map Comparators Trend Targets Issues and Indicator Reference Comments
locations
UDP Annual Monitoring Report, 2004
% new retail / leisure floorspace planning permissions in/adjoining town centres
Brent, 2005-06 In town centre: 33.3% Adjoining town centre: 33.3% Out of town: 33.3%
(AMR, 2005-06 (Brent Planning Applications Database))
1994-2004 In town centre: 46% Adjoining town centre: 21% Out of town: 33%
(AMR, 2004-05 (Planning Applications Database))
As above
Commuting by mode (mode of travel to work and school)
Brent 2001 Means of travelling to work (question in Census) Underground: 26% Train: 7% Bus: 13% Walk: 7% Car: 34% Other: 6%
Note: these data do not sum to 100% as does not include those who work mainly from home.
The 2001 Census, A Profile of Brent.
London 2001 Underground: 18.8% Train: 12.2% Bus: 11.1% Walk: 8.4% Car: 36% Other: 4.9%
National Statistics, Neighbourhood Statistics (based on Census 2001). http://neighbourhood.statistics.gov.uk/Repor ts/eng/TableViewer/wdsview/download.asp
London: In 2001, 50% of London children walked to school, 22% travelled by car and 20% caught the bus. Nationally, fewer children walk to school (48.5%) and more are driven to school by car (28.5%)
National Travel Survey, Department for Transport. http://www.dft.gov.uk/stellent/groups/dft_tra nsstats/documents/page/dft_transstats_028 347.hcsp
Brent 1991 Underground: 25% Train: 4.5% Bus: 12.5% Walk: 9% Car: 36% Other: 6%
Note: these data do not sum to 100% as does not include those who work mainly from home.
The 2001 Census, A Profile of Brent.
Relatively high use and dependence on public transport, and particularly underground.
Low car use is a positive factor against most sustainability criteria, however ensuring adequate access to public transport and ease of movement is a key sustainability issue.
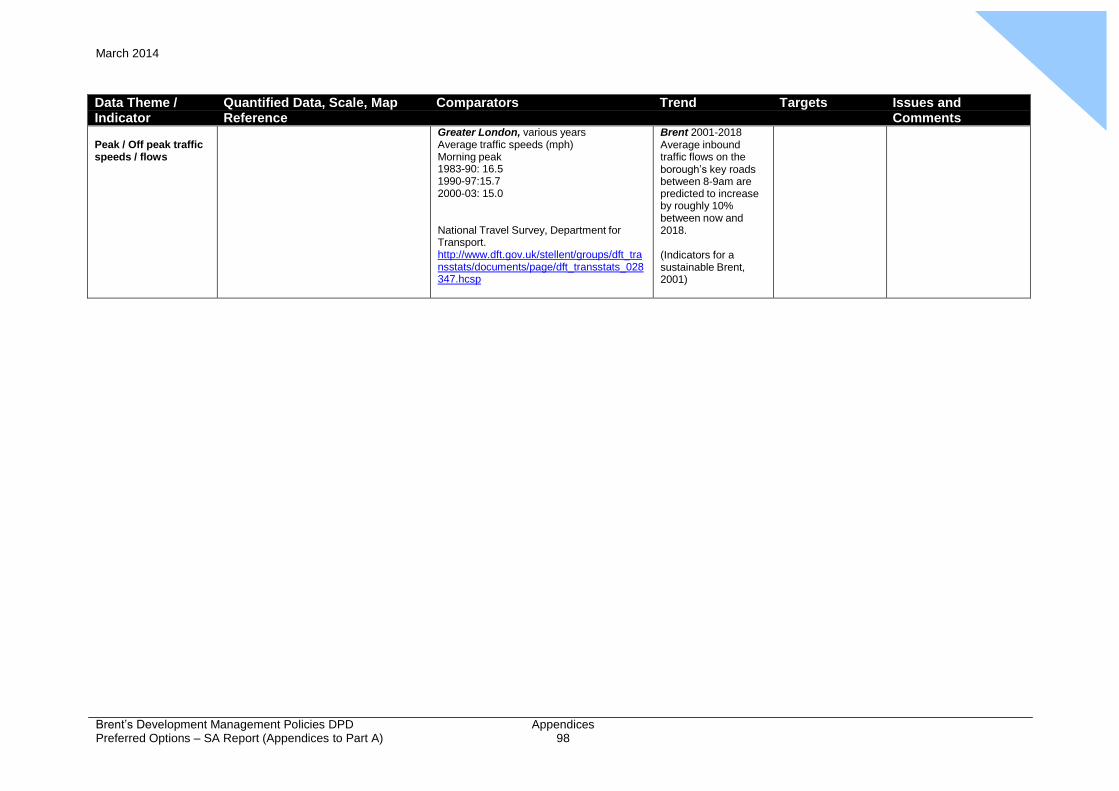
Appendix
5 March 2014
Brent’s Development Management Policies DPD Preferred Options – SA Report (Appendices to Part A)
Appendices 98
Data Theme / Quantified Data, Scale, Map Comparators Trend Targets Issues and Indicator Reference Comments
Peak / Off peak traffic speeds / flows
Greater London, various years Average traffic speeds (mph) Morning peak 1983-90: 16.5 1990-97:15.7 2000-03: 15.0
National Travel Survey, Department for Transport. http://www.dft.gov.uk/stellent/groups/dft_tra nsstats/documents/page/dft_transstats_028 347.hcsp
Brent 2001-2018 Average inbound traffic flows on the borough’s key roads between 8-9am are predicted to increase by roughly 10% between now and 2018.
(Indicators for a sustainable Brent, 2001)
March 2014
Brent’s Development Management Policies Preferred Options – SA Report (Appendices to Part A)
Appendices 99
APPENDIX 5
SUSTAINABILITY OBJECTIVES, CRITERIA, INDICATORS AND
TARGETS

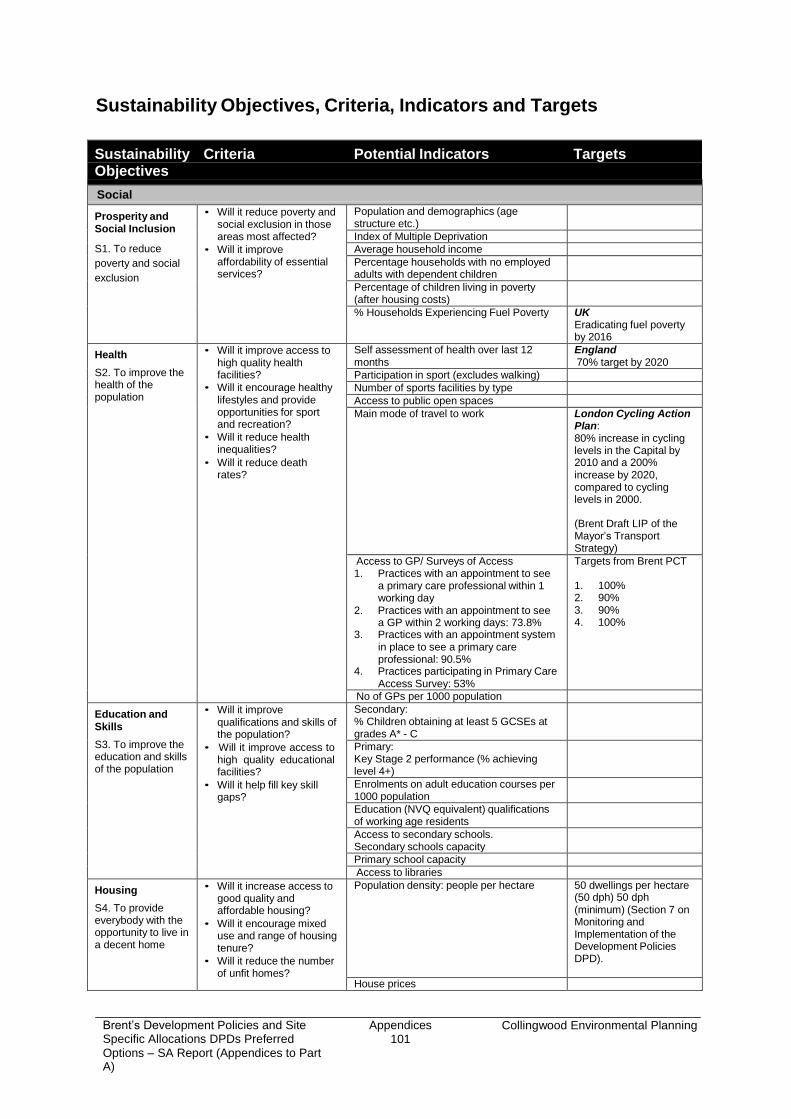
Brent’s Development Policies and Site Specific Allocations DPDs Preferred
Options – SA Report (Appendices to Part A)
Appendices 101
Collingwood Environmental Planning
Sustainability Objectives, Criteria, Indicators and Targets
Sustainability Criteria Potential Indicators Targets Objectives
Social
Prosperity and Social Inclusion
S1. To reduce
poverty and social
exclusion
• Will it reduce poverty and social exclusion in those areas most affected?
• Will it improve affordability of essential services?
Population and demographics (age structure etc.)
Index of Multiple Deprivation Average household income Percentage households with no employed adults with dependent children
Percentage of children living in poverty (after housing costs)
% Households Experiencing Fuel Poverty UK Eradicating fuel poverty by 2016
Health
S2. To improve the health of the population
• Will it improve access to high quality health facilities?
• Will it encourage healthy lifestyles and provide opportunities for sport and recreation?
• Will it reduce health inequalities?
• Will it reduce death rates?
Self assessment of health over last 12 months
England 70% target by 2020
Participation in sport (excludes walking) Number of sports facilities by type Access to public open spaces Main mode of travel to work London Cycling Action
Plan: 80% increase in cycling levels in the Capital by 2010 and a 200% increase by 2020, compared to cycling levels in 2000.
(Brent Draft LIP of the Mayor’s Transport Strategy)
Access to GP/ Surveys of Access 1. Practices with an appointment to see
a primary care professional within 1 working day
2. Practices with an appointment to see a GP within 2 working days: 73.8%
3. Practices with an appointment system in place to see a primary care professional: 90.5%
4. Practices participating in Primary Care Access Survey: 53%
Targets from Brent PCT
1. 100% 2. 90% 3. 90% 4. 100%
No of GPs per 1000 population Education and Skills
S3. To improve the education and skills of the population
• Will it improve qualifications and skills of the population?
• Will it improve access to high quality educational facilities?
• Will it help fill key skill gaps?
Secondary: % Children obtaining at least 5 GCSEs at grades A* - C
Primary: Key Stage 2 performance (% achieving level 4+)
Enrolments on adult education courses per 1000 population
Education (NVQ equivalent) qualifications of working age residents
Access to secondary schools. Secondary schools capacity
Primary school capacity Access to libraries
Housing
S4. To provide everybody with the opportunity to live in a decent home
• Will it increase access to good quality and affordable housing?
• Will it encourage mixed use and range of housing tenure?
• Will it reduce the number of unfit homes?
Population density: people per hectare 50 dwellings per hectare (50 dph) 50 dph (minimum) (Section 7 on Monitoring and Implementation of the Development Policies DPD).
House prices
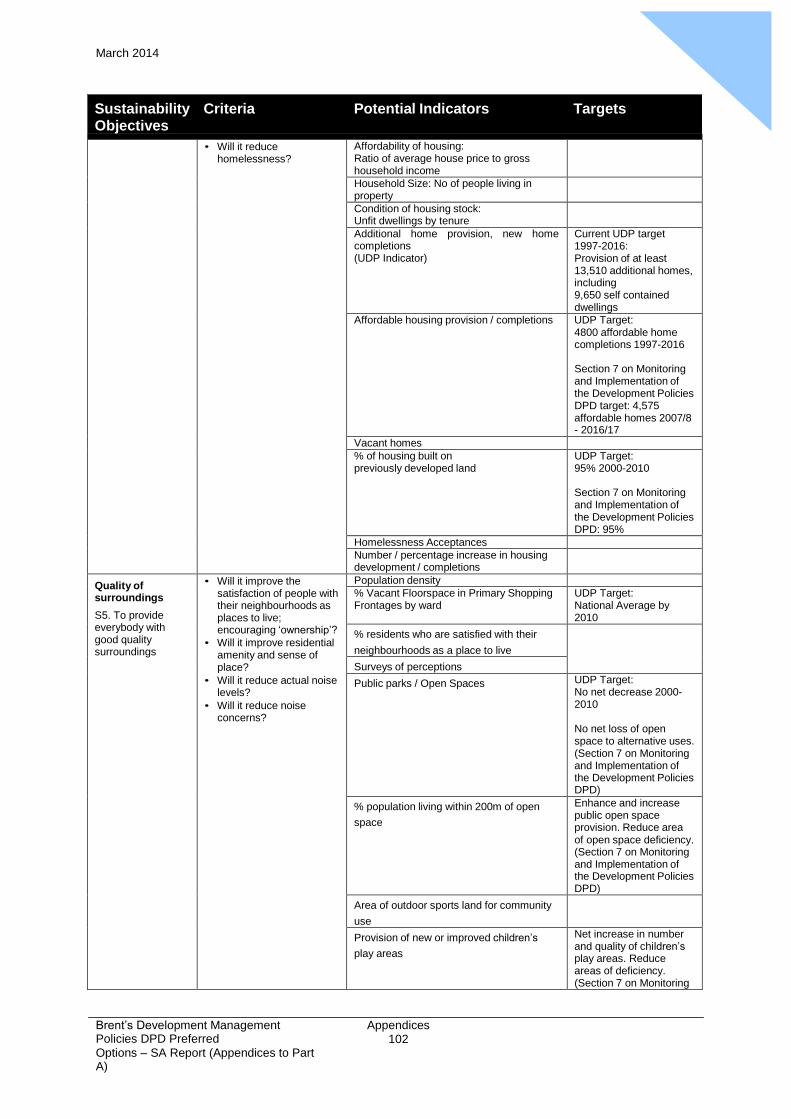
Appendix
6 March 2014
Brent’s Development Management Policies DPD Preferred
Options – SA Report (Appendices to Part A)
Appendices 102
Sustainability Criteria Potential Indicators Targets Objectives
• Will it reduce homelessness?
Affordability of housing: Ratio of average house price to gross household income
Household Size: No of people living in property
Condition of housing stock: Unfit dwellings by tenure
Additional home provision, new home completions (UDP Indicator)
Current UDP target 1997-2016: Provision of at least 13,510 additional homes, including 9,650 self contained dwellings
Affordable housing provision / completions UDP Target: 4800 affordable home completions 1997-2016
Section 7 on Monitoring and Implementation of the Development Policies DPD target: 4,575 affordable homes 2007/8 - 2016/17
Vacant homes % of housing built on previously developed land
UDP Target: 95% 2000-2010
Section 7 on Monitoring and Implementation of the Development Policies DPD: 95%
Homelessness Acceptances Number / percentage increase in housing development / completions
Quality of surroundings
S5. To provide everybody with good quality surroundings
• Will it improve the satisfaction of people with their neighbourhoods as places to live; encouraging ‘ownership’?
• Will it improve residential amenity and sense of place?
• Will it reduce actual noise levels?
• Will it reduce noise concerns?
Population density % Vacant Floorspace in Primary Shopping Frontages by ward
UDP Target: National Average by 2010
% residents who are satisfied with their
neighbourhoods as a place to live
Surveys of perceptions
Public parks / Open Spaces UDP Target: No net decrease 2000- 2010
No net loss of open space to alternative uses. (Section 7 on Monitoring and Implementation of the Development Policies DPD)
% population living within 200m of open
space
Enhance and increase public open space provision. Reduce area of open space deficiency. (Section 7 on Monitoring and Implementation of the Development Policies DPD)
Area of outdoor sports land for community
use
Provision of new or improved children’s
play areas
Net increase in number and quality of children’s play areas. Reduce areas of deficiency. (Section 7 on Monitoring
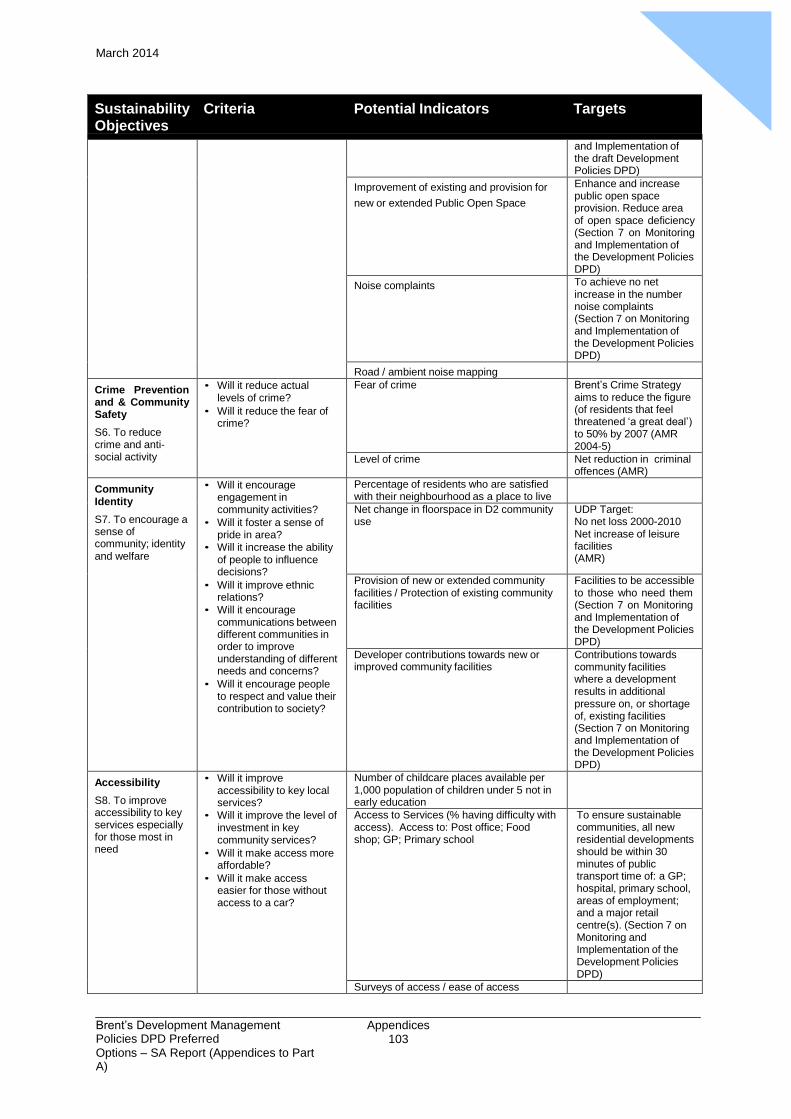
Appendix
6 March 2014
Brent’s Development Management Policies DPD Preferred
Options – SA Report (Appendices to Part A)
Appendices 103
Sustainability Criteria Potential Indicators Targets Objectives
and Implementation of the draft Development Policies DPD)
Improvement of existing and provision for
new or extended Public Open Space
Enhance and increase public open space provision. Reduce area of open space deficiency (Section 7 on Monitoring and Implementation of the Development Policies DPD)
Noise complaints To achieve no net increase in the number noise complaints (Section 7 on Monitoring and Implementation of the Development Policies DPD)
Road / ambient noise mapping Crime Prevention and & Community Safety
S6. To reduce crime and anti- social activity
• Will it reduce actual levels of crime?
• Will it reduce the fear of crime?
Fear of crime Brent’s Crime Strategy aims to reduce the figure (of residents that feel threatened ‘a great deal’) to 50% by 2007 (AMR 2004-5)
Level of crime Net reduction in criminal offences (AMR)
Community Identity
S7. To encourage a sense of community; identity and welfare
• Will it encourage engagement in community activities?
• Will it foster a sense of pride in area?
• Will it increase the ability of people to influence decisions?
• Will it improve ethnic relations?
• Will it encourage communications between different communities in order to improve understanding of different needs and concerns?
• Will it encourage people to respect and value their contribution to society?
Percentage of residents who are satisfied with their neighbourhood as a place to live
Net change in floorspace in D2 community use
UDP Target: No net loss 2000-2010 Net increase of leisure facilities (AMR)
Provision of new or extended community facilities / Protection of existing community facilities
Facilities to be accessible to those who need them (Section 7 on Monitoring and Implementation of the Development Policies DPD)
Developer contributions towards new or improved community facilities
Contributions towards community facilities where a development results in additional pressure on, or shortage of, existing facilities (Section 7 on Monitoring and Implementation of the Development Policies DPD)
Accessibility
S8. To improve accessibility to key services especially for those most in need
• Will it improve accessibility to key local services?
• Will it improve the level of investment in key community services?
• Will it make access more affordable?
• Will it make access easier for those without access to a car?
Number of childcare places available per 1,000 population of children under 5 not in early education
Access to Services (% having difficulty with access). Access to: Post office; Food shop; GP; Primary school
To ensure sustainable communities, all new residential developments should be within 30 minutes of public transport time of: a GP; hospital, primary school, areas of employment; and a major retail centre(s). (Section 7 on Monitoring and Implementation of the Development Policies DPD)
Surveys of access / ease of access
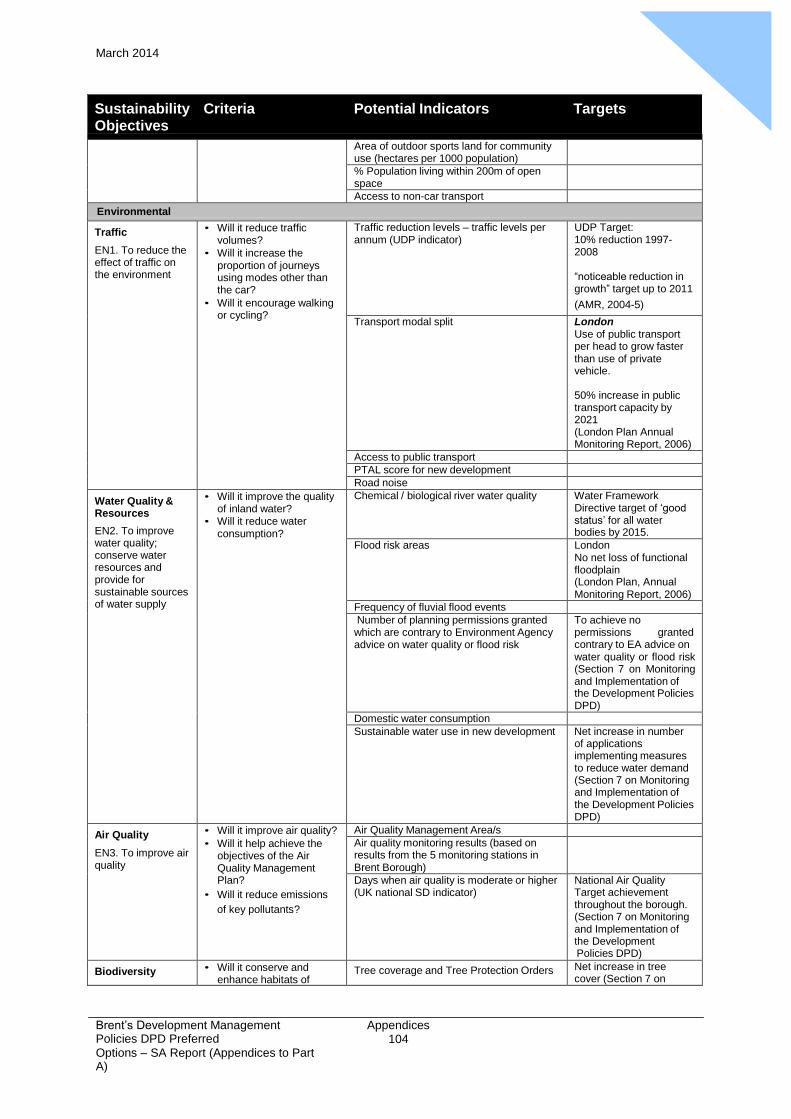
Appendix
6 March 2014
Brent’s Development Management Policies DPD Preferred
Options – SA Report (Appendices to Part A)
Appendices 104
Sustainability Criteria Potential Indicators Targets Objectives
Area of outdoor sports land for community use (hectares per 1000 population)
% Population living within 200m of open space
Access to non-car transport Environmental
Traffic
EN1. To reduce the effect of traffic on the environment
• Will it reduce traffic volumes?
• Will it increase the proportion of journeys using modes other than the car?
• Will it encourage walking or cycling?
Traffic reduction levels – traffic levels per annum (UDP indicator)
UDP Target: 10% reduction 1997- 2008
“noticeable reduction in growth” target up to 2011
(AMR, 2004-5)
Transport modal split London Use of public transport per head to grow faster than use of private vehicle.
50% increase in public transport capacity by 2021 (London Plan Annual Monitoring Report, 2006)
Access to public transport PTAL score for new development Road noise
Water Quality & Resources
EN2. To improve water quality; conserve water resources and provide for sustainable sources of water supply
• Will it improve the quality of inland water?
• Will it reduce water consumption?
Chemical / biological river water quality Water Framework Directive target of ‘good status’ for all water bodies by 2015.
Flood risk areas London No net loss of functional floodplain (London Plan, Annual Monitoring Report, 2006)
Frequency of fluvial flood events Number of planning permissions granted which are contrary to Environment Agency advice on water quality or flood risk
To achieve no permissions granted contrary to EA advice on water quality or flood risk (Section 7 on Monitoring and Implementation of the Development Policies DPD)
Domestic water consumption Sustainable water use in new development Net increase in number
of applications implementing measures to reduce water demand (Section 7 on Monitoring and Implementation of the Development Policies DPD)
Air Quality
EN3. To improve air quality
• Will it improve air quality?
• Will it help achieve the objectives of the Air Quality Management Plan?
• Will it reduce emissions
of key pollutants?
Air Quality Management Area/s Air quality monitoring results (based on results from the 5 monitoring stations in Brent Borough)
Days when air quality is moderate or higher (UK national SD indicator)
National Air Quality Target achievement throughout the borough. (Section 7 on Monitoring and Implementation of the Development Policies DPD)
Biodiversity • Will it conserve and enhance habitats of
Tree coverage and Tree Protection Orders Net increase in tree cover (Section 7 on
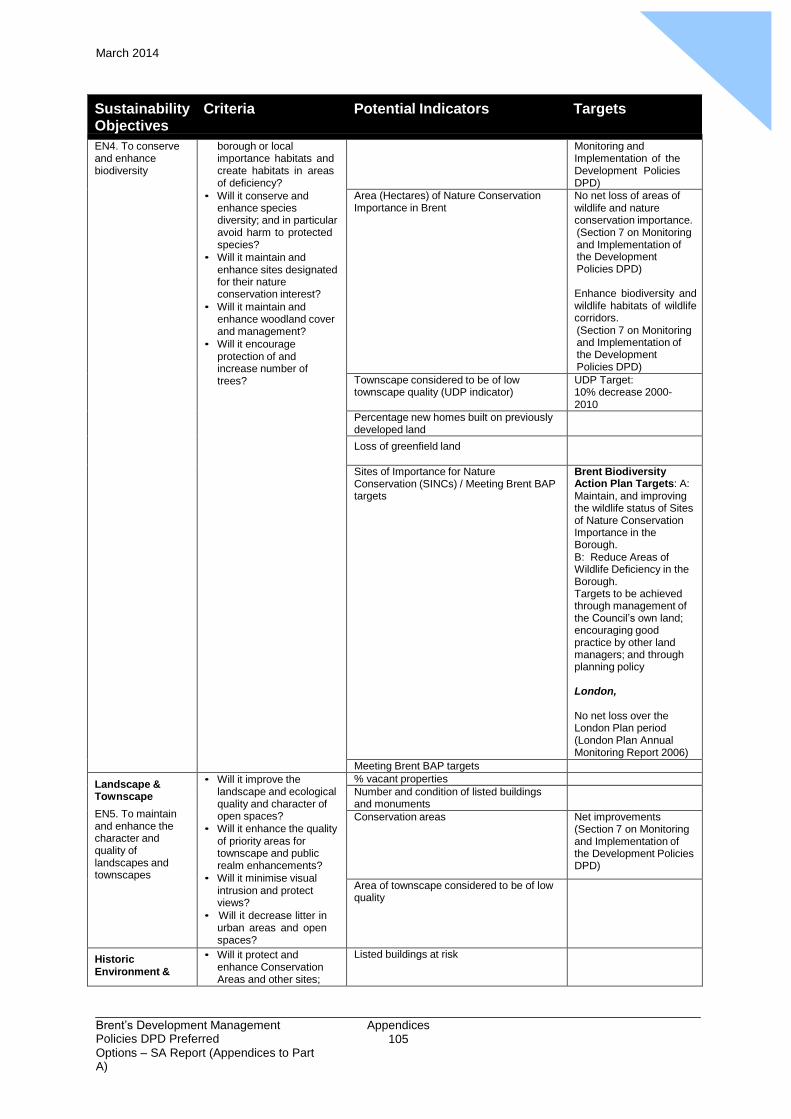
Appendix
6 March 2014
Brent’s Development Management Policies DPD Preferred
Options – SA Report (Appendices to Part A)
Appendices 105
Sustainability Criteria Potential Indicators Targets Objectives
EN4. To conserve and enhance biodiversity
borough or local importance habitats and create habitats in areas of deficiency?
• Will it conserve and enhance species diversity; and in particular avoid harm to protected species?
• Will it maintain and enhance sites designated for their nature conservation interest?
• Will it maintain and enhance woodland cover and management?
• Will it encourage protection of and increase number of trees?
Monitoring and Implementation of the Development Policies DPD)
Area (Hectares) of Nature Conservation Importance in Brent
No net loss of areas of wildlife and nature conservation importance. (Section 7 on Monitoring and Implementation of the Development Policies DPD)
Enhance biodiversity and wildlife habitats of wildlife corridors. (Section 7 on Monitoring and Implementation of the Development Policies DPD)
Townscape considered to be of low townscape quality (UDP indicator)
UDP Target: 10% decrease 2000- 2010
Percentage new homes built on previously developed land
Loss of greenfield land
Sites of Importance for Nature Conservation (SINCs) / Meeting Brent BAP targets
Brent Biodiversity Action Plan Targets: A: Maintain, and improving the wildlife status of Sites of Nature Conservation Importance in the Borough. B: Reduce Areas of Wildlife Deficiency in the Borough. Targets to be achieved through management of the Council’s own land; encouraging good practice by other land managers; and through planning policy
London,
No net loss over the London Plan period (London Plan Annual Monitoring Report 2006)
Meeting Brent BAP targets Landscape & Townscape
EN5. To maintain and enhance the character and quality of landscapes and townscapes
• Will it improve the landscape and ecological quality and character of open spaces?
• Will it enhance the quality of priority areas for townscape and public realm enhancements?
• Will it minimise visual intrusion and protect views?
• Will it decrease litter in urban areas and open spaces?
% vacant properties Number and condition of listed buildings and monuments
Conservation areas Net improvements (Section 7 on Monitoring and Implementation of the Development Policies DPD)
Area of townscape considered to be of low quality
Historic Environment &
• Will it protect and enhance Conservation Areas and other sites;
Listed buildings at risk
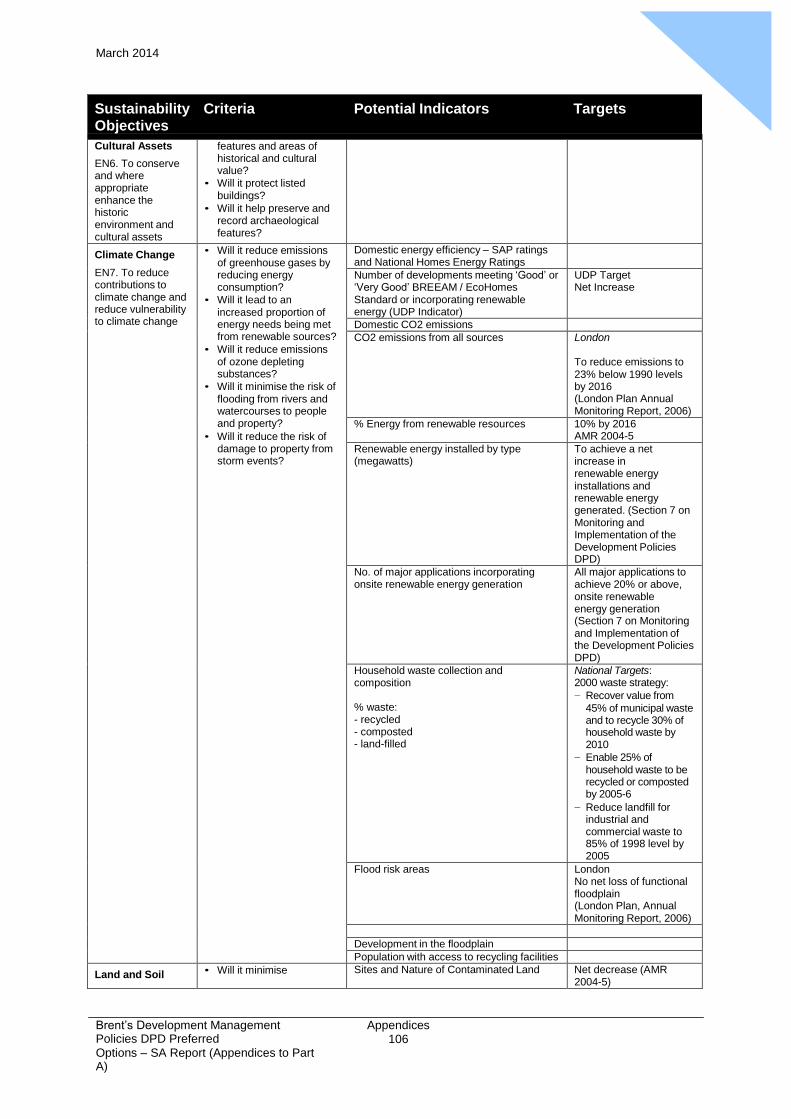
Appendix
6 March 2014
Brent’s Development Management Policies DPD Preferred
Options – SA Report (Appendices to Part A)
Appendices 106
Sustainability Criteria Potential Indicators Targets Objectives
Cultural Assets
EN6. To conserve and where appropriate enhance the historic environment and cultural assets
features and areas of historical and cultural value?
• Will it protect listed buildings?
• Will it help preserve and record archaeological features?
Climate Change
EN7. To reduce contributions to climate change and reduce vulnerability to climate change
• Will it reduce emissions of greenhouse gases by reducing energy consumption?
• Will it lead to an increased proportion of energy needs being met from renewable sources?
• Will it reduce emissions of ozone depleting substances?
• Will it minimise the risk of flooding from rivers and watercourses to people and property?
• Will it reduce the risk of damage to property from storm events?
Domestic energy efficiency – SAP ratings and National Homes Energy Ratings
Number of developments meeting ‘Good’ or ‘Very Good’ BREEAM / EcoHomes Standard or incorporating renewable energy (UDP Indicator)
UDP Target Net Increase
Domestic CO2 emissions CO2 emissions from all sources London
To reduce emissions to 23% below 1990 levels by 2016 (London Plan Annual Monitoring Report, 2006)
% Energy from renewable resources 10% by 2016 AMR 2004-5
Renewable energy installed by type (megawatts)
To achieve a net increase in renewable energy installations and renewable energy generated. (Section 7 on Monitoring and Implementation of the Development Policies DPD)
No. of major applications incorporating onsite renewable energy generation
All major applications to achieve 20% or above, onsite renewable energy generation (Section 7 on Monitoring and Implementation of the Development Policies DPD)
Household waste collection and composition
% waste: - recycled - composted - land-filled
National Targets: 2000 waste strategy:
− Recover value from
45% of municipal waste and to recycle 30% of household waste by 2010
− Enable 25% of household waste to be recycled or composted by 2005-6
− Reduce landfill for industrial and commercial waste to 85% of 1998 level by 2005
Flood risk areas London No net loss of functional floodplain (London Plan, Annual Monitoring Report, 2006)
Development in the floodplain Population with access to recycling facilities
Land and Soil • Will it minimise Sites and Nature of Contaminated Land Net decrease (AMR 2004-5)

Appendix
6 March 2014
Brent’s Development Management Policies DPD Preferred
Options – SA Report (Appendices to Part A)
Appendices 107
Sustainability Criteria Potential Indicators Targets Objectives
EN9. To conserve and enhance land quality and soil resources
development on greenfield sites?
• Will it ensure that where possible; new development occurs on derelict; vacant and underused previously developed land and buildings?
• Will it ensure land is remediated as appropriate?
• Will it minimise the loss of soils to development?
• Will it maintain and enhance soil quality?
• Will it reduce the risk of subsidence?
% of housing built on previously developed land (UDP Indicator)
UDP Target: 95% 2000-2010
Stock / Area of Vacant and Brownfield Land Loss of greenfield land
Economic
Growth
EC1. To encourage sustainable economic growth
• Will it encourage new business start-ups and opportunities for local people?
• Will it improve business development and enhance productivity?
• Will it improve the resilience of business and the local economy?
• Will it promote growth in key sectors?
• Will it promote growth in key clusters?
• Will it enhance the image of the area as a business location?
Number of Businesses, Business composition and Jobs
Uses of land in employment use across the borough
Net increase in the amount of floorspace developed by type.
Net increase in the amount of floorspace developed by type in employment or regeneration areas.
Maintain integrity of Strategic and Borough employment area designations, subject to SSAs.
5% or less losses of employment land in employment/regeneration areas and local authority areas. (Section 7 on Monitoring and Implementation of the Development Policies DPD)
Employment
EC2. To offer everybody the opportunity for rewarding and satisfying employment
• Will it reduce short and long-term local unemployment?
• Will it provide job opportunities for those most in need of employment?
• Will it help to reduce long hours worked?
• Will it help to improve earnings?
Change in claimant count unemployment rate
Long-term unemployment (percentage of unemployed who have been out of work for over one year)
% People in Work-less Households
Regeneration
EC3. To reduce disparities in economic performance and promote sustainable regeneration
• Will it promote regeneration; reducing disparity with surrounding areas?
Vacant land and properties and derelict land
UDP Target: 25% reduction in derelict land by 2008
Ratio of most to least deprived wards Area of land redeveloped in important regeneration areas: Park Royal Wembley
UDP Target: 20Ha by 2010
Investment • Will it encourage % Business Investment from Outside Borough
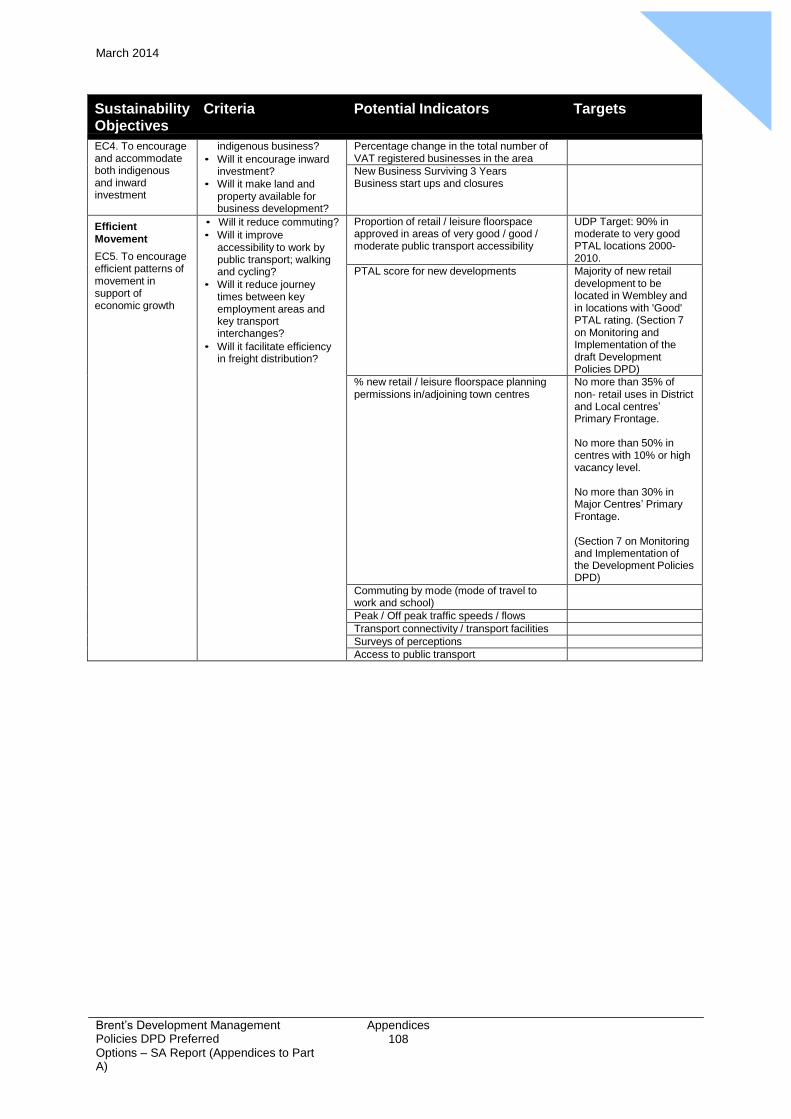
Appendix
6 March 2014
Brent’s Development Management Policies DPD Preferred
Options – SA Report (Appendices to Part A)
Appendices 108
Sustainability Criteria Potential Indicators Targets Objectives
EC4. To encourage and accommodate both indigenous and inward investment
indigenous business?
• Will it encourage inward investment?
• Will it make land and property available for business development?
Percentage change in the total number of VAT registered businesses in the area
New Business Surviving 3 Years Business start ups and closures
Efficient Movement
EC5. To encourage efficient patterns of movement in support of economic growth
• Will it reduce commuting?
• Will it improve accessibility to work by public transport; walking and cycling?
• Will it reduce journey times between key employment areas and key transport interchanges?
• Will it facilitate efficiency in freight distribution?
Proportion of retail / leisure floorspace approved in areas of very good / good / moderate public transport accessibility
UDP Target: 90% in moderate to very good PTAL locations 2000- 2010.
PTAL score for new developments Majority of new retail development to be located in Wembley and in locations with 'Good' PTAL rating. (Section 7 on Monitoring and Implementation of the draft Development Policies DPD)
% new retail / leisure floorspace planning permissions in/adjoining town centres
No more than 35% of non- retail uses in District and Local centres’ Primary Frontage.
No more than 50% in centres with 10% or high vacancy level.
No more than 30% in Major Centres’ Primary Frontage.
(Section 7 on Monitoring and Implementation of the Development Policies DPD)
Commuting by mode (mode of travel to work and school)
Peak / Off peak traffic speeds / flows Transport connectivity / transport facilities Surveys of perceptions Access to public transport
Brent’s Development Management Policies DPD Preferred
Options – SA Report (Appendices to Part A)
Appendices 109
Appendix
6 March 2014
APPENDIX 6
SIGNIFICANCE CRITERIA

Appendix
6 March 2014
Background and preamble A set of ‘generic’ significance criteria was developed to provide guidance to help in scoring
significance when completing the SA matrices, see overleaf. Perhaps more importantly the
criteria provide a degree of transparency as to the reasoning behind allocating individual
scores, such that anyone reading the SA Report should be able to understand the rationale
underlying the score, even if they do not entirely agree with the score given.
It is important to recognise that the creation of pre-determined significance criteria is not a
substitute for applying expert judgement:
• Completeness will never be possible, nor appropriate. Significance criteria are broad,
and provide guidance to arriving at significance judgements rather than offer an
accurate scale or series of thresholds. Such thresholds may be possible, but only in
specific cases or projects and at small geographical scales, where, for example specific
impacts and receptors can be both identified and understood.
• Significance criteria will be case and location specific. Separate criteria will need to be
developed in all SA and SEA examples.
• Expert judgement and local knowledge will remain a key and fundamental aspect of
appraisal and significance scoring. Even when a scale or set of significance criteria
have been developed, a series of judgements will still be required to decide the likely
level of the effect(s) of a particular policy drawing on the evidence base available.
• Given this, differences of opinion and inconsistency remain possible. In particular the
complexity surrounding predicting the effects of implementing a particular policy will
remain even where significance criteria are introduced. Indirect, cumulative and long-
term effects are still likely to lead to uncertainty, and different appraisers may still assign
divergent scores in the same circumstances. The generic significance criteria described here were developed further for each
sustainability objective used in the completed SA of the Core Strategy Preferred Options to
make them applicable to the Brent context, and can be provided on request.
The significance criteria developed for the SA of the Core Strategy DPD Preferred Options
were also applicable to the SAs of the Development Policies and the Site Specific Allocation
Preferred Options.
By way of illustration, the description of what would constitute a ‘major positive’ effect in the
case of the sustainability objective S1 ‘To reduce poverty and social inclusion’ is as follows: • The policy or option is likely to significantly reduce disparity and inequality within
Borough, especially between the most deprived areas (Harlseden, Willesden, Kilburn
Brent’s Development Management Policies DPD Preferred Options – SA Report (Appendices to Part A)
111
Appendix
6 March 2014
and Crickelwood) and those less deprived. In the long term it may lead to the alleviation
of certain inequalities.
• It is likely to reduce significantly the number of households suffering from fuel poverty.
The long-term effects are likely to lead to the eradication of fuel poverty in vulnerable
households in the borough by 2010 and by 2016, as far as reasonably practical, for no
person in England to be in fuel poverty (Fuel Poverty in England: The Government’s
Plan for Action).
• Much improved access and affordability of essential services will be created.
• The policy or option is likely to create significant and suitable employment opportunities
for local people.
• Sites: a major positive if all or most of the sites in or within easy access of most deprived
wards; if providing a significant number of affordable homes;
Note that the criteria for a particular significance of effect category (major positive, minor
positive, neutral etc) are not meant to be exhaustive. They are intended to provide guidance
on the scores assigned during the appraisal, to ensure transparency and consistency of
scoring. A score can be assigned without all the criteria within a significance of effect
category being met – it would generally be assigned if one or more of the categories are
met. They are not intended to be used as checklist, which suggests a level of accuracy in
scoring which is simply not possible in the majority of cases.
Brent’s Development Management Policies DPD Preferred Options – SA Report (Appendices to Part A)
Appendices 112
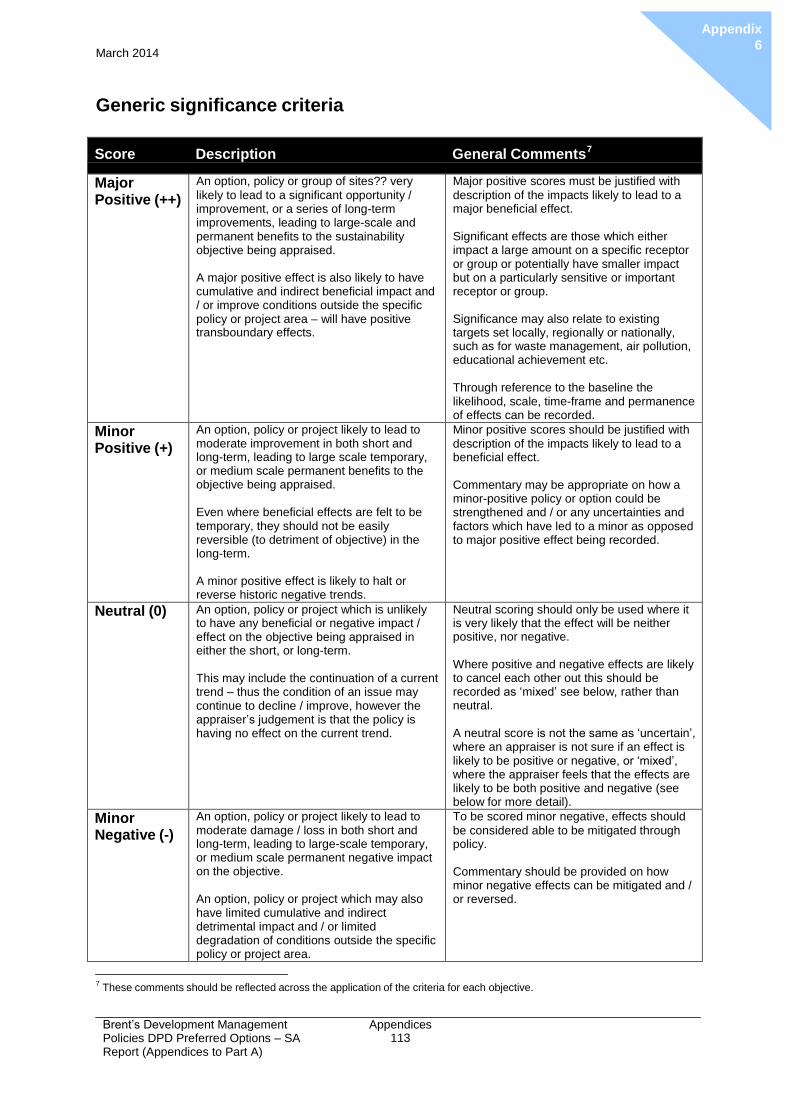
Appendix
6 March 2014
Generic significance criteria
Score Description General Comments7
Major Positive (++)
An option, policy or group of sites?? very
likely to lead to a significant opportunity / improvement, or a series of long-term improvements, leading to large-scale and permanent benefits to the sustainability objective being appraised.
A major positive effect is also likely to have cumulative and indirect beneficial impact and / or improve conditions outside the specific policy or project area – will have positive transboundary effects.
Major positive scores must be justified with
description of the impacts likely to lead to a major beneficial effect.
Significant effects are those which either impact a large amount on a specific receptor or group or potentially have smaller impact but on a particularly sensitive or important receptor or group.
Significance may also relate to existing targets set locally, regionally or nationally, such as for waste management, air pollution, educational achievement etc.
Through reference to the baseline the likelihood, scale, time-frame and permanence of effects can be recorded.
Minor Positive (+)
An option, policy or project likely to lead to moderate improvement in both short and long-term, leading to large scale temporary, or medium scale permanent benefits to the objective being appraised.
Even where beneficial effects are felt to be temporary, they should not be easily reversible (to detriment of objective) in the long-term.
A minor positive effect is likely to halt or reverse historic negative trends.
Minor positive scores should be justified with
description of the impacts likely to lead to a beneficial effect.
Commentary may be appropriate on how a minor-positive policy or option could be strengthened and / or any uncertainties and factors which have led to a minor as opposed to major positive effect being recorded.
Neutral (0) An option, policy or project which is unlikely to have any beneficial or negative impact / effect on the objective being appraised in either the short, or long-term.
This may include the continuation of a current trend – thus the condition of an issue may continue to decline / improve, however the appraiser’s judgement is that the policy is having no effect on the current trend.
Neutral scoring should only be used where it is very likely that the effect will be neither positive, nor negative.
Where positive and negative effects are likely to cancel each other out this should be recorded as ‘mixed’ see below, rather than neutral.
A neutral score is not the same as ‘uncertain’, where an appraiser is not sure if an effect is likely to be positive or negative, or ‘mixed’, where the appraiser feels that the effects are likely to be both positive and negative (see below for more detail).
Minor Negative (-)
An option, policy or project likely to lead to moderate damage / loss in both short and long-term, leading to large-scale temporary, or medium scale permanent negative impact on the objective.
An option, policy or project which may also have limited cumulative and indirect detrimental impact and / or limited degradation of conditions outside the specific policy or project area.
To be scored minor negative, effects should
be considered able to be mitigated through policy.
Commentary should be provided on how minor negative effects can be mitigated and / or reversed.
7
These comments should be reflected across the application of the criteria for each objective.
Brent’s Development Management Policies DPD Preferred Options – SA Report (Appendices to Part A)
Appendices 113
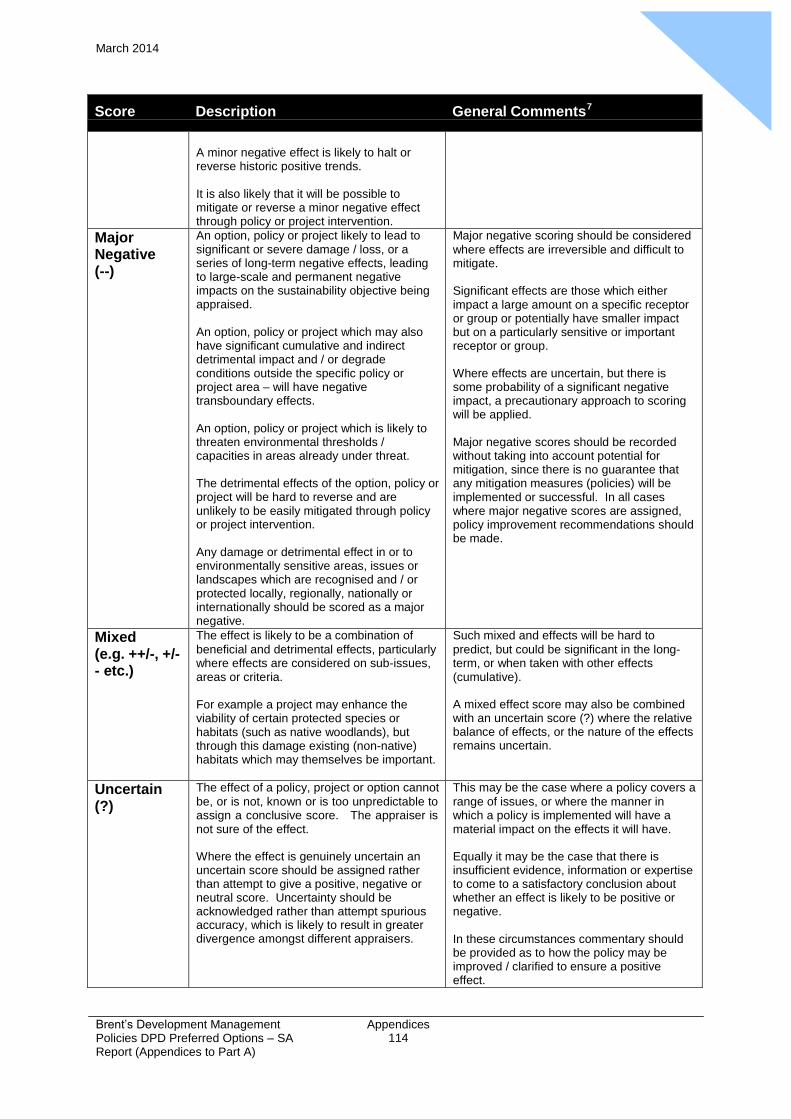
Appendix
7 March 2014
Score Description General Comments7
A minor negative effect is likely to halt or reverse historic positive trends.
It is also likely that it will be possible to mitigate or reverse a minor negative effect through policy or project intervention.
Major Negative (--)
An option, policy or project likely to lead to significant or severe damage / loss, or a series of long-term negative effects, leading to large-scale and permanent negative impacts on the sustainability objective being appraised.
An option, policy or project which may also have significant cumulative and indirect detrimental impact and / or degrade conditions outside the specific policy or project area – will have negative transboundary effects.
An option, policy or project which is likely to threaten environmental thresholds / capacities in areas already under threat.
The detrimental effects of the option, policy or project will be hard to reverse and are unlikely to be easily mitigated through policy or project intervention.
Any damage or detrimental effect in or to environmentally sensitive areas, issues or landscapes which are recognised and / or protected locally, regionally, nationally or internationally should be scored as a major negative.
Major negative scoring should be considered
where effects are irreversible and difficult to mitigate.
Significant effects are those which either impact a large amount on a specific receptor or group or potentially have smaller impact but on a particularly sensitive or important receptor or group.
Where effects are uncertain, but there is some probability of a significant negative impact, a precautionary approach to scoring will be applied.
Major negative scores should be recorded without taking into account potential for mitigation, since there is no guarantee that any mitigation measures (policies) will be implemented or successful. In all cases where major negative scores are assigned, policy improvement recommendations should be made.
Mixed (e.g. ++/-, +/- - etc.)
The effect is likely to be a combination of
beneficial and detrimental effects, particularly where effects are considered on sub-issues, areas or criteria.
For example a project may enhance the viability of certain protected species or habitats (such as native woodlands), but through this damage existing (non-native) habitats which may themselves be important.
Such mixed and effects will be hard to
predict, but could be significant in the long- term, or when taken with other effects (cumulative).
A mixed effect score may also be combined with an uncertain score (?) where the relative balance of effects, or the nature of the effects remains uncertain.
Uncertain (?)
The effect of a policy, project or option cannot
be, or is not, known or is too unpredictable to assign a conclusive score. The appraiser is not sure of the effect.
Where the effect is genuinely uncertain an uncertain score should be assigned rather than attempt to give a positive, negative or neutral score. Uncertainty should be acknowledged rather than attempt spurious accuracy, which is likely to result in greater divergence amongst different appraisers.
This may be the case where a policy covers a
range of issues, or where the manner in which a policy is implemented will have a material impact on the effects it will have.
Equally it may be the case that there is insufficient evidence, information or expertise to come to a satisfactory conclusion about whether an effect is likely to be positive or negative.
In these circumstances commentary should be provided as to how the policy may be improved / clarified to ensure a positive effect.
Brent’s Development Management Policies DPD Preferred Options – SA Report (Appendices to Part A)
Appendices 114
London Borough of Brent’s Local Development Framework
Development Policies and Site Specific Allocations Development Plan Documents Preferred Options
Sustainability Appraisal Report Appendices to Part B: Appraisal of the Development Policies Preferred Options
Incorporating an Environmental Report under the Environmental Assessment of Plans and
Programmes Regulations 2004 No. 1633
March 2014
Prepared for London Borough of Brent
and Collingwood Environmental
Planning
Collingwood Environmental Planning 1E, The Chandlery 50 Westminster Bridge Road London, SE1 7QY, UK tel: 020 7407 8700 email: [email protected] web: www.cep.co.uk

SA Report
Contents
March 2014
CONTENTS
Brent’s Development Management Policies DPD Preferred
Options – SA Report (Appendices to Part B)
Appendices i
(See separate volumes for the contents of the main SA Report)
APPENDICES
APPENDICES TO PART B: APPRAISAL OF THE DEVELOPMENT POLICIES
Appendix 7: Initial Sustainability Appraisal Commentary and LB Brent Responses
SA Report Abbreviations
March 2014
ABBREVIATIONS
Brent’s Development Management Policies DPD Preferred
Options – SA Report (Appendices to Part B)
Appendices ii
AMR Annual Monitoring Report
AQMA Air Quality Management Area
BAP Biodiversity Action Plan
BEA Borough Employment Area
BIW Businesses, Industry and Warehouses
BREEAM BRE (Building Research Establishment) Environmental Assessment Method
CEP Collingwood Environmental Planning
CF Community Facilities
CMS Convention on Migratory Species
CO Carbon Monoxide
CO2 Carbon Dioxide
CP Core Policy
CST Culture Sport and Tourism
db Decibels
DC Development Control
DCLG Department for Communities and Local Government
DCMS Department for Culture Media and Sport
Defra Department for Environment Food and Rural Affairs
DETR Department for Transport, Local Government and the Regions
DfT Department for Transport
DP Development Policy
DPD Development Plan Document
DTI Department of Trade and Industry
EA Environment Agency
EEA Energy Action Area
EEC European Economic Community
EC European Commission
EIA Environmental Impact Assessment
ENV Environment
EU European Union
GPD Gross Domestic Product
GIS Geographical Information System
GLA Greater London Authority
GOL Government Office for London
GP General Practitioner
GQA General Quality Assessment
H Housing
HA Housing Association
Ha Hectare
IEA Industrial Employment Area
IMD Index of Multiple Deprivation
I & O Issues and Options
LA 21 Local Agenda 21
LBB London Borough of Brent LB
Brent London Borough of Brent
LBPN London Bus Priority Network
LCN+ London Cycle Network Plus
LDD Local Development Document
LDF Local Development Framework
LDS Local Development Scheme
LEA Local Education Authority
LES Local Employment Site
LGA Local Government Association
LNR Local Nature Reserve LPA
Local Planning Authority
LIP Local Implementation Plan
MOL Metropolitan Open Land
NDC New Deal for Communities
NO Nitric Oxide
NO2 Nitrogen dioxide
NVQ National Vocational Qualifications
ODPM Office of the Deputy Prime Minister
OS Open Space
ONS Office of National Statistics
PCT Primary Care Trust
PM10 Particles measuring less than 10 microns
PPG Planning Policy Guidance
PPS Planning Policy Statement
PTAL Public Transport Accessibility Level
RSL Registered Social Landlords
SA Sustainability Appraisal
SAP Standard Assessment Procedure
SCI Statement of Community Involvement
SD Sustainable development
SD Sustainable design
SEA Strategic Employment Area
SEA Strategic Environmental Assessment
SFRA Strategic Flood Risk Assessment
SINC Sites of Importance for Nature Conservation
SOA Super Output Areas
SO2 Sulphur dioxide
SPD Supplementary Planning Document
SPG Supplementary Planning Guidance
SRDF Sub Regional Development Framework
SSSI Site of Special Scientific Interest
SUDS Sustainable Urban Drainage
TC Town Centre
TPO Tree Preservation Order
TRN Transport
UD Urban Design
UDP Unitary Development Plan
UNFCCC United Nations Framework Convention on Climate Change
VAT Value Added Tax
WFD Water Framework Directive
WLWDA West London Waste Disposal Authority (known as WestWaste)
ZED Zero Energy Development
Appendix
7 March 2014
Brent’s Development Management Policies DPD Preferred
Options – SA Report (Appendices to Part B)
Appendices 115
APPENDIX 7
INITIAL SUSTAINABILITY APPRAISAL COMMENTARY AND LB
BRENT RESPONSES
Appendix
7 March 2014
Brent’s Development Management Policies DPD Preferred
Options – SA Report (Appendices to Part B)
Appendices 116
Introduction The tables which follow are recreated from the Initial Sustainability Appraisal Commentary prepared by Collingwood Environmental Planning based on a detailed review of the Development Control Policies – Preferred Options, March 2007 (as received 23/03/07 by email) and amended to reflect Development Policies – Preferred Options, May 2007 (as received 27/04/07 by email).
The tables also include (final column) the responses from LB Brent noting where the commentary and proposed changes were accepted, and if not the reason for this. Where comments have been accepted changes were made to the draft text which were included in
the Development Policies DPD Preferred Options, June 1st May 2007.
Appendix
8 March 2014
Brent’s Development Management Policies DPD Preferred Options – SA Report (Appendices to Part B)
117
Overall and General Comments
Topic Suggested changes to the policy wording or supporting text as a result of the SA LBB Response
General comments Consideration of alternatives
The document includes boxes titled “Alternative options not included”. However, there are some concerns that the justification of alternatives considered and rejected may not be sufficient within some of the sections / for some policies. This relates to both SA requirements for the consideration of alternatives and to meet the test of soundness of the DPD etc.
A few more specific comments are included on these boxes within the sections below, but the approach between sections in the draft Preferred Options is not always consistent and generally they would benefit from additional references back to the policy direction set by the Core Strategy policies or the London Plan (and that therefore various options have already been foreclosed by this higher level documents) which would provide the justification needed in some cases.
Some of the justifications on the alternatives not included just comment on that it is preferable to have a policy rather than not have one, which may well be correct but there are also potentially alternative polices / policy wording that could be used that it would be more useful to discuss.
Comments on alternatives not selected does not appear to be included for every policy and in amending the document between the March and May versions not all the policy references in the boxes have been updated.
Consider presenting several (ideally more than 2) for each policy (as presented fro DP OS8). This should include the business as usual (i.e. existing UDP policy).
Accepted.
Further justification of alternative options not selected to be provided as indicated against relevant sections below.
Possible additional policy areas
Some potential additional areas for additional policy are included within the sections below.
Cross referencing of policies
In some cases policies include cross-references to other policies which are relevant or related.
We would recommend that the document is reviewed to ensure that they are consistent and also mutually supportive – for example UD3 Urban Structure: Space and Movement could be usefully cross-referenced to TRN2 and TRN4.
Policy “coding” Some policies do not have a reference number e.g. the policy on Sustainable Water – Demand and Efficiency and Wildlife Corridors. Adding these in will change the subsequent policy numbers.
Comments on the introduction
DPD objectives Section 1 of the draft document includes a section on ‘Purpose of the Development Control Policies Preferred Options’ and ‘What are Development Control Policies?’. The later states that
“this Development Plan Document sets out the detailed policies which will be used primarily for
Accepted. Additional information explaining the purpose of the Development Policies document and its relationship with other
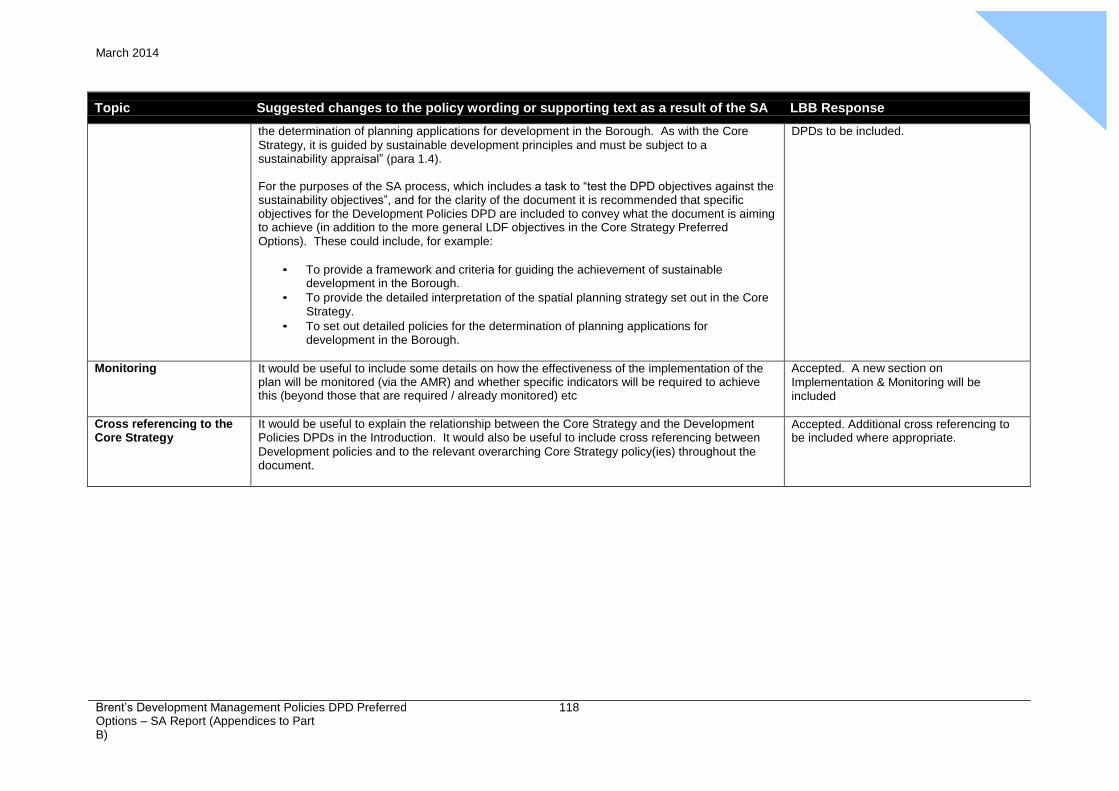
Appendix
8 March 2014
Brent’s Development Management Policies DPD Preferred Options – SA Report (Appendices to Part B)
118
Topic Suggested changes to the policy wording or supporting text as a result of the SA LBB Response
the determination of planning applications for development in the Borough. As with the Core
Strategy, it is guided by sustainable development principles and must be subject to a sustainability appraisal” (para 1.4).
For the purposes of the SA process, which includes a task to “test the DPD objectives against the sustainability objectives”, and for the clarity of the document it is recommended that specific objectives for the Development Policies DPD are included to convey what the document is aiming to achieve (in addition to the more general LDF objectives in the Core Strategy Preferred Options). These could include, for example:
• To provide a framework and criteria for guiding the achievement of sustainable
development in the Borough.
• To provide the detailed interpretation of the spatial planning strategy set out in the Core Strategy.
• To set out detailed policies for the determination of planning applications for development in the Borough.
DPDs to be included.
Monitoring It would be useful to include some details on how the effectiveness of the implementation of the plan will be monitored (via the AMR) and whether specific indicators will be required to achieve this (beyond those that are required / already monitored) etc
Accepted. A new section on
Implementation & Monitoring will be included
Cross referencing to the Core Strategy
It would be useful to explain the relationship between the Core Strategy and the Development Policies DPDs in the Introduction. It would also be useful to include cross referencing between
Development policies and to the relevant overarching Core Strategy policy(ies) throughout the document.
Accepted. Additional cross referencing to be included where appropriate.
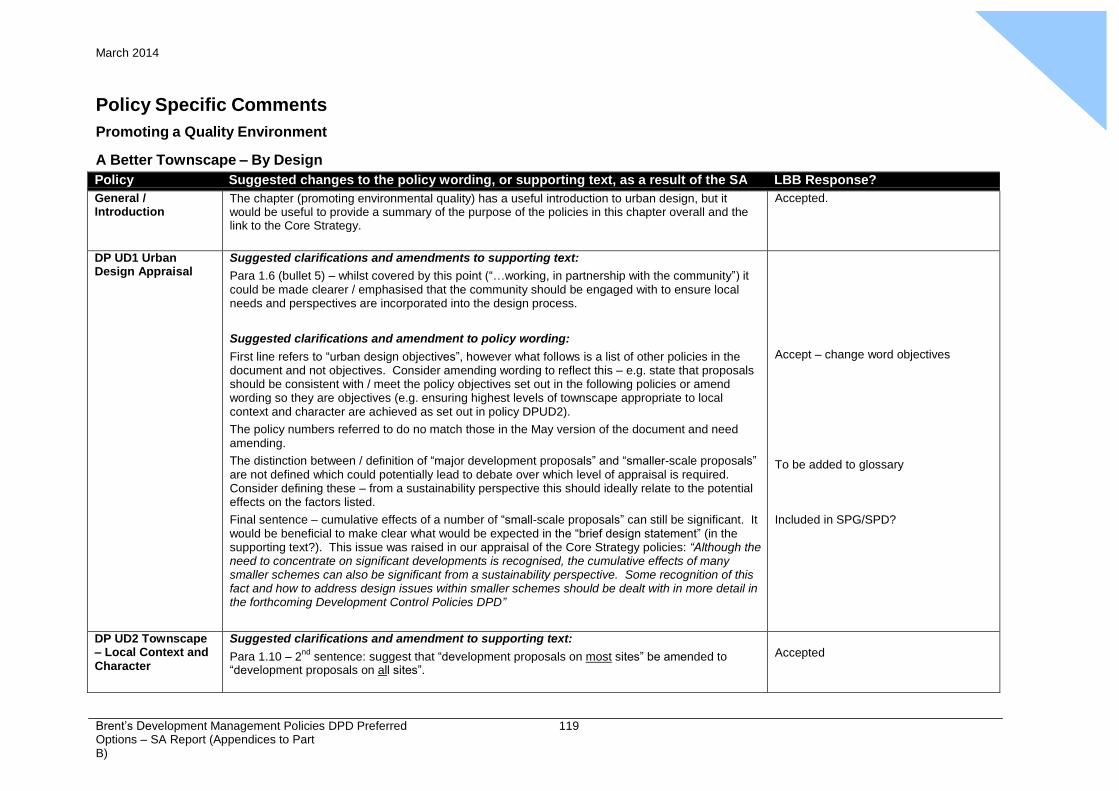
Appendix
8 March 2014
Brent’s Development Management Policies DPD Preferred Options – SA Report (Appendices to Part B)
119
Policy Specific Comments
Promoting a Quality Environment
A Better Townscape – By Design
Policy Suggested changes to the policy wording, or supporting text, as a result of the SA LBB Response?
General / Introduction
The chapter (promoting environmental quality) has a useful introduction to urban design, but it would be useful to provide a summary of the purpose of the policies in this chapter overall and the link to the Core Strategy.
Accepted.
DP UD1 Urban Design Appraisal
Suggested clarifications and amendments to supporting text:
Para 1.6 (bullet 5) – whilst covered by this point (“…working, in partnership with the community”) it could be made clearer / emphasised that the community should be engaged with to ensure local needs and perspectives are incorporated into the design process.
Suggested clarifications and amendment to policy wording:
First line refers to “urban design objectives”, however what follows is a list of other policies in the document and not objectives. Consider amending wording to reflect this – e.g. state that proposals should be consistent with / meet the policy objectives set out in the following policies or amend wording so they are objectives (e.g. ensuring highest levels of townscape appropriate to local context and character are achieved as set out in policy DPUD2).
The policy numbers referred to do no match those in the May version of the document and need amending.
The distinction between / definition of “major development proposals” and “smaller-scale proposals” are not defined which could potentially lead to debate over which level of appraisal is required. Consider defining these – from a sustainability perspective this should ideally relate to the potential effects on the factors listed.
Final sentence – cumulative effects of a number of “small-scale proposals” can still be significant. It would be beneficial to make clear what would be expected in the “brief design statement” (in the supporting text?). This issue was raised in our appraisal of the Core Strategy policies: “Although the need to concentrate on significant developments is recognised, the cumulative effects of many smaller schemes can also be significant from a sustainability perspective. Some recognition of this fact and how to address design issues within smaller schemes should be dealt with in more detail in the forthcoming Development Control Policies DPD”
Accept – change word objectives
To be added to glossary
Included in SPG/SPD?
DP UD2 Townscape – Local Context and Character
Suggested clarifications and amendment to supporting text:
Para 1.10 – 2nd
sentence: suggest that “development proposals on most sites” be amended to “development proposals on all sites”.
Accepted
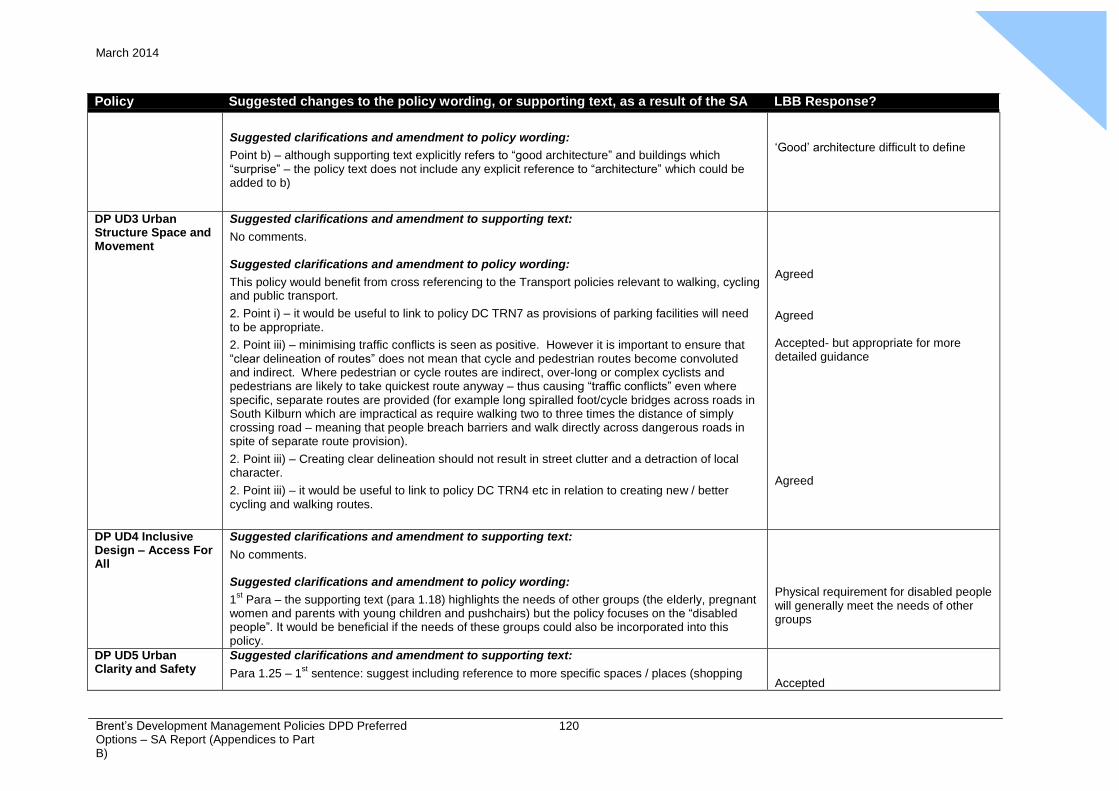
Appendix
8 March 2014
Brent’s Development Management Policies DPD Preferred Options – SA Report (Appendices to Part B)
120
Policy Suggested changes to the policy wording, or supporting text, as a result of the SA LBB Response?
Suggested clarifications and amendment to policy wording:
Point b) – although supporting text explicitly refers to “good architecture” and buildings which “surprise” – the policy text does not include any explicit reference to “architecture” which could be added to b)
‘Good’ architecture difficult to define
DP UD3 Urban Structure Space and Movement
Suggested clarifications and amendment to supporting text:
No comments.
Suggested clarifications and amendment to policy wording:
This policy would benefit from cross referencing to the Transport policies relevant to walking, cycling and public transport.
2. Point i) – it would be useful to link to policy DC TRN7 as provisions of parking facilities will need to be appropriate.
2. Point iii) – minimising traffic conflicts is seen as positive. However it is important to ensure that “clear delineation of routes” does not mean that cycle and pedestrian routes become convoluted and indirect. Where pedestrian or cycle routes are indirect, over-long or complex cyclists and pedestrians are likely to take quickest route anyway – thus causing “traffic conflicts” even where specific, separate routes are provided (for example long spiralled foot/cycle bridges across roads in South Kilburn which are impractical as require walking two to three times the distance of simply crossing road – meaning that people breach barriers and walk directly across dangerous roads in spite of separate route provision).
2. Point iii) – Creating clear delineation should not result in street clutter and a detraction of local character.
2. Point iii) – it would be useful to link to policy DC TRN4 etc in relation to creating new / better cycling and walking routes.
Agreed
Agreed
Accepted- but appropriate for more detailed guidance
Agreed
DP UD4 Inclusive Design – Access For All
Suggested clarifications and amendment to supporting text:
No comments.
Suggested clarifications and amendment to policy wording:
1st
Para – the supporting text (para 1.18) highlights the needs of other groups (the elderly, pregnant women and parents with young children and pushchairs) but the policy focuses on the “disabled people”. It would be beneficial if the needs of these groups could also be incorporated into this policy.
Physical requirement for disabled people will generally meet the needs of other groups
DP UD5 Urban Clarity and Safety
Suggested clarifications and amendment to supporting text:
Para 1.25 – 1st
sentence: suggest including reference to more specific spaces / places (shopping
Accepted
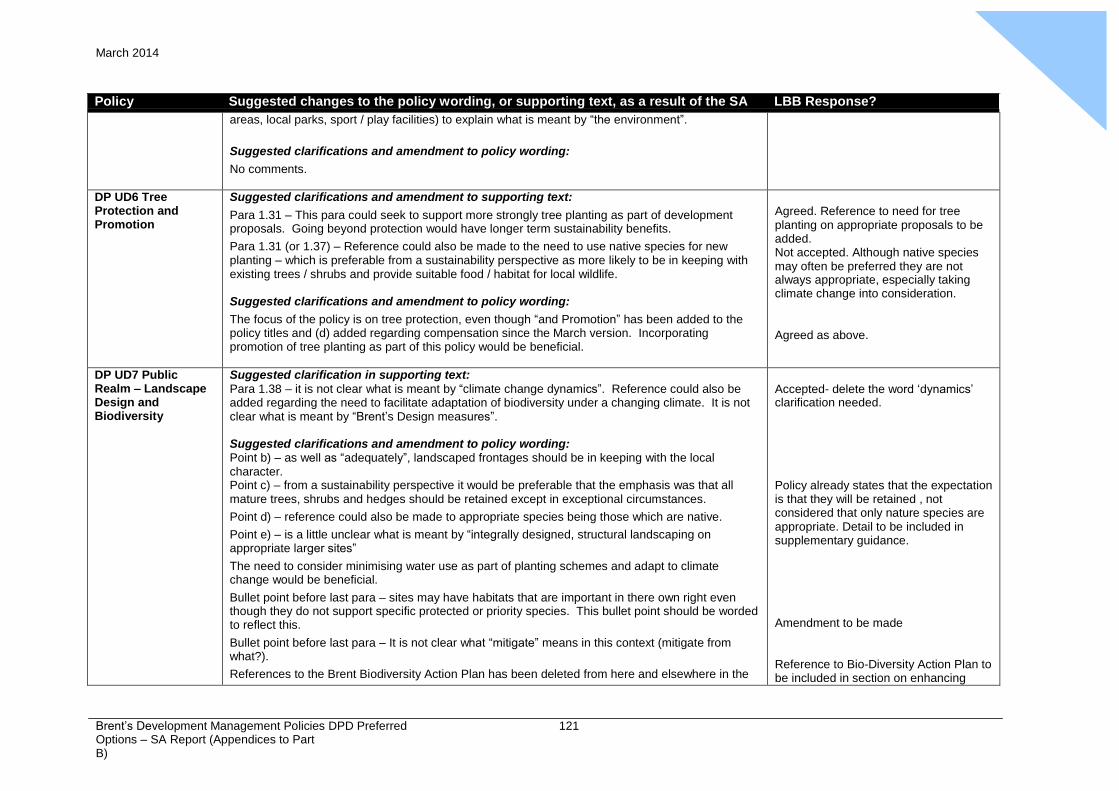
Appendix
8 March 2014
Brent’s Development Management Policies DPD Preferred Options – SA Report (Appendices to Part B)
121
Policy Suggested changes to the policy wording, or supporting text, as a result of the SA LBB Response?
areas, local parks, sport / play facilities) to explain what is meant by “the environment”.
Suggested clarifications and amendment to policy wording:
No comments.
DP UD6 Tree Protection and Promotion
Suggested clarifications and amendment to supporting text:
Para 1.31 – This para could seek to support more strongly tree planting as part of development proposals. Going beyond protection would have longer term sustainability benefits.
Para 1.31 (or 1.37) – Reference could also be made to the need to use native species for new planting – which is preferable from a sustainability perspective as more likely to be in keeping with existing trees / shrubs and provide suitable food / habitat for local wildlife.
Suggested clarifications and amendment to policy wording:
The focus of the policy is on tree protection, even though “and Promotion” has been added to the policy titles and (d) added regarding compensation since the March version. Incorporating promotion of tree planting as part of this policy would be beneficial.
Agreed. Reference to need for tree planting on appropriate proposals to be added. Not accepted. Although native species may often be preferred they are not always appropriate, especially taking climate change into consideration.
Agreed as above.
DP UD7 Public Realm – Landscape Design and Biodiversity
Suggested clarification in supporting text:
Para 1.38 – it is not clear what is meant by “climate change dynamics”. Reference could also be added regarding the need to facilitate adaptation of biodiversity under a changing climate. It is not clear what is meant by “Brent’s Design measures”.
Suggested clarifications and amendment to policy wording: Point b) – as well as “adequately”, landscaped frontages should be in keeping with the local character. Point c) – from a sustainability perspective it would be preferable that the emphasis was that all mature trees, shrubs and hedges should be retained except in exceptional circumstances.
Point d) – reference could also be made to appropriate species being those which are native.
Point e) – is a little unclear what is meant by “integrally designed, structural landscaping on appropriate larger sites”
The need to consider minimising water use as part of planting schemes and adapt to climate change would be beneficial.
Bullet point before last para – sites may have habitats that are important in there own right even though they do not support specific protected or priority species. This bullet point should be worded to reflect this.
Bullet point before last para – It is not clear what “mitigate” means in this context (mitigate from what?).
References to the Brent Biodiversity Action Plan has been deleted from here and elsewhere in the
Accepted- delete the word ‘dynamics’ clarification needed.
Policy already states that the expectation is that they will be retained , not considered that only nature species are appropriate. Detail to be included in supplementary guidance.
Amendment to be made
Reference to Bio-Diversity Action Plan to be included in section on enhancing
Appendix
8 March 2014
Brent’s Development Management Policies DPD Preferred Options – SA Report (Appendices to Part B)
122
Policy Suggested changes to the policy wording, or supporting text, as a result of the SA LBB Response?
document compared with the March version of the document. Its there a reason for this as it is
assumed this provides useful context to what species and habitats are important locally and the actions that are needed locally?
open space & biodiversity.
DP UD8 Public Realm – Streetscape
Suggested clarifications and amendment to supporting text:
Para 1.43 – It is also important to resist crossovers etc as it increases urban run-off (as highlighted in London Assembly’s Environment Committee report Crazy Paving: the environmental importance of London’s front gardens. This included a table of the number of applications for pavement
crossovers to London Boroughs and for those boroughs that provided figures Brent had the most in most recent year report (2004)). It is recommended that this is given more prominence within policy.
Suggested clarifications and amendment to policy wording:
1st
and 2nd
para – consideration should be given to the environmental effects of street elements and furniture in terms of the materials used and their sources etc. This consideration should be referred to here.
The factors listed a – e do not just raise issues which “detract from the local character” – they raise a broader range of environmental issues (e.g. run-off and flood risk connected with c hard surfacing and front gardens)
Point a) – ambiguity as to what may be deemed “excessive” infilling of space. Suggest expanding on this point to clarify.
Point c) –“half of a front garden area” could still represent a major loss of green space adjacent to the street / open land. Any loss further should ideally be resisted.
Possible omission: signage. High-quality, clear signage can greatly improve permeability / access and ease of movement. This can be an integral part of / incorporated within street furniture and fittings. This is mentioned in the supporting text (para 1.39) however it is suggested this may merit inclusion within the policy text.
The formation of a crossover does not in itself require planning permission where permission is required the policy seeks to control the amount of hard landscaping
Not agreed. Criteria a & b are concerned primarily with character. Detail relating to a provided by SPG. On c it is considered unreasonable to not allow any hard paving on development, especially as paving does not generally require permission, so is not included in policy.
DP UD9 Public
Realm – Lighting and Light Pollution
Suggested clarifications and amendment to supporting text:
No comments.
Suggested clarifications and amendment to policy wording:
No comments.
DP UD10 Architectural Quality
Suggested a clarifications and amendment to supporting text:
No comments.
Suggested clarifications and amendment to policy text:
Appendix
8 March 2014
Brent’s Development Management Policies DPD Preferred Options – SA Report (Appendices to Part B)
123
Policy Suggested changes to the policy wording, or supporting text, as a result of the SA LBB Response?
Point e) – suggest could include reference to pedestrians / passers-by, who may be as effected by a
new building or extension to an existing one as those likely to use or visit it. Final sentence – from a sustainability perspective it is suggested that attention to these design /
architectural considerations are just as important in areas of low townscape quality.
Point e or f) - a reference could be added here to the need to consider climate change / hotter average temperatures / urban heat island effect in design, use of materials, colour etc
Not agreed. It is considered to be especially important to respect the local positive design and landscape where this is of good quality. Can be dealt with by cross referencing to policy SD1.
DP UD11 Design-led
Intensive and Mixed- use Design
Suggested clarifications and amendment to supporting text:
No comments.
Suggested clarifications and amendment to policy text: No comments.
DP UD12 High Buildings
Suggested clarifications and amendment to supporting text:
No comments.
Suggested clarifications and amendment to policy text: 1st sentence – high building should only be appropriate where their visual and other impact can be accommodated (rather than being “most” appropriate in these locations).
Second sentence - Possible changing of wording from “Preferred locations” to “The only locations”. The supporting text seems to suggest that the Council will try to limit high buildings to these locations – so wording the policy thus could strengthen the Council’s position in this regard.
Point a) – suggest inclusion of shadows / relationship to natural light and movement of the sun in the visual impact study.
Point e) – this point could also refer to how high buildings need to consider waste disposal / recycling issues and the need to adapt to climate change (increased temperatures etc) without increasing CO2 emissions etc.
Point f) – “water channels” should also refer to groundwater flows is relevant.
The policy could include or cross-refer to transport policies. Parking and localised traffic impacts may be a particularly important impact of such developments.
Accepted- delete ‘most’
Not accepted- there may be other locations, depending upon assessment of a proposal in terms of impact. This issue is addressed in SPG. Not accepted- as these issues are dealt with in generic policy elsewhere, e.g. SD1 & SD7.
Not considered necessary as parking and traffic impact are an important consideration in all development.
Alternatives to Policies DP UD1 – UD11
Should refer to DP UD12 as well as DP UD 1-11.
No specific policy alternatives have been recommended, although some justification is provided for this. However, the “return to an earlier, single design policy” would appear not to be the only reasonable alternative available.
Some discrete policy alternatives can be imagined for Policy UD11 High Buildings, for example. It could be limited to fewer areas or allow across the borough, or restricted further in height.
Agreed
The policies also flow from the core strategy i.e. policies SS1, SS9, UD1 & UD2. This suite of policies provides the detail of how the core policies principles will be applied.

Appendix
8 March 2014
Brent’s Development Management Policies DPD Preferred Options – SA Report (Appendices to Part B)
124
Policy Suggested changes to the policy wording, or supporting text, as a result of the SA LBB Response?
If options are limited by the context provided by the London Plan or the Core Strategy, this should
be stated.
Agreed and will be added.
DP UD13 Priority Enhancement Areas
Suggested clarifications and amendment to supporting text:
Para 1.68 – it is unclear which “qualities” are being referred to in the 1st
sentence.
Para 1.69 – Gateways should include railway stations as well as road junctions.
Suggested clarifications and amendment to policy text: General comment – the purpose and requirements of the policy are unclear from the limited details included. The sense of the policy also needs to be reviewed following the amendments from the March version.
Agreed- to further clarify Agreed- and will also be reflected in a map to be included
The intention of the policy is to treat development within the gateways as a priority in terms of enhancing the area. This will be made clearer.
Alternatives to Policies DC UD12
Should refer to DP UD13.
No specific policy alternatives have been recommended beyond dispensing with design area policies. See General Comments above.
The only alternative is to not focus on key areas which is indicated, would not be in conformity with the London Plan.
DP UD14 Building Services Equipment
Suggested clarifications and amendment to supporting text:
General comment – we would suggest including more comments promoting the use of passive solar design / passive heating and cooling systems and low energy cooling of buildings within the supporting text. This is important for reducing energy use / reducing greenhouse gas emissions, and adaptation to climate change / reducing the urban heat island effect.
Possible policy omission – there is no detailed policy obvious in the document seeking such passive
and design led approaches to cooling / heating and ventilation. Also is relevant as climate change response – adaptability and mitigation.
Suggested clarifications and amendment to policy text: First sentence – possible typographical error – should “conditional” read “conditioning”?
First sentence – suggest that this should include both “proposed buildings” and modifications / refurbishment to existing buildings.
Penultimate sentence – suggestion that the policy text is re-ordered so that this comes first. The “best” option in all cases seems likely to be encouraging design / architecture which negates the need for such equipment.
Last sentence – these effects should be avoided as far as possible, with mitigation (as a last resort) to an acceptable level where unavoidable.
The importance in reducing energy use is accepted although it is considered that this is highlighted sufficiently by relevant policies SD1-7. This policy is primarily
concerned with the visual /amenity impacts of equipment – detailed guidance on how to achieve reduced
energy demand as required by policy SD3, will be included in supplementary guidance. Agreed.
Agreed- delete word ‘proposed’
Not accepted
Agreed.
DP UD15 Telecommunic-
Suggested clarifications and amendment to supporting text:
Para 1.75 – Is it likely that it would be acceptable to erect a mast in an SSSI?
Depends upon the impact.
Appendix
8 March 2014
Brent’s Development Management Policies DPD Preferred Options – SA Report (Appendices to Part B)
125
Policy Suggested changes to the policy wording, or supporting text, as a result of the SA LBB Response?
ations Suggested clarifications and amendment to policy text:
Final sentence – although the policy text is relatively strong as it stands (and perhaps goes as far as it can legally?) it is suggested that schools and other sensitive sites should only be considered as a last resort/exceptional circumstances. The text here could perhaps be strengthened to ensure this.
Considered strong enough for it to be demonstrated that there are no alternative sites and that potential impact will be carefully assessed.
DP UD16 Building- Mounted and Freestanding Advertisements
Suggested clarifications and amendment to supporting text:
General comment – can / should fly-posting and temporary advertising (such as estate agents boards etc.) be included in this policy?
Suggested clarifications and amendment to policy text:
Point b) – would it be possible to change “on or adjacent to” to “on, in, adjacent to as well as affecting” these areas as advertisements may be detrimental even if it is not on or adjavent to them?
This is an enforcement issue and does not need reference.
Considered that policy already goes into sufficient detail.
Alternatives to policies UD13 - 15
Should be DP UD 14 -16.
Limited policy alternatives are discussed. See General Comments above.
Accepted- amendments to be made.
DP UD17 Locally Listed Buildings
Suggested clarifications and amendment to supporting text: No comments.
Suggested clarifications and amendment to policy text: Point d) – to ensure that long-term ‘gap-sites’ do not occur could a specific time-frame be put on the construction of replacements?
A condition would be applied to planning consent.
DP UD18 Conversation Areas
Suggested clarifications and amendment to supporting text:
Para 1.95 / 1.96 – is there any plan to produce SPDs of Conservation Area Character Appraisals? If so, they could be referred to here.
Suggested clarifications and amendment to policy text: No comments.
Although character appraisals are being produced it is not intended that these should be SPD.
DP UD19 Areas of
Distinctive Residential Character
Suggested clarifications and amendment to supporting text:
No comments.
Suggested clarifications and amendment to policy text: No comments.
N/A
DP UD20 Views and Landmarks
Suggested clarifications and amendment to supporting text:
No comments.
N/A
Appendix
8 March 2014
Brent’s Development Management Policies DPD Preferred Options – SA Report (Appendices to Part B)
126
Policy Suggested changes to the policy wording, or supporting text, as a result of the SA LBB Response?
Suggested clarifications and amendment to policy text:
No comments.
Alternatives to policies UD16-19
Should refer to policies DP UD 17-20
No specific policy alternatives have been included beyond simply having no conservation policies. Make reference to options foreclosed by Core Strategy and genuine alternatives to the policies. See General Comments above.
2nd
para – 4 polices are included not 5.
Agreed
Agreed
Agreed
Towards a Sustainable Brent, 2020
Policy Suggested changes to the policy wording, or supporting text, as a result of the SA LBB Response?
Overall comments: The completion of the supporting text at the start of the section compared with the March version
is welcomed.
Referring back to the SA comments made during the appraisal of the Core Strategy, we would reiterate to reflect the London Plan alterations, the text could include reference to London targets to reduce carbon dioxide emissions e.g. “the council will seek to mitigate the effects of climate change locally to reduce carbon dioxide emissions by 25% by 2020 from 1990 baseline” (this is one of the figures in the London Plan alterations’ mitigating climate change policy – 4A.2ii, which is working towards 60% in 2050. The Borough could obviously have its own targets or use the target for a different year).
Updating the Brent Sustainable Design and Construction SPG 19 to an SPD, in line with the London SPG and London Plan alterations and other developments, will ensure that sustainable design and construction in the Borough is in line with the latest good practice. A specific reference to this could be added to this in the introductory text.
It would be beneficial that the measures included in the London Plan (further alterations) policy on sustainable design and construction which are not be given much weight in the current document are reviewed and incorporated where possible (in this section or elsewhere as appropriate):
• design new buildings for flexible uses throughout their lifetime
• avoid creation of adverse local climate conditions
• promoting the use of alternative fuels for transport (partly covered by ENV1?)
• minimising overheating, heat island effects and solar gain in summer
Agreed. Reference to London targets can be included.
Agreed
Consideration will be given to this.
DP SD1 Climate Change Mitigation and Adaptation
Suggested clarifications and amendment to supporting text:
Paras 1.178 – 1.181 and 1.188 – 1.190 – we welcome the inclusion of references to key documents etc. Possible additional documents that could be referred to or could be used as a resource in drafting these sections include:
Noted
Appendix
8 March 2014
Brent’s Development Management Policies DPD Preferred Options – SA Report (Appendices to Part B)
127
Policy Suggested changes to the policy wording, or supporting text, as a result of the SA LBB Response?
• Mayor’s Energy Strategy, 2004 http://www.london.gov.uk/mayor/strategies/energy/index.jsp
• Planning response to climate change, ODPM, September 2004
• Towards zero carbon development: supportive information for Boroughs, July 2006
• Code for Sustainable Homes: a technical guide, March 2007 http://www.planningportal.gov.uk/uploads/code_for_sustainable_homes_techguide.pdf
• Adapting to Climate change: a case study companion to the checklist for development, March
2007 http://www.london.gov.uk/climatechangepartnership/docs/adapting-climate-change-case- study-ver2.pdf
Para 1.190 – reference could also be added to this para to the GLA’s forthcoming Climate Change Adaptation Strategy.
Suggested clarifications and amendment to policy text:
First sentence – it is unclear whether ‘major proposals’ have to be both or either 1,000m2/10
dwellings. Suggested that major proposals qualify if they are either of these rather than having to be both (or is this meant to be commercial and residential thresholds? If so would be clear to
state this).
Bullet list – in terms of climate change mitigation and adaptation, a wider range of polices will be relevant that those in the SD or ENV sections. e.g. Adaptation of planting / landscaping to be water drought tolerant (e.g. UD7 and OS7?); reducing the need to travel (e.g. TRN2?); and passive heating / cooling etc (UD10?), for example.
Bullet list – reference numbering of policies needs to be reviewed as appears incorrect / note that the sustainable water policy is not numbered below
Bullet list – why is ENV5 not included under environmental protection? It includes water supply which is relevant here.
Penultimate para, 1st
sentence – DP ENV6 Flooding could also be referenced here, not just CP ENV1. Given the susceptibility of the Borough to surface and sewer flooding, adaptation to increased flood risk from these sources may not be associated with traditional flood risk areas and the need to increase resilience to these forms of flooding should be reflected here.
Last para, 1st
sentence – the supporting text (para 1.180) specifies that levels 4-5 will be required, but this is not explicitly stated within the policy – reference to 4-6 could be added here (6, ‘zero carbon homes’, should not be restricted to the sites listed in para 1.187 but encouraged elsewhere especially within Wembley Energy Action Area and the Growth Areas).
Clarification will be made that it is either 1,000m² or for residential development 10 units. Accepted- but will be made clear in supporting text. Agreed. Add cross reference Agreed Agreed Agreed- minimum of level 4 to be added. ‘zero carbon homes’ are not restricted to these sites – as par 1.113 indicates these are initial designations
Appendix
8 March 2014
Brent’s Development Management Policies DPD Preferred Options – SA Report (Appendices to Part B)
128
Policy Suggested changes to the policy wording, or supporting text, as a result of the SA LBB Response?
Alternatives to
policy DP SD1
Continuation of the current policy is one of the options available, but not the only one. Levels
could be higher everywhere for example not just in the Wembley EAA and Housing Growth Areas. Justification based on the Alterations to the London Plan could be added etc. See general comments above.
Agreed- alternative option of higher level will be included
DP SD2 Sustainable Householder
Developments
Suggested clarifications and amendment to supporting text:
Para 1.194 – this point about the significance of small developments to mitigation is important, but these smaller development also need to incorporate adaptation to climate change and it should also be mentioned in this context.
Suggested clarifications and amendment to policy text: Policy SD2 contains requirements to submit / prepare checklists and statements. Whilst some criteria are included (minimum code level 2 and a min. of half the relevant measures etc), by drafting this policy (and others) in this way with limited criteria / targets setting out explicitly what is expected, significant reliance is being placed on the robustness of these checklists etc (for the final SA it would be useful to review these to come to a view on the implications on sustainability of this policy). Reference to specific targets/criteria in the policy would provide weight to negotiations with developers. Whilst it is understood that there could be advantages in not tying your hands within the policy itself with criteria, allowing the checklists and statements to be strengthened over time.
Agreed- sentence to be added to end of paragraph 1.120 accepting need for adaptation as well
It is necessary to minimise the level of detail within policy and provide more detailed criteria in supplementary guidance. This applies to guidance in filling in a checklist.
Alternatives to
policy DP SD2
Another option, for example, would be not to distinguish between the major and small
developments and require them all to meet the standards set out in SD1. See general comments above.
Agreed- this option will be included.
DP SD3 Energy –
Demand, Renewables
and Efficiency
Suggested clarifications and amendment to supporting text: Note Towards zero carbon development: supportive information for Boroughs (July 2006 –
http://www.london.gov.uk/mayor/environment/energy/partnership-steering- group/LEP_towards_zero_carbon_developments.pdf) which suggests phasing requirements in major developments, and has an example policy from Kirklees council where “new council buildings incorporate a proportion of on-site renewable energy generation: at least 10% in 2005/6, rising by 5% each year, to at least 30% by 2010/11.” The current policy requires 20% straight away, which is welcomed, but the accommodation of future increases could usefully be included.
The above document, and the Mayor’s Energy Strategy also suggest that boroughs should require “energy demand assessments” for all major new developments – we would recommend incorporating this in the policy.
Suggested clarifications and amendment to policy text:
2nd
bullet – generating - See comments above re 1,000m2
/ 10 dwellings. What is the percentage required for smaller sites? Would they have to comply with the 10% in the last para (as in policy
Consideration will be given to reference in policy to seeking phased increases in the proportion of energy derived from renewables over time and to requiring energy demand assessments.
Appendix
8 March 2014
Brent’s Development Management Policies DPD Preferred Options – SA Report (Appendices to Part B)
129
Policy Suggested changes to the policy wording, or supporting text, as a result of the SA LBB Response?
SD2)?
Last para – examples of the circumstances which would be considered an exception could be added to the supporting text for clarity.
General - it is important to ensure that energy targets / aspirations are actually complied with / implemented post construction, especially where these targets are ongoing and progressive. If possible we would recommend that some formal requirement for ongoing energy performance reporting / assessment is included in this policy and incorporated into AMR monitoring.
Consideration will be given as to how policy will be mentioned.
DP SD4 Sustainable
Water – Demand and
Efficiency
Suggested amendments and clarifications to supporting text: No comments.
Suggested amendments and clarifications to supporting text: Presumably this should be DP SD4?
Points 1-3) - Whilst referred to in the draft strategy as a hierarchy, not all the ‘hierarchies’ operate solely sequentially and it would useful to point out that all these approaches are likely to be required (not if you do one you don’t need to do the others).
General - By not including targets, just measures, this policy is potentially weakened and relies on enforcement through the Sustainability Statement etc. Reference to specific targets/criteria in the policy would provide weight to negotiations with developers.
Last para – add ‘and’ before ’Growth Areas’ as presumably this ‘particular regard’ should be for all major developments in the Wembley EAA and Growth Areas?
Note that Water matters: the Mayor’s consultation draft Water Strategy, 2007 (http://www.london.gov.uk/mayor/environment/water/index.jsp) includes (among others – these are selected for relevance) the following proposals (the targets from which could usefully be incorporated into this or other policies):
Proposal 3 The water use in new residential developments in London should never exceed 40m3 per bedspace per year. The Mayor’s Preferred Standards is 25 m3 per bedspace per year.
Proposal 4 The Mayor will, and the Boroughs should, require major developments to supply a significant proportion of their water requirement from the site’s own resources. The Mayor will expect major developments over 30,000 m2 to supply a minimum of 50 per cent of their water requirement through on site reclamation, and developments over 15,000 m2 or 500 dwellings to meet 25 per cent of their water requirement in this way.
Proposal 7 The Mayor will, and the Boroughs should, require new developments (larger than 1,000 m2 or more than 10 dwellings) to manage their surface water runoff so that there is a 50 per cent reduction in the volume and rate of surface water drainage when compared to that of the undeveloped site at peak times.
Proposal 8 The Mayor will, and the Boroughs should, require new developments (larger than
3,000 m2 or more than 100 dwellings) to establish separate foul sewer and surface water drains
Agreed- policy to be clarified. Although specific targets will be extremely difficult to monitor a reference to the need to have regard to the targets set out in the Mayor’s draft water strategy 2007 will be added.
As indicated above reference will be made to the need to have regard to the Mayor’s draft water strategy 2007.
Appendix
8 March 2014
Brent’s Development Management Policies DPD Preferred Options – SA Report (Appendices to Part B)
130
Policy Suggested changes to the policy wording, or supporting text, as a result of the SA LBB Response?
and not to discharge excess surface water into the combined sewer system.
Proposal 16: Developers, in consultation with the relevant water company and sewerage undertaker, should demonstrate that there is an adequate water supply on and off site to serve the development, and that there is adequate capacity to dispose of the wastewater generated at the site. In some circumstances, it may be necessary for developers to fund studies to ascertain whether the proposed development will lead to overloading of the existing water infrastructure.
DP SD5 Resource
Efficiency –
sustainable
materials and
de/construction
Suggested clarifications and amendments to supporting text:
No Comments.
Suggested clarifications and amendments to policy text: Point a) – it is unclear how much weight is meant by ‘giving preference to’, does it mean all apart from exceptional circumstances for example – this could be clarified (e.g. by using a percentage)
Point a-c) – does this really operate as a sequential hierarchy?
Point c) – would it be possible to provide an increasing, date defined target – such as minimum 10% up until 2010, and 20% thereafter (to be reviewed) etc? Reference to specific targets/criteria in the policy would provide weight to negotiations with developers.
General comment –a useful source of information on sustainable construction and demolition can be found in: Planning policies for sustainable building, Guidance for Local Development Frameworks, LGA October 2006. http://www.pas.gov.uk/pas/aio/27775 (In particular, see p.8, p.11 and p.14 for policy examples from LDFs and p.18 onwards provides an outline of should be possible in policy).
No- wording will be amended accordingly Not accepted- it is not clear how a date defind target would work and how it could be monitored
DP SD6 Poor Air Quali - Adaptation
General comment – a link is not made between this policy and DP ENV1. There would seem to be potential overlaps between them.
Suggested clarifications and amendments to supporting text: Section / policy title – the use of ‘adaptation’ in this context may be confusing and an incorrect assumption made that it is principally to do with climate change (whilst the comment in para 1.215 is acknowledged).
Policy focus – it is unclear within the supporting text and the policy whether the focus is meant to be internal air quality or internal and external air quality. The supporting text and the policy would benefit from clarifying this.
Suggested amendments and clarification to policy text: General comment - More detail could be provided on the specific types of action and features which developers will be expected to implement.
Accepted – cross reference to be added to supporting text.
Accepted- heading to be amended
Accepted- policy is intended to deal with the impact of poor external air quality on internal air quality for sensitive uses. This will be clarified.
More detail will be provided in revised
SPD
Accept- need for consistency
Appendix
8 March 2014
Brent’s Development Management Policies DPD Preferred Options – SA Report (Appendices to Part B)
131
Policy Suggested changes to the policy wording, or supporting text, as a result of the SA LBB Response?
2nd
para – replace ‘adjacent’ with ‘near’ as in the 1st
para.
Last para – whilst energy/CO2 is relevant the key source of poor air quality is likely to be traffic generation which is not addressed here. Requirements could be made to reduce the need to travel, reduce parking etc to compensate.
Not accepted- policy ENV1 deals with the impacts of new development on external air quality.
DP SD7 Operational
Waste Management
Suggested amendments and clarifications to supporting text:
Para 1.217 – to add to the urgency of this waste ‘message’ reference could be made to research by the Environment Agency, showing that at current rates of disposal to landfill, London only has landfill capacity for 4 years. Within the lifetime of the LDF dramatic changes will be required in the way the borough manages waste. http://www.environment- agency.gov.uk/subjects/waste/1031954/315439/1434288/1434300/?version=1&lang=_e
Para 1.193 – Suggest changing “Government planning policy” to “Government Planning Policy Statement (PPS) 10: Sustainable Waste Management” and providing a link / full reference.
Para 1.220 and 1.221 – these 2 paragraphs appear incomplete.
Suggested amendments and clarification to policy text:
General comment – it is recognised that waste is to be addressed through separate SPD etc however reference to specific targets/criteria in the policy would provide weight to negotiations with developers.
Considered that the urgency of the waste message has been addressed sufficiently by both the document and the core strategy.
Agreed- paragraph 1.444 will be amended.
Paragraphs no longer included.
Waste to be addressed through separated Joint Waste DPD for West London. Targets to be included in separate monitoring section.
Alternatives to
policy DP SD3-7
More specific details on potential options for each of the 5 policies covered here would be useful. See general comments above.
Agreed- alternative options will be more fully expressed.
Appendix
8 March 2014
Brent’s Development Management Policies DPD Preferred Options – SA Report (Appendices to Part B)
132
Environmental Protection
Policy Suggested changes to the policy wording, or supporting text, as a result of the SA LBB Response?
DP ENV1: Air Quality Suggested amendments and clarifications to supporting text: Para 1.226 – it is recognised that the need to manage the air quality impacts of traffic is necessary,
however there may be some risk that the wording of the 1st
sentence of this paragraph re development that “generates significant amounts of traffic” which could be taken to be acceptable so long as they undertake an air quality assessment. Reference could be included to clarify that all effort will need to be made to ensure that new development does not create air pollution problems by significantly increasing traffic and that the need to travel and public transport, walking and cycling should be promoted.
Para 1.226 – 3rd
sentence: could an exemption be made to the requirement for energy generation projects to have an air quality assessment for wind and solar? “Any energy generation project” may act as an (albeit minor) obstacle to appropriate renewables generation.
Suggested amendments and clarifications to policy text:
1st
sentence – information on what is likely to be considered a “significant adverse impacts” within the supporting text would provide additional clarity.
1st
bullet – policy SD6 refers to in or near AQMAs – could this also be used here (rather than just within)?
2nd
bullet - see comments above on traffic generation.
5th
bullet – see comments above on renewable energy generation projects.
General comments: In Cleaning London’s Air, the Mayor’s Air Quality Strategy, 2002 (http://www.london.gov.uk/mayor/strategies/air_quality/index.jsp) a number of actions which boroughs can assist with were identified. Some of these which we would suggest could be included
in the supporting / policy text are:
Transport Low emission zones – excluding worst vehicles. Help expansion of alternative fuelling infrastructure
Buildings Efficient new / improved efficiency of old buildings Lower construction pollution
Agreed. Additional text to be added
stating “ every effort will be made to ensure new development will not create air pollution problems by generating significant amounts of traffic, and the council will promote reducing the need to travel and sustainable transport modes such as public transport, walking and cycling as promoted by Core policy CP TRN2 “Reducing the need to travel”. Agreed.
The significant adverse impacts of a development will vary from site to site, and it is used to allow flexibility. No change
Agreed
See changes above
Will review the actions list in this document again.
Will add reference to this document and to the importance of energy efficiency
DP ENV2: Noise & Vibration
Suggested clarifications and amendment to supporting text:
No comments.
Suggested clarifications and amendment to policy text: No comments.
Appendix
8 March 2014
Brent’s Development Management Policies DPD Preferred Options – SA Report (Appendices to Part B)
133
Policy Suggested changes to the policy wording, or supporting text, as a result of the SA LBB Response?
DP ENV3: Pollution and Amenity
Suggested clarifications and amendment to supporting text:
No comments.
Suggested clarifications and amendment to policy text:
1st
para, Final sentence – “acceptable” impacts may be open to interpretation. We would suggest reviewing the text in order that it is clearer what will be considered acceptable, or not.
The word acceptable is used here as the impacts will vary from site to site, and it is used to allow flexibility. No change.
DP ENV4: Contaminated Land
Suggested clarifications and amendment to supporting text: Para 1.232 – mention could be made as a caveat of the potential ecological value of brownfield land
/ previously development land (e.g. as a habitat for protected species) and the need for this to be assessed and taken into account / appropriately mitigated / compensation proposed.
Suggested clarifications and amendment to policy text: General – mention could be made of the approach to the remediation of contaminated land and the
need to consider its environmental impact and the potential for biological treatment, or
bioremediation, for example and approaches which may reduce the environmental impact of remediation (within the context of the regulatory regime, risk assessment and the protection of human health etc).
Agreed will add additional text.
Agreed will add additional text.
DP ENV5: Water Suggested clarifications and amendment to supporting text:
Para 1.237, 1st
sentence – the WFD was transposed into UK law via Regulations rather than just becoming law itself.
Para 1.239 – The WFD my change these requirements as part of the process of classifying water bodies and setting standards and in terms of achieving good ecological and good chemical status ..
General – reference could be made to the GLA’s draft Water Strategy and implications for the policies considered.
Para 1.242 – 1st
sentence – the text could actively seek the removal of existing culverts and impounding as part of new development / redevelopment. This could also be included in the policy text. This is included in Open Space policy DP OS3 – so one suggestion is these policies are cross referenced here.
Para 1.242, 3rd
para – it would be beneficial to add ‘at least’ before the reference to an 8m or 5m buffer so a wider buffer is encouraged – this is a minimum.
General – no mention is made of climate change and the potential effect this mayhave on water quality through reduced flows etc.
Suggested clarifications and amendment to policy text:
1st
para, 1st
sentence – although it is recognised that the individual effects of large developments is
Agree will amend.
Agreed will cross reference accordingly.
Agreed.
Will add additional text to policy (individually or cumulatively) as in policy ENV6 flooding.
Appendix
8 March 2014
Brent’s Development Management Policies DPD Preferred Options – SA Report (Appendices to Part B)
134
Policy Suggested changes to the policy wording, or supporting text, as a result of the SA LBB Response?
likely to be significant, the cumulative effects of smaller developments / changes can also be
significant (see para 1.244). The policy could perhaps go further than encourage and actually require all developments to consider the sustainable drainage.
1st
para, 2nd
sentence – suggest ‘appropriate’ is added before ‘sustainable drainage techniques’.
2nd
para, 1st
sentence – suggest add that the removal of existing culverts and impounding as part of new development / redevelopment is sought rather than just avoiding new culverting and impounding.
2nd
para, 2nd
sentence - suggest ‘at least’ is added before ‘8 metre’ and ‘5 metre’.
Agreed
Agreed
Agreed
DP ENV7: Flooding Suggested clarifications and amendment to supporting text:
General – section could be titled ‘Flood and Drainage’ as two separate but related issues. See GLA’s draft Water Strategy (and the forthcoming Climate Change Adaptation Strategy) – reference could be made to the flooding and drainage hierarchies.
General – no refence is made to surface water or sewer flooding (or groundwater flooding) all of which are potentially important issues within Brent and should be considered as part of FRAs (not just fluvial flooding).
General – no mention is made of climate change and the need to incorporate planning for increased risk / the need for greater resilience (in the supporting text and the policy). General - while the financial impact of social costs may be very hard to calculate the social impacts are relatively well known. See for example: The impact of flooding on urban and rural communities, Environment Agency and Defra, December 2005, http://publications.environment-
agency.gov.uk/pdf/SCHO1005BJTG-e-e.pdf
Suggested amendments and clarifications to policy text:
2nd
para, last sentence – does not currently make sense.
Agreed
Add additional text stating that the SFRA will identify areas at risk from surface water, sewer or groundwater
flooding in addition to fluvial flooding. FRAs should consider all types of potential flooding.
The first sentence of the flooding policy text justification mentions flood risk and its relationship with climate change. Will add additional text to enhance the current wording to emphasise the impacts on urban areas.
DP ENV8: Energy and Renewable Energy Generation
Suggested clarifications and amendment to supporting text: Para 1.257 – It would be useful to explain the link to policy DP SD 3.
Suggested clarifications and amendments to policy text:
2nd
para, 1st
sentence – after ‘demonstrable need’ add reference to also the need to demonstrate no significant impacts on the environment (air quality, congestion etc) or people (noise, health etc) etc as in the bullet points above which should also apply in these circumstances (traffic generation could be issue with such energy generation projects depending on the fuel). Any new non renewable energy generation should not conflict with policies relating to climate change, air quality etc,
2nd
para, 2nd
sentence – The Mayor’s Energy Strategy also encourages boroughs to have “at least one showcase renewables project”. This could be referred to in the context of the EAA with further
Agreed – will amend to reflect this comment.
Agreed.
Agreed – this is also covered in sustainable development policies – which will be cross referenced here.
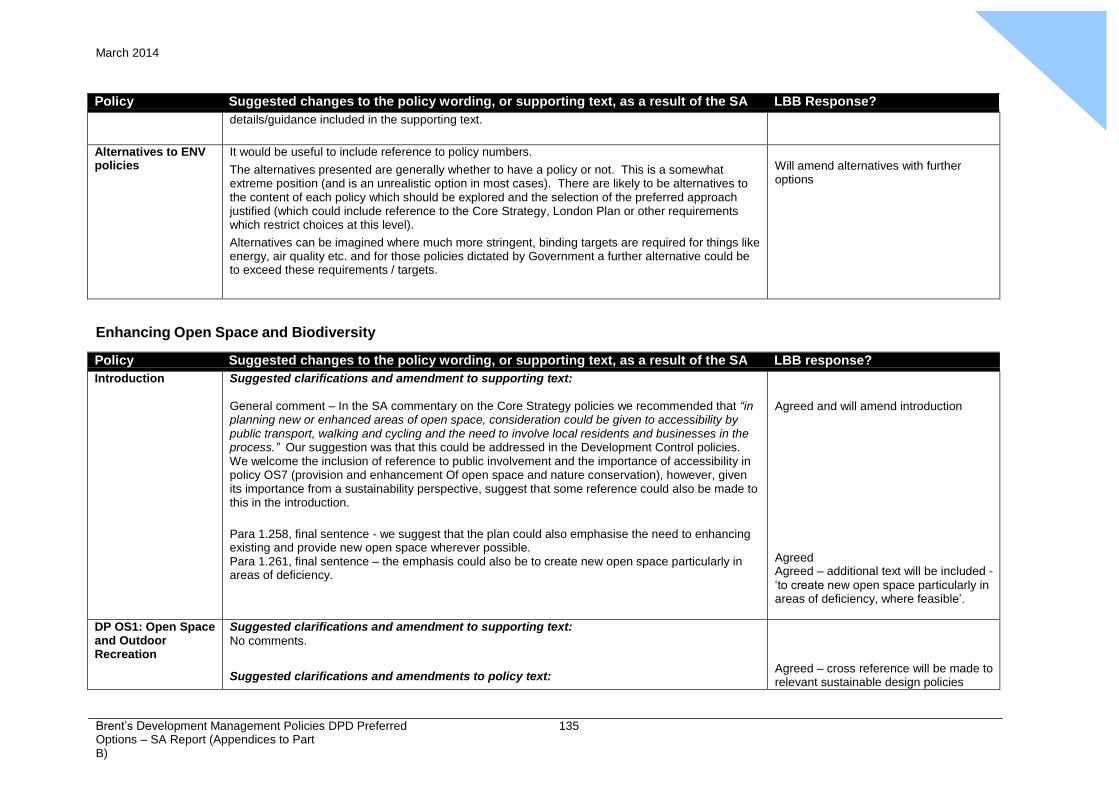
Appendix
8 March 2014
Brent’s Development Management Policies DPD Preferred Options – SA Report (Appendices to Part B)
135
Policy Suggested changes to the policy wording, or supporting text, as a result of the SA LBB Response?
details/guidance included in the supporting text.
Alternatives to ENV policies
It would be useful to include reference to policy numbers.
The alternatives presented are generally whether to have a policy or not. This is a somewhat extreme position (and is an unrealistic option in most cases). There are likely to be alternatives to the content of each policy which should be explored and the selection of the preferred approach justified (which could include reference to the Core Strategy, London Plan or other requirements which restrict choices at this level).
Alternatives can be imagined where much more stringent, binding targets are required for things like energy, air quality etc. and for those policies dictated by Government a further alternative could be to exceed these requirements / targets.
Will amend alternatives with further options
Enhancing Open Space and Biodiversity
Policy Suggested changes to the policy wording, or supporting text, as a result of the SA LBB response?
Introduction Suggested clarifications and amendment to supporting text:
General comment – In the SA commentary on the Core Strategy policies we recommended that “in planning new or enhanced areas of open space, consideration could be given to accessibility by public transport, walking and cycling and the need to involve local residents and businesses in the process.” Our suggestion was that this could be addressed in the Development Control policies. We welcome the inclusion of reference to public involvement and the importance of accessibility in policy OS7 (provision and enhancement Of open space and nature conservation), however, given its importance from a sustainability perspective, suggest that some reference could also be made to this in the introduction.
Para 1.258, final sentence - we suggest that the plan could also emphasise the need to enhancing existing and provide new open space wherever possible. Para 1.261, final sentence – the emphasis could also be to create new open space particularly in areas of deficiency.
Agreed and will amend introduction
Agreed Agreed – additional text will be included -
‘to create new open space particularly in areas of deficiency, where feasible’.
DP OS1: Open Space and Outdoor Recreation
Suggested clarifications and amendment to supporting text:
No comments.
Suggested clarifications and amendments to policy text:
Agreed – cross reference will be made to relevant sustainable design policies
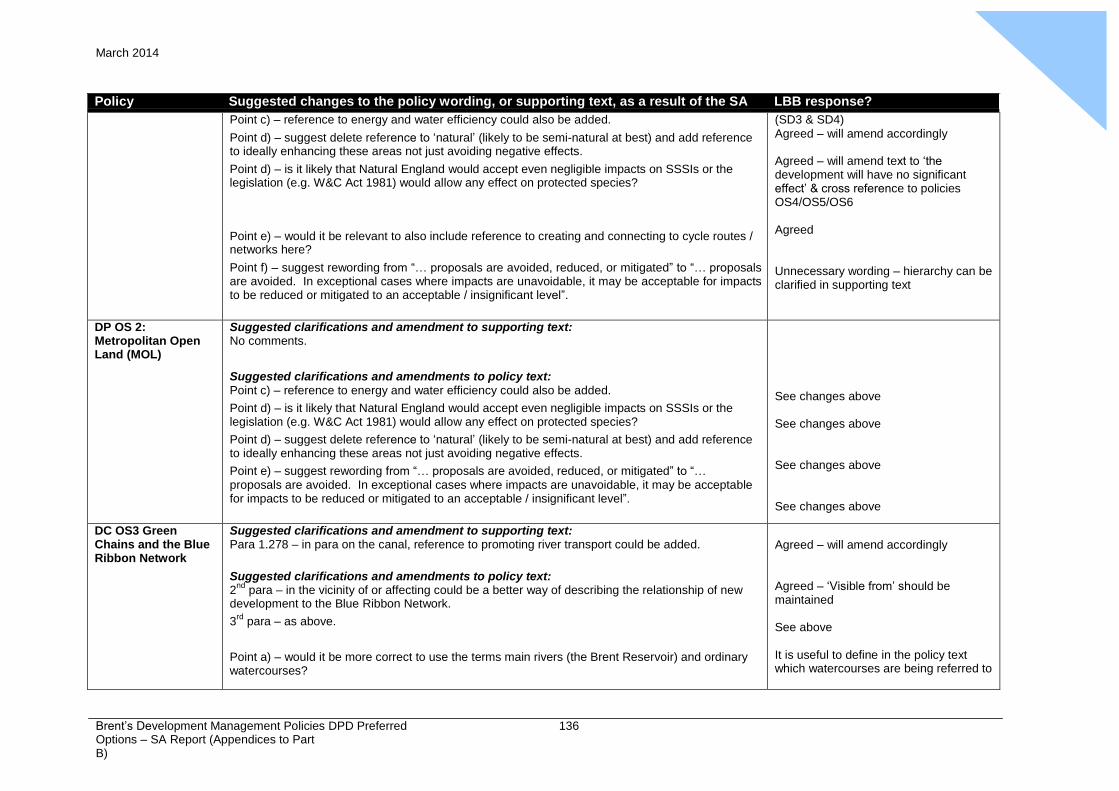
Appendix
8 March 2014
Brent’s Development Management Policies DPD Preferred Options – SA Report (Appendices to Part B)
136
Policy Suggested changes to the policy wording, or supporting text, as a result of the SA LBB response?
Point c) – reference to energy and water efficiency could also be added.
Point d) – suggest delete reference to ‘natural’ (likely to be semi-natural at best) and add reference to ideally enhancing these areas not just avoiding negative effects.
Point d) – is it likely that Natural England would accept even negligible impacts on SSSIs or the legislation (e.g. W&C Act 1981) would allow any effect on protected species?
Point e) – would it be relevant to also include reference to creating and connecting to cycle routes / networks here?
Point f) – suggest rewording from “… proposals are avoided, reduced, or mitigated” to “… proposals are avoided. In exceptional cases where impacts are unavoidable, it may be acceptable for impacts to be reduced or mitigated to an acceptable / insignificant level”.
(SD3 & SD4)
Agreed – will amend accordingly
Agreed – will amend text to ‘the development will have no significant effect’ & cross reference to policies OS4/OS5/OS6
Agreed
Unnecessary wording – hierarchy can be clarified in supporting text
DP OS 2: Metropolitan Open Land (MOL)
Suggested clarifications and amendment to supporting text: No comments.
Suggested clarifications and amendments to policy text: Point c) – reference to energy and water efficiency could also be added.
Point d) – is it likely that Natural England would accept even negligible impacts on SSSIs or the legislation (e.g. W&C Act 1981) would allow any effect on protected species?
Point d) – suggest delete reference to ‘natural’ (likely to be semi-natural at best) and add reference to ideally enhancing these areas not just avoiding negative effects.
Point e) – suggest rewording from “… proposals are avoided, reduced, or mitigated” to “… proposals are avoided. In exceptional cases where impacts are unavoidable, it may be acceptable for impacts to be reduced or mitigated to an acceptable / insignificant level”.
See changes above
See changes above
See changes above
See changes above
DC OS3 Green Chains and the Blue Ribbon Network
Suggested clarifications and amendment to supporting text: Para 1.278 – in para on the canal, reference to promoting river transport could be added.
Suggested clarifications and amendments to policy text:
2nd
para – in the vicinity of or affecting could be a better way of describing the relationship of new development to the Blue Ribbon Network.
3rd
para – as above.
Point a) – would it be more correct to use the terms main rivers (the Brent Reservoir) and ordinary watercourses?
Agreed – will amend accordingly
Agreed – ‘Visible from’ should be maintained
See above
It is useful to define in the policy text which watercourses are being referred to
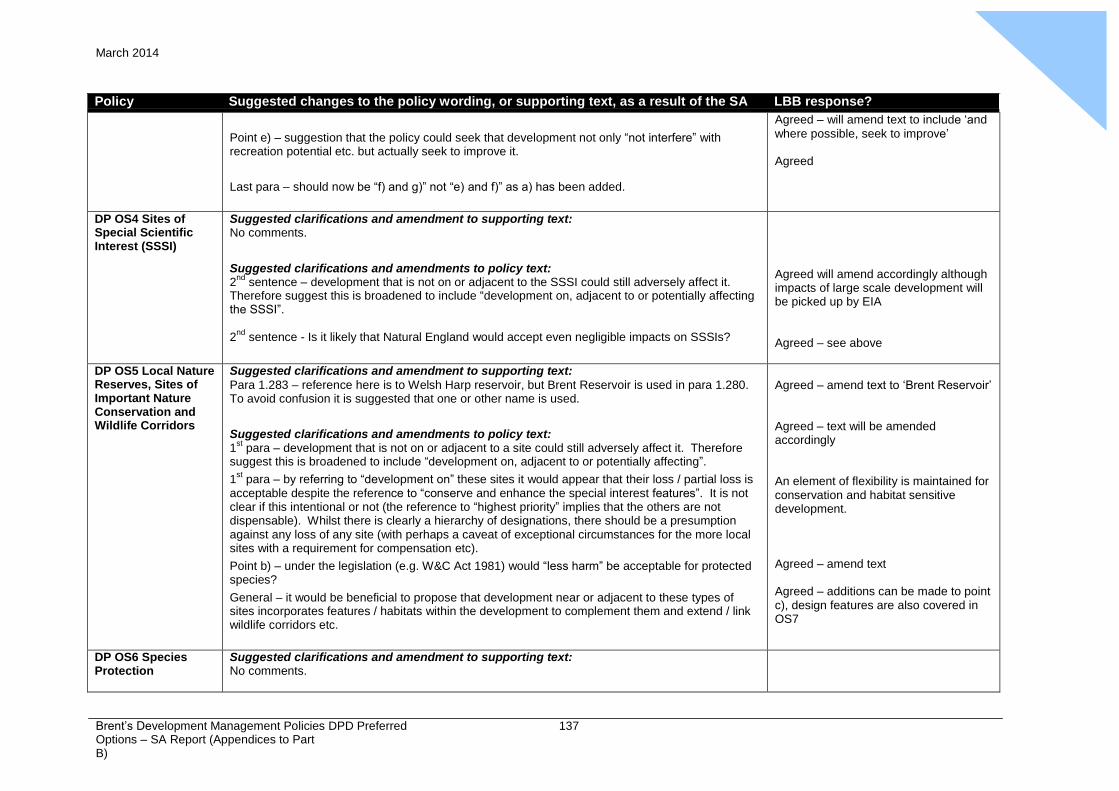
Appendix
8 March 2014
Brent’s Development Management Policies DPD Preferred Options – SA Report (Appendices to Part B)
137
Policy Suggested changes to the policy wording, or supporting text, as a result of the SA LBB response?
Point e) – suggestion that the policy could seek that development not only “not interfere” with recreation potential etc. but actually seek to improve it.
Last para – should now be “f) and g)” not “e) and f)” as a) has been added.
Agreed – will amend text to include ‘and
where possible, seek to improve’
Agreed
DP OS4 Sites of Special Scientific Interest (SSSI)
Suggested clarifications and amendment to supporting text: No comments.
Suggested clarifications and amendments to policy text:
2nd
sentence – development that is not on or adjacent to the SSSI could still adversely affect it. Therefore suggest this is broadened to include “development on, adjacent to or potentially affecting the SSSI”.
2nd
sentence - Is it likely that Natural England would accept even negligible impacts on SSSIs?
Agreed will amend accordingly although impacts of large scale development will be picked up by EIA
Agreed – see above
DP OS5 Local Nature Reserves, Sites of Important Nature Conservation and Wildlife Corridors
Suggested clarifications and amendment to supporting text:
Para 1.283 – reference here is to Welsh Harp reservoir, but Brent Reservoir is used in para 1.280. To avoid confusion it is suggested that one or other name is used.
Suggested clarifications and amendments to policy text:
1st
para – development that is not on or adjacent to a site could still adversely affect it. Therefore suggest this is broadened to include “development on, adjacent to or potentially affecting”.
1st
para – by referring to “development on” these sites it would appear that their loss / partial loss is acceptable despite the reference to “conserve and enhance the special interest features”. It is not clear if this intentional or not (the reference to “highest priority” implies that the others are not dispensable). Whilst there is clearly a hierarchy of designations, there should be a presumption against any loss of any site (with perhaps a caveat of exceptional circumstances for the more local sites with a requirement for compensation etc).
Point b) – under the legislation (e.g. W&C Act 1981) would “less harm” be acceptable for protected species?
General – it would be beneficial to propose that development near or adjacent to these types of sites incorporates features / habitats within the development to complement them and extend / link wildlife corridors etc.
Agreed – amend text to ‘Brent Reservoir’
Agreed – text will be amended accordingly
An element of flexibility is maintained for conservation and habitat sensitive development.
Agreed – amend text
Agreed – additions can be made to point c), design features are also covered in OS7
DP OS6 Species Protection
Suggested clarifications and amendment to supporting text: No comments.
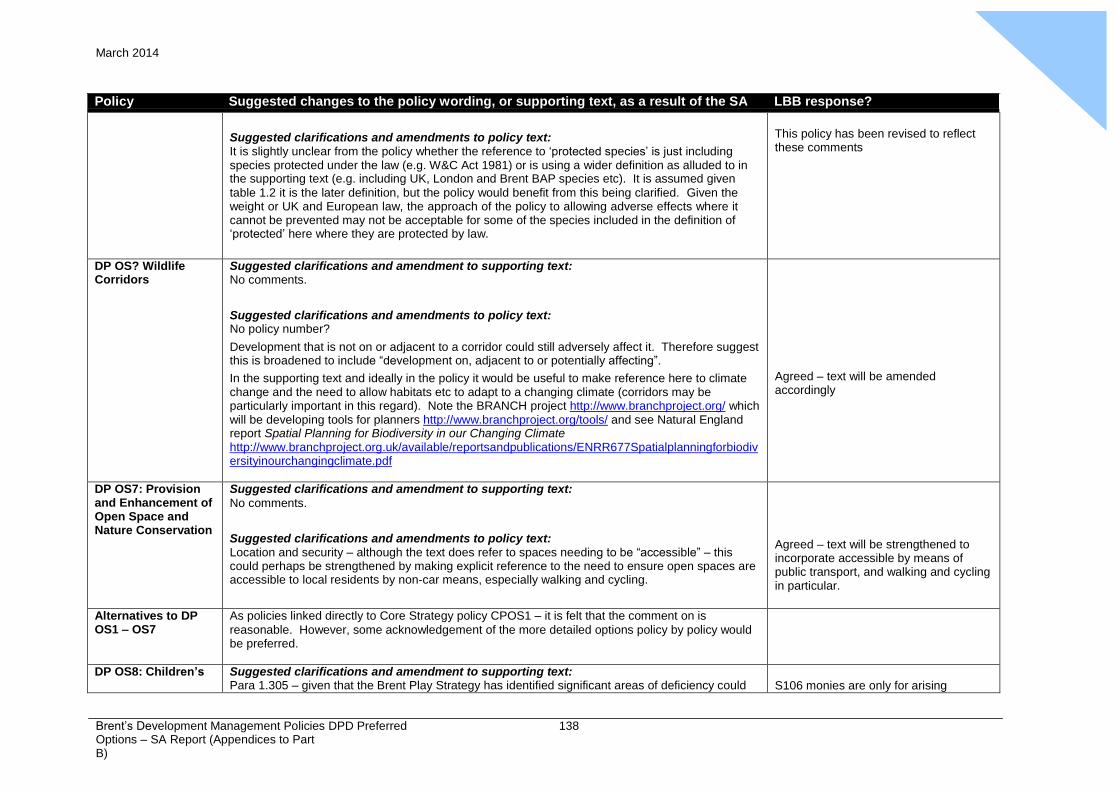
Appendix
8 March 2014
Brent’s Development Management Policies DPD Preferred Options – SA Report (Appendices to Part B)
138
Policy Suggested changes to the policy wording, or supporting text, as a result of the SA LBB response?
Suggested clarifications and amendments to policy text: It is slightly unclear from the policy whether the reference to ‘protected species’ is just including species protected under the law (e.g. W&C Act 1981) or is using a wider definition as alluded to in the supporting text (e.g. including UK, London and Brent BAP species etc). It is assumed given
table 1.2 it is the later definition, but the policy would benefit from this being clarified. Given the weight or UK and European law, the approach of the policy to allowing adverse effects where it cannot be prevented may not be acceptable for some of the species included in the definition of ‘protected’ here where they are protected by law.
This policy has been revised to reflect these comments
DP OS? Wildlife Corridors
Suggested clarifications and amendment to supporting text: No comments.
Suggested clarifications and amendments to policy text: No policy number?
Development that is not on or adjacent to a corridor could still adversely affect it. Therefore suggest this is broadened to include “development on, adjacent to or potentially affecting”.
In the supporting text and ideally in the policy it would be useful to make reference here to climate change and the need to allow habitats etc to adapt to a changing climate (corridors may be particularly important in this regard). Note the BRANCH project http://www.branchproject.org/ which will be developing tools for planners http://www.branchproject.org/tools/ and see Natural England report Spatial Planning for Biodiversity in our Changing Climate http://www.branchproject.org.uk/available/reportsandpublications/ENRR677Spatialplanningforbiodiv ersityinourchangingclimate.pdf
Agreed – text will be amended accordingly
DP OS7: Provision and Enhancement of Open Space and Nature Conservation
Suggested clarifications and amendment to supporting text:
No comments.
Suggested clarifications and amendments to policy text: Location and security – although the text does refer to spaces needing to be “accessible” – this could perhaps be strengthened by making explicit reference to the need to ensure open spaces are accessible to local residents by non-car means, especially walking and cycling.
Agreed – text will be strengthened to incorporate accessible by means of public transport, and walking and cycling in particular.
Alternatives to DP OS1 – OS7
As policies linked directly to Core Strategy policy CPOS1 – it is felt that the comment on is
reasonable. However, some acknowledgement of the more detailed options policy by policy would be preferred.
DP OS8: Children’s Suggested clarifications and amendment to supporting text: Para 1.305 – given that the Brent Play Strategy has identified significant areas of deficiency could
S106 monies are only for arising
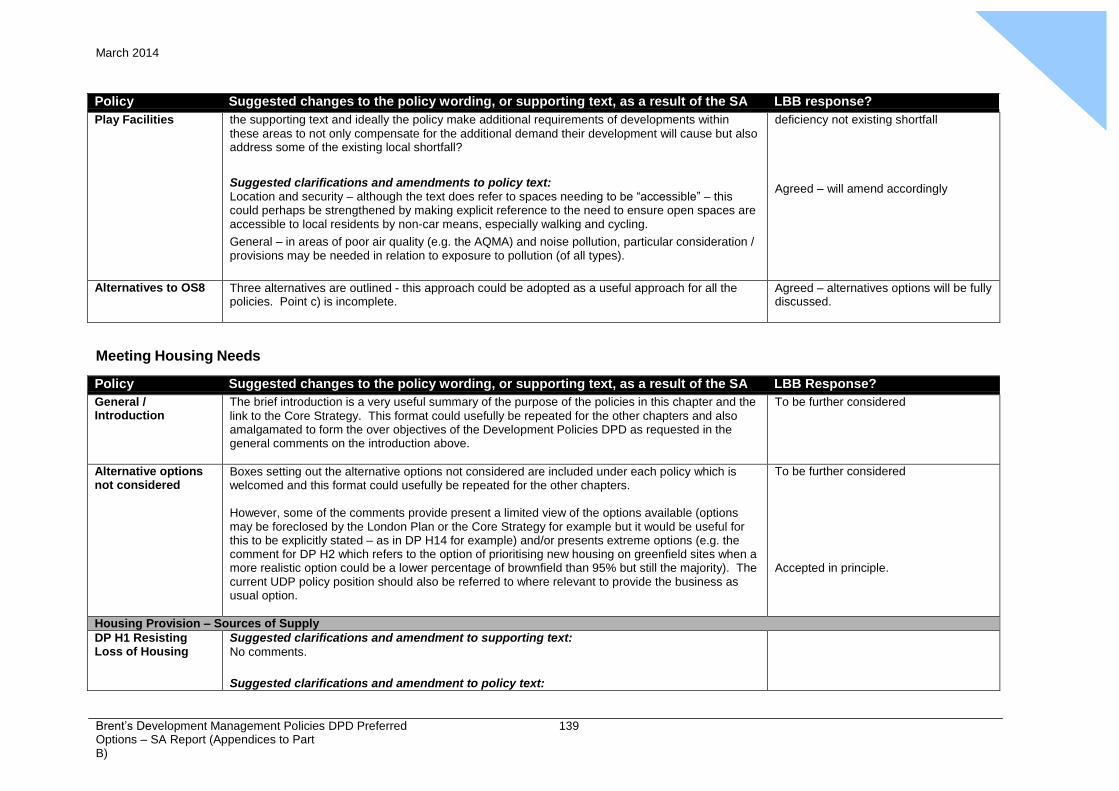
Appendix
8 March 2014
Brent’s Development Management Policies DPD Preferred Options – SA Report (Appendices to Part B)
139
Policy Suggested changes to the policy wording, or supporting text, as a result of the SA LBB response?
Play Facilities the supporting text and ideally the policy make additional requirements of developments within
these areas to not only compensate for the additional demand their development will cause but also address some of the existing local shortfall?
Suggested clarifications and amendments to policy text: Location and security – although the text does refer to spaces needing to be “accessible” – this could perhaps be strengthened by making explicit reference to the need to ensure open spaces are accessible to local residents by non-car means, especially walking and cycling.
General – in areas of poor air quality (e.g. the AQMA) and noise pollution, particular consideration / provisions may be needed in relation to exposure to pollution (of all types).
deficiency not existing shortfall
Agreed – will amend accordingly
Alternatives to OS8 Three alternatives are outlined - this approach could be adopted as a useful approach for all the policies. Point c) is incomplete.
Agreed – alternatives options will be fully discussed.
Meeting Housing Needs
Policy Suggested changes to the policy wording, or supporting text, as a result of the SA LBB Response?
General / Introduction
The brief introduction is a very useful summary of the purpose of the policies in this chapter and the
link to the Core Strategy. This format could usefully be repeated for the other chapters and also amalgamated to form the over objectives of the Development Policies DPD as requested in the general comments on the introduction above.
To be further considered
Alternative options not considered
Boxes setting out the alternative options not considered are included under each policy which is welcomed and this format could usefully be repeated for the other chapters.
However, some of the comments provide present a limited view of the options available (options may be foreclosed by the London Plan or the Core Strategy for example but it would be useful for this to be explicitly stated – as in DP H14 for example) and/or presents extreme options (e.g. the comment for DP H2 which refers to the option of prioritising new housing on greenfield sites when a more realistic option could be a lower percentage of brownfield than 95% but still the majority). The current UDP policy position should also be referred to where relevant to provide the business as usual option.
To be further considered
Accepted in principle.
Housing Provision – Sources of Supply
DP H1 Resisting Loss of Housing
Suggested clarifications and amendment to supporting text:
No comments.
Suggested clarifications and amendment to policy text:
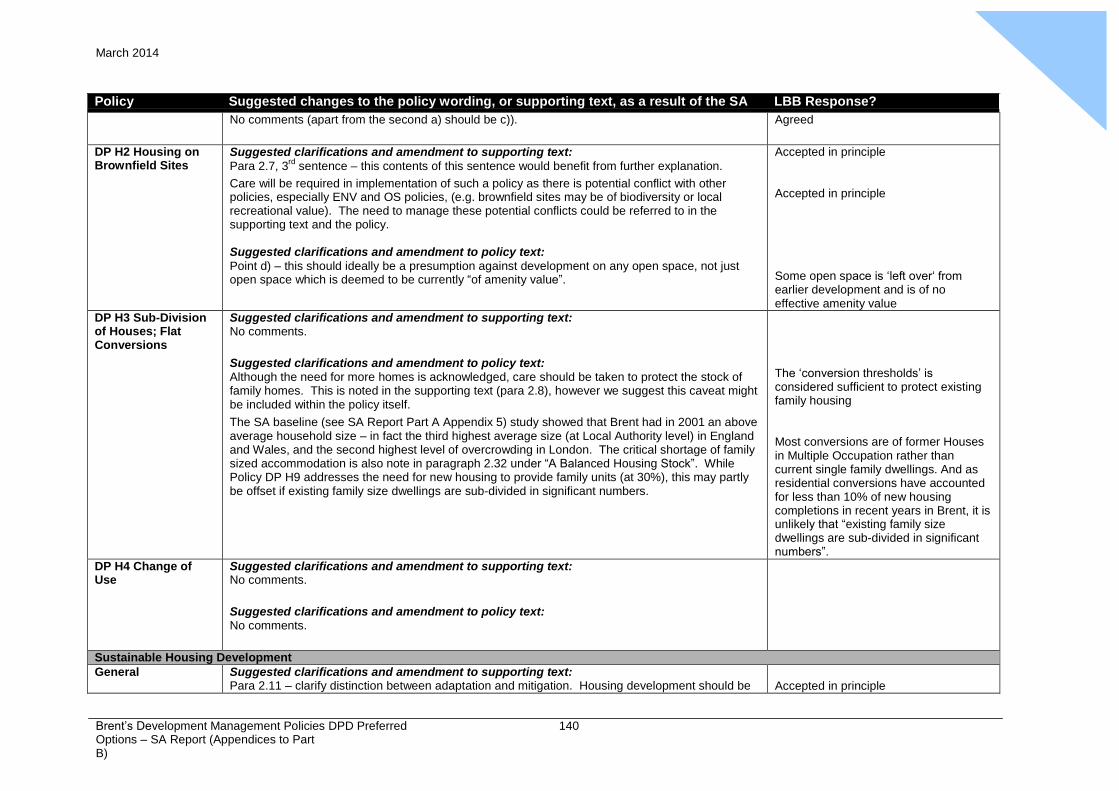
Appendix
8 March 2014
Brent’s Development Management Policies DPD Preferred Options – SA Report (Appendices to Part B)
140
Policy Suggested changes to the policy wording, or supporting text, as a result of the SA LBB Response?
No comments (apart from the second a) should be c)). Agreed
DP H2 Housing on Brownfield Sites
Suggested clarifications and amendment to supporting text:
Para 2.7, 3rd
sentence – this contents of this sentence would benefit from further explanation.
Care will be required in implementation of such a policy as there is potential conflict with other policies, especially ENV and OS policies, (e.g. brownfield sites may be of biodiversity or local recreational value). The need to manage these potential conflicts could be referred to in the supporting text and the policy.
Suggested clarifications and amendment to policy text:
Point d) – this should ideally be a presumption against development on any open space, not just open space which is deemed to be currently “of amenity value”.
Accepted in principle
Accepted in principle
Some open space is ‘left over‘ from earlier development and is of no effective amenity value
DP H3 Sub-Division of Houses; Flat Conversions
Suggested clarifications and amendment to supporting text: No comments.
Suggested clarifications and amendment to policy text: Although the need for more homes is acknowledged, care should be taken to protect the stock of family homes. This is noted in the supporting text (para 2.8), however we suggest this caveat might be included within the policy itself.
The SA baseline (see SA Report Part A Appendix 5) study showed that Brent had in 2001 an above average household size – in fact the third highest average size (at Local Authority level) in England and Wales, and the second highest level of overcrowding in London. The critical shortage of family sized accommodation is also note in paragraph 2.32 under “A Balanced Housing Stock”. While Policy DP H9 addresses the need for new housing to provide family units (at 30%), this may partly be offset if existing family size dwellings are sub-divided in significant numbers.
The ‘conversion thresholds’ is considered sufficient to protect existing family housing
Most conversions are of former Houses in Multiple Occupation rather than current single family dwellings. And as residential conversions have accounted for less than 10% of new housing completions in recent years in Brent, it is unlikely that “existing family size dwellings are sub-divided in significant numbers”.
DP H4 Change of Use
Suggested clarifications and amendment to supporting text: No comments.
Suggested clarifications and amendment to policy text: No comments.
Sustainable Housing Development
General Suggested clarifications and amendment to supporting text: Para 2.11 – clarify distinction between adaptation and mitigation. Housing development should be
Accepted in principle
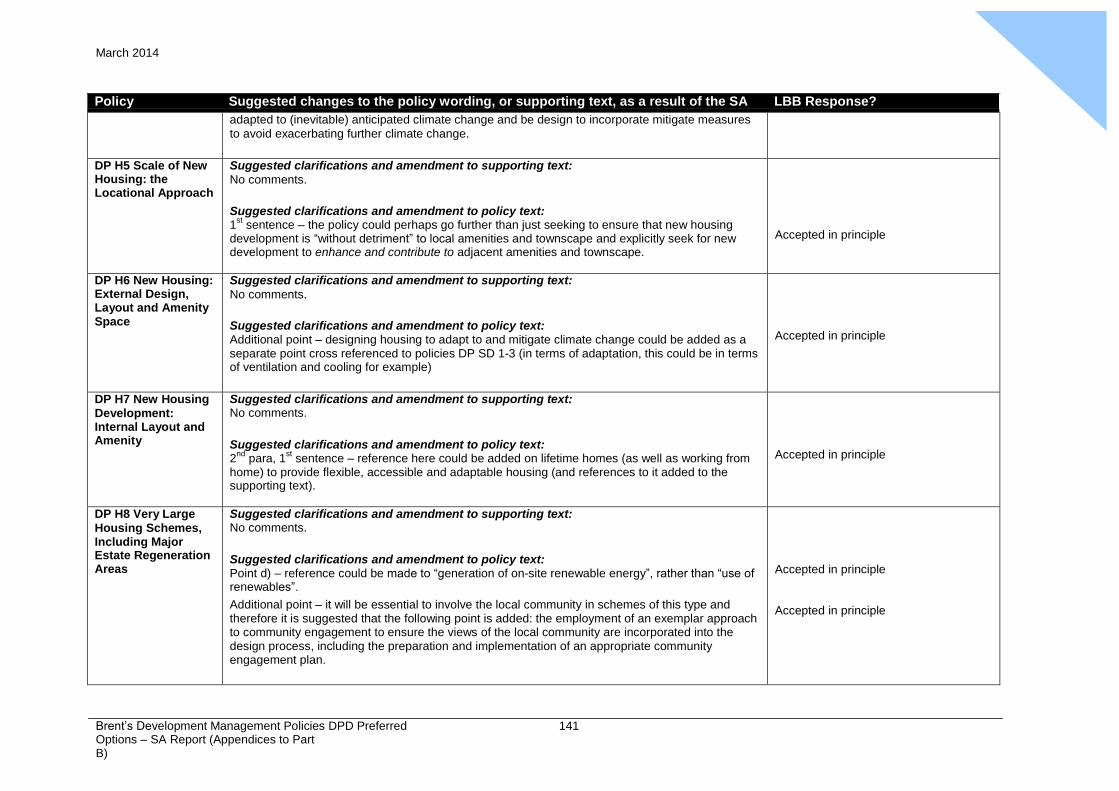
Appendix
8 March 2014
Brent’s Development Management Policies DPD Preferred Options – SA Report (Appendices to Part B)
141
Policy Suggested changes to the policy wording, or supporting text, as a result of the SA LBB Response?
adapted to (inevitable) anticipated climate change and be design to incorporate mitigate measures
to avoid exacerbating further climate change.
DP H5 Scale of New Housing: the Locational Approach
Suggested clarifications and amendment to supporting text:
No comments.
Suggested clarifications and amendment to policy text:
1st
sentence – the policy could perhaps go further than just seeking to ensure that new housing development is “without detriment” to local amenities and townscape and explicitly seek for new development to enhance and contribute to adjacent amenities and townscape.
Accepted in principle
DP H6 New Housing: External Design, Layout and Amenity Space
Suggested clarifications and amendment to supporting text:
No comments.
Suggested clarifications and amendment to policy text: Additional point – designing housing to adapt to and mitigate climate change could be added as a separate point cross referenced to policies DP SD 1-3 (in terms of adaptation, this could be in terms of ventilation and cooling for example)
Accepted in principle
DP H7 New Housing
Development: Internal Layout and Amenity
Suggested clarifications and amendment to supporting text: No comments.
Suggested clarifications and amendment to policy text:
2nd
para, 1st
sentence – reference here could be added on lifetime homes (as well as working from home) to provide flexible, accessible and adaptable housing (and references to it added to the supporting text).
Accepted in principle
DP H8 Very Large
Housing Schemes, Including Major Estate Regeneration Areas
Suggested clarifications and amendment to supporting text: No comments.
Suggested clarifications and amendment to policy text: Point d) – reference could be made to “generation of on-site renewable energy”, rather than “use of renewables”.
Additional point – it will be essential to involve the local community in schemes of this type and therefore it is suggested that the following point is added: the employment of an exemplar approach to community engagement to ensure the views of the local community are incorporated into the design process, including the preparation and implementation of an appropriate community engagement plan.
Accepted in principle
Accepted in principle
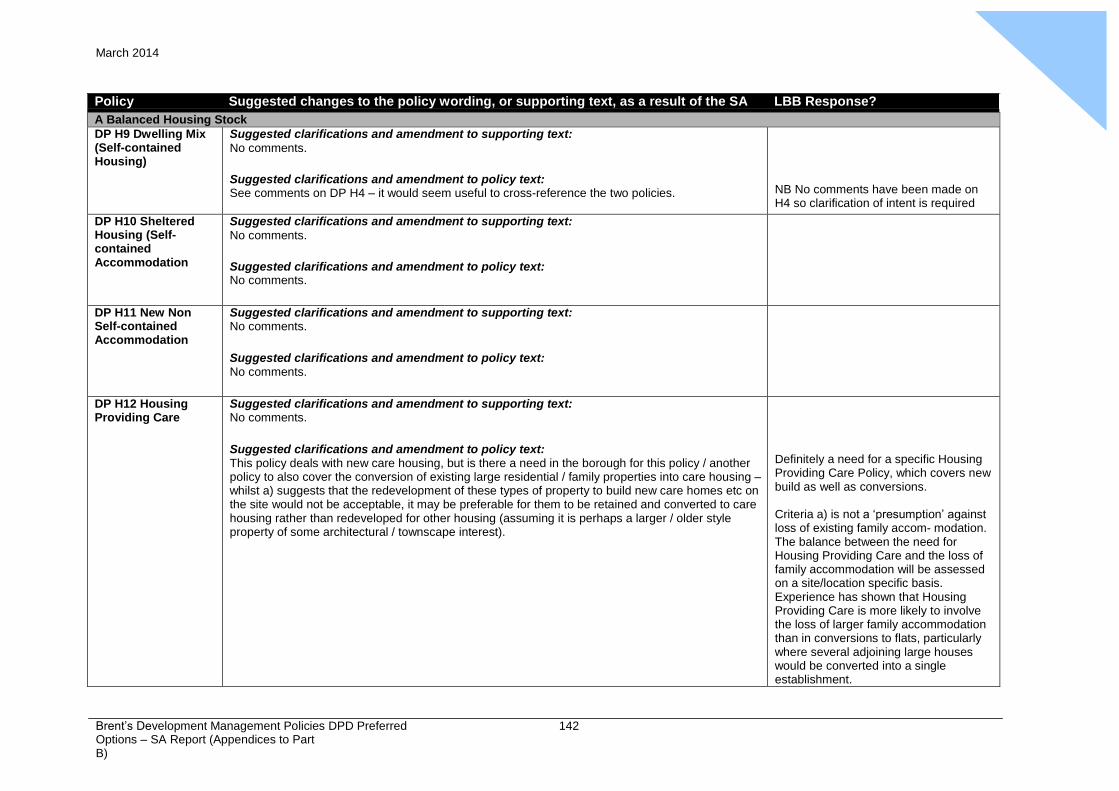
Appendix
8 March 2014
Brent’s Development Management Policies DPD Preferred Options – SA Report (Appendices to Part B)
142
Policy Suggested changes to the policy wording, or supporting text, as a result of the SA LBB Response?
A Balanced Housing Stock
DP H9 Dwelling Mix (Self-contained Housing)
Suggested clarifications and amendment to supporting text:
No comments.
Suggested clarifications and amendment to policy text: See comments on DP H4 – it would seem useful to cross-reference the two policies.
NB No comments have been made on H4 so clarification of intent is required
DP H10 Sheltered Housing (Self- contained Accommodation
Suggested clarifications and amendment to supporting text:
No comments.
Suggested clarifications and amendment to policy text: No comments.
DP H11 New Non Self-contained Accommodation
Suggested clarifications and amendment to supporting text: No comments.
Suggested clarifications and amendment to policy text: No comments.
DP H12 Housing Providing Care
Suggested clarifications and amendment to supporting text: No comments.
Suggested clarifications and amendment to policy text: This policy deals with new care housing, but is there a need in the borough for this policy / another policy to also cover the conversion of existing large residential / family properties into care housing – whilst a) suggests that the redevelopment of these types of property to build new care homes etc on the site would not be acceptable, it may be preferable for them to be retained and converted to care housing rather than redeveloped for other housing (assuming it is perhaps a larger / older style property of some architectural / townscape interest).
Definitely a need for a specific Housing Providing Care Policy, which covers new build as well as conversions.
Criteria a) is not a ‘presumption’ against loss of existing family accom- modation. The balance between the need for Housing Providing Care and the loss of family accommodation will be assessed on a site/location specific basis. Experience has shown that Housing Providing Care is more likely to involve the loss of larger family accommodation than in conversions to flats, particularly where several adjoining large houses would be converted into a single establishment.
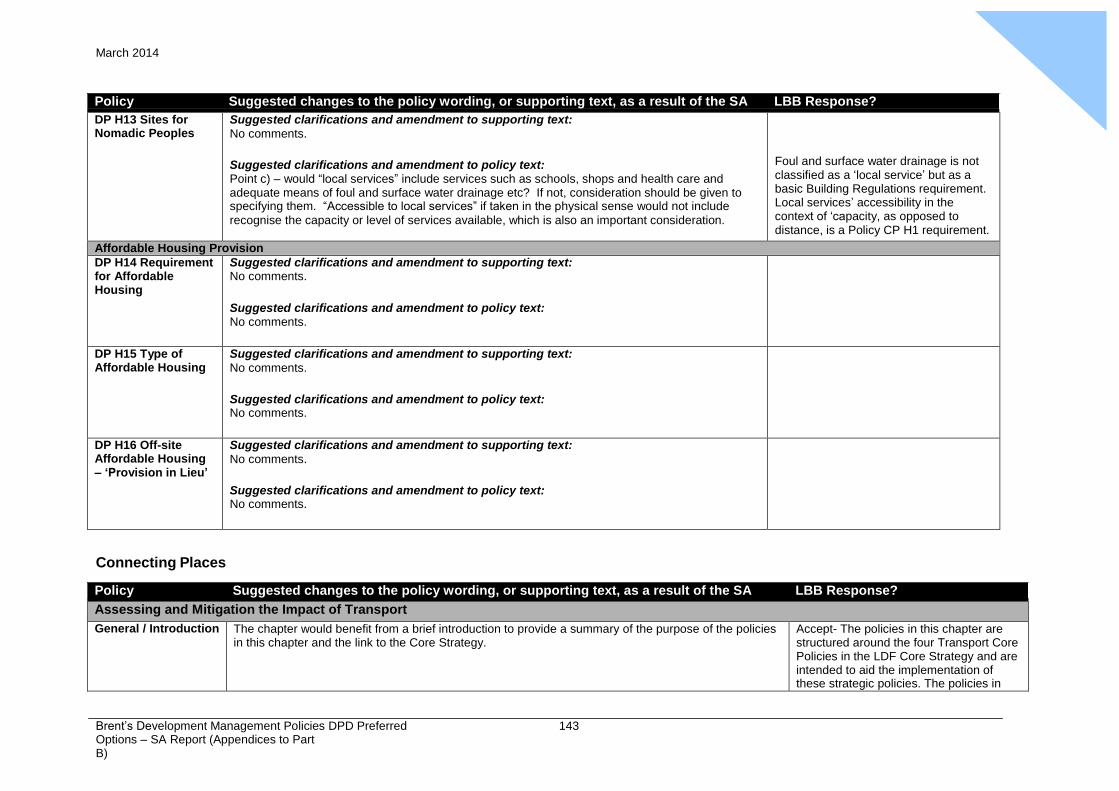
Appendix
8 March 2014
Brent’s Development Management Policies DPD Preferred Options – SA Report (Appendices to Part B)
143
Policy Suggested changes to the policy wording, or supporting text, as a result of the SA LBB Response?
DP H13 Sites for Nomadic Peoples
Suggested clarifications and amendment to supporting text:
No comments.
Suggested clarifications and amendment to policy text: Point c) – would “local services” include services such as schools, shops and health care and adequate means of foul and surface water drainage etc? If not, consideration should be given to specifying them. “Accessible to local services” if taken in the physical sense would not include
recognise the capacity or level of services available, which is also an important consideration.
Foul and surface water drainage is not classified as a ‘local service’ but as a basic Building Regulations requirement. Local services’ accessibility in the context of ‘capacity, as opposed to distance, is a Policy CP H1 requirement.
Affordable Housing Provision
DP H14 Requirement for Affordable Housing
Suggested clarifications and amendment to supporting text: No comments.
Suggested clarifications and amendment to policy text: No comments.
DP H15 Type of Affordable Housing
Suggested clarifications and amendment to supporting text:
No comments.
Suggested clarifications and amendment to policy text: No comments.
DP H16 Off-site Affordable Housing – ‘Provision in Lieu’
Suggested clarifications and amendment to supporting text:
No comments.
Suggested clarifications and amendment to policy text: No comments.
Connecting Places
Policy Suggested changes to the policy wording, or supporting text, as a result of the SA LBB Response?
Assessing and Mitigation the Impact of Transport
General / Introduction The chapter would benefit from a brief introduction to provide a summary of the purpose of the policies in this chapter and the link to the Core Strategy.
Accept- The policies in this chapter are structured around the four Transport Core Policies in the LDF Core Strategy and are intended to aid the implementation of these strategic policies. The policies in
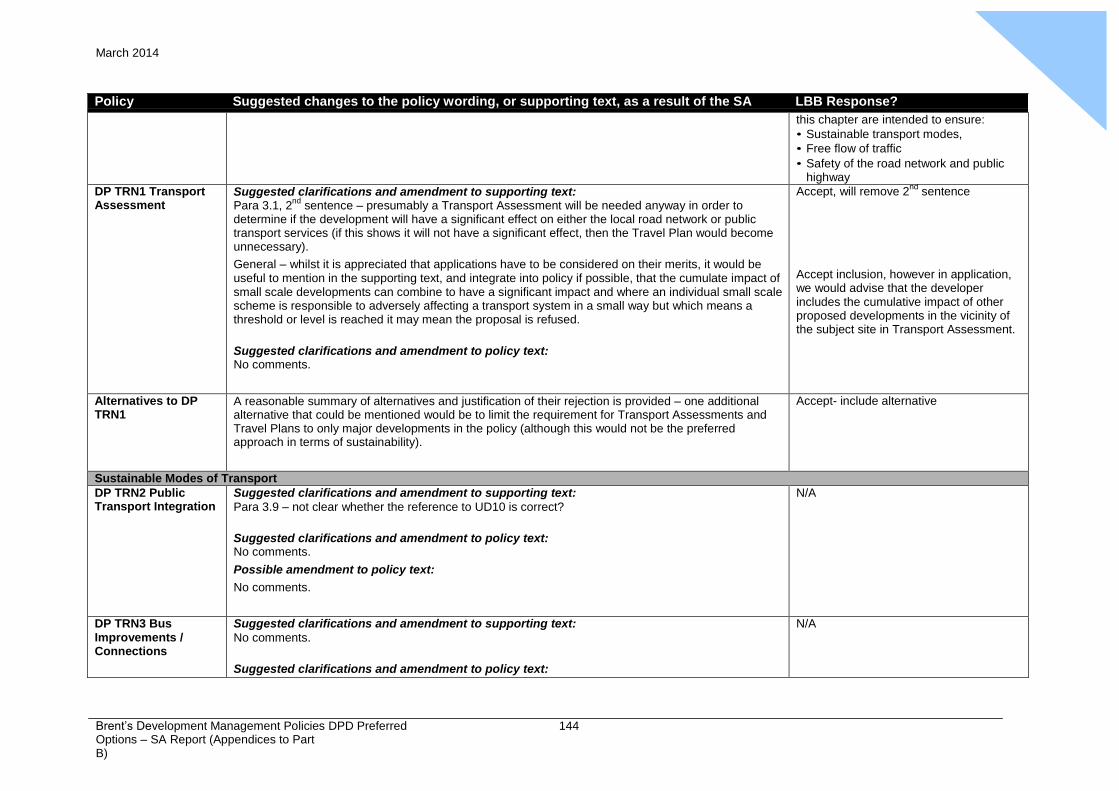
Appendix
8 March 2014
Brent’s Development Management Policies DPD Preferred Options – SA Report (Appendices to Part B)
144
Policy Suggested changes to the policy wording, or supporting text, as a result of the SA LBB Response?
this chapter are intended to ensure:
• Sustainable transport modes,
• Free flow of traffic
• Safety of the road network and public highway
DP TRN1 Transport Assessment
Suggested clarifications and amendment to supporting text:
Para 3.1, 2nd
sentence – presumably a Transport Assessment will be needed anyway in order to determine if the development will have a significant effect on either the local road network or public transport services (if this shows it will not have a significant effect, then the Travel Plan would become unnecessary).
General – whilst it is appreciated that applications have to be considered on their merits, it would be useful to mention in the supporting text, and integrate into policy if possible, that the cumulate impact of small scale developments can combine to have a significant impact and where an individual small scale scheme is responsible to adversely affecting a transport system in a small way but which means a threshold or level is reached it may mean the proposal is refused.
Suggested clarifications and amendment to policy text: No comments.
Accept, will remove 2nd
sentence
Accept inclusion, however in application, we would advise that the developer includes the cumulative impact of other proposed developments in the vicinity of the subject site in Transport Assessment.
Alternatives to DP TRN1
A reasonable summary of alternatives and justification of their rejection is provided – one additional alternative that could be mentioned would be to limit the requirement for Transport Assessments and Travel Plans to only major developments in the policy (although this would not be the preferred approach in terms of sustainability).
Accept- include alternative
Sustainable Modes of Transport
DP TRN2 Public Transport Integration
Suggested clarifications and amendment to supporting text:
Para 3.9 – not clear whether the reference to UD10 is correct?
Suggested clarifications and amendment to policy text: No comments.
Possible amendment to policy text:
No comments.
N/A
DP TRN3 Bus Improvements / Connections
Suggested clarifications and amendment to supporting text:
No comments.
Suggested clarifications and amendment to policy text:
N/A
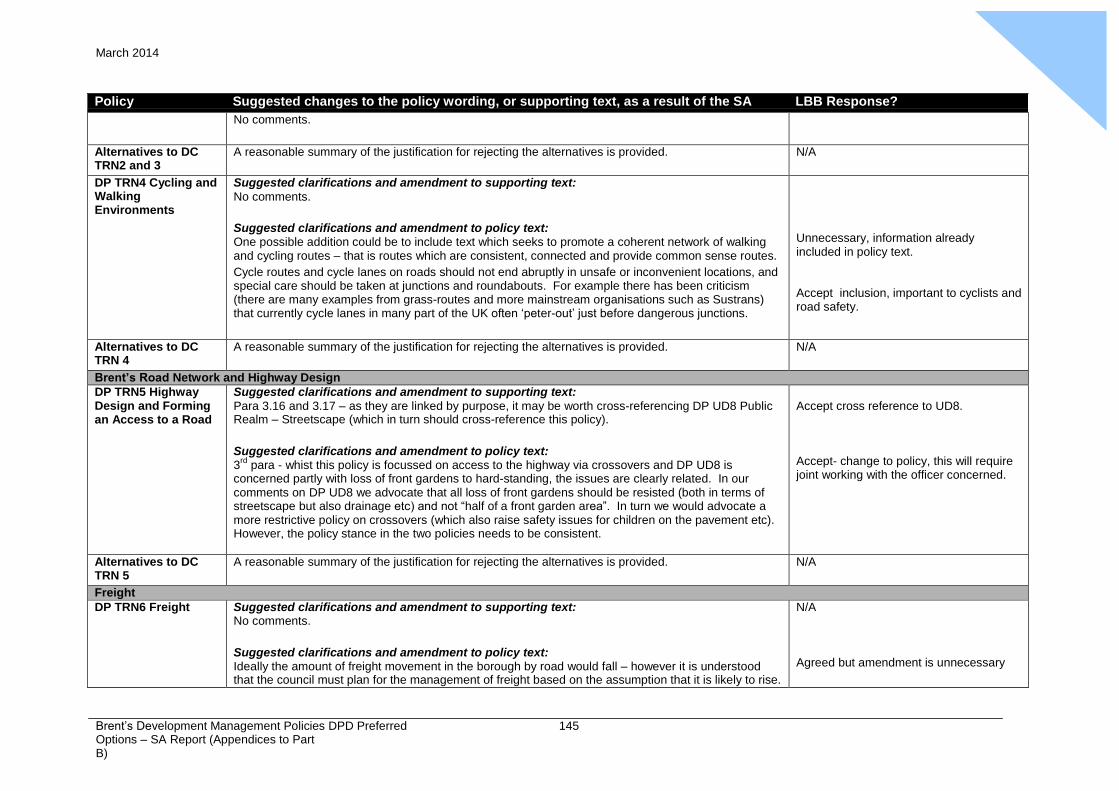
Appendix
8 March 2014
Brent’s Development Management Policies DPD Preferred Options – SA Report (Appendices to Part B)
145
Policy Suggested changes to the policy wording, or supporting text, as a result of the SA LBB Response?
No comments.
Alternatives to DC TRN2 and 3
A reasonable summary of the justification for rejecting the alternatives is provided. N/A
DP TRN4 Cycling and Walking Environments
Suggested clarifications and amendment to supporting text:
No comments.
Suggested clarifications and amendment to policy text: One possible addition could be to include text which seeks to promote a coherent network of walking and cycling routes – that is routes which are consistent, connected and provide common sense routes.
Cycle routes and cycle lanes on roads should not end abruptly in unsafe or inconvenient locations, and special care should be taken at junctions and roundabouts. For example there has been criticism (there are many examples from grass-routes and more mainstream organisations such as Sustrans) that currently cycle lanes in many part of the UK often ‘peter-out’ just before dangerous junctions.
Unnecessary, information already included in policy text.
Accept inclusion, important to cyclists and road safety.
Alternatives to DC TRN 4
A reasonable summary of the justification for rejecting the alternatives is provided. N/A
Brent’s Road Network and Highway Design
DP TRN5 Highway Design and Forming an Access to a Road
Suggested clarifications and amendment to supporting text:
Para 3.16 and 3.17 – as they are linked by purpose, it may be worth cross-referencing DP UD8 Public Realm – Streetscape (which in turn should cross-reference this policy).
Suggested clarifications and amendment to policy text:
3rd
para - whist this policy is focussed on access to the highway via crossovers and DP UD8 is concerned partly with loss of front gardens to hard-standing, the issues are clearly related. In our comments on DP UD8 we advocate that all loss of front gardens should be resisted (both in terms of streetscape but also drainage etc) and not “half of a front garden area”. In turn we would advocate a more restrictive policy on crossovers (which also raise safety issues for children on the pavement etc). However, the policy stance in the two policies needs to be consistent.
Accept cross reference to UD8.
Accept- change to policy, this will require joint working with the officer concerned.
Alternatives to DC TRN 5
A reasonable summary of the justification for rejecting the alternatives is provided. N/A
Freight
DP TRN6 Freight Suggested clarifications and amendment to supporting text: No comments.
Suggested clarifications and amendment to policy text: Ideally the amount of freight movement in the borough by road would fall – however it is understood that the council must plan for the management of freight based on the assumption that it is likely to rise.
N/A
Agreed but amendment is unnecessary
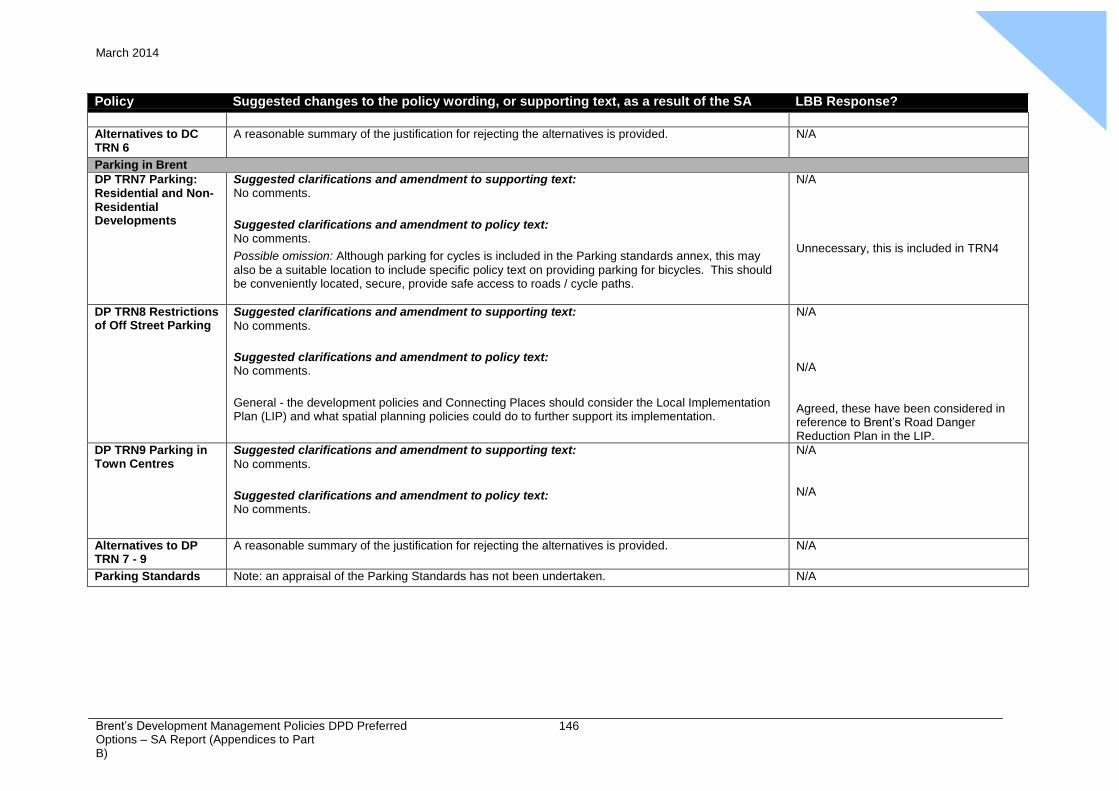
Appendix
8 March 2014
Brent’s Development Management Policies DPD Preferred Options – SA Report (Appendices to Part B)
146
Policy Suggested changes to the policy wording, or supporting text, as a result of the SA LBB Response?
Alternatives to DC TRN 6
A reasonable summary of the justification for rejecting the alternatives is provided. N/A
Parking in Brent
DP TRN7 Parking: Residential and Non- Residential Developments
Suggested clarifications and amendment to supporting text: No comments.
Suggested clarifications and amendment to policy text: No comments.
Possible omission: Although parking for cycles is included in the Parking standards annex, this may
also be a suitable location to include specific policy text on providing parking for bicycles. This should be conveniently located, secure, provide safe access to roads / cycle paths.
N/A
Unnecessary, this is included in TRN4
DP TRN8 Restrictions of Off Street Parking
Suggested clarifications and amendment to supporting text:
No comments.
Suggested clarifications and amendment to policy text: No comments.
General - the development policies and Connecting Places should consider the Local Implementation Plan (LIP) and what spatial planning policies could do to further support its implementation.
N/A
N/A
Agreed, these have been considered in reference to Brent’s Road Danger Reduction Plan in the LIP.
DP TRN9 Parking in Town Centres
Suggested clarifications and amendment to supporting text:
No comments.
Suggested clarifications and amendment to policy text: No comments.
N/A
N/A
Alternatives to DP TRN 7 - 9
A reasonable summary of the justification for rejecting the alternatives is provided. N/A
Parking Standards Note: an appraisal of the Parking Standards has not been undertaken. N/A
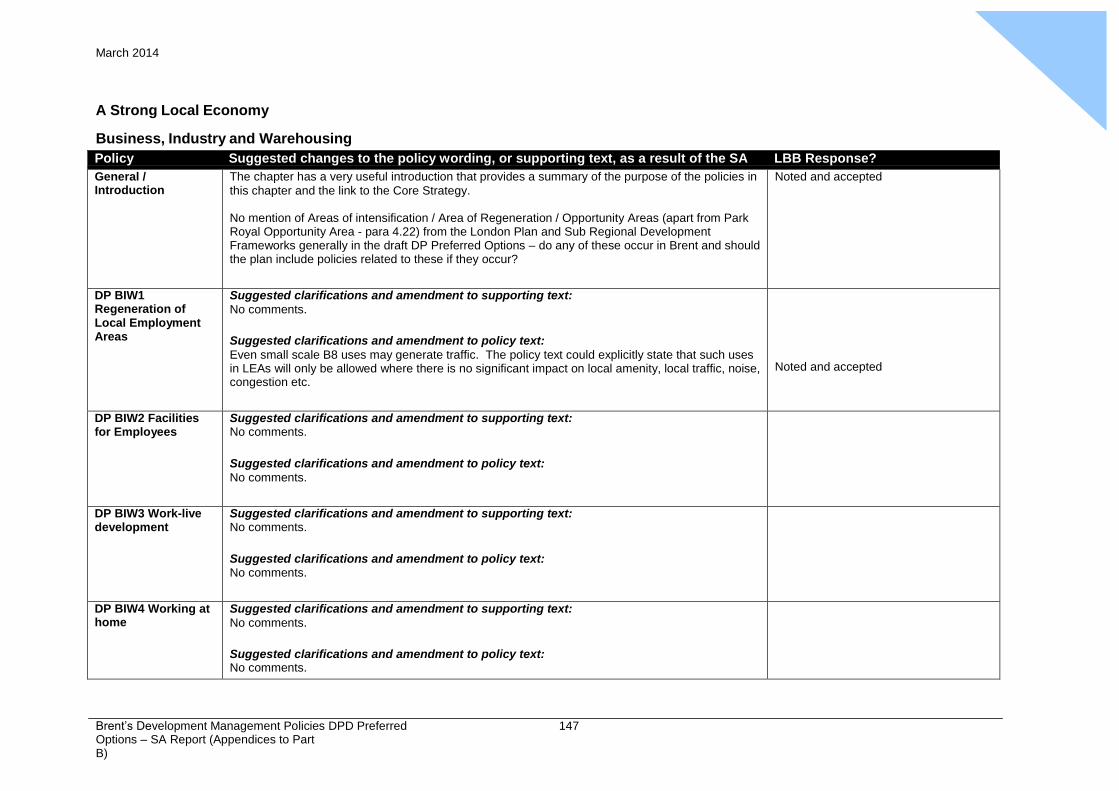
Appendix
8 March 2014
Brent’s Development Management Policies DPD Preferred Options – SA Report (Appendices to Part B)
147
A Strong Local Economy
Business, Industry and Warehousing
Policy Suggested changes to the policy wording, or supporting text, as a result of the SA LBB Response?
General / Introduction
The chapter has a very useful introduction that provides a summary of the purpose of the policies in
this chapter and the link to the Core Strategy.
No mention of Areas of intensification / Area of Regeneration / Opportunity Areas (apart from Park Royal Opportunity Area - para 4.22) from the London Plan and Sub Regional Development Frameworks generally in the draft DP Preferred Options – do any of these occur in Brent and should the plan include policies related to these if they occur?
Noted and accepted
DP BIW1 Regeneration of Local Employment Areas
Suggested clarifications and amendment to supporting text:
No comments.
Suggested clarifications and amendment to policy text:
Even small scale B8 uses may generate traffic. The policy text could explicitly state that such uses in LEAs will only be allowed where there is no significant impact on local amenity, local traffic, noise, congestion etc.
Noted and accepted
DP BIW2 Facilities for Employees
Suggested clarifications and amendment to supporting text: No comments.
Suggested clarifications and amendment to policy text:
No comments.
DP BIW3 Work-live development
Suggested clarifications and amendment to supporting text: No comments.
Suggested clarifications and amendment to policy text: No comments.
DP BIW4 Working at home
Suggested clarifications and amendment to supporting text:
No comments.
Suggested clarifications and amendment to policy text: No comments.
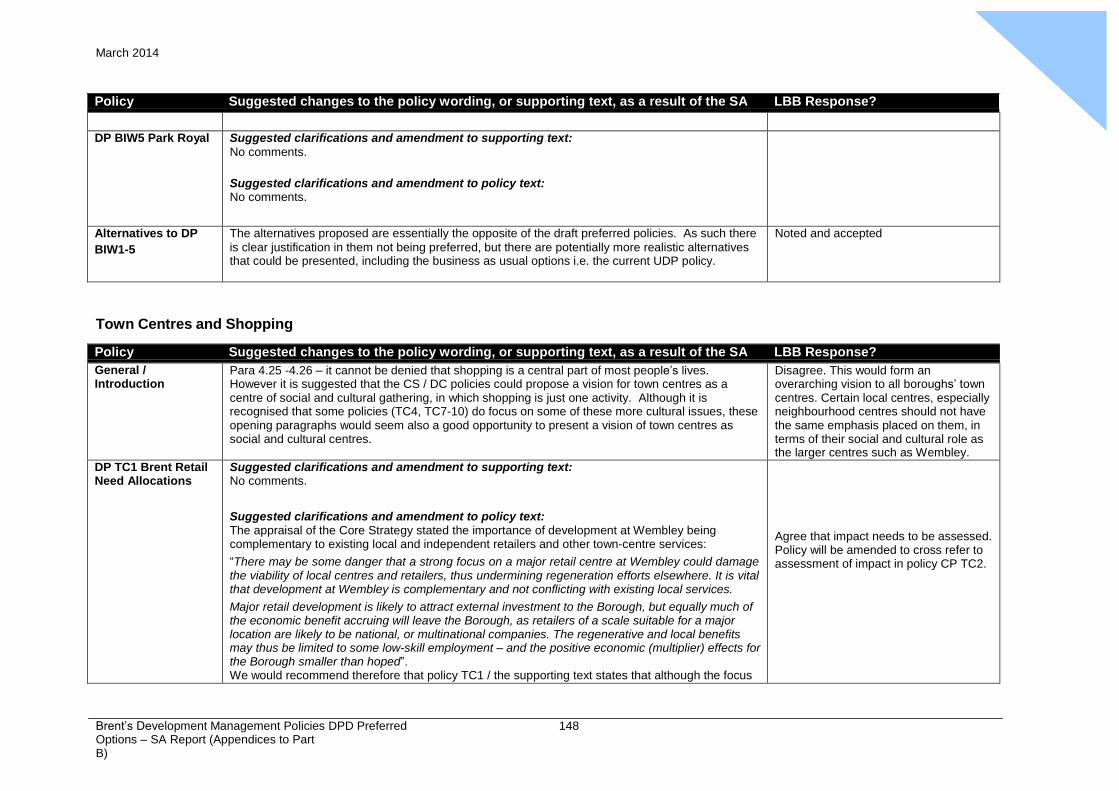
Appendix
8 March 2014
Brent’s Development Management Policies DPD Preferred Options – SA Report (Appendices to Part B)
148
Policy Suggested changes to the policy wording, or supporting text, as a result of the SA LBB Response?
DP BIW5 Park Royal Suggested clarifications and amendment to supporting text:
No comments.
Suggested clarifications and amendment to policy text: No comments.
Alternatives to DP
BIW1-5
The alternatives proposed are essentially the opposite of the draft preferred policies. As such there
is clear justification in them not being preferred, but there are potentially more realistic alternatives that could be presented, including the business as usual options i.e. the current UDP policy.
Noted and accepted
Town Centres and Shopping
Policy Suggested changes to the policy wording, or supporting text, as a result of the SA LBB Response?
General / Introduction
Para 4.25 -4.26 – it cannot be denied that shopping is a central part of most people’s lives. However it is suggested that the CS / DC policies could propose a vision for town centres as a centre of social and cultural gathering, in which shopping is just one activity. Although it is recognised that some policies (TC4, TC7-10) do focus on some of these more cultural issues, these opening paragraphs would seem also a good opportunity to present a vision of town centres as social and cultural centres.
Disagree. This would form an overarching vision to all boroughs’ town centres. Certain local centres, especially neighbourhood centres should not have the same emphasis placed on them, in terms of their social and cultural role as the larger centres such as Wembley.
DP TC1 Brent Retail Need Allocations
Suggested clarifications and amendment to supporting text: No comments.
Suggested clarifications and amendment to policy text: The appraisal of the Core Strategy stated the importance of development at Wembley being complementary to existing local and independent retailers and other town-centre services:
“There may be some danger that a strong focus on a major retail centre at Wembley could damage the viability of local centres and retailers, thus undermining regeneration efforts elsewhere. It is vital that development at Wembley is complementary and not conflicting with existing local services.
Major retail development is likely to attract external investment to the Borough, but equally much of the economic benefit accruing will leave the Borough, as retailers of a scale suitable for a major location are likely to be national, or multinational companies. The regenerative and local benefits may thus be limited to some low-skill employment – and the positive economic (multiplier) effects for the Borough smaller than hoped”. We would recommend therefore that policy TC1 / the supporting text states that although the focus
Agree that impact needs to be assessed. Policy will be amended to cross refer to assessment of impact in policy CP TC2.
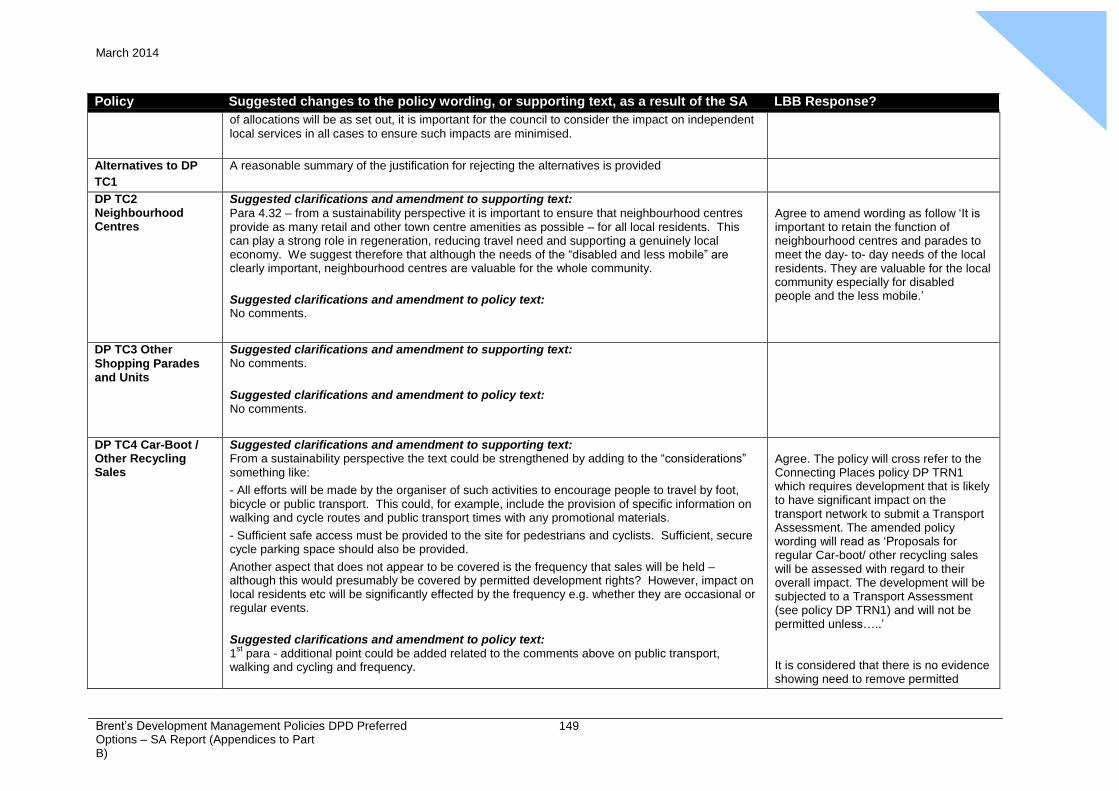
Appendix
8 March 2014
Brent’s Development Management Policies DPD Preferred Options – SA Report (Appendices to Part B)
149
Policy Suggested changes to the policy wording, or supporting text, as a result of the SA LBB Response?
of allocations will be as set out, it is important for the council to consider the impact on independent
local services in all cases to ensure such impacts are minimised.
Alternatives to DP
TC1
A reasonable summary of the justification for rejecting the alternatives is provided
DP TC2 Neighbourhood Centres
Suggested clarifications and amendment to supporting text:
Para 4.32 – from a sustainability perspective it is important to ensure that neighbourhood centres provide as many retail and other town centre amenities as possible – for all local residents. This can play a strong role in regeneration, reducing travel need and supporting a genuinely local economy. We suggest therefore that although the needs of the “disabled and less mobile” are clearly important, neighbourhood centres are valuable for the whole community.
Suggested clarifications and amendment to policy text: No comments.
Agree to amend wording as follow ‘It is important to retain the function of neighbourhood centres and parades to meet the day- to- day needs of the local residents. They are valuable for the local community especially for disabled people and the less mobile.’
DP TC3 Other
Shopping Parades and Units
Suggested clarifications and amendment to supporting text: No comments.
Suggested clarifications and amendment to policy text: No comments.
DP TC4 Car-Boot / Other Recycling Sales
Suggested clarifications and amendment to supporting text: From a sustainability perspective the text could be strengthened by adding to the “considerations”
something like:
- All efforts will be made by the organiser of such activities to encourage people to travel by foot, bicycle or public transport. This could, for example, include the provision of specific information on walking and cycle routes and public transport times with any promotional materials.
- Sufficient safe access must be provided to the site for pedestrians and cyclists. Sufficient, secure cycle parking space should also be provided.
Another aspect that does not appear to be covered is the frequency that sales will be held – although this would presumably be covered by permitted development rights? However, impact on local residents etc will be significantly effected by the frequency e.g. whether they are occasional or regular events.
Suggested clarifications and amendment to policy text:
1st
para - additional point could be added related to the comments above on public transport, walking and cycling and frequency.
Agree. The policy will cross refer to the Connecting Places policy DP TRN1 which requires development that is likely to have significant impact on the transport network to submit a Transport Assessment. The amended policy wording will read as ‘Proposals for regular Car-boot/ other recycling sales will be assessed with regard to their overall impact. The development will be subjected to a Transport Assessment (see policy DP TRN1) and will not be permitted unless…..’
It is considered that there is no evidence showing need to remove permitted
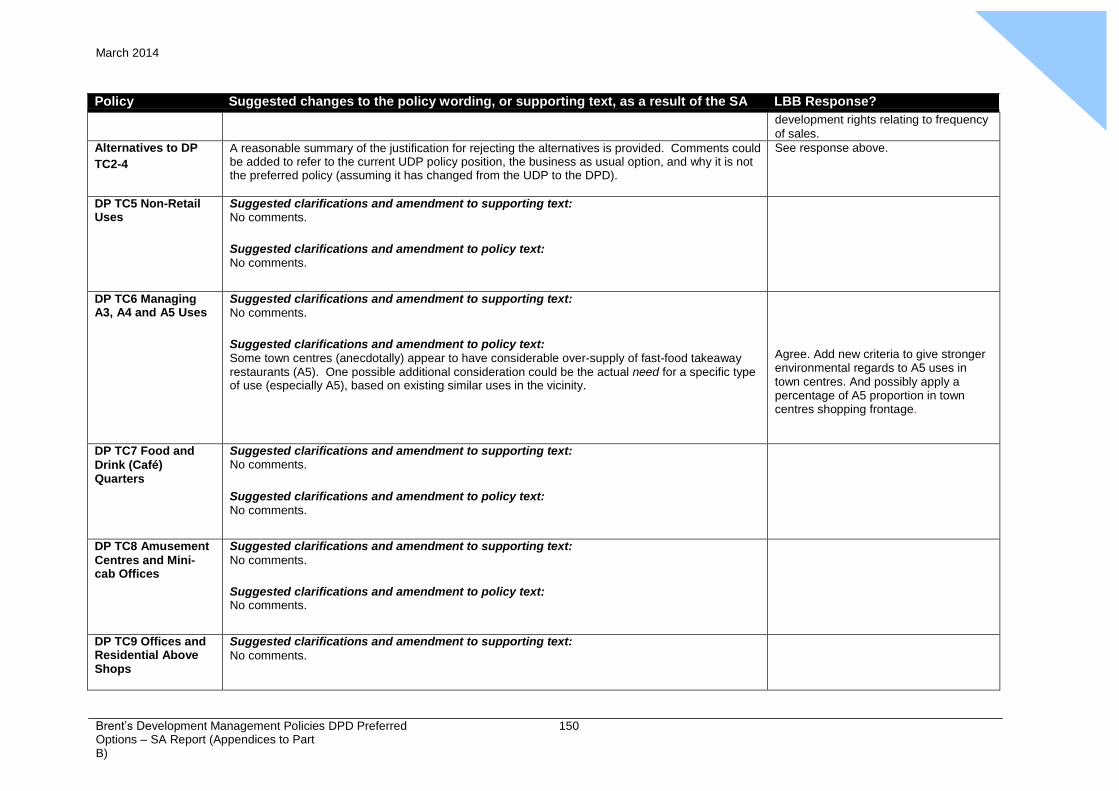
Appendix
8 March 2014
Brent’s Development Management Policies DPD Preferred Options – SA Report (Appendices to Part B)
150
Policy Suggested changes to the policy wording, or supporting text, as a result of the SA LBB Response?
development rights relating to frequency
of sales.
Alternatives to DP
TC2-4
A reasonable summary of the justification for rejecting the alternatives is provided. Comments could be added to refer to the current UDP policy position, the business as usual option, and why it is not the preferred policy (assuming it has changed from the UDP to the DPD).
See response above.
DP TC5 Non-Retail Uses
Suggested clarifications and amendment to supporting text: No comments.
Suggested clarifications and amendment to policy text: No comments.
DP TC6 Managing A3, A4 and A5 Uses
Suggested clarifications and amendment to supporting text: No comments.
Suggested clarifications and amendment to policy text: Some town centres (anecdotally) appear to have considerable over-supply of fast-food takeaway restaurants (A5). One possible additional consideration could be the actual need for a specific type of use (especially A5), based on existing similar uses in the vicinity.
Agree. Add new criteria to give stronger environmental regards to A5 uses in town centres. And possibly apply a percentage of A5 proportion in town centres shopping frontage.
DP TC7 Food and
Drink (Café) Quarters
Suggested clarifications and amendment to supporting text: No comments.
Suggested clarifications and amendment to policy text: No comments.
DP TC8 Amusement
Centres and Mini- cab Offices
Suggested clarifications and amendment to supporting text:
No comments.
Suggested clarifications and amendment to policy text: No comments.
DP TC9 Offices and Residential Above Shops
Suggested clarifications and amendment to supporting text:
No comments.
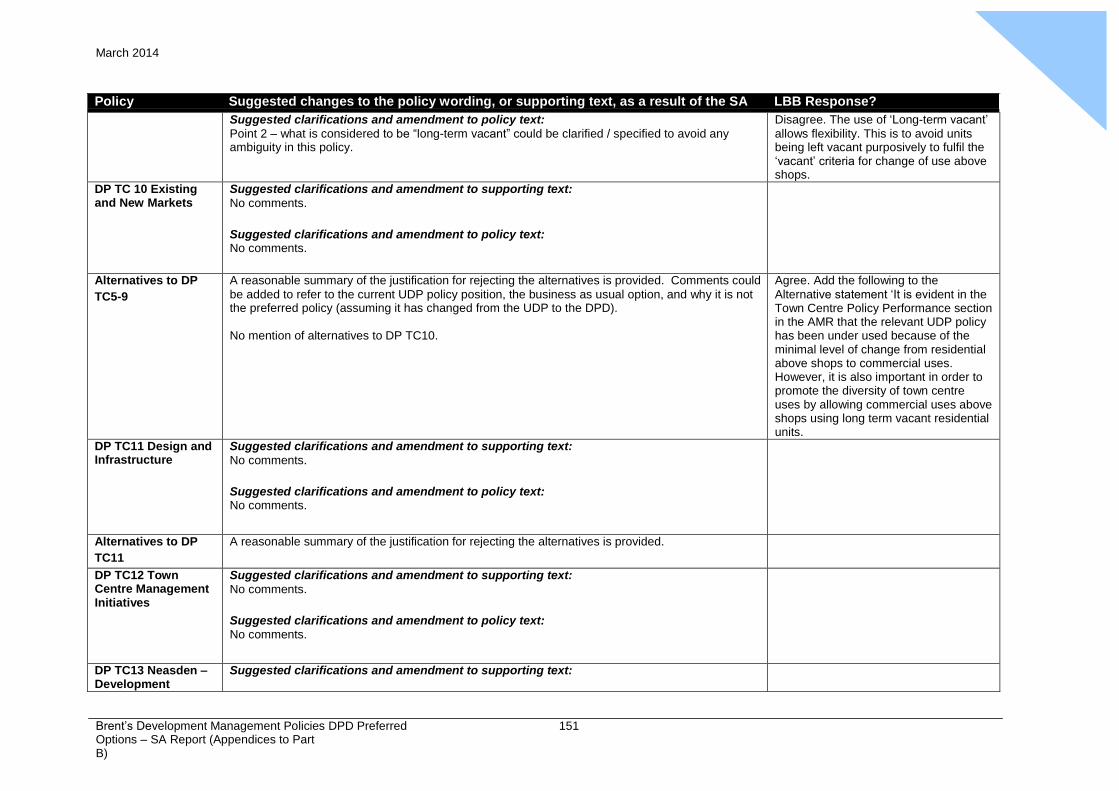
Appendix
8 March 2014
Brent’s Development Management Policies DPD Preferred Options – SA Report (Appendices to Part B)
151
Policy Suggested changes to the policy wording, or supporting text, as a result of the SA LBB Response?
Suggested clarifications and amendment to policy text:
Point 2 – what is considered to be “long-term vacant” could be clarified / specified to avoid any ambiguity in this policy.
Disagree. The use of ‘Long-term vacant’
allows flexibility. This is to avoid units being left vacant purposively to fulfil the ‘vacant’ criteria for change of use above shops.
DP TC 10 Existing and New Markets
Suggested clarifications and amendment to supporting text:
No comments.
Suggested clarifications and amendment to policy text: No comments.
Alternatives to DP
TC5-9
A reasonable summary of the justification for rejecting the alternatives is provided. Comments could
be added to refer to the current UDP policy position, the business as usual option, and why it is not the preferred policy (assuming it has changed from the UDP to the DPD).
No mention of alternatives to DP TC10.
Agree. Add the following to the
Alternative statement ‘It is evident in the Town Centre Policy Performance section in the AMR that the relevant UDP policy has been under used because of the minimal level of change from residential above shops to commercial uses. However, it is also important in order to promote the diversity of town centre uses by allowing commercial uses above shops using long term vacant residential units.
DP TC11 Design and Infrastructure
Suggested clarifications and amendment to supporting text:
No comments.
Suggested clarifications and amendment to policy text: No comments.
Alternatives to DP
TC11
A reasonable summary of the justification for rejecting the alternatives is provided.
DP TC12 Town Centre Management Initiatives
Suggested clarifications and amendment to supporting text:
No comments.
Suggested clarifications and amendment to policy text: No comments.
DP TC13 Neasden – Development
Suggested clarifications and amendment to supporting text:

Appendix
8 March 2014
Brent’s Development Management Policies DPD Preferred Options – SA Report (Appendices to Part B)
152
Policy Suggested changes to the policy wording, or supporting text, as a result of the SA LBB Response?
Opportunities No comments.
Suggested clarifications and amendment to policy text: No comments.
DP TC 14 Brent’s
Distinctive Multi- cultural centres
Suggested clarifications and amendment to supporting text:
No comments.
Suggested clarifications and amendment to policy text: No comments.
DP TC15 Willesden Arts Quarter
Suggested clarifications and amendment to supporting text:
No comments.
Suggested clarifications and amendment to policy text: No comments.
Alternatives to DP
TC5-9
A reasonable summary of the justification for rejecting the alternatives is provided. Comments could be added to refer to the current UDP policy position, the business as usual option, and why it is not the preferred policy (assuming it has changed from the UDP to the DPD) and reasonable alternatives to the polices as included.
Culture, Leisure and Tourism
Policy Suggested changes to the policy wording, or supporting text, as a result of the SA LBB Response?
DP CLT1 Culture
Leisure and Tourism uses
Suggested clarifications and amendment to supporting text:
Para 4.41 – encouraging facilities with a “community element” is welcomed. This text could be strengthened further perhaps by recommending / seeking to ensure that local communities are involved in the planning, design, location and decisions over which types of facilities may be
provided in their area.
Para 4.44 – We would recommend that any “major tourist generating activities” are only sought / provided in areas of excellent public transport (PTAL) and walking / cycling access – otherwise they can have significant impacts on local traffic problems, especially during large / popular events. This comment also applies to point v) in the policy.
Para 4.45 – this point regarding recruitment, training etc could be included as one of the criteria in
Whilst this suggestion is good in theory, in practice it is unrealistic. Supporting text will be strengthened to include the benefit of community involvement.
Major developments are encouraged in Town Centres according to the sequential approach. Our main Town centres already have very good public transport. This accords to criteria iii of the policy, which states the scale and
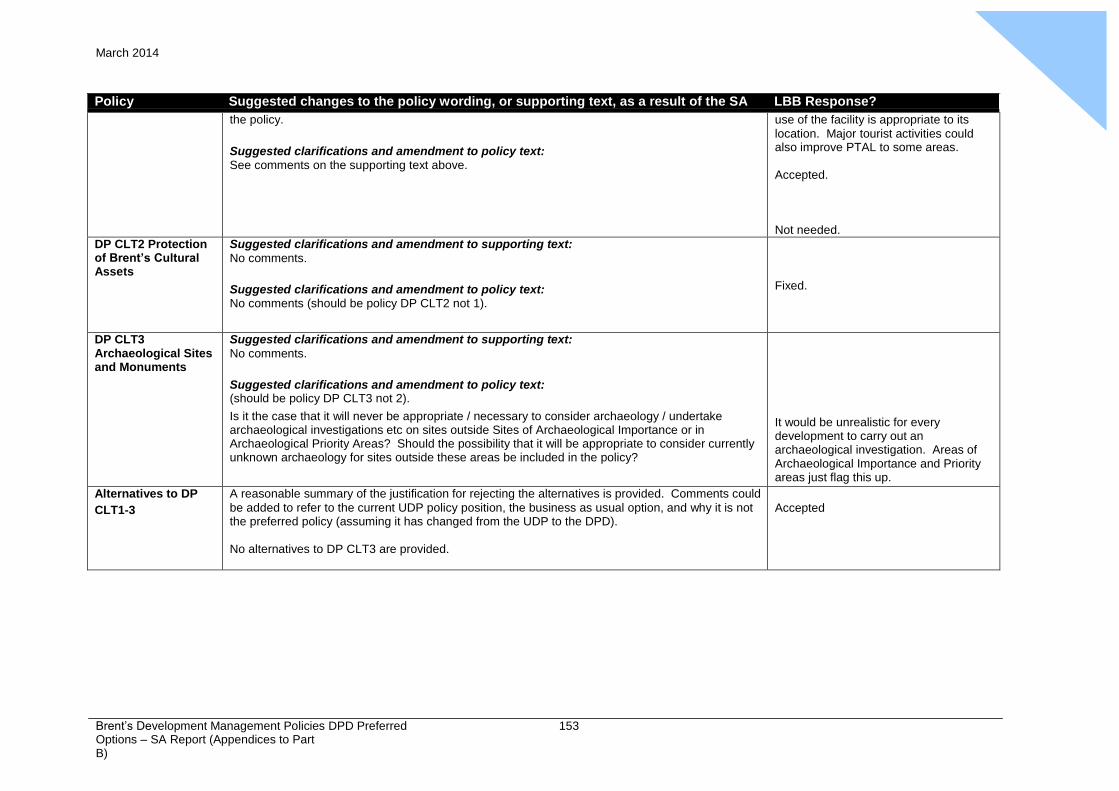
Appendix
8 March 2014
Brent’s Development Management Policies DPD Preferred Options – SA Report (Appendices to Part B)
153
Policy Suggested changes to the policy wording, or supporting text, as a result of the SA LBB Response?
the policy.
Suggested clarifications and amendment to policy text: See comments on the supporting text above.
use of the facility is appropriate to its
location. Major tourist activities could also improve PTAL to some areas.
Accepted.
Not needed.
DP CLT2 Protection of Brent’s Cultural Assets
Suggested clarifications and amendment to supporting text:
No comments.
Suggested clarifications and amendment to policy text: No comments (should be policy DP CLT2 not 1).
Fixed.
DP CLT3 Archaeological Sites and Monuments
Suggested clarifications and amendment to supporting text:
No comments.
Suggested clarifications and amendment to policy text: (should be policy DP CLT3 not 2).
Is it the case that it will never be appropriate / necessary to consider archaeology / undertake archaeological investigations etc on sites outside Sites of Archaeological Importance or in Archaeological Priority Areas? Should the possibility that it will be appropriate to consider currently unknown archaeology for sites outside these areas be included in the policy?
It would be unrealistic for every development to carry out an archaeological investigation. Areas of Archaeological Importance and Priority areas just flag this up.
Alternatives to DP
CLT1-3
A reasonable summary of the justification for rejecting the alternatives is provided. Comments could
be added to refer to the current UDP policy position, the business as usual option, and why it is not the preferred policy (assuming it has changed from the UDP to the DPD).
No alternatives to DP CLT3 are provided.
Accepted
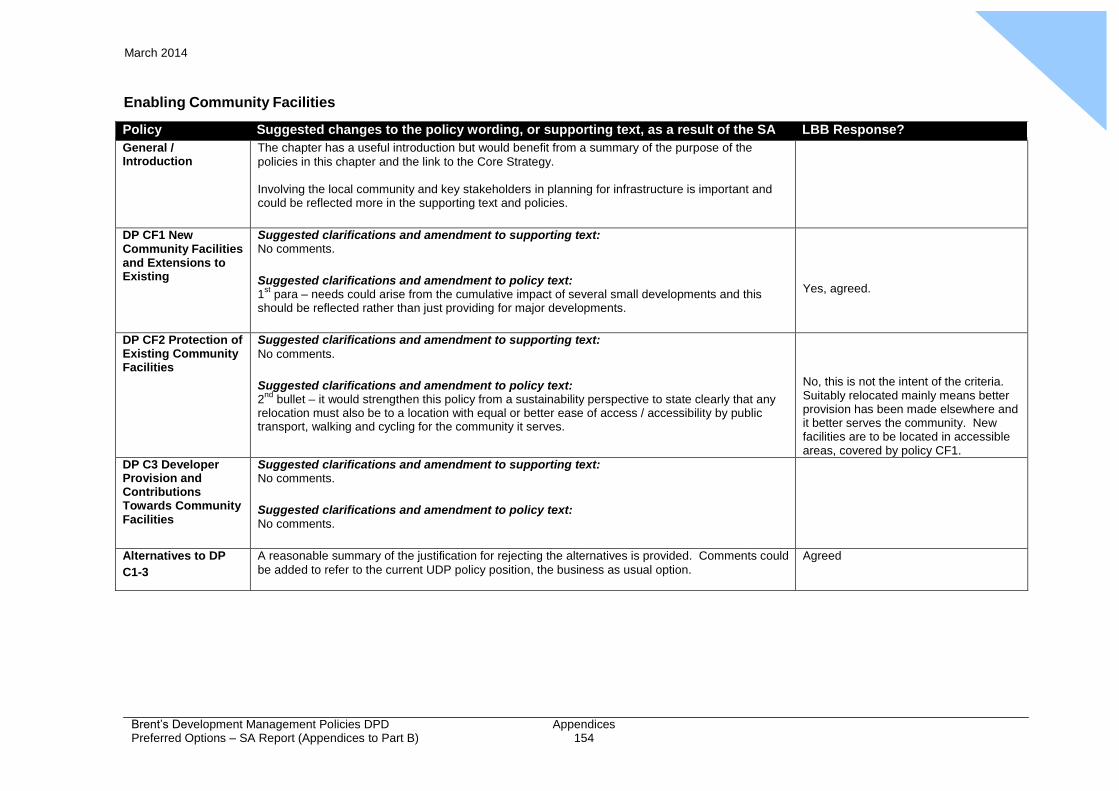
Appendix
9 March 2014
Brent’s Development Management Policies DPD Preferred Options – SA Report (Appendices to Part B)
Appendices 154
Enabling Community Facilities
Policy Suggested changes to the policy wording, or supporting text, as a result of the SA LBB Response?
General / Introduction
The chapter has a useful introduction but would benefit from a summary of the purpose of the
policies in this chapter and the link to the Core Strategy.
Involving the local community and key stakeholders in planning for infrastructure is important and could be reflected more in the supporting text and policies.
DP CF1 New Community Facilities and Extensions to Existing
Suggested clarifications and amendment to supporting text: No comments.
Suggested clarifications and amendment to policy text:
1st
para – needs could arise from the cumulative impact of several small developments and this should be reflected rather than just providing for major developments.
Yes, agreed.
DP CF2 Protection of Existing Community Facilities
Suggested clarifications and amendment to supporting text:
No comments.
Suggested clarifications and amendment to policy text:
2nd
bullet – it would strengthen this policy from a sustainability perspective to state clearly that any relocation must also be to a location with equal or better ease of access / accessibility by public transport, walking and cycling for the community it serves.
No, this is not the intent of the criteria. Suitably relocated mainly means better provision has been made elsewhere and it better serves the community. New facilities are to be located in accessible areas, covered by policy CF1.
DP C3 Developer Provision and Contributions Towards Community Facilities
Suggested clarifications and amendment to supporting text: No comments.
Suggested clarifications and amendment to policy text: No comments.
Alternatives to DP
C1-3
A reasonable summary of the justification for rejecting the alternatives is provided. Comments could
be added to refer to the current UDP policy position, the business as usual option.
Agreed

Collingwood Environmental Planning