Embed Size (px)
Citation preview

Development, Implementation Development, Implementation and Testing of a DNA and Testing of a DNA
Microarray Test SuiteMicroarray Test Suite
Ehsanul HaqueEhsanul Haque
Mentors:Mentors:Dr. Cecilie BoysenDr. Cecilie Boysen
Dr. Jim BreauxDr. Jim BreauxViaLogy Corp.ViaLogy Corp.

OutlineOutline
PurposePurpose
BackgroundBackground
DatasetsDatasets
AlgorithmsAlgorithms
ResultsResults
ConclusionConclusion
PurposePurpose
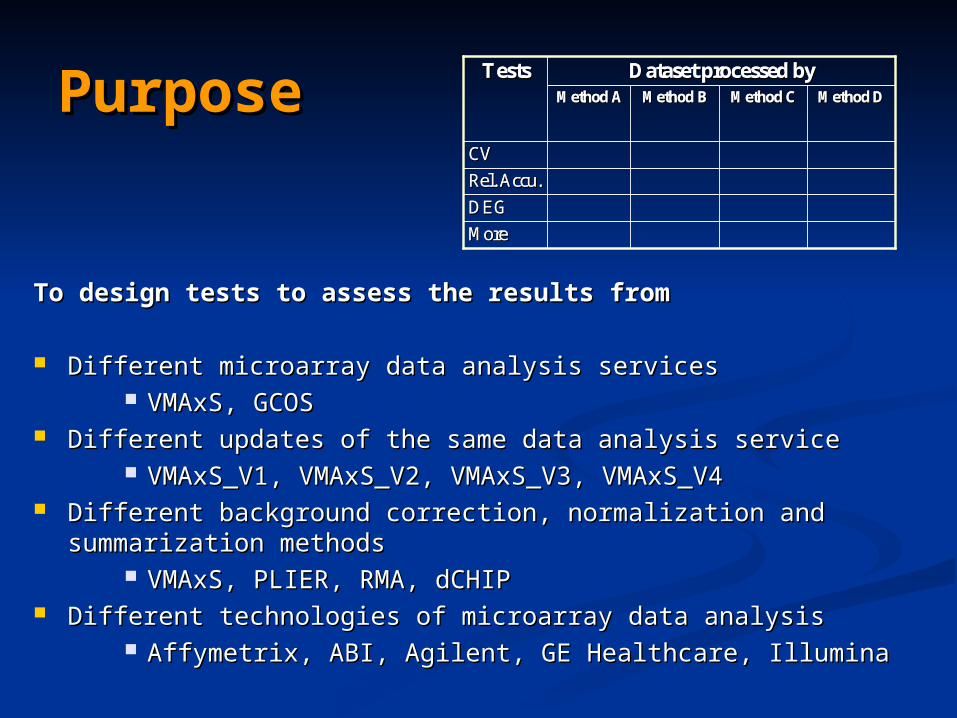
To design tests to assess the results fromTo design tests to assess the results from
Different microarray data analysis servicesDifferent microarray data analysis services VMAxS, GCOSVMAxS, GCOS
Different updates of the same data analysis serviceDifferent updates of the same data analysis service VMAxS_V1, VMAxS_V2, VMAxS_V3, VMAxS_V4VMAxS_V1, VMAxS_V2, VMAxS_V3, VMAxS_V4
Different background correction, normalization and Different background correction, normalization and summarization methodssummarization methods
VMAxS, PLIER, RMA, dCHIPVMAxS, PLIER, RMA, dCHIP Different technologies of microarray data analysisDifferent technologies of microarray data analysis
Affymetrix, ABI, Agilent, GE Healthcare, IlluminaAffymetrix, ABI, Agilent, GE Healthcare, Illumina
Dataset processed byDataset processed by
DEGDEG
MoreMore
RelRel. . AccuAccu..CVCV
Method DMethod DMethod CMethod CMethod BMethod BMethod AMethod A
TestsTests Dataset processed byDataset processed by
DEGDEG
MoreMore
RelRel. . AccuAccu..CVCV
Method DMethod DMethod CMethod CMethod BMethod BMethod AMethod A
TestsTests

BackgroundBackground
VMAxS RA Report
(Resonance Amplitude)
Probe level signal data
11-20 probe per gene
1 expression value per gene
(if from Affymetrix system)
VMAxSSignal Detection via
QRI
DAT or raw image fileOnly raw data files accepted
Quantum Resonance Interferometry (QRI)Quantum Resonance Interferometry (QRI)– – Active Signal ProcessingActive Signal Processing

From image to gene level dataFrom image to gene level data
Raw pixel level data
VMAxS/GCOS
Probe level data
VMAxS/MAS5.0/PLIER/RMA
Background correction
Normalization
Summarization (PM/MM)
Gene level data
Image analysis

DatasetsDatasets
.DAT File .DAT File
Method D
Method C
Method B
Method A
Each Dataset stems from the same raw Each Dataset stems from the same raw AffymetrixGeneChip .dat filesAffymetrixGeneChip .dat files
GeneChip family Human 2A: GeneChip family Human 2A: 54676 54676 genesgenes
3 Replicates * 8 Dilutions
3 Replicates * 8 Dilutions
3 Replicates * 8 Dilutions
3 Replicates * 8 Dilutions
24 Samples
24 Samples
24 Samples
24 Samples

Test SuiteTest Suite [R scripting][R scripting]
Master Function
Function CV(Coefficient of Variance)
User File User File
Function RA(Relative Accuracy)
Function DEG(Differential Expressed Gene)
OtherOutput
File list & parameters

Algorithm Algorithm
Function RA(Rela. Accu.)
Function TABLE.IN
Using a loop, calls function TABLE.IN to work on the User File list of input datasets
Calls other functions, parses different formats of data-sets and provides function RA with the required table.
Method A Method B Method C Method D
Slope 0.497897086864 0.497897086864 0.394078146688 0.394078146688 0.33660070237 0.33660070237 0.2112750562570.211275056257
User File User File File list & parameters
Calculates Mean & SD
Calculates Slope and Ave. of mean intensities
Plots Slope vs. Average of mean intensity
PlotsConc. vs. Mean Intensity
Creates a list ofMedian Slope
Replaces zero values

CV PlotCV Plot Three Replicates A, B Three Replicates A, B & C& C

CV Plot CV Plot With fitted lineWith fitted line
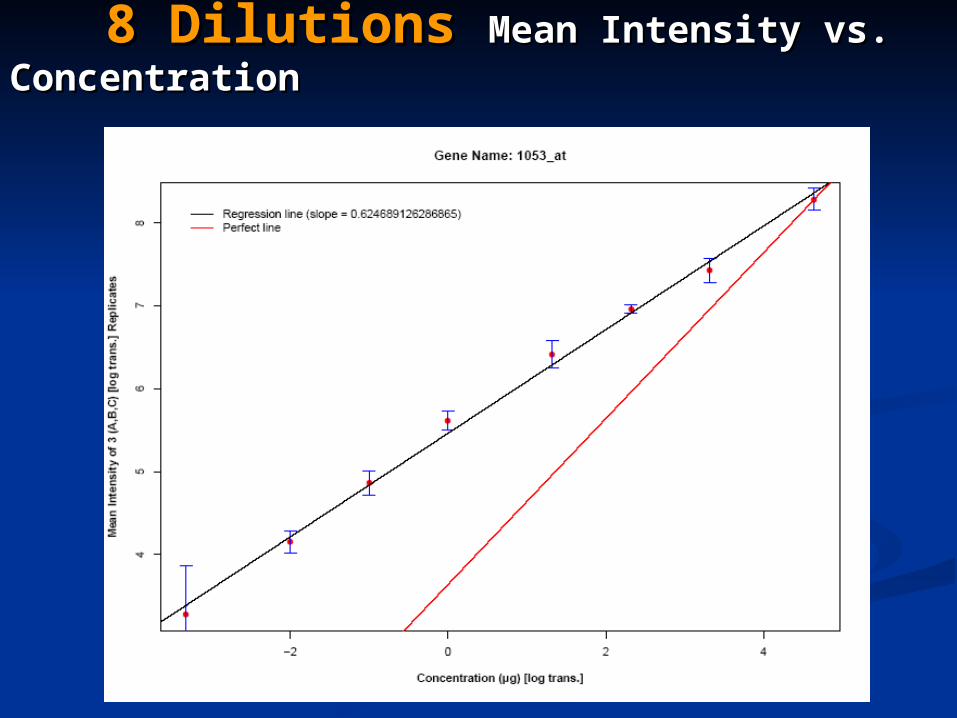
8 Dilutions8 Dilutions Mean Intensity vs. Mean Intensity vs. ConcentrationConcentration
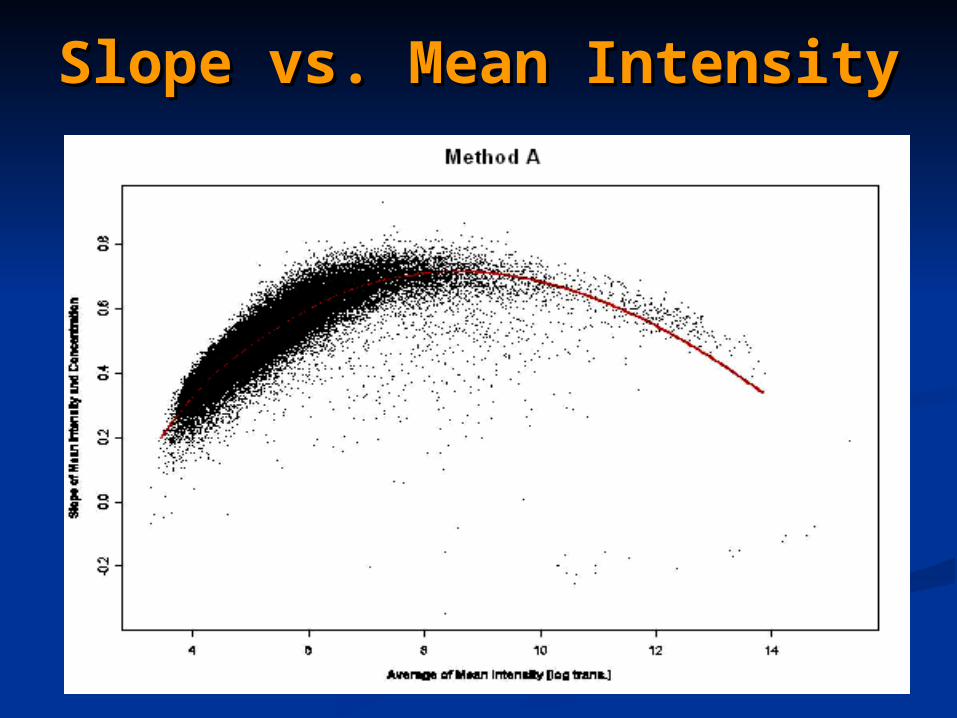
Slope vs. Mean IntensitySlope vs. Mean Intensity

Median SlopeMedian Slope

ResultsResults
TestsTestsDataset processed byDataset processed by
Method Method AA
Method Method BB
Method Method C C
Method Method DD
CVCV 0.117055480.1170554806340634
0.1719023230.171902323603603
0.0727114620.07271146285468546
0.1008522740.100852274894894
Rel. Rel. Accu.Accu.
0.497897080.4978970868646864
0.3940781460.394078146688688
0.3366007020.3366007023737
0.2112750560.211275056257257
DEGDEG
MoreMore

ConclusionConclusion Developed and implemented two tests in RDeveloped and implemented two tests in R
CV & RA (relative accuracy)CV & RA (relative accuracy)
Tested 2 X 4 datasetsTested 2 X 4 datasets Different parameters of the same analysis Different parameters of the same analysis
methodmethod Different normalization methodsDifferent normalization methods
More tests are needed to draw a better More tests are needed to draw a better conclusion about the data. conclusion about the data.

Reference & Reference & AcknowledgmentAcknowledgment
References:References:
Zhijin Wu el al, Zhijin Wu el al, A Model Based Background Adjustment of A Model Based Background Adjustment of Oligonucleotide Expression ArraysOligonucleotide Expression Arrays, Johns Hopkins University, Dept , Johns Hopkins University, Dept of Biostatistics Working Papers, 2004, paper 1 of Biostatistics Working Papers, 2004, paper 1
Irizarry et al, Irizarry et al, Exploration, Normalization, and Summaries of High Exploration, Normalization, and Summaries of High Density Oligonucleotide Array Probe Level DataDensity Oligonucleotide Array Probe Level Data, Biostatistics (2003), , Biostatistics (2003), 4, 2, pp. 249-2644, 2, pp. 249-264
Cope et al, Cope et al, A Benchmark of Affymetrix GeneChip Expression A Benchmark of Affymetrix GeneChip Expression Measures, BioinformaticsMeasures, Bioinformatics, Vol. 1 no. 1 2003, pp. 1-10, Vol. 1 no. 1 2003, pp. 1-10
Acknowledgements:Acknowledgements:
Dr. Cecilie BoysenDr. Cecilie Boysen Dr. Jim BreauxDr. Jim Breaux
- - VialogyVialogy
Southern California Bioinformatics Summer Institute (SoCalBSI)Southern California Bioinformatics Summer Institute (SoCalBSI) National Institute of Health (NIH)National Institute of Health (NIH)


![2011 GF Cert - MBFI Boysen [Recovered]](https://img.pdfslide.us/doc/110x75/577cc67c1a28aba7119e5ce7/2011-gf-cert-mbfi-boysen-recovered.jpg)