Embed Size (px)
Citation preview

GREENS K I L LDEVELOPMENTPROGRAMME(GSDP)
Certificate Course inETP/STP/CETP Operation and Maintenance
GOVERNMENT OF INDIA
MINISTRY OF ENVIRONMENT, FOREST AND CLIMATE CHANGE (MoEF&CC)
NEW DELHI
July, 2018
Table of Contents 1.INTRODUCTION .................................................................................................................................. 1
1 .0 Introduction to Wastewater Treatment Plant Operation & Maintenance ................................. 1 2. Types & Characteristics of wastewater ............................................................................................. 2
2.1 Types of Treatment and typical Flow sheets ............................................................................... 2 2.2 Characterisation of Wastewater ................................................................................................ 3 2.3 Discharge Standards .................................................................................................................... 5 2.4 WASTEWATER FLOW FLUCIVATIONS, AND FLOW MEASUREMENT ............................................ 8 2.5 AEROBIC AND ANAEROBIC CYCLES OF DECOMPOSITION .......................................................... 12 2.6 INTRODUCTION TO ARITHMETICAL COMPUTATIONS ............................................................... 14
2.6.1 Conversion Factors: ........................................................................................................... 14 2.6.2 Velocity and Flow Rate ....................................................................................................... 16 2.6.3 Selection of Formula .......................................................................................................... 19 2.6.4 Basic Formulae ................................................................................................................... 19
3. OPERATION & MAINTENANCE OF TREATMENT UNITS ................................................................... 22 3.1 FUNDAMENTAL PRINCIPLES OF PLANT OPERATION AND MAINTENANCE ................................ 22 3.2 OPERATION OF DOMESTIC AND INDUSTRIAL WASTEWATER TREATMENT PLANTS (ETPs) ....... 24
3.2.1 Preamble ............................................................................................................................ 24 3.2.2. Preventive Maintenance Programmes (PMP) ................................................................... 24 3.2.3 Mechanical/Electrical Break-downs ................................................................................... 25 3.2.4 Equipment maintenance .................................................................................................... 28 3.2.5 Lubrication ......................................................................................................................... 29 3.2 6 Storing of share units and spare parts ............................................................................... 29 3.2.7 Drawings of Plants and Equipment .................................................................................... 30 3.2.8 Pollution Control Measures ............................................................................................... 30 3.2.9 Laboratory Control on the ETP operation .......................................................................... 30 3.2.10 Lighting, First Aid and Communication ............................................................................ 33 3.2.11 Necessity of mechanisation Quill operations at ETP: ....................................................... 33 3.2.12 Recruitment of staff for ETPs training: ............................................................................. 33 3.2.13 Remuneration, salaries etc. ............................................................................................. 34
3.3 PUMPING STATIONS AND PUMPS ............................................................................................. 34 3.3.1 Objectives .......................................................................................................................... 34 3.3.2 Types .................................................................................................................................. 34 3.3.3 Some definitions ................................................................................................................ 34 3.3.4 Typical data/drawings ........................................................................................................ 34 3.3-5 Performance Criteria ......................................................................................................... 34 3.3.6. What can go wrong? ......................................................................................................... 34 3.3.7 Corrosion/structural deterioration .................................................................................... 34 3.3.8 Safety aspects .................................................................................................................... 34 3.3.9 Electrical-mechanical aspects ............................................................................................ 35 3.3.10 Start-up & Shut-down aspects ......................................................................................... 35 3.3.11 Simple arithmetical Calculations ...................................................................................... 35 3.3.12 Pumps .............................................................................................................................. 35 3.3.12 General Operational Procedure for Pumps: ..................................................................... 43
3.4 INLET CHAMBERS/DIVIDER BOX/SPLITIER BOX ......................................................................... 51 3.4.1 Objectives.................................................................................................................... 51 3.4.2 Types ........................................................................................................................... 51 3.4.3 Some Definitions ......................................................................................................... 51 3.4.4 Typical Data/Drawings ................................................................................................ 51 3.4.5 Performance Criteria ................................................................................................... 51 3.4.6 Corrosion/Structural Deterioration ............................................................................. 51
3.4.7 Safety Aspects ............................................................................................................. 51 3.4.8 Electrical-Mechanical Aspects/Switchgear .................................................................. 51 3.4.9 Simple Arithmetic ........................................................................................................ 51
3.5 SCREENS .................................................................................................................................... 53 3.5.1 Objectives .......................................................................................................................... 53 3.5.2 Types and Definitions ......................................................................................................... 53 3.5.3 Performance Criteria ................................................................................................... 54 3.5.4 What can go wrong? .......................................................................................................... 54 3.5.5 Corrosion/Structural Deterioration .................................................................................... 54 3.5.6 Safety Aspects .................................................................................................................... 54
3.6 GRIT REMOVAL SYSTEM ............................................................................................................ 59 3.6.1 Objective ............................................................................................................................ 59 3.6.2 Types .................................................................................................................................. 59 3.6.3 Some Definitions ................................................................................................................ 60 3.6.4 Typical Drawings ................................................................................................................ 60 3.6.5 Performance Criteria .......................................................................................................... 61 3.6.6 What can go wrong ? ......................................................................................................... 61 3.6.7 Corrosion/structural Deterioration .................................................................................... 61 3.6.8 Safely aspects ..................................................................................................................... 61 3.6.9 Start-up and shut-down ..................................................................................................... 62 3.6.10 Simple Arithmetic ............................................................................................................ 62
3.7 EQUALISATION/NEUTRALISATION TANKS ................................................................................. 66 3.7.1 Objectives .......................................................................................................................... 66 3.7.2 Types .................................................................................................................................. 66 3.7.3 Some Definitions ................................................................................................................ 66 3.7.4 Typical Data/Drawings ....................................................................................................... 66 3.7.5 Performance Criteria .......................................................................................................... 66 3.7.6 What can go wrong? .......................................................................................................... 66 3.7.7 Corrosion/Structural Deterioration .................................................................................... 66 3.7.8 Safety Aspects .................................................................................................................... 66 3.7.9 Electrical- Mechanical Aspects/Switchgear ........................................................................ 67 3.7.10 Start-up and Shut-down Aspects ..................................................................................... 67 3.7.11 Simple Arithmetic Calculations ........................................................................................ 67 3.7.12 EXAMPLES ........................................................................................................................ 67
3.8 SEDIMENTATION TANKS ........................................................................................................... 69 3.8.1 Objectives .......................................................................................................................... 69 3.8.2 Types .................................................................................................................................. 69 3.8.3 Some Definitions ................................................................................................................ 69 3.8.4 Typical Data/Drawings ....................................................................................................... 69 3.8.5 Performance Criteria .......................................................................................................... 69 3.8.6 Corrosion/Structural Deterioration .................................................................................... 69 3.8.7 Safety Aspects .................................................................................................................... 69 3.8.8 Electrical- Mechanical Aspects/Switchgear ........................................................................ 69 3.8.9 Start-up and Shut-down Aspects ....................................................................................... 69 3.8.10 Simple Arithmetic Calculations ........................................................................................ 69 3.8.11 Trouble shooting guidelines for Primary Sedimentation Units ........................................ 72
3.9 ACTIVATED SLUDGE/EXTENDED AERATION .............................................................................. 77 3.9.1 Objectives .......................................................................................................................... 77 3.9.2 Types .................................................................................................................................. 77 3.9.3 Some Definition ................................................................................................................. 77 3.9.4 Typical Data/Drawings ....................................................................................................... 77
3.9.4 Performance Criteria .......................................................................................................... 77 3.9.6 What can go wrong? .......................................................................................................... 77 3.9.7 Corrosion/Structural Deterioration .................................................................................... 77 3.9.8 Safety Aspects. ................................................................................................................... 77 3.9.9 Electrical-Mechanical Work/Switchgear ............................................................................ 77 3.9.10 Start up and Shut down Aspects ...................................................................................... 77 3.9.11 Simple Arithmetical Calculation ....................................................................................... 77 3.9.9 Mechanical Work and maintenance .................................................................................. 78 3.9.11 Examples .......................................................................................................................... 85
3.10 TRICKLING FILTER .................................................................................................................... 88 3.10.1 Objectives ........................................................................................................................ 88 3.10.2 Types ................................................................................................................................ 88 3.10.3 Some definitions .............................................................................................................. 88 3.10.4 Typical data/drawings ...................................................................................................... 88 3.10.5 Performance Criteria ........................................................................................................ 88 3.10.6 What can go wrong? ........................................................................................................ 89 3.10.7 Corrosion/structural deterioration .................................................................................. 89 3.10.8 Safety Aspects .................................................................................................................. 89 3.10.9 Electrical-mechanical aspects .......................................................................................... 89 3.10.10 Start-up and shut-down aspects .................................................................................... 89 3.10.11 Simple Arithmetical calculations .................................................................................... 89 3.10.6 Operational Problems ...................................................................................................... 89 3.10.11 Examples ........................................................................................................................ 94
3.11 AERATAED LAGOONS .............................................................................................................. 96 3.11.1 Objectives ........................................................................................................................ 96 3.11.2 Types ................................................................................................................................ 96 3.11.3 Some Definitions .............................................................................................................. 96 3.11.4 Typical Data/Drawing ....................................................................................................... 96 3.11.5 Performance Criteria ........................................................................................................ 96 3.11.6 What Can Go Wrong? ...................................................................................................... 96 3.11.7 Corrosion/Structural Deterioration .................................................................................. 96 3.11.8 Safety Aspects .................................................................................................................. 96 3.11.9 Electrical-Mechanical Aspects/Switchgear ....................................................................... 96 3.11.10 Start-up and Shut-down Aspects ................................................................................... 96 3.11.11 Simple Arithmetical Calculations ................................................................................... 96 3.11.6 OPEERATIONAL. PROBLEMS ........................................................................................... 101
3.12 SLUDGE DIGESTION AND DEWATERING ................................................................................ 104 3.12.1. Objective: ...................................................................................................................... 104 3.12.2. Types of Digestion and Digestion Tanks ........................................................................ 104 3.12.3 Some Definition ............................................................................................................. 105 3.12.4 Typical drawings............................................................................................................. 107 3.12.5. Performance Criteria ..................................................................................................... 107 3.12.6. What can go Wrong ? ................................................................................................... 107 3.12.7. Safety Aspects ............................................................................................................... 108 3.12.8 Corrosion/Structural Deterioration .............................................................................. 109 3.12.9. Start-up and Shut-down Aspects .................................................................................. 110 3.12.10. Simple Arithmetic Calculations ................................................................................... 113
3.13 WASTEWATER IRRIGATION ................................................................................................... 115 3.13.1. Objective ....................................................................................................................... 115 3.13.2 Types .............................................................................................................................. 115 3.13.3. Factors affecting Land Disposal ..................................................................................... 115
3.13.4. Quality requirements of irrigation waters..................................................................... 116 3.13.5. Alternative arrangements during non-irrigation periods .............................................. 116
3.14 CHLORINATION OF WASTEWATERS ...................................................................................... 117 3.14.1 Objectives ...................................................................................................................... 117 3.14.2 Forms of Chlorine used for Wastewater Disinfection .................................................... 117 3.14.3 Some Definitions ............................................................................................................ 118 3.14.4 Typical Data ................................................................................................................... 119 3.14.5 Performance Criteria ...................................................................................................... 119 3.14.6 What can go wrong ? .................................................................................................... 120 3.14.7 Simple Arithmetic Calculations ...................................................................................... 120
4. FIELD TESTS ................................................................................................................................... 124 4.1 LIST OF EQUIPMENT ................................................................................................................ 124 4.2 LIST OF REAGENTS ................................................................................................................... 124 4.3 PHYSICAL AND CHEMICAL EXAMINATION ............................................................................... 125
4.3.1 Settleable Matter ............................................................................................................. 125 4.3.2 pH .................................................................................................................................... 125 4.3.3 Acidity .............................................................................................................................. 126 4.3.4 Alkalinity of Wastewater and Sludge ............................................................................... 128
4.4 TESTS ON ACTIVATED SLUDGE ................................................................................................ 129 4.4.1 Suspended Matter for Mixed Liqour and Return Sludge .................................................. 129 4.4.2 Settleabilitv for Mixed Liquor and Return Sludge ............................................................ 130 4.4.3 Sludge Volume Index ....................................................................................................... 131 4.4.4 Sludge Density Index ........................................................................................................ 131 4.4.5 Dissolved Oxygen MO) - Winkler Method ........................................................................ 132
4.5 Chemical Oxygen Demand ...................................................................................................... 134 4.6 CHLORINE TESTS ..................................................................................................................... 136
4.6.1 Chlorine Residual ............................................................................................................. 136
Table of Tables
Table 1 The Environment (protection) Second Amendment Rules, 1988 ............................................. 6 Table 2 Flow Measurement by ‘V’ Notch .............................................................................................. 9 Table 3 Standard dimensions and capacities for Parshall flumes........................................................ 11 Table 4 Prefixes used in the Metric System ........................................................................................ 14 Table 5 Abnormal Operation and Trouble shooting for Pumps .......................................................... 48 Table 6 Flow Measurement for Rectangular Weir .............................................................................. 52 Table 7 Trouble shooting guidelines for Primary Sedimentation Units ............................................... 72 Table 8 Troubleshooting problems for Activated sludge/ Aeration Tanks .......................................... 80 Table 9 Quality requirements for Irrigation Waters .......................................................................... 116 Table 10 Recommended Hydraulic Loadings on various types of Soils ............................................. 116 Table 11 Purpose of Chlorine to Wastewater ................................................................................... 119 Table 12 Effect of Chlorine on Human Body ..................................................................................... 120 Table 13 Chlorine Closed Loop Control System ................................................................................ 122 Table 14 General Flow sheet for Wastewater Treatment possible Chlorine addition points ............ 123
Table of Figures
Figure 1 Wastewater Treatment Methods............................................................................................ 4 Figure 2 Pattern of outflow from a gravity type equalisation tank ..................................................... 10 Figure 3 The Parshall Flow .................................................................................................................. 11 Figure 4 An Ecosystem on Earth.......................................................................................................... 13
Figure 5 Pump Characteristic Curves .................................................................................................. 39 Figure 6 INLET CHAMBERS/DIVIDER BOX/SPLITIER BOX ..................................................................... 55 Figure 7 Graphical diagram of Roto Screen ......................................................................................... 56 Figure 8 Graphical diagram of Bar Screen ........................................................................................... 57 Figure 9 Manually Screened Bar Screen .............................................................................................. 58 Figure 10 Mechanically Screened Bar Screen ..................................................................................... 58 Figure 11 Grit removal system ............................................................................................................ 64 Figure 12 Grit Channel ........................................................................................................................ 65 Figure 13 Graphical diagram of Clariflocculator ................................................................................. 73 Figure 14 Central Drive Clarifier suitable for 4 m to 14 m ................................................................... 74 Figure 15 Bio-Tech Turn Table Type Clarifier ...................................................................................... 75 Figure 16 Graphical diagram of Clarifier ............................................................................................. 76 Figure 17 Graphical diagram of Bio-tech Floating Aerator .................................................................. 82 Figure 18 Graphical Diagram of Slow Speed Floating Aerator ............................................................ 83 Figure 19 Slow Speed Aerator ............................................................................................................. 84 Figure 20 General Flow sheet for Wastewater Treatment conventional activated sludge process .... 86 Figure 21 Graphical diagram of External Aeration System .................................................................. 87 Figure 22 Sectional plan of Trickling Filter .......................................................................................... 93 Figure 23 Mechanically Aerated Facultative Lagoon ........................................................................... 97 Figure 24 Mechanically Aerated Flow Through Lagoon ...................................................................... 97 Figure 26 An extended Aeration Lagoon with a Settling Compartment within the Lagoon ................ 98 Figure 25 An extended Aeration Lagoon with separate settling and sludge recirculation .................. 98 Figure 27 An extended Aeration Lagoon with Two Cells for Intermittent Operation ......................... 99 Figure 28 Different types of Pasveer Oxidation Ditches.................................................................... 100 Figure 29 Sludge Drying Bed ............................................................................................................. 111 Figure 30 Sludge Thickness .............................................................................................................. 112
1
1. INTRODUCTION 1 .0 Introduction to Wastewater Treatment Plant Operation & Maintenance
Industrial activity results in the generation of a number of pollutants which can
be broadly grouped as (a) oxygen demanding materials (b) nutrients (c) disease
producing organisms (d) Suspended solids (e) Salts (0 toxic metals (g) toxic
organic chemicals and (h) heat. Wide variations in the quality of industrial
wastewaters are quite common. Further, the rate of flow of the wastewaters
depends, among other factors, on the nature of the manufacturing process,
viz. batch production process or continuous production process.
An industrial wastewater treatment plant is required to handle varying inputs,
but is expected to give an output of an effluent fit for discharge to the
environment at all times. This is possible to achieve in a well designed,
operated and maintained plant.
In order to be able to bring about effective treatment of an industrial effluent,
it is necessary to know more about the types of treatment alternatives
available to us, the characteristics of wastewaters to be treated, requirements
of treated wastewater quality, different unit processes and unit operations,
techniques of wastewater sampling and analysis etc. in addition, preventive
and corrective maintenance or the treatment machinery, knowledge of repairs
to and replacement of various parts of equipment, record keeping, report
preparation, aspects of safety in treatment plants etc. are factors which
enable a plant operator to run a wastewater treatment plant smoothly.
This training course is designed to give the participants some background and
experience in operating wastewater treatment plant for industrial wastes.
2
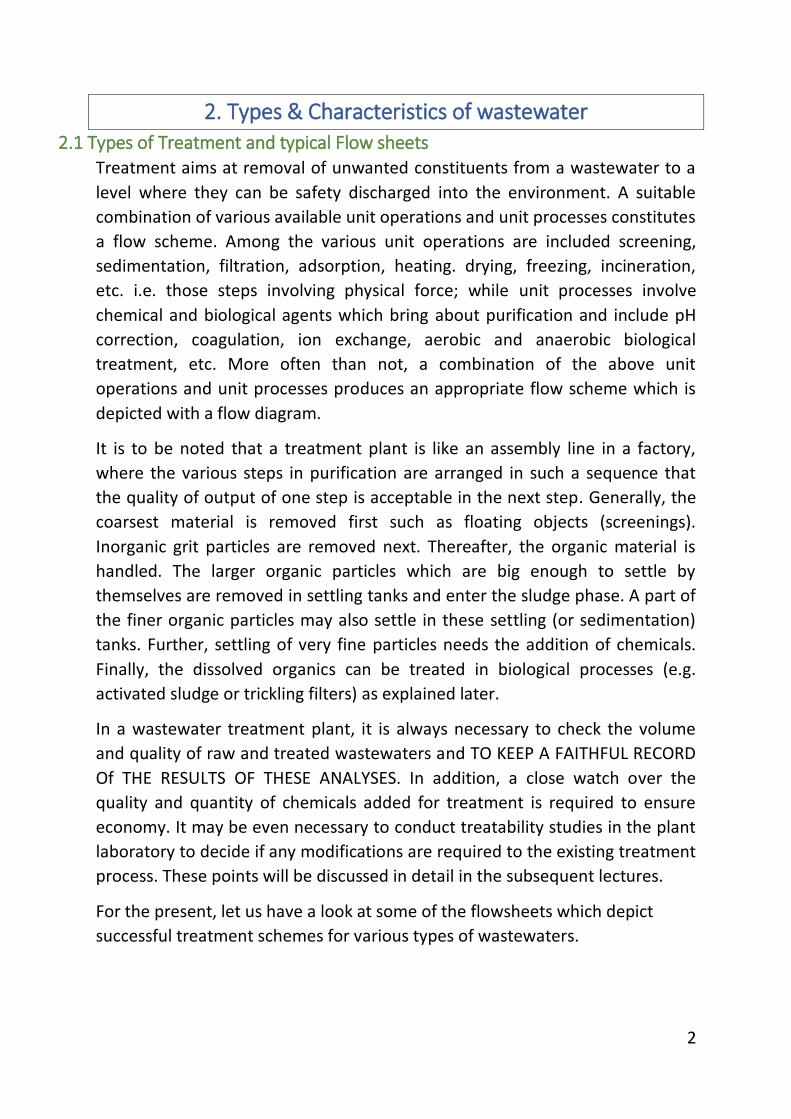
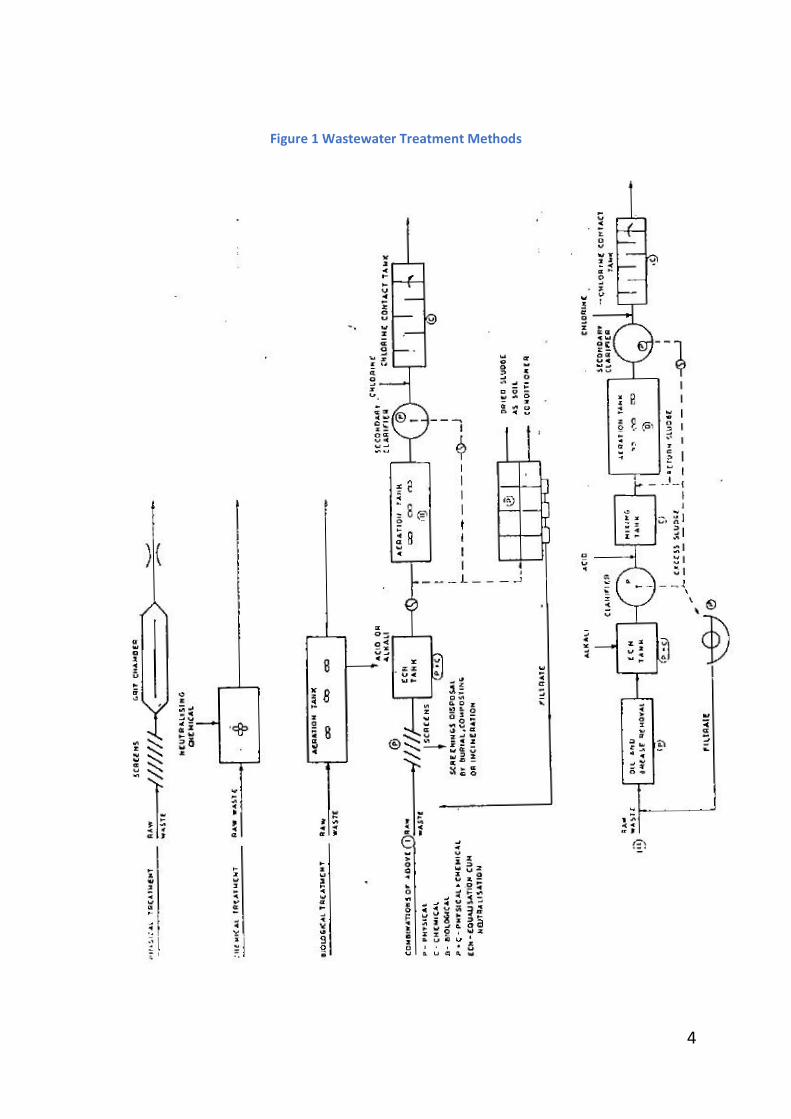
2. Types & Characteristics of wastewater 2.1 Types of Treatment and typical Flow sheets
Treatment aims at removal of unwanted constituents from a wastewater to a
level where they can be safety discharged into the environment. A suitable
combination of various available unit operations and unit processes constitutes
a flow scheme. Among the various unit operations are included screening,
sedimentation, filtration, adsorption, heating. drying, freezing, incineration,
etc. i.e. those steps involving physical force; while unit processes involve
chemical and biological agents which bring about purification and include pH
correction, coagulation, ion exchange, aerobic and anaerobic biological
treatment, etc. More often than not, a combination of the above unit
operations and unit processes produces an appropriate flow scheme which is
depicted with a flow diagram.
It is to be noted that a treatment plant is like an assembly line in a factory,
where the various steps in purification are arranged in such a sequence that
the quality of output of one step is acceptable in the next step. Generally, the
coarsest material is removed first such as floating objects (screenings).
Inorganic grit particles are removed next. Thereafter, the organic material is
handled. The larger organic particles which are big enough to settle by
themselves are removed in settling tanks and enter the sludge phase. A part of
the finer organic particles may also settle in these settling (or sedimentation)
tanks. Further, settling of very fine particles needs the addition of chemicals.
Finally, the dissolved organics can be treated in biological processes (e.g.
activated sludge or trickling filters) as explained later.
In a wastewater treatment plant, it is always necessary to check the volume
and quality of raw and treated wastewaters and TO KEEP A FAITHFUL RECORD
Of THE RESULTS OF THESE ANALYSES. In addition, a close watch over the
quality and quantity of chemicals added for treatment is required to ensure
economy. It may be even necessary to conduct treatability studies in the plant
laboratory to decide if any modifications are required to the existing treatment
process. These points will be discussed in detail in the subsequent lectures.
For the present, let us have a look at some of the flowsheets which depict
successful treatment schemes for various types of wastewaters.
3
2.2 Characterisation of Wastewater
This involves determination of the physical, chemical and biological
characteristics of the samples of wastewater by using laboratory techniques
such as gravimetry, colorimetry, titrimetry etc. Knowledge of the
characteristics helps us
(a) in knowing the strength of the raw and treated wastewaters,
(b) in checking the efficiency of operation of the plant as a whole and
that of individual treatment processes and
(c) in deciding the nature of treatment required in the case of the given
wastewater in order to meet the quality standards laid down by
pollution control authorities.
Characterisation firstly includes appropriate sampling techniques, followed by prompt conveyance of the samples to the laboratory and preservation of the samples, if required. The correct sampling technique yields a sample which is truly representative of the nature of the wastewater. If the flow of wastewater comes to the sampling point in batches, one grab sample during the flow period may suffice. But if the flow is known to fluctuate in quantity and quality, collecting small samples at regular time intervals and mixing them will be more representative of the actual conditions than one grab sample. A further refinement in the sampling technique is to collect a sample volume in proportion to the rate of flow of the wastewater. Such samples are called "composited samples". Within a treatment plant, sampling can be done either manually or with the
help of an automatic sampler. When the sampling programme extends over a
long time period, it becomes necessary to preserve the quality of the sample
by either storing the sample at low temperature or by using suitable
preservatives. The tests to be carried out are grouped as:
a) Physical Temperature, colour, appearance, total solids, suspended solids, dissolved solids, volatile solids, fixed solids.
b) Chemical - pH, alkalinity or acidity, sulphates, chlorides, phosphates, nitrogen in its various forms, DOD; COD, specific pollutants known to be present in specific industrial wastes, such as cyanides and heavy metals in the electroplating industry, lignin in the pulp and paper industry and so on.
C) Biological/microbiological tests – For determining process biology, different organisms, etc.
d) Routine Tests – for monitoring plant performance.
4
Figure 1 Wastewater Treatment Methods
5
2.3 Discharge Standards
Quality standards are so framed that the treated effluent of an industry will
not disturb the ecological balance within the receiving water body if the
concentration of each parameter is within the specified limit. If some
parameter falls outside the limit, it is necessary to
(a) check the overall plant performance
(b) efficiency of operation of individual treatment units,
(c) any changes that might have taken place in raw wastewater
characteristics and
(d) amount and quality of chemicals being added in the treatment
process.
The quality standards for an industrial effluent depend on its point of
intermediate or final disposal viz.
(a) municipal sewer or
(b) intercepting sewer leading to a common effluent treatment plant or
(c) a river or stream used as a source of drinking water or
(d) a lake or impoundment or
(e) a creek, or
(f) the sea or
(g) land for irrigation.
In the case of the common effluent treatment plant, the quality standard of its
treated effluent will depend on where the effluent is going to be discharged.
The standards specified for various parameters are given below
6
Table 1 The Environment (protection) Second Amendment Rules, 1988
General Standard for Discharge of Effluents
S.No Parameter
Standards
Inland Surface Water
Public Sewer
Land for irrigation
Marine areas
1 Colour and odour See note 1 - See note 1 See note 1
2 Suspended solids. mg/l, Max
100 600 200 100
3 Particle size of suspended solids
Shall pass 85 micron sieve
- -
a) Floatable solids max 3mm b) Settleable solids, max 850 micron
4 Dissolved solids (inorganic), mg/l, max
2100 2100 2100 -
5 pH value 5.5 to 9.0 5.5 to 9.0 5.5 to 9.0 5.5 to 9.0
6 Temperature, deg C, Max
shall not xceed 40 in downstream sectio within 15 meters
45 at the point of
discharge -
45 at the pint of
discharge
7 Oil and grease, mg/l, Max 10 20 10 20
8 Total residue chlorine, mg/l, Max
1.0 - - -
9 Ammoniacal nirogen (as N), mg/l, Max
50 50 - 50
10 Total Kjeldhal nitrogen (as N0, mg/l
100 - - 100
11 Free ammonia (as NH3), mg/l, Max
5.0 - - 5.0
12 Biochemical oxygen demand (5 days at 20 deg C), Max
30 350 100 100
13 Chemical Oxygen Demand, mg/l, Max
250 - - 250
14 Arsenic (as As), mg/l, Max 0.2 0.2 0.2 0.2
15 Mercury (as Hg), mg/l, Max 0.01 0.01 - 0.01
16 Lead (as Pb), mg/l, Max 0.1 1.0 - 1.0
17 Cadmium (as cd), mg/l, Max
2.0 1.0 - 2.0
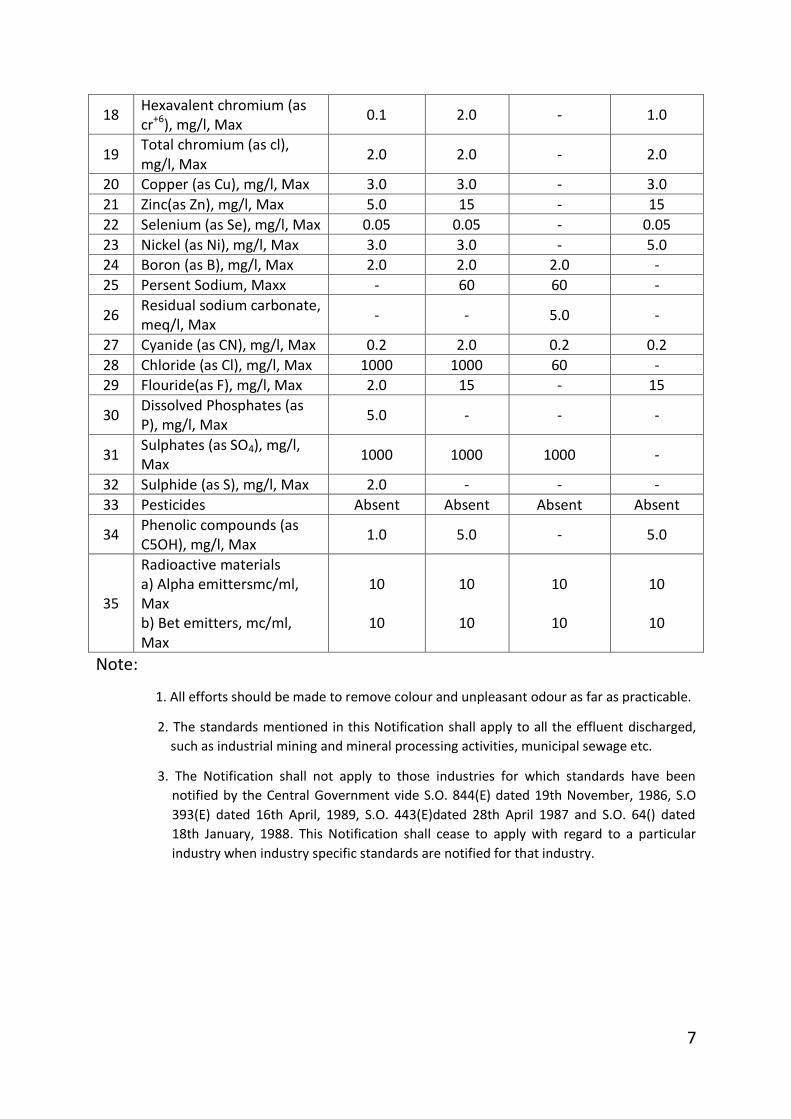
7
18 Hexavalent chromium (as cr+6), mg/l, Max
0.1 2.0 - 1.0
19 Total chromium (as cl), mg/l, Max
2.0 2.0 - 2.0
20 Copper (as Cu), mg/l, Max 3.0 3.0 - 3.0
21 Zinc(as Zn), mg/l, Max 5.0 15 - 15
22 Selenium (as Se), mg/l, Max 0.05 0.05 - 0.05
23 Nickel (as Ni), mg/l, Max 3.0 3.0 - 5.0 24 Boron (as B), mg/l, Max 2.0 2.0 2.0 -
25 Persent Sodium, Maxx - 60 60 -
26 Residual sodium carbonate, meq/l, Max
- - 5.0 -
27 Cyanide (as CN), mg/l, Max 0.2 2.0 0.2 0.2
28 Chloride (as Cl), mg/l, Max 1000 1000 60 -
29 Flouride(as F), mg/l, Max 2.0 15 - 15
30 Dissolved Phosphates (as P), mg/l, Max
5.0 - - -
31 Sulphates (as SO4), mg/l, Max
1000 1000 1000 -
32 Sulphide (as S), mg/l, Max 2.0 - - -
33 Pesticides Absent Absent Absent Absent
34 Phenolic compounds (as C5OH), mg/l, Max
1.0 5.0 - 5.0
35
Radioactive materials a) Alpha emittersmc/ml, Max b) Bet emitters, mc/ml, Max
10
10
10
10
10
10
10
10
Note:
1. All efforts should be made to remove colour and unpleasant odour as far as practicable.
2. The standards mentioned in this Notification shall apply to all the effluent discharged,
such as industrial mining and mineral processing activities, municipal sewage etc.
3. The Notification shall not apply to those industries for which standards have been
notified by the Central Government vide S.O. 844(E) dated 19th November, 1986, S.O
393(E) dated 16th April, 1989, S.O. 443(E)dated 28th April 1987 and S.O. 64() dated
18th January, 1988. This Notification shall cease to apply with regard to a particular
industry when industry specific standards are notified for that industry.
8
2.4 WASTEWATER FLOW FLUCIVATIONS, AND FLOW MEASUREMENT
Every industrial wastewater treatment plant is designed to handle a certain
volume of wastewater per unit time. The hydraulic load varies with time; the
magnitude of this variation depends upon
(a) the diversity of products manufactured
(b) process operations contributing waste and
(c) whether the manufacturing process is batch type or continuous type.
In addition, if the wastewaters flow up to the treatment plant by gravity, it
necessitates pumping of the wastewater to an elevation from where it can
flow by gravity through the treatment units. This imposes its own pattern of
fluctuations in flow rates passing through the plant.
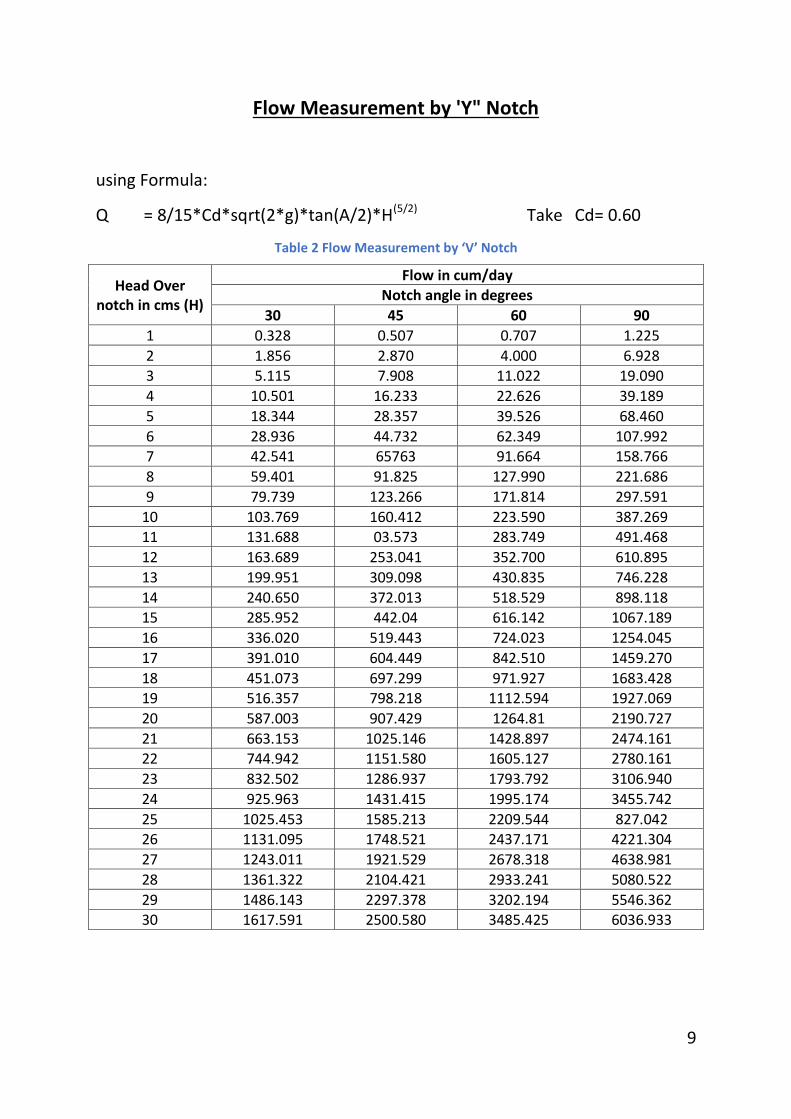
Equalisation Tanks:
Difficulties arising out of these fluctuations are overcome by providing
equalisation tanks which ensure a more uniform flow of wastewater into the
downstream treatment units in terms of quality and flowrate.
(a) Graphical representation of flowrate with time from a wet well 'of a
pomp house.
(b) Graphical representation of flowrate with time from a gravity type
equalisation tank.
(c) Types of equalisation tanks.
Flow Measurement:
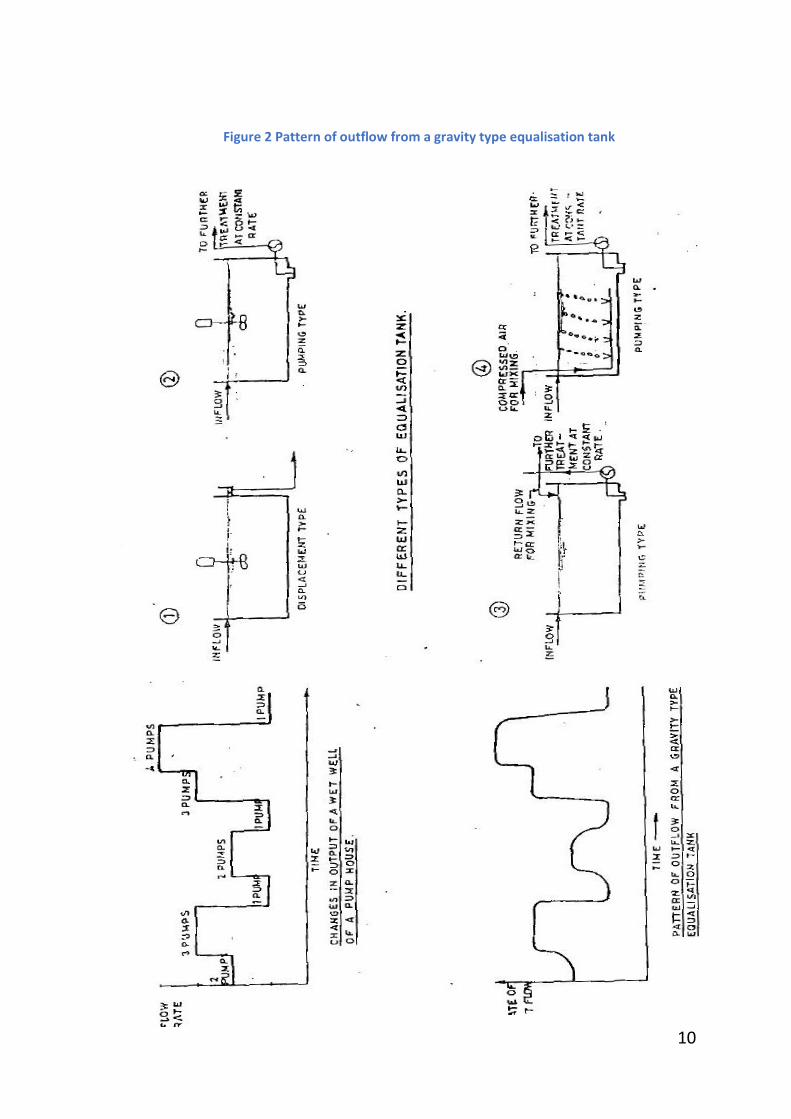
Flow measurement at a treatment plant can be done by (a) area velocity
method, (b) use of stopwatch and bucket, (c) use of V-notches or rectangular
notches (d) use of overflow weirs (e) use of Parshall or other flumes with or
without recorders. E.ach method has its own limitations which must be kept in
mind while using it.
9
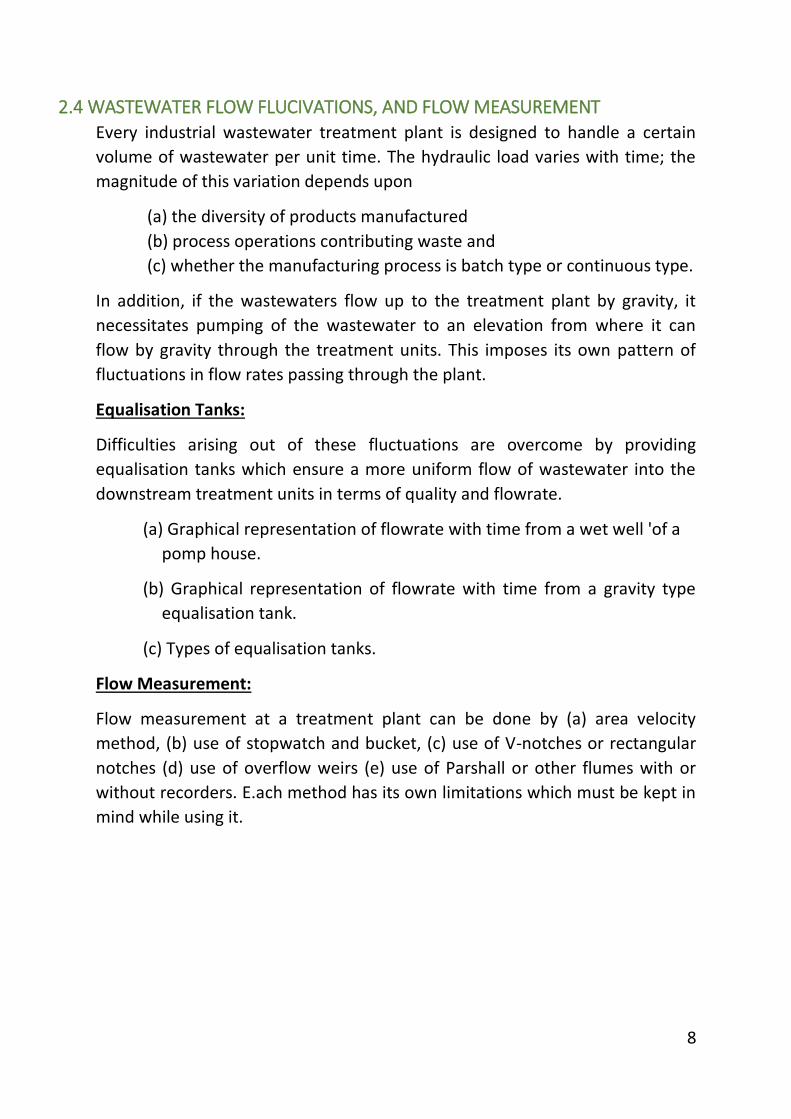
Flow Measurement by 'Y" Notch
using Formula:
Q = 8/15*Cd*sqrt(2*g)*tan(A/2)*H(5/2) Take Cd= 0.60
Table 2 Flow Measurement by ‘V’ Notch
Head Over notch in cms (H)
Flow in cum/day Notch angle in degrees
30 45 60 90
1 0.328 0.507 0.707 1.225
2 1.856 2.870 4.000 6.928
3 5.115 7.908 11.022 19.090
4 10.501 16.233 22.626 39.189
5 18.344 28.357 39.526 68.460
6 28.936 44.732 62.349 107.992 7 42.541 65763 91.664 158.766
8 59.401 91.825 127.990 221.686
9 79.739 123.266 171.814 297.591
10 103.769 160.412 223.590 387.269
11 131.688 03.573 283.749 491.468
12 163.689 253.041 352.700 610.895
13 199.951 309.098 430.835 746.228
14 240.650 372.013 518.529 898.118 15 285.952 442.04 616.142 1067.189
16 336.020 519.443 724.023 1254.045
17 391.010 604.449 842.510 1459.270
18 451.073 697.299 971.927 1683.428 19 516.357 798.218 1112.594 1927.069
20 587.003 907.429 1264.81 2190.727
21 663.153 1025.146 1428.897 2474.161 22 744.942 1151.580 1605.127 2780.161
23 832.502 1286.937 1793.792 3106.940
24 925.963 1431.415 1995.174 3455.742
25 1025.453 1585.213 2209.544 827.042 26 1131.095 1748.521 2437.171 4221.304
27 1243.011 1921.529 2678.318 4638.981
28 1361.322 2104.421 2933.241 5080.522
29 1486.143 2297.378 3202.194 5546.362 30 1617.591 2500.580 3485.425 6036.933
10
Figure 2 Pattern of outflow from a gravity type equalisation tank
11
Figure 3 The Parshall Flow
Table 3 Standard dimensions and capacities for Parshall flumes
Dimensions mm Capacity, m3/min
µ A B C D Max Min
300 1370 1345 600 845 27.4 0.6 600 1525 1495 900 1205 56.3 1.1
900 1675 1645 1200 1570 85.7 1.7
1200 1830 1795 1500 1935 115.4 2.1
1500 1980 1945 1800 2300 145.5 3.8 180 2130 2090 2100 2665 176.0 4.9
210 2290 2240 2400 3040 206.4 6.9
2400 2440 2490 2700 3400 237.2 7.9
12
2.5 AEROBIC AND ANAEROBIC CYCLES OF DECOMPOSITION
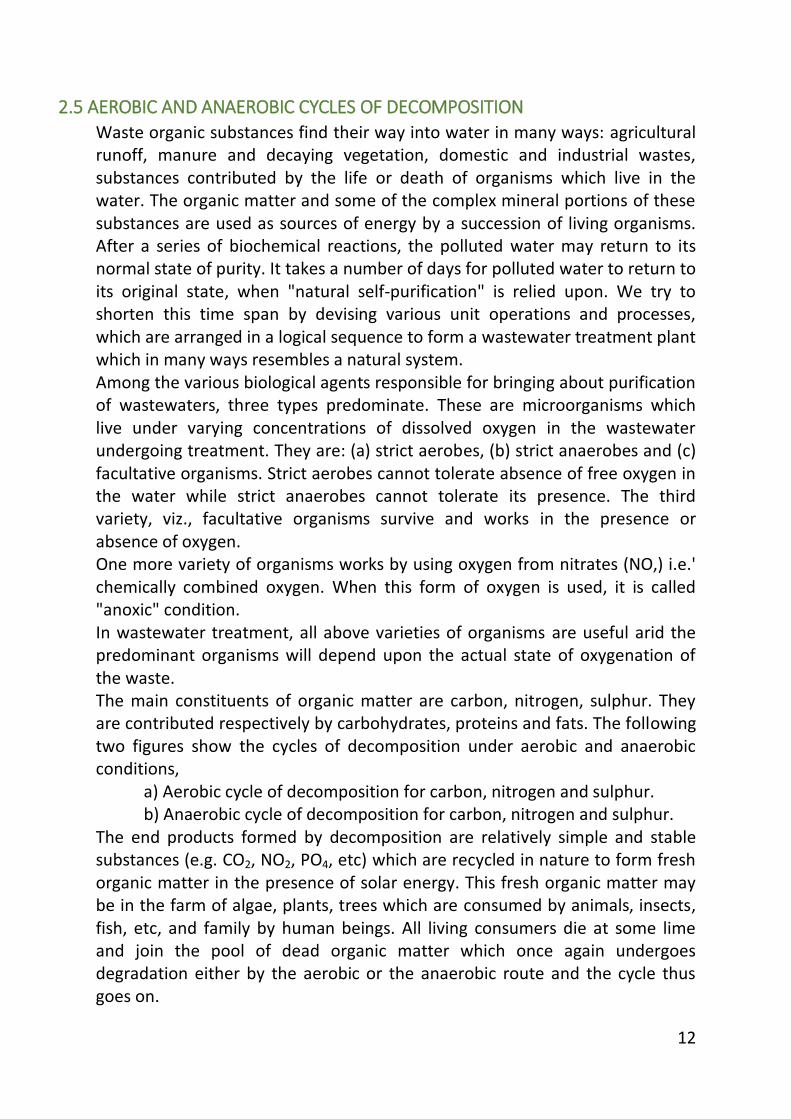
Waste organic substances find their way into water in many ways: agricultural runoff, manure and decaying vegetation, domestic and industrial wastes, substances contributed by the life or death of organisms which live in the water. The organic matter and some of the complex mineral portions of these substances are used as sources of energy by a succession of living organisms. After a series of biochemical reactions, the polluted water may return to its normal state of purity. It takes a number of days for polluted water to return to its original state, when "natural self-purification" is relied upon. We try to shorten this time span by devising various unit operations and processes, which are arranged in a logical sequence to form a wastewater treatment plant which in many ways resembles a natural system. Among the various biological agents responsible for bringing about purification of wastewaters, three types predominate. These are microorganisms which live under varying concentrations of dissolved oxygen in the wastewater undergoing treatment. They are: (a) strict aerobes, (b) strict anaerobes and (c) facultative organisms. Strict aerobes cannot tolerate absence of free oxygen in the water while strict anaerobes cannot tolerate its presence. The third variety, viz., facultative organisms survive and works in the presence or absence of oxygen. One more variety of organisms works by using oxygen from nitrates (NO,) i.e.' chemically combined oxygen. When this form of oxygen is used, it is called "anoxic" condition. In wastewater treatment, all above varieties of organisms are useful arid the predominant organisms will depend upon the actual state of oxygenation of the waste. The main constituents of organic matter are carbon, nitrogen, sulphur. They are contributed respectively by carbohydrates, proteins and fats. The following two figures show the cycles of decomposition under aerobic and anaerobic conditions,
a) Aerobic cycle of decomposition for carbon, nitrogen and sulphur. b) Anaerobic cycle of decomposition for carbon, nitrogen and sulphur.
The end products formed by decomposition are relatively simple and stable substances (e.g. CO2, NO2, PO4, etc) which are recycled in nature to form fresh organic matter in the presence of solar energy. This fresh organic matter may be in the farm of algae, plants, trees which are consumed by animals, insects, fish, etc, and family by human beings. All living consumers die at some lime and join the pool of dead organic matter which once again undergoes degradation either by the aerobic or the anaerobic route and the cycle thus goes on.
13
Figure 4 An Ecosystem on Earth
14
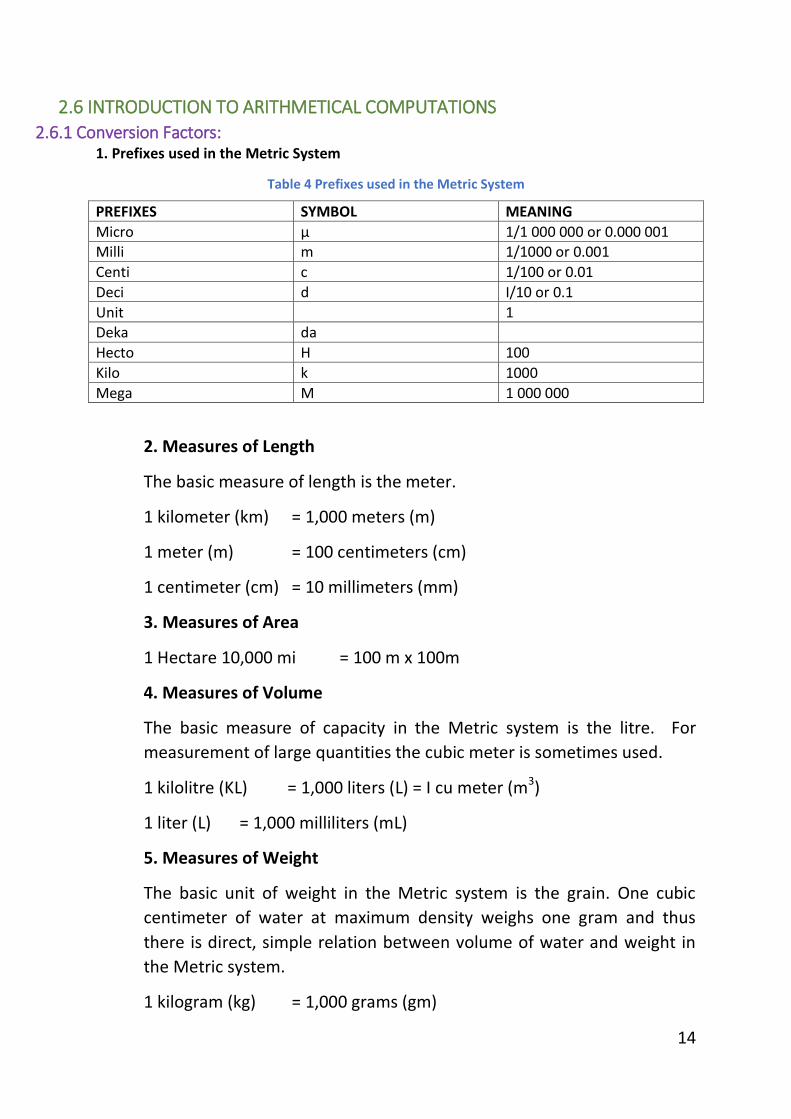
2.6 INTRODUCTION TO ARITHMETICAL COMPUTATIONS
2.6.1 Conversion Factors: 1. Prefixes used in the Metric System
Table 4 Prefixes used in the Metric System
PREFIXES SYMBOL MEANING
Micro µ 1/1 000 000 or 0.000 001 Milli m 1/1000 or 0.001
Centi c 1/100 or 0.01
Deci d I/10 or 0.1
Unit 1 Deka da
Hecto H 100
Kilo k 1000
Mega M 1 000 000
2. Measures of Length
The basic measure of length is the meter.
1 kilometer (km) = 1,000 meters (m)
1 meter (m) = 100 centimeters (cm)
1 centimeter (cm) = 10 millimeters (mm)
3. Measures of Area
1 Hectare 10,000 mi = 100 m x 100m
4. Measures of Volume
The basic measure of capacity in the Metric system is the litre. For
measurement of large quantities the cubic meter is sometimes used.
1 kilolitre (KL) = 1,000 liters (L) = I cu meter (m3)
1 liter (L) = 1,000 milliliters (mL)
5. Measures of Weight
The basic unit of weight in the Metric system is the grain. One cubic
centimeter of water at maximum density weighs one gram and thus
there is direct, simple relation between volume of water and weight in
the Metric system.
1 kilogram (kg) = 1,000 grams (gm)
15
1 gram (gm) = 1,000 milligrams (mg)
1 milligram (mg) = 1,000 micrograms (pg)
6. Temperature
𝐶
5=
𝐹−32
9
100°C = 212°F, 0°c = 32°F, 0°F = - 17.8°C, 20°C = 68°F
7. Milligrams per litre
Milligrams per litre (mg/L) is a unit of measurement used in laboratory
and scientific work to indicate very small concentrations of dilutions.
Since water contains small concentrations of dissolved substances and
solids and since small amounts of chemical compounds are sometimes
used in water treatment processes, the term milligrams per litre is also
common in treatment plants. It is a weight/volume relationship.
As previously discussed:
1000 litres = 1 cubic meter = 1,000,000 cubic centimetres
Therefore,
1 litre = 1,000 cubic centimetres
Since one cubic centimetre of water weighs one gram:
1 Litre of water = 1,000 grams or 1,000,000 milligrams
Milligrams per litre (mg/L) and parts per million (parts) may be used
interchangeably as long as the liquid density is 1.0 gm/cu.cm. A
concentration of 1 milligram/litre (mg/L) or I ppm means that there is 1
part of substance by weight for every I million parts of water. A
concentration of 10 mg/L would mean 10 parts of substance per million
parts of water.
To get an idea of how small 1 mg/L is, divide the numerator and
denominator of the fraction by 10,000. This, of course, does not change
its value since, 10,000 /10,000 is equal to one.
1 milligram
litre =
1 milligram
1,000,000 milligrams=
1 part
million parts= 1 part per million (ppm)
1 mg
L =
1 mg
1,000,000 mg=
1 /10,000 mg
1,000,000/10,000 mg=
0.0001 mg
100 mg = 0.0001%
16
Therefore, 1 mg/L is equal to one ten-thousandth of a percent, or
1% is equal to 10,000 mg/L
To convert ing/L to %, move the decimal point four places or numbers to
the left.
Working problems using milligrams per litre or parts per million is a part
of everyday operation in most wastewater treatment plants.
8. Weight volume relationship
1 litre = 1000 gms = 1 kilogram
1000 litres = 1000 kilograms = 1 Tonne = 1 CU . m.
1 million litres = 1000,000 litres = 1000 m3
9. Force, Pressure and Head
FORCE : The push being exerted by water on any surface being
used to confine it. Force is usually expressed in grams,
kilograms or tonnes.
PRESSURE : The force per unit area. Pressure can be expressed in
many ways, but the most common term is kilograms per
square centimeter (kg/cm2).
HEAD : Vertical distance from the water surface to a reference
point below the surface. Usually expressed in meters.
If the water were poured into a tank 1m x 1m x 1m, the force acting on
the bottom of the tank will be 1000 kg or 1 tonne. The pressure acting
on the bottom of the tank will be-:
1000 kg/ 1m x 1m = 1000 kg/m2 or I Tonne/m2
Since the height of water in the tank is 1 metre, the head of water is 1
metre.
2.6.2 Velocity and Flow Rate Velocity
The velocity of a particle or substance is the speed at which it is moving.
It is expressed by indicating the length of travel and how long it takes to
cover the distance. Velocity can be expressed in almost any distance and
time units. However, it is normal to express the distance travelled per
17
unit time. Thus if a car travels 280 kilometers in 5 hours, its velocity
becomes:
Velocity, km/hr = 280 kilometers / 5 hours
= 56 Km/hour
The velocity of water in a channel, pipe, or other conduit can be
expressed in the same way. If the particle of water travels 600 meters in
five minutes, the velocity is:
Velocity,m
min =
Distance m
Time minutes
= 600 m
5 min
= 120 m
60 seconds
= 2m /sec
Flow Rate
If water in a one meter wide channel is one meter deep, then the cross
sectional area of the channel is 1m X 1m = I sq. m.
If the velocity in this channel is 1 meter per second, then each second a
body of water 1 square meter in area and 1 meter long will pass a given
point. The volume of this body of water would be 1 cubic meter. Since 1
cubic meter of water would pass by every second, the flow rate would
be equal to 1 cubic meter per second or 1 cumec.
To obtain the flow rate the velocity is multiplied by the cross sectional
area. This is another important general formula,
Q = flow rate cu.m./sec.
V= velocity, m/sec.
A = areaa, sq.m.
Q =V X A
18
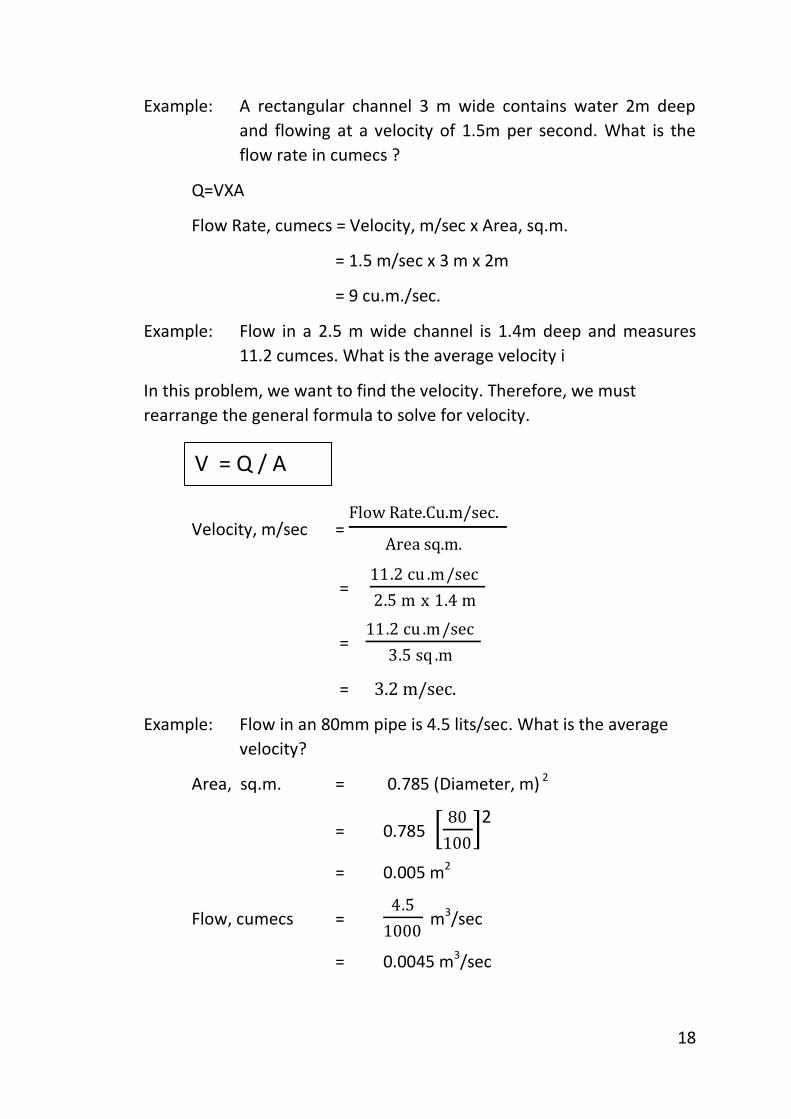
Example: A rectangular channel 3 m wide contains water 2m deep
and flowing at a velocity of 1.5m per second. What is the
flow rate in cumecs ?
Q=VXA
Flow Rate, cumecs = Velocity, m/sec x Area, sq.m.
= 1.5 m/sec x 3 m x 2m
= 9 cu.m./sec.
Example: Flow in a 2.5 m wide channel is 1.4m deep and measures
11.2 cumces. What is the average velocity i
In this problem, we want to find the velocity. Therefore, we must
rearrange the general formula to solve for velocity.
Velocity, m/sec = Flow Rate.Cu.m/sec.
Area sq.m.
= 11.2 cu .m/sec
2.5 m x 1.4 m
= 11.2 cu .m/sec
3.5 sq .m
= 3.2 m/sec.
Example: Flow in an 80mm pipe is 4.5 lits/sec. What is the average
velocity?
Area, sq.m. = 0.785 (Diameter, m) 2
= 0.785 80
100 2
= 0.005 m2
Flow, cumecs = 4.5
1000
m3/sec
= 0.0045 m3/sec
V = Q / A
19
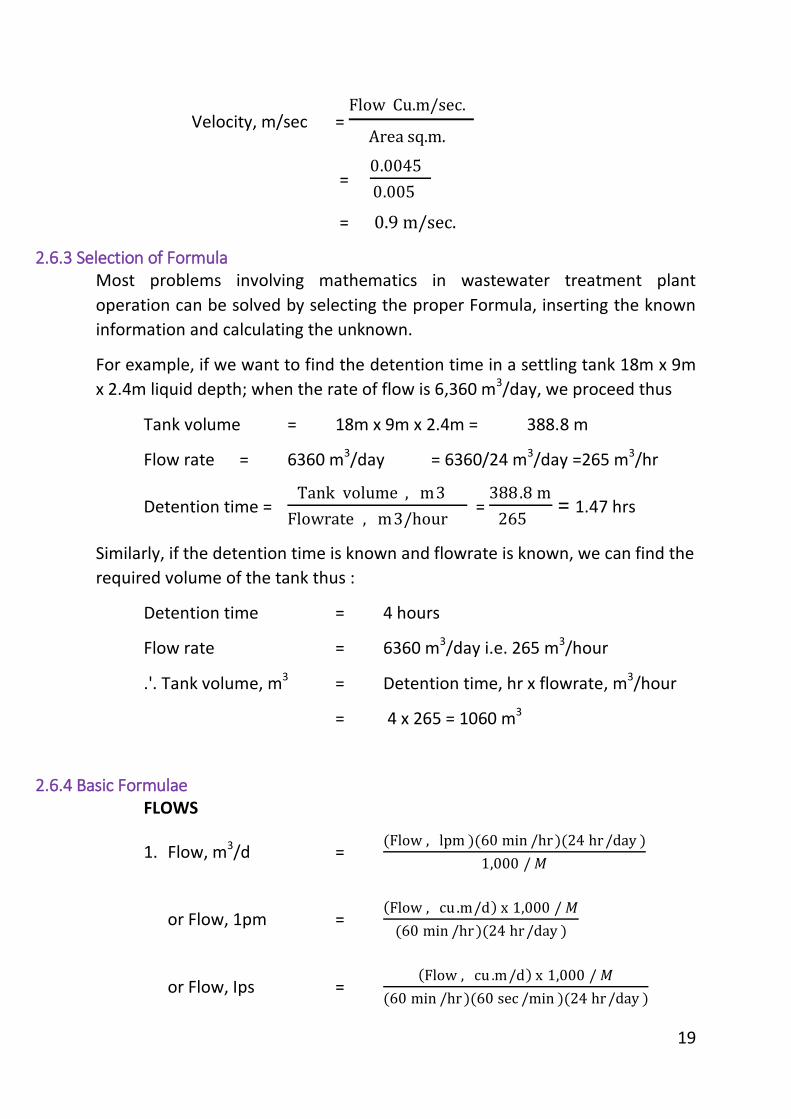
Velocity, m/sec = Flow Cu.m/sec.
Area sq.m.
= 0.0045
0.005
= 0.9 m/sec.
2.6.3 Selection of Formula Most problems involving mathematics in wastewater treatment plant
operation can be solved by selecting the proper Formula, inserting the known
information and calculating the unknown.
For example, if we want to find the detention time in a settling tank 18m x 9m
x 2.4m liquid depth; when the rate of flow is 6,360 m3/day, we proceed thus
Tank volume = 18m x 9m x 2.4m = 388.8 m
Flow rate = 6360 m3/day = 6360/24 m3/day =265 m3/hr
Detention time = Tank volume , m3
Flowrate , m3/hour =
388.8 m
265 = 1.47 hrs
Similarly, if the detention time is known and flowrate is known, we can find the
required volume of the tank thus :
Detention time = 4 hours
Flow rate = 6360 m3/day i.e. 265 m3/hour
.'. Tank volume, m3 = Detention time, hr x flowrate, m3/hour
= 4 x 265 = 1060 m3
2.6.4 Basic Formulae FLOWS
1. Flow, m3/d = (Flow , lpm )(60 min /hr )(24 hr /day )
1,000 / 𝑀
or Flow, 1pm = Flow , cu .m/d x 1,000 / 𝑀
(60 min /hr )(24 hr /day )
or Flow, Ips = Flow , cu .m/d x 1,000 / 𝑀
(60 min /hr )(60 sec /min )(24 hr /day )
20
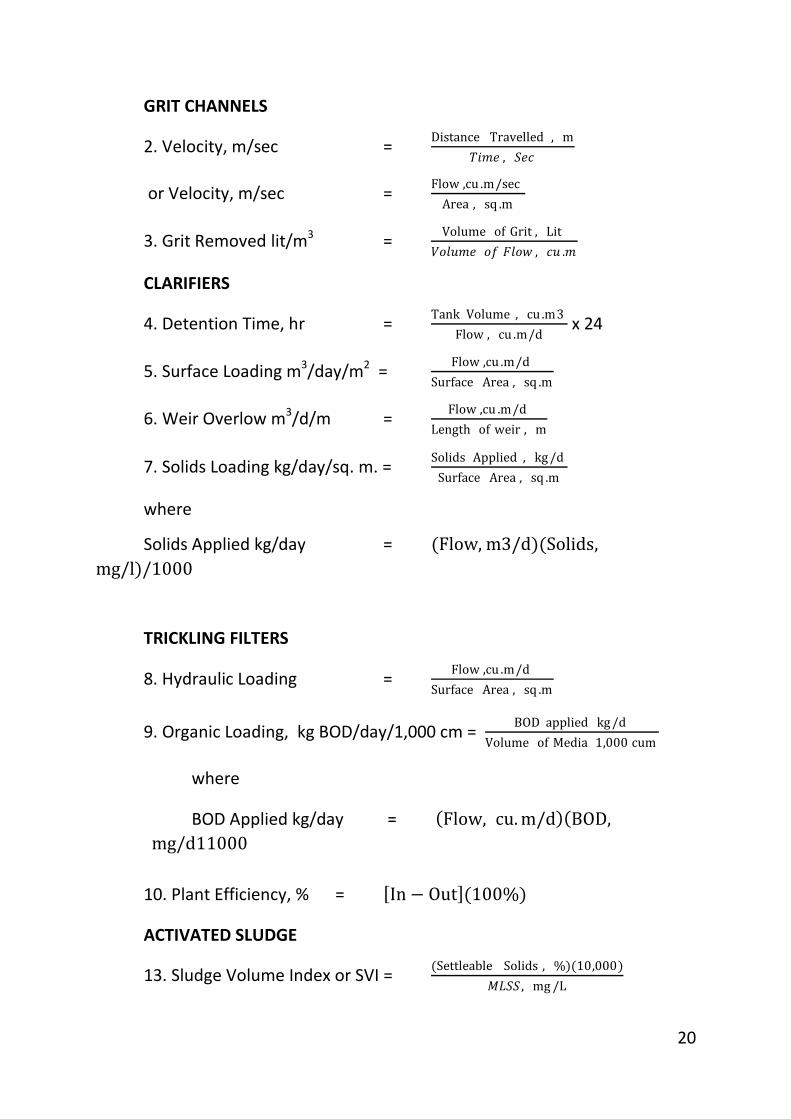
GRIT CHANNELS
2. Velocity, m/sec = Distance Travelled , m
𝑇𝑖𝑚𝑒 , 𝑆𝑒𝑐
or Velocity, m/sec = Flow ,cu .m/sec
Area , sq .m
3. Grit Removed lit/m3 = Volume of Grit , Lit
𝑉𝑜𝑙𝑢𝑚𝑒 𝑜𝑓 𝐹𝑙𝑜𝑤 , 𝑐𝑢 .𝑚
CLARIFIERS
4. Detention Time, hr = Tank Volume , cu .m3
Flow , cu .m/d x 24
5. Surface Loading m3/day/m2 = Flow ,cu .m/d
Surface Area , sq .m
6. Weir Overlow m3/d/m = Flow ,cu .m/d
Length of weir , m
7. Solids Loading kg/day/sq. m. = Solids Applied , kg /d
Surface Area , sq .m
where
Solids Applied kg/day = (Flow, m3/d)(Solids,
mg/l)/1000
TRICKLING FILTERS
8. Hydraulic Loading = Flow ,cu .m/d
Surface Area , sq .m
9. Organic Loading, kg BOD/day/1,000 cm = BOD applied kg /d
Volume of Media 1,000 cum
where
BOD Applied kg/day = Flow, cu. m/d BOD,
mg/d11000
10. Plant Efficiency, % = In − Out (100%)
ACTIVATED SLUDGE
13. Sludge Volume Index or SVI = (Settleable Solids , %)(10,000)
𝑀𝐿𝑆𝑆 , mg /L
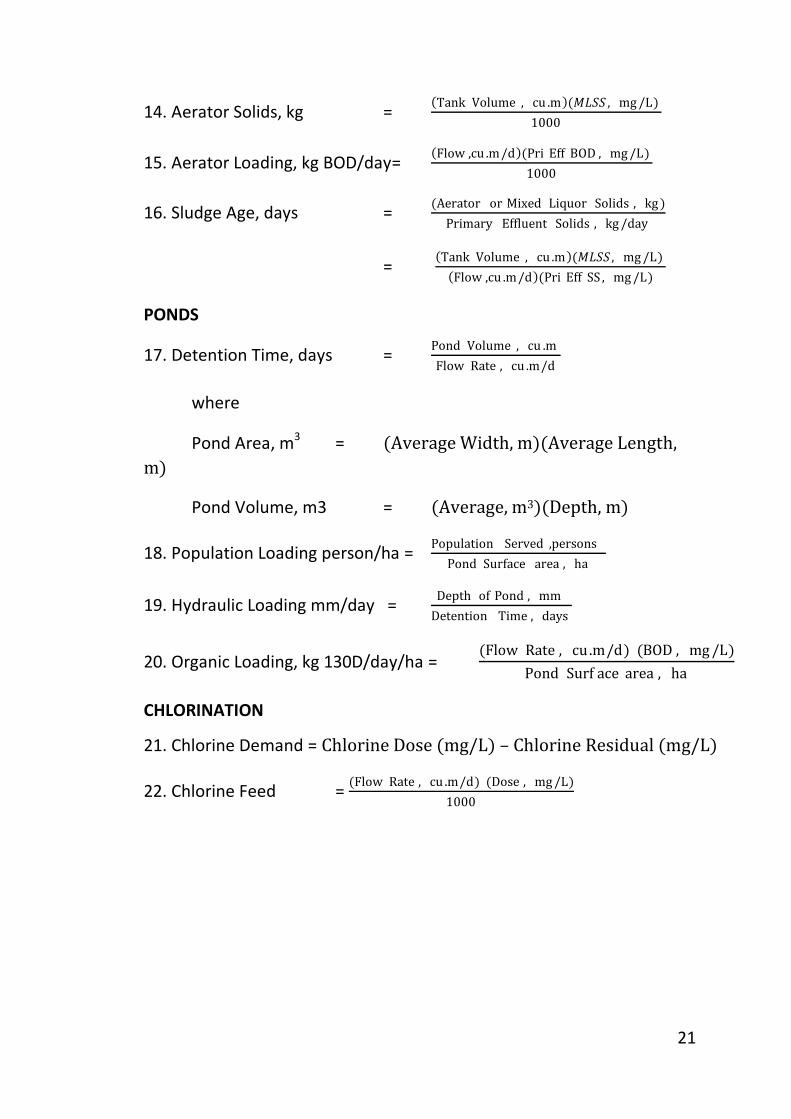
21
14. Aerator Solids, kg = Tank Volume , cu .m (𝑀𝐿𝑆𝑆 , mg /L)
1000
15. Aerator Loading, kg BOD/day= Flow ,cu .m/d (Pri Eff BOD , mg /L)
1000
16. Sludge Age, days = (Aerator or Mixed Liquor Solids , kg )
Primary Effluent Solids , kg /day
= Tank Volume , cu .m (𝑀𝐿𝑆𝑆 , mg /L)
Flow ,cu .m/d (Pri Eff SS , mg /L)
PONDS
17. Detention Time, days = Pond Volume , cu .m
Flow Rate , cu .m/d
where
Pond Area, m3 = (Average Width, m)(Average Length,
m)
Pond Volume, m3 = (Average, m3)(Depth, m)
18. Population Loading person/ha = Population Served ,persons
Pond Surface area , ha
19. Hydraulic Loading mm/day = Depth of Pond , mm
Detention Time , days
20. Organic Loading, kg 130D/day/ha = (Flow Rate , cu .m/d) (BOD , mg /L)
Pond Surf ace area , ha
CHLORINATION
21. Chlorine Demand = Chlorine Dose (mg/L) – Chlorine Residual (mg/L)
22. Chlorine Feed = (Flow Rate , cu .m/d) (Dose , mg /L)
1000
22
3. OPERATION & MAINTENANCE OF TREATMENT UNITS
The following lectures contain some outlines useful to operators and
supervisors in providing good 0 & M to industrial wastewater treatment plants.
Typical unit operations and unit processes most often used in industrial and
municipal plants in India are the following:
Pumping Screening Degritting Equalisation Neutralisation/Chemical dosing Sedimentation Activated sludge Extended aeration Tricking filtration Aerated lagoons Sludge digestion Sludge dewatering Effluent irrigation Chlorination
These methods are discussed giving some definitions, drawings, performance
criteria, safety aspects, electrical-mechanical and switchgear used, and some
broad aspects of their start-up or shut-down as required for maintenance and
repairs. Finally, a few simple, arithmetical calculations which a plant supervisor
may be required to carry out, are also given.
3.1 FUNDAMENTAL PRINCIPLES OF PLANT OPERATION AND MAINTENANCE
The plant supervisor/operator is not concerned with the engineering design of
the treatment units. He has to assume that the plant has been basically
designed correctly by the engineers, keeping in view good operation. The
supervisors/operator has to be concerned with plant operation on a day to day
basis. His position is like that of the driver of a motor car.
A good car driver has to know some simple repairs also. An intelligent driver
can often tell from the sound of the engine if there is something wrong with it.
So can a wastewater treatment plant operator tell from the looks of the
wastewater itself. For example, a wastewater devoid of oxygen is generally
darker (blacker) in colour than one with oxygen. Neglected electrical-
23
mechanical items invariably break down after some time. Hence, the first
principle is,
PREVENTIVE MAINTENANCE HELPS:
The manufacturer's instructions have to be carefully followed, every day! For
example, the right type of lubricating oil and spare parts must be used. Only
then will all the equipment be kept running. If one item of equipment or
process fails, a greater load is placed on the other items or processes which
may also fail one by one and make matters worse. Thus, the 2nd rule of good
maintenance is that when things go wrong;
PROMPT REPAIRS ARE NECESSARY:
Thirdly, it is not enough to keep things running. The equipment and processes
must also give the desired degree of treatment. A process may be outwardly
functioning, the electrical motors, aerators and pumps may all be working (and
power may be getting consumed) but treatment may not at all be effective
because of the presence of toxic substances or the wrong type of biological
growths which may not be known to the operator. Thus,
PERFORMANCE MUST BE REGULARLY CONTROLLED:
Performance can be regularly controlled by
Simple visual inspection of the treatment plant
Sampling and testing of key parameters in a laboratory
Intelligent understanding of what can go wrong in the factory
itself and in the treatment plant so as to keep on the lookout for
certain types of problems.
For example, products which may have got spoiled in manufacturing are often
dumped into the sewers and go to the wastewater treatment plants where
they may cause problems for the unsuspecting operator.
Finally, the operator can give his experience to the management in the form of
user manual.
FEEDBACK:
Based on which problems and upsets may be reduced as time goes. Thus, good
operation and maintenance of wastewater treatment plants involves :
Preventive Maintenance
24
Prompt Repairs
Performance Control
Feedback to Management
3.2 OPERATION OF DOMESTIC AND INDUSTRIAL WASTEWATER TREATMENT
PLANTS (ETPs) 3.2.1 Preamble
The Wastewater (Effluent) Treatment Plants (ETPs) are designed, installed and
operate as to be able to meet the pollution control necessity of the region as
envisaged by the State Pollution Control Board (SPCB) of the region.
Before permitting installation of the ETP the concerned SPCB lays down
limitations on concentrations and characteristics of different pollutants in the
final treated effluent at the time and also on die total quantity of final effluent
that will be discharged per day. In some of Industrial Wastewater, the SPCB
lays down the above limitations on concentrations of pollutants in the final
effluent after studying the raw materials used, details of chemical process
carried out and the waste waters expected from each process carried out in
the industry.
The compliance with the terms of permission granted by SPCB is necessary
round the corner irrespective of electrical/mechanical breakdowns at the ETP,
for which alternative arrangements will have to be incorporated in the design
of ETP.
3.2.2. Preventive Maintenance Programmes (PMP) In order to prevent or minimise mechanical/electrical breakdowns at ETP and
commissioning the ETP, it is necessary to draw out a Preventive Maintenance
Programme for maintenance of all mechanical and electrical equipment
installed based on the recommendations of the manufacturers of different
equipment and also on the experience obtained earlier during operation of
similar ETPs.
The implementation of PMP by the operators should be constantly checked by
the Supervisors to see that the PMP is implemented as per recommended
procedures and sometimes by personal supervision. The maintenance work so
carried out as per schedule should be properly recorded and signed with dates
and time by operator concerned, on cards specially designed with required
maintenance procedures and the frequency of the maintenance operation for
different equipment. Methodical implementation of PMP shall enable pin-
25
pointing the responsibility for failures or breakdown of any of the equipment
installed. Sometimes, it enables making improvements in maintenance
procedures. Schedule the PMP considerably helps to know the causes of
failures, which enables prevention and failures thereafter.
3.2.3 Mechanical/Electrical Break-downs Inspite of diligent implementation of PMP, for one reason or other the break-
downs do occur. Time required for carrying out the necessary repairs depend
on the nature of breakdown and availability of spares required for replacement
of damaged parts. •
i) Mechanical and Electrical repairs:
Minor repairs can be carried out by plant staff. However for carrying out
major repairs expeditiously in some cases, it is found economical to
enter into service contracts with local agencies. In case of larger
Municipalities/Municipal Corporation, where number of small and large
size ETPs are provided, it becomes economical to provide Flying Squads
having transport vehicles fitted with necessary infrastructure for
carrying out repairs or for replacement of damaged parts with spares,
stored at respective ETPs under their jurisdiction.
Causes of Breakdowns
Every Mechanical/Electrical Breakdown should be fully investigated to
determine causes of breakdowns, with primary objects of prevention of
its recurrence and carrying out remedial measures.
If the breakdowns are found to be due to faulty or under-rated
equipment installed, then, the same should be got replaced with new
ones suitable for the purpose/for the working conditions. Sometimes,
the breakdowns are found to be due to use of unsuitable lubricating oils
and greases either due to non-availability of recommended one or due
to inability to understand the importance of using recommended
lubricants. Such breakdowns can be remedied by flushing out the
lubricants used and using alternative lubrication oils and greases having
recommended specifications and characteristics.
In most cases, the breakdowns are due to failure to implement PMP as
recommended. Study of PMP records enables detection of
26
defaulter/defaulters who can be then suitably warned or punished for
getting assured performance of equipment thereafter.
A well trained and experienced operator can prevent most of these
breakdowns, as he can detect very early the unusual rise in temperature
of operating motors. Starters, switches, bearings, etc., which indicates
that something is wrong somewhere. Sometimes, unusual sounds
emanating from working units indicates faulty operations. AlI these, will
enable taking measures to detect the fault and taking remedial
measures in very early stages, thus avoiding embarrassment that would
be caused by breakdowns.
ii) Stand-by Units:
If the damaged equipment is submerged or if long time is required for
carrying out the necessary repairs, the entire unit will have to be
stopped and dewatered for carrying out the repairs.
For operating the ETP as required during such times, stand-by units will
have to be incorporated in the design of the ETP.
The requirements in this context in brief for different units are as below
I) Coarse Screens: As these are hand raked ones, the question of standby
does not arise.
2) Detritus Removal System:
i) Small sized (capacity) units:
As in small units, the detritus is manually removed, (we units are
generally required to be provided, as such the question of stand-
by unit does not arise.
ii) Medium and Large size plants:
(a) In cases where entire equipment is above water level
and the tank has grit holding capacity for up to a week,
the necessity of stand-by unit is not felt as the necessary
repairs can be carried out during the Grit Holding
capacity of the tank.
(b) In cases of medium or large size plants where one or
more units are required for operation, one fully
27
mechanised unit should be incorporated in the plant
design as a stand-by unit. Dewatering pipes should be
included in each unit, so that it would become possible
to empty/dewater any unit without affecting the
operation of remaining units, including the stand-by
unit.
3) Primary and Secondary Sedimentation Tanks : Where peak flow is
around 1.75 times the average rate of flow per day, in small and
medium size plants, it will be sufficient to provide two sedimentation
tanks each having capacity to treat flow equivalent to 3/4 of the
average daily rate of flow. This will enable carrying out necessary
repairs after dewatering the damaged tank and by passing the entire
flow through the second sedimentation, without much affecting the
performance of ETP.
However larger plants, where more than 2 sedimentation tanks are
required for normal operation, one additional sedimentation tank
should be incorporated in plant design as stand-by unit.
4. Secondary Units:
For secondary units where one row of aerators or one high rate filter
is found necessary, there one 100% capacity unit is advisable.
However, where two or more aeration rows or filters are necessary
for normal operation, one aeration row or filter should be provided as
stand-by unit.
In case of Returned Activated Sludge pumps or air compressor or filter
pumps, atleast one such unit should be provided as a stand-by unit.
5. Sludge Pumps and Anaerobic Digesters :
In case of small capacity plants, it is advisable to provide Extended
Aeration plant and avoid necessity of Digesters, primary settlement
tanks and sludge pumps.
In medium size plants, it is sufficient to provide only one 100%
capacity Digester relying on prompt repairs to sludge mixing
mechanism of Digester.
In large capacity plant, where two or more digesters are normally
requited, it is advisable to provide one unit as standby.
28
In case of sludge pumps, atleast one standby unit should be provided.
6. Gas Collectors (Gas Holding) :
Gas Holding capacity is determined by taking into account sludge
pumping pattern, gas generation pattern and gas consumption
pattern. The Gas Holding capacity at about 100% gas consumption
could be minimum, if gas generation rate are close to each other.
However, at no time the gas holder should contain less than 30% of its
holding capacity to meet emergency. To prevent fire hazards, the gas
supply should be closed and restarted by giving precious notice to gas
consumers. No standby unit for gas holder is normally felt necessary if
due steps are taken in the beginning to provide epoxy painting of
inside of the holder. Outside plates and crown of holder can be
periodically painted easily. Frequency of outside painting can be
reduced by providing 25-50 mm oil layer inside and outside on water
surface in the holder tank. By up and down movement of holder, a
thin film of oil can be provided on holder plates, thus protecting the
plates from corrosion.
3.2.4 Equipment maintenance Equipment maintenance assists to keep equipments and processes functioning
properly without interruption. It can be
(a) Preventive Maintenance to prevent breakdown and/or
(b) Corrective Maintenance which involves carrying out repairs after
breakdown. Preventive maintenance is more economical than
corrective maintenance and provides uninterrupted service of the
plant.
The primary aim of any industrial waste water treatment Plant operation is the
trouble free running of the plant efficiently and economically, so that the
effluent front the plant meets the regulatory standards and treated effluent
could be discharged safely on land or into water bodies.
The basic requirements of successful operation and maintenance of effluent
treatment plants are:
1. Good house keeping
2. Assignment of specific maintenance responsibilities to operating
staff;
29
3. Systematic and periodic inspection and maintenance schedules; and
4. Overall supervision of operation and maintenance schedules; and
5. Adequate stock of spare parts.
The main units of the plant are designed for maximum efficiency within a
certain flow range and quality. Close control and coordination of operation of
different units are therefore required within the limits of design.
Better plant operation is possible only when the operator is fully conversant
with the characteristic and composition of effluent handled and the results
achieved during each stage or unit of the treatment process.
Operation and preventive maintenance of several treatment units and the
frequency of cleaning, lubrication of mechanical equipment etc. are to be
strictly adhered to. If optimum results are to be expected.
3.2.5 Lubrication Proper lubrication of equipment is an important factor in obtaining good
performance and long service life. Lubricant should be properly selected to
withstand various condition of operation to assess maximum efficiency.
It is also not good practice to over-fill the housing of bearings, as a filled
bearing a may overheat and result in failure.
Hence, always check grease and oil levels before refurnishing with guard. The
level indicator provided will indicate the proper oil level for both lubricated
gears and bearings
Electrical motors and commercial speed reducers should be lubricated as per
manufacturer’s instructions.
A regular interval of grease application is essential. The operating conditions
will largely determine how often each part must be serviced but in general
frequent applications the lubricants in small quantity is better than heavy
dosage at longer interval.
3.2 6 Storing of share units and spare parts For being able to carry out repairs to damaged mechanical/electrical units, it is
necessary to keep in stock motors, gear heads, starters, switches and spare
parts.
Attempts should be made to standardise equipments. This will go a long way in
reducing the inventory of spares required for efficient plant operation. The
30
quantities of spares required depend largely on ready availability of spares in
market and on the location of the unit from markets. ETPs at far away places
need larger stocking of spares. Care should be taken to replace used spares
promptly. Minimum number of each type of spare should always be kept in
stock. In case of imported spares, orders for the same should be placed, very
promptly.
3.2.7 Drawings of Plants and Equipment The detailed plans of the plant and individual equipment should be made
available to the plant supervisors and operators and also their specifications,
operational procedures and performance guarantees given by the suppliers.
This information will go a long way in taking prompt measures during repairs to
breakdowns, removal of chokes in pipelines.
3.2.8 Pollution Control Measures Pollution Control Measures arising out of necessity of by passing of untreated
or partially treated effluent during emergency .
Sometimes due to total failure of electric power supply or due to failure of any
of the plant units, for one reason or other, it becomes necessary to bypass the
wastes - untreated/partially treated - into a stream, river or the sea. Then in
order to minimise the water pollution that could be caused, provision should
be made to chlorinate the waste water meeting its chlorine demand before its
final discharge. This will necessitate provision of chlorinators, chlorine cylinder
and overhead water supply required for the purpose in operational conditions
at any time for ready use, when required.
In this context, as a preventive measure, feasibility of provision of electric
power generators at site should he considered. The emergency power
generator should be able to operate minimum essential units so that plant
operation and gas supply to consumers will not be much affected.
3.2.9 Laboratory Control on the ETP operation The regular collection of samples - spot or composite - collected at different
pines at the ETP and their analysis in the laboratory indicates how different
units at the plant and ETP as whole are functioning and whether the ETP is
complying with the limitations on the concentration of different pollutants in
final treated effluent are complied with.
31
Comparing the analytical results obtained with those obtained under normal
working of ETP treating the same quantity and rate of wastewater in flow
indicates that something is wrong somewhere. For example,
a) i) Increase in organic matter in grit recovered from grit chamber
indicates lowering of velocity of waste water in grit chamber caused
by defects velocity controls provided.
ii) High organic matter is washed grit indicated defective washing of
grit.
b) i) Marked increase in settleable suspended solids and BOD5 of
settled sewage indicates either over-loading of unit or defective
sludge scraping from tank invert or insufficient removal of settled
sludge. This can also indicate possibility of short circuiting caused by
uneven overflow weir.
c) Marked drop in pH of influent in the plant can upset ETP
performance. This being urgent requires immediate steps to raise
the pH of influent and simultaneously report the matter to
concerned authority to find out the source of discharge of acidic
wastes in sewers and to take remedial measures.
d) Increase in volatile acid contents and volatile solids in digesting
mass accompanied by drop in its pH and increase in CO2% in sludge
gas, give warning that system is not functioning properly, which can
be due to defective mixing of raw sludge and digester contents
either due to accumulation of scum on tank surface, which can be
traced to defective or insufficient mixing procedures followed. It
can sometimes be due to insufficient nutrients in the digesting
mass. This can also he caused by excessive removal of digested
sludge. Excessive (extent of which depends on nature of chemical)
discharge of bactericide in sewers inadvertently UT even purposely.
Sudden thinning (lower solid %) of sludge discharged from sedimentation tanks
can be due either due to breaking or perforation of submerged sludge pipes or
due to excessive dislodging of tanks.
Chemical and microscopic examination and settling rate of activated sludge
indicates whether the process is functioning properly. Adverse findings can be

32
traced to causes of process failure. All this assumes satisfactory functioning of
mechanical and electrical equipments provided.
From the above it will be seen that the critical interpretations of laboratory
findings indicates necessity of investigation of faults, so that necessary
remedial measures can be taken. The chemical analysis of influent, indicates
the nature of difficulties which can arise in ETP operation. Increase in sulphate
contents in influent can cause H2S problems in digester operation and its
contents in sludge gas generated, which may require installation of H2S
removal unit for making it fit for use as domestic fuel or for its use in power
generators.
From the above it will be seen that proper use of laboratory can provide an
early warning system for ETP operation and thus can help operation of ETP
complying with SPCB requirements.
Further with increase in urbanisation and industrialisation of region
discharging their waste water the character of influent to the ETP changes.
Further, with introduction of three shift operations in industrial plants the flow
pattern of influent changes.
All this indicates necessity of modifications in the operation of the ETP and if
found necessary to install additional units necessary to meet the changes
occurring in the character of influent to the plant.
In case of industrial waste water, many times the changes in character of
waste water is very slow, which require minor modifications in ETP operation.
But some cases, there are rapid changes in influent character from hour to
hour due to discharges from different units. The matters get worst when spoilt
batches are required to be discharged. In chemical factories the wastewater is
generally chemically treated and flocculated before sedimentation. As
character of waste water changes fast, two or more equalisation tanks are
necessary. This requires determination of doses of chemicals necessary for
each equalisation tank, from which the chemically dosed waste water can be
pumped at steady rate to floculator and sedimentation tank, from which
reasonably steady quality settled effluent can be obtained from secondary
treatment if deemed necessary. If biological treatment process is to be
adopted, the laboratory can indicate the quantities of nutrients required to be
added to the equalisation tanks before commencement of pumping
operations.
33
3.2.10 Lighting, First Aid and Communication i) Lighting: As the ETPs are operated round the clock, it is necessary to
provide sufficient lighting in the plant area so as to enable operators to
move along freely for carrying out maintenance work for taking
necessary readings and also to carry out minor repairs, when required.
Emergency lighting arrangements should also be made for moving
around during power failures, in addition to provision of electric torches
for closer scrutiny at such times. This assumes sufficient lighting of
approach roads and ladders required for the purpose.
ii) First Aid Kits: For meeting all types of injuries to persons working in
the plant precincts, suitable First Air Box should be kept handy. For being
able to give appropriate first aid, all the operators and plant supervisors
should be given necessary training as approved by medical authority in
the region.
iii) Communication: In order to be able to cope up with major
emergencies at all times of day and night, it should become possible to
get necessary help quickly from officer-in-charge, fire brigade, electric
power supply authority and ambulance services. Hence it is necessary to
provide telephone connection with instructions to telephone company
to see that it is kept in working order continuously as ETP is an essential
service.
3.2.11 Necessity of mechanisation Quill operations at ETP: As failure of ETP poses a potential health hazard to the citizens, all operations
at ETP should be mechanised, such that the plant can be operated without
interruption round the year, irrespective of strikes by labour unions, which has
become the order of the times. It is safe practice to get office staff - not
connected with unions -trained for operating waste water pumping stations
and ETPs at such times under police protection. A periodical rehearsal for the
same keeps the system operational at all times.
3.2.12 Recruitment of staff for ETPs training: People selected for working as operators or plant supervisors should have
minimum educational qualifications necessary for the purpose.
The selected persons should first be given training in giving First-Aid to injured
persons using First-Aid kits provided at site. Simultaneously, the selected
persons should be taught the methods of implementation of Preventive
34
Maintenance Programme drawn out for the ETP and given the required
training by making them work on ETP along with regular staff thereat. The
Training Programme should make the trainees understand the necessity of
operating the ETP efficiently and what happens if the untreated/partially
treated waste water is required to be by-passed. The pollution aspects should
be vividly brought out to understand the importance of the work.
3.2.13 Remuneration, salaries etc. In view of hazardous and insanitary conditions prevailing at the ETP, inspire of
provision washing and bathing facilities provided, generally people are found
unwilling to work at ETP and many times working at ETP is made a stepping
stone for getting better job. For meeting such situations, the people working at
ETPs should be well paid, such that they will not get higher remuneration
anywhere easily.
3.3 PUMPING STATIONS AND PUMPS
3.3.1 Objectives To collect and pump wastewater as necessary for onward delivery.
3.3.2 Types Lift station; pump station.
3.3.3 Some definitions Suction, delivery, wet well, dry well, detention time in wet well, lift head,
pumping sluice valve, non-return valve, header, vent shafts, blower, motor,
shaft, pump, electrical switchgear, ampere meter, panel, sump pump, ground
water relief valves.
3.3.4 Typical data/drawings Vertical shaft, horizontal and submerged pumps layouts, cross-sections.
3.3-5 Performance Criteria Power consumed; flow measurement
3.3.6. What can go wrong? Defective valves, burnt out motors, flooding of dry well, faulty electrical in
operative vent shafts.
3.3.7 Corrosion/structural deterioration - Steel corrosion - Repairs to
3.3.8 Safety aspects Gas asphyxiation, railings, floors, ladders, electrical work.
35
3.3.9 Electrical-mechanical aspects Switchgear, meters Display panels Cabling
3.3.10 Start-up & Shut-down aspects 3.3.11 Simple arithmetical Calculations
KW, KVA, HP-hr (units), Reading head-discharge curves
3.3.12 Pumps Pressure
Atmospheric pressure at sea level is approximately 1.03 kg/cm3. This pressure
is in all directions and on all objects.
The action of the partial vacuum is what gets water out of a sump or well and
to a pump. It is not sucked up, but it is pushed up by atmospheric pressure on
the well surface in the sump. If a complete vacuum could be drawn, the water
would 1.03 x 10 = 10.35 m; but this is impossible to achieve. The practical limit
ct suction lift of a positive displacement pump is about 6.7 m, and that of a
centrifugal pump is 4.5 m.
Work
Work can be expressed as lifting a weight a certain vertical distance. It is to
defined in terms of kilogram metres.
Example:
A 60 kg man runs up a flight of stairs 6m high. How much work he do ?
Work, kg-m = Weight kg x Height, m
= 60 x 6
Work done = 360 kg-meters
Power
Power is a rate of doing work and is usually expressed in kg-m per minute.
Example: If the man in the above example runs up the stairs in three seconds,
how much power has he exerted ?
Power, kg − m/sec =Work kg − m
Time, sec
36
= 360
3 = 120 kg. m/sec
Horsepower
Horsepower is also a unit of power. One horsepower is defined as 4572 kg-
metres per minute or 746 watts, or 76.2 kg.m/second
Example: How much horsepower has the man in the previous example exerted
as he climbs the stairs ?
Horsepower = (Power, kg − m)/sec
76.2
= 120 /76.2
= 1.58
Work is also done by lifting water, if the flow from a pump is converted to a
weight of water and multiplied by the vertical distance it is lifted, the amount
of work or power can be obtained.
Horsepower, HP = Flow, lit
min X Lift m X 1 kg X
Horsepower
lit
= 4572 kg. m/min
Solving the above relation, the amount of horsepower necessary to lift the
water is obtained. This is called water horsepower.
Water, HP = Flow, lpm (H, m)
4572
However, since pumps are not 100% efficient (they cannot transmit all the
power put into them), the horsepower supplied to a pump is greater than the
water horsepower. Horsepower supplied to the pump is called brake
horsepower.
Brake, HP = Flow, lpm (H, m)
4572 X 𝐸𝑝
Motors are also not 100% efficient; therefore, the power supplied to the motor
is greater than the motor transmits.
Ep = Efficiency of
Pump (usual range
50-85% depending
on type and size of
pump.)
37
Motor, HP = Flow, lpm (H, m)
4572 X 𝐸𝑝𝑋 𝐸𝑚
The above formulae have been developed for pumping of water and
wastewater which have a specific gravity of 1.0. If other liquids are to be
pumped, the formulae must be multiplied by the specific gravity of the liquid.
Example: A flow of 1890 Ipm of water is to be pumped against the total head
of 30m by a pump with an efficiency of 70%. What is the pump horse-power?
Brake, HP = Flow, lpm (H, m)
4572 X 𝐸𝑝
= 1890 X 30
4572 X 0.7
= 17.72 HP
Pump Characteristics
The discharge of centrifugal pump, unlike a positive displacement pump, can
be made to vary from zero to a maximum capacity which depends on the
speed, head, power and specific impeller design. The interrelation of capacity,
efficiency. head and power is known as the characteristics of the pump.
The first relation normally looked at when searching for a pump is the head vs.
capacity. The head of a centrifugal pump normally rises as the capacity is
reduced. If the values are plotted on a graph they appear as shown in figure
follows:
Another important characteristic is the pump efficiency. It begins from zero at
no discharge, increases to a maximum and then drops as the capacity is
increased. Following is a graph of efficiency vs. capacity.
The last important characteristic is the brake horsepower or the power input
to the pump. The brake horsepower usually increases with increasing capacity
until it reaches a maximum, then it normally decreases slightly.
These pump characteristic curves are quite important. Pump sizes arc normally
picked from these curves rather than calculations. For ease of reading, the
three characteristic curves are normally plotted together. A typical graph of
pump characteristics is shown as follows:
Em = Efficiency of
motor (usual range
80-95% depending
on type and size of
pump.)
38
The preceding is only a brief description of pumps to familiarize the operator
with their characteristics. The operator does not normally specify the type and
size of pump needed at a plant. If a pump is needed, the operator should be
able to supply the information necessary for a pump supplier to provide the
best possible pump for the lowest cost. Some of the information needed
includes:
1. Flow range desired.
2. Head conditions
a. Suction head or lift b. Pipe and fitting friction head c. Discharge head
3. Type of fluid pumped and temperature
4. Pump location
Evaluation of Pump Performance
1. Capacity
Sometimes it is necessary to determine the capacity of a pump. This can be
accomplished by determining the time it takes a pump to fill or empty a
portion of a wet well or diversion box when all inflow is blocked off.
39
Figure 5 Pump Characteristic Curves
40
EXAMPLE:
a. Measure the size of the wet well.
Length = 3.3 m
Width = 3.3 m
Depth = 1.5 m (We will measure the time it lakes to lower the
well a distance of 1.5 m).
Volume, cu m = L, m X W, m X D, m = 3.3 m X 3.3 m X 1.5 m = 16.34 cu.m = 16,340 lit.
b. Record time for water to drop 1.5 in wet well.
Time = 10 minutes 30 seconds
= 10.5 minutes
c. Calculate pumping rate or capacity
Pumping Rate, lpm = Volume, litres
Time, minutes
= 16,340 lit 10.5 min
= 1556.12 lpm
If you know the total dynamic head and have the pump's performance curves,
you can determine if the pump is delivering at design capacity. If not, try to
determine the cause. After a pump overhaul, the pump's actual performance
(flow; head, power and efficiency) should be compared with the pump
manufacturer's performance curves. This procedure for calculating the rate of
filling or emptying of a wet well or diversion box can be used to calibrate flow
meters.
2. Efficiency
To estimate the efficiency of the pump in the previous example, the total head
must be known. This head may be estimated by measuring the suction and
discharge pressures. Assume these were measured as follows.
No additional information is necessary if we assume the pressure gauges are at
the same height and the pipe diameters are the same. Both pressure readings
must be convened to metres.
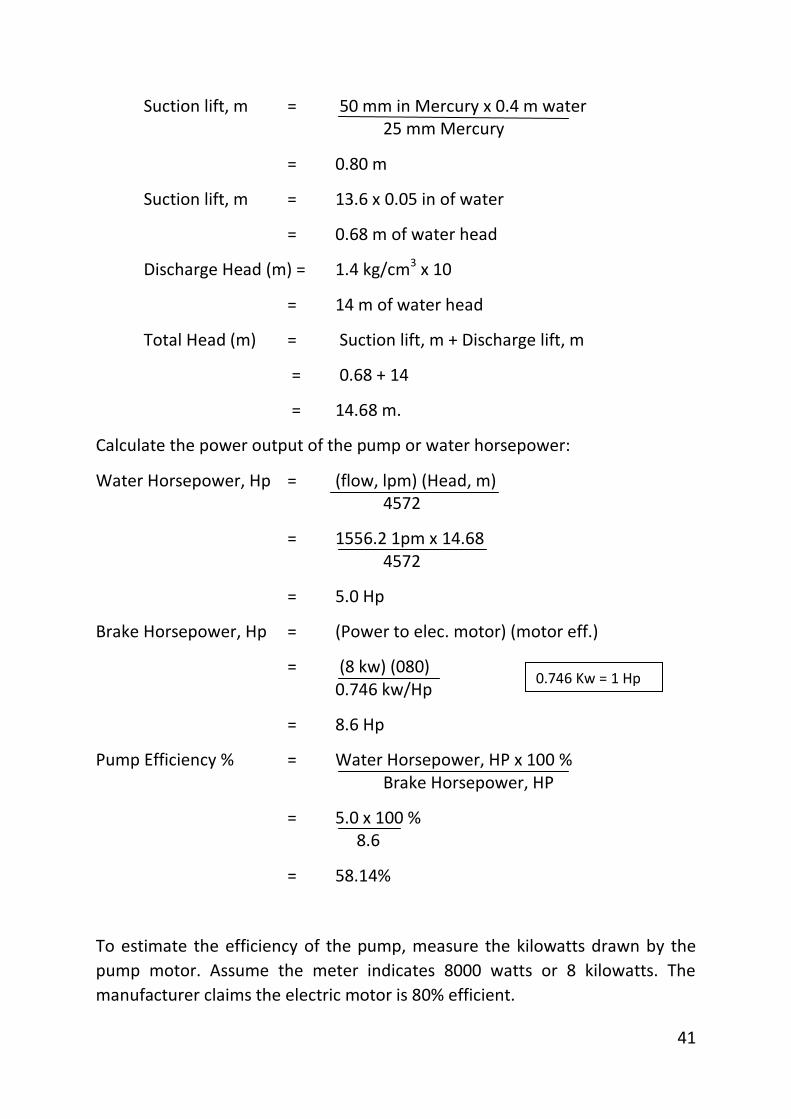
41
Suction lift, m = 50 mm in Mercury x 0.4 m water 25 mm Mercury
= 0.80 m
Suction lift, m = 13.6 x 0.05 in of water
= 0.68 m of water head
Discharge Head (m) = 1.4 kg/cm3 x 10
= 14 m of water head
Total Head (m) = Suction lift, m + Discharge lift, m
= 0.68 + 14
= 14.68 m.
Calculate the power output of the pump or water horsepower:
Water Horsepower, Hp = (flow, lpm) (Head, m) 4572
= 1556.2 1pm x 14.68 4572
= 5.0 Hp
Brake Horsepower, Hp = (Power to elec. motor) (motor eff.)
= (8 kw) (080) 0.746 kw/Hp
= 8.6 Hp
Pump Efficiency % = Water Horsepower, HP x 100 % Brake Horsepower, HP
= 5.0 x 100 % 8.6
= 58.14%
To estimate the efficiency of the pump, measure the kilowatts drawn by the
pump motor. Assume the meter indicates 8000 watts or 8 kilowatts. The
manufacturer claims the electric motor is 80% efficient.
0.746 Kw = 1 Hp
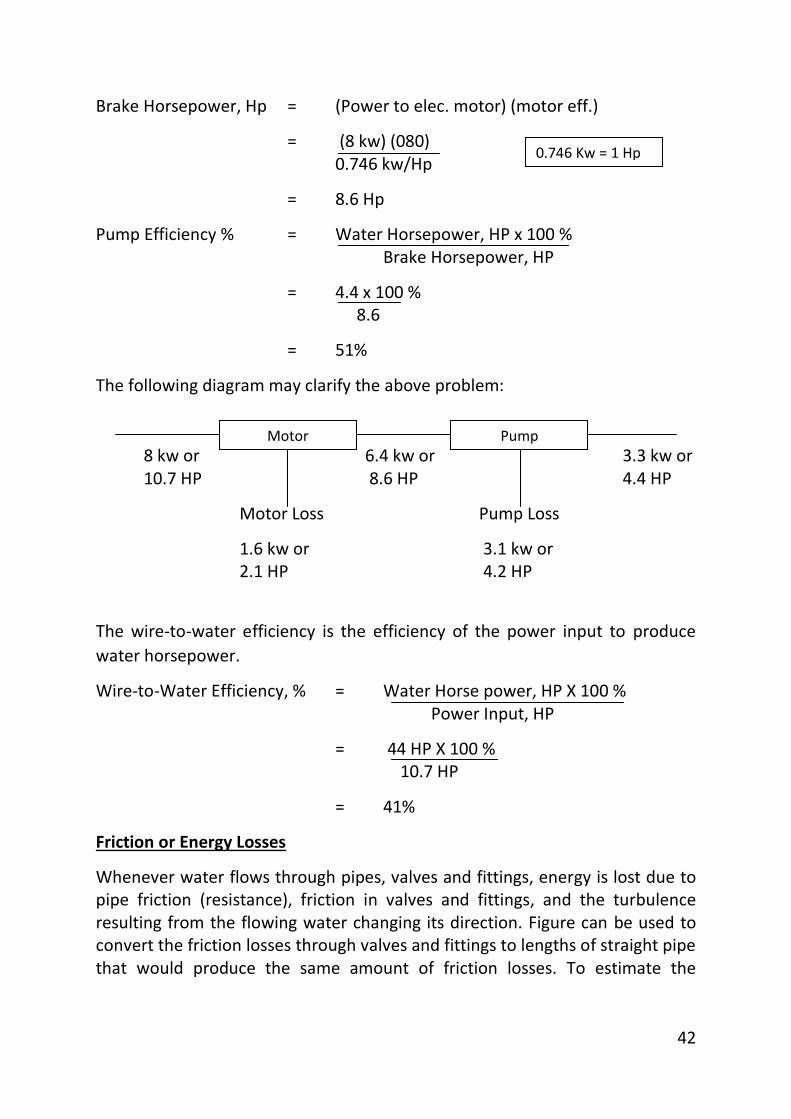
42
Brake Horsepower, Hp = (Power to elec. motor) (motor eff.)
= (8 kw) (080) 0.746 kw/Hp
= 8.6 Hp
Pump Efficiency % = Water Horsepower, HP x 100 % Brake Horsepower, HP
= 4.4 x 100 % 8.6
= 51%
The following diagram may clarify the above problem:
8 kw or 6.4 kw or 3.3 kw or 10.7 HP 8.6 HP 4.4 HP
Motor Loss Pump Loss
1.6 kw or 3.1 kw or 2.1 HP 4.2 HP
The wire-to-water efficiency is the efficiency of the power input to produce
water horsepower.
Wire-to-Water Efficiency, % = Water Horse power, HP X 100 % Power Input, HP
= 44 HP X 100 % 10.7 HP
= 41%
Friction or Energy Losses
Whenever water flows through pipes, valves and fittings, energy is lost due to pipe friction (resistance), friction in valves and fittings, and the turbulence resulting from the flowing water changing its direction. Figure can be used to convert the friction losses through valves and fittings to lengths of straight pipe that would produce the same amount of friction losses. To estimate the
0.746 Kw = 1 Hp
Motor Pump
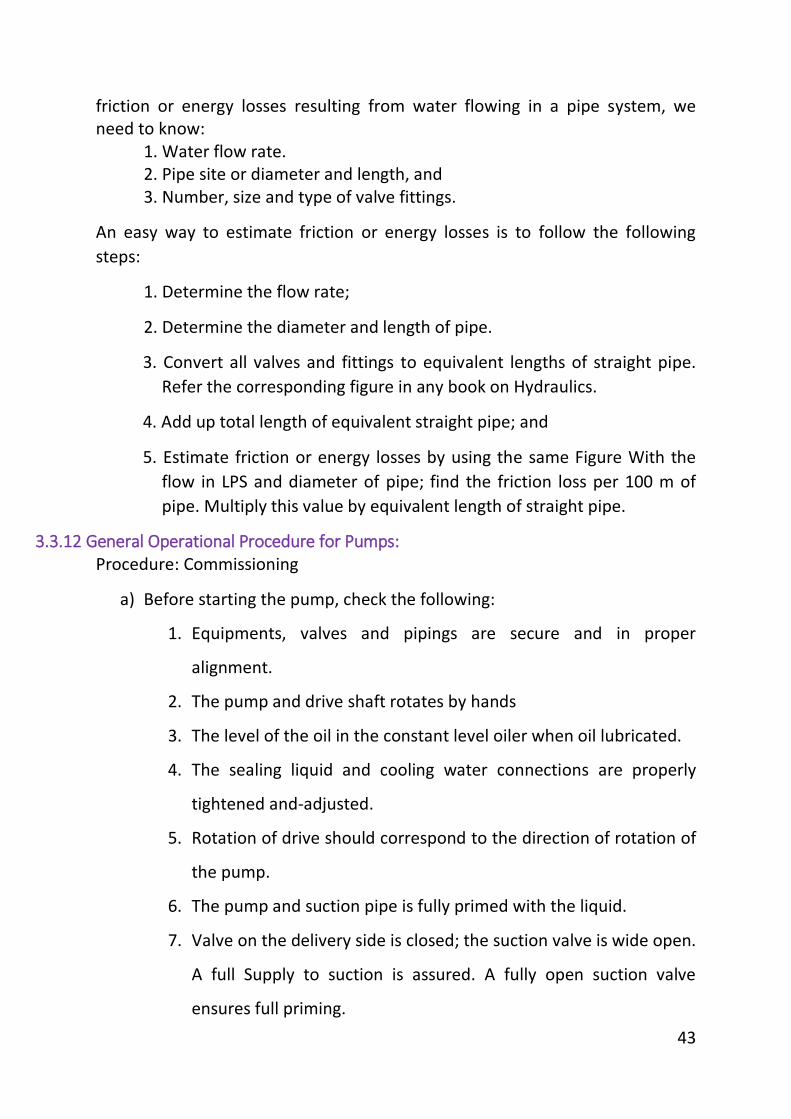
43
friction or energy losses resulting from water flowing in a pipe system, we need to know:
1. Water flow rate. 2. Pipe site or diameter and length, and 3. Number, size and type of valve fittings.
An easy way to estimate friction or energy losses is to follow the following
steps:
1. Determine the flow rate;
2. Determine the diameter and length of pipe.
3. Convert all valves and fittings to equivalent lengths of straight pipe.
Refer the corresponding figure in any book on Hydraulics.
4. Add up total length of equivalent straight pipe; and
5. Estimate friction or energy losses by using the same Figure With the
flow in LPS and diameter of pipe; find the friction loss per 100 m of
pipe. Multiply this value by equivalent length of straight pipe.
3.3.12 General Operational Procedure for Pumps: Procedure: Commissioning
a) Before starting the pump, check the following:
1. Equipments, valves and pipings are secure and in proper
alignment.
2. The pump and drive shaft rotates by hands
3. The level of the oil in the constant level oiler when oil lubricated.
4. The sealing liquid and cooling water connections are properly
tightened and-adjusted.
5. Rotation of drive should correspond to the direction of rotation of
the pump.
6. The pump and suction pipe is fully primed with the liquid.
7. Valve on the delivery side is closed; the suction valve is wide open.
A full Supply to suction is assured. A fully open suction valve
ensures full priming.
44
8. The cock for pressure gauge connection is closed.
9. When two pumps are connected in parallel one acting as a
standby, make sure that the delivery valve of standby is always
closed.
10.The stuffing box packing is properly tightened.
b) See that Amber light is 'OFF' and Green light is ‘ON’.
c) If Amber light is ‘ON' call the electrician for checking/repair. After
checking/repair press the reset button and see that Green light is on.
d) Switch HS 'ON’.
e) Push the start button (Green Button). See that Green light is 'OFF' and
Red Light is 'ON'. Let the prime Mover pick up its full speed.
f) Open the valve on delivery line slowly to reduce the starting load on the
motor.
g) Regulate the required flow by adjusting the delivery valve.
h) Open the gauge for pressure gauge connection.
i) Note the reading on pressure gauge.
j) If everything is O.K. pump is in normal operation.
Procedure - Normal Operation
While running the pump the following things should be noted and regulated
if necessary,
1. For starting any pump see that suction valve, if provided, if fully opened
and delivery valve is closed.
2. Start the pump and open the delivery valve gradually.
3. The flow of codling liquid and Cooling water is uninterrupted. If
necessary, provide sight glass in between the piping.
4. The bearings are not getting abnormally hot: (limit is 80 deg C.)
45
5. The gland is properly tightened to give leakage of approximately 60
drops per minute through stuffing box.
6. Watch the discharge pressure regularly; see that the operating pressure
is in normal range.
7. Head and capacity developed by the pump is as specified.
8. Power consumption is within the limit.
9. Ensure that there is no mechanical friction in the pump. Watch for any
loose mechanical parts, misalignment and any unusual noise in the
system.
10.Stop the pump immediately, if any defect is detected. Do not start the
pump unless the defects are rectified. Report immediately to the
supplier, if it is not possible to rectify the defects.
11.Allow each pump to work atleast once in a shift.
12.Check the bearing lubricating oil level regularly.
Procedure - Shut Down
1. Close the valve on delivery line of pump in operation
2. Press stop button (Red button) and allow prime mover to come to stand
still.
3. Close the cooling water and sealing liquid connections.
4. Leave the suction valve open unless any maintenance is required.
PROCEDURE TO PUT A STANDBY PUMP IN OPERATION
1. Follow steps (a) and (b) of the shut down procedure for the pump to be
stopped if necessary.
2. Press the start hand switch 'ON' to start the standby unit.
3. Watch the discharge pressure on the gauge. It should be normal.
4. Open discharge shut off valve gradually and leave it wide open.
46
5. If everything is O.K. from steps (a) to (I) of the pump start up procedure,
the unit is in normal service.
INSTRUCTIONS FOR ACID HANDLING PUMPS
Operation
1. Direction of rotation of motor should be clockwise looking from the
drive end. In case of reverse rotation the impeller will get loosened from
the shaft and it will touch the suction cover and may cause damage to
the whole pump.
2. The safe minimum flow rate for ANTICO polypropylene pump is 0.5
cu.m/hr for continuous operating where as it can be run for 5 to 10
minutes at shut off head i.e. closed discharge.
3. In case of gland packed pumps there will be slight leakage and this
leakage acts as a coolant and lubricant.
4. Cooling water at a rate of 0.1 to 0.5 lpm is required for the pumps with
Mechanical Seal. Cooling water can he introduced on the mating faces of
the seal with the help of a rubber tube.
5. PLEASE NOTE THAT THE PUMP SHOULD NOT RUN DRY.
SERVICE AND MAJENTFNANCE
1. Bearing Maintenance
Please note that the bearing temperature should not go beyond 80 deg
C. If it increases further please note the following points and set it right
a) Pipe line tension
b) Coupling misalignment
c) Coupling clearance
d) Insufficient grease lubricant.
Both the bearings are lubricated by wheel bearing grease which
can be introduced with the help of grease cups fitted on the
bearing block just above the bearings.
47
2. Mechanical Seal Maintenance
In case of leakage from the mechanical seal, please loosen the rotary
part of the mechanical seal from the shaft and press it slightly and again
tighten it can the shaft. Leakage will stop.
In case you are not able to prevent the leakage just by pressing the
rotary head, please open the pump, remove the seal and inspect both
the surfaces of the seal. If there are scratches on the faces, then get it
lapped and install the seal.
Another case of leakage from the Mechanical Seal is the worn-out
sleeve. Please replace the sleeve in such cases.
3. Gland Packing Arrangement Maintenance
All ANTICO Gland packed pumps are provided with a Teflon Impregnated
Blue Asbestos packing.
There will be a slight leakage from the gland which acts as a coolant and
lubricant.
If the leakage increases then the gland packing should be tightened with
the help of gland pusher.
If the pump leaks even after tightening the packing, then you have to
replace the packing. It is advisable to replace the packing after every two
months. Another cause of leakage from the gland packing pumps is the
worn-out sleeve which should be replaced.
DISMANTLING AND ASSEMBLING THE PUMP
For dismantling the pump, the following sequence should be followed:
1. First dismantle the pump from motor and delivery.
2. Remove the eight bolts.
3. Take out CI ring of the Polypropylene Volute Casing.
4. Hold the coupling end of the shaft and unscrew the impeller from the
shaft.
5. Take out backplate carefully.
6. Take out stationary part of the Mechanical Seal from the backplate by
removing the locating flange.
7. Now remove the rotating part of the Mechanical seal from the shaft by
loosening the alen screw.
48
8. Remove the pump coupling
9. Remove the bolts of the Bearing Cover and pull it back
10. Remove the circlip
11. Remove the shaft of bearing assembly from the bearing cover
12. Remove the locknut of the star washer from the shaft
13. Remove bearings. (inner and outer)
For gland packing arrangement pump
Take out the gland pusher from the backplate and take out the gland
packing rings from the stuffing box of the backplate.
ASSEIYMLY OF THE PUMPS IS TO BE CARRIED OUT IN THE REVERSE ORDER
Note: All other normal installation, operation and maintenance instructions
of the Centrifugal Pumps are applicable to the acid handling (ANTICO)
pumps also.
Table 5 Abnormal Operation and Trouble shooting for Pumps
Symptoms Possible Cause Remedial Procedure
1 Pump fails to start pumping
a. No current drawn due to defective circuit. b. Pump is not properly primed. c. Clogged impeller.
d. Incorrect direction of rotation.
Check circuit and replace if necessary. Check that the liquid level is above cooling of pump. Inform supervisor, down this pump put the standby 'ON'. Clean the respective parts. Inform Supervisor, shut down this unit and put the standby 'ON'. Reverse the connection of concerned motor terminal.
2 Pump does not deliver its capacity of pressure.
a. Air leaking into stuffing box or suction line.
b. Clogged Impeller.
c. Bearing ring may be worn out, Impeller may be damaged shaft sleeve may be loose Stuffing may be defective. Casing gasket
Inform supervisor shut down this unit and put the standby 'ON' and get the concerned parts repaired.
--- do ---
--- do ---
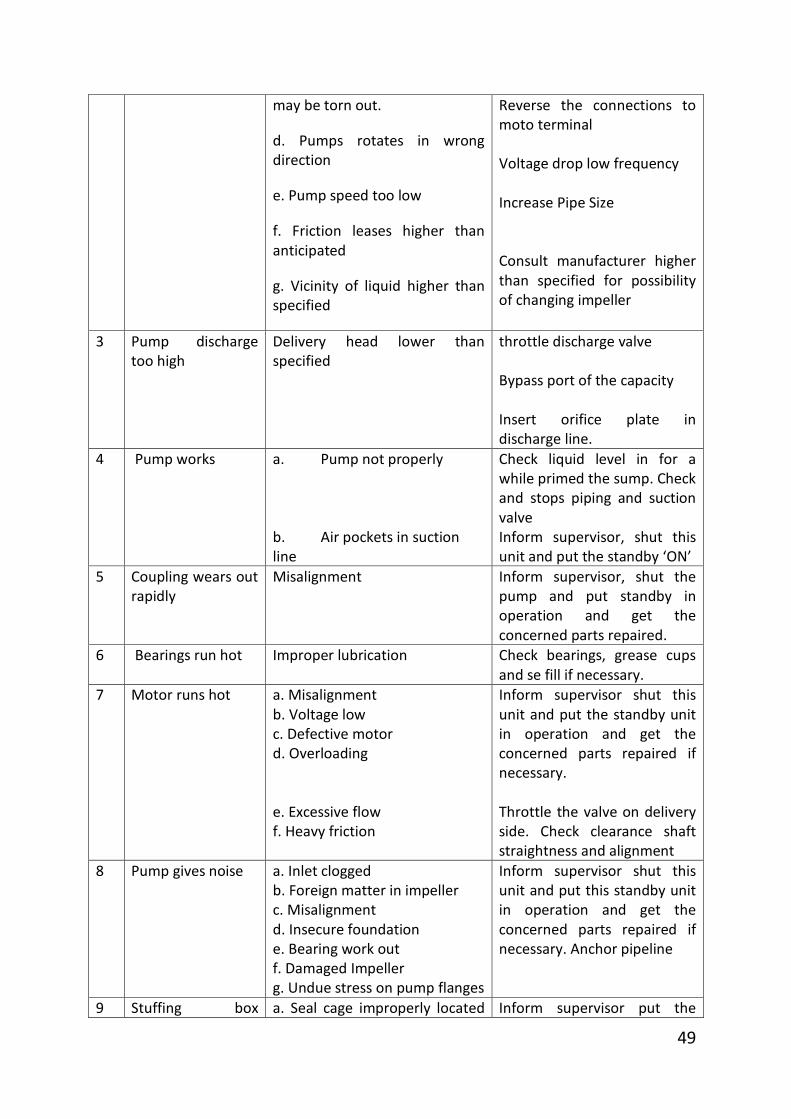
49
may be torn out.
d. Pumps rotates in wrong direction
e. Pump speed too low
f. Friction leases higher than anticipated
g. Vicinity of liquid higher than specified
Reverse the connections to moto terminal
Voltage drop low frequency
Increase Pipe Size Consult manufacturer higher than specified for possibility of changing impeller
3 Pump discharge too high
Delivery head lower than specified
throttle discharge valve Bypass port of the capacity Insert orifice plate in discharge line.
4 Pump works
a. Pump not properly b. Air pockets in suction line
Check liquid level in for a while primed the sump. Check and stops piping and suction valve Inform supervisor, shut this unit and put the standby ‘ON’
5 Coupling wears out rapidly
Misalignment
Inform supervisor, shut the pump and put standby in operation and get the concerned parts repaired.
6 Bearings run hot
Improper lubrication Check bearings, grease cups and se fill if necessary.
7 Motor runs hot a. Misalignment b. Voltage low c. Defective motor d. Overloading e. Excessive flow f. Heavy friction
Inform supervisor shut this unit and put the standby unit in operation and get the concerned parts repaired if necessary. Throttle the valve on delivery side. Check clearance shaft straightness and alignment
8 Pump gives noise a. Inlet clogged b. Foreign matter in impeller c. Misalignment d. Insecure foundation e. Bearing work out f. Damaged Impeller g. Undue stress on pump flanges
Inform supervisor shut this unit and put this standby unit in operation and get the concerned parts repaired if necessary. Anchor pipeline
9 Stuffing box a. Seal cage improperly located Inform supervisor put the
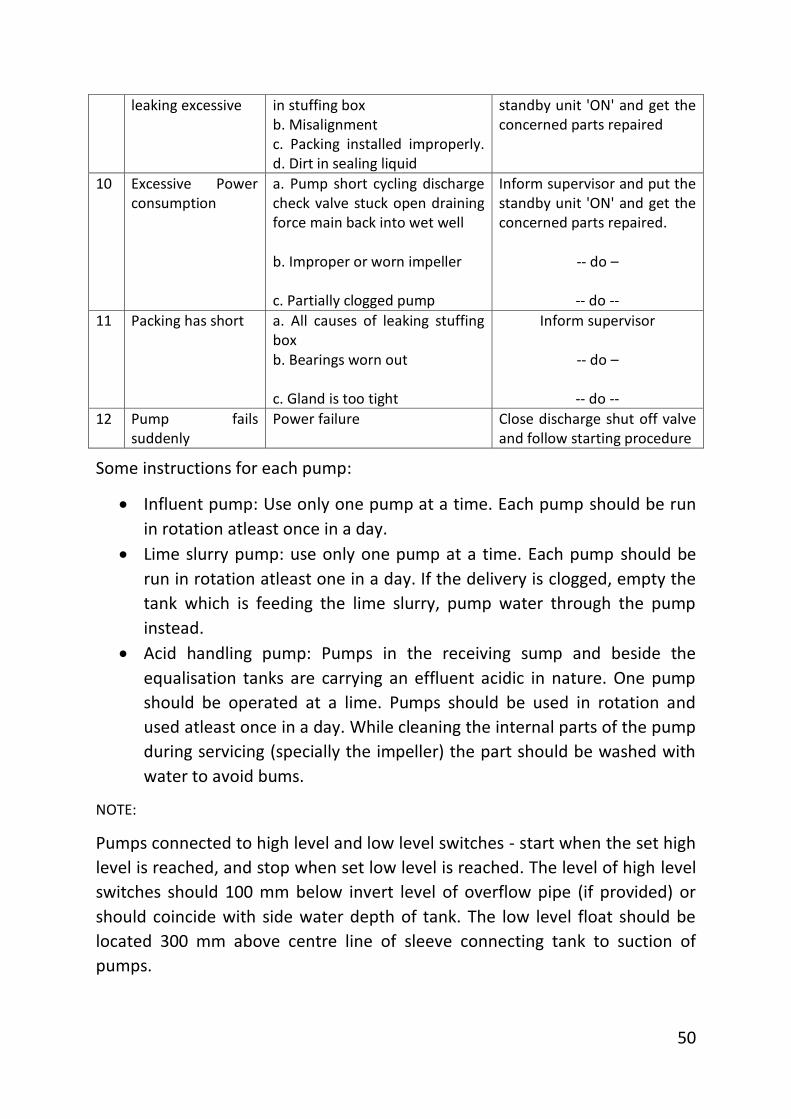
50
leaking excessive in stuffing box b. Misalignment c. Packing installed improperly. d. Dirt in sealing liquid
standby unit 'ON' and get the concerned parts repaired
10 Excessive Power consumption
a. Pump short cycling discharge check valve stuck open draining force main back into wet well b. Improper or worn impeller c. Partially clogged pump
Inform supervisor and put the standby unit 'ON' and get the concerned parts repaired.
-- do –
-- do --
11 Packing has short a. All causes of leaking stuffing box b. Bearings worn out c. Gland is too tight
Inform supervisor
-- do –
-- do --
12 Pump fails suddenly
Power failure Close discharge shut off valve and follow starting procedure
Some instructions for each pump:
Influent pump: Use only one pump at a time. Each pump should be run
in rotation atleast once in a day.
Lime slurry pump: use only one pump at a time. Each pump should be
run in rotation atleast one in a day. If the delivery is clogged, empty the
tank which is feeding the lime slurry, pump water through the pump
instead.
Acid handling pump: Pumps in the receiving sump and beside the
equalisation tanks are carrying an effluent acidic in nature. One pump
should be operated at a lime. Pumps should be used in rotation and
used atleast once in a day. While cleaning the internal parts of the pump
during servicing (specially the impeller) the part should be washed with
water to avoid bums.
NOTE:
Pumps connected to high level and low level switches - start when the set high
level is reached, and stop when set low level is reached. The level of high level
switches should 100 mm below invert level of overflow pipe (if provided) or
should coincide with side water depth of tank. The low level float should be
located 300 mm above centre line of sleeve connecting tank to suction of
pumps.
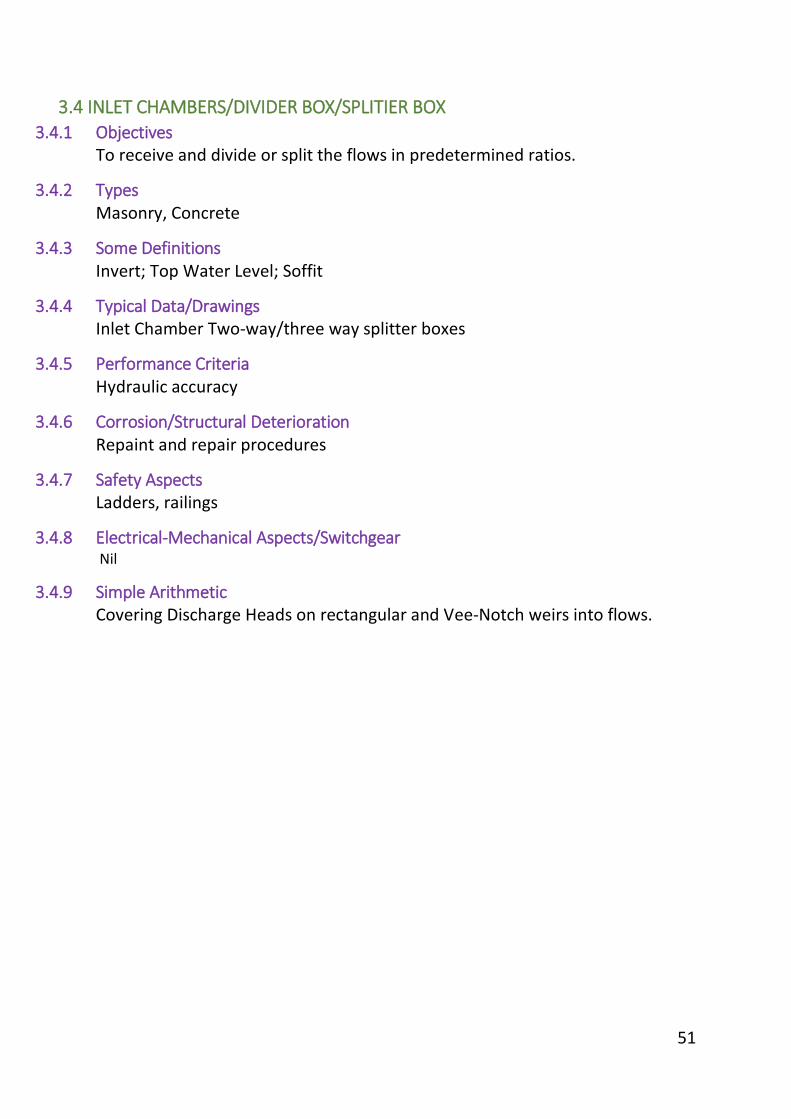
51
3.4 INLET CHAMBERS/DIVIDER BOX/SPLITIER BOX
3.4.1 Objectives To receive and divide or split the flows in predetermined ratios.
3.4.2 Types Masonry, Concrete
3.4.3 Some Definitions Invert; Top Water Level; Soffit
3.4.4 Typical Data/Drawings Inlet Chamber Two-way/three way splitter boxes
3.4.5 Performance Criteria Hydraulic accuracy
3.4.6 Corrosion/Structural Deterioration Repaint and repair procedures
3.4.7 Safety Aspects Ladders, railings
3.4.8 Electrical-Mechanical Aspects/Switchgear Nil
3.4.9 Simple Arithmetic Covering Discharge Heads on rectangular and Vee-Notch weirs into flows.
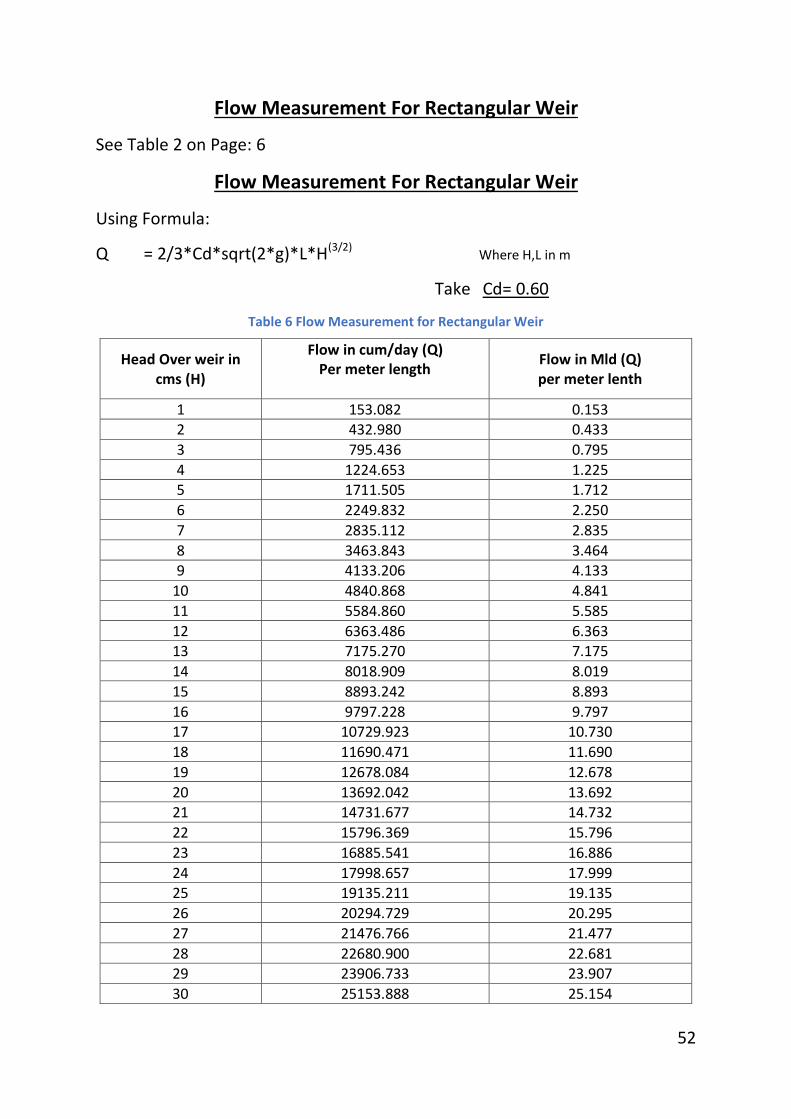
52
Flow Measurement For Rectangular Weir
See Table 2 on Page: 6
Flow Measurement For Rectangular Weir
Using Formula:
Q = 2/3*Cd*sqrt(2*g)*L*H(3/2) Where H,L in m
Take Cd= 0.60
Table 6 Flow Measurement for Rectangular Weir
Head Over weir in cms (H)
Flow in cum/day (Q) Per meter length
Flow in Mld (Q) per meter lenth
1 153.082 0.153 2 432.980 0.433
3 795.436 0.795
4 1224.653 1.225 5 1711.505 1.712
6 2249.832 2.250
7 2835.112 2.835
8 3463.843 3.464 9 4133.206 4.133
10 4840.868 4.841
11 5584.860 5.585
12 6363.486 6.363 13 7175.270 7.175
14 8018.909 8.019
15 8893.242 8.893
16 9797.228 9.797 17 10729.923 10.730
18 11690.471 11.690
19 12678.084 12.678
20 13692.042 13.692 21 14731.677 14.732
22 15796.369 15.796
23 16885.541 16.886
24 17998.657 17.999 25 19135.211 19.135
26 20294.729 20.295
27 21476.766 21.477
28 22680.900 22.681
29 23906.733 23.907
30 25153.888 25.154
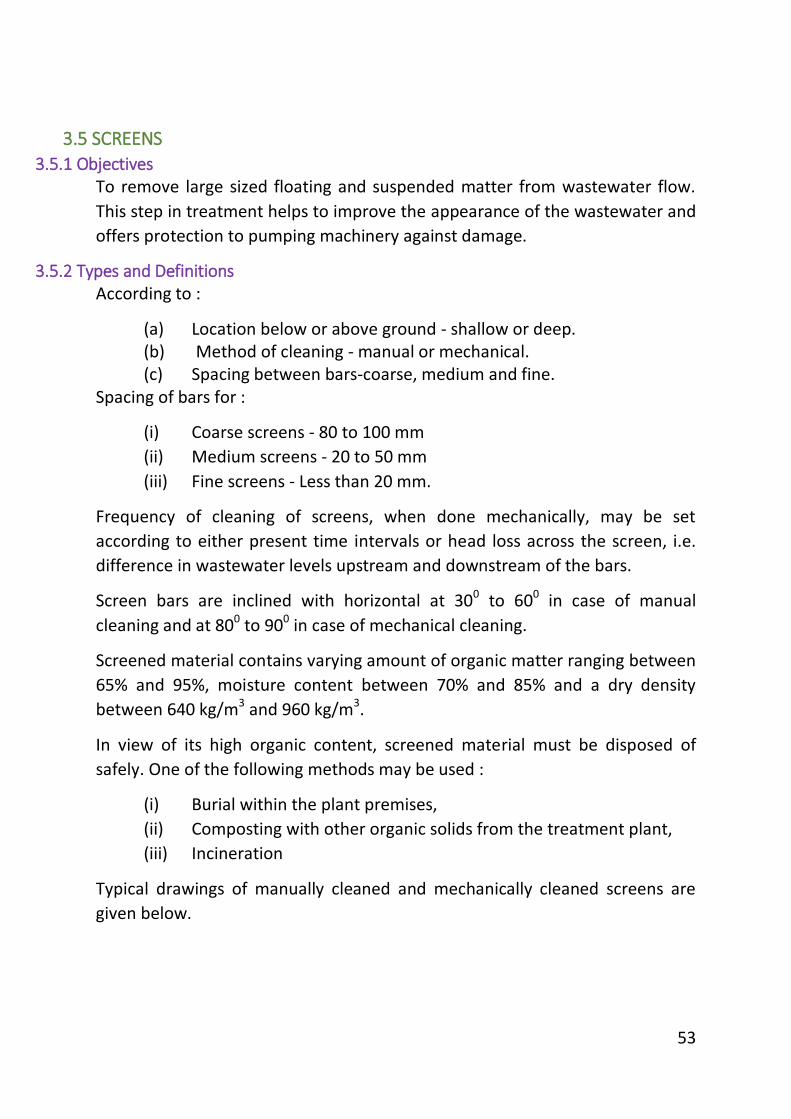
53
3.5 SCREENS
3.5.1 Objectives To remove large sized floating and suspended matter from wastewater flow.
This step in treatment helps to improve the appearance of the wastewater and
offers protection to pumping machinery against damage.
3.5.2 Types and Definitions According to :
(a) Location below or above ground - shallow or deep. (b) Method of cleaning - manual or mechanical. (c) Spacing between bars-coarse, medium and fine.
Spacing of bars for :
(i) Coarse screens - 80 to 100 mm
(ii) Medium screens - 20 to 50 mm
(iii) Fine screens - Less than 20 mm.
Frequency of cleaning of screens, when done mechanically, may be set
according to either present time intervals or head loss across the screen, i.e.
difference in wastewater levels upstream and downstream of the bars.
Screen bars are inclined with horizontal at 300 to 600 in case of manual
cleaning and at 800 to 900 in case of mechanical cleaning.
Screened material contains varying amount of organic matter ranging between
65% and 95%, moisture content between 70% and 85% and a dry density
between 640 kg/m3 and 960 kg/m3.
In view of its high organic content, screened material must be disposed of
safely. One of the following methods may be used :
(i) Burial within the plant premises,
(ii) Composting with other organic solids from the treatment plant,
(iii) Incineration
Typical drawings of manually cleaned and mechanically cleaned screens are
given below.
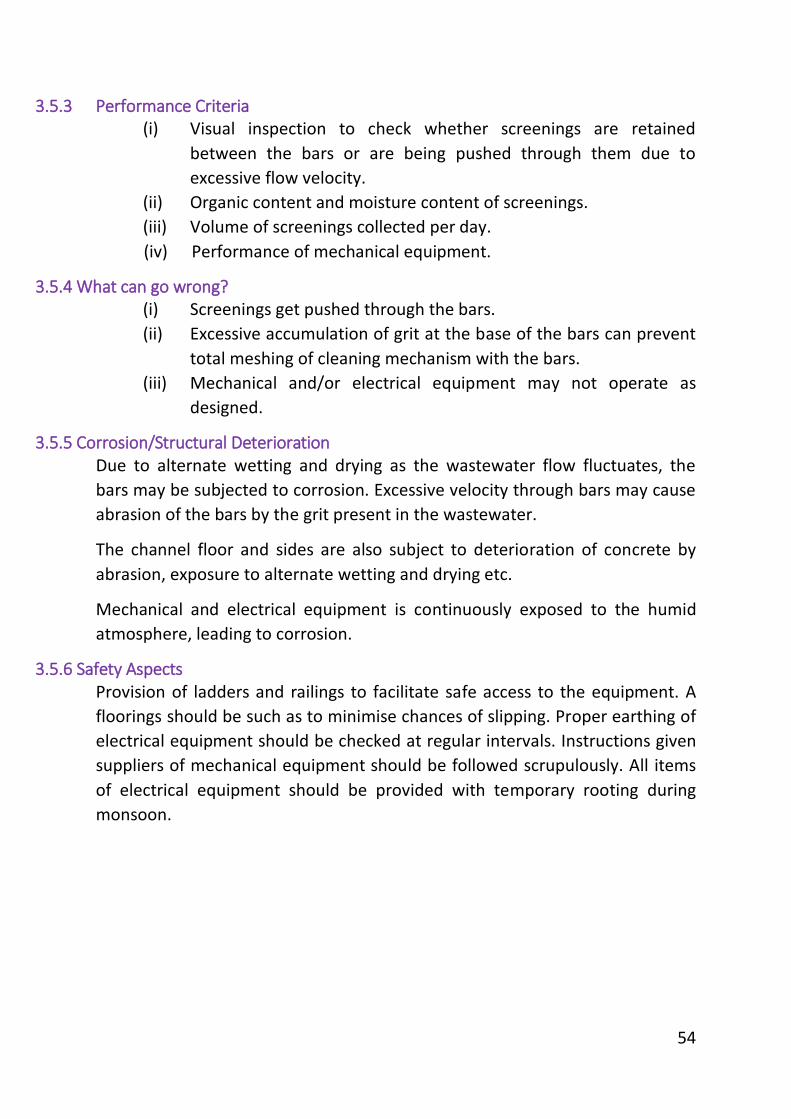
54
3.5.3 Performance Criteria (i) Visual inspection to check whether screenings are retained
between the bars or are being pushed through them due to
excessive flow velocity.
(ii) Organic content and moisture content of screenings.
(iii) Volume of screenings collected per day.
(iv) Performance of mechanical equipment.
3.5.4 What can go wrong? (i) Screenings get pushed through the bars.
(ii) Excessive accumulation of grit at the base of the bars can prevent
total meshing of cleaning mechanism with the bars.
(iii) Mechanical and/or electrical equipment may not operate as
designed.
3.5.5 Corrosion/Structural Deterioration Due to alternate wetting and drying as the wastewater flow fluctuates, the
bars may be subjected to corrosion. Excessive velocity through bars may cause
abrasion of the bars by the grit present in the wastewater.
The channel floor and sides are also subject to deterioration of concrete by
abrasion, exposure to alternate wetting and drying etc.
Mechanical and electrical equipment is continuously exposed to the humid
atmosphere, leading to corrosion.
3.5.6 Safety Aspects Provision of ladders and railings to facilitate safe access to the equipment. A
floorings should be such as to minimise chances of slipping. Proper earthing of
electrical equipment should be checked at regular intervals. Instructions given
suppliers of mechanical equipment should be followed scrupulously. All items
of electrical equipment should be provided with temporary rooting during
monsoon.
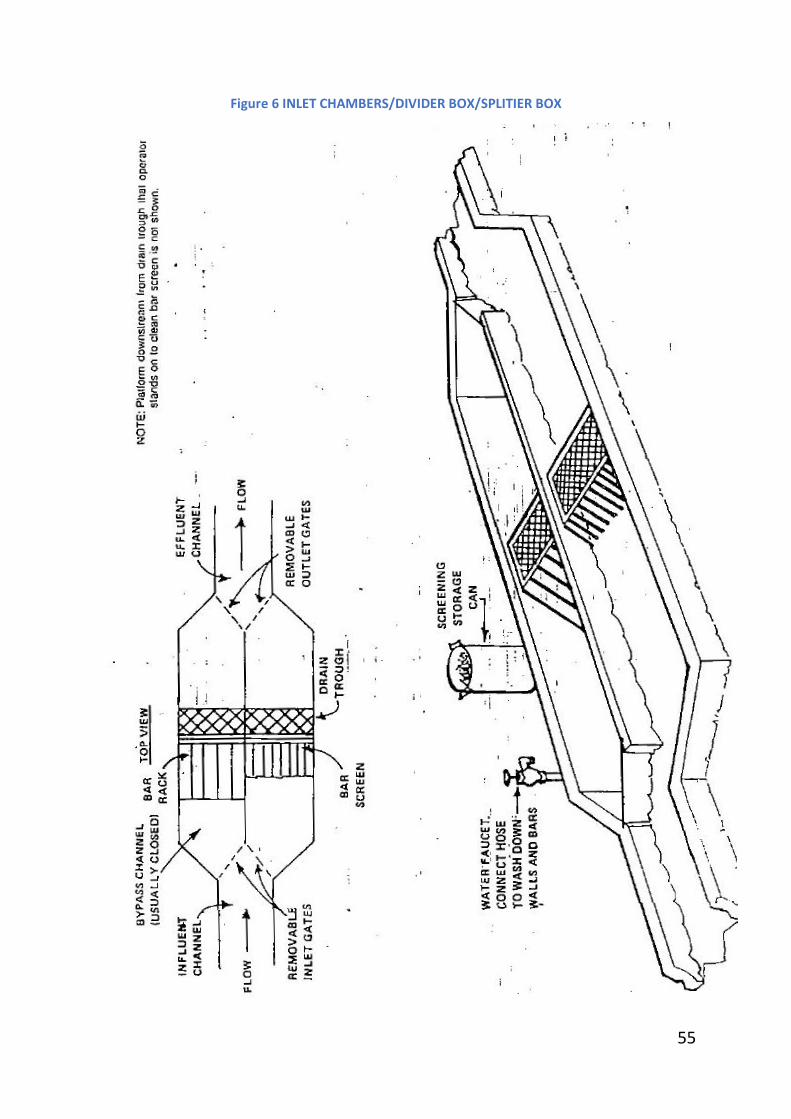
55
Figure 6 INLET CHAMBERS/DIVIDER BOX/SPLITIER BOX
56
Figure 7 Graphical diagram of Roto Screen
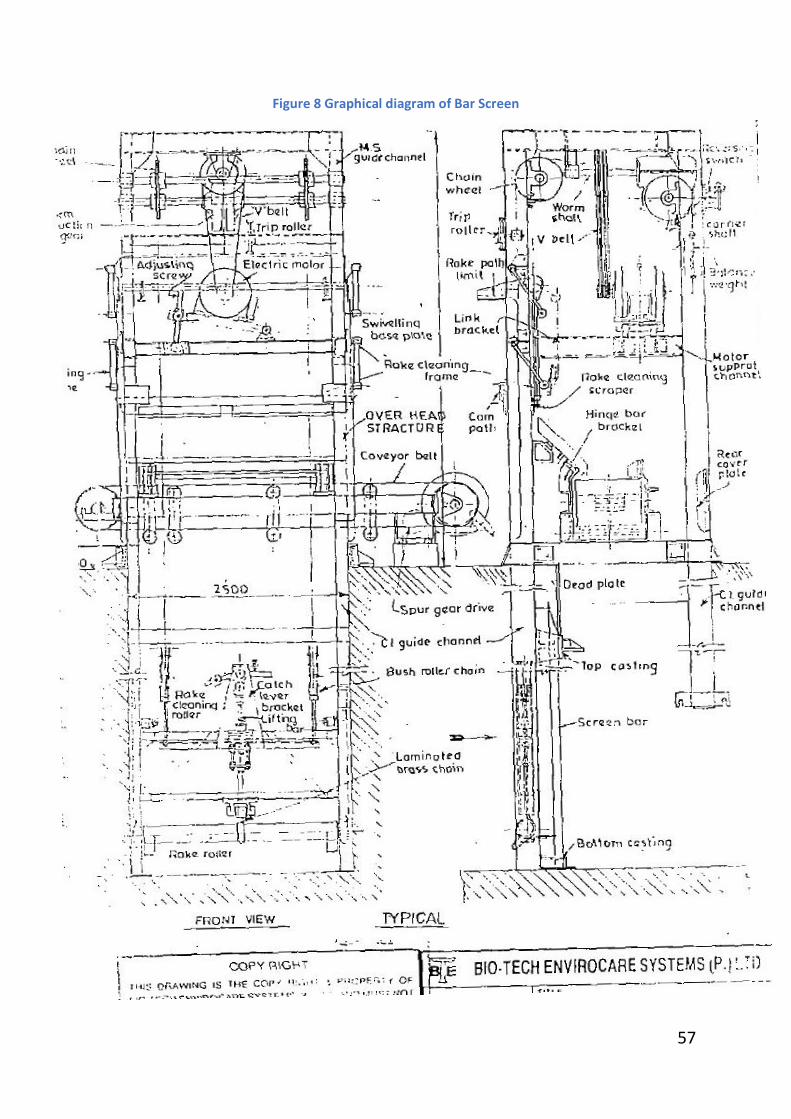
57
Figure 8 Graphical diagram of Bar Screen
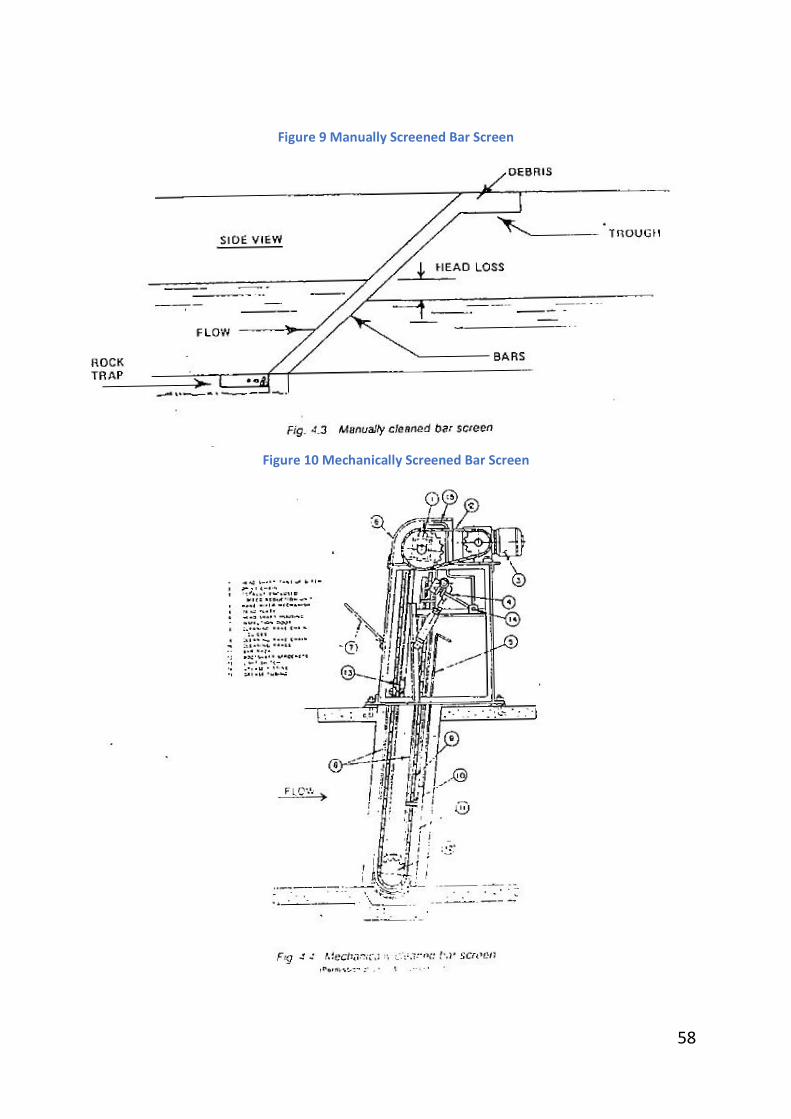
58
Figure 9 Manually Screened Bar Screen
Figure 10 Mechanically Screened Bar Screen
59
3.6 GRIT REMOVAL SYSTEM
3.6.1 Objective To separate and remove grit from wastewaters, followed by washing the grit
for separation of organic matters and then disposing of the washed grit in a
safe and hygienic matter. Grit removal achieves the following objectives:
a) Protection of pumps, valves, piping, etc. from damage due to
abrasion.
b) Minimising chances of choking of pipes and conduits with grit.
c) To prevent the grit from occupying useful volume in biological
treatment units such as aeration tanks, anaerobic digesters, etc.
3.6.2 Types a) Grit chambers or channels
b) Aerated grit chambers
c) Detritus tanks.
Type (a) above is usually manually cleaned and is always provided with a
velocity control device such as Parshall flume or a Sutro weir. Velocity control
may also be achieved by constructing the grit channel with an approximately
parabolic shape. Grit removed from these channels has to be washed
separately before its disposal.
Type (b) is provided with grit separation and washing arrangement in the same
tank. Grit removal from the chambers is done with mechanical equipment.
Separation of the grit from the wastewater flow is achieved by means of
compressed air bubbled into the flowing wastewater. Velocity control is
achieved by regulating the flow of compressed air.
Type (c) also achieves separation and washing of grit by mechanical means.
This type of device does not require velocity control over the wastewater
flowing through
Type (a) is provided for small flows.
Type (b) and (c) are provided for handling large flows.
60
3.6.3 Some Definitions Grit
This includes sand, egg shells, cinders, ashes, etc. It is the heavy mineral matter
present in wastewater. It does not decompose under the action of
microorganisms. It has specific gravity ranging from 2.0 to 2.60.
Detention lime
It is the ratio between the volumetric capacity and flow rate per unit time.
Flow though velocity
It is the rate of movement of wastewater through the length of the grit
channel.
Detritus
It is the heavy, coarse mixture of grit and organic matter carried by
wastewater.
Head loss
An indirect measure of loss of energy or pressure. In the case of grit removal
devices, it is the difference in elevation between the upstream and
downstream water surfaces and is expressed in metres.
Short circuiting
A condition which occurs in tanks or basins or channels when some of the
water travels faster than the rest of the flowing water, thereby reducing the
theoretical detention time.
Surface loading
It is the ratio between the flow rate per unit time and the surface area of a
tank or channel through which the flow is taking place,
Grit washing
A process for separating the organic matter from grit which settles down in the
grit removing devices. This step is essential prior to final disposal of grit.
3.6.4 Typical Drawings Typical drawings of a grit channel, an aerated grit chamber and a detritus tank
are given below :
61
3.6.5 Performance Criteria Visual Inspection
Short circuiting, breakdown of velocity control system, floating matter
travelling with the wastewater, gas bubbles emanating from the grit removal
device indicating inadequate grit removal and too long a storage of grit in the
device.
Sampling and Analysis
Samples of wastewater to be collected at inlet and outlet of grit channels,
should he allowed to scale for ten minutes, the supernatant thrown away and
the settled grit should be taken for analysis.
Analysis of the samples should be done to determine (a) organic content, (b)
amount of grit deposited per unit volume of wastewater and (c) sieve size of
collected grit. Properly washed grit should contain between 3% and 5% organic
matter by weight.
3.6.6 What can go wrong ? (a) Grit escapes with effluent. This can be due to sudden overloading of
the system, or due to excessive velocity accumulation of grit which is not
removed regularly.
(b) Stale or septic conditions develop in the grit chamber due to low
velocities of flow, permitting organic Mattes to scale with the grit.
Infrequent removal of grit can also lead to this condition.
3.6.7 Corrosion/structural Deterioration Alternate wetting and drying of structural members and parts of, mechanical
engineering causes corrosion. This should be prevented by regular painting
schedule.
Deterioration of structural members, especially of the plaster of the civil
works, should be prevented by prompt replastering of the damaged substance.
Application of water proof paint to the inside surfaces of tanks and channels,
helps minimising corrosion.
3.6.8 Safely aspects Periodical checking of earthing provided for all electrical equipment is
essential.
62
Provision of ladders and railings which permit the operator to approach, repair,
replace, maintain items of equipment, should be done.
3.6.9 Start-up and shut-down Before starting, all items of mechanical and electrical equipment should be
checked to see that they are in good working order.
Before shutdown, the entire unit should be emptied of wastewater and
accumulated grit.
3.6.10 Simple Arithmetic 1) Calculate the detention time in a grit channel 12 m long, 1.8 m wide
and 1.5 m deep, when the peak flow through it is 70 mid.
Volume of grit channel = 12 x 1.8 x 1.5 = 32.4 cu.m.
Flow rate = 70 mid = 70,000 cu.m/day or
= 70,000 /24 x 60 x 60
= 0.8 cu.m./sec.
.*. Detention time = 32.4 /0.8 = 40.5 seconds.
2) Calculate the surface lading on a grit channel treating 54 mld of
wastewater at peak flow. The dimensions of the grit channel are 15 m
x 3 in x 1.8 in liquid depth.
Surface area of grit channel = 15 x 3 = 45 sq.m.
Peak flow rate = 54 mld. = 54,000 cu.m./day
.*. Surface loading = Peak flow rate/ Surface. Area
= 54,000 /45
= 1200 cu.m/sq.m./day
3) Estimate the velocity of wastewater flowing through a grit channel if a
float travels 16 meters in 40 seconds.
Distance = 16 m
Time = 40 sec
Velocity, m/sec. = Distance Travelled, m/Time, sec
= 16 m/40 sec
63
= 0.4 m/sec.
4) A grit channel removed 100 litres of grit during a period when the
total flow was 3,000 cubic meters. How -many liters of grit are
removed per cubic meter?
Vol. of Grit = 100 litres
Vol. of Flow = 3,000 cu m
Grit Removed = Volume of Grit litres/ Volume of Flow, cu.m
= 100 litres /3,000 cu m
= 0.033 L/cu.m
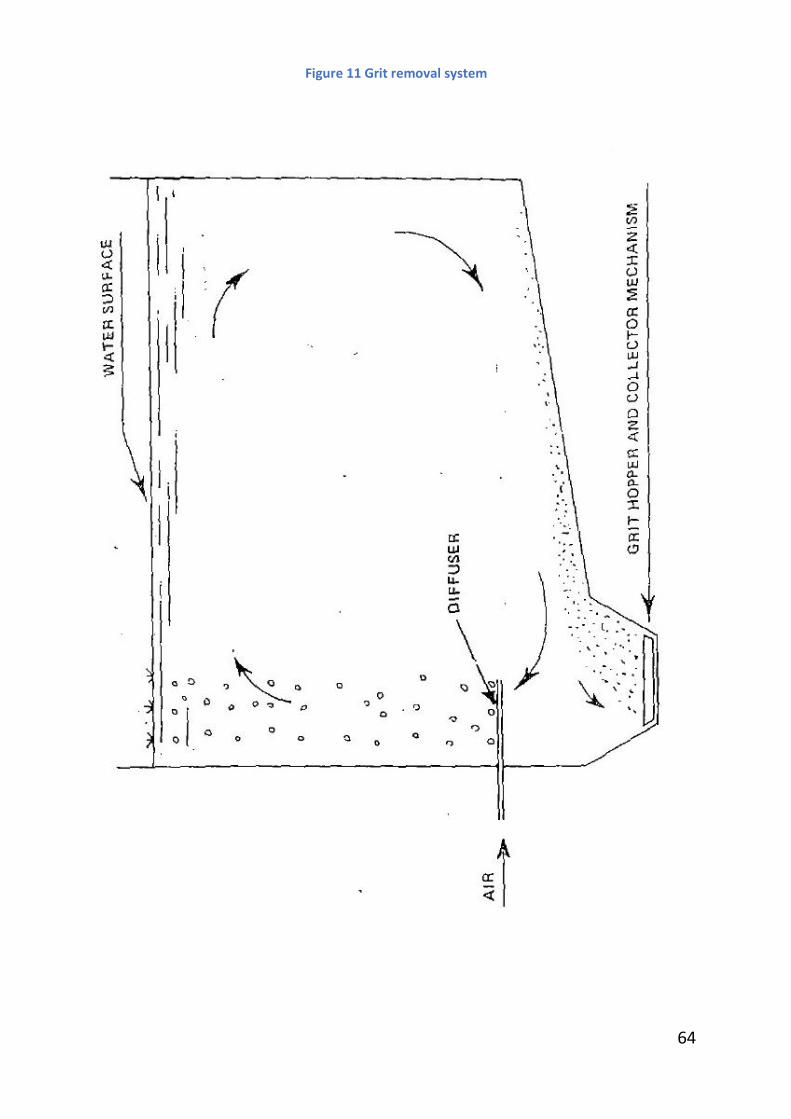
64
Figure 11 Grit removal system
65
Figure 12 Grit Channel
66
3.7 EQUALISATION/NEUTRALISATION TANKS
3.7.1 Objectives To equalise or even out a fluctuating flow before further treatment.
3.7.2 Types Intermittent flow, continuous flow; plain,
Pneumatically or mechanically aerated;
Stirred (non-aerated)
3.7.3 Some Definitions Detention time, free-board, bottom slope,
Inlets; gravity and pumped outlets; sludge
3.7.4 Typical Data/Drawings Intermittent, fill and draw type
Continuous flow with weir outlet
Continuous flow pumped outlet
Boating and fixed aerators
Pneumatic systems
Chemical dosing systems
3.7.5 Performance Criteria
pH, acidity, alkalinity
Hydraulic flow equalisation achieved
Sampling-and testing
Chemical sludge dewatering capability
3.7.6 What can go wrong? Dosing systems; chemical solutions-preparation and feed pH actuated systems, pH probes Hydraulic flow measurement Outlet pumps
3.7.7 Corrosion/Structural Deterioration Equipment corrosion
Steel corrosion
Structural concrete deterioration
3.7.8 Safety Aspects Railing, ladders, floors
Electrical work
67
3.7.9 Electrical- Mechanical Aspects/Switchgear 3.7.10 Start-up and Shut-down Aspects 3.7.11 Simple Arithmetic Calculations
Chemical solution strengths (v/v, g/l, %, mols)
% purity of chemical
Stoichiometric doses
Sludge weight and volume estimations
Head-discharge relationships for weirs
3.7.12 EXAMPLES Determination of Flowrate of Lime for NNeutralisation
1. An acidic wastewater stream discharges 250 cu.m./day. Laboratory
experiments indicate a dose of 85 mg of lime per litre of wastewater to
raise the pH value to 7.50. Determine the daily consumption of time
which has a purity of 60% available CaO.
A. Lime dose = 85 mg/1 = 85 gms per cu.m
Weight of lime (100% pure) to be used per day
= 85 gms x 250 cum/1000gm
=21.25 kg
Since the available CaO is 60%, the actual weight of lime consumed will
be
= 21.25 x 100/60
= 35.5kg/day
2. A 5% suspension of lime is to be prepared for feeding to the above
wastewater. Determine the rate of flow of the suspension.
A 5% suspension means 5 Kg of lime are mixed with 100 litres of water.
For 35.5 kg. of lime, the volume of water required will be
= 35.5 x 100/5
= 710 litres
If this flow is to be discharged at a constant rate over a 24-hour period,
the rate of flow of the suspension will be
= 710/24
68
= 29.6 liters per hour
In practice, it may happen that the flow of the wastewater may not be
uniformly distributed over 24 hours, e.g. if in the above example, the
discharge of 250 cu.m. occurs in 16 hours, then the rate of flow of the
lime suspension will be
= 29.6 x 24 /16
= 44.40 litres per hour.
In the case of large, flows, it may be necessary to provide an equalisation
tank, from which the wastewater will be drawn at a uniform rate by
pumping, so that the flow of neutralising chemical can also be kept
constant.
The feeding of the neutralising chemical to the wastewater can be done
by (a) pumping or (b) by constant head dosing tanks. The pumps used for
feeding, maybe of "variable speed" or "variable stroke" type. In either
case, the pump supplier's information on the discharging capacity should
be used.
DETERMINATION OF FLOW RATE OF COAGULANT
3. Laboratory tests indicate an optimum dose of 40 mg/l of coagulant for a
wastewater flow of 4.8 mld. Calculate the rate of flow of the coagulant if
it is to be dosed as a 10% solution.
A. 40 mg/l = 40 gm.cu.m.
For 4.8 MId, or 4800 cu.m./day, weight of coagulant required
= 40 gm/1000 gm X 4800
= 192 kg. per day
Volume of a 10% solution = 192/10 x 100 = 1920 litres
.". Rate of Coagulant Solution flow = 1920/24 = 80 litres per hour
69
3.8 SEDIMENTATION TANKS
3.8.1 Objectives To remove all the settleable particles and some of the colloidal particles.
3.8.2 Types Primary, secondary, intermediate,
Plain and chemically-aided sedimentation.
3.8.3 Some Definitions Detention time; overflow rate; side water depth; freeboard, Weir overflow
rate; bottom slope; headloss hydrostatic system; Launders;
underflow/overflow; short-circuiting, specific gravity; chemical sludge.
3.8.4 Typical Data/Drawings Hopper slopes
Sludge scrapers, RPM
Scum arms
Weirs
Sludge moisture content
3.8.5 Performance Criteria Visual inspection
Sampling of influent, effluent, sludge
Typical tests
3.8.6 Corrosion/Structural Deterioration Steel corrosion
Repairs to concrete work
3.8.7 Safety Aspects Railings, ladders, electrical work.
3.8.8 Electrical- Mechanical Aspects/Switchgear 3.8.9 Start-up and Shut-down Aspects 3.8.10 Simple Arithmetic Calculations
Overflow rate, detention time, sludge m.c, power consumed.
Examples
A circular secondary clarifier handles a flow of 3,400 cu m/day and a
suspended solids of 3,600 mg/L. The clarifier is 15 meters in diameter and 2.5
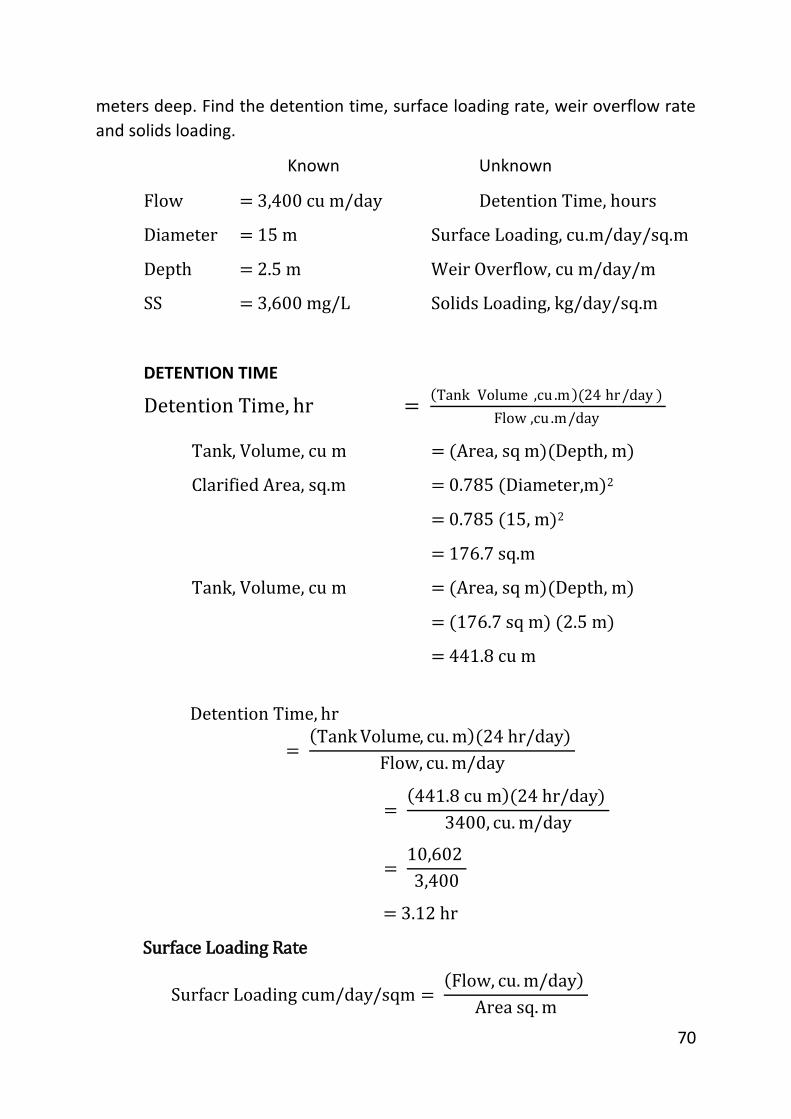
70
meters deep. Find the detention time, surface loading rate, weir overflow rate
and solids loading.
Known Unknown
Flow = 3,400 cu m/day Detention Time, hours
Diameter = 15 m Surface Loading, cu.m/day/sq.m
Depth = 2.5 m Weir Overflow, cu m/day/m
SS = 3,600 mg/L Solids Loading, kg/day/sq.m
DETENTION TIME
Detention Time, hr = Tank Volume ,cu .m (24 hr/day )
Flow ,cu .m/day
Tank, Volume, cu m = (Area, sq m)(Depth, m)
Clarified Area, sq.m = 0.785 (Diameter,m)2
= 0.785 (15, m)2
= 176.7 sq.m
Tank, Volume, cu m = (Area, sq m)(Depth, m)
= (176.7 sq m) (2.5 m)
= 441.8 cu m
Detention Time, hr
= Tank Volume, cu. m (24 hr/day)
Flow, cu. m/day
= 441.8 cu m (24 hr/day)
3400, cu. m/day
= 10,602
3,400
= 3.12 hr
Surface Loading Rate
Surfacr Loading cum/day/sqm = Flow, cu. m/day
Area sq. m
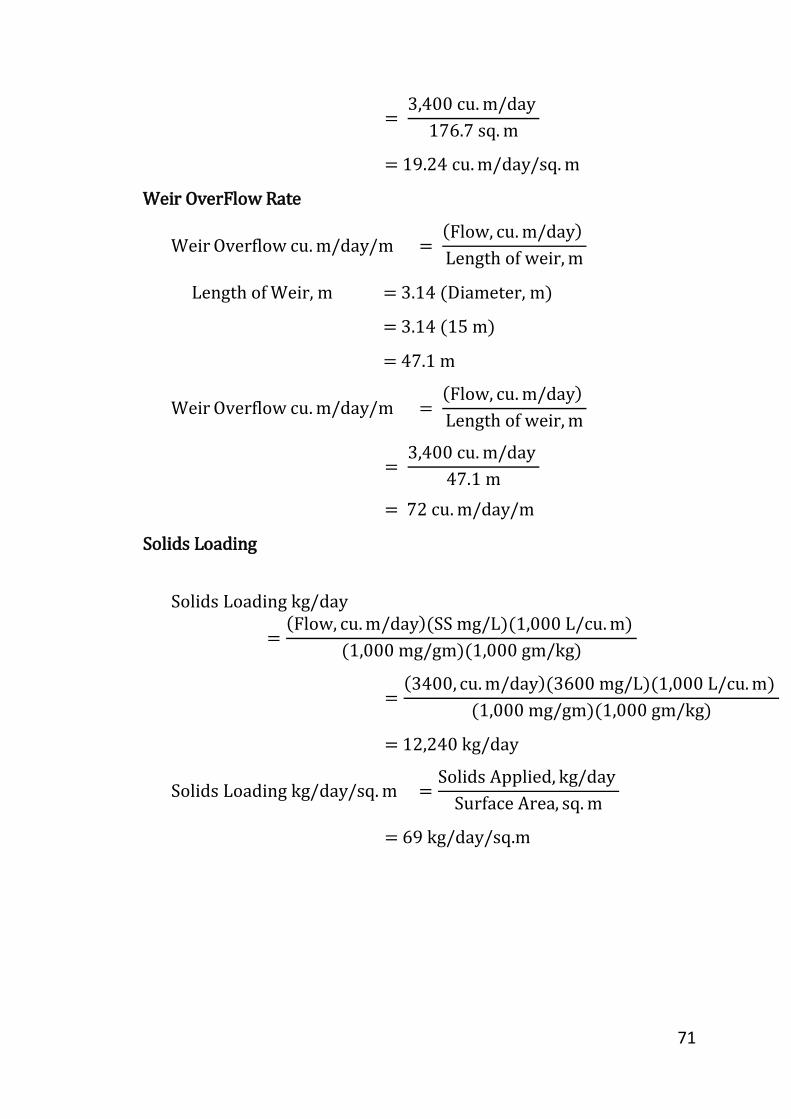
71
= 3,400 cu. m/day
176.7 sq. m
= 19.24 cu. m/day/sq. m
Weir OverFlow Rate
Weir Overflow cu. m/day/m = Flow, cu. m/day
Length of weir, m
Length of Weir, m = 3.14 (Diameter, m)
= 3.14 (15 m)
= 47.1 m
Weir Overflow cu. m/day/m = Flow, cu. m/day
Length of weir, m
= 3,400 cu. m/day
47.1 m
= 72 cu. m/day/m
Solids Loading
Solids Loading kg/day
= Flow, cu. m/day (SS mg/L)(1,000 L/cu. m)
(1,000 mg/gm)(1,000 gm/kg)
= 3400, cu. m/day (3600 mg/L)(1,000 L/cu. m)
(1,000 mg/gm)(1,000 gm/kg)
= 12,240 kg/day
Solids Loading kg/day/sq. m =Solids Applied, kg/day
Surface Area, sq. m
= 69 kg/day/sq.m
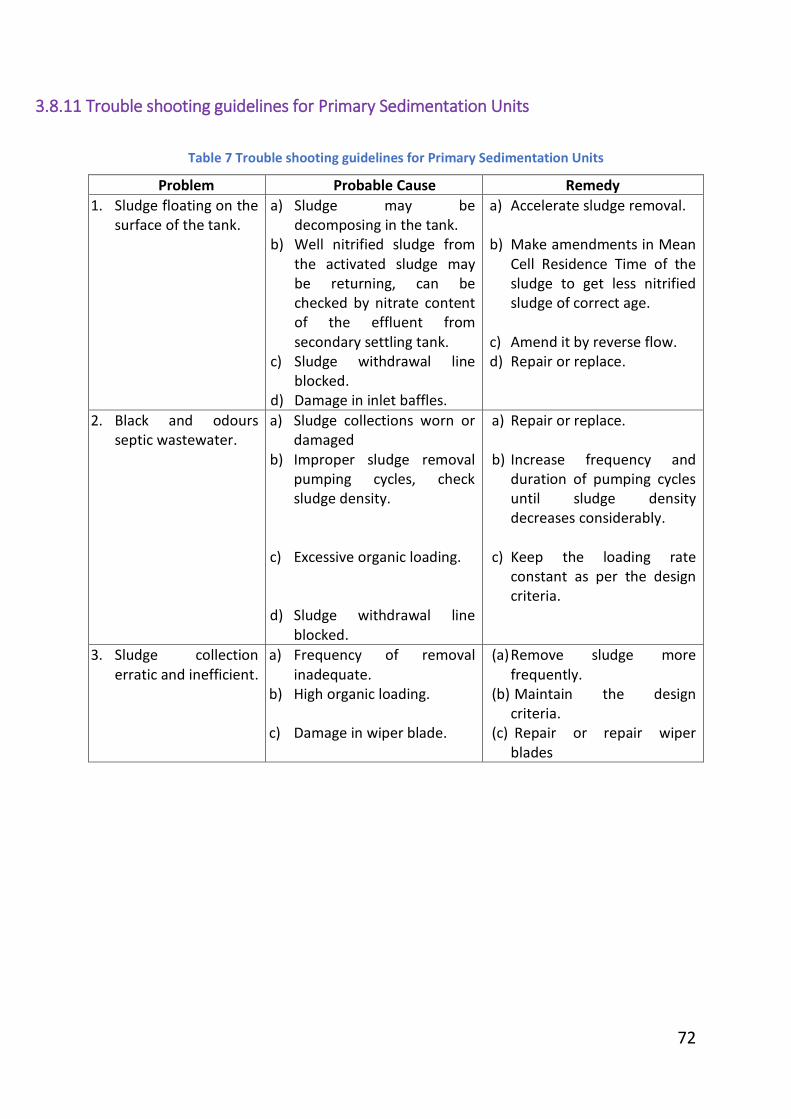
72
3.8.11 Trouble shooting guidelines for Primary Sedimentation Units
Table 7 Trouble shooting guidelines for Primary Sedimentation Units
Problem Probable Cause Remedy
1. Sludge floating on the surface of the tank.
a) Sludge may be decomposing in the tank.
b) Well nitrified sludge from the activated sludge may be returning, can be checked by nitrate content of the effluent from secondary settling tank.
c) Sludge withdrawal line blocked.
d) Damage in inlet baffles.
a) Accelerate sludge removal. b) Make amendments in Mean
Cell Residence Time of the sludge to get less nitrified sludge of correct age.
c) Amend it by reverse flow. d) Repair or replace.
2. Black and odours septic wastewater.
a) Sludge collections worn or damaged
b) Improper sludge removal pumping cycles, check sludge density.
c) Excessive organic loading. d) Sludge withdrawal line
blocked.
a) Repair or replace.
b) Increase frequency and duration of pumping cycles until sludge density decreases considerably.
c) Keep the loading rate
constant as per the design criteria.
3. Sludge collection erratic and inefficient.
a) Frequency of removal inadequate.
b) High organic loading.
c) Damage in wiper blade.
(a) Remove sludge more frequently.
(b) Maintain the design criteria.
(c) Repair or repair wiper blades
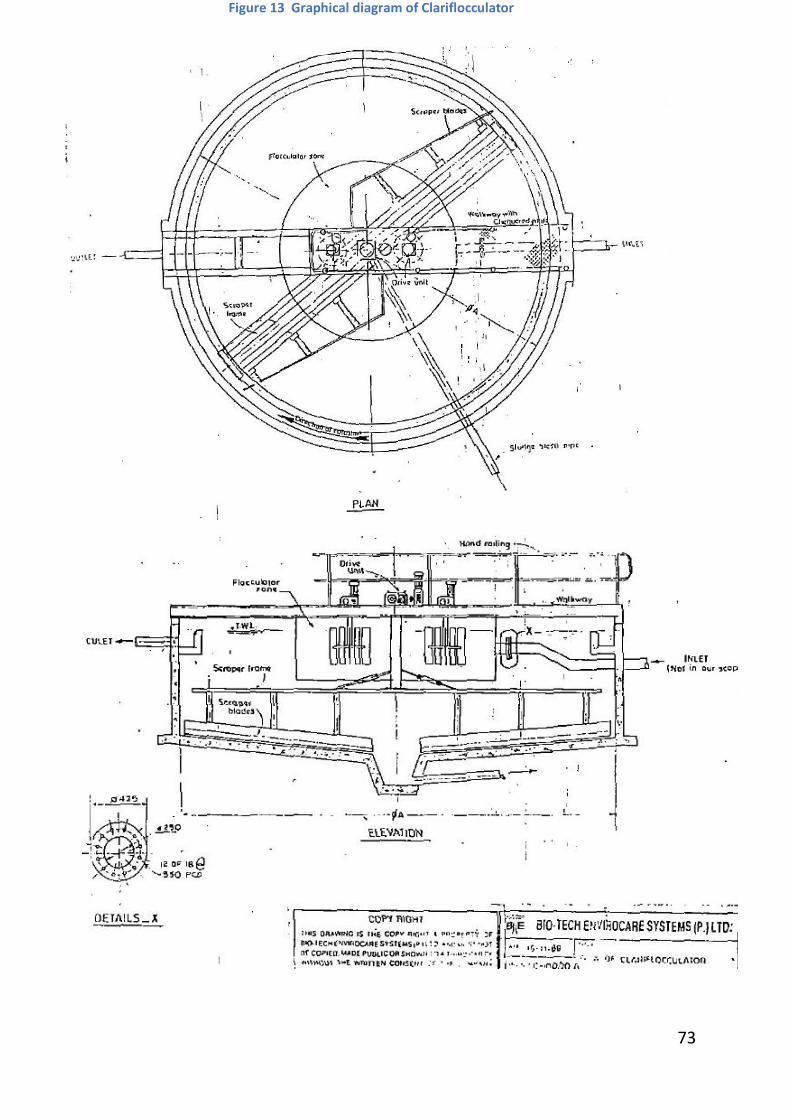
73
Figure 13 Graphical diagram of Clariflocculator
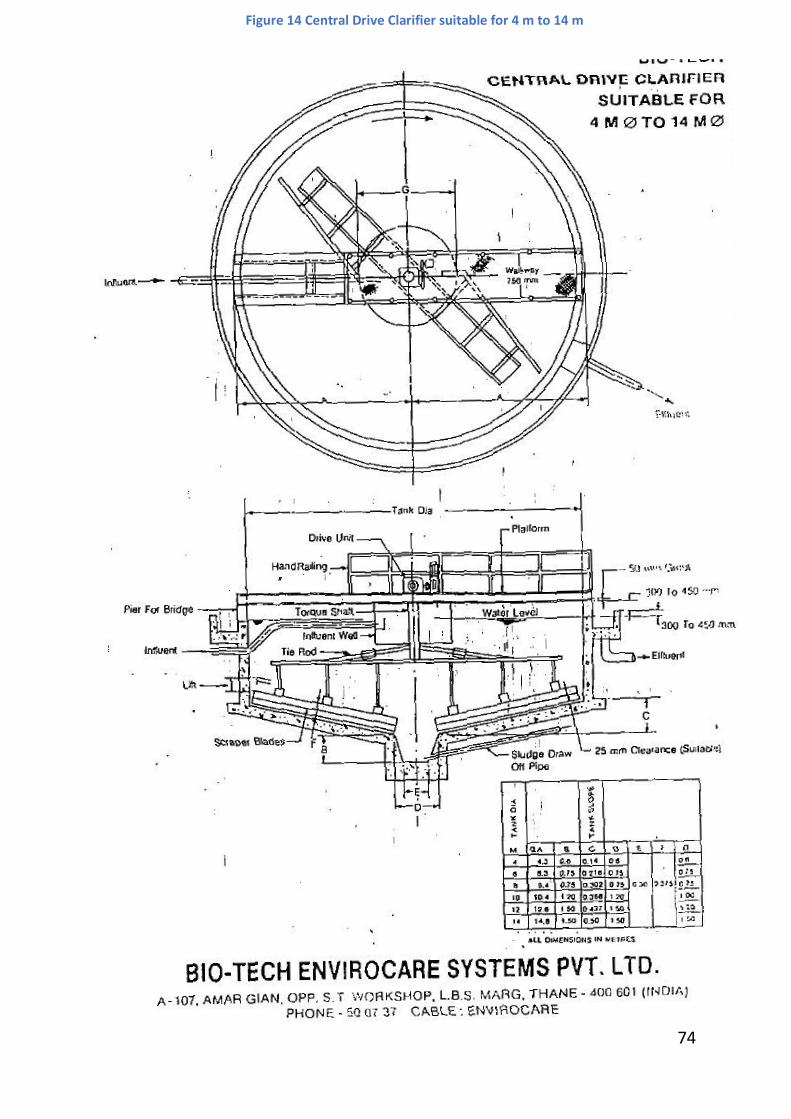
74
Figure 14 Central Drive Clarifier suitable for 4 m to 14 m
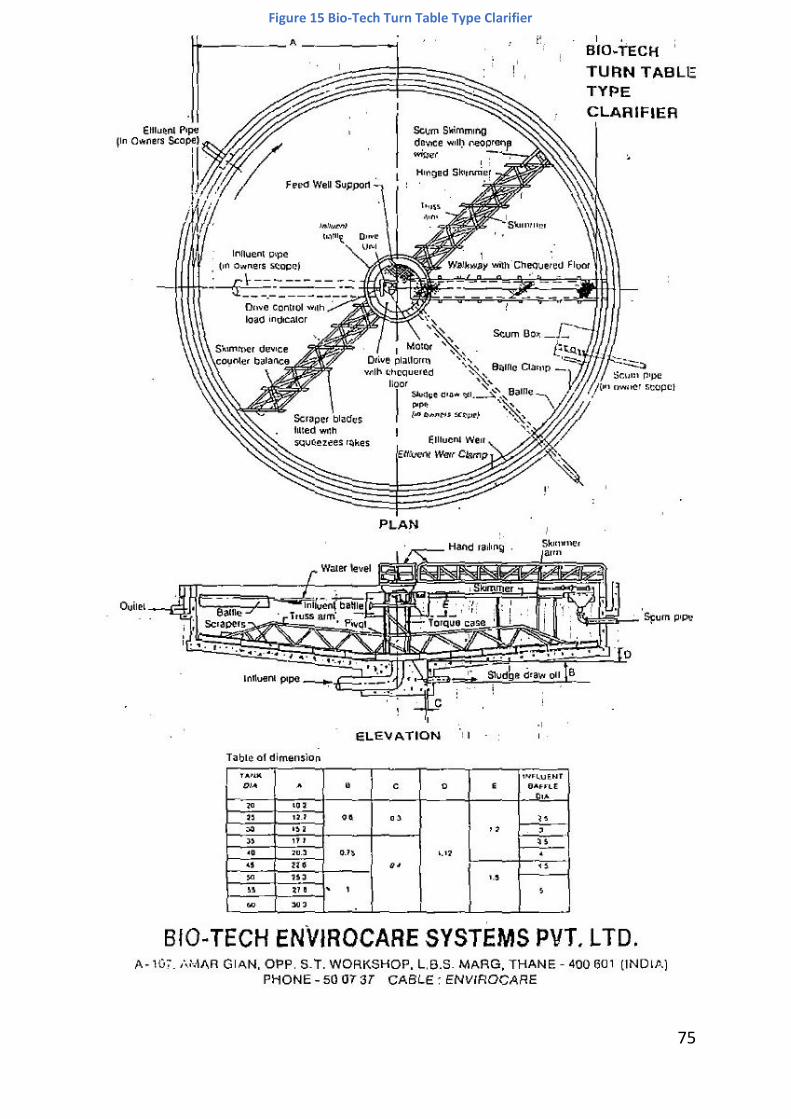
75
Figure 15 Bio-Tech Turn Table Type Clarifier
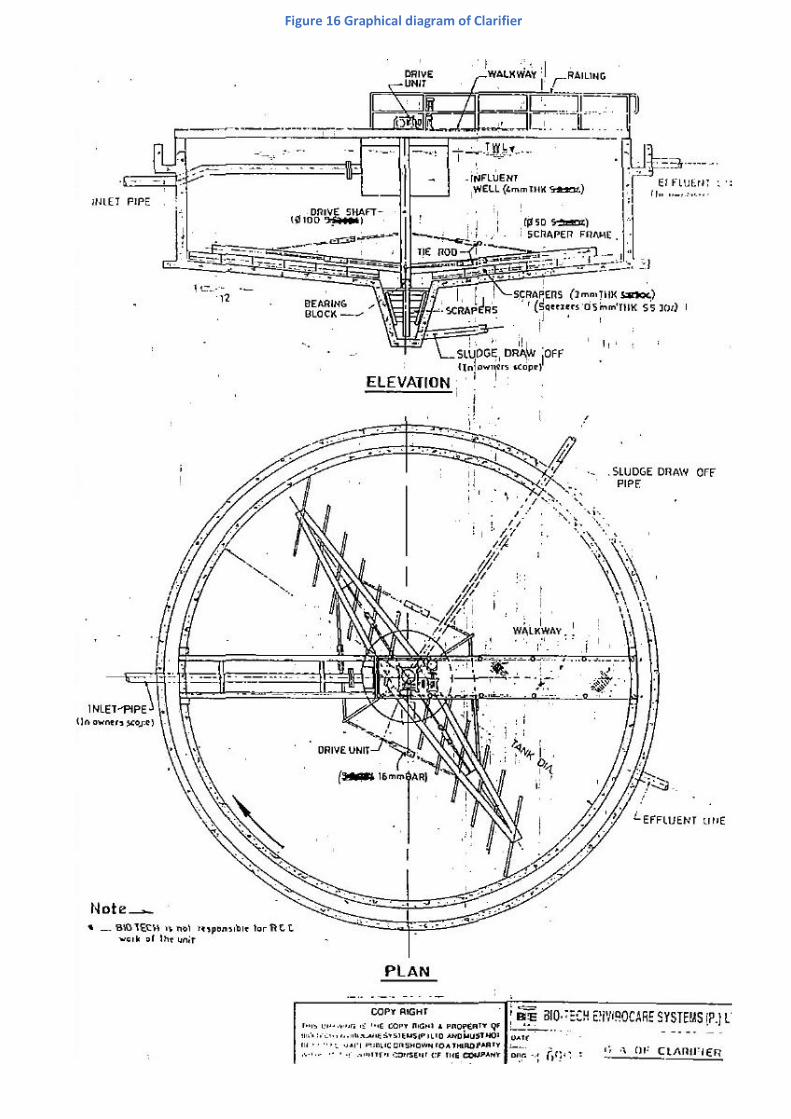
76
Figure 16 Graphical diagram of Clarifier
77
3.9 ACTIVATED SLUDGE/EXTENDED AERATION
3.9.1 Objectives To provide biological or secondary treatment to reduce dissolved and colloidal
organic matter from the wastewater.
3.9.2 Types 1. Conventional, with separate sludge digestion. 2. Extended aeration (with no sludge digestion)
3.9.3 Some Definition Complete-mixing; plug-flow; Aeration time; recycle ratio; throughput, organic loading; hydraulic loading:
age; Food/micro-organisms ratio; MLSS; MLVSS; Nutrients. Surplus sludge.
3.9.4 Typical Data/Drawings Types of aeration, settling and recycle arrangements, Aeration systems: mechanical and pneumatic; Surplus sludge dewatering and disposal.
3.9.4 Performance Criteria Visual inspection Microscopic examination of mixed liquor Sludge Volume Index Sampling of influent/effluent Power Consumed
3.9.6 What can go wrong? 3.9.7 Corrosion/Structural Deterioration
Corrosion of exposed steel parts Repairs to concrete work
3.9.8 Safety Aspects. Railings, ladders Electrical work
3.9.9 Electrical-Mechanical Work/Switchgear 3.9.10 Start up and Shut down Aspects 3.9.11 Simple Arithmetical Calculation
Oxygenation rate Detention, recycle Power consumed Surplus sludge estimation
78
3.9.9 Mechanical Work and maintenance
3.9.9.1 AERATOR
Start-up instructions
1. Before commissioning the plant, remove all foreign items such as nuts, bolts, rods etc from the tanks, pipelines and any other operating equipment.
2. Turn by hand the aerator mechanism and make sure that all drives run freely and are not stuck. If any drives do not rotate freely, determine the cause and remove it.
3. Start effluent flow into aeration tank and allow liquid level to build up to the recommended submergence level.
4. Start the aerator 5. It is desirable to take current readings occasionally to check that the
power drawn by the aerator mechanism is not excessive.
3.9.9.2 CAUTION
1. Ensure that liquid entering aeration tank has almost neutral pH value and is not acidic or corrosive.
2. Since motor is out if IP55 enclosure the shaft will be initially tight run it on no load for atleast 24 hours to make shaft free, otherwise motor will be overheated.
3. It is highly recommended to provide shed/canopy for gear box and
motor.
3.9.9.3 SURFACE AERATOR
Daily Checking
a. Check oil circulation through pump and its temperature. b. Check the vibration and also unusual sound in the gear box.
3.9.9.4 Oil Change and Cleaning
The first oil change after about 200 working hours; drain the oil soon after
stopping the gear unit while oil is still warm.
Subsequent oil change must be made after every 1500-5000 operating hours
depending on working condition. The oil change intervals should however, not
exceed 18 months.
It is recommended that while changing the oil, gear unit should be refilled with
the previously used grade of oil. Different grades of oil or oils obtained from
different manufactured must not be mixed.
79
Maximum permissible oil temperature and bearing temperature is 930 C when
using specific lubricant.
3.9.9.5 It is very essential that spare pans necessary should be ordered well in time to
minimize the stoppage time.
3.9.9.6 Weekly/Monthly/Yearly Check up
1. Whenever possible, examine gears and all wearing parts periodically to determine whether excessive wear is taking place.
2. Test the over load alarm atleast once a week to make sure that the mechanism is protected.
3. If the power is shut off, or if the mechanism is support for any reason for longer than an hour, by pass the flow until machine is again started.
4. The entire mechanism above and below the water line should be painted once in every year.
5. Keep the machine and surroundings clean and touch up all rust spots
with paint.
3.9.9.7 Lubrication
a. Electric motors, or speed reducers should be lubricated according to instruction of the manufacturers.
b. The worm gear and ball bearings are lubricated by oil bath, using SAE 140 oil or equivalent for temperature between 40° F and 130° F. Remove the worm cover and pour oil in slowly until it starts to run out of the elbow at the side of the housing. Be sure the elbow is turned down. Allow the unit to run for a short period, and then rest for an equal period enabling the oil to reach all voids. Add oil if necessary to bring to correct level.
c. The work shaft bearings are lubricated through alemite fittings, using good grade cup grease.
d. The roller chain in the chain guard can be lubricated through inspection
opening using a good grade of cup grease. Recommended lubricant # 2
cup grease.
3.9.9.8 Warning
If foreign objects such as, tools iron pieces etc, are dropped in to the clarifier,
the mechanism should be stopped immediately and not started again until
such objects are removed.
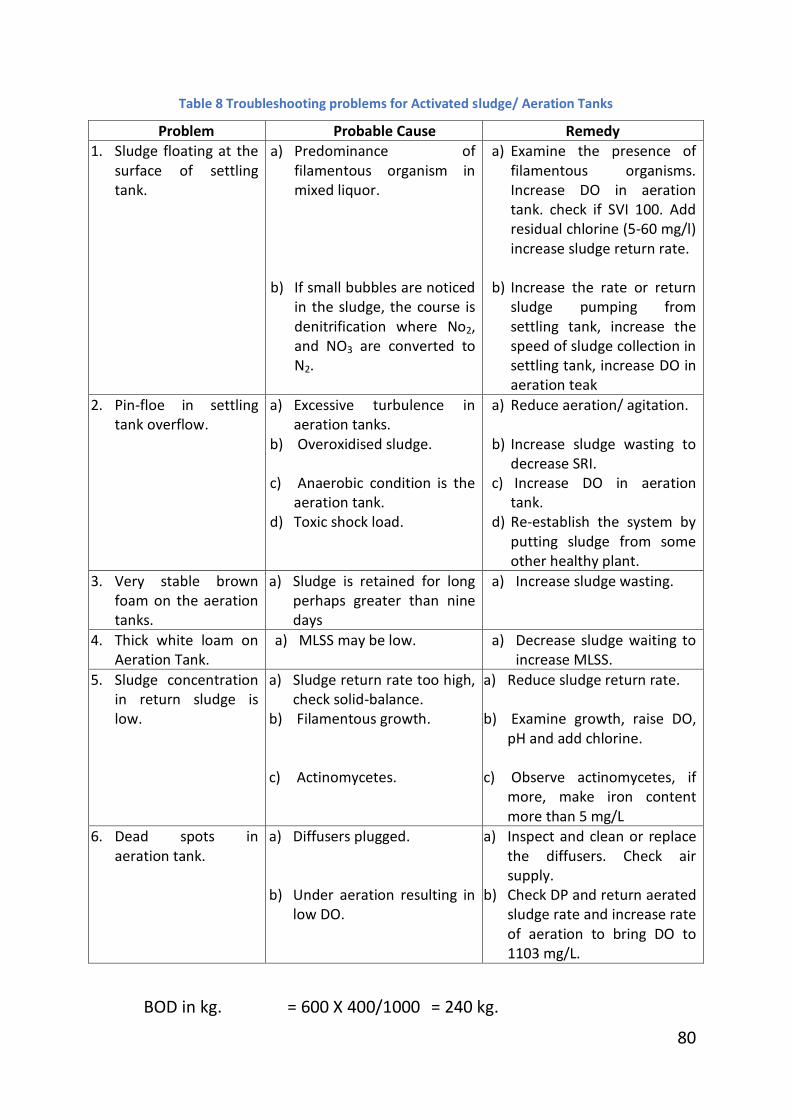
80
Table 8 Troubleshooting problems for Activated sludge/ Aeration Tanks
Problem Probable Cause Remedy 1. Sludge floating at the
surface of settling tank.
a) Predominance of filamentous organism in mixed liquor.
b) If small bubbles are noticed
in the sludge, the course is denitrification where No2, and NO3 are converted to N2.
a) Examine the presence of filamentous organisms. Increase DO in aeration tank. check if SVI 100. Add residual chlorine (5-60 mg/l) increase sludge return rate.
b) Increase the rate or return
sludge pumping from settling tank, increase the speed of sludge collection in settling tank, increase DO in aeration teak
2. Pin-floe in settling tank overflow.
a) Excessive turbulence in aeration tanks.
b) Overoxidised sludge.
c) Anaerobic condition is the aeration tank.
d) Toxic shock load.
a) Reduce aeration/ agitation.
b) Increase sludge wasting to decrease SRI.
c) Increase DO in aeration tank.
d) Re-establish the system by putting sludge from some other healthy plant.
3. Very stable brown foam on the aeration tanks.
a) Sludge is retained for long perhaps greater than nine days
a) Increase sludge wasting.
4. Thick white loam on Aeration Tank.
a) MLSS may be low. a) Decrease sludge waiting to increase MLSS.
5. Sludge concentration in return sludge is low.
a) Sludge return rate too high, check solid-balance.
b) Filamentous growth.
c) Actinomycetes.
a) Reduce sludge return rate.
b) Examine growth, raise DO, pH and add chlorine.
c) Observe actinomycetes, if more, make iron content more than 5 mg/L
6. Dead spots in aeration tank.
a) Diffusers plugged.
b) Under aeration resulting in low DO.
a) Inspect and clean or replace the diffusers. Check air supply.
b) Check DP and return aerated sludge rate and increase rate of aeration to bring DO to 1103 mg/L.
BOD in kg. = 600 X 400/1000 = 240 kg.
81
For a BOD:N:P ration of 100:20:1, the weights of nitrogen and
phosphorous to be added per day will be
240 X 20/100 = 48 kg of nitrogen
And 240 X 1/100 = 2.4 kg of phosphorous.
Urea has a formula CO(NH3)2 and molecular weight of 12+ 16 + 2 (14 + 2) = 60,
i.e. 60 gm. of 100% pure urea will have 2 x 14 = 28 gm of nitrogen.
Diammonium phosphate (DAP) has a formula (NH4)2HPO4, and molecular
weight of 2(14 + 4) + 31 + (4 x 16) = 131, i.e. 131 gm of 100% pure DAP will
have 28 gm of nitrogen and 31 gm of phosphorus.
The nitrogen requirement in the present case can be met by using
48 x 28/60 = 22.4 kg of 100% pure urea
The phosphorus requirement can be met by using
2,4 x 31/131 = 0.57 kg. of DAP.
Here the nitrogen available from DAP is ignored. The above requirements will
be corrected for purity of the commercially available urea and DAP.
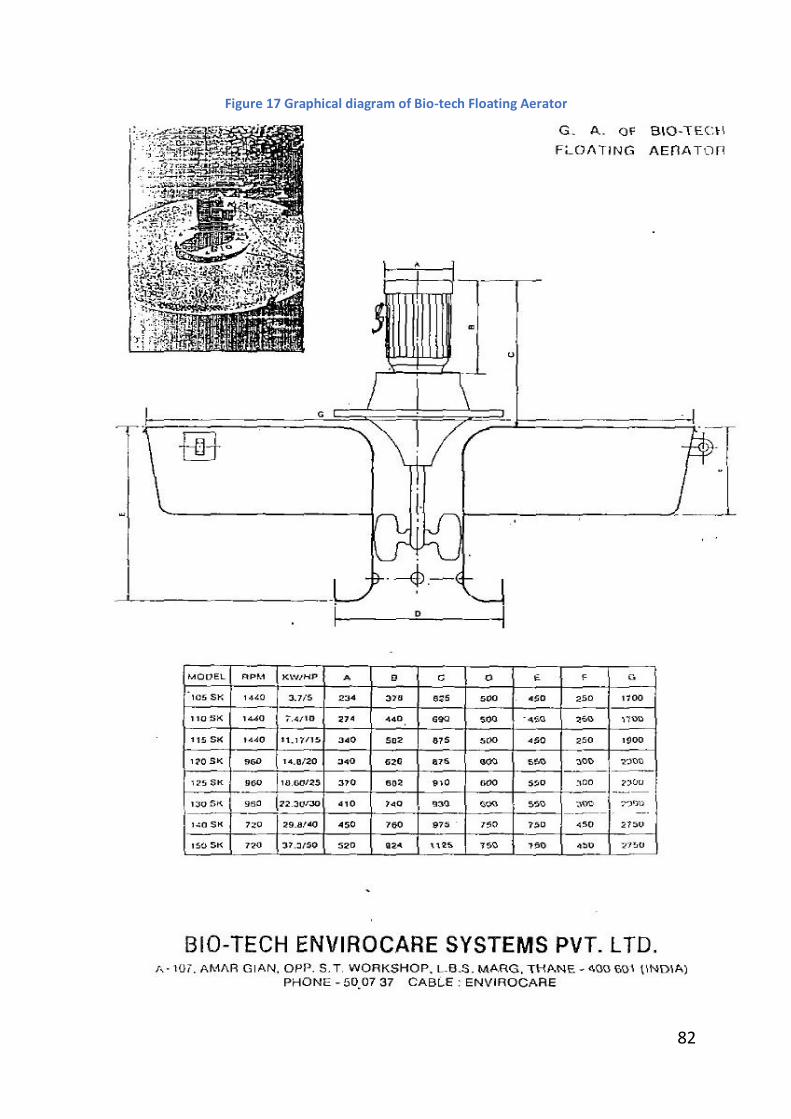
82
Figure 17 Graphical diagram of Bio-tech Floating Aerator
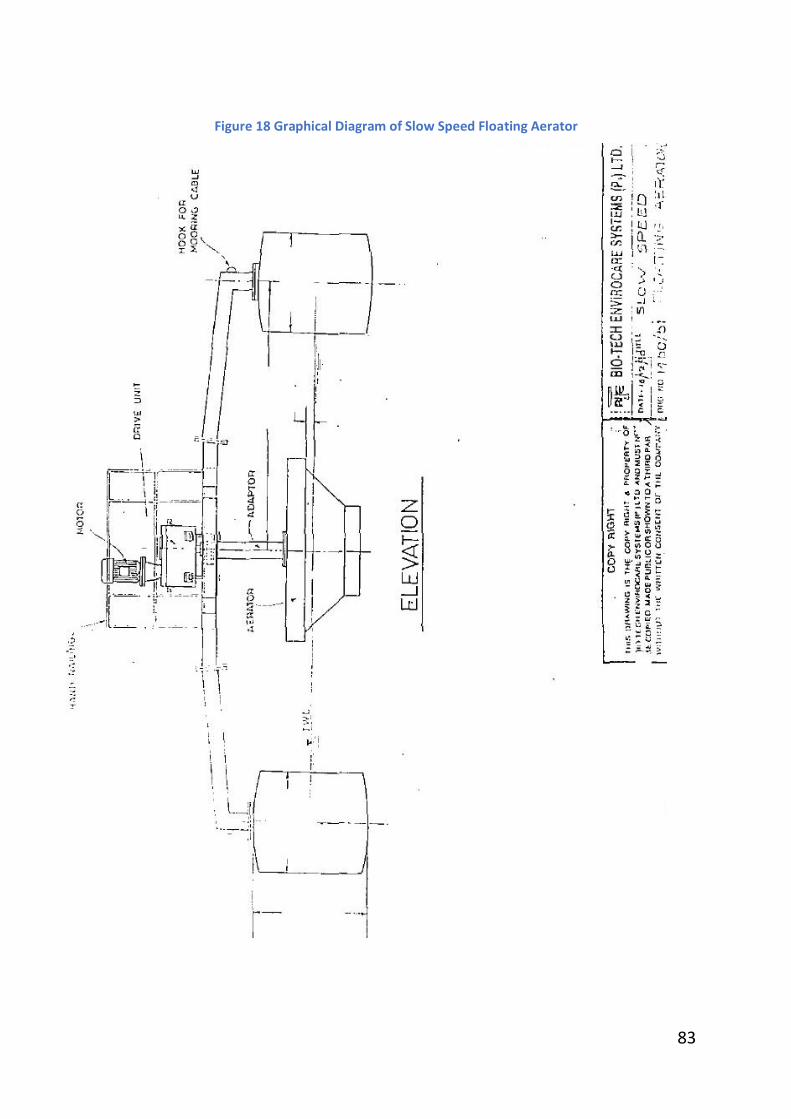
83
Figure 18 Graphical Diagram of Slow Speed Floating Aerator
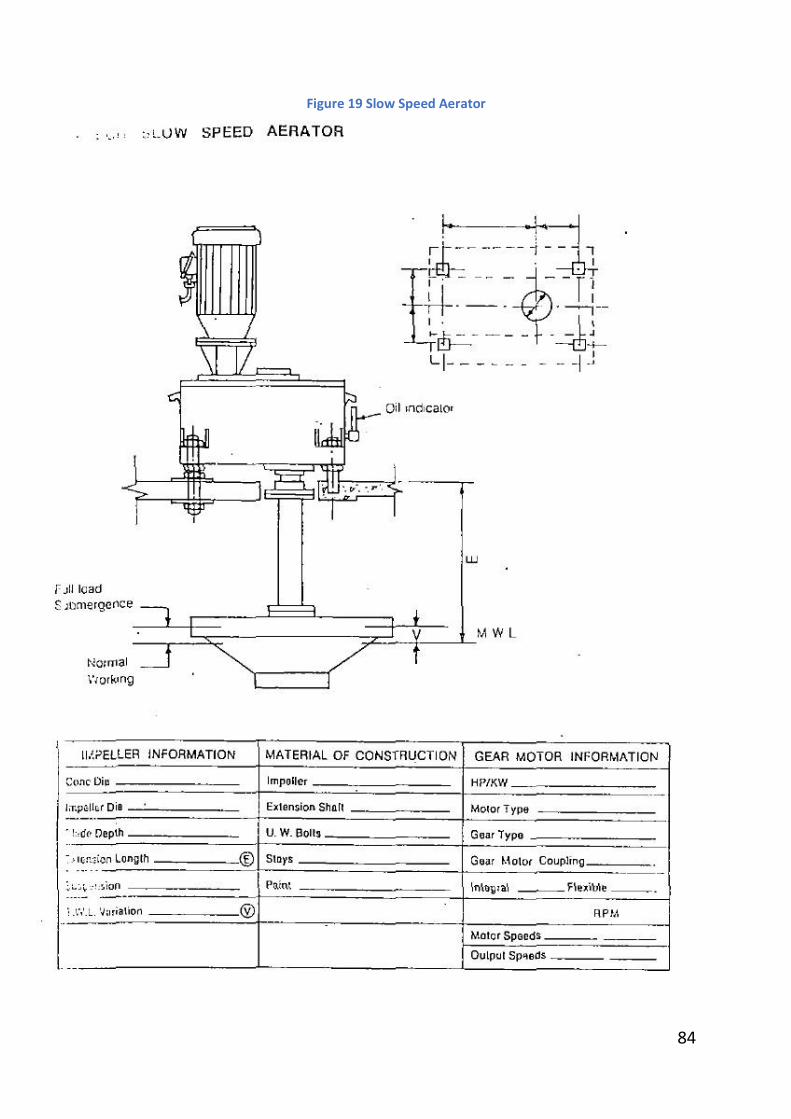
84
Figure 19 Slow Speed Aerator
85
3.9.11 Examples Lab results and flow rate for an activated sludge plant are listed below under
the known column. Information helpful to the operator in controlling the
process is listed in the unknown column. The aerator or aeration tank volume
is 2,000 cu m.
Known
Mixed Liquor Suspended Solids (MLSS) = 1,800 mg/L
Mixed Liquor Volatile Content = 76%
Thirty Minute Settleable Solids Test = 170 mL/L, or 17%
Primary Effluent BOD (P.E.BOD) = 140 mg/L
Primary Effluent Suspended Solids = 110 mg/L.
Flow Rate = 8,000 cu m/day
Unknown
Sludge Volume Index, SVI
Kilograms of Solids in the Aerator
Kilograms of BOD Applied per Day to Aeration tank
Sludge Age, days
SLUDGE VOLUME INDEX
SVI = Set Sol, mL/L (1,000)
MLSS, mg/L
= 170 (1,000)
1,800
= 94
KILOGRAMS OF SOLIDS IN AERATOR
Aerator Solids = MLSS mg/L (Tank Vol. cu. m)
1000
= 1,800mg/L (2,000 cu. m)
1000
= 3,600 kg
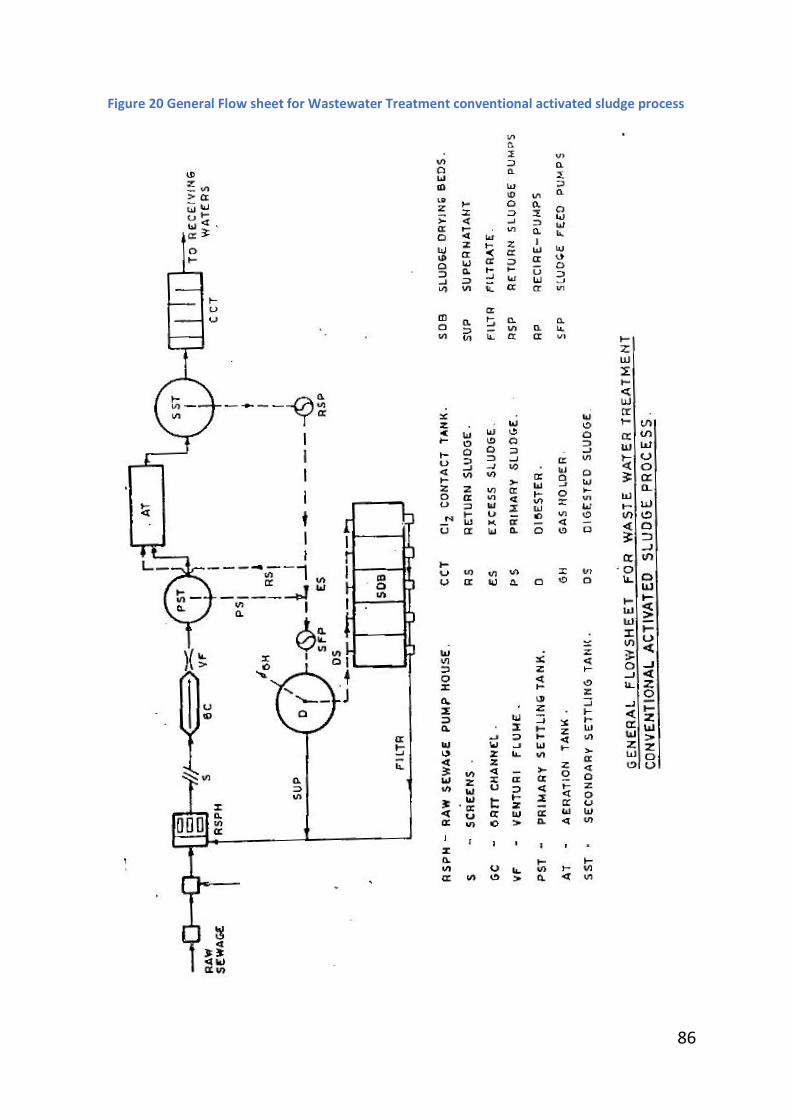
86
Figure 20 General Flow sheet for Wastewater Treatment conventional activated sludge process
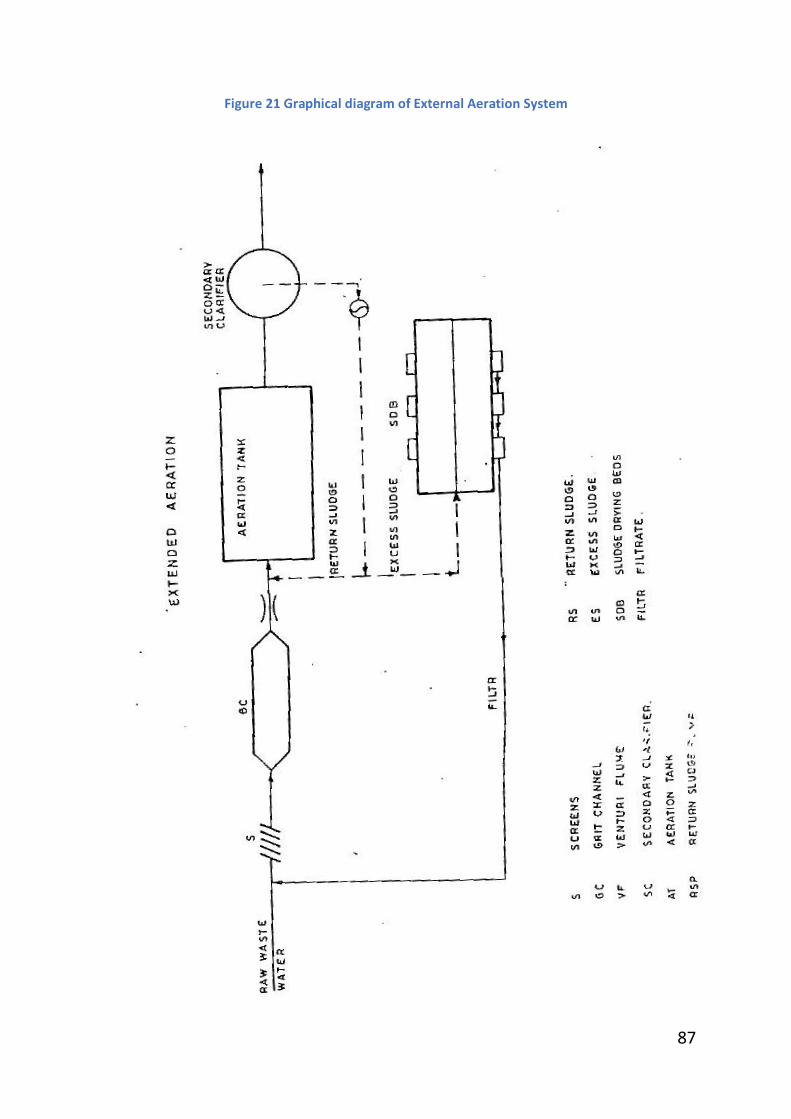
87
Figure 21 Graphical diagram of External Aeration System
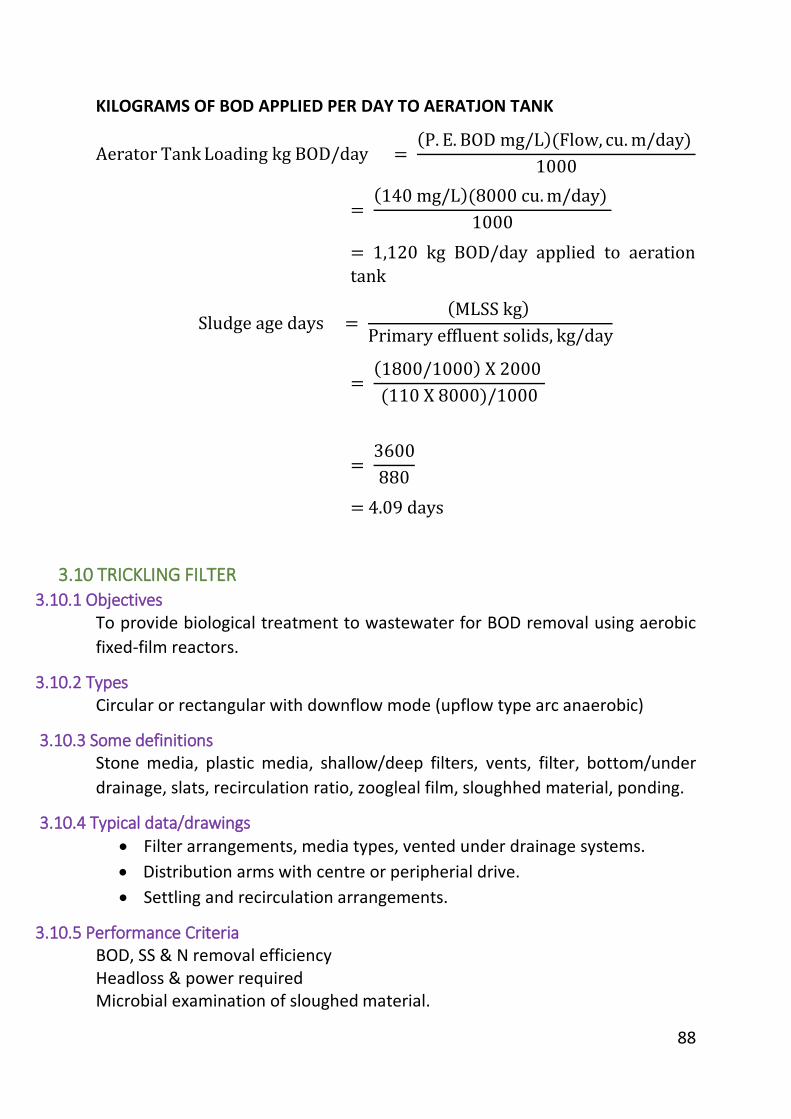
88
KILOGRAMS OF BOD APPLIED PER DAY TO AERATJON TANK
Aerator Tank Loading kg BOD/day = P. E. BOD mg/L (Flow, cu. m/day)
1000
= 140 mg/L (8000 cu. m/day)
1000
= 1,120 kg BOD/day applied to aeration
tank
Sludge age days = MLSS kg
Primary effluent solids, kg/day
= 1800/1000 X 2000
(110 X 8000)/1000
= 3600
880
= 4.09 days
3.10 TRICKLING FILTER 3.10.1 Objectives
To provide biological treatment to wastewater for BOD removal using aerobic
fixed-film reactors.
3.10.2 Types Circular or rectangular with downflow mode (upflow type arc anaerobic)
3.10.3 Some definitions Stone media, plastic media, shallow/deep filters, vents, filter, bottom/under
drainage, slats, recirculation ratio, zoogleal film, sloughhed material, ponding.
3.10.4 Typical data/drawings
Filter arrangements, media types, vented under drainage systems.
Distribution arms with centre or peripherial drive.
Settling and recirculation arrangements.
3.10.5 Performance Criteria BOD, SS & N removal efficiency Headloss & power required Microbial examination of sloughed material.
89
3.10.6 What can go wrong? Chockage, ponding, fly nuisance, Poor efficiency of BOD removal Tilting or stoppage of arms/loss of seal
3.10.7 Corrosion/structural deterioration Media deterioration and loss Steel arm supports corrosion.
3.10.8 Safety Aspects Relatively minor
3.10.9 Electrical-mechanical aspects Maintenance of distributing arm seat Recirculation pumps
3.10.10 Start-up and shut-down aspects 3.10.11 Simple Arithmetical calculations
Recirculation ratio Organic load Hydraulic load
3.10.6 Operational Problems Even though the trickling filter process is considered to be one of the most
trouble-free types of secondary treatment, the potential for operating
problems still exists. Troubleshooting a trickling filter treatment facility
involves basically three steps:
1. Locate the problem,
2. Identify the cause of the problem,
3. Apply the proper corrective measures.
When troubleshooting, the operator should examine the following:
1. The treatment plant's operation and maintenance manual; 2. The design and operating flexibility of the treatment facility; 3. The daily operating records and log book; 4. The current operating procedures; and, 5. The possibility of upset caused by acids, alkali, oil, or other toxic
materials from industrial sources.
Common operating problems and their possible corrective measures are
discussed in the following paragraphs.
90
Filter Ponding
Causes. Filter ponding may be caused by:
1. Rock or other media are too small or not sufficiently uniform in size. 2. Rock medium breaks up, because of extremes in temperatures,
producing fines that clog the voids. 3. Primary treatment units are operated improperly, resulting in
excessive SS in the influent to the filter. 4. Excessive sloughing takes place, clogging the voids between the
medium. 5. Organic loading on the filter is excessive for the liquid loading.
Prevention and cure
1. Rake or fork the rocks on the filter surface. Heavy equipment should not be allowed on the filter.
2. Wash dm filter surface with a stream of water under high pressure. 3. Stop the distributor over the ponded area and allow a continuous flow
of wastewater to wash the growths out of the filter. 4. Dose the filter with heavy applications of chlorine (5 mg/L) free
chlorine in filter influent) for periods of several hours at weekly intervals. This should be done during periods of low flow (possibly at night) to minimize the chlorine requirement. Chlorine is particularly effective for control of fungus growths, with doses as low as 1 mg/l.
5. Take the filter out of service for a period of one day or longer to allow it to dry out. This should be done only if there is adequate provision for treating the waste in other units.
6. Flood the filter and allow it to stand for at least 24 h. This is applicable only to filters with water-tight walls and provisions fur sealing underdrains.
7. Replace the filter medium if all other methods fail. It may cost less to
replace an old medium with a new than to clean the old one.
Filter Flies
Causes. The filter fly (psychoda) is a nuisance frequently associated with the
filter operation. The fly (moth) passes through ordinary window screens and
gets into the eyes, ears, mouth, and nostrils of anyone coming within its flight
range. Its natural flight range is only a few hundred feet, but it can be carried
much farther by the wind. Filter flies develop most frequently in an alternately
wet and dry environment.
91
Prevention and Cure
1. Dose filter continuously, not intermittently.
2. Remove excessive biological growths by methods similar to those
used to reduce ponding.
3. Flood the filter for 24 h at weekly or biweekly intervals. To be
continually effective, the filter must be flooded at intervals frequent
enough to prevent the fly from completing its life cycle between
floodings.
4. Wash vigorously the inside of the exposed filter walls (Figure 3). This
sometimes can be accomplished by adjusting or modifying the ends of
the distributor arms to provide wastewater for splashing on the wall.
If the walls are kept wet, flies cannot survive.
5. Maintain the whole plant and the filter itself so as not to provide
sanctuaries for flies.
6. Chlorinate the wastewater to produce a chlorine residual of 0.5 to 1
mg/I at intervals frequent enough to prevent the fly from completing
its life cycle between chlorine additions (1- to 2-wk intervals).
7. Apply insecticide. An insecticide applied to the filter surface and walls
will kill the adult flies that come in contact with it. If applied at
intervals of 4 to 6 wk, the flies usually are controlled. The effects of an
insecticide on the receiving waters should be considered before
application.
Odours
Cause. The trickling filter is basically a aerobic process; therefore, no serious
odour problem should exist. The presence of "rotten egg" odour is an
indication of anaerobic condition.
Prevention and Cure
1. Maintain aerobic conditions in all units, including settling tanks and
wastewater system.
2. Reduce accumulations of sludge and biological growths.
3. Chlorinate filter influent for short periods, preferably when flow to
plant is low.
4. Recirculate to filters.
5. Practice good housekeeping throughout the plant.
6. Clean underdrain system of all stoppages.
92
7. Clean all filter vents.
8. Increase ventilation by forcing air into filter drain system.
9. Reduce unusually heavy organic loadings (such as milk processing or
canning wastes) that produce heavy accumulations of solids in filter
or cause ponding.
10. Cover filter and deodorize the off gases (usually beyond operator
control and will require major cost for improvement).
Clogging of Distributor-Arm Orifices
Causes. Non-uniform flow of wastewater over the filter medium may cause
plugging, thus reducing the area to which the wastewater is applied and,
therefore, the filter's efficiency. In severe cases in which a large number of the
distributor-arm orifices are clogged, excessive pressure can be generated in
the distributor and cause the seal to blow.
Prevention and Cure
1. Clean all orifices and flush the distributor piping occasionally.
2. Improve grease and SS removal in the primary settling tank.
3. Maintain adequate hydraulic load on filter.
4. Lubricate the distributor according to the manufacturer's
instructions:
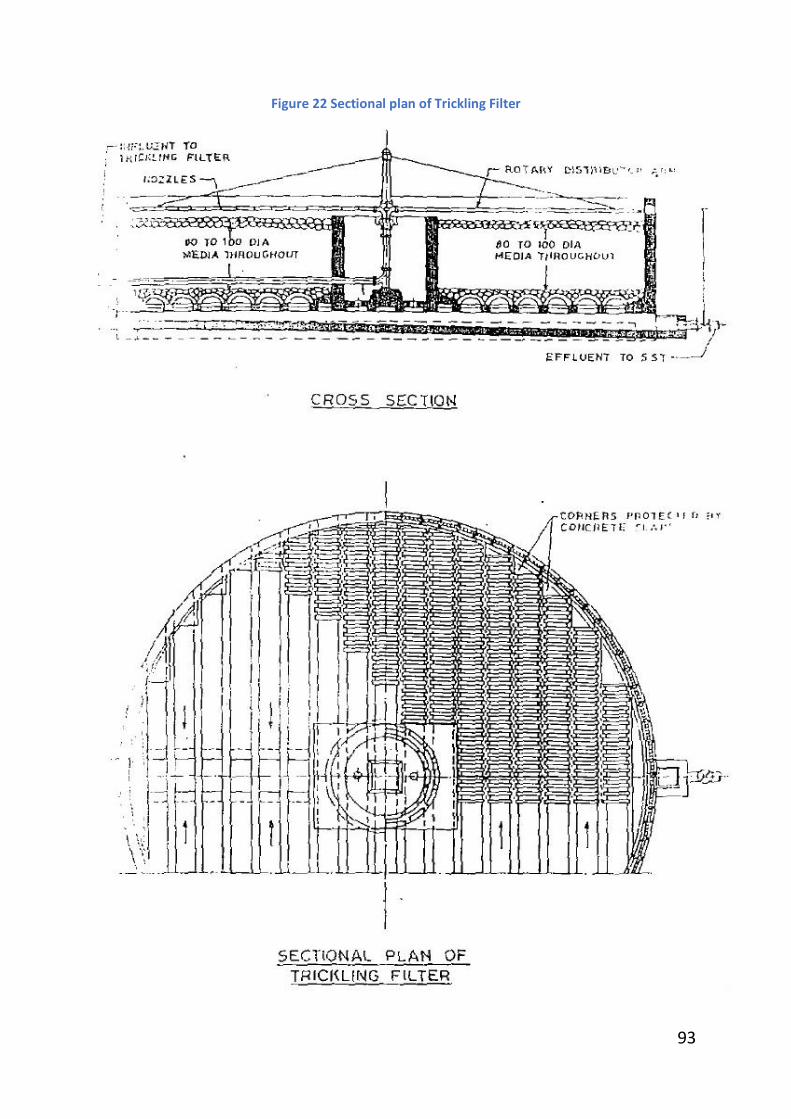
93
Figure 22 Sectional plan of Trickling Filter
94
3.10.11 Examples Trickling Filters
A flow of 4,300 cu.m/day is applied to a 15 meter diameter trickling litter
which is 1.2 meters deep. The BOD of the wastewater applied to the filter is
120 mg/L. Calculate the hydraulic and organic loadings as the filter.
Known Unknown
Flow = 4,300 cu m/day Hydraulic Loading, cu.m/day/sq m
Diameter = 15 m Organic Loading, Kg BOD/day/cu.m
Depth = 1.2 m
BOD = 120 mg/L
HYDRAULIC LOADING
Hydraulic Loading, = Flow, cu. m/day cu.m/day/sq m Surface Area, sq m
Surface Area, sq m = 0.785 (Diameter, m)2
= 0.785(15 m) 2
= 176.7 sq m
Hydraulic Loading = Flow, cu. m/day cu.m/day/sq m Surface Area, sq m
= 4,300 cu m/day 176.7 sq m
= 24.3 cu m/day/sq m
ORGANIC LOADING
Organic Loading, = BOD Applied, kg/day kg, BOD/day/cu m Volume of media, cu m
BOD Applied = (BOD, mg/L) (Flow, cu m/day) (1,000 L) (1 kg) (1 cu m) (1,000,000 mg)
95
= (120, mg/L) (4,300 cu m/day) (1,000 L) (1 kg) (1 cu m) (1,000,000 mg)
= 516 kg BOD/day
Volume of Media, = (Surface Area, sq m)(Depth, m) Cu m = (176.7 sq m)(I.2 m)
= (212.04 cu m)
Organic Loading, = BOD Applied, kg/day
kg BOD/day/cu m Volume of Media, cu m
= 516 kg BOD/day 212.04 cu m
= 2.43 kg BOD/day cu m
The influent BOD to a trickling filter plant is 200 mg/L and the effluent BOD is
20 mg/L. What is the BOD removal efficiency of the plant?
Known Unknown
Influent BOD = 200 mg/L Plant Efficiency, %
Effluent BOD = 20 mg/L
Efficiency, % = (In -Out) 100 % In
= (200 mg/L – 20 mg/L) 100 % 200 mg/L
= 180 mg/L (100 %) 200 mg/L
= 90 %
96
3.11 AERATAED LAGOONS
3.11.1 Objectives To provide biological treatment to wastewater (along with some incidental
settlement and equalisation).
3.11.2 Types 1. Facultative 2. Fully aerobic
3.11.3 Some Definitions Detention time; free board; organic loading per unit area/volume; aerators
(high speed, low-speed, floating and fixed).
3.11.4 Typical Data/Drawing Aerators and their mountings. Inlets with screens and flow measurement
arrangements; intermediate connections between lagoons; overflow weirs and
outlets.
Earthwork/embankment slopes and protection.
3.11.5 Performance Criteria BOD removal efficiency, Effluent S.S. , Sampling and testing
3.11.6 What Can Go Wrong? Aeration systems (motors, switchgear)
Levels of aerators vis-a-vis outlet weir levels
Undue vegetational growths
3.11.7 Corrosion/Structural Deterioration Corrosion/damage to aerator trestles, Embankment slopes dislodge
3.11.8 Safety Aspects Electrical work
3.11.9 Electrical-Mechanical Aspects/Switchgear Long length of cabling , Motor starters placement
3.11.10 Start-up and Shut-down Aspects Gradual build-up of level in lagoon. Leakage loss.
Dewatering for periodic sludge withdrawal.
3.11.11 Simple Arithmetical Calculations Head-discharge relationships for weirs
Flow and detention time averages.
97
Figure 23 Mechanically Aerated Facultative Lagoon
Figure 24 Mechanically Aerated Flow Through Lagoon
98
Figure 26 An extended Aeration Lagoon with a Settling Compartment within the Lagoon
Figure 25 An extended Aeration Lagoon with separate settling and sludge recirculation
99
Figure 27 An extended Aeration Lagoon with Two Cells for Intermittent Operation
100
Figure 28 Different types of Pasveer Oxidation Ditches
101
3.11.6 OPEERATIONAL. PROBLEMS
Operating troubles can be classified as:
1) Performance related 2) Environmental nuisance 3) Hazardous conditions to structures or to personnel.
Performance Related Operating Problems:
1. Overloading 2. Toxic materials in effluent 3. Nutrient deficient industrial waste 4. Short circuiting 5. Loss of liquid volume because of sludge 'deposition, leakage, or
evaporation. 6. Aeration equipment and malfunctioning 7. Mixing/agitation equipment malfunctioning 8. Blockage of light by excess of plant growth on dikes.
Environmental nuisances :
These may be caused by:
1. Odours caused by anaerobic conditions in the bulk liquid scum or sludge deposits.
2. Foaming and spray from the agitation caused by aerators. 3. Insect generation; and 4. Groundwater contamination caused by leakage through bottom or
sides.
Hazardous conditions :
Hazardous conditions may be caused by:
1. Bank or dike erosion caused by wave action on the interior surface or by the flow of an adjacent stream against the exterior surface;
2. Root growths of woody plants and trees that furnish pathways fot
leakage.
Some Solutions to Operating Problems
Overloading
Overloading is a design problem largely beyond the operator's control.
However, certain operation-oriented measures may mitigate the organic
102
overloading on a short-term basis. One of these is the addition of an oxygen
source in the form of sodium nitrate in quantities of 5 to 15 percent (by
weight) of influent BOD. The nitrate should be spread evenly throughout the
lagoon by broadcasting it from the edges of the pond and, for very large ponds,
by using a boat to reach the central areas of the pond. The chcmical also may
be added in the inlet manhole or wet well.
Another possibility is the installation and part-time use of aeration equipment.
It should be realised, however, that each time the aerator is re-started after an
extended shutdown, much of the bottom sludge will be agitated and
resuspended. Because this sludge is likely to be anaerobic, a considerable
odour problem will occur; however, this is a short-term problem. When the
pond operation restabilizes after 2 or 3 days, the odour will cease.
Toxic Materials
Toxic materials in the influent ordinarily are not a problem that can be solved
at the lagoon. industrial wastes, especially heavy and transition metals, are
likely to be responsible for toxic effects, and these wastes are best controlled
at the source.
Nutrient Deficiencies
Nutrient-deficient industrial wastes, may be deficient either in nitrogen or
phosphorous or both. Laboratory analysis will show whether these Iwo
nutrients are present in adequate amounts to support normal biological
growth. Bulk chemicals may be purchased and added to make up any
deficiencies.
Short-Circuiting
Short-circuiting (flow-through of the wastewater with insufficient detention
time) also is largely a design problem. Minor revisions in piping arrangements
frequently can cure this situation.
Loss of Volume
Loss of volume caused by sludge deposits will impair performance. The sludge
must be removed for more efficient operation.
Inability to maintain liquid levels because of excess percolation, evaporation,
or overdesign of the lagoon may be alleviated on a short-term basis by
diverting land drainage or stream flow into the lagoon.
103
Aerator Performance
In lagoons designed on the basis of artificial aeration, performance will suffer
when the units are malfunctioning or inoperative. Equipment maintenance
and repair also must be given attention.
Odours
Odours may occur when there are anaerobic conditions in the bulk liquid,
sludge layers, or scum. The cure for anaerobic conditions in an aerobic pond
already has been discussed previously under "Overloading". Repeated
attempts to break up the sludge mat may be necessary because the mat may
tend to reform.
Odours also may occur in nominally aerobic or facultative lagoons in
connection with algal "blooms", that is, sudden and extreme algal growth.
These blooms commonly consist-of blue-green algae. These algae normally
emit a certain amount of odour. The dead algae furnish an extremely large and
sudden BOD load to the lagoon, frequently making an aerobic lagoon go
anaerobic and causing odour problems. The bloom may be halted chemically
by the use of copper sulfate or certain herbicides.
Foaming and Spray
Foaming and spray in aerated lagoons usually are problems only in very windy
weather when the foam of aerosol droplets may be carried far beyond the
treatment plant boundaries. Ordinarily, the odour control buffer zone around
the lagoon is wide enough to prevent foam and spray front reaching
residences.
Insect Generation
Insects common to wastewater treatment lagoons include mosquitoes, and
beetles. Mosquitoes are vectors for malaria, encephalitis, and other diseases.
Insect generation occurs in sheltered areas or quiescent portions of the lagoon
where there may be substantial growth of rooted plants or layers of scum. The
basic measure for insect control, then, is adequate control of weeds and scum.
Insecticides also may be used for specific cases. Insecticide application usually
will be more effective if the lagoon is isolated from the system, for example, by
stopping inflow and effluent for I or 2 days subsequent to the application. The
prolonged contact period will lessen the dose required for equal effect and
also lessen any impact on the receiving waters.
104
Ground Water Contamination
While groundwater contamination and lagoon seepage are matters Of
Concern, inability to maintain adequate levels in the lagoon usually is
considered to be more of a problem. When excessive leakage does occur,
lagoon soil interstices may be plugged with bentonite clay applied in the
lagoon water. It is unwise to depend on wastewater solids to seal a leaky
lagoon. Leakage through the dikes also may occur as the result of penetration
by plant roots.
Dike Erosion
Erosion problems primarily are the result of neglect of proper monitoring and
maintenance. The maintenance of proper grass cover and rip rap not only will
prevent erosion but discourage the presence of wildlife by denying them
protective cover.
3.12 SLUDGE DIGESTION AND DEWATERING
3.12.1. Objective: (1) To destroy organic settleable solids from a wastewater so that their
oxygen demand is reduced and smell and fly nuisance are avoided. (2) To reduce the volume of these solids. (3) To obtain by-products in the form of (a) sludge gas (in the case of
anaerobic digestion) and (b) digested sludge which is useful as soil conditioner.
(4) To destroy pathogenic organisms present in the sludge.
3.12.2. Types of Digestion and Digestion Tanks
(1) Aerobic or
(2) Anaerobic - which may be done under mesophilic or thermophilic
conditions of temperature.
Since anaerobic mesophilic digestion is most commonly used, it is
discussed in detail in the following pages.
An anaerobic digester is constructed in R.C.C. or masonry and consists of
a covered tank with either a fixed rood of R.C.C. or a floating roof of mild
steel which also acts as a gas holder. The fixed roof digester has a
separate gas holder. The fixed roof is usually dome-shaped and is also
constructed in R.C.C. Depending on the size of the digester, one or more
screw pumps with draft tubes are provided to mix the tank contents and
105
to break the scum that forms on the surface of the digesting sludge. The
floating roof digester is also provided with a screw pump and a draft
tube located in the centre of the floating roof. The floors of digesters
are sloped towards the centre.
3.12.3 Some Definition Detention Time
The time period of which sludge is retained in the digestion tank.
Digestibility
The amenability of a wastewater to treatment by anaerobic means is found
out by experiments in the laboratory with a batch digestion unit. This is known
as determining digestibility of the wastewater.
Mesophilic Digestion
Digestion carried out in the temperature range of 27°C to 38°C.
Thermophilic Digestion
Digestion carried out in the temperature range of 43°C to 60°C.
Substrate:
Organic and inorganic matter in the wastewater which is used by micro-
organisms as a source of food.
Auaerobes:
Organisms which cannot survive in the presence of free oxygen.
Volatile Acids :
Organic acids formed during the first stage of anaerobic digestion which can be
separated from the digesting mass by steam distillation at atmospheric
pressure.
Alkalinity :
The capacity of water or wastewater to neutralise acids. This is due to the
presence of bicarbonates, carbonates and hydroxides in the water. Alkalinity is
a measure of how much acid must be added to a liquid to lower its pH value to
4.5.
pH Value :
106
It is an expression of the intensity of basic or acidic condition of a liquid and is
defined as the logarithm (to base 10) of the reciprocal of hydrogen ion
concentration.
Volatile Solids :
These are solids which are lost from a sample of solid, liquid or sludge when
heated in a muffle furnace at 600°C for 30 minutes.
Digester Gas:
A mixture of gases produced as a result of the anaerobic digestion of organic
matter. The main constituents of this gas are methane (C114), carbon dioxide
(CO,), hydrogen sulphide (H2S) etc. their percentage depending on the nature
of the organic matter undergoing digestion.
Supernatant:
It is the liquid between the sludge on the bottom and scum on the surface of
an anaerobic digester. This liquid is usually returned to the plant inlet.
Digested Sludge :
The mixture of water and stabilized suspended matter left in a digester at the
end of the• digestion period.
Sludee Dcving Beds :
These are covered or open, masonry or R.C.C. structures, shallow in depth,
filled with coarse sand and gravel and are provided with an open-jointed under
drainage system. They are used for dewatering and drying digested sludge
discharged from aerobic or anaerobic digester.
The process of anaerobic digestion takes place in two distinct steps (1) Acid
formation and (2) Methane formation. When organic matter is subjected in
anaerobic digestion, acid-forming micro-organisms use it as substrate and
break it down into simpler compounds. Among these compounds are volatile
acids, which are used in turn by methane forming micro-organisms. Digestion
is said to have taken place when methane formation occurs.
Since the entire process occurs in two distinct steps, the modern-day digester
is split into two tanks placed in series. The first tank receives raw sludge, i.e.
organic matter, where acid-formation takes place. The second tank receives
107
the acid-bearing effluent which is converted into digester gases and digested
sludge. This method of digestion is known as two-stage digestion.
3.12.4 Typical drawings Typical drawings of a conventional anaerobic digester, sludge drying beds, gas
holder, pressure and vacuum relief valves, moisture trap and flame trap arc
enclosed herewith.
3.12.5. Performance Criteria (a) Visual inspection
(i) Odour and appearance of digested sludge. The digested sludge
should have tarry odour and should generally appear black in
colour. Well-digested sludge flows easily and dries quickly.
(ii) Daily gas production should be steady.
(iii) The R.C.C. roof of the fixed roof digester should be frequently
inspected to check for the presence of black, wet, fine cracks
which allow leakage of gas.
(b) Analysis of digested sludge, raw sludge, supernatant and gas.
Tests to be conducted include - moisture content, volatile solids, pH.
alkalinity and volatile acids, percent methane and carbon dioxide in
the generated gas, burning characteristics of gas, fertiliser value of
digested sludge which includes determination of nitrogen,
phosphorous (as P2O4) and potassium (as K2), drying time.
3.12.6. What can go Wrong ? (i) Drop in gas generation inspite of no gas leakage.
- Drop in pH of Digested Sludge. - Drop in Alkalinity and increase in Volatile Acids in Digested Sludge.
- Failure of sludge mixing mechanism. - Heavy scum formation of tank surface.
All of these indicate failure of Digestion Process.
(ii) Loss of gas through R.C.C. roof cracks. (iii) Smell and fly nuisance on sludge drying beds due to malfunctioning
digestion process. (iv) Failure of digestion process due to overloading.
108
(v) Failure of process due to inadvertent discharge of large quantities of toxic matter in sewers.
(vi) Failure due to defective sludge mixing procedures followed and frequency and duration of mixing per day.
(vii) Insufficiency of nutrients in raw sludge fed to Digestion Tank.
3.12.7. Safety Aspects This pertains particularly to safety of persons working at ETP sites.
(a) For being able to carry out maintenance works as periodic
maintenance programme and also to carry out periodical inspection of
civil structures, ladders and stairs are required to be provided. The
same will have to be of design approved by the Factory's Inspector in
order to provide necessary safety to the operators. Similarly one
meter high railings are required at proper places under the Factories
Act. The steel ladders and railings need to be periodically painted. Not
only to extend their useful life, but also to prevent possible injuries
from corroded sections.
(b) Safety during desludging and cleaning of sludge tanks and digester.
This is the most important safety aspect as large numbers of people
have lost their lives during these operations earlier.
Before permitting person to enter these tanks, as first step tanks
should be desludged under hydrostatic head to the maximum extent.
Then after filling tank fully in the effluent and mixing, the tank should
be again desludged to maximum extent. This should be repeated till
the tank contents get considerably diluted. Then after removing
maximum lank contents under hydrostatic head, the remaining liquid
may be pumped out stirring it continuously.
At same stage, the persons are required to enter the tanks for
facilitating which the following steps have to be taken as safety -
measures:-
(1) To blow air into the tank to provide maximum ventilation and blow
out noxious gases continuously till the end of cleaning operations.
(2) The air in the tank should be tested for detecting presence of
inflammable gas and deficiency of oxygen using Daby's Safety Lamp.
109
3.12.8 Corrosion/Structural Deterioration (A) Corrosion of steel _Parts
(a) Submerged
This can be, considerably reduced by providing sacrificial Anodes
adopting Cathodic Protection System.
(b) Above Water Level
This type of corrosion can be mitigated by periodic painting with
acid proof paints.
(c) Intersurfce Corrosion
The corrosion at intersurface between air and water. This requires
special attention by drawing out Periodic Painting Programme,
where liquid level wilt have to be lowered.
(d) Underside of steel plates of steel floating roof above water level
These areas not being accessible unless the tank is put out of
commission require to be protected by giving it a thick layer of
epoxy paints before commissioning.
(B) Structural Deterioration
The R.C.C. roof of the Digester above water level being exposed to very
humid environment containing high CO, contents and percentage of
which depends on sulphates in influent is worst it and the RCC structure
corrodes and plaster peels out much faster unless this area is well
protected by providing it sealand coat covered with atleast 3 layers of
epoxy or plastic coats before commissioning the plant.
Deterioration of RCC roof forming fine cracks in the roof, resulting in loss
of gas can be remedied by injecting chemicals under pressure even while
the digester is operating. The air should also be tested for H,S contents.
This testing of air in the tank should be repeated till the end of
operations as there is always a possibility of release of trapped gases.
The persons entering the tanks should be provided with safety belt, and
strong ropes. The operations being carried out in the tank should be
closely watched from observation window, to facilitate which and to
carry out the work, the inside of the tank should be ell illuminate:' with
110
safety lamps. With the slightest discomfort felt by person in the tank, it
should be possible pull out the person from the tank. This assumes that
sufficient numbers of manholes are provided. At all such times, a vehicle
should be kept really for transport of injured persons to a hospital after
giving them necessary first aid.
For preventing fire hazards, the gas holder, waste gas burners and gas
supply lines should be provided with flame-arresters of approved design
for protecting the units from flash-back of flames caused accidentally by
sudden drop in gas pressure.
All electrical equipment and electrically driven pumps, air compressors,
blowers etc, should be well earthed as per power supply authority
requirements or Govt. Electricity Inspector's requirements. This should
also include necessary earthing for protection from lightening on
Digesters, which are the tallest structures in an effluent treatment plant.
3.12.9. Start-up and Shut-down Aspects (a) Start-up Aspects
Before commissioning a tank, it should be seen that all equipment
provided is working satisfactorily. Further the civil structure should be
checked for any defects.
After fully filling the tank with waste water, it should be seen that there
is no drop in level, of liquid in the tank. Thereafter, the equipment
should be operated to get assured performance.
(b) Shut-down Aspects
During shutdown period, in order to prevent formation of scum, most of
the digested sludge should be removed. The manholes provided should
be opened and provided with Safety covers. The shutdown period can
be used for attending to mixing equipment and sludge pipelines and
sluice valves. AU other safety measures mentioned earlier must be
strictly followed.
111
Figure 29 Sludge Drying Bed
112
Figure 30 Sludge Thickness
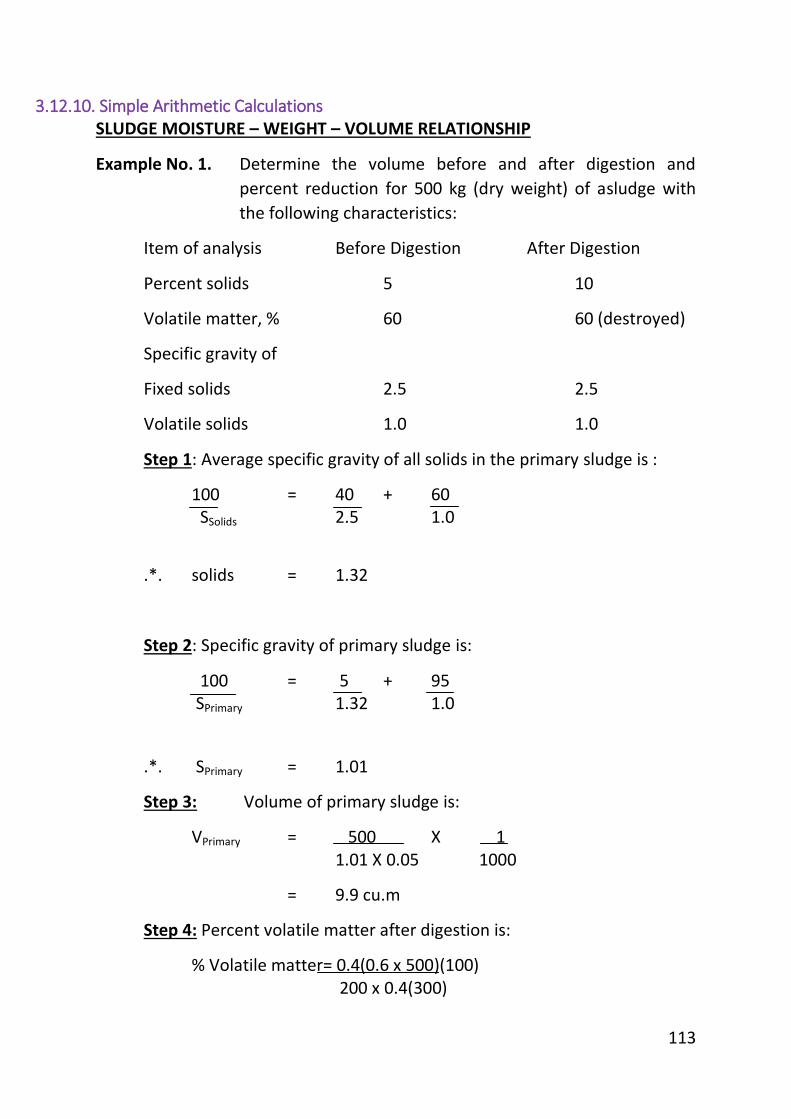
113
3.12.10. Simple Arithmetic Calculations SLUDGE MOISTURE – WEIGHT – VOLUME RELATIONSHIP
Example No. 1. Determine the volume before and after digestion and
percent reduction for 500 kg (dry weight) of asludge with
the following characteristics:
Item of analysis Before Digestion After Digestion
Percent solids 5 10
Volatile matter, % 60 60 (destroyed)
Specific gravity of
Fixed solids 2.5 2.5
Volatile solids 1.0 1.0
Step 1: Average specific gravity of all solids in the primary sludge is :
100 = 40 + 60 SSolids 2.5 1.0
.*. solids = 1.32
Step 2: Specific gravity of primary sludge is:
100 = 5 + 95 SPrimary 1.32 1.0
.*. SPrimary = 1.01
Step 3: Volume of primary sludge is:
VPrimary = 500 X 1 1.01 X 0.05 1000
= 9.9 cu.m
Step 4: Percent volatile matter after digestion is:
% Volatile matter= 0.4(0.6 x 500)(100) 200 x 0.4(300)
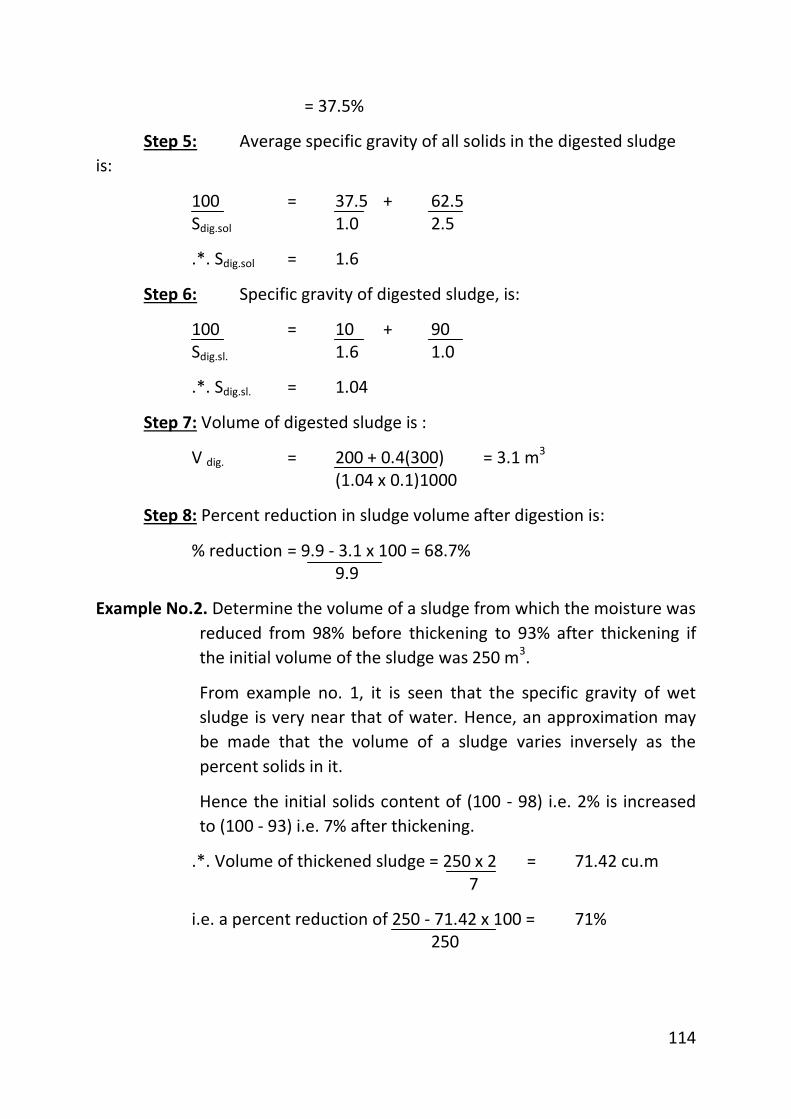
114
= 37.5%
Step 5: Average specific gravity of all solids in the digested sludge
is:
100 = 37.5 + 62.5 Sdig.sol 1.0 2.5
.*. Sdig.sol = 1.6
Step 6: Specific gravity of digested sludge, is:
100 = 10 + 90 Sdig.sl. 1.6 1.0
.*. Sdig.sl. = 1.04
Step 7: Volume of digested sludge is :
V dig. = 200 + 0.4(300) = 3.1 m3 (1.04 x 0.1)1000
Step 8: Percent reduction in sludge volume after digestion is:
% reduction = 9.9 - 3.1 x 100 = 68.7% 9.9
Example No.2. Determine the volume of a sludge from which the moisture was
reduced from 98% before thickening to 93% after thickening if
the initial volume of the sludge was 250 m3.
From example no. 1, it is seen that the specific gravity of wet
sludge is very near that of water. Hence, an approximation may
be made that the volume of a sludge varies inversely as the
percent solids in it.
Hence the initial solids content of (100 - 98) i.e. 2% is increased
to (100 - 93) i.e. 7% after thickening.
.*. Volume of thickened sludge = 250 x 2 = 71.42 cu.m 7
i.e. a percent reduction of 250 - 71.42 x 100 = 71% 250
115
3.13 WASTEWATER IRRIGATION
3.13.1. Objective The objective of wastewater irrigation is to dispose of a treated effluent safely
and profitably. Industrial effluents such as from food industries, alcoholic and
non-alcoholic beverages, pulp and paper mill, fertilizer manufacture etc., are
suitable for disposal by irrigation, besides sewage. This form of disposal is of
interest because it constitutes primary, secondary and tertiary treatment, all in
a single operation. Not only is the water reused, but nutrients such as nitrogen
and phosphorus are effectively removed from it.
3.13.2 Types There are several arrangements in which irrigation with effluents is done,
typical among these are:
(a) Surface irrigation over a contoured field,
(b) Flood irrigation with or without an under drainage system.
(c) Spray irrigation using fixed or movable pipe network.
(d) Ridge and furrow irrigation and
(e) Drip irrigation.
3.13.3. Factors affecting Land Disposal (a) Rate of water application which depends on climate, crop and nature
of soil;
(b) Nutrient requirements of crops and nutrients available in the soil;
(c) Organic load on the soil;
(d) Transmission of pathogens if any are present in the treated industrial
effluents;
(e) Presence of toxic substances and their transmission in the food chain;
(f) Build-up of salts in the soil;
(g) Long-term effects on soil and plants;
(h) Possibility of groundwater pollution and
(i) Effectiveness of nutrient removal.
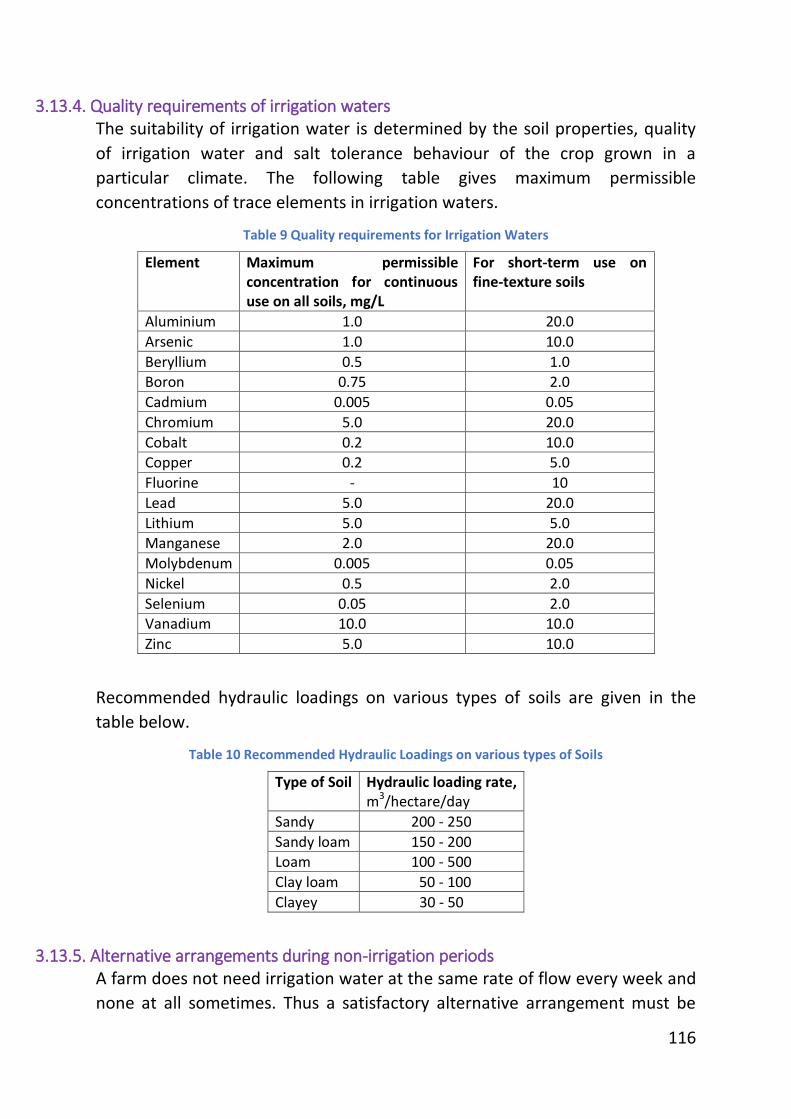
116
3.13.4. Quality requirements of irrigation waters The suitability of irrigation water is determined by the soil properties, quality
of irrigation water and salt tolerance behaviour of the crop grown in a
particular climate. The following table gives maximum permissible
concentrations of trace elements in irrigation waters.
Table 9 Quality requirements for Irrigation Waters
Element Maximum permissible concentration for continuous use on all soils, mg/L
For short-term use on fine-texture soils
Aluminium 1.0 20.0
Arsenic 1.0 10.0
Beryllium 0.5 1.0
Boron 0.75 2.0
Cadmium 0.005 0.05
Chromium 5.0 20.0
Cobalt 0.2 10.0 Copper 0.2 5.0
Fluorine - 10
Lead 5.0 20.0
Lithium 5.0 5.0 Manganese 2.0 20.0
Molybdenum 0.005 0.05
Nickel 0.5 2.0
Selenium 0.05 2.0 Vanadium 10.0 10.0
Zinc 5.0 10.0
Recommended hydraulic loadings on various types of soils are given in the
table below.
Table 10 Recommended Hydraulic Loadings on various types of Soils
Type of Soil Hydraulic loading rate, m3/hectare/day
Sandy 200 - 250
Sandy loam 150 - 200 Loam 100 - 500
Clay loam 50 - 100
Clayey 30 - 50
3.13.5. Alternative arrangements during non-irrigation periods A farm does not need irrigation water at the same rate of flow every week and
none at all sometimes. Thus a satisfactory alternative arrangement must be
117
made for disposal during non-irrigation periods. The alternatives generally
available are
1. Provide holding lagoons for off-season storage.
2. Provide additional agricultural or forest land which can be brought
into use when wastewater is not required for irrigation on the main
plot of land.
3. Discharge the surplus wastewater to sea or river.
4. Practise groundwater recharge where feasible.
3.14 CHLORINATION OF WASTEWATERS
3.14.1 Objectives Wastewaters may be treated with chlorine in order to make us of its bleaching
(colour removal), oxidizing (BOD reduction) or disinfecting (destruction of
micro-organisms) properties. It is used for odour control, as an aid to grease
removal, to reduce sludge bulking in activated sludge, to eliminate filter
ponding and fly nuisance in trickling filters, for wet-scrubbing of digester gas
and for minimising after growths of micro-organisms in conduits which carry
treated effluent upto the point of final disposal. It is also used for destroying
phenols and cyanides from wastewaters. Fig. shows the points of application of
chlorine in a wastewater treatment plant.
It should he noted that chlorine reacts with most of the organic and some
inorganic compounds present in a wastewater, but does not react with
carbohydrates (with the exception of levulose), methyl and ethyl alcohol,
glycerol, starch, and olcate, palmitate and acetate of sodium. Care should,
therefore, be taken to confirm the presence (or absence) of the above
substances in the wastewater before deciding to give it chlorine treatment.
Although a number of disinfecting agents such as heating, use of ultraviolet
rays, ultrasonic waves, chemicals such as metal ions, acids, alkalis, surface-
active agents, ozone and chlorine- dioxide are available, chlorine is the
favoured agent of disinfection.
3.14.2 Forms of Chlorine used for Wastewater Disinfection The farms in which chlorine is commonly used for disinfecting industrial
wastewaters are:
(a) Liquid-gaseous chlorine,
118
(b) Sodium hypochlorite and (c) Bleaching powder.
For small plants, sodium hypochlorite or bleaching powder may be preferred
while for large plants, liquid chlorine in cylinders is used.
3.14.3 Some Definitions Chlorination
The application of chlorine to water or wastewater, generally for disinfection,
but frequently for accomplishing other biological or chemical results.
Chloramines
These are compounds formed by the reaction between aqueous chlorine and
ammonia.
Chlorine contact tank
A baffled unit which provides sufficient detention time for disinfection to
occur.
Chlorine demand
It is the difference between the amount of chlorine added to wastewater and
the amount of residual chlorine after a given contact time. Chlorine demand
may change with dosage, time of contact, temperature, pH value and nature
and amount of impurities in the water.
Chlorine demand = Chlorine remaining, mg/l. = Chlorine
applied mg/l
Combined available chlorine
The concentration of chlorine which is combined with ammonia as chloramine
or as other chloro derivative yet is still available to oxidize organic matter.
Combined residual chlorination
The application of chlorine to water to produce a combined available residual
chlorine. The residual may consist of chlorine compounds formed by the
reaction of chlorine with natural or added ammonia or with certain organic
nitrogen compounds.
Free available chlorine
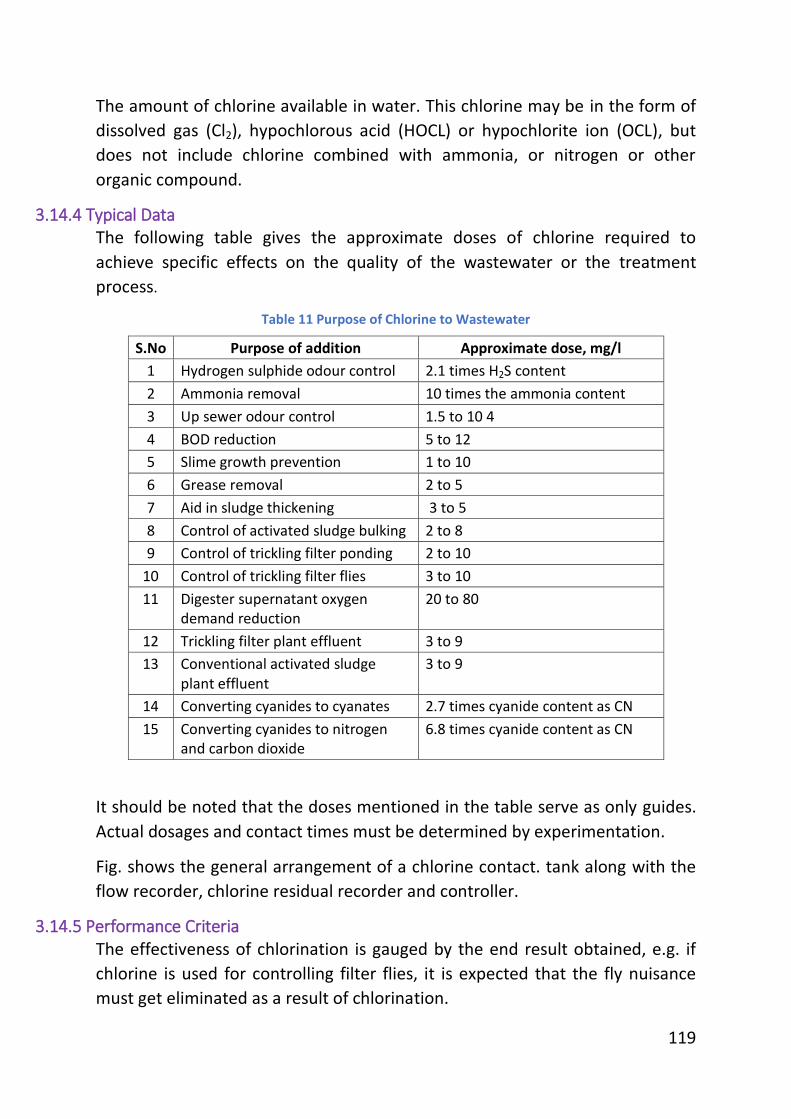
119
The amount of chlorine available in water. This chlorine may be in the form of
dissolved gas (Cl2), hypochlorous acid (HOCL) or hypochlorite ion (OCL), but
does not include chlorine combined with ammonia, or nitrogen or other
organic compound.
3.14.4 Typical Data The following table gives the approximate doses of chlorine required to
achieve specific effects on the quality of the wastewater or the treatment
process.
Table 11 Purpose of Chlorine to Wastewater
S.No Purpose of addition Approximate dose, mg/l
1 Hydrogen sulphide odour control 2.1 times H2S content
2 Ammonia removal 10 times the ammonia content
3 Up sewer odour control 1.5 to 10 4
4 BOD reduction 5 to 12
5 Slime growth prevention 1 to 10
6 Grease removal 2 to 5
7 Aid in sludge thickening 3 to 5
8 Control of activated sludge bulking 2 to 8
9 Control of trickling filter ponding 2 to 10
10 Control of trickling filter flies 3 to 10
11 Digester supernatant oxygen demand reduction
20 to 80
12 Trickling filter plant effluent 3 to 9
13 Conventional activated sludge plant effluent
3 to 9
14 Converting cyanides to cyanates 2.7 times cyanide content as CN
15 Converting cyanides to nitrogen and carbon dioxide
6.8 times cyanide content as CN
It should be noted that the doses mentioned in the table serve as only guides.
Actual dosages and contact times must be determined by experimentation.
Fig. shows the general arrangement of a chlorine contact. tank along with the
flow recorder, chlorine residual recorder and controller.
3.14.5 Performance Criteria The effectiveness of chlorination is gauged by the end result obtained, e.g. if
chlorine is used for controlling filter flies, it is expected that the fly nuisance
must get eliminated as a result of chlorination.
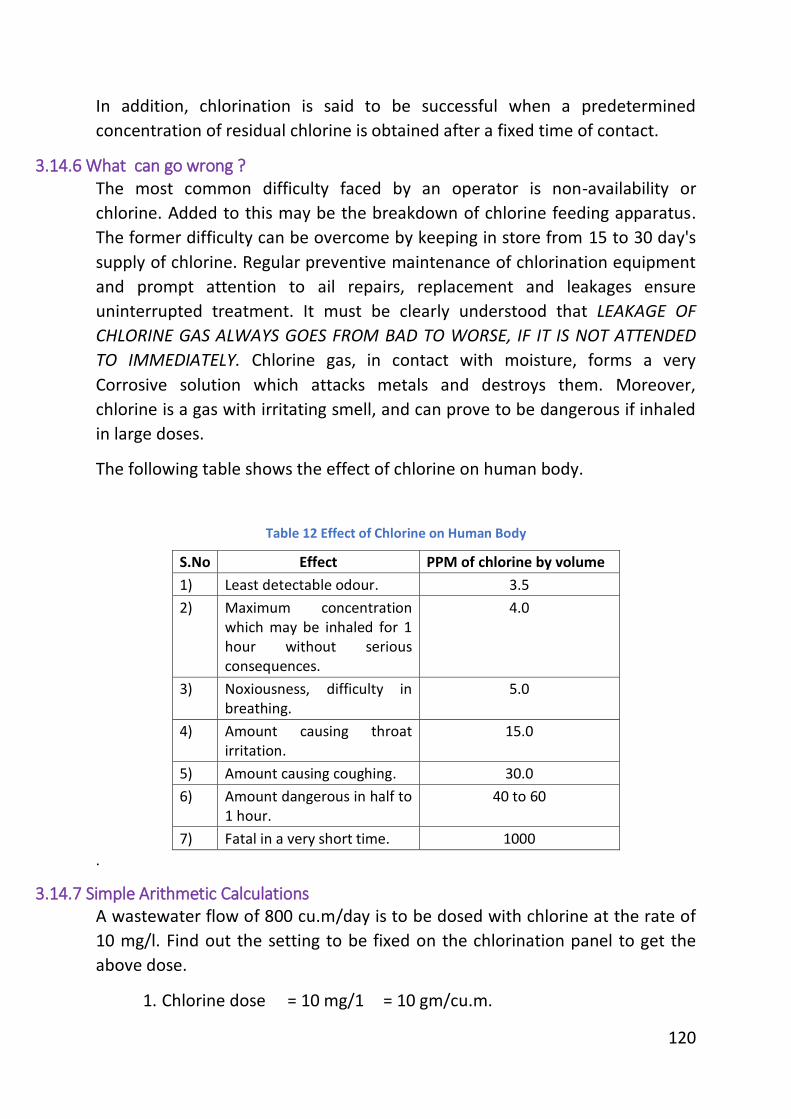
120
In addition, chlorination is said to be successful when a predetermined
concentration of residual chlorine is obtained after a fixed time of contact.
3.14.6 What can go wrong ? The most common difficulty faced by an operator is non-availability or
chlorine. Added to this may be the breakdown of chlorine feeding apparatus.
The former difficulty can be overcome by keeping in store from 15 to 30 day's
supply of chlorine. Regular preventive maintenance of chlorination equipment
and prompt attention to ail repairs, replacement and leakages ensure
uninterrupted treatment. It must be clearly understood that LEAKAGE OF
CHLORINE GAS ALWAYS GOES FROM BAD TO WORSE, IF IT IS NOT ATTENDED
TO IMMEDIATELY. Chlorine gas, in contact with moisture, forms a very
Corrosive solution which attacks metals and destroys them. Moreover,
chlorine is a gas with irritating smell, and can prove to be dangerous if inhaled
in large doses.
The following table shows the effect of chlorine on human body.
Table 12 Effect of Chlorine on Human Body
S.No Effect PPM of chlorine by volume
1) Least detectable odour. 3.5
2) Maximum concentration which may be inhaled for 1 hour without serious consequences.
4.0
3) Noxiousness, difficulty in breathing.
5.0
4) Amount causing throat irritation.
15.0
5) Amount causing coughing. 30.0
6) Amount dangerous in half to 1 hour.
40 to 60
7) Fatal in a very short time. 1000
.
3.14.7 Simple Arithmetic Calculations A wastewater flow of 800 cu.m/day is to be dosed with chlorine at the rate of
10 mg/l. Find out the setting to be fixed on the chlorination panel to get the
above dose.
1. Chlorine dose = 10 mg/1 = 10 gm/cu.m.
121
Weight of chlorine required per day = 10 x 800 = 8 kg/day , or 1000
= 8000 gm/hr 24
= 333.3 gm/hr.
2. If bleaching, powder with available chlorine of 20% is given, find the
weight of bleaching powder required per day, to treat the above
volume of wastewater.
Dose of chlorine = 10 mg/l
Weight of chlorine required = 800 x 10 = 8 kg/day 1000
Weight of bleaching powder = 8 x 100 = 40 kg/day 20
If a 2% suspension is prepared, the daily discharge of this suspension will
be
= 40 x 100 = 2000 litres 2
or about 85 litres per hour.
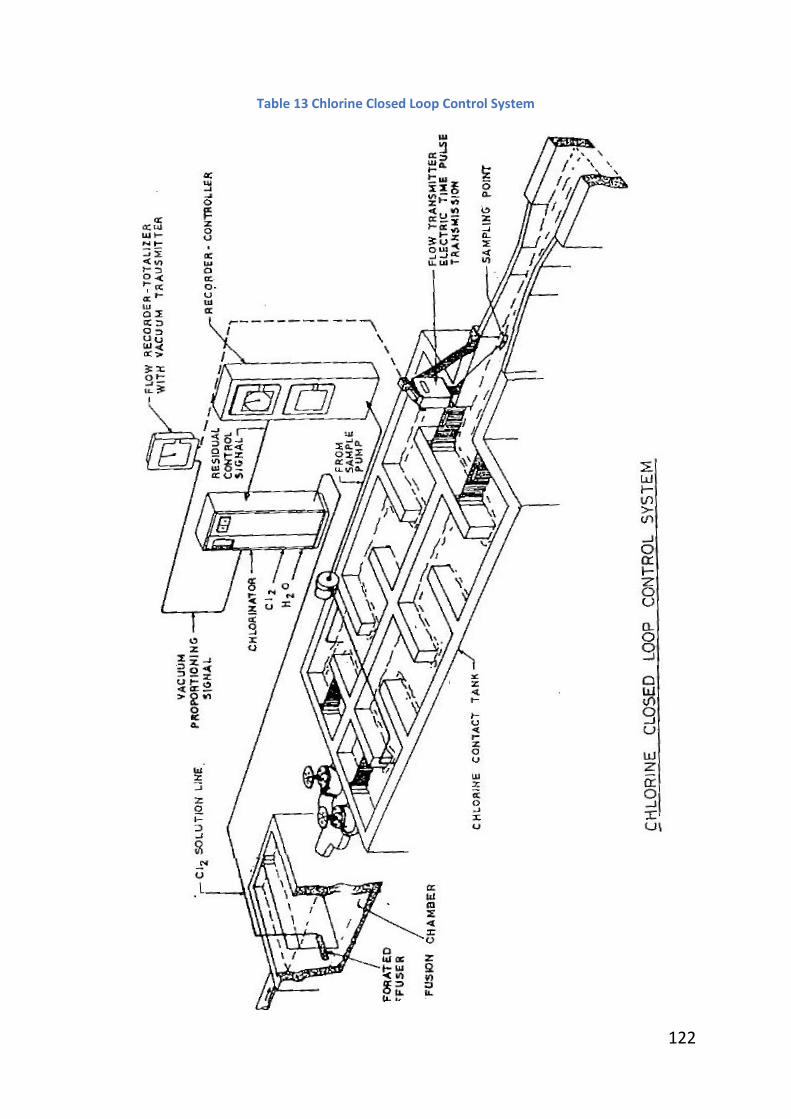
122
Table 13 Chlorine Closed Loop Control System
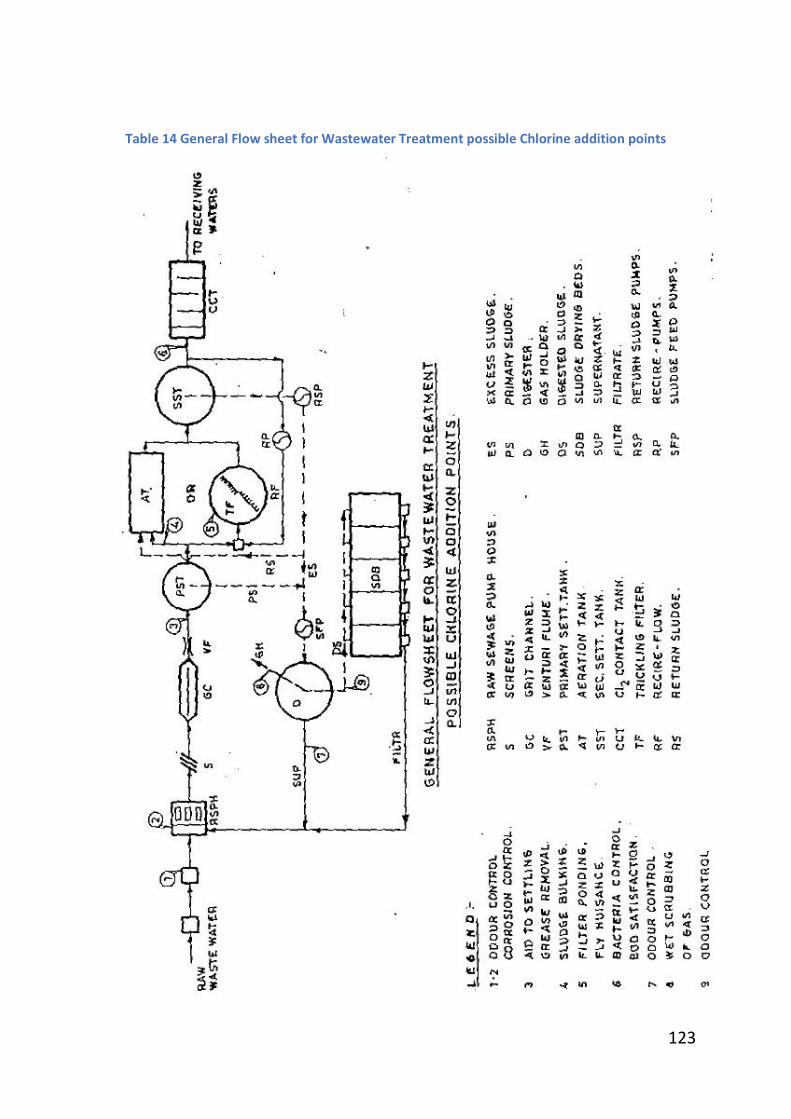
123
Table 14 General Flow sheet for Wastewater Treatment possible Chlorine addition points
124
4. FIELD TESTS 4.1 LIST OF EQUIPMENT
pH meter
Desiccator
1030C drying oven
Reflux apparatus
Imhoff cone, cone support
250 ml Erlenmeyer flask
500 ml Erkenmeyer flask
Calomel and glass electrodes
Graduated cylinder
1 litre volumetric flask
Glass fibre filter disk, filter assembly, filter flask
Burets - 25 ml, Pipets, flasks, glass rods, white tile
10 ml - pipet
Glass stoppered bottles - 300 ml
4.2 LIST OF REAGENTS
Buffer tablets of various pH value
NaOH Sodium Hydroxide
Phenolphthalein powder
Isopropyl alcohol.
H2S04 Sulphuric acid
Na2CO3 Sodium Carbonate
Methyl Orange indicator/powder
MnSO4 (crystalline) Managanese Sulfate
KI Potassium iodide
Sodium azide NaN3
Na2S2O3 (crystalline) Sodium Thiosulfate
Starch solution
Toluene C6H4CH3
Ag2S04 Silver Sulfate o
K2Cr2O7 Potassium Dichromate
Ferroine indicator/phenanthroline (C12H6N2H2O) with FeSO47H20 Ferrous Sulfate crystals
Ferrous Ammonium Sulfate
Mercuric Sulfate (HgSO4)
Phenylarsine oxide powder
125
Acetic acid
Sodium acetate tribydrate NaC2H2O2 3H20
Arsenic trioxide As2O3
Hydrochloric acid HCI
Standard chlorine solution
Sodium Sulfite Na2SO3
Salicylic acid
Zinc Chloride
4.3 PHYSICAL AND CHEMICAL EXAMINATION
4.3.1 Settleable Matter This simple test may be made to show quickly, visibly, and qualitatively if the
primary and secondary processes are functioning properly. The volume of
settleable solids in the raw waste and effluents is seen readily, and the
turbidity removal caused by the secondary purification processes is evident
immediately to the eye.
Apparatus
An Imhoff cone, made either of Pyrex glass or clear plastic material, a cone
support and a long glass stirring rod.
Procedure
1. Fill the Imhoff cone to the (-1 mark with a well-mixed sample. 2. Settle for 45 min. and then gently stir the sample with the glass rod to
dislodge suspended matter clinging to the tapered sides of the cone. 3. Settle 15 min. longer, then read the volume of settleable matter in
milliliters per litre.
4.3.2 pH It has been said that pH is a numerical expression of the intensity of acidity or
basicity.
The pH of wastewater is normally near 7.0. Sudden changes of pH values of
wastewater may be indicative of illegal discharges of acid or alkaline industrial
waste into the wastewater system. These discharges are often damaging to
treatment facilities, and biological treatment methods such as activated sludge
or the trickling filter process.
Apparatus
pH meter, calomel and glass electrodes, beakers.
126
Reagents
Buffer tablets of various pH values.
Procedure
The manufacturer's instructions must be followed for the correct operation of
instrument. The electrodes are wetted thoroughly and prepared for use in
accordance with the instruction given. The instrument is standardized against a
buffer solution with a pH approaching that of the sample, and then the
linearity of the electrode response may be checked against at least one
additional buffer of a different pH. The readings with the additional buffers will
afford a rough idea of the limits of accuracy to be expected from the
instrument and the technique of operation. After standardization, the
electrodes are to be washed carefully with distilled water from a wash bottle
and wiped with soft tissue. Because wastewaters may contain oils, greases,
and fats, the electrodes may need occasional cleaning by wiping with solvents
or detergents. The electrodes are delicate instruments and must be handled
carefully. Always keep the electrodes immersed in distilled water when not in
use.
4.3.3 Acidity Drainage from swampy areas often contains organic acids, as do some stream,
receiving mine drainage industrial wastes. Because most public water supplies
are neutral or basic, the presence of low pH with moderate acidity generally
indicates the discharge of acidic industrial wastes into the sewers.
Apparatus
25 ml buret, assorted pipets, flasks, graduated cylinders, glass rods, and bottles
as needed and a 1 litre volumetric flask.
Reagents
1. Sodium hydroxide (Na0H) 1 N. Dissolve 40.0 g NaOH in distilled water
and make up to 1 l with distilled water.
2. Sodium hydroxide, 0.02 N. Dilute 20.0 ml of 1 N NaOH with distilled
water to 1 1 in a volumetric flask.
3. Phenolphthalein indicator. Dissolve 5 g phenolphthalein in 500 ml
isopropyl alcohol, and add 500 ml distilled water. Add 0.02 N sodium
hydroxide dropwise until a faint pink color appears.
127
Procedure
1. Measure 100 ml of sample, using a graduated cylinder. Transfer the
sample to a 250 ml Erlenmeyer flask.
2. Add three drops of phenophthalein.
3. Add 0.02 N sodium hydroxide from a buret with constant swirling of
the flask contents above a white surface until a pink color appears and
lasts for at least 3 s. If there is a lasting pink color on adding the
indicator before the addition of sodium hydroxide, there is no acidity.
Calculations
The total acidity is expressed in terms of the amount of CaCO3 needed to
neutralize the sample
Total acidity, as mg/l CaCO3 = ml of 0.02 N NaOH x 1.000 ml of original sample
4.3.3.1 Acidity Test for Sludge
The test measures the acidity that may be caused by the presence of
uncombined carbon dioxide, organic acids such as the volatile acids, or
industrial wastes. This information may be valuable in the control of sludge
digestion and other sludge conditioning practices. A titration procedure is
used, making use of a pH meter for determining the end point.
Apparatus
pH meter; 25-m1 buret; assorted glass rods, beakers, and graduated cylinders
as needed,
Reagents
Sodium hydroxide, 0.05 N. Dilute 50 ml of I N sodium hydroxide with distilled
water to 1 litre.
Procedures
1. Measure 50 ml of wastewater or supernatant liquor (at room temperature) into a beaker.
2. Insert electrodes of pH meter, and measure pH (the pH meter shod standardized according to the manufacturer's directions before using).
3. With careful stirring to minimize loss of CO2 add 0.05 N NaOH from a buret until the pH is 8.3.
128
4. Record the number of millilitres of hydroxide used.
Calculations
Acidity, as mg/I CaCO, = ml of 0.05N NaOH x 2,500 ml of original sample
4.3.4 Alkalinity of Wastewater and Sludge The presence of abnormally high alkalinity in wastewater may be indicative of
the presence of alkaline industrial waste. The determination of the alkalinity
levels at various points in a treatment plant is an aid to the proper
understanding and interpretation of the treatment process and to the
management of digesters and sludge elutriation as well as sludge conditioning
before vacuum filtration.
Apparatus
25 ml buret, 250-ml Erlenmeyer flask, a white surface such as a 100 x 100 non
white tile, assorted beakers, graduated cylinders, volumetric flasks, and bottles
as needed.
Reagents
1. Sulfuric acid, 0.02 N. to a graduated cylinder or volumetric flask
containing 300 ml of distilled water (freshly boiled and cooled) add 3
ml of concentrated sulfuric acid and dilute to 1 litre with boiled
distilled water. Further dilute 200 ml of this acid solution to 1 litre
with freshly boiled and cooled distilled water. Standardize against 0.02
N sodium carbonate (see Step 2).
2. Sodium carbonate, 0.02 N. Dissolve 1.060 g anhydrous sodium
carbonate (Na2CO3) in freshly boiled and cooled distilled water and
make up to 1 litre with distilled water.
3. Phenolphthalein indicator. (See “Acidity” test).
4. Methyl orange indicator. Dissolve 0.5 mg methyl orange in 1 litre of
distilled water.
Procedure
1. Place 100 ml of sample, of smaller quantity diluted to 100 ml with
distilled water, in an Erlenmeyer flask. With digested sludges, use 50
ml of supernatant liquor from above a settled sample.
129
2. Add two drops of phenolphthalein.
3. Add 0.02 N sulfuric acid from a buret with constant swirling of the
flask contents above a white surface until the original pink color just
disappears. If there is no pink colour after the phenolphthalein is
added, record the phenolphthalein alkalinity as 0.0 ml and go directly
to the next step.
4. Add two drops of methyl orange indicator to the flask contents and
continue adding acid from the buret until the color of the flask
contents just turns faintly pink.
Calculations
mg/l phenolphthalein alkalinity as CaCO3 = ml 0.02 N H2SO4 x 1,000
ml original sample
mg/l total alkalinity as CaCO3 = total ml 0.02 N H2SO4 x 1,000
ml original sample
If color or turbidity interfere in detecting the end points, it is better to
measure a 50 ml sample into a 100 ml graduated cylinder and carry on
the above titrations by using a plunger type stirrer.
4.4 TESTS ON ACTIVATED SLUDGE Successful operation of the activated sludge process of wastewater treatment is dependent
on laboratory control. Some of the test procedures are given below. These
methods are presented as a group because they are interrelated.
Interference
An excess of heavy metals such as chromium, nickel, zinc, and copper will
change the settleability of activated sludge, as well cyanides. Shock loadings
that cause a deficiency of oxygen and a changed pH in the primary effluent
above and below the range of 6.5 to 8.5 may affect settleability. Changes in
settleability also will change the SVI or SDI values.
4.4.1 Suspended Matter for Mixed Liqour and Return Sludge Apparatus
130
Filter flask with side tube, 1,000 mm size; glass fiber filter disk; filter assembly;
1030C drying oven; desiccators.
Procedure
1. Place the glass fiber filter disk on the filter apparatus.
2. Apply vacuum and wash the disk with three successive 20 ml portions
of distilled water. Continue suction to remove all traces of water from
the disk, then discard the washings.
3. Remove the filter from the filter apparatus and transfer to an
aluminium tray.
4. Dry in an oven at 1030C for 1 h. Weigh immediately before, using and
record the weight as W1.
5. Proceed as in step 4 in the section, "Suspended Matter".
Calculations
mg/I total suspended matter = (W2 - WI) x 1,000 ml of sample
4.4.2 Settleabilitv for Mixed Liquor and Return Sludge The settleability of activated sludge solids test is made by taking 1 I of a well-
mixed sample and allowing it to settle quiescently for 30 min in a 1 I graduated
cylinder.
The condition of the activated sludge may be observed by this test. If the
activated sludge is in good condition, the SS will settle rapidly and compact
into a very small volume, the activated sludge in poor condition may not settle
readily.
Apparatus
Two 1,000 ml graduated cylinders with graduation lines 10 ml apart.
Procedures
1. The test should be run immediately after the sample is taken.
2. The sample must be well mixed. Pour 1,000 ml into the 1 l graduate.
3. At the end of 30 min record the volume occupied by the sludge to the
nearest 5 ml.
131
The reading at the end of 30 min generally is used for plant control.
Occasionally, it is helpful to measure the settling rate by recording the volume
occupied by the sludge at various intervals of time, for example, every 5, 10, 20
and 30 min. Although the settleability test on return sludge is not used in any
calculations for activated sludge, the result is helpful in determining whether
too much or too little sludge is being returned from the final settling tank.
Calculations
Percentage of settled sludge = ml of settled mixed liquor or return sludge X 100
I ,000
4.4.3 Sludge Volume Index The SVI of activated sludge is defined as the volume in milliliters occupied by 1
g of activated sludge after settling 30 min. From this definition it may be
observed that the lower the SVI the better is the settling quality of the aerated
mixed liquor. Sludge with an SVI of 100 or less is considered a good settling
sludge.
Calculations
The results obtained from the "Suspended Matter" and "Settleability" test on
the aerated mixed liquor are used to obtain SVI.
Sludge Volume Index (SVI) = ml of settled sludge x 1,000 mg/l of suspended matter
4.4.4 Sludge Density Index The SDI is also a method of measuring the settling quality of activated sludge. II
differs from SVI in that the higher the SDI value the better is the settling quality
of the aerated mixed liquor. Similarly, the lower the SDI the poorer is the
concentration in percentage solids that the activated sludge will assume after
settling 30 min. (the UK often uses 1 h settling time). Sludge with an SDI of 1 or
more is considered to have good settling characteristics.
Calculations
The results obtained from the "Suspended Matter" test and "Settleability" test
on aerated mixed liquor are used to obtain SDI.
SDI = mg/I of suspended matter in mixed liquor ml of settled sludge x 10
132
SDI = 100 SVI
4.4.5 Dissolved Oxygen MO) - Winkler Method DO represents the amount of oxygen dissolved in the liquor. It is necessary to
mark DO determinations of samples at the time of collection or to "fix" the
samples for such determinations.
All aerobic treatment processes depend on the presence of a sufficient supply
of DO, and tests for it are indispensable as a means of controlling the rate of
aearation to assure that aerobic conditions are maintained.
Interference
Interfering substances include iron salts, organic matter, excessive suspended
matter, sulfide, sulfur dioxide, residual chlorine chromium and cyanide.
Apparatus
Buret, 50 ml graduated at 0.1 ml; glass stoppered BOD bottles, 300 ml;
widemourth Erlenmeyer flask, 250 ml; measuring pipet, 10 ml.
Reagents
1. Manganese sulfate solution. Dissolve 480 g manganese sulfate crystal
(MnSO4 4H2O) in 400 to 600 ml distilled water. Filter through filter
paper, then add distilled water to the filtered liquid to make a 1 litre
volume.
2. Alkali-iodide-azide solution, dissolve 500 g sodium hydroxide (NaOH)
in 500 to 600 ml distilled water; dissolve 150 g potassium iodide (KI) in
200 to 300 ml distilled water in a separate container. Mix both
solutions when they are cool. Dissolve 10 g sodium azide (NaN3) in 40
ml of distilled water. Add this sodium azide solution with constant
stirring to the cooled solution of alkaline iodide, then add distilled
water to the mixture to make a 1 l volume.
3. Sulfuric acid. Use concentrated, reagent grade acid (H2SO4).
4. Sodium thiosulfate solution, 0.025 N. Dissolve 6.2.05 g sodium
thiosulfate crystals (Na2S2O3 5H2O) in freshly boiled and cooled
distilled water and make up to 11. For preservation, add 0.4 g or 1
pellet of sodium hydroxide (NaOH).
133
5. Starch solution. Make a thin paste of 3 g of soluble starch in a small
quantity of distilled water. Pour this paste into 500 ml of boiling
distilled water, allow to boil for a few minutes, then settle overnight.
Remove the clear supernatant and save; discard the rest. For
preservation add two drops toluene (C6H6CH2).
Procedure
1. Completely fill a 300 ml BOD bottle with the sample to be analyzed by
siphoning the sample slowly into the bottle. Be sure no air is
entrapped.
2. By holding the tip of the pipet below the surface of the liquid add 2 ml
manganese sulfate solution and then add 2 ml alkaline iodide azide
solution.
3. Replace stopper, avoiding trapping air bubbles, and shake well by
gentle inversion. Repeat shaking after floc has settled halfway. Allow
floc to settle again.
4. Remove stopper and add 2 ml of concentrated sulfuric acid. Hold
pipet above the surface of the liquid. Re-stopper and mix by gentle
inversion until no floc is visible. Allow to stand to atleast 5 min. but
not in direct sunlight. The solution can stand safely for 2 h in this
condition.
5. Withdraw 203 ml of the solution into the Erlenmeyer flask and titrate
with sodium thiosulfate solution until the yellow color almost
disappears.
6. Add 1 ml starch solution and continue titration until the blue color just
disappears.
7. Record the number of millilitres of thiosulfate used. Disregard any
return of the blue color.
Calculations
The DO present in the sample is expressed in milligrams per liter and is equal
to the number of millitres of sodium thiosulfate solution used in titration (Step
7).
mg/I DO = ml thiosulfate solution.
134
4.5 Chemical Oxygen Demand
The COD determination is a measure of the oxygen equivalent of that portion
of organic matter in a sample that can be oxidized by a strong chemical
oxidizing agent. The COD value is important in industrial waste studies and
control of wastewater treatment plants. Generally, the BOD is 50 to 70 percent
of the COD depending on the type of organic matter in the water.
Interferences
Certain types of organic compounds are oxidized in this test that normally are
not oxidized biologically.
Apparatus
Reflux apparatus, consisting of a 300 ml round bottom flask with ground glass
neck size 24/40 and a Friedrichs style condenser; a hot plate with 1300-W
rating; 500-ml Erlenmeyer flask.
Reagents
1. Sulfuric acid - silver sulfate solution. Dissolve 22 g silver sulfate
(Ag2SO4) in a 4.1 kg bottle of concentrated sulfuric acid (H2SO4). It will
take 1 to 2 days for the silver sulfate to dissolve.
2. Potassium dichromate solution, 0.25 N. Dissolve 12.259 g potassium
dichromate (K2Cr2O7) previously dried at 103 0 C for 2 h. in distilled
water and make up to 1 litre.
3. Ferroin indicator solution. Dissolve 1.485 g of 1,10 Phenanthroline
(C12H8N2 H2O) together with 0.695 g ferrous sulfate crystals (FeSO4
7H2O) in water and make up to 100 ml.
4. Ferrous ammonium sulfate solution, 0.25N. dissolve 98 g ferrous
ammonium sulfate [Fe(NH4)2(S04)2 6H2O] in distilled water. Add 20 ml
concentrated sulfuric acid, cool, and make up to 1 litre. This solution
must be standardized against potassium dichromate daily.
5. Mercuric sulfate (HgSO4) analytical grade crystals.
Procedures
1. Place a 20 ml sample in the round bottom flask, add 0.4 g mercuric
sulfate, and add by pipet 10 ml of potassium dichromate solution.
Carefully add 30 ml sulfuric acid silver sulfate solution, a little at a
135
time, mixing after each addition. Be sure the reflux mixture is mixed
thoroughly before heat is applied. If this is not done, the mixture may
be blown out of the condenser.
2. Add a few clean glass beads to prevent bumping and attach the flask
to the condenser. Reflux the mixture for 2 h. Cool, and then wash
down the condenser with approximately 25 ml distilled water.
3. Transfer the contents to a 500 ml Erlenmeyer flask, washing out the
reflux flask 4 to 5 times with distilled water. Dilute the mixture to
approximately 140 ml: cool and titrate the excess dichromate with
ferrous ammonium sulfate solution, using ferroin indicator. Generally,
two or three drops of the indicator are added to the sample just
before titrating.
4. Take as the end point the sharp color change from blue-green to
reddish brown, even though the blue-green may reappear within
minutes.
5. A blank consisting of 20 ml of distilled water instead of the sample,
together with the reagents, is refluxed and titrated in the same
manner.
Calculations
Mg/l COD = (a - b) x c x 8,000 ml of sample
in which
COD = oxygen consumed from potassium dichromate
a = ferrous ammonium sulfate solution used for blank,
ml.
b = ferrous ammonium sulfate solution used for
sample, ml, and
c = normality of ferrous ammonium sulfate solution.
136
4.6 CHLORINE TESTS
4.6.1 Chlorine Residual Chlorine in water solutions is not stable. As a result, its concentration in
samples will increase rapidly. Exposure to sunlight or other strong light or
agitation will further reduce the quantity of chlorine present in solutions.
Therefore, samples to be analysed for chlorine cannot be stored and tests,
must be started immediately after sampling.
Interference
Colour, turbidity, iron, manganese and nitrites are factors that may interfere
with the accuracy of this test.
Apparatus
250 ml flask, 5-ml volumetric pipet, 10 ml graduated cylinder; stirring rod;
titration apparatus.
Reagents
1. Standard phenylarsine oxide solution (PAO) 0.00564 N. (This solution
may be obtained commercially). To produce in the laboratory,
dissolve approximately 0.8 g. phenylarsine oxide powder in 150 ml.
0.3 N NaOH solution. After settling, decant 110 ml. of this solution
into 800 ml. distilled water and mix thoroughly. Bring to pH 6 to 7
with 6 N HCL and dilute to 950 ml with distilled water.
To standardize the PAO, accurately measure 5 to 10 ml freshly
standardized 0.0282 N iodine solution into a flash and add 1 ml KI
solution. Titrate with phenylarsine oxide solution, using starch
solution as an indicator. Adjust to exactly 0.00564 N and recheck
against the standard iodine solution : 1.00 ml = 200 mg available
chlorine.
2. Acetate bugger solution, pH 4.0. Dissolve 480 g. concentrated (glacial)
acetic acid and 243 g sodium acetate trihydrate, NaC2H3O2 3H2O in
400 ml distilled water and make up to 1 l.
3. Standard arsenite solution 0.1 N. Accurately weigh a stoppered
weighing bottle containing approximately 4.95 g arsenic trioxide,
AS2O3. Transfer without loss to 1.1 volumetric flask and again weigh
the bottle. Do not attempt to brush out the adhering oxide. Moisten
137
the AS2O3 with water anti add 15 g. NaOH and 100 ml. distilled water.
Swirl the contents of the flash gently until AS2O3 is in solution. Dilute
to 250 ml with distilled water and saturate with CO2, thus converting
the NaOH to sodium bicarbonate. Dilute to 1:1 and mix thoroughly.
The normality of this solution may be calculated as follows:
Normality = AS2O3
49.455
4. Potassium iodide, Ki, crystals, reagent grade.
5. Standard iodine solution, o.1 N (This solution may be obtained
commercially). In the laboratory, dissolve 40 g KI in 25 ml distilled
water, add 13 g resublimed iodine, and stir until dissolved, transfer to
a 1 litre volumetric flask and dilute to the mark.
To standardize the Ki, accurately measure 40 to 50 ml 0.1 N arsenite
solution into a flash and titrate with the o.1 N iodine solution, using
starch solution as indicator. To obtain accurate results, it is absolutely
necessary that the solution be saturated with CO2 at the end of the
titration. CO2 may be passed through the solution for a few minutes
just before the end point is reached, or a few drops of HCL may be
added to liberate sufficient CO to saturate the solution.
6. Standard iodine titrant, 0.0282 N. Dilute 282 ml (or appropriate
aliquot if normality is not exact) of 0.1 N iodine solution
volumetrically to 1:1 with distilled water.
7. Starch indicator. Either the aqueous solution or soluble starch
powder mixtures may be used for detection of the iodine end point.
Dissolve 5 g of soluble starch in 1:1 of boiling distilled water. Preserve
with 1.25 g of salicylic acid or with 4 g of zinc chloride.
Procedure
1. Place 5.00 ml 0.00564 N phenylarsine oxide solution in a flask.
2. Add 1 g of KI crystals and 4 ml acetate buffer solution or sufficient
amount to reduce the pH to between 3.5 to 4.2
3. Measure 200 ml of sample and pour the volume into the flask and
mix with stirring rod.
4. Add 1 ml of starch indicator solution and mix.

GSDP: COMPLETE COURSE of GEOGRAPHIC INFORMATION SYSTEM (GIS)
Page 1 of 23
GSDP: COMPLETE COURSE of GEOGRAPHIC INFORMATION SYSTEM (GIS)
Page 2 of 23
TABLE OF CONTENT
INTRODUCTION
FUNDAMENTALS OF COMPUTER
CHAPTER-1: GIS SOFTWARES
CHAPTER-2: FUNDAMENTALS OF GIS
CHAPTER-3: LAYERS
CHAPTER-4: SPATIAL DATA AND GIS BASICS
CHAPTER-5: FUNDAMENTALS OF MAPS
CHAPTER-6: SCALES
CHAPTER-7: PROJECTIONS
CHAPTER-8: GPS (Global Positioning System)
GSDP: COMPLETE COURSE of GEOGRAPHIC INFORMATION SYSTEM (GIS)
Page 3 of 23
Introduction
GIS stands for Geographic Information System. It is defined as an integrated tool,
capable of mapping, analyzing, manipulating and storing geographical data in order to
provide solutions to real world problems and help in planning for the future. GIS deals
with what and where components of occurrences.
FUNDAMENTALS OF COMPUTER
A computer is an electronic machine that accepts data, stores and processes data into
information. The computer is able to work because there are instructions in its memory
directing it. The instructions that direct the computer are called software or computer
program.
Computer hardware is the physical parts or components of a computer, such as the
monitor, keyboard, computer data storage, graphic card, sound card and motherboard.
By contrast, software is instructions that can be stored and ran by hardware.
Computers are usually categories into three general categories:
1. Supercomputer – The fastest, largest, most powerful and most expensive computer.
2. Mainframe Computer – This is a little smaller and less powerful than the
supercomputer, but, like the supercomputer it is also
expensive.
3. Personal Computer (PC) - This is the computer that most people use in their daily
lives. This computer is much smaller, less powerful and less
expensive than the supercomputer and the mainframe
computer. There are two main types of personal computers.
Macintosh (Macs) and the PC compatibles (PC). The main
differences between the two are the operating systems and
the processor they use. This category of computer has two
additional types of computers. These are mobile computer
and handheld computer. The most popular type of mobile
computer is the notebook or laptop computer, and the
GSDP: COMPLETE COURSE of GEOGRAPHIC INFORMATION SYSTEM (GIS)
Page 4 of 23
handheld computer is a very small PC that you can hold in
hand.
A BRIEF COMPUTER HISTORY
The computer as we know it today had its beginning with a 19th century English
mathematics professor name Charles Babbage. He designed the Analytical Engine and it
was this design that the basic framework of the computers of today are based on.
Generally speaking, computers can be classified into three generations. Each generation
lasted for a certain period of time, and each gave us either a new and improved
computer or an improvement to the existing computer.
First generation: 1937 – 1946 - In 1937 the first electronic digital computer was built by
Dr. John V. Atanasoff and Clifford Berry. It was called the Atanasoff-Berry Computer
(ABC). In 1943 an electronic computer name the Colossus was built for the military.
Other developments continued until in 1946 the first general– purpose digital computer,
the Electronic Numerical Integrator and Computer (ENIAC) was built. It is said that this
computer weighed 30 tons, and had 18,000 vacuum tubes which was used for
processing. When this computer was turned on for the first time lights dim in sections of
Philadelphia. Computers of this generation could only perform single task, and they had
no operating system.
Second generation: 1947 – 1962 - This generation of computers used transistors instead
of vacuum tubes which were more reliable. In 1951 the first computer for commercial
use was introduced to the public; the Universal Automatic Computer (UNIVAC 1). In
1953 the International Business Machine (IBM) 650 and 700 series computers made
their mark in the computer world. During this generation of computers over 100
computer programming languages were developed, computers had memory and
operating systems. Storage media such as tape and disk were in use also were printers
for output.
Third generation: 1963 - present - The invention of integrated circuit brought us the
third generation of computers. With this invention computers became smaller, more
powerful more reliable and they are able to run many different programs at the same
time. In1980 Microsoft Disk Operating System (MS-Dos) was born and in 1981 IBM
introduced the personal computer (PC) for home and office use. Three years later Apple
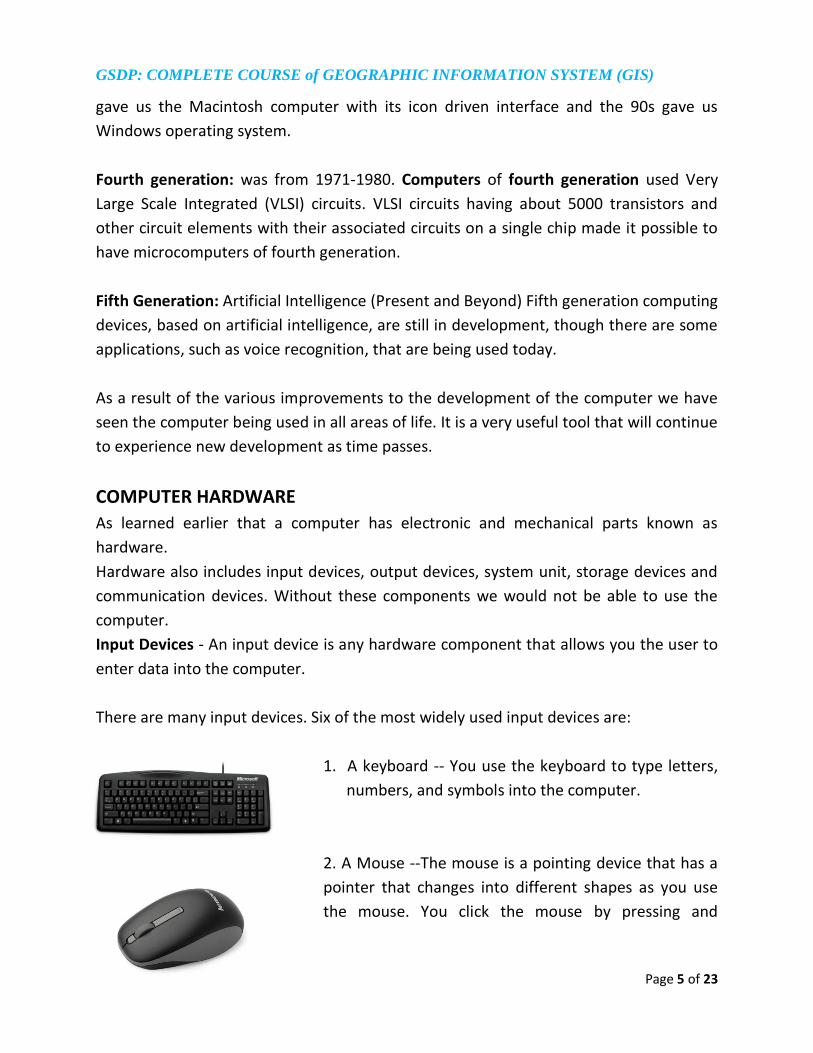
GSDP: COMPLETE COURSE of GEOGRAPHIC INFORMATION SYSTEM (GIS)
Page 5 of 23
gave us the Macintosh computer with its icon driven interface and the 90s gave us
Windows operating system.
Fourth generation: was from 1971-1980. Computers of fourth generation used Very
Large Scale Integrated (VLSI) circuits. VLSI circuits having about 5000 transistors and
other circuit elements with their associated circuits on a single chip made it possible to
have microcomputers of fourth generation.
Fifth Generation: Artificial Intelligence (Present and Beyond) Fifth generation computing
devices, based on artificial intelligence, are still in development, though there are some
applications, such as voice recognition, that are being used today.
As a result of the various improvements to the development of the computer we have
seen the computer being used in all areas of life. It is a very useful tool that will continue
to experience new development as time passes.
COMPUTER HARDWARE
As learned earlier that a computer has electronic and mechanical parts known as
hardware.
Hardware also includes input devices, output devices, system unit, storage devices and
communication devices. Without these components we would not be able to use the
computer.
Input Devices - An input device is any hardware component that allows you the user to
enter data into the computer.
There are many input devices. Six of the most widely used input devices are:
1. A keyboard -- You use the keyboard to type letters,
numbers, and symbols into the computer.
2. A Mouse --The mouse is a pointing device that has a
pointer that changes into different shapes as you use
the mouse. You click the mouse by pressing and
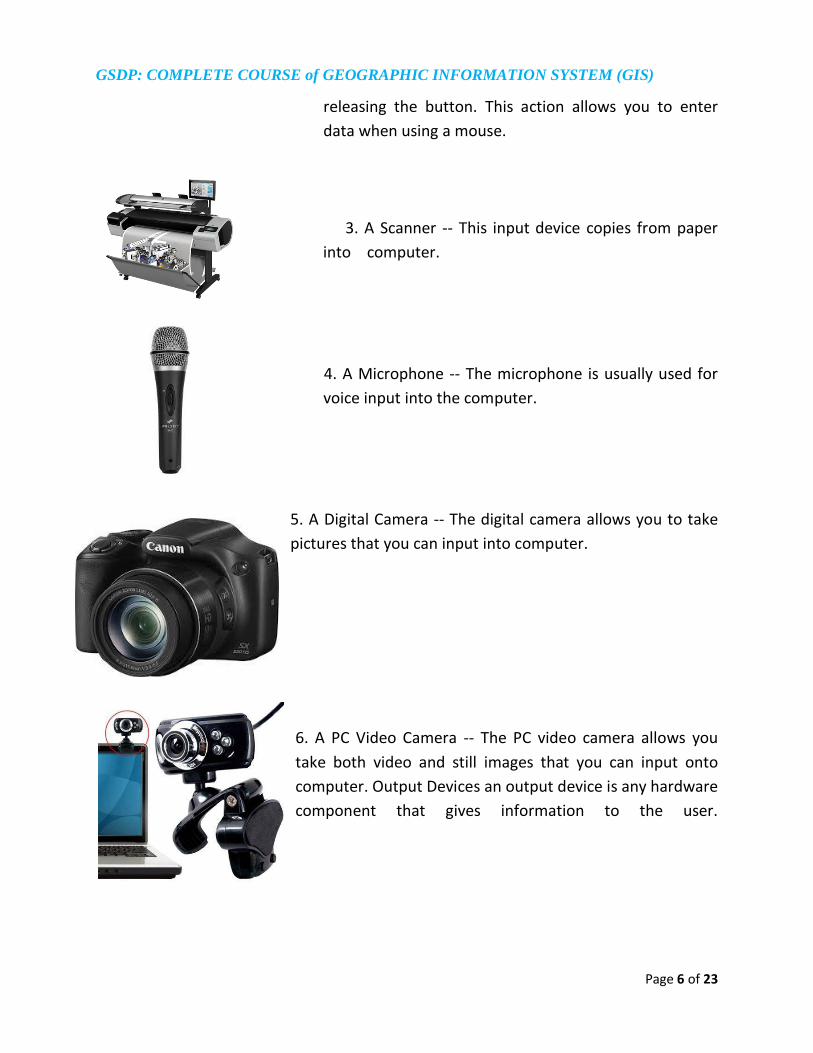
GSDP: COMPLETE COURSE of GEOGRAPHIC INFORMATION SYSTEM (GIS)
Page 6 of 23
releasing the button. This action allows you to enter
data when using a mouse.
3. A Scanner -- This input device copies from paper
into computer.
4. A Microphone -- The microphone is usually used for
voice input into the computer.
5. A Digital Camera -- The digital camera allows you to take
pictures that you can input into computer.
6. A PC Video Camera -- The PC video camera allows you
take both video and still images that you can input onto
computer. Output Devices an output device is any hardware
component that gives information to the user.
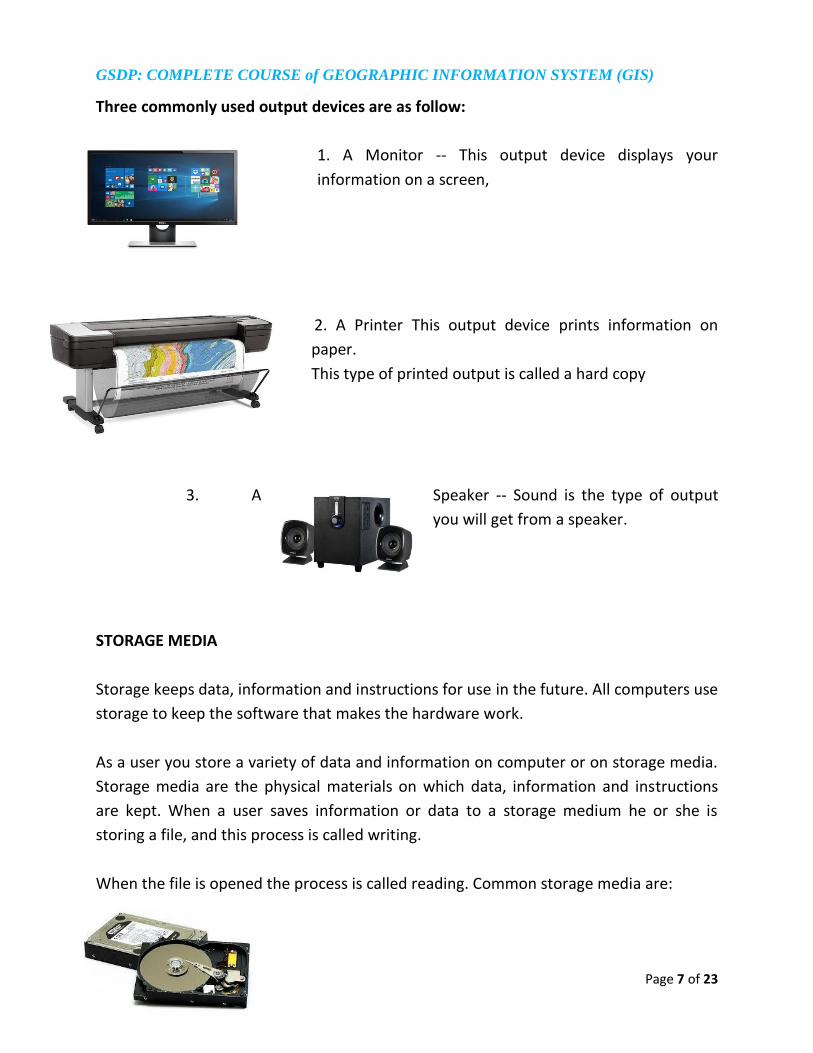
GSDP: COMPLETE COURSE of GEOGRAPHIC INFORMATION SYSTEM (GIS)
Page 7 of 23
Three commonly used output devices are as follow:
1. A Monitor -- This output device displays your
information on a screen,
2. A Printer This output device prints information on
paper.
This type of printed output is called a hard copy
3. A Speaker -- Sound is the type of output
you will get from a speaker.
STORAGE MEDIA
Storage keeps data, information and instructions for use in the future. All computers use
storage to keep the software that makes the hardware work.
As a user you store a variety of data and information on computer or on storage media.
Storage media are the physical materials on which data, information and instructions
are kept. When a user saves information or data to a storage medium he or she is
storing a file, and this process is called writing.
When the file is opened the process is called reading. Common storage media are:
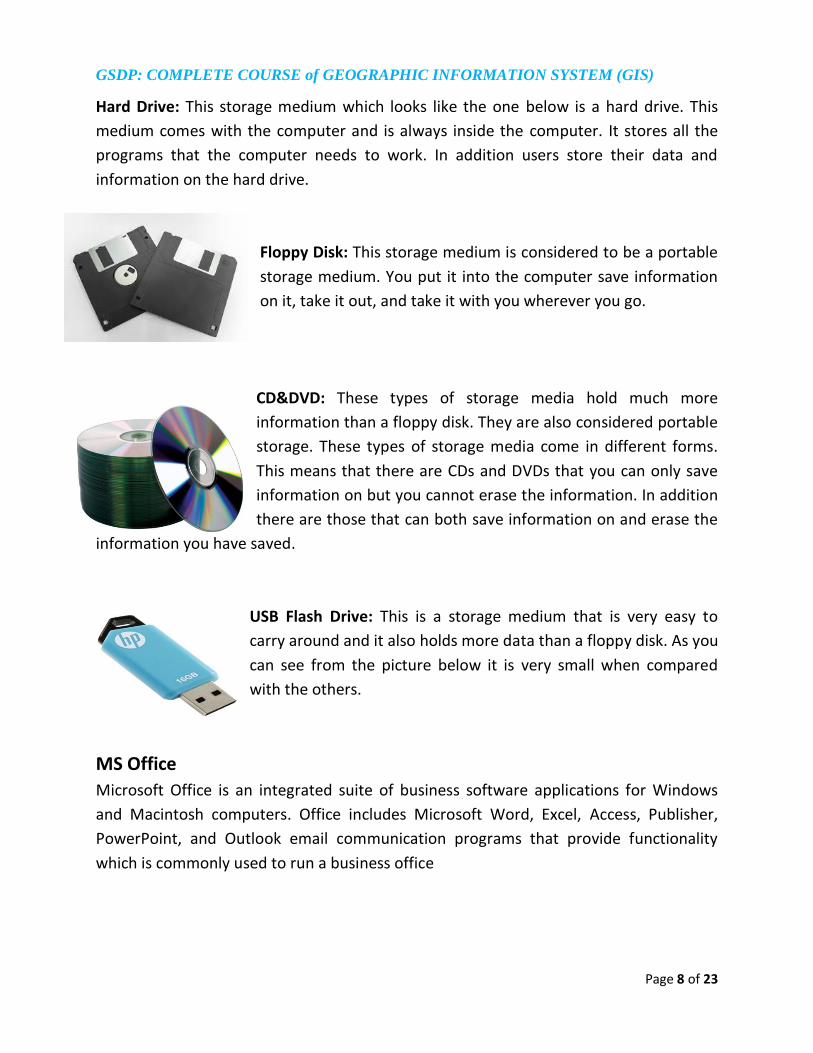
GSDP: COMPLETE COURSE of GEOGRAPHIC INFORMATION SYSTEM (GIS)
Page 8 of 23
Hard Drive: This storage medium which looks like the one below is a hard drive. This
medium comes with the computer and is always inside the computer. It stores all the
programs that the computer needs to work. In addition users store their data and
information on the hard drive.
Floppy Disk: This storage medium is considered to be a portable
storage medium. You put it into the computer save information
on it, take it out, and take it with you wherever you go.
CD&DVD: These types of storage media hold much more
information than a floppy disk. They are also considered portable
storage. These types of storage media come in different forms.
This means that there are CDs and DVDs that you can only save
information on but you cannot erase the information. In addition
there are those that can both save information on and erase the
information you have saved.
USB Flash Drive: This is a storage medium that is very easy to
carry around and it also holds more data than a floppy disk. As you
can see from the picture below it is very small when compared
with the others.
MS Office
Microsoft Office is an integrated suite of business software applications for Windows
and Macintosh computers. Office includes Microsoft Word, Excel, Access, Publisher,
PowerPoint, and Outlook email communication programs that provide functionality
which is commonly used to run a business office

GSDP: COMPLETE COURSE of GEOGRAPHIC INFORMATION SYSTEM (GIS)
Page 9 of 23
Internet and Email
The internet is a globally connected network system that uses TCP/IP to transmit data
via various types of media. The internet is a network of global exchanges – including
private, public, business, academic and government networks – connected by guided,
wireless and fiber-optic technologies.
E-mail Application: Outlook Express is an e-mail program that allows you to receive and
send e-mails. Messages distributed by electronic means from one computer user to one
or more recipients via a network.
GEOGRAPHY
The scientific study of the Earth's surface and its various climates, countries, peoples,
and natural resources. The physical characteristics, especially the surface features, of an
area.
GSDP: COMPLETE COURSE of GEOGRAPHIC INFORMATION SYSTEM (GIS)
Page 10 of 23
CHAPTER-1
GIS SOFTWARES
ArcGIS (ESRI-Environmental Systems Research Institute)
Esri busted onto the geospatial scene in the 1970s. They’ve pulled ahead as being the
market leader in commercial GIS software and hasn’t looked back since. The fine-tuned
Esri ArcGIS is the most innovative, cutting-edge GIS software in the industry.
ArcGlobe and ArcScene bring objects to life in a separate 3D interface. Furthermore,
ArcEarth has an interface similar to Google Earth that is part of the Esri family of
software. Standard mapping is top-notch in ArcMap. They’ve perfected automatic map
production with data-driven pages, ultimately saving you time and money. The
extensions are amazing. Network analyst is one of a kind, and nothing comes close from
other commercial GIS software. ArcGIS simplifies geostatistics by actually teaching you
statistics giving the user more informed decisions. Scripting and model builder deserves
the entire rave it gets. Stringing together models is an easy process after a bit of
practice. Esri GIS software provides scalability, interoperability, stability, flexibility with
their cartographic, modelling and spatial features. AutoCAD Map 3D (Autodesk)
AutoCAD Map
AutoCAD isn’t just about drafting. AutoCAD Map 3D bridges the gap between CAD and
GIS.
For those already using Autodesk, this commercial GIS software gives a familiar interface
to manage spatial data and underlying asset information. With its growing range of tools
to choose from, you can also produce some beautiful cartographic output. As the name
suggests, AutoCAD Map 3D seamlessly renders spatial data in three dimensions.
Whether you’re working in oil and gas, public utilities or the mining industry, 3D
mapping is an advantageous feature. And AutoCAD certainly delivers in that respect and
much more.

GSDP: COMPLETE COURSE of GEOGRAPHIC INFORMATION SYSTEM (GIS)
Page 11 of 23
MapInfo Professional
MapInfo Professional has come a long way in terms of proprietary GIS software. It has a
clear focus on location intelligence. Locate optimal positions for retail stores, uncover
geographic patterns and improve insurance risk with GIS insurance mapping. Usability
means productivity – This is a core philosophy for MapInfo. It comes naturally as
naturally to you as breathing. Ultimately, this helps drive greater profits. The latest
version brings improvements in cartographic output. It’s smarter with labeling, legend
and scale bars. It brings 64-bit compatibility, enhanced layouts and much more. It’s a
full-blown GIS software package always mapping out new ways to innovate.
Quantum GIS QGIS (previously known as Quantum GIS) is a free and open-source cross-platform
desktop geographic information system (GIS) application that supports viewing, editing,
and analysis of geospatial data.
GSDP: COMPLETE COURSE of GEOGRAPHIC INFORMATION SYSTEM (GIS)
Page 12 of 23
CHAPTER-2
FUNDAMENTALS OF GIS
A Geographic Information System (GIS) is a software package that is helping to digitize
the world around us. Geographic Information System (GIS) is used by multi-disciplines as
tools for spatial data handling in a geographic environment. Basic elements of GIS
consist of hardware, software, data and liveware.
Dr. Roger Tomlinson (1933-2014) English geographer and the primary originator of
modern computerised geographic information systems generally recognized as the
"father of GIS.” He is the visionary geographer who conceived and developed the first
GIS for use by the Canada Land Inventory in the early 1960s.
1. Definition
An integrated collection of computer software and data used to view and manage
information about geographic places, analyze spatial relationships, and model spatial
processes. A GIS provides a framework for gathering and organizing spatial data and
related information so that it can be displayed and analyzed.
2. Components of GIS
A working GIS integrates five key components: hardware, software, data, people, and
methods. Hardware is the computer on which a GIS operates. Today, GIS software runs
on a wide range of hardware types, from centralized computer servers to desktop
computers used in stand-alone or networked configurations.
3. Applications of GIS
Uses of GIS range from indigenous people, communities, research institutions,
environmental scientists, health organizations, land use planners, businesses, and
government agencies at all levels.
GSDP: COMPLETE COURSE of GEOGRAPHIC INFORMATION SYSTEM (GIS)
Page 13 of 23
CHAPTER-3
LAYERS
The visual representation of a geographic dataset in any digital map environment.
Conceptually, a layer is a slice or stratum of the geographic reality in a particular area,
and is more or less equivalent to a legend item on a paper map. On a road map, for
example, roads, national parks, political boundaries, and rivers might be considered
different layers.
In ArcGIS, a reference to a data source, such as a shapefile, coverage, geodatabase
feature class, or raster, that defines how the data should be symbolized on a map.
Layers can also define additional properties, such as which features from the data
source are included. Layers can be stored in map documents (.mxd) or saved individually
as layer files (.lyr). Layers are conceptually similar to themes in ArcView 3.x.
FEATURES
A representation of a real-world object on a map.
Raster
A spatial data model that defines space as an array of equally sized cells arranged in
rows and columns, and composed of single or multiple bands. Each cell contains an
attribute value and location coordinates. Unlike a vector structure, which stores
coordinates explicitly, raster coordinates are contained in the ordering of the matrix.
Groups of cells that share the same value represent the same type of geographic
feature.
Raster data is an abstraction of the real world where spatial data is expressed as a
matrix of cells or pixels, with spatial position implicit in the ordering of the pixels. With
the raster data model, spatial data is not continuous but divided into discrete units. This
makes raster data particularly suitable for certain types of spatial operation, for example
overlays or area calculations.
Raster structures may lead to increased storage in certain situations, since they store
each cell in the matrix regardless of whether it is a feature or simply 'empty' space.
GSDP: COMPLETE COURSE of GEOGRAPHIC INFORMATION SYSTEM (GIS)
Page 14 of 23
Vector
A coordinate-based data model that represents geographic features as points, polylines,
and polygons. Each point feature is represented as a single coordinate pair, while line
and polygon features are represented as ordered lists of vertices. Attributes are
associated with each vector feature, as opposed to a raster data model, which
associates attributes with grid cells.
1. Point: A geometric element defined by a pair of x, y coordinates. A map
feature that has neither length nor area at a given scale, such as a city on a
world map or a building on a city map.
2. Polyline: a digital map feature that represents a place or thing that has length
but not area at a given scale. A polyline feature may have one or more parts.
For example, a stream is typically a polyline feature with one part. If the
stream goes underground and later reemerges, it might be represented as a
multipart polyline feature with discontinuous parts. If the stream diverges
around an island and then rejoins itself, it might be represented as a multipart
polyline feature with branching parts. A multipart polyline feature is
associated with a single record in an attribute table.
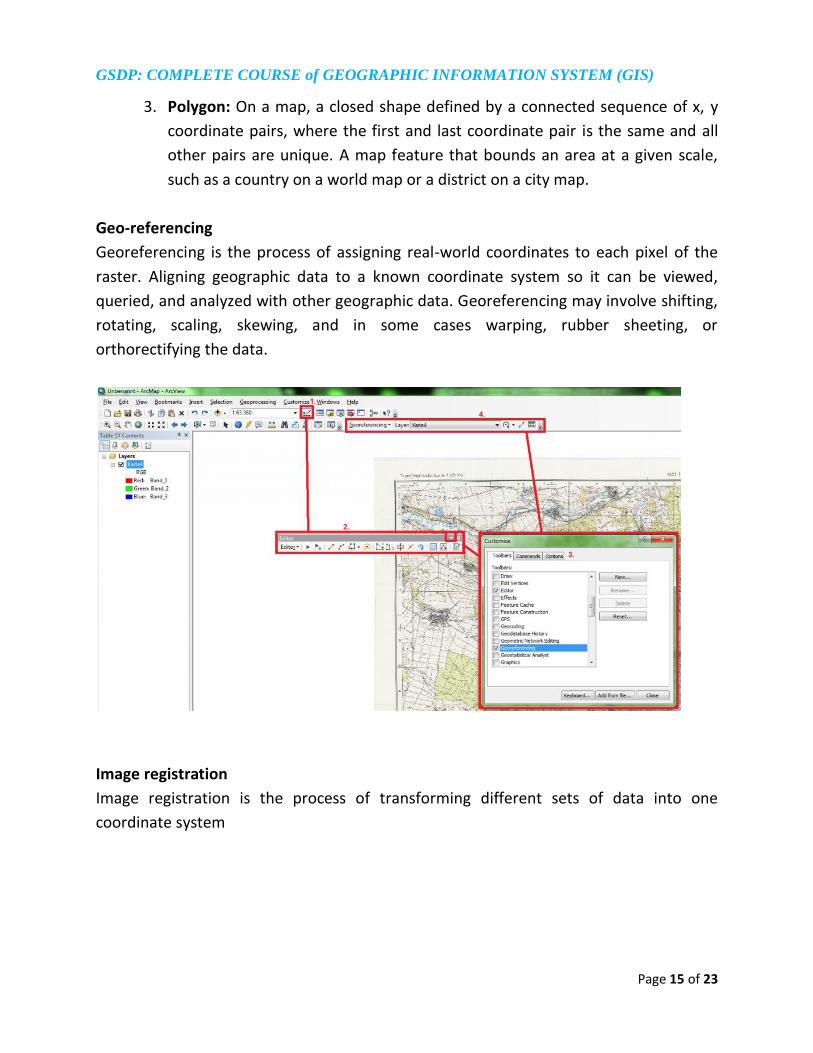
GSDP: COMPLETE COURSE of GEOGRAPHIC INFORMATION SYSTEM (GIS)
Page 15 of 23
3. Polygon: On a map, a closed shape defined by a connected sequence of x, y
coordinate pairs, where the first and last coordinate pair is the same and all
other pairs are unique. A map feature that bounds an area at a given scale,
such as a country on a world map or a district on a city map.
Geo-referencing
Georeferencing is the process of assigning real-world coordinates to each pixel of the
raster. Aligning geographic data to a known coordinate system so it can be viewed,
queried, and analyzed with other geographic data. Georeferencing may involve shifting,
rotating, scaling, skewing, and in some cases warping, rubber sheeting, or
orthorectifying the data.
Image registration
Image registration is the process of transforming different sets of data into one
coordinate system
GSDP: COMPLETE COURSE of GEOGRAPHIC INFORMATION SYSTEM (GIS)
Page 16 of 23
CHAPTER-4
SPATIAL DATA AND GIS BASICS
Information about the locations and shapes of geographic features and the relationships
between them, usually stored as coordinates and topology.
Digitization
The process of converting the geographic features on an analog map into digital format
using a digitizing tablet, or digitizer, which is connected to a computer. Features on a
paper map are traced with a digitizer puck, a device similar to a mouse, and the x, y
coordinates of these features are automatically recorded and stored as spatial data.
Data attributes
Nonspatial information about a geographic feature in a GIS, usually stored in a table and
linked to the feature by a unique identifier. For example, attributes of a river might
include its name, length, and sediment load at a gauging station.
Spatial topology
Topology in GIS is generally defined as the spatial relationships between adjacent or
neighbouring features. Mathematical topology assumes that geographic features occur
on a two-dimensional plane.
1. In geodatabases, the arrangement that constrains how point, line, and polygon
features share geometry. For example, street centerlines and census blocks share
geometry, and adjacent soil polygons share geometry. Topology defines and
enforces data integrity rules (for example, there should be no gaps between
polygons). It supports topological relationship queries and navigation (for
example, navigating feature adjacency or connectivity), supports sophisticated
editing tools, and allows feature construction from unstructured geometry (for
example, constructing polygons from lines).
2. The branch of geometry that deals with the properties of a figure that remains
unchanged even when the figure is bent, stretched, or otherwise distorted.
3. In an ArcInfo coverage, the spatial relationships between connecting or adjacent
features in a geographic data layer (for example, arcs, nodes, polygons, and
points). Topological relationships are used for spatial modeling operations that
do not require coordinate information.
GSDP: COMPLETE COURSE of GEOGRAPHIC INFORMATION SYSTEM (GIS)
Page 17 of 23
CHAPTER-5
FUNDAMENTALS OF MAPS
What is Map
A graphic representation of the spatial relationships of entities within an area.
Types of Map
There are many different types of maps, which are usually classified according to what
they are attempting to show. However, it must be noted that there are many different
ways to interpret the types of maps. One common point of view is that there are two
main types of maps:
1. Those which summarise the actual landscape (topographic and general reference
maps); and
2. Those which describe ⁄ comment on specific features using the landscape as a
background or for context (all other maps – usually called thematic maps).
For ease of describing functionally quite different maps; and to explain what can be
confusing differences; we have opted to use a greater number of map types. To read
more on these topics:
General Reference (sometimes called planimetric maps)
Topographic Maps
Thematic
Navigation Charts
Cadastral Maps and Plans
It must be noted that even this is a simplistic approach as there are often overlapping
features between maps. For example, a topographic map may be used to show the
distribution of a native orchid (therefore it is both a topographic and thematic map) or
may be used to show features of particular interest to tourists (topographic, general
reference and thematic).
All of these map types may be a unique, stand-alone, map with no relationship to other
maps or they may be part of a series of related maps, these are generally called Series
Maps.

GSDP: COMPLETE COURSE of GEOGRAPHIC INFORMATION SYSTEM (GIS)
Page 18 of 23
Map Properties
1. Title
2. Scale
3. Projection
4. Legend
5. North arrow
CHAPTER-6
SCALES
Definition:
The ratio or relationship between a distance or area on a map and the corresponding
distance or area on the ground, commonly expressed as a fraction or ratio. A map scale
of 1/100,000 or 1:100,000 mean that one unit of measure on the map equals 100,000 of
the same unit on the earth.
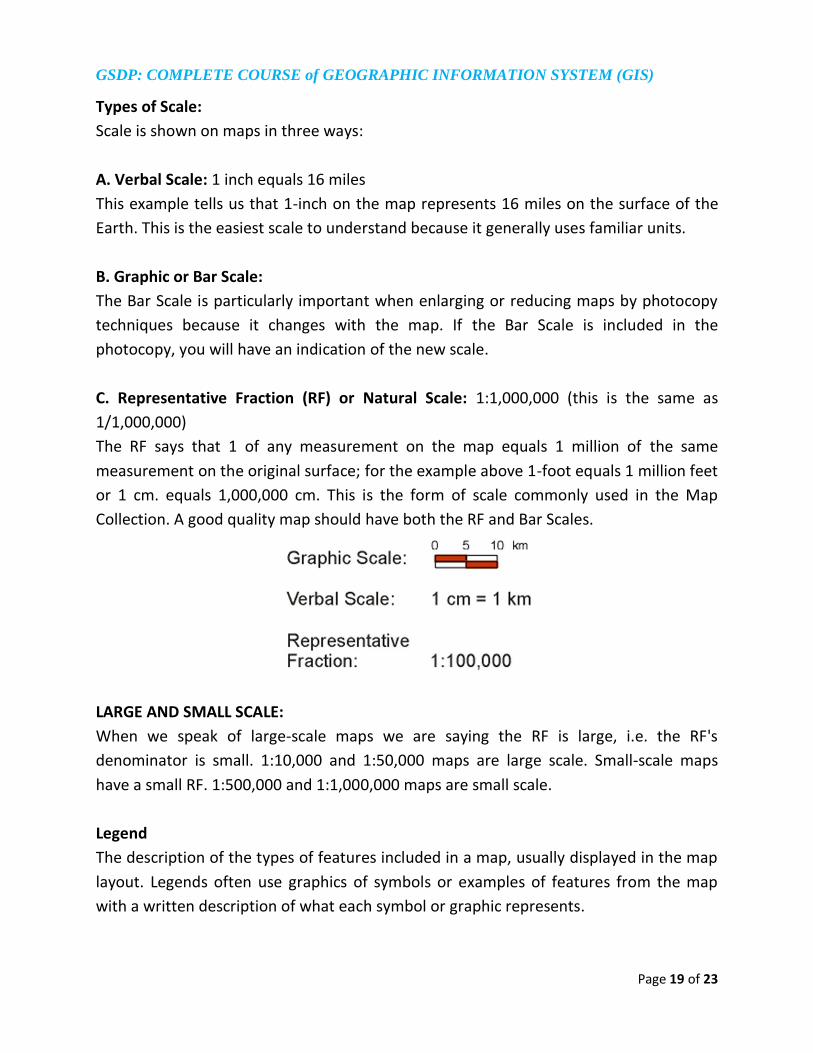
GSDP: COMPLETE COURSE of GEOGRAPHIC INFORMATION SYSTEM (GIS)
Page 19 of 23
Types of Scale:
Scale is shown on maps in three ways:
A. Verbal Scale: 1 inch equals 16 miles
This example tells us that 1-inch on the map represents 16 miles on the surface of the
Earth. This is the easiest scale to understand because it generally uses familiar units.
B. Graphic or Bar Scale:
The Bar Scale is particularly important when enlarging or reducing maps by photocopy
techniques because it changes with the map. If the Bar Scale is included in the
photocopy, you will have an indication of the new scale.
C. Representative Fraction (RF) or Natural Scale: 1:1,000,000 (this is the same as
1/1,000,000)
The RF says that 1 of any measurement on the map equals 1 million of the same
measurement on the original surface; for the example above 1-foot equals 1 million feet
or 1 cm. equals 1,000,000 cm. This is the form of scale commonly used in the Map
Collection. A good quality map should have both the RF and Bar Scales.
LARGE AND SMALL SCALE:
When we speak of large-scale maps we are saying the RF is large, i.e. the RF's
denominator is small. 1:10,000 and 1:50,000 maps are large scale. Small-scale maps
have a small RF. 1:500,000 and 1:1,000,000 maps are small scale.
Legend
The description of the types of features included in a map, usually displayed in the map
layout. Legends often use graphics of symbols or examples of features from the map
with a written description of what each symbol or graphic represents.
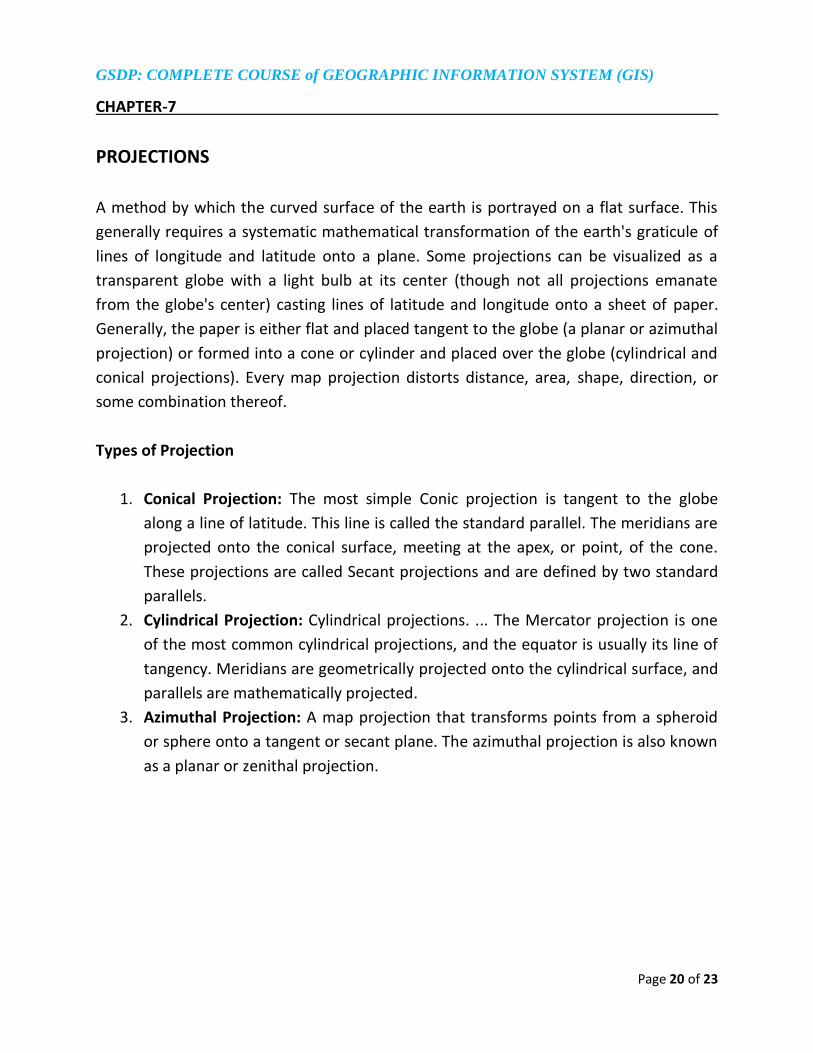
GSDP: COMPLETE COURSE of GEOGRAPHIC INFORMATION SYSTEM (GIS)
Page 20 of 23
CHAPTER-7
PROJECTIONS
A method by which the curved surface of the earth is portrayed on a flat surface. This
generally requires a systematic mathematical transformation of the earth's graticule of
lines of longitude and latitude onto a plane. Some projections can be visualized as a
transparent globe with a light bulb at its center (though not all projections emanate
from the globe's center) casting lines of latitude and longitude onto a sheet of paper.
Generally, the paper is either flat and placed tangent to the globe (a planar or azimuthal
projection) or formed into a cone or cylinder and placed over the globe (cylindrical and
conical projections). Every map projection distorts distance, area, shape, direction, or
some combination thereof.
Types of Projection
1. Conical Projection: The most simple Conic projection is tangent to the globe
along a line of latitude. This line is called the standard parallel. The meridians are
projected onto the conical surface, meeting at the apex, or point, of the cone.
These projections are called Secant projections and are defined by two standard
parallels.
2. Cylindrical Projection: Cylindrical projections. ... The Mercator projection is one
of the most common cylindrical projections, and the equator is usually its line of
tangency. Meridians are geometrically projected onto the cylindrical surface, and
parallels are mathematically projected.
3. Azimuthal Projection: A map projection that transforms points from a spheroid
or sphere onto a tangent or secant plane. The azimuthal projection is also known
as a planar or zenithal projection.
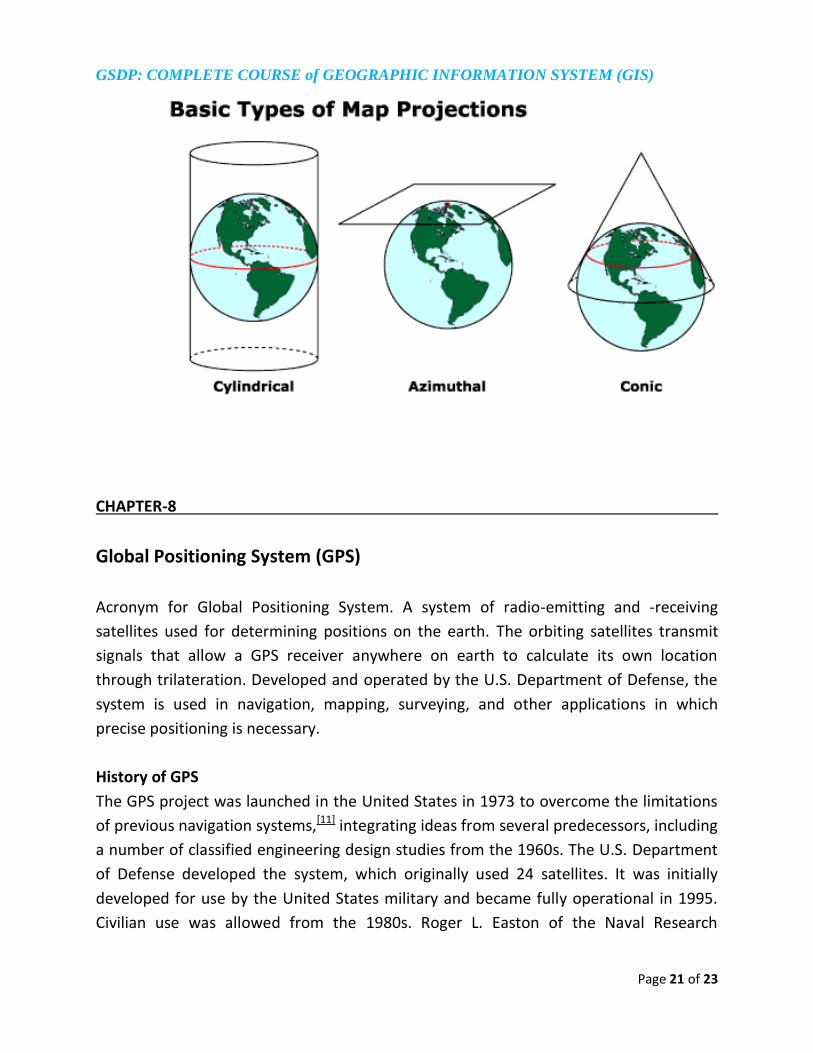
GSDP: COMPLETE COURSE of GEOGRAPHIC INFORMATION SYSTEM (GIS)
Page 21 of 23
CHAPTER-8
Global Positioning System (GPS)
Acronym for Global Positioning System. A system of radio-emitting and -receiving
satellites used for determining positions on the earth. The orbiting satellites transmit
signals that allow a GPS receiver anywhere on earth to calculate its own location
through trilateration. Developed and operated by the U.S. Department of Defense, the
system is used in navigation, mapping, surveying, and other applications in which
precise positioning is necessary.
History of GPS
The GPS project was launched in the United States in 1973 to overcome the limitations
of previous navigation systems,[11] integrating ideas from several predecessors, including
a number of classified engineering design studies from the 1960s. The U.S. Department
of Defense developed the system, which originally used 24 satellites. It was initially
developed for use by the United States military and became fully operational in 1995.
Civilian use was allowed from the 1980s. Roger L. Easton of the Naval Research

GSDP: COMPLETE COURSE of GEOGRAPHIC INFORMATION SYSTEM (GIS)
Page 22 of 23
Laboratory, Ivan A. Getting of The Aerospace Corporation, and Bradford Parkinson of
the Applied Physics Laboratory are credited with inventing it.
The design of GPS is based partly on similar ground-based radio-navigation systems,
such as LORAN and the Decca Navigator, developed in the early 1940s.
Navigate the GPS
The GPS has different screens and menus that allow you to do different things. To
switch between screens, press the button marked “X”, just above the power
button on the right side of the device. This button also serves to go back. If you
press something by mistake and would like to cancel or go back, press the “X”
button.
By pressing the X button, you should be able to flip through different screens that
will look something like this:
GSDP: COMPLETE COURSE of GEOGRAPHIC INFORMATION SYSTEM (GIS)
Page 23 of 23
If you return to the Satellites page, you can see that you are connected to three
or more satellites. In the upper left corner are coordinates, latitude and
longitude.
Flip to the Map page, and you can see a map of where you are. If you have added
OSM maps to GPS, you may see roads and places. Otherwise, the map may look
quite blank. Zoom in and out by pressing the up and down arrow buttons on the
left side of the GPS.
Tracks and Waypoints
GPS records two kinds of information that are useful for creating maps or saving the
coordinates of a place. First, it allows you to save location in the memory of the GPS.
When you save a location, the coordinates will be saved with a name. For example, first
saved point will be named 001, the second 002, and so on.
Download Saved points from GPS to GIS Platform
Step 1: Connect the GPS unit to the computer through cable.
Step 2: Configure the GPS receiver
Step 3: Start the download software
Step 4: Download the waypoints
Step 5: Save the waypoints.

NOTES

GUJARAT CLEANER PRODUCTION CENTRE ENVIS RESOURCE PARTNER
MINISTRY OF ENVIRONMENT, FOREST & CLIMATE CHANGE
GOVERNMENT OF INDIA
BLOCK NO.11 & 12, 3RD FLOOR, UDYOG BHAVAN, SECTOR-11
GANDHINAGAR-382017, GUJARAT, INDIA
TELEPHONE: + 91 79 23244147, EMAIL: [email protected], [email protected]
WEBSITE: www.gcpcenvis.nic.in

Partners in Green Skilling:
Environment Protection Training & Research Institute (EPTRI)
Designed & Published by Environmental Information (EI) Division, Ministry of Environment, Forest & Climate Change, Indira Paryavaran Bhawan, Jorbagh Road, New Delhi-110003
011-24695377 www.envis.nic.in @
Gujarat Cleaner Production Centre
ENVIS RP


![Gsdp all states[1]](https://img.pdfslide.us/doc/110x75/55d1f1d2bb61eb662c8b45fc/gsdp-all-states1.jpg)