Embed Size (px)
Citation preview
Harvard Institute forInternational Development
HARVARD UNIVERSITY
Development Discussion Papers
Economic Convergence and Economic Policies
Jeffrey D. Sachs and Andrew M. Warner
Development Discussion Paper No. 502March 1995
© Copyright 1995 Jeffrey D. Sachs, Andrew M. Warner,and President and Fellows of Harvard College
Economic Convergence and Economic Po1icies
Jeffrey D. Sachs and Andrew M. Warner*
ABSTRACT
Many of the crucial debates in development economics areencapsulated in the question of economic convergence. Is there atendency for the poorer countries to grow more rapidly than thericher countries, and thereby to converge in living standards?Some recent research on endogenous growth has emphasisedincreasing returns as a possible reason not to expectconvergence. Other research has suggested that convergence maybe achieved only after poor countries attain a threshold level ofincome or human capital. This paper presents evidence that asufficient condition for higher-than-average growth of poorercountries, and therefore convergence, is that poorer countriesfollow reasonably efficient economic policies, mainly open tradeand protection of private property rights.
Jeffrey Sachs is the Galen L. Stone Professor of InternationalTrade at Harvard University, Faculty Fellow at the HarvardInstitute for International Development, and a ResesarchAssociate of the National Bureau of Economic Research. Sachsserves as an economic advisor to several governmentes in LatinAmerica, Eastern Europe, the Former Soviet Union, and Asia. Hehas also been a consultant to the IMF, the World Bank, the OEeD,and the UNDP.
Andrew Warner is a Resesarch Associate at the Harvard Institutefor International Development, currently working with ProfessorJeffrey Sachs to establish an economic resesarch instsitute inMosco, Russia. He received his Ph.D. in economics from Harvard in1991, and has worked at the Board of Governors of the FederalReserve and the World Bank. He has previously publihsed papers onthe international debt crisis of the 1980's and on American tradeperformance.
*We thank Robert Barro, Bradford DeLong, Robert King, Jong-Wha Lee, RossLevine, Lant Pritchett and Lawrence Summers for sharing their data with us,and seminar participants at UCLA and Berkeley for helpful comments.
I. Introduction
Many of the crucial debates in development economics are encapsulated in
the question of economic convergence. Is there a tendency for the poorer
countries to grow more rapidly than the richer countries, and thereby to converge
in living standards? Or instead, are there tendencies for the 11 rich to get
richer, and the poor to get poorer, 11 so that the gap between rich and poor
nations tends to widen over time?
An enormous professional debate over this issue has been underway during
the past decade, instigated by several theoretical and empirical insights. Paul
Romer (1986) provided a major spur to the debate by introducing a theoretical
growth model with increasing-returns-to-scale production technology, which
results in a strong tendency for rich countries to maintain or even increase
their lead over poorer countries. Romer stressed that the more standard
technology assumptions of the Solow growth model lead to the presumption that the
poorer countries would experience faster growth1• Romer noted that his
theoretical model with increasing returns to scale seemed to be broadly
consistent with the cross-country growth experience of the post-war era, in which
there was no discernable trend for the poorer nations to converge with the richer
nations. 2
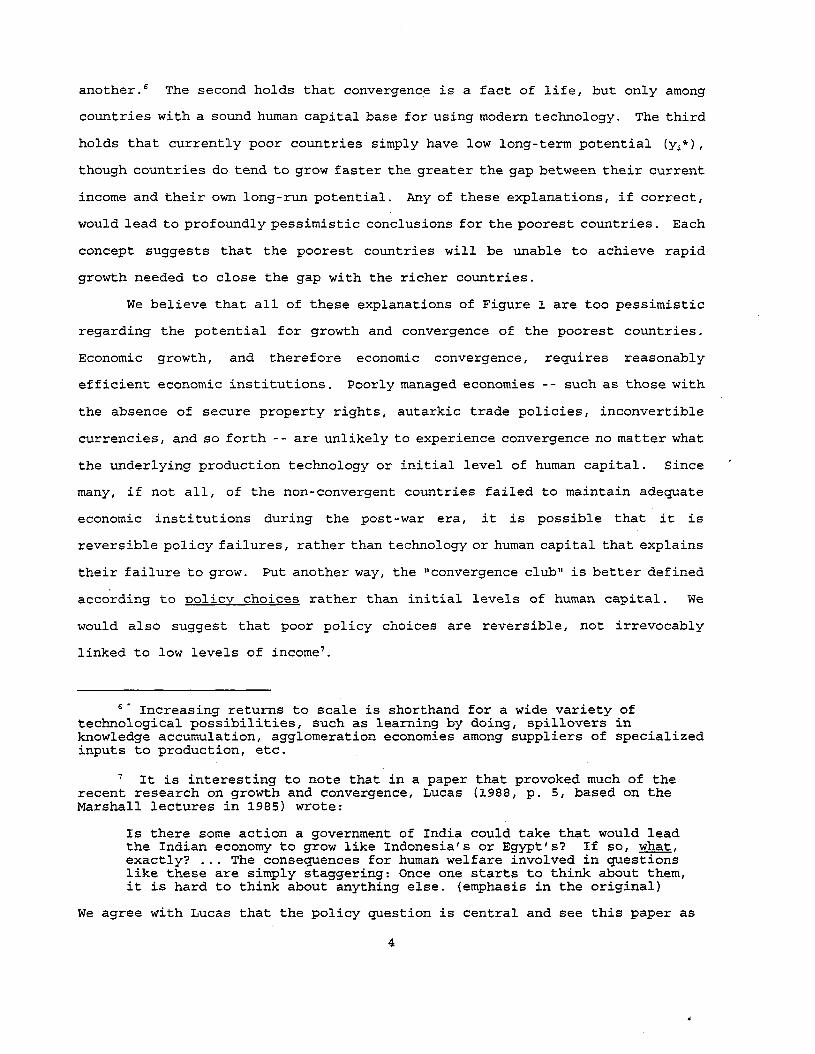
Romer's point about the absence of convergence is evident in Figure 1. We
graph on the x-axis the' 1970 level of per capita income of several dozen
developing countries, and on the y-axis the growth of per capita income between
1 More precisely, as Mankiw, Romer and Weil (1992) have clarified, theSolow model predicts conditional convergence: countries will have differentsteady state income levels, but after controlling for the determinants of thesteady state income level, the poorer countries should grow faster than richercountries.
2 He was also careful, however, to point out the problem of interpretingsuch simple correlations:
Cross-country comparisons of growth rates are complicated by thedifficulty of controlling for political and social variables that appearto strongly influence the growth process.
1
~970-89.3 If convergence predominated in the data, then we would find a
negative relationship between initial income in 1970 and subsequent growth
between 1970 and ~989. No such tendency is found overall in the world economy
during this time period. Many poor countries, particularly those in Sub-Saharan
Africa, not only fail to grow faster than the rich countries; they in fact
experience negative per capita growth, so that the gap between these countries
and the rich countries widens significantly.
Romer's theoretical model and empirical insight set off a decade-long
debate which still continues. Many authors, such as Dowrick and Nguyen (1989),
demonstrated that convergence seemed to hold among the richest countries alone,
specifically those countries in the Organization for Economic Cooperation and
Development (OECD) 4. Baumol and others suggested that there may be a
"convergence club," meaning a subset of countries for which convergence applies,
while countries outside of "club" would not necessarily experience convergence
via-a-vis those in the club:
It also seems clear that convergence does not apply to the poorest of theworld's economies, though the line separating those eligible formembership in the convergence club and those foreclosed from membershiphas not been determined definitively. (Baumol, 1994, p. 82)
Baumol suggested that only countries with an adequate initial level of human
capital endowments can take advantage of modern technology to enjoy the
possibility of convergent growth. Baumol (1994, p. 65) therefore speaks of the
"advantages of moderate backwardness," arguing that while middle-income
developing countries can take advantage of their lag in technology to borrow from
abroad, the poorest countries are unable to bridge the gap in technology and
knowledge.
Barro (1991) and Barro and Sala-i-Martin (1991, 1992) introduced a related
The exact definitions of the data and the selection of countries isdescribed in the Appendix.
4 Interestingly, Williamson (1993) presents further evidence that amongthe current members of the OECD, convergence has been going on since 1850,interrupted only by the four decades between 1913 and 1950.
2
notion of "conditional convergence," in which countries purportedly differ in
their long-run per capita income levels, with each country tending to grow more
rapidly the greater is the gap between its initial per capita income level and
its~ long-run per capita income level. Formally, country i is assumed to have
the long-run per capita income level Yi*' and initial per capita income level
Yi' The rate of growth,
gap between Yi* and Yi
Yi' is assumed to be an increasing function of the
(1)
A positive value of ~ is said to signify conditional convergence. In turn, Yi*
is proxied by certain "structural" variables, such as the initial level of human
capital, according to an equation Yi* = l:rji Zji' Barro and co-authors then
estimate a regression equation of the form:
(2 )
They tend to find a positive and significant coefficient for ~ and significant
coefficients on several structural variables ZS. Like Baumol, Barro 1991, p.
409) concludes that:
A poor country tends to grow faster than a rich country, but only for agiven quantity of human capital; that is, only if the poor country's humancapital exceeds the amount that typically accompanies the low level of percapita income.
In summary, there have been three dominant explanations offered in the
literature for the absence of convergence in Figure 1. The first holds that
productive technology is intrinsically kind to the technological leader: the rich
tend to grow richer as a result of increasing returns to scale in one form or
5 The finding of conditional convergence is now fairly well establishedin the empirical literature. A number of studies have found this result usingpost-WWII data with different conditioning variables. The list of suchstudies includes Barro (1991), DeLong and Summers (1991), King and Levine(1993), Levine and Renelt (1992), Mankiw, Romer and Weil (1992), and Sachs andWarner (1994).
3
another. 6 The second holds that convergence is a fact of life, but only among
countries with a sound human capital base for using modern technology. The third
holds that currently poor countries simply have low long-term potential (Yi*) ,
though countries do tend to grow faster the greater the gap between their current
income and their own long-run potential. Any of these explanations, if correct,
would lead to profoundly pessimistic conclusions for the poorest countries. Each
concept suggests that the poorest countries will be unable to achieve rapid
growth needed to close the gap with the richer countries.
We believe that all of these explanations of Figure 1 are too pessimistic
regarding the potential for growth and convergence of the poorest countries.
Economic growth, and therefore economic convergence, requires reasonably
efficient economic institutions. Poorly managed economies -- such as those with
the absence of secure property rights, autarkic trade policies, inconvertible
currencies, and so forth -- are unlikely to experience convergence no matter what
the underlying production technology or initial level of human capital. Since
many, if not all, of the non-convergent countries failed to maintain adequate
economic institutions during the post-war era, it is possible that it is
reversible policy failures, rather than technology or human capital that explains
their failure to grow. Put another way, the I1convergence club l1 is better defined
according to policy choices rather than initial levels of human capital. We
would also suggest that poor policy choices are reversible, not irrevocably
linked to low levels of income'.
6" Increasing returns to scale is shorthand for a wide variety oftechnological possibilities, such as learning by doing, spillovers inknowledge accumulation, agglomeration economies among suppliers of specializedinputs to production, etc.
, It is interesting to note that in a paper that provoked much of therecent research on growth and convergence, Lucas (1988, p. 5, based on theMarshall lectures in 1985) wrote:
Is there some action a government of India could take that would leadthe Indian economy to grow like Indonesia's or Egypt's? If so, what,exactly? '.' The consequences for human welfare involved in questionslike these are simply staggering: Once one starts to think about them,it is hard to think about anything else. (emphasis in the original)
We agree with Lucas that the policy question is central and see this paper as
4
Such an interpretation is more in line with the cross-country evidence than
interpretations suggesting an intrinsic failure of convergence. When we examine
poor countries that have followed standard market-based economic policies,
including respect for private property rights and open international trade, we
note an overwhelming tendency towards convergence, even among countries that
start with extremely low levels of human capital endowments and extremely low
levels of initial per capita income. In fact, it is hard to find a single case
in which a poor country actually protected private property rights and maintained
economic openness, and yet failed to achieved economic growth. In essence, we
subscribe to a much earlier, and widely cited judgment of Adam SmithS:
Little else is requisite to carry a state to the highest degrees ofopulence from the lowest barbarism, but peace, easy taxes, and tolerableadministration of justice.
In our view, as in the view of Adam Smith, burdensome taxes on foreign trade (and
related trade distortions such as import and export quotas) are of particular
harm, since these not only distort economic incentives (e.g. pushing countries
towards inefficient import-substituting industries), but they also cut countries
off from international flows of knowledge.
In the next section of the paper, we demonstrate that good behavior in
economic policy has been its own reward: all developing countries that have
satisfied certain unexceptionable conditions on economic policy have experienced
positive economic growth during the decades of the 1970s and 1980s, and in almost
all cases these countries have shown a tendency to grow more rapidly than the
developed economies, and thereby to converge. After demonstrating this point,
we then undertake a cross-country regression analysis based on equation (2), to
try to determine some of the specific ways that poor economic policies have
suggesting a basic answer to Lucas's question. Somewhat interestingly inlight of this quote, P. Krishna and D. Mitra (1994), present evidence thatIndia'S trade liberalization of 1991 has led to increased productivity growthand lower price-marginal cost markups in a variety of industries.
This aphorism is quoted by A. Leddin and B. Walsh, in The Macroeconomvof Ireland, Gill & McMillan, 1995. These authors in turn refer to thecitation in Paul Kennedy, The Rise and Fall of Great Powers.
5
affected the growth dynamics of developing countries.
II. Economic Policies and Economic Convergence
In this section we define a subset of countries that have sustained
"appropriate" market-based economic policies during the period of observation,
1970-89. We then examine whether there is a tendency towards economic
convergence among this subset of qualifying countries during this sub-period.
In essence, we examine whether there is a convergence club for all countries that
have sustained adequate basic economic policies.
Our selection criteria are as follows. We start with the universe of all
135 countries in the Heston-Summers data series, and then eliminate 18 countries
(total population about 66 million) that lack some or all of the necessary
underlying data. 9 We then establish two basic subsets of "appropriate"
policies: one set related to property rights and one set related to integration
of the economy in international trade. All countries that pass both sets of
criteria are considered to be countries that have pursued appropriate policies
during the observation period. We call these the "qualifying" countries.
Countries that fail at least one test are "non-qualifying." We then examine the
growth dynamics of the qualifying and non-qualifying economies.
We note that many authors have previously used political and openness
variables in cross-country growth studies and have often found these variables
to be significant determinants of growth. These studies include Alesina, OzIer,
Roubini, and Swagel (1992), Barro (1991), Bhalla (1994), DeLong and Summers
(1991), Dollar (1992), Levine and Renelt (1992), and Svensson (1994)10. Indeed,
Countries dropped from the sample because of insufficient data are:Afghanistan, Bahamas, Bahrain, Comoros, Dominica, Fiji, Grenada, Iceland,Kuwait, Oman, St. Lucia, St. Vincent, Saudi Arabia, Seychelles, SolomonIslands, Sudan, Surinam, United Arab Emirates.
10 More specifically, Alesina etinstability and democracy indicators.revolutions, coups and assassinationsDeLong and Summers (1991) use severalprice distortions. Levine and Renelt
al. (1992) use measures of politicalBarro (1991) uses the number of
and a dummy for Socialist countries.measures of outward orientation and(1992) use the black market premium,
6
we rely on some of the data series that were generated by Barro (1991), Lee
(1993), Levine and Renelt (1992), McMillan et. al. (1994) and Summers and Heston
(1991) .11 To our knowledge, however, no earlier studies have used such
variables as filters to divide countries between "qualifying" and "non-
qualifying" countries, in order to test whether economic convergence applies
among the subset of countries following appropriate economic policies.
with regard to the property rights test, a country is non-qualifying (i.e.
judged to have inappropriate policies) if it is characterized by at least one of
the following three conditions:
(1) a socialist economic structure, according to the list of countries in
Kornai (1993);
(2) extreme domestic unrest, caused by revolutions, coups, chronic civil
unrest, or a prolonged war with a foreign country that is fought on domestic
territory;
(3) extreme deprivation of civil or political rights, according to the
Freedom House index, reported in McMillan, et. al. (1994);
These criteria are selected because failure on any of them would tend to
undermine efficient long-term private capital accumulation (including human
capital accumulation), which is a fundamental feature of economic growth.
number of revolutions and coups, a Socialist dummy, a civil liberties index,and measures of openness based on Leamer (1988). And Svensson (examininginvestment rather than growth) uses various measures for respect for propertyrights, contract enforcement, efficiency of legal institutions, and businessrisk, as well as measures of political repression. All of these studiesexamine the marginal contribution of the variables on the right side of aregression equation; none use these variables to sort countries into groupsand examine the groups separately.
11 Interestingly, an association between convergence and openness acrosshistory has been noted by Williamson (1993). He argues that convergence andglobal economic integration have been associated since 1850. In the two subperiods that saw relatively free movements of goods and factors, 1870-1913 andpost-1950, there is evidence of convergence. In the period of restrictedglobal trade between the two world wars, one does not find evidence forconvergence. Ben-David (1993) also argues that income convergence within themembers of the European Community was associated with the timing of tradeliberalization.
7
(Details on the variables and data sources are described in the Appendix) .
The second test is economic openness. One of the basic tenets of classical
and neoclassical economics dating back to Adam Smith is the economic benefits of
openness, including: increased specialization, efficient resource·· allocation
according to comparative advantage, diffusion of international knowledge through
trade, and heightened domestic competition as a result of international
competition12•
To test for openness, we include four kinds of measures. First, the
country must not impose excessive quotas on imports. Second, the country must
not impose excessive quotas, or state monopolies, on exports. Third, the country
must maintain a reasonably convertible currency. We judge convertibility
according to the gap between the black market and official exchange rate. A
large black market premium signals inconvertibility of the national currency, and
thereby effective closure from world markets. 13 Fourth, the country must not
be socialist (as classified by Kornai, 1993) .14 In addition, we exclude South
Africa and the two countries located within South Africa (Lesotho and Swaziland)
on the grounds of the international boycott of the South African economy during
much of the period of observation.
Specifically, a country fails the openness test as a result of any of the
following criteria (with details in the Appendix) :
12 Lucas (1988) and Young (1991) observe that much existing theorypredicts a level effect rather than a growth effect from greater openness.The literature however is changing rapidly on this issue. Young (1991),Grossman and Helpman (1991), Eicher (1993) and Lee (1993) have proposedtheoretical mechanisms by which increased trade can affect the long run growthrate.
13 As is well known, rationing of foreign exchange to importers at theofficial exchange rate is economically similar, if not identical, to a quotaon imports.
14 Of course, the socialist countries fail on the other criteria. Weuse the Kornai list as an additional filter only because the other variablesare not available for some of the socialist economies. In particular, byusing the socialist criterion, we are able to classify Hungary, Poland, andYugoslavia as closed economies, whereas the data sources we relied on do nothave complete data for these countries.
8
(1) a very high proportion of imports covered by quota restrictions,
according to the index prepared by Lee (1993);
(2) for Sub-Saharan Africa, a high proportion of exports covered by state
export monopolies and state-set prices, according to an index in the World Bank
(1993) 15;
(3) a socialist economic structure, according to the list of countries in
Kornai (1993);
(4) a black-market premium over the official exchange rate of 20 percent
or more, on average, either for the decade of the 1970s or the decade of the
1980s (or both) .
Failure on any of these criteria indicates that the economy is operating in
substantial isolation from the world economy16.
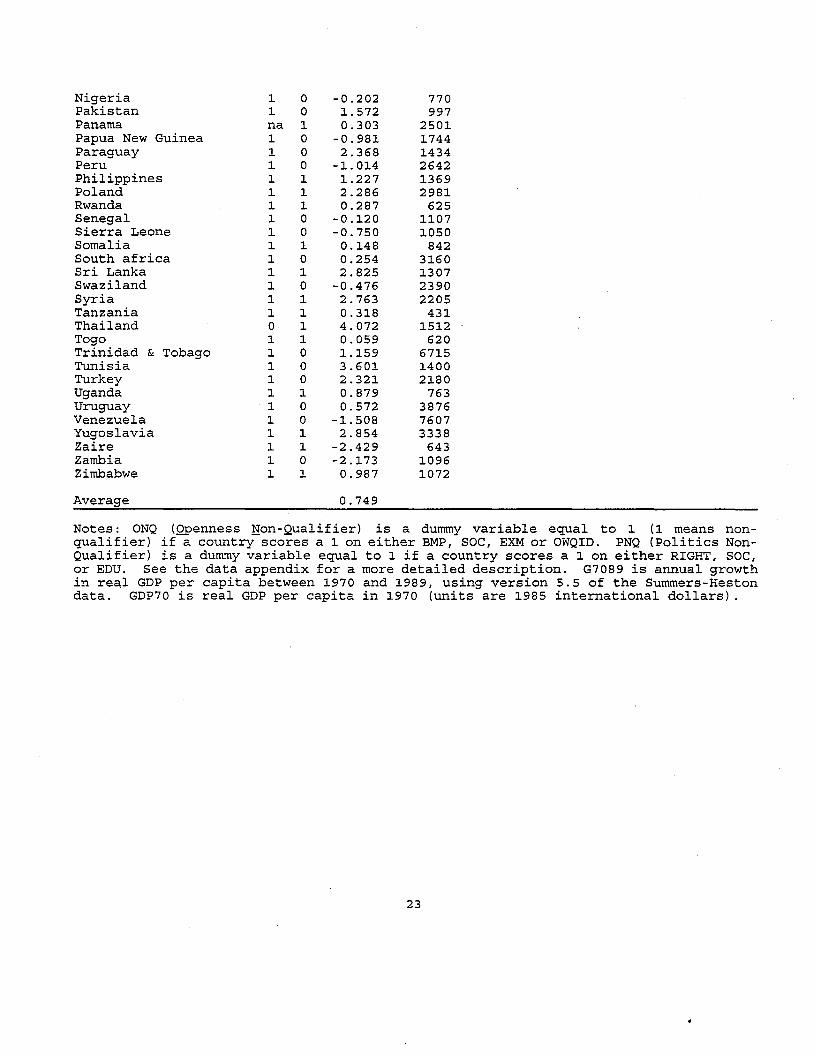
The list of non-qualifying countries according to any of the political or
openness criteria is shown in Table 1, and the list of qualifying countries is
shown in Table 2. It turns out that openness is the main determinant of whether
a country isa non-qualifier. Virtually all countries that fail the political
test also fail the openness test, with the two exceptions of Haiti (which had
open trade but which denied civil and political rights) and Thailand (which had
15 The World Bank index of monopolization of exports was constructedonly for 29 Sub-Saharan African countries in the World Bank (1993) study onAfrican structural adjustment. We are confident that none of the countriesoutside of Sub-Saharan Africa that we characterize as "qualifying" vis-a-visopenness should be disqualified on the basis of monopolization of exports.More generally, outside of Sub-Saharan Africa, trade quotas are overwhelminglyon the import side rather than the export side.
16 Pritchett (1993) shows that the correlations between several measuresof "outward orientation" are quite low. This result has encouraged the viewthat measurement error is a severe problem with such measures (a conclusionnot necessarily shared by Pritchett). We have three responses. First, wethink that some of his variables actually measure different things, so that alow correlation is not necessarily surprising. We would put the trade sharevariable and the average import tariff variable in this category. Second, atleast two of his variables, average tariffs and coverage of non-tariffbarriers, are policy substitutes. The low correlation (0.36) may simply meanthat some countries have chosen to close themselves with quotas and otherswith tariffs. Third, we try to minimize measurement error by using the tradeindicators to sort countries into broad groups, rather than using all of thecardinal information in' the data.
9
open trade but high political instability) .17 Thus, if we exclude countries
that are closed, we almost also exclude all countries that are non-qualifiers on
political grounds. We find later on in the cross-section growth equations that
the political variables do, however, help to explain the rate of economic growth
in addition to the openness variables.
A statistical summary of the growth performance of the qualifying and non-
qualifying countries is shown in Table 3. We see that the non-qualifying low
income countries have lower average growth rates than the qualifiers. We expect,
therefore, that the qualifying developing countries are more likely to exhibit
economic convergence once the non-qualifiers are dropped from the sample. It is
notable that 23 of 29 countries with 1970 income levels above $4,000 passed both
the political and openness tests (income is measured in U.S. dollars, in
purchasing-power-adjusted, constant 1985 prices), in contrast with just 12 out
of 88 countries with initial income levels of less than $4,000. However, the 12
low-income qualifiers have a higher average growth rate than the high-income
qualifiers, which is consistent with the view that convergence tends to occur
within the subset of countries that pursue appropriate economic policies.
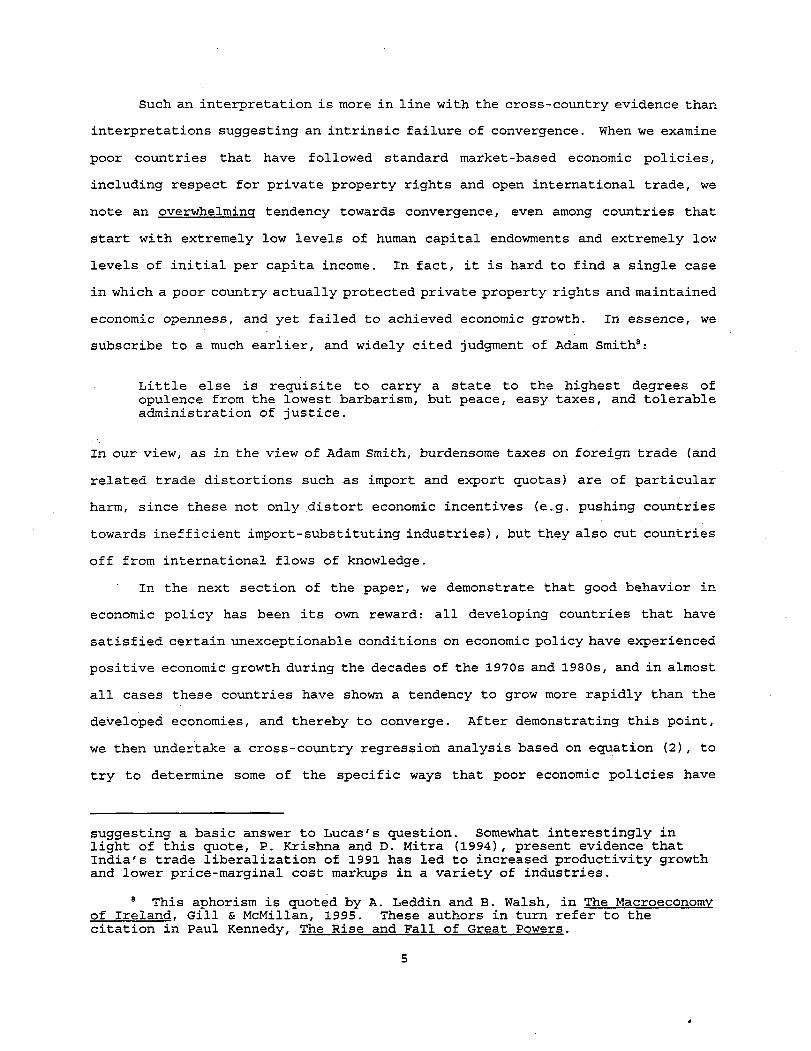
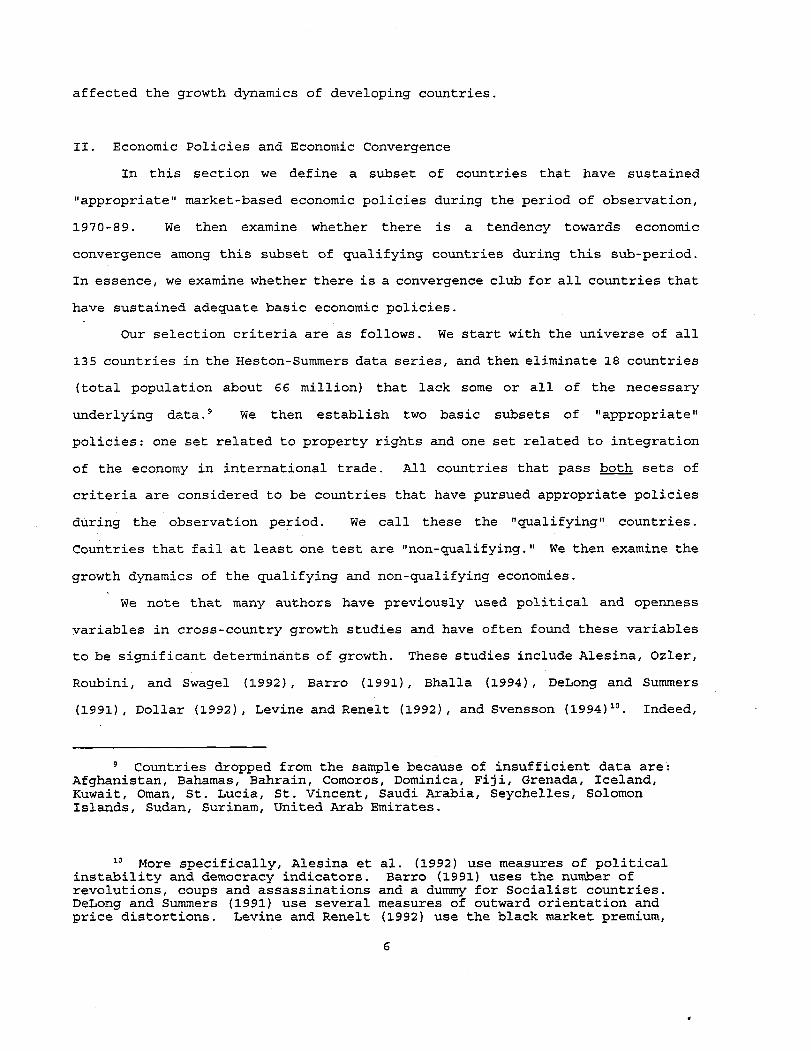
The role of policy choices in convergence is dramatically evident in
Figures 2(a) and 2(b), where we divide the sample in Figure 1 into groups of
qualifying and non-qualifying countries. We should note that with very few
exceptions, We see in Figure 2 (a) that the qualifying countries display a strong
tendency towards economic convergence, with the countries with the initially low
per capita income levels growing more rapidly than the richer countries. The
non-qualifiers in Figure 2(b) do not display any tendency towards convergence.
The non-qualifying countries in Figure 2 (b) are clearly the source of the failure
of convergence that we noted in Figure 1.
Even more strikingly, there is not a single country in our sample (which
covers 117 countries and approximately 90 percent of the world's population as
of 1985) which pursued appropriate policies during 1970-89 and yet which had per
17 There are, in addition, three countries that fail the political testfor which the openness variable is not available because of incomplete data.These countries are: Cape Verde, Liberia, and Panama.
10
capita growth of less than 1.2 percent per year, and not a single qualifying
developing country « $4,000 per capita) which grew at less than 2 percent per
year! In fact, with the single exception of Haiti, there is not a single
developing country that had substantially open trade and yet failed to grow by
at least 2 percent per year. In this sense, the openness variable is almost a
perfect determinant of the real "convergence club" in the world economy, a "club"
based on policies available to all countries rather than on a country's initial
level of income or educational attainment. By our count, there are 12 developing
countries « $4,000 initial income) that pursued appropriate policies according
to our criteria, and all grew at more than 2 percent per year.
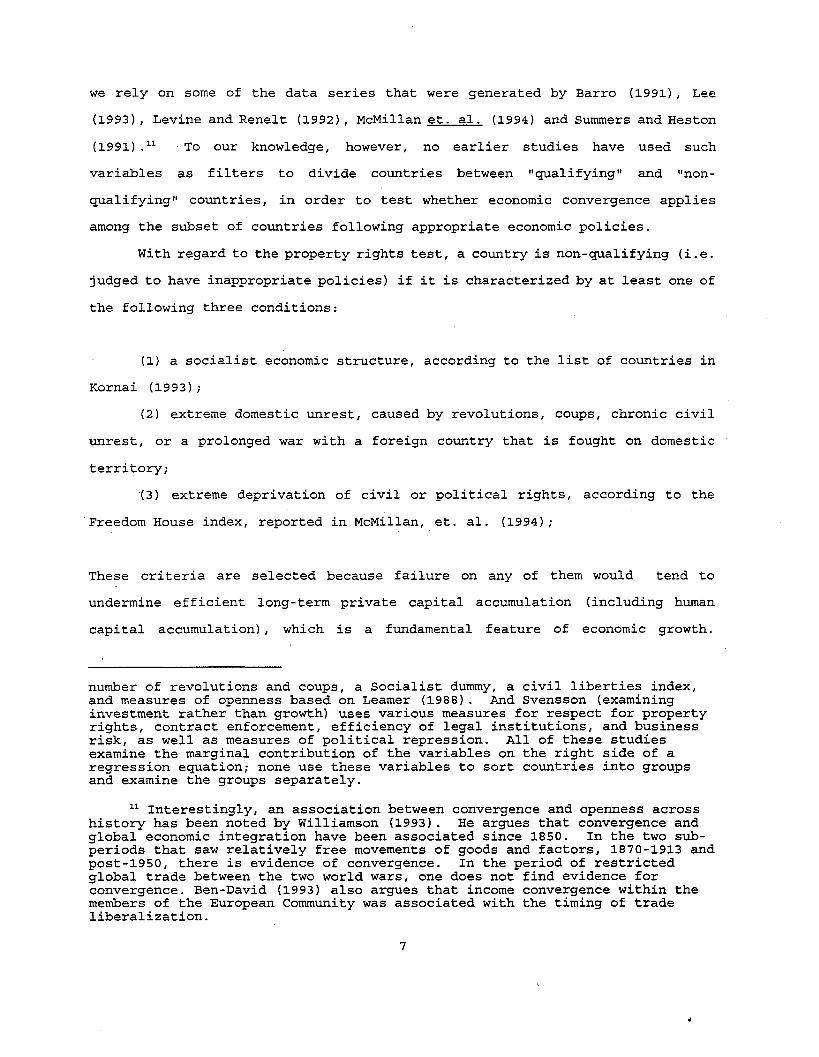
So far we have analyzed growth per-capita rather than growth per-worker.
The reason is that the per-capita growth rates are available for a longer time
span than the per-worker growth rates, which often rely on less frequent census
data. However, since some theories, (the Solow model in particular), predict
convergence more precisely in terms of growth per-worker, it is worth examining
the available data on growth per-worker. In figure 3 we present the result when
figure 2(a) is redrawn with growth per-worker on the y-axis (covering the period
1970-85 rather than 1970-89). The figure shows stronger evidence for convergence
tha~ before; but we also find that growth is lower than before for the higher
income economies. Based on this evidence, if growth per-worker were available
for the full time period, we expect that it would strengthen our conclusions
regarding convergence, but the minimum growth rate of the qualifying group would
be about 0 percent rather than 2 percent. We plan to examine this further when
data from the 1990 census rounds become available. 18
In summary, we find no cases to support the frequent worry that a country
might "do the right things" in terms of overall policy (both politics and
openness), and yet fail to grow. Of course, economic reforms take time to work,
so that some countries that have recently adopted outward-oriented market reforms
(in the late 1980s or early 1990s) might not yet enjoy high growth rates as a
18 This result that per-worker growth exhibits stronger evidence forconvergence than per-capita growth is also observed by Wolf (1994).
11
resul t of those reforms. 19
So far we have argued the case of sufficiency: a set of good policies is
sufficient to produce a good economic outcome (i.e. convergent growth). What of
necessity? Are there many countries that "broke the rules" and yet achieved high
economic growth? There are seven countries that failed to qualify on one or more
of the criteria and yet that had per capita growth of more than 3 percent per
year during ~970-89: Botswana, Cape Verde, China, Hungary, Lesotho, Thailand and
Tunisia. (Remember that of the 75 developing non-qualifying countries, only 7,
or 9 percent of the cases, achieved growth of three percent or more, while of the
qualifying countries, ~~, or 85 percent, achieved growth of three percent or
more) .
It is relatively straightforward to account for five of these six
"exceptions." Botswana failed to qualify on the black-market premium for the
~970s, but did qualify for the ~980s. It passed all other criteria. Overall,
therefore, the policies have been relatively well balanced, especially in the
~980s. Moreover, since around 80 percent of Botswana's exports are diamonds, and
a remarkably small proportion (less than 5 percent) of the labor force is in
agriculture, Botswana avoided the anti-agricultural biases of most of Sub-Saharan
Africa.
As for Cape Verde, Hungary, and Tunisia, the "successful" growth during
~970-89 is more apparent than real. All three countries pursued statist
development strategies that produced growth in the ~970s and financial crises in
the ~980s and early ~990s. In all three cases, there was a serious downturn in
gro~th at the end of the ~980s, as financial crises hit the government. Taken
over a slightly longer time period, therefore, these cases would not look like
successes and would not be anomalous.
Lesotho was excluded on the general grounds that it was expected to suffer
from the worldwide boycott against South Africa. Otherwise it passed the
19 On the other hand, there are many recent reformers that are alreadyexperiencing rapid economic growth, such as Argentina, Bolivia, and Peru inLatin America, and Poland, Estonia, Slovenia in post-communist Central andEastern Europe. We lack systematic data, however, to bring the record up tothe mid-~990s.
~2
remaining criteria. It appears that its small size (population 1.8 million)
allowed Lesotho to make effective use of the South African market (both for goods
and for migrant labor) even as South Africa itself was subjected to international
sanctions.
Thailand is another example that qualifies on all the criteria except one:
in this case our measure for extreme domestic unrest. It is disqualified because
of the large number of coups in the 1970s and 1980s. But as is well known, these
coups reflect a revolving door of Army Generals in an otherwise stable regime
under the Thai King, and with a rather stable economic strategy. Therefore,
unlike other countries characterized by domestic instability, the coups did not
pose direct threats to private investors and therefore did not stifle Thai
economic growth. Since Thailand was very open and otherwise pursued market-
oriented policies, it has been a successful developing country. In effect, it
should probably be classified as a qualifier, although adherence to our technical
definitions put it into the non-qualifying camp20.
In our view, there is only one deep puzzle to these exceptions, the case
of China. It is indeed true that China has violated most of the rules: obscure
property rights, political repression, high black market premia on the yuan,
extensive reliance on trade quotas. Nonetheless, China has experienced a boom.
We believe that China'S success is strongly related to its particular economic
structure at the onset of its market reforms at the end of the 1970s. In
particular, China was a very poor economy in 1978, with three-fourths of the
labor force in peasant farming. The essence of Deng Xiaoping's reforms at the
end of the 1970s was to free the peasant economy from state controls, even while
maintaining the state's grip on the non-peasant state-owned sector (which covered
just 18 percent of the labor force) .
This "two- track approach" (de- control of the peasant sector, with continued
control of the state sector) was sufficient to unleash China's growth and labor-
20 Along these lines, we also ran regressions with Thailand classified asa qualifier. This slightly strengthened the political variables, butotherwise there was no material difference with the regressions reported here.For more detailed discussions of Thailand's case, see Laothamatas (1992) andPhongpaichit (1992).
13
intensive export boom, even though it did not solve many problems of poor
performance in the state-owned sector. Some analysts have also argued that its
boom is fragile as well, and could still be stopped by macroeconomic instability
characteristic of many economies part way between planning and a market economy.
See Sachs and Woo (1993) for further details of the two-track approach in China
and the current macroeconomic problems.
III. Regression Analysis
We now turn to a regression analysis, to confirm and deepen these basic
findings. Various regression estimates are reported in Table 4, showing the
simple bivariate relationship between initial income in 1970 and subsequent
growth between 1970 and 1989. We see in regression (1) the absence of
convergence for the entire sample of countries (the coefficient on initial income
is positive rather than negative, and is statistically insignificant). In
regression (2) we see the strong evidence of convergence within the set of
qualifying countries. The coefficient on initial income suggests that each
percentage point rise in per capita income in 1970 reduces subsequent annual
growth by .013 percentage points. Each doubling of 1970 income reduces annual
growth by .92 percentage points (=In(2)*1.325). In regression (3), we confirm
the absence of convergence among the non-qualifying countries.
The regressions in Table 5 confirm the growth effects of the political and
openness variables in the overall sample. In regression (4), we regress annual
economic growth on the logarithm of initial income and six dummy variables, for
the three political and three openness criteria. For each of the variables, a
value of 1 signifies "non-qualifying" and a value of 0 signifies "qualifying."
Therefore, we should expect negative coefficients on each of these variables in
the growth regression. This is indeed what we find. In each case, the
coefficient signifies the effect on annual growth, in percentage point terms, of
the failure to conform to the particular standard of policy. For example, an
excessive black-market premium is estimated to be associated with 2.25 percentage
points of reduced annual growth (t-statistic equal to 6.0). Extensive export
14
controls in Sub-Saharan Africa are estimated to have reduced growth by 1.88
percentage points per year. Socialist countries grew on average by 1.27
percentage points per year more slowly than non-socialist countries, holding
constant other factors. (Evidence from the Pc0st-socialist period in many of
these countries suggests that the growth rates of the socialist countries were
probably overstated during our period of observation) .
In regression (5), we compress the criteria into two variables, a single
political variable (PNQ) and an openness variable (ONQ). Again, a value of 1 on
either variable signifies "non-qualifying" on the criterion. The openness
variable is highly negative and statistically significant; while the political
variable is also negative, but smaller in magnitude and not quite statistically
significant.
In Table 6, regression (6), we replicate the basic Barro (1991) regression
on cross-country growth for our sample and time period. We see that the basic
Barro equation performs as expected over our sample and time period, with
conditional convergence (a negative, significant coefficient on initial income),
positive effects of educational attainment (though not significant), positive
effects of the investment-GDP ratio, and negative effects of measures of
political instability.
Regression (7) estimates the same equation but includes the two dummy
variables for political and openness qualifications (1 for non-qualifiers, 0 for
qualifiers). When we add PNQ and ONQ, we find that the political non-qualifiers
grow, on average, by 1.04 percentage points less per year than the political
qualifiers, while the openness non-qualifiers grow by 1.94 percentage points less
than the openness qualifiers. The rest of the structural variables remain
roughly the same as in regression (6), though the initial education levels are
even less significant. This is consistent with our view that the growth rate
over this period was determined less by initial human capital levels than by
policy choices.
We attempted various experiments to interact the PNQ and ONQ dummy
variables with the right-hand-side variables in the Barro equation, to see for
15
example whether the effects of education, initial income, investment, and the
like were different for the qualifiers and non-qualifiers. To our surprise, the
interaction terms generally proved to be small and statistically insignificant.
The effect of policy failure was therefore measured to result in a downward step
in growth, without clearly affecting the conditional impacts of the other right
hand-side variables.
In equation (8), we add two variables to the basic growth equation that we
have explored in earlier work. The first variable, PXI, is a measure of the raw
material intensity of the economy, based on the share of raw-materials exports
in total exports in 1970. The second variable, DTT, is a measure of the change
in the terms of trade of the country during 1970-89. As we argued in Sachs and
Warner (1994), there are reasons to believe that resource-rich countries will
experience lower growth than resource poor countries, all other things equal,
because the natural resource base will push resources into the non-tradeables
sector at the expense of the manufacturing tradeables sector. If, as is
sometimes argued, the manufacturing sector is the site of technological
spillovers and learning by doing, then the shift of resources to non-tradeables
could slow aggregate growth in the medium and long term.
As in our earlier paper, we find in regression (8) that the natural
resource proxy variable does indeed help to account for cross-country growth, and
this is true even controlling for PNQ and ONQ. Specifically, countries that
specialized in natural resource exports at the start of the period tended to grow
more slowly than manufacturing exporters. There is also some evidence, though
not statistically significant, that a rising terms-of-trade over the period
raised average growth over the period. While the inclusion of the PXI variable
seems to be justified even after controlling for ONQ and PNQ (which remain highly
significant in the regression), the presence of PXI tends to eliminate the
statistical significance of the investment-to-GDP ratio. Raw-materials exporters
systematically had lower rates of physical investment relative to GDP. When the
equation must choose between PXI and investment-to-GDP as an explanation of
16
growth, the PXI variable dominates21 •
In other regressions, not reported in the table, we instrument the PXI
'variable in order to eliminate the possibility that high-resource intensity of
exports is a result of poor growth performance rather than a cause. As in Sachs
and Warner (1994) we use an instrument suggested originally by Adrian Wood: the
ratio of aggregate years of schooling in the country divided by total land area
of the country. Countries with high schooling-to-land ratios should be expected,
on Heckscher-Ohlin-Samuelson trade theoretic grounds, to be manufacturing
exporters, while countries with low ratios should be raw-materials exporters.
The use of this instrument does not change our finding with regard to the
negative effect of PXI on subsequent growth.
In regressions (9) and (10) we run the Barro equation, augmented by PXI and
DTT, separately for the two subsets of countries, the qualifiers and the non-
qualifiers. For the qualifying countries, in regression (9), the basic equation
remains satisfactory, with evidence of conditional convergence (a negative,
statistically significant effect of initial income on subsequent growth), and
with the continuing importance of the PXI variable. For the non-qualifiers, in
regression (10), there is also (surprising-though not quite significant) evidence
of conditional convergence, with the initially poorer countries tending to grow
faster after controlling for the other right-hand-side variables. Of course, the
constant term in (10) is lower than in (9), reflecting the overall drag on growth
of inappropriate policies.
In regression (8), we had found that PNQ and ONQ reduced overall growth
when controlling for the other variables. Since poor policies might also affect
the rates of investment relative to GDP and the rates of human capital
21 We checked regression (8) for sensitivity to outlying observations byexamining the residuals and leverage statistics (a measure for how far thedata for a particular country differs from the cross-country means). We foundthat Sierra Leone and Guatemala have the highest leverage and that Jamaica andSyria have the highest residuals (there is no country that has a high valuefor both). When the regression was re-estimated without these observations,none of the estimated coefficients in regression (8) changed enough to alterthe conclusions in the text about significance: indeed, most estimatedcoefficients rose in absolute value (the exception was the ONQ coefficient,which fell from -1.4 to about -1.2).
17
accumulation, we would expect indirect adverse growth effects of poor policies
as a result of slower capital accumulation (both physical and human). In
regressions (11) (13), we therefore check whether the qualifying and non-
qualifying countries differed systematically in the rates of capital
accumulation, once we control for initial income and resource-intensity of
initial production (as proxied by PXI). In regression (11) we find that the
openness non-qualifiers (ONQ = 1) had significantly lower investment-to-GDP
ratios, with ONQ reducing the investment ratio by an average of 3.7 percentage
points. 22 Interestingly, there is also some evidence that richer countries have
higher investment rates than poorer countries.
In regressions (12) and (13), we ask whether the increase in educational
attainment between 1970 and 1985 was different for the two subsets of countries,
again controlling for initial income levels and PXI. We find no evidence that
the non-qualifiers had a lower improvement in the coverage of primary and
secondary education than did the qualifiers. It is clear, though, that the more
developed economies had less improvement in educational coverage than did the
poorer countries (as evidenced by the significant, negative sign on initial
income in both regressions) .
Based on the regression analysis, we may make five conclusions:
(1) there is strong evidence of unconditional convergence for qualifying
countries, and no evidence of unconditional convergence for non-qualifying
countries; (2) non-qualifying countries grew systematically more slowly than did
the qualifying countries, so that "good" policies mattered; (3) each of the
policy criteria played a role in determining average growth rates; (4) the role
of the policy criteria remains in place after controlling for other growth
factors, as in a standard Barro cross-country growth equation; (5) poor policies
seem to affect growth directly, controlling for other factors, while poor trade
policies also seemed to affect the rate of accumulation of physical capital.
22 We note that Levine and Renelt (1992), using trade shares as ameasure of openness, also find that investment shares are higher in more openeconomies. This is also one of the few findings that they classify as robust,using extreme bounds analysis.
18
IV. Discussion and Conclusions
The absence of strong evidence across countries of unconditional economic
convergence has led to a number of disparate views in the economics profession
in recent years. Some have argued that non-convergence is a technological fact
of life. Others have suggested that laggard countries require special remedial
policies to provoke high-speed growth, lest they get trapped in a low-growth
economy. Industrial policies a la East Asia have sometimes been posited as a
model for such lagging countries. The evidence in this paper strongly calls into
question these views.
A more parsimonious interpretation of the evidence is that convergent
growth can be achieved by all or virtually all countries that follow a reasonable
set of political and economic policies, including civil peace, basic adherence
to political and civil rights, and (most decisively) an open economy, through the
absence of trade quotas, export monopolies, or inconvertible currencies. All
developing countries that followed such a pattern achieved per capita growth
between 1970 and 1989 of two percent per year or greater.
We note again that many authors have introduced political and openness data
into cross-country growth equations, and indeed we use many of the criteria
suggested by others. Our contribution is not to show that trade "matters" for
growth, since this has already been done. Our contribution, we believe, is to
show the strength of convergence among all well-behaving countries. We believe
that this simple and important fact has been obscured among growth theorists.
19
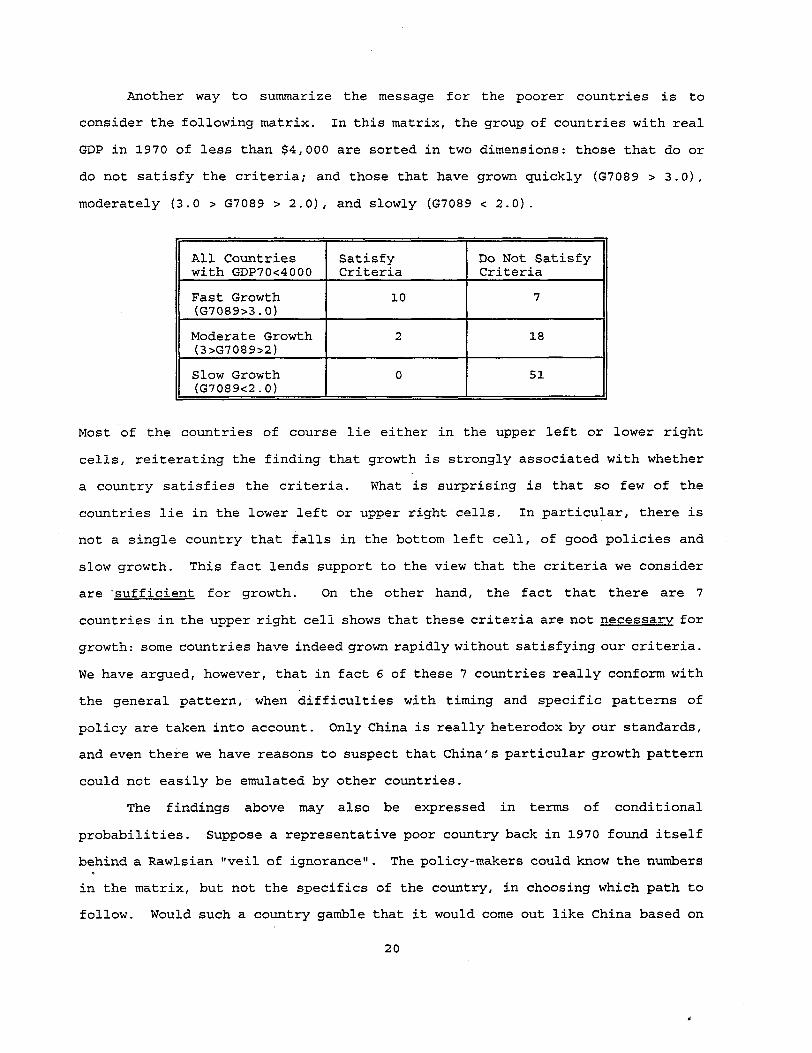
Another way to summarize the message for the poorer countries is to
consider the following matrix. In this matrix, the group of countries with real
GDP in 1970 of less than $4,000 are sorted in two dimensions: those that do or
do not satisfy the criteria; and those that have grown quickly (G7089 > 3.0),
moderately (3.0 > G7089 > 2.0), and slowly (G7089 < 2.0).
All Countries Satisfy Do Not Satisfywith GDP70<4000 Criteria Criteria
Fast Growth 10 7(G7089>3.0)
Moderate Growth 2 18(3)G7089>2)
Slow Growth 0 51(G7089<2.0)
Most of the countries of course lie either in the upper left or lower right
cells, reiterating the finding that growth is strongly associated with whether
a country satisfies the criteria. What is surprising is that so few of the
countries lie in the lower left or upper right cells. In particular, there is
not a single country that falls in the bottom left cell, of good policies and
slow growth. This fact lends support to the view that the criteria we consider
are 'sufficient for growth. On the other hand, the fact that there are 7
countries in the upper right cell shows that these criteria are not necessary for
growth: some countries have indeed grown rapidly without satisfying our criteria.
We have argued, however, that in fact 6 of these 7 countries really conform with
the general pattern, when difficulties with timing and specific patterns of
policy are taken into account. Only China is really heterodox by our standards,
and even there we have reasons to suspect that China's particular growth pattern
could not easily be emulated by other countries.
The findings above may also be expressed in terms of conditional
probabilities. Suppose a representative poor country back in 1970 found itself
behind a Rawlsian "veil of ignorance". The policy-makers could know the numbers
in the matrix, but not the specifics of the country, in choosing which path to
follow. Would such a country gamble that it would come out like China based on
20
the numbers above? Conditional on closed policies, the probability of growing
at 3 percent or more would be only 0.09 (7 divided by the 76 disqualified
c:ountries with low income). On the other hand, the gamble based on good policies
would yield vastly better odds.
It is natural to ask whether our results are a case of reverse causation,
in which slow economic growth led to bad policies -- for example, if stagnant
economies tried to experiment with trade barriers in order to speed economic
growth. We think this is highly unlikely. In most cases, the "bad" policies
were selected early in the post-war era, long before a track record on growth had
occurred. These countries stuck with the policy choices until quite recently,
certainly into the 1970s and 1980s, the interval of observation. Moreover, the
few cases of developing countries that pursued outward oriented polic:ies did so
in part because of their particularly close security relations with the United
States or with European nations. For these reasons, we believe that it is
appropriate to take the policy regime "as given," for purposes of studying the
effects of policy choices on growth. In a follow up study, we propose to examine
the sources of basic development strategies of these nations, according to
geography, colonial history (if any), date of independence and therefore
experience of government, and economic structure.
In conclusion, we believe that are findings are significant. Dozens of
countries in Latin America, Africa, Eastern Europe, and the former Soviet Union
have recently undertaken market-reform policies that will shift them from the
non-qualifying to the qualifying category of nations. Our results suggest that
most or all of these reforming nations have a good chance to benefit from these
reforms with higher economic growth. Indeed, we can already see the fruits of
reform in several economies in Latin America (e.g. Argentina, Peru, Bolivia), in
Asia (e.g. the Philippines), and in Africa (e.g. Mauritius, Botswana).
21
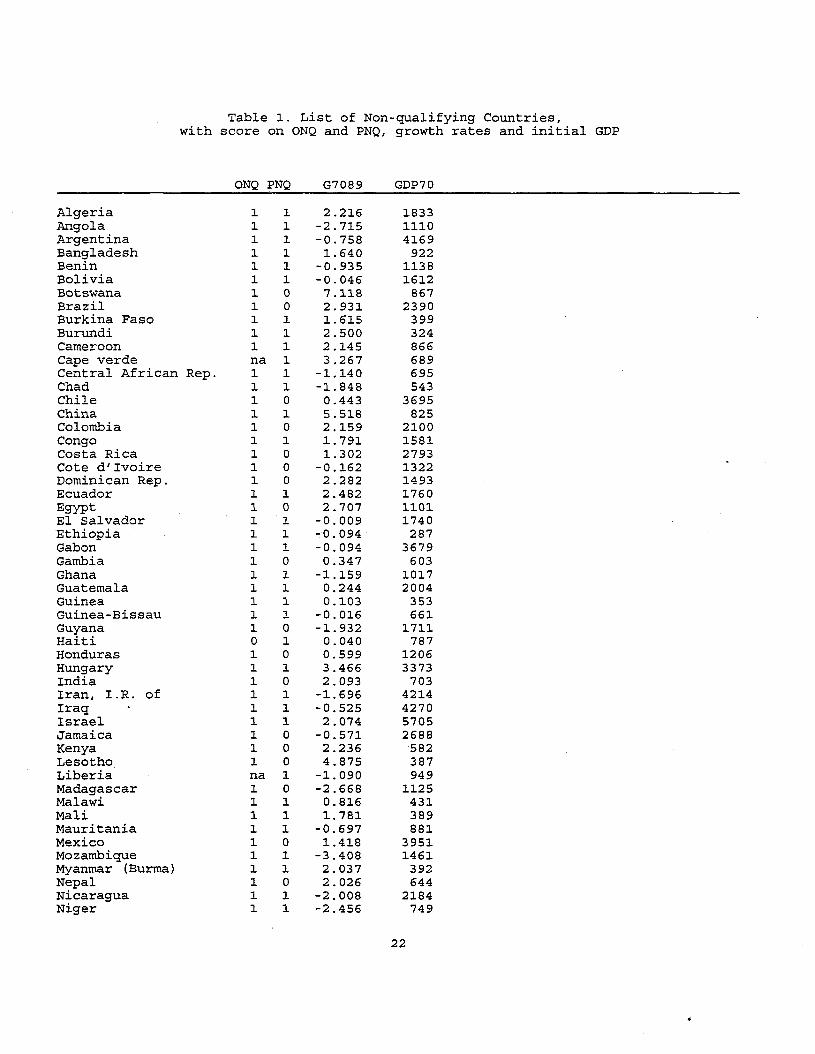
Table ~. List of Non-qualifying Countries,with score on ONQ and PNQ, growth rates and initial GDP
ONQ PNQ G7089 GDP70
Algeria ~ ~ 2.2~6 ~833
Angola ~ ~ -2.715 ~110
Argentina ~ ~ -0.758 4~69
Bangladesh ~ ~ 1.640 922Benin ~ ~ -0.935 1138Bolivia ~ ~ -0.046 ~6~2
Botswana ~ 0 7.~~B 867Brazil ~ 0 2.93~ 2390Burkina Faso ~ ~ 1.6~5 399Burundi ~ ~ 2.500 324Cameroon ~ ~ 2.~45 866Cape verde na ~ 3.267 689Central African Rep. ~ ~ -~.~40 695Chad ~ ~ -1.848 543Chile ~ 0 0.443 3695China ~ ~ 5.5~8 825Colombia ~ 0 2.~59 2~00
Congo ~ ~ ~.79~ ~58~
Costa Rica ~ 0 1.302 2793Cote d'Ivoire ~ 0 -0.~62 ~322
Dominican Rep. 1 0 2.282 ~493
Ecuador 1 ~ 2.482 ~760
Egypt ~ 0 2.707 1101El Salvador ~ 1 -0.009 1740Ethiopia 1 1 -0.094 287Gabon 1 1 -0.094 3679Gambia 1 0 0.347 603Ghana 1 1 -1.159 1017Guatemala 1 1 0.244 2004Guinea 1 1 0.103 353Guinea-Bissau 1 ~ -0.016 661Guyana 1 0 -~.932 ~711
Haiti 0 1 0.040 787Honduras 1 0 0.599 1206Hungary 1 1 3.466 3373India 1 0 2.093 703Iran, I.R. of ~ ~ -1. 696 42~4
Iraq 1 1 -0.525 4270Israel 1 ~ 2.074 5705Jamaica ~ 0 -0.571 2688Kenya ~ 0 2.236 582Lesotho ~ 0 4.875 387Liberia na ~ -1.090 949Madagascar ~ 0 -2.668 ~125
Malawi ~ 1 0.8~6 4nMali ~ 1 1.781 389Mauritania 1 1 -0.697 881Mexico 1 0 1.418 3951Mozambique 1 1 -3.408 1461Myanmar (Burma) 1 1 2.037 392Nepal 1 0 2.026 644Nicaragua 1 1 -2.008 2184Niger 1 1 -2.456 749
22
Nigeria 1 0 -0.202 770Pakistan 1 0 1.572 997Panama na 1 0.303 2501Papua New Guinea 1 0 -0.981 1744Paraguay 1 0 2.368 1434Peru 1 0 -LOU 2642Philippines 1 1 1.227 1369Poland 1 1 2.286 2981Rwanda 1 1 0.287 625Senegal 1 0 -0.120 1107Sierra Leone 1 0 -0.750 1050Somalia 1 1 0.148 842South africa 1 0 0.254 3160Sri Lanka 1 1 2.825 1307Swaziland 1 0 -0.476 2390Syria 1 1 2.763 2205Tanzania 1 1 0.318 431Thailand 0 1 4.072 1512Togo 1 1 0.059 620Trinidad & Tobago 1 0 1.159 6715Tunisia 1 0 3.601 1400Turkey 1 0 2.321 2180Uganda 1 1 0.879 763Uruguay 1 0 0.572 3876Venezuela 1 0 -1. 508 7607Yugoslavia 1 1 2.854 3338Zaire 1 1 -2.429 643Zambia 1 0 -2.173 1096Zimbabwe 1 1 0.987 1072
Average 0.749
Notes: ONQ (Qpenness Non-Qualifier) is a dummy variable equal to 1 (1 means nonqualifier) if a country scores a 1 on either BMP, SOC, EXM or OWQID. PNQ (Politics NonQualifier) is a dummy variable equal to 1 if a country scores a 1 on either RIGHT, SOC,or EDU. See the data appendix for a more detailed description. G7089 is annual growthin real GDP per capita between 1970 and 1989, using version 5.5 of the Summers-Hestondata. GDP70 is real GDP per capita in 1970 (units are 1985 international dollars) .
23
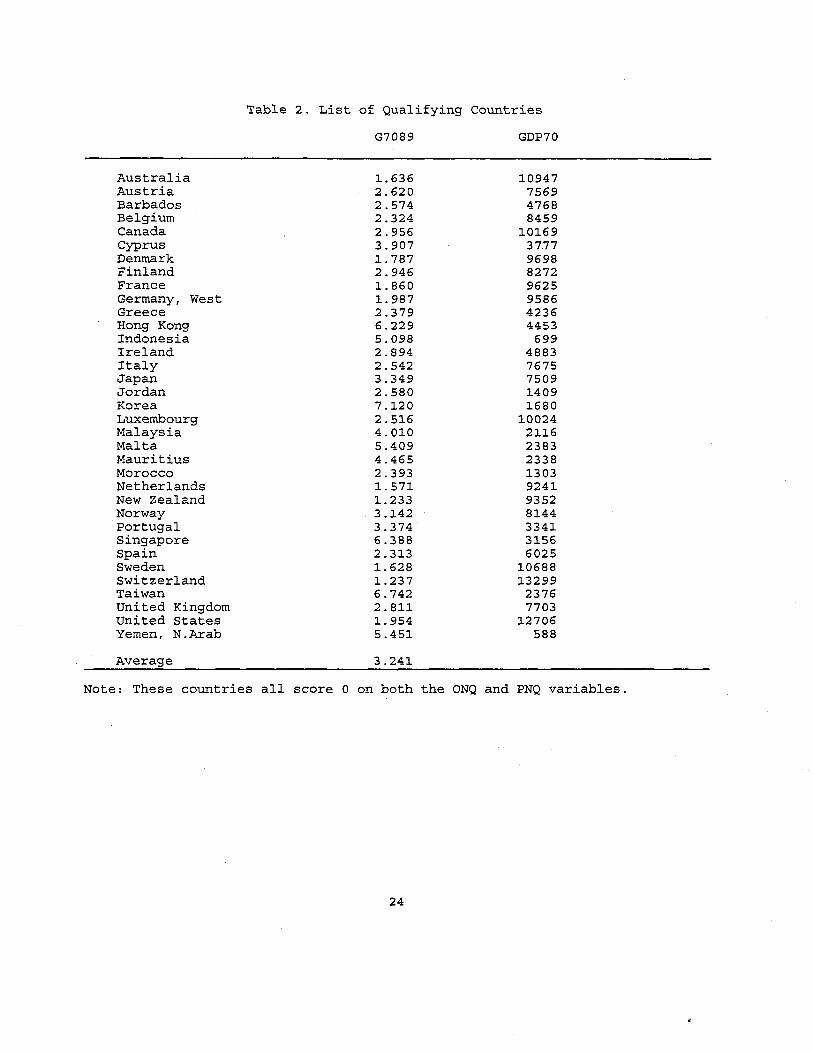
Table 2. List of Qualifying Countries
AustraliaAustriaBarbadosBelgiumCanadaCyprusDenmarkFinlandFranceGermany, WestGreeceHong KongIndonesiaIrelandItalyJapanJordanKoreaLuxembourgMalaysiaMaltaMauritiusMoroccoNetherlandsNew ZealandNorwayPortugalSingaporeSpainSwedenSwitzerlandTaiwanUnited KingdomUnited StatesYemen, N.Arab
Average
G7089
1.6362.6202.5742.3242.9563.9071. 7872.9461. 8601. 9872.3796.2295.0982.8942.5423.3492.5807.1202.5164.0105.4094.4652.3931.5711.2333.1423.3746.3882.3131.6281.2376.7422.8111.9545.451
3.241
GDP70
10947756947688459
101693777969882729625958642364453
69948837675750914091680
l00242116238323381303924193528144334131566025
1068813299
23767703
12706588
Note: These countries all score 0 on both the ONQ and PNQ variables.
24
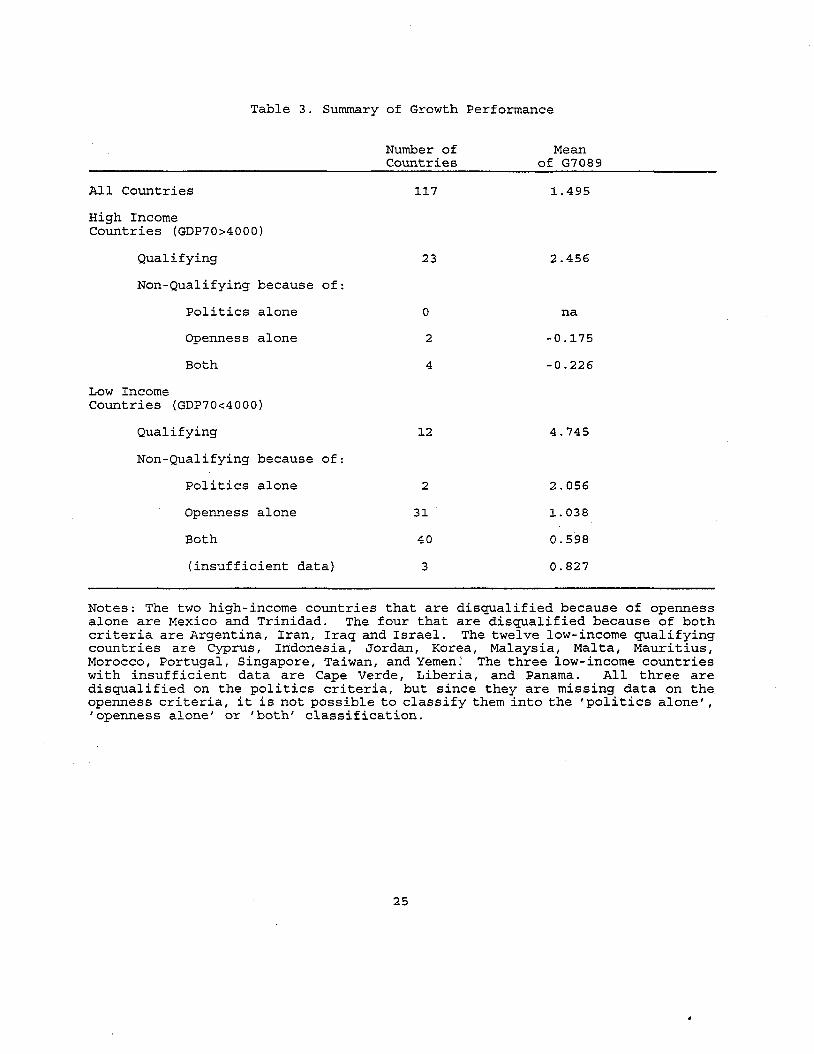
Table 3. Summary of Growth Performance
All Countries
High IncomeCountries (GDP70>4000)
Qualifying
Non-Qualifying because of:
Politics alone
Openness alone
Both
Low IncomeCountries (GDP70<4000)
Qualifying
Non-Qualifying because of:
Politics alone
Openness alone
Both
(insufficient data)
Number ofCountries
127
23
o
2
4
12
2
31
40
3
Meanof G7089
1.495
2.456
na
-0.175
-0.226
4.745
2.056
1. 038
0.598
0.827
Notes: The two high-income countries that are disqualified because of opennessalone are Mexico and Trinidad. The four that are disqualified because of bothcriteria are Argentina, Iran, Iraq and Israel. The twelve low-income qualifyingcountries are Cyprus, Indonesia, Jordan, Korea, Malaysia, Malta, Mauritius,Morocco, Portugal, Singapore, Taiwan, and Yemen: The three low-income countrieswith insufficient data are Cape Verde, Liberia, and Panama. All three aredisqualified on the politics criteria, but since they are missing data on theopenness criteria, it is not possible to classify them into the 'politics alone' ,'openness alone' or 'both' classification.
25
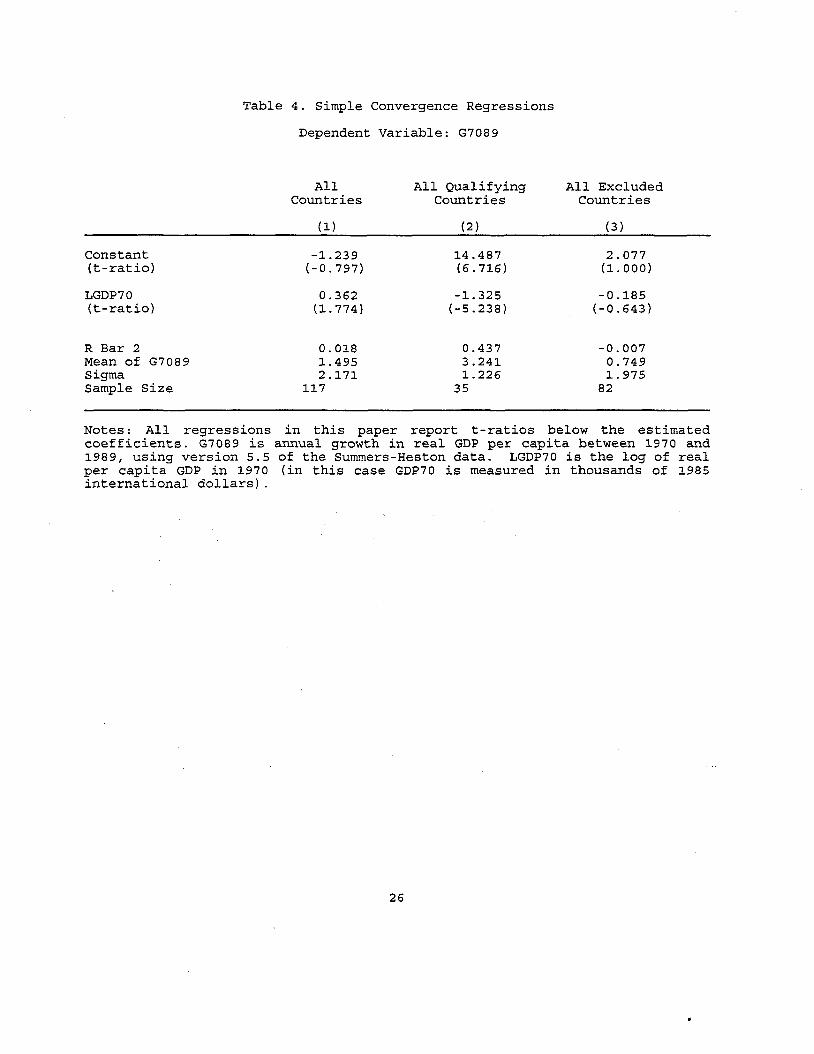
Table 4. Simple Convergence Regressions
Dependent Variable: G7089
All All Qualifying All ExcludedCountries Countries Countries
(1) (2 ) (3)
Constant -1.239 14.487 2.077(t-ratio) (-0.797) (6.716) (1.000)
LGDP70 0.362 -1. 325 -0.185(t-ratio) (1. 774) (-5.238) (-0.643)
R Bar 2 0.018 0.437 -0.007Mean of G7089 1.495 3.241 0.749Sigma 2.171 1.226 1. 975Sample Size 117 35 82
Notes: All regressions in this paper report t-ratios below the estimatedcoefficients. G7089 is annual growth in real GDP per capita between 1970 and1989, using version 5.5 of the Summers-Heston data. LGDP70 is the log of realper capita GDP in 1970 (in this case GDP70 is measured in thousands of 1985international dollars) .
26
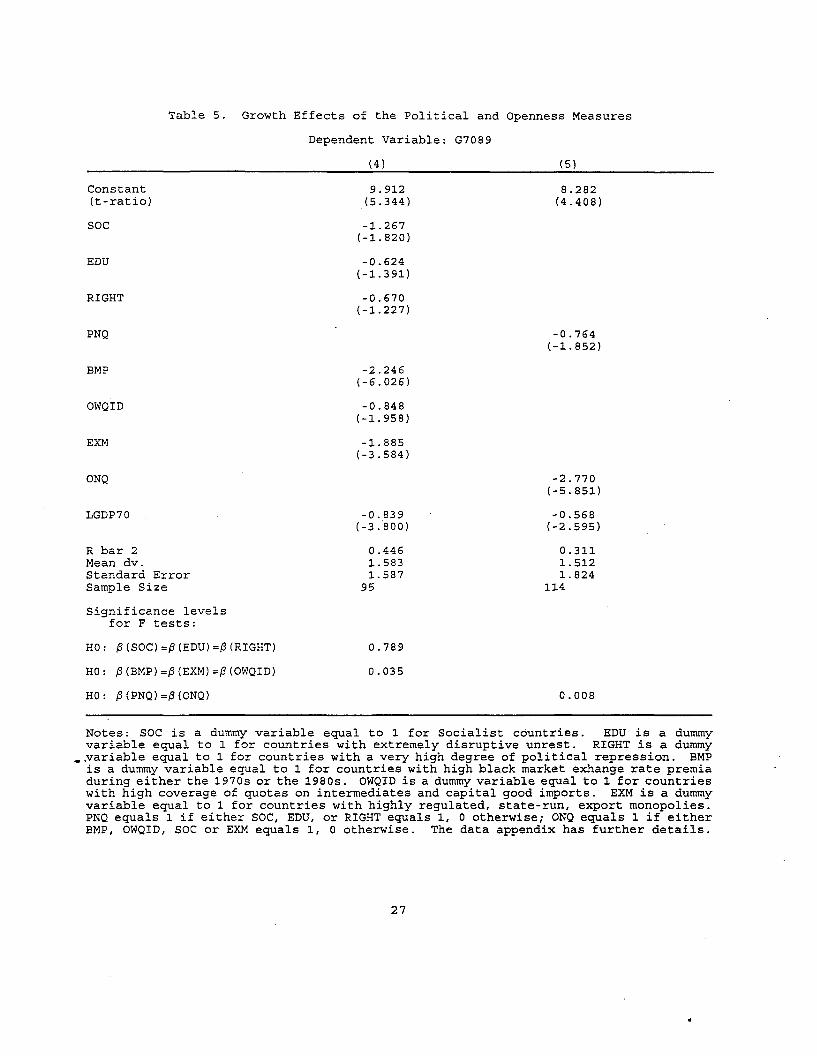
Table 5. Growth Effects of the Political and Openness Measures
Dependent Variable: G7089
Constant(t-ratio)
SOC
EDU
RIGHT
PNQ
BMP
OWQID
EXM
ONQ
LGDP70
R bar 2Mean dv.Standard ErrorSample Size
Significance levelsfor F tests:
(4) (5)
9.912 8.282(5.344) (4.408)
-1.267(-1.820)
-0.624(-1.391)
-0.670(-1.227)
-0.764(-1.852)
-2.246(-6.026)
-0.848(-1.958)
-1.885(-3.584)
-2.770(-5.851)
-0.839 -0.568(-3.800) (-2.595)
0.446 0.3111.583 1.5121.587 1.824
9S 114
HO: ~(SOC)=~(EDU)=~(RIGHT)
HO: ~(BMP)=~(EXM)=~(OWQID)
HO: ~(PNQ)=~(ONQ)
0.789
0.035
0.008
Notes: SOC is a dummy variable equal to 1 for Socialist countries. EDU is a dummyvariable equal to 1 for countries with extremely disruptive unrest. RIGHT is a dummy
•.variable equal to 1 for countries with a very high degree of political repression. BMPis a dummy variable equal to 1 for countries with high black market exhange rate premiaduring either the 1970s or the 1980s. OWQID is a dummy variable equal to 1 for countrieswith high coverage of quotas on intermediates and capital good imports. EXM is a dummyvariable equal to 1 for countries with highly regulated, state-run, export monopolies.PNQ equals 1 if either SOC, EDU, or RIGHT equals 1, 0 otherwise; ONQ equals 1 if eitherBMP, OWQID, SOC or EXM equals 1, 0 otherwise. The data appendix has further details.
27
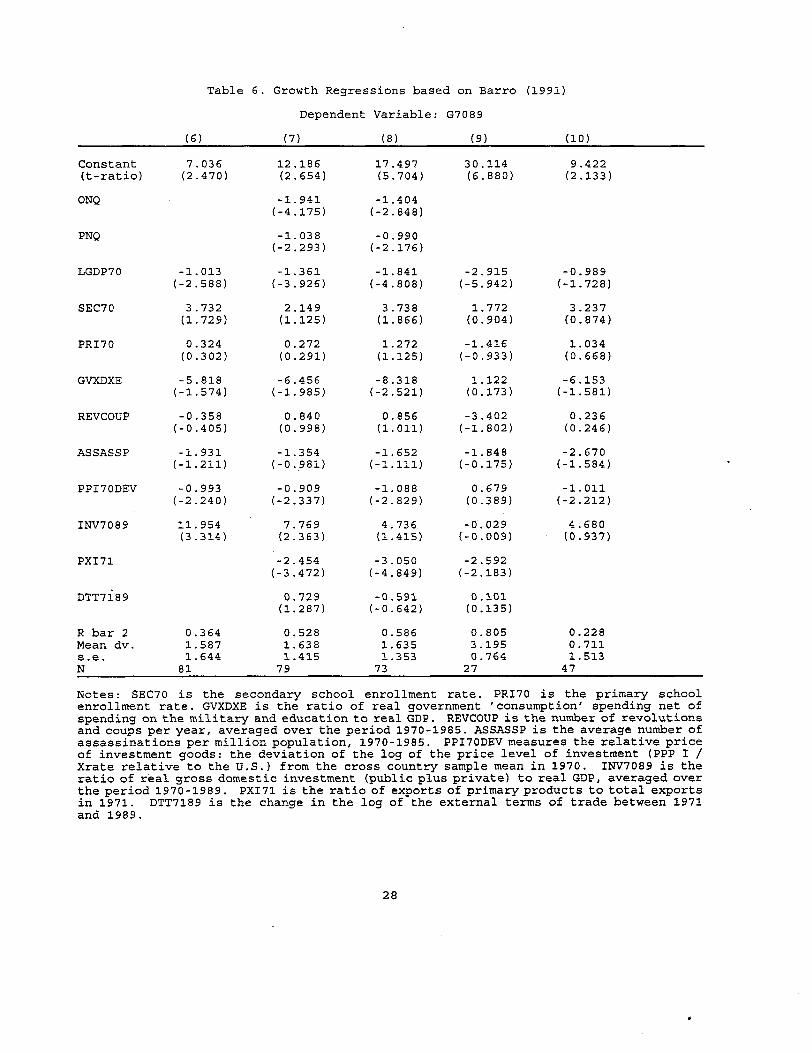
Table 6. Growth Regressions based on Barro (1991)
Dependent Variable: G7089
(6) (7) (8) (9) (10)
Constant 7.036 12.186 17.497 30.114 9.422(t-ratio) (2.470) (2.654) (5.704) (6.880) (2.133)
ONQ -1. 941 -1.404(-4.175) (-2.848)
PNQ -1.038 -0.990(-2.293) (-2.176)
LGDP70 -1.013 -1. 361 -1. 841 -2.915 -0.989(-2.588) (-3.926) (-4.808) (-5.942) (-1.728)
SEC70 3.732 2.149 3.738 1.772 3.237(1. 729) (1.125) (1. 866) (0.904) (0.874)
PRI70 0.324 0.272 1.272 -1.416 1.034(0.302) (0.291) (1.125) (-0.933) (0.668)
GVXDXE -5.818 -6.456 -8.318 1.122 -6.153(-1.574) (-1.985) (-2.521) (0.173) (-1.581)
REVCOUP -0.358 0.840 0.856 -3.402 0.236(-0.405) (0.998) (1. 011) (-1. 802) (0.246)
ASSASSP -1. 931 -1.354 -1. 652 -1.848 -2.670(-1. 211) (-0.981) (-1.111) (-0.175) (-1.584)
PPI70DEV -0.993 -0.909 -1.088 0.679 -1.011(-2.240) (-2.337) (-2.829) (0.389) (-2.212)
INV7089 11.954 7.769 4.736 -0.029 4.680(3.314 ) (2.363) (1.415) (-0.009) (0.937)
PXI71 -2.454 -3.050 -2.592(-3.472) (-4.849) (-2.183)
DTT7189 0.729 -0.591 0.101(1. 287) (-0.642) (0.135)
R bar 2 0.364 0.528 0.586 0.805 0.228Mean dv. 1.587 1.638 1. 635 3.195 0.711s.e. 1.644 1.415 1.353 0.764 1.513N 81 79 73 27 47
Notes: SEC70 is the secondary school enrollment rate. PRI70 is the primary schoolenrollment rate. GVXDXE is the ratio of real government 'consumption' spending net ofspending on the military and education to real GDP. REVCOUP is the number of revolutionsand coups per year, averaged over the period 1970-1985. ASSASSP is the average number ofassassinations per million population, 1970-1985. PPI70DEV measures the relative priceof investment goods: the deviation of the log of the price level of investment (PPP I IXrate relative to the U.S.) from the cross country sample mean in 1970. INV7089 is theratio of real gross domestic investment (public plus private) to real GDP, averaged overthe period 1970-1989. PXI71 is the ratio of exports of primary products to total exportsin 1971. DTT7189 is the change in the log of the external terms of trade between 1971and 1989.
28
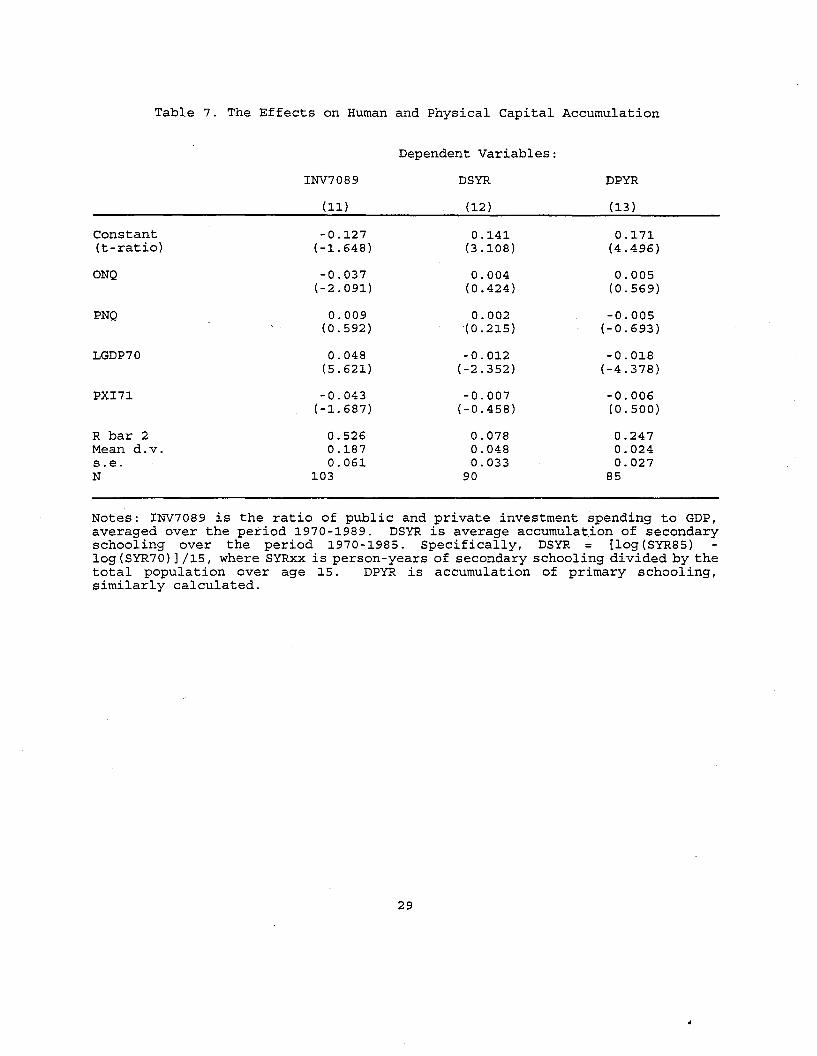
Table 7. The Effects on Human and Physical Capital Accumulation
Dependent Variables:
INV7089 DSYR DPYR
(11.) (12) (l3)
Constant -0.127 0.141 0.171(t-ratio) (-1.648) (3.108) (4.496)
ONQ -0.037 0.004 0.005(-2.091) (0.424) (0.569)
PNQ 0.009 0.002 -0.005(0.592) (0.215) (-0.693)
LGDP70 0.048 -0.012 -0.018(5.621) (-2.352) (-4.378)
PXI71 -0.043 -0.007 -0.006(-1. 687) (-0.458) (0.500)
R bar 2 0.526 0.078 0.247Mean d.v. 0.187 0.048 0.024s.e. 0.061 0.033 0.027N 103 90 85
Notes: INV7089 is the ratio of public and private investment spending to GDP,averaged over the period 1970-1989. DSYR is average accumulation of secondaryschooling over the period 1970-1985. Specifically, DSYR = [log (SYR85)log (SYR70) ] /15, where SYRxx is person-years of secondary schooling divided by thetotal population over age 15. DPYR is accumulation of primary schooling,similarly calculated.
29
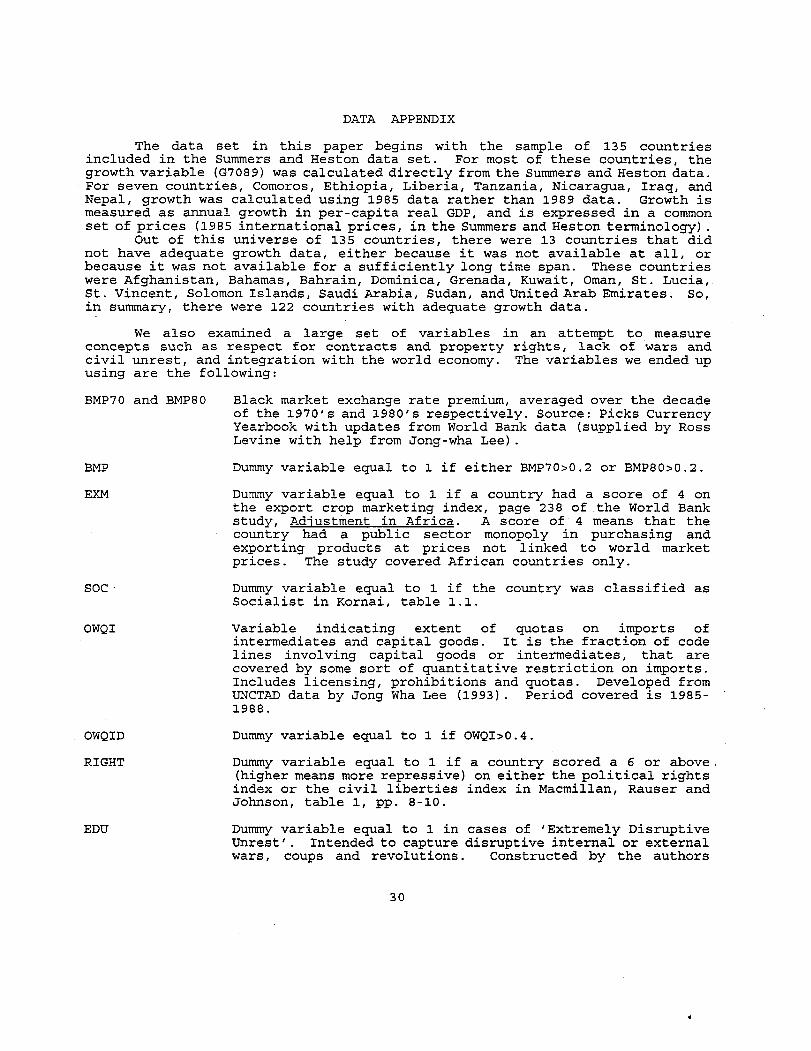
DATA APPENDIX
The data set in this paper begins with the sample of 135 countriesincluded in the Summers and Heston data set. For most of these countries, thegrowth variable (G7089) was calculated directly from the Summers and Heston data.For seven countries, Comoros, Ethiopia, Liberia, Tanzania, Nicaragua, Iraq, andNepal, growth was calculated using 1985 data rather than 1989 data. Growth ismeasured as annual growth in per-capita real GDP, and is expressed in a commonset of prices (1985 international prices, in the Summers and Heston terminology) .
Out of this universe of 135 countries, there were 13 countries that didnot have adequate growth data, either because it was not available at all, orbecause it was not available for a sufficiently long time span. These countrieswere Afghanistan, Bahamas, Bahrain, Dominica, Grenada, Kuwait, Oman, St. Lucia,St. Vincent, Solomon Islands, Saudi Arabia, Sudan, and United Arab Emirates. So,in summary, there were 122 countries with adequate growth data.
We also examined a large set of variables in an attempt to measureconcepts such as respect for contracts and property rights, lack of wars andcivil unrest, and integration with the world economy. The variables we ended upusing are the following:
BMP70 and BMP80
BMP
EXM
SOC·
OWQI
OWQID
RIGHT
EDU
Black market exchange rate premium, averaged over the decadeof the 1970's and 1980's respectively. Source: Picks CurrencyYearbook with updates from World Bank data (supplied by RossLevine with help from Jong-wha Lee) .
Dummy variable equal to 1 if either BMP70>0.2 or BMP80>0.2.
Dummy variable equal to 1 if a country had a score of 4 onthe export crop marketing index, page 238 of the World Bankstudy, Adjustment in Africa. A score of 4 means that thecountry had a public sector monopoly in purchasing andexporting products at prices not linked to world marketprices. The study covered African countries only.
Dummy variable equal to 1 if the country was classified asSocialist in Kornai, table 1.1.
Variable indicating extent of quotas on imports ofintermediates and capital goods. It is the fraction of codelines involving capital goods or intermediates, that arecovered by some sort of quantitative restriction on imports.Includes licensing, prohibitions and quotas. Developed fromUNCTAD data by Jong Wha Lee (1993). Period covered is 19851988.
Dummy variable equal to 1 if OWQI>0.4.
Dummy variable equal to 1 if a country scored a 6 or above.(higher means more repressive) on either the political rightsindex or the civil liberties index in Macmillan, Rauser andJohnson, table 1, pp. 8-10.
Dummy variable equal to 1 in cases of 'Extremely DisruptiveUnrest'. Intended to capture disruptive internal or externalwars, coups and revolutions. Constructed by the authors
30
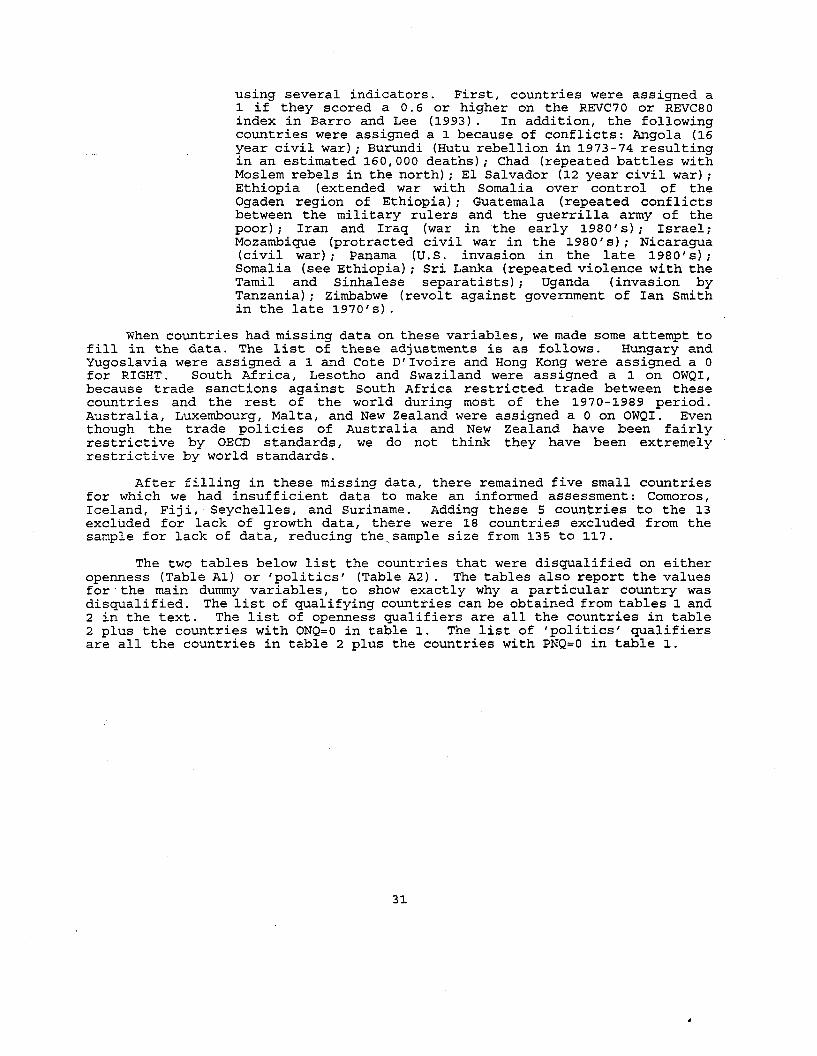
using several indicators. First, countries were assigned a1 if they scored a 0.6 or higher on the REVC70 or REVC80index in Barro and Lee (1993). In addition, the followingcountries were assigned a 1 because of conflicts: Angola (16year civil war); Burundi (Hutu rebellion in 1973-74 resultingin an estimated 160,000 deaths); Chad (repeated battles withMoslem rebels in the north); El Salvador (12 year civil war);Ethiopia (extended war with Somalia over control of theOgaden region of Ethiopia); Guatemala (repeated conflictsbetween the military rulers and the guerrilla army of thepoor); Iran and Iraq (war in the early 1980's) ; Israel;Mozambique (protracted civil war in the 1980's); Nicaragua(civil war); Panama (U.S. invasion in the late 1980's);Somalia (see Ethiopia); Sri Lanka (repeated violence with theTamil and Sinhalese separatists); Uganda (invasion byTanzania); Zimbabwe (revolt against government of Ian Smithin the late 1970's).
When countries had missing data on these variables, we made some attempt tofill in the data. The list of these adjustments is as follows. Hungary andYugoslavia were assigned a 1 and Cote D'Ivoire and Hong Kong were assigned a 0for RIGHT. South Africa, Lesotho and Swaziland were assigned a 1 on OWQI,because trade sanctions against South Africa restricted trade between thesecountries and the rest of the world during most of the 1970-1989 period.Australia, Luxembourg, Malta, and New Zealand were assigned a 0 on OWQI. Eventhough the trade policies of Australia and New Zealand have been fairlyrestrictive by OECD standards, we do not think they have been extremelyrestrictive by world standards.
After filling in these missing data, there remained five small countriesfor which we had insufficient data to make an informed assessment: Comoros,Iceland, Fiji, Seychelles, and Suriname. Adding these 5 countries to the 13excluded for lack of growth data, there were 18 countries excluded from thesample for lack of data, reducing the,sample size from 135 to 117.
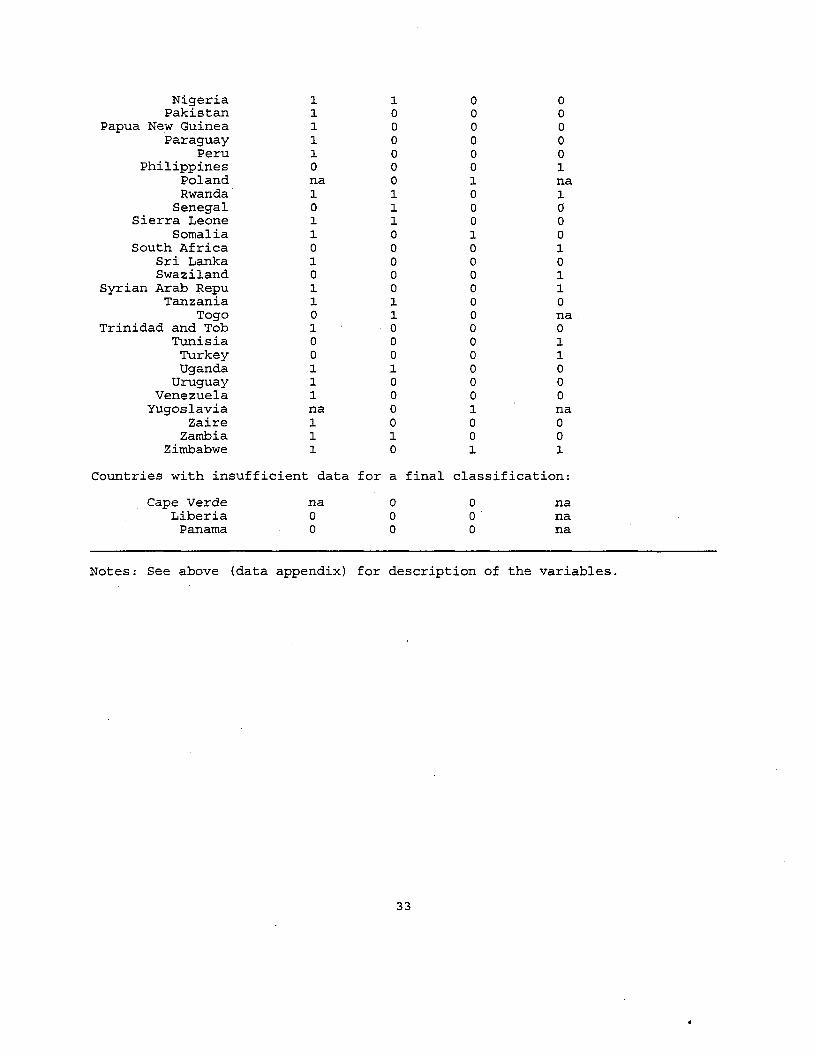
The two tables below list the countries that were disqualified on eitheropenness (Table A1) or 'politics' (Table A2). The tables also report the valuesfor' the main dummy variables, to show exactly why a particular country wasdisqualified. The list of qualifying countries can be obtained from tables 1 and2 in the text. The list of openness qualifiers are all the countries in table2 plus the countries with ONQ=O in table 1. The list of 'politics' qualifiersare all the countries in table 2 plus the countries with PNQ=O in table 1.
31
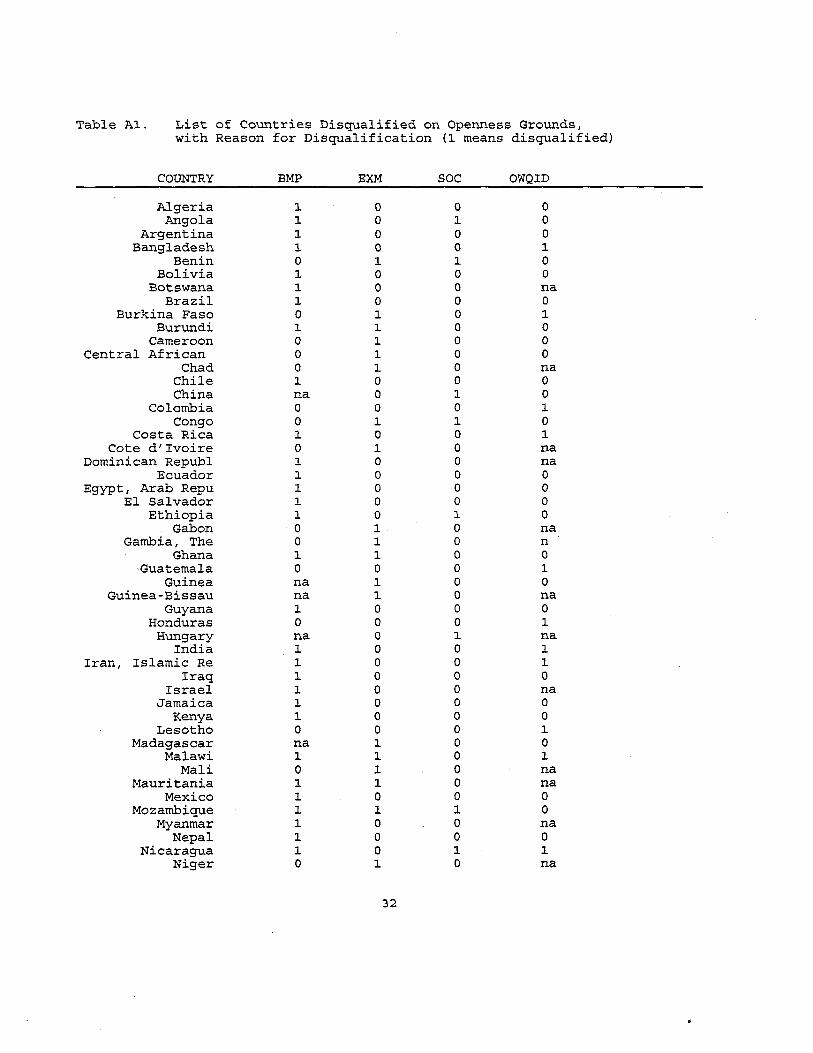
Table A1. List of Countries Disqualified on Openness Grounds,with Reason for Disqualification (1 means disqualified)
COUNTRY BMP EXM SOC OWQID
Algeria 1 0 0 0Angola 1 0 1 0
Argentina 1 0 0 0Bangladesh 1 0 0 1
Benin 0 1 1 0Bolivia 1 0 0 0
Botswana 1 0 0 naBrazil 1 0 0 0
Burkina Faso 0 1 0 1Burundi 1 1 0 0
Cameroon 0 1 0 0Central African 0 1 0 0
Chad 0 1 0 naChile 1. 0 0 0China na 0 1. 0
Colombia 0 0 0 1.Congo 0 1. 1. 0
Costa Rica 1. 0 0 1.Cote d'Ivoire 0 1. 0 na
Dominican Republ 1. 0 0 naEcuador 1. 0 0 0
Egypt, Arab Repu 1. 0 0 0El Salvador 1. 0 0 0
Ethiopia 1. 0 1. 0Gabon 0 1. 0 na
Gambia, The 0 1. 0 nGhana 1 1. 0 0
Guatemala 0 0 0 1.Guinea na 1. 0 0
Guinea-Bissau na 1. 0 naGuyana 1. 0 0 0
Honduras 0 0 0 1.Hungary na 0 1. na
India 1. 0 0 1.Iran, Islamic Re 1. 0 0 1.
Iraq 1. 0 0 0Israel 1. 0 0 na
Jamaica 1. 0 0 0Kenya 1. 0 0 0
Lesotho 0 0 0 1.Madagascar na 1. 0 0
Malawi 1. 1. 0 1.Mali 0 1. 0 na
Mauritania 1. 1. 0 naMexico 1. 0 0 0
Mozambique 1. 1. 1. 0Myanmar 1. 0 0 na
Nepal 1. 0 0 0Nicaragua 1. 0 1. 1.
Niger 0 1. 0 na
32
Nigeria 1 1 0 0Pakistan 1 0 0 0
Papua New Guinea 1 0 0 0Paraguay 1 0 0 0
Peru 1 0 0 0Philippines 0 0 0 1
Poland na 0 1 naRwanda 1 1 0 1
Senegal 0 1 0 0Sierra Leone 1 1 0 0
Somalia 1 0 1 0South Africa 0 0 0 1
Sri Lanka 1 0 0 0Swaziland 0 0 0 1
Syrian Arab Repu 1 0 0 1Tanzania 1 1 0 0
Togo 0 1 0 naTrinidad and Tob 1 0 0 0
Tunisia 0 0 0 1Turkey 0 0 0 1Uganda 1 1 0 0
Uruguay 1 0 0 0Venezuela 1 0 0 0
Yugoslavia na 0 1 naZaire 1 0 0 0
Zambia 1 1 0 0Zimbabwe 1 0 1 1
Countries with insufficient data for a final classification:
Cape Verde na 0 0 naLiberia 0 0 0 na
Panama 0 0 0 na
Notes: See above (data appendix) for description of the variables.
33
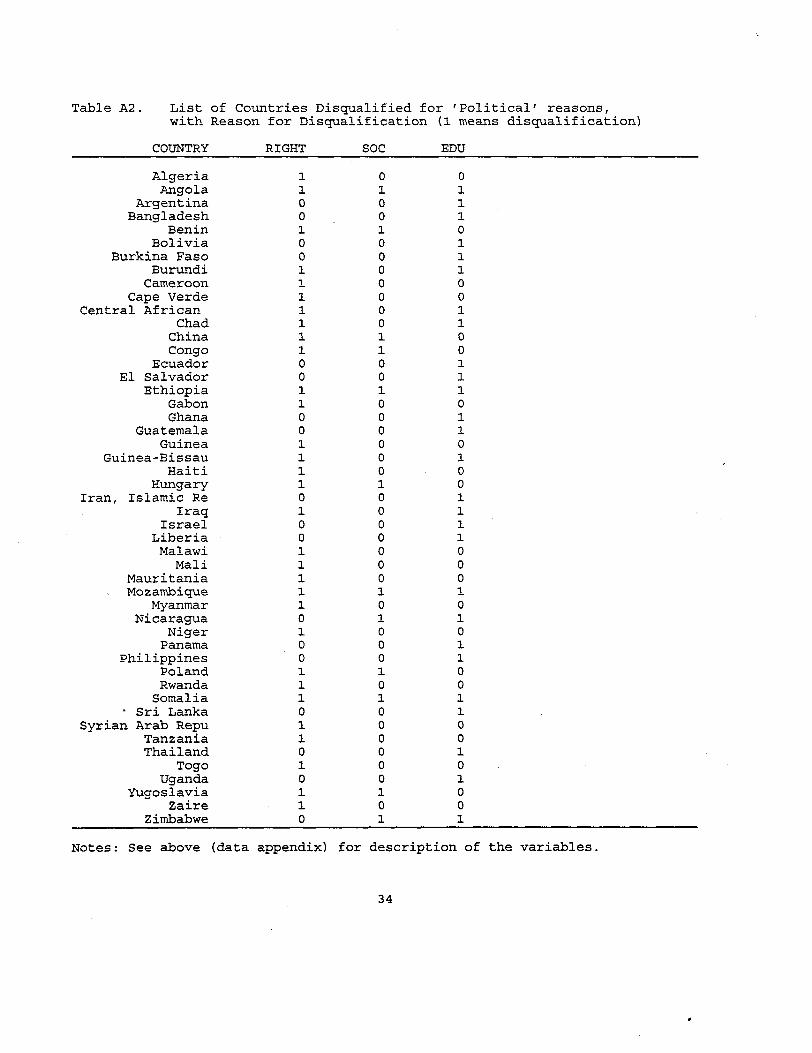
Table A2. List of Countries Disqualified for 'Political' reasons,with Reason for Disqualification (1 means disqualification)
COUNTRY RIGHT SOC EDU
Algeria 1 0 0Angola 1 1 1
Argentina 0 0 1Bangladesh 0 0 1
Benin 1 1 0Bolivia 0 0 1
Burkina Faso 0 0 1Burundi 1 0 1
Cameroon 1 0 0Cape Verde 1 0 0
Central African 1 0 1Chad 1 0 1
China 1 1 0Congo 1 1 0
Ecuador 0 0 1El Salvador 0 0 1
Ethiopia 1 1 1Gabon 1 0 0Ghana 0 0 1
Guatemala 0 0 1Guinea 1 0 0
Guinea-Bissau 1 0 1Haiti 1 0 0
Hungary 1 1 0Iran, Islamic Re 0 0 1
Iraq 1 0 1Israel 0 0 1
Liberia 0 0 1Malawi 1 0 0
Mali 1 0 0Mauritania 1 0 0Mozambique 1 1 1
Myanmar 1 0 0Nicaragua 0 1 1
Niger 1 0 0Panama 0 0 1
Philippines 0 0 1Poland 1 1 0Rwanda 1 0 0
Somalia 1 1 1. Sri Lanka 0 0 1Syrian Arab Repu 1 0 0
Tanzania 1 0 0Thailand 0 0 1
Togo 1 0 0Uganda 0 0 1
Yugoslavia 1 1 0Zaire 1 0 0
Zimbabwe 0 1 1
Notes: See above (data appendix) for description of the variables.
34
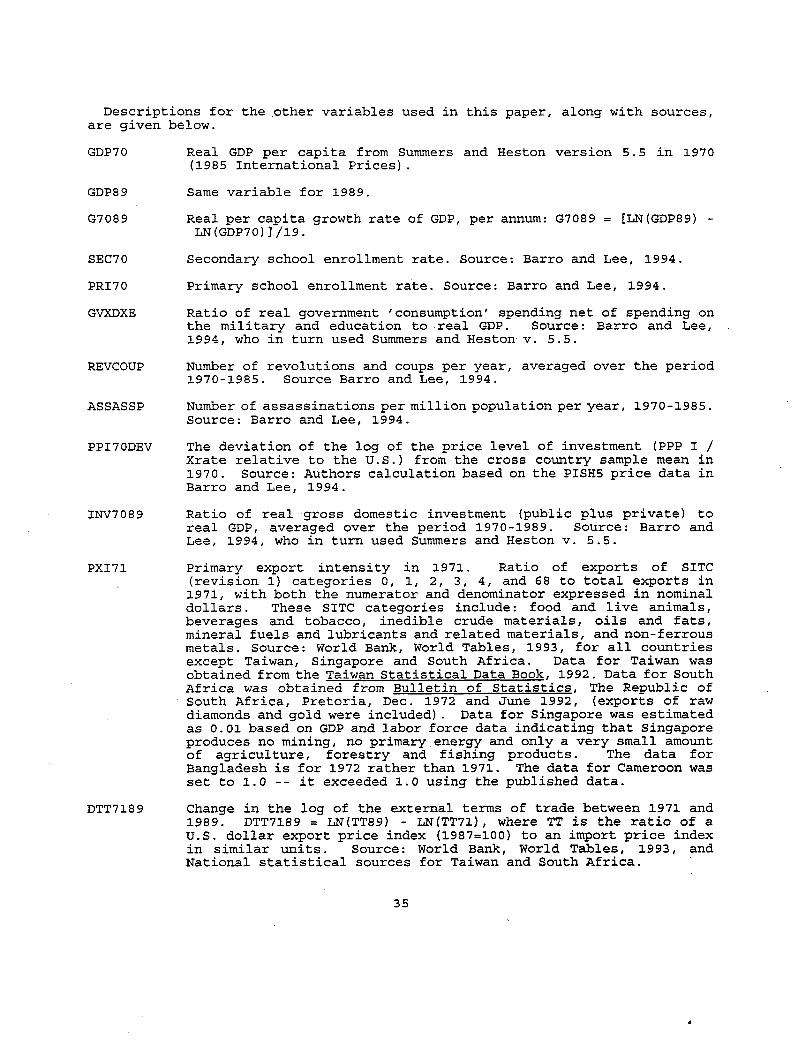
Descriptions for the other variables used in this paper, along with sources,are given below.
GDP70
GDP89
Real GDP per capita from Summers and Heston version 5.5 in 1970(1985 International Prices).
Same variable for 1989.
G7089 Real per capita growth rate of GDP, per annum: G7089LN(GDP70»)/19.
[LN(GDP89) -
SEC70
PRI70
GVXDXE
REVCOUP
ASSASSP
PPI70DEV
INV7089
PXI71
DTT7189
Secondary school enrollment rate. Source: Barro and Lee, 1994.
Primary school enrollment rate. Source: Barro and Lee, 1994.
Ratio of real government 'consumption' spending net of spending onthe military and education to real GDP. Source: Barro and Lee,1994, who in turn used Summers and Heston v. 5.5.
Number of revolutions and coups per year, averaged over the period1970-1985. Source Barro and Lee, 1994.
Number of assassinations per million population per year, 1970-1985.Source: Barro and Lee, 1994.
The deviation of the log of the price level of investment (PPP I /Xrate relative to the U.S.) from the cross country sample mean in1970. Source: Authors calculation based on the PISH5 price data inBarro and Lee, 1994.
Ratio of real gross domestic investment (public plus private) toreal GDP, averaged over the period 1970-1989. Source: Barro andLee, 1994, who in turn used Summers and Heston v. 5.5.
Primary export intensity in 1971. Ratio of exports of SITC(revision 1) categories 0, 1, 2, 3, 4, and 68 to total exports in1971, with both the numerator and denominator expressed in nominaldollars. These SITC categories include: food and live animals,beverages and tobacco, inedible crude materials, oils and fats,mineral fuels and lubricants and related materials, and non-ferrousmetals. Source: World Bank, World Tables, 1993, for all countriesexcept Taiwan, Singapore and South Africa. Data for Taiwan wasobtained from the Taiwan Statistical Data Book, 1992. Data for SouthAfrica was obtained from Bulletin of Statistics, The Republic ofSouth Africa, Pretoria, Dec. 1972 and June 1992, (exports of rawdiamonds and gold were included). Data for Singapore was estimatedas 0.01 based on GDP and labor force data indicating that Singaporeproduces no mining, no primary energy and only a very small amountof agriculture, forestry and fishing products. The data forBangladesh is for 1972 rather than 1971. The data for Cameroon wasset to 1.0 -- it exceeded 1.0 using the published data.
Change in the log of the external terms of trade between 1971 and1989. DTT71B9 = LN(TTB9) - LN(TT71), where TT is the ratio of aU.S. dollar export price index (1987=100) to an import price indexin similar units. Source: World Bank, World Tables, 1993, andNational statistical sources for Taiwan and South Africa.
35
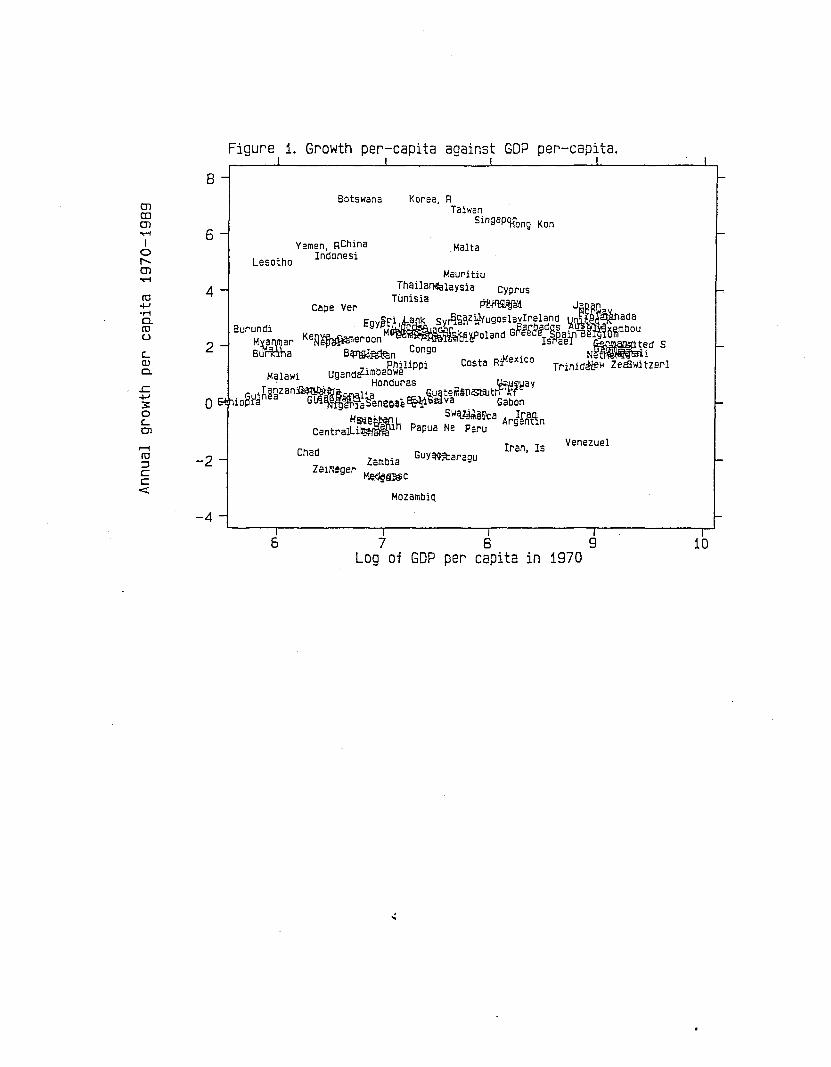
Figure i. Growth per-capita against GOP per-capita.I I I I
B -I
I-
Maur'itiu4 - Thaila~laysia Cyprus
Cape Ver Tunisia ~ ~InE9y~f~'a k syr!J.Si\Z~ugOSlavlreland LJ ~ada
Burundi M' cl;Qr~,,~ 1 d G~g~8gd~S/" olnmbou
2 - Mx?_n,i1)ar Ke~~eroon . oo~'lf° an IsiPaelf ~ted 5Bumna B~~n Congo . N~~i
. Philippi Costa Rflexlco Trinid~W ZecBwitzerlMalawi ugandc?lmbabwe
. . Honduras ~§I~ay.Tanzan~S; lia G.uiltelilaDcstaJthW'~roB hio§~anea GW!W.tg~aseneoee 8§.'lriijfl1 va Gabon
. 5W"7';1""-a IranMl!ll.e~h VttIll",,, Argennn
CentralLi~'l Papua Ne Peru
01CD01......I
of'01......co
-l-'·rl0..COU
c:...(l)0..
.c-l-'~oc:...OJ
6 -
Botswana
Yemen RChinaLesotho Indonesi
Korea, RTaiwan
singaP'Hong Kon
Malta
-
-
Chad Zambia GUY~araguZairleger t-4M§§~C
Mozambiq
Iran, Is Venezuel
-
-4 -
789Log of GOP per capita in 1970
I
10
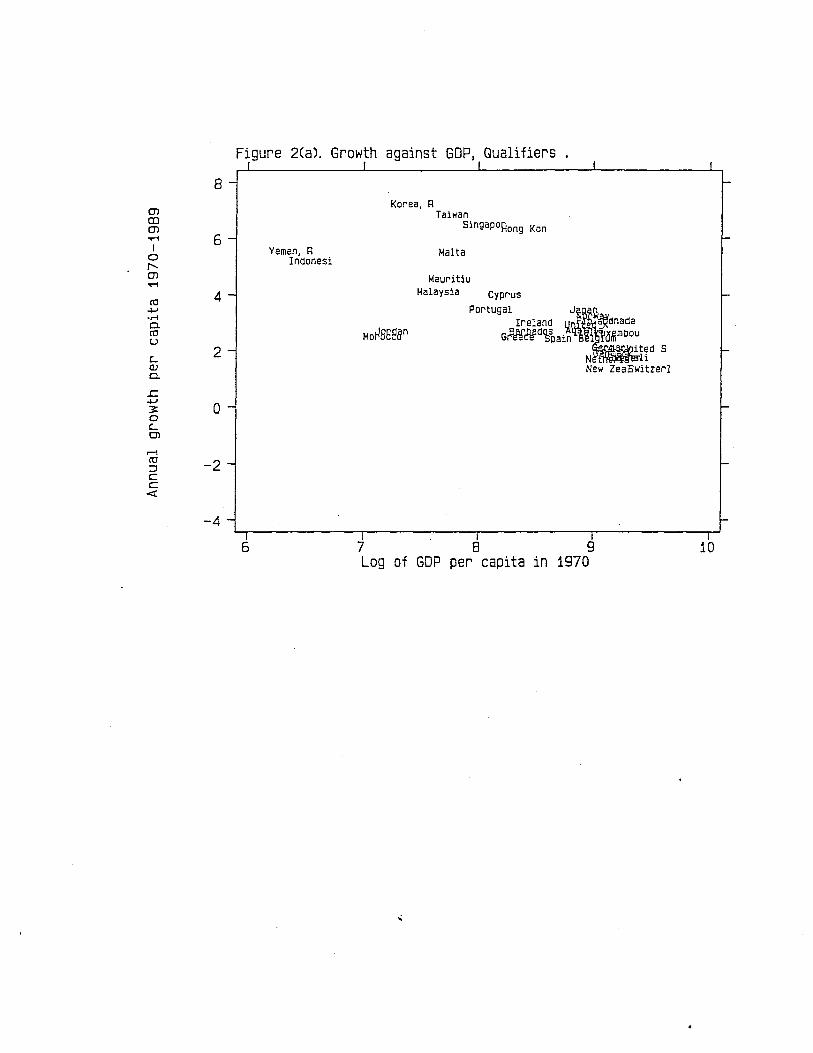
Figure 2(a). Growth against GOP I QualifiersI f I I I
8- -
mKorea, R
TaiwanaJ singapoHong Konm...-1 6 - l-I Yemen, R Malta0 Indonesi
-'""ן
m Mauritiu...-1
4 - Malaysia Cyprusco4-' Portugal ~~·rl Ireland ~ ~6nada0.
Mo~BEeanco G~~d~~ain am mbouu
2- ~~dS -'- N 1III New ZeaEwitzerl0.
.r:4-' o -3=0'-Ol
~
co -2 -::lCC<!
-4 - -I I I I I
6 7 8 9 10Log of GOP per capita in 1970
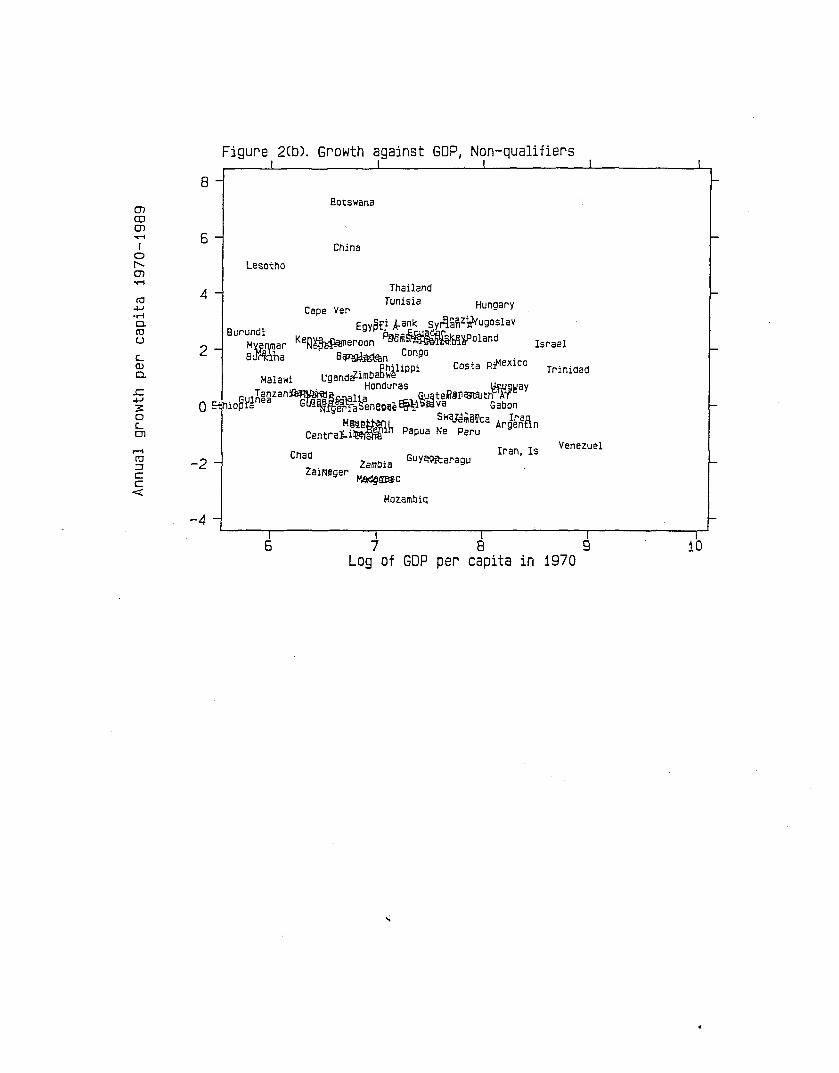
Figure 2Cb). Growth against GOP I Non-qualifiersI I I I I
8 -
-I
10
VenezuelIran, IsGUycrntaragu
China
Botswana
7 ~ ~Log of GOP per capita in 1970
ZambiaZail'l/1ger
~mc
Mozambiq
Chad
I6
lesothO
4 -
6 -
ThailandTunisiaCape Ver Hungary
EgySf! kank Sy~aRZ~ugoslavBurundi P ~c.ua~r_u~
M ar Ke~~eroon Pgl8~h~~~oland Israel2 - BJf4fha 8~n Congo .
. PhiliPPi Costa RtleXlco TrinidadMalawi ugandcf:lmbabwe
. Honduras ~§~ay
Gu'A~gzan~S~lia GuatefliiDCSl:l'tJthV'A'fo8!hiopla GUi~fgE!'laSenell~e~i\ii13Va Gabon
MSIl~~ h SWa.M~8!'ca ArJf~&nCentralli~'l Papua Ne Peru
-2 -
-4 -
mcom.......I
o"ן
m.......
......ro:JcC<
ro4.J'M0rou
"(l)
0-
.c4.J~o"OJ
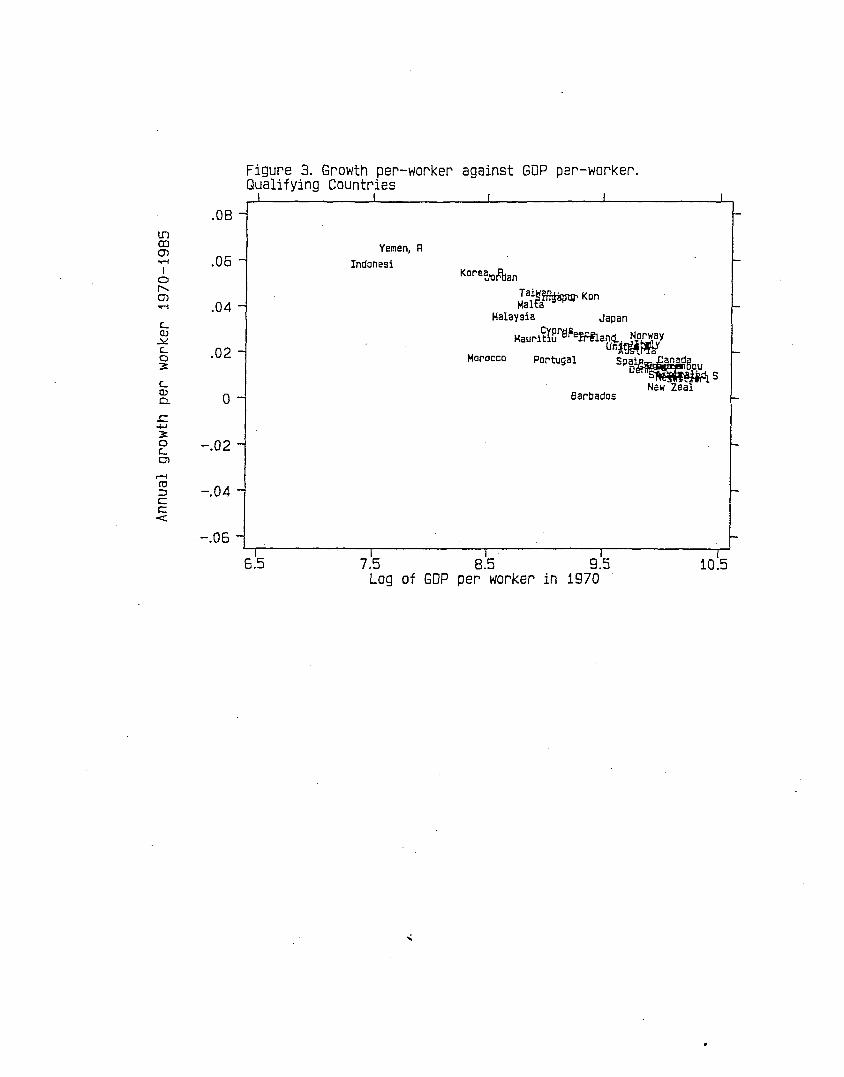
Figure 3. Growth per-worker against GOP per-worker.Qualifying Countries
I I f I I
.08 - e-
If)en Yemen, Rm...-I .06 - Indanesi -I Kor-e~fban0l"
Tai~~Konm...-I .04 - Mal a ~
Malaysia Japanc...Maur-i~lBr-!l~e!Rland. Nor-wayOJ
.::.t.U1l1tM~c... .02 - -0 Mor-occo Por-tugal spa~J: D ou. 5
c... New ZealOJ o - Bar-bados f-a..
.c4..JJ:0 -.02 -c...OJ
r-ico -.04 -::JCC<r:
-.06 - r-
5~5 7:5I
9:5I
8.5 10.5Log of GOP per worker in 1970
REFERENCES
Adjustment in Africa, World Bank, New York, Oxford University Press, 1994.
Alesina, A S. OzIer, N. Roubini, and P. Swagel, Political Instability andEconomic Growth, NBER Working Paper No. 4173, 1992
Barro, R. and X. Sala-i-Martin, "Convergence Across States andRegions," Brookings Papers on Economic Activity, 1991:1
Barro, R., "Economic Growth in a Cross Section of Countries," QuarterlyJournal of Economics 106, 1991, 407-444.
Barro, R. and X. Sala-i-Martin, "Convergence," Journal of PoliticalEconomy, Vol. 100, No.2, 1992
Barro, R. and X. Sala-i-Martin, "Regional Growth and Migration: AJapan-United States Comparison," Journal of Japanese andInternational Economics, 6, 1992, pp. 312-346
Barro, R. and Jong-Wha Lee, "International Comparisons of EducationalAttainment," Journal of Monetary Economics 32, 1993, 363-394.
Baumol, William J., Richard R. Nelson, Edward N. Wolff (eds.), Convergenceof Productivity, New York: Oxford University Press, 1994.
Ben-David, Dan. "Equalizing exchange: trade liberalization and incomeconvergence." Quarterly Journal of Economics, August 1993, v108, n3,p653 (27) .
Bhalla, Surgit S., "Freedom and economic Growth: A Virtuous Cycle,"presented at the Nobel Symposium on Democracies, Victory and Crisis atUppsala University, Sweden, August 27-30, 1994.
DeLong J. B. "Productivity Growth, Convergence and Welfare: A Comment",American Economic Review, 78, December 1988, 1138-54.
Dollar, David, "Outward Oriented Economies Really do Grow More Rapidly:Evidence from 95 LDCs, 1976-1985," Economic Development and CulturalChange 40, 1992, 523-544.
Dowrick, Steve, and Duc-Tho Nguyen, "OECD Comparative EconomicGrowth 1950-1985: Catch-up and Convergence," American EconomicReview, 79, pp. 1010-30
Grossman, Gene, and Elhanan Helpman, Innovation and Growth in the GlobalEconomy, Cambridge: MIT Press, 1991.
Helliwell, J. F. "International Growth Linkages: Evidence from Asia andthe OECD." National Bureau of Economic Research Working Paper No. 4245.December 1992.
Eicher, T. S. "Trade and converging Growth Rates in a Model withEndogenous Human Capital and Technological Change." Unpublished paper,Columbia University, December, 1993.
King, Robert and Ross Levine, "Finance and Growth: Schumpeter Might be
37
Right," Ouarterly Journal of Economics 108, 1993, 717-738.
Kormendi, Roger and Philip Meguire, "Macroeconomic Determinents ofGrowth," Journal of Monetary Economics 16, 1985, 141-163.
Kornai, Janos, The Socialist System: The Political Economv ofCommunism, Princeton, N.J.: Princeton University Press, 1992.
Krishna, Pravin and Devashish Mitra, "Trade Liberalization, MarketDiscipline and Productivity Growth: New Evidence from India." Unpublishedpaper, Columbia University, December 1994.
Laothamatos, Anek, "The Politics of Structural Adjustment in Thailand: aPolitical Explanation of Economic Success", in Andrew Macintyre andKanishka Jayasuriya eds. The Dynamics of Economic Policy Reform in southEast Asia and the South-West Pacific, Oxford: Oxford University Press,1992 .
Lee, Jong-Wha, "International Trade, Distortions, and Long-Run EconomicGrowth," IMF Staff Papers, vol. 40, No.2, June 1993, 299-328.
Levine, Ross and David Renelt, "A Sensitivity Analysis of Cross-CountryGrowth Regressions," American Economic Review 82, 1992, 942-963.
Lucas, Robert, "On the Mechanics of Economic Development," Journal ofMonetary Economics, 22, 1988, 3-42.
Mankiw, Gregory, David Romer, and David Weil, "A Contribution to theEmpirics of Economic Growth," Ouarterly Journal of Economics 106, 1992,407-437.
McMillan, John C., Gordon C. Rausser, and Stanley R. Johnson, "EconomicGrowth, Political and civil Liberties," Occasional Paper No. 53,International Center for Economic Growth, San Francisco: ICS Press, 1994.
Phongpaichit, Pasuk, "Technocrats, Businessmen and Generals: Democracy andEconomic Policy Making in Thailand", in Andrew Macintyre and KanishkaJayasuriya eds. The Dynamics of Economic Policy Reform in South-East Asiaand the South-West Pacific, Oxford: Oxford University Press, 1992.
Pritchett, Lant, "Measuring Outward Orientation in Developing Countries:can it be done?", WPS Working Paper No. 566, The World Bank, October 1993.
Romer, Paul M., "Increasing Returns and Long-Run Growth," Journalof Political Economy, 1986, vol. 94, no. 5, pp. 1002-1037.
Romer, Paul M., "Endogenous Technological Change," Journal ofPolitical Economy, 1990, vol. 98, no. 5, pt. 2, pp. S71-S102.
Svensson, Jakob, Investment, Property Rights, and Political Instability:Theory and Evidence., Seminar Paper 575, Institute for InternationalEconomic Studies, University of Stockholm. July 1994.
Sachs, Jeffrey D., and Andrew M. Warner, Natural Resources and EconomicGrowth., Unpublished Paper, Harvard University, August 1994.
Williamson, J. G. "The Evolution of Global Labor Markets in the First andSecond World Since 1830: Background Evidence and Hypotheses." National
38
Bureau of Economic Research, SAE Working Paper no. 36, February 1992.
Williamson, J. G. "Economic Convergence: Placing Post-famine Ireland inComparative Perspective." Discussion Paper No. 1654, Harvard Institute ofEconomic Research. September 1993.
Wolf, Holger, "Convergence Reconsidered", Weltwirtschaftliches Archiv,December, 1994.
Young, AlWYn, "Learning by Doing and the Dynamic Effects of InternationalTrade." Quarterly Journal of Economics, May 1991, vol. evI, No.2, pp.369-406.
39