Embed Size (px)
Citation preview
Development Bank of Japan Research Report No. 54 Improving Corporate Value through Disaster Man-agement: Prospects of Socially Responsible Investment (SRI) for Disaster Reduction
July 2005
Economic and Industrial Research Department Development Bank of Japan This report was originally published in Japanese as Chosa No. 80 in March 2005.
Development Bank of Japan Research Report/ No. 54 i
Contents Summary ........................................................................................................................................ iii Introduction ................................................................................................................................... 1 I Overview of Natural Disaster Conditions in Japan............................................................ 2
1. Natural Disasters in Recent Years .................................................................................... 2 2. Major Risks of Earthquake .............................................................................................. 4
II Improving Corporate Disaster Preparedness through Market Forces ............................ 7
1. Framework for Disaster Reduction .................................................................................. 7 2. Why Market Forces?........................................................................................................ 10 3. Disaster Reduction Business............................................................................................ 11 4. New Types of Risk Financing.......................................................................................... 13 5. CSR and Disaster Reduction............................................................................................ 16 6. Cooperation with Communities in Case of Disaster ........................................................ 17
III Corporate Risk Management and Business Continuity Plan (BCP) ................................ 20
1. Developments in Corporate Risk Management ............................................................... 20 2. Outline of Business Continuity Plan (BCP)..................................................................... 21
IV Issues and Outlook of Corporate Value Improvement through Disaster Management . 26
1. Approach to Corporate Efforts for Disaster Reduction.................................................... 26 2. Ideas on Disaster Rating .................................................................................................. 32 3. Disaster Rating Indicator ................................................................................................. 32 4. New Methods of Business Evaluation ............................................................................. 34 5. Development of SRI for Disaster Reduction ................................................................... 37
Conclusion...................................................................................................................................... 39 References ...................................................................................................................................... 40

Development Bank of Japan Research Report/ No. 54 iii
Improving Corporate Value through Disaster Management: Prospects of Socially Responsible Investment (SRI) for Disaster Reduction Summary 1. Japan is prone to various natural disasters including earthquakes, tsunamis, typhoons and volcanic eruptions. Great damage has been caused recently by windstorms, floods and earthquakes, including the torrential rain in Nii-gata and Fukui and the Niigata-Chuetsu earth-quake last year. With the imminent threat of ma-jor earthquakes in the Tokai region as well as in the Pacific to the southeast and south of the ar-chipelago, disaster reduction is now a top priority in Japan. Disaster reduction efforts may be ad-dressed from three perspectives: time (prevention, disaster response and recovery/rehabilitation), space (global/national level, area level and zone/grid square level) and actors (public sector and private sector). In terms of actors, such ef-forts may be classified into self-help, mutual aid and public assistance. Self-help and mutual aid efforts are becoming increasingly important as public assistance is constrained due to tight budgets in central and local governments. Under these circumstances, businesses are now ex-pected to play a leading role in building safe and secure communities by working with other com-panies, local residents and the government. As international competition intensifies, however, companies are narrowing the focus of investment through selection and concentration, while cur-tailing costs to improve business efficiency. Thus, they are reluctant to invest actively in disaster reduction efforts, which do not produce any tan-gible short-term effects. 2. Legislative and other regulatory measures are not sufficient to improve the resilience of corporations against natural disasters. It is im-perative to evaluate properly corporate efforts for disaster reduction, thereby creating an enabling environment for voluntary and strategic ap-proaches to disaster reduction. In so doing, the following measures may be considered:
(1) Companies should provides for disaster re-duction investments as part of risk man-agement and prepare a strategic Business Continuity Plan (BCP) to help return to normality without undue business disruption in case of a contingency. This should be followed by risk financing to implement the BCP, the promotion of cooperation with the local community, and the disclosure of cor-porate disaster reduction efforts in a specific account or report.
(2) Building on the measures described in (1) above, a mechanism should be created to ensure social recognition of those compa-nies making appropriate efforts for disaster reduction (e.g. disaster rating of companies and socially responsible investment for dis-aster reduction).
(3) Corporate activities for disaster reduction should be expanded and promoted to pro-vide a wide range of relevant products and services.
3. There has been heightened interest in the BCP since the 9/11 terrorist attacks in the United States. The significance of the BCP has been in-creasingly recognized in such previously over-looked areas as operating loss and impact on lo-cal employment. From the standpoint of a com-pany, preparation of a BCP will ultimately im-prove corporate value by winning the confidence of customers and discharging corporate social responsibility in cooperation with the local community. Some call for Japanese companies to conduct BCP awareness-raising activities, as they lag behind their European and American counterparts in business continuity planning. However, a BCP on paper alone is unlikely to actually improve corporate resilience against natural disasters. Steady progress in the prepara-tion of a highly effective Japanese version of BCP is needed, drawing on the disaster-related expertise accumulated thus far in individual companies.
iv Development Bank of Japan Research Report/ No. 54
4. Also, proper evaluation of the BCP and other comprehensive corporate efforts for disas-ter reduction (disaster management) is required for promoting such efforts. Some indicators have been developed to evaluate existing corporate disaster reduction efforts, building on the guide-lines provided by the U.S. Federal Emergency Management Agency (FEMA). Some indicators evaluate overall corporate risks, while others, including those published by the Fire Defense Agency, concern the disaster resilience of com-munities. Recently, the Cabinet Office also an-nounced that it would prepare indicators to measure corporate resilience against natural dis-asters. Introduction of any disaster rating will have to address issues such as (1) the formation of social consensus, (2) divergence between the indicators and actual conditions, and (3) the de-velopment of proper, harmonized indicators. Based on those considerations, a technique may be proposed to evaluate comprehensively the functioning of a PDCA (plan-do-check-action) cycle at each of the prevention, disaster response, and recovery stages.
5. Traditionally, business management and evaluation thereof focused primarily on financial indicators. In recent years, however, experiments on various approaches have been conducted to examine corporate management from the long-term viewpoint, including CSR, risk man-agement and intellectual capital. In Japan, any risk management should consider earthquakes and other natural disasters, as they have huge impact on business management. Nonetheless, corporate response has been insufficient largely due to the unpredictability of natural disasters and the difficulty in making assumptions on pos-sible damages. Although companies are willing to take measures against natural disasters, they have found it difficult to establish a proper in-ternal decision-making process due to the lack of specific criteria, making it impossible to clarify to the stakeholders the positive effects of disaster reduction efforts. Disaster accounting and the
disclosure of disaster reduction efforts ensure steady improvement in corporate disaster resil-ience and enable efficient business management by analyzing the cost-effectiveness of disaster protection investments. Such measures may also increase corporate value by providing the stake-holders with quantitative and qualitative expla-nations of disaster reduction efforts. Nevertheless, some issues remain regarding disaster accounting and similar practices: (1) Companies have to bear additional costs as
disaster data are largely underdeveloped. (2) Appropriate indicators need to be developed
to measure the effect of disaster reduction investments.
Actually, some companies disclose costs and investments for disaster reduction in their sustainability reports, along with descriptions of relevant efforts. As discussion on corporate social responsi-bility heats up, the significance of efforts for disaster reduction needs to be clearly understood in conjunction with the triple bottom lines of economy, environment and society. Starting in the environmental field, socially responsible in-vestment (SRI) in Japan has expanded to social-ity areas. Although it remains far below the scale of Europe and the U.S., SRI in Japan is expected to increase in the years ahead as interest in cor-porate social responsibility grows. In this context, the introduction of SRI for disaster reduction will have to be considered for assessing corporate management in terms of disaster resilience, as well as environmental soundness and sociality. Most importantly, Japanese companies will be able to erase their concerns about the future risks of earthquakes and other natural disasters by ad-vocating the adoption of SRI for disaster reduc-tion as a global standard. [Kentaro Noda (e-mail: [email protected]) and Kazumasa Sato]
Development Bank of Japan Research Report/ No. 54 1
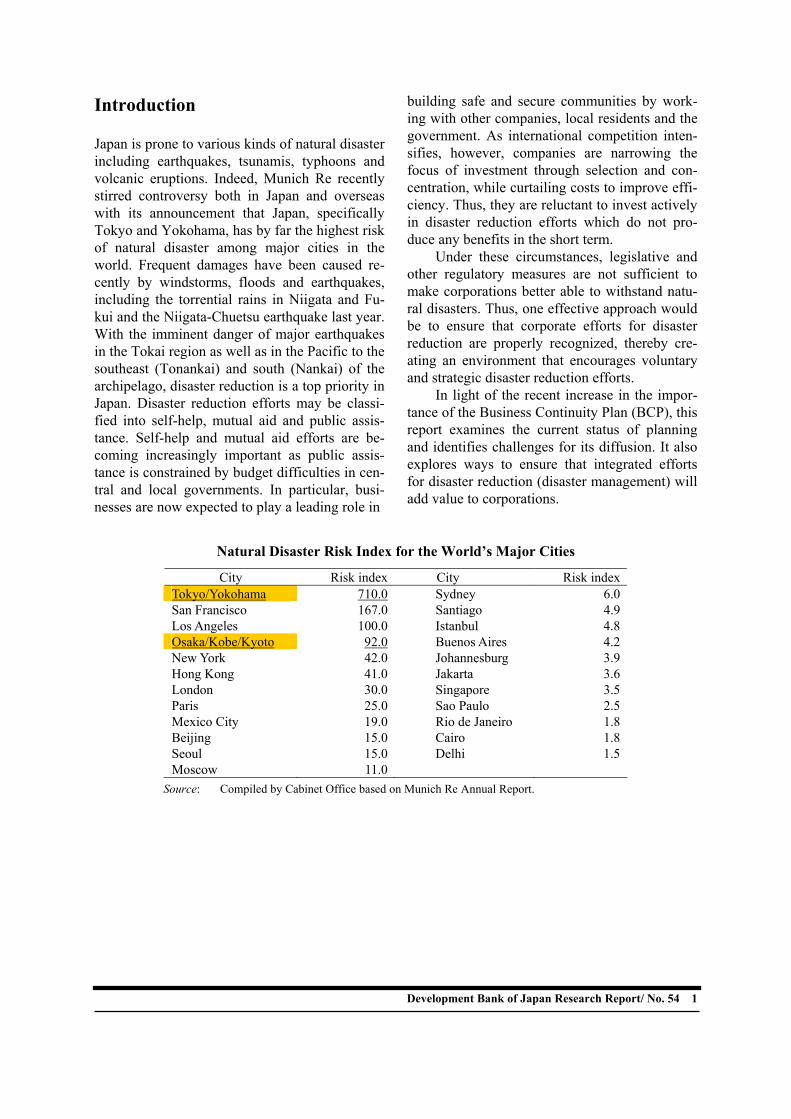
Introduction Japan is prone to various kinds of natural disaster including earthquakes, tsunamis, typhoons and volcanic eruptions. Indeed, Munich Re recently stirred controversy both in Japan and overseas with its announcement that Japan, specifically Tokyo and Yokohama, has by far the highest risk of natural disaster among major cities in the world. Frequent damages have been caused re-cently by windstorms, floods and earthquakes, including the torrential rains in Niigata and Fu-kui and the Niigata-Chuetsu earthquake last year. With the imminent danger of major earthquakes in the Tokai region as well as in the Pacific to the southeast (Tonankai) and south (Nankai) of the archipelago, disaster reduction is a top priority in Japan. Disaster reduction efforts may be classi-fied into self-help, mutual aid and public assis-tance. Self-help and mutual aid efforts are be-coming increasingly important as public assis-tance is constrained by budget difficulties in cen-tral and local governments. In particular, busi-nesses are now expected to play a leading role in
building safe and secure communities by work-ing with other companies, local residents and the government. As international competition inten-sifies, however, companies are narrowing the focus of investment through selection and con-centration, while curtailing costs to improve effi-ciency. Thus, they are reluctant to invest actively in disaster reduction efforts which do not pro-duce any benefits in the short term. Under these circumstances, legislative and other regulatory measures are not sufficient to make corporations better able to withstand natu-ral disasters. Thus, one effective approach would be to ensure that corporate efforts for disaster reduction are properly recognized, thereby cre-ating an environment that encourages voluntary and strategic disaster reduction efforts. In light of the recent increase in the impor-tance of the Business Continuity Plan (BCP), this report examines the current status of planning and identifies challenges for its diffusion. It also explores ways to ensure that integrated efforts for disaster reduction (disaster management) will add value to corporations.
Natural Disaster Risk Index for the World’s Major Cities
City Risk index City Risk index Tokyo/Yokohama 710.0 Sydney 6.0 San Francisco 167.0 Santiago 4.9 Los Angeles 100.0 Istanbul 4.8 Osaka/Kobe/Kyoto 92.0 Buenos Aires 4.2 New York 42.0 Johannesburg 3.9 Hong Kong 41.0 Jakarta 3.6 London 30.0 Singapore 3.5 Paris 25.0 Sao Paulo 2.5 Mexico City 19.0 Rio de Janeiro 1.8 Beijing 15.0 Cairo 1.8 Seoul 15.0 Delhi 1.5 Moscow 11.0
Source: Compiled by Cabinet Office based on Munich Re Annual Report.
2 Development Bank of Japan Research Report/ No. 54
I Overview of Natural Disaster Conditions in Japan
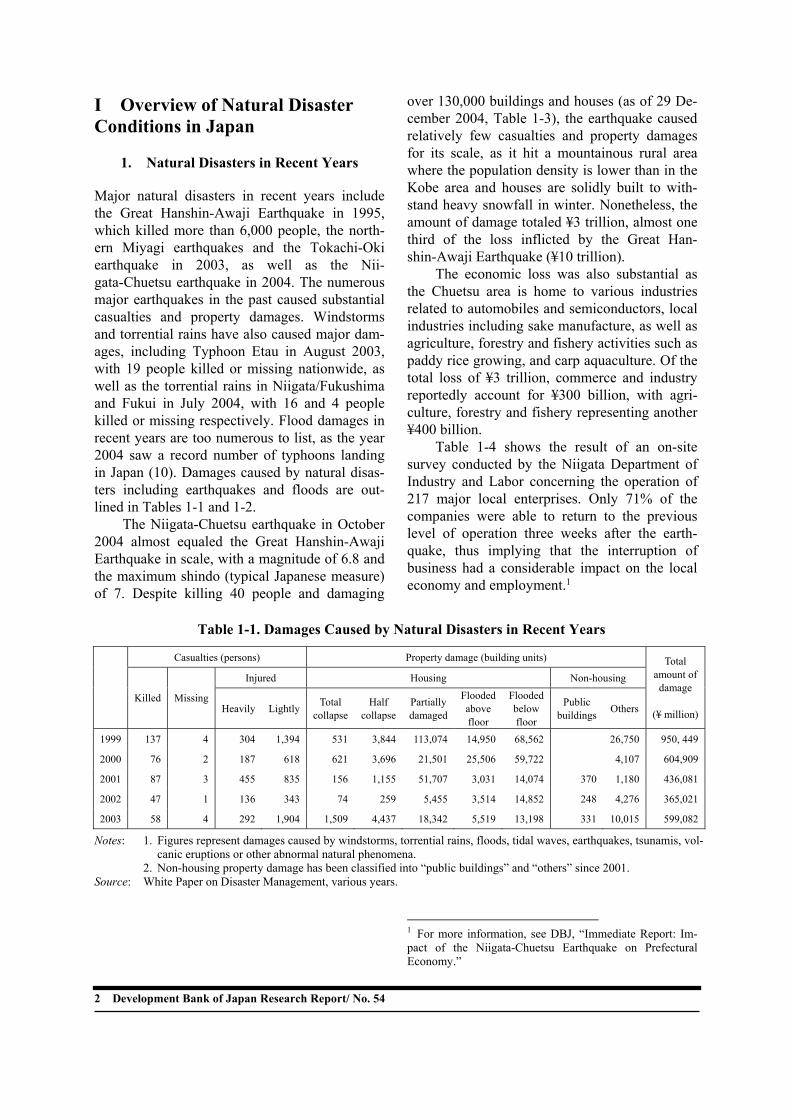
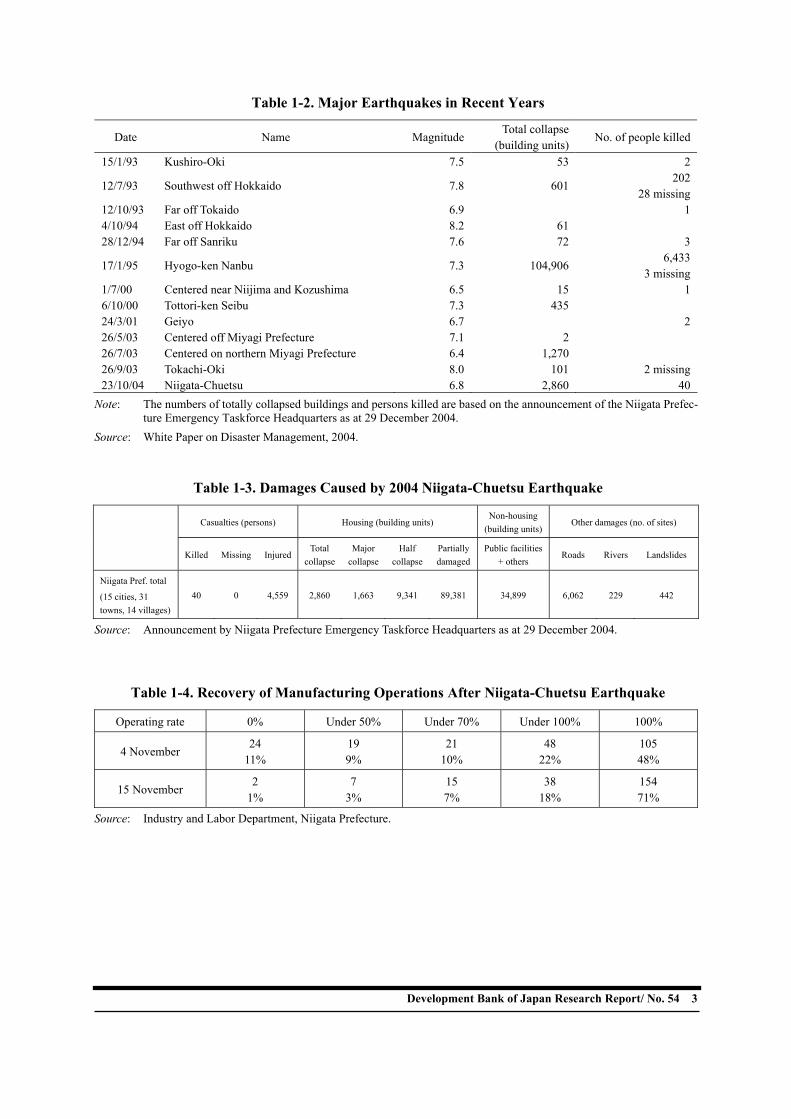
1. Natural Disasters in Recent Years Major natural disasters in recent years include the Great Hanshin-Awaji Earthquake in 1995, which killed more than 6,000 people, the north-ern Miyagi earthquakes and the Tokachi-Oki earthquake in 2003, as well as the Nii-gata-Chuetsu earthquake in 2004. The numerous major earthquakes in the past caused substantial casualties and property damages. Windstorms and torrential rains have also caused major dam-ages, including Typhoon Etau in August 2003, with 19 people killed or missing nationwide, as well as the torrential rains in Niigata/Fukushima and Fukui in July 2004, with 16 and 4 people killed or missing respectively. Flood damages in recent years are too numerous to list, as the year 2004 saw a record number of typhoons landing in Japan (10). Damages caused by natural disas-ters including earthquakes and floods are out-lined in Tables 1-1 and 1-2. The Niigata-Chuetsu earthquake in October 2004 almost equaled the Great Hanshin-Awaji Earthquake in scale, with a magnitude of 6.8 and the maximum shindo (typical Japanese measure) of 7. Despite killing 40 people and damaging
over 130,000 buildings and houses (as of 29 De-cember 2004, Table 1-3), the earthquake caused relatively few casualties and property damages for its scale, as it hit a mountainous rural area where the population density is lower than in the Kobe area and houses are solidly built to with-stand heavy snowfall in winter. Nonetheless, the amount of damage totaled ¥3 trillion, almost one third of the loss inflicted by the Great Han-shin-Awaji Earthquake (¥10 trillion). The economic loss was also substantial as the Chuetsu area is home to various industries related to automobiles and semiconductors, local industries including sake manufacture, as well as agriculture, forestry and fishery activities such as paddy rice growing, and carp aquaculture. Of the total loss of ¥3 trillion, commerce and industry reportedly account for ¥300 billion, with agri-culture, forestry and fishery representing another ¥400 billion. Table 1-4 shows the result of an on-site survey conducted by the Niigata Department of Industry and Labor concerning the operation of 217 major local enterprises. Only 71% of the companies were able to return to the previous level of operation three weeks after the earth-quake, thus implying that the interruption of business had a considerable impact on the local economy and employment.1
1 For more information, see DBJ, “Immediate Report: Im-pact of the Niigata-Chuetsu Earthquake on Prefectural Economy.”
Table 1-1. Damages Caused by Natural Disasters in Recent Years
Casualties (persons) Property damage (building units)
Injured Housing Non-housing
Killed Missing Heavily Lightly Total
collapseHalf
collapsePartially damaged
Flooded above floor
Flooded below floor
Public buildings Others
Total amount of damage
(¥ million)
1999 137 4 304 1,394 531 3,844 113,074 14,950 68,562 26,750 950, 449
2000 76 2 187 618 621 3,696 21,501 25,506 59,722 4,107 604,909
2001 87 3 455 835 156 1,155 51,707 3,031 14,074 370 1,180 436,081
2002 47 1 136 343 74 259 5,455 3,514 14,852 248 4,276 365,021
2003 58 4 292 1,904 1,509 4,437 18,342 5,519 13,198 331 10,015 599,082
Notes: 1. Figures represent damages caused by windstorms, torrential rains, floods, tidal waves, earthquakes, tsunamis, vol-canic eruptions or other abnormal natural phenomena.
2. Non-housing property damage has been classified into “public buildings” and “others” since 2001. Source: White Paper on Disaster Management, various years.
Development Bank of Japan Research Report/ No. 54 3
Table 1-2. Major Earthquakes in Recent Years
Date Name MagnitudeTotal collapse
(building units) No. of people killed
15/1/93 Kushiro-Oki 7.5 53 2
12/7/93 Southwest off Hokkaido 7.8 601 202
28 missing12/10/93 Far off Tokaido 6.9 14/10/94 East off Hokkaido 8.2 61 28/12/94 Far off Sanriku 7.6 72 3
17/1/95 Hyogo-ken Nanbu 7.3 104,906 6,433
3 missing1/7/00 Centered near Niijima and Kozushima 6.5 15 16/10/00 Tottori-ken Seibu 7.3 435 24/3/01 Geiyo 6.7 226/5/03 Centered off Miyagi Prefecture 7.1 2 26/7/03 Centered on northern Miyagi Prefecture 6.4 1,270 26/9/03 Tokachi-Oki 8.0 101 2 missing23/10/04 Niigata-Chuetsu 6.8 2,860 40
Note: The numbers of totally collapsed buildings and persons killed are based on the announcement of the Niigata Prefec-ture Emergency Taskforce Headquarters as at 29 December 2004.
Source: White Paper on Disaster Management, 2004.
Table 1-3. Damages Caused by 2004 Niigata-Chuetsu Earthquake
Casualties (persons) Housing (building units) Non-housing
(building units)Other damages (no. of sites)
Killed Missing Injured Total
collapseMajor
collapseHalf
collapsePartially damaged
Public facilities + others
Roads Rivers Landslides
Niigata Pref. total
(15 cities, 31 towns, 14 villages)
40 0 4,559 2,860 1,663 9,341 89,381 34,899 6,062 229 442
Source: Announcement by Niigata Prefecture Emergency Taskforce Headquarters as at 29 December 2004.
Table 1-4. Recovery of Manufacturing Operations After Niigata-Chuetsu Earthquake
Operating rate 0% Under 50% Under 70% Under 100% 100%
4 November 24
11% 19 9%
21 10%
48 22%
105 48%
15 November 2
1% 7
3% 15 7%
38 18%
154 71%
Source: Industry and Labor Department, Niigata Prefecture.
4 Development Bank of Japan Research Report/ No. 54
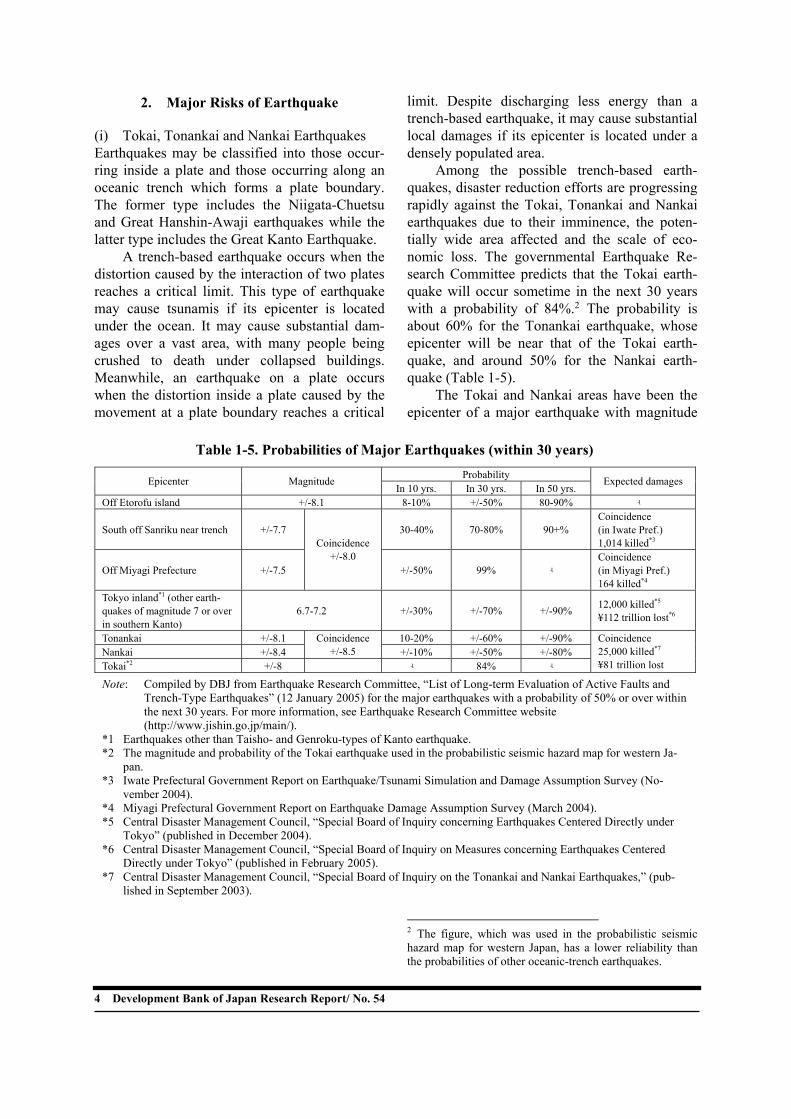
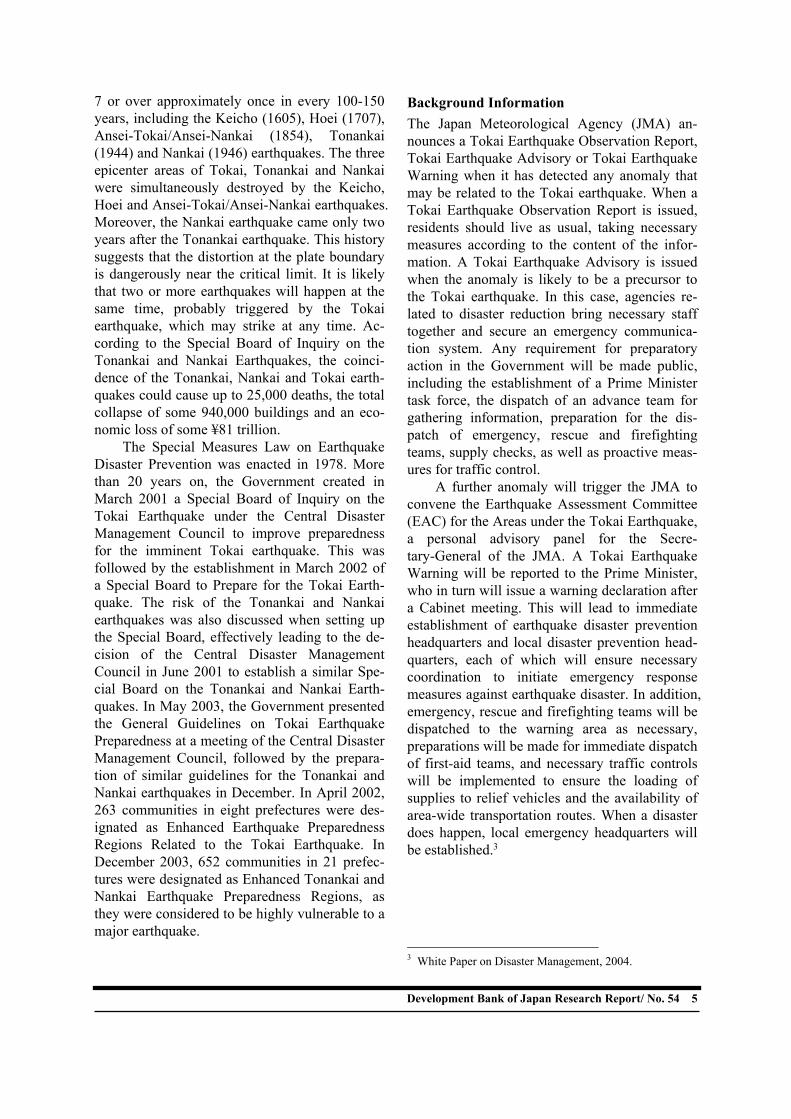
2. Major Risks of Earthquake (i) Tokai, Tonankai and Nankai Earthquakes Earthquakes may be classified into those occur-ring inside a plate and those occurring along an oceanic trench which forms a plate boundary. The former type includes the Niigata-Chuetsu and Great Hanshin-Awaji earthquakes while the latter type includes the Great Kanto Earthquake. A trench-based earthquake occurs when the distortion caused by the interaction of two plates reaches a critical limit. This type of earthquake may cause tsunamis if its epicenter is located under the ocean. It may cause substantial dam-ages over a vast area, with many people being crushed to death under collapsed buildings. Meanwhile, an earthquake on a plate occurs when the distortion inside a plate caused by the movement at a plate boundary reaches a critical
limit. Despite discharging less energy than a trench-based earthquake, it may cause substantial local damages if its epicenter is located under a densely populated area. Among the possible trench-based earth-quakes, disaster reduction efforts are progressing rapidly against the Tokai, Tonankai and Nankai earthquakes due to their imminence, the poten-tially wide area affected and the scale of eco-nomic loss. The governmental Earthquake Re-search Committee predicts that the Tokai earth-quake will occur sometime in the next 30 years with a probability of 84%.2 The probability is about 60% for the Tonankai earthquake, whose epicenter will be near that of the Tokai earth-quake, and around 50% for the Nankai earth-quake (Table 1-5). The Tokai and Nankai areas have been the epicenter of a major earthquake with magnitude
2 The figure, which was used in the probabilistic seismic hazard map for western Japan, has a lower reliability than the probabilities of other oceanic-trench earthquakes.
Table 1-5. Probabilities of Major Earthquakes (within 30 years) Probability Epicenter Magnitude
In 10 yrs. In 30 yrs. In 50 yrs. Expected damages
Off Etorofu island +/-8.1 8-10% +/-50% 80-90% -
South off Sanriku near trench +/-7.7 30-40% 70-80% 90+% Coincidence (in Iwate Pref.) 1,014 killed*3
Off Miyagi Prefecture +/-7.5
Coincidence +/-8.0
+/-50% 99% - Coincidence (in Miyagi Pref.) 164 killed*4
Tokyo inland*1 (other earth-quakes of magnitude 7 or over in southern Kanto)
6.7-7.2 +/-30% +/-70% +/-90% 12,000 killed*5
¥112 trillion lost*6
Tonankai +/-8.1 10-20% +/-60% +/-90% Nankai +/-8.4
Coincidence +/-8.5 +/-10% +/-50% +/-80%
Tokai*2 +/-8 - 84% -
Coincidence 25,000 killed*7
¥81 trillion lost
Note: Compiled by DBJ from Earthquake Research Committee, “List of Long-term Evaluation of Active Faults and Trench-Type Earthquakes” (12 January 2005) for the major earthquakes with a probability of 50% or over within the next 30 years. For more information, see Earthquake Research Committee website (http://www.jishin.go.jp/main/).
*1 Earthquakes other than Taisho- and Genroku-types of Kanto earthquake. *2 The magnitude and probability of the Tokai earthquake used in the probabilistic seismic hazard map for western Ja-
pan. *3 Iwate Prefectural Government Report on Earthquake/Tsunami Simulation and Damage Assumption Survey (No-
vember 2004). *4 Miyagi Prefectural Government Report on Earthquake Damage Assumption Survey (March 2004). *5 Central Disaster Management Council, “Special Board of Inquiry concerning Earthquakes Centered Directly under
Tokyo” (published in December 2004). *6 Central Disaster Management Council, “Special Board of Inquiry on Measures concerning Earthquakes Centered
Directly under Tokyo” (published in February 2005). *7 Central Disaster Management Council, “Special Board of Inquiry on the Tonankai and Nankai Earthquakes,” (pub-
lished in September 2003).
Development Bank of Japan Research Report/ No. 54 5
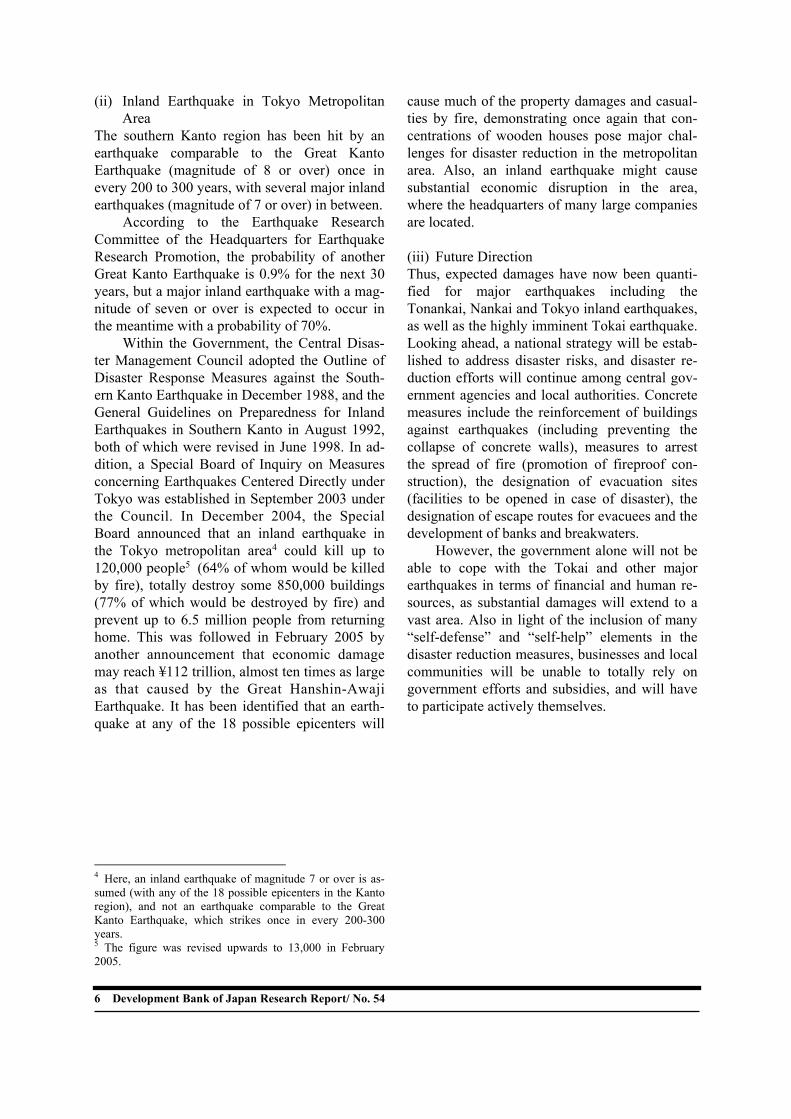
7 or over approximately once in every 100-150 years, including the Keicho (1605), Hoei (1707), Ansei-Tokai/Ansei-Nankai (1854), Tonankai (1944) and Nankai (1946) earthquakes. The three epicenter areas of Tokai, Tonankai and Nankai were simultaneously destroyed by the Keicho, Hoei and Ansei-Tokai/Ansei-Nankai earthquakes. Moreover, the Nankai earthquake came only two years after the Tonankai earthquake. This history suggests that the distortion at the plate boundary is dangerously near the critical limit. It is likely that two or more earthquakes will happen at the same time, probably triggered by the Tokai earthquake, which may strike at any time. Ac-cording to the Special Board of Inquiry on the Tonankai and Nankai Earthquakes, the coinci-dence of the Tonankai, Nankai and Tokai earth-quakes could cause up to 25,000 deaths, the total collapse of some 940,000 buildings and an eco-nomic loss of some ¥81 trillion. The Special Measures Law on Earthquake Disaster Prevention was enacted in 1978. More than 20 years on, the Government created in March 2001 a Special Board of Inquiry on the Tokai Earthquake under the Central Disaster Management Council to improve preparedness for the imminent Tokai earthquake. This was followed by the establishment in March 2002 of a Special Board to Prepare for the Tokai Earth-quake. The risk of the Tonankai and Nankai earthquakes was also discussed when setting up the Special Board, effectively leading to the de-cision of the Central Disaster Management Council in June 2001 to establish a similar Spe-cial Board on the Tonankai and Nankai Earth-quakes. In May 2003, the Government presented the General Guidelines on Tokai Earthquake Preparedness at a meeting of the Central Disaster Management Council, followed by the prepara-tion of similar guidelines for the Tonankai and Nankai earthquakes in December. In April 2002, 263 communities in eight prefectures were des-ignated as Enhanced Earthquake Preparedness Regions Related to the Tokai Earthquake. In December 2003, 652 communities in 21 prefec-tures were designated as Enhanced Tonankai and Nankai Earthquake Preparedness Regions, as they were considered to be highly vulnerable to a major earthquake.
Background Information The Japan Meteorological Agency (JMA) an-nounces a Tokai Earthquake Observation Report, Tokai Earthquake Advisory or Tokai Earthquake Warning when it has detected any anomaly that may be related to the Tokai earthquake. When a Tokai Earthquake Observation Report is issued, residents should live as usual, taking necessary measures according to the content of the infor-mation. A Tokai Earthquake Advisory is issued when the anomaly is likely to be a precursor to the Tokai earthquake. In this case, agencies re-lated to disaster reduction bring necessary staff together and secure an emergency communica-tion system. Any requirement for preparatory action in the Government will be made public, including the establishment of a Prime Minister task force, the dispatch of an advance team for gathering information, preparation for the dis-patch of emergency, rescue and firefighting teams, supply checks, as well as proactive meas-ures for traffic control. A further anomaly will trigger the JMA to convene the Earthquake Assessment Committee (EAC) for the Areas under the Tokai Earthquake, a personal advisory panel for the Secre-tary-General of the JMA. A Tokai Earthquake Warning will be reported to the Prime Minister, who in turn will issue a warning declaration after a Cabinet meeting. This will lead to immediate establishment of earthquake disaster prevention headquarters and local disaster prevention head-quarters, each of which will ensure necessary coordination to initiate emergency response measures against earthquake disaster. In addition, emergency, rescue and firefighting teams will be dispatched to the warning area as necessary, preparations will be made for immediate dispatch of first-aid teams, and necessary traffic controls will be implemented to ensure the loading of supplies to relief vehicles and the availability of area-wide transportation routes. When a disaster does happen, local emergency headquarters will be established.3
3 White Paper on Disaster Management, 2004.
6 Development Bank of Japan Research Report/ No. 54
(ii) Inland Earthquake in Tokyo Metropolitan Area
The southern Kanto region has been hit by an earthquake comparable to the Great Kanto Earthquake (magnitude of 8 or over) once in every 200 to 300 years, with several major inland earthquakes (magnitude of 7 or over) in between. According to the Earthquake Research Committee of the Headquarters for Earthquake Research Promotion, the probability of another Great Kanto Earthquake is 0.9% for the next 30 years, but a major inland earthquake with a mag-nitude of seven or over is expected to occur in the meantime with a probability of 70%. Within the Government, the Central Disas-ter Management Council adopted the Outline of Disaster Response Measures against the South-ern Kanto Earthquake in December 1988, and the General Guidelines on Preparedness for Inland Earthquakes in Southern Kanto in August 1992, both of which were revised in June 1998. In ad-dition, a Special Board of Inquiry on Measures concerning Earthquakes Centered Directly under Tokyo was established in September 2003 under the Council. In December 2004, the Special Board announced that an inland earthquake in the Tokyo metropolitan area4 could kill up to 120,000 people5 (64% of whom would be killed by fire), totally destroy some 850,000 buildings (77% of which would be destroyed by fire) and prevent up to 6.5 million people from returning home. This was followed in February 2005 by another announcement that economic damage may reach ¥112 trillion, almost ten times as large as that caused by the Great Hanshin-Awaji Earthquake. It has been identified that an earth-quake at any of the 18 possible epicenters will
4 Here, an inland earthquake of magnitude 7 or over is as-sumed (with any of the 18 possible epicenters in the Kanto region), and not an earthquake comparable to the Great Kanto Earthquake, which strikes once in every 200-300 years. 5 The figure was revised upwards to 13,000 in February 2005.
cause much of the property damages and casual-ties by fire, demonstrating once again that con-centrations of wooden houses pose major chal-lenges for disaster reduction in the metropolitan area. Also, an inland earthquake might cause substantial economic disruption in the area, where the headquarters of many large companies are located. (iii) Future Direction Thus, expected damages have now been quanti-fied for major earthquakes including the Tonankai, Nankai and Tokyo inland earthquakes, as well as the highly imminent Tokai earthquake. Looking ahead, a national strategy will be estab-lished to address disaster risks, and disaster re-duction efforts will continue among central gov-ernment agencies and local authorities. Concrete measures include the reinforcement of buildings against earthquakes (including preventing the collapse of concrete walls), measures to arrest the spread of fire (promotion of fireproof con-struction), the designation of evacuation sites (facilities to be opened in case of disaster), the designation of escape routes for evacuees and the development of banks and breakwaters. However, the government alone will not be able to cope with the Tokai and other major earthquakes in terms of financial and human re-sources, as substantial damages will extend to a vast area. Also in light of the inclusion of many “self-defense” and “self-help” elements in the disaster reduction measures, businesses and local communities will be unable to totally rely on government efforts and subsidies, and will have to participate actively themselves.
Development Bank of Japan Research Report/ No. 54 7
II Improving Corporate Disaster Preparedness through Market Forces
1. Framework for Disaster Reduction
1.1. What is Disaster Reduction? This section reviews the framework for disaster reduction. Threats to security come not only from natural disasters such as earthquakes, ty-phoons and tsunamis, but also from human neg-ligence such as traffic accidents, building fires, falling masonry, radioactive pollution, plane crashes and oil spills, and even from deliberate acts such as murder, robbery, terrorism and war. In this report, “disaster reduction” refers to measures against unintended threats that may cause widespread damage, and this chapter con-siders disaster reduction efforts in this context.
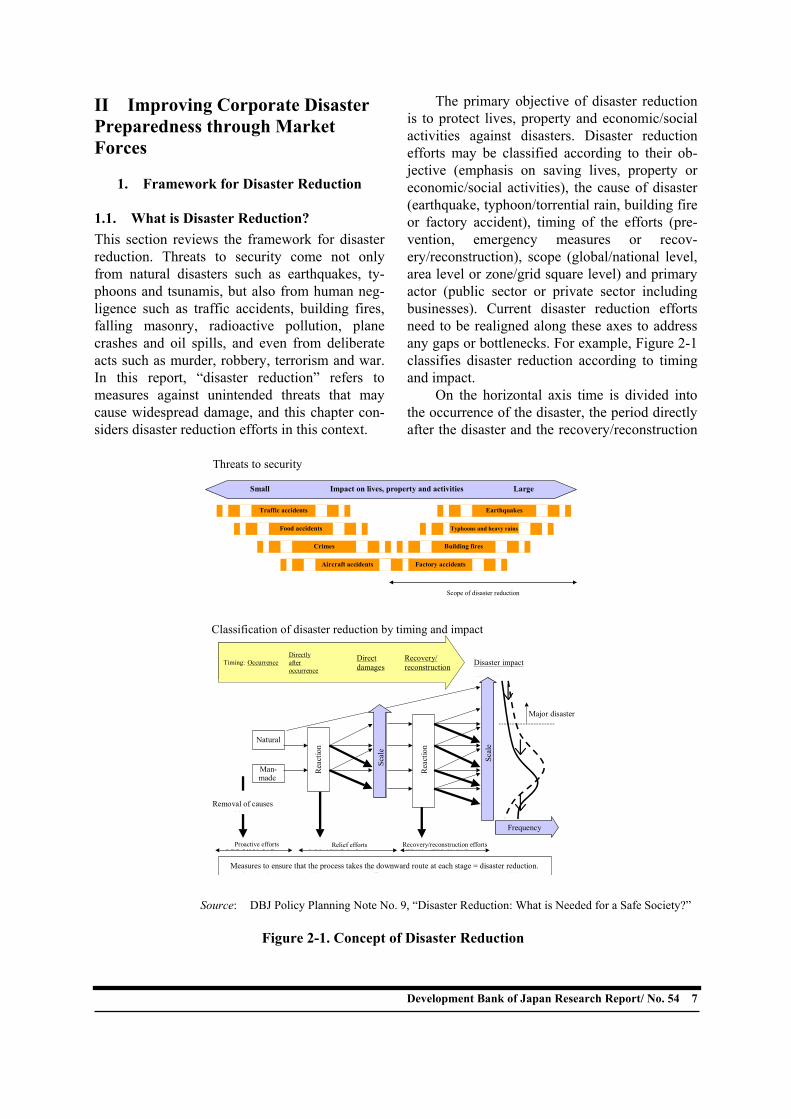
The primary objective of disaster reduction is to protect lives, property and economic/social activities against disasters. Disaster reduction efforts may be classified according to their ob-jective (emphasis on saving lives, property or economic/social activities), the cause of disaster (earthquake, typhoon/torrential rain, building fire or factory accident), timing of the efforts (pre-vention, emergency measures or recov-ery/reconstruction), scope (global/national level, area level or zone/grid square level) and primary actor (public sector or private sector including businesses). Current disaster reduction efforts need to be realigned along these axes to address any gaps or bottlenecks. For example, Figure 2-1 classifies disaster reduction according to timing and impact. On the horizontal axis time is divided into the occurrence of the disaster, the period directly after the disaster and the recovery/reconstruction
Small Impact on lives, property and activities Large
Traffic accidents Earthquakes
Typhoons and heavy rains
Factory accidents
Crimes Building fires
Food accidents
Aircraft accidents
Scope of disaster reduction
Threats to security
時間: 発災 災害影響
発災直後
規模
大災害
人為
自然
原因除去
それぞれの段階で「下向き」のルートに乗せる方策=防災
対応
復旧復興
対応
発災前対応 発災直後対応 復旧・復興対応
規模
直接被害
頻度
Classification of disaster reduction by timing and impact
Timing: Occurrence Directly after occurrence
Direct damages
Recovery/reconstruction Disaster impact
Major disaster
Frequency
Natural
Man-made
Reac
tion
Reac
tion
Scal
e
Scal
e
Proactive efforts Relief efforts Recovery/reconstruction efforts
Measures to ensure that the process takes the downward route at each stage = disaster reduction.
Removal of causes
Source: DBJ Policy Planning Note No. 9, “Disaster Reduction: What is Needed for a Safe Society?”
Figure 2-1. Concept of Disaster Reduction
8 Development Bank of Japan Research Report/ No. 54
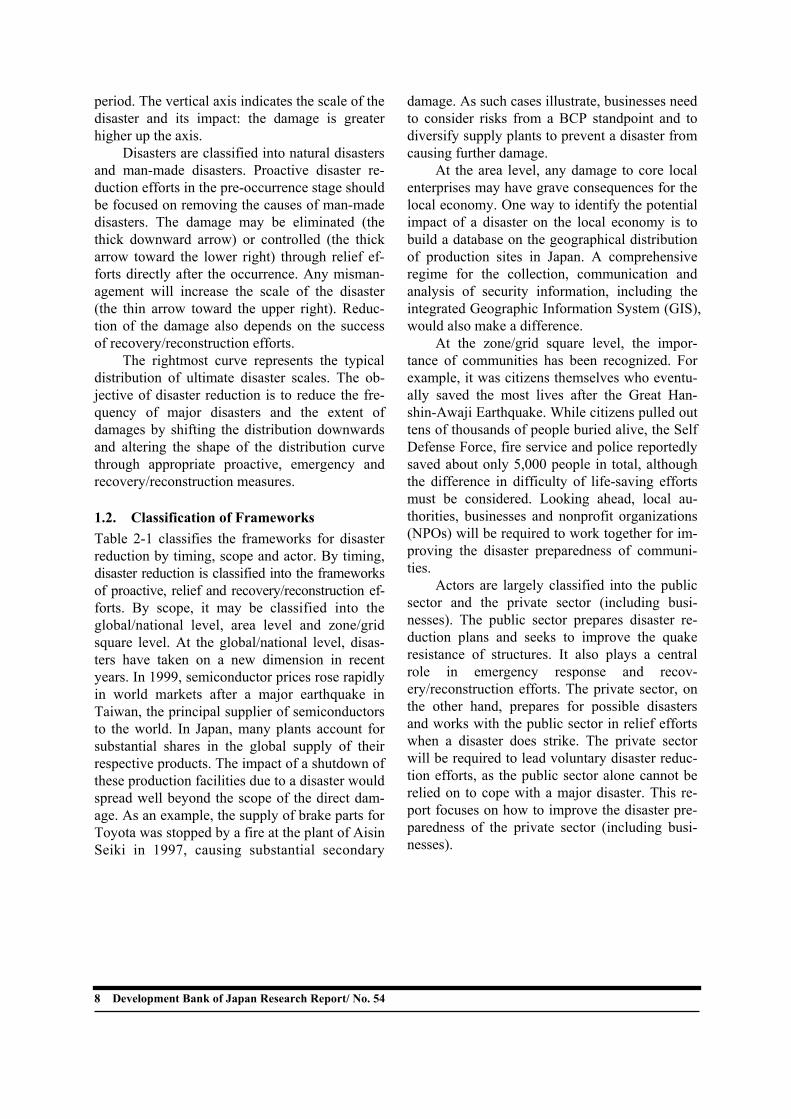
period. The vertical axis indicates the scale of the disaster and its impact: the damage is greater higher up the axis. Disasters are classified into natural disasters and man-made disasters. Proactive disaster re-duction efforts in the pre-occurrence stage should be focused on removing the causes of man-made disasters. The damage may be eliminated (the thick downward arrow) or controlled (the thick arrow toward the lower right) through relief ef-forts directly after the occurrence. Any misman-agement will increase the scale of the disaster (the thin arrow toward the upper right). Reduc-tion of the damage also depends on the success of recovery/reconstruction efforts. The rightmost curve represents the typical distribution of ultimate disaster scales. The ob-jective of disaster reduction is to reduce the fre-quency of major disasters and the extent of damages by shifting the distribution downwards and altering the shape of the distribution curve through appropriate proactive, emergency and recovery/reconstruction measures. 1.2. Classification of Frameworks Table 2-1 classifies the frameworks for disaster reduction by timing, scope and actor. By timing, disaster reduction is classified into the frameworks of proactive, relief and recovery/reconstruction ef-forts. By scope, it may be classified into the global/national level, area level and zone/grid square level. At the global/national level, disas-ters have taken on a new dimension in recent years. In 1999, semiconductor prices rose rapidly in world markets after a major earthquake in Taiwan, the principal supplier of semiconductors to the world. In Japan, many plants account for substantial shares in the global supply of their respective products. The impact of a shutdown of these production facilities due to a disaster would spread well beyond the scope of the direct dam-age. As an example, the supply of brake parts for Toyota was stopped by a fire at the plant of Aisin Seiki in 1997, causing substantial secondary
damage. As such cases illustrate, businesses need to consider risks from a BCP standpoint and to diversify supply plants to prevent a disaster from causing further damage. At the area level, any damage to core local enterprises may have grave consequences for the local economy. One way to identify the potential impact of a disaster on the local economy is to build a database on the geographical distribution of production sites in Japan. A comprehensive regime for the collection, communication and analysis of security information, including the integrated Geographic Information System (GIS), would also make a difference. At the zone/grid square level, the impor-tance of communities has been recognized. For example, it was citizens themselves who eventu-ally saved the most lives after the Great Han-shin-Awaji Earthquake. While citizens pulled out tens of thousands of people buried alive, the Self Defense Force, fire service and police reportedly saved about only 5,000 people in total, although the difference in difficulty of life-saving efforts must be considered. Looking ahead, local au-thorities, businesses and nonprofit organizations (NPOs) will be required to work together for im-proving the disaster preparedness of communi-ties. Actors are largely classified into the public sector and the private sector (including busi-nesses). The public sector prepares disaster re-duction plans and seeks to improve the quake resistance of structures. It also plays a central role in emergency response and recov-ery/reconstruction efforts. The private sector, on the other hand, prepares for possible disasters and works with the public sector in relief efforts when a disaster does strike. The private sector will be required to lead voluntary disaster reduc-tion efforts, as the public sector alone cannot be relied on to cope with a major disaster. This re-port focuses on how to improve the disaster pre-paredness of the private sector (including busi-nesses).
Development Bank of Japan Research Report/ No. 54 9
Table 2-1. Classification of Disaster Reduction Efforts
• Recovery/reconstruction plan• Proper resource allocation
(prioritizing)• Financial assistance and tax
relief• Emergency credit
• Repair and renewal, reinforcement of new buildings
• Implement BCP.• Backup offices.• Repair and renewal• Utilization of financial
contracts
• Coordinate volunteer efforts and manage funds and relief aid.
• Delegate authority and ensure cooperation between organizations.
• Rescue, check the spread of fire.• Prevent secondary disasters.
• Evacuation/relief, information, resource input (prioritization)
• Avoid disruptions in industry, logistics and finance.
• Evacuation drills
• Prepare disaster reduction plan.• Proactive measures on land
management, living, industry and logistics as well as their interaction through appropriate utilization of forecast information.
• Lifecycle management of structures
• Failsafe measures• Repair and reinforce structures
(measures commensurate with the amount of risks, effective use of existing stocks).
• Prepare disaster reduction manual/BCP.
• Disaster forecast/simulation• Physical reinforcement of
structures• Physical diversification:
correct excessive concentration and ensure backup.
• Disaster accounting• Disaster reduction business
Public sector
Publicassistance
Private sector(businesses)
By actor
Zone/grid square level
Area level
Global/national level
By scope
Prevent indirect impact from spreading.Recover physical situation.Recover economic and social situation (better functions may be required than before).
Specify/prioritize emergencies to be dealt with.Prevent damages from spreading.Respond to unexpected events.Prevent post-disaster disorder.Prevent economic disruption.
Identify emergencies to be dealt with.Remove causes of (man-made) disasters.Minimize damages from disasters (proactive measures).Most effective disaster reduction measures within financial constraints and environmental considerations.
By timing
Recovery/reconstructionEmergency measuresProactive measures
Serious damage to a domestic plant affects domestic and overseas production.
• Diversify plants. (Globalization)
Serious damage to local businesses substantially affects the local economy.
• Utilize GIS (Geographic Information system).• Create local industry disaster reduction
database (disaster reduction map). (Information )
• Buildings that only satisfy old quakeproof standards.
• Renew urban concentrations of wooden buildings.
• Community/business cooperation • Business cooperation • Community cooperation
(Community) Mutual aid
Mutual aid
Self-help
Source: DBJ Policy Planning Note No. 9, “Disaster Reduction: What is Needed for a Safe Society?” partially revised.
10 Development Bank of Japan Research Report/ No. 54
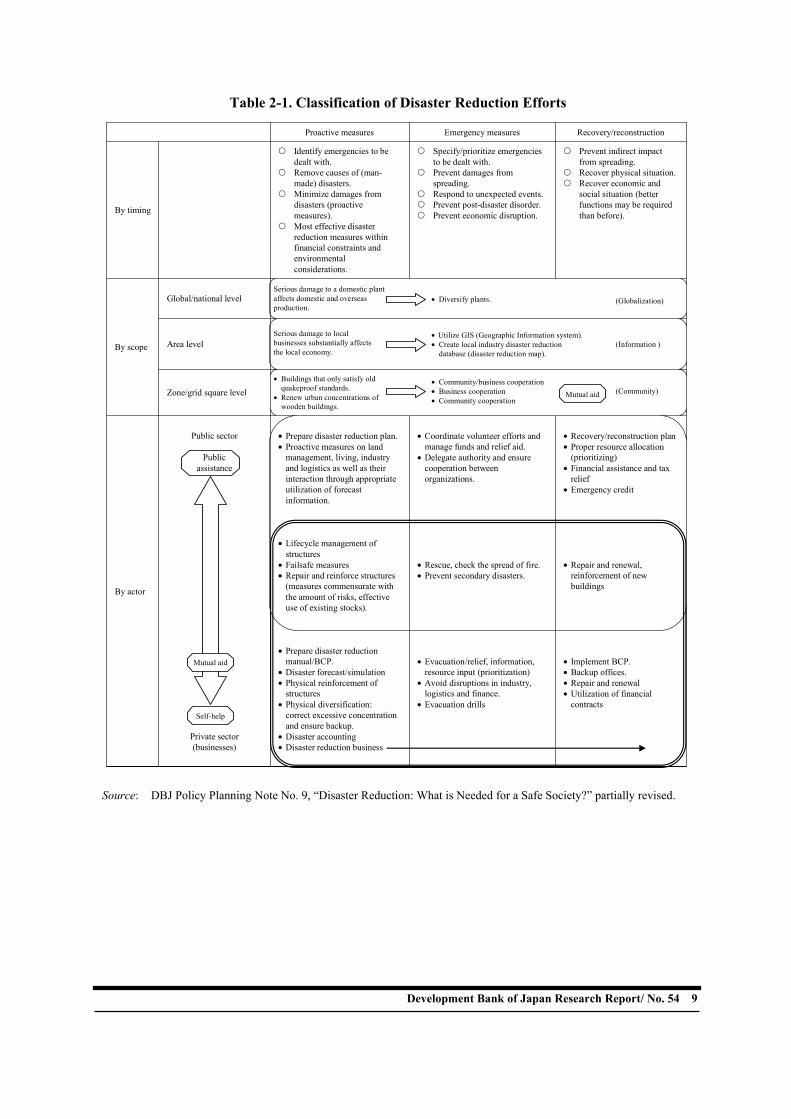
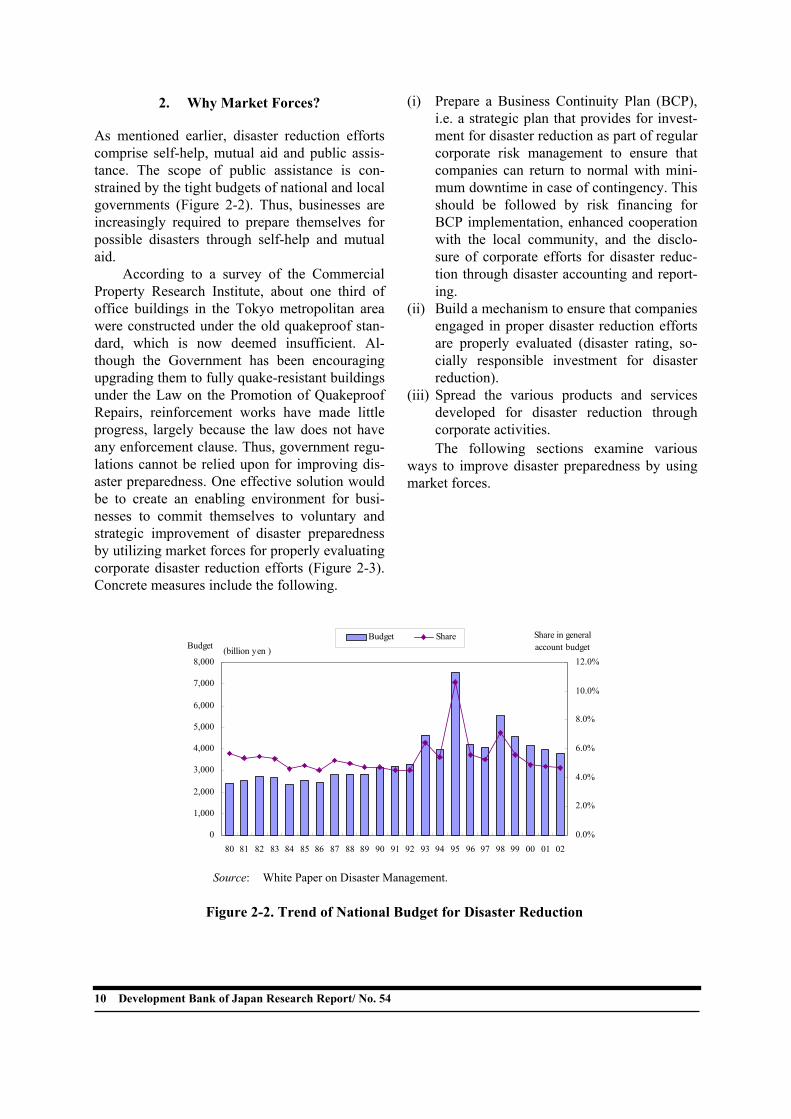
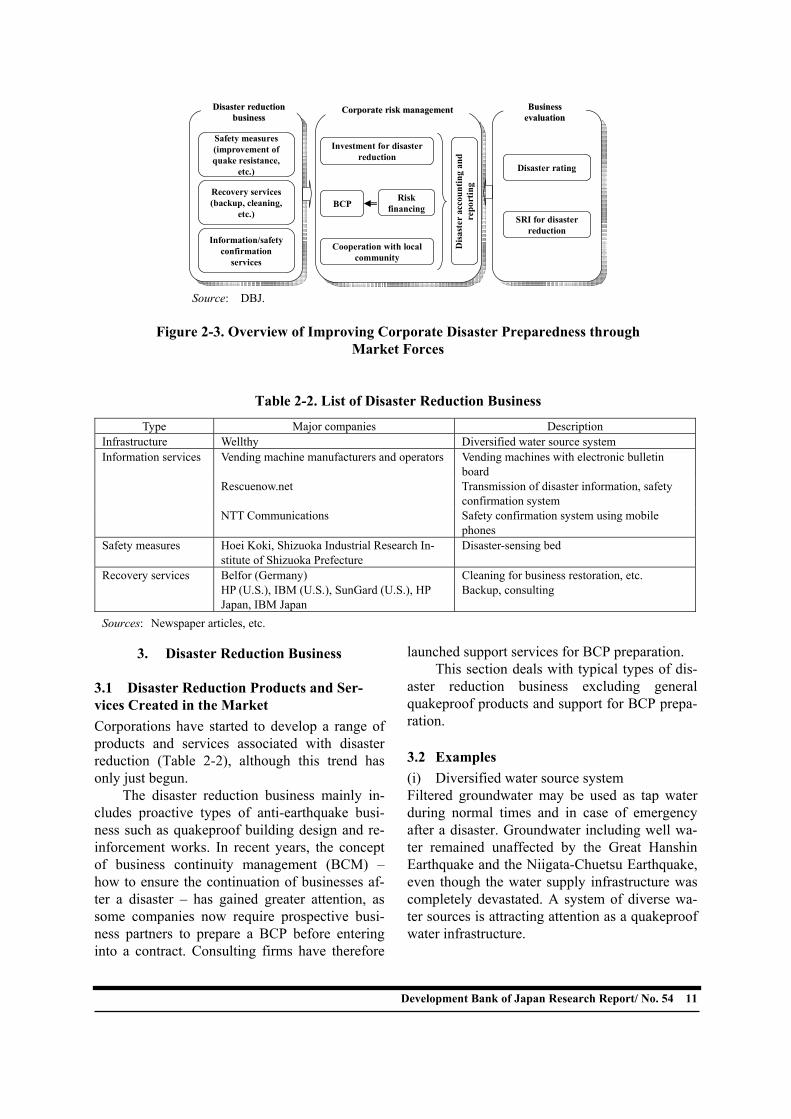
2. Why Market Forces? As mentioned earlier, disaster reduction efforts comprise self-help, mutual aid and public assis-tance. The scope of public assistance is con-strained by the tight budgets of national and local governments (Figure 2-2). Thus, businesses are increasingly required to prepare themselves for possible disasters through self-help and mutual aid. According to a survey of the Commercial Property Research Institute, about one third of office buildings in the Tokyo metropolitan area were constructed under the old quakeproof stan-dard, which is now deemed insufficient. Al-though the Government has been encouraging upgrading them to fully quake-resistant buildings under the Law on the Promotion of Quakeproof Repairs, reinforcement works have made little progress, largely because the law does not have any enforcement clause. Thus, government regu-lations cannot be relied upon for improving dis-aster preparedness. One effective solution would be to create an enabling environment for busi-nesses to commit themselves to voluntary and strategic improvement of disaster preparedness by utilizing market forces for properly evaluating corporate disaster reduction efforts (Figure 2-3). Concrete measures include the following.
(i) Prepare a Business Continuity Plan (BCP), i.e. a strategic plan that provides for invest-ment for disaster reduction as part of regular corporate risk management to ensure that companies can return to normal with mini-mum downtime in case of contingency. This should be followed by risk financing for BCP implementation, enhanced cooperation with the local community, and the disclo-sure of corporate efforts for disaster reduc-tion through disaster accounting and report-ing.
(ii) Build a mechanism to ensure that companies engaged in proper disaster reduction efforts are properly evaluated (disaster rating, so-cially responsible investment for disaster reduction).
(iii) Spread the various products and services developed for disaster reduction through corporate activities. The following sections examine various
ways to improve disaster preparedness by using market forces.
Share in generalaccount budget
0
1,000
2,000
3,000
4,000
5,000
6,000
7,000
8,000
80 81 82 83 84 85 86 87 88 89 90 91 92 93 94 95 96 97 98 99 00 01 02
Budget
0.0%
2.0%
4.0%
6.0%
8.0%
10.0%
12.0%
Budget Share(billion yen )
Source: White Paper on Disaster Management.
Figure 2-2. Trend of National Budget for Disaster Reduction
Development Bank of Japan Research Report/ No. 54 11
3. Disaster Reduction Business 3.1 Disaster Reduction Products and Ser-vices Created in the Market Corporations have started to develop a range of products and services associated with disaster reduction (Table 2-2), although this trend has only just begun. The disaster reduction business mainly in-cludes proactive types of anti-earthquake busi-ness such as quakeproof building design and re-inforcement works. In recent years, the concept of business continuity management (BCM) – how to ensure the continuation of businesses af-ter a disaster – has gained greater attention, as some companies now require prospective busi-ness partners to prepare a BCP before entering into a contract. Consulting firms have therefore
launched support services for BCP preparation. This section deals with typical types of dis-aster reduction business excluding general quakeproof products and support for BCP prepa-ration. 3.2 Examples (i) Diversified water source system Filtered groundwater may be used as tap water during normal times and in case of emergency after a disaster. Groundwater including well wa-ter remained unaffected by the Great Hanshin Earthquake and the Niigata-Chuetsu Earthquake, even though the water supply infrastructure was completely devastated. A system of diverse wa-ter sources is attracting attention as a quakeproof water infrastructure.
Disaster reduction Disaster reduction businessbusiness
Corporate risk managementCorporate risk management Business Business evaluationevaluation
Investment for disaster reduction
Risk financingBCP
Cooperation with local community
Disaster rating
SRI for disaster reduction
Information/safety confirmation
services
Recovery services (backup, cleaning,
etc.)
Safety measures (improvement of quake resistance,
etc.)
Dis
aste
r ac
coun
ting
and
repo
rtin
g
Source: DBJ.
Figure 2-3. Overview of Improving Corporate Disaster Preparedness through
Market Forces
Table 2-2. List of Disaster Reduction Business
Type Major companies Description Infrastructure Wellthy Diversified water source system
Vending machine manufacturers and operators Vending machines with electronic bulletin board
Rescuenow.net Transmission of disaster information, safety confirmation system
Information services
NTT Communications Safety confirmation system using mobile phones
Safety measures Hoei Koki, Shizuoka Industrial Research In-stitute of Shizuoka Prefecture
Disaster-sensing bed
Belfor (Germany) Cleaning for business restoration, etc. Recovery services HP (U.S.), IBM (U.S.), SunGard (U.S.), HP Japan, IBM Japan
Backup, consulting
Sources: Newspaper articles, etc.

12 Development Bank of Japan Research Report/ No. 54
(ii) Vending machines for disaster reduction Vending machines with a built-in pager can pro-vide real-time disaster information on an elec-tronic bulletin board. Awareness of potential disasters may also be raised by providing infor-mation on disaster prevention during normal times. In case of an emergency or disaster, the machines could even dispense the products for free. They are increasingly being introduced by local governments.
Source: Chiyoda Ward website.
Figure 2-5
(iii) Disaster-sensing Bed In the Great Hanshin-Awaji Earthquake, 84% of the people killed were either crushed or suffo-cated by collapsed buildings. Although the fun-damental way to reduce earthquake damage is to improve quake resistance, many households cannot afford to do so, but a disaster-sensing bed could provide a breathing space under a col-lapsed building or fallen furniture.
Source: Shizuoka Prefecture website.
Figure 2-6
Source: Wellthy website.
Figure 2-4
Water pumped from a deep well is stored in the origi-
nal water tank.
As pre-treatment, water is filtered to the level of tap
water.
Pre-treated water is further filtered with a 0.1-micron
film.
Water is stored in the treated water tank.
Water is supplied to the receiving tank.
Safety design
In case of anomaly, the system will be automatically stopped and the supply will be switched to tap water.
Water quality monitoring
system
Development Bank of Japan Research Report/ No. 54 13
(iv) Safety confirmation system In times of disaster, it becomes difficult to estab-lish phone connections as large numbers of peo-ple try to check the safety of their family mem-bers, friends, relatives and employees by using fixed or mobile phones, thus overloading the circuits. To avoid this, the NTT Group set up the Emergency Voice Mail Service, available in case of a disaster and on the first day of each month.6 Other systems include the i-mode Disaster Mes-sage Board Service by NTT DoCoMo and the text-mail safety confirmation services provided by NTT Communications and Rescuenow.net, among others. These services transmit text-mail messages to all registered employees, enabling the manager to efficiently check the safety of the employees by counting the number of responses on the system. (v) Disaster recovery services Disaster recovery services range from consulting, system backup and the provision of substitute of-fices to the restoration and cleaning of office equipment damaged by fire or flood. According to IDC, a private market research firm, the backup/restoration service market is worth more than $3 billion in the U.S., where the awareness of risk management is higher than in Japan due to the existence of major risks including hurricanes and other natural disasters, terrorism, and war. However, even the best efforts to avoid dis-aster, such as improving resistance to quakes, fires and flooding, might not be sufficient to prevent damages. In such cases, disaster recovery services would allow businesses to get up and running again quickly and minimize economic losses. (vi) Refine Construction The initiative “Refine Construction,” advocated by architect Shigeru Aoki, deserves attention as an innovative experiment at improving quake resistance, by renewing the existing building stock at low cost while improving its quake re-sistance. At present, almost half of all buildings in Japan were constructed before 1981 and so
6 A trial campaign has been held on the first day of each month since September 2004. The trial campaign is also held during National Disaster Prevention Week (30 Au-gust-5 September).
probably have only the level of quake resistance that was required under the old standard. The quake resistance of this vast stock, including civil engineering structures such as roads and bridges, needs to be raised. However, it would be impossible to replace them all with new struc-tures at once due to exorbitant costs and adverse environmental impacts. Therefore, the concept of life cycle management, as embodied by “Refine Construction”, should be considered. (vii) Consideration of a “disaster reduction label” At a meeting of the Special Board of Inquiry on enhancing disaster management by utilizing the private sector and markets, the Central Disaster Management Council recommended the consid-eration of a framework for granting a “disaster reduction label” to products and services that serve to prevent disasters. Just like the eco-label in the field of the en-vironment, this disaster reduction label is de-signed to raise the awareness of disaster prepar-edness among consumers by providing them with clear choices for disaster reduction (= safety). It is also hoped that adding the new value of disas-ter preparedness will help reactivate markets re-lated to disaster reduction, and eventually lower the costs of goods and services for disaster pre-vention, which in turn will promote the diffusion of such goods and services.
4. New Types of Risk Financing 4.1 Outline of Financial Schemes (i) Contingent debt facility (CDF) The substantial compensation payouts made fol-lowing successive disasters in the 1990s caused some insurance and reinsurance companies to go bankrupt, thus raising premium rates. New methods of disaster risk management have thus been considered, including the securitization of disaster insurance, which allows diversification of disaster risk beyond the reinsurance market and into the far larger financial markets. The hedging of insurance risks in the financial market involves “risk financing” techniques. Backed by the development of financial engineering and improved techniques for evaluating natural dis-asters and other risks, the use of risk financing is expected to spread in the years ahead.
14 Development Bank of Japan Research Report/ No. 54
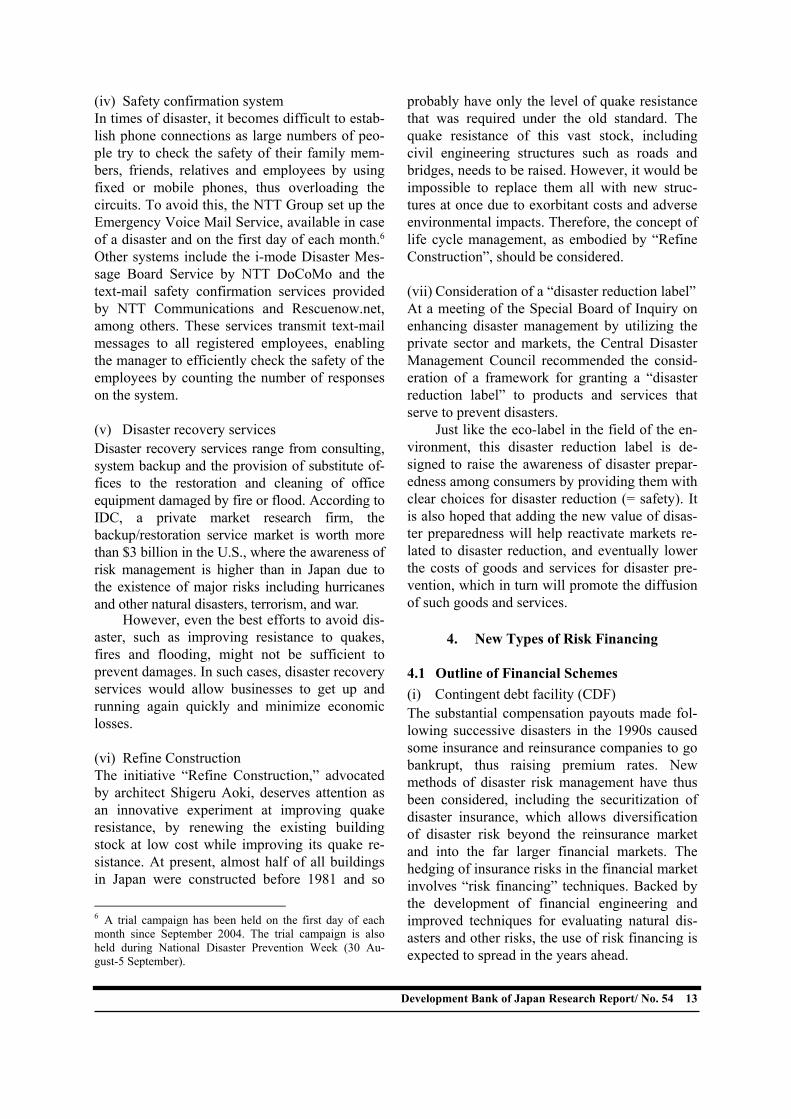
A disaster will not only cause direct finan-cial losses in the form of declining asset values, business interruption or cash crises, but also have indirect effects including damaging financial conditions through the decline in share prices and ratings. Such financial risks require a proper mix of techniques including earthquake insur-ance, funds on hand (cash and deposits) and risk finance. An earthquake in Tokai or directly under the Tokyo metropolitan area would cause very seri-ous damage, making insurers reluctant to enter the corporate earthquake market in the two re-gions. Moreover, an earthquake policy only cov-ers property losses such as the collapse of build-ings and not the cash crisis that will be triggered by reduced sales due to shutdowns. In order to address this situation, a contingent debt facility (CDF) typically undertakes to provide a loan that will cover part of the essential funds required for recovering from a major earthquake. Earthquake risk is quantified in determining the applicable interest rate, and the loan thus provided may be used as relief funds following an earthquake. This type of risk financing would also demon-strate to stakeholders that the company is pre-pared for major disasters including earthquakes. The Development Bank of Japan, in coop-eration with the Shizuoka Bank and Mitsui Su-mitomo Insurance as loan arrangers, has ex-
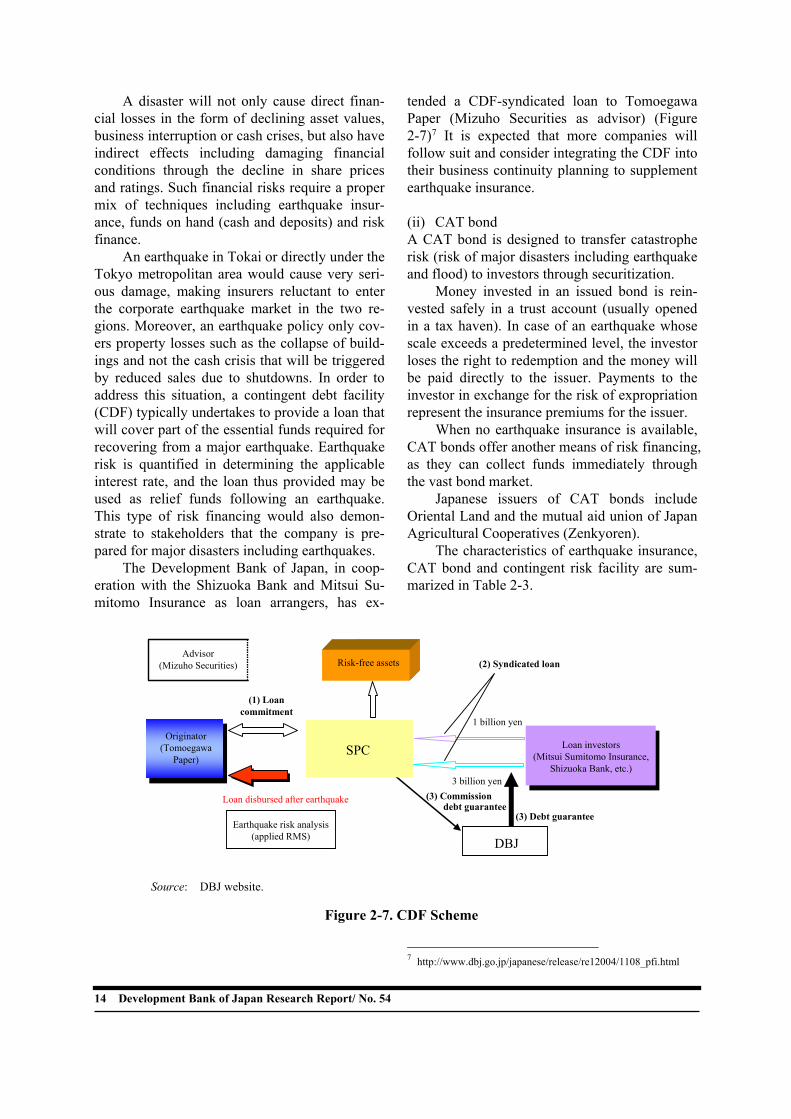
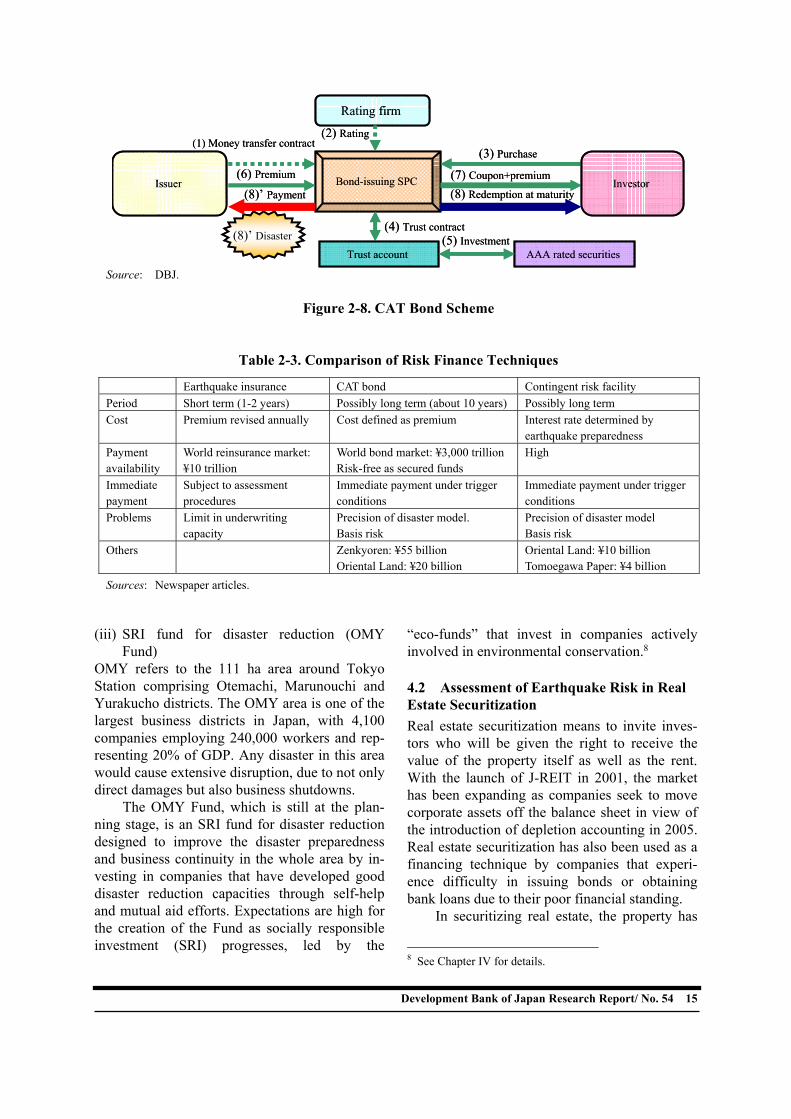
tended a CDF-syndicated loan to Tomoegawa Paper (Mizuho Securities as advisor) (Figure 2-7)7 It is expected that more companies will follow suit and consider integrating the CDF into their business continuity planning to supplement earthquake insurance. (ii) CAT bond A CAT bond is designed to transfer catastrophe risk (risk of major disasters including earthquake and flood) to investors through securitization. Money invested in an issued bond is rein-vested safely in a trust account (usually opened in a tax haven). In case of an earthquake whose scale exceeds a predetermined level, the investor loses the right to redemption and the money will be paid directly to the issuer. Payments to the investor in exchange for the risk of expropriation represent the insurance premiums for the issuer. When no earthquake insurance is available, CAT bonds offer another means of risk financing, as they can collect funds immediately through the vast bond market. Japanese issuers of CAT bonds include Oriental Land and the mutual aid union of Japan Agricultural Cooperatives (Zenkyoren). The characteristics of earthquake insurance, CAT bond and contingent risk facility are sum-marized in Table 2-3.
7 http://www.dbj.go.jp/japanese/release/re12004/1108_pfi.html
(2) Syndicated loan
1 billion yen
(1) Loan commitment
Advisor (Mizuho Securities)
(3) Commission debt guarantee
(3) Debt guarantee
Loan disbursed after earthquake
Risk-free assets
3 billion yen
Originator (Tomoegawa
Paper)SPC Loan investors
(Mitsui Sumitomo Insurance, Shizuoka Bank, etc.)
Earthquake risk analysis(applied RMS) DBJ
Source: DBJ website.
Figure 2-7. CDF Scheme
Development Bank of Japan Research Report/ No. 54 15
(iii) SRI fund for disaster reduction (OMY Fund)
OMY refers to the 111 ha area around Tokyo Station comprising Otemachi, Marunouchi and Yurakucho districts. The OMY area is one of the largest business districts in Japan, with 4,100 companies employing 240,000 workers and rep-resenting 20% of GDP. Any disaster in this area would cause extensive disruption, due to not only direct damages but also business shutdowns. The OMY Fund, which is still at the plan-ning stage, is an SRI fund for disaster reduction designed to improve the disaster preparedness and business continuity in the whole area by in-vesting in companies that have developed good disaster reduction capacities through self-help and mutual aid efforts. Expectations are high for the creation of the Fund as socially responsible investment (SRI) progresses, led by the
“eco-funds” that invest in companies actively involved in environmental conservation.8 4.2 Assessment of Earthquake Risk in Real Estate Securitization Real estate securitization means to invite inves-tors who will be given the right to receive the value of the property itself as well as the rent. With the launch of J-REIT in 2001, the market has been expanding as companies seek to move corporate assets off the balance sheet in view of the introduction of depletion accounting in 2005. Real estate securitization has also been used as a financing technique by companies that experi-ence difficulty in issuing bonds or obtaining bank loans due to their poor financial standing. In securitizing real estate, the property has
8 See Chapter IV for details.
(8)’ Disaster
Issuer Bond-issuing SPC
AAA rated securities
Rating firm
Investor
(2) Rating (1) Money transfer contract
(3) Purchase
(4) Trust contract
(7) Coupon+premium(6) Premium
(8) Redemption at maturity(8)’ Payment
Trust account (5) Investment (8)’ Disaster
Issuer Bond-issuing SPC
AAA rated securities
Rating firm
Investor
(2) Rating (1) Money transfer contract
(3) Purchase
(4) Trust contract
(7) Coupon+premium(6) Premium
(8) Redemption at maturity(8)’ Payment
Trust account (5) Investment
Source: DBJ.
Figure 2-8. CAT Bond Scheme
Table 2-3. Comparison of Risk Finance Techniques
Earthquake insurance CAT bond Contingent risk facility Period Short term (1-2 years) Possibly long term (about 10 years) Possibly long term Cost Premium revised annually Cost defined as premium Interest rate determined by
earthquake preparedness Payment availability
World reinsurance market: ¥10 trillion
World bond market: ¥3,000 trillion Risk-free as secured funds
High
Immediate payment
Subject to assessment procedures
Immediate payment under trigger conditions
Immediate payment under trigger conditions
Problems Limit in underwriting capacity
Precision of disaster model. Basis risk
Precision of disaster model Basis risk
Others Zenkyoren: ¥55 billion Oriental Land: ¥20 billion
Oriental Land: ¥10 billion Tomoegawa Paper: ¥4 billion
Sources: Newspaper articles.
16 Development Bank of Japan Research Report/ No. 54
to be evaluated properly from a holistic view-point, taking into account applicable laws and regulations, the trend of the real estate market, environmental aspects including soil pollution, earthquake resistance and topography (due dili-gence). The result of due diligence is then pre-sented to rating firms and potential investors for consideration.9 Thus, disaster prevention meas-ures including quake resistance improvement will raise the value of property through the due diligence process.
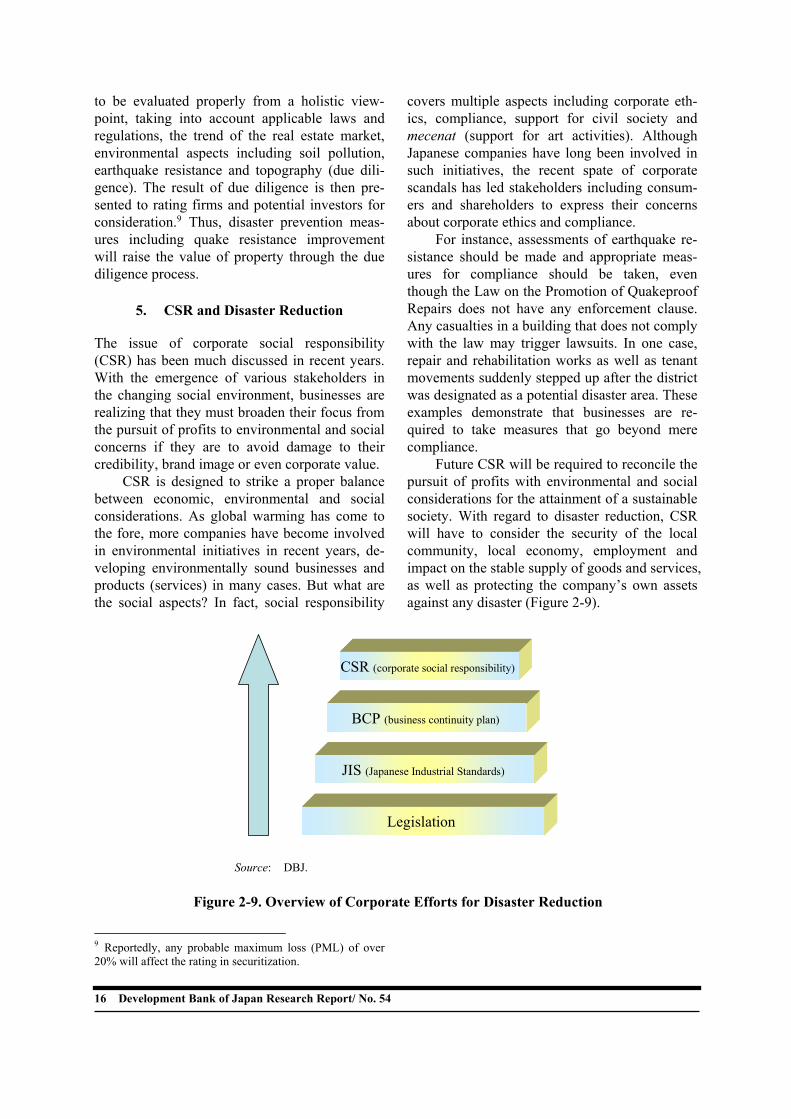
5. CSR and Disaster Reduction
The issue of corporate social responsibility (CSR) has been much discussed in recent years. With the emergence of various stakeholders in the changing social environment, businesses are realizing that they must broaden their focus from the pursuit of profits to environmental and social concerns if they are to avoid damage to their credibility, brand image or even corporate value. CSR is designed to strike a proper balance between economic, environmental and social considerations. As global warming has come to the fore, more companies have become involved in environmental initiatives in recent years, de-veloping environmentally sound businesses and products (services) in many cases. But what are the social aspects? In fact, social responsibility
9 Reportedly, any probable maximum loss (PML) of over 20% will affect the rating in securitization.
covers multiple aspects including corporate eth-ics, compliance, support for civil society and mecenat (support for art activities). Although Japanese companies have long been involved in such initiatives, the recent spate of corporate scandals has led stakeholders including consum-ers and shareholders to express their concerns about corporate ethics and compliance. For instance, assessments of earthquake re-sistance should be made and appropriate meas-ures for compliance should be taken, even though the Law on the Promotion of Quakeproof Repairs does not have any enforcement clause. Any casualties in a building that does not comply with the law may trigger lawsuits. In one case, repair and rehabilitation works as well as tenant movements suddenly stepped up after the district was designated as a potential disaster area. These examples demonstrate that businesses are re-quired to take measures that go beyond mere compliance. Future CSR will be required to reconcile the pursuit of profits with environmental and social considerations for the attainment of a sustainable society. With regard to disaster reduction, CSR will have to consider the security of the local community, local economy, employment and impact on the stable supply of goods and services, as well as protecting the company’s own assets against any disaster (Figure 2-9).
Legislation
JIS (Japanese Industrial Standards)
BCP (business continuity plan)
CSR (corporate social responsibility)
Legislation
JIS (Japanese Industrial Standards)
BCP (business continuity plan)
CSR (corporate social responsibility)
Source: DBJ.
Figure 2-9. Overview of Corporate Efforts for Disaster Reduction
Development Bank of Japan Research Report/ No. 54 17
6. Cooperation with Communities in Case of Disaster
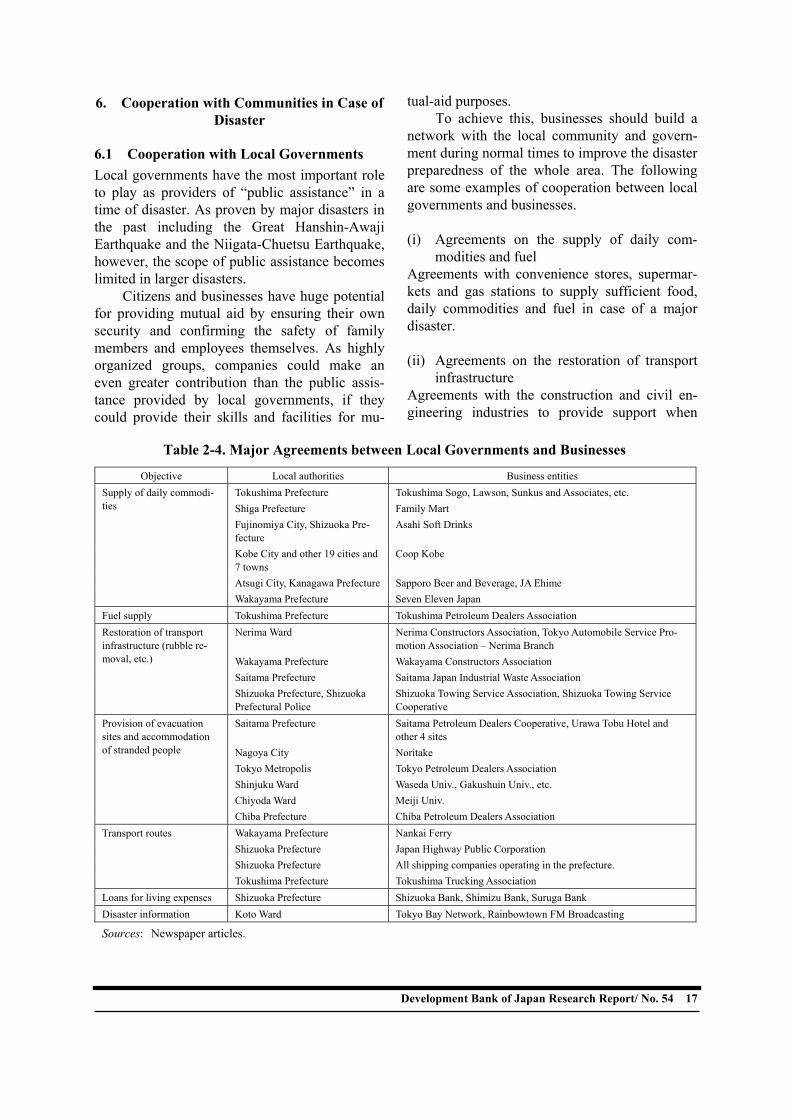
6.1 Cooperation with Local Governments Local governments have the most important role to play as providers of “public assistance” in a time of disaster. As proven by major disasters in the past including the Great Hanshin-Awaji Earthquake and the Niigata-Chuetsu Earthquake, however, the scope of public assistance becomes limited in larger disasters. Citizens and businesses have huge potential for providing mutual aid by ensuring their own security and confirming the safety of family members and employees themselves. As highly organized groups, companies could make an even greater contribution than the public assis-tance provided by local governments, if they could provide their skills and facilities for mu-
tual-aid purposes. To achieve this, businesses should build a network with the local community and govern-ment during normal times to improve the disaster preparedness of the whole area. The following are some examples of cooperation between local governments and businesses. (i) Agreements on the supply of daily com-
modities and fuel Agreements with convenience stores, supermar-kets and gas stations to supply sufficient food, daily commodities and fuel in case of a major disaster. (ii) Agreements on the restoration of transport
infrastructure Agreements with the construction and civil en-gineering industries to provide support when
Table 2-4. Major Agreements between Local Governments and Businesses
Objective Local authorities Business entities Tokushima Prefecture Tokushima Sogo, Lawson, Sunkus and Associates, etc. Shiga Prefecture Family Mart Fujinomiya City, Shizuoka Pre-fecture
Asahi Soft Drinks
Kobe City and other 19 cities and 7 towns
Coop Kobe
Atsugi City, Kanagawa Prefecture Sapporo Beer and Beverage, JA Ehime
Supply of daily commodi-ties
Wakayama Prefecture Seven Eleven Japan Fuel supply Tokushima Prefecture Tokushima Petroleum Dealers Association
Nerima Ward Nerima Constructors Association, Tokyo Automobile Service Pro-motion Association – Nerima Branch
Wakayama Prefecture Wakayama Constructors Association Saitama Prefecture Saitama Japan Industrial Waste Association
Restoration of transport infrastructure (rubble re-moval, etc.)
Shizuoka Prefecture, Shizuoka Prefectural Police
Shizuoka Towing Service Association, Shizuoka Towing Service Cooperative
Saitama Prefecture Saitama Petroleum Dealers Cooperative, Urawa Tobu Hotel and other 4 sites
Nagoya City Noritake Tokyo Metropolis Tokyo Petroleum Dealers Association Shinjuku Ward Waseda Univ., Gakushuin Univ., etc. Chiyoda Ward Meiji Univ.
Provision of evacuation sites and accommodation of stranded people
Chiba Prefecture Chiba Petroleum Dealers Association Wakayama Prefecture Nankai Ferry Shizuoka Prefecture Japan Highway Public Corporation Shizuoka Prefecture All shipping companies operating in the prefecture.
Transport routes
Tokushima Prefecture Tokushima Trucking Association Loans for living expenses Shizuoka Prefecture Shizuoka Bank, Shimizu Bank, Suruga Bank Disaster information Koto Ward Tokyo Bay Network, Rainbowtown FM Broadcasting
Sources: Newspaper articles.
18 Development Bank of Japan Research Report/ No. 54
roads become impassable due to cave-ins or ob-stacles. (iii) Agreements on evacuation sites and the ac-
commodation of stranded people Agreements with hotels and other private com-panies and universities to open up their facilities as temporary shelters in a time of disaster. Agreements are also concluded with gas stations for accommodating stranded people. (iv) Agreements on transport routes Agreements are concluded with shipping compa-nies to transport daily commodities and relief workers to isolated areas where access by road or railway has been cut off. (v) Agreements on loans to cover living ex-
penses Prior agreements to enable disaster victims to obtain loans for living expenses without delay even in the chaos following a disaster. (vi) Agreements on disaster information Agreements with TV and radio stations to give priority to disaster information over normal pro-gramming. 6.2 Community Disaster Reduction though Cooperation among Businesses In addition to cooperation between local gov-ernments and businesses, the resilience of com-munities needs to be built through cooperation among businesses. There are many cases of business cooperation in Japan to improve the disaster preparedness of communities, as shown by the examples below. (i) Liaison Group to Prepare for Major Disas-
ters (Fuji, Shizuoka Prefecture) The City of Fuji has a large concentration of pa-per and chemical-related plants, and so local residents and governments requested businesses to take measures to minimize secondary disasters such as plant explosions and fires following a Tokai earthquake, as well as primary damages.10 10 According to the Third Assessment of Earthquake Dam-ages conducted by the Shizuoka prefectural government, a seismic intensity of lower 6 or over on the Japanese scale will be registered in Fuji in case of a Tokai earthquake,
However, individual companies did not know where to start, and many did not even have an officer in charge of disaster reduction. The Fuji Chamber of Commerce and Industry therefore created in April 2004 a Liaison Group to Prepare for Major Disasters. This organization includes some 30 companies that volunteered to join the Group, as well as local authorities including the Shizuoka prefectural government and the Fuji municipal government. The aim of the Group is to raise awareness, build expertise and consider concrete measures to be incorporated in a manual through exchange and sharing of issues and information among responsible corporate officers, thereby improving the disaster preparedness of the community as a whole. The Group provides the participating companies with an opportunity to share disaster prevention measures, information on disaster risk management and relevant skills. The prefectural and municipal governments and the Chamber of Commerce and Industry also expect the Group to play a key role in sustaining the local industry, as well as in providing security to the whole com-munity, as it is clear that an earthquake would have a huge impact on the local economy and employment if the community was not prepared. (ii) OMY Neighborhood Association for Disas-
ter Reduction (Chiyoda Ward, Tokyo) As mentioned earlier, the OMY area – Otemachi, Marunouchi, and Yurakucho – is the heart of the Japanese economy, accounting for some 20% of GDP. The Tokyo metropolitan government esti-mates that a strong earthquake directly under the metropolitan area, which is considered to have a 70% probability of occurring within the next 30 years, will leave some 600,000 people stranded in Chiyoda Ward alone. Along with preparing the area for disaster, how to accommodate those stranded people is a major issue to be solved. This issue is being addressed by the Asso-ciation for the Accommodation of Stranded Peo-ple in Tokyo and Yurakucho Station Area (“Neighborhood Association for Disaster Reduc-tion”) – a group of some 60 companies operating in the OMY area led by Mitsubishi Estate, the
resulting in the collapse of 6,745 buildings.
Development Bank of Japan Research Report/ No. 54 19
largest landowner in the district. A comprehensive emergency drill was co-organized in January 2005 by the Neighbor-hood Association and Chiyoda Ward to ensure the safe and early return home of stranded people when a strong earthquake directly hits the area. Training activities included escape guidance, safe return home and cargo shipment by the Self Defense Force.
20 Development Bank of Japan Research Report/ No. 54
III Corporate Risk Management and Business Continuity Plan (BCP)
1. Developments in Corporate Risk Management
1.1. Developments in Japan Following the Great Hanshin-Awaji Earthquake and subsequent incidents, accidents and scandals, the Guidelines for development and implementa-tion of risk management systems was published as a Japanese Industrial Standard in March 2003. The Guidelines describe typical techniques to support risk and crisis management by compa-nies and local governments. They define risk management as a framework of corporate man-agement comprising the involvement of man-agement, the establishment of routine measures and the development of human resources, and suggests that resilience be continually strength-ened by repeatedly applying the PDCA (plan-do-check-action) process to risk manage-ment. Although the Guidelines define a manage-rial framework as in the case of ISO14000 (en-vironmental management system) and ISO9000 (quality management system), they do not offer a certification system but rely on voluntary efforts by corporations. The Guidelines comprise the following seven principles: (i) risk management policy, (ii) risk management planning, (iii) im-plementation of risk management, (iv) assess-ment of the performance and effectiveness of risk management systems, (v) correction and im-provement of risk management systems, (vi) re-view by the CEO and (vii) system and mecha-nism for maintaining the risk management sys-tem. Continued improvement is possible by starting with the development of an organism or mechanism (Principle vii) and then repeating Principles i through vi within its framework.11 The Guidelines cover all entities including busi-nesses and local governments. Elsewhere, the METI Study Group on Risk Management and Internal Control issued in July 2003 the “Guideline for Internal Control That Functions Together with Risk Management.”
11 “New Corporate Management and Risk Management: Guidelines for Building a JIS Risk Management System JISQ2001,” Tokyo Marine Risk Consulting.
The Guideline defines risk management as “a series of company activities that appropriately manage various internal and external risks asso-ciated with its business, in the course of corpo-rate management, to maintain and augment its value” and internal control as “a system or a process established and operated in a company to carry out its business properly and efficiently.” It also stresses the need to integrate internal control and risk management by stating that these two concepts, which have grown out of different backgrounds, share broadly the same objectives from the standpoint of preserving and enhancing enterprise value by responding to a variety of risks surrounding companies.12 1.2. Developments in the U.K. In 1994, the U.K. Business Continuity Institute (BCI) was established to draw up guidelines on business continuity management (BCM) and train BCM experts. The BCI is a membership organization with 1,650 members in 45 countries worldwide, including Asian economies such as Hong Kong, Singapore, Thailand and Japan as well as those in Europe and North America. The “Guide to Business Continuity Man-agement” prepared by the BCI in 2002 assumes that BCM will be effectively implemented through a cyclical process comprising the fol-lowing five stages: (i) understanding one’s busi-ness, (ii) building BCM strategies, (iii) develop-ing and implementing a BCP, (iv) establishing the BCM culture and (v) implementing and up-dating the BCM. Published as PAS (Publicly Available Specification) 56 of the British Stan-dards Institute (BSI), the Guide is the first to present a comprehensive idea of BCM, for which no unified concept or concrete techniques had existed. Currently, there is a trend toward global standardization of risk management. As the BCI has moved closest to standardization, it encour-ages the International Organization for Stan-dardization (ISO) to follow suit. With similar encouragement by the U.S., the ISO is now moving toward drawing up guidelines.13 Discus- 12 White Paper on International Economy and Trade 2004. 13 The matter is currently being considered by the High-level Advisory Group on Security established under the Technical Management Board (TMB).
Development Bank of Japan Research Report/ No. 54 21
sion on standardization needs to consider cultural differences among nations. As far as risk man-agement is concerned, Japan should make its po-sition clear on earthquakes and other disasters that have a major impact on its territory and peo-ple, while introducing foreign techniques as deemed appropriate. In Japan, the BCI Japan Alliance was estab-lished in December 2003, following the certifica-tion of InterRisk Research Institute as BCI’s Japanese branch. The Alliance has been involved in awareness-raising activities, providing BCM information to businesses, government ministries and agencies and universities. In September 1999, the Institute of Char-tered Accountants in England and Wales (ICAEW) published the Turnbull Guidance, 14 which calls for the integration of risk manage-ment and internal control. The London Stock Exchange requires listed companies to comply with the Turnbull Guidance for business years ending 23 December 1999 or later, thus virtually requiring corporations to take measures for risk management. 1.3. Developments in the U.S. Activities to promote risk management, although less comprehensive, have also been taken in the U.S., mainly by the BCI, DRII15 and the FEMA (Federal Emergency Management Agency) 16 . Following a series of corporate scandals, five major accounting associations also launched an initiative to consider internal control matters in June 1985 by establishing a Committee of Spon-soring Organization of the Treadway Commis-sion (COSO). In its report published in October 1987, the National Commission on Fraudulent Financial Reporting stated, “top management first must establish the proper environment, one in which fraudulent financial reporting is less likely to occur and, if it does occur, is more
14 The Turnbull Guidance, issued by the ICAEW in Sep-tember 1999, aims at promoting the introduction of risk management and internal control systems by companies (InterRisk Research Institute “Disclosure of Risk Manage-ment Information in U.K. Companies: Outline of Turnbull Guidance,” Corporate Risk Information, Vol. 9). 15 Established in 1988, DRII (Disaster Recovery Institute International) operates a certification system for business continuity managers. 16 See Chapter IV, Section 1, 1.2 (i).
likely to be detected.” In line with this report, the COSO published the Internal Con-trol—Integrated Framework (COSO report) in 1992. The idea of the COSO report, referred to in the BIS Guideline as well as in the U.S. and Japanese auditing standards, has now become the de facto global standard on internal control. Fur-thermore, the COSO Enterprise Risk Manage-ment Framework, prepared in 2003, seeks to in-tegrate risk management with internal control. Moreover, it is now a statutory obligation under the Sarbanes-Oxley Act of 2002, in order to restore the reliability of financial reporting in response to a series of financial scandals, for company management to attach certification on the effectiveness of disclosure controls and pro-cedures, and to assert internal control over finan-cial reporting with an attestation by an inde-pendent auditor when filing registration docu-ments with the SEC.17
2. Outline of Business Continuity Plan (BCP)
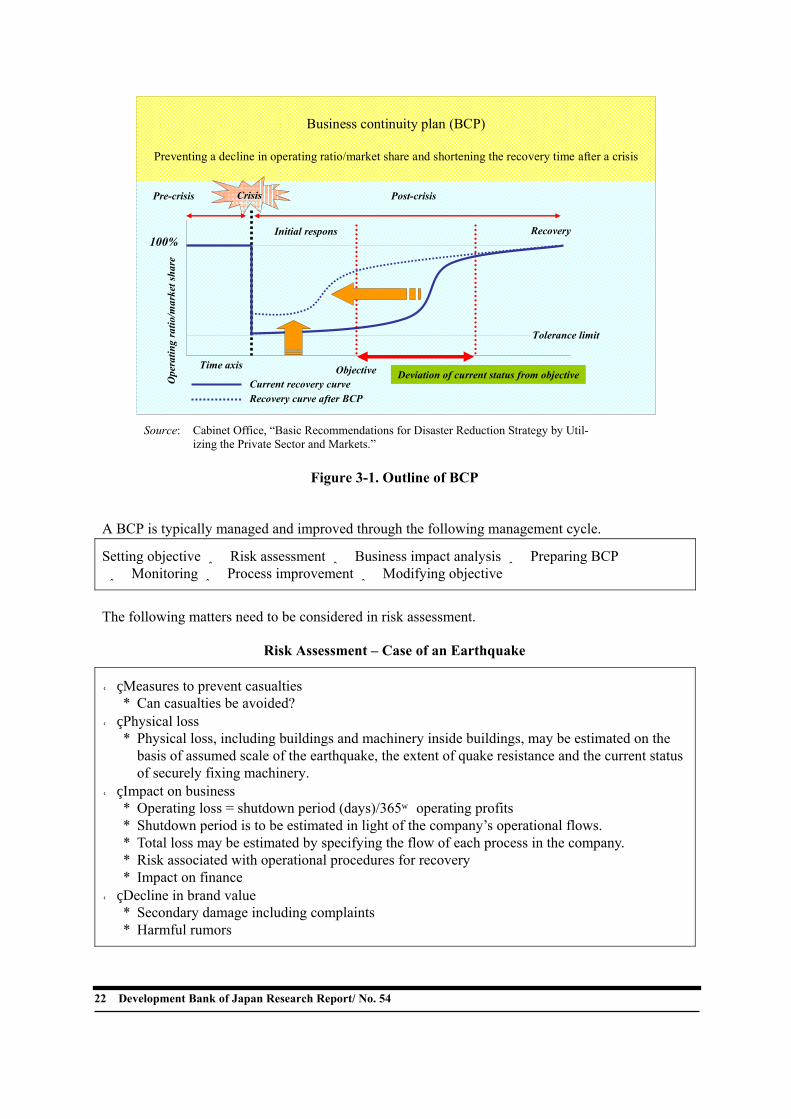
2.1. What is BCP? A business continuity plan (BCP) is a manage-ment strategy to resume critical operations in the shortest possible time following any business interruption due to contingency and thus prevent the subsequent loss of customers, decline in market share and deterioration in corporate reputation by taking necessary measures to pre-pare for emergency situations such as the devel-opment of a chain of command, backup system, the training of substitute personnel, arrangements for immediate safety confirmation and the preparation of manuals. Therefore, BCP is at the core of corporate risk management. Making pro-active plans for providing priority products and services in an emergency would raise the confi-dence of customers and ultimately improve the company’s value.
17 “Internal Control in the New Era of Risks,” Study Group on Risk Management and Internal Control, June 2003.
22 Development Bank of Japan Research Report/ No. 54
Business continuity plan (BCP)
Preventing a decline in operating ratio/market share and shortening the recovery time after a crisis O
pera
ting
ratio
/mar
ket s
hare
100%
Pre-crisis Post-crisis
Recovery
Tolerance limit
Crisis
Initial respons
Time axis Objective Deviation of current status from objective Current recovery curveRecovery curve after BCP
Source: Cabinet Office, “Basic Recommendations for Disaster Reduction Strategy by Util-
izing the Private Sector and Markets.”
Figure 3-1. Outline of BCP
A BCP is typically managed and improved through the following management cycle.
Setting objective ⇒ Risk assessment ⇒ Business impact analysis ⇒ Preparing BCP ⇒ Monitoring ⇒ Process improvement ⇒ Modifying objective
The following matters need to be considered in risk assessment.
Risk Assessment – Case of an Earthquake
○ Measures to prevent casualties * Can casualties be avoided? ○ Physical loss * Physical loss, including buildings and machinery inside buildings, may be estimated on the
basis of assumed scale of the earthquake, the extent of quake resistance and the current status of securely fixing machinery.
○ Impact on business * Operating loss = shutdown period (days)/365×operating profits * Shutdown period is to be estimated in light of the company’s operational flows. * Total loss may be estimated by specifying the flow of each process in the company. * Risk associated with operational procedures for recovery * Impact on finance ○ Decline in brand value * Secondary damage including complaints * Harmful rumors
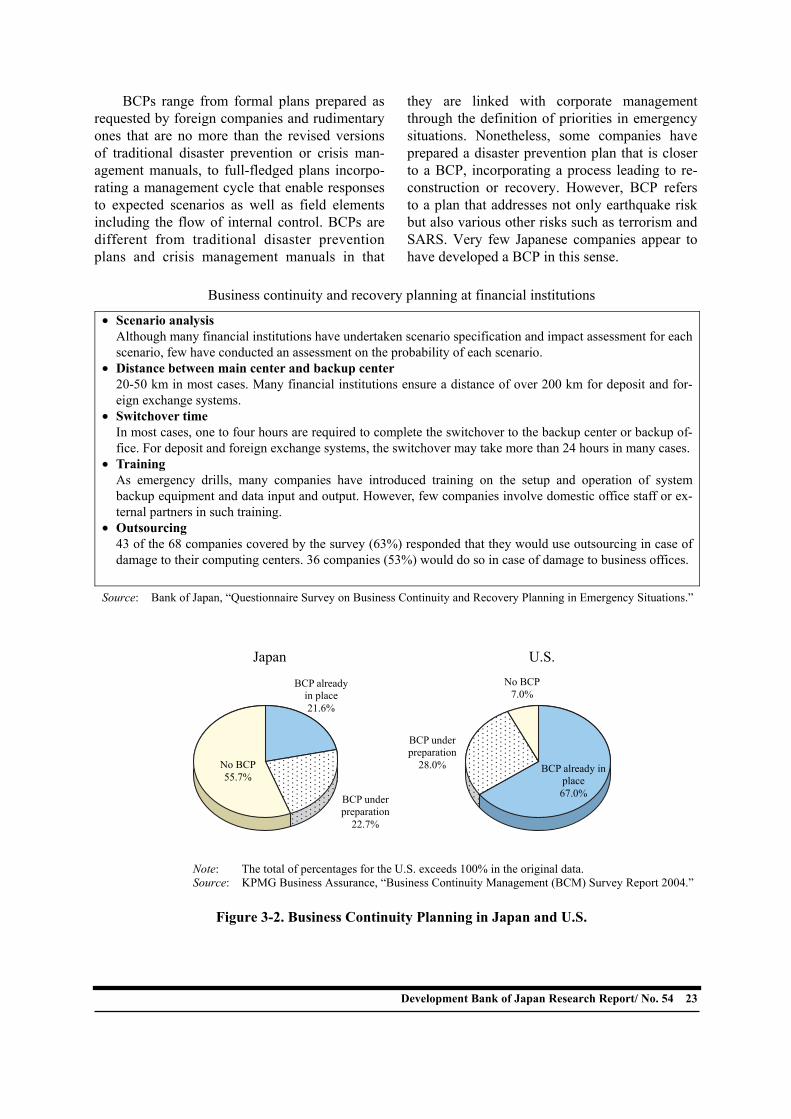
Development Bank of Japan Research Report/ No. 54 23
BCPs range from formal plans prepared as requested by foreign companies and rudimentary ones that are no more than the revised versions of traditional disaster prevention or crisis man-agement manuals, to full-fledged plans incorpo-rating a management cycle that enable responses to expected scenarios as well as field elements including the flow of internal control. BCPs are different from traditional disaster prevention plans and crisis management manuals in that
they are linked with corporate management through the definition of priorities in emergency situations. Nonetheless, some companies have prepared a disaster prevention plan that is closer to a BCP, incorporating a process leading to re-construction or recovery. However, BCP refers to a plan that addresses not only earthquake risk but also various other risks such as terrorism and SARS. Very few Japanese companies appear to have developed a BCP in this sense.
Business continuity and recovery planning at financial institutions
• Scenario analysis Although many financial institutions have undertaken scenario specification and impact assessment for each scenario, few have conducted an assessment on the probability of each scenario.
• Distance between main center and backup center 20-50 km in most cases. Many financial institutions ensure a distance of over 200 km for deposit and for-eign exchange systems.
• Switchover time In most cases, one to four hours are required to complete the switchover to the backup center or backup of-fice. For deposit and foreign exchange systems, the switchover may take more than 24 hours in many cases.
• Training As emergency drills, many companies have introduced training on the setup and operation of system backup equipment and data input and output. However, few companies involve domestic office staff or ex-ternal partners in such training.
• Outsourcing 43 of the 68 companies covered by the survey (63%) responded that they would use outsourcing in case of damage to their computing centers. 36 companies (53%) would do so in case of damage to business offices.
Source: Bank of Japan, “Questionnaire Survey on Business Continuity and Recovery Planning in Emergency Situations.”
Japan U.S.
Note: The total of percentages for the U.S. exceeds 100% in the original data. Source: KPMG Business Assurance, “Business Continuity Management (BCM) Survey Report 2004.”
Figure 3-2. Business Continuity Planning in Japan and U.S.
No BCP 7.0%
BCP under preparation
28.0% BCP already in place 67.0%
BCP already in place 21.6%
No BCP 55.7%
BCP under preparation
22.7%
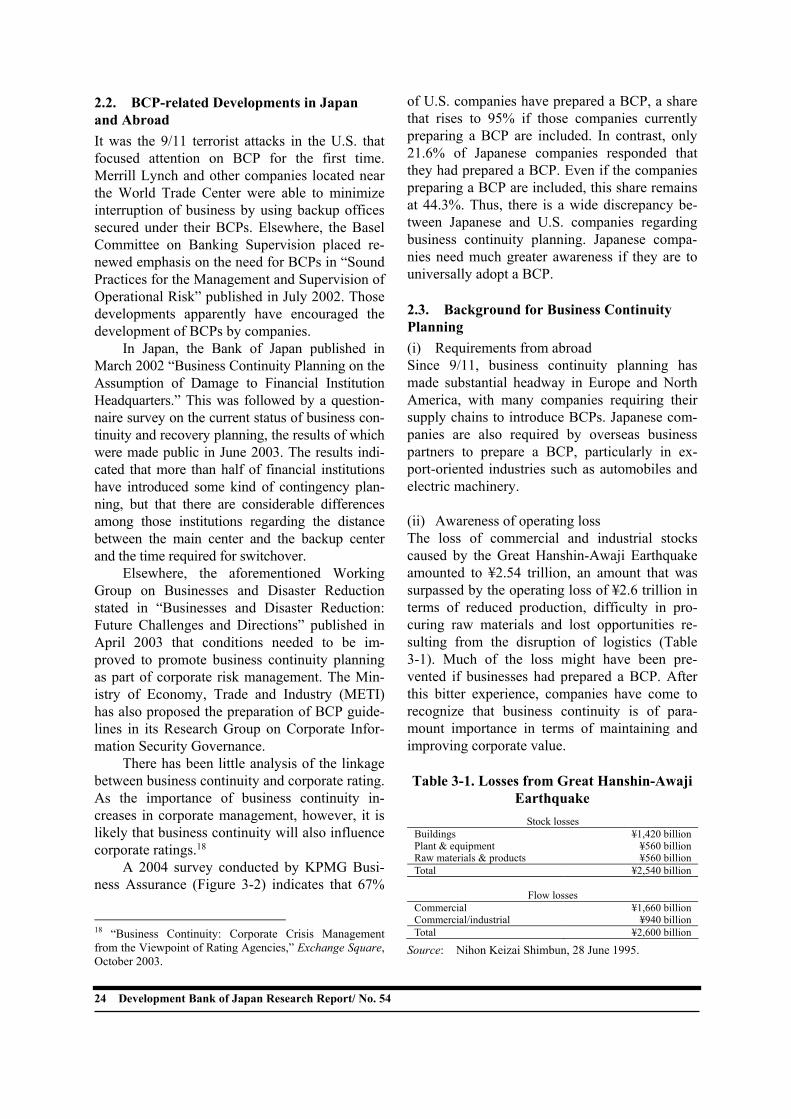
24 Development Bank of Japan Research Report/ No. 54
2.2. BCP-related Developments in Japan and Abroad It was the 9/11 terrorist attacks in the U.S. that focused attention on BCP for the first time. Merrill Lynch and other companies located near the World Trade Center were able to minimize interruption of business by using backup offices secured under their BCPs. Elsewhere, the Basel Committee on Banking Supervision placed re-newed emphasis on the need for BCPs in “Sound Practices for the Management and Supervision of Operational Risk” published in July 2002. Those developments apparently have encouraged the development of BCPs by companies. In Japan, the Bank of Japan published in March 2002 “Business Continuity Planning on the Assumption of Damage to Financial Institution Headquarters.” This was followed by a question-naire survey on the current status of business con-tinuity and recovery planning, the results of which were made public in June 2003. The results indi-cated that more than half of financial institutions have introduced some kind of contingency plan-ning, but that there are considerable differences among those institutions regarding the distance between the main center and the backup center and the time required for switchover. Elsewhere, the aforementioned Working Group on Businesses and Disaster Reduction stated in “Businesses and Disaster Reduction: Future Challenges and Directions” published in April 2003 that conditions needed to be im-proved to promote business continuity planning as part of corporate risk management. The Min-istry of Economy, Trade and Industry (METI) has also proposed the preparation of BCP guide-lines in its Research Group on Corporate Infor-mation Security Governance. There has been little analysis of the linkage between business continuity and corporate rating. As the importance of business continuity in-creases in corporate management, however, it is likely that business continuity will also influence corporate ratings.18 A 2004 survey conducted by KPMG Busi-ness Assurance (Figure 3-2) indicates that 67%
18 “Business Continuity: Corporate Crisis Management from the Viewpoint of Rating Agencies,” Exchange Square, October 2003.
of U.S. companies have prepared a BCP, a share that rises to 95% if those companies currently preparing a BCP are included. In contrast, only 21.6% of Japanese companies responded that they had prepared a BCP. Even if the companies preparing a BCP are included, this share remains at 44.3%. Thus, there is a wide discrepancy be-tween Japanese and U.S. companies regarding business continuity planning. Japanese compa-nies need much greater awareness if they are to universally adopt a BCP. 2.3. Background for Business Continuity Planning (i) Requirements from abroad Since 9/11, business continuity planning has made substantial headway in Europe and North America, with many companies requiring their supply chains to introduce BCPs. Japanese com-panies are also required by overseas business partners to prepare a BCP, particularly in ex-port-oriented industries such as automobiles and electric machinery. (ii) Awareness of operating loss The loss of commercial and industrial stocks caused by the Great Hanshin-Awaji Earthquake amounted to ¥2.54 trillion, an amount that was surpassed by the operating loss of ¥2.6 trillion in terms of reduced production, difficulty in pro-curing raw materials and lost opportunities re-sulting from the disruption of logistics (Table 3-1). Much of the loss might have been pre-vented if businesses had prepared a BCP. After this bitter experience, companies have come to recognize that business continuity is of para-mount importance in terms of maintaining and improving corporate value. Table 3-1. Losses from Great Hanshin-Awaji
Earthquake Stock losses
Buildings ¥1,420 billionPlant & equipment ¥560 billionRaw materials & products ¥560 billionTotal ¥2,540 billion
Flow losses
Commercial ¥1,660 billionCommercial/industrial ¥940 billionTotal ¥2,600 billion
Source: Nihon Keizai Shimbun, 28 June 1995.
Development Bank of Japan Research Report/ No. 54 25
The recent Niigata-Chuetsu Earthquake inflicted severe damage on auto and electric machinery parts manufacturers. Companies which use an efficient production system to minimize stock, including the just-in-time method, are likely to experience a shutdown if supplies from parts manufacturers are cut off. Indeed, Nihon Seiki, the top manufacturer of motorcycle instruments, stopped supplying products as its plant suffered damage from the earthquake, thus affecting the production of motorcycle manufacturers such as Yamaha Motor and Kawasaki Heavy Industries. Niigata Sanyo Electronics, a subsidiary of Sanyo Electric and major supplier of semiconductors for audio-visual applications, suffered a huge
estimated loss of ¥37 billion due to the shutdown, in addition to direct losses of ¥18.4 billion, an inventory loss of ¥4.6 billion and a recovery cost of ¥27 billion.19 (iii) Viewpoint of corporate social responsibility
(CSR) It is crucial to consider what measures should be taken to satisfy stakeholders when facing risks. So far, companies have focused on how to pro-tect their own managerial resources in crisis situations. From now on, companies that incor-porate stakeholder considerations in their BCP will receive higher evaluation from the viewpoint of CSR.
19 Nihon Keizai Shimbun, 22 December.
26 Development Bank of Japan Research Report/ No. 54
IV Issues and Outlook of Corporate Value Improvement through Disaster Management
1. Approach to Corporate Efforts for Disaster Reduction
This section outlines techniques for evaluating corporate efforts for disaster reduction. In addi-tion to these techniques, the Cabinet office has announced that it will develop a separate indica-tor of corporate disaster preparedness. 1.1. Evaluation Technique Addressing Risks as a Whole Crisis Management Regime Diagnosis System of Tokio Marine & Nichido Risk Consulting The system diagnoses corporate crisis manage-ment regimes by quantifying the answers given to a series of questions related to the following nine subjects: top management; organization (e.g. group in charge of crisis management); crisis management process (risk analysis/evaluation, measures against risks, preparation of a crisis management program); the implementation, evaluation and correction of a crisis management program; the development of organizational ca-pacity/human resources; information processing in crisis situations; management records (crisis management documents, activity records); emer-gency regime and planning (response, public in-formation, media relations); and recovery plan-ning (plan for returning to normal operation). 1.2. Indicators Emphasizing Earthquake Factors (i) FEMA (Federal Emergency Management
Agency) indicator The FEMA was established in 1979 by integrat-ing the emergency management functions that had previously been dispersed among multiple departments and agencies. The Agency deals with a wide range of risks from natural disasters to armed conflicts. As regards earthquakes, four guidelines have been presented for businesses, counties, cities and metropolitan areas, respec-tively. The FEMA indicator typically identifies the responsibility of each sector, providing a ba-sis for many evaluation techniques for disaster
management in Japan.
Outline of integrated earthquake prepared-ness guideline for businesses
Part 1 User guide A. Introduction B. Cooperation with local governments in
planning C. Essential elements of corporate earth-
quake planning D. Objectives E. Premises for planning F. Planning procedure
Part 2 Planning guide A. Planning components B. Burden sharing C. Emergency response D. Business recovery E. Earthquake preparedness
Part 3 References Sources: Sumitomo Marine Risk Research Institute, Fed-
eral Emergency Management Agency, Japanese Standard Association, 1995; Research Report for the Improvement of Corporate Disaster Pre-paredness in the Gakunan Area.
(ii) BAREPP (Bay Area Earthquake Prepared-
ness Project) corporate disaster prepared-ness checklist
The checklist is composed as follows. 1) Disaster prevention and mitigation
Buildings, indoor contents, education and awareness-raising, business continuity, data management/backup, management of haz-ardous materials, quake-resistant computer equipment.
2) Occurrence of an earthquake Damage inspection, liaison with administra-tive organizations, backup power, evacuation, risk assessment of damaged buildings, emer-gency relief, housing/food/medical care in emergency situations, public information.
3) Rapid restoration Inspection of damage to facilities, preparation for rubble disposal, recovery of facilities, preparation for emergency measures includ-ing the construction of shelters, ensuring the supply of necessary goods and materials, ar-rangements with the mass media (public in-
Development Bank of Japan Research Report/ No. 54 27
formation), planning for restoring functions, coordination with the local community, plan-ning for loans and investment, cooperation with banks where accounts are held, liaison with local authorities.
Specific questions include: 1) Disaster prevention and mitigation
• Have you identified the construction method, risks and vulnerable spots of the buildings that constitute your workplace?
2) Occurrence of an earthquake • Have you made plans for preliminary esti-
mation of damages and identification of dangerous situations?
3) Rapid restoration • Have you made plans to conduct a com-
prehensive investigation of the damage to facilities to determine whether the opera-tion should be relocated temporarily or continued at the same site?
Sources: Morio Ino, “Earthquake Preparedness of U.S.
Companies,” Earthquake Journal No. 13, Asso-ciation for the Development of Earthquake Pre-diction, 1994; Research Report for the Improve-ment of Corporate Disaster Preparedness in the Gakunan Area.
(iii) Research Report and Check Sheet for the
Improvement of Corporate Disaster Prepar-edness in the Gakunan Area
Fuji Tokoha University, Fuji Prefectural Ad-ministration Center, the City of Fuji, the City of
Fujinomiya, the Town of Shibakawa, and related chambers and associations of commerce and in-dustry, all located in the potential disaster area of a Tokai Earthquake, worked together to establish the Study Group for the Improvement of Corpo-rate Disaster Preparedness in the Gakunan Area, in order to promote preparedness for the Tokai and other earthquakes. Based on the results of a questionnaire survey by the Study Group, a Check Sheet for the Improvement of Corporate Disaster Preparedness against a Tokai Earth-quake was developed for use by business estab-lishments including SMEs, to enable them to check their own disaster preparedness. Two sets of check sheet have been prepared, one for com-prehensive measures and another for individual measures. The check sheet for individual meas-ures comprises the sections dealing with damage mitigation, preparedness for emergency response, preparedness for business continuity and recov-ery, contribution to disaster prevention in the community and universal design for disaster re-duction. Each section consists of several items, to be evaluated on a scale of 0 to 3. The average score is calculated for each section to draw a balance chart, which is used to identify the level of achievement. Progress may be monitored by periodic evaluation.
Table 4-1. Check Sheet for Improvement of Corporate Disaster Preparedness against a Tokai Earthquake
Individual measures
II-1
ii-1 ii-2 ii-3 II-2 II-3
Section
Comprehen-sive meas-
ures Damage
mitigation
Prepared-ness for
emergency response
Prepared-ness for business
continuity and recovery
Contribution to disaster prevention in the com-
munity
Universal design for disaster
reduction
Aggre-gate total
Score (A)
16 7 8 6 5 5 47 No. of items (B) Upper line: manufacturing Lower line: commerce 16 5 11 6 5 6 49
Average (C) = A/B
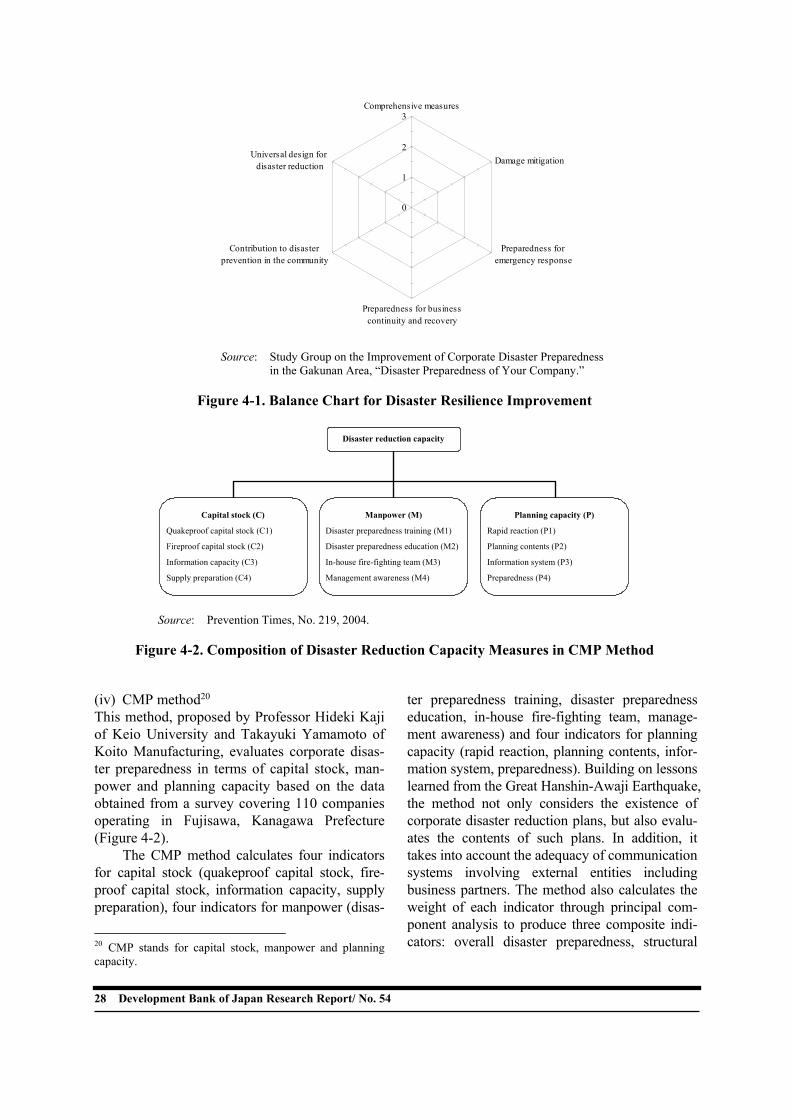
28 Development Bank of Japan Research Report/ No. 54
(iv) CMP method20 This method, proposed by Professor Hideki Kaji of Keio University and Takayuki Yamamoto of Koito Manufacturing, evaluates corporate disas-ter preparedness in terms of capital stock, man-power and planning capacity based on the data obtained from a survey covering 110 companies operating in Fujisawa, Kanagawa Prefecture (Figure 4-2). The CMP method calculates four indicators for capital stock (quakeproof capital stock, fire-proof capital stock, information capacity, supply preparation), four indicators for manpower (disas-
20 CMP stands for capital stock, manpower and planning capacity.
ter preparedness training, disaster preparedness education, in-house fire-fighting team, manage-ment awareness) and four indicators for planning capacity (rapid reaction, planning contents, infor-mation system, preparedness). Building on lessons learned from the Great Hanshin-Awaji Earthquake, the method not only considers the existence of corporate disaster reduction plans, but also evalu-ates the contents of such plans. In addition, it takes into account the adequacy of communication systems involving external entities including business partners. The method also calculates the weight of each indicator through principal com-ponent analysis to produce three composite indi-cators: overall disaster preparedness, structural
0
1
2
3Comprehensive measures
Damage mitigation
Preparedness for emergency response
Preparedness for businesscontinuity and recovery
Contribution to disaster prevention in the community
Universal design for disaster reduction
Source: Study Group on the Improvement of Corporate Disaster Preparedness in the Gakunan Area, “Disaster Preparedness of Your Company.”
Figure 4-1. Balance Chart for Disaster Resilience Improvement
Disaster reduction capacity
Manpower (M)
Disaster preparedness training (M1)
Disaster preparedness education (M2)
In-house fire-fighting team (M3)
Management awareness (M4)
Capital stock (C)
Quakeproof capital stock (C1)
Fireproof capital stock (C2)
Information capacity (C3)
Supply preparation (C4)
Planning capacity (P)
Rapid reaction (P1)
Planning contents (P2)
Information system (P3)
Preparedness (P4)
Source: Prevention Times, No. 219, 2004.
Figure 4-2. Composition of Disaster Reduction Capacity Measures in CMP Method
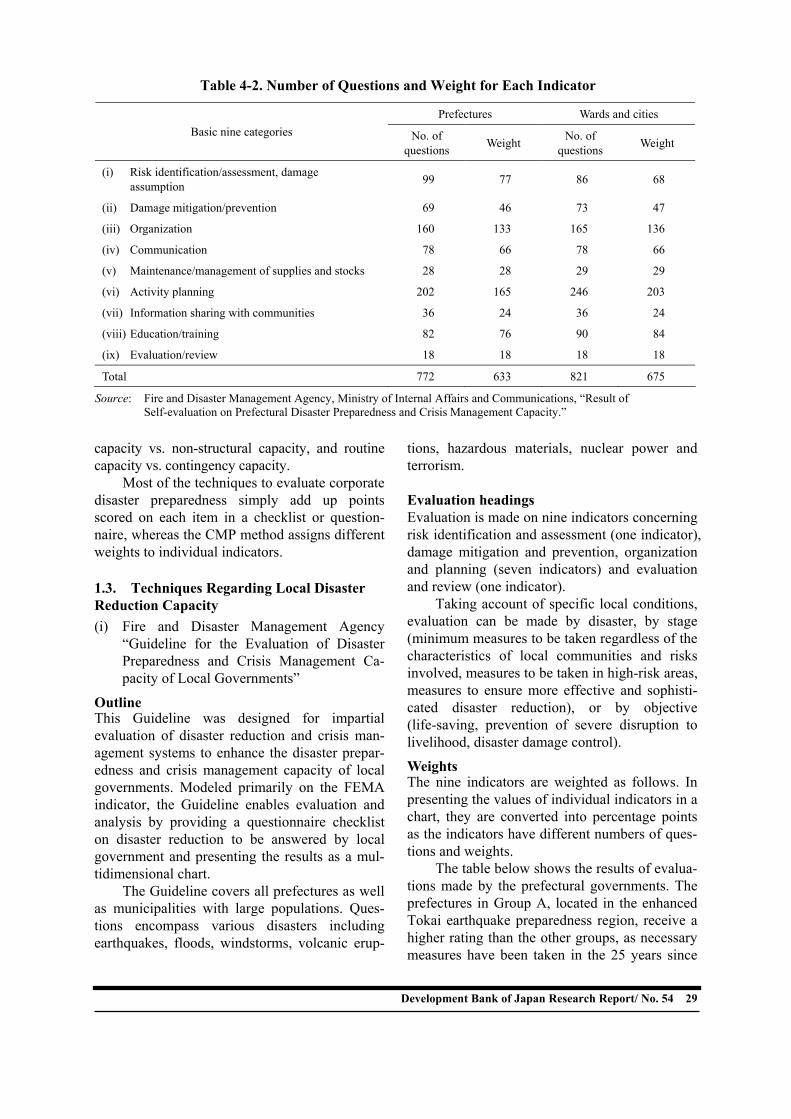
Development Bank of Japan Research Report/ No. 54 29
capacity vs. non-structural capacity, and routine capacity vs. contingency capacity. Most of the techniques to evaluate corporate disaster preparedness simply add up points scored on each item in a checklist or question-naire, whereas the CMP method assigns different weights to individual indicators. 1.3. Techniques Regarding Local Disaster Reduction Capacity (i) Fire and Disaster Management Agency
“Guideline for the Evaluation of Disaster Preparedness and Crisis Management Ca-pacity of Local Governments”
Outline This Guideline was designed for impartial evaluation of disaster reduction and crisis man-agement systems to enhance the disaster prepar-edness and crisis management capacity of local governments. Modeled primarily on the FEMA indicator, the Guideline enables evaluation and analysis by providing a questionnaire checklist on disaster reduction to be answered by local government and presenting the results as a mul-tidimensional chart. The Guideline covers all prefectures as well as municipalities with large populations. Ques-tions encompass various disasters including earthquakes, floods, windstorms, volcanic erup-
tions, hazardous materials, nuclear power and terrorism. Evaluation headings Evaluation is made on nine indicators concerning risk identification and assessment (one indicator), damage mitigation and prevention, organization and planning (seven indicators) and evaluation and review (one indicator). Taking account of specific local conditions, evaluation can be made by disaster, by stage (minimum measures to be taken regardless of the characteristics of local communities and risks involved, measures to be taken in high-risk areas, measures to ensure more effective and sophisti-cated disaster reduction), or by objective (life-saving, prevention of severe disruption to livelihood, disaster damage control).
Weights The nine indicators are weighted as follows. In presenting the values of individual indicators in a chart, they are converted into percentage points as the indicators have different numbers of ques-tions and weights. The table below shows the results of evalua-tions made by the prefectural governments. The prefectures in Group A, located in the enhanced Tokai earthquake preparedness region, receive a higher rating than the other groups, as necessary measures have been taken in the 25 years since
Table 4-2. Number of Questions and Weight for Each Indicator
Prefectures Wards and cities Basic nine categories No. of
questions Weight No. of questions Weight
(i) Risk identification/assessment, damage assumption 99 77 86 68
(ii) Damage mitigation/prevention 69 46 73 47
(iii) Organization 160 133 165 136
(iv) Communication 78 66 78 66
(v) Maintenance/management of supplies and stocks 28 28 29 29
(vi) Activity planning 202 165 246 203
(vii) Information sharing with communities 36 24 36 24
(viii) Education/training 82 76 90 84
(ix) Evaluation/review 18 18 18 18
Total 772 633 821 675
Source: Fire and Disaster Management Agency, Ministry of Internal Affairs and Communications, “Result of Self-evaluation on Prefectural Disaster Preparedness and Crisis Management Capacity.”
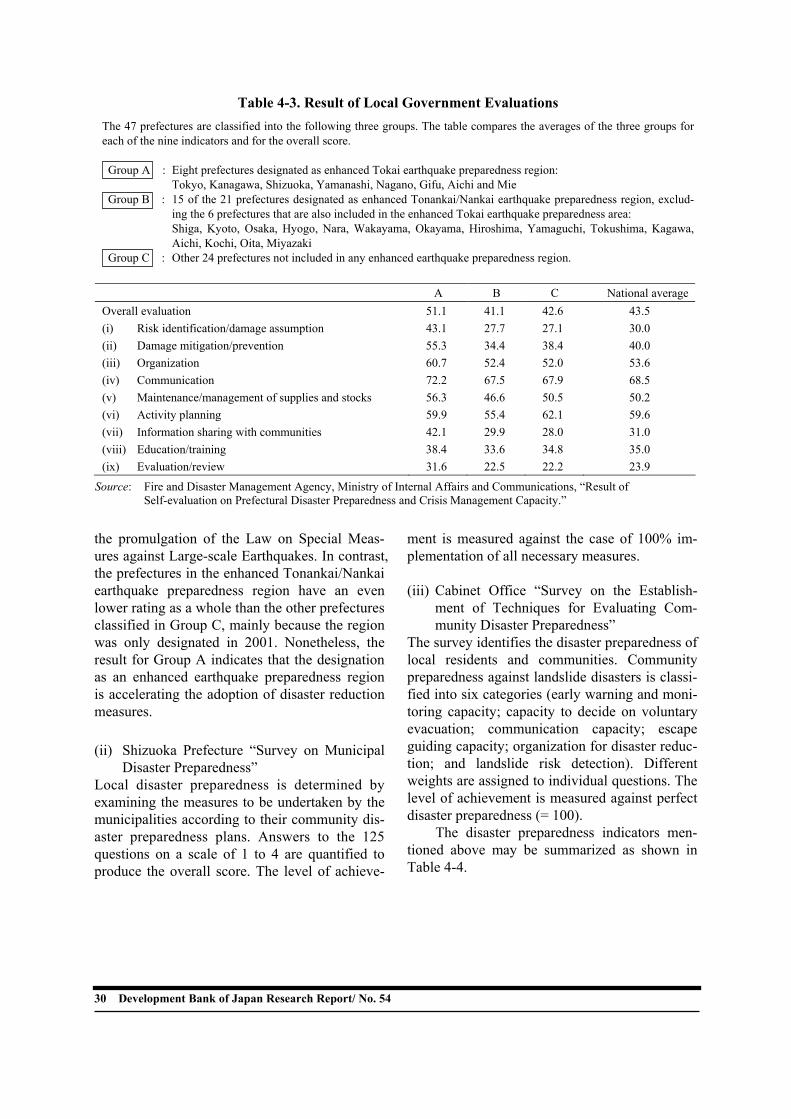
30 Development Bank of Japan Research Report/ No. 54
the promulgation of the Law on Special Meas-ures against Large-scale Earthquakes. In contrast, the prefectures in the enhanced Tonankai/Nankai earthquake preparedness region have an even lower rating as a whole than the other prefectures classified in Group C, mainly because the region was only designated in 2001. Nonetheless, the result for Group A indicates that the designation as an enhanced earthquake preparedness region is accelerating the adoption of disaster reduction measures. (ii) Shizuoka Prefecture “Survey on Municipal
Disaster Preparedness” Local disaster preparedness is determined by examining the measures to be undertaken by the municipalities according to their community dis-aster preparedness plans. Answers to the 125 questions on a scale of 1 to 4 are quantified to produce the overall score. The level of achieve-
ment is measured against the case of 100% im-plementation of all necessary measures. (iii) Cabinet Office “Survey on the Establish-
ment of Techniques for Evaluating Com-munity Disaster Preparedness”
The survey identifies the disaster preparedness of local residents and communities. Community preparedness against landslide disasters is classi-fied into six categories (early warning and moni-toring capacity; capacity to decide on voluntary evacuation; communication capacity; escape guiding capacity; organization for disaster reduc-tion; and landslide risk detection). Different weights are assigned to individual questions. The level of achievement is measured against perfect disaster preparedness (= 100). The disaster preparedness indicators men-tioned above may be summarized as shown in Table 4-4.
Table 4-3. Result of Local Government EvaluationsThe 47 prefectures are classified into the following three groups. The table compares the averages of the three groups for each of the nine indicators and for the overall score. Group A : Eight prefectures designated as enhanced Tokai earthquake preparedness region: Tokyo, Kanagawa, Shizuoka, Yamanashi, Nagano, Gifu, Aichi and Mie Group B : 15 of the 21 prefectures designated as enhanced Tonankai/Nankai earthquake preparedness region, exclud-
ing the 6 prefectures that are also included in the enhanced Tokai earthquake preparedness area: Shiga, Kyoto, Osaka, Hyogo, Nara, Wakayama, Okayama, Hiroshima, Yamaguchi, Tokushima, Kagawa, Aichi, Kochi, Oita, Miyazaki
Group C : Other 24 prefectures not included in any enhanced earthquake preparedness region.
A B C National averageOverall evaluation 51.1 41.1 42.6 43.5 (i) Risk identification/damage assumption 43.1 27.7 27.1 30.0 (ii) Damage mitigation/prevention 55.3 34.4 38.4 40.0 (iii) Organization 60.7 52.4 52.0 53.6 (iv) Communication 72.2 67.5 67.9 68.5 (v) Maintenance/management of supplies and stocks 56.3 46.6 50.5 50.2 (vi) Activity planning 59.9 55.4 62.1 59.6 (vii) Information sharing with communities 42.1 29.9 28.0 31.0 (viii) Education/training 38.4 33.6 34.8 35.0 (ix) Evaluation/review 31.6 22.5 22.2 23.9
Source: Fire and Disaster Management Agency, Ministry of Internal Affairs and Communications, “Result of Self-evaluation on Prefectural Disaster Preparedness and Crisis Management Capacity.”
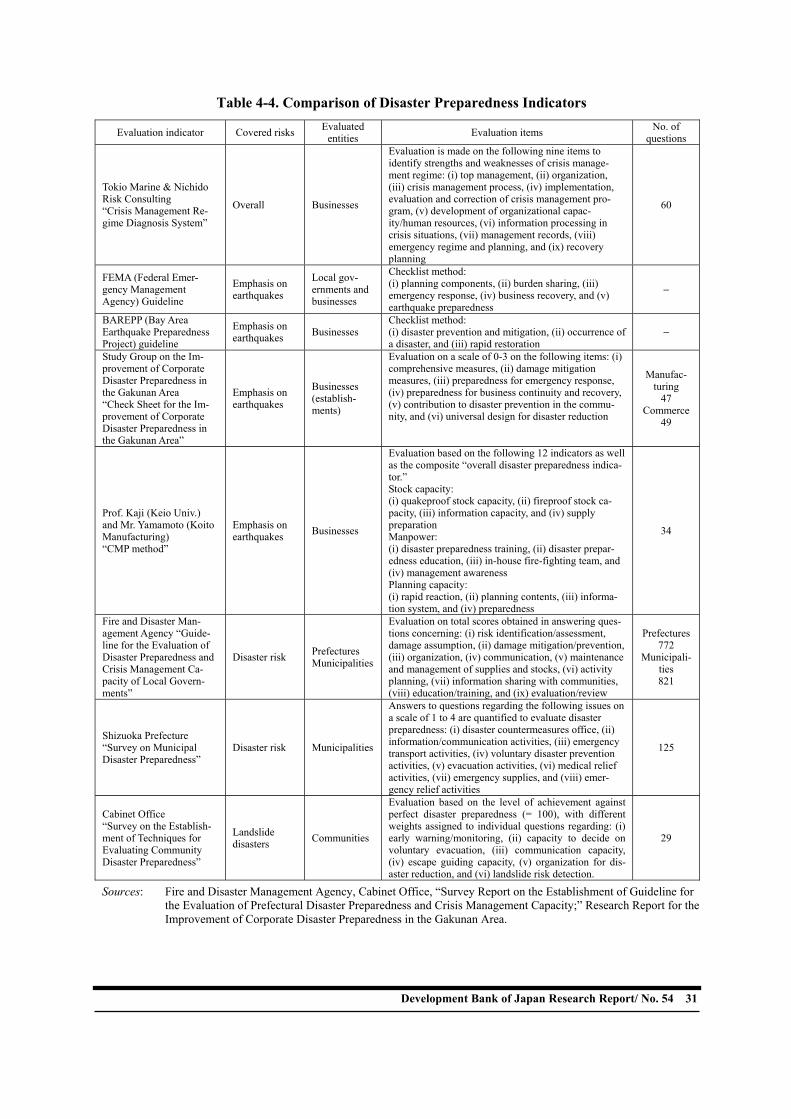
Development Bank of Japan Research Report/ No. 54 31
Table 4-4. Comparison of Disaster Preparedness Indicators
Evaluation indicator Covered risks Evaluated entities Evaluation items No. of
questions
Tokio Marine & Nichido Risk Consulting “Crisis Management Re-gime Diagnosis System”
Overall Businesses
Evaluation is made on the following nine items to identify strengths and weaknesses of crisis manage-ment regime: (i) top management, (ii) organization, (iii) crisis management process, (iv) implementation, evaluation and correction of crisis management pro-gram, (v) development of organizational capac-ity/human resources, (vi) information processing in crisis situations, (vii) management records, (viii) emergency regime and planning, and (ix) recovery planning
60
FEMA (Federal Emer-gency Management Agency) Guideline
Emphasis on earthquakes
Local gov-ernments and businesses
Checklist method: (i) planning components, (ii) burden sharing, (iii) emergency response, (iv) business recovery, and (v) earthquake preparedness
−
BAREPP (Bay Area Earthquake Preparedness Project) guideline
Emphasis on earthquakes Businesses
Checklist method: (i) disaster prevention and mitigation, (ii) occurrence of a disaster, and (iii) rapid restoration
−
Study Group on the Im-provement of Corporate Disaster Preparedness in the Gakunan Area “Check Sheet for the Im-provement of Corporate Disaster Preparedness in the Gakunan Area”
Emphasis on earthquakes
Businesses (establish-ments)
Evaluation on a scale of 0-3 on the following items: (i) comprehensive measures, (ii) damage mitigation measures, (iii) preparedness for emergency response, (iv) preparedness for business continuity and recovery, (v) contribution to disaster prevention in the commu-nity, and (vi) universal design for disaster reduction
Manufac-turing
47 Commerce
49
Prof. Kaji (Keio Univ.) and Mr. Yamamoto (Koito Manufacturing) “CMP method”
Emphasis on earthquakes Businesses
Evaluation based on the following 12 indicators as well as the composite “overall disaster preparedness indica-tor.” Stock capacity: (i) quakeproof stock capacity, (ii) fireproof stock ca-pacity, (iii) information capacity, and (iv) supply preparation Manpower: (i) disaster preparedness training, (ii) disaster prepar-edness education, (iii) in-house fire-fighting team, and (iv) management awareness Planning capacity: (i) rapid reaction, (ii) planning contents, (iii) informa-tion system, and (iv) preparedness
34
Fire and Disaster Man-agement Agency “Guide-line for the Evaluation of Disaster Preparedness and Crisis Management Ca-pacity of Local Govern-ments”
Disaster risk Prefectures Municipalities
Evaluation on total scores obtained in answering ques-tions concerning: (i) risk identification/assessment, damage assumption, (ii) damage mitigation/prevention, (iii) organization, (iv) communication, (v) maintenance and management of supplies and stocks, (vi) activity planning, (vii) information sharing with communities, (viii) education/training, and (ix) evaluation/review
Prefectures772
Municipali-ties 821
Shizuoka Prefecture “Survey on Municipal Disaster Preparedness”
Disaster risk Municipalities
Answers to questions regarding the following issues on a scale of 1 to 4 are quantified to evaluate disaster preparedness: (i) disaster countermeasures office, (ii) information/communication activities, (iii) emergency transport activities, (iv) voluntary disaster prevention activities, (v) evacuation activities, (vi) medical relief activities, (vii) emergency supplies, and (viii) emer-gency relief activities
125
Cabinet Office “Survey on the Establish-ment of Techniques for Evaluating Community Disaster Preparedness”
Landslide disasters Communities
Evaluation based on the level of achievement against perfect disaster preparedness (= 100), with different weights assigned to individual questions regarding: (i) early warning/monitoring, (ii) capacity to decide on voluntary evacuation, (iii) communication capacity, (iv) escape guiding capacity, (v) organization for dis-aster reduction, and (vi) landslide risk detection.
29
Sources: Fire and Disaster Management Agency, Cabinet Office, “Survey Report on the Establishment of Guideline for the Evaluation of Prefectural Disaster Preparedness and Crisis Management Capacity;” Research Report for the Improvement of Corporate Disaster Preparedness in the Gakunan Area.
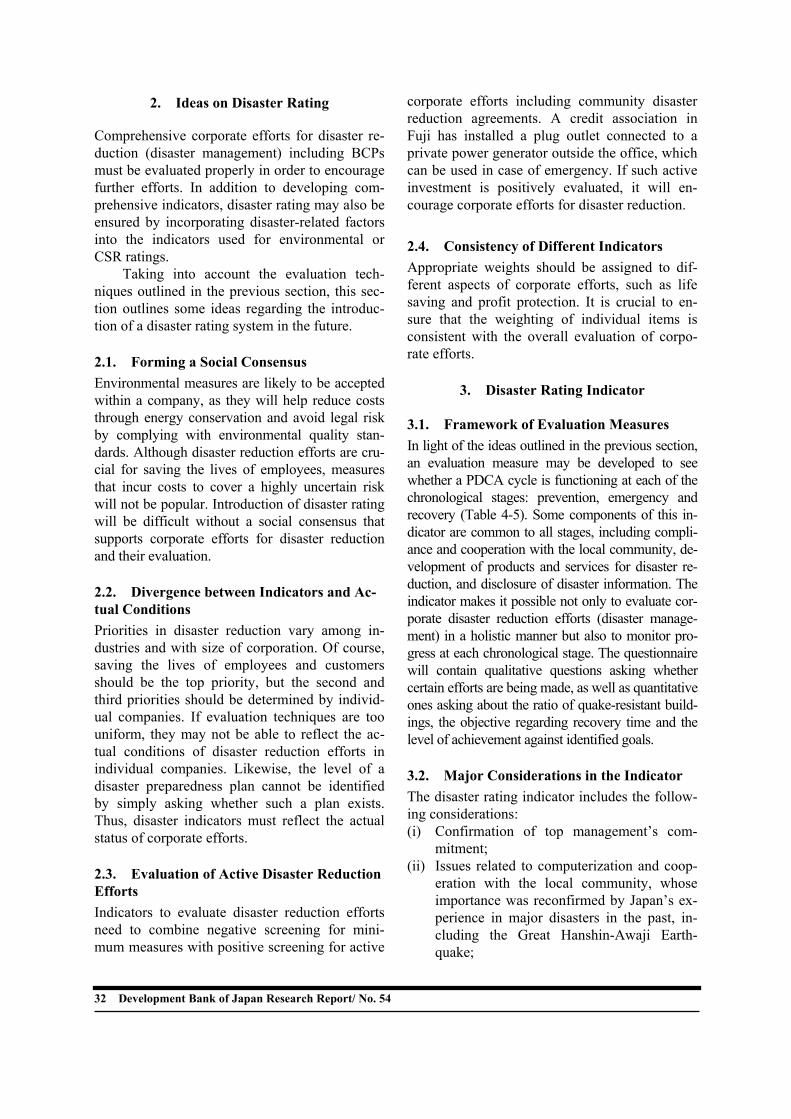
32 Development Bank of Japan Research Report/ No. 54
2. Ideas on Disaster Rating Comprehensive corporate efforts for disaster re-duction (disaster management) including BCPs must be evaluated properly in order to encourage further efforts. In addition to developing com-prehensive indicators, disaster rating may also be ensured by incorporating disaster-related factors into the indicators used for environmental or CSR ratings. Taking into account the evaluation tech-niques outlined in the previous section, this sec-tion outlines some ideas regarding the introduc-tion of a disaster rating system in the future. 2.1. Forming a Social Consensus Environmental measures are likely to be accepted within a company, as they will help reduce costs through energy conservation and avoid legal risk by complying with environmental quality stan-dards. Although disaster reduction efforts are cru-cial for saving the lives of employees, measures that incur costs to cover a highly uncertain risk will not be popular. Introduction of disaster rating will be difficult without a social consensus that supports corporate efforts for disaster reduction and their evaluation. 2.2. Divergence between Indicators and Ac-tual Conditions Priorities in disaster reduction vary among in-dustries and with size of corporation. Of course, saving the lives of employees and customers should be the top priority, but the second and third priorities should be determined by individ-ual companies. If evaluation techniques are too uniform, they may not be able to reflect the ac-tual conditions of disaster reduction efforts in individual companies. Likewise, the level of a disaster preparedness plan cannot be identified by simply asking whether such a plan exists. Thus, disaster indicators must reflect the actual status of corporate efforts. 2.3. Evaluation of Active Disaster Reduction Efforts Indicators to evaluate disaster reduction efforts need to combine negative screening for mini-mum measures with positive screening for active
corporate efforts including community disaster reduction agreements. A credit association in Fuji has installed a plug outlet connected to a private power generator outside the office, which can be used in case of emergency. If such active investment is positively evaluated, it will en-courage corporate efforts for disaster reduction. 2.4. Consistency of Different Indicators Appropriate weights should be assigned to dif-ferent aspects of corporate efforts, such as life saving and profit protection. It is crucial to en-sure that the weighting of individual items is consistent with the overall evaluation of corpo-rate efforts.
3. Disaster Rating Indicator 3.1. Framework of Evaluation Measures In light of the ideas outlined in the previous section, an evaluation measure may be developed to see whether a PDCA cycle is functioning at each of the chronological stages: prevention, emergency and recovery (Table 4-5). Some components of this in-dicator are common to all stages, including compli-ance and cooperation with the local community, de-velopment of products and services for disaster re-duction, and disclosure of disaster information. The indicator makes it possible not only to evaluate cor-porate disaster reduction efforts (disaster manage-ment) in a holistic manner but also to monitor pro-gress at each chronological stage. The questionnaire will contain qualitative questions asking whether certain efforts are being made, as well as quantitative ones asking about the ratio of quake-resistant build-ings, the objective regarding recovery time and the level of achievement against identified goals. 3.2. Major Considerations in the Indicator The disaster rating indicator includes the follow-ing considerations: (i) Confirmation of top management’s com-
mitment; (ii) Issues related to computerization and coop-
eration with the local community, whose importance was reconfirmed by Japan’s ex-perience in major disasters in the past, in-cluding the Great Hanshin-Awaji Earth-quake;
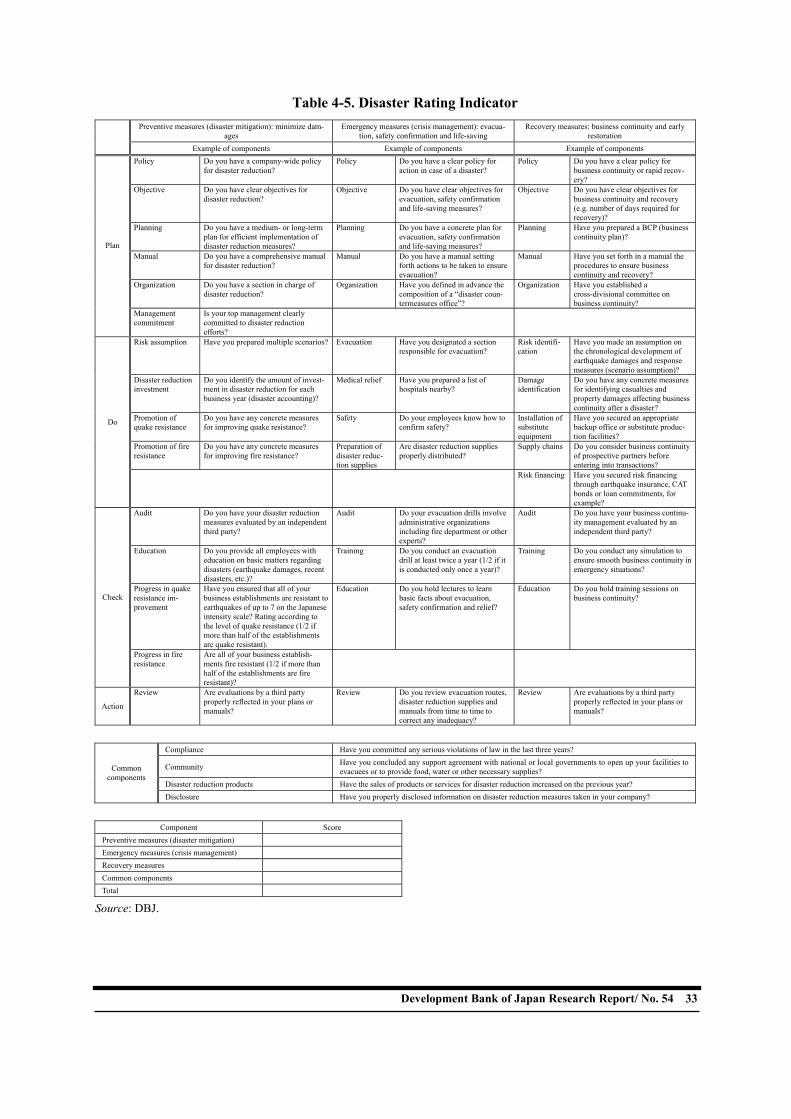
Development Bank of Japan Research Report/ No. 54 33
Table 4-5. Disaster Rating IndicatorPreventive measures (disaster mitigation): minimize dam-
ages Emergency measures (crisis management): evacua-
tion, safety confirmation and life-saving Recovery measures: business continuity and early
restoration Example of components Example of components Example of components
Policy Do you have a company-wide policy for disaster reduction?
Policy Do you have a clear policy for action in case of a disaster?
Policy Do you have a clear policy for business continuity or rapid recov-ery?
Objective Do you have clear objectives for disaster reduction?
Objective Do you have clear objectives for evacuation, safety confirmation and life-saving measures?
Objective Do you have clear objectives for business continuity and recovery (e.g. number of days required for recovery)?
Planning Do you have a medium- or long-term plan for efficient implementation of disaster reduction measures?
Planning Do you have a concrete plan for evacuation, safety confirmation and life-saving measures?
Planning Have you prepared a BCP (business continuity plan)?
Manual Do you have a comprehensive manual for disaster reduction?
Manual Do you have a manual setting forth actions to be taken to ensure evacuation?
Manual Have you set forth in a manual the procedures to ensure business continuity and recovery?
Organization Do you have a section in charge of disaster reduction?
Organization Have you defined in advance the composition of a “disaster coun-termeasures office”?
Organization Have you established a cross-divisional committee on business continuity?
Plan
Management commitment
Is your top management clearly committed to disaster reduction efforts?
Risk assumption Have you prepared multiple scenarios? Evacuation Have you designated a section responsible for evacuation?
Risk identifi-cation
Have you made an assumption on the chronological development of earthquake damages and response measures (scenario assumption)?
Disaster reduction investment
Do you identify the amount of invest-ment in disaster reduction for each business year (disaster accounting)?
Medical relief Have you prepared a list of hospitals nearby?
Damage identification
Do you have any concrete measures for identifying casualties and property damages affecting business continuity after a disaster?
Promotion of quake resistance
Do you have any concrete measures for improving quake resistance?
Safety Do your employees know how to confirm safety?
Installation of substitute equipment
Have you secured an appropriate backup office or substitute produc-tion facilities?
Promotion of fire resistance
Do you have any concrete measures for improving fire resistance?
Preparation of disaster reduc-tion supplies
Are disaster reduction supplies properly distributed?
Supply chains Do you consider business continuity of prospective partners before entering into transactions?
Do
Risk financing Have you secured risk financing through earthquake insurance, CAT bonds or loan commitments, for example?
Audit Do you have your disaster reduction measures evaluated by an independent third party?
Audit Do your evacuation drills involve administrative organizations including fire department or other experts?
Audit Do you have your business continu-ity management evaluated by an independent third party?
Education Do you provide all employees with education on basic matters regarding disasters (earthquake damages, recent disasters, etc.)?
Training Do you conduct an evacuation drill at least twice a year (1/2 if it is conducted only once a year)?
Training Do you conduct any simulation to ensure smooth business continuity in emergency situations?
Progress in quake resistance im-provement
Have you ensured that all of your business establishments are resistant to earthquakes of up to 7 on the Japanese intensity scale? Rating according to the level of quake resistance (1/2 if more than half of the establishments are quake resistant).
Education Do you hold lectures to learn basic facts about evacuation, safety confirmation and relief?
Education Do you hold training sessions on business continuity? Check
Progress in fire resistance
Are all of your business establish-ments fire resistant (1/2 if more than half of the establishments are fire resistant)?
Action
Review Are evaluations by a third party properly reflected in your plans or manuals?
Review Do you review evacuation routes, disaster reduction supplies and manuals from time to time to correct any inadequacy?
Review Are evaluations by a third party properly reflected in your plans or manuals?
Compliance Have you committed any serious violations of law in the last three years?
Community Have you concluded any support agreement with national or local governments to open up your facilities to evacuees or to provide food, water or other necessary supplies?
Disaster reduction products Have the sales of products or services for disaster reduction increased on the previous year?
Common components
Disclosure Have you properly disclosed information on disaster reduction measures taken in your company?
Component Score
Preventive measures (disaster mitigation) Emergency measures (crisis management) Recovery measures Common components Total
Source: DBJ.
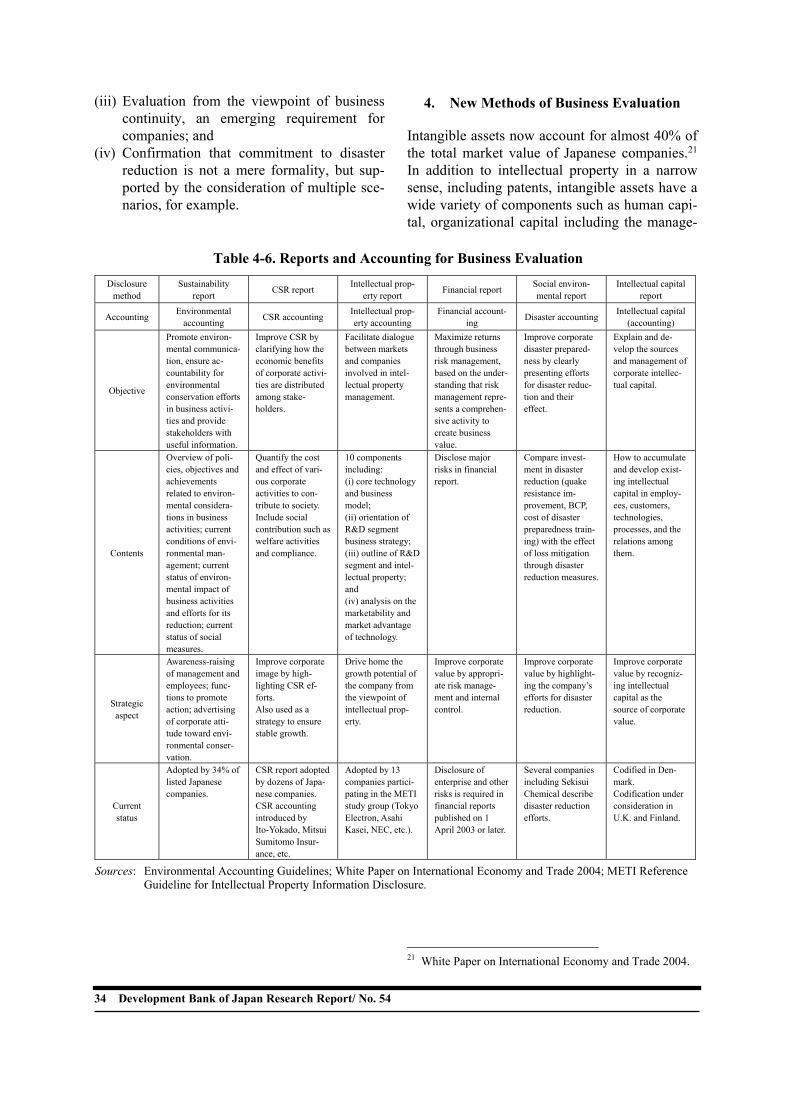
34 Development Bank of Japan Research Report/ No. 54
(iii) Evaluation from the viewpoint of business continuity, an emerging requirement for companies; and
(iv) Confirmation that commitment to disaster reduction is not a mere formality, but sup-ported by the consideration of multiple sce-narios, for example.
4. New Methods of Business Evaluation Intangible assets now account for almost 40% of the total market value of Japanese companies.21 In addition to intellectual property in a narrow sense, including patents, intangible assets have a wide variety of components such as human capi-tal, organizational capital including the manage-
21 White Paper on International Economy and Trade 2004.
Table 4-6. Reports and Accounting for Business Evaluation Disclosure
method Sustainability
report CSR report Intellectual prop-erty report Financial report Social environ-
mental report Intellectual capital
report
Accounting Environmental accounting CSR accounting Intellectual prop-
erty accounting Financial account-
ing Disaster accounting Intellectual capital (accounting)
Objective
Promote environ-mental communica-tion, ensure ac-countability for environmental conservation efforts in business activi-ties and provide stakeholders with useful information.
Improve CSR by clarifying how the economic benefits of corporate activi-ties are distributed among stake-holders.
Facilitate dialogue between markets and companies involved in intel-lectual property management.
Maximize returns through business risk management, based on the under-standing that risk management repre-sents a comprehen-sive activity to create business value.
Improve corporate disaster prepared-ness by clearly presenting efforts for disaster reduc-tion and their effect.
Explain and de-velop the sources and management of corporate intellec-tual capital.
Contents
Overview of poli-cies, objectives and achievements related to environ-mental considera-tions in business activities; current conditions of envi-ronmental man-agement; current status of environ-mental impact of business activities and efforts for its reduction; current status of social measures.
Quantify the cost and effect of vari-ous corporate activities to con-tribute to society. Include social contribution such as welfare activities and compliance.
10 components including: (i) core technology and business model; (ii) orientation of R&D segment business strategy; (iii) outline of R&D segment and intel-lectual property; and (iv) analysis on the marketability and market advantage of technology.
Disclose major risks in financial report.
Compare invest-ment in disaster reduction (quake resistance im-provement, BCP, cost of disaster preparedness train-ing) with the effect of loss mitigation through disaster reduction measures.
How to accumulate and develop exist-ing intellectual capital in employ-ees, customers, technologies, processes, and the relations among them.
Strategic aspect
Awareness-raising of management and employees; func-tions to promote action; advertising of corporate atti-tude toward envi-ronmental conser-vation.
Improve corporate image by high-lighting CSR ef-forts. Also used as a strategy to ensure stable growth.
Drive home the growth potential of the company from the viewpoint of intellectual prop-erty.
Improve corporate value by appropri-ate risk manage-ment and internal control.
Improve corporate value by highlight-ing the company’s efforts for disaster reduction.
Improve corporate value by recogniz-ing intellectual capital as the source of corporate value.
Current status
Adopted by 34% of listed Japanese companies.
CSR report adopted by dozens of Japa-nese companies. CSR accounting introduced by Ito-Yokado, Mitsui Sumitomo Insur-ance, etc.
Adopted by 13 companies partici-pating in the METI study group (Tokyo Electron, Asahi Kasei, NEC, etc.).
Disclosure of enterprise and other risks is required in financial reports published on 1 April 2003 or later.
Several companies including Sekisui Chemical describe disaster reduction efforts.
Codified in Den-mark. Codification under consideration in U.K. and Finland.
Sources: Environmental Accounting Guidelines; White Paper on International Economy and Trade 2004; METI Reference Guideline for Intellectual Property Information Disclosure.
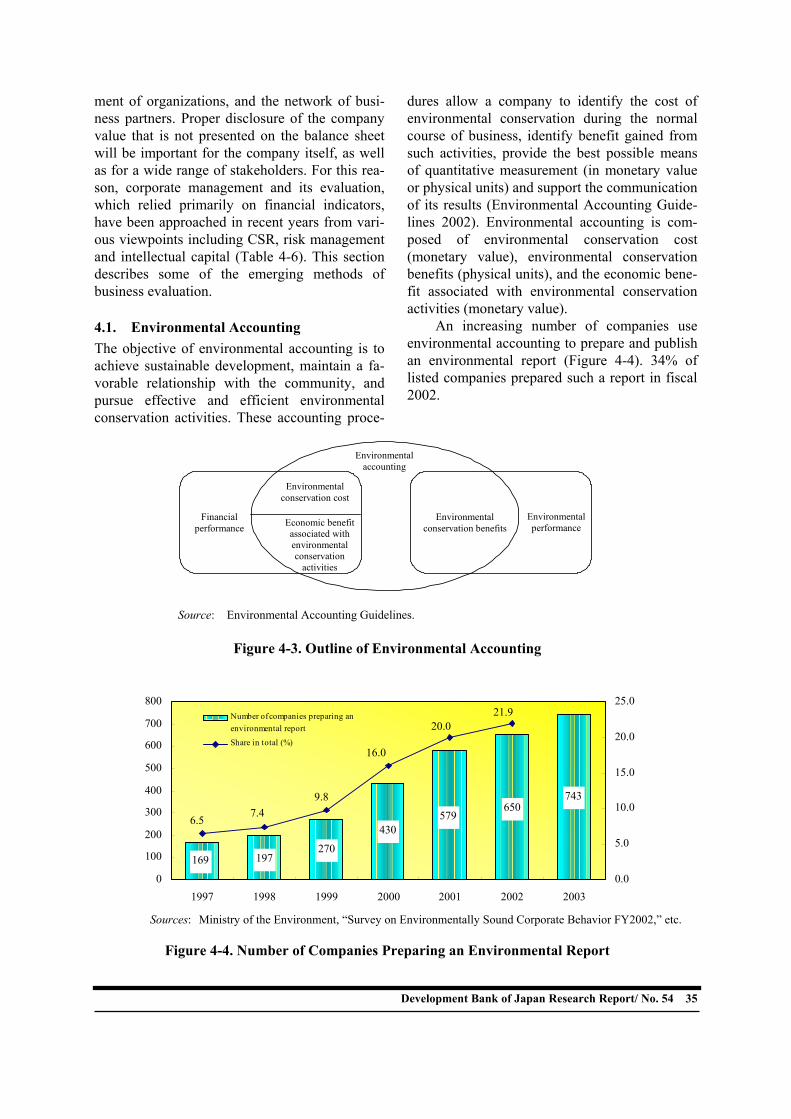
Development Bank of Japan Research Report/ No. 54 35
ment of organizations, and the network of busi-ness partners. Proper disclosure of the company value that is not presented on the balance sheet will be important for the company itself, as well as for a wide range of stakeholders. For this rea-son, corporate management and its evaluation, which relied primarily on financial indicators, have been approached in recent years from vari-ous viewpoints including CSR, risk management and intellectual capital (Table 4-6). This section describes some of the emerging methods of business evaluation. 4.1. Environmental Accounting The objective of environmental accounting is to achieve sustainable development, maintain a fa-vorable relationship with the community, and pursue effective and efficient environmental conservation activities. These accounting proce-
dures allow a company to identify the cost of environmental conservation during the normal course of business, identify benefit gained from such activities, provide the best possible means of quantitative measurement (in monetary value or physical units) and support the communication of its results (Environmental Accounting Guide-lines 2002). Environmental accounting is com-posed of environmental conservation cost (monetary value), environmental conservation benefits (physical units), and the economic bene-fit associated with environmental conservation activities (monetary value). An increasing number of companies use environmental accounting to prepare and publish an environmental report (Figure 4-4). 34% of listed companies prepared such a report in fiscal 2002.
Financial performance
Environmental conservation cost
Economic benefit associated with environmental conservation
activities
Environmental conservation benefits
Environmental accounting
Environmental performance
Source: Environmental Accounting Guidelines.
Figure 4-3. Outline of Environmental Accounting
579650
430
270197169
743
20.021.9
16.0
9.87.4
6.5
0
100
200
300
400
500
600
700
800
1997 1998 1999 2000 2001 2002 20030.0
5.0
10.0
15.0
20.0
25.0Number of companies preparing anenvironmental report
Share in total (%)
Sources: Ministry of the Environment, “Survey on Environmentally Sound Corporate Behavior FY2002,” etc.
Figure 4-4. Number of Companies Preparing an Environmental Report
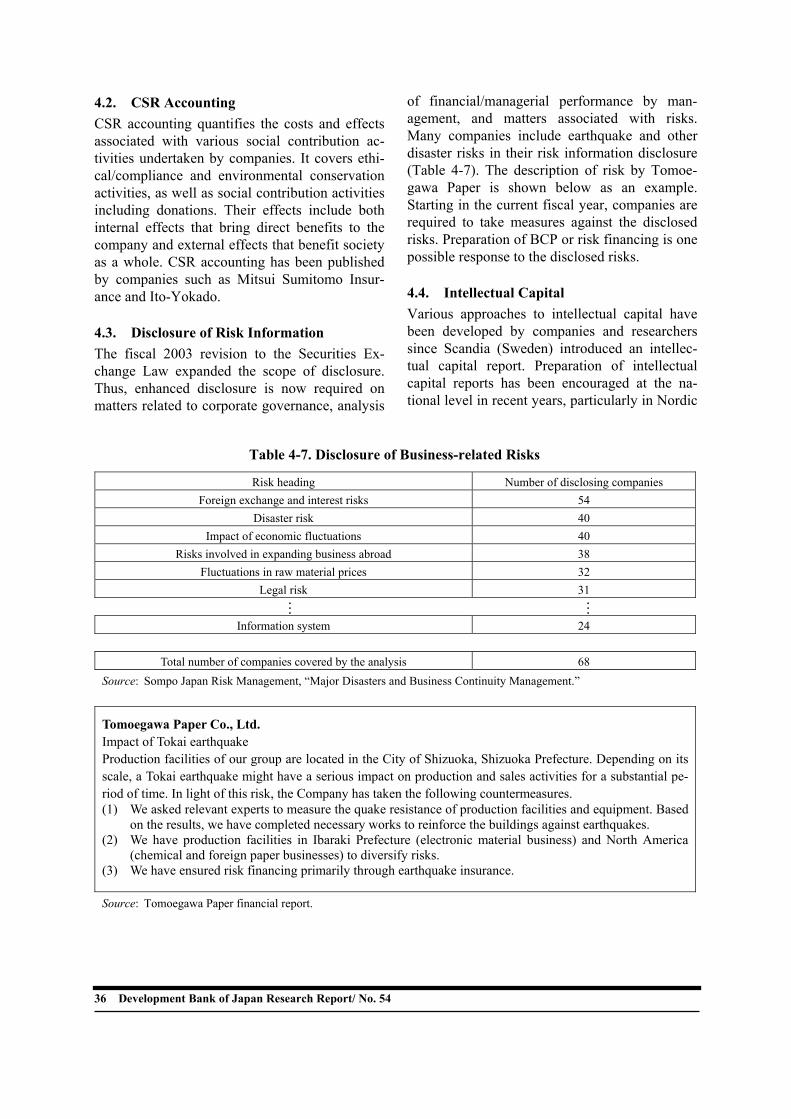
36 Development Bank of Japan Research Report/ No. 54
4.2. CSR Accounting CSR accounting quantifies the costs and effects associated with various social contribution ac-tivities undertaken by companies. It covers ethi-cal/compliance and environmental conservation activities, as well as social contribution activities including donations. Their effects include both internal effects that bring direct benefits to the company and external effects that benefit society as a whole. CSR accounting has been published by companies such as Mitsui Sumitomo Insur-ance and Ito-Yokado. 4.3. Disclosure of Risk Information The fiscal 2003 revision to the Securities Ex-change Law expanded the scope of disclosure. Thus, enhanced disclosure is now required on matters related to corporate governance, analysis
of financial/managerial performance by man-agement, and matters associated with risks. Many companies include earthquake and other disaster risks in their risk information disclosure (Table 4-7). The description of risk by Tomoe-gawa Paper is shown below as an example. Starting in the current fiscal year, companies are required to take measures against the disclosed risks. Preparation of BCP or risk financing is one possible response to the disclosed risks. 4.4. Intellectual Capital Various approaches to intellectual capital have been developed by companies and researchers since Scandia (Sweden) introduced an intellec-tual capital report. Preparation of intellectual capital reports has been encouraged at the na-tional level in recent years, particularly in Nordic
Table 4-7. Disclosure of Business-related Risks
Risk heading Number of disclosing companies Foreign exchange and interest risks 54
Disaster risk 40 Impact of economic fluctuations 40
Risks involved in expanding business abroad 38 Fluctuations in raw material prices 32
Legal risk 31
Information system 24
Total number of companies covered by the analysis 68 Source: Sompo Japan Risk Management, “Major Disasters and Business Continuity Management.”
Tomoegawa Paper Co., Ltd. Impact of Tokai earthquake Production facilities of our group are located in the City of Shizuoka, Shizuoka Prefecture. Depending on its scale, a Tokai earthquake might have a serious impact on production and sales activities for a substantial pe-riod of time. In light of this risk, the Company has taken the following countermeasures. (1) We asked relevant experts to measure the quake resistance of production facilities and equipment. Based
on the results, we have completed necessary works to reinforce the buildings against earthquakes. (2) We have production facilities in Ibaraki Prefecture (electronic material business) and North America
(chemical and foreign paper businesses) to diversify risks. (3) We have ensured risk financing primarily through earthquake insurance.
Source: Tomoegawa Paper financial report.
…
…
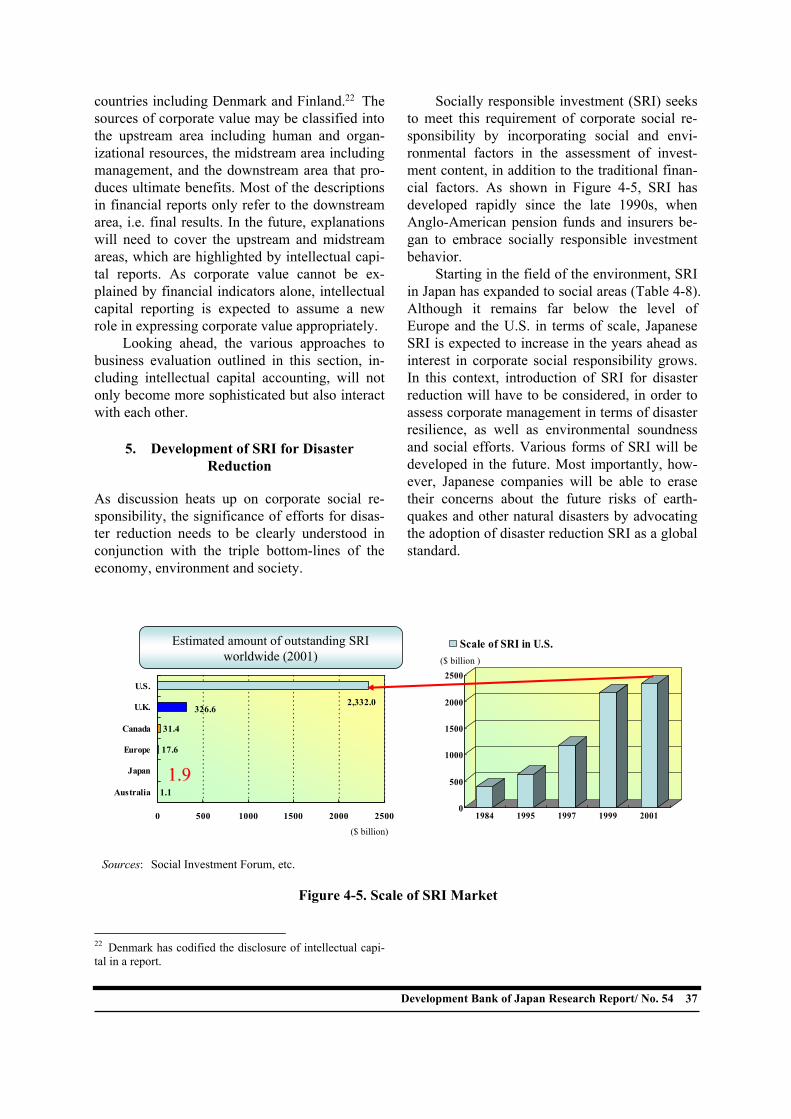
Development Bank of Japan Research Report/ No. 54 37
countries including Denmark and Finland.22 The sources of corporate value may be classified into the upstream area including human and organ-izational resources, the midstream area including management, and the downstream area that pro-duces ultimate benefits. Most of the descriptions in financial reports only refer to the downstream area, i.e. final results. In the future, explanations will need to cover the upstream and midstream areas, which are highlighted by intellectual capi-tal reports. As corporate value cannot be ex-plained by financial indicators alone, intellectual capital reporting is expected to assume a new role in expressing corporate value appropriately. Looking ahead, the various approaches to business evaluation outlined in this section, in-cluding intellectual capital accounting, will not only become more sophisticated but also interact with each other.
5. Development of SRI for Disaster Reduction
As discussion heats up on corporate social re-sponsibility, the significance of efforts for disas-ter reduction needs to be clearly understood in conjunction with the triple bottom-lines of the economy, environment and society.
22 Denmark has codified the disclosure of intellectual capi-tal in a report.
Socially responsible investment (SRI) seeks to meet this requirement of corporate social re-sponsibility by incorporating social and envi-ronmental factors in the assessment of invest-ment content, in addition to the traditional finan-cial factors. As shown in Figure 4-5, SRI has developed rapidly since the late 1990s, when Anglo-American pension funds and insurers be-gan to embrace socially responsible investment behavior. Starting in the field of the environment, SRI in Japan has expanded to social areas (Table 4-8). Although it remains far below the level of Europe and the U.S. in terms of scale, Japanese SRI is expected to increase in the years ahead as interest in corporate social responsibility grows. In this context, introduction of SRI for disaster reduction will have to be considered, in order to assess corporate management in terms of disaster resilience, as well as environmental soundness and social efforts. Various forms of SRI will be developed in the future. Most importantly, how-ever, Japanese companies will be able to erase their concerns about the future risks of earth-quakes and other natural disasters by advocating the adoption of disaster reduction SRI as a global standard.
0
500
1000
1500
2000
2500
1984 1995 1997 1999 2001
Scale of SRI in U.S. ($ billion )
Estimated amount of outstanding SRI worldwide (2001)
17.6
31.4
326.62,332.0
0 500 1000 1500 2000 2500
Australia
Japan
Europe
Canada
U.K.
U.S.
1.91.91.1
($ billion)
Sources: Social Investment Forum, etc.
Figure 4-5. Scale of SRI Market
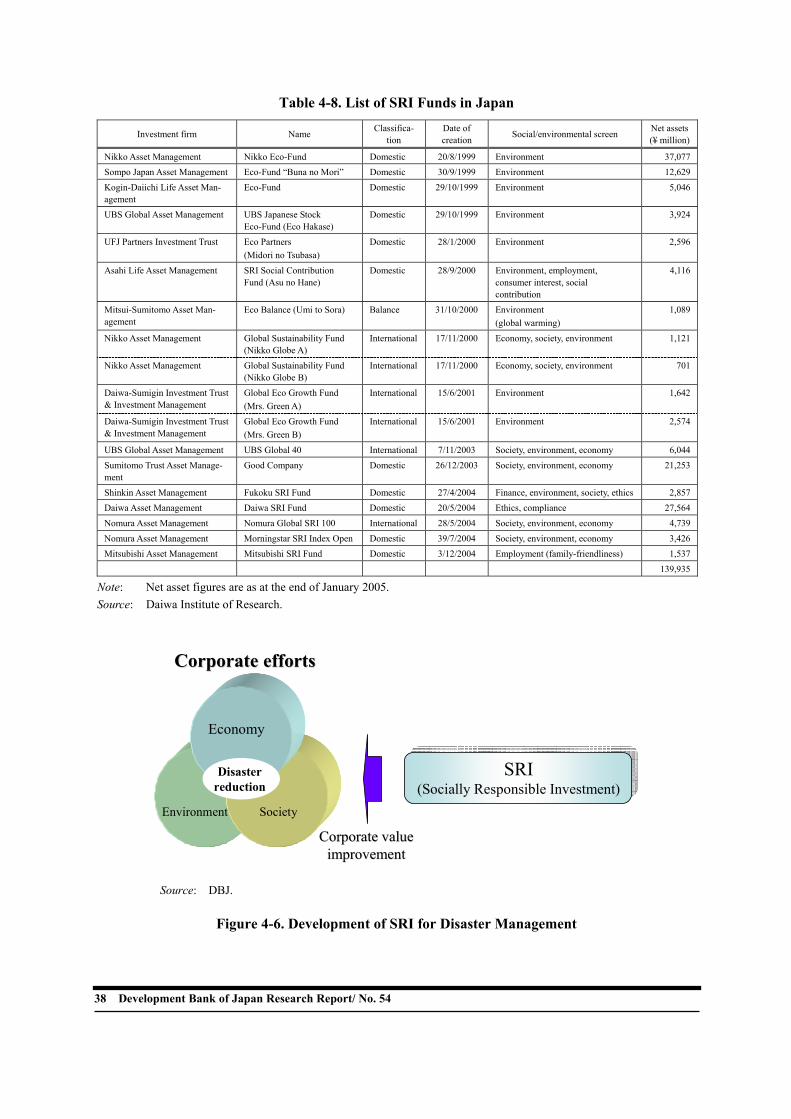
38 Development Bank of Japan Research Report/ No. 54
Table 4-8. List of SRI Funds in Japan
Investment firm Name Classifica-tion
Date of creation Social/environmental screen Net assets
(¥ million)
Nikko Asset Management Nikko Eco-Fund Domestic 20/8/1999 Environment 37,077Sompo Japan Asset Management Eco-Fund “Buna no Mori” Domestic 30/9/1999 Environment 12,629
Kogin-Daiichi Life Asset Man-agement
Eco-Fund Domestic 29/10/1999 Environment 5,046
UBS Global Asset Management UBS Japanese Stock Eco-Fund (Eco Hakase)
Domestic 29/10/1999 Environment 3,924
UFJ Partners Investment Trust Eco Partners (Midori no Tsubasa)
Domestic 28/1/2000 Environment 2,596
Asahi Life Asset Management SRI Social Contribution Fund (Asu no Hane)
Domestic 28/9/2000 Environment, employment, consumer interest, social contribution
4,116
Mitsui-Sumitomo Asset Man-agement
Eco Balance (Umi to Sora) Balance 31/10/2000 Environment (global warming)
1,089
Nikko Asset Management Global Sustainability Fund (Nikko Globe A)
International 17/11/2000 Economy, society, environment 1,121
Nikko Asset Management Global Sustainability Fund (Nikko Globe B)
International 17/11/2000 Economy, society, environment 701
Daiwa-Sumigin Investment Trust & Investment Management
Global Eco Growth Fund (Mrs. Green A)
International 15/6/2001 Environment 1,642
Daiwa-Sumigin Investment Trust & Investment Management
Global Eco Growth Fund (Mrs. Green B)
International 15/6/2001 Environment 2,574
UBS Global Asset Management UBS Global 40 International 7/11/2003 Society, environment, economy 6,044
Sumitomo Trust Asset Manage-ment
Good Company Domestic 26/12/2003 Society, environment, economy 21,253
Shinkin Asset Management Fukoku SRI Fund Domestic 27/4/2004 Finance, environment, society, ethics 2,857Daiwa Asset Management Daiwa SRI Fund Domestic 20/5/2004 Ethics, compliance 27,564
Nomura Asset Management Nomura Global SRI 100 International 28/5/2004 Society, environment, economy 4,739
Nomura Asset Management Morningstar SRI Index Open Domestic 39/7/2004 Society, environment, economy 3,426Mitsubishi Asset Management Mitsubishi SRI Fund Domestic 3/12/2004 Employment (family-friendliness) 1,537
139,935
Note: Net asset figures are as at the end of January 2005. Source: Daiwa Institute of Research.
Disaster reduction
Economy
Society Environment
Disaster reduction
Economy
Society Environment
SRI (Socially Responsible Investment)
Corporate effortsCorporate efforts
Corporate value Corporate value improvementimprovement
Source: DBJ.
Figure 4-6. Development of SRI for Disaster Management
Development Bank of Japan Research Report/ No. 54 39
Conclusion In January 2005, the tenth anniversary of the Great Hanshin-Awaji Earthquake was marked by the United Nations World Conference on Disas-ter Reduction, which was held in Kobe with the participation of 168 delegations and 78 interna-tional organizations. The Conference reiterated the importance of disaster reduction by adopting a Hyogo Framework for Action, which includes five “priorities for action” to be addressed in the coming ten years including the development of early warning systems for natural disasters. An appropriate mix of self-help, mutual aid and public assistance is essential if we are to prepare for major disasters including earthquakes. Among the three elements, self-help, particularly
the role of businesses, has become increasingly important. Corporate disaster preparedness is expected to improve substantially, boosted by legal obligations and voluntary efforts by busi-nesses. The development of BCPs and SRI (so-cially responsible investment) for disaster reduc-tion will be one of the major challenges in en-couraging voluntary and strategic corporate ef-forts. Active discussion on corporate social re-sponsibility indicates that disaster reduction, as well as environmental conservation, must be considered within its framework. Looking ahead, efforts for disaster reduction will become a major factor in improving corporate value, as they have a substantial impact on corporate management in the long term.
40 Development Bank of Japan Research Report/ No. 54
References Bank of Japan (2003) Kinyu Kikan no Kyoten Hisai
wo Sotei Shita Gyomu Keizoku Keikaku no Ari-kata (Business Continuity Planning on the As-sumption of Damage to Financial Institution Headquarters).
Bank of Japan (2003) Kinkyu Ji ni Okeru Gyomu Keizoku/Fukkyu Taisei ni Kansuru Enquête Kekka ni Tsuite (Questionnaire Survey on Busi-ness Continuity and Recovery Planning in Emergency Situations).
BCI Japan (2004) BCI Newsletter, August 2004. Cabinet Office (various years) Bosai Hakusho (White
Paper on Disaster Management). ChuoAoyama PricewaterhouseCoopers Financial and
Risk Management (2002) BCP ni Oite Yusenteki ni Fukkyu, Saikai Subeki Gyomu ni Tsuite (Which Businesses Should be Restored First in a BCP?).
Chuo Mitsui Asset Management, ed. (2000) Hudosan no Shokenka: Sono Shikumi to Shuho (Real Es-tate Securitization: Its Mechanism and Tech-niques). Chuokoron-Shinsha.
Commercial Property Research Institute (2001) “To-shi Saisei Story: Taishin Toshi Zukuri (Urban Redevelopment Story: Building Quake Resistant Cities),” Commercial Property Research Insti-tute Report, No. 6.
Development Bank of Japan (1996) “Bosai Gata no Toshi Zukuri ni Mukete (Towards Building Disaster Resilient Cities),” DBJ Quarterly, No. 31.
Diamond (2004) Harvard Business Review, July 2004.
Disaster Preparedness Information Center, Shizuoka Research Institute, ed. (2002) Tokai Jishin ni Sonaeru: Kigyo no Jishin Bosai Taisaku (Pre-paring for Tokai Earthquake: Corporate Earth-quake Preparedness). Kindai Shobo Sha.
Enomoto, Seiichi (2001) Business Continuity Plan-ning no Hyoka Shihyo (Rei) (Indicators for Evaluation of Business Continuity Planning (Best Practice), KPMG AZSA & Co.
Fire and Disaster Management Agency, ed. (various years) Shobo Hakusho (White Paper on Fire Fighting).
Furuya, Shunsuke (2004) Shakaiteki Sonshitsu no Kanten kara no Risk Taio Hyoka (Evaluation of Risk Management from the Viewpoint of Social
Losses), material presented at a Japan Society of Mechanical Engineering lecture.
Furuya, Shunsuke (2004) Saigai Ji no Business Con-tinuity (Business Continuity in Time of Disaster), monthly lecture at Fuji Sankei Forum.
InterRisk Research Institute, ed. (2004) Jissen CSR: Jizoku Kano na Hatten ni Mukete (CSR in Prac-tice: Toward Sustainable Development). Eco-nomic Legal Research Institute.
Japan Disaster Reduction Institute, ed. (1995) Chikyu wa Ikite Iru: Jishin to Katsudanso – Heisei Nippon Saigai Shi (The Earth is Alive: Earth-quakes and Active Faults – Major Disasters in Japan in Heisei Era). Japan Disaster Reduction Association Press.
Kinehara, Yoshiki (2004) “Nippon Shakai ni Okeru Anzen Mondai no Suii to Goi Keisei (Develop-ment of Safety Issues and Consensus Building in Japanese Society),” Safety Engineering, Vol. 43.
KPMG AZSA & Co. (2004) AZ Insight, Vol. 4, Au-gust 2004.
KPMG Business Assurance (2004) Material presented at the BCM Seminar.
Ministry of Economy, Trade and Industry (2004) En-terprise Risk Management: Textbook.
Ministry of Science Technology and Innovation (2003) Intellectual Capital Statements – The New Guideline.
Misani, Nicola (2002) Risk Management between Insurance and Finance - New Instruments for pure risks: Catastrophe bonds, insurance de-rivatives, contingent capital, risk fusion. Sigma Base Capital.
Nippon Jitsugyo Publishing, ed. (1996) Kigyo no Bo-sai Taisaku Manual (Corporate Disaster Reduc-tion Manual). Nippon Jitsugyo Publishing.
Nippon Keidanren (2003) Saigai ni Tsuyoi Shakai no Kochiku ni Mukete (Toward Building a Disas-ter-Resilient Society).
Non-Life Insurance Rating Organization of Japan (2002) Jishin Kikendo Shisu ni Kansuru Chosa Kenkyu: Jishin PML no Genjo to Shorai (Re-search on Earthquake Risk Indicators: The Pre-sent and Future of Earthquake PML).
Oyo RMS and ERS. “Keiei no Kadai to Shiteno Jishin Risk to Sono Senryakuteki Taio (Earthquake Risk as a Management Issue and Strategic Re-sponse Thereto),” material presented at the Corporate Earthquake Risk Management Semi-nar.
Development Bank of Japan Research Report/ No. 54 41
Policy Engineering Department, Safety Research Center, Mitsubishi Research Institute, ed. (2000) Risk Management Guide. Japanese Standards Association.
Regional Development Department, Osaka Branch, Research Institute of Capital Formation, Devel-opment Bank of Japan (1996) Hanshin-Awaji Dai Shinsai Zen Kiroku: Higai no Jittai to Has-sai Go 1 Nenkan no Fukko eno Torikumi (The Record of Great Hanshin-Awaji Earthquake: Actual Damages and Reconstruction Efforts in the 12 Months after the Disaster).
Research Institute of Capital Formation, Development Bank of Japan (1996) Viewpoint for Establishing Disaster Resilient Urban Structure: (1) Through Categorization of Issues in the Great Han-shin-Awaji Earthquake; (2) With Special Focus on Government's Role (Collection of Docu-ments).
Review Session on Businesses and Disaster Reduc-tion, Cabinet Office (2003) Kigyo to Bosai: Kongo no Kadai to Hokosei (Businesses and Disaster Reduction: Future Challenges and Di-rections).
Sompo Japan Risk Management (2004) “Daikibo Saigai to Jigyo Keizoku Management (Major Disasters and Business Continuity Manage-ment),” material presented at the Corporate Risk Management Seminar.
Sompo Japan Risk Management (2004) Safety Eye, October 2004.
Special Board of Inquiry on enhancing disaster man-agement by utilizing the public sector and mar-kets, Cabinet Office (2004) Minkan to Shijo no Chikara wo Ikashita Bosai Senryaku no Kihon-teki Teigen (Basic Recommendations for Disas-ter Reduction Strategy Utilizing the Public Sec-tor and Markets).
Study Group on the Establishment of Guideline for the Evaluation of Disaster Preparedness and Crisis Management Capacity of Local Govern-ments, Fire and Disaster Management Agency (2003) Chiho Kokyo Dantai no Chiiki Bosairyoku/Kiki Kanri Noryoku Hyoka Shishin: Chosa Hokokusho (Guideline for the Evaluation of Disaster Preparedness and Crisis Manage-ment Capacity of Local Governments: Research Report).
Study Group on the Improvement of Corporate Dis-aster Preparedness in the Gakunan Area (2003) Gakunan Chiiki ni Okeru Kigyo Bosairyoku Kojo ni Kansuru Kenkyu (Research Report for the Improvement of Corporate Disaster Pre-paredness in the Gakunan Area).
Sumitomo Marine Risk Research Institute, ed. (1995) Kigyo no Jishin Taisaku 60 no Point (60 Points of Corporate Earthquake Preparedness). Toyo Keizai.
Swiss Re. “The picture of ART,” sigma, No. 1/2003. Yoshida, Jiro (2002) “Bosai: Anzen na Shakai ni
Mukete Ima Nani ga Hitsuyo ka (Disaster Re-duction: What is Needed for a Safe Society),” Policy Planning Note, No. 9. Development Bank of Japan
Yoshizawa, Hirotaka and Yusuke Sato (2004) Niigata Chuetsu Jishin ga Oyoboshita Kennai Keizai to eno Eikyo ni Tsuite (Impact of the Nii-gata-Chuetsu Earthquake on the Prefectural Economy). Development Bank of Japan.
Other sources include websites of related or-ganizations and companies.

List of Back Numbers (Including JDB Research Report)
No. 54 Improving Corporate Value through Disaster Management: Prospects of Socially Responsible Invest-ment (SRI) for Disaster Reduction (this issue)
No. 53 Japan's Innovative Capacity and Policies for Commercializing New Technologies: Using Carve-Outs to Create New Industries, May 2005
No. 52 Intelligent Transport System (ITS): Current State and Future Prospects, May 2005
No. 51 Recent Trends in the Japanese Economy: Pause in Recovery, March 2005
No. 50 Corporate Capital Spending Behavior and Innovation Efforts: Findings of Survey on Capital Spending Behavior (Conducted in November 2004), March 2005
No. 49 Survey on Planned Capital Spending for Fiscal Years 2004 and 2005 (Conducted in November 2004), January 2005
No. 48 Recent Trends in the Japanese Economy: Medium-term Outlook of Japanese Industrial Structure, Janu-ary 2005
No. 47 Survey on Planned Capital Spending for Fiscal Years 2003, 2004 and 2005 (Conducted in June 2004), September 2004
No. 46 Recent Trends in the Japanese Economy: Impact of Rising International Commodity Prices on Corpo-rate Input/Output Behavior, September 2004
No. 45 How Life Cycle Assessment (LCA) Can Enhance the Fight against Global Warming, August 2004
No. 44 Recent Trends in the Japanese Economy: A Medium-term Scenario for the Japanese Economy with Special Focus on the Flow of Funds and Finance, March 2004
No. 43 Survey on Planned Capital Spending for Fiscal Years 2002, 2003 and 2004 (Conducted in August 2003), November 2003
No. 42 Promoting Corporate Measures to Combat Global Warming: An Analysis of Innovative Activities in the Field, September 2003
No. 41 Prospects and Challenges for End-of-Life Vehicle Recycling, May 2003
No. 40 Survey on Planned Capital Spending for Fiscal Years 2002 and 2003 (Conducted in February 2003), May 2003
No. 39 China’s Economic Development and the Role of Foreign-Funded Enterprises, May 2003
No. 38 Decline in Productivity in Japan and Disparities Between Firms in the 1990s: An Empirical Approach Based on Data Envelopment Analysis, April 2003
No. 37 Trends in Socially Responsible Investment: Corporate Social Responsibility in a New Phase, March 2003
No. 36 Recent Trends in the Japanese Economy: A Medium-term Scenario for the Sustainability of the Japa-nese Economy, February 2003
No. 35 Concerns for the Future and Generational Consumption Behavior, February 2003
No. 34 Prospects and Challenges Surrounding Japan’s Electrical Equipment Industry: General Electrical Equipment Manufacturers’ Restructuring of Operations and Future Prospects, November 2002
No. 33 Survey on Planned Capital Spending for Fiscal Years 2001, 2002 and 2003 (Conducted in August 2002), November 2002
No. 32 Behavior Trends of Japanese Banks toward the Corporate Sector and Their Impact on the Economy, October 2002
No. 31 Microstructure of Investment and Employment Dynamics: Stylized Facts of Factor Adjustment Based
on Listed Company Data, October 2002
No. 30 Recent Trends in the Japanese Economy: Globalization and the Japanese Economy, August 2002
No. 29 Corporate Financing Trends in Recent Years: Fund Shortages and Repayment Burden, August 2002
No. 28 Urban Renewal and Resource Recycling: For the Creation of a Resource Recycling Society, July 2002
No. 27 Labor’s Share and the Adjustment of Wages and Employment, June 2002
No. 26 Survey on Planned Capital Spending for Fiscal Years 2001 and 2002 (Conducted in February 2002), May 2002
No. 25 Environmental Information Policy and Utilization of Information Technology: Toward a Shift in Envi-ronmental Policy Paradigm, March 2002
No. 24 The Changing Structure of Trade in Japan and Its Impact: With the Focus on Trade in Information Technology (IT) Goods, March 2002
No. 23 Microstructure of persistent ROA decline in the Japanese corporate sector: Inter-company disparities and investment strategies, March 2002
No. 22 Recent Trends in the Japanese Economy: The Japanese Economy under Deflation and Prospects of Evolution, February 2002
No. 21 Survey on Planned Capital Spending for Fiscal Years 2000, 2001 and 2002, December 2001
No. 20 Current Situation and Challenges for Cable Television in the Broadband Era, October 2001
No. 19 Recent Trends in the Japanese Economy: The Japanese Economy under Deflation, August 2001
No. 18 Introduction of a Home Appliance Recycling System: Effects & Prospects: Progress towards Utilisation of Recycling Infrastructure, June 2001
No. 17 Survey on Planned Capital Spending for Fiscal Years 2000 and 2001, June 2001
No. 16 Revitalization of Middle-aged and Elderly Workers in Japan’s Labor Markets: Requiring the Expansion of the Vocational Training Functions, March 2001
No. 15 Risk-Averting Portfolio Trends of Japanese Households, March 2001
No. 14 Consumption Demand Trends and the Structure of Supply: Focus on Retail Industry Supply Behavior, March 2001
No. 13 Recent Trends in the Japanese Economy: Weakness of Current Economic Recovery and Its Background, March 2001
No. 12 Empirical Reassessment of Japanese Corporate Investment Behavior: Features and Changes since the 1980s, based on Micro-level Panel Data, March 2001
No. 11 Survey on Planned Capital Spending for Fiscal Years 1999, 2000 and 2001, October 2000
No. 10 Job Creation and Job Destruction in Japan, 1978-1998: An Empirical Analysis Based on Enterprise Data, September 2000
No. 9 Recent Trends in the Japanese Economy: Information Technology and the Economy, September 2000
No. 8 Trend of International Reorganization Affecting the Japanese Automobile and Auto Parts Industries, June 2000
No. 7 Survey on Planned Capital Spending for Fiscal Years 1999 and 2000, June 2000
No. 6 Current Status and Future Perspective of the Japanese Remediation Industry: Technology and Market for Underground Remediation, May 2000
No. 5 Recent Trends in the Japanese Economy: The 1990s in Retrospect, March 2000
No. 4 Destabilized Consumption and the Post-bubble Consumer Environment, February 2000
No. 3 The Slump in Plant and Equipment Investment in the 1990s: Focusing on Lowered Expectations, the Debt Burden and Other Structural Factors, January 2000
No. 2 Survey on Planned Capital Spending for Fiscal Years 1998, 1999 and 2000, November 1999
No. 1 Corporate Strategies in Japan’s Semiconductor Industry: Implications of Development in Other Asian Countries, November 1999
JDB Research Report No. 96 Recent Trends in the Japanese Economy: Focused on Fixed Investment and Capital Stock, August 1999
No. 95 Efforts to Protect the Natural Environment in the United States and Germany: Environmental Mitiga-tion and Biotope Conservation, July 1999
No. 94 Survey on Planned Capital Spending for Fiscal Years 1998 and 1999, June 1999
No. 93 Towards the realization of ‘environmental partnership’: A survey of Japan’s environmental NPO sector through comparison with Germany, June 1999
No. 92 The Impact of Demographic Changes on Consumption and Savings, March 1999
No. 91 Recent Research and Development Trends in Japanese Enterprises: Technology Fusion, March 1999
No. 90 Recent Trends in the Japanese Economy: Prolonged Balance Sheet Adjustment, January 1999
No. 89 Impact of Asset Price Fluctuations on Household and Corporate Behavior: A Comparison between Ja-pan and the U.S., December 1998
No. 88 Survey on Planned Capital Spending for Fiscal Years 1997, 1998, and 1999, December 1998
No. 87 Foreign Exchange Rate Fluctuations and Changes in the Input-Output Structure, November 1998
No. 86 Structural Changes in Unemployment of Japan: An Approach from Labor Flow, November 1998
No. 85 Recent Trends in the Japanese Economy: Characteristics of the Current Recession, August 1998
No. 84 R&D Stock and Trade Structure in Japan, August 1998
No. 83 Survey on Planned Capital Spending for Fiscal Years 1997 and 1998, August 1998
No. 82 The Significance, Potential, and Problems of DNA Analysis Research: Establishing Public Acceptance is Essential, May 1998
No. 81 The Japan Development Bank Reports on Capital Spending: Survey for Fiscal Years 1996, 1997 and 1998 Conducted in August 1997, March 1998
No. 80 Recent Trends in the Japanese Economy: Growth Base of the Japanese Economy, January 1998
No. 79 Information Appliances: The Strength of Japanese Companies and Tasks for the Future, January 1998
No. 78 Challenges and Outlook for the Japanese Machinery Industries: Impact of ISO14000 Series and Envi-ronmental Cost, January 1998
No. 77 Current Conditions and Issues of Computerization in the Health Care Industry: For the Construction of a Health Care Information Network, January 1998
No. 76 Household Consumption and Saving in Japan, December 1997
No. 75 The Direction of Japanese Distribution System Reforms: Strengthening the Infrastructure to Support Diverse Consumer Choices, November 1997
No. 74 Foreign Direct Investments by Japanese Manufacturing Industries and Their Effects on International Trade, October 1997
No. 73 The Impact of the Changing Trade Structure on the Japanese Economy: With Special Focus on the Ef-fects on Productivity and Employment, October 1997
No. 72 An Analysis of Foreign Direct Investment and Foreign Affiliates in Japan, August 1997
No. 71 Recent Trends in the Japanese Economy: Stock Replacement and New Demand as Aspects of Eco-nomic Recovery, August 1997
No. 70 Corporate Fundraising: An International Comparison, June 1997
No. 69 The Japan Development Bank Reports on Capital Spending: Survey for Fiscal Years 1996 and 1997 Conducted in February 1997, May 1997
No. 68 The Japan Development Bank Reports on Capital Spending: Survey for Fiscal Years 1996 and 1997 Conducted in August 1996, August 1997
No. 67 An International Comparison of Corporate Investment Behavior: Empirical Analysis Using Firm Data from Japan, France and the US, April 1997
No. 66 Housing in the National Capital: Analysis of the Market for Housing using Micro Data, March 1997
No. 65 The Environment for Locating Business Operations in Major East Asian Cities, January 1997
No. 64 Direction of Reconstruction of Business Strategy in the Chemical Industry, January 1997
No. 63 Reflection on Discussions Concerning Regulation of the Electric Power Industry: Deregulation of the Electric Power Industry in Japan and Implication of Experiences in the United States, December 1996
No. 62 Current Status and Future Perspective of the Japanese Semiconductor Industry, November 1996
No. 61 A Breakthrough for the Japanese Software Industry?: Responsiveness to Users’ Needs is the key, Oc-tober 1996
No. 60 Recent Trends in the Japanese Economy Focusing on the Characteristics and Sustainability of the Cur-rent Economic Recovery, September 1996
No. 59 Analysis of the Primary Causes and Economic Effects of Information: Related investment in the United States and Trends in Japan, August 1996
No. 58 Selected Summaries of Research Reports: Published in FY1995, June 1996
No. 57 The Japan Development Bank Reports on Capital Spending: Survey for Fiscal Years 1995 and 1996 Conducted in February 1996, May 1996
No. 56 Recent Trends in the Japanese Economy, May 1996
No. 55 Issues Concerning the Competitiveness of the Japanese Steel Industry, February 1996
No. 54 Changes in the Financial Environment and the Real Economy, January 1996
No. 53 The Japan Development Bank Reports on Capital Spending: Survey for Fiscal Years 1994, 1995 and 1996 Conducted in August 1995, October 1995
No. 52 Current Economic Trends: Focusing on the Appreciation of the Yen and its Effects, October 1995
No. 51 Problems Concerning the International Competitiveness of the Petrochemical Industry, October 1995
No. 50 An Economic Approach to International Competitiveness, October 1995
No. 49 Selected Summaries of Research Reports Published in FY1994, July 1995
No. 48 Strategies for Improving the Efficiency of the Japanese Physical Distribution System: Part 2, July 1995
No. 47 Issues on International Competitive Strength of the Auto Industry, June 1995
No. 46 Problems Concerning the International Competitiveness of the Electronics and Electric Machinery In-dustry, June 1995
No. 45 The Japan Development Bank Reports on Capital Spending: Survey for Fiscal Years 1994 and 1995 Conducted in March 1995, June 1995
No. 44 Strategies for Improving the Efficiency of the Japanese Physical Distribution System, March 1995
No. 43 Capital Spending Recovery Scenario Cycle and Structure, August 1994
No. 42 Progress of International Joint Development between Industrialized Countries on the Private Level, May 1994
No. 41 The Japan Development Bank Reports on Capital Spending: Survey for Fiscal Years 1993, 1994 and 1995 Conducted in August 1994 , November 1994
No. 40 Selected Summaries of Research Reports Published in FY1993, June 1994
No. 39 Recent Trends in Japan’s Foreign Accounts, April 1994
No. 38 The Japan Development Bank Reports on Capital Spending: Survey for Fiscal Years 1993 and 1994 Conducted in March 1994, April 1994
No. 37 Economic Zones and East Asia Prospect for Economic Activity Oriented Market Integration, December 1993
No. 36 Japanese Corporate Responses to Global Environmental Issues, December 1993
No. 35 The Japan Development Bank Reports on Capital Spending: Survey for Fiscal Years 1992, 1993 and 1994 Conducted in August 1993, September 1993
No. 34 Structure of Profit to Capital in the Manufacturing Industry, September 1993
No. 33 Comparison of the Japanese and The U.S. Labor Markets, October 1992
No. 32 The Relative Competitiveness of U.S., German, and Japanese Manufacturing, March 1993
No. 31 The Japan Development Bank Reports on Capital Spending: Survey for Fiscal Years 1992 and 1993 Conducted in March 1993, April 1993
No. 30 The Japan Development Bank Reports on Capital Spending: Survey for Fiscal Years 1991, 1992 and 1993 Conducted in August 1992, December 1992
No. 29 Flow of Funds in the 80s and Future Corporate Finance in Japan, November 1992
No. 28 The Japan Development Bank Reports on Capital Spending: Survey for Fiscal Years 1991 and 1992 Conducted in February 1992, April 1992
No. 27 An Analysis of Foreign Direct Investment in Japan, March 1992
No. 26 Projection of Japan's Trade Surplus in 1995: Analysis of Japan's Trade Structure in the 80s, February 1992
No. 25 Intra-Industry Trade and Dynamic Development of The World Economy, November 1991
No. 24 The Japan Development Bank Reports on Capital Spending: Survey for Fiscal Years 1990, 1991 and 1992 Conducted in August 1991, September 1991
No. 23 The Japan Development Bank Reports on Capital Spending: Survey for Fiscal Years 1990 and 1991 Conducted in February 1991, March 1991
No. 22 Trends of the Petrochemical Industry and its Marketplace in East Asia, March 1991
No. 21 The Japan Development Bank Reports on Capital Spending: Survey for Fiscal Years 1989, 1990 and 1991 Conducted in August 1990, September 1990
No. 20 Deepening Economic Linkages in The Pacific Basin Region: Trade, Foreign Direct Investment and Technology, September 1990
No. 19 The Japan Development Bank Reports on Capital Spending: Survey for Fiscal Years 1989 and 1990 Conducted in February 1990, March 1990
No. 18 Petrochemicals in Japan, The US, and Korea an Assessment of Economic Efficiency, February 1990
No. 17 The Japan Development Bank Reports on Capital Spending: Survey for Fiscal Years 1988, 1989 and 1990 Conducted in August 1989, October 1989
No. 16 Impact of the EC Unification on Japan’s Automobile and Electronics Industries, August 1989
No. 15 Industrial and Trade Structures and the International Competitiveness of Asia’s Newly Industrializing Economies, August 1989
No. 14 The Japan Development Bank Reports on Capital Investment Spending: Survey for Fiscal Years 1988 and 1989 Conducted in February 1989, March 1989
No. 13 The Japan Development Bank Reports on Capital Spending: Survey for Fiscal Years 1987, 1988 and 1989 Conducted in August 1988, September 1988
No. 12 Growing Foreign Investors’ Activities and the Future of Internationalization, September 1988
No. 11 Futures Tasks and Prospects for the Japanese Machine-Tool Industry, July 1988
No. 10 International Division of Labor in the Machine Industries Among Japan, Asia’s NICs and ASEAN Countries, June 1988
No. 9 Trends of the Petrochemical Industry and its Marketplace in East Asia around Japan, May 1988
No. 8 The International Competitiveness of Japan and U.S. in High Technology Industries, April 1988
No. 7 The Japan Development Bank Reports on Private Fixed Investment in Japan, March 1988
No. 6 Economic Projections of the Japan’s Economy to the Year 2000, February 1988
No. 5 The Japan Development Bank Reports on Private Fixed Investment in Japan, September 1987
No. 4 Current Trends in the Japanese Auto Parts Industry in Overseas Production, July 1987
No. 3 Current Moves for Foreign Direct Investment into Japan, May 1987
No. 2 Overseas Direct Investments by Japanese Corporations, May 1987
No. 1 Current U.S. Consumption Trends, May 1987