Embed Size (px)
Citation preview
DEVELOPMENT AT U.S. AIRPORTSA Summary Look at Future Trends and Opportunities
A SPECIAL REPORT BY ACC
2 | SPECIAL REPORT: Development at U.S. Airports
1 Introduction
1.1 Foreword . . . . . . . . . . . . . . . . . . . . . . . 31.2 Acknowledgements . . . . . . . . . . . . . . . . . . 31.3 Executive Summary . . . . . . . . . . . . . . . . . . 4
2 Trends in U.S. Airport Development
2.1 Summary of Recent NPIAS Investment . . . . . . . . . . . 62.2 Change in AIP Funding Over Time . . . . . . . . . . . . . 72.3 Financing & Project Procurement . . . . . . . . . . . . . 82.4 General Trends in U.S. Airport Development . . . . . . . . 11
3 2017 – 2021 Development Projects: Large & Medium Hubs
3.1 Research Methodology . . . . . . . . . . . . . . . . 153.2 Summary of Development at Large & Medium Hubs . . . . . 193.3 Large & Medium Hub Investment Per NPIAS . . . . . . . . 21
4 2017 – 2021 Development Investment: Small Hub, Nonhub, and Nonprimary Airports
4.1 Research Methodology . . . . . . . . . . . . . . . . 234.2 Summary & Analysis of Development Investments . . . . . 24
5 Conclusions
5.1 Conclusions . . . . . . . . . . . . . . . . . . . . . 26
APPENDIX
APPENDIX A: Top 20 Major Projects . . . . . . . . . . . . . . 27
CONTENTS
DEVELOPMENT AT U.S. AIRPORTSA Summary Look at Future Trends and Opportunities
| SPECIAL REPORT: Development at U.S. Airports
1. Introduction
1.1 Foreword
The airport development environment in the United States is as dynamic as
ever. ACC endeavored to develop a summary report to capture key trends
in airport development in the U.S., and opportunities and implications for
companies involved in all facets of airport development.
This report provides the industry important, high-level trends in future
airport development, including funding, types of projects, required
services, and procurement methods that will be utilized by airport owners/
operators. Readers may find the comprehensive list of anticipated capital
projects at over 50 large- and medium-hub airports that accompanies
this report particularly valuable. It is available on the ACC website at
www.ACConline.org.
ACC seeks feedback on the report and more importantly, what enhance-
ments could be made in future editions. ACC is interested in what specific
data companies would find useful. Please go to this survey and provide
your input.
1.2 Acknowledgements
ACC would like to acknowledge the following individuals who helped
contribute to this report.
Report Authors – Arup USA, Inc.:• Mark Ahasic, IATA AvMP, Associate, Aviation • Matthew Sheren, AICP, Planner• Eglantin Dashi, Graduate Aviation Planner
Airport Sponsor Contributors:• Geoffrey Neumayr, Chief Development Officer, San Francisco (SFO)• Jack Christine, Chief Operating Officer, Charlotte (CLT)• Mark Day, Director of Engineering and Maintenance, Lexington, KY (LEX)• Mark Duebner, Director of Aviation, Dallas Love Field (DAL)• Rhonda Hamm-Niebruegge, Director, St. Louis (STL)• Richard Smyth, Project Executive, LaGuardia (LGA) Redevelopment Program• Sam Sleiman, Director of Capital Programs, Massport
3
4 | SPECIAL REPORT: Development at U.S. Airports
ACC Review Team:• Carol Lurie, LEED AP, ENV SP, AICP - VHB• Roddy Boggus, NCARB, AIA – Suffolk• Benjamin DeCosta – DeCosta Consulting, LLC• Kevin Dolliole – Unison Consulting• David Kipp, PE – Burns Engineering, Inc.• Larry Studdiford, PMP – Studdiford Technical Solutions, LLC• Zach Varwig – The Faith Group
1.3 Executive Summary
This report is intended to inform the airport industry of trends in airport
capital investment across the entire spectrum of U.S. airports, from large
global-scale hubs to the smallest of General Aviation (GA) airports. Based
on research of U.S. airport capital development projects over the next half
decade to 2022, it highlights trends in types of projects, likely procurement
models and funding, and associated consulting services required by
airports. In addition, it examines the shift in airport development investment
compared to that over the past five years. Priorities by project category are
highlighted, along with a summary of the largest development projects
expected over the next five years. The report’s objective is to provide a
concise source of future projects and anticipated capital expenditures.
| SPECIAL REPORT: Development at U.S. Airports
1) Greatest investment will be in terminals: new, expanded,
and renovated, with the primary objective being capacity
enhancement.
2) Airfield pavement projects are ubiquitous but don’t represent
the largest investment category. Most are rehabilitative in
nature, with few new runway projects planned.
3) 2017 – 2021 National Plan of Integrated Airport Systems
(NPIAS) includes an identified investment need of $32.5
billion in projects eligible for federal funding. A new national
initiative to improve nonstandard airfield geometry is
beginning and should increase development costs in the next
NPIAS report.
4) Design-Build and Construction Manager at Risk models are
gaining interest by airport sponsors where available.
5) Public Private Partnerships (P3) for components of U.S.
airports continue to increase in frequency, while airport-wide
P3s continue to be rare.
6) Airports, airlines and Federal agencies are increasing the use
of technology to enhance passenger facilitation.
7) Consolidated Rent-A-Car (CONRAC) facilities are becoming
more common, popular and substantial in nature.
8) Investments in the passenger experience are a way for
airports to increase passenger spend.
9) Transportation Network Companies (TNC) are noticeably
evolving landside behavior, demand and challenges.
10) Projects at GA airports tend towards upgrades of existing
facilities and State of Good Repair (SOGR) initiatives.
“Top 10” Headlines
5
6 | SPECIAL REPORT: Development at U.S. Airports
2. Trends in U.S. Airport Development
2.1 Summary of Recent NPIAS Investment
Every two years, the Federal Aviation Administration (FAA) publishes a report
outlining its estimates of the amount of Federal Airport Improvement Program
(AIP) investment required to fund infrastructure development at 3,000+ airports
identified in the National Plan of Integrated Airport Systems (NPIAS).1 The
estimated development investment needs are intended to upgrade airports to
current design standards and to enhance capacity over the next five years. An
important note that the NPIAS identifies only AIP-eligible projects and excludes
projects that are privately-funded or funded with Passenger Facility Charges
(PFCs). It also does not necessarily equate to actual spending. The authors
analyzed the current NPIAS report (covering the years 2017-2021), using it as a
consistent proxy for expected U.S. airport development investment during the
next half decade. A summary of system-wide NPIAS investment is below.
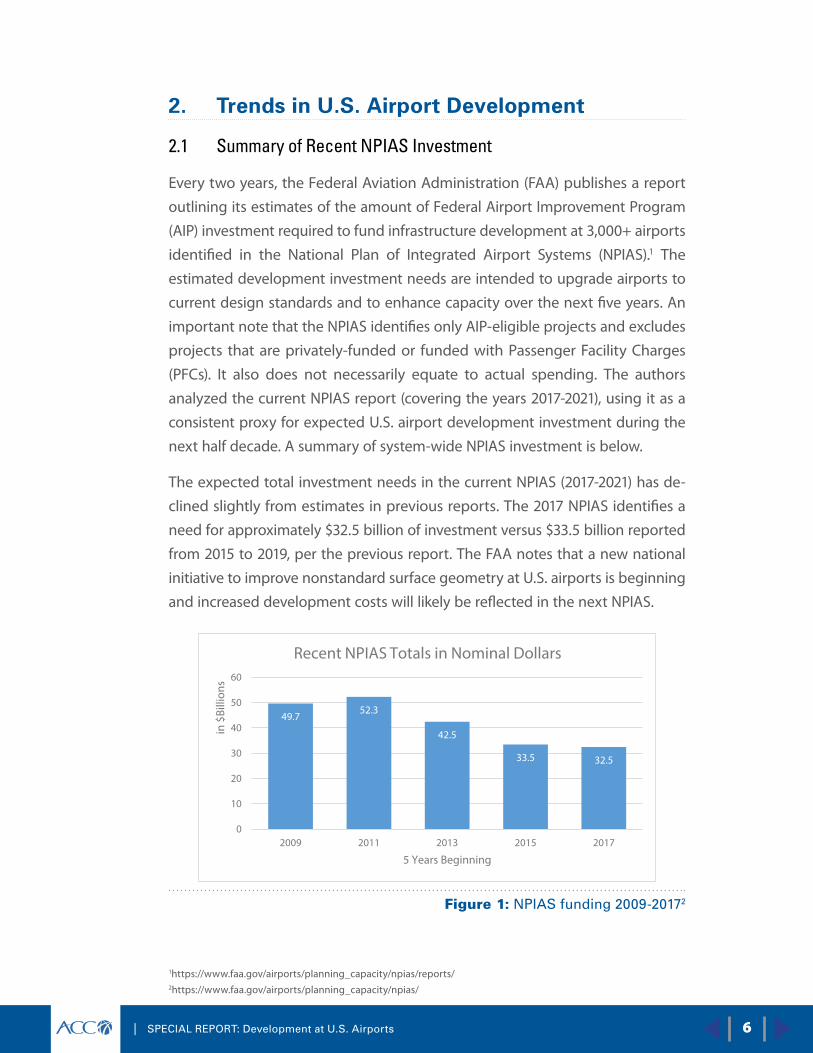
The expected total investment needs in the current NPIAS (2017-2021) has de-
clined slightly from estimates in previous reports. The 2017 NPIAS identifies a
need for approximately $32.5 billion of investment versus $33.5 billion reported
from 2015 to 2019, per the previous report. The FAA notes that a new national
initiative to improve nonstandard surface geometry at U.S. airports is beginning
and increased development costs will likely be reflected in the next NPIAS.
49.752.3
42.5
33.5 32.5
0
10
20
30
40
50
60
2009 2011 2015 2017
in $
Billi
ons
2013
5 Years Beginning
Recent NPIAS Totals in Nominal Dollars
Figure 1: NPIAS funding 2009-20172
1https://www.faa.gov/airports/planning_capacity/npias/reports/2https://www.faa.gov/airports/planning_capacity/npias/

| SPECIAL REPORT: Development at U.S. Airports
2.2 Change in AIP Funding Over Time
From 2005 to 2011, AIP projects fell into four main categories: reconstruction,
standards, capacity, and terminal. In the 2013 NPIAS report, terminal
projects ceased being a major category, and the 2015 NPIAS reported
that capacity projects had a deep decline. Today, only reconstruction and
compliance with FAA standards are major categories, combining for 64
percent of projects between them.
The current NPIAS report (2017-2021) shows that reconstruction and
standards both have slight increases compared to 2015. Capacity is now
less than half of its 2013 peak, while terminal is only a third of its 2009 peak.
These declines stem from the completion of specific major projects.
Overall, smaller airports have a larger share of Federal funding needs
compared to their overall place in the national aviation system. Small and
Non-hub airports have 13 percent of enplanements, but 49 percent of
funding. Similarly, the 30 Large Hubs have 72 percent of enplanements, but
only 35 percent of funding. This is expected, given the greater importance
of AIP grants for smaller airports. There is also an element of “overhead”
in airport funding, as Large Hubs have identified needs of $12.35 per
enplanement, Medium Hubs are $26.62, and Small Hubs, $64.11.
There are few notable outliers in terms of project distribution over the
airport categories. For example, standards spending is weighted towards
Non-primary airports by a 60/40 split, and Large Hubs take up two-thirds
of capacity spending. Relative to their share of enplanements, capacity and
noise projects are the largest needs at Large Hubs, while reconstruction is
prevalent at Medium Hubs.
At Nonprimary airports, categories generally track with regard to funding
versus Air Traffic Movements (ATMs). Reconstruction and standards projects
make up 87 percent of spending. Relative to their share of ATMs, noise,
safety, and security projects are over-represented at National airports,
while environmental and terminal projects lag behind. At local and basic
airports, terminal and security projects are overrepresented, while noise
projects lag far behind.
7
8 | SPECIAL REPORT: Development at U.S. Airports
2.3 Financing & Project Procurement
While innovative methods of financing are growing more popular across
the infrastructure industry, the flat-lined levels of funding provided by
Congress on a yearly basis require many airports to undertake sophisti-
cated financing and project delivery vehicles when upfront capital needs
far outpace available revenue streams.
2.3.1 Financing for Airport Development
Each year, airports receive funding through AIP grants and revenues from
PFC user fees. In FY16, combined AIP and PFC authority was approximately
$6.5 billion.
FAA reauthorization proposals introduced in the House and Senate in
2016 contained increases to AIP from the current annual $3.35 billion
level. There may be a chance that the AIP increases (up to $3.75 billion
proposed by the Senate in 2016, and an incremental increase to $3.99
billion proposed in the House) could be included in the new FAA
reauthorization bills to be considered in 2017.
While a previous push to increase the PFC from the current $4.50 cap
failed in Congress last year, proponents such as ACC, Airports Council
International-North America, American Association of Airport Executives,
and other stakeholders will lobby Capitol Hill to reconsider this in the
upcoming session, though airlines are generally opposed to any increase.
Without PFC increases, additional financing for some airports will come
from the bond market, which could raise borrowing costs, potentially
impacting overall bond ratings, and possibly increase costs to the airlines.
Under the bond financing model, PFCs are often used to pay the debt
service on the bonds. A number of airports have fully obligated their PFC
entitlements for this purpose, some for years to come. It should also be
noted that not all airports are able to access the bond market to finance
projects.
The prevalence of private sector investment in U.S. airport development
continues to lag that in other regions of the world, but it is starting to
gain traction through Public-Private Partnerships (PPP or P3). Such private
sector involved projects are typically only desirable where there is a
...flat-lined levels of
funding provided by
Congress on a yearly
basis require many
airports to undertake
sophisticated
financing and project
delivery vehicles
| SPECIAL REPORT: Development at U.S. Airports
specific and predictable revenue stream attached, such as lease agreements
in terminals. P3s are only widely authorized in 10 states (and the airport-less
District of Columbia) at the moment, though certain governance structures
can overcome these limitations. A prime example is the nearly 20-year-old
P3 for JFK T4 (developed and managed by Schiphol USA), and the ongoing
the Central Terminal Building replacement at LaGuardia. New York does
not permit P3s, but the independent, bi-state Port Authority of New York
& New Jersey is not subject to this restriction.
There has been limited acceptance of airport-wide P3s at some U.S. airports
in recent years, though there is still some resistance from operators who
are leery of involving private developers whose interests may not be
in alignment with those of a publicly-owned and operated airport. The
revenue demands of P3s may also result in higher costs for tenants that are
then passed along to passengers and customers. The FAA’s Airport Pilot
Privatization Program has resulted in an airport-wide P3 at Luis Muñoz
Marín International Airport in San Juan, Puerto Rico; however the only
Large Hub to begin the process, Chicago-Midway, ceased the process after
all but one bidder dropped out. There are two applications in process at
Westchester County Airport, New York and Hendry County Airglades in
Florida. Outside the pilot program, there have been (or will soon be) a
number of facility-specific P3s at Austin (South Terminal), Orlando-Sanford,
Denver (DEN) (Great Hall), and for components of the LAX Landside Access
Modernization Program (LAMP). In addition, San Diego has announced a
P3 for Terminal 1 to occur starting in 2017.
The U.S. airport P3 market is affected by the ability of airlines to finance
tax-exempt and other debt for terminal developments through the
airports where they hold a long-term lease on a terminal. Under current
models of collaborative terminal development, airline-led initiatives can be
considered as a “Soft” P3, with an airline funding and managing a project,
with the contribution and support from the hosting airport authority.
Airline investment in terminals is expected to continue to be a significant
component of the U.S. P3 market, complementary to other forms of private
investment.
Air cargo facility long-term leases have also been privately financed and
can be considered forms of P3s. Another variety of P3 includes long-term
The prevalence
of private sector
investment in
U.S. airport
development
continues to
lag that in other
regions of the
world, but it is
starting to gain
traction
9
10 | SPECIAL REPORT: Development at U.S. Airports
management contracts where airports or terminals are managed by private
operators (such as AvPorts), under agreement with an airport authority.
These tend to be limited to smaller air carrier or general aviation airports.
Given recent P3 initiatives, it is likely that facility-specific P3s will increase in
popularity and frequency. Consultants have much to offer airports during
P3 projects, as some have the experience of being involved in multiple P3
projects, whereas it is likely that an airport’s management team has limited
or no experience.
At smaller airports, State economic development and other funding may
be an alternative means of finance, though this requires airport authorities
and their consultants to make a strong case for the benefits of individual
projects.
2.3.2 Project Procurement Models
Traditional Design-Bid-Build (DBB) models are still being used by airports
to procure development projects, but are starting to lose popularity
according to airport leaders who were interviewed as part of the research
effort. DBB continues to be utilized for smaller, less complex, and often
airport-designed projects. For larger and more complex projects, airports
are increasingly using Design-Build (DB) and Construction Manager at Risk
(CM at Risk) to expedite schedules, reduce the risk to the airport, and to
provide a better project at a lower cost.
Design-build projects engage a team consisting of a design firm and a
general contractor and feature the owner interacting with both the design
and construction segments of a project through a single contract and
a single point of contact. Though the DB model has been increasing in
prevalence, the varying levels of state adoption of DB has limited their
widespread adoption for airport projects. Although only 16 states still have
strict limits on DB transportation projects3, the relative unfamiliarity with
the process even in authorized states has slowed its uptake.
The more common CM at Risk model has many of the benefits of DB,
especially with regard to having known and fixed construction costs during
design, though changes to the design are very expensive once works have
started. CM at Risk keeps the owner at the table, and is generally accepted
under every jurisdiction’s regulations.
3http://www.dbia.org/advocacy/state/Documents/design_build_maps.pdf
| SPECIAL REPORT: Development at U.S. Airports
San-Francisco (SFO) is pioneering an innovative variation of the DB model
known as Progressive Design-Build, which they are using to procure
two-thirds of its upcoming $6 billion Capital Improvement Plan. PDB
aims to improve project delivery by bringing stakeholders together at
the beginning of the process to jointly agree on programming once the
DB team has been selected, but before a final price and schedule has
been agreed. The process also includes a 3D Virtual Design Construction
Model to help align stakeholder expectations and fora for collaboration
throughout.
2.4 General Trends in U.S. Airport Development
R U N WAYS & S A F E T Y
The Congressionally-mandated Runway Safety Area (RSA) program
had a deadline of December 31, 2015, and most airports are now either
in compliance or are in the final stages of construction. With the RSA
improvement push having been completed, the next identified Federal
airport safety initiative is known as Runway Incursion Mitigation (RIM). This
will entail reconfiguring non-standard geometries in runway and taxiway
networks in order to improve safety. The specific projects that will comprise
RIM have not yet been chosen, and will begin to appear in the 2019 NPIAS.
Consultants should be aware of airports’ upcoming RIM airfield projects, as
studies and projects are already underway.
With the exception of previously announced projects, new runway
construction is not expected to be a major project driver. Seventeen of
the 30 Large Hubs have added runways in the last 20 years, and among
those which have not, most airports face physical constraints that would
prohibit this type of major construction. Airport authorities still have in
recent memory new runway construction projects at airports that were
de-hubbed by their dominant carrier shortly after the completion of the
runway, such as Saint Louis (STL). Given this, many airports with the ability
to construct new runways are being patient and content to wait for the
capacity upgrades brought by NextGen technology before embarking on
a new round of pavement expansion. The system-wide nature and Federal
control of NextGen is not reflected in per-airport spending trends.
Consultants
should be aware
of airports’
upcoming
RIM airfield
projects.
11
12 | SPECIAL REPORT: Development at U.S. Airports
PA S S E N G E R FAC I L I TAT I O N
There are a number of innovation trends involving airports and
passenger facilitation. The most prominent is a continued increase in
global demand, with total passengers potentially doubling by 2030.
In order to meet this demand, airports cannot build their way out of
congestion, but must find ways to use existing infrastructure more
efficiently. To do this, airports will need to realign two of the major
processors located in terminals – baggage and security screening.
By screening for intent, the physical space devoted to traditional
hands-on security can be greatly reduced, and by taking advantage of
innovations in autonomous mobility, baggage can be decoupled from
the passenger journey. Terminal designers and developers should be
aware of these trends to future-proof any major renovations or new
construction that will result in terminal lifecycles stretching into this
zone of innovation.
Within terminals themselves, there is renewed emphasis on enhancing
the passenger experience, which is not always synonymous with
new-build facilities. As existing facilities age and begin to require
rehabilitation and SOGR needs, airports and their tenants can take the
opportunity to add amenities and improve measures of sustainability
and resiliency. A terminal rehabilitation is also an opportunity to
refocus the building around operations and allow airports to spend
less to realize greater efficiency. By flipping the standard process of
terminal design to an “inside-out” model, focusing on remodeled
concourses with high-quality passenger amenities rather than
distinctive architecture, an airport can achieve the positive effect of
increased passenger spend and airport revenue.
C H A N G E S I N F L E E T M I X
The advent of efficient and lower cost widebodies such as the Boeing
787 and the Airbus A350 have opened new international routes to
the tier of larger airports that have not previously had significant
nonstop intercontinental connectivity, such as Boston, San Diego, Fort
Lauderdale, or Oakland. The coming introduction of long-range narrow
bodied aircraft such as the 737 MAX and the A320neo families will
push this international route development and provide opportunities
In order to meet this
demand, airports
cannot build their way
out of congestion,
but must find ways
to use existing
infrastructure more
efficiently
| SPECIAL REPORT: Development at U.S. Airports
for airlines to serve transatlantic routes from secondary airports. For
example, Norwegian Air International (NAI) is planning transatlantic 737
MAX service from Providence, RI and from Stewart Airport near New York.
This will require traditionally-domestic airports to upgrade terminals to
include FIS and other facilities required to support international service.
Aircraft Design Group VI (Airbus A380 and Boeing 747-8) airfield and gate
modifications and upgrades are largely finished, with the exception of
Boston-Logan, which is wrapping up its upgrades as part of an overall
expansion of international capability over the past 5 years. Orders for new
A380s and 747-8s have stagnated and there is unlikely to be significant
new demand for Group VI aircraft to serve destinations where they are not
already present.
T R A N S P O R TAT I O N N E T WO R K CO M PA N I E S ( T N C )
The sudden rise of TNC such as Uber and Lyft has created drastic shifts in
mode share in only a few years, changing the volumes and characteristics
of the vehicles placing demand on roadways and terminal curbs. This will
cause many commercial airports to examine their landside operations with
an eye towards re-accommodating and optimizing their space allocations.
Airport leaders see this shift as presenting an opportunity for TNC consult-
ing and for ground access planning activities.
2.4.1 General Aviation
While construction continues apace at large commercial airports, the
picture is not as optimistic for GA.
The number of certificated pilots continues to decline, despite recent
innovations like the Light Sport Aircraft category and the upcoming reforms
to Third Class (non-commercial) Medicals. The number of commercial-
rated (CPL/ATP) pilots is remaining steady, which means nearly all of this
decline is in the private pilot (PPL) ranks. This trend is also seen in new
student certificates issued, which has declined by 22 percent from 2006 to
2015. While some large GA airports, such as those in Florida and Arizona,
retain a brisk business in flight instruction, many of these students come
from overseas and never exercise their FAA license privileges in the United
States once training is complete.
13
14 | SPECIAL REPORT: Development at U.S. Airports
The GA fleet continues to shrink, though jet aircraft are gaining in popularity.
Compared to 1980, the piston fleet is down 28 percent as of 2014, while
business jets have quadrupled, portending a greater concentration of
GA activity in the National and Regional categories, which serve more
important cities and with better facilities. While Large Hubs will exist in
cities that are big enough to have dedicated general aviation relievers,
many business jet trips will involve the other categories of primary airports,
and attracting GA will be a part of the business plans for those operators.
Despite the increase in jets, total hours flown by GA are roughly half of
their 1980 levels, and the average single-engine piston is now almost 45
years old. It is likely the piston fleet will shrink even further as the 2020
ADS-B mandate draws near and 100LL avgas continues to become scarcer
and more expensive.
In addition to the decline in pilots, fleet size, and hours flown, GA airports
around the country continue to be subject to outside pressures such as
land development that may hinder airport operations or expansion, or in
some cases result in closures entirely.
| SPECIAL REPORT: Development at U.S. Airports
3 2017 – 2021 Development Projects: Large & Medium Hubs3.1 Research Methodology
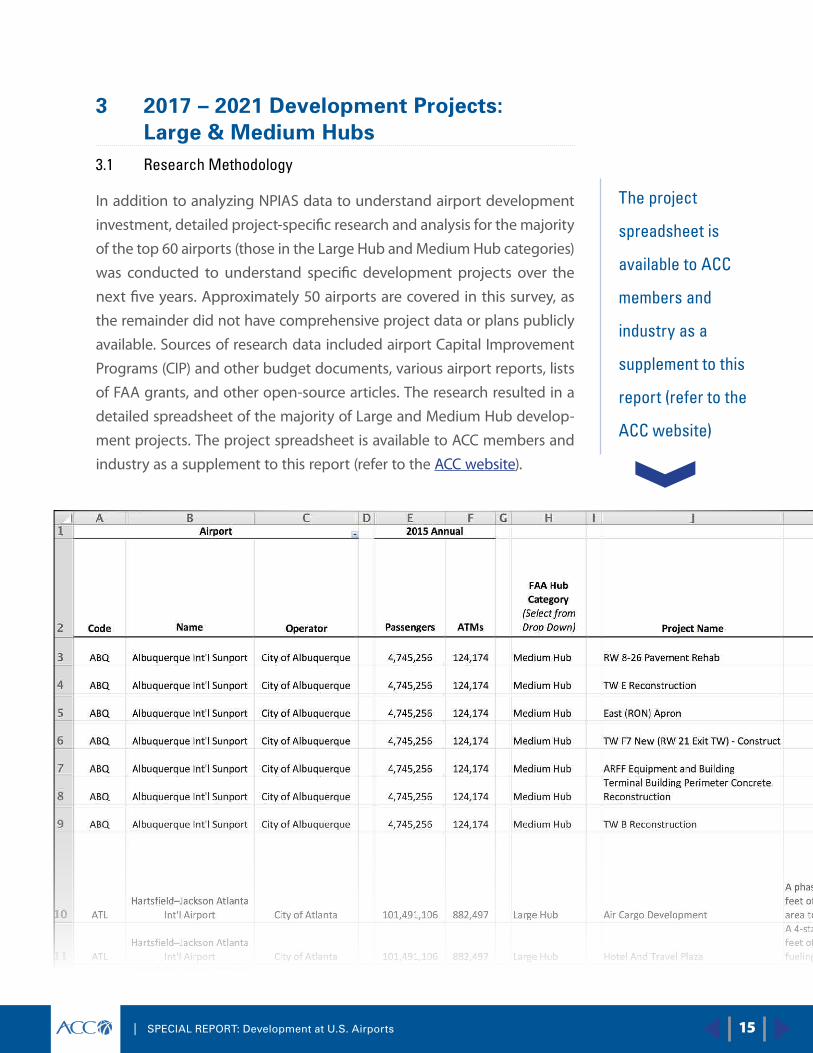
In addition to analyzing NPIAS data to understand airport development
investment, detailed project-specific research and analysis for the majority
of the top 60 airports (those in the Large Hub and Medium Hub categories)
was conducted to understand specific development projects over the
next five years. Approximately 50 airports are covered in this survey, as
the remainder did not have comprehensive project data or plans publicly
available. Sources of research data included airport Capital Improvement
Programs (CIP) and other budget documents, various airport reports, lists
of FAA grants, and other open-source articles. The research resulted in a
detailed spreadsheet of the majority of Large and Medium Hub develop-
ment projects. The project spreadsheet is available to ACC members and
industry as a supplement to this report (refer to the ACC website).
The project
spreadsheet is
available to ACC
members and
industry as a
supplement to this
report (refer to the
ACC website)
15
16 | SPECIAL REPORT: Development at U.S. Airports
The findings are summarized below with a focus on understanding the
leading project types, the most common motivators of projects, and a
description of the categories of consulting services likely to be needed
by airports to accomplish these projects. Each project was classified in
terms of project category, motivator and types of consulting services
required in order to perform this analysis.
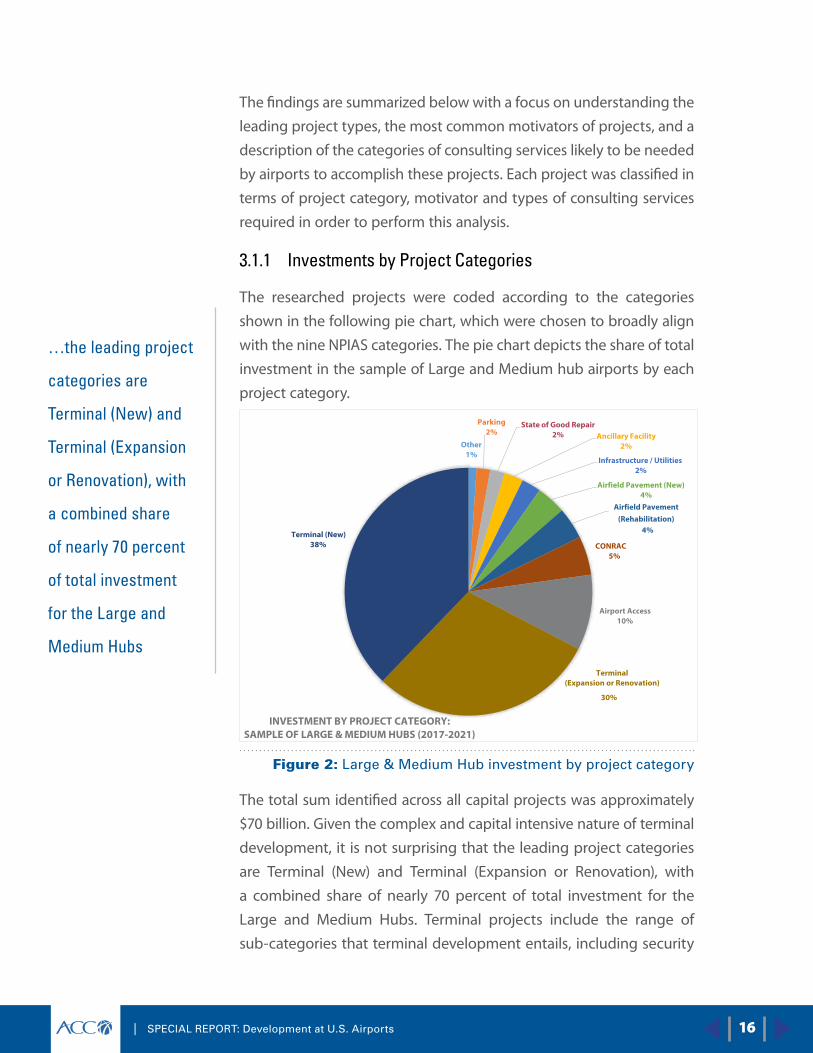
3.1.1 Investments by Project Categories
The researched projects were coded according to the categories
shown in the following pie chart, which were chosen to broadly align
with the nine NPIAS categories. The pie chart depicts the share of total
investment in the sample of Large and Medium hub airports by each
project category.
Other1%
Parking2%
State of Good Repair2% Ancillary Facility
2%
Infrastructure / Utilities2%
Airfield Pavement (New)4%
Airfield Pavement (Rehabilitation)
4%
CONRAC5%
Airport Access10%
Terminal (Expansion or Renovation)
30%
Terminal (New)38%
INVESTMENT BY PROJECT CATEGORY: SAMPLE OF LARGE & MEDIUM HUBS (2017-2021)
Figure 2: Large & Medium Hub investment by project category
The total sum identified across all capital projects was approximately
$70 billion. Given the complex and capital intensive nature of terminal
development, it is not surprising that the leading project categories
are Terminal (New) and Terminal (Expansion or Renovation), with
a combined share of nearly 70 percent of total investment for the
Large and Medium Hubs. Terminal projects include the range of
sub-categories that terminal development entails, including security
…the leading project
categories are
Terminal (New) and
Terminal (Expansion
or Renovation), with
a combined share
of nearly 70 percent
of total investment
for the Large and
Medium Hubs
| SPECIAL REPORT: Development at U.S. Airports
screening and related projects. While stand-alone security initiatives
appear to make up only a small amount of overall spending, the security-
related components of new or redeveloped terminal projects are counted
within these top two categories. The terminal category also includes the
technological innovation and passenger experience programs that are
inherent in construction or renovation, but are not broken out separately.
Multi-billion new terminal projects are underway or planned at LaGuardia
(LGA) ($8.5b), Salt Lake City (SLC) ($2.9b), SFO ($2.4b), Newark (EWR)
($2.3b) and San Diego (SAN) ($2.3b), with similarly significant renovations/
expansions planned at Los Angeles (LAX), Atlanta (ATL), Portland (PDX) and
elsewhere. Airport Access projects make up a tenth of the total investment
of the sample (#3 of the categories), led by the $2.7b Automated People
Mover (APM) and associated projects planned for LAX. CONRAC facilities
make up 5 percent of the total investment of the sample, as such facilities
are becoming as sophisticated as airport terminal projects. LAX is planning
a $1b CONRAC, with the City of Chicago planning to invest nearly $800m
in one at ORD.
As expected, the research indicated that airfield pavement projects are
underway consistently across the airports of the sample. While abundant,
these less complicated projects tend to require less total investment,
which is why they only reflect an 8 percent share, split evenly between
new pavement and rehabilitation.
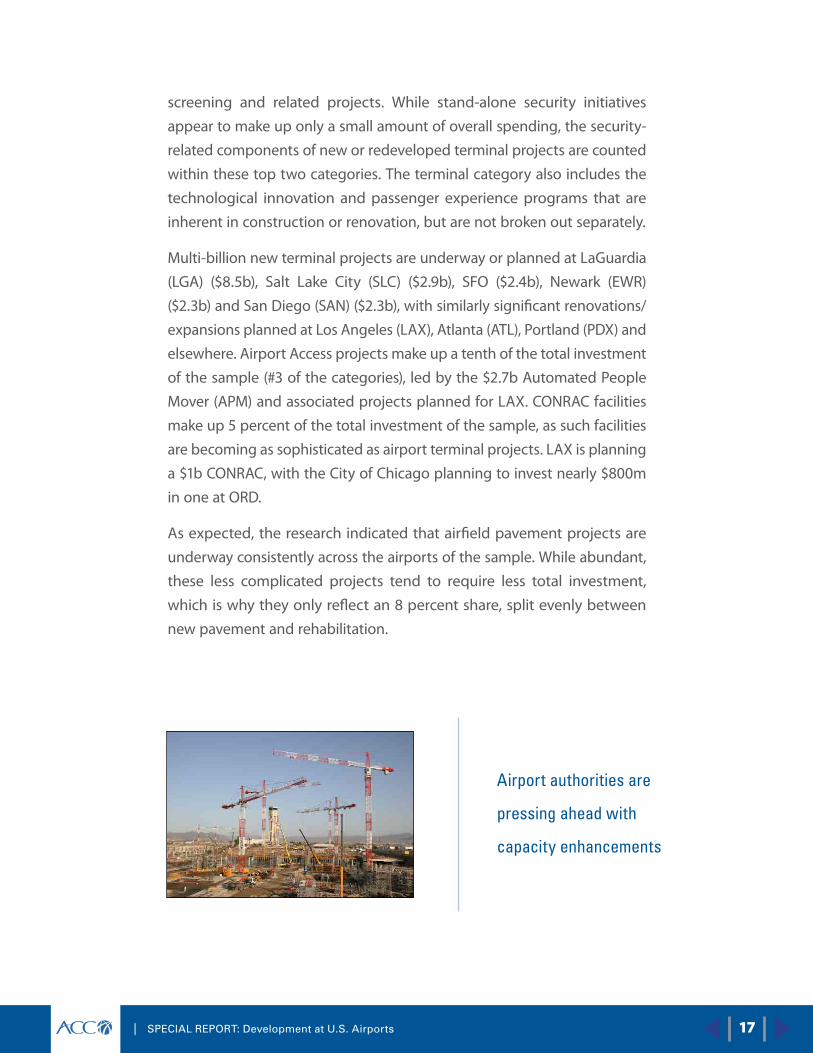
Airport authorities are
pressing ahead with
capacity enhancements
17
18 | SPECIAL REPORT: Development at U.S. Airports
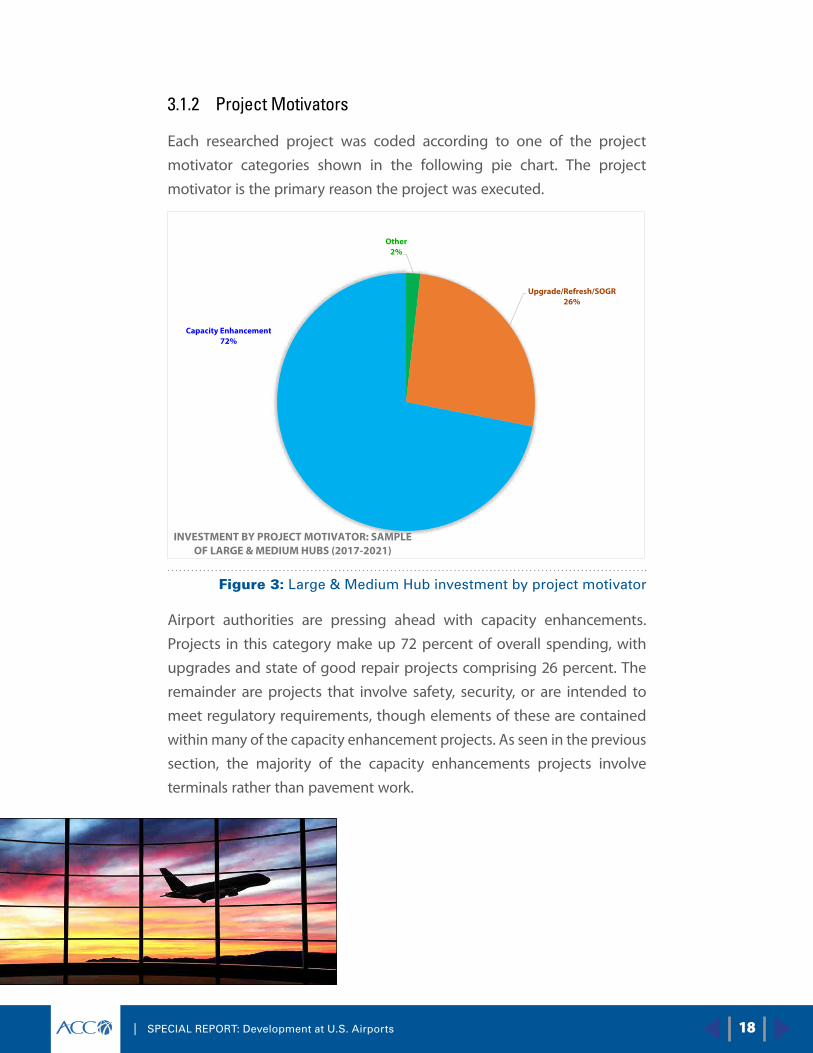
3.1.2 Project Motivators
Each researched project was coded according to one of the project
motivator categories shown in the following pie chart. The project
motivator is the primary reason the project was executed.
Other2%
Upgrade/Refresh/SOGR26%
Capacity Enhancement72%
INVESTMENT BY PROJECT MOTIVATOR: SAMPLE OF LARGE & MEDIUM HUBS (2017-2021)
Figure 3: Large & Medium Hub investment by project motivator
Airport authorities are pressing ahead with capacity enhancements.
Projects in this category make up 72 percent of overall spending, with
upgrades and state of good repair projects comprising 26 percent. The
remainder are projects that involve safety, security, or are intended to
meet regulatory requirements, though elements of these are contained
within many of the capacity enhancement projects. As seen in the previous
section, the majority of the capacity enhancements projects involve
terminals rather than pavement work.
| SPECIAL REPORT: Development at U.S. Airports
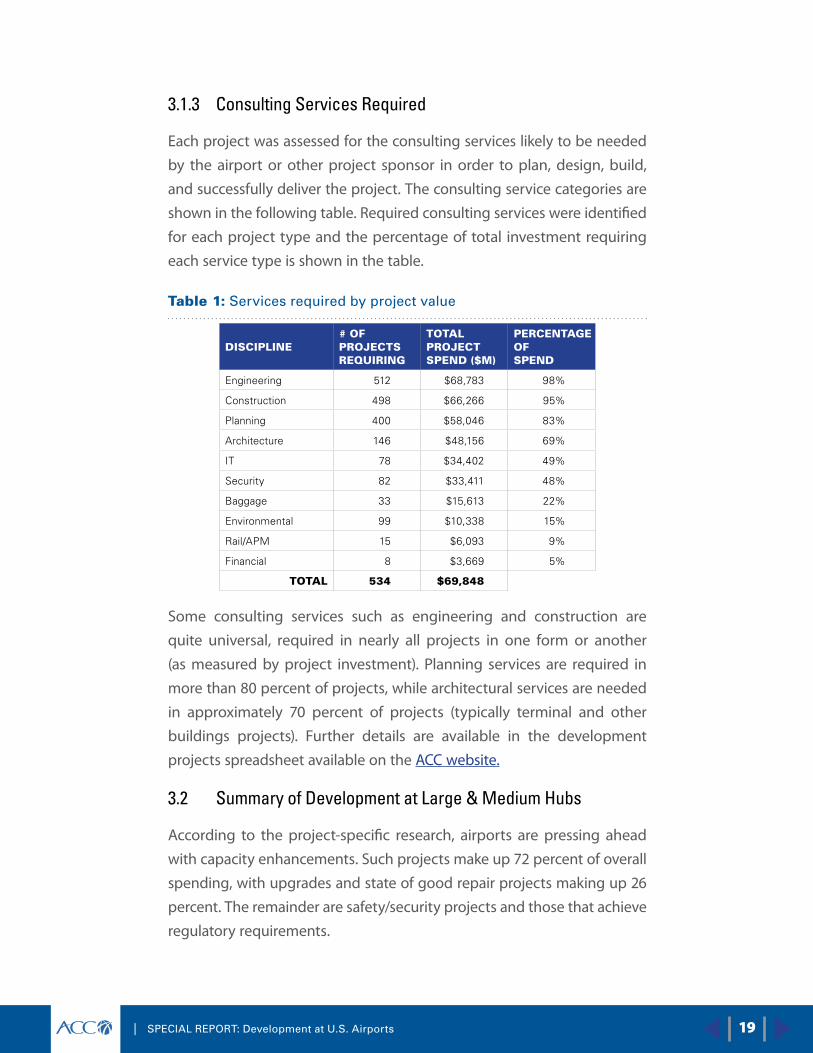
3.1.3 Consulting Services Required
Each project was assessed for the consulting services likely to be needed
by the airport or other project sponsor in order to plan, design, build,
and successfully deliver the project. The consulting service categories are
shown in the following table. Required consulting services were identified
for each project type and the percentage of total investment requiring
each service type is shown in the table.
Table 1: Services required by project value
DISCIPLINE# OF PROJECTS REQUIRING
TOTAL PROJECT SPEND ($M)
PERCENTAGE OF SPEND
Engineering 512 $68,783 98%
Construction 498 $66,266 95%
Planning 400 $58,046 83%
Architecture 146 $48,156 69%
IT 78 $34,402 49%
Security 82 $33,411 48%
Baggage 33 $15,613 22%
Environmental 99 $10,338 15%
Rail/APM 15 $6,093 9%
Financial 8 $3,669 5%
TOTAL 534 $69,848
Some consulting services such as engineering and construction are
quite universal, required in nearly all projects in one form or another
(as measured by project investment). Planning services are required in
more than 80 percent of projects, while architectural services are needed
in approximately 70 percent of projects (typically terminal and other
buildings projects). Further details are available in the development
projects spreadsheet available on the ACC website.
3.2 Summary of Development at Large & Medium Hubs
According to the project-specific research, airports are pressing ahead
with capacity enhancements. Such projects make up 72 percent of overall
spending, with upgrades and state of good repair projects making up 26
percent. The remainder are safety/security projects and those that achieve
regulatory requirements.
19
20 | SPECIAL REPORT: Development at U.S. Airports
Capacity enhancements are dominated by terminal construction. Major
terminal projects are underway or planned at Columbus (CMH), EWR,
Houston (IAH), LAX, LGA, New Orleans (MSY), Orlando (MCO), Philadelphia
(PHL), San Antonio (SAT), SFO, and SLC.
These terminal projects make up two-thirds of all spending at Large and
Medium Hub Airports, with an estimated total expenditure of $47 billion
out of the roughly $70 billion in overall projects in the sample. Spending
on new terminals slightly outpaces that of renovations, $26.4 billion to
$20.6 billion.
The final new runway of the ORD Modernization Program has been
approved and is in design, and Charlotte (CLT) is currently in the
Environmental Impact Statement (EIS) process for a planned fourth parallel
runway. Among other high-profile recent runway proposals, the planned
new runway at PHL is currently on hold, and there is no firm commitment
or timeline for the next runway approved and included in DEN’s master
plan.
Airfield pavement projects make up $5.6 billion, or 8 percent of total
expenditures. These are split roughly equally between new pavement and
rehabilitation of existing installations.
Airport access projects are a strong segment of spending, at $6.8 billion,
or almost 10 percent of the total. This is driven by the $4.1 billion LAMP
project at LAX, which includes an APM, an intermodal transport facility,
and roadway improvements. Other notable APM projects are found at ATL,
MCO, Phoenix (PHX), SFO, and Tampa (TPA). Significant roadway projects
are expected at BOS, CLT, Ft. Lauderdale (FLL), and PDX.
CONRAC facilities make up $3.5 billion, or 5 percent of expected
expenditures. The largest of these is at LAX, with Hartford (BDL), Maui
(OGG), Minneapolis-St. Paul (MSP), ORD, PDX, and TPA all above $250
million each.
| SPECIAL REPORT: Development at U.S. Airports
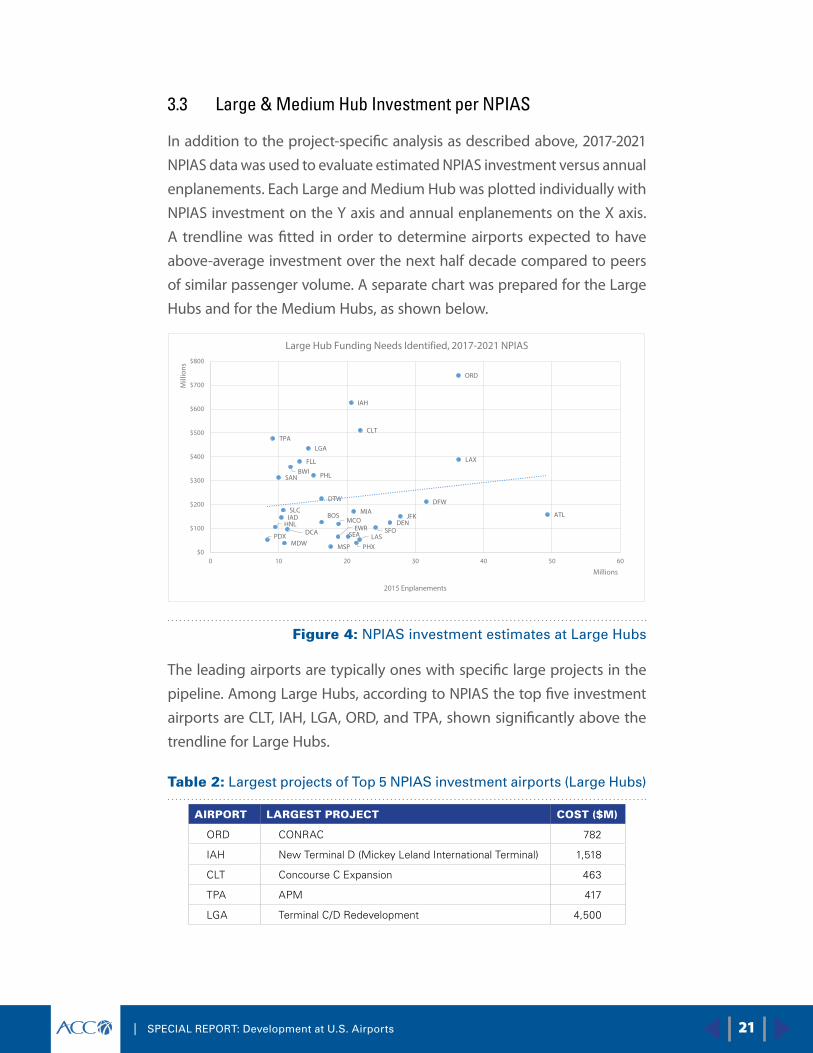
3.3 Large & Medium Hub Investment per NPIAS
In addition to the project-specific analysis as described above, 2017-2021
NPIAS data was used to evaluate estimated NPIAS investment versus annual
enplanements. Each Large and Medium Hub was plotted individually with
NPIAS investment on the Y axis and annual enplanements on the X axis.
A trendline was fitted in order to determine airports expected to have
above-average investment over the next half decade compared to peers
of similar passenger volume. A separate chart was prepared for the Large
Hubs and for the Medium Hubs, as shown below.
PHX
LAX
SAN
SFODEN
DCA
IAD
FLL
MIAMCO
TPA
ATLHNL
MDW
ORD
BOS
BWI
DTW
MSP
CLT
EWRLAS
JFK
LGA
PDX
PHL
DFW
IAH
SLC
SEA
$0
$100
$200
$300
$400
$500
$600
$700
$800
0 10 20 30 40 50 60
Mill
ions
2015 Enplanements
Millions
Large Hub Funding Needs Identified, 2017-2021 NPIAS
Figure 4: NPIAS investment estimates at Large Hubs
The leading airports are typically ones with specific large projects in the
pipeline. Among Large Hubs, according to NPIAS the top five investment
airports are CLT, IAH, LGA, ORD, and TPA, shown significantly above the
trendline for Large Hubs.
Table 2: Largest projects of Top 5 NPIAS investment airports (Large Hubs)
AIRPORT LARGEST PROJECT COST ($M)
ORD CONRAC 782
IAH New Terminal D (Mickey Leland International Terminal) 1,518
CLT Concourse C Expansion 463
TPA APM 417
LGA Terminal C/D Redevelopment 4,500
21
22 | SPECIAL REPORT: Development at U.S. Airports
ANC
BUR
OAK
ONT
SMF
SJC
SNA
BDLRSW
JAX PBI
OGG IND
CVG
MSY
MCI
STL
RDU
OMA
ABQ
BUF
CLE
CMH
PIT
SJU
BNA
AUS
DAL
HOU
SAT
MKE
$0
$50
$100
$150
$200
$250
$300
$350
0 1 2 3 4 5 6 7 8
Mill
ions
2015 Enplanements
Millions
Medium Hub Funding Needs Identified, 2017-2021 NPIAS
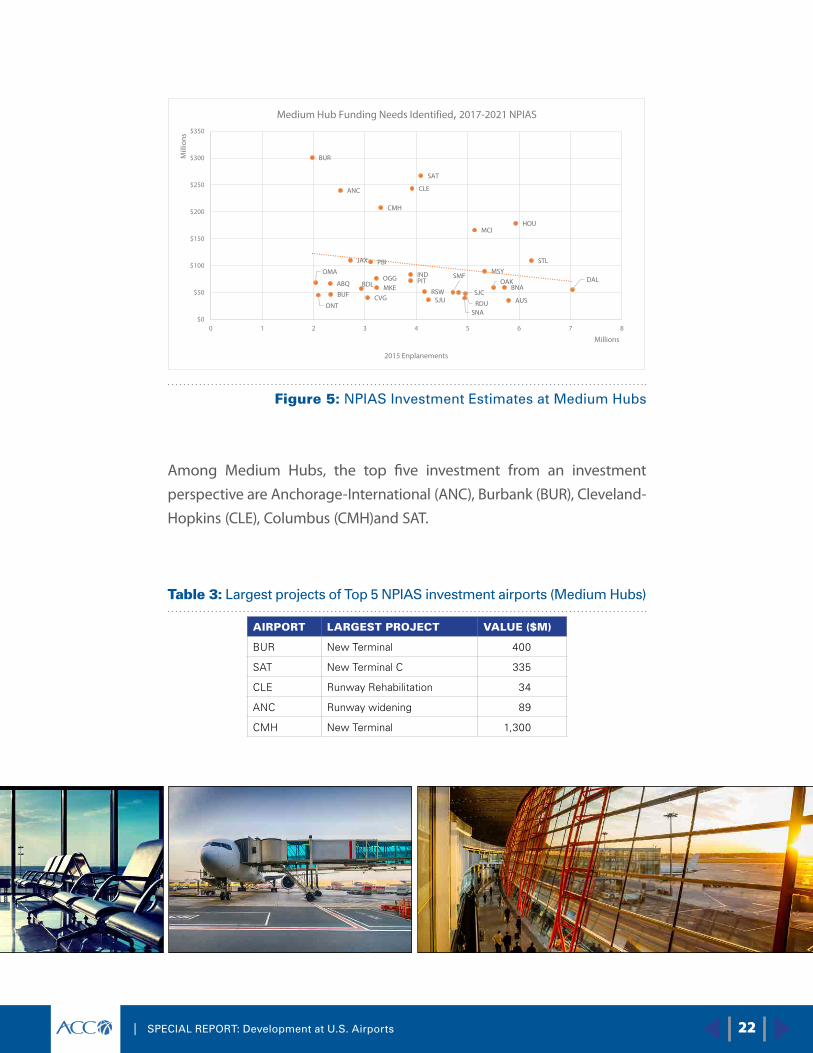
Figure 5: NPIAS Investment Estimates at Medium Hubs
Among Medium Hubs, the top five investment from an investment
perspective are Anchorage-International (ANC), Burbank (BUR), Cleveland-
Hopkins (CLE), Columbus (CMH)and SAT.
Table 3: Largest projects of Top 5 NPIAS investment airports (Medium Hubs)
AIRPORT LARGEST PROJECT VALUE ($M)
BUR New Terminal 400
SAT New Terminal C 335
CLE Runway Rehabilitation 34
ANC Runway widening 89
CMH New Terminal 1,300
| SPECIAL REPORT: Development at U.S. Airports
4 2017 – 2021 Development Investment: Small Hub, Nonhub, and Nonprimary Airports
4.1 Research Methodology
Benchmarking was conducted for Small Hub, Nonhub and Nonprimary
airports using 2017 – 2021 NPIAS investment data versus annual
enplanements and ATMs. The data was plotted on various scatterplots
by airport category and region, and trendlines were established.
Development projects at airports which plotted well above the trend line
were investigated and are presented.
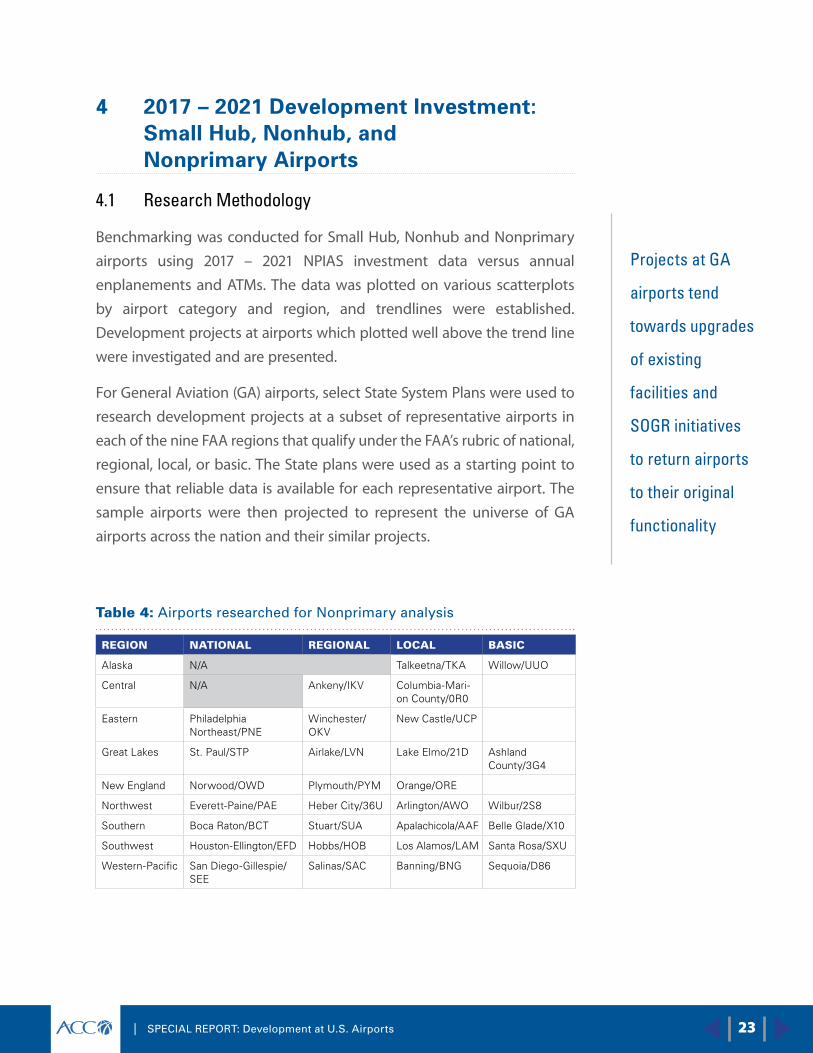
For General Aviation (GA) airports, select State System Plans were used to
research development projects at a subset of representative airports in
each of the nine FAA regions that qualify under the FAA’s rubric of national,
regional, local, or basic. The State plans were used as a starting point to
ensure that reliable data is available for each representative airport. The
sample airports were then projected to represent the universe of GA
airports across the nation and their similar projects.
Table 4: Airports researched for Nonprimary analysis
REGION NATIONAL REGIONAL LOCAL BASIC
Alaska N/A Talkeetna/TKA Willow/UUO
Central N/A Ankeny/IKV Columbia-Mari-on County/0R0
Eastern Philadelphia Northeast/PNE
Winchester/OKV
New Castle/UCP
Great Lakes St . Paul/STP Airlake/LVN Lake Elmo/21D Ashland County/3G4
New England Norwood/OWD Plymouth/PYM Orange/ORE
Northwest Everett-Paine/PAE Heber City/36U Arlington/AWO Wilbur/2S8
Southern Boca Raton/BCT Stuart/SUA Apalachicola/AAF Belle Glade/X10
Southwest Houston-Ellington/EFD Hobbs/HOB Los Alamos/LAM Santa Rosa/SXU
Western-Pacific San Diego-Gillespie/SEE
Salinas/SAC Banning/BNG Sequoia/D86
Projects at GA
airports tend
towards upgrades
of existing
facilities and
SOGR initiatives
to return airports
to their original
functionality
23
24 | SPECIAL REPORT: Development at U.S. Airports
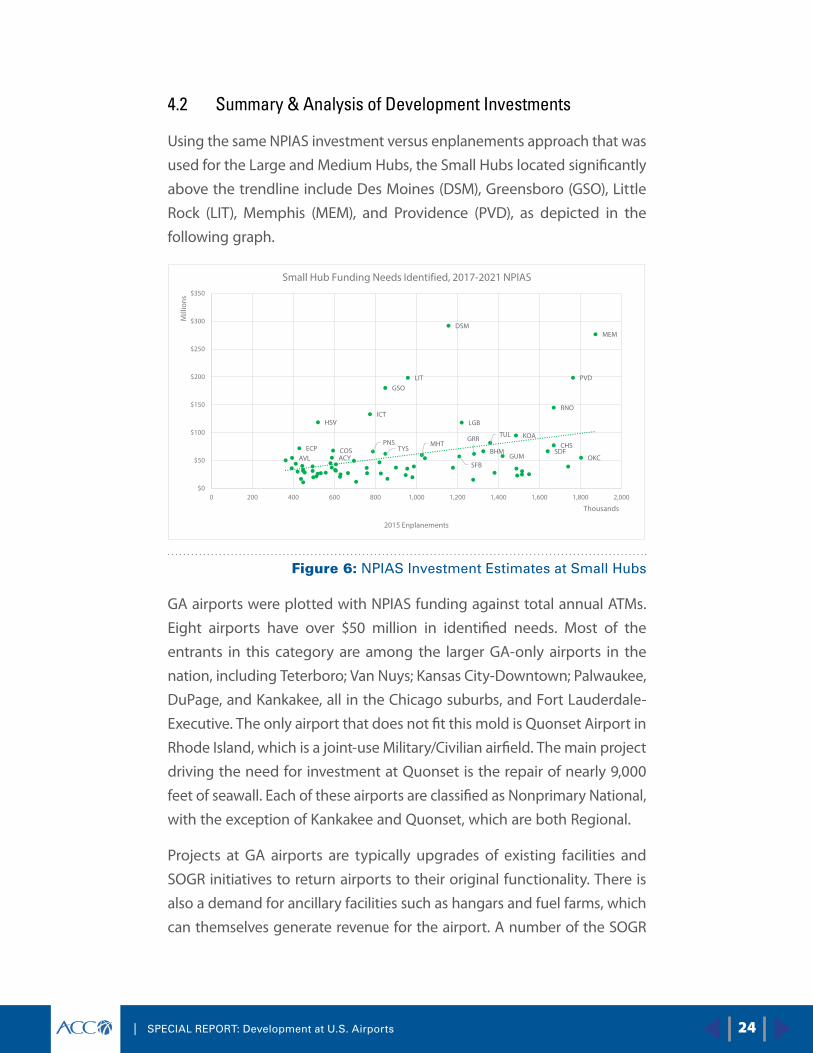
4.2 Summary & Analysis of Development Investments
Using the same NPIAS investment versus enplanements approach that was
used for the Large and Medium Hubs, the Small Hubs located significantly
above the trendline include Des Moines (DSM), Greensboro (GSO), Little
Rock (LIT), Memphis (MEM), and Providence (PVD), as depicted in the
following graph.
DSMMEM
PVDLITGSO
RNOICT
HSV LGB
KOATUL
CHSECP COS SDFBHMPNS
TYSGRR
MHT
GUMSFB
OKCACYAVL
$0
$50
$100
$150
$200
$250
$300
$350
0 200 400 600 800 1,000 1,200 1,400 1,600 1,800 2,000
Mill
ions
2015 Enplanements
Thousands
Small Hub Funding Needs Identified, 2017-2021 NPIAS
Figure 6: NPIAS Investment Estimates at Small Hubs
GA airports were plotted with NPIAS funding against total annual ATMs.
Eight airports have over $50 million in identified needs. Most of the
entrants in this category are among the larger GA-only airports in the
nation, including Teterboro; Van Nuys; Kansas City-Downtown; Palwaukee,
DuPage, and Kankakee, all in the Chicago suburbs, and Fort Lauderdale-
Executive. The only airport that does not fit this mold is Quonset Airport in
Rhode Island, which is a joint-use Military/Civilian airfield. The main project
driving the need for investment at Quonset is the repair of nearly 9,000
feet of seawall. Each of these airports are classified as Nonprimary National,
with the exception of Kankakee and Quonset, which are both Regional.
Projects at GA airports are typically upgrades of existing facilities and
SOGR initiatives to return airports to their original functionality. There is
also a demand for ancillary facilities such as hangars and fuel farms, which
can themselves generate revenue for the airport. A number of the SOGR
| SPECIAL REPORT: Development at U.S. Airports
projects include runway and taxiway reconstruction, as these are items
with time-limited lifespans and require periodic rebuilding.
Two-thirds of all spending at GA airports is for pavement projects, split
60/40 in favor of pavement rehabilitations over new pavement. An
additional 11 percent of funding is dedicated to ancillary facilities, and 7
percent to infrastructure or utility projects. At the larger National category
airports, pavement makes up 48 percent of spending, while for the other
three GA airport categories pavement averages 75 percent of spending.
The National category airports instead have greater investment emphasis
on ancillary facilities (18 percent), SOGR (13 percent), and infrastructure/
utility (11 percent).
Smaller airports often have limited or no engineering staff, and must
acquire engineering and other consultant services to accomplish a wide
range of projects, including extensions of staff during major capital
program planning and implementation.
25
26 | SPECIAL REPORT: Development at U.S. Airports
5 Conclusions
Capital needs and opportunities within the national airport system are
substantial, as airports seek to invest in constant improvements with an
eye towards more efficient operations, happier passengers, and increased
revenue generation. The vast majority of spending at commercial airports
remains in passenger-facing applications, such as new or upgraded
terminals, CONRAC facilities, and ground access projects. Airfield pavement
projects including rehabilitation programs are included in most airports’
capital improvement programs, but the total cost of such projects is low
compared to more significant terminal, access, and other projects.
At GA airports, projects tend towards the physical plant of the airfield itself,
with maintenance and upkeep of existing runways, taxiways, and apron
areas, which are often large undertakings that may stretch the capacity of
airport staff. Much like commercial airports, larger GA airports are looking
to add amenities such as additional hangar space and upgraded facilities
to allow more operations by more types of aircraft in an effort to gain
regional competitive advantages.
One unknown factor is the new Trump Administration, which has made
robust infrastructure investment a keystone of its policy agenda. The
details of the infrastructure funding package, its potential impact on
airports, and the role of the private sector in ultimately financing and
delivering projects remains to be seen. Overall, a number of airports across
the country are undertaking aggressive and substantial capital expansion
and redevelopment programs in the next five years, which will present
many new opportunities for airport development companies.
| SPECIAL REPORT: Development at U.S. Airports
Appendix
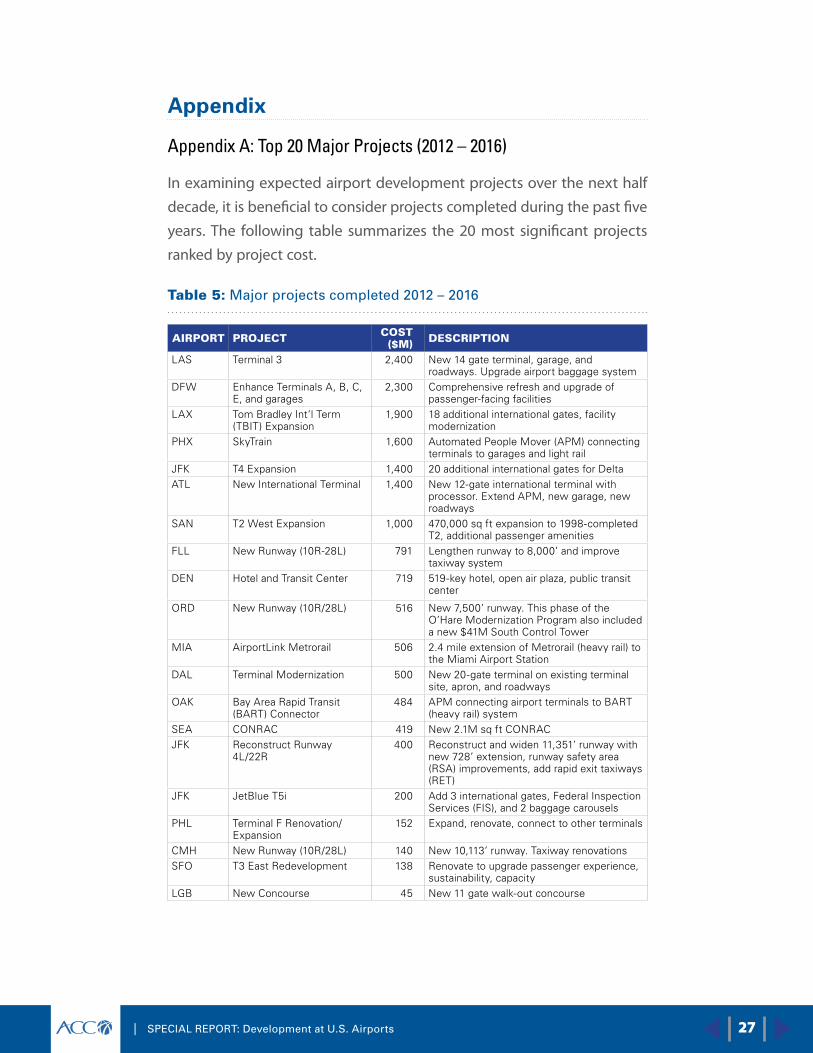
Appendix A: Top 20 Major Projects (2012 – 2016)
In examining expected airport development projects over the next half
decade, it is beneficial to consider projects completed during the past five
years. The following table summarizes the 20 most significant projects
ranked by project cost.
Table 5: Major projects completed 2012 – 2016
AIRPORT PROJECT COST ($M) DESCRIPTION
LAS Terminal 3 2,400 New 14 gate terminal, garage, and roadways. Upgrade airport baggage system
DFW Enhance Terminals A, B, C, E, and garages
2,300 Comprehensive refresh and upgrade of passenger-facing facilities
LAX Tom Bradley Int’l Term (TBIT) Expansion
1,900 18 additional international gates, facility modernization
PHX SkyTrain 1,600 Automated People Mover (APM) connecting terminals to garages and light rail
JFK T4 Expansion 1,400 20 additional international gates for DeltaATL New International Terminal 1,400 New 12-gate international terminal with
processor. Extend APM, new garage, new roadways
SAN T2 West Expansion 1,000 470,000 sq ft expansion to 1998-completed T2, additional passenger amenities
FLL New Runway (10R-28L) 791 Lengthen runway to 8,000’ and improve taxiway system
DEN Hotel and Transit Center 719 519-key hotel, open air plaza, public transit center
ORD New Runway (10R/28L) 516 New 7,500’ runway. This phase of the O’Hare Modernization Program also included a new $41M South Control Tower
MIA AirportLink Metrorail 506 2.4 mile extension of Metrorail (heavy rail) to the Miami Airport Station
DAL Terminal Modernization 500 New 20-gate terminal on existing terminal site, apron, and roadways
OAK Bay Area Rapid Transit (BART) Connector
484 APM connecting airport terminals to BART (heavy rail) system
SEA CONRAC 419 New 2.1M sq ft CONRACJFK Reconstruct Runway
4L/22R400 Reconstruct and widen 11,351’ runway with
new 728’ extension, runway safety area (RSA) improvements, add rapid exit taxiways (RET)
JFK JetBlue T5i 200 Add 3 international gates, Federal Inspection Services (FIS), and 2 baggage carousels
PHL Terminal F Renovation/Expansion
152 Expand, renovate, connect to other terminals
CMH New Runway (10R/28L) 140 New 10,113’ runway. Taxiway renovationsSFO T3 East Redevelopment 138 Renovate to upgrade passenger experience,
sustainability, capacityLGB New Concourse 45 New 11 gate walk-out concourse
27
ACC | 908 King Street, Suite 100 • Alexandria, Virginia 22314 USAPhone +1-703-683-5900 • Fax +1-703-683-2564
www.ACConline.org
...delivering excellence in airport development