Embed Size (px)
Citation preview
ACTA CHROMATOGRAPHICA, NO. 18, 2007
DEVELOPMENT AND VALIDATION OF A STABILITY-INDICATING HPLC METHOD FOR ANALYSIS OF CELECOXIB (CXB) IN BULK DRUG AND MICROEMULSION FORMULATIONS
S. Baboota1,*, S. Faiyaz1, A. Ahuja1, J. Ali1, S. Shafiq1, and S. Ahmad2 1Department of Pharmaceutics, Faculty of Pharmacy, Jamia Hamdard, Hamdard Nagar, New Delhi-110062, India
2Department of Pharmacognosy and Phytochemistry, Faculty of Pharmacy, Jamia Hamdard, Hamdard Nagar, New Delhi-110062, India
SUMMARY A simple, economic, selective, precise, and stability-indicating HPLC method has been developed and validated for analysis of celecoxib (CXB), a selective COX-2 inhibitor, both in bulk drug and in microemulsions. Re-versed-phase chromatography was performed on a C18 column with me-thanol–water, 75:25 (%, v/v), as mobile phase at a flow rate of 1.25 mL min−1. Detection was performed at 250 nm and a sharp peak was obtained for CXB at a retention time of 4.8 ± 0.01 min. Linear regression analysis data for the calibration plot showed there was a good linear relationship between response and concentration in the range 0.27–80 µg mL−1; the regression coefficient was 0.996 and the linear regression equation was y = 48415x + 54359. The detection (LOD) and quantification (LOQ) limits were 0.086 and 0.2625 µg mL−1 respectively. The method was validated for accuracy, precision, reproducibility, specificity, robustness, and detec-tion and quantification limits, in accordance with ICH guidelines. Statisti-cal analysis proved the method was precise, reproducible, selective, speci-fic, and accurate for analysis of CXB. The wide linearity range, sensitivity, accuracy, short retention time, and simple mobile phase imply the method is suitable for routine quantification of CXB with high precision and accu-racy. INTRODUCTION Celecoxib (CXB) is a selective cyclooxygenase-2 (COX-2) inhibitor used for treatment of rheumatoid arthritis and osteoarthritis [1,2]. CXB has
- 116 -
analgesic, antipyretic, and anti-inflammatory activity as a result of selecti-ve inhibition of the enzyme COX-2 and does not inhibit platelet aggre-gation [3]. In contrast with other non-steroidal anti-inflammatory drugs (NSAIDs) it has neither acute nor chronic gastrointestinal toxicity [1–4]. CXB is also used for treatment of colon cancer [5], ultraviolet (UV) light-induced skin cancer [6], and breast cancer [7]. A thorough literature survey has revealed that a limited number of spectrophotometric, fluorimetric, voltammetric, electrophoretic, and chro-matographic methods have been reported for analysis of CXB [8]. An ul-traviolet (UV) spectrophotometric method based on absorption at 251 nm was used for assay of CXB in bulk drugs and capsules [9]. The method was unsuitable for assay of CXB in microemulsion formulations, because oil peaks interfered with the CXB peak. It was, therefore, thought worth-while to develop a stability-indicating chromatographic method for assay of CXB in bulk drugs and pharmaceutical dosage forms. Chromatographic methods using acetonitrile and buffer as mobile phase have been reported for assay of CXB in biological fluids [10–16], bulk drugs [17–20], and pharmaceutical dosage forms [21] but only two methods are available for analysis of CXB in pharmaceutical dosage forms which use methanol–wa-ter (85:15) as mobile phase [22,23]. In one of these methods a mass spec-trophotometer was used as detector [22]. The principal objective of this study was, therefore, to develop a new, simple, economical, selective, precise, reproducible, and stability-indicating high-performance liquid chromatographic (HPLC) method with a wide linear range and good sensitivity for assay of CXB in the bulk drug and in microemulsion formulations using UV detection. In the method proposed the mobile phase was used directly for dilution of the formula-tion after filtration, and then further used for analysis. Direct use of the mobile phase as diluent for formulations in quantitative analysis minimizes errors that occur during tedious extraction procedures. The method was validated in accordance with International Conference on Harmonization (ICH) guidelines [24]. EXPERIMENTAL
Chemicals
CXB was obtained as a gift from Ranbaxy Research Laboratory, Gurgaon, India. HPLC-grade methanol was purchased from Merck, India.
- 117 -
High-purity water was prepared using Millipore purification system. Other chemicals and reagents were of AR grade. Chromatography
Chromatography was performed, under ambient conditions, with Shimadzu HPLC equipment comprising quaternary LC-10A VP pumps, a variable-wavelength programmable UV–visible detector, SPD-10AVP co-lumn oven, and a SCL 10AVP system controller. Samples (20 µL) were injected by means of a Rheodyne injector fitted with a 20-µL loop. The in-strumentation was controlled by use of Class-VP 5.032 software. Compounds were separated on a 25 cm × 4.6 mm i.d., 5-µm particle, 516 C18 DB rever-sed-phase column (Supelco). The mobile phase was methanol–water, 75:25, at a flow rate of 1.25 mL min−1. The eluate was monitored at 250 nm. Method Development
A variety of mobile phases were investigated in the development of an HPLC method suitable for analysis of CXB in the bulk drug and in microemulsions. These included methanol–water, 75:25 (% v/v), acetoni-trile–water, 75:25, methanol–water, 50:50, methanol–water, 95:5, metha-nol–phosphate buffer (pH 3.5–6.5), 80:20, and acetonitrile–phosphate buf-fer (pH 3.5–6.5), 80:20. The suitability of the mobile phase was decided on the basis of the sensitivity of the assay, suitability for stability studies, time required for the analysis, ease of preparation, and use of readily avai-lable cost-effective solvents. The same solvent mixture was used for extrac-tion of the drug from the formulation containing excipients. Method Validation
Linearity
A stock solution of CXB (100 µg mL−1) was prepared by dissol-ving 50 mg drug in 100 mL mobile phase then transferring 2 mL of this solution to a 10-mL volumetric flask and diluting to volume. Solutions of different concentration (0.27–80 µg mL−1) for construction of calibration plots were prepared from this stock solution. The mobile phase was filte-red through a 0.45-µm membrane filter and delivered at 1.25 mL min−1 for column equilibration; the baseline was monitored continuously during this process. The detection wavelength was 250 nm. The prepared dilutions were injected in series, peak area was calculated for each dilution, and concentration was plotted against peak area.
- 118 -
Accuracy, as Recovery
Accuracy was determined by the standard addition method. Pre-viously analyzed samples of CXB (8 µg mL−1) were spiked with 0, 50, 100, and 150% extra CXB standard and the mixtures were analyzed by the pro-posed method. The experiment was performed in triplicate. Recovery (%), RSD (%), bias (%), and standard error of mean (SEM) were calculated for each concentration. Precision
Precision was determined as both repeatability and intermediate pre-cision, in accordance with ICH recommendations. Repeatability of sample injection was determined as intra-day variation and intermediate precision was determined by measurement of inter-day variation. For both intra-day and inter-day variation, solutions of CXB at four different concentrations (4, 8, 12, and 16 µg mL−1) were determined in triplicate. Reproducibility
The reproducibility of the method was checked by determining pre-cision on a different instrument, analysis being performed by another per-son in different laboratory. For both intra-day and inter-day variation, solu-tions of CXB at four different concentrations (4, 8, 12, and 16 µg mL−1) were determined in triplicate. Specificity
The specificity of the method was determined by exposing a solu-tion (8 µg mL−1) of the sample to acidic (0.1 M HCl), basic (0.1 M NaOH), and oxidising (3% H2O2) stress conditions. The resulting solutions were then analyzed and the analyte peak was evaluated both for peak purity and for resolution from the nearest eluting peak. Detection (LOD) and Quantification (LOQ) Limits
LOD and LOQ were determined by the standard deviation (Sy/x) method. Blank samples were injected in triplicate and the peak area of this blank was calculated. LOD and LOQ were determined from the slope, S, of the calibration plot and the standard deviation of the response for the blank sample, Sy/x, by use of the formulae LOD = 3.3 × Sy/x/S and LOQ = 10 × Sy/x/S.
- 119 -
Robustness
The robustness of the method was determined to assess the effect of small but deliberate variation of the chromatographic conditions on the determination of CXB. Robustness was determined by changing the mobile phase flow rate to 1 and 1.5 mL min−1 and the concentration of methanol in the mobile phase to 73 and 77%. Stability
The stability of the drug in solution during analysis was determined by repeated analysis of samples during the course of experimentation on the same day and also after storage of the drug solution for 48 h under la-boratory bench conditions (32 ± 1°C) and under refrigeration (8 ± 0.5°C). Analysis of CXB in Microemulsion
To determine the CXB content of the microemulsion (label claim 20 mg mL−1), 1 mL microemulsion was suitably diluted with mobile pha-se to furnish 100 mL stock solution. This solution was sonicated for 10 min then analyzed for drug content. The analysis was repeated in triplicate. The possibility of interference of excipients with the analysis was studied. RESULTS AND DISCUSSION Method Development
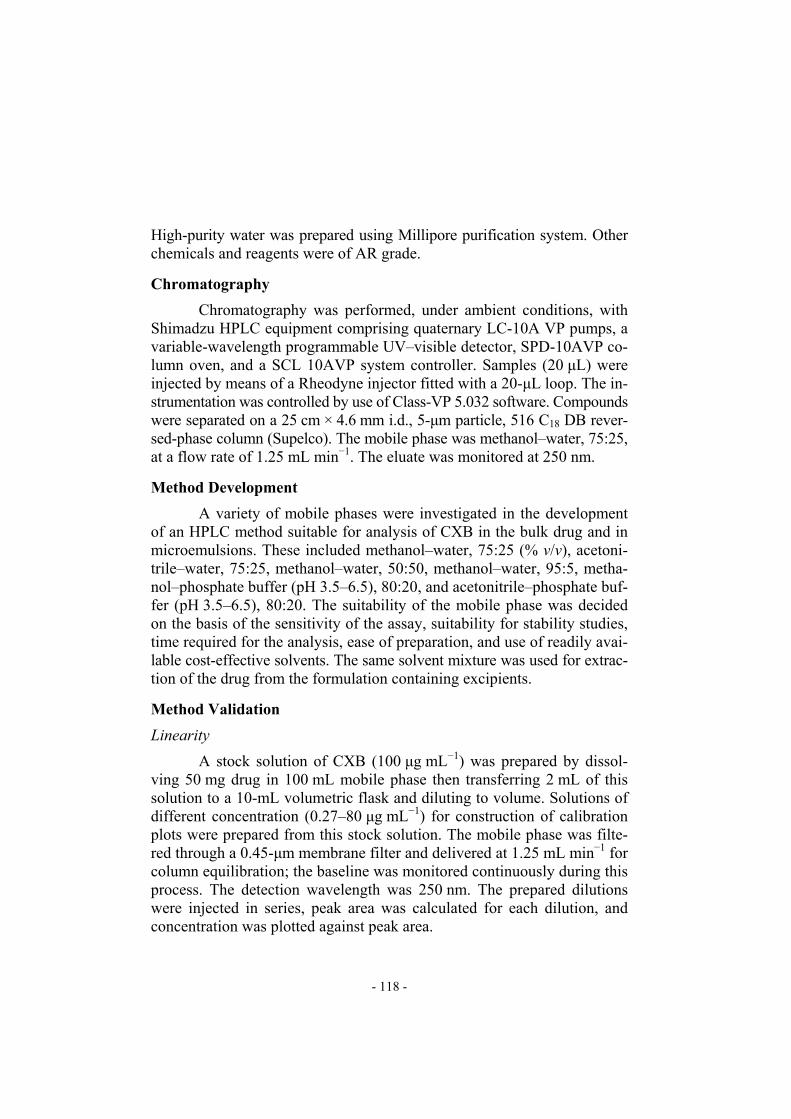
The HPLC procedure was optimized with a view to developing a method for stability-indicating assay. No internal standard was used beca-use no extraction or separation step was involved. Of several solvents and solvent mixtures investigated methanol–water 75:25 (%, v/v) was found to
Fig. 1
HPLC chromatogram obtained from celecoxib in methanol–water 75:25 (% v/v), tR 4.8 min
- 120 -
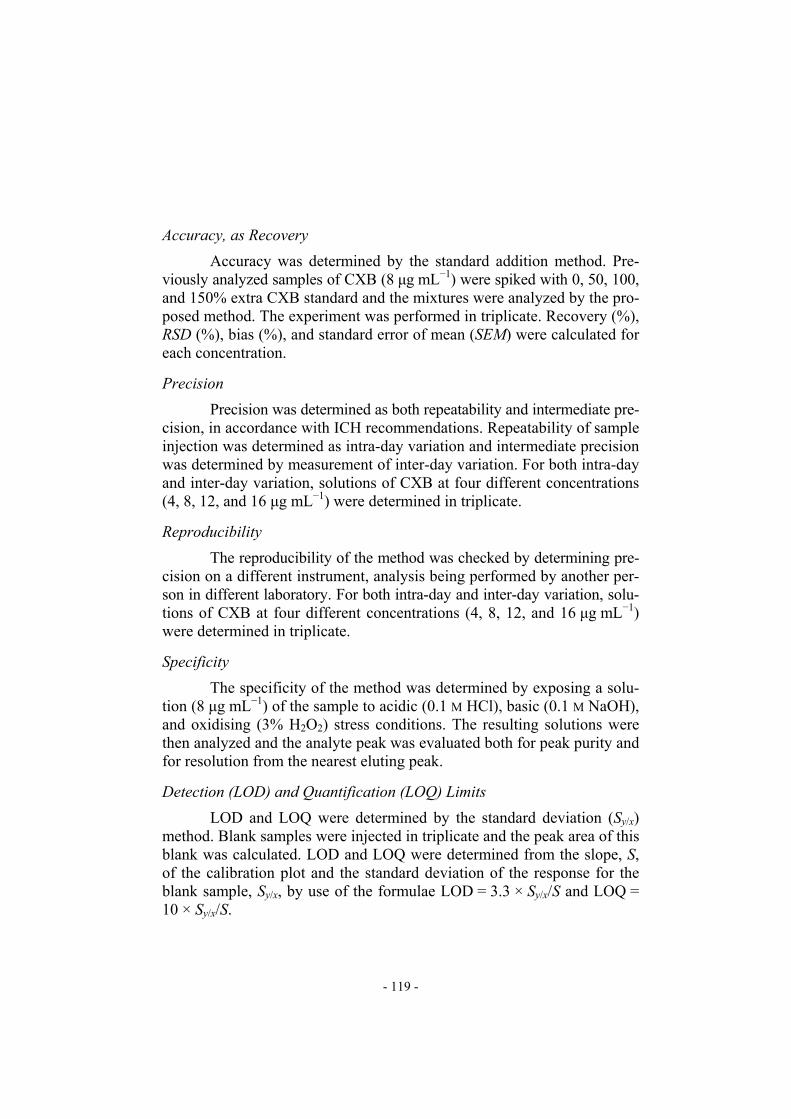
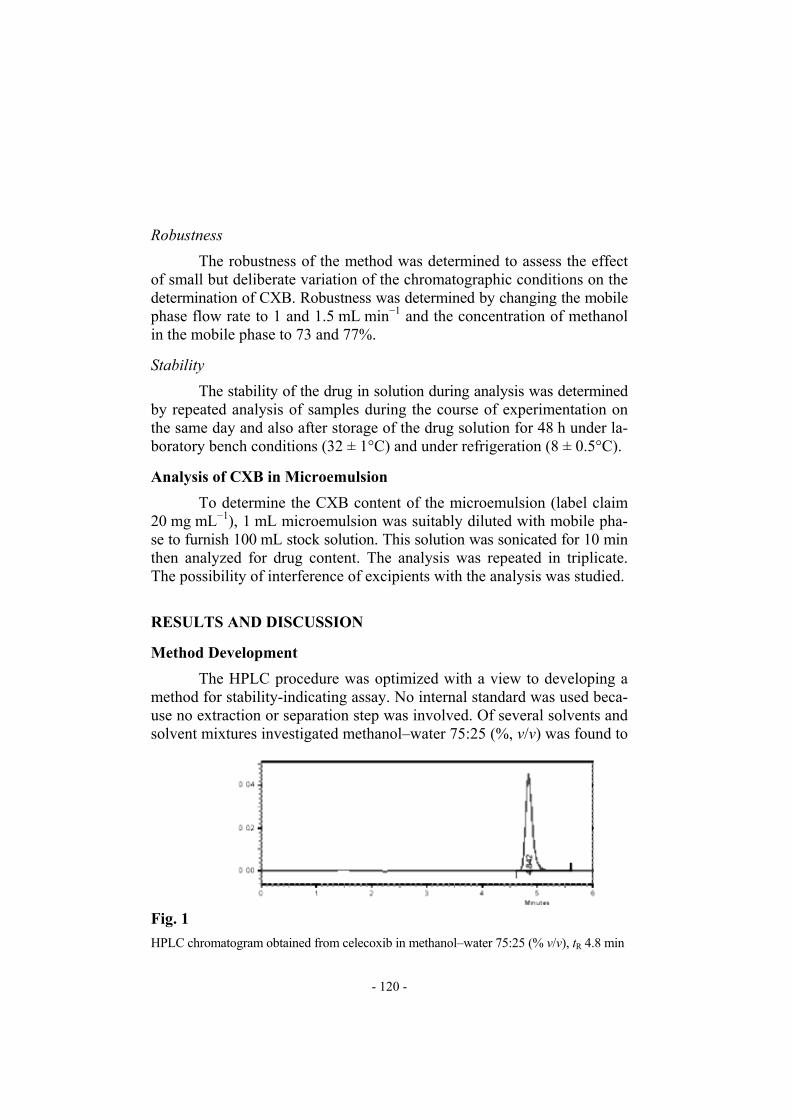
furnish sharp, well-defined peaks with very good symmetry (1.25) and low tR (4.8 min) (Fig. 1). With acetonitrile–water 75:25 as mobile phase tR was 5.9 min (Fig. 2) and peak shape and sensitivity were poor. Acetonitrile was also more expensive than methanol. Methanol–water 95:05 (Fig. 3) and methanol–water 50:50 (Fig. 4) did not furnish sharp, well-defined peaks and other mobile phases tried either resulted in much lower sen-sitivity or did not give well defined peaks in a short time, and so were not considered.
Fig. 2
HPLC chromatogram obtained from celecoxib in acetonitrile–water 75:25 (% v/v), tR 5.9 min
Minutes0 2 4 6 8 10 12 14 16 18 20
Volts
-0.004
-0.002
0.000
0.002
0.004
0.006
0.008
0.010
Vol
ts
-0.004
-0.002
0.000
0.002
0.004
0.006
0.008
0.010
10.3
58
13.8
83
18.8
17
Fig. 3
HPLC chromatogram obtained from celecoxib in methanol–water 50:50 (% v/v)
- 121 -
Minutes
0 1 2 3 4 5 6 7 8 9 10
Volts
0.000
0.025
0.050
0.075
0.100
0.125
0.150
Vol
ts
0.000
0.025
0.050
0.075
0.100
0.125
0.150
0.38
3
2.30
82.
500
2.65
82.
875
3.83
3
6.05
0
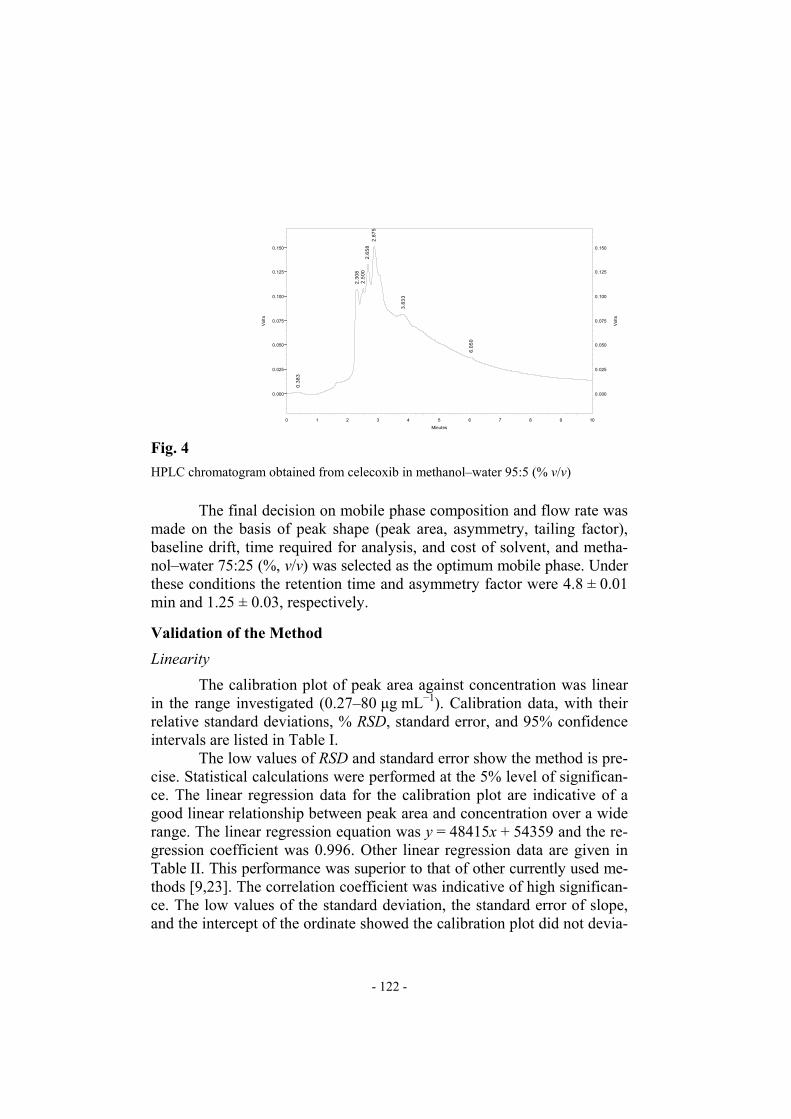
Fig. 4
HPLC chromatogram obtained from celecoxib in methanol–water 95:5 (% v/v) The final decision on mobile phase composition and flow rate was made on the basis of peak shape (peak area, asymmetry, tailing factor), baseline drift, time required for analysis, and cost of solvent, and metha-nol–water 75:25 (%, v/v) was selected as the optimum mobile phase. Under these conditions the retention time and asymmetry factor were 4.8 ± 0.01 min and 1.25 ± 0.03, respectively.
Validation of the Method
Linearity
The calibration plot of peak area against concentration was linear in the range investigated (0.27–80 µg mL−1). Calibration data, with their relative standard deviations, % RSD, standard error, and 95% confidence intervals are listed in Table I. The low values of RSD and standard error show the method is pre-cise. Statistical calculations were performed at the 5% level of significan-ce. The linear regression data for the calibration plot are indicative of a good linear relationship between peak area and concentration over a wide range. The linear regression equation was y = 48415x + 54359 and the re-gression coefficient was 0.996. Other linear regression data are given in Table II. This performance was superior to that of other currently used me-thods [9,23]. The correlation coefficient was indicative of high significan-ce. The low values of the standard deviation, the standard error of slope, and the intercept of the ordinate showed the calibration plot did not devia-
- 122 -
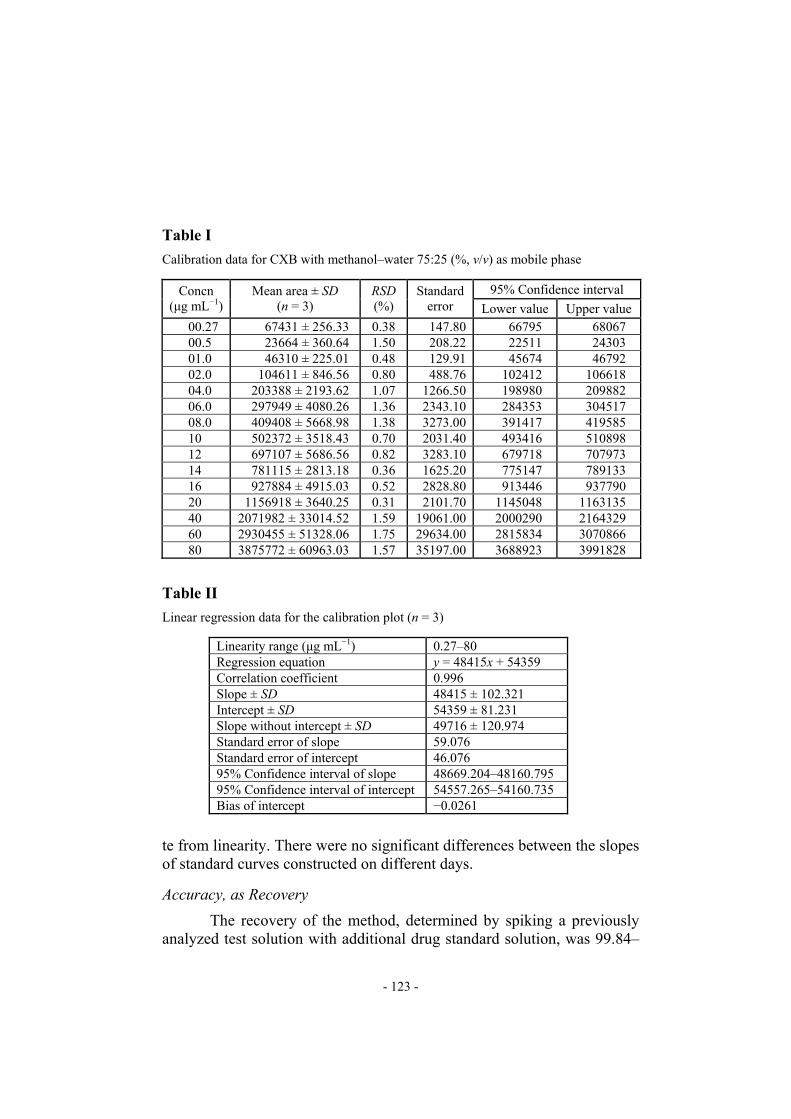
Table I
Calibration data for CXB with methanol–water 75:25 (%, v/v) as mobile phase
95% Confidence interval Concn (µg mL−1)
Mean area ± SD (n = 3)
RSD (%)
Standard error Lower value Upper value
00.27 67431 ± 256.33 0.38 147.80 66795 68067 00.5 23664 ± 360.64 1.50 208.22 22511 24303 01.0 46310 ± 225.01 0.48 129.91 45674 46792 02.0 104611 ± 846.56 0.80 488.76 102412 106618 04.0 203388 ± 2193.62 1.07 1266.50 198980 209882 06.0 297949 ± 4080.26 1.36 2343.10 284353 304517 08.0 409408 ± 5668.98 1.38 3273.00 391417 419585 10 502372 ± 3518.43 0.70 2031.40 493416 510898 12 697107 ± 5686.56 0.82 3283.10 679718 707973 14 781115 ± 2813.18 0.36 1625.20 775147 789133 16 927884 ± 4915.03 0.52 2828.80 913446 937790 20 1156918 ± 3640.25 0.31 2101.70 1145048 1163135 40 2071982 ± 33014.52 1.59 19061.00 2000290 2164329 60 2930455 ± 51328.06 1.75 29634.00 2815834 3070866 80 3875772 ± 60963.03 1.57 35197.00 3688923 3991828
Table II
Linear regression data for the calibration plot (n = 3)
Linearity range (µg mL−1) 0.27–80 Regression equation y = 48415x + 54359 Correlation coefficient 0.996 Slope ± SD 48415 ± 102.321 Intercept ± SD 54359 ± 81.231 Slope without intercept ± SD 49716 ± 120.974 Standard error of slope 59.076 Standard error of intercept 46.076 95% Confidence interval of slope 48669.204–48160.795 95% Confidence interval of intercept 54557.265–54160.735 Bias of intercept −0.0261
te from linearity. There were no significant differences between the slopes of standard curves constructed on different days. Accuracy, as Recovery
The recovery of the method, determined by spiking a previously analyzed test solution with additional drug standard solution, was 99.84–
- 123 -
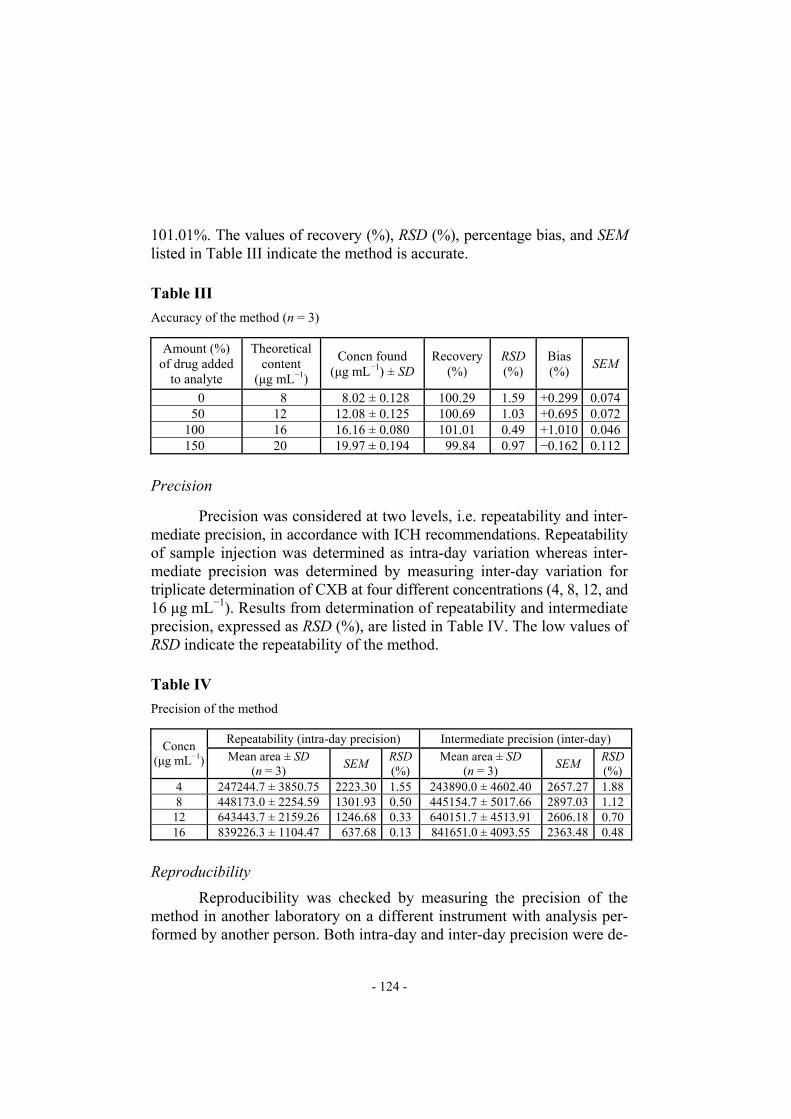
101.01%. The values of recovery (%), RSD (%), percentage bias, and SEM listed in Table III indicate the method is accurate. Table III
Accuracy of the method (n = 3)
Amount (%) of drug added
to analyte
Theoretical content
(µg mL−1)
Concn found (µg mL−1) ± SD
Recovery (%)
RSD (%)
Bias (%) SEM
0 8 8.02 ± 0.128 100.29 1.59 +0.299 0.074 50 12 12.08 ± 0.125 100.69 1.03 +0.695 0.072
100 16 16.16 ± 0.080 101.01 0.49 +1.010 0.046 150 20 19.97 ± 0.194 99.84 0.97 −0.162 0.112
Precision Precision was considered at two levels, i.e. repeatability and inter-mediate precision, in accordance with ICH recommendations. Repeatability of sample injection was determined as intra-day variation whereas inter-mediate precision was determined by measuring inter-day variation for triplicate determination of CXB at four different concentrations (4, 8, 12, and 16 µg mL−1). Results from determination of repeatability and intermediate precision, expressed as RSD (%), are listed in Table IV. The low values of RSD indicate the repeatability of the method. Table IV
Precision of the method
Repeatability (intra-day precision) Intermediate precision (inter-day) Concn (µg mL−1) Mean area ± SD
(n = 3) SEM RSD (%)
Mean area ± SD (n = 3) SEM RSD
(%) 4 247244.7 ± 3850.75 2223.30 1.55 243890.0 ± 4602.40 2657.27 1.88 8 448173.0 ± 2254.59 1301.93 0.50 445154.7 ± 5017.66 2897.03 1.12
12 643443.7 ± 2159.26 1246.68 0.33 640151.7 ± 4513.91 2606.18 0.70 16 839226.3 ± 1104.47 637.68 0.13 841651.0 ± 4093.55 2363.48 0.48
Reproducibility
Reproducibility was checked by measuring the precision of the method in another laboratory on a different instrument with analysis per-formed by another person. Both intra-day and inter-day precision were de-
- 124 -
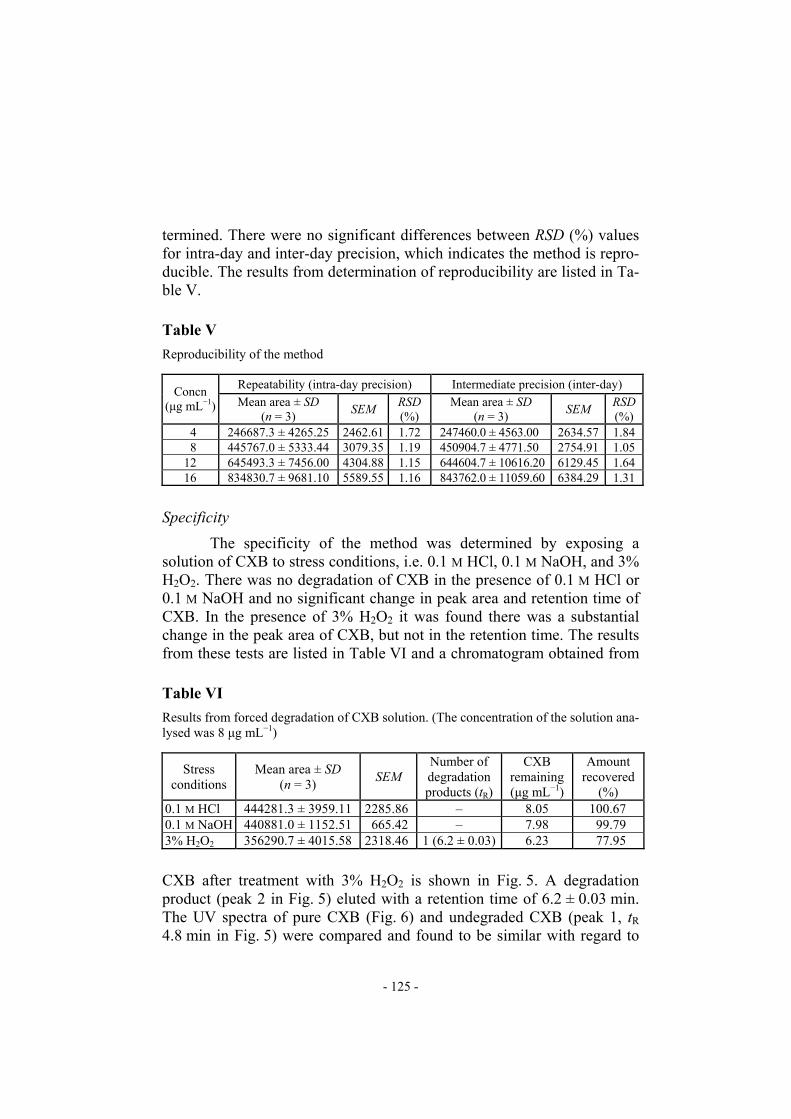
termined. There were no significant differences between RSD (%) values for intra-day and inter-day precision, which indicates the method is repro-ducible. The results from determination of reproducibility are listed in Ta-ble V. Table V
Reproducibility of the method
Repeatability (intra-day precision) Intermediate precision (inter-day) Concn (µg mL−1) Mean area ± SD
(n = 3) SEM RSD (%)
Mean area ± SD (n = 3) SEM RSD
(%) 4 246687.3 ± 4265.25 2462.61 1.72 247460.0 ± 4563.00 2634.57 1.84 8 445767.0 ± 5333.44 3079.35 1.19 450904.7 ± 4771.50 2754.91 1.05
12 645493.3 ± 7456.00 4304.88 1.15 644604.7 ± 10616.20 6129.45 1.64 16 834830.7 ± 9681.10 5589.55 1.16 843762.0 ± 11059.60 6384.29 1.31
Specificity
The specificity of the method was determined by exposing a solution of CXB to stress conditions, i.e. 0.1 M HCl, 0.1 M NaOH, and 3% H2O2. There was no degradation of CXB in the presence of 0.1 M HCl or 0.1 M NaOH and no significant change in peak area and retention time of CXB. In the presence of 3% H2O2 it was found there was a substantial change in the peak area of CXB, but not in the retention time. The results from these tests are listed in Table VI and a chromatogram obtained from Table VI
Results from forced degradation of CXB solution. (The concentration of the solution ana-lysed was 8 µg mL−1)
Stress conditions
Mean area ± SD (n = 3) SEM
Number of degradation products (tR)
CXB remaining (µg mL−1)
Amount recovered
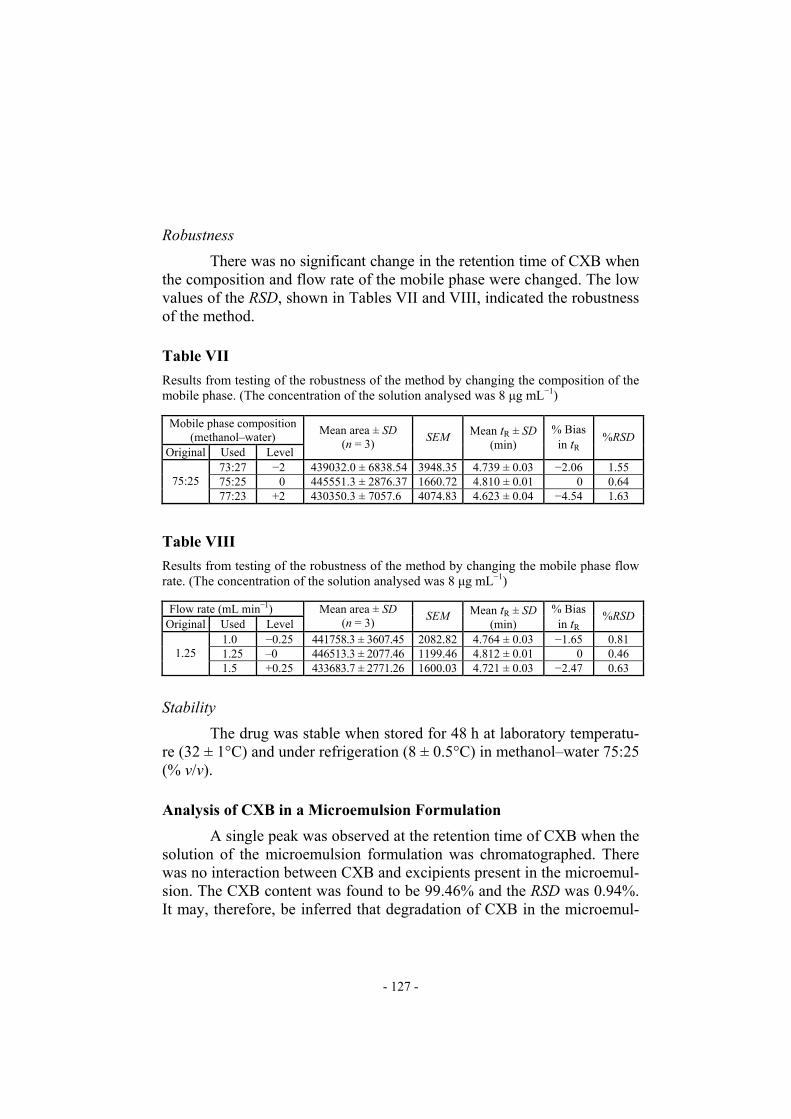
(%) 0.1 M HCl 444281.3 ± 3959.11 2285.86 – 8.05 100.67 0.1 M NaOH 440881.0 ± 1152.51 665.42 – 7.98 99.79 3% H2O2 356290.7 ± 4015.58 2318.46 1 (6.2 ± 0.03) 6.23 77.95 CXB after treatment with 3% H2O2 is shown in Fig. 5. A degradation product (peak 2 in Fig. 5) eluted with a retention time of 6.2 ± 0.03 min. The UV spectra of pure CXB (Fig. 6) and undegraded CXB (peak 1, tR 4.8 min in Fig. 5) were compared and found to be similar with regard to
- 125 -
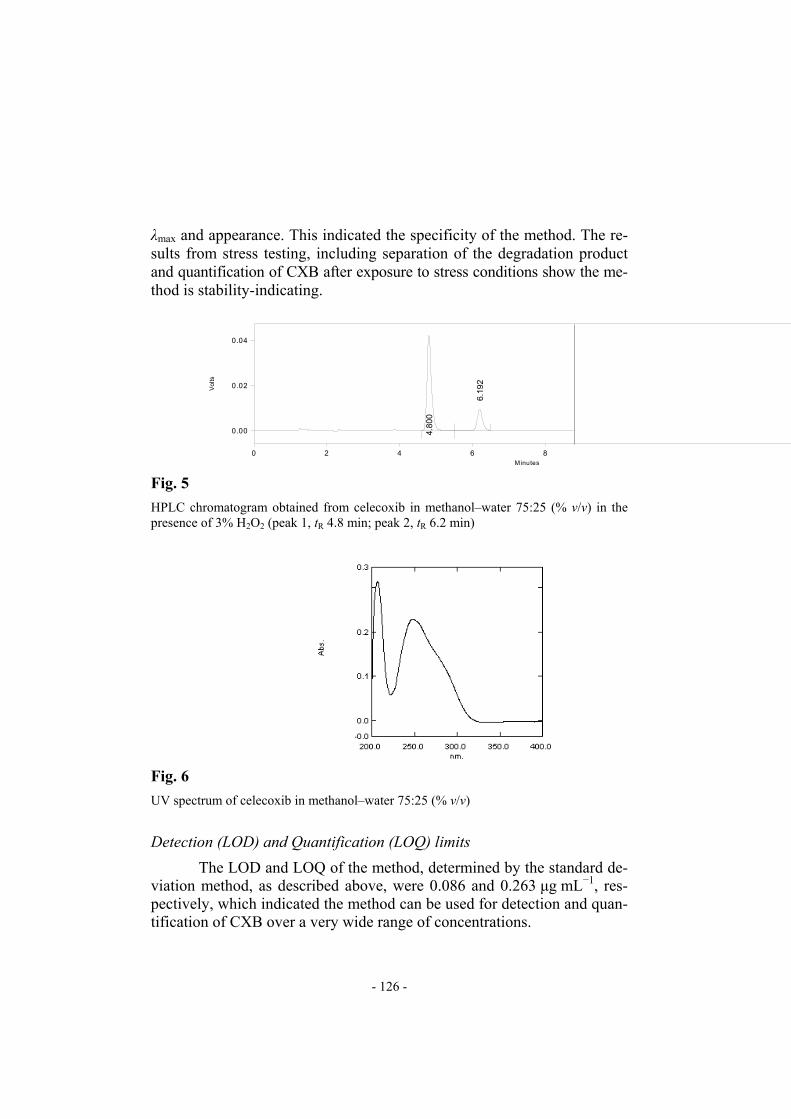
λmax and appearance. This indicated the specificity of the method. The re-sults from stress testing, including separation of the degradation product and quantification of CXB after exposure to stress conditions show the me-thod is stability-indicating.
Minutes0 2 4 6 8
Vol
ts
0.00
0.02
0.04
4.80
0
6.19
2
Detector A (250nm)celecoxibcxb-spe-h2o2-8mcg-01021
etention Time
R
Fig. 5
HPLC chromatogram obtained from celecoxib in methanol–water 75:25 (% v/v) in the presence of 3% H2O2 (peak 1, tR 4.8 min; peak 2, tR 6.2 min)
Fig. 6
UV spectrum of celecoxib in methanol–water 75:25 (% v/v)
Detection (LOD) and Quantification (LOQ) limits
The LOD and LOQ of the method, determined by the standard de-viation method, as described above, were 0.086 and 0.263 µg mL−1, res-pectively, which indicated the method can be used for detection and quan-tification of CXB over a very wide range of concentrations.
- 126 -
Robustness
There was no significant change in the retention time of CXB when the composition and flow rate of the mobile phase were changed. The low values of the RSD, shown in Tables VII and VIII, indicated the robustness of the method. Table VII
Results from testing of the robustness of the method by changing the composition of the mobile phase. (The concentration of the solution analysed was 8 µg mL−1)
Mobile phase composition (methanol–water)
Original Used Level
Mean area ± SD (n = 3) SEM Mean tR ± SD
(min) % Bias
in tR %RSD
73:27 −2 439032.0 ± 6838.54 3948.35 4.739 ± 0.03 −2.06 1.55 75:25 0 445551.3 ± 2876.37 1660.72 4.810 ± 0.01 0 0.64 75:25 77:23 +2 430350.3 ± 7057.6 4074.83 4.623 ± 0.04 −4.54 1.63
Table VIII
Results from testing of the robustness of the method by changing the mobile phase flow rate. (The concentration of the solution analysed was 8 µg mL−1)
Flow rate (mL min−1) Original Used Level
Mean area ± SD (n = 3) SEM Mean tR ± SD
(min) % Bias
in tR %RSD
1.0 −0.25 441758.3 ± 3607.45 2082.82 4.764 ± 0.03 −1.65 0.81 1.25 –0 446513.3 ± 2077.46 1199.46 4.812 ± 0.01 0 0.46 1.25 1.5 +0.25 433683.7 ± 2771.26 1600.03 4.721 ± 0.03 −2.47 0.63
Stability
The drug was stable when stored for 48 h at laboratory temperatu-re (32 ± 1°C) and under refrigeration (8 ± 0.5°C) in methanol–water 75:25 (% v/v). Analysis of CXB in a Microemulsion Formulation
A single peak was observed at the retention time of CXB when the solution of the microemulsion formulation was chromatographed. There was no interaction between CXB and excipients present in the microemul-sion. The CXB content was found to be 99.46% and the RSD was 0.94%. It may, therefore, be inferred that degradation of CXB in the microemul-
- 127 -
sion formulation had not occurred. The low RSD indicated the suitability of this method for routine analysis of CXB in pharmaceutical dosage forms. CONCLUSIONS This HPLC method is accurate, precise, reproducible, specific, and stability-indicating. The method has been found to be better than previously reported methods, because of its wide range of linearity, use of an econo-mical and readily available mobile phase, UV detection, lack of extraction procedures, low tR, no internal standard, and use of the same mobile phase for washing of the column. All these factors make this method suitable for quantification of CXB in bulk drugs and in pharmaceutical dosage forms. It can therefore be concluded that use of the method can save much time and money and it can be used in small laboratories with very high accu-racy and a wide linear range. The method can be successfully used for routine analysis of CXB in bulk drug and in pharmaceutical dosage forms without interference. Study of the effects of exhaustive stress conditions, and separation and identification of the degradation products, is in progress in our laboratory. ACKNOWLEDGEMENTS The authors are thankful to Ranbaxy Research Laboratory, Gurgaon, India, for providing the sample of Celecoxib as a gift. The authors are also grateful to the University Grants Commission for providing a Research Award to Dr Sanjula Baboota. REFERENCES
[1] J. Fort, Am. J. Orthop., 28, 13 (1999) [2] A. Gaurl, A.M. Martel, and J. Castner, Drugs Future, 22, 711 (1997) [3] G.S. Gies, Scand. J. Rheumatol., 109, 31 (1999) [4] M.M. Goldberg, Clin. Ther., 21, 1497 (1999) [5] T. Kawamori, C.V. Rao, K. Seibert, and B.S. Reddy, Cancer Res.,
58, 409 (1998) [6] S.M. Fisher, H.H. Lo, G.B. Gordon, K. Seibert, G. Kellof,
R.A. Lubet, and C.J. Conti, Mol. Carcinog., 25, 231 (1999)
- 128 -
[7] R.E. Harris, G.A. Alshafie, H. Asbou-Issa, and K Seibert, Cancer Res., 60, 2101 (2000)
[8] R.N. Rao, S. Meena, and A.R. Rao, J. Pharm. Biomed. Anal., 39, 349 (2005)
[9] R.N. Saha, C. Sajeev, P.R. Jadhav, S.P. Patil, and N. Srinivasan, J. Pharm. Biomed. Anal., 28, 741 (2002)
[10] O.I. Wong, N. Tsuzuki, M. Rhichardson, M.H. Rytting, W.R. Konishi, and T. Higuchi, Heterocycles, 26, 315 (1987)
[11] M.N.E.I. Kousy, J. Pharm. Biomed. Anal., 20, 185 (1999) [12] R.W. Mathew and F. Jamali, J. Chromatogr., 616, 59 (1993) [13] C. Giachetti, A. Assandri, G. Zalano, and E. Brembilla, Biomed.
Chromatogr., 8, 180 (1994) [14] H.S. Chow, N. Anavy, D. Salazar, D.H. Frank, and D.S. Albert,
J. Pharm. Biomed. Anal., 34, 167 (2004) [15] E. Stormer, S. Bauer, J. Kirehhiener, J. Brockmoller, and I. Roots,
J. Chromatogr B, 783, 207 (2003) [16] M. Zhang, G.A. Moore, S.J. Gardiner, and E.J. Begg,
J. Chromatogr B, 830, 245 (2006) [17] G. Jayasagar, M.K. Kumar, K. Chandrasekar, P.S. Prasad,
and Y.M. Rao, Pharmazie., 57, 619 (2002) [18] M.A. Hamid, L. Novotny, and H. Hamza, J. Chromatogr. B,
753, 401 (2001) [19] U. Werner, D. Werner, A. Phal, R. Mundkowski, M. Gllich,
and K. Brune, Biomed. Chromatogr., 16, 56 (2000) [20] U. Satyanarayana, D. Rao, Y.K. Kumar, J.M. Babu, P.R. Kumar,
and J.T. Reddy, J. Pharm. Biomed. Anal., 35, 951 (2004) [21] F. Schoenberger, G. Hienkele, T.E. Murdter, S. Brenner, U. Koltz,
and U. Hoffman, J. Chromatogr. B, 768, 255 (2002) [22] H. Jalalizadeh, M. Amini, V. Ziace, S.A. Farsam, and A. Shafice,
J. Pharm. Biomed. Anal., 35, 665 (2004) [23] P.M. Dhabu and K.G. Akamanchy, Drug Dev. Ind. Pharm.,
28, 815 (2002) [24] International Conference on Harmonisation (ICH) of Technical
Requirements for Registration of Pharmaceuticals for Human Use: Harmonised Triplicate Guideline on Validation of Analytical Procedures: Methodology, Recommended for Adoption at Step 4 of the ICH Process on November 1996 by the ICH Steering Committee, IFPMA, Switzerland
- 129 -