Embed Size (px)
Citation preview
September - October 2011 Indian Journal of Pharmaceutical Sciences 527
*Address for correspondence E-mail: [email protected]
Development and Validation of New Discriminative Dissolution Method for Carvedilol TabletsV. RAJU AND K. V. R. MURTHY*Division of Pharmaceutical Technology, University College of Pharmaceutical Sciences, Andhra University, Visakhapatnam-530 003, India
Raju and Murthy: Discriminative Dissolution Method For Carvedilol Tablets
The objective of the present study was to develop and validate a discriminative dissolution method for evaluation of carvedilol tablets. Different conditions such as type of dissolution medium, volume of dissolution medium and rotation speed of paddle were evaluated. The best in vitro dissolution profile was obtained using Apparatus II (paddle), 50 rpm, 900 ml of pH 6.8 phosphate buffer as dissolution medium. The drug release was evaluated by high-performance liquid chromatographic method. The dissolution method was validated according to current ICH and FDA guidelines using parameters such as the specificity, accuracy, precision and stability were evaluated and obtained results were within the acceptable range. The comparison of the obtained dissolution profiles of three different products were investigated using ANOVA-based, model-dependent and model-independent methods, results showed that there is significant difference between the products. The dissolution test developed and validated was adequate for its higher discriminative capacity in differentiating the release characteristics of the products tested and could be applied for development and quality control of carvedilol tablets.
Key words: ANOVA-based method, carvedilol, difference factor (f1), discriminative dissolution, model-dependent
method, model-independent method, similarity factor (f2)
Research Paper
Drug absorption from a dosage form after oral administration depends on the release of the drug substance from the drug product, dissolution and/or solubilization of the drug under physiologic conditions and the permeability of the site of absorption in the gastrointestinal tract. Because of the critical nature of the first two of these steps, in vitro dissolution may be relevant to the prediction of in vivo performance[1,2]. The evaluation of dissolution profiles is a very important quality measure for solid oral drug delivery systems (tablets and capsules).
In vitro dissolution testing is an economic and useful quality control tool to effectively assure acceptable product quality during different stages of the development and production of tablets, capsules and other solid dosage forms[3]. Dissolution tests can be used (a) to assess the charateristics of the active pharmaceutical ingredient (API), such as the particle size and the crystal form; (b) to guide development of new formulations; (c) to assist in proper formulation selection (selection of excipients) and to optimize
the manufacturing process (e.g., compression forces, equipment) during dosage form optimization; (d) to assess the batch to batch quality of a drug product; (e) to compare new or generic formulations with an existing product; (f) to assess the stability of the drug product, helping in establishment of shelf life; (g) to ensure the product quality in case of certain scale-up and post approval changes (SUPAC) like manufacturing site changes, increase or decrease of batch size and small quantitative changes in excipients; (h) to provide a basis for achieving an in vitro/in vivo correlation (to predict product performance in vivo); (i) to minimize the need for bioequivalency studies[3-6].
Dissolution study is particularly important for insoluble or poorly soluble drugs, where as absorption is dissolution-rate limited (BCS class II drugs). At the same time, development of a dissolution method for this group of drugs is very challenging.
The discriminatory power of the dissolution method is the method’s ability to detect changes in the drug product. Demonstrating the discriminatory power of the dissolution method it is both challenging
www.ijpsonline.com
528 Indian Journal of Pharmaceutical Sciences September - October 2011
and important, particularly in monitoring API or formulation parameters critical for optimal product performance of the poorly soluble compound[7]. For water insoluble drugs, difficulties are usually encountered in selecting a dissolution medium of acceptable volume and composition as well as a good discriminating power. When dissolution test is not defined in the monograph of the dosage form, or if the monograph is not available, comparison of drug dissolution profiles is recommended in three different dissolution media, in the pH range of 1–7.5[8]. The choice of the best medium, i.e. one that can discriminate between critical manufacturing variables is crucial in such cases[9]. Dissolution medium must provide sink conditions (i.e, saturation solubility is at least 3 times more than the drug concentration in the dissolution medium as outlined in USP) [10].
The simplest way to compare dissolution profiles of test and reference formulations is to check the percentage of drug dissolved in the dissolution medium after a certain period of time. For rapidly dissolving drug products, the use of single point comparison of the dissolution profiles may be sufficient. However especially in the case of slowly dissolving or poorly water-soluble drugs, comparison of the multiple time points is recommended by the Food and Drug Administration (FDA). Comparison of multiple time point dissolution profile is necessarily more complex than with a single point test. In the literature, several methods to evaluate and compare the multiple time points dissolution profiles, such as ANOVA–based, model-dependent and model-independent methods are reported[3,6,8,11].
Carvedilol, 1-(9H-carbazol-4-yloxy)-3-[2-(2-methoxy-phenoxy)ethylamino]propan-2-ol, is a nonselective β-adrenergic blocking agent with α1-blocking activity. It is widely used in clinical practice for the treatment of cardiovascular diseases like hypertension, congestive heart failure and myocardial infarction, etc. It is a white to off-white crystalline powder, practically insoluble in water, gastric and intestinal fluids. Carvedilol is a weak base (pKa value is approximately 7.8) and lipophilic drug (log P value is about 3.967). It is categorized under BCS class II. The dose of carvedilol is 25 mg twice a day, however, a lower effective dose is reported as 3.125 mg. Its absolute bioavailability is considerably low, i.e., about 25% due to first-pass metabolism, and its plasma half-life is about 6 h[12-16].
Carvedilol in its pure form is official only in European Pharmacopoeia. Simulated gastric fluid without enzyme (SGF) is mentioned as the dissolution medium for the dissolution testing of carvedilol tablets by FDA under listed drugs[17]. However this medium is not suitable for discriminating the dissolution testing to support product development for the dosage form. Hence the objective of present study is to develop a discriminating dissolution method for carvedilol tablets to support product development and quality control efforts.
The initial part of the study is focused on the selection of suitable dissolution test conditions like paddle speed, volume of medium using different dissolution media including that reported by FDA using commercial product-A. The second part of the study is focused on the validation and optimization of the best dissolution test conditions by comparing dissolution profiles of two different API, varying in their particle size and three different products using ANOVA–based, model-dependent and model-independent methods.
MATERIALS AND METHODS
Two samples of micronized carvedilol pure drug were obtained from Dr. Reddy’s Laboratories (Hyderabad, India) (API-I) having d90 in the range of 25.3 µm and API-II from Sun Pharma Advanced Research Company (SPARC, Vadodara, India) having d90 in the range of 8.5 µm. The two commercial products of carvedilol tablets (Product-A: Cardivas 25 mg tablet, Batch no. 101185, SPARC, India and Product-B: Cadmos 25 mg tablet, Batch no. 010708, VHB Life Sciences Limited, Mumbai, India) were purchased from local Pharmacy. Extra pure grades of potassium dihydrogen orthophosphate, sodium hydroxide, hydrochloric acid and glacial acetic acid (Qualigens, Mumbai) and HPLC grades of methanol and acetonitrile (Merck, Mumbai) were used. 0.45 µm Millipore membrane filters (25 mm), polypropylene syringe filter holder (25 mm) were purchased from Millipore Corp. (Bedford, MA, USA). 0.1N HCl, simulated gastric fluid (SGF), pH 4.5 acetate buffer, pH 6.8 phosphate buffer were prepared according to the directions in USP 29. All the computations were performed in OriginPro 8 (OrginLab Corporation, MA, USA) and GraphPad Prism 5 (GraphPad Software, Inc. CA, USA). Product-C tablets containing 25 mg of the drug along with the following excipients: microcrystalline cellulose (Avicel pH 101), crospovidone (Polyplasdone
www.ijpsonline.com
September - October 2011 Indian Journal of Pharmaceutical Sciences 529
XL) and colloidal silicon dioxide (Aerosil 200) as the formulated product. All other chemicals used were of analytical grade.
Determination of saturation solubility:The saturation solubility of carvedilol (API-II) was determined in the following media: 0.1N HCl, SGF, pH 4.5 acetate buffer, pH 6.8 phosphate buffer and distilled water. Experiments were conducted in triplicate. Excess amount of carvedilol was added in each medium in a 10 ml screw-capped vial. The vials were shaken continuously in a shaker for 24 h and temperature was maintained at 37°. The solutions were kept aside at the same temperature for 6 h until equilibrium was achieved. The equilibrated samples were immediately filtered through 0.45 µm Millipore membrane filter and the filtrate was diluted with an appropriate volume of methanol. A 20 µl volume of the sample was analyzed by a reversed phase HPLC method described below.
Dissolution test:The initial dissolution tests were carried out on product-A by employing USP Apparatus II at 37±0.5º. Each dissolution test was performed in triplicate. In each dissolution testing a paddle speed of either 50 or 75 rpm, different dissolution media (0.1N HCl, SGF, pH 4.5 acetate buffer, pH 6.8 phosphate buffer, distilled water) with either 500 ml or 900 ml were used. Sampling aliquots of 5.0 ml were withdrawn at 5, 10, 15, 30, 45, 60 and 120 min replaced with an equal volume of the fresh medium maintained at the same temperature. After the end of each test time, samples aliquots were filtered through 0.45 µm membrane filter, diluted with respective dissolution medium, when necessary and then analyzed by HPLC method described below.
Estimation of carvedilol in the dissolution samples:The drug content of the carvedilol sample solutions was determined by HPLC using Shimadzu liquid chromatography (Shimadzu Corporation, Kyoto, Japan) equipped with a model LC-10ATVP binary pump and model SPD-M10AVP PDA detector using the stationary phase 250×4.6 mm LiChrospher® 100 RP-18 octadecyl silane column (5 µm particle size) (Merck, Darmstadt, Germany) with integration by LC Solution Version 1.23 SP1 Software (Shimadzu Corporation, Kyoto, Japan). The mobile phase consisted of a mixture of 0.03M potassium dihydrogen orthophosphate (pH 4.8) buffer:methanol:acetonitrile (58:32:10). The mobile phase was prepared daily and
degassed by sonication under reduced pressure and filtered through 0.45 µm membrane filter. The flow rate was set at 1.2 ml/min resulting in a run time of 10 min per sample. The injection volume was 20 µl. Detection was performed at 242 nm and samples were analyzed at room temperature ~25°[18].
Preparation of standard stock solutions:The stock solution was prepared by dissolving 25 mg of carvedilol in 50 ml volumetric flask with methanol, obtaining a concentration of 500 µg/ml from which seven working standard solutions in the range of 0.5–10 µg/ml were prepared by appropriate dilution with respective dissolution medium (0.1N HCl, SGF, pH 4.5 acetate buffer, pH 6.8 phosphate buffer and distilled water). The solution was filtered in a 0.45 µm membrane filter before injecting into the column.
Validation of the dissolution method:The selected dissolution test condition was validated for specificity, accuracy, precision and stability according to current ICH and FDA guidelines. The specificity of the dissolution medium was tested by examining the peak interference from the dissolution medium and placebo in comparison with drug by 1) an aliquot of the dissolution medium without drug 2) dissolution medium containing known concentration of drug 3) dissolution medium in which placebo tablet was added 4) dissolution medium added with commercial tablet (product-A). All these samples were stirred at a speed of 100 rpm for 30 min and samples were filtered through 0.45 µm membrane filter and analyzed by HPLC method.
Accuracy of the method was evaluated by the recovery test. It was conducted by adding known amounts of carvedilol reference substance to placebo. A stock solution containing 10 mg/ml of carvedilol was prepared in methanol. Aliquots of 1, 10 and 15 ml of this solution were added to vessels containing dissolution medium for a final volume of 1000 ml kept at 37±0.5º (final concentrations were 10, 100 and 150 mg/ml). Samples were stirred at 150 rpm for 1 h. After that aliquots of each sample were collected and analyzed by HPLC method.
The precision of the method was determined by repeatability in the same day (intra-day) and intermediate precision in two different days (inter-day) were evaluated based on relative standard deviation
www.ijpsonline.com
530 Indian Journal of Pharmaceutical Sciences September - October 2011
(RSD) of the results. The same solutions used in the accuracy test were analyzed in order to access the precision of the method.
For solutions stability, solutions of pure carvedilol and product-A were collected after complete dissolution and samples were stored in light at ambient temperature and at 2–8° for up to seven days. Sample aliquots of 5 ml were withdrawn, suitably diluted and analyzed by HPLC method after every 24 h period. Each day the concentrations of drug found in the standard and formulation were compared with concentrations of drug found in the same samples stored at 2–8°.
Methods used to compare dissolution profiles:The dissolution data were compared by ANOVA-based, Model-dependent (Zero-order, First- order, Higuchi, Korsmeyer-Peppas, Hixson-Crowell, Weibull and Baker-Lonsdale) and Model-independent (f1 and f2 factors) methods[6,19-24].
In ANOVA-based method, the differences among drug products A, B and C were tested by comparison of the percentage of drug dissolved at each time point using one-way ANOVA followed by Tukey test, in order to find the source of difference. The calculations were performed using the statistical softwares OriginPro 8 (OrginLab Corporation, MA, USA) and GraphPad Prism 5 (GraphPad Software, Inc. CA, USA). Throughout the study, P≤0.05 was used as the criterion to assess statistical significance.
Carvedilol release kinetic profiles were compared by various model-dependent methods (Table 1), which were applied considering the percentage of drug released from 0 to 120 min. The model-independent method includes the difference factor (f1) and the similarity factor (f2). The f1 is proportional to the average difference between the two profiles, whereas f2 is inversely proportional to the average squared difference between the two profiles, with emphasis on the larger difference among all the time points. The use of these factors was also recommended for dissolution profile comparison in the FDA’s guidelines for industry[25]. The factors are defined by Eqns. 1 and 2, where n is the number of dissolution sample times and Rt and Tt are the individual or mean percent dissolved at each time point, t, for the reference and test
dissolution profiles respectively. According to the FDA’s guidelines f1 values lower than 15 (0-15) and f2 values greater than 50 (50-100) show the similarity of the dissolution profiles[3,6,26].
fR T
Rt tt
n
tt
n11
1
100=−
×=
=
∑∑
(1)
fn
R Tt tt
n2
2
1
0 5
50 1 1 100= + −( )
×
=
−
∑log.
(2)
RESULTS AND DISCUSSION
The lack of a predictive ability of the present FDA recommended dissolution method for carvedilol is attributed to a higher solubility of carvedilol in the recommended dissolution medium and higher agitation intensity which would practically mask, if any changes are expected in the performance of formulation. Thus, the objective of the present study was to evaluate carvedilol from three different products using USP Type II apparatus and compared with the recommended FDA method (SGF).
Solubility plays a prime role in the dissolution of a drug substance from a solid dosage form. Correlations between solubility and intrinsic dissolution rate of different drug substances in various media are well established[9]. The results of the solubility study and the influence of sink conditions of
TABLE 1: MATHEMATICAL MODELS USED TO DESCRIBE THE DISSOLUTION CURVESModel EquationZero-order Q Q k tt = +0 0
First-order InQ InQ ktt = −0 1
Higuchi Q k tt H=Korsmeyer-Peppas Q Q K tt k
n/ ∞ =
Hixon-Crowell Q Q K to t s1 3 1 3/ /− =
Weibull log log log− −
= −( ) −
∞
InQQ
t Ttd1 β α
Baker-Lonsdale32
1 1
23
− −
−
=
∞ ∞
K tt tb
Qt: Amount of drug released in time t, Q0: Initial amount of drug in the Tablet, Qt/Q∞: Fraction of drug released at time t, k0; k1; kH; Kk; Ks; Kb are release rate constants, n: The release exponent, b: Shape parameter, a: Scale parameter α β= ( )
Td, Td: Time parameter (time interval necessary to
release 63.2% of the drug).
www.ijpsonline.com
September - October 2011 Indian Journal of Pharmaceutical Sciences 531
carvedilol are summarized in Table 2. It showed wide variation in solubility in physiological pH range. Carvedilol exhibited higher solubility in pH 4.5 acetate buffer, SGF and 0.1N HCl. In case of pH 6.8 phosphate buffer, solubility was found to be less as compared to solubility in acidic conditions. The solubility of carvedilol in distilled water was found to be 2.89 µg/ ml. The ratio of solubility to drug concentration (dose), expressed as Cs/Cd, represents the closeness to sink conditions; a sink condition occurs when the amount of drug that can be dissolved in the dissolution medium is three times greater than the amount of drug to be dissolved. A low Cs/Cd ratio shows the existence of non-sink conditions.
The rate of drug dissolution will be slowed by the limited solubility of the drug in that medium. In the present study, the value of Cs/Cd was <3 in water and exhibited non-sink conditions.
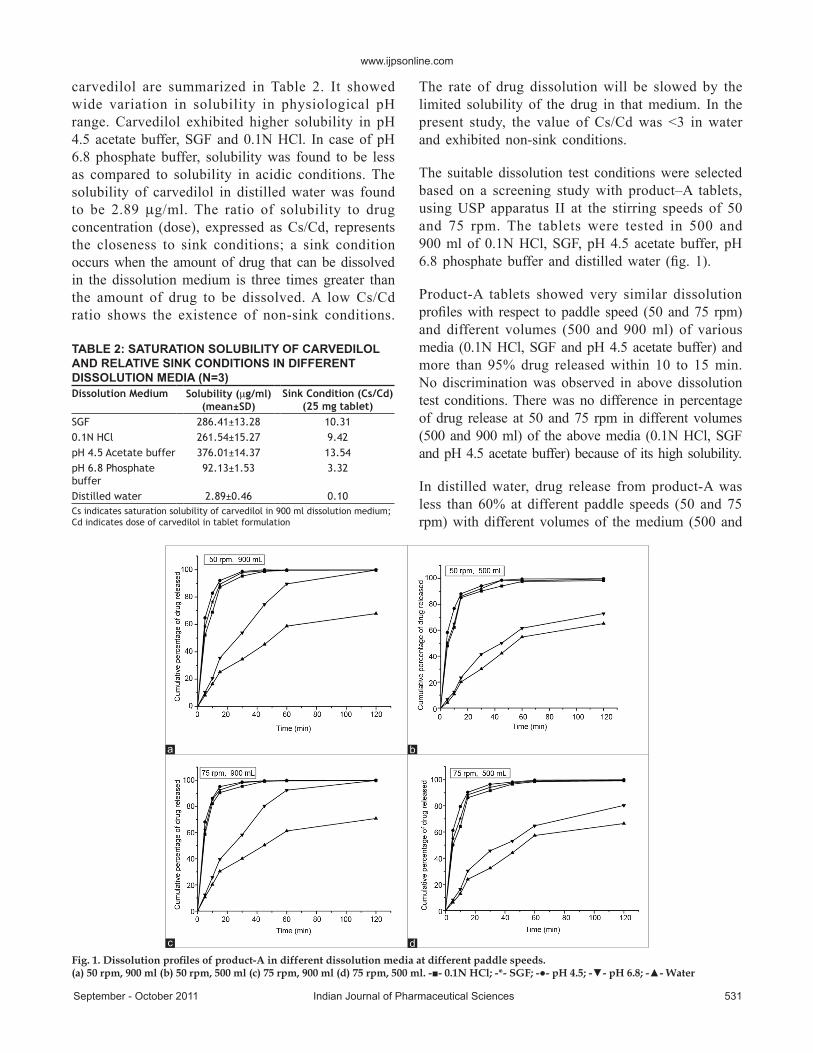
The suitable dissolution test conditions were selected based on a screening study with product–A tablets, using USP apparatus II at the stirring speeds of 50 and 75 rpm. The tablets were tested in 500 and 900 ml of 0.1N HCl, SGF, pH 4.5 acetate buffer, pH 6.8 phosphate buffer and distilled water (fig. 1).
Product-A tablets showed very similar dissolution profiles with respect to paddle speed (50 and 75 rpm) and different volumes (500 and 900 ml) of various media (0.1N HCl, SGF and pH 4.5 acetate buffer) and more than 95% drug released within 10 to 15 min. No discrimination was observed in above dissolution test conditions. There was no difference in percentage of drug release at 50 and 75 rpm in different volumes (500 and 900 ml) of the above media (0.1N HCl, SGF and pH 4.5 acetate buffer) because of its high solubility.
In distilled water, drug release from product-A was less than 60% at different paddle speeds (50 and 75 rpm) with different volumes of the medium (500 and
TABLE 2: SATURATION SOLUBILITY OF CARVEDILOL AND RELATIVE SINK CONDITIONS IN DIFFERENT DISSOLUTION MEDIA (N=3)Dissolution Medium Solubility (µg/ml)
(mean±SD)Sink Condition (Cs/Cd)
(25 mg tablet)SGF 286.41±13.28 10.310.1N HCl 261.54±15.27 9.42pH 4.5 Acetate buffer 376.01±14.37 13.54pH 6.8 Phosphate buffer
92.13±1.53 3.32
Distilled water 2.89±0.46 0.10Cs indicates saturation solubility of carvedilol in 900 ml dissolution medium; Cd indicates dose of carvedilol in tablet formulation
Fig. 1. Dissolution profiles of product-A in different dissolution media at different paddle speeds.(a) 50 rpm, 900 ml (b) 50 rpm, 500 ml (c) 75 rpm, 900 ml (d) 75 rpm, 500 ml. -■- 0.1N HCl; -*- SGF; -●- pH 4.5; -▼- pH 6.8; -▲- Water
a b
c d
www.ijpsonline.com
532 Indian Journal of Pharmaceutical Sciences September - October 2011
900 ml). However, incomplete dissolution might be due to lack of sink conditions. This was evident from Cs/Cd ratio obtained above i.e. <3. The use of distilled water in dissolution testing is usually not recommended primarily due to its limited buffering capacity[1,27].
It was observed that more than 85% of drug was released from product-A at 60 min in 900 ml of pH 6.8 phosphate buffer at 50 and 75 rpm. Whereas in 500 ml pH 6.8 phosphate buffer at 50 and 75 rpm, the percentage of drug release observed was less than 65%. This indicated that the required drug release was not achieved in 500 ml of pH 6.8 phosphate buffer at both paddle speeds due to maintenance of non-sink conditions throughout the dissolution process (Cs/Cd ratio <3). From the obtained results it was observed that rate of dissolution of carvedilol was increased with increase in the volume of the dissolution medium. Product-A showed increased drug release in 900 ml of pH 6.8 phosphate buffer at both the speeds when compared to 500 ml of the same medium due to the maintenance of sink conditions throughout the dissolution process. Use of the slowest calibrated paddle speed (50 rpm) results in a method with a steeper drug release profile, typically leading to a higher discriminating power[28]. Hence the paddle speed 50 rpm was selected. USP apparatus II, 50 rpm, 900 ml of pH 6.8 phosphate buffer were chosen as the conditions for the dissolution method. The drug release profile obtained in the developed dissolution test was considered satisfactory.
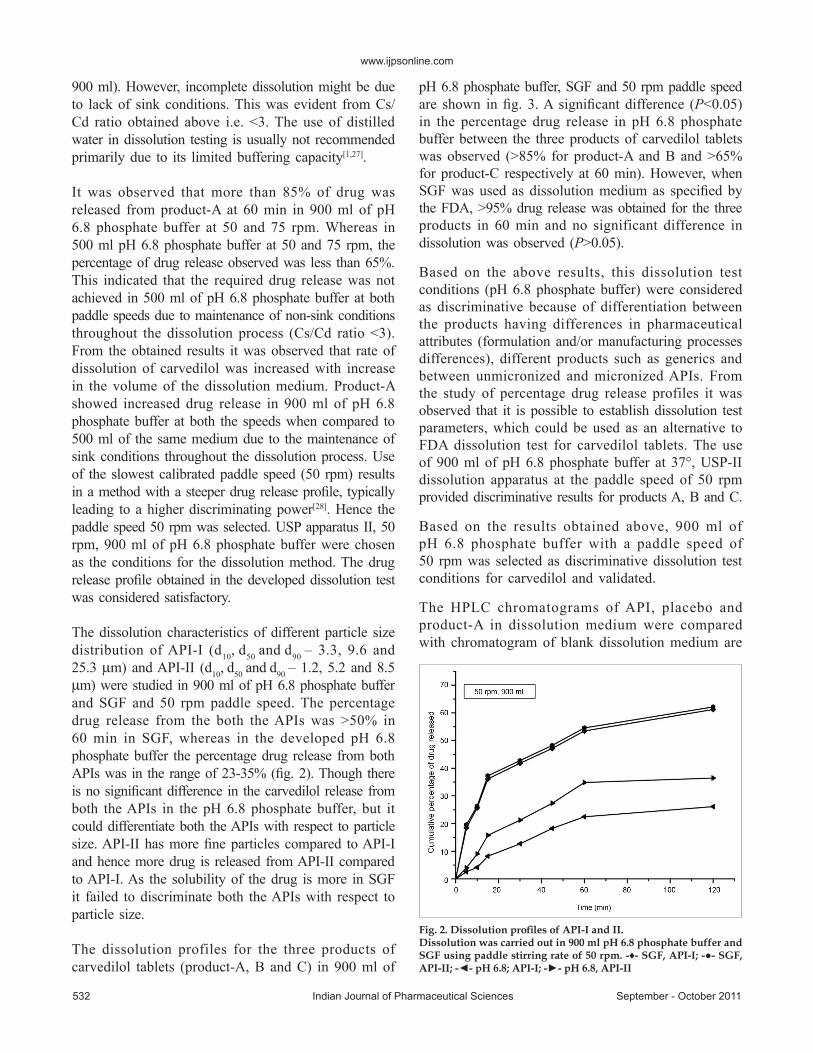
The dissolution characteristics of different particle size distribution of API-I (d10, d50 and d90 – 3.3, 9.6 and 25.3 µm) and API-II (d10, d50 and d90 – 1.2, 5.2 and 8.5 µm) were studied in 900 ml of pH 6.8 phosphate buffer and SGF and 50 rpm paddle speed. The percentage drug release from the both the APIs was >50% in 60 min in SGF, whereas in the developed pH 6.8 phosphate buffer the percentage drug release from both APIs was in the range of 23-35% (fig. 2). Though there is no significant difference in the carvedilol release from both the APIs in the pH 6.8 phosphate buffer, but it could differentiate both the APIs with respect to particle size. API-II has more fine particles compared to API-I and hence more drug is released from API-II compared to API-I. As the solubility of the drug is more in SGF it failed to discriminate both the APIs with respect to particle size.
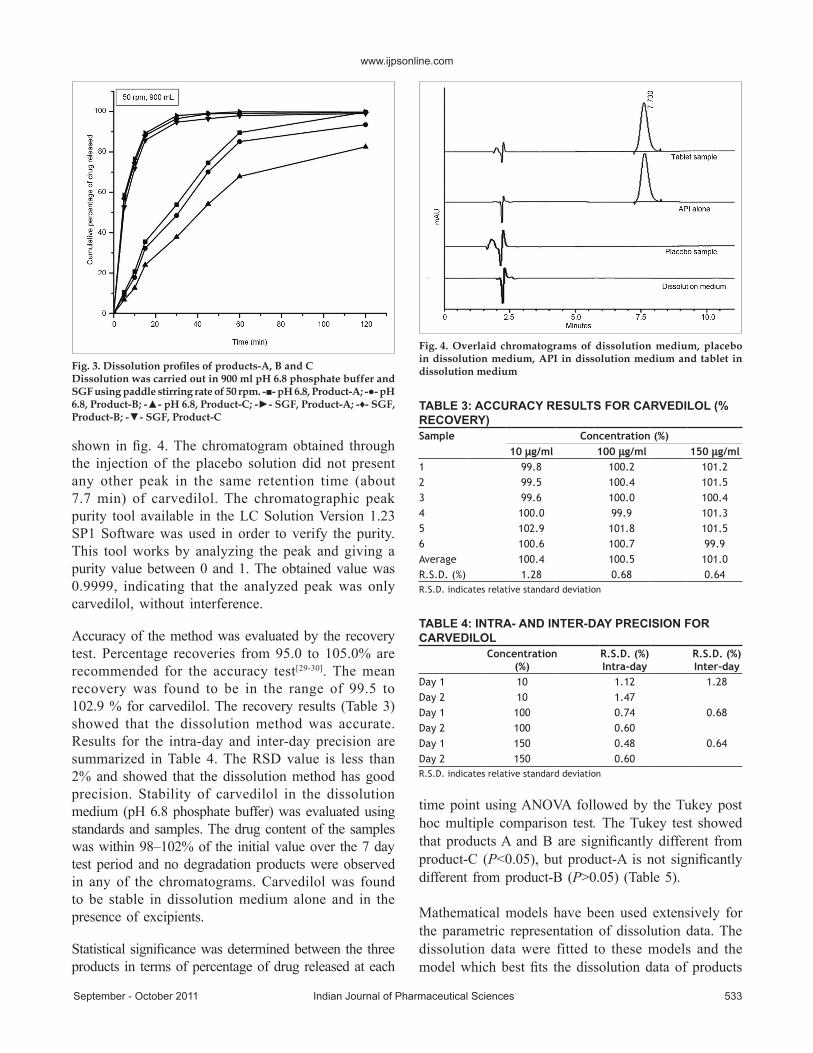
The dissolution profiles for the three products of carvedilol tablets (product-A, B and C) in 900 ml of
pH 6.8 phosphate buffer, SGF and 50 rpm paddle speed are shown in fig. 3. A significant difference (P<0.05) in the percentage drug release in pH 6.8 phosphate buffer between the three products of carvedilol tablets was observed (>85% for product-A and B and >65% for product-C respectively at 60 min). However, when SGF was used as dissolution medium as specified by the FDA, >95% drug release was obtained for the three products in 60 min and no significant difference in dissolution was observed (P>0.05).
Based on the above results, this dissolution test conditions (pH 6.8 phosphate buffer) were considered as discriminative because of differentiation between the products having differences in pharmaceutical attributes (formulation and/or manufacturing processes differences), different products such as generics and between unmicronized and micronized APIs. From the study of percentage drug release profiles it was observed that it is possible to establish dissolution test parameters, which could be used as an alternative to FDA dissolution test for carvedilol tablets. The use of 900 ml of pH 6.8 phosphate buffer at 37°, USP-II dissolution apparatus at the paddle speed of 50 rpm provided discriminative results for products A, B and C.
Based on the results obtained above, 900 ml of pH 6.8 phosphate buffer with a paddle speed of 50 rpm was selected as discriminative dissolution test conditions for carvedilol and validated.
The HPLC chromatograms of API, placebo and product-A in dissolution medium were compared with chromatogram of blank dissolution medium are
Fig. 2. Dissolution profiles of API-I and II.Dissolution was carried out in 900 ml pH 6.8 phosphate buffer and SGF using paddle stirring rate of 50 rpm. -♦- SGF, API-I; -●- SGF, API-II; -◄- pH 6.8; API-I; -►- pH 6.8, API-II
www.ijpsonline.com
September - October 2011 Indian Journal of Pharmaceutical Sciences 533
shown in fig. 4. The chromatogram obtained through the injection of the placebo solution did not present any other peak in the same retention time (about 7.7 min) of carvedilol. The chromatographic peak purity tool available in the LC Solution Version 1.23 SP1 Software was used in order to verify the purity. This tool works by analyzing the peak and giving a purity value between 0 and 1. The obtained value was 0.9999, indicating that the analyzed peak was only carvedilol, without interference.
Accuracy of the method was evaluated by the recovery test. Percentage recoveries from 95.0 to 105.0% are recommended for the accuracy test[29-30]. The mean recovery was found to be in the range of 99.5 to 102.9 % for carvedilol. The recovery results (Table 3) showed that the dissolution method was accurate. Results for the intra-day and inter-day precision are summarized in Table 4. The RSD value is less than 2% and showed that the dissolution method has good precision. Stability of carvedilol in the dissolution medium (pH 6.8 phosphate buffer) was evaluated using standards and samples. The drug content of the samples was within 98–102% of the initial value over the 7 day test period and no degradation products were observed in any of the chromatograms. Carvedilol was found to be stable in dissolution medium alone and in the presence of excipients.
Statistical significance was determined between the three products in terms of percentage of drug released at each
time point using ANOVA followed by the Tukey post hoc multiple comparison test. The Tukey test showed that products A and B are significantly different from product-C (P<0.05), but product-A is not significantly different from product-B (P>0.05) (Table 5).
Mathematical models have been used extensively for the parametric representation of dissolution data. The dissolution data were fitted to these models and the model which best fits the dissolution data of products
TABLE 3: ACCURACY RESULTS FOR CARVEDILOL (% RECOVERY)Sample Concentration (%)
10 µg/ml 100 µg/ml 150 µg/ml1 99.8 100.2 101.22 99.5 100.4 101.53 99.6 100.0 100.44 100.0 99.9 101.35 102.9 101.8 101.56 100.6 100.7 99.9Average 100.4 100.5 101.0R.S.D. (%) 1.28 0.68 0.64R.S.D. indicates relative standard deviation
Fig. 3. Dissolution profiles of products-A, B and CDissolution was carried out in 900 ml pH 6.8 phosphate buffer and SGF using paddle stirring rate of 50 rpm. -■- pH 6.8, Product-A; -●- pH 6.8, Product-B; -▲- pH 6.8, Product-C; -►- SGF, Product-A; -♦- SGF, Product-B; -▼- SGF, Product-C
Fig. 4. Overlaid chromatograms of dissolution medium, placebo in dissolution medium, API in dissolution medium and tablet in dissolution medium
TABLE 4: INTRA- AND INTER-DAY PRECISION FOR CARVEDILOL
Concentration (%)
R.S.D. (%) Intra-day
R.S.D. (%) Inter-day
Day 1 10 1.12 1.28Day 2 10 1.47Day 1 100 0.74 0.68Day 2 100 0.60Day 1 150 0.48 0.64Day 2 150 0.60R.S.D. indicates relative standard deviation
www.ijpsonline.com
534 Indian Journal of Pharmaceutical Sciences September - October 2011
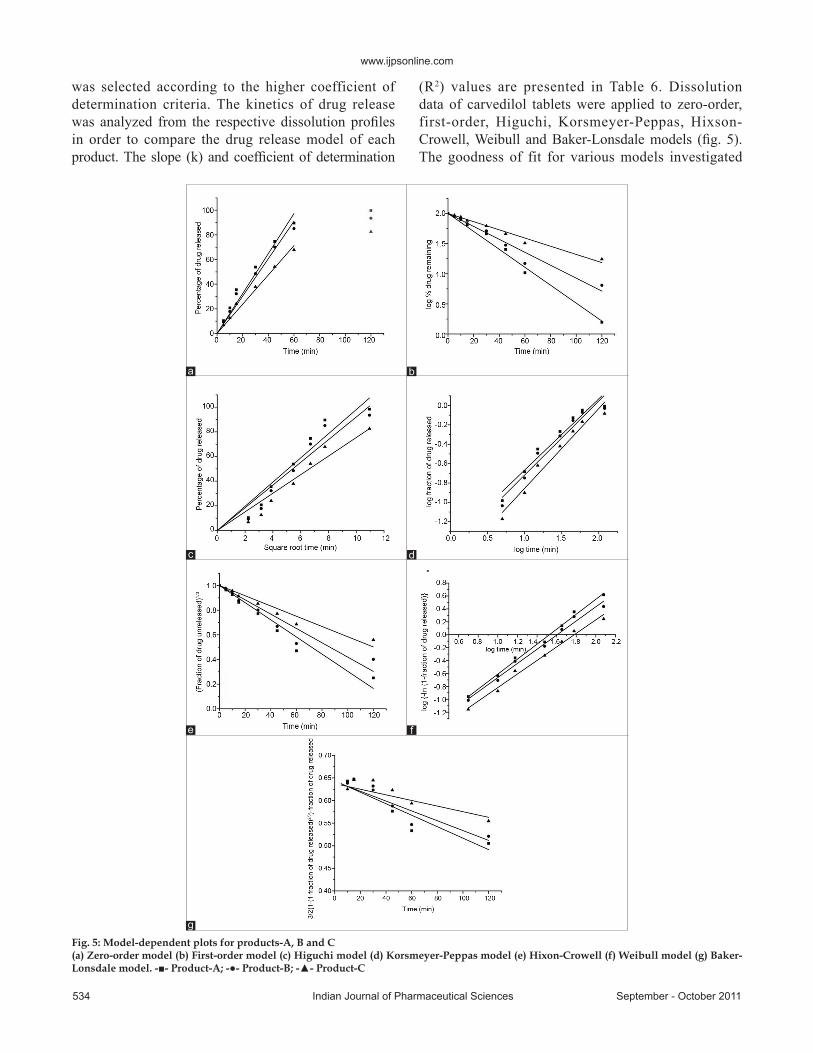
was selected according to the higher coefficient of determination criteria. The kinetics of drug release was analyzed from the respective dissolution profiles in order to compare the drug release model of each product. The slope (k) and coefficient of determination
(R2) values are presented in Table 6. Dissolution data of carvedilol tablets were applied to zero-order, first-order, Higuchi, Korsmeyer-Peppas, Hixson-Crowell, Weibull and Baker-Lonsdale models (fig. 5). The goodness of fit for various models investigated
Fig. 5: Model-dependent plots for products-A, B and C (a) Zero-order model (b) First-order model (c) Higuchi model (d) Korsmeyer-Peppas model (e) Hixon-Crowell (f) Weibull model (g) Baker-Lonsdale model. -■- Product-A; -●- Product-B; -▲- Product-C
a b
c d
e f
g

www.ijpsonline.com
September - October 2011 Indian Journal of Pharmaceutical Sciences 535
for products ranks in the order of Weibull>first-order>zero-order>Higuchi>Korsmeyer-Peppas>Hixson-Crowell>Baker-Lonsdale. Weibull distribution model gave the highest coefficient of determination (R2) and showed the best suitability for all dissolution data. The derived model parameters, Td (time interval necessary to release 63.2% of the drug) and β (shape factor), were compared in three products using t-test and found to be significantly different (P<0.05).
The values of f1 and f2 factors for products A, B and C were calculated from the means of percentage of drug released at each time point by using Eqs. 1 and 2 and the results are listed in Table 7. According to the f-criteria, it can be concluded that the A/B dissolution profiles were similar and A/C, B/C dissolution profiles were dissimilar.
In conclusion, a robust, discriminating dissolution method was developed for carvedilol tablets. An initial study was conducted by evaluating the dissolution profiles of product-A by using different
dissolution media, volume of the medium and paddle stirring speeds. The use of pH 6.8 phosphate buffer at 37±0.5º, 900 ml, 50 rpm provided satisfactory results. Dissolution profiles of API-I and II and product-A, B and C were tested, evaluated in pH 6.8 phosphate buffer and compared with FDA recommended dissolution medium. A new discriminating dissolution test method was developed and validated according to the current ICH and FDA guidelines to support formulation development. ANOVA-based method gave more discrimination and showed that there is statistically significant difference between the products A, B and C. Drug release from the products A, B and C corresponds best to the Weibull model suggests a meaningful comparison of level (location) and homogeneity in profile shape. The comparison of the obtained dissolution profiles was realized by the factors f1 and f2 and showed that the profiles were similar for product-B and dissimilar for product-C when compared with the product-A. Each method used here for the comparison of dissolution profiles seems to be applicable and useful. This discriminative dissolution method can be used to optimize the formulation and manufacturing process, to assess the quality and performance of each tablet lot, and to minimize the risk of releasing bioinequivalent product batches in the market.
ACKNOWLEDGEMENTS
One of the authors, Vengaladasu Raju would like to thank the CSIR, New Delhi, India for providing Senior Research Fellowship (No. 09/002/ (0483)/2008/EMR-I). Authors are thankful to Dr. Reddy’s Laboratories, Hyderabad and Sun Pharma Advanced Research Company (SPARC), Vadodara for the generous gift sample of carvedilol.
TABLE 6: PARAMETERS OF THE MATHEMATICAL MODELS AND DESCRIPTIVE STATISTICS OF REGRESSION FOR THE DISSOLUTION DATAModel Statistics Product-A Product-B Product-CZero-order R2 0.988 0.982 0.975
k0 1.130 1.415 1.484First-order R2 0.990 0.958 0.974
k1 0.015 0.010 0.006Higuchi R2 0.974 0.973 0.976
kH 7.536 9.201 9.804Korsmeyer-Peppas R2 0.956 0.938 0.935
Kk 0.032 0.037 0.033n 0.824 0.764 0.734
Hixson-Crowell R2 0.953 0.913 0.946ks 0.006 0.005 0.004
Weibull R2 0.992 0.991 0.990b 1.049 1.097 1.160Td 36.63 40.43 54.94α 43.69 57.88 104.3
Baker-Lonsdale R2 0.818 0.773 0.503Kb 0.001 0.001 0.001
k0; k1; kH; Kk; Ks; Kb are release rate constants, b: shape parameter, n: the release exponent, Td: time parameter (time interval necessary to release 63.2% of the drug), a: scale parameter α β= ( )
Td. Korsmeyer-Peppas
model fits to the initial 60% of drug release.
TABLE 7: F1 AND F2 FACTORS FOR EACH COMPARISON OF DISSOLUTION PROFILES OF PRODUCTS AT pH 6.8 PHOSPHATE BUFFERComparison f1
a f2 Dissolution profile
A vs B 7.22 67.94 SimilarA vs C 25.70 40.59 DissimilarB vs C 19.92 47.28 Dissimilara The first f1 value is obtained when the first formulation on the left column is set as reference.
TABLE 5: TUKEY’S MULTIPLE COMPARISON TEST FOR PRODUCTSComparison Mean Diff q P Significant P<0.05 95% LCL 95% UCLA vs B 3.97 2.96 0.133 No -1.08 9.02A vs C 14.12 10.54 <0.001 Yes 9.06 19.17B vs C 10.15 7.58 <0.001 Yes 5.09 15.20LCL indicates lower control limit and UCL indicates upper control limit
www.ijpsonline.com
536 Indian Journal of Pharmaceutical Sciences September - October 2011
REFERENCES
1. Tzanavaras PD, Themelis DG, Zotou A, Stratis J, Karlberg B. Optimization and validation of a dissolution test for selegiline hydrochloride tablets by a novel rapid HPLC assay using a monolithic stationary phase. J Pharm Biomed Anal 2008;46:670-5.
2. Rossi RC, Dias CL, Donato EM, Martins LA, Bergold AM, Froehlich PE. Development and validation of dissolution test for ritonavir soft gelatin capsules based on in vivo data. Int J Pharm 2007;338:119-24.
3. Maggio RM, Castellano PM, Kaufman TS. A new principal component analysis-based approach for testing “similarity” of drug dissolution profiles. Eur J Pharm Sci 2008;34:66-77.
4. Hoti E, Censi R, Ricciutelli M, Malaj L, Barboni L, Martelli S, et al. Validation of an HPLC-MS method for rociverine tablet dissolution analysis. J Pharm Biomed Anal 2008;47:422-8.
5. Adams E, De Maesschalck R, De Spiegeleer B, Vander Heyden Y, Smeyers-Verbeke J, Massart DL. Evaluation of dissolution profiles using principal component analysis. Int J Pharm 2001;212:41-53.
6. Yuksel N, Kanik AE, Baykara T. Comparison of in vitro dissolution profiles by ANOVA-based, model-dependent and -independent methods. Int J Pharm 2000;209:57-67.
7. Brown CK, Chokshi HP, Nickerson B, Reed RA, Rohrs BR, Shah PA. Acceptable Analytical Practices for Dissolution Testing of Poorly Soluble Compounds. Pharm Technol 2004;28:56-65.
8. Carvalho-Silva B, Moreira-Campos LM, Nunan EA, Vianna-Soares CD, Araujo-Alves BL, Cesar IC, et al. Optimization and statistical evaluation of dissolution tests for indinavir sulfate capsules. Farmaco 2004;59:921-7.
9. He Z, Zhong D, Chen X, Liu X, Tang X, Zhao L. Development of a dissolution medium for nimodipine tablets based on bioavailability evaluation. Eur J Pharm Sci 2004;21:487-91.
10. Jamzad S, Fassihi R. Role of surfactant and pH on dissolution properties of fenofibrate and glipizide- a technical note. AAPS PharmSciTech 2006;7:E17-E22.
11. Eryol C, Demirturk E, Oner L. Preparation of meloxicam tablet formulations and evaluation of in vitro release similarities. FABAD J Pharm Sci 2004;29:53-61.
12. Pokharkar VB, Mandpe LP, Padamwar MN, Ambike AA, Mahadik KR, Paradkar A. Development, characterization and stabilization of amorphous form of a low Tg drug. Powder Technol 2006;167:20-5.
13. Wei L, Sun P, Nie S, Pan W. Preparation and evaluation of SEDDS and SMEDDS containing carvedilol. Drug Develop Ind Pharm 2005;31:785-94.
14. Agnihotri SA, Aminabhavi TM. Development of novel interpenetrating network gellan gum-poly(vinyl alcohol) hydrogel microspheres for the controlled release of carvedilol. Drug Develop Ind Pharm 2005;31:491-503.
15. Loftsson T, Vogensen SB, Desbos C, Jansook P. Carvedilol: solubilization and cyclodextrin complexation: A technical note. AAPS
PharmSciTech 2008;9:425-30.16. Rathod R, Prasad LP, Rani S, Nivsarkar M, Padh H. Estimation of
carvedilol in human plasma by using HPLC-fluorescence detector and its application to pharmacokinetic study. J Chromatogr B: Anal Technol Biomed Life Sci 2007;857:219-23.
17. FDA Recommended Dissolution Methods, available from: <http://www.accessdata.fda.gov/scripts/cder/dissolution/index.cfm> [Last accessed on 2010 Jan 11]
18. Gannu R, Yamsani VV, Rao YM. New RP-HPLC method with UV-detection for the determination of carvedilol in human serum. J Liq Chromatogr Relat Technol 2007;30:1677-85.
19. O’Hara T, Dunne A, Butler J, Devane J. A review of methods used to compare dissolution profile data. Pharm Sci Technol Today 1998;1:214-23.
20. Patel N, Chotai N, Patel J, Soni T, Desai J, Patel R. Comparison of in vitro dissolution profiles of oxcarbazepine-HP-β-CD tablet formulations with marketed oxcarbazepine tablets. Dissol Technol 2008;15:28-34.
21. Polli JE, Rekhi GS, Shah VP. Methods to Compare Dissolution Profiles. Drug Inf J 1996;30:1113-20.
22. Polli JE, Rekhi GS, Augsburger LL, Shah VP. Methods to compare dissolution profiles and a rationale for wide dissolution specifications for metoprolol tartrate tablets. J Pharm Sci 1997;86:690-700.
23. Costa P, Sousa Lobo JM. Modeling and comparison of dissolution profiles. Eur J Pharm Sci 2001;13:123-33.
24. Ahuja N, Katare OP, Singh B. Studies on dissolution enhancement and mathematical modeling of drug release of a poorly water-soluble drug using water-soluble carriers. Eur J Pharm Biopharm 2007; 65:26-38.
25. FDA. Guidance for Industry: Dissolution Testing of Immediate Release Solid Oral Dosage Forms. Center for Drug Evaluation and Research (CDER), Food and Drug Administration, Rockville;1997.
26. Moore JW, Flanner HH. Mathematical comparison of dissolution profiles. Pharm Technol 1996;20:64-75.
27. Lee SL, Raw AS, Yu L. Dissolution testing. In: Krishna R, Yu L, editors, Biopharmaceutics Application in Drug Development, New Jersey: Springer; 2008. p 47-74.
28. Lagace M, Gravelle L, Di Maso M, McClintock S. Developing a discriminating dissolution procedure for a dual active pharmaceutical product with unique solubility characteristics. Dissol Technol 2004;11:13-8.
29. The United States Pharmacopoeia. The dissolution procedure: Development and validation. Pharmacopeial Forum 2004;30:351-63.
30. The United States Pharmacopoeia 29th ed. Rockville: The United States Pharmacopeial Convention; 2006.
Accepted 5 October 2011Revised 1 October 2011
Received 12 July 2010Indian J. Pharm. Sci., 2011, 73 (5): 527-536