Embed Size (px)
Citation preview
toxins
Article
Development and Validation of a UPLC-MS/MS andUPLC-HR-MS Method for the Determination ofFumonisin B1 and Its Hydrolysed Metabolites andFumonisin B2 in Broiler Chicken Plasma
Siegrid De Baere 1,*, Siska Croubels 1 ID , Barbara Novak 2, Gerlinde Bichl 2
and Gunther Antonissen 1,3 ID
1 Department of Pharmacology, Toxicology and Biochemistry, Salisburylaan 133, 9820 Merelbeke, Belgium;[email protected] (S.C.); [email protected] (G.A.)
2 BIOMIN Research Center, Technopark 1, 3430 Tulln, Austria; [email protected] (B.N.);[email protected] (G.B.)
3 Department of Pathology, Bacteriology and Avian Diseases, Salisburylaan 133, 9820 Merelbeke, Belgium* Correspondence: [email protected]; Tel.: +32-9-264-7348
Received: 14 December 2017; Accepted: 29 January 2018; Published: 31 January 2018
Abstract: A sensitive and specific method for the quantitative determination of Fumonisin B1 (FB1),its partially hydrolysed metabolites pHFB1a+b and hydrolysed metabolite HFB1, and FumonisinB2 (FB2) in broiler chicken plasma using ultra-performance liquid chromatography combined withtandem mass spectrometry (UPLC-MS/MS) was developed. The sample preparation was rapid,straightforward and consisted of a deproteinization and phospholipid removal step using an Oasis®
OstroTM 96-well plate. Chromatography was performed on an Acquity HSS-T3 column, using 0.3%formic acid and 10 mM ammonium formate in water, and acetonitrile as mobile phases. The MS/MSinstrument was operated in the positive electrospray ionization mode and the two multiple reactionmonitoring transitions were monitored for each component for quantification and identification,respectively. The method was validated in-house: matrix-matched calibration graphs were preparedand good linearity (r≥ 0.99) was achieved over the concentration ranges tested (1–500 ng/mL for FB1and FB2; 0.86–860 ng/mL for pHFB1a; 0.72–1430 ng/mL for pHFB1b and 2.5–2500 ng/mL for HFB1).Limits of quantification (LOQ) and detection (LOD) in plasma ranged between 0.72 to 2.5 ng/mLand 0.03 to 0.17 ng/mL, respectively. The results for the within-day and between-day precisionand accuracy fell within the specified ranges. Moreover, the method was transferred to an UPLChigh-resolution mass spectrometry (HR-MS) instrument in order to determine potential metabolitesof HFB1, such as N-acyl-HFB1s and phase II metabolites. The method has been successfully appliedto investigate the toxicokinetics and biotransformation of HFB1 in broiler chickens.
Keywords: fumonisin B1; hydrolysed FB1; fumonisin B2; UPLC-MS/MS; UPLC-HR-MS; plasma;broiler chickens; toxicokinetics
1. Introduction
Fumonisins (FBs) are secondary metabolites of fungi, such as Fusarium verticillioides,Fusarium proliferatum and Aspergillus niger, which frequently contaminate maize and maize-basedproducts [1–4]. Fumonisin B1 (FB1) is the most prevalent component of the family and is hepato- andnephrotoxic in a variety of animal species, although it is poorly absorbed and rapidly excreted [1,4–7].FB1 is associated with a number of mycotoxicoses, such as equine leukoencephalomalacia [5], porcinepulmonary oedema [5,6] and hepatocarcinoma in rats [8,9].
Toxins 2018, 10, 62; doi:10.3390/toxins10020062 www.mdpi.com/journal/toxins
Toxins 2018, 10, 62 2 of 20
FB1 (Figure 1) includes a long-chain aminopolyol (AP1) backbone (2-amino-12,16-dimethyl-3,5,10,14,15-pentahydroxyeicosane) with two ester-linked tricarballylic acids at C14 and C15(propane-1,2,3-tricarboxylic acid, TCA) [1,10]. It is a competitive inhibitor of the enzyme ceramidesynthase (CerS) and disrupts sphingolipid metabolism due to the structural similarity between FB1and sphinganine (Sa) or sphingosine (So), which are CerS substrates [1,2,4,9]. The elevation of the freeSa/So ratio in biological matrices was suggested as an efficient biomarker.
FB1 can be converted to partially hydrolysed FB1 (pHFB1a and pHFB1b) and hydrolysed FB1(HFB1) by the cleavage of the TCA side chains at C14 and C15 (Figure 1) through alkaline hydrolysisduring food and feed processing (nixtamalization) [2,6,11]. Hence, animals can be exposed not onlyto the parent compound FB1, but also to the hydrolysed forms. Moreover, it has been demonstratedin pigs that FB1 can be metabolized by carboxylesterase(s) into pHFB1 and HFB1 by the intestinalmicrobiota and the liver [1,12], whereas it is not known if these metabolites are formed in avian species.
Toxins 2018, 10, x FOR PEER REVIEW 2 of 21
[1–4]. Fumonisin B1 (FB1) is the most prevalent component of the family and is hepato‐ and
nephrotoxic in a variety of animal species, although it is poorly absorbed and rapidly excreted [1,4–
7]. FB1 is associated with a number of mycotoxicoses, such as equine leukoencephalomalacia [5],
porcine pulmonary oedema [5,6] and hepatocarcinoma in rats [8,9].
FB1 (Figure 1) includes a long‐chain aminopolyol (AP1) backbone
(2‐amino‐12,16‐dimethyl‐3,5,10,14,15‐pentahydroxyeicosane) with two ester‐linked tricarballylic
acids at C14 and C15 (propane‐1,2,3‐tricarboxylic acid, TCA) [1,10]. It is a competitive inhibitor of
the enzyme ceramide synthase (CerS) and disrupts sphingolipid metabolism due to the structural
similarity between FB1 and sphinganine (Sa) or sphingosine (So), which are CerS substrates [1,2,4,9].
The elevation of the free Sa/So ratio in biological matrices was suggested as an efficient biomarker.
FB1 can be converted to partially hydrolysed FB1 (pHFB1a and pHFB1b) and hydrolysed FB1
(HFB1) by the cleavage of the TCA side chains at C14 and C15 (Figure 1) through alkaline
hydrolysis during food and feed processing (nixtamalization) [2,6,11]. Hence, animals can be
exposed not only to the parent compound FB1, but also to the hydrolysed forms. Moreover, it has
been demonstrated in pigs that FB1 can be metabolized by carboxylesterase(s) into pHFB1 and
HFB1 by the intestinal microbiota and the liver [1,12], whereas it is not known if these metabolites
are formed in avian species.
Analyte R1 R2 R3 R4 R5
FB1 TCA TCA OH OH H
FB2 TCA TCA H OH H
FB3 TCA TCA OH H H
pHFB1a TCA H OH OH H
pHFB1b H TCA OH OH H
HFB1 H H OH OH H
NAHFB1 H H OH OH NA
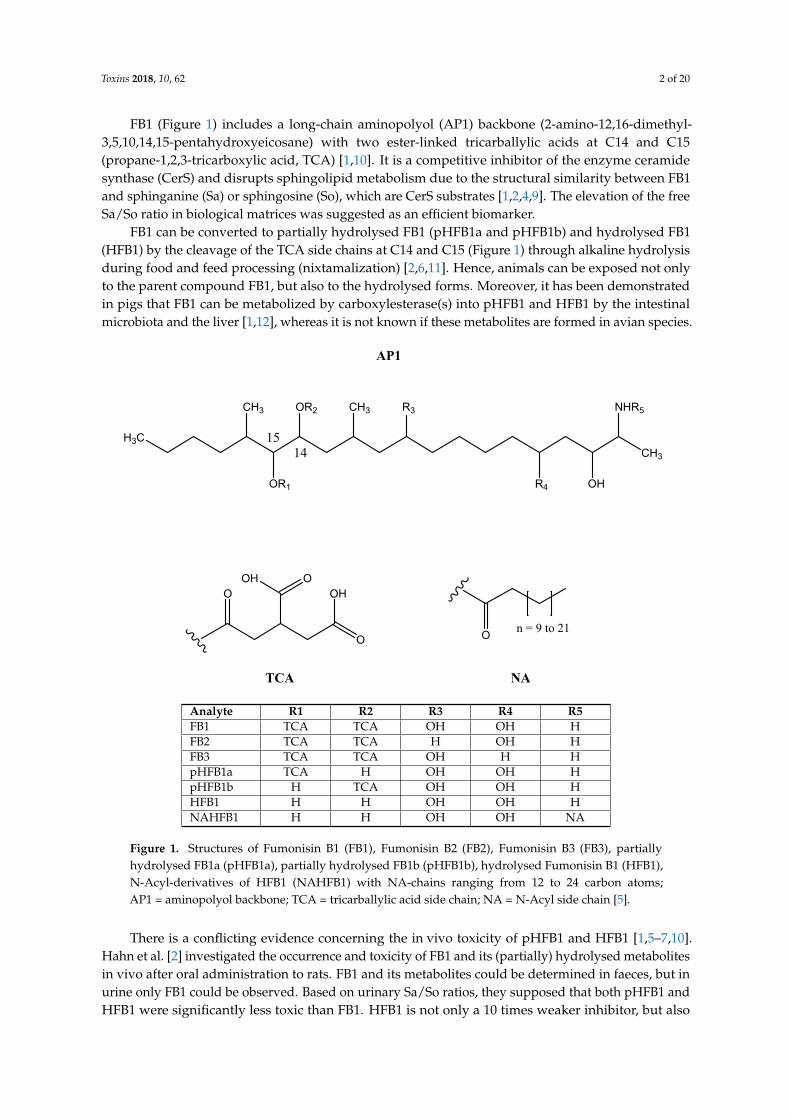
Figure 1. Structures of Fumonisin B1 (FB1), Fumonisin B2 (FB2), Fumonisin B3 (FB3), partially
hydrolysed FB1a (pHFB1a), partially hydrolysed FB1b (pHFB1b), hydrolysed Fumonisin B1 (HFB1),
N‐Acyl‐derivatives of HFB1 (NAHFB1) with NA‐chains ranging from 12 to 24 carbon atoms; AP1 =
aminopolyol backbone; TCA = tricarballylic acid side chain; NA = N‐Acyl side chain [5].
H3CCH3
CH3
OR1
OR2 CH3 R3
R4 OH
NHR5
OOH O
OH
O On = 9 to 21
1415
AP1
TCA NA
Analyte R1 R2 R3 R4 R5FB1 TCA TCA OH OH HFB2 TCA TCA H OH HFB3 TCA TCA OH H HpHFB1a TCA H OH OH HpHFB1b H TCA OH OH HHFB1 H H OH OH HNAHFB1 H H OH OH NA
Figure 1. Structures of Fumonisin B1 (FB1), Fumonisin B2 (FB2), Fumonisin B3 (FB3), partiallyhydrolysed FB1a (pHFB1a), partially hydrolysed FB1b (pHFB1b), hydrolysed Fumonisin B1 (HFB1),N-Acyl-derivatives of HFB1 (NAHFB1) with NA-chains ranging from 12 to 24 carbon atoms;AP1 = aminopolyol backbone; TCA = tricarballylic acid side chain; NA = N-Acyl side chain [5].
There is a conflicting evidence concerning the in vivo toxicity of pHFB1 and HFB1 [1,5–7,10].Hahn et al. [2] investigated the occurrence and toxicity of FB1 and its (partially) hydrolysed metabolitesin vivo after oral administration to rats. FB1 and its metabolites could be determined in faeces, but inurine only FB1 could be observed. Based on urinary Sa/So ratios, they supposed that both pHFB1 andHFB1 were significantly less toxic than FB1. HFB1 is not only a 10 times weaker inhibitor, but also
Toxins 2018, 10, 62 3 of 20
a substrate for CerS in rat liver microsomes [2,4,5,9,13] and can be acetylated at the primary aminogroup with fatty acids of various chain lengths to form ceramide analogues known as N-acyl-HFB1s(NAHFB1s). In addition, some authors reported the in vivo formation of NAHFB1s in liver andkidney of rats exposed to HFB1 [5]. Therefore, elimination of the TCA side chains of FB1 bycarboxylesterase is not sufficient for FB1 detoxification and elimination of the C2-amino group of HFB1by aminotransferase is essential as well [9]. No data on the in vivo toxicokinetics of HFB1 are availablein other animal species besides the rat, nor on the formation of NAHFB1s.
To extend the current knowledge of the biotransformation of FB1 and its in vivo metabolitesand to investigate the toxicokinetics of these components, sensitive analytical methods are necessaryto detect the generally low concentrations in biological matrices. Currently, there are only a fewmethods available for the determination of FB1 and its metabolites in biological matrices ofanimal origin: high-performance liquid chromatography (HPLC) methods with fluorescence (FL)detection after derivatisation with o-phthaldialdehyde (OPA) reagent were reported for the analysisof FB1 in rat plasma and urine [14] or FB1 and its metabolites in ruminal fluid [8]. To omitthe time-consuming derivatisation procedure, liquid chromatography in combination with massspectrometric detection (LC-MS) was used for the determination of FB1 and its hydrolysed orN-acetylated metabolites in animal biological matrices, such as urine, faeces and tissues [2,7,10,12]or plasma [15]. Sample preparation consisted of protein precipitation using acetonitrile (ACN) [15]or liquid-liquid extraction (LLE) in polar solvents, such as mixtures of methanol, ACN, ethyl acetate(EtOAc), chloroform or aceton with water [2,4,5,12]. In some cases, acids were added, such ashydrochloric acid, sulfuric acid, formic acid (FA) to enhance the extraction of analytes due to theiracidic properties [16]. Other authors applied solid-phase extraction (SPE) [17] or a combination ofprotein precipitation, LLE and SPE to purify the samples prior to LC-MS analysis [7,10,18].
Until now, no data on the toxicokinetics of FB1 and its hydrolysed metabolites in avian species areavailable. In addition, sensitive and straightforward analytical methods for the determination of thesecomponents in animal plasma are scarce. Therefore, it was the aim of this study to develop and validatean ultra-performance liquid chromatography tandem mass spectrometry (UPLC-MS/MS) methodfor the simultaneous quantitative determination of FB1 and its hydrolysed metabolites (pHFB1a+b,HFB1) in broiler chicken plasma. The validated method was applied to the analysis of plasma samplesthat were taken as a part of a toxicokinetic (TK) study with HFB1 in chickens fed a control and a FBscontaminated diet for two weeks. To investigate possible N-acyl-metabolites of HFB1, the method wasalso transferred to an UPLC high-resolution mass spectrometry (HR-MS) instrument.
2. Results and Discussion
During method development, the following points of interest were taken into account. First,the sample preparation procedure had to be straightforward and cost-effective, since it was the final aimto analyse a high number of samples per day (n ≥ 96). Secondly, to be able to analyse all these sampleswithin 24 h, the UPLC-MS/MS analysis had to be accomplished within a short run-time (≤10 min).
2.1. Sample Preparation
The preferred extraction methods for FBs in biological matrices (urine, faeces, tissues) aresingle-step or multiple-step LLE alone [2,4,5,12], or in combination with a SPE clean-up [7,10,17].For the present study, LLE using diethylether and EtOAc at two different pH levels (2 and 7)was evaluated.
In addition, a more generic sample preparation procedure, based on protein precipitation by 1%FA in ACN in combination with phospholipid (PL) removal, using OstroTM 96-well plates was tested.This procedure was based on that reported by De Baere et al. [19] for the analysis of gamithromycinin chicken plasma. Indeed, during this study analytical problems were observed when a simpleprotein precipitation step with ACN was applied for sample clean-up, which could be attributed to thepresence of high amounts of PLs in the deproteinized sample. Ferlazzo et al. [20] indeed reported that
Toxins 2018, 10, 62 4 of 20
phosphatidylcholine and sphingomyelin levels were significantly higher in chicken plasma comparedto other species tested (pigs, cows, horses and ostriches) and Chambers et al. [21] mentioned that matrixcomponents and endogenous PLs in particular, can be a serious source of imprecision in quantitativeLC-MS/MS analysis.
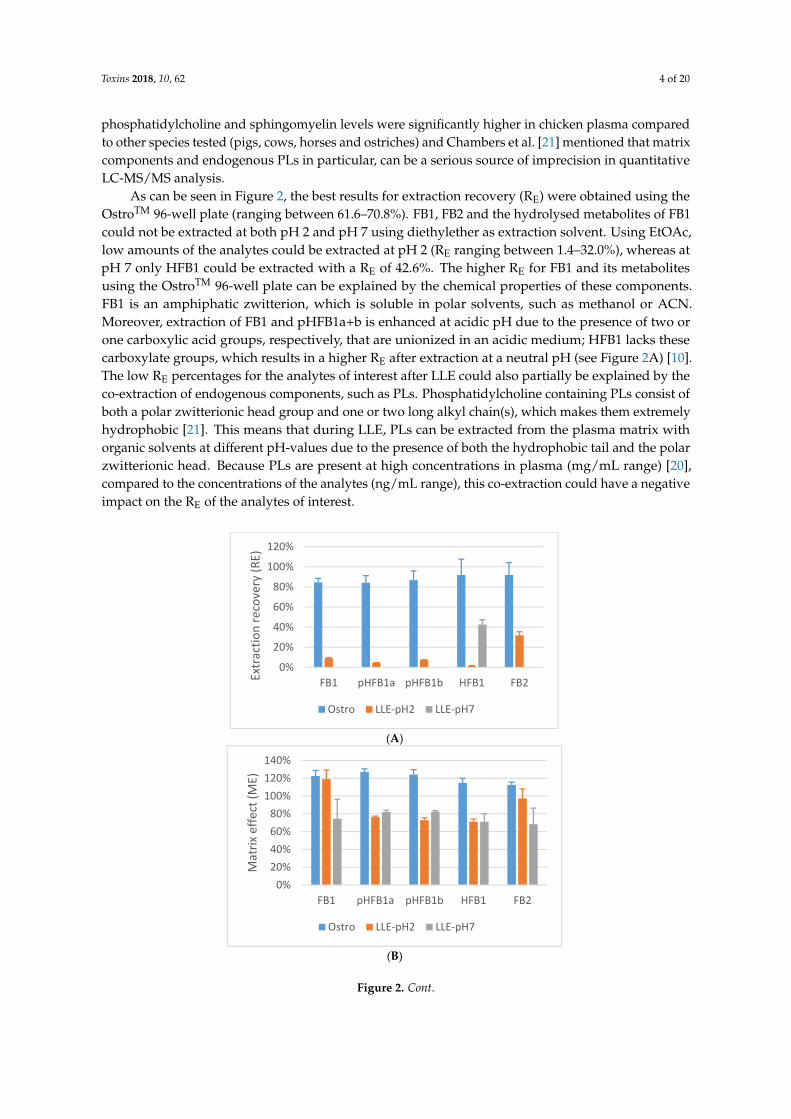
As can be seen in Figure 2, the best results for extraction recovery (RE) were obtained using theOstroTM 96-well plate (ranging between 61.6–70.8%). FB1, FB2 and the hydrolysed metabolites of FB1could not be extracted at both pH 2 and pH 7 using diethylether as extraction solvent. Using EtOAc,low amounts of the analytes could be extracted at pH 2 (RE ranging between 1.4–32.0%), whereas atpH 7 only HFB1 could be extracted with a RE of 42.6%. The higher RE for FB1 and its metabolitesusing the OstroTM 96-well plate can be explained by the chemical properties of these components.FB1 is an amphiphatic zwitterion, which is soluble in polar solvents, such as methanol or ACN.Moreover, extraction of FB1 and pHFB1a+b is enhanced at acidic pH due to the presence of two orone carboxylic acid groups, respectively, that are unionized in an acidic medium; HFB1 lacks thesecarboxylate groups, which results in a higher RE after extraction at a neutral pH (see Figure 2A) [10].The low RE percentages for the analytes of interest after LLE could also partially be explained by theco-extraction of endogenous components, such as PLs. Phosphatidylcholine containing PLs consist ofboth a polar zwitterionic head group and one or two long alkyl chain(s), which makes them extremelyhydrophobic [21]. This means that during LLE, PLs can be extracted from the plasma matrix withorganic solvents at different pH-values due to the presence of both the hydrophobic tail and the polarzwitterionic head. Because PLs are present at high concentrations in plasma (mg/mL range) [20],compared to the concentrations of the analytes (ng/mL range), this co-extraction could have a negativeimpact on the RE of the analytes of interest.
Toxins 2018, 10, x FOR PEER REVIEW 4 of 21
In addition, a more generic sample preparation procedure, based on protein precipitation by 1%
FA in ACN in combination with phospholipid (PL) removal, using OstroTM 96‐well plates was tested.
This procedure was based on that reported by De Baere et al. [19] for the analysis of gamithromycin
in chicken plasma. Indeed, during this study analytical problems were observed when a simple
protein precipitation step with ACN was applied for sample clean‐up, which could be attributed to
the presence of high amounts of PLs in the deproteinized sample. Ferlazzo et al. [20] indeed reported
that phosphatidylcholine and sphingomyelin levels were significantly higher in chicken plasma
compared to other species tested (pigs, cows, horses and ostriches) and Chambers et al. [21]
mentioned that matrix components and endogenous PLs in particular, can be a serious source of
imprecision in quantitative LC‐MS/MS analysis.
As can be seen in Figure 2, the best results for extraction recovery (RE) were obtained using the
OstroTM 96‐well plate (ranging between 61.6–70.8%). FB1, FB2 and the hydrolysed metabolites of FB1
could not be extracted at both pH 2 and pH 7 using diethylether as extraction solvent. Using EtOAc,
low amounts of the analytes could be extracted at pH 2 (RE ranging between 1.4–32.0%), whereas at
pH 7 only HFB1 could be extracted with a RE of 42.6%. The higher RE for FB1 and its metabolites
using the OstroTM 96‐well plate can be explained by the chemical properties of these components.
FB1 is an amphiphatic zwitterion, which is soluble in polar solvents, such as methanol or ACN.
Moreover, extraction of FB1 and pHFB1a+b is enhanced at acidic pH due to the presence of two or
one carboxylic acid groups, respectively, that are unionized in an acidic medium; HFB1 lacks these
carboxylate groups, which results in a higher RE after extraction at a neutral pH (see Figure 2A) [10].
The low RE percentages for the analytes of interest after LLE could also partially be explained by the
co‐extraction of endogenous components, such as PLs. Phosphatidylcholine containing PLs consist
of both a polar zwitterionic head group and one or two long alkyl chain(s), which makes them
extremely hydrophobic [21]. This means that during LLE, PLs can be extracted from the plasma
matrix with organic solvents at different pH‐values due to the presence of both the hydrophobic tail
and the polar zwitterionic head. Because PLs are present at high concentrations in plasma (mg/mL
range) [20], compared to the concentrations of the analytes (ng/mL range), this co‐extraction could
have a negative impact on the RE of the analytes of interest.
(A)
(B)
0%
20%
40%
60%
80%
100%
120%
FB1 pHFB1a pHFB1b HFB1 FB2Extraction recovery (RE)
Ostro LLE‐pH2 LLE‐pH7
0%
20%
40%
60%
80%
100%
120%
140%
FB1 pHFB1a pHFB1b HFB1 FB2
Matrix effect (ME)
Ostro LLE‐pH2 LLE‐pH7
Figure 2. Cont.
Toxins 2018, 10, 62 5 of 20
Toxins 2018, 10, x FOR PEER REVIEW 5 of 21
(C)
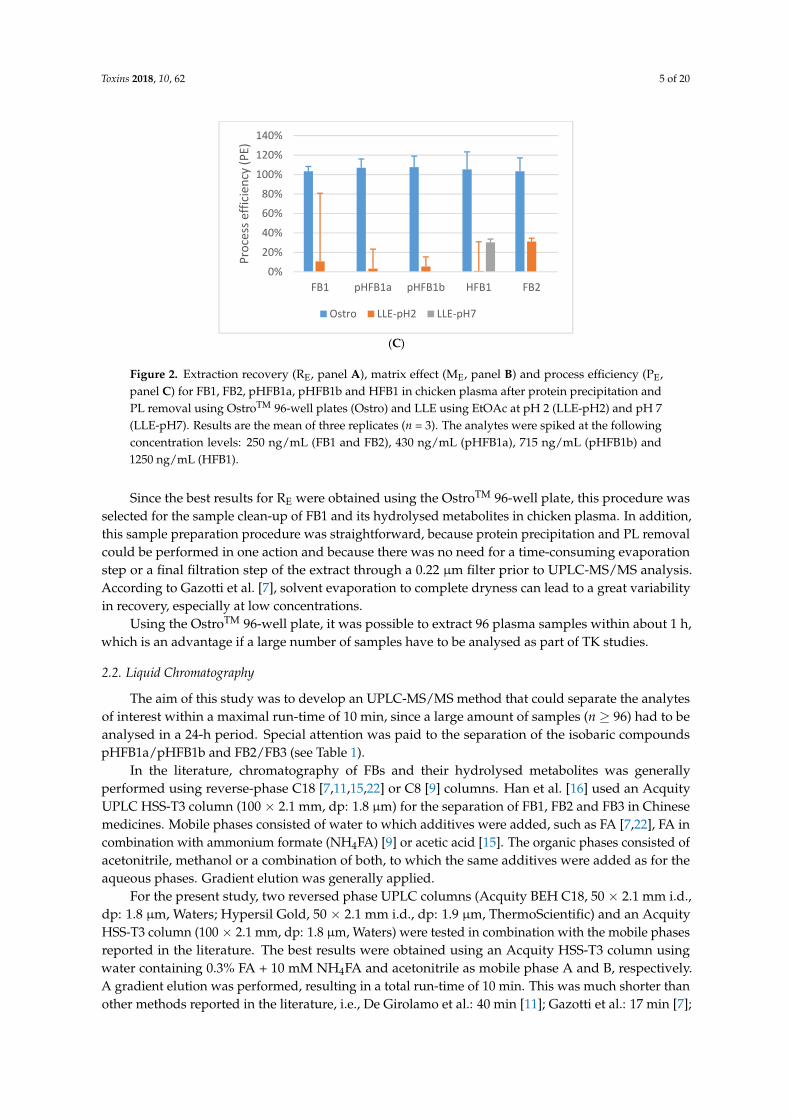
Figure 2. Extraction recovery (RE, panel A), matrix effect (ME, panel B) and process efficiency (PE,
panel C) for FB1, FB2, pHFB1a, pHFB1b and HFB1 in chicken plasma after protein precipitation and
PL removal using OstroTM 96‐well plates (Ostro) and LLE using EtOAc at pH 2 (LLE‐pH2) and pH 7
(LLE‐pH7). Results are the mean of three replicates (n = 3). The analytes were spiked at the following
concentration levels: 250 ng/mL (FB1 and FB2), 430 ng/mL (pHFB1a), 715 ng/mL (pHFB1b) and 1250
ng/mL (HFB1).
Since the best results for RE were obtained using the OstroTM 96‐well plate, this procedure was
selected for the sample clean‐up of FB1 and its hydrolysed metabolites in chicken plasma. In
addition, this sample preparation procedure was straightforward, because protein precipitation and
PL removal could be performed in one action and because there was no need for a time‐consuming
evaporation step or a final filtration step of the extract through a 0.22 μm filter prior to
UPLC‐MS/MS analysis. According to Gazotti et al. [7], solvent evaporation to complete dryness can
lead to a great variability in recovery, especially at low concentrations.
Using the OstroTM 96‐well plate, it was possible to extract 96 plasma samples within about 1 h,
which is an advantage if a large number of samples have to be analysed as part of TK studies.
2.2. Liquid Chromatography
The aim of this study was to develop an UPLC‐MS/MS method that could separate the analytes
of interest within a maximal run‐time of 10 min, since a large amount of samples (n ≥ 96) had to be
analysed in a 24‐h period. Special attention was paid to the separation of the isobaric compounds
pHFB1a/pHFB1b and FB2/FB3 (see Table 1).
In the literature, chromatography of FBs and their hydrolysed metabolites was generally
performed using reverse‐phase C18 [7,11,15,22] or C8 [9] columns. Han et al. [16] used an Acquity
UPLC HSS‐T3 column (100 × 2.1 mm, dp: 1.8 μm) for the separation of FB1, FB2 and FB3 in Chinese
medicines. Mobile phases consisted of water to which additives were added, such as FA [7,22], FA in
combination with ammonium formate (NH4FA) [9] or acetic acid [15]. The organic phases consisted
of acetonitrile, methanol or a combination of both, to which the same additives were added as for the
aqueous phases. Gradient elution was generally applied.
For the present study, two reversed phase UPLC columns (Acquity BEH C18, 50 × 2.1 mm i.d.,
dp: 1.8 μm, Waters; Hypersil Gold, 50 × 2.1 mm i.d., dp: 1.9 μm, ThermoScientific) and an Acquity
HSS‐T3 column (100 × 2.1 mm, dp: 1.8 μm, Waters) were tested in combination with the mobile
phases reported in the literature. The best results were obtained using an Acquity HSS‐T3 column
using water containing 0.3% FA + 10 mM NH4FA and acetonitrile as mobile phase A and B,
respectively. A gradient elution was performed, resulting in a total run‐time of 10 min. This was
much shorter than other methods reported in the literature, i.e., De Girolamo et al.: 40 min [11];
Gazotti et al.: 17 min [7]; Heinl et al.: 20 min [9]; Meyer et al.: 20 min [22]. Han et al. analysed FB1,
FB2 and FB3 within 5 min, but this method did not include the hydrolysed metabolites [16].
0%
20%
40%
60%
80%
100%
120%
140%
FB1 pHFB1a pHFB1b HFB1 FB2
Process efficiency (PE)
Ostro LLE‐pH2 LLE‐pH7
Figure 2. Extraction recovery (RE, panel A), matrix effect (ME, panel B) and process efficiency (PE,panel C) for FB1, FB2, pHFB1a, pHFB1b and HFB1 in chicken plasma after protein precipitation andPL removal using OstroTM 96-well plates (Ostro) and LLE using EtOAc at pH 2 (LLE-pH2) and pH 7(LLE-pH7). Results are the mean of three replicates (n = 3). The analytes were spiked at the followingconcentration levels: 250 ng/mL (FB1 and FB2), 430 ng/mL (pHFB1a), 715 ng/mL (pHFB1b) and1250 ng/mL (HFB1).
Since the best results for RE were obtained using the OstroTM 96-well plate, this procedure wasselected for the sample clean-up of FB1 and its hydrolysed metabolites in chicken plasma. In addition,this sample preparation procedure was straightforward, because protein precipitation and PL removalcould be performed in one action and because there was no need for a time-consuming evaporationstep or a final filtration step of the extract through a 0.22 µm filter prior to UPLC-MS/MS analysis.According to Gazotti et al. [7], solvent evaporation to complete dryness can lead to a great variabilityin recovery, especially at low concentrations.
Using the OstroTM 96-well plate, it was possible to extract 96 plasma samples within about 1 h,which is an advantage if a large number of samples have to be analysed as part of TK studies.
2.2. Liquid Chromatography
The aim of this study was to develop an UPLC-MS/MS method that could separate the analytesof interest within a maximal run-time of 10 min, since a large amount of samples (n ≥ 96) had to beanalysed in a 24-h period. Special attention was paid to the separation of the isobaric compoundspHFB1a/pHFB1b and FB2/FB3 (see Table 1).
In the literature, chromatography of FBs and their hydrolysed metabolites was generallyperformed using reverse-phase C18 [7,11,15,22] or C8 [9] columns. Han et al. [16] used an AcquityUPLC HSS-T3 column (100 × 2.1 mm, dp: 1.8 µm) for the separation of FB1, FB2 and FB3 in Chinesemedicines. Mobile phases consisted of water to which additives were added, such as FA [7,22], FA incombination with ammonium formate (NH4FA) [9] or acetic acid [15]. The organic phases consisted ofacetonitrile, methanol or a combination of both, to which the same additives were added as for theaqueous phases. Gradient elution was generally applied.
For the present study, two reversed phase UPLC columns (Acquity BEH C18, 50 × 2.1 mm i.d.,dp: 1.8 µm, Waters; Hypersil Gold, 50 × 2.1 mm i.d., dp: 1.9 µm, ThermoScientific) and an AcquityHSS-T3 column (100 × 2.1 mm, dp: 1.8 µm, Waters) were tested in combination with the mobile phasesreported in the literature. The best results were obtained using an Acquity HSS-T3 column usingwater containing 0.3% FA + 10 mM NH4FA and acetonitrile as mobile phase A and B, respectively.A gradient elution was performed, resulting in a total run-time of 10 min. This was much shorter thanother methods reported in the literature, i.e., De Girolamo et al.: 40 min [11]; Gazotti et al.: 17 min [7];
Toxins 2018, 10, 62 6 of 20
Heinl et al.: 20 min [9]; Meyer et al.: 20 min [22]. Han et al. analysed FB1, FB2 and FB3 within 5 min,but this method did not include the hydrolysed metabolites [16].
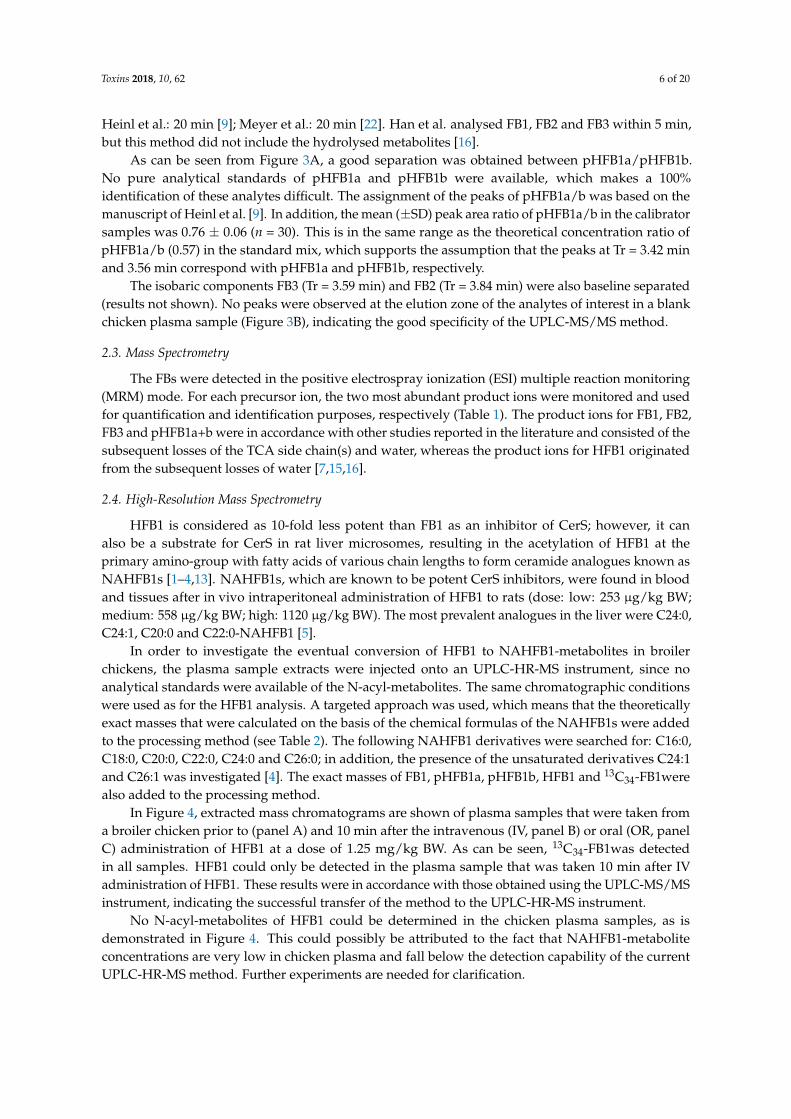
As can be seen from Figure 3A, a good separation was obtained between pHFB1a/pHFB1b.No pure analytical standards of pHFB1a and pHFB1b were available, which makes a 100%identification of these analytes difficult. The assignment of the peaks of pHFB1a/b was based on themanuscript of Heinl et al. [9]. In addition, the mean (±SD) peak area ratio of pHFB1a/b in the calibratorsamples was 0.76 ± 0.06 (n = 30). This is in the same range as the theoretical concentration ratio ofpHFB1a/b (0.57) in the standard mix, which supports the assumption that the peaks at Tr = 3.42 minand 3.56 min correspond with pHFB1a and pHFB1b, respectively.
The isobaric components FB3 (Tr = 3.59 min) and FB2 (Tr = 3.84 min) were also baseline separated(results not shown). No peaks were observed at the elution zone of the analytes of interest in a blankchicken plasma sample (Figure 3B), indicating the good specificity of the UPLC-MS/MS method.
2.3. Mass Spectrometry
The FBs were detected in the positive electrospray ionization (ESI) multiple reaction monitoring(MRM) mode. For each precursor ion, the two most abundant product ions were monitored and usedfor quantification and identification purposes, respectively (Table 1). The product ions for FB1, FB2,FB3 and pHFB1a+b were in accordance with other studies reported in the literature and consisted of thesubsequent losses of the TCA side chain(s) and water, whereas the product ions for HFB1 originatedfrom the subsequent losses of water [7,15,16].
2.4. High-Resolution Mass Spectrometry
HFB1 is considered as 10-fold less potent than FB1 as an inhibitor of CerS; however, it canalso be a substrate for CerS in rat liver microsomes, resulting in the acetylation of HFB1 at theprimary amino-group with fatty acids of various chain lengths to form ceramide analogues known asNAHFB1s [1–4,13]. NAHFB1s, which are known to be potent CerS inhibitors, were found in bloodand tissues after in vivo intraperitoneal administration of HFB1 to rats (dose: low: 253 µg/kg BW;medium: 558 µg/kg BW; high: 1120 µg/kg BW). The most prevalent analogues in the liver were C24:0,C24:1, C20:0 and C22:0-NAHFB1 [5].
In order to investigate the eventual conversion of HFB1 to NAHFB1-metabolites in broilerchickens, the plasma sample extracts were injected onto an UPLC-HR-MS instrument, since noanalytical standards were available of the N-acyl-metabolites. The same chromatographic conditionswere used as for the HFB1 analysis. A targeted approach was used, which means that the theoreticallyexact masses that were calculated on the basis of the chemical formulas of the NAHFB1s were addedto the processing method (see Table 2). The following NAHFB1 derivatives were searched for: C16:0,C18:0, C20:0, C22:0, C24:0 and C26:0; in addition, the presence of the unsaturated derivatives C24:1and C26:1 was investigated [4]. The exact masses of FB1, pHFB1a, pHFB1b, HFB1 and 13C34-FB1werealso added to the processing method.
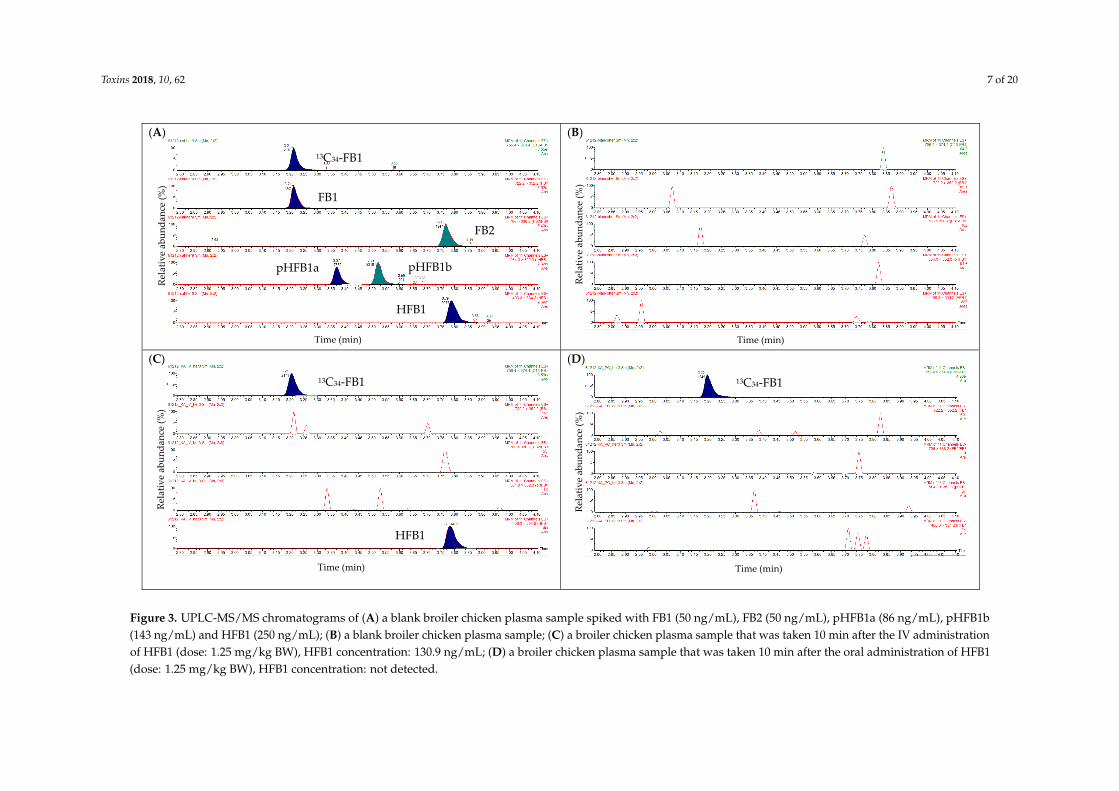
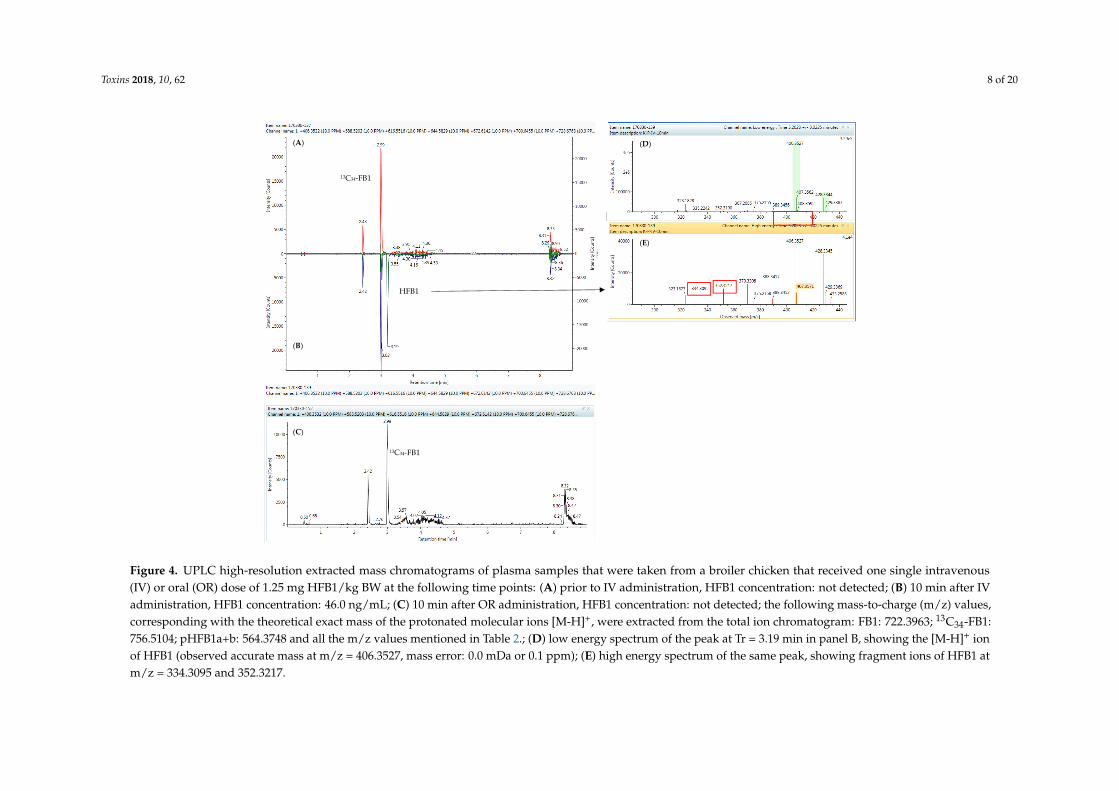
In Figure 4, extracted mass chromatograms are shown of plasma samples that were taken froma broiler chicken prior to (panel A) and 10 min after the intravenous (IV, panel B) or oral (OR, panelC) administration of HFB1 at a dose of 1.25 mg/kg BW. As can be seen, 13C34-FB1was detectedin all samples. HFB1 could only be detected in the plasma sample that was taken 10 min after IVadministration of HFB1. These results were in accordance with those obtained using the UPLC-MS/MSinstrument, indicating the successful transfer of the method to the UPLC-HR-MS instrument.
No N-acyl-metabolites of HFB1 could be determined in the chicken plasma samples, as isdemonstrated in Figure 4. This could possibly be attributed to the fact that NAHFB1-metaboliteconcentrations are very low in chicken plasma and fall below the detection capability of the currentUPLC-HR-MS method. Further experiments are needed for clarification.
Toxins 2018, 10, 62 7 of 20
Toxins 2018, 10, x FOR PEER REVIEW 7 of 21
Time (min) Time (min)
Time (min) Time (min)
(A)
(B)
(C)
(D)
Figure 3. UPLC‐MS/MS chromatograms of (A) a blank broiler chicken plasma sample spiked with FB1 (50 ng/mL), FB2 (50 ng/mL), pHFB1a (86 ng/mL), pHFB1b
(143 ng/mL) and HFB1 (250 ng/mL); (B) a blank broiler chicken plasma sample; (C) a broiler chicken plasma sample that was taken 10 min after the IV
administration of HFB1 (dose: 1.25 mg/kg BW), HFB1 concentration: 130.9 ng/mL; (D) a broiler chicken plasma sample that was taken 10 min after the oral
administration of HFB1 (dose: 1.25 mg/kg BW), HFB1 concentration: not detected.
13C34‐FB1
FB1
FB2
pHFB1a pHFB1b
HFB1
Relative abundance (%)
Relative abundance (%)
HFB1
13C34‐FB1
Relative abundance (%)
13C34‐FB1
Relative abundance (%)
Figure 3. UPLC-MS/MS chromatograms of (A) a blank broiler chicken plasma sample spiked with FB1 (50 ng/mL), FB2 (50 ng/mL), pHFB1a (86 ng/mL), pHFB1b(143 ng/mL) and HFB1 (250 ng/mL); (B) a blank broiler chicken plasma sample; (C) a broiler chicken plasma sample that was taken 10 min after the IV administrationof HFB1 (dose: 1.25 mg/kg BW), HFB1 concentration: 130.9 ng/mL; (D) a broiler chicken plasma sample that was taken 10 min after the oral administration of HFB1(dose: 1.25 mg/kg BW), HFB1 concentration: not detected.
Toxins 2018, 10, 62 8 of 20
Toxins 2018, 10, x FOR PEER REVIEW 8 of 21
HFB1
(A)
(B)
13C34‐FB1
(C)
13C34‐FB1
(D)
(E)
Figure 4. UPLC high-resolution extracted mass chromatograms of plasma samples that were taken from a broiler chicken that received one single intravenous(IV) or oral (OR) dose of 1.25 mg HFB1/kg BW at the following time points: (A) prior to IV administration, HFB1 concentration: not detected; (B) 10 min after IVadministration, HFB1 concentration: 46.0 ng/mL; (C) 10 min after OR administration, HFB1 concentration: not detected; the following mass-to-charge (m/z) values,corresponding with the theoretical exact mass of the protonated molecular ions [M-H]+, were extracted from the total ion chromatogram: FB1: 722.3963; 13C34-FB1:756.5104; pHFB1a+b: 564.3748 and all the m/z values mentioned in Table 2.; (D) low energy spectrum of the peak at Tr = 3.19 min in panel B, showing the [M-H]+ ionof HFB1 (observed accurate mass at m/z = 406.3527, mass error: 0.0 mDa or 0.1 ppm); (E) high energy spectrum of the same peak, showing fragment ions of HFB1 atm/z = 334.3095 and 352.3217.
Toxins 2018, 10, 62 9 of 20
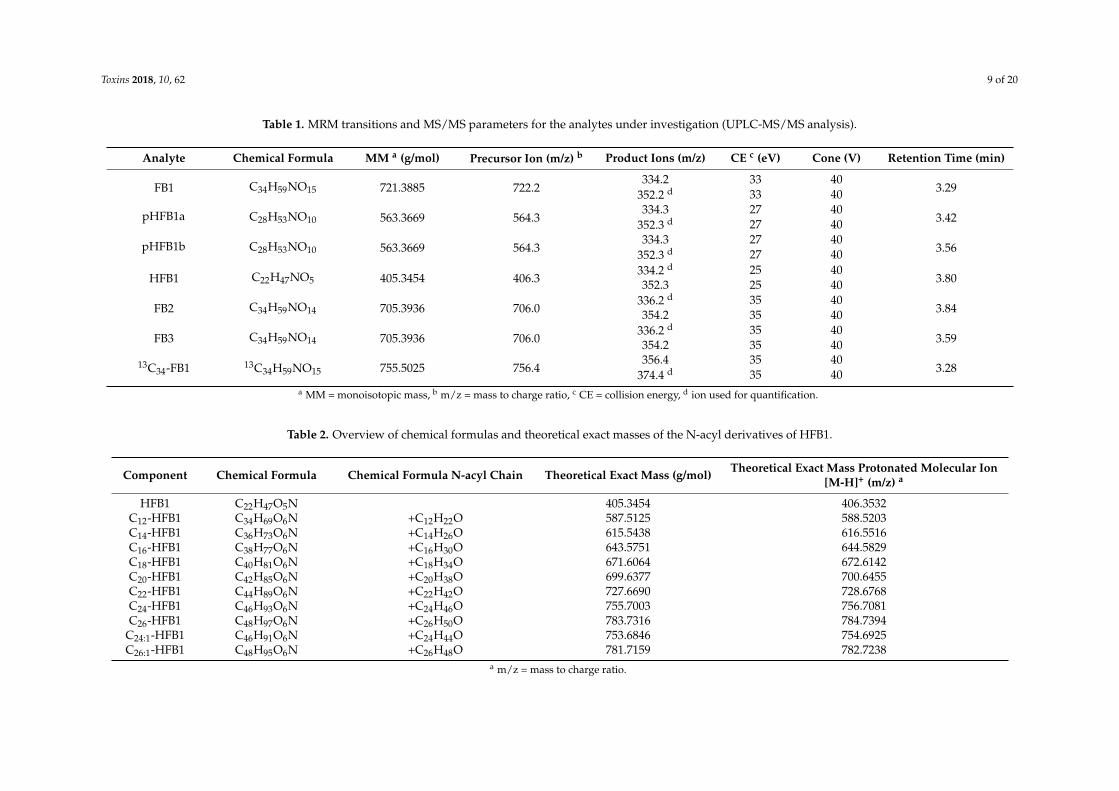
Table 1. MRM transitions and MS/MS parameters for the analytes under investigation (UPLC-MS/MS analysis).
Analyte Chemical Formula MM a (g/mol) Precursor Ion (m/z) b Product Ions (m/z) CE c (eV) Cone (V) Retention Time (min)
FB1 C34H59NO15 721.3885 722.2334.2 33 40
3.29352.2 d 33 40
pHFB1a C28H53NO10 563.3669 564.3334.3 27 40
3.42352.3 d 27 40
pHFB1b C28H53NO10 563.3669 564.3334.3 27 40
3.56352.3 d 27 40
HFB1 C22H47NO5 405.3454 406.3334.2 d 25 40
3.80352.3 25 40
FB2 C34H59NO14 705.3936 706.0336.2 d 35 40
3.84354.2 35 40
FB3 C34H59NO14 705.3936 706.0336.2 d 35 40
3.59354.2 35 40
13C34-FB1 13C34H59NO15 755.5025 756.4356.4 35 40
3.28374.4 d 35 40a MM = monoisotopic mass, b m/z = mass to charge ratio, c CE = collision energy, d ion used for quantification.
Table 2. Overview of chemical formulas and theoretical exact masses of the N-acyl derivatives of HFB1.
Component Chemical Formula Chemical Formula N-acyl Chain Theoretical Exact Mass (g/mol) Theoretical Exact Mass Protonated Molecular Ion[M-H]+ (m/z) a
HFB1 C22H47O5N 405.3454 406.3532C12-HFB1 C34H69O6N +C12H22O 587.5125 588.5203C14-HFB1 C36H73O6N +C14H26O 615.5438 616.5516C16-HFB1 C38H77O6N +C16H30O 643.5751 644.5829C18-HFB1 C40H81O6N +C18H34O 671.6064 672.6142C20-HFB1 C42H85O6N +C20H38O 699.6377 700.6455C22-HFB1 C44H89O6N +C22H42O 727.6690 728.6768C24-HFB1 C46H93O6N +C24H46O 755.7003 756.7081C26-HFB1 C48H97O6N +C26H50O 783.7316 784.7394
C24:1-HFB1 C46H91O6N +C24H44O 753.6846 754.6925C26:1-HFB1 C48H95O6N +C26H48O 781.7159 782.7238
a m/z = mass to charge ratio.
Toxins 2018, 10, 62 10 of 20
2.5. Method Validation
2.5.1. Linearity
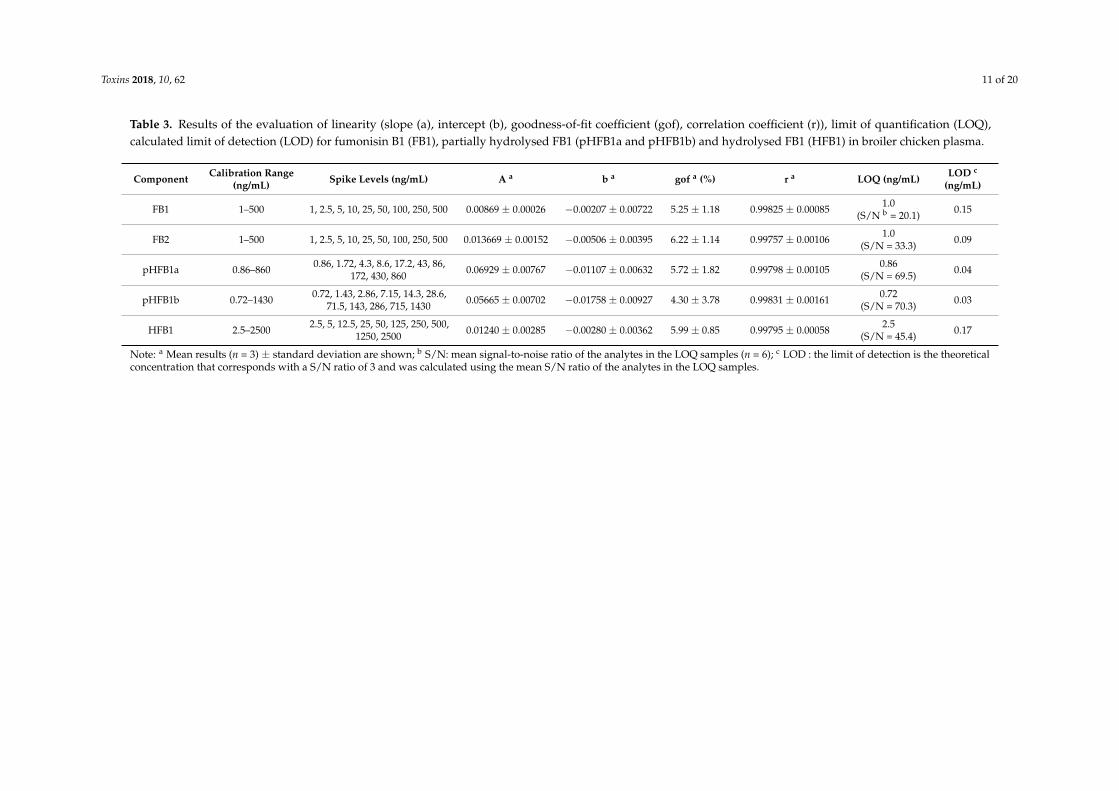
All calibration curves were constructed using matrix-matched calibrator samples in order tocompensate for matrix effects. Linear calibration curves covering a concentration range of 1–500 ng/mL(FB1 and FB2), 0.86–860 ng/mL (pHFB1a), 0.72–1430 ng/mL (pHFB1b) and 2.5–2500 ng/mL (HFB1)were obtained for all analytes (see Table 3).The correlation coefficients (r) and goodness-of-fitcoefficients (gof) were determined and met the acceptance criteria and were ≥0.99 and ≤20%,respectively [23,24]. The residuals plots of the different unweighted calibration curves indicatedthat the data were heteroscedastic (results not shown), which meant that the absolute error variedwith sample concentration. Therefore, the best weighting factor was determined [25]. Per analyteand weighting factor, the sum of goodness-of-fit coefficients (gof) was determined and the resultsranged between 178.9–1223.7% (unweighted, 1/x0), 19.6–32.8% (weighting factor 1/x1) and 12.9–18.7%(weighting factor 1/x2). This indicated that a calibration model using a weighting factor of 1/x2 wasthe most appropriate for all analytes. As a consequence, improvements of accuracy were observedparticularly at the lower end of the calibration range, resulting in lower limits of quantification [25].
The calibration curves fell in the same range or higher as those reported by Devreese et al.(1–1000 ng/mL for FB1 in pig plasma) [15], Gazotti et al. (5–100 ng/mL for FB1, FB2 and hydrolysedmetabolites in pig liver) [7], Han et al. (0.5–60 ng/mL for FB1, FB2 and FB3 in Chinese medicines) [16]or Heinl et al. (10–2000 ng/mL for FB1 and HFB1 in culture medium) [9].
The method of internal standardization was applied in order to compensate for analyte lossesduring sample preparation and for matrix effects during UPLC-MS/MS analysis. In the presentedmethod, an isotope-labelled internal standard (13C34-FB1) was chosen, because the structural, physicaland chemical properties of such a compound are very similar to FB1. Since 13C-labelled standards forpHFB1 and HFB1 are not yet commercially available, 13C34-FB1 was also used as internal standard forthose components. Although this was in theory not optimal, it has been shown during the methodvalidation experiments that the reliable determination of pHFB1a+b and HFB1 was not impaired.
Toxins 2018, 10, 62 11 of 20
Table 3. Results of the evaluation of linearity (slope (a), intercept (b), goodness-of-fit coefficient (gof), correlation coefficient (r)), limit of quantification (LOQ),calculated limit of detection (LOD) for fumonisin B1 (FB1), partially hydrolysed FB1 (pHFB1a and pHFB1b) and hydrolysed FB1 (HFB1) in broiler chicken plasma.
Component Calibration Range(ng/mL) Spike Levels (ng/mL) A a b a gof a (%) r a LOQ (ng/mL) LOD c
(ng/mL)
FB1 1–500 1, 2.5, 5, 10, 25, 50, 100, 250, 500 0.00869 ± 0.00026 −0.00207 ± 0.00722 5.25 ± 1.18 0.99825 ± 0.00085 1.0(S/N b = 20.1) 0.15
FB2 1–500 1, 2.5, 5, 10, 25, 50, 100, 250, 500 0.013669 ± 0.00152 −0.00506 ± 0.00395 6.22 ± 1.14 0.99757 ± 0.00106 1.0(S/N = 33.3) 0.09
pHFB1a 0.86–860 0.86, 1.72, 4.3, 8.6, 17.2, 43, 86,172, 430, 860 0.06929 ± 0.00767 −0.01107 ± 0.00632 5.72 ± 1.82 0.99798 ± 0.00105 0.86
(S/N = 69.5) 0.04
pHFB1b 0.72–1430 0.72, 1.43, 2.86, 7.15, 14.3, 28.6,71.5, 143, 286, 715, 1430 0.05665 ± 0.00702 −0.01758 ± 0.00927 4.30 ± 3.78 0.99831 ± 0.00161 0.72
(S/N = 70.3) 0.03
HFB1 2.5–2500 2.5, 5, 12.5, 25, 50, 125, 250, 500,1250, 2500 0.01240 ± 0.00285 −0.00280 ± 0.00362 5.99 ± 0.85 0.99795 ± 0.00058 2.5
(S/N = 45.4) 0.17
Note: a Mean results (n = 3) ± standard deviation are shown; b S/N: mean signal-to-noise ratio of the analytes in the LOQ samples (n = 6); c LOD : the limit of detection is the theoreticalconcentration that corresponds with a S/N ratio of 3 and was calculated using the mean S/N ratio of the analytes in the LOQ samples.
Toxins 2018, 10, 62 12 of 20
2.5.2. Accuracy and Precision
The within-run accuracy and precision were tested at three different concentration levels(i.e., low, medium and high). The acceptability ranges were met for all compounds at the specifiedlevels according to VICH GL49 [26]. The between-run precision and accuracy was tested at the sameconcentration levels by the analysis of quality control samples and the results fell also within theranges specified (see Table 4) [26].
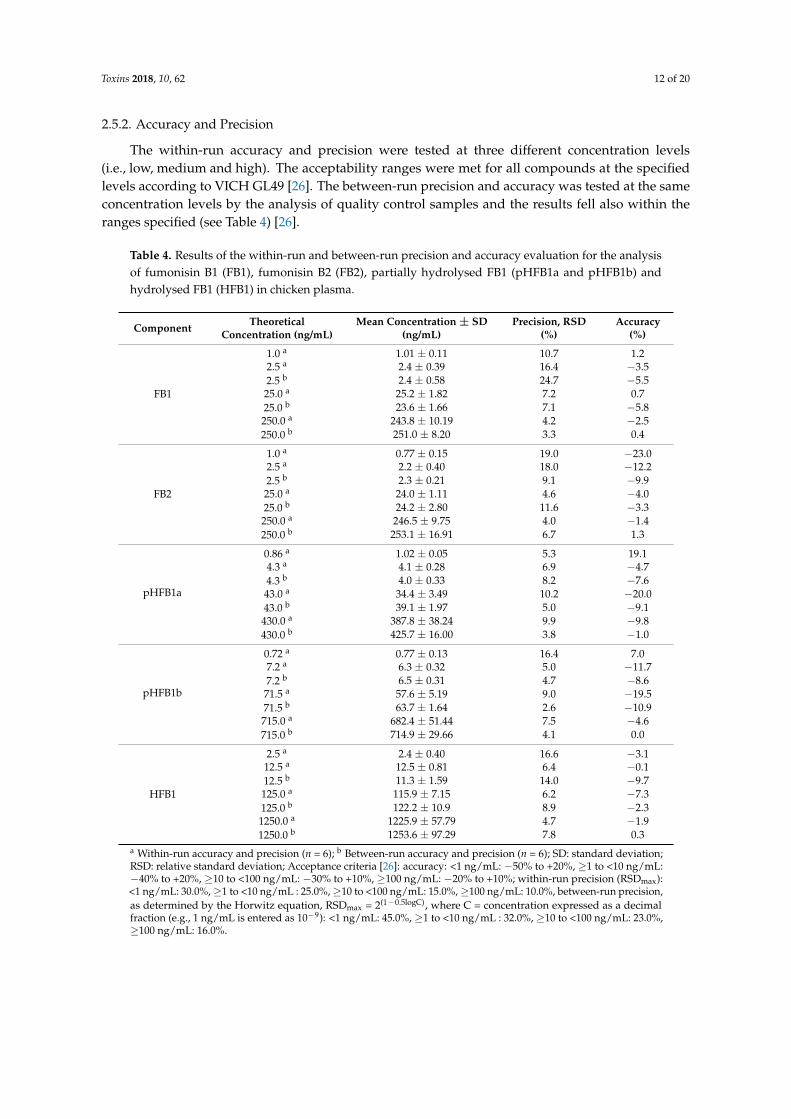
Table 4. Results of the within-run and between-run precision and accuracy evaluation for the analysisof fumonisin B1 (FB1), fumonisin B2 (FB2), partially hydrolysed FB1 (pHFB1a and pHFB1b) andhydrolysed FB1 (HFB1) in chicken plasma.
Component TheoreticalConcentration (ng/mL)
Mean Concentration ± SD(ng/mL)
Precision, RSD(%)
Accuracy(%)
FB1
1.0 a 1.01 ± 0.11 10.7 1.22.5 a 2.4 ± 0.39 16.4 −3.52.5 b 2.4 ± 0.58 24.7 −5.525.0 a 25.2 ± 1.82 7.2 0.725.0 b 23.6 ± 1.66 7.1 −5.8250.0 a 243.8 ± 10.19 4.2 −2.5250.0 b 251.0 ± 8.20 3.3 0.4
FB2
1.0 a 0.77 ± 0.15 19.0 −23.02.5 a 2.2 ± 0.40 18.0 −12.22.5 b 2.3 ± 0.21 9.1 −9.925.0 a 24.0 ± 1.11 4.6 −4.025.0 b 24.2 ± 2.80 11.6 −3.3250.0 a 246.5 ± 9.75 4.0 −1.4250.0 b 253.1 ± 16.91 6.7 1.3
pHFB1a
0.86 a 1.02 ± 0.05 5.3 19.14.3 a 4.1 ± 0.28 6.9 −4.74.3 b 4.0 ± 0.33 8.2 −7.643.0 a 34.4 ± 3.49 10.2 −20.043.0 b 39.1 ± 1.97 5.0 −9.1430.0 a 387.8 ± 38.24 9.9 −9.8430.0 b 425.7 ± 16.00 3.8 −1.0
pHFB1b
0.72 a 0.77 ± 0.13 16.4 7.07.2 a 6.3 ± 0.32 5.0 −11.77.2 b 6.5 ± 0.31 4.7 −8.671.5 a 57.6 ± 5.19 9.0 −19.571.5 b 63.7 ± 1.64 2.6 −10.9715.0 a 682.4 ± 51.44 7.5 −4.6715.0 b 714.9 ± 29.66 4.1 0.0
HFB1
2.5 a 2.4 ± 0.40 16.6 −3.112.5 a 12.5 ± 0.81 6.4 −0.112.5 b 11.3 ± 1.59 14.0 −9.7125.0 a 115.9 ± 7.15 6.2 −7.3125.0 b 122.2 ± 10.9 8.9 −2.31250.0 a 1225.9 ± 57.79 4.7 −1.91250.0 b 1253.6 ± 97.29 7.8 0.3
a Within-run accuracy and precision (n = 6); b Between-run accuracy and precision (n = 6); SD: standard deviation;RSD: relative standard deviation; Acceptance criteria [26]: accuracy: <1 ng/mL: −50% to +20%, ≥1 to <10 ng/mL:−40% to +20%, ≥10 to <100 ng/mL: −30% to +10%, ≥100 ng/mL: −20% to +10%; within-run precision (RSDmax):<1 ng/mL: 30.0%,≥1 to <10 ng/mL : 25.0%,≥10 to <100 ng/mL: 15.0%,≥100 ng/mL: 10.0%, between-run precision,as determined by the Horwitz equation, RSDmax = 2(1−0.5logC), where C = concentration expressed as a decimalfraction (e.g., 1 ng/mL is entered as 10−9): <1 ng/mL: 45.0%, ≥1 to <10 ng/mL : 32.0%, ≥10 to <100 ng/mL: 23.0%,≥100 ng/mL: 16.0%.
Toxins 2018, 10, 62 13 of 20
2.5.3. LOQ and LOD
LOQ values in plasma ranged between 0.72 and 2.50 ng/mL, depending on the component.The LOQ was set as the lowest concentration of the calibration curve that could be determined with anaccuracy that fell within the acceptability ranges at the specified level.
The LOD values were theoretical and calculated, based on the mean signal-to-noise (S/N) ratiosof the LOQ samples. Values corresponding to a theoretical S/N ratio of 3 were set as the LOD andranged between 0.03 and 0.17 ng/mL. These LOQ and LOD values in plasma were in the same rangeas reported by Devreese et al. for FB1 in pig plasma [15] and by other authors in matrices of variousorigin [2,7,12,16]. The LOQ values were low enough to allow accurate quantification of the analytesof interest in plasma samples that were taken from broiler chickens up to 360 min after IV or oraladministration of HFB1 (dose: 1.25 mg/kg BW).
2.5.4. Carry-Over
According to Gazotti et al., care must be taken to prevent carry-over problems in thechromatographic system [7]. In the current procedure carry-over was negligible (<0.35%), which canbe attributed to the flow-through-needle (FTN)-design of the Acquity H-Class system.
2.5.5. Matrix Effects and Process Efficiency
UPLC-MS/MS is known for its specificity and selectivity, but it has been shown that co-elutingmatrix components may affect the ionization efficiency [21,27]. This phenomenon can be reduced byoptimizing sample clean-up and chromatographic separation. In the present method the influences ofmatrix effects have been further minimized by preparing matrix-matched calibrator samples and bythe use of an isotope-labelled internal standard.
The influence of the matrix on ME has been investigated quantitatively for FB1, FB2, pHFB1a,pHFB1b and HFB1 [27]. As can be seen from Figure 2B, a moderate signal enhancement(ME : 112.5–127.1%) on the UPLC-MS/MS instrument could be observed for all analytes of interestin chicken plasma if the sample preparation procedure consisted of deproteinization in combinationwith PL removal using OstroTM 96-well plates. Using LLE at pH 2 or pH 7, a signal suppression wasobserved (ME at pH2: 71.2–118.9%; ME at pH 7: 68.3–82.1%).
By combining RE and ME, the efficiency (PE) of the whole analytical procedure could be evaluated.From the results in Figure 2C, it is clear that the procedure using the OstroTM 96-well plates is superiorcompared to LLE at pH 2 or pH 7.
2.6. Analysis of Real Samples
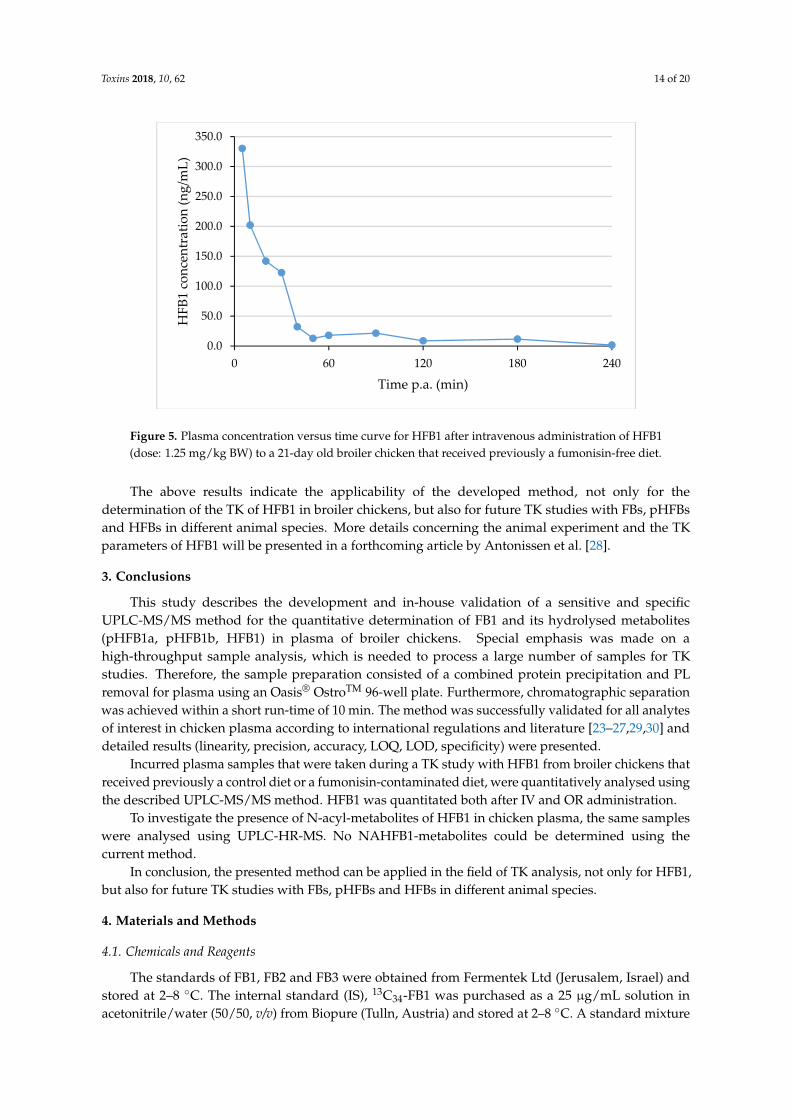
To demonstrate the applicability of the developed UPLC-MS/MS method, biological sampleswere analysed that were taken as a part of a two-way cross-over TK study with HFB1 in chickens thatreceived either a control diet or a FBs contaminated diet, respectively. Blood samples were drawnbefore and at different time points after the IV and oral administration of a single dose of 1.25 mgHFB1/kg BW. The results of the analysis of HFB1 in plasma samples that were taken from one chickenthat received a control diet and an IV dose of HFB1 are shown in Figure 5.
As can be seen from Figure 5, HFB1 concentrations above the LOQ level (2.5 ng/mL) could bedetected up to 180 min after IV administration. HFB1 concentrations after oral administration weremuch lower and concentrations above the LOQ level could only be determined in some samples.
Toxins 2018, 10, 62 14 of 20
Toxins 2018, 10, x FOR PEER REVIEW 15 of 21
Figure 5. Plasma concentration versus time curve for HFB1 after intravenous administration of HFB1
(dose: 1.25 mg/kg BW) to a 21‐day old broiler chicken that received previously a fumonisin‐free diet.
The above results indicate the applicability of the developed method, not only for the
determination of the TK of HFB1 in broiler chickens, but also for future TK studies with FBs, pHFBs
and HFBs in different animal species. More details concerning the animal experiment and the TK
parameters of HFB1 will be presented in a forthcoming article by Antonissen et al. [28].
3. Conclusions
This study describes the development and in‐house validation of a sensitive and specific
UPLC‐MS/MS method for the quantitative determination of FB1 and its hydrolysed metabolites
(pHFB1a, pHFB1b, HFB1) in plasma of broiler chickens. Special emphasis was made on a
high‐throughput sample analysis, which is needed to process a large number of samples for TK
studies. Therefore, the sample preparation consisted of a combined protein precipitation and PL
removal for plasma using an Oasis® OstroTM 96‐well plate. Furthermore, chromatographic separation
was achieved within a short run‐time of 10 min. The method was successfully validated for all
analytes of interest in chicken plasma according to international regulations and literature [23–
27,29,30] and detailed results (linearity, precision, accuracy, LOQ, LOD, specificity) were presented.
Incurred plasma samples that were taken during a TK study with HFB1 from broiler chickens
that received previously a control diet or a fumonisin‐contaminated diet, were quantitatively
analysed using the described UPLC‐MS/MS method. HFB1 was quantitated both after IV and OR
administration.
To investigate the presence of N‐acyl‐metabolites of HFB1 in chicken plasma, the same samples
were analysed using UPLC‐HR‐MS. No NAHFB1‐metabolites could be determined using the
current method.
In conclusion, the presented method can be applied in the field of TK analysis, not only for
HFB1, but also for future TK studies with FBs, pHFBs and HFBs in different animal species.
4. Materials and Methods
4.1. Chemicals and Reagents
The standards of FB1, FB2 and FB3 were obtained from Fermentek Ltd (Jerusalem, Israel) and
stored at 2–8 °C. The internal standard (IS), 13C34‐FB1 was purchased as a 25 μg/mL solution in
acetonitrile/water (50/50, v/v) from Biopure (Tulln, Austria) and stored at 2–8 °C. A standard mixture
containing FB1 (2.9 μg/mL), HFB1 (5.0 μg/mL), pHFB1a (8.3 μg/mL) and pHFB1b (14.5 μg/mL) was
0.0
50.0
100.0
150.0
200.0
250.0
300.0
350.0
0 60 120 180 240
HFB1 concentration (ng/m
L)
Time p.a. (min)
Figure 5. Plasma concentration versus time curve for HFB1 after intravenous administration of HFB1(dose: 1.25 mg/kg BW) to a 21-day old broiler chicken that received previously a fumonisin-free diet.
The above results indicate the applicability of the developed method, not only for thedetermination of the TK of HFB1 in broiler chickens, but also for future TK studies with FBs, pHFBsand HFBs in different animal species. More details concerning the animal experiment and the TKparameters of HFB1 will be presented in a forthcoming article by Antonissen et al. [28].
3. Conclusions
This study describes the development and in-house validation of a sensitive and specificUPLC-MS/MS method for the quantitative determination of FB1 and its hydrolysed metabolites(pHFB1a, pHFB1b, HFB1) in plasma of broiler chickens. Special emphasis was made on ahigh-throughput sample analysis, which is needed to process a large number of samples for TKstudies. Therefore, the sample preparation consisted of a combined protein precipitation and PLremoval for plasma using an Oasis® OstroTM 96-well plate. Furthermore, chromatographic separationwas achieved within a short run-time of 10 min. The method was successfully validated for all analytesof interest in chicken plasma according to international regulations and literature [23–27,29,30] anddetailed results (linearity, precision, accuracy, LOQ, LOD, specificity) were presented.
Incurred plasma samples that were taken during a TK study with HFB1 from broiler chickens thatreceived previously a control diet or a fumonisin-contaminated diet, were quantitatively analysed usingthe described UPLC-MS/MS method. HFB1 was quantitated both after IV and OR administration.
To investigate the presence of N-acyl-metabolites of HFB1 in chicken plasma, the same sampleswere analysed using UPLC-HR-MS. No NAHFB1-metabolites could be determined using thecurrent method.
In conclusion, the presented method can be applied in the field of TK analysis, not only for HFB1,but also for future TK studies with FBs, pHFBs and HFBs in different animal species.
4. Materials and Methods
4.1. Chemicals and Reagents
The standards of FB1, FB2 and FB3 were obtained from Fermentek Ltd (Jerusalem, Israel) andstored at 2–8 ◦C. The internal standard (IS), 13C34-FB1 was purchased as a 25 µg/mL solution inacetonitrile/water (50/50, v/v) from Biopure (Tulln, Austria) and stored at 2–8 ◦C. A standard mixture
Toxins 2018, 10, 62 15 of 20
containing FB1 (2.9 µg/mL), HFB1 (5.0 µg/mL), pHFB1a (8.3 µg/mL) and pHFB1b (14.5 µg/mL) wasprepared by Biomin according to the procedure described by Hahn et al. [2]. This standard mixturewas stored at ≤−15 ◦C.
The solvents and reagents that were used for the preparation of the UPLC mobile phase (water, ACN,FA, NH4FA) were of UPLC-MS grade and were obtained from Biosolve (Valkenswaard, The Netherlands).All other solvents and reagents were of HPLC grade (water, ACN, diethylether, EtOAc; Filterservice,Eupen, Belgium) or analytical grade (FA, hydrochloric acid; VWR, Leuven, Belgium).
Oasis® OstroTM protein precipitation & phospholipid removal 96-well plates (25 mg) wereobtained from Waters (Zellik, Belgium).
4.2. Preparation of Standard Solutions
Stock solutions of FB1, FB2 and FB3 (1 mg/mL) were prepared in water/ACN (50/50, v/v)and stored at 2–8 ◦C. Working solutions at concentrations of 10 µg/mL, 1 µg/mL and 0.1 µg/mLwere prepared by appropriate dilution of the stock solution in water/ACN (50/50, v/v). The standardmixture solution containing FB1, HFB1, pHFB1a and pHFB1b was appropriately diluted in water/ACN(50/50, v/v) to obtain working solutions for the preparation of calibrator and quality control (QC)samples. For the IS, a working solution of 1 µg/mL was prepared in water/ACN (50/50, v/v).All working solutions were stored at 2–8 ◦C.
4.3. Biological Samples
Blank plasma samples. For the preparation of matrix-matched calibrator and QC samples, blankplasma samples were obtained from broiler chickens that received no FBs. Blank samples were storedat ≤−15 ◦C until the moment of analysis.
Incurred plasma samples. In order to evaluate the applicability of the developed method, incurredplasma samples from broiler chickens were analysed.
Chicken plasma samples were obtained after the IV and OR administration of HFB1 (dose:1.25 mg/kg BW), to 21-day-old chickens that received previously a control (i.e., fumonisin-free) diet(n = 8) or a fumonisin-contaminated diet for two weeks (n = 8, i.e., between day 8 and day 21, fumonisincontamination level of the feed: 10.8 mg/kg FB1, 3.3 mg/kg FB2 and 1.5 mg/kg FB3). A two-waycross-over design was applied and with a wash-out and recovery period of two days between bothadministrations. Blood samples were taken from the leg vein at 0 min (before administration) and at5′, 10′, 20′, 30′, 40′, 50′, 1 h, 1.5 h, 2 h, 3 h, 4 h, 6 h, and 9 h post administration (p.a.). After sampling,all blood samples were centrifuged at 2851× g for 10 min (4 ◦C) and plasma was stored at ≤−15 ◦Cuntil the moment of analysis. The animal experiment was approved by the Ethical Committee of theFaculty of Veterinary Medicine and Bioscience Engineering of Ghent University (EC 2015/10, approvaldate: 9 March 2015).
The results of the analysis of the plasma samples of one broiler chicken are presented in Section 2.6.Detailed results concerning the plasma concentration versus time profiles and the toxicokineticparameters of HFB1 after IV and OR administration will be presented in a forthcoming article [28].
4.4. Sample Pre-Treatment
4.4.1. Final Procedure
To 100 µL of plasma were added 12.5 µL of the IS working solution (1.0 µg/mL), followed byvortex mixing and loading onto the OstroTM 96-well plate. Thereafter, 300 µL of 1% FA in ACN wereadded and the sample was aspirated three times to enhance protein precipitation. The sample waspassed through the 96-well plate by the application of a vacuum (67.7 kPa) for 10 min. A 2.5-µL aliquotwas injected onto the UPLC-MS/MS or UPLC-HR-MS instrument.
Toxins 2018, 10, 62 16 of 20
4.4.2. Liquid–Liquid Extraction Procedure
To 100 µL of plasma were added 12.5 µL of the IS working solution (1.0 µg/mL), followed byvortex mixing and the addition of 3 mL of ether or EtOAc. The sample was extracted in acidic (pH = 2)or neutral (pH = 7) medium for 20 min on a horizontal rotary shaker, followed by a centrifugation stepof 10 min at 3500 rpm. Thereafter, the organic phase was transferred to another tube and evaporateduntil dryness under a gentle stream of nitrogen at a temperature of ±45 ◦C. The dry residue wasreconstituted in 250 µL of a water/ACN (50/50, v/v) mixture, vortex mixed and transferred to anautosampler vial. A 2.5-µL aliquot was injected onto the UPLC-MS/MS instrument.
4.5. UPLC-MS/MS Analysis for Quantification
The UPLC system consisted of an Acquity UPLC H-Class Quaternary Solvent Manager andFlow-Through-Needle Sample Manager with temperature controlled tray and column oven fromWaters (Zellik, Belgium). Chromatographic separation was achieved on an Acquity UPLC HSS T3column (100 mm × 2.1 mm i.d., dp: 1.8 µm) in combination with an Acquity HSS T3 1.8 µm Vanguardpre-column, both from Waters.
The mobile phase A consisted of 0.3% FA and 10 mM NH4FA in water, while the mobile phase Bwas acetonitrile. A gradient elution was performed: 0–0.5 min (90% A, 10% B), 5.5 min (linear gradientto 90% B), 5.5–7.5 min (10% A, 90% B), 7.7 min (linear gradient to 90% A), 7.7–10.0 min (90% A, 10% B).The flow-rate was 0.4 mL/min.
The temperatures of the column oven and autosampler tray were set at 40 ◦C and8 ◦C, respectively.
The UPLC column effluent was interfaced to a Xevo TQ-S® MS/MS system, equipped with anESI probe operating in the positive mode (all from Waters). A divert valve was used and the UPLCeffluent was directed to the mass spectrometer from 2.5 to 4.5 min.
Instrument parameters were optimised by direct infusion of working solutions of 1.0 µg/mL ofFB1, FB2, FB3 and the IS and of a diluted standard mixture solution, containing FB1, HFB1, pHFB1aand pHFB1b at a concentration of 0.50, 0.86, 1.43 and 2.50 µg/mL, respectively, at a flow-rate of10 µL/min and in combination with the mobile phase (50% A, 50% B, flow-rate: 200 µL/min).
The following parameters were used: capillary voltage: 3.0 kV, cone: 40 V, source offset: 60 V,desolvation temperature: 600 ◦C, desolvation gas: 1000 L/h, cone gas: 150 L/h, nebuliser pressure:7.0 bar, LM resolution 1 and 2: 2.80 and 2.77, respectively, HM resolution 1 and 2: 15.00, respectively,ion energy 1 and 2: 0.2 and 0.8, respectively, collision gas flow: 0.15 mL/min.
MS/MS acquisition was performed in the MRM mode. The MRM transitions that were monitoredfor all analytes are shown in Table 1.
4.6. UPLC-HR-MS Analysis for Identification
An Acquity I-Class UPLC coupled to a Synapt G2-Si HDMS instrument (Waters, Zellik, Belgium)was used to identify potential phase-II metabolites and N-acyl metabolites of HFB1 in incurredchicken plasma samples. The chromatographic conditions were the same as described above. HR-MSinstrument parameters were optimized by syringe infusion of a standard mixture solution of FB1,pHFB1a, pHFB1b and HFB1. The following HR-MS parameters were used: capillary voltage, 2.70 kV;sampling cone voltage, 30.00 V; source offset, 80.00 V; source temperature, 150 ◦C; desolvationtemperature, 550 ◦C; cone gas flow, 50 L/h; desolvation gas flow, 800 L/h; nebuliser gas flow, 6.50 bar;lock spray capillary voltage, 2.00 kV. HR-MS acquisition was performed from 0.2–9.0 min in thepositive ESI resolution mode using the MSE continuum scan function. Time-of-flight (TOF) MS settingswere as follows: low mass, 50 Da; high mass, 1000 Da; scan time, 0.15 s; interscan time, 0.1 s; dataformat, continuum. The lock mass solution consisted of leucine encephalin (200 pg/µL). The lockspraywas acquired during HR-MS acquisition, but no correction was applied. The lock spray settingswere as follows: scan time, 0.15 s; interval, 30 s; scans to average, 3; mass window, 0.5 Da. Data
Toxins 2018, 10, 62 17 of 20
processing and lock mass correction (m/z 556.276575) was performed using the Unify 1.8 software(Waters). Identification of analytes was based on retention time (target TR tolerance: 0.1 min) and mass(target mass tolerance: 10 ppm). The search for phase-II metabolites of HFB1 was performed using apathway profiling approach. The following transformations were added to the method: glucuronideconjugation and sulphate conjugation, based on the suggestion by Hopmans et al. [31]. The searchfor N-acyl metabolites of HFB1 was based on Harrer et al., 2015 and Seiferlein et al., 2007 and wasperformed using a targeted approach [4,5]. Therefore, the chemical formulas of potential N-acyl (NA)metabolites of HFB1 (ranging from C12-HFB1 to C26-HFB1 and C24:1-HFB1, C26:1-HFB1) were addedto the accurate mass–MSe screening method (see Table 2).
4.7. Method Validation
The developed LC-MS/MS method was in-house validated for FB1, FB2, pHFB1a, pHFB1b andHFB1 based on the protocol described by De Baere et al. [23], using spiked blank plasma samplesobtained from healthy, untreated chickens. The method was not validated for FB3, since this componentwas of less importance (cfr. Concentration in contaminated feed) and it was expected that eventualFB3 levels in plasma would be very low.
Linearity, accuracy, precision, limit of quantification (LOQ), limit of detection (LOD) andcarry-over were determined in compliance with the recommendations and guidelines defined bythe European Community and with criteria described in the literature [23–27,29,30].
4.7.1. Calibration Curves
Matrix-matched calibration curves were prepared in 100 µL blank chicken plasma (concentrationrange: FB1: 1–500 ng/mL, FB2: 1–500 ng/mL, pHFB1a: 0.86–860 ng/mL, pHFB1b: 0.72–1430 ng/mL,HFB1: 2.5–2500 ng/mL). Three individual calibration curves were prepared, i.e., one on three differentanalysis days. The correlation coefficients (r) and gof were calculated and limits were set at ≥0.99 and≤20%, respectively [23,24,30]. The gof was determined according to Knecht and Stork [24] using thefollowing formula:
g =
√Σ(% deviation)2/(n− 1),
with % deviation = xcalculated conc − xnominal value/xnonimal value × 100(1)
The choice of the most appropriate weighting factor (1/x0, 1/x1, 1/x2) was performed, based onVICH GL49 and Almeida et al. [25,26]. The following procedure was applied: three weighting factorswere applied to each calibration curve and the gof were calculated. Per weighting factor, the gof ofthe three individual curves were summed; the weighting factor that gave the smallest sum of gof wasconsidered to be the most appropriate model.
4.7.2. Accuracy and Precision
Within-run accuracy and precision (repeatability) were determined by analysing six blank samplesthat were spiked at a low medium and high concentration level in the same run. The between-runaccuracy and precision (reproducibility) were determined by analysing two blank samples spiked atthe same concentration levels on three different days (n = 6). An overview of the concentration levelsper component is given in Table 3. The acceptance criteria for accuracy were: −50% to +20%, 40% to+20%, −30% to +10% and −20% to +10% for concentration levels <1 ng/mL, ≥1 to <10 ng/mL, ≥10to <100 ng/mL and ≥100 ng/mL, respectively. The precision was evaluated by the determination ofthe relative standard deviation (RSD), which had to be below the RSDmax value. For the within-dayprecision, RSDmax is fixed at <30%, <25%, <15% and <10% for concentrations <1 ng/mL, ≥1 to<10 ng/mL, ≥10 to <100 ng/mL and ≥100 ng/mL, respectively [26]. For between-run precision,
Toxins 2018, 10, 62 18 of 20
the RSD had to be below the RSDmax value calculated by the Horwitz equation [26]. These criteria areshown in Table 4.
4.7.3. LOQ and LOD
The LOQ was the lowest concentration of the analyte for which the method was validated with anaccuracy that fell within the recommended range. The LOQ was also established as the lowest point ofthe calibration curve. The LOQ was determined by analysing six samples spiked at a concentrationlevel of 1.0 ng/mL for FB1 and FB2, 0.86 ng/mL for pHFB1a, 0.72 ng/mL for pHFB1b and 2.5 ng/mLfor HFB1, on the same day. In addition, the S/N ratios of all analytes in the LOQ samples weredetermined and the mean S/N ratios were calculated.
The LOD was defined as the concentration that corresponded with a theoretical S/N ratio of 3.The LOD values were calculated using the mean S/N of the analytes spiked in blank plasma at theLOQ level.
4.7.4. Carry-Over
The absence of carry-over was verified by analysing the reconstitution solvent injected after thehighest calibration sample. If a peak was observed in the elution zone of an analyte or the IS, it had tobe below the LOD.
4.7.5. Extraction Recovery, Matrix Effects and Process Efficiency
Extraction recovery (RE), matrix effects (ME) and process efficiency (PE) were quantitativelyassessed by preparing three sets of samples: set A consisted of standard solutions containing theanalytes of interest at a concentration of 250 ng/mL (FB1 and FB2), 430 ng/mL (pHFB1a), 715 ng/mL(pHFB1b) and 1250 ng/mL (HFB1); the other sets consisted of matrix-matched samples that wereprepared by spiking blank matrix after (set B) and before (set C) extraction at the same concentrationlevels as the set-A samples. All experiments were performed in triplicate. The RE, ME and PE weredetermined by dividing the peak areas of FB1, FB2, pHFB1a, pHFB1b and HFB1 in the respectivesamples, i.e., RE = C/B × 100, ME = B/A × 100 and PE = C/A × 100.
Acknowledgments: The assistance of J. Muyle with analysing the plasma samples is acknowledged. G. Antonissenis supported by a postdoctoral fellowship from the Research Foundation—Flanders. The authors also acknowledgethe Hercules infrastructure funding AUGE/13/13.
Author Contributions: S.D.B., G.A. and S.C. conceived and designed the experiments; S.D.B. performed theanalytical experiments; B.N. and G.B. contributed to the synthesis of the FB1, pHFB1a, pHFB1b and HFB1 standardmixture; S.D.B. and G.A. analysed the data; S.D.B., G.A. and S.C. wrote the paper.
Conflicts of Interest: The authors declare no conflict of interest. The founding sponsors had no role in the designof the study; in the collection, analyses, or interpretation of data; in the writing of the manuscript, and in thedecision to publish the results.
References
1. Escriva, L.; Font, G.; Manyes, L. In vivo toxicity studies of fusarium mycotoxins in the last decade: A review.Food Chem. Toxicol. 2015, 78, 185–206. [CrossRef] [PubMed]
2. Hahn, I.; Nagl, V.; Schwartz-Zimmermann, H.E.; Varga, E.; Schwarz, C.; Slavik, V.; Reisinger, N.;Malachova, A.; Cirlini, M.; Generotti, S.; et al. Effects of orally administered fumonisin B1 (FB1), partiallyhydrolysed FB1, hydrolysed FB1 and N-(1-deoxy-D-fructos-1-yl) FB1 on the sphingolipid metabolism in rats.Food Chem. Toxicol. 2015, 76, 11–18. [CrossRef] [PubMed]
3. Harrer, H.; Laviad, E.L.; Humpf, H.-U.; Futerman, A.H. Identification of N-acyl-fumonisin B1 as newcytotoxic metabolites of fumonisin mycotoxins. Mol. Nutr. Food Res. 2013, 57, 516–522. [CrossRef] [PubMed]
4. Harrer, H.; Humpf, H.-U.; Voss, K.A. In vivo formation of N-acyl-fumonisin B1. Mycotoxin Res. 2015, 31,33–40. [CrossRef] [PubMed]
Toxins 2018, 10, 62 19 of 20
5. Seiferlein, M.; Humpf, H.-U.; Voss, K.A.; Sullards, M.C.; Allegood, J.C.; Wang, E.; Merrill, A.H., Jr.Hydrolyzed fumonisins HFB1 and HFB2 are acylated in vitro and in vivo by ceramide synthase to formcytotoxic N-acyl-metabolites. Mol. Nutr. Food Res. 2007, 51, 1120–1130. [CrossRef] [PubMed]
6. Collins, T.F.X.; Sprando, R.L.; Black, T.N.; Olejnik, N.; Eppley, R.M.; Shackelford, M.E.; Howard, P.C.;Rorie, J.I.; Bryant, M.; Ruggles, D.I. Effects of aminopentol on in utero development in rats. Food Chem. Toxicol.2006, 44, 161–169. [CrossRef] [PubMed]
7. Gazzotti, T.; Zironi, E.; Lugoboni, B.; Barbarossa, A.; Piva, A.; Pagliuca, G. Analysis of fumonisins B1, B2 andtheir hydrolysed metabolites in pig liver by LC-MS/MS. Food Chem. 2011, 125, 1379–1384. [CrossRef]
8. Caloni, F.; Spotti, M.; Auerbach, H.; Op den Camp, H.; Fink Gremmels, J.; Pompa, G. In vitro metabolism offumonisin B1 by ruminal microflora. Vet. Res. Commun. 2000, 24, 379–387. [CrossRef] [PubMed]
9. Heinl, S.; Hartinger, D.; Themhesl, M.; Vekiru, E.; Krska, R.; Schatzmayr, G.; Moll, W.-D.; Grabherr, R.Degradation of fumonisin B1 by consecutive action of two bacterial enzymes. J. Biotechnol. 2010, 145, 120–129.[CrossRef] [PubMed]
10. Pagliuca, G.; Zironi, E.; Ceccolini, A.; Matera, R.; Serrazanetti, G.P.; Piva, A. Simple method for thesimultaneous isolation and determination of fumonisin B1 and its metabolite aminopentol-1 in swineliver by liquid chromatography-fluorescence detection. J. Chromatogr. B 2005, 819, 97–103. [CrossRef][PubMed]
11. De Girolamo, A.; Lattanzio, V.M.T.; Schena, R.; Visconti, A.; Pascale, M. Use of liquidchromatography–high-resolution mass spectrometry for isolation and characterization of hydrolyzedfumonisins and relevant analysis in maize-based products. J. Mass Spectrom. 2014, 49, 297–305. [CrossRef][PubMed]
12. Fodor, J.; Balogh, K.; Weber, M.; Mézes, M.; Kametler, L.; Pósa, R.; Mamet, R.; Bauer, J.; Horn, P.; Kovács, F.;et al. Absorption, distribution and elimination of fumonisin B1 metabolites in weaned piglets. Food Addit.Contam. Part A 2008, 25, 88–96. [CrossRef] [PubMed]
13. Humpf, H.-U.; Schmelz, E.-M.; Meredithi, F.I.; Vesper, H.; Vales, T.R.; Wang, E.; Menaldino, D.S.; Liotta, D.C.;Merrill, A.H., Jr. Acylation of Naturally Occurring and Synthetic 1-Deoxysphinganines by CeramideSynthase. J. Biol. Chem. 1998, 273, 19060–19064. [CrossRef] [PubMed]
14. Shephard, G.S.; Thiel, P.G.; Sydenham, E.W. Determination of fumonisin B1 in plasma and urine byhigh-performance liquid chromatography. J. Chromatogr. A 1992, 574, 299–304. [CrossRef]
15. Devreese, M.; De Baere, S.; De Backer, P.; Croubels, S. Quantitative determination of several toxicologicalimportant mycotoxins in pig plasma using multi-mycotoxin and analyte-specific high performance liquidchromatography–tandem mass spectrometric methods. J. Chromatogr. A 2012, 1257, 74–80. [CrossRef][PubMed]
16. Han, Z.; Ren, Y.; Liu, X.; Luan, L.; Wu, Y. A reliable isotope dilution method for simultaneousdetermination of fumonisins B1, B2, B3 in traditional Chinese medicines by ultra-high-performance liquidchromatography-tandem mass spectrometry. J. Sep. Sci. 2010, 33, 2723–2733. [CrossRef] [PubMed]
17. Riley, R.T.; Torres, O.; Showker, J.L.; Zitomer, N.C.; Matute, J.; Voss, K.A.; Gelineau-van Waes, J.; Maddox, J.R.;Gregory, S.G.; Ashley-Koch, A.E. The kinetics of urinary fumonisin B1 excretion in humans consumingmaize-based diets. Mol. Nutr. Food Res. 2012, 56, 1445–1455. [CrossRef] [PubMed]
18. Dilkin, P.; Direito, G.; Simas, M.M.S.; Mallmann, C.A.; Corrêa, B. Toxicokinetics and toxicological effectsof single oral dose of fumonisin B1 containing Fusarium verticillioides culture material in weaned piglets.Chem. Biol. Interact. 2010, 185, 157–162. [CrossRef] [PubMed]
19. De Baere, S.; Devreese, M.; Watteyn, A.; Wyns, H.; Plessers, E.; De Backer, P.; Croubels, S. Development andvalidation of a liquid chromatography–tandemmass spectrometry method for the quantitative determinationof gamithromycin in animal plasma, lung tissue and pulmonaryepithelial lining fluid. J. Chromatogr. A 2015,1398, 73–82. [CrossRef] [PubMed]
20. Ferlazzo, A.M.; Bruschetta, G.; Di Pietro, P.; Medica, P.; Notti, A.; Rotondo, E. Phospholipid composition ofplasma and erythrocyte membranes in animal species by 31P NMR. Vet. Res. Commun. 2011, 35, 521–530.[CrossRef] [PubMed]
21. Chambers, E.; Wagrowski-Diehl, D.M.; Lu, Z.; Mazzea, J.R. Systemic and comprehensive strategy forreducing matrix effects in LC-MS/MS analyses. J. Chromatogr. B 2007, 852, 22–34. [CrossRef] [PubMed]
22. Meyer, K.; Mohr, K.; Bauer, J.; Horn, P.; Kovács, M. Residue formation of fumonisin B1 in porcine tissues.Food Addit. Contam. 2003, 20, 639–647. [CrossRef] [PubMed]
Toxins 2018, 10, 62 20 of 20
23. De Baere, S.; Goossens, J.; Osselaere, A.; Devreese, M.; Vandenbroucke, V.; De Backer, P.; Croubels, S.Quantitative determination of T-2 toxin, HT-2 toxin, deoxynivalenol and deepoxy-deoxynivalenol in animalbody fluids using LC-MS/MS detection. J. Chrom. B 2011, 879, 2403–2415. [CrossRef] [PubMed]
24. Knecht, J.; Stork, G. Percentage and logarithmic procedures for calculation of calibration curves. Fresenius Z.Anal. Chem. 1974, 270, 97–99. [CrossRef]
25. Almeida, A.M.; Castel-Branco, M.M.; Falcão, A.C. Linear regression for calibration lines revisited: Weightingschemes for bioanalytical methods. J. Chromatogr. B. 2002, 774, 215–222. [CrossRef]
26. U.S. Department of Health and Human Services. VICH GL49(R): Guidance for Industry. Studies to Evaluate theMetabolism and Residue Kinetics of Veterinary Drugs in Food-Producing Animals: Validation of Analytical MethodsUsed in Residue Depletion Studies, Revision at Step 9 for Implementation at Step 7; U.S. Department of Health andHuman Services; Food and Drug Administration; Center for Veterinary Medicine: Rockvill, MD, USA, 2015.
27. Matuszewski, B.K.; Constanzer, M.L.; Chavez-Eng, C.M. Strategies for the assessment of matrix effect inquantitative bioanalytical methods based on HPLC-MS/MS. Anal. Chem. 2003, 75, 3019–3030. [CrossRef][PubMed]
28. Antonissen, G.; De Baere, S.; Novak, B.; Bichl, G.; Devreese, M.; Croubels, S. Toxicokinetics of hydrolyzedfumonisin B1 in broiler chickens fed a control or a fumonisins contaminated diet. 2018; in preparation.
29. European Commission. Commission Decision 2002/657/EC, implementing Council Directive 96/23/ECconcerning the performances of analytical methods and interpretation of results. Off. J. Eur. Communities2002, L221, 29.
30. Heitzman, R.J. Veterinary Drug Residues; Report Eur. 14126-EN; Commision of the EC: Brussels, Belgium;Luxembourg, 1994.
31. Hopmans, E.C.; Hauck, C.C.; Hendrich, S.; Murphy, P.A. Excretion of Fumonisin B1, Hydrolyzed FumonisinB1, and the Fumonisin B1-Fructose Adduct in Rats. J. Agric. Food Chem. 1997, 45, 2618–2625. [CrossRef]
© 2018 by the authors. Licensee MDPI, Basel, Switzerland. This article is an open accessarticle distributed under the terms and conditions of the Creative Commons Attribution(CC BY) license (http://creativecommons.org/licenses/by/4.0/).