Embed Size (px)
Citation preview
Development and validation of a hybrid physical-ecological model for Narragansett Bay: EcoGEM.
Jamie VaudreyDepartment of Marine Sciences, Uconn
Manager’s Meeting, URIMay 3, 2012
Acknowledgementsfunded by NOAA CHRP 2005, 2011
collaboratorsChristelle Balt
Deanna Bergondo, PIMark Brush, PI
Daniel Codiga, PIChristopher Deacutis, PI
Wally FulweilerSue Kiernan, PIChris Kincaid, PIJames Kremer, PIJason KrumholzNicole LaSota
David MurrayScott Nixon, PI
Candace Oviatt, lead-PIAnna Pfeiffer-Herbert
Warren Prell, PIEdwin Requintina Sr.
Leslie SmithHeather Stoffel
David Ullman, PIJamie Vaudrey
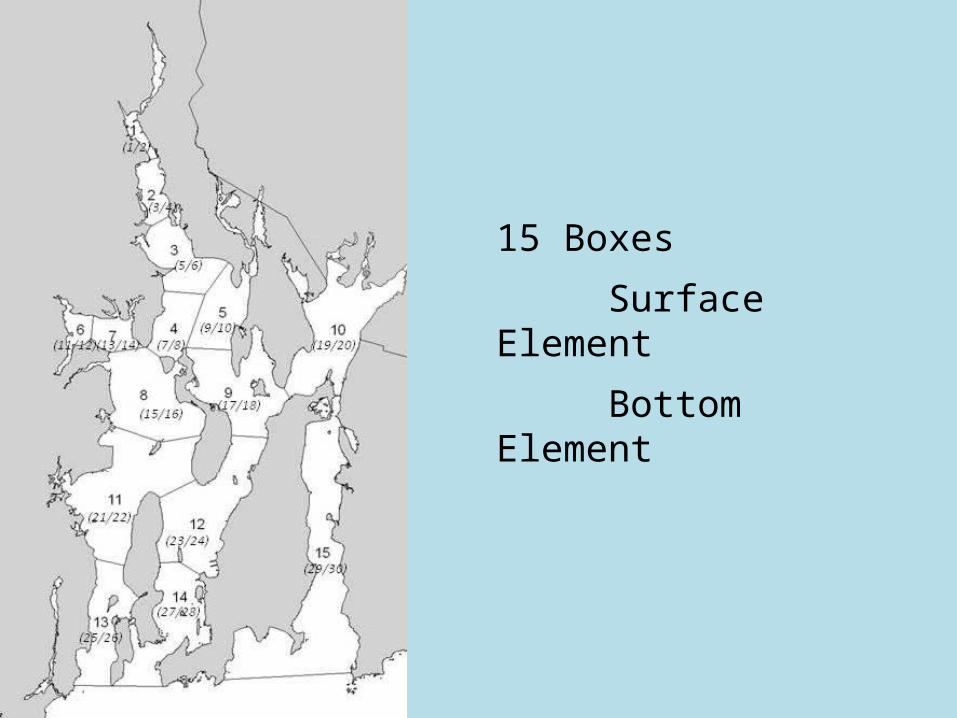
15 Boxes
Surface Element
Bottom Element
DO2
N P
N
Land-use
Atmosphericdeposition
N P
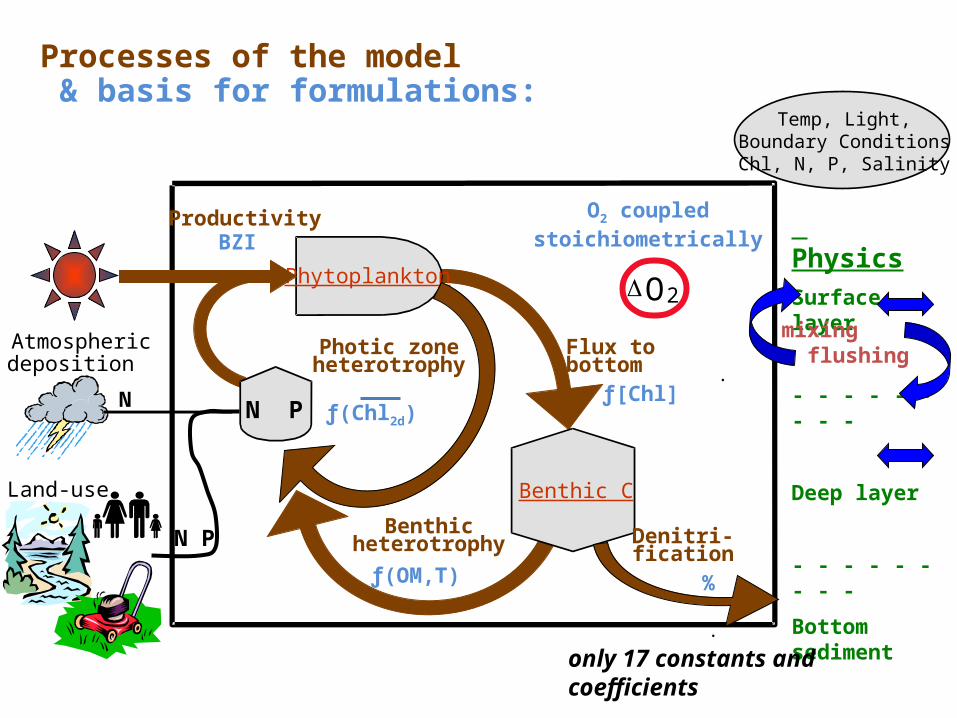
Productivity
Temp, Light,Boundary Conditions
Chl, N, P, Salinity
Phytoplankton
.
.
PhysicsSurface layer
- - - - - - - - -
Deep layer
- - - - - - - - -
Bottom sediment
Flux tobottom
Photic zoneheterotrophy
Benthicheterotrophy Denitri-
fication
O2 coupledstoichiometricallyBZI
ƒ(Chl2d)ƒ[Chl]
ƒ(OM,T) %
Processes of the model & basis for formulations:
mixing flushing
only 17 constants and coefficients
Benthic C
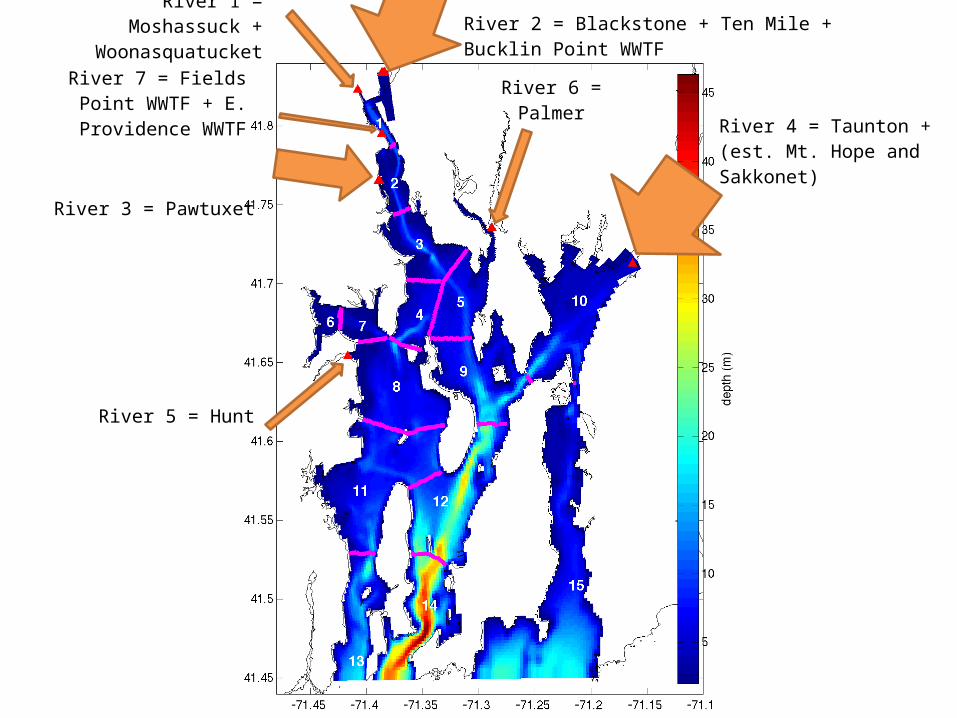
River 1 = Moshassuck + Woonasquatucket River 2 = Blackstone + Ten Mile + Bucklin Point WWTF
River 3 = Pawtuxet
River 4 = Taunton + (est. Mt. Hope and Sakkonet)
River 5 = Hunt
River 6 = PalmerRiver 7 = Fields Point WWTF + E. Providence WWTF
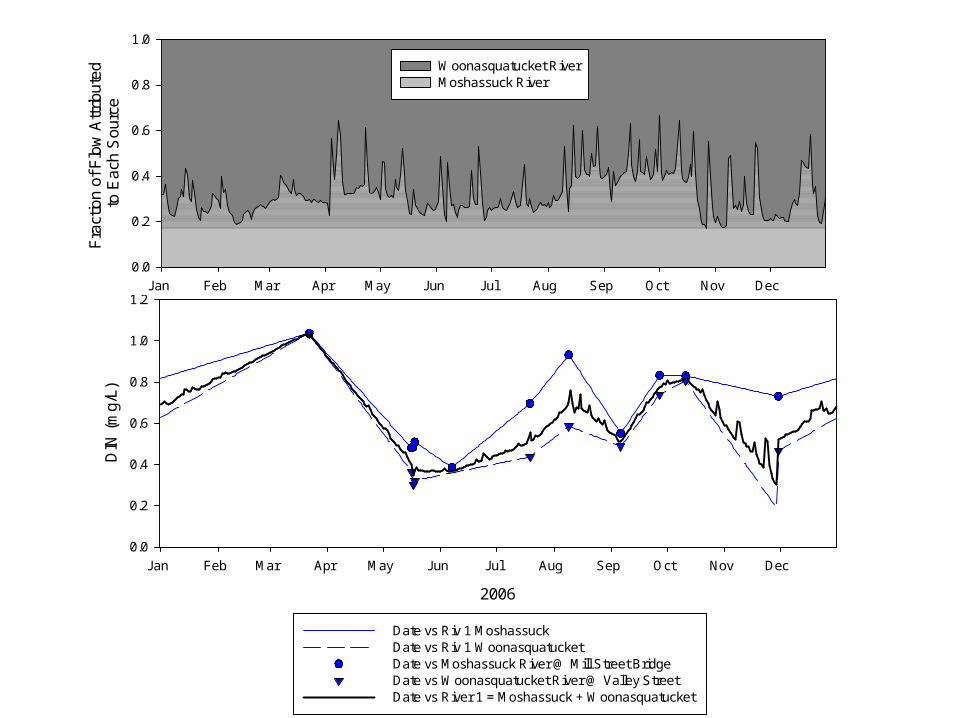
2006
Jan Feb Mar Apr May Jun Jul Aug Sep Oct Nov Dec
Fra
ctio
n of
Flo
w A
ttrib
uted
to
Eac
h S
ourc
e
0.0
0.2
0.4
0.6
0.8
1.0
Woonasquatucket RiverMoshassuck River
2006
Jan Feb Mar Apr May Jun Jul Aug Sep Oct Nov Dec
DIN
(m
g/L)
0.0
0.2
0.4
0.6
0.8
1.0
1.2
Date vs Riv 1 Moshassuck Date vs Riv 1 Woonasquatucket Date vs Moshassuck River @ Mill Street Bridge Date vs Woonasquatucket River @ Valley Street Date vs River 1 = Moshassuck + Woonasquatucket
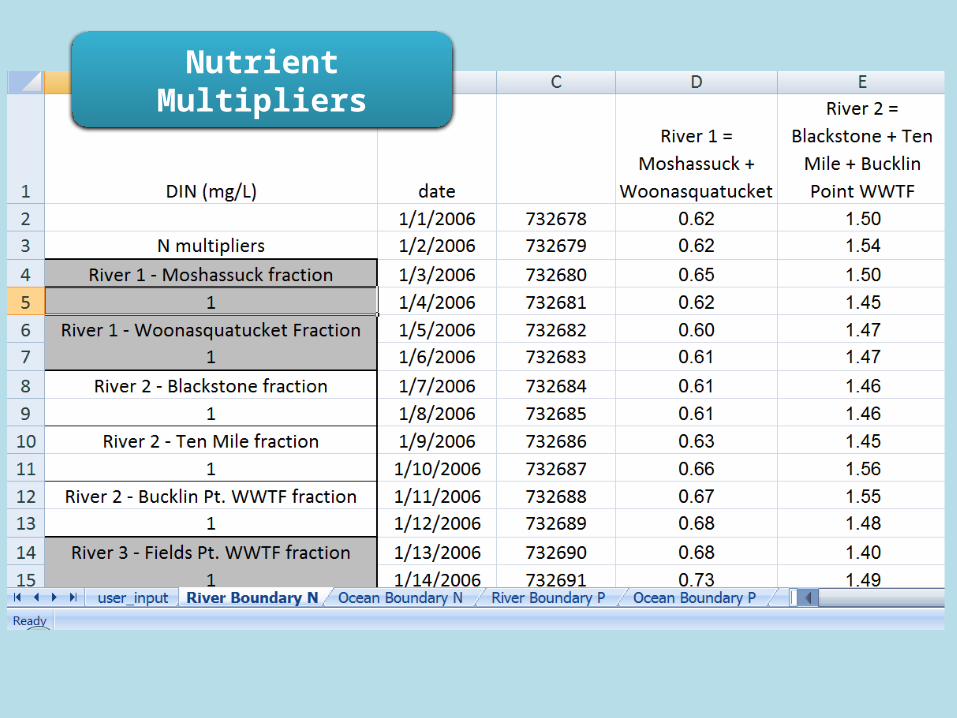
Nutrient Multipliers
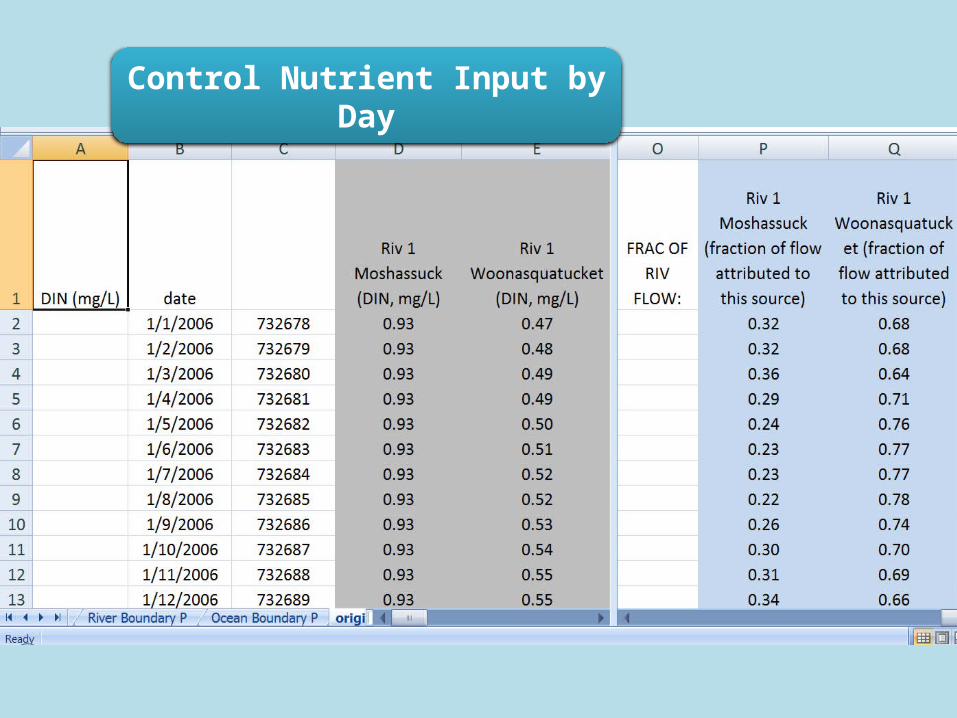
Control Nutrient Input by Day
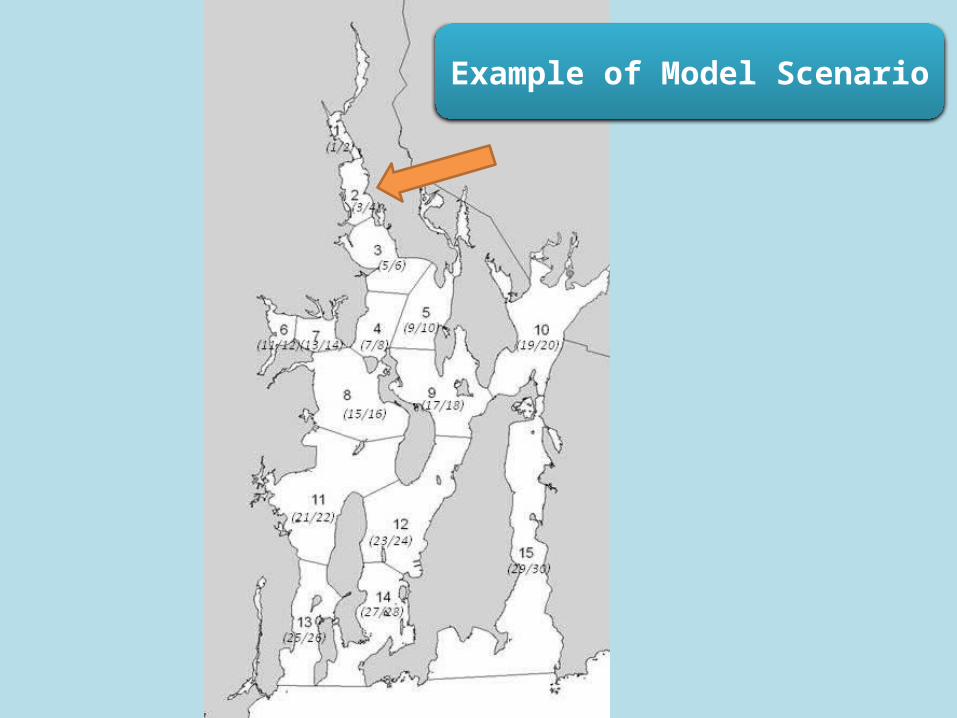
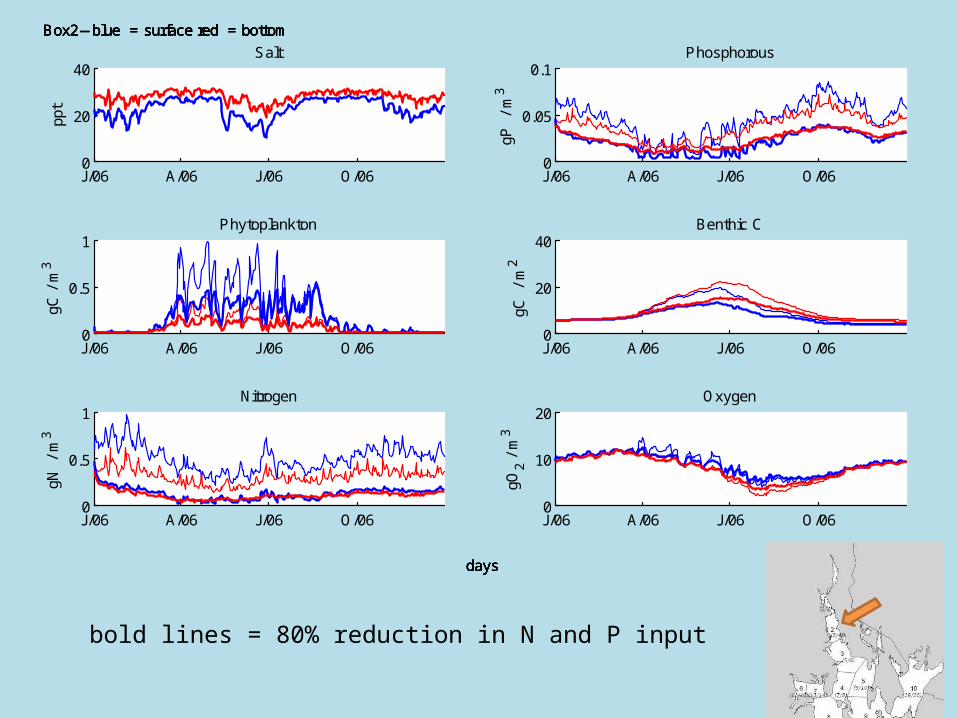
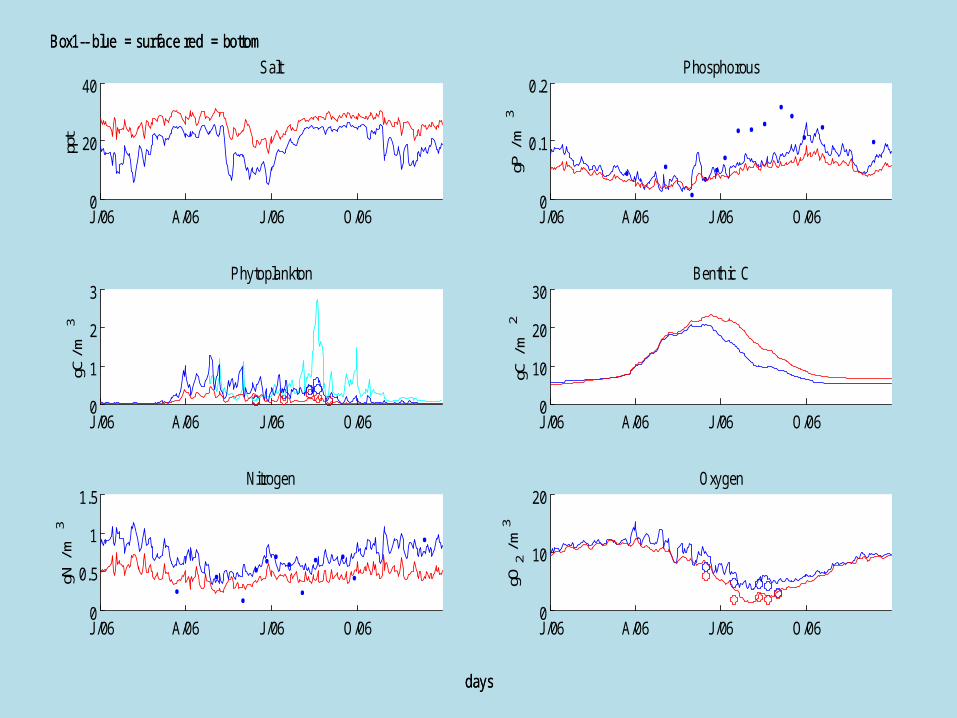
Example of Model Scenario
J/06 A/06 J/06 O/060
20
40Salt
ppt
J/06 A/06 J/06 O/060
0.05
0.1Phosphorous
gP
/ m
3
J/06 A/06 J/06 O/060
0.5
1Phytoplankton
gC /
m3
J/06 A/06 J/06 O/060
20
40Benthic C
gC
/ m
2J/06 A/06 J/06 O/060
0.5
1Nitrogen
gN
/ m
3
J/06 A/06 J/06 O/060
10
20Oxygen
gO2 /
m3
Box2-- blue = surface red = bottom
days
Box2-- blue = surface red = bottom
days
Box2-- blue = surface red = bottom
days
Box2-- blue = surface red = bottom
days
bold lines = 80% reduction in N and P input
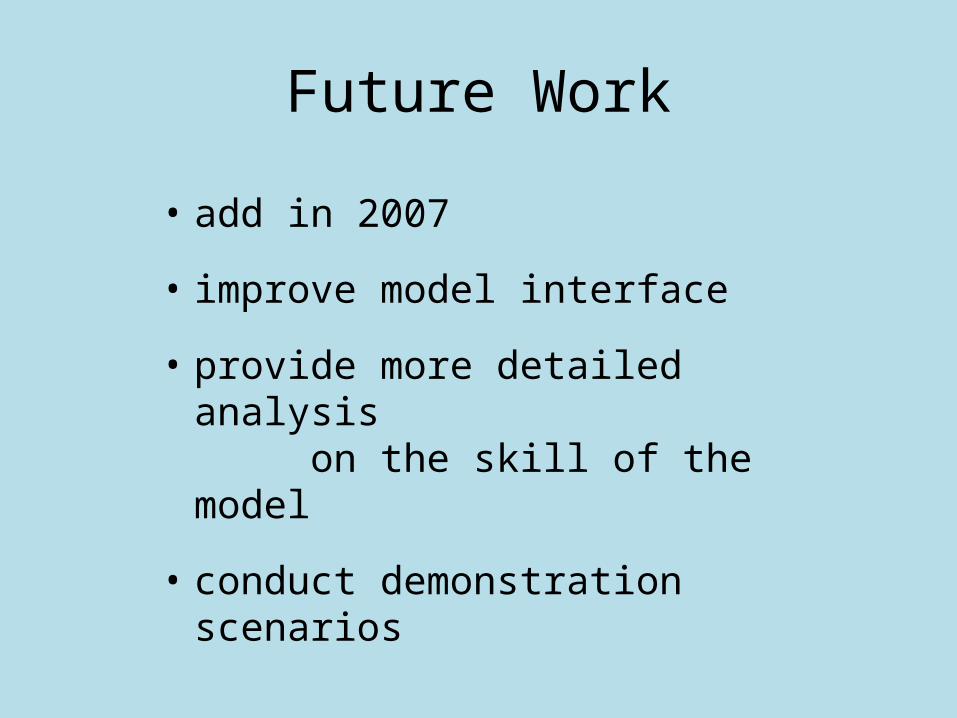
Future Work
• add in 2007
• improve model interface
• provide more detailed analysis on the skill of the model
• conduct demonstration scenarios
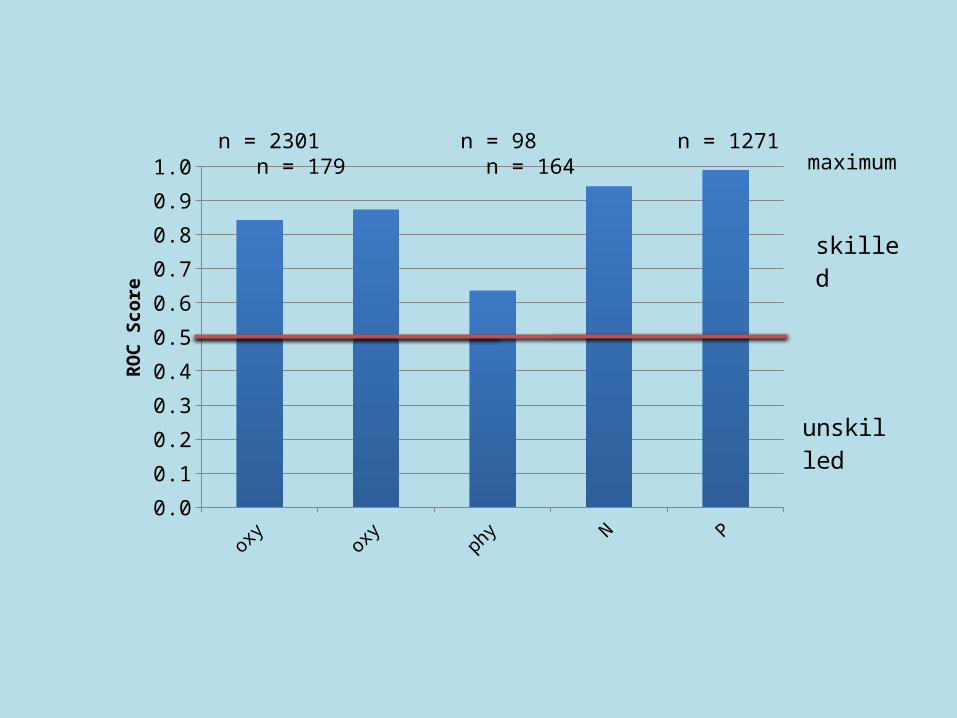
oxygen, buoy oxygen, CTD phyto, buoy N P0.0
0.1
0.2
0.3
0.4
0.5
0.6
0.7
0.8
0.9
1.0
ROC
Scor
e
skilled
unskilled
n = 2301 n = 98 n = 1271 n = 179 n = 164maximum
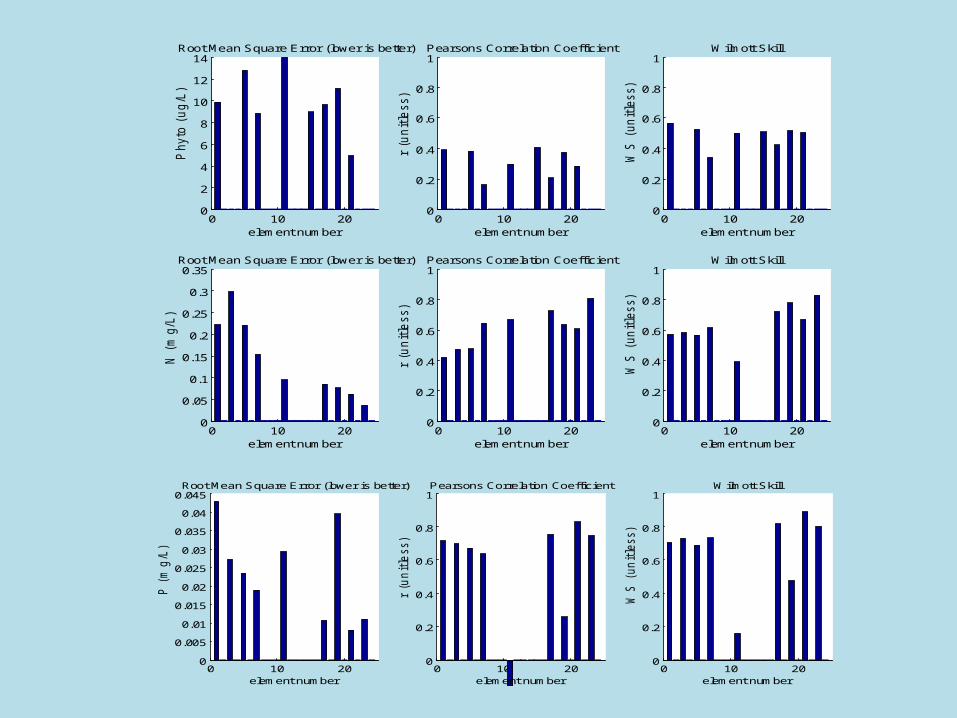
0 10 200
2
4
6
8
10
12
14Root Mean Square Error (lower is better)
element number
Phyto
(u
g/L
)
0 10 200
0.2
0.4
0.6
0.8
1Pearsons Correlation Coefficient
element number
r (u
nit
less)
0 10 200
0.2
0.4
0.6
0.8
1Wilmott Skill
WS
(un
itle
ss)
element number0 10 20
-1
-0.5
0
0.5
1Median Relative Error
fracti
on
element number
0 10 200
0.05
0.1
0.15
0.2
0.25
0.3
0.35Root Mean Square Error (lower is better)
element number
N (
mg/L
)
0 10 200
0.2
0.4
0.6
0.8
1Pearsons Correlation Coefficient
element number
r (u
nit
less)
0 10 200
0.2
0.4
0.6
0.8
1Wilmott Skill
WS
(un
itle
ss)
element number0 10 20
-1
-0.5
0
0.5
1Median Relative Error
fracti
on
element number
Phytoplankton - buoy data
Nitrogen0 10 20
0
0.005
0.01
0.015
0.02
0.025
0.03
0.035
0.04
0.045Root Mean Square Error (lower is better)
element number
P (
mg
/L)
0 10 200
0.2
0.4
0.6
0.8
1Pearsons Correlation Coefficient
element number
r (u
nit
less)
0 10 200
0.2
0.4
0.6
0.8
1Wilmott Skill
WS
(un
itle
ss)
element number0 10 20
-1
-0.5
0
0.5
1Median Relative Error
fracti
on
element number
Phosphorus
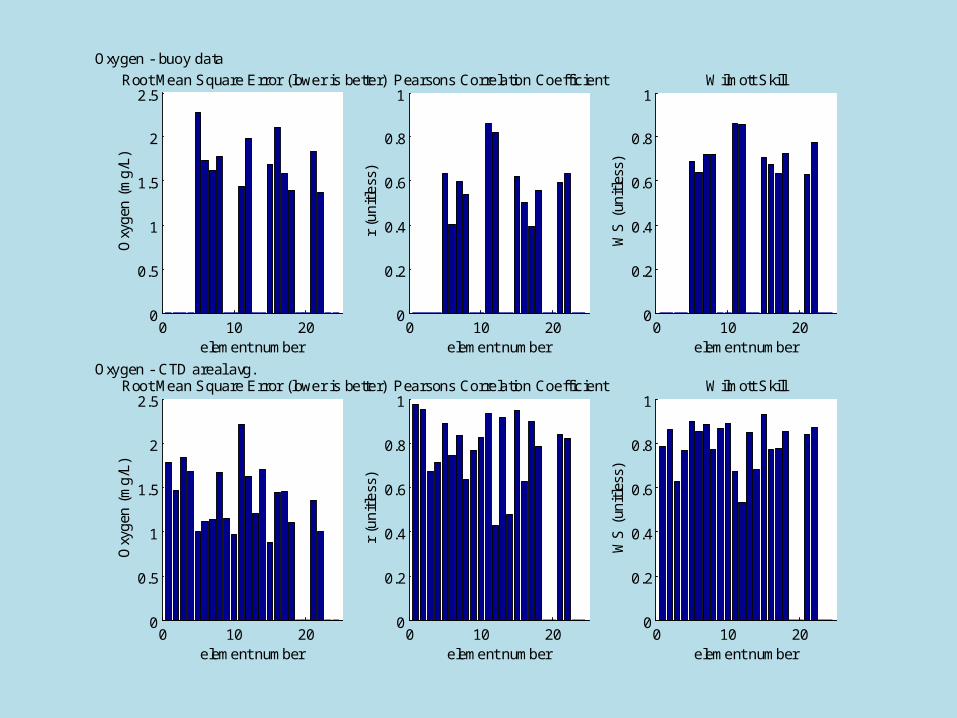
0 10 200
0.5
1
1.5
2
2.5Root Mean Square Error (lower is better)
element number
Oxy
gen
(m
g/L
)
0 10 200
0.2
0.4
0.6
0.8
1Pearsons Correlation Coefficient
element number
r (u
nit
less
)
0 10 200
0.2
0.4
0.6
0.8
1Wilmott Skill
WS
(un
itle
ss)
element number0 10 20
-1
-0.5
0
0.5
1Median Relative Error
frac
tion
element number
0 10 200
0.5
1
1.5
2
2.5Root Mean Square Error (lower is better)
element number
Oxy
gen
(m
g/L
)
0 10 200
0.2
0.4
0.6
0.8
1Pearsons Correlation Coefficient
element number
r (u
nit
less
)
0 10 200
0.2
0.4
0.6
0.8
1Wilmott Skill
WS
(un
itle
ss)
element number0 10 20
-1
-0.5
0
0.5
1Median Relative Error
frac
tion
element number
Oxygen - buoy data
Oxygen - CTD areal avg.
J/06 A/06 J/06 O/060
1
2
3Phytoplankton
gC /
m3
J/06 A/06 J/06 O/060
0.5
1
1.5Nitrogen
gN /
m3
J/06 A/06 J/06 O/060
10
20Oxygen
gO2 /
m3
J/06 A/06 J/06 O/060
0.1
0.2Phosphorous
gP /
m3
J/06 A/06 J/06 O/060
20
40Salt
ppt
J/06 A/06 J/06 O/060
10
20
30Benthic C
gC /
m2
Box1-- blue = surface red = bottom
days
Box1-- blue = surface red = bottom
days