Embed Size (px)
Citation preview
Dublin Institute of TechnologyARROW@DIT
Articles School of Biological Sciences
2005-2
Development and Validation of a Food-FrequencyQuestionnaire for the Determination of DetailedFatty Acid IntakesMaria CantwellDublin Institute of Technology
Michael GibneyTrinity College Dublin
Denis CroninUniversity College Dublin
Katherine YoungerDublin Institute of Technology, [email protected]
John O'NeillUniversity College Dublin
See next page for additional authors
Follow this and additional works at: http://arrow.dit.ie/scschbioart
Part of the Biology Commons
This Article is brought to you for free and open access by the School ofBiological Sciences at ARROW@DIT. It has been accepted for inclusion inArticles by an authorized administrator of ARROW@DIT. For moreinformation, please contact [email protected], [email protected].
This work is licensed under a Creative Commons Attribution-Noncommercial-Share Alike 3.0 License
Recommended CitationCantwell, M. et al:Development and Validation of a Food-Frequency Questionnaire for the Determination of Detailed Fatty AcidIntakes. Public Health Nutrition, 2005, Feb;8(1):97-107. DOI: 10.1079/PHN2004668

AuthorsMaria Cantwell, Michael Gibney, Denis Cronin, Katherine Younger, John O'Neill, Linda Hogan, and MaryFlynn
This article is available at ARROW@DIT: http://arrow.dit.ie/scschbioart/94
Development and validation of a food-frequency questionnairefor the determination of detailed fatty acid intakes
Marie M Cantwell1,2,†, Michael J Gibney2, Denis Cronin3, Kate M Younger1,John P O’Neill3, Linda Hogan1 and Mary AT Flynn1,4,*1Department of Biological Sciences, Dublin Institute of Technology, Republic of Ireland: 2Department of ClinicalMedicine, Trinity Centre for Health Sciences, University of Dublin, Trinity College, Republic of Ireland: 3UniversityCollege Dublin, Republic of Ireland: 4Nutrition and Active Living, Health Promotion and Disease Prevention,Calgary Health Region, PO Box 4016, Station C, 5th Floor, Centre 15, 1509 Centre Street SW, Calgary, Alberta,Canada T2T 5T1
Submitted 9 September 2003: Accepted 12 August 2004
Abstract
Objective: To validate a fat intake questionnaire (FIQ) developed to assess habitualdietary intake while focusing on the assessment of detailed fatty acid intake includingtotal trans unsaturated fatty acids (TUFA).Design: An 88 food item/food group FIQ was developed using a meal patterntechnique. Validation was achieved by comparison with dietary intake assessed by amodified diet history (DH) in a cross-over design. Eighty-four individuals suppliedadipose tissue biopsies for linoleic acid and total TUFA analysis as an independentvalidation of the FIQ and DH.Setting: Medical Centre, Dublin Airport, Republic of Ireland.Subjects: One hundred and five healthy volunteers (43 females and 62 males aged23–63 years).Results: Significant correlations (P , 0.0005) were achieved for intakes of energy(0.78), total fat (0.77), saturated fat (0.77), monounsaturated fat (0.63), polyunsatu-rated fat (0.73), TUFA (0.67) and linoleic acid (0.71) assessed by the FIQ comparedwith the DH. Linoleic acid intake assessed by the FIQ and the DH was significantlycorrelated with adipose tissue concentrations (r ¼ 0.58 and 0.49, respectively;P , 0.005); however, total TUFA intake was poorly correlated with adipose tissueconcentrations (r ¼ 0.17 and 0.10 for FIQ and DH, respectively).Conclusions: The FIQ compared favourably with the DH in assessing habitual diet, inparticular fatty acid intake. In addition, the FIQ was successfully validated against thelinoleic acid composition of adipose tissue, an independent biomarker of relative fattyacid status. The FIQ could therefore be used as an alternative to the DH as it is ashorter, less labour-intensive method.
KeywordsValidation
Fatty acidsTrans unsaturated fatty acids
Nutrient databaseAdipose tissue biopsies
Linoleic acid
Epidemiological and laboratory research suggests that
diets high in fat are associated with an increased risk of
developing cardiovascular disease, some cancers and
possibly obesity1. Studies suggest that individual fatty
acids within the same class differ in their effects on blood
lipids and affect cardiovascular disease risk differently2.
Hu et al.3 examined dietary intake of saturated fatty acids
(SFA) and coronary heart disease (CHD), and showed that
while short- to medium-chain (4:0–10:0) SFA were not
significantly associated with an increased risk of CHD,
longer-chain SFA (12:0–18:0) were each separately
associated with a small increase in risk. Cis monounsatu-
rated fatty acids (MUFA), e.g. oleic acid, have a lowering
effect on low-density lipoprotein (LDL)-cholesterol and a
neutral effect on high-density lipoprotein (HDL)-choles-
terol levels, whereas trans MUFA, e.g. elaidic acid, raise
LDL-cholesterol while lowering HDL-cholesterol levels4.
The assessment of individual fatty acid intake is however
highly complex and limited to the nutrient database used
to analyse dietary data.
Dietary assessment of fatty acid intake is particularly
challenging as the fatty acid composition of certain foods
(e.g. margarine, cooking fat and biscuits) differs
dramatically between brands. In addition, manufacturers
of margarine and cooking fat may change the component
oils used depending on production costs. For example,
q The Authors 2005*Corresponding author: Email [email protected]
†Current address: Cancer Prevention Fellowship Program, Division of
Cancer Prevention, National Cancer Institute, National Institutes of
Health, USA.
Public Health Nutrition: 8(1), 97–107 DOI: 10.1079/PHN2004668
the species and content of fish oils used may change
depending on availability and cost, thereby changing
the fatty acid composition of the margarine or fat
produced and finally the products manufactured using
this fat. Therefore, dietary data should ideally be
analysed using food composition data that have been
collected during the same reference period.
The 7-day diet history (DH) method, standardised for
use in the Irish National Nutrition Survey5, has previously
been validated for energy intake against the doubly
labelled water method in adolescents6. The DH assesses
habitual dietary intake and can be modified to assess
brands of processed foods eaten and therefore fatty acid
intake; however, this increases the administration time
required. Food-frequency questionnaires (FFQs) are
therefore frequently used, as they are less labour-
intensive. The relative validity of a newly developed
FFQ must in general be assessed by comparison with a
reference method (a previously validated dietary assess-
ment method, e.g. DH). However, Hirsch et al.7 suggested
the use of a biological index of intake as an independent
validity check. It has been demonstrated for example that
the fatty acid composition of subcutaneous adipose tissue
reflects dietary fatty acid intake over the previous 2 years
and can therefore be used as a biological index of fatty
acid intake. A biomarker serves as an independent
measure of intake unbiased by self-reporting or changes
in the fatty acid composition of the food supply from
season to season.
The specific objectives of the present paper are:
1. to describe the development of a food/nutrient
database which includes the fatty acid and total trans
unsaturated fatty acids (TUFA) content of 225 foods
analysed specifically for this study;
2. to describe the development and validation of a fat
intake questionnaire (FIQ) developed to assess habitual
dietary intake, with particular emphasis on fatty acid
intake, by comparison with the DH method; and
3. to describe the validation of the FIQ by comparison
with the fatty acid composition of adipose tissue as an
independent marker of relative fatty acid status.
Methods
FIQ development
An FIQ was developed using food intake data assessed in
a previous study of 153 healthy Irish adults8. This included
the development of a comprehensive list of foods that
accounted for the total fat intake and 95% of total energy
intake of individuals in this study. Food items with a
similar nutrient content and of similar portion size were
grouped together; for example all types of root vegetable
were assessed as one food group. The FIQ was designed
to record additional information on method of cooking,
sauces added, the type and amount of fat used both
in cooking and at the table, and the consumption of fat
on meats.
The FIQ, which was pilot-tested in a group of 20 healthy
adults (10 males, 10 females), was modified slightly for
clarity. The final questionnaire included 88 food items or
food groups and was structured to follow a typical daily
meal pattern; i.e. all foods usually consumed at breakfast
were assessed first, followed by foods typically eaten at
other meals. For example, bread intake was assessed for
four eating occasions: breakfast, lunch, dinner and snacks.
For certain foods e.g. biscuits, the frequency of consump-
tion of all types of biscuits was recorded and additional
questions collected information regarding the amount,
type and brand chosen. Intakes of mixed dishes, cakes,
confectionery and take-away foods were also assessed in
this way. The reference period included the four weeks
preceding the interview. The frequency of consumption
of each food item was recorded as frequency per day,
per week, per fortnight or per month.
Standard portion sizes were derived from commonly
used household units for each food listed (e.g. pre-sliced
bread, pat of butter, teaspoon, tablespoon, cup, etc.). The
FIQ recorded the subject’s regular portion size of each
food eaten relative to this standard portion size (e.g. 4
slices of bread, 1/2 teaspoon of sugar, etc.). For a limited
number of foods (namely breakfast cereals, meat, fish and
mixed dishes) a semi-quantitative approach was necessary
and portion sizes were described as small, medium and
large9. To identify brands of food consumed, an atlas of
142 photographs of different brands of biscuits, cakes,
pastries, breads, cooking fats, dairy and non-dairy spreads
was developed specifically for this study. Finally, the FIQ
was developed for administration by a trained nutritionist
as a quick method of measuring fat intake.
Compilation of a food/nutrient database
Two hundred and twenty-five foods (cakes, biscuits,
pastries, breads, dairy and non-dairy spreads, cooking fats,
hard margarines, fruit-filled pies and snack foods) were
analysed for their individual fatty acid and total TUFA
content10,11. Fatty acid methyl esters (FAMEs) were
separated by gas chromatography and identified by
comparison with standard samples of known methyl
esters. Fatty acids with 20–22 carbon atoms were
calculated as one group, making no distinction between
SFA, MUFA or PUFA, or whether the configuration of the
double bonds was cis or trans. The presence of C20 and
C22 fatty acids indicated the use of marine oils in the
production of a food. The total TUFA content was analysed
using infra-red spectroscopy10,11. The analysis of foods
was carried out according to the methods outlined by
O’Neill10 and Cronin and O’Neill11. As a result of this
analysis, the following fatty acid profile was established
for each food: 12:0, 14:0, 16:0, 18:0, 16:1, 18:1, 18:2, 18:3,
C20 þ C22 and total TUFA content.
MM Cantwell et al.98
UK food composition tables (FOODBASE) were
modified as follows to incorporate the fatty acid data of
the 225 Irish foods analysed. The nutrient record of a
similar food in the UK database was copied and the fatty
acid profile was substituted, producing a new food record
that included the carbohydrate, protein and micronutrient
content of the UK food and the fatty acid composition of
the Irish food. New food records were therefore developed
for each of the 225 foods analysed. Checks for internal
consistency of the database included comparison of
calculated measurements with expected values for each
database entry as described by Buzzard et al.12.
Validation study
Of 2000 employees invited through a mailing system and
advertisement in a company magazine, 317 volunteered
for the study. One hundred and fifty-two individuals were
excluded as a result of the following criteria: taking
prescription medication, lipid abnormalities or aged ,20
or .65 years. Of the 165 suitable healthy volunteers who
were recruited, 54 were missing dietary intake data and six
reported an implausible dietary intake. Subject infor-
mation for the remaining 105 volunteers is shown in
Table 1. Ethical approval was received from the ethics
committee of the Federated Dublin Voluntary Hospitals
and all participants provided informed written consent.
The dietary intake of all participants was assessed twice,
once with the FIQ and once with the modified DH method
(reference method). The DH method described by
Livingstone et al.6 was modified to assess individual fatty
acid intake by assessing the brands of foods chosen with
the photographic atlas described previously. The study
was conducted using a cross-over design whereby equal
numbers of participants were assessed using the FIQ and
DH history first. A four-week interval between dietary
assessments prevented information carryover from the
first to the second assessment. Anthropometric measure-
ments were recorded at both interviews. Body weight,
without shoes and jacket, was assessed on a SECA scale to
the nearest 0.1 kg. Height was recorded in cm.
Laboratory analysis
Subcutaneous adipose tissue samples were aspirated from
the abdomen using a modification of the method described
by Hirsch et al.7, and biopsies that were adequate for
analysis were obtained from 84 of the volunteers. Accurately
weighed samples of approximately 10mg adipose fat were
dissolved in 0.1ml isopropyl ether and transesterified at
ambient temperature with 0.1ml of 1M sodium methoxide
for 20min. Methylation of any free fatty acids present in the
original adipose sample was completed using 0.2ml of 5%
methanolic HCl, with methylation carried out at 808C for 1 h.
Samples were then evaporated to dryness under nitrogen
and dried for 5–10min in an oven at 808C. FAMEs were
dissolved in hexane to give a concentration of exactly 2%
w/v, based on the weight of sample taken. Before sealing,
approximately 20mg of anhydrous sodium sulphate was
added to each vial to remove any residual traces of moisture
from the extracts. The FAME solutions were stored at2208C
until analysis by gas chromatography under the following
conditions: SP2560 (100 m £ 0.25 mm id, 20 pm film
thickness) flexible fused silica capillary column (Supelco,
Bellefonte, PA, USA) in a Pye Unicam 610 FID gas
chromatograph; split ratio 50:1; hydrogen (0.8mlmin21)
carrier gas; 1ml (2% FAME solution in hexane) injected
sample; injector temperature of 2408C; detector temperature
of 2608C. Resolution of cis- and trans-isomers was optimised
using the following temperature programming: 150–1808C
at 0.58Cmin21, 180–2108C at 28Cmin21. Peak areas were
integrated using a Spectra Physics SP4290 integrator. FAMEs
were confirmed by comparison of retention times of
authentic standards run under the same conditions. These
standards were sometimes ‘spiked’ into the FAME solution
whenever there was doubt about the component identity
in groups of closely eluting peaks. The content of linoleic
acid and total TUFA was expressed as a percentage by
weight (g/100 g) of total fat content.
Data management
To eliminate inter-interviewer bias, the main investigator
carried out all interviews, coding and analysis. Nutrient
intakes were calculated using the food/nutrient database
(FOODBASE), which included analysis of 225 foods
described previously. For composite recipe dishes, the
nutrient content was calculated as the weighted con-
sumption of each separate food product.
Statistical analysis
The mean difference in intake of each nutrient assessed by
both methods was calculated as an estimate of the average
bias of one method relative to the other. The limits of
agreement (mean difference plus or minus two standard
Table 1 Demographic characteristics of participants who completed the fat intake questionnaire and diet history
Total (n ¼ 105) Males (n ¼ 62) Females (n ¼ 43)
Mean (range) Mean (range) Mean (range)
Age (years) 38.5 (23–63) 40.8 (28–63) 35.1 (23–56)Weight (kg) 78.3 (48–117) 69.1 (59–117) 62.0 (48–115)Height (m) 1.72 (1.54–1.94) 1.77 (1.63–1.94) 1.65 (1.54–1.77)BMI (kg m22) 26.1 (18.9–41.5) 26.7 (20.5–36.3) 25.1 (18.9–41.5)
BMI – body mass index.
Validation of a fat intake questionnaire 99
deviations of the difference (^2SDdifference)) were also
calculated for each nutrient to consider how well the
methods agreed for an individual.
To exclude the possibility of a non-constant bias, i.e. a
bias that depends on the level of intake, the difference
between the two measures and the mean of the two
measures were calculated for each individual13. The
relationship between these parameters was studied by
means of regression analysis, as advocated by Altman and
Bland13. The ability of the FIQ to classify individuals into
the same quartile of intake as the DH was tested for each
nutrient to evaluate agreement between both dietary
assessment methods.
Pearson product–moment correlation coefficients were
calculated to assess the association between the fatty acid
composition of the diet, estimated by the FIQ and the DH,
with the fatty acid composition of adipose tissue. Finally,
the study group was divided into quartiles of long-chain
fatty acid (C20 þ C22) intake and a comparison of the total
TUFA intake (g/100 g fatty acids) and the total TUFA
content of adipose tissue among these quartiles was
performed. Statistical analyses were performed using SPSS
software (Statistical Package for Social Sciences; SPSS Inc.,
Chicago, IL, USA).
Results
Validation by comparison with the DH method
The FIQ required on average 29 min to administer
compared with 62 min for the DH. The mean differences
in macronutrient intake assessed by the FIQ and
the modified DH were not significantly different from
zero (Table 2), indicating that the methods agreed
excellently on average. The limits of agreement indicate
that for a new subject we expect the two methods to differ
in the assessment of total fat intake by approximately 8.4,
SFA intake by 5, MUFA by 4, PUFA by 3, TUFA by 1.5 and
linoleic acid by 3.2 (% energy). Differences between
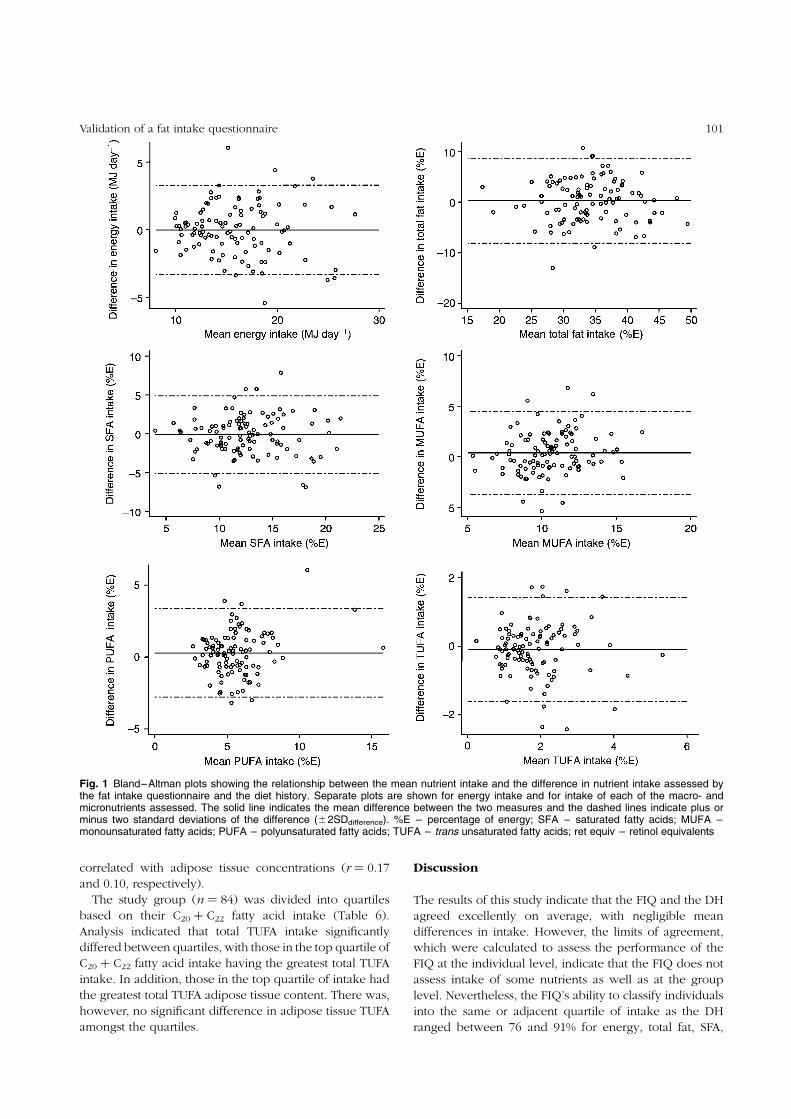
individual pairs of intake estimates were not significantly
related to the means for the majority of macronutrients, as
demonstrated by regression analysis (Fig. 1). However,
low intakes were underestimated and high intakes
overestimated for polyunsaturated fat (% energy) and
vice versa for carbohydrate (% energy) intake, resulting in
a regression equation in which b was 0.21 and 20.23,
respectively.
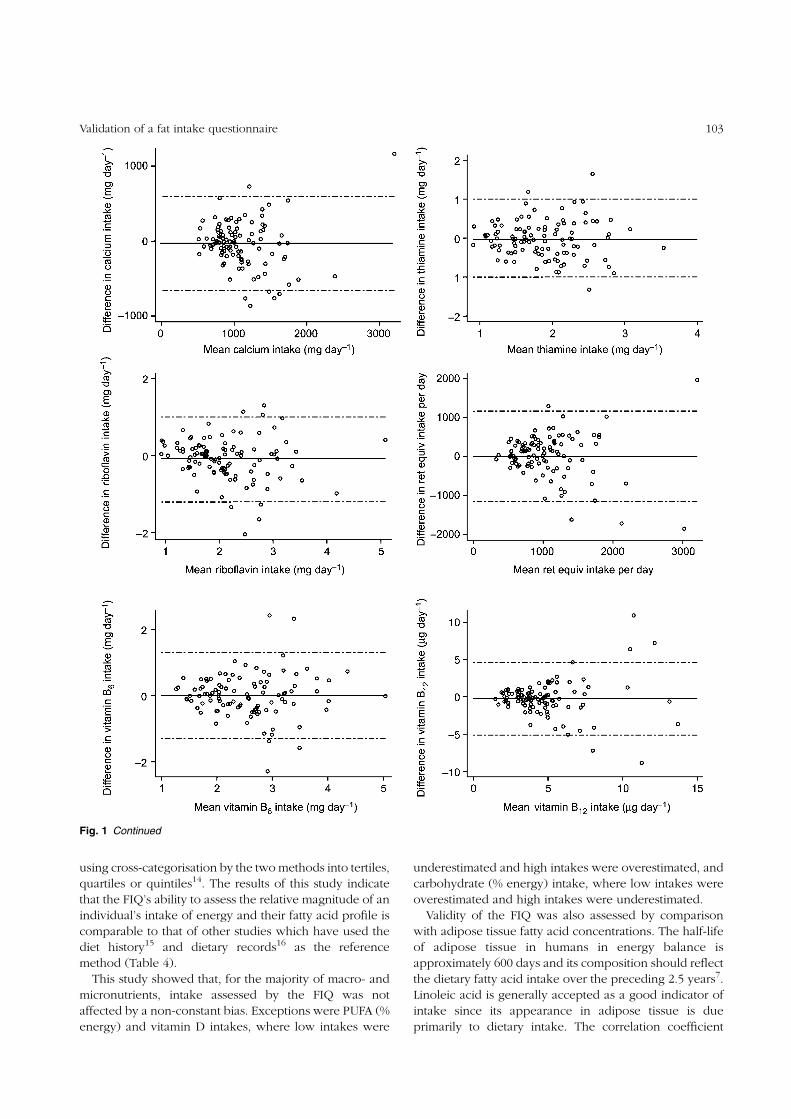
Mean differences in micronutrient intakes assessed
by both methods were also comparable (Table 3), with
the exception of vitamin D. A non-constant bias was
also detected for vitamin D, as low intakes were
underestimated and high intakes overestimated
(b ¼ 0.45).
The ability of the FIQ to classify individuals into the
same or adjacent quartile of intake as the DH ranged
from 76% for linoleic acid (% energy) to 91% for energy
(MJ), total fat (g day21) and saturated fat (g day21),
shown in Table 4. The highest proportion of misclassi-
fication (i.e. classified from one extreme category to the
other extreme category of intake) was 5% for total TUFA
(% energy).
Validation by comparison with adipose tissue
biopsies
Linoleic acid intake (g/100 g total fatty acids) assessed by
the FIQ and the DH was significantly correlated with
adipose tissue concentrations (g/100 g FAMEs) for the total
group, with r ¼ 0.58 and 0.49 (P , 0.005), respectively
(Table 5). In contrast, total TUFA intake assessed by the
FIQ and the DH were poorly and not significantly
Table 2 Intakes of energy, macronutrients and dietary fibre, and ratio of energy intake to basal metabolicrate (EI/BMR), estimated using the fat intake questionnaire (FIQ) and diet history (DH) in 105 healthy adults
FIQ DHMean difference
(limits of agreement)†Intake Mean (SD) Mean (SD) Correlation‡
Energy (MJ) 10.6 (3.0) 10.6 (2.7) 20.02 (23.3, 3.3) 0.78***Fatty acids (%E)
Total 33.9 (6.2) 34.2 (6.1) 0.28 (28.1, 8.6) 0.77***SFA 12.7 (3.8) 12.6 (3.7) 20.10 (25.1, 4.9) 0.77***MUFA 10.4 (2.2) 10.8 (2.5) 0.39 (23.7, 4.5) 0.63***PUFA 5.5 (1.9) 5.7 (2.2) 0.23 (22.8, 3.3) 0.73***TUFA 1.9 (0.9) 1.8 (0.9) 20.10 (21.6, 1.4) 0.67***Linoleic 4.8 (2.1) 4.9 (2.1) 0.05 (23.1, 3.2) 0.71***
Alcohol (%E) 6.3 (5.1) 5.7 (4.3) 20.04 (27.5, 6.4) 0.71***CHO (%E) 45.9 (6.8) 45.5 (5.9) 20.43 (28.3, 7.4) 0.82***Protein (%E) 14.8 (2.6) 15.2 (2.5) 0.38 (23.9, 4.7) 0.64***Fibre (g)§ 26.9 (9.2) 26.9 (9.7) 0.07 (214.0, 14.2) 0.73***EI/BMR 1.50 (0.4) 1.51 (0.4)
SD – standard deviation; %E – percentage of energy; SFA – saturated fatty acids; MUFA – monounsaturated fatty acids;PUFA – polyunsaturated fatty acids; TUFA – trans unsaturated fatty acids; CHO – carbohydrate.† Limits of agreement ¼ mean difference (DH 2 FIQ) ^ 2SDdifference.‡ Pearson correlation.§ Southgate method.*** Significant correlation between FIQ and DH: P , 0.0005.
MM Cantwell et al.100
correlated with adipose tissue concentrations (r ¼ 0.17
and 0.10, respectively).
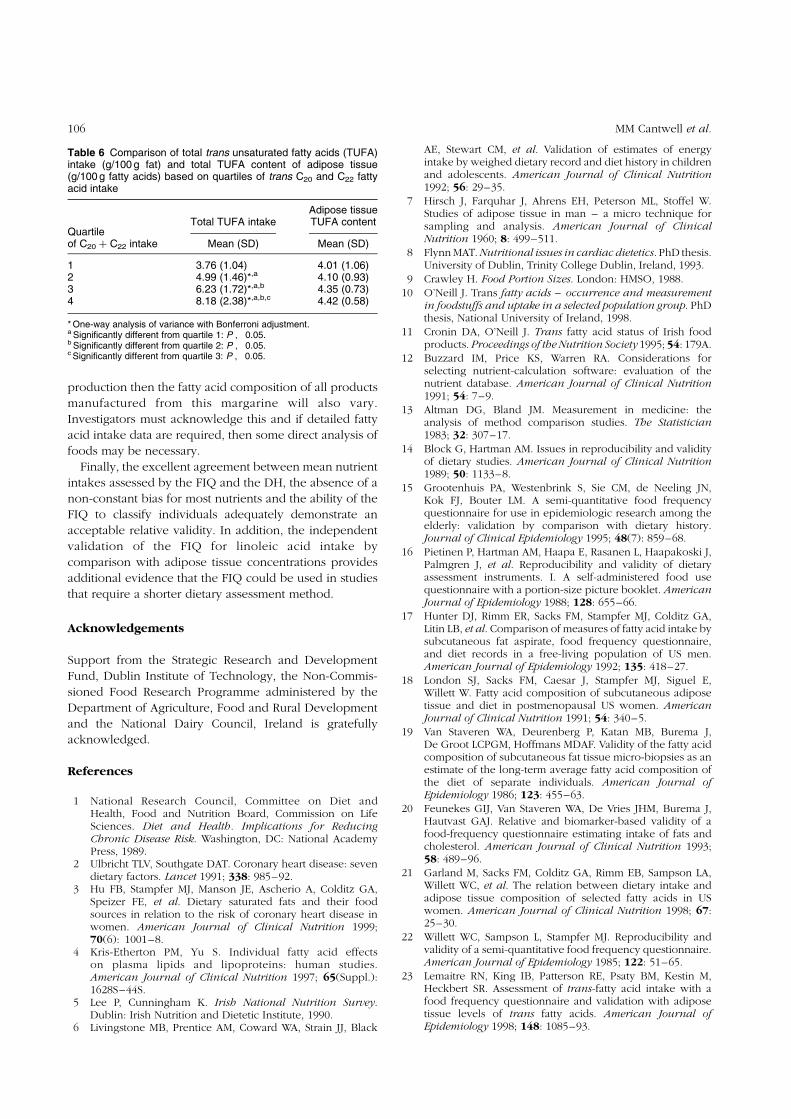
The study group (n ¼ 84) was divided into quartiles
based on their C20 þ C22 fatty acid intake (Table 6).
Analysis indicated that total TUFA intake significantly
differed between quartiles, with those in the top quartile of
C20 þ C22 fatty acid intake having the greatest total TUFA
intake. In addition, those in the top quartile of intake had
the greatest total TUFA adipose tissue content. There was,
however, no significant difference in adipose tissue TUFA
amongst the quartiles.
Discussion
The results of this study indicate that the FIQ and the DH
agreed excellently on average, with negligible mean
differences in intake. However, the limits of agreement,
which were calculated to assess the performance of the
FIQ at the individual level, indicate that the FIQ does not
assess intake of some nutrients as well as at the group
level. Nevertheless, the FIQ’s ability to classify individuals
into the same or adjacent quartile of intake as the DH
ranged between 76 and 91% for energy, total fat, SFA,
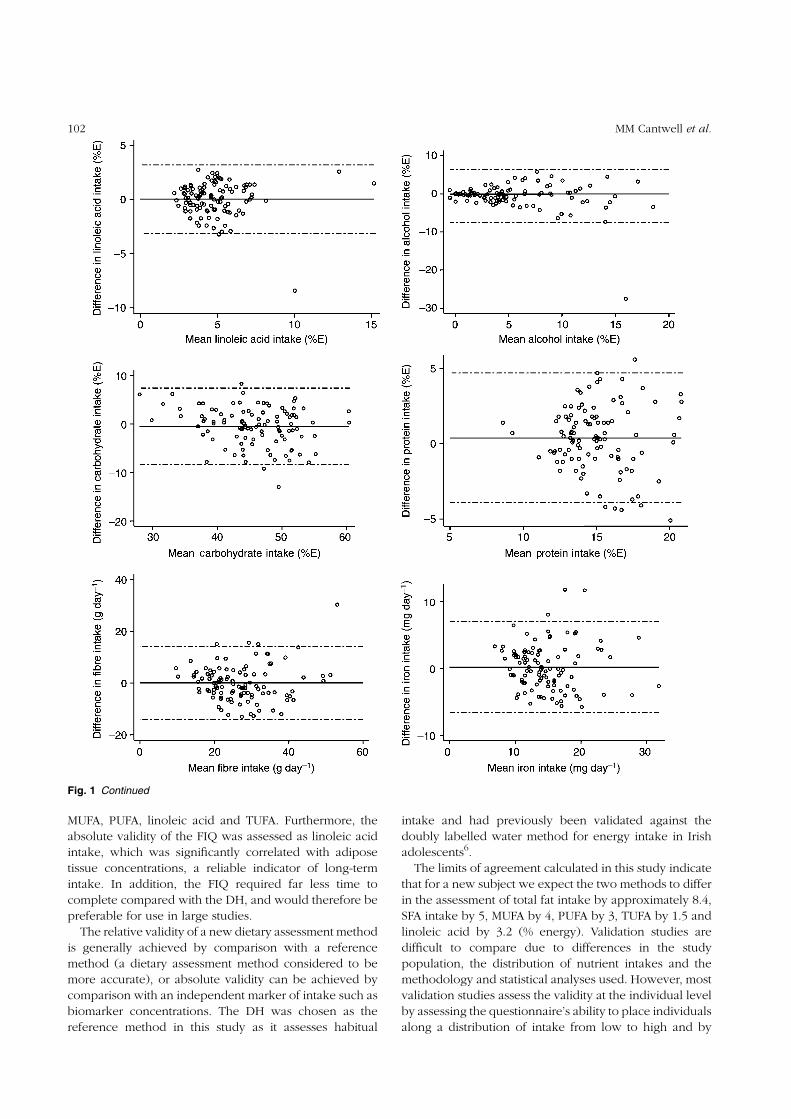
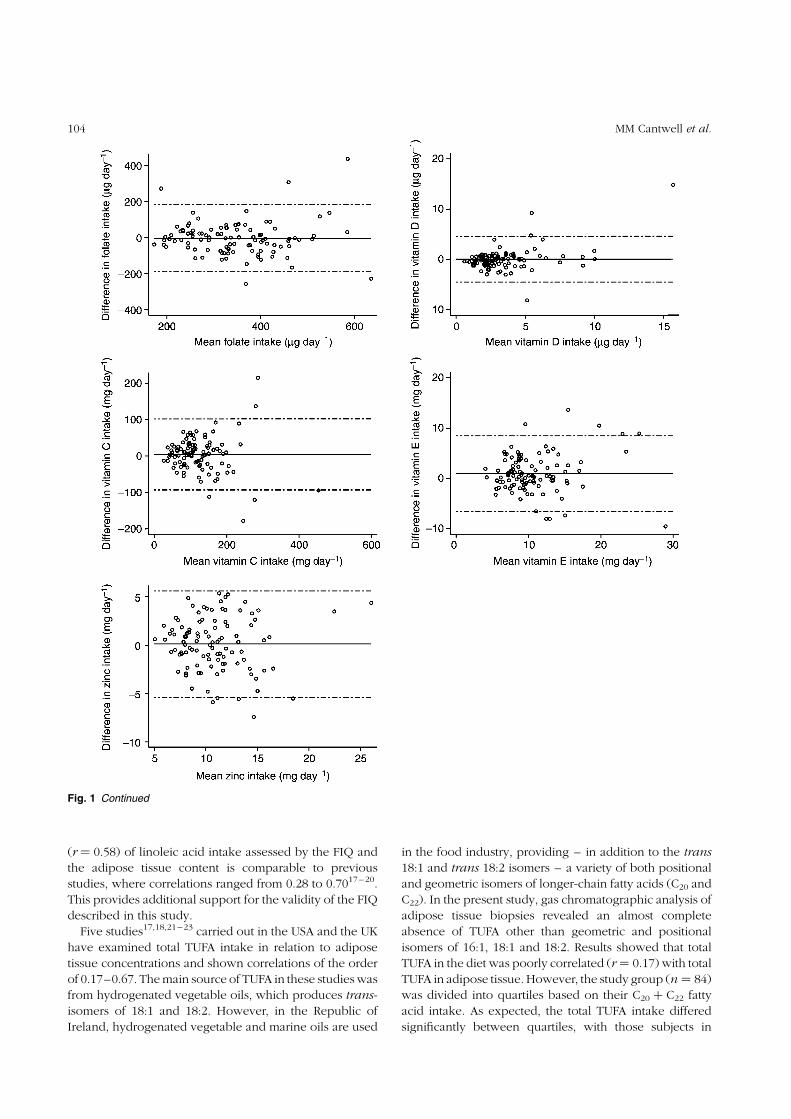
Fig. 1 Bland–Altman plots showing the relationship between the mean nutrient intake and the difference in nutrient intake assessed bythe fat intake questionnaire and the diet history. Separate plots are shown for energy intake and for intake of each of the macro- andmicronutrients assessed. The solid line indicates the mean difference between the two measures and the dashed lines indicate plus orminus two standard deviations of the difference (^2SDdifference). %E – percentage of energy; SFA – saturated fatty acids; MUFA –monounsaturated fatty acids; PUFA – polyunsaturated fatty acids; TUFA – trans unsaturated fatty acids; ret equiv – retinol equivalents
Validation of a fat intake questionnaire 101
MUFA, PUFA, linoleic acid and TUFA. Furthermore, the
absolute validity of the FIQ was assessed as linoleic acid
intake, which was significantly correlated with adipose
tissue concentrations, a reliable indicator of long-term
intake. In addition, the FIQ required far less time to
complete compared with the DH, and would therefore be
preferable for use in large studies.
The relative validity of a new dietary assessment method
is generally achieved by comparison with a reference
method (a dietary assessment method considered to be
more accurate), or absolute validity can be achieved by
comparison with an independent marker of intake such as
biomarker concentrations. The DH was chosen as the
reference method in this study as it assesses habitual
intake and had previously been validated against the
doubly labelled water method for energy intake in Irish
adolescents6.
The limits of agreement calculated in this study indicate
that for a new subject we expect the two methods to differ
in the assessment of total fat intake by approximately 8.4,
SFA intake by 5, MUFA by 4, PUFA by 3, TUFA by 1.5 and
linoleic acid by 3.2 (% energy). Validation studies are
difficult to compare due to differences in the study
population, the distribution of nutrient intakes and the
methodology and statistical analyses used. However, most
validation studies assess the validity at the individual level
by assessing the questionnaire’s ability to place individuals
along a distribution of intake from low to high and by
Fig. 1 Continued
MM Cantwell et al.102
using cross-categorisation by the two methods into tertiles,
quartiles or quintiles14. The results of this study indicate
that the FIQ’s ability to assess the relative magnitude of an
individual’s intake of energy and their fatty acid profile is
comparable to that of other studies which have used the
diet history15 and dietary records16 as the reference
method (Table 4).
This study showed that, for the majority of macro- and
micronutrients, intake assessed by the FIQ was not
affected by a non-constant bias. Exceptions were PUFA (%
energy) and vitamin D intakes, where low intakes were
underestimated and high intakes were overestimated, and
carbohydrate (% energy) intake, where low intakes were
overestimated and high intakes were underestimated.
Validity of the FIQ was also assessed by comparison
with adipose tissue fatty acid concentrations. The half-life
of adipose tissue in humans in energy balance is
approximately 600 days and its composition should reflect
the dietary fatty acid intake over the preceding 2.5 years7.
Linoleic acid is generally accepted as a good indicator of
intake since its appearance in adipose tissue is due
primarily to dietary intake. The correlation coefficient
Fig. 1 Continued
Validation of a fat intake questionnaire 103
(r ¼ 0.58) of linoleic acid intake assessed by the FIQ and
the adipose tissue content is comparable to previous
studies, where correlations ranged from 0.28 to 0.7017–20.
This provides additional support for the validity of the FIQ
described in this study.
Five studies17,18,21–23 carried out in the USA and the UK
have examined total TUFA intake in relation to adipose
tissue concentrations and shown correlations of the order
of 0.17–0.67. The main source of TUFA in these studies was
from hydrogenated vegetable oils, which produces trans-
isomers of 18:1 and 18:2. However, in the Republic of
Ireland, hydrogenated vegetable and marine oils are used
in the food industry, providing – in addition to the trans
18:1 and trans 18:2 isomers – a variety of both positional
and geometric isomers of longer-chain fatty acids (C20 and
C22). In the present study, gas chromatographic analysis of
adipose tissue biopsies revealed an almost complete
absence of TUFA other than geometric and positional
isomers of 16:1, 18:1 and 18:2. Results showed that total
TUFA in the diet was poorly correlated (r ¼ 0.17) with total
TUFA in adipose tissue. However, the study group (n ¼ 84)
was divided into quartiles based on their C20 þ C22 fatty
acid intake. As expected, the total TUFA intake differed
significantly between quartiles, with those subjects in
Fig. 1 Continued
MM Cantwell et al.104
the top quartile of C20 þ C22 fatty acid intake having
the greatest total TUFA intake and total TUFA adipose
tissue content. However, there was no significant
difference in total TUFA adipose tissue concentrations
amongst quartiles. Clearly, longer-chain TUFA are not
incorporated into adipose tissue to the same extent as
trans-isomers of C18. This concept, which has been
discussed previously24, can be explained by a decreased
absorption of long-chain fatty acids with increasing chain
length in humans25 and a reduced retention of 22:0, when
fed as a component of hydrogenated fish oil, in the carcass
fat of rats26.
It is possible that nutrient intakes assessed in the present
study may be slightly biased because the study
participants, who were volunteers, could be nutritionally
more aware than persons who did not respond. However,
it does not appear that total fat intake or the fatty acid
profiles assessed in the present study differ substantially
from population estimates in 2001 assessed by the
North/South Ireland Food Consumption Survey27. For
example, in the present study, total fat intake (% energy)
was 33.9 versus 34.8 and 35.6 for men and women,
respectively, in the nationally representative sample. The
FIQ, which was developed for use in Ireland, could be
used by other investigators without additional changes,
but would need to be re-validated for use in other ethnic
or culturally different groups. As previously mentioned, if
food manufacturers change the oils they use in margarine
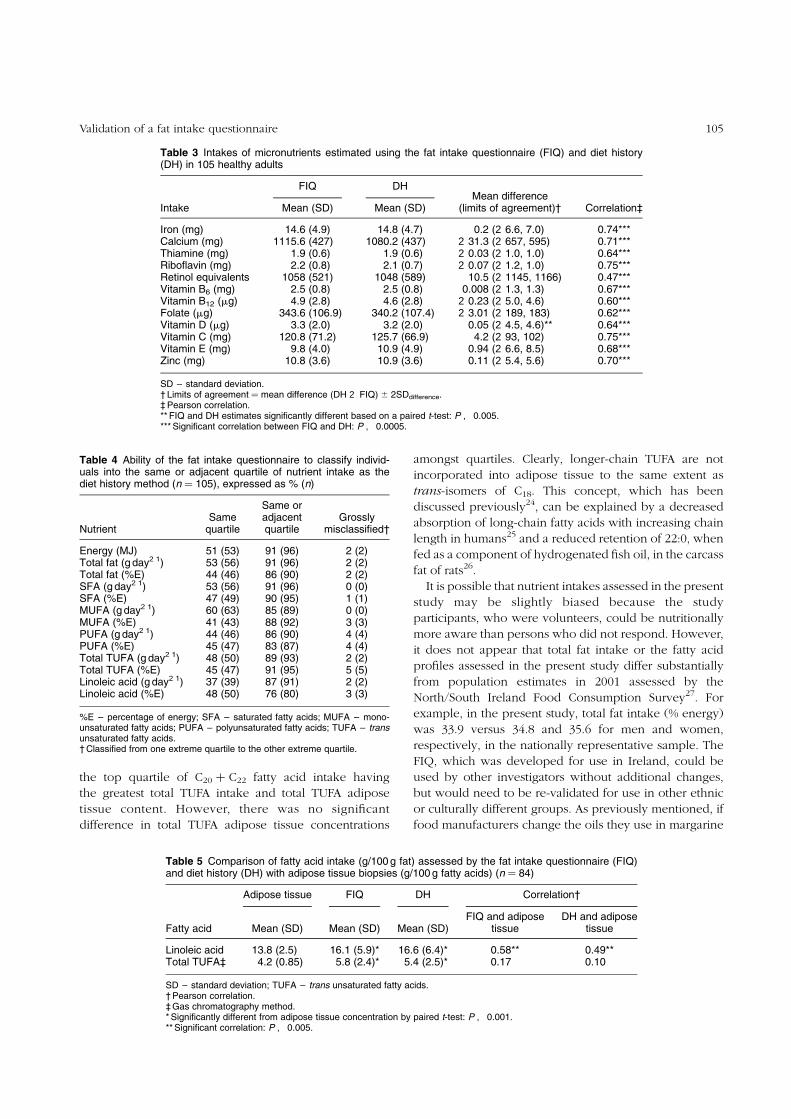
Table 3 Intakes of micronutrients estimated using the fat intake questionnaire (FIQ) and diet history(DH) in 105 healthy adults
FIQ DHMean difference
(limits of agreement)†Intake Mean (SD) Mean (SD) Correlation‡
Iron (mg) 14.6 (4.9) 14.8 (4.7) 0.2 (26.6, 7.0) 0.74***Calcium (mg) 1115.6 (427) 1080.2 (437) 231.3 (2657, 595) 0.71***Thiamine (mg) 1.9 (0.6) 1.9 (0.6) 20.03 (21.0, 1.0) 0.64***Riboflavin (mg) 2.2 (0.8) 2.1 (0.7) 20.07 (21.2, 1.0) 0.75***Retinol equivalents 1058 (521) 1048 (589) 10.5 (21145, 1166) 0.47***Vitamin B6 (mg) 2.5 (0.8) 2.5 (0.8) 0.008 (21.3, 1.3) 0.67***Vitamin B12 (mg) 4.9 (2.8) 4.6 (2.8) 20.23 (25.0, 4.6) 0.60***Folate (mg) 343.6 (106.9) 340.2 (107.4) 23.01 (2189, 183) 0.62***Vitamin D (mg) 3.3 (2.0) 3.2 (2.0) 0.05 (24.5, 4.6)** 0.64***Vitamin C (mg) 120.8 (71.2) 125.7 (66.9) 4.2 (293, 102) 0.75***Vitamin E (mg) 9.8 (4.0) 10.9 (4.9) 0.94 (26.6, 8.5) 0.68***Zinc (mg) 10.8 (3.6) 10.9 (3.6) 0.11 (25.4, 5.6) 0.70***
SD – standard deviation.† Limits of agreement ¼ mean difference (DH 2 FIQ) ^ 2SDdifference.‡ Pearson correlation.** FIQ and DH estimates significantly different based on a paired t-test: P , 0.005.*** Significant correlation between FIQ and DH: P , 0.0005.
Table 4 Ability of the fat intake questionnaire to classify individ-uals into the same or adjacent quartile of nutrient intake as thediet history method (n ¼ 105), expressed as % (n)
NutrientSame
quartile
Same oradjacentquartile
Grosslymisclassified†
Energy (MJ) 51 (53) 91 (96) 2 (2)Total fat (g day21) 53 (56) 91 (96) 2 (2)Total fat (%E) 44 (46) 86 (90) 2 (2)SFA (g day21) 53 (56) 91 (96) 0 (0)SFA (%E) 47 (49) 90 (95) 1 (1)MUFA (g day21) 60 (63) 85 (89) 0 (0)MUFA (%E) 41 (43) 88 (92) 3 (3)PUFA (g day21) 44 (46) 86 (90) 4 (4)PUFA (%E) 45 (47) 83 (87) 4 (4)Total TUFA (g day21) 48 (50) 89 (93) 2 (2)Total TUFA (%E) 45 (47) 91 (95) 5 (5)Linoleic acid (g day21) 37 (39) 87 (91) 2 (2)Linoleic acid (%E) 48 (50) 76 (80) 3 (3)
%E – percentage of energy; SFA – saturated fatty acids; MUFA – mono-unsaturated fatty acids; PUFA – polyunsaturated fatty acids; TUFA – transunsaturated fatty acids.† Classified from one extreme quartile to the other extreme quartile.
Table 5 Comparison of fatty acid intake (g/100 g fat) assessed by the fat intake questionnaire (FIQ)and diet history (DH) with adipose tissue biopsies (g/100 g fatty acids) (n ¼ 84)
Adipose tissue FIQ DH Correlation†
Fatty acid Mean (SD) Mean (SD) Mean (SD)FIQ and adipose
tissueDH and adipose
tissue
Linoleic acid 13.8 (2.5) 16.1 (5.9)* 16.6 (6.4)* 0.58** 0.49**Total TUFA‡ 4.2 (0.85) 5.8 (2.4)* 5.4 (2.5)* 0.17 0.10
SD – standard deviation; TUFA – trans unsaturated fatty acids.† Pearson correlation.‡ Gas chromatography method.* Significantly different from adipose tissue concentration by paired t-test: P , 0.001.** Significant correlation: P , 0.005.
Validation of a fat intake questionnaire 105
production then the fatty acid composition of all products
manufactured from this margarine will also vary.
Investigators must acknowledge this and if detailed fatty
acid intake data are required, then some direct analysis of
foods may be necessary.
Finally, the excellent agreement between mean nutrient
intakes assessed by the FIQ and the DH, the absence of a
non-constant bias for most nutrients and the ability of the
FIQ to classify individuals adequately demonstrate an
acceptable relative validity. In addition, the independent
validation of the FIQ for linoleic acid intake by
comparison with adipose tissue concentrations provides
additional evidence that the FIQ could be used in studies
that require a shorter dietary assessment method.
Acknowledgements
Support from the Strategic Research and Development
Fund, Dublin Institute of Technology, the Non-Commis-
sioned Food Research Programme administered by the
Department of Agriculture, Food and Rural Development
and the National Dairy Council, Ireland is gratefully
acknowledged.
References
1 National Research Council, Committee on Diet andHealth, Food and Nutrition Board, Commission on LifeSciences. Diet and Health. Implications for ReducingChronic Disease Risk. Washington, DC: National AcademyPress, 1989.
2 Ulbricht TLV, Southgate DAT. Coronary heart disease: sevendietary factors. Lancet 1991; 338: 985–92.
3 Hu FB, Stampfer MJ, Manson JE, Ascherio A, Colditz GA,Speizer FE, et al. Dietary saturated fats and their foodsources in relation to the risk of coronary heart disease inwomen. American Journal of Clinical Nutrition 1999;70(6): 1001–8.
4 Kris-Etherton PM, Yu S. Individual fatty acid effectson plasma lipids and lipoproteins: human studies.American Journal of Clinical Nutrition 1997; 65(Suppl.):1628S–44S.
5 Lee P, Cunningham K. Irish National Nutrition Survey.Dublin: Irish Nutrition and Dietetic Institute, 1990.
6 Livingstone MB, Prentice AM, Coward WA, Strain JJ, Black
AE, Stewart CM, et al. Validation of estimates of energyintake by weighed dietary record and diet history in childrenand adolescents. American Journal of Clinical Nutrition1992; 56: 29–35.
7 Hirsch J, Farquhar J, Ahrens EH, Peterson ML, Stoffel W.Studies of adipose tissue in man – a micro technique forsampling and analysis. American Journal of ClinicalNutrition 1960; 8: 499–511.
8 Flynn MAT. Nutritional issues in cardiac dietetics. PhD thesis.University of Dublin, Trinity College Dublin, Ireland, 1993.
9 Crawley H. Food Portion Sizes. London: HMSO, 1988.10 O’Neill J. Trans fatty acids – occurrence and measurement
in foodstuffs and uptake in a selected population group. PhDthesis, National University of Ireland, 1998.
11 Cronin DA, O’Neill J. Trans fatty acid status of Irish foodproducts. Proceedings of the Nutrition Society 1995; 54: 179A.
12 Buzzard IM, Price KS, Warren RA. Considerations forselecting nutrient-calculation software: evaluation of thenutrient database. American Journal of Clinical Nutrition1991; 54: 7–9.
13 Altman DG, Bland JM. Measurement in medicine: theanalysis of method comparison studies. The Statistician1983; 32: 307–17.
14 Block G, Hartman AM. Issues in reproducibility and validityof dietary studies. American Journal of Clinical Nutrition1989; 50: 1133–8.
15 Grootenhuis PA, Westenbrink S, Sie CM, de Neeling JN,Kok FJ, Bouter LM. A semi-quantitative food frequencyquestionnaire for use in epidemiologic research among theelderly: validation by comparison with dietary history.Journal of Clinical Epidemiology 1995; 48(7): 859–68.
16 Pietinen P, Hartman AM, Haapa E, Rasanen L, Haapakoski J,Palmgren J, et al. Reproducibility and validity of dietaryassessment instruments. I. A self-administered food usequestionnaire with a portion-size picture booklet. AmericanJournal of Epidemiology 1988; 128: 655–66.
17 Hunter DJ, Rimm ER, Sacks FM, Stampfer MJ, Colditz GA,Litin LB, et al. Comparison of measures of fatty acid intake bysubcutaneous fat aspirate, food frequency questionnaire,and diet records in a free-living population of US men.American Journal of Epidemiology 1992; 135: 418–27.
18 London SJ, Sacks FM, Caesar J, Stampfer MJ, Siguel E,Willett W. Fatty acid composition of subcutaneous adiposetissue and diet in postmenopausal US women. AmericanJournal of Clinical Nutrition 1991; 54: 340–5.
19 Van Staveren WA, Deurenberg P, Katan MB, Burema J,De Groot LCPGM, Hoffmans MDAF. Validity of the fatty acidcomposition of subcutaneous fat tissue micro-biopsies as anestimate of the long-term average fatty acid composition ofthe diet of separate individuals. American Journal ofEpidemiology 1986; 123: 455–63.
20 Feunekes GIJ, Van Staveren WA, De Vries JHM, Burema J,Hautvast GAJ. Relative and biomarker-based validity of afood-frequency questionnaire estimating intake of fats andcholesterol. American Journal of Clinical Nutrition 1993;58: 489–96.
21 Garland M, Sacks FM, Colditz GA, Rimm EB, Sampson LA,Willett WC, et al. The relation between dietary intake andadipose tissue composition of selected fatty acids in USwomen. American Journal of Clinical Nutrition 1998; 67:25–30.
22 Willett WC, Sampson L, Stampfer MJ. Reproducibility andvalidity of a semi-quantitative food frequency questionnaire.American Journal of Epidemiology 1985; 122: 51–65.
23 Lemaitre RN, King IB, Patterson RE, Psaty BM, Kestin M,Heckbert SR. Assessment of trans-fatty acid intake with afood frequency questionnaire and validation with adiposetissue levels of trans fatty acids. American Journal ofEpidemiology 1998; 148: 1085–93.
Table 6 Comparison of total trans unsaturated fatty acids (TUFA)intake (g/100 g fat) and total TUFA content of adipose tissue(g/100 g fatty acids) based on quartiles of trans C20 and C22 fattyacid intake
Quartileof C20 þ C22 intake
Total TUFA intakeAdipose tissueTUFA content
Mean (SD) Mean (SD)
1 3.76 (1.04) 4.01 (1.06)2 4.99 (1.46)*,a 4.10 (0.93)3 6.23 (1.72)*,a,b 4.35 (0.73)4 8.18 (2.38)*,a,b,c 4.42 (0.58)
* One-way analysis of variance with Bonferroni adjustment.a Significantly different from quartile 1: P , 0.05.b Significantly different from quartile 2: P , 0.05.c Significantly different from quartile 3: P , 0.05.
MM Cantwell et al.106

24 Cantwell MM. Assessment of individual fatty acid intake.Proceedings of the Nutrition Society 2000; 59: 187–91.
25 Peters JC, Holcombe BN, Hiller LK, Webb DR. Caprenin 3.Absorption and caloric value in adult humans. Journal of theAmerican College of Toxicology 1991; 10(3): 357–67.
26 Webb DR, Peters JC, Jandacek RJ, Fortier NE. Caprenin 2.Short-term safety and metabolism in rats and hamsters.
Journal of the American College of Toxicology 1991; 10(3):341–56.
27 Harrington KE, McGowan MJ, Kiely M, Robson PJ,Livingstone MB, Morrissey PA, Gibney MJ. Macronutrientintakes and food sources in Irish adults: findings of theNorth/South Ireland Food Consumption Survey. PublicHealth Nutrition 2001; 4(5A): 1051–60.
Validation of a fat intake questionnaire 107