Embed Size (px)
Citation preview
29
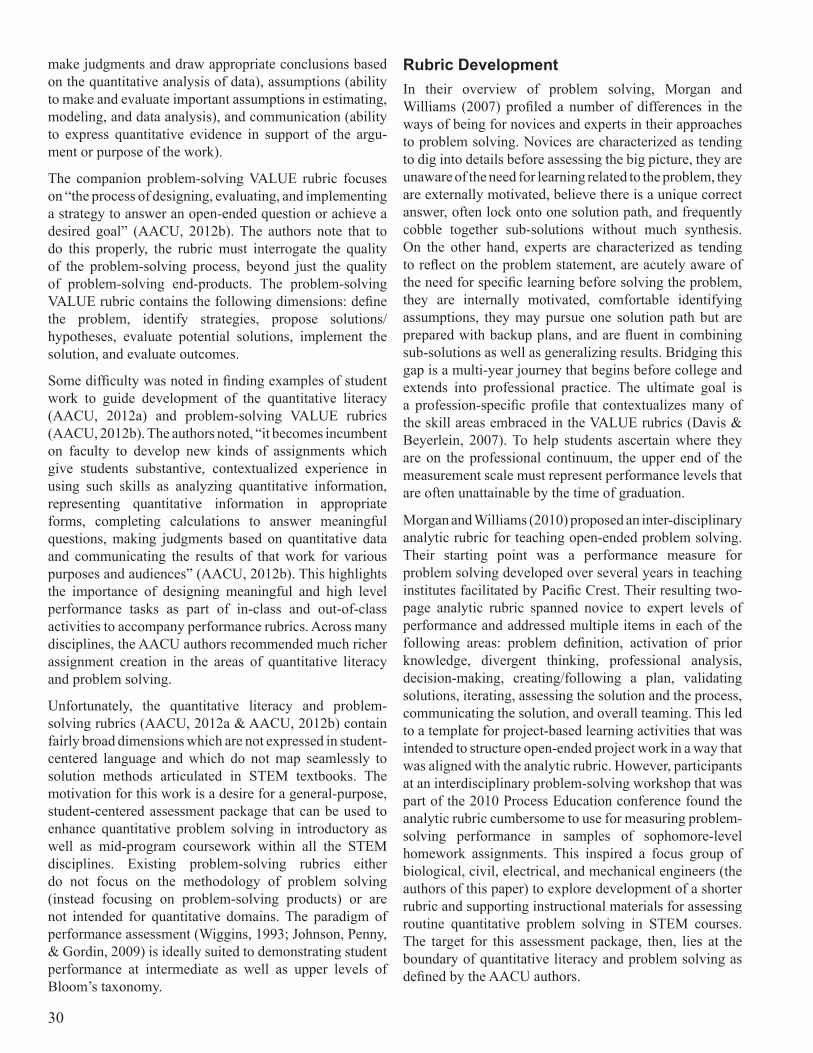
IntroductionThe National Academy of Engineers (2012) outlined 14 global challenges that invoke a wide variety of professional skills, but which are undergirded by quantitative reasoning and problem-solving skills that are the hallmark of science, technology, engineering, and mathematics (STEM) disciplines. Woods (2000) identified over 150 different problem-solving methodologies that could be mapped to one or more of these challenges. Woods concluded that problem solving could be described by a generic 6-stage strategy: (1) becoming personally engaged in the problem, (2) defining the problem, (3) creating an internal representation of the problem, (4) devising a plan for solution, (5) carrying out the plan, and (6) checking & looking back. All of the stages included cognitive and affective elements that apply to both analytical problem solving and open-ended problem solving. Trussel and Dietz (2003) concluded that working thoughtfully designed practice problems and getting meaningful feedback on problem-solving performance are two of the most significant variables in elevating analytical problem solving.
Rubistar (2012) offers an interactive web-based system for creating rubrics to support project-based learning ac-tivities. Rubrics created with this system have a four-point rating scale, allow selection of dimensions from a prede-termined list, and provide ready-made cell descriptions which can also be customized. Many sample rubrics have been created with the Rubistar system, most of which ap-pear to be directed at pre-college mini-projects. Dimen-sions offered in the predetermined list examine important solution attributes such as strategy/procedures, mathemat-ical concepts, mathematical reasoning, mathematical er-
rors, working with others, use of manipulatives, explana-tion, checking, neatness/organization, diagrams/sketches, completion, and terminology/notation. Users can map their favorite problem-solving methodology into the order that some or all of these are selected, but there is not a recommended holistic framework for analytical problem solving.
Some of the best known collegiate rubrics for quantitative literacy (Association for American Colleges and Universities, 2012a) and problem solving (AACU, 2012b) are intended for discussing student learning at the program level, not for classroom assessment or grading. These two rubrics were developed by teams of faculty experts representing colleges and universities across the United States through a process that examined many existing campus rubrics and related documents for 15 essential learning outcomes (Rhodes, 2010). Their efforts resulted in a set of widely disseminated VALUE rubrics (Valid Assessment of Learning in Undergraduate Education). In all of the rubrics, scores are provided on a four-point scale from benchmark (Level 1), through two milestone levels (Levels 2–3), and ultimately to a capstone level (Level 4) which is expected for the best college graduates.
Quantitative literacy is also known as quantitative reason-ing. In the words of the AACU authors (2012a), this is a “habit of mind, a way of thinking about the world that relies on data and on the mathematical analysis of data to make connections and draw conclusions.” Their quan-titative literacy rubric contains the following dimensions: interpretation (ability to explain information presented in equations, graphs, diagrams, tables, and words), represen-tation (ability to convert relevant information into various mathematical forms), application/analysis (ability to
Development and Usability of a Generic Quantitative Problem-Solving Rubric for Student Learning
Jay McCormack1, Barbara Williams1, Ken Noren1, Steve Beyerlein1, Dan Cordon1, and Jim Morgan2
AbstractAn interdisciplinary group of faculty within colleges of engineering at the University of Idaho and Texas A&M University has developed a general purpose quantitative problem-solving rubric for students and young professionals. The rubric is intended to promote reflective practice of analytical problem solving, encourage more comprehensive solution documentation, provide formative assessment in conjunction with selected homework assignments, and enable collection of accreditation data across courses and programs. This article describes the development of an assessment package (problem-solving rubric combined with implementation tips and instructor resources) that is broadly applicable across multiple disciplines. The validity and usability of the assessment package is evaluated through a small-scale survey of faculty who teach mid-program courses involving multiple, calculation-based homework assignments. Based on survey input, the rubric was revised to incorporate better customization and the assessment package was expanded to include an example of scored student work as well as a facilitation plan for introducing students to the rubric.
1 University of Idaho2 Texas A&M University
30
make judgments and draw appropriate conclusions based on the quantitative analysis of data), assumptions (ability to make and evaluate important assumptions in estimating, modeling, and data analysis), and communication (ability to express quantitative evidence in support of the argu-ment or purpose of the work).
The companion problem-solving VALUE rubric focuses on “the process of designing, evaluating, and implementing a strategy to answer an open-ended question or achieve a desired goal” (AACU, 2012b). The authors note that to do this properly, the rubric must interrogate the quality of the problem-solving process, beyond just the quality of problem-solving end-products. The problem-solving VALUE rubric contains the following dimensions: define the problem, identify strategies, propose solutions/hypotheses, evaluate potential solutions, implement the solution, and evaluate outcomes.
Some difficulty was noted in finding examples of student work to guide development of the quantitative literacy (AACU, 2012a) and problem-solving VALUE rubrics (AACU, 2012b). The authors noted, “it becomes incumbent on faculty to develop new kinds of assignments which give students substantive, contextualized experience in using such skills as analyzing quantitative information, representing quantitative information in appropriate forms, completing calculations to answer meaningful questions, making judgments based on quantitative data and communicating the results of that work for various purposes and audiences” (AACU, 2012b). This highlights the importance of designing meaningful and high level performance tasks as part of in-class and out-of-class activities to accompany performance rubrics. Across many disciplines, the AACU authors recommended much richer assignment creation in the areas of quantitative literacy and problem solving.
Unfortunately, the quantitative literacy and problem-solving rubrics (AACU, 2012a & AACU, 2012b) contain fairly broad dimensions which are not expressed in student-centered language and which do not map seamlessly to solution methods articulated in STEM textbooks. The motivation for this work is a desire for a general-purpose, student-centered assessment package that can be used to enhance quantitative problem solving in introductory as well as mid-program coursework within all the STEM disciplines. Existing problem-solving rubrics either do not focus on the methodology of problem solving (instead focusing on problem-solving products) or are not intended for quantitative domains. The paradigm of performance assessment (Wiggins, 1993; Johnson, Penny, & Gordin, 2009) is ideally suited to demonstrating student performance at intermediate as well as upper levels of Bloom’s taxonomy.
Rubric DevelopmentIn their overview of problem solving, Morgan and Williams (2007) profiled a number of differences in the ways of being for novices and experts in their approaches to problem solving. Novices are characterized as tending to dig into details before assessing the big picture, they are unaware of the need for learning related to the problem, they are externally motivated, believe there is a unique correct answer, often lock onto one solution path, and frequently cobble together sub-solutions without much synthesis. On the other hand, experts are characterized as tending to reflect on the problem statement, are acutely aware of the need for specific learning before solving the problem, they are internally motivated, comfortable identifying assumptions, they may pursue one solution path but are prepared with backup plans, and are fluent in combining sub-solutions as well as generalizing results. Bridging this gap is a multi-year journey that begins before college and extends into professional practice. The ultimate goal is a profession-specific profile that contextualizes many of the skill areas embraced in the VALUE rubrics (Davis & Beyerlein, 2007). To help students ascertain where they are on the professional continuum, the upper end of the measurement scale must represent performance levels that are often unattainable by the time of graduation.
Morgan and Williams (2010) proposed an inter-disciplinary analytic rubric for teaching open-ended problem solving. Their starting point was a performance measure for problem solving developed over several years in teaching institutes facilitated by Pacific Crest. Their resulting two-page analytic rubric spanned novice to expert levels of performance and addressed multiple items in each of the following areas: problem definition, activation of prior knowledge, divergent thinking, professional analysis, decision-making, creating/following a plan, validating solutions, iterating, assessing the solution and the process, communicating the solution, and overall teaming. This led to a template for project-based learning activities that was intended to structure open-ended project work in a way that was aligned with the analytic rubric. However, participants at an interdisciplinary problem-solving workshop that was part of the 2010 Process Education conference found the analytic rubric cumbersome to use for measuring problem-solving performance in samples of sophomore-level homework assignments. This inspired a focus group of biological, civil, electrical, and mechanical engineers (the authors of this paper) to explore development of a shorter rubric and supporting instructional materials for assessing routine quantitative problem solving in STEM courses. The target for this assessment package, then, lies at the boundary of quantitative literacy and problem solving as defined by the AACU authors.
31
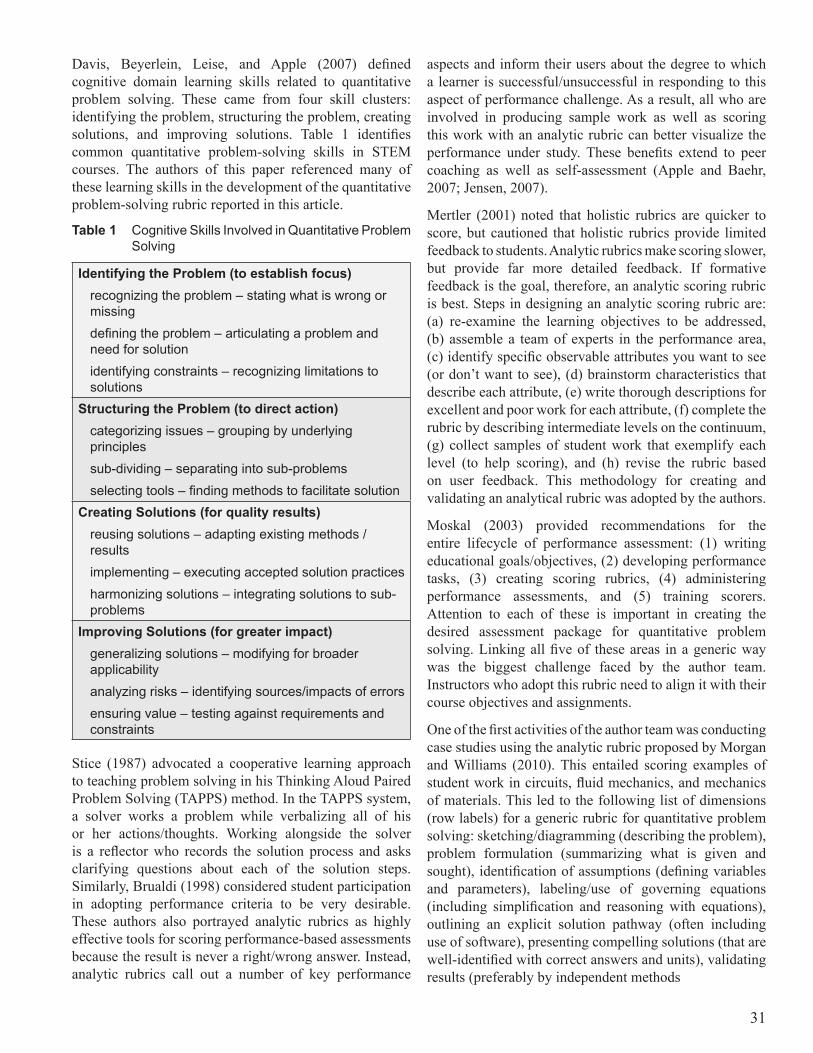
Davis, Beyerlein, Leise, and Apple (2007) defined cognitive domain learning skills related to quantitative problem solving. These came from four skill clusters: identifying the problem, structuring the problem, creating solutions, and improving solutions. Table 1 identifies common quantitative problem-solving skills in STEM courses. The authors of this paper referenced many of these learning skills in the development of the quantitative problem-solving rubric reported in this article.
Table 1 CognitiveSkillsInvolvedinQuantitativeProblemSolving
Identifying the Problem (to establish focus)recognizingtheproblem–statingwhatiswrongormissingdefiningtheproblem–articulatingaproblemandneedforsolutionidentifyingconstraints–recognizinglimitationstosolutions
Structuring the Problem (to direct action)categorizingissues–groupingbyunderlyingprinciplessub-dividing–separatingintosub-problemsselectingtools–findingmethodstofacilitatesolution
Creating Solutions (for quality results)reusingsolutions–adaptingexistingmethods/resultsimplementing–executingacceptedsolutionpracticesharmonizingsolutions–integratingsolutionstosub-problems
Improving Solutions (for greater impact)generalizingsolutions–modifyingforbroaderapplicabilityanalyzingrisks–identifyingsources/impactsoferrorsensuringvalue–testingagainstrequirementsandconstraints
Stice (1987) advocated a cooperative learning approach to teaching problem solving in his Thinking Aloud Paired Problem Solving (TAPPS) method. In the TAPPS system, a solver works a problem while verbalizing all of his or her actions/thoughts. Working alongside the solver is a reflector who records the solution process and asks clarifying questions about each of the solution steps. Similarly, Brualdi (1998) considered student participation in adopting performance criteria to be very desirable. These authors also portrayed analytic rubrics as highly effective tools for scoring performance-based assessments because the result is never a right/wrong answer. Instead, analytic rubrics call out a number of key performance
aspects and inform their users about the degree to which a learner is successful/unsuccessful in responding to this aspect of performance challenge. As a result, all who are involved in producing sample work as well as scoring this work with an analytic rubric can better visualize the performance under study. These benefits extend to peer coaching as well as self-assessment (Apple and Baehr, 2007; Jensen, 2007).
Mertler (2001) noted that holistic rubrics are quicker to score, but cautioned that holistic rubrics provide limited feedback to students. Analytic rubrics make scoring slower, but provide far more detailed feedback. If formative feedback is the goal, therefore, an analytic scoring rubric is best. Steps in designing an analytic scoring rubric are: (a) re-examine the learning objectives to be addressed, (b) assemble a team of experts in the performance area, (c) identify specific observable attributes you want to see (or don’t want to see), (d) brainstorm characteristics that describe each attribute, (e) write thorough descriptions for excellent and poor work for each attribute, (f) complete the rubric by describing intermediate levels on the continuum, (g) collect samples of student work that exemplify each level (to help scoring), and (h) revise the rubric based on user feedback. This methodology for creating and validating an analytical rubric was adopted by the authors.
Moskal (2003) provided recommendations for the entire lifecycle of performance assessment: (1) writing educational goals/objectives, (2) developing performance tasks, (3) creating scoring rubrics, (4) administering performance assessments, and (5) training scorers. Attention to each of these is important in creating the desired assessment package for quantitative problem solving. Linking all five of these areas in a generic way was the biggest challenge faced by the author team. Instructors who adopt this rubric need to align it with their course objectives and assignments.
One of the first activities of the author team was conducting case studies using the analytic rubric proposed by Morgan and Williams (2010). This entailed scoring examples of student work in circuits, fluid mechanics, and mechanics of materials. This led to the following list of dimensions (row labels) for a generic rubric for quantitative problem solving: sketching/diagramming (describing the problem), problem formulation (summarizing what is given and sought), identification of assumptions (defining variables and parameters), labeling/use of governing equations (including simplification and reasoning with equations), outlining an explicit solution pathway (often including use of software), presenting compelling solutions (that are well-identified with correct answers and units), validating results (preferably by independent methods
32
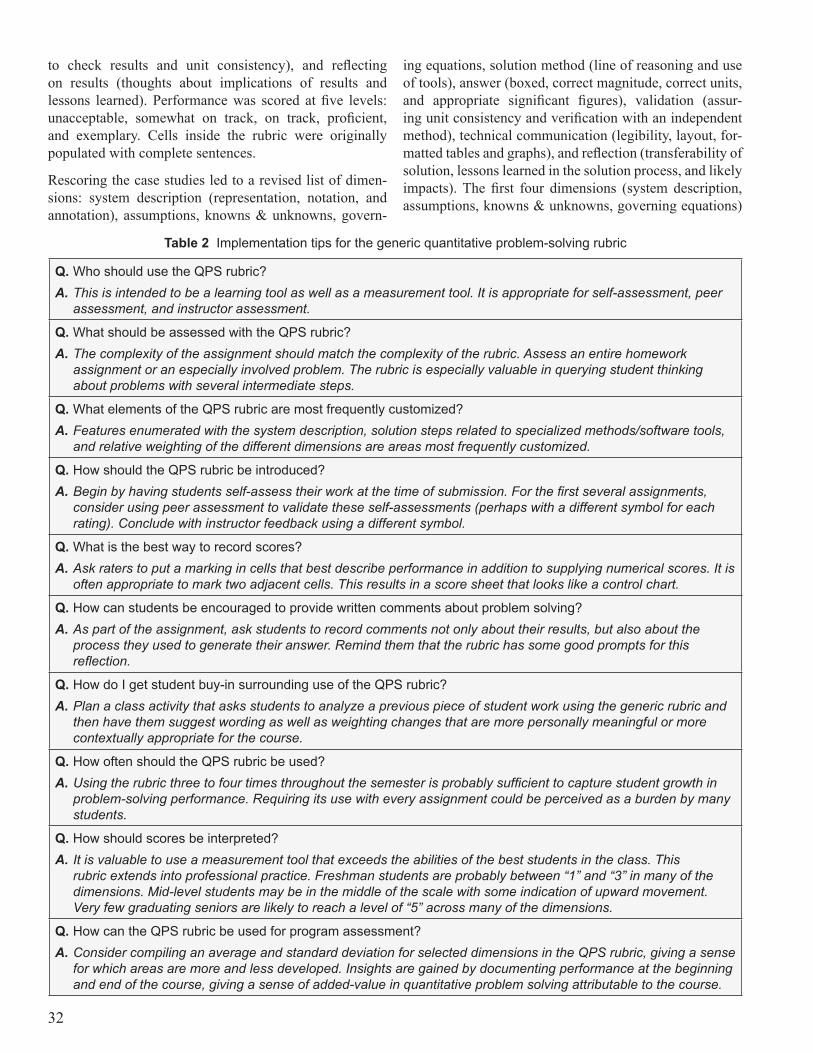
to check results and unit consistency), and reflecting on results (thoughts about implications of results and lessons learned). Performance was scored at five levels: unacceptable, somewhat on track, on track, proficient, and exemplary. Cells inside the rubric were originally populated with complete sentences.
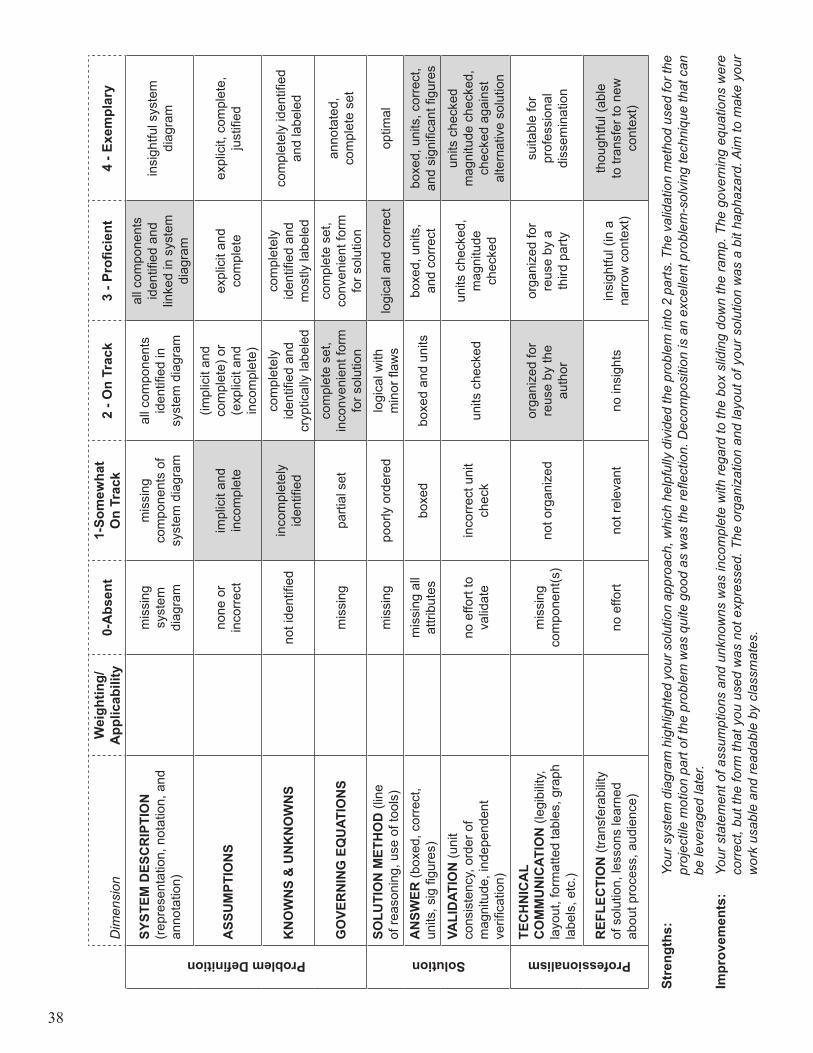
Rescoring the case studies led to a revised list of dimen-sions: system description (representation, notation, and annotation), assumptions, knowns & unknowns, govern-
ing equations, solution method (line of reasoning and use of tools), answer (boxed, correct magnitude, correct units, and appropriate significant figures), validation (assur-ing unit consistency and verification with an independent method), technical communication (legibility, layout, for-matted tables and graphs), and reflection (transferability of solution, lessons learned in the solution process, and likely impacts). The first four dimensions (system description, assumptions, knowns & unknowns, governing equations)
Table 2 Implementationtipsforthegenericquantitativeproblem-solvingrubric
Q. WhoshouldusetheQPSrubric?A. This is intended to be a learning tool as well as a measurement tool. It is appropriate for self-assessment, peer
assessment, and instructor assessment.
Q. WhatshouldbeassessedwiththeQPSrubric?A. The complexity of the assignment should match the complexity of the rubric. Assess an entire homework
assignment or an especially involved problem. The rubric is especially valuable in querying student thinking about problems with several intermediate steps.
Q. WhatelementsoftheQPSrubricaremostfrequentlycustomized?A. Features enumerated with the system description, solution steps related to specialized methods/software tools,
and relative weighting of the different dimensions are areas most frequently customized.
Q. HowshouldtheQPSrubricbeintroduced?A. Begin by having students self-assess their work at the time of submission. For the first several assignments,
consider using peer assessment to validate these self-assessments (perhaps with a different symbol for each rating). Conclude with instructor feedback using a different symbol.
Q. Whatisthebestwaytorecordscores?A. Ask raters to put a marking in cells that best describe performance in addition to supplying numerical scores. It is
often appropriate to mark two adjacent cells. This results in a score sheet that looks like a control chart.
Q. Howcanstudentsbeencouragedtoprovidewrittencommentsaboutproblemsolving?A. As part of the assignment, ask students to record comments not only about their results, but also about the
process they used to generate their answer. Remind them that the rubric has some good prompts for this reflection.
Q. HowdoIgetstudentbuy-insurroundinguseoftheQPSrubric?A. Plan a class activity that asks students to analyze a previous piece of student work using the generic rubric and
then have them suggest wording as well as weighting changes that are more personally meaningful or more contextually appropriate for the course.
Q. HowoftenshouldtheQPSrubricbeused?A. Using the rubric three to four times throughout the semester is probably sufficient to capture student growth in
problem-solving performance. Requiring its use with every assignment could be perceived as a burden by many students.
Q. Howshouldscoresbeinterpreted?A. It is valuable to use a measurement tool that exceeds the abilities of the best students in the class. This
rubric extends into professional practice. Freshman students are probably between “1” and “3” in many of the dimensions. Mid-level students may be in the middle of the scale with some indication of upward movement. Very few graduating seniors are likely to reach a level of “5” across many of the dimensions.
Q. HowcantheQPSrubricbeusedforprogramassessment?A. Consider compiling an average and standard deviation for selected dimensions in the QPS rubric, giving a sense
for which areas are more and less developed. Insights are gained by documenting performance at the beginning and end of the course, giving a sense of added-value in quantitative problem solving attributable to the course.
33
were considered to be components of problem definition. The next three dimensions (solution method, answer, and validation) were viewed as the problem solution. The final two dimensions (technical communication and reflection) were considered to be aspects of professionalism. The au-thors concluded that it was appropriate to retain the origi-nal performance levels, but felt it necessary to make the contents of cells inside the rubric more accessible by con-densing the original sentences into shorter phrases.
Next, a set of implementation tips were devised to guide utilization of the new rubric. These appear in the form of frequently asked questions (FAQs) in Table 2. The faculty survey in the next section was then created to probe the validity and usability of the new rubric, along with a subset of the implementation tips by a larger faculty audience.
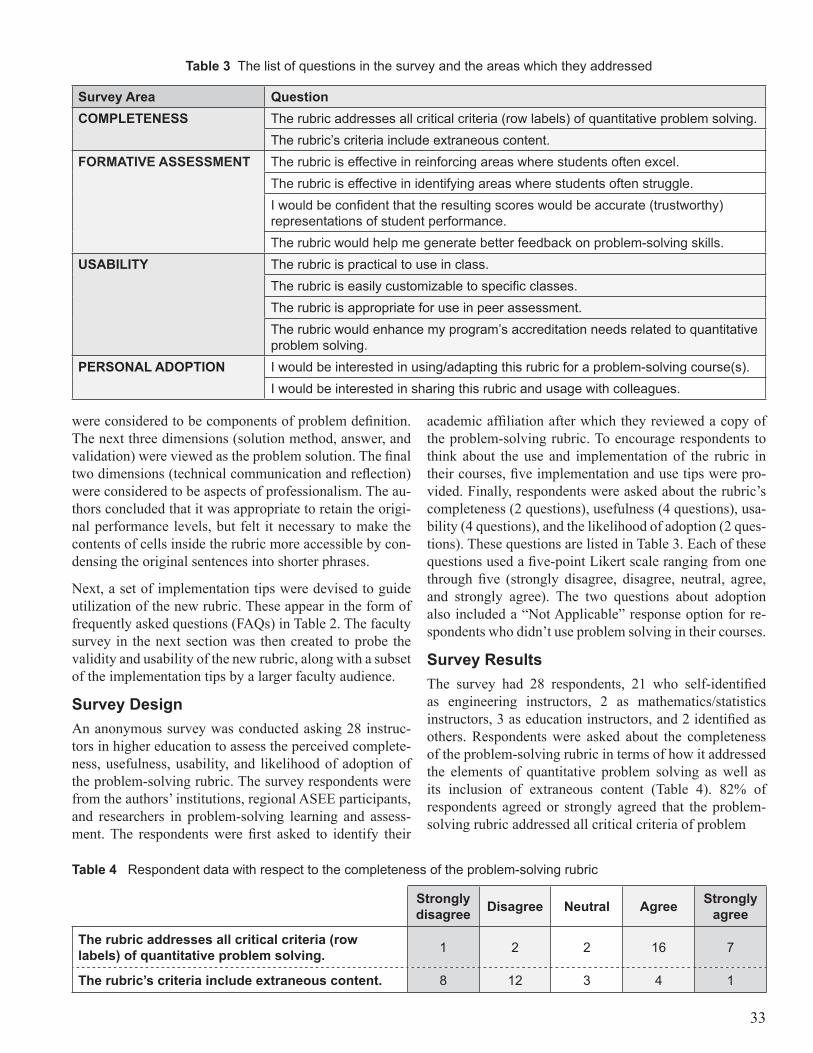
Survey DesignAn anonymous survey was conducted asking 28 instruc-tors in higher education to assess the perceived complete-ness, usefulness, usability, and likelihood of adoption of the problem-solving rubric. The survey respondents were from the authors’ institutions, regional ASEE participants, and researchers in problem-solving learning and assess-ment. The respondents were first asked to identify their
academic affiliation after which they reviewed a copy of the problem-solving rubric. To encourage respondents to think about the use and implementation of the rubric in their courses, five implementation and use tips were pro-vided. Finally, respondents were asked about the rubric’s completeness (2 questions), usefulness (4 questions), usa-bility (4 questions), and the likelihood of adoption (2 ques-tions). These questions are listed in Table 3. Each of these questions used a five-point Likert scale ranging from one through five (strongly disagree, disagree, neutral, agree, and strongly agree). The two questions about adoption also included a “Not Applicable” response option for re-spondents who didn’t use problem solving in their courses.
Survey ResultsThe survey had 28 respondents, 21 who self-identified as engineering instructors, 2 as mathematics/statistics instructors, 3 as education instructors, and 2 identified as others. Respondents were asked about the completeness of the problem-solving rubric in terms of how it addressed the elements of quantitative problem solving as well as its inclusion of extraneous content (Table 4). 82% of respondents agreed or strongly agreed that the problem-solving rubric addressed all critical criteria of problem
Table 3 Thelistofquestionsinthesurveyandtheareaswhichtheyaddressed
Survey Area QuestionCOMPLETENESS Therubricaddressesallcriticalcriteria(rowlabels)ofquantitativeproblemsolving.
Therubric’scriteriaincludeextraneouscontent.FORMATIVE ASSESSMENT Therubriciseffectiveinreinforcingareaswherestudentsoftenexcel.
Therubriciseffectiveinidentifyingareaswherestudentsoftenstruggle.Iwouldbeconfidentthattheresultingscoreswouldbeaccurate(trustworthy)representationsofstudentperformance.Therubricwouldhelpmegeneratebetterfeedbackonproblem-solvingskills.
USABILITY Therubricispracticaltouseinclass.Therubriciseasilycustomizabletospecificclasses.Therubricisappropriateforuseinpeerassessment.Therubricwouldenhancemyprogram’saccreditationneedsrelatedtoquantitativeproblemsolving.
PERSONAL ADOPTION Iwouldbeinterestedinusing/adaptingthisrubricforaproblem-solvingcourse(s).Iwouldbeinterestedinsharingthisrubricandusagewithcolleagues.
Table 4 Respondentdatawithrespecttothecompletenessoftheproblem-solvingrubric
Strongly disagree Disagree Neutral Agree Strongly
agree
The rubric addresses all critical criteria (row labels) of quantitative problem solving. 1 2 2 16 7
The rubric’s criteria include extraneous content. 8 12 3 4 1
34
solving, while 71% disagreed or strongly disagreed that the rubric included extraneous content.
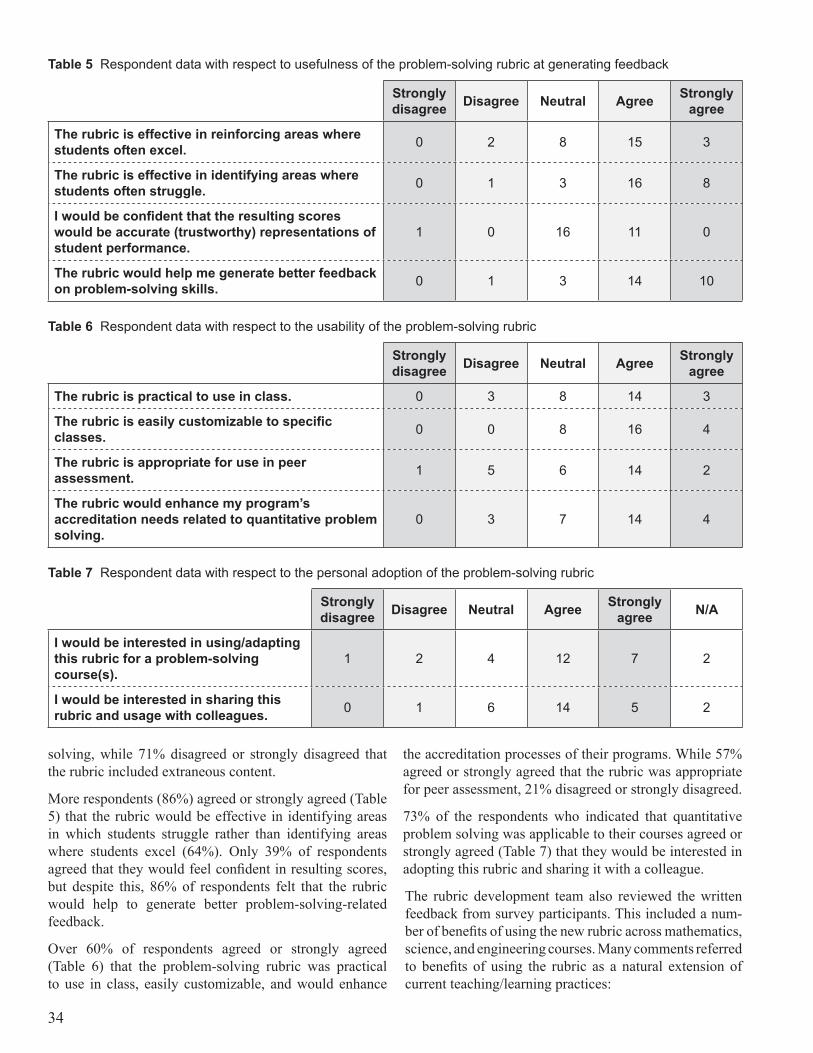
More respondents (86%) agreed or strongly agreed (Table 5) that the rubric would be effective in identifying areas in which students struggle rather than identifying areas where students excel (64%). Only 39% of respondents agreed that they would feel confident in resulting scores, but despite this, 86% of respondents felt that the rubric would help to generate better problem-solving-related feedback.
Over 60% of respondents agreed or strongly agreed (Table 6) that the problem-solving rubric was practical to use in class, easily customizable, and would enhance
the accreditation processes of their programs. While 57% agreed or strongly agreed that the rubric was appropriate for peer assessment, 21% disagreed or strongly disagreed.
73% of the respondents who indicated that quantitative problem solving was applicable to their courses agreed or strongly agreed (Table 7) that they would be interested in adopting this rubric and sharing it with a colleague.
The rubric development team also reviewed the written feedback from survey participants. This included a num-ber of benefits of using the new rubric across mathematics, science, and engineering courses. Many comments referred to benefits of using the rubric as a natural extension of current teaching/learning practices:
Table 5 Respondentdatawithrespecttousefulnessoftheproblem-solvingrubricatgeneratingfeedback
Strongly disagree Disagree Neutral Agree Strongly
agree
The rubric is effective in reinforcing areas where students often excel. 0 2 8 15 3
The rubric is effective in identifying areas where students often struggle. 0 1 3 16 8
I would be confident that the resulting scores would be accurate (trustworthy) representations of student performance.
1 0 16 11 0
The rubric would help me generate better feedback on problem-solving skills. 0 1 3 14 10
Table 6 Respondentdatawithrespecttotheusabilityoftheproblem-solvingrubric
Strongly disagree Disagree Neutral Agree Strongly
agree
The rubric is practical to use in class. 0 3 8 14 3
The rubric is easily customizable to specific classes. 0 0 8 16 4
The rubric is appropriate for use in peer assessment. 1 5 6 14 2
The rubric would enhance my program’s accreditation needs related to quantitative problem solving.
0 3 7 14 4
Table 7 Respondentdatawithrespecttothepersonaladoptionoftheproblem-solvingrubric
Strongly disagree Disagree Neutral Agree Strongly
agree N/A
I would be interested in using/adapting this rubric for a problem-solving course(s).
1 2 4 12 7 2
I would be interested in sharing this rubric and usage with colleagues. 0 1 6 14 5 2
35
All rubrics of this type are much more transparent than a grade in helping students see the areas they are strong and weak in. Students can use this document to improve their specific weaknesses
Complete problem formulation is critical to success-ful solutions and the rubric conveys this lesson to students.
Many instructors, including myself, tend to rate students too highly and this hinders higher level skill development.
I already use something like this in my class, although it is not as systematic.
I already use a rubric with very similar content but much lengthier anchor label language at the various levels of performance. Merging mine and this one might be helpful for me.
Several suggestions were made for improving the rubric:
Many of the terms/adjectives used need to be defined or made more explicit.
The labels along the top provide a qualitative continuum. In general, the ones in the cells do not add too much.
The first four items are the important factors in problem solving. If a student has mastered the skills needed to be rated in the upper range on these first four, the remaining items are just “window dressing” and should not carry the same weight as the first four.
All of my ratings (Agrees) are predicated on the need for the generic rubric to be customized and clarified, with explicit education of the students in the rubric’s meaning and use.
There were also some concerns surrounding implementa-tion of the rubric:
My neutral comment is regarding the necessarily appropriate assignment on which to use the rubric. In other words, some assignments are not well designed to be suited for all of these categories or to explore the full range of scales.
This rubric only works to improve students if they know what each level in each criteria looks like. They need examples that help them understand how to turn what they submit into what it should be.
Peers would need to be trained in the use of the rubric.
Good professional development for instructors would be essential to get the most out of the tool.
The rubric needs verification as to its stability and accuracy.
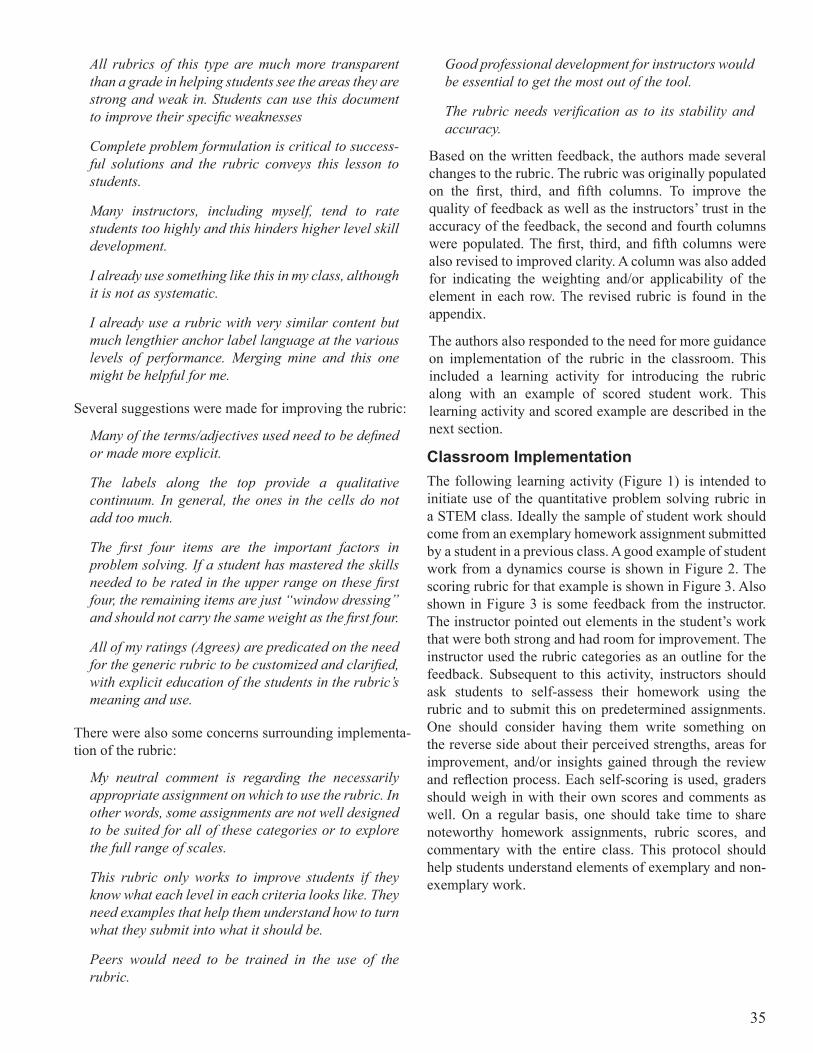
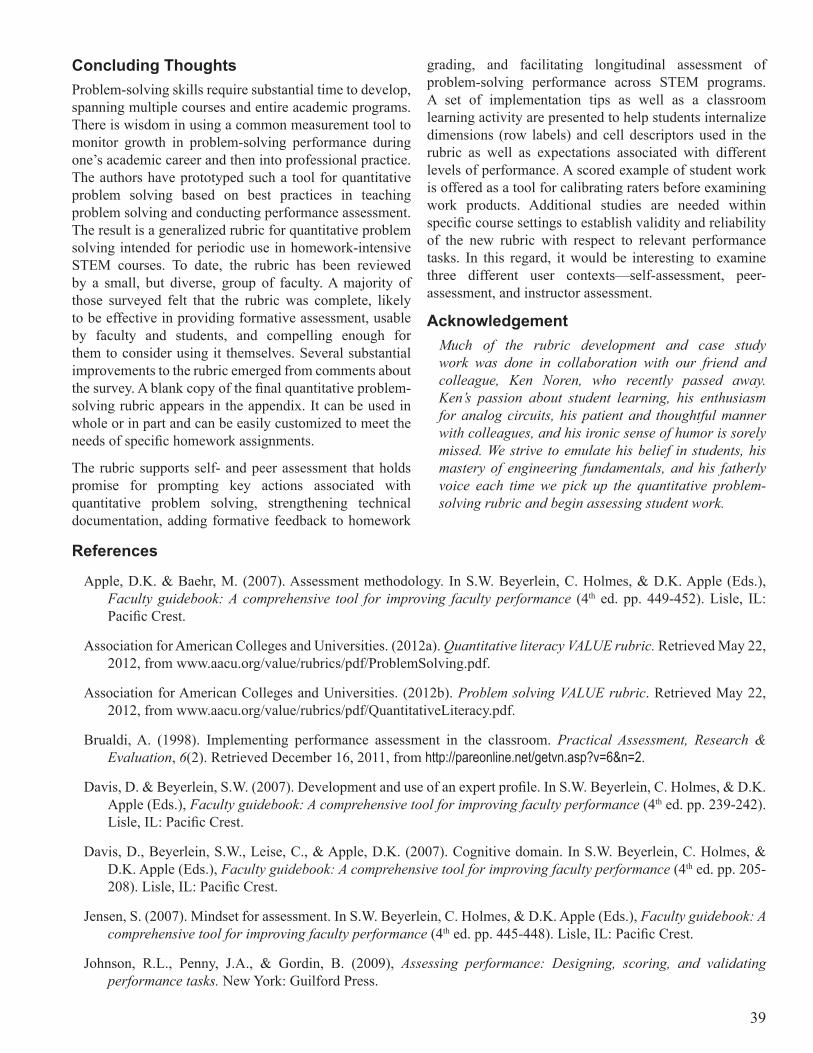
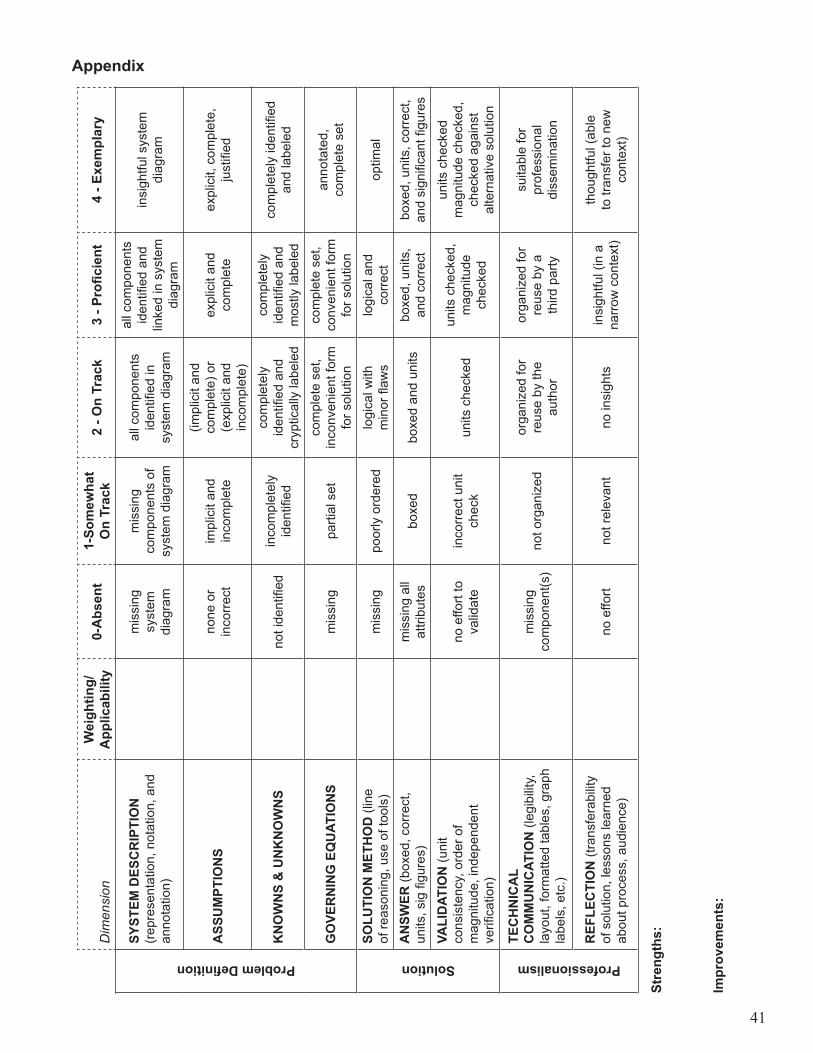
Based on the written feedback, the authors made several changes to the rubric. The rubric was originally populated on the first, third, and fifth columns. To improve the quality of feedback as well as the instructors’ trust in the accuracy of the feedback, the second and fourth columns were populated. The first, third, and fifth columns were also revised to improved clarity. A column was also added for indicating the weighting and/or applicability of the element in each row. The revised rubric is found in the appendix.
The authors also responded to the need for more guidance on implementation of the rubric in the classroom. This included a learning activity for introducing the rubric along with an example of scored student work. This learning activity and scored example are described in the next section.
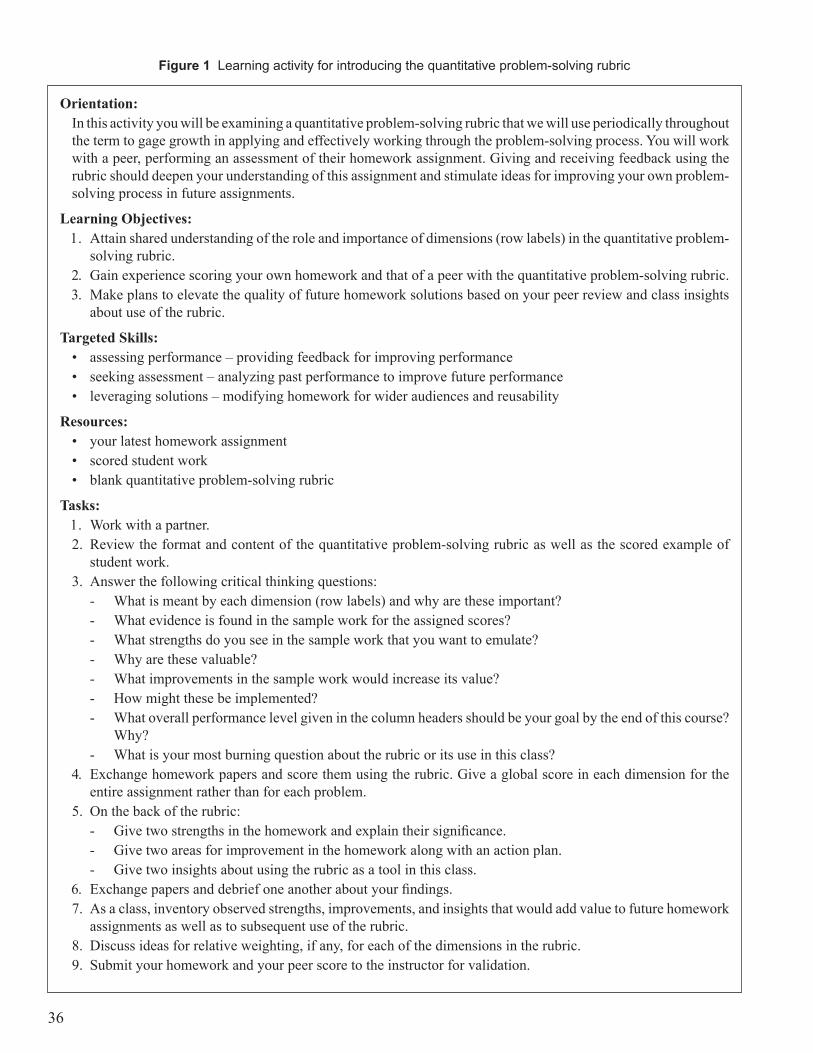
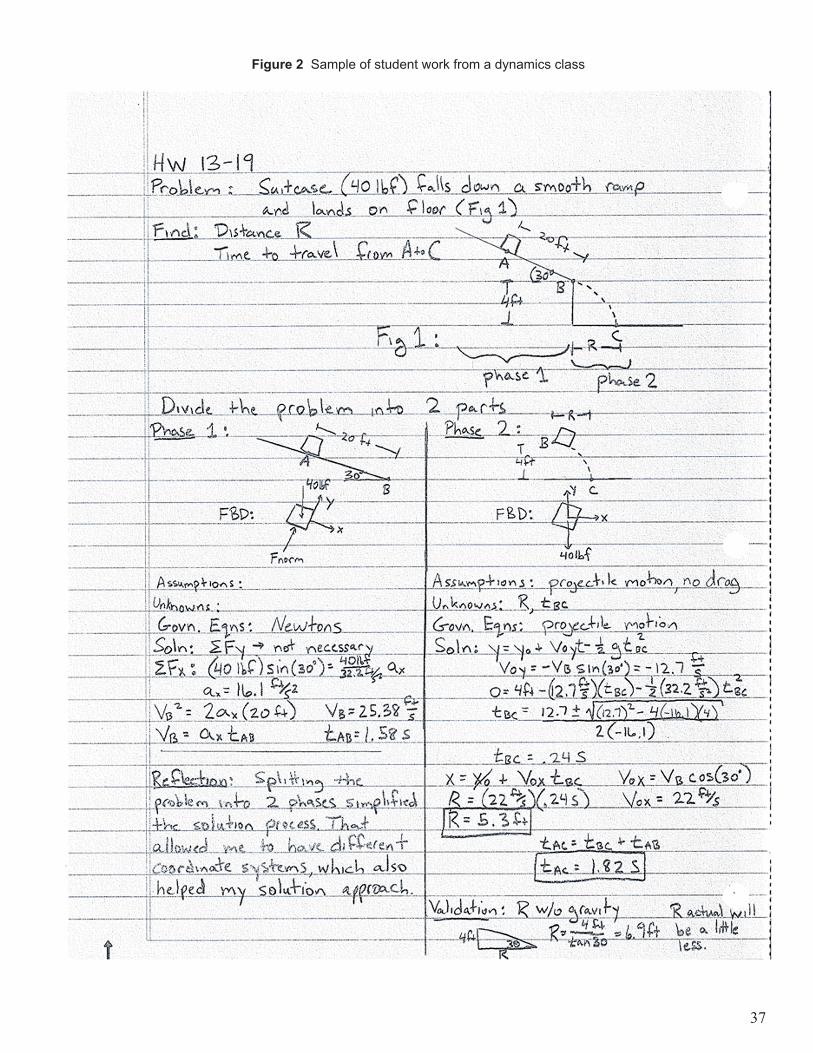
Classroom ImplementationThe following learning activity (Figure 1) is intended to initiate use of the quantitative problem solving rubric in a STEM class. Ideally the sample of student work should come from an exemplary homework assignment submitted by a student in a previous class. A good example of student work from a dynamics course is shown in Figure 2. The scoring rubric for that example is shown in Figure 3. Also shown in Figure 3 is some feedback from the instructor. The instructor pointed out elements in the student’s work that were both strong and had room for improvement. The instructor used the rubric categories as an outline for the feedback. Subsequent to this activity, instructors should ask students to self-assess their homework using the rubric and to submit this on predetermined assignments. One should consider having them write something on the reverse side about their perceived strengths, areas for improvement, and/or insights gained through the review and reflection process. Each self-scoring is used, graders should weigh in with their own scores and comments as well. On a regular basis, one should take time to share noteworthy homework assignments, rubric scores, and commentary with the entire class. This protocol should help students understand elements of exemplary and non-exemplary work.
36
Orientation:In this activity you will be examining a quantitative problem-solving rubric that we will use periodically throughout the term to gage growth in applying and effectively working through the problem-solving process. You will work with a peer, performing an assessment of their homework assignment. Giving and receiving feedback using the rubric should deepen your understanding of this assignment and stimulate ideas for improving your own problem-solving process in future assignments.
Learning Objectives:1. Attain shared understanding of the role and importance of dimensions (row labels) in the quantitative problem-
solving rubric.2. Gain experience scoring your own homework and that of a peer with the quantitative problem-solving rubric.3. Make plans to elevate the quality of future homework solutions based on your peer review and class insights
about use of the rubric.
Targeted Skills:• assessing performance – providing feedback for improving performance• seeking assessment – analyzing past performance to improve future performance• leveraging solutions – modifying homework for wider audiences and reusability
Resources: • your latest homework assignment • scored student work• blank quantitative problem-solving rubric
Tasks:1. Work with a partner.2. Review the format and content of the quantitative problem-solving rubric as well as the scored example of
student work.3. Answer the following critical thinking questions:
- What is meant by each dimension (row labels) and why are these important?- What evidence is found in the sample work for the assigned scores?- What strengths do you see in the sample work that you want to emulate?- Why are these valuable?- What improvements in the sample work would increase its value?- How might these be implemented?- What overall performance level given in the column headers should be your goal by the end of this course?
Why?- What is your most burning question about the rubric or its use in this class?
4. Exchange homework papers and score them using the rubric. Give a global score in each dimension for the entire assignment rather than for each problem.
5. On the back of the rubric:- Give two strengths in the homework and explain their significance.- Give two areas for improvement in the homework along with an action plan.- Give two insights about using the rubric as a tool in this class.
6. Exchange papers and debrief one another about your findings.7. As a class, inventory observed strengths, improvements, and insights that would add value to future homework
assignments as well as to subsequent use of the rubric.8. Discuss ideas for relative weighting, if any, for each of the dimensions in the rubric. 9. Submit your homework and your peer score to the instructor for validation.
Figure 1 Learningactivityforintroducingthequantitativeproblem-solvingrubric
37
Figure 2 Sampleofstudentworkfromadynamicsclass
38
Dim
ensi
onW
eigh
ting/
App
licab
ility
0-A
bsen
t1-
Som
ewha
t
On
Trac
k2
- On
Trac
k3
- Pro
ficie
nt4
- Exe
mpl
ary
Problem Definition
SYST
EM D
ESC
RIP
TIO
N
(representation,notation,and
annotation)
missing
system
diagram
missing
componentsof
system
diagram
allcom
ponents
identifiedin
system
diagram
allcom
ponents
identifiedand
linkedinsystem
diagram
insightfulsystem
diagram
ASS
UM
PTIO
NS
noneor
incorrect
implicitand
incomplete
(implicitand
complete)or
(explicitand
incomplete)
explicitand
complete
explicit,com
plete,
justified
KN
OW
NS
& U
NK
NO
WN
S
notidentified
incompletely
identified
completely
identifiedand
crypticallylabeled
completely
identifiedand
mostlylabeled
completelyidentified
andlabeled
GO
VER
NIN
G E
QU
ATIO
NS
missing
partialset
completeset,
inconvenientform
forsolution
completeset,
convenientform
forsolution
annotated,
completeset
Solution
SOLU
TIO
N M
ETH
OD(line
ofreasoning,useoftools)
missing
poorlyordered
logicalw
ith
minorflaw
slogicalandcorrect
optim
al
AN
SWER
(boxed,correct,
units,sigfigures)
missingall
attributes
boxed
boxedandunits
boxed,units,
andcorrect
boxed,units,correct,
andsignificantfigures
VALI
DAT
ION(unit
consistency,orderof
magnitude,independent
verification)
noeffortto
validate
incorrectunit
check
unitschecked
unitschecked,
magnitude
checked
unitschecked
magnitudechecked,
checkedagainst
alternativesolution
Professionalism
TEC
HN
ICA
L C
OM
MU
NIC
ATIO
N(legibility,
layout,formattedtables,graph
labels,etc.)
missing
component(s)
notorganized
organizedfor
reusebythe
author
organizedfor
reusebya
thirdparty
suitablefor
professional
dissem
ination
REF
LEC
TIO
N(transferability
ofsolution,lessonslearned
aboutprocess,audience)
noeffort
notrelevant
noinsights
insightful(ina
narrow
context)
thoughtful(able
totransfertonew
context)
Stre
ngth
s:
Your
sys
tem
dia
gram
hig
hlig
hted
you
r sol
utio
n ap
proa
ch, w
hich
hel
pful
ly d
ivid
ed th
e pr
oble
m in
to 2
par
ts. T
he v
alid
atio
n m
etho
d us
ed fo
r the
pr
ojec
tile
mot
ion
part
of th
e pr
oble
m w
as q
uite
goo
d as
was
the
refle
ctio
n. D
ecom
posi
tion
is a
n ex
celle
nt p
robl
em-s
olvi
ng te
chni
que
that
can
be
leve
rage
d la
ter.
Impr
ovem
ents
: Yo
ur s
tate
men
t of a
ssum
ptio
ns a
nd u
nkno
wns
was
inco
mpl
ete
with
rega
rd to
the
box
slid
ing
dow
n th
e ra
mp.
The
gov
erni
ng e
quat
ions
wer
e co
rrec
t, bu
t the
form
that
you
use
d w
as n
ot e
xpre
ssed
. The
org
aniz
atio
n an
d la
yout
of y
our s
olut
ion
was
a b
it ha
phaz
ard.
Aim
to m
ake
your
w
ork
usab
le a
nd re
adab
le b
y cl
assm
ates
.
39
Concluding ThoughtsProblem-solving skills require substantial time to develop, spanning multiple courses and entire academic programs. There is wisdom in using a common measurement tool to monitor growth in problem-solving performance during one’s academic career and then into professional practice. The authors have prototyped such a tool for quantitative problem solving based on best practices in teaching problem solving and conducting performance assessment. The result is a generalized rubric for quantitative problem solving intended for periodic use in homework-intensive STEM courses. To date, the rubric has been reviewed by a small, but diverse, group of faculty. A majority of those surveyed felt that the rubric was complete, likely to be effective in providing formative assessment, usable by faculty and students, and compelling enough for them to consider using it themselves. Several substantial improvements to the rubric emerged from comments about the survey. A blank copy of the final quantitative problem-solving rubric appears in the appendix. It can be used in whole or in part and can be easily customized to meet the needs of specific homework assignments.
The rubric supports self- and peer assessment that holds promise for prompting key actions associated with quantitative problem solving, strengthening technical documentation, adding formative feedback to homework
grading, and facilitating longitudinal assessment of problem-solving performance across STEM programs. A set of implementation tips as well as a classroom learning activity are presented to help students internalize dimensions (row labels) and cell descriptors used in the rubric as well as expectations associated with different levels of performance. A scored example of student work is offered as a tool for calibrating raters before examining work products. Additional studies are needed within specific course settings to establish validity and reliability of the new rubric with respect to relevant performance tasks. In this regard, it would be interesting to examine three different user contexts—self-assessment, peer-assessment, and instructor assessment.
AcknowledgementMuch of the rubric development and case study work was done in collaboration with our friend and colleague, Ken Noren, who recently passed away. Ken’s passion about student learning, his enthusiasm for analog circuits, his patient and thoughtful manner with colleagues, and his ironic sense of humor is sorely missed. We strive to emulate his belief in students, his mastery of engineering fundamentals, and his fatherly voice each time we pick up the quantitative problem-solving rubric and begin assessing student work.
References
Apple, D.K. & Baehr, M. (2007). Assessment methodology. In S.W. Beyerlein, C. Holmes, & D.K. Apple (Eds.), Faculty guidebook: A comprehensive tool for improving faculty performance (4th ed. pp. 449-452). Lisle, IL: Pacific Crest.
Association for American Colleges and Universities. (2012a). Quantitative literacy VALUE rubric. Retrieved May 22, 2012, from www.aacu.org/value/rubrics/pdf/ProblemSolving.pdf.
Association for American Colleges and Universities. (2012b). Problem solving VALUE rubric. Retrieved May 22, 2012, from www.aacu.org/value/rubrics/pdf/QuantitativeLiteracy.pdf.
Brualdi, A. (1998). Implementing performance assessment in the classroom. Practical Assessment, Research & Evaluation, 6(2). Retrieved December 16, 2011, from http://pareonline.net/getvn.asp?v=6&n=2.
Davis, D. & Beyerlein, S.W. (2007). Development and use of an expert profile. In S.W. Beyerlein, C. Holmes, & D.K. Apple (Eds.), Faculty guidebook: A comprehensive tool for improving faculty performance (4th ed. pp. 239-242). Lisle, IL: Pacific Crest.
Davis, D., Beyerlein, S.W., Leise, C., & Apple, D.K. (2007). Cognitive domain. In S.W. Beyerlein, C. Holmes, & D.K. Apple (Eds.), Faculty guidebook: A comprehensive tool for improving faculty performance (4th ed. pp. 205-208). Lisle, IL: Pacific Crest.
Jensen, S. (2007). Mindset for assessment. In S.W. Beyerlein, C. Holmes, & D.K. Apple (Eds.), Faculty guidebook: A comprehensive tool for improving faculty performance (4th ed. pp. 445-448). Lisle, IL: Pacific Crest.
Johnson, R.L., Penny, J.A., & Gordin, B. (2009), Assessing performance: Designing, scoring, and validating performance tasks. New York: Guilford Press.
Dim
ensi
onW
eigh
ting/
App
licab
ility
0-A
bsen
t1-
Som
ewha
t
On
Trac
k2
- On
Trac
k3
- Pro
ficie
nt4
- Exe
mpl
ary
Problem Definition
SYST
EM D
ESC
RIP
TIO
N
(representation,notation,and
annotation)
missing
system
diagram
missing
componentsof
system
diagram
allcom
ponents
identifiedin
system
diagram
allcom
ponents
identifiedand
linkedinsystem
diagram
insightfulsystem
diagram
ASS
UM
PTIO
NS
noneor
incorrect
implicitand
incomplete
(implicitand
complete)or
(explicitand
incomplete)
explicitand
complete
explicit,com
plete,
justified
KN
OW
NS
& U
NK
NO
WN
S
notidentified
incompletely
identified
completely
identifiedand
crypticallylabeled
completely
identifiedand
mostlylabeled
completelyidentified
andlabeled
GO
VER
NIN
G E
QU
ATIO
NS
missing
partialset
completeset,
inconvenientform
forsolution
completeset,
convenientform
forsolution
annotated,
completeset
Solution
SOLU
TIO
N M
ETH
OD(line
ofreasoning,useoftools)
missing
poorlyordered
logicalw
ith
minorflaw
slogicalandcorrect
optim
al
AN
SWER
(boxed,correct,
units,sigfigures)
missingall
attributes
boxed
boxedandunits
boxed,units,
andcorrect
boxed,units,correct,
andsignificantfigures
VALI
DAT
ION(unit
consistency,orderof
magnitude,independent
verification)
noeffortto
validate
incorrectunit
check
unitschecked
unitschecked,
magnitude
checked
unitschecked
magnitudechecked,
checkedagainst
alternativesolution
Professionalism
TEC
HN
ICA
L C
OM
MU
NIC
ATIO
N(legibility,
layout,formattedtables,graph
labels,etc.)
missing
component(s)
notorganized
organizedfor
reusebythe
author
organizedfor
reusebya
thirdparty
suitablefor
professional
dissem
ination
REF
LEC
TIO
N(transferability
ofsolution,lessonslearned
aboutprocess,audience)
noeffort
notrelevant
noinsights
insightful(ina
narrow
context)
thoughtful(able
totransfertonew
context)
Stre
ngth
s:
Your
sys
tem
dia
gram
hig
hlig
hted
you
r sol
utio
n ap
proa
ch, w
hich
hel
pful
ly d
ivid
ed th
e pr
oble
m in
to 2
par
ts. T
he v
alid
atio
n m
etho
d us
ed fo
r the
pr
ojec
tile
mot
ion
part
of th
e pr
oble
m w
as q
uite
goo
d as
was
the
refle
ctio
n. D
ecom
posi
tion
is a
n ex
celle
nt p
robl
em-s
olvi
ng te
chni
que
that
can
be
leve
rage
d la
ter.
Impr
ovem
ents
: Yo
ur s
tate
men
t of a
ssum
ptio
ns a
nd u
nkno
wns
was
inco
mpl
ete
with
rega
rd to
the
box
slid
ing
dow
n th
e ra
mp.
The
gov
erni
ng e
quat
ions
wer
e co
rrec
t, bu
t the
form
that
you
use
d w
as n
ot e
xpre
ssed
. The
org
aniz
atio
n an
d la
yout
of y
our s
olut
ion
was
a b
it ha
phaz
ard.
Aim
to m
ake
your
w
ork
usab
le a
nd re
adab
le b
y cl
assm
ates
.
40
Mertler, C. A. (2001). Designing scoring rubrics for your classroom. Practical Assessment, Research & Evaluation, 7(25) Retrieved December 16, 2011, from http://pareonline.net/getvn.asp?v=7&n=25.
Morgan, J. & Williams, B.C. (2007). Overview of problem solving. In S.W. Beyerlein, C. Holmes, & D.K. Apple (Eds.), Faculty guidebook: A comprehensive tool for improving faculty performance (4th ed. pp. 181-184). Lisle, IL: Pacific Crest.
Morgan, J., Williams, B. (2010) Process Education best practices for teaching open-ended problem solving in a project context. International Journal of Process Education, 2(1) 35-49.
Moskal, B. M. (2003). Recommendations for developing classroom performance assessments and scoring rubrics. Practical Assessment, Research & Evaluation, 8(14). Retrieved May 16, 2012 from http://pareonline.net/getvn.asp?v=8&n=14.
National Academy of Engineers. (2012). Grand challenges for engineering. Retrieved May 2, 2012, from http://www.engineeringchallenges.org/
Rhodes, T. L. (Ed.). (2010). Assessing outcomes and improving achievement: Tips and tools for using rubrics. Washington, DC: Association of American Colleges and Universities.
Rubistar (2012). Create rubrics for project-based learning activities. Retrieved May 16, 2012, from http://rubistar.4teachers.org/index.php?screen=Waypoint&module=Rubistar
Stice, J. E. (Ed.). (1987). Developing critical thinking and problem-solving abilities: New directions for teaching and learning #30. San Francisco: Jossey-Bass.
Trussell, H. J. & Dietz E. J. (2003). A study of the effect of graded homework in a preparatory class for electrical engineers. Journal of Engineering Education, 92(1), 141–146.
Wiggins, G. P. (1993). Assessing student performance: Exploring the purpose and limits of testing. San Francisco: Jossey-Bass.
Woods, D. R. (2000). An evidence-based strategy for problem solving. Journal of Engineering Education, 89(3), 443-459.
41
Dim
ensi
onW
eigh
ting/
App
licab
ility
0-A
bsen
t1-
Som
ewha
t
On
Trac
k2
- On
Trac
k3
- Pro
ficie
nt4
- Exe
mpl
ary
Problem Definition
SYST
EM D
ESC
RIP
TIO
N
(representation,notation,and
annotation)
missing
system
diagram
missing
componentsof
system
diagram
allcom
ponents
identifiedin
system
diagram
allcom
ponents
identifiedand
linkedinsystem
diagram
insightfulsystem
diagram
ASS
UM
PTIO
NS
noneor
incorrect
implicitand
incomplete
(implicitand
complete)or
(explicitand
incomplete)
explicitand
complete
explicit,com
plete,
justified
KN
OW
NS
& U
NK
NO
WN
S
notidentified
incompletely
identified
completely
identifiedand
crypticallylabeled
completely
identifiedand
mostlylabeled
completelyidentified
andlabeled
GO
VER
NIN
G E
QU
ATIO
NS
missing
partialset
completeset,
inconvenientform
forsolution
completeset,
convenientform
forsolution
annotated,
completeset
Solution
SOLU
TIO
N M
ETH
OD(line
ofreasoning,useoftools)
missing
poorlyordered
logicalw
ith
minorflaw
slogicaland
correct
optim
al
AN
SWER
(boxed,correct,
units,sigfigures)
missingall
attributes
boxed
boxedandunits
boxed,units,
andcorrect
boxed,units,correct,
andsignificantfigures
VALI
DAT
ION(unit
consistency,orderof
magnitude,independent
verification)
noeffortto
validate
incorrectunit
check
unitschecked
unitschecked,
magnitude
checked
unitschecked
magnitudechecked,
checkedagainst
alternativesolution
Professionalism
TEC
HN
ICA
L C
OM
MU
NIC
ATIO
N(legibility,
layout,formattedtables,graph
labels,etc.)
missing
component(s)
notorganized
organizedfor
reusebythe
author
organizedfor
reusebya
thirdparty
suitablefor
professional
dissem
ination
REF
LEC
TIO
N(transferability
ofsolution,lessonslearned
aboutprocess,audience)
noeffort
notrelevant
noinsights
insightful(ina
narrow
context)
thoughtful(able
totransfertonew
context)
Stre
ngth
s:
Impr
ovem
ents
:
Appendix