Embed Size (px)
Citation preview

DEVELOPMENT AND POLYMORPHISM OF SIMPLE SEQUENCE REPEAT (SSR) DNA MARKERS FOR Duabanga moluccana BLUME
Llew Kit Siong
Master of Science 2012 .

Posat Khidlllat Malduma( Akademik UNIVERSm MALAYSIA SARAWAK
DEVELOPMENT AND POLYMORPHISM OF SIMPLE SEQUENCE REPEAT (SSR) DNA MARKERS FOR Duabanga moluccana BLUME
Liew Kit Siong
A thesis submitted in fulfillment of the requirements for the degree of Master of Science
Faculty of Resource Science and Technology UNIVERSITI MALAYSIA SARA W AK
2012

ACKNOWLEDGEMENTS
Though the following dissertation is an individual work, it would not have been possible
without the support, guidance and efforts of numerous people. It is a pleasant aspect that I
have now the opportunity to express my gratitude to all of them.
I express my deepest thanks to my supervisor, Dr. Ho Wei Seng for providing an
opportunity to work in this project, continuous support, excellent supervision and
encouragement throughout this work. I also very thankful to Dr. Pang Shek Ling for her
guidance in laboratory works, suggestions and discussions during my studies.
I acknowledge the Universiti Malaysia Sarawak (UNlMAS) and Sarawak Forestry
Corporation for providing financial support for my studies. My appreciation also goes to the
Ministry of Science, Technology & Innovation (MOSTI) for providing me the Postgraduate
Studies (PASCA) Scholarship.
I would like to express my wann gratitude to Ms. Kamaliawati Bt. Yusop as a
laboratory assistant. I am also thankful to all my labmates for their friendship, support and
many interesting academic and non-academic discussions. My deepest of and genuine
gratitude is extended to my family for their unconditional support. They give me strength and
help me in countless ways. Finally, my special thanks to many others who could not be
mentioned here, but who had contributed to this work. Thanks to them, too.

ABSTRACT
.r
~ Duabanga moluccana Blume (or locally known as Sawih) is an indigenous fast growing tree
species that has been selected for planted forest development in Sarawak. It possesses great
commercial values in production of various wood products. Therefore, the development of an
array of simple sequences repeats (SSRs) or micro satellite DNA based-markers is absolutely
necessary to study the genetic makeup of this species. These molecular markers had been
rapidly used in the selection of plus trees, quality control in seed production, investigation of
population genetics and conservation management. Isolation of high-quality genomic DNA
from D. moluccana is vital for molecular marker development as well as other downstream
application) In the present study, an improved method of total DNA isolation from D.
moiuccana was established. These modifications include: 1) precipitating DNA with '/3
volwne of 5 M NaCI together with isopropanol; 2) using I% ~-mercaptoethanol in the
extraction buffer; 3) sample incubation time of 40 minutes at 65 DC, and 4) adding a CIA
extraction step. By using this method, the isolated DNA was suitable for amplification and
restriction digestion analysis. In this study, we used ISSR-suppression method to develop
simple sequence repeats (SSRs) markers for D. moiuccana. Overall, 44 SSR regions were
identified. The microsatellite motifs contained simple perfect and simple imperfect
microsatellites constituted by di- and trinucleotides and, perfect/imperfect compounds. The
most nwnerous class was the perfect compound with 24 (54.5%) occurrences, followed by the
imperfect compounds with 8 (18.2%), simple perfect with 8 (18.2%), and the simple imperfect
repeats with 4 (9.1 %). Majority of the dinucleotide microsatellites found in the Sawih genome
was AG/GA/CT/TC repeats (83.3%) followed by ACICAITG/GT repeats (16.7%). Primer
pairs were designed for 43 SSR regions. The newly identified SSR markers were
11
r I ,....
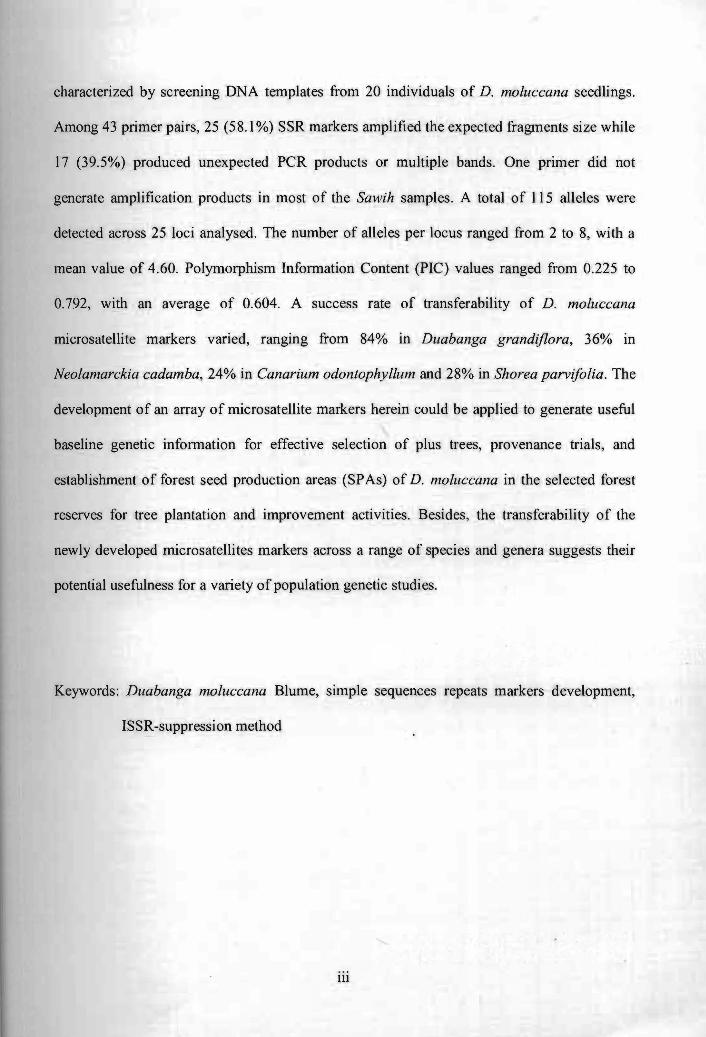
characterized by screening DNA templates from 20 individuals of D. moluccana seedlings.
Among 43 primer pairs, 25 (58.1 %) SSR markers amplified the expected fragments size while
17 (39.5%) produced unexpected PCR products or multiple bands. One primer did not
generate amplification products in most of the Sawih samples. A total of 115 alleles were
detected across 25 loci analysed. The number of alleles per locus ranged from 2 to 8, with a
mean value of 4.60. Polymorphism Information Content (PIC) values ranged from 0.225 to
0.792, with an average of 0.604. A success rate of transferability of D. moluccana
microsatellite markers varied, ranging from 84% in Duabanga grand~flora, 36% in
Neolamarckia cadamba, 24% in Canarium odontophyllum and 28% in Shorea parvifolia. The
development of an array of microsatellite markers herein could be applied to generate useful
baseline genetic information for effective selection of plus trees, provenance trials, and
establislunent of forest seed production areas (SPAs) of D. moluccana in the selected forest
reserves for tree plantation and improvement activities. Besides, the transferability of the
newly developed microsatellites markers across a range of species and genera suggests their
potential usefulness for a variety of population genetic studies.
Keywords: Duabanga molllccana Blume, simple sequences repeats markers development,
ISSR-suppression method
III
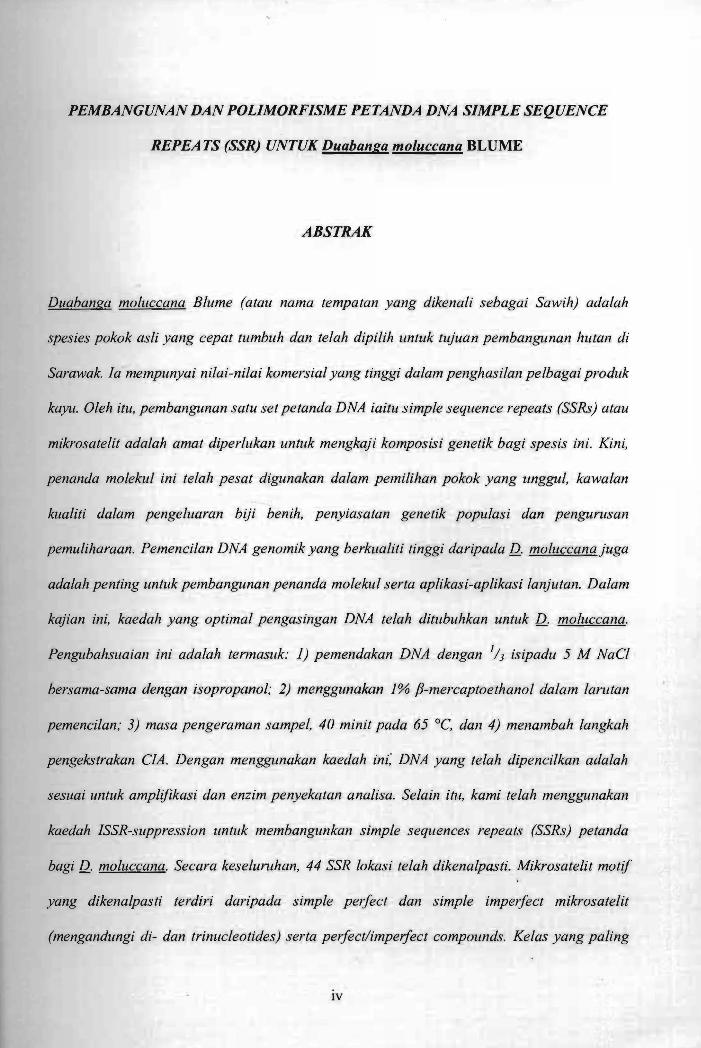
PEMBANGUNAN DAN POLIMORFISME PETANDA DNA SIMPLE SEQUENCE
REPEA TS (SSR) UNTUK Duabanga moluccana BLUME
ABSTRAK
Duabanga moluccana Blume (atau nama tempatan yang dikenali sebagai Sawih) adalah
spesies pokok asli yang cepat tumbuh dan telah dipilih untuk tujuan pembangunan hutan di
Sarawak. Ia mempunyai nilai-nilai komersial yang tinggi dalam penghasilan pelbagai prodllk
kayu. Oleh itu, pembangllnan satu set petanda DNA iaitu simple sequence repeats (SSRs) atau
mikrosatelit adalah amat diperlukan untuk mengkaji komposisi genetik bag; spesis ini. Kini,
penanda molekul in; telah pesat digunakan dalam pemilihan pokok yang unggul, kawalan
kualiti dalam pengeluaran biji benih, penyiasatan genetik populasi dan pengurllsan
pemuliharaan. Pemencilan DNA genomik yang berkualiti tinggi daripada D. moluccana juga
adalah penting untuk pembangunan penanda molekul serta aplikasi-aplikasi lanjutan. Dalam
kajian ini, kaedah yang optimal pengasingan DNA telah ditllbuhkan untuk D. moluccana.
Pengubahsuaian ini adalah termasuk: J) pemendakan DNA dengan Ih isipadu 5 M NaCl
bersama-sama dengan isopropanol; 2) menggunakan J% fJ-mercaptoethanol dalam larutan
pemencilan; 3) masa pengeraman sampel, 40 minit pada 65°C, dan 4) menambah langkah
pengekstrakan CIA. Dengan menggunakan kaedah ini: DNA yang telah dipencilkan adalah
sesllai untuk amplifikasi dan enzim penyekatan analisa. Selain itu, kami telah menggunakan
kaedah ISSR-suppression untuk membangunkan simple sequences repeats (SSRs) petanda
bagi D. molliccana. Secara keselunthan, 44 SSR lokasi telah dikenalpasti. Mikrosatelit mott!
yang dikenalpasti terdiri daripada simple pelfeet dan simple imperfect mikrosatelit
(mengandungi di- dan trinucleotides) serta perfect/imperfect compounds. Kelas yang paling
IV
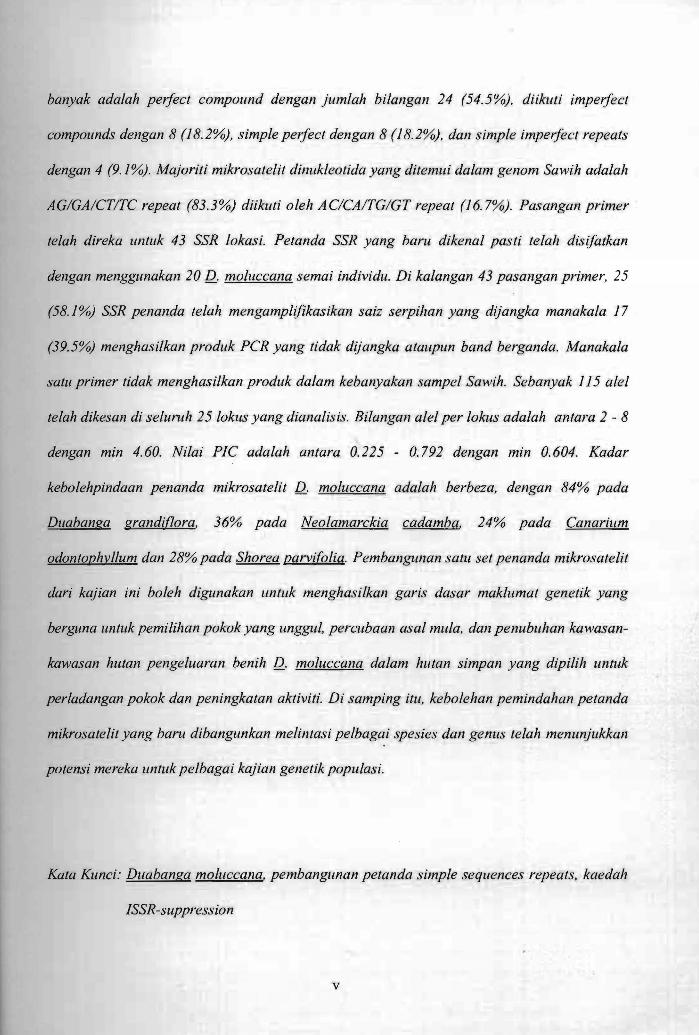
banyak adalah pelfect compound dengan jumlah bilangan 24 (54.5%), diikuti imperfect
compounds dengan 8 (18.2%), simple pelfect dengan 8 (18.2%), dan simple impelfect repeats
dengan 4 (9.1%). Majoriti mikrosatelit dinukleotida yang ditemui dalam genom Sawih adalah
AGIGAICTITC repeat (83.3%) diikllti oleh ACICAITGIGT repeat (16.7%). Pasangan primer
telah direka untuk 43 SSR lokasi. Petanda SSR yang bam dikenal pasti telah dis!fatkan
dengan menggunakan 20 D. moluccana semai individu. Di kalangan 43 pasangan primer, 25
(58.1%) SSR penanda telah mengamplijikasikan saiz serpihan yang dijangka manakala 17
(39.5%) menghasilkan produk PCR yang tidak dijangka atallpun band berganda. Manakala
satu primer tidak menghasilkan produk dalam kebanyakan sampel Sawih. Sebanyak 115 aIel
telah dikesan di selunth 25 lokus yang dianalisis. Bilangan aiel per lokus adalah antara 2 - 8
dengan min 4.60. Nilai PIC adalah antara 0.225 - 0.792 dengan min 0.604. Kadar
kebolehpindaan penanda mikrosatelit D. moluccana adalah berbeza, dengan 84% pada
Dliabanga grandiflora, 36% pada Neolamarckia cadamba, 24% pada Canarillm
odontophyllum dan 28% pada Shorea parvifolia. Pembangunan satu set penanda mikrosatelit
dari kajian ini boleh digunakan lIntuk menghasilkan garis dasar maklumat genetik yang
berguna untuk pemilihan pokok yang zmggul, percubaan asal mula, dan penubuhan kawasan
kawasan hlltan pengeluaran benih D. moluccana dalam hutan simpan yang dipilih untuk
perladangan pokok dan peningkatan aktiviti. Di samping itu, kebolehan pemindahan petanda
mikrosatelit yang baru dibangunkan melintasi pelbagai spesies dan genus telah menunjukkan
potensi mereka lIntuk pelbagai kajian genetik populasi.
Kata Klinci: Duabanga moluccana, pembangzl11an petanda simple sequences repeats, kaedah
ISSR-s uppress ion
v

,.. Pusat Khidmat Maklumat Akademik UNlVERSm MALAYSIA· SARAWAK
TABLE OF CONTENTS
ACKNOWLEDGMENTS
ABSTRACT 11
ABSTRAK IV
TABLE OF CONTENTS VI
LIST OF TABLES IX
LIST OF FIGURES X
LIST OF ABBREVIATIONS XV11
CHAPTER I
CHAPTER II
2.1 Duabanga moluccana Blume 6
2.2 Molecular Genetic Markers 9
2.3 Microsatelli tes 14
INTRODUCTION
LITERATURE REVIEW
2.2.1 Molecular Markers in Forestry Research 12
2.3.1 General Characters of Microsatelli tes 14
2.3.2 Genome Distribution of Microsatellites 18
2.3.3 Polymorphism of Microsatellites 20
2.3.4 Theoretical Mutation Models for Microsatellites 23
2.3.5 Functional Roles of Microsatellites in the Genome 28
2.3.6 Advantages of Microsatellite Markers 31
2.3.7 Strategies for Development of Microsatellites Markers 34
2.3 .8 Applications of Microsatellite Markers 40
VI

CHAPTER III MATERIALS AND METHODS 44
3.1 Total Genomic DNA Isolation 44
3.1.1 Plant Materials 44
3.1.2 Chemicals Reagents and Solutions 44
3.1.3 Optimization of DNA Isolation Protocol 45
3.1.4 DNA Purification Protocol 46
3.1.5 Genomic DNA Analysis and Quantification 46
3.2 Development of Simple Sequence Repeats (SSRs) DNA Markers 47
3.2.1 Cloning and Sequencing ISSR Amplified Fragments and Primer 48 Design
3.2.1.1 Optimization oflSSR-PCR Conditions 48
3.2.1.2 PCR Products Purification 49
3.2.1.3 Ligation of ISSR-PCR Products 50
3.2.1.4 Bacterial Transformation 51
3.2.1.5 Blue and White Colony Screening 51
3.2.1.6 Plasmid Isolation and Purification 52
3.2.1.7 Confirmation for Desired Insert 53
3.2.1.8 Sequencing and Primer Design 54
3.2.2 Constructions of DNA Libraries 55
3.2.3 Identification ofthe Other Sequence Flanking the SSR Region 56
3.2.4 SSR Regions Identification and Primer Design 57
3.2.5 SSR Markers Validation 58
3.2.6 Analysis of Polymorphism of SSR Markers 59
Vll
CHAPTER IV
4.1
4.2
4.3
CHAPTER V
REFERENCES
APPENDIX
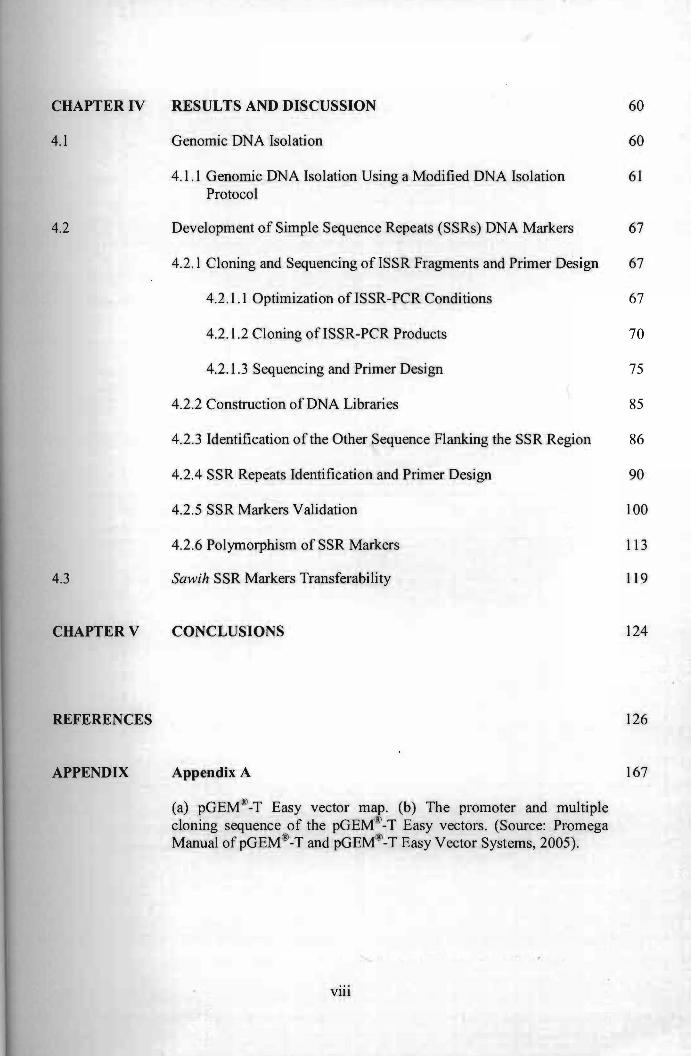
RESULTS AND DISCUSSION
Genomic DNA Isolation
4.1.1 Genomic DNA Isolation Using a Modified DNA Isolation Protocol
Development of Simple Sequence Repeats (SSRs) DNA Markers
4.2.1 Cloning and Sequencing of ISSR Fragments and Primer Design
4.2.1.1 Optimization of ISSR-PCR Conditions
4.2.1.2 Cloning ofISSR-PCR Products
4.2.1.3 Sequencing and Primer Design
4.2.2 Construction of DNA Libraries
4.2.3 Identification of the Other Sequence Flanking the SSR Region
4.2.4 SSR Repeats Identification and Primer Design
4.2.5 SSR Markers Validation
4.2.6 Polymorphism of SSR Markers
Sawih SSR Markers Transferability
CONCLUSIONS
Appendix A
(a) pGEM'!\'-T Easy vector map. (b) The promoter and multiple cloning sequence of the pGEM~l-T Easy vectors. (Source: Promega Manual ofpGEM®-T and pGEM®-T Easy Vector Systems, 2005).
60
60
61
67
67
67
70
75
85
86
90
100
113
119
124
126
167
Vlll
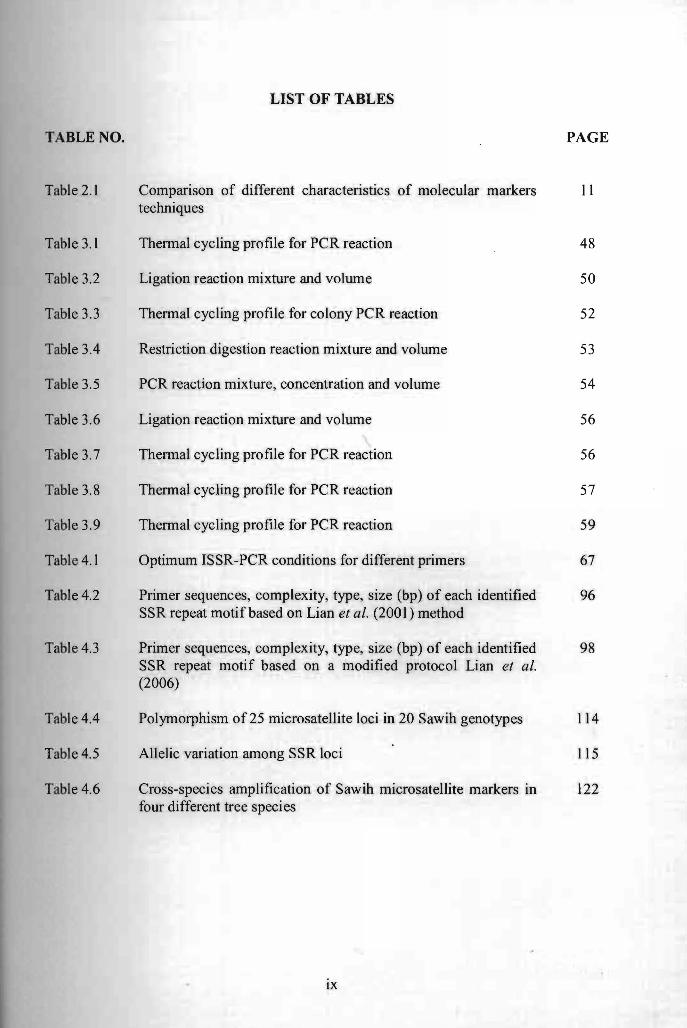
TABLE NO.
Table 2.1
Table 3.1
Table 3.2
Table 3.3
Table 3.4
Table 3.5
Table 3.6
Table 3.7
Table 3.8
Table 3.9
Table 4.1
Table 4.2
Table 4.3
Table 4.4
Table 4.5
Table 4.6
LIST OF TABLES
PAGE
Comparison of different characteristics of molecular markers 11 techniques
Thennal cycling profile for PCR reaction 48
Ligation reaction mixture and volume 50
Thennal cycling profile for colony PCR reaction 52
Restriction digestion reaction mixture and volume 53
PCR reaction mixture, concentration and volume 54
Ligation reaction mixture and volume 56
Thennal cycling profile for PCR reaction 56
Thennal cycling profile for PCR reaction 57
Thennal cycling profile for PCR reaction 59
Optimum ISSR-PCR conditions for different primers 67
Primer sequences, complexity, type, size (bp) of each identified 96 SSR repeat moti f based on Lian et al. (200 I) method
Primer sequences, complexity, type, size (bp) of each identified 98 SSR repeat motif based on a modified protocol Lian et al. (2006)
Polymorphism of 25 microsatellite loci in 20 Sawih genotypes
Allelic variation among SSR loci 115
Cross-species amplification of Sawih microsatellite markers in 122 four different tree species
IX

,..
FIGURE NO.
Figure 2.1
Figure 2.2
Figure 2.3
Figure 2.4
Figure 2.5
Figure 2.6
Figure 2.7
Figure 4.1
Figure 4.2
Figure 4.3
LIST OF FIGURES
Dllabanga molliccana (a) Seedlings, (b) Flowers, (c) Matured fruits and (d) Mature tree.
Example of microsatellites made up from mono-, di-, tri, tetra-, penta-, and hexanucleotide repeats, respectively.
Example of microsatellite repeats in D. molliccana (a) Perfect dinucleotide repeat - (AG)n; (b) Imperfect dinucleotide repeat (AG)6GG(AG)3 interrupted by (G) and (c) Compound SSR (ACMAG)s.
Model of the unequal crossing over between homologous chromosomes. Repeat units are denoted by arrows. Numbers refer to the unit number within each strand. Adapted from Park et al. (2009).
Model of the SSM mutation process at microsatellite loci. Repeat units are denoted by arrows. Numbers refer to the unit number within each strand. Bulging is the presence of non-base-pair base residues interrupting a regular 2-strand DNA helix. Adapted from Belkum et al. (1998) .
Schematic representation of traditional methods for microsatellites isolation and the alternative PIMA approach. Adapted from Zane et al. (2002).
Schematic representation of microsatellite enrichment by selective hybridization. Adapted from Hussain et al. (2009) .
Electrophoresis of unpurified DNA samples on 0.8% agarose gel. Lanes 1 & 2: Genomic DNA isolated from D. moluccana leaves.
Electrophoresis of DNA samples on 0.8% agarose gel (a) Unpurified genomic DNA. (b) Purified genomic DNA. Lanes 1 and 2: Genomic DNA isolated from D. moluccana leaves.
Electrophoresis of PCR amplified ISSR products on 1.5% agarose gel using (AC)IO primer with different DNA concentrations. Lane I: 2ng/JlI, Lane 2: 20ng/JlI, Lane 3: 30ng/JlI, Lane 4: 40ng/JlI and Lane 5: SOng/ill. Lane M: 1 kb DNA ladder (Promega, USA).
I
PAGE
8
15
16
21
22
36
38
61
62
x
63
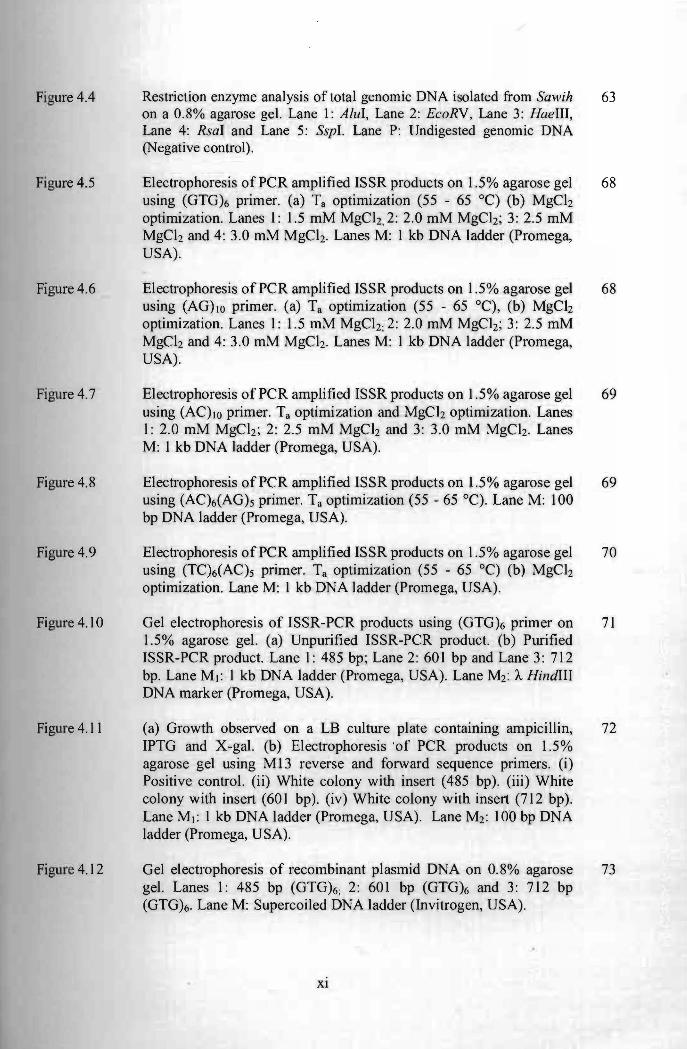
Figure 4.4 Restriction enzyme analysis of total genomic DNA isoiated from Sawih on a 0.8% agarose gel. Lane 1: AluI, Lane 2: EcoRV, Lane 3: HaeIII, Lane 4: RsaI and Lane 5: SspI. Lane P: Undigested genomic DNA (Negative control).
63
Figure 4.5 Electrophoresis of PCR amplified ISSR products on 1.5% agarose gel using (GTG)6 primer. (a) Ta optimization (55 - 65°C) (b) MgCIz optimization. Lanes I: 1.5 mM MgCIz,2: 2.0 mM MgClz; 3: 2.5 mM MgCl2 and 4: 3.0 mM MgCI2. Lanes M: I kb DNA ladder (Promega, USA).
68
Figure 4.6 Electrophoresis of PCR amplified ISSR products on 1.5% agarose gel using (AG)1O primer. (a) Ta optimization (55 - 65°C), (b) MgCh optimization. Lanes I: 1.5 mM MgCI2; 2: 2.0 mM MgCI2; 3: 2.5 mM MgCIz and 4: 3.0 mM MgCIz. Lanes M: I kb DNA ladder (Promega, USA).
68
Figure 4.7 Electrophoresis of PCR amplified ISSR products on 1.5% agarose gel using (AC)1O primer. Ta optimization and MgCIz optimization. Lanes 1: 2.0 mM MgClz; 2: 2.5 mM MgCIz and 3: 3.0 mM MgCIz. Lanes M: I kb DNA ladder (Promega, USA).
69
Figure 4.8 Electrophoresis of PCR amplified ISSR products on 1.5% agarose gel using (AC)6(AG)5 primer. Ta optimization (55 - 65°C). Lane M: 100 bp DNA ladder (Promega, USA).
69
Figure 4.9 Electrophoresis of PCR amplified ISSR products on 1.5% agarose gel using (TC)6(AC)5 primer. Ta optimization (55 - 65°C) (b) MgCIz optimization. Lane M: I kb DNA ladder (Promega, USA).
70
Figure 4.10 Gel electrophoresis of ISSR-PCR products using (GTG)6 primer on 1.5% agarose gel. (a) Unpurified ISSR-PCR product. (b) Purified ISSR-PCR product. Lane I: 485 bp; Lane 2: 601 bp and Lane 3: 712 bp. Lane M 1: 1 kb DNA ladder (Promega, USA). Lane M2: A HindlII DNA marker (Promega, USA).
71
Figure 4.11 (a) Growth observed on a LB culture plate containing ampicillin, IPTG and X-gal. (b) Electrophoresis ·of PCR products on 1.5% agarose gel using M 13 reverse and forward sequence primers. (i) Positive control. (ii) White colony with insert (485 bp). (iii) White colony with insert (601 bp). (iv) White colony with insert (712 bp). Lane M 1: I kb DNA ladder (Promega, USA). Lane M2 : 100 bp DNA ladder (Promega, USA).
72
Figure 4.12 Gel electrophoresis of recombinant plasmid DNA on 0.8% agarose gel. Lanes 1: 485 bp (GTG)6; 2: 601 bp (GTG)6 and 3: 712 bp (GTG)6. Lane M: Supercoiled DNA ladder (Invitrogen, USA).
73
Xl

I Figure 4.13 Gel electrophoresis of PCR products on 1.5% agarose gel using M13 74
reverse and forward sequence primers. Lanes 1-2: 485 bp (GTG)6; 34: 601 bp (GTG)6 and 5-6: 712 bp (GTGk Lane M,: I kb DNA ladder (Promega, USA). Lane M2 : 100 bp DNA ladder (Promega, USA).
Figure 4.14 Gel electrophoresis of EcoRI restriction analysis of the recombinant 75 plasm ids on 1.0% agarose gel. Lane M,: I kb DNA ladder. Lane M2 :
100 bp DNA ladder (Promega, USA).
Figure 4.l5 (a) ISSR fragment containing the microsatellite sequence at only one 76 end (b) ISSR fragment flanked by two microsatellite sequence at the both ends with opposite orientations as highlighted in grey.
Figure 4.16 Three different ISSR sequences amplified by using a microsatellite 77 (GTG)6 primer.
Figure 4.17 ISSR-PCR sequence amplified by using a microsatellite (AC)IO 78 primer. IP I and IP2 primers were designed based on ISSR sequence flanking the SSR region as highlighted in grey.
Figure 4.18 ISSR-PCR sequence amplified by using a microsatellite (AG)IO 79 primer. IP I and IP2 primers were designed based on ISSR sequence flanking the SSR region as highlighted in grey.
Figure 4.19 ISSR-PCR sequence amplified by using a microsatellite (GTG)6 80 primer. IP I and IP2 primers were designed based on ISSR sequence flanking the SSR region as highlighted in grey.
Figure 4.20 ISSR-PCR sequence amplified by using a microsatellite (GTG)6 81 primer. IP I and IP2 primers were designed based on ISSR sequence flanking the SSR region as highlighted in grey.
Figure 4.21 ISSR-PCR sequence amplified by using a microsatellite (GTG)6 82 primer. IP I and IP2 primers were designed based on ISSR sequence flanking the SSR region as highlighted in grey.
Figure 4.22 ISSR-PCR sequence amplified by using a microsatellite (AG)IO 83 primer. IP I and IP2 primers were designed based on ISSR sequence flanking the SSR region as highlighted in grey.
Figure 4.23 ISSR-PCR sequence amplified by using a microsatellite (AC)IO 84 primer. IPI and IP2 primers were designed based on ISSR sequence flanking the SSR region as highlighted in grey.
XlI

Figure 4.24
Figure 4.25
Figure 4.26
Figure 4.27
Figure 4.28
Figure 4.29
Figure 4.30
Figure 4.31
Figure 4.32
Example of amplification PCR products obtained using a walking 87 method (Siebert et al., 1995) to detennine the other flanking region ofa microsatellite. (a) Primary PCR products amplified with the API and AG473 IP1. (b) Nested PCR products amplified with the AP2 and AG473 IP2. Lanes 1-5: PCR products obtained from the Lane 1: AluI; Lane 2: EcoRV; Lane 3: HaeIII; Lane 4: RsaI and Lane 5: SspI restricted-DNA libraries, respectively. Lanes M: 100 bp DNA ladder (Promega, USA).
Example of amplification PCR products obtained using a walking 87 method (Siebe11 et al., 1995) to detennine the other flanking region of a microsatellite. (a) Primary PCR products amplified with the AP 1 and AC584 IP1. (b) Nested PCR products amplified with the AP2 and AC584 IP2. Lanes 1-5: PCR products obtained from the Lane 1: AluI; Lane 2: EcoRV; Lane 3: HaeIII; Lane 4: RsaI and Lane 5: SspI restricted-DNA libraries, respectively. Lanes M: 100 bp DNA ladder (Promega, USA).
Nested PCR products amplified with the AP2 and AC584 IP2 for 89 restricted DNA library Alui. Lane 1: 55.0 °C; Lane 2: 55.2 °C; Lane 3: 55 .7 °C; Lane 4: 56.6 °C; Lane 5: 57.8 °C; Lane 6: 59.1 °C; Lane 7: 60.5 °C; Lane 8: 61.8 °C; Lane 9: 63.1 °C; Lane 10: 64.2 °C; Lane 11: 65.0 °C; Lane 12: 65 .5 0c. Lane M: 100 bp DNA ladder (Promega, USA).
Nested PCR products amplified with AP2 and DMAC584 IP2 for 89 restricted-DNA library All/I. Lanes 1-10: Serial dilution (10- 1 to 1010). Lane M: 100 bp DNA ladder (Promega, USA).
Frequency of microsatellites identified based on two different 90 methods (a) Lian et al. (2001) and a modified protocol of Lian et al. (2006) .
Frequency of different types of SSR repeat motifs identified in Sawih 91 genome.
Frequency of SSR loci obtained from five different ISSR primers. 94
Forward and reverse primers binding sites flanking the SSR repeat - 95 (GA)3CACC(GA)7 as marked in bold.
Electrophoresis of SSR-PCR product on 3.5% metaphor gel by using 100 (a) DMAC02; (b) DMAC03; (c) DMAC04 and (d) DMGTG02 microsatellite primers. Lanes 1-12: Ta optimization (50 - 60°C). Lanes M: 100 bp DNA ladder (Prom ega, USA).
Xlll
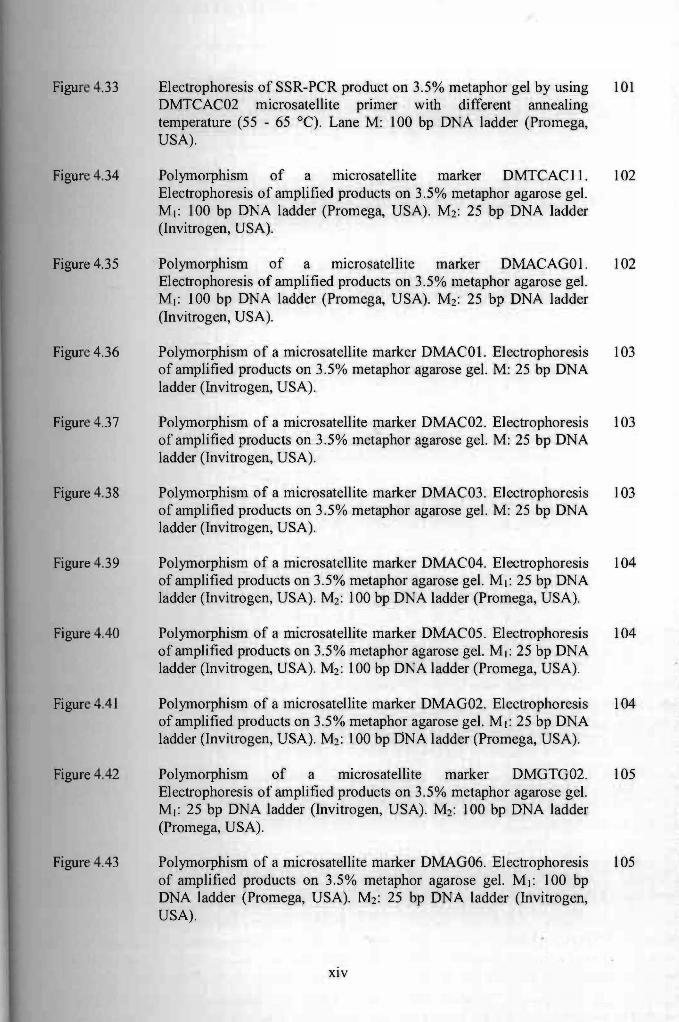
Figure 4.33 Electrophoresis of SSR-PCR product on 3.5% metaphor gel by using DMTCAC02 microsatellite pnmer with different annealing temperature (55 - 65°C). Lane M: 100 bp DNA ladder (Promega, USA).
101
Figure 4.34 Polymorphism of a microsatellite marker DMTCAC 11. Electrophoresis of amplified products on 3.5% metaphor agarose gel. M 1: 100 bp DNA ladder (Prom ega, USA). M2: 25 bp DNA ladder (Invitrogen, USA).
102
Figure 4.35 Polymorphism of a microsatellite marker DMACAGOI. Electrophoresis of amplified products on 3.5% metaphor agarose gel. M1: 100 bp DNA ladder (Promega, USA). M2: 25 bp DNA ladder (Invitrogen, USA).
102
Figure 4.36 Polymorphism of a microsatellite marker DMACOI. Electrophoresis of amplified products on 3.5% metaphor agarose gel. M: 25 bp DNA ladder (Invitrogen, USA).
103
Figure 4.37 Polymorphism of a microsatellite marker DMAC02. Electrophoresis of amplified products on 3.5% metaphor agarose gel. M: 25 bp DNA ladder (Invitrogen, USA).
103
Figure 4.38 Polymorphism of a microsatellite marker DMAC03. Electrophoresis of amplified products on 3.5% metaphor agarose gel. M: 25 bp DNA ladder (Invitrogen, USA).
103
Figure 4.39 Polymorphism of a microsatellite marker DMAC04. Electrophoresis of amplified products on 3.5% metaphor agarose gel. M1: 25 bp DNA ladder (Invitrogen, USA). M2: 100 bp DNA ladder (Promega, USA).
104
Figure 4.40 Polymorphism of a microsatellite marker DMAC05 . Electrophoresis of amplified products on 3.5% metaphor agarose gel. M 1: 25 bp DNA ladder (Invitrogen, USA). M2: 100 bp DNA ladder (Promega, USA).
104
Figure 4.41 Polymorphism of a microsatelIite marker DMAG02. Electrophoresis of amplified products on 3.5% metaphor agarose gel. M 1: 25 bp DNA ladder (Invitrogen, USA). M2: 100 bp DNA ladder (Promega, USA).
104
Figure 4.42 Polymorphism of a microsatellite marker DMGTG02. Electrophoresis of amplified products on 3.5% metaphor agarose gel. M 1: 25 bp DNA ladder (Invitrogen, USA). M2: 100 bp DNA ladder (Promega, USA).
105
Figure 4.43 Polymorphism of a microsatellite marker DMAG06. Electrophoresis of amplified products on 3.5% metaphor agarose gel. M 1: 100 bp DNA ladder (Promega, USA). M2: 25 bp DNA ladder (Invitrogen, USA).
105
XlV

Figure 4.44 Polymorphism of a microsatellite marker DMAG07. Electrophoresis of amplified products on 3.5% metaphor agarose gel. M1: 25 bp DNA ladder (Invitrogen, USA). M2: 100 bp DNA ladder (Promega, USA).
105
Figure 4.45 Polymorphism of a microsatellite marker DMAG09. Electrophoresis of amplified products on 3.5% metaphor agarose gel. M 1: 25 bp DNA ladder (Invitrogen, USA). M2: 100 bp DNA ladder (Promega, USA).
106
Figure 4.46 Polymorphism of a microsatellite marker DMTCAC04. Electrophoresis of amplified products on 3.5% metaphor agarose gel. M1: 25 bp DNA ladder (Invitrogen, USA). M2: 100 bp DNA ladder (Promega, USA).
[06
Figure 4.47 Polymorphism of a microsatellite marker DMTCAC 13. Electrophoresis of amplified products on 3.5% metaphor agarose gel. M1: 25 bp DNA ladder (Invitrogen, USA). M2: 100 bp DNA ladder (Promega, USA).
106
Figure 4.48 Frequency of null alleles detected on each SSR primer. 107
Figure 4.49 Polymorphism of a microsatellite marker DMAG04. Electrophoresis of amplified products on 3.5% metaphor agarose gel. M 1: 25 bp DNA ladder (Invitrogen, USA). M2: 100 bp DNA ladder (Promega, USA).
110
Figure 4.50 Polymorphism of a microsatellite marker DMAG05. Electrophoresis of amplified products on 3.5% metaphor agarose gel. M: 25 bp DNA ladder (Invitrogen, USA).
110
Figure 4.51 Sequence alignments of three microsatellite alleles per Sawih individual amplified by DMAG05. Asterisks (*) indicate nucleotide conservation. The repeat regions are marked in bold and point mutation is highlighted in grey. Gaps (-) indicate the absence of nucleotides in given aHeles.
111
Figure 4.52 Sequence alignment of microsatellite alleles from two different individual Sawih trees. Asterisks (*) indicate nucleotide conservation. The repeat regions are marked in bold and point mutations are highlighted in grey. Gaps (-) indicate tne absence of nucleotides in given alleles.
112
Figure 4.53 A positive correlation between PIC 0.7349).
and number of alleles (R2 = 116
Figure 4.54 Cross-species amplification of SSR loci . Twenty-five primer pairs were tested for amplification in Duabanga grandiflora (DG), Neolamarckia cadamba (NC), Canarium odontophyllum (CO) and Shorea parvifolia (SP). Successful amplification in each species is shown as a percentage of the total number of primer pairs screened.
120
xv

Figure 4.55 Electrophoresis of peR products amplified with different Sawih SSR 123 markers. Lane 1 represents the D. grandiflora tree 1. Lane 2 represents the D. grandiflora tree 2. Lane M: 100 bp DNA ladder (Invitrogen, USA).
XVI

----
LIST OF ABBREVATIONS
CIA
CTAB
ddH20
dNTP
DNA
EDTA
EtBr
IPTG
LB
MgCh
NaCI
NH40Ac
ISSR-PCR
PIC
PVP
RNA
RNase
TAE
TBE
TE
UV
X-gal
Chlorofonn-Isoamyl Alcohol
Cetyl trim ethyl ammonium Bromide
Double Distilled Water
Deoxynucleotide Triphosphate
Deoxyribonucleic Acid
Ethylenediamine Tetraacetic Acid
Ethidium Bromide
Isopropyl P-D-I-thiogalactopyranoside
Luria Broth
Magnesium Chloride
Sodium Chloride
Ammonium acetate
Inter-Simple Sequence Repeats-Polymerase Chain Reaction
Polymorphism Infonnation Content
Polyvinylpyrrilodone
Ribonucleic Acid
Ribonuclease
Tris-acetate-EDTA
Tris-borate-EDT A
Tris-EDTA
Ultraviolet
5-bromo-4-chloro-3-indolyl-b-D-galactopyranoside
XVIl

CHAPTER I
INTRODUCTION
The demand for quality wood is projected to increase dramatically in line with global
consumption requirements. This increasing demand is mainly forced by global population
growth and rise in socio-economic levels (F AO, 2010). The global consumption of industrial
round wood is estimated increase from 1707 million m3 in 1990 to 2436 million m3 in 2030
(FAO, 2009). However, the slow-growing of natural forests are unable to meet current global
demand for wood, resulting in the loss and degradation of natural forests (F enning and
Gershenzon, 2002). They further stated that the development of high-yielding with short
rotation plantation forests is vital to supply the bulk of humanity ' s wood needs on a long-term
basis. As reported by Datuk Len Talif Salleh (Sarawak State Forestry Department director),
the planted forests can generate more volume from a small area about 10 to 20 times more
than the natural forests and at the same time reduce dependency on natural forest (Borneo Post,
2010).
In line with these trends, Sarawak state government is targeting one million hectares of
land for planted forests development by year 2020. To date, state government has issued 43
licenses for planted forests and about 250,000 ha of planted forests have been achieved
(Borneo Post, 20 10). In Sarawak, planted forest development has been recognized as
sustainable method to supply raw materials for the timber-based industry, one of the ten
priority industries in Sarawak Corridor of Renewable Energy (SCORE). They also can
provide a number of social and environmental services such as rehabilitation of degraded

lands, soil and water protection, sequestering and storing carbon and, conservation of
biological diversity. In addition, planted forests also can create rural employment, help
communities raise their standard of living and contribute to sustainable development (F AO,
2010).
An important issue which should be addressed by any forest plantation programme is
the selection of plus stands for improved seed production. The development of site-specific
quality seeds is one of the most important approaches in any tree improvement programme to
maximize adaptability and yield potentials under stress-site condition (Goel and Behl, 200 I).
It is also important to ensure a sustainable supply of high-genetic quality seedlings as
approximately 30 million planting materials are required annually for planted forest
development in Sarawak.
In this regards, forest genetics and tree improvement researches will help respond to
the need to develop adequate tools for producing good quality seedlings that are of faster
growth, high-yield and high wood quality in the shortest of time at a reasonable cost.
Advances in genomics research, there has been a remarkable progress in the development of
an array of potential molecular markers, including RAPD, RFLP, AFLP, SSRs and other
markers for monitoring forest tree improvement activities ~uch as, measuring genetic variation
in breeding populations, gennplasm identification, verifying controlled crosses and estimating
seed orchard efficiencies (Neale et al., 1992). As explained by Westman and Kresovich
(1997), DNA-based markers play a vital role to detect variation for both coding and non
coding DNA sequences from nuclear and organelle genomes. Nowadays, these molecular
2

markers bave proven their utility in fields like taxonomy, physiology, embryology, genetic
I
engineering, etc (Joshi et al., 1999; Mondini et al., 2009).
Simple Sequence Repeats (SSRs) or microsatellites are becoming a popular DNA
marker for genetic analysis in plants. According to Saha et al. (2003), microsatellites are a
class of repetitive DNA that is a ubiquitous component of eukaryotic genomes. Such loci are
found scattered throughout the genome and inherited in a Mendelian fashion (Moon et aI.,
1999). Microsatellites are consisting of a short motifs, typically mono-, di-, tri-, or
tetranucleotide repeats, which are repeated several times (Mahalakshmi et aI., 2002). They
almost invariably show extensive polymorphism, due to the variability in SSR repeat length as
a consequence of slippage during DNA replication or unequal-crossing over. The
hypervariability (with mutation rates ranging from 10-2 - 10-6 per locus per generation) in
species and populations is the key feature of SSRs as molecular markers (Chistiakov et aI.,
2006). To exploit microsatellites as DNA based-markers, they are assayed by PCR with
specifically designed primers to match unique sequences flanking the SSR region.
Conventionally, isolation of microsatellite loci involves construction of a genomic
library, screening with repeat oligonucleotide probes for the identification of positive clones,
designing and synthesis of primers (Roy et aI., 2004). However, these tasks are usually
labour-intensive, time-consuming and expensive because the proportional of microsatellites to
the entire genome is generally low (Lian et aI., 2001). In addition, the recovery rate of useful
SSRs is low due to non-specific amplification and monomorphic loci (Hayden and Sharp,
2001). An alternative method is by searching the SSR-containing sequences from the
available databases, e.g. EMBL and GenBank. This method is cost-effective, simple and
3

relatively quick but only applicable to species that are well represented in the databases
(Rakoczy-Trojanowska and Bolibok, 2004; Westman and Kresovich, 1997). In this study, we
used two different methods for SSR markers development in Sawih; namely Lian et al. (2001)
and a modified protocol of Lian et al. (2006). As explained by Lian et al. (200 I), such
methods are relatively simple without enrichment and screening procedures.
Of these PCR-based markers, SSRs display a high information content, as they are
codominant and highly multiallelic. Furthermore, they are usually transferable across closely
related species and it has been reported some classes of SSR constitute an important source of
quantitative genetic variation, coding for functional elements of protein molecules and serve
as regulatory elements of transcription (Kashi et al., 1997; Collevatti et aI., 1999; Yasodha et
al., 2005). Therefore, these markers have contributed greatly to the understanding of mating
systems and pollen dispersal patterns (Garcia et aI., 2005), construction of genetic maps
(Brondani et aI., 2006) and forensics (Craft et aI., 2007). Additionally, the attractive attribute
ofthis marker is especially in the case of species which show a low level of genetic variation,
inbred populations and geographically close populations (Rakoczy-Trojanowska and Bolibo,
2004). Butcher et al. (1999) also reported the use of SSR markers in monitoring the genetic
effects of forest management practices and fragmentation on genetic diversity and gene flow
in several forest tree species.
A large number of studies have been reported on the development and use of SSR
maricers, for example in Pinus contorta (Hicks et al., 1998), Shorea curtisii and other
Dipterocarpaceae species (Ujino et al., 1998), Acacia magnium (Butcher et al., 2000), Picea
abies (Scotti et al., 2000), Populus trichocarpa (Tuskan et al., 2004), and Cryptomeria
4

•Pusat Khidmat Maldumat Akademik UNIVERSm MALAYSIA SARAWAK
japonica (Tani et ai. , 2004). However, further study is required in order to evaluate the
generality of SSR conservation, to understand the evaluation of SSR markers during
speciation and the genetic mechanisms (Ujino et ai., 1998). Additionally, such isolation and
characterization of SSR markers in other tropical timber species is relatively lacking thus far.
Duabanga moluccana Blume, or locally known as Sawih is a timber species belonging
to the family Sonneratiaceae. The wood of D. moluccana confers various advantages for the
timber industry including production of wood works and products, such as plywood, veneer,
blockboard and interior joinery. Additionally, it is suitable for interior paneling, matches,
moulding and pulping (ClRAD, 2003). Owing to its fast-growing ability, D. moluccana has
been now identified as a species of great potential for planted forests development in Sarawak.
To date, the genetic information and molecular markers of this species are still scanty. Thus,
the objectives of this study are (I) to establish an efficient protocol for isolating pure and
high-molecular weight genomic DNA from D. moluccana; (2) to develop a set of simple
sequence repeats markers specific for genotyping D. moluccana trees and; (3) to investigate
the characteristics and polymorphisms of each newly developed SSR marker.
5