Embed Size (px)
Citation preview
*
DOT HS-805 864
DEVELOPMENT AND FIELD TEST OF PSYCHOPHYSICALTESTS FOR DWI ARREST
V. TharpM. Burns
H. Moskowitz
Southern California Research Institute6305 Arizona Place
Los Angeles, California 90045
Contract No. DOT-HS-8-01970 *
Contract Amt. $205,519
MARCH 1981FINAL REPORT
This document is available to the U.S. public through theNational Technical Information Service,
Springfield, Virginia 22161
Prepared for
U.S. DEPARTMENT OF TRANSPORTATIONNational Highway Traffic Safety Administration
Washington, D.C. 20590
V
This document is disseminated under the sponsorship of the Department of Transportation in the interest of information exchange. The United States Government assumes no liability for its contents or use thereof.
TECHNICAL REPORT STANDARD TITLE P.,..
1. Report No. 2. Gov.rnmer 4cc.ssion No. 3. Recipient's Catalog No.
DOT-HS-805-864
4. Title and Svbtitl. 5. Report Dot.
DEVELOPMENT AND FIELD TEST OF PSYCHOPHYSICAL Marsh 1981 TESTS FOR DWI ARREST 6. Performing Organisation Code
7. Author(s) 0. Performing OreeAlsetlen Report No.
V. Tharp, M. Burns, and H. Moskowitz SCRI-TR81
9, Performing Organization Name and Address 10. Work Unit No.
Southern California Research Institute 6305 Arizona Place 11 . Contract or Grant No .
Los Angeles, California 90045 DOT-HS-8-01970 13. Type of Report and Period Covered
12. Sponsoring Agency Nome and Address Final Repor4 Department of Transportation Aug. 1978 - March 1981 ( National Highway Traffic Safety AdministratioWashington, D. C. 20590 14. Sponsoring Agency Cod.
15 5upplementory Notes
none
I 6 Aost'act
Administration and scoring procedures were standardized for a sobriety test battery consisting of the walk-and-turn test, the one leg stand test, and horizontal gaze nystagmus. The effectiveness of the standardized battery was then evaluated in the laboratory and, to a limited extent, in the field.
Ten police officers administered the tests in the laboratory to 297 drinking volunteers with blood alcohol concentrations (BACs) ranging from 0 to 0.18%. The officers were able to classify 81% of these volunteers, on the basis of their test scores, with respect to whether their BACs were above or below 0.10%. Officer estimates of the BACs of people they tested differed by 0.03% on the average from the actual BAC. Interrater and test-retest reliabilities for the test battery ranged from 0.60 to 0.80.
In a limited field evaluation police officers filled out 3128 data forms, each represented a driver stopped during a three month period. Police officers, after training on the administration and scoring procedures for the test battery, tended to increase their arrest rates and appeared to be more effective in estimating BACs of stopped drivers than they were before training. Anonymous breath testing of released drivers who were stopped indicated that many of the drinking 'drivers were never given a sobriety test.
. t... 00.01 18. Distribution Statement
sobriety test one leg stand This document is available to the standardization horizontal gaze- U.S. public through the National alcohol nystagmus Technical Information Service, police Springfield, Virginia 22161 walk and turn
IT. Security Cloesil. (eI this report) 20. Security Clossilf. (of this page) 21. No. of Pages 22. Price
unclassified unclassified 98
Form DOT F 1740.7 (e•69)
*
*
* *
*
METRIC CONVERSION FACTORS
ANati.ala ca....alar to Moots Maasanc*ppi.sialata Caaaallllo.s hrs. M.Ws M.as. as
$"Ad MIN TN lass II.Is b I. Tw S1sId g S/.Ist Thu r« la.. OWN* by Ti lw Statal
.13 tuNRTN
--- Lamm .. .INI..Ia/. SAO rasa bgo seMhrr. 0.4 Yds.
Id
base •aAba is►.lal. 0.9
taMra....ellrra.4rn
..wsa.. M .
Yal
.I.Iw.
s.NNYi1.s.Nas
1.31.1aA
Yaw-arts
InIt
W5
r .IYr 1A YN...trs r Off
AREA ANIA
r a .seale rase aA .s.l. c.MI..w. 00.*we aMY.i.gasl.. WN&
0.1141t1
si..w wafts.al.•• tr••s.
to %so ever• Yil..aa/s a.I .41.4. mom
.ioseals .o w•
ago" all"9.4
2A.etlsa. • stsea
.arr. Yil.w sassjboa
. be Y.etrse 116.6a 011 to SCOW
.s/se 0.4
MASS IwIIIq
Y.caw Is2
MASS WOWS).- -;e 2
« sl.a. st arm.. a - -° • al••• aJaa ...1. «
r prd.art w
a.waA
YIIw...la....
YsaA-- a M YiIs
- _ • N/a.s Haas Ya 1.1N.rMabove I.a.
M
(4101 1M ' - -- $
VOtUME - - YOIUMEP w
S&P l•••r•••• { .uN11a.1. Of .M Mi iIlrs lIt 11.i/asl.se. Nays
lb" «Yr.pse. 1a .illilll.as .11 is • I lia4. 2.1 Ph" l•N « N.Y SWAM millf#Wws ad Y a^- 1 now* 1.46 OWNC
M410116Pines 0.41
filmsNan 1
I Newscwwd mows
a.:.n
asllrs"k
!gk
N tll•ll. s.N .h.a. I ass c.Yr saw. 1.1 a" 1•Ir. Iris
9111 1111 3A him112
weold" Isle s...ark pads 0.78
640 mows
.IYIC s rsr.40
01 = r T110111"Tong low"
TEMPINATUNE Isascll c.lal.. sA la.a {abssY.ilwl./.Itar. safe 121
It FtAIw.N $+a lsYlr C.Lise .c 1=_121 Sr 12 saa as
w -40 Ia0 1110 N0 I• / w . 111 W J 010. I....r ...cl .....•...w ...1 w...Y141.a I.IM......... a...:. /rW. 71.1.U..^ .I a.44.^ ... N. ..s. w.. 4126. 50 Cask. N.. C 11.1.26..
w -40.c -N a0n
a0 N•C
.,
PREFACE
This study involved the participation of three different police
agencies whose cooperation and support was essential. We are
especially grateful for the exceptional contributions to the
project of the administrative and patrol personnel of these
agencies. The agencies, along with our principal point of
contact, are listed below in alphabetical order.
California Highway Patrol, Southern Division
Cpt. Kenneth Rude
Los Angeles County Sheriff's Department
Sgt. Harry Douglas
Los Angeles Police Department, Central Traffic
Sgt. Richard Studdard
•:e also wish to acknowledge the contribution of two research
assistants, Melinda Baille and Leslie Rosdol, whose contribution
was exceptional.
The Contract Technical Managers for this project were
Stephen Benson, Pamela Anikeeff, and Robert Schweitz. We
appreciate their assistance and support.
iii
TABLE OF CONTENTS
PAGE
I. INTRODUCTION .......................................... 1
A. PRELIMINARY ASSESSMENT OF FIELD SOBRIETY TESTS 1
B. PILOT TESTS WITH THE SELECTED TEST BATTERY ._....., 2
1. Standardization ............................. 32. Field Observation 33. Pilot Subjects 4
a. Walk and Turn Test ..••••••.••...--••.- 4b. One Leg Stand Test .................... 5c. Gaze Nystagmus Test ................... 7
II. LABORATORY EVALUATION OF THE TEST BATTERY ............. 13
A. LABORATORY PROCEDURES 13
1. Police Officers, Observers, and LaboratoryParticipants .............................. 13
2. Training Precedures for Police Officers ..... 163. Testing Procedures .......................... 16
a. Participants .......................... 16b. Officers and Observers ••.•••.•••..••. _ U
B. TEST BATTERY VALIDITY 19
1. BAC Estimates .............................. 192. Impairment and Arrest Decisions ............. 203. Ability to Classify Subjects with Respect
to 0.10% BAC .............................. 204. Nystagmus Criteria .......................... 25
a. BAC Versus Angle Onset ................ 25b. Rater Estimate Versus Machine Estimate
of Onset ............................ 30
C. RELIABILITY ....................................... 30
1. Interaction Reliability ..................... 302. Test-Retest Reliability ..................... 34
III. FIELD EVALUATION PRECEDURES ........................... 37
POLICE AGENCY ..................................... A. 37
v
V
PAGE
1. Station A ................................. 382. Station B ................................ 383. Station C ................................ 384. Station D ................................ 38
B. STUDY DESIGN ................................... 39
C. TRAINING POLICE OFFICERS ........................ 41
D. DATA COLLECTION ................................. 42
1. Data Forms ................................ 422. Ridealong Data ............................ 45
. EVALUATION OF THE FIELD STUDY ....................... 50
A. THE NATURE OF THE STOPEE POPULATION ............ 50
1. Age ....................................... 522. Sex ........................................ 523. Race ...................................... 52
B. TEST BATTERY EFFECTIVENESS ...................... 54
1. Will the Percentages of the Stopees Who Are Arrested Increase after the Training on the Test Battery? ...................... 55
2. Will Police Officers Make More AccurateDecision with Respect to a BAC of 0.10% after Being Trained on the Test Battery? 57
a. Exposure to Drinking Drivers ........ 57b. Accuracy of Decisions ............... 57
3. Will the Mean BAC of Arrested Drivers Be Reduced after the Test Battery Is Introduced? ............................... 60
a. Drug Arrests ........................ 62b. Refusals ............................ 62
4. Mill Police Officers More Accurately Estimate the BAC Levels of Stopees after Being Trained on the Test Battery? .................................. 62
a. Few Stopees Are Tested .............. 62b. Most Officers' BAC Estimates
Were Invalid ............. ... ...... 63'c. Blood and Urine Data Were Obtained
on a Biased Sample of Arrestees..... . 63d. Given these Problems, the Accuracy
of the Officers' BAC Estimates Tended To Be More Accurate after Training ............................ 63
vi
IV
7
PAGE
5. BAC Distribution of Police Stopees ............. 65
a. Driver's BAC Versus His Arrest Probability.. 65b. BAC During Different Phases of the Study.... 65c. BAC Versus Type of Driving Error ........... 68
C. FEASIBILITY ................................... 68
1.2.
3.
Police Attitude Toward DWI Arrests ............. Police Acceptance of Standard Administrationand Scoring Procedures ......................... Set BAC Levels .................................
68
6970
V. CONCLUSIONS AND RECOMMENDATIONS .......................... 72
A. CONCLUSIONS ......................................... 72
B. RECOMMENDATIONS ..................................... 73
1.2.3.
Police Attitude and Motivation ................. 73Adequate Time Frame for Data Collection ........ 73Other Considerations ........................... 74
IV. REFERENCES ............................................... 75
APPENDIX A: LITERATURE REVIEW ........................... 79
A. ALCOHOL AND NYSTAGMUS ................................ 79
1. Vestibular Mechanism ........................... 792. Neural Mechanism ............................... 813. Gaze Nystagmus ................................. 82
B. ALCOHOL AND BALANCE .................................. 83
1.2.
Walk the Line .................................. 84One Leg Stand .................................. 84
APPENDIX B: INSTRUCTIONS AND SCORING SHEET ............... 85
vii

LIST OF TABLES
TABLE PAGE
1. Backround of Officers Who Scored and12Administered the Field Sobriety Test Battery..
2. Age and Sex Comparison of LaboratoryParticipants with Stopees from theField Evaluation ............................. 14
3. Mean Absolute Value of the DifferenceBetween the Actual BAC and the EstimatedBAC of Each Rater ........................... 21
4. Percentage of Subjects Classified as"Arrested" or "Impaired" at. Each AlcoholDose ......................................... 22
5. Rater's Criterion for the Arrest/No ArrestDecision .................................... 23
6. Rater's Criterion for the Impaired/NotImpaired Decision ............................ 24
7. Classification Percentages with Respect to aBAC of .10% for Individual Raters ............ 26
8. Decision Matrix for Police Officers .......... 27
9. Decision Matrix for Observers ................ 28
10. Correlation between Machine NystagmusReadings and Blood Alcohol Concentration ..... 29
11. Correlation between Machine Angle of Nystagmusonset and individual Rater Estimates of Onset,the Rank of these Correlations, and theRark of Each Rater's Classification Ability .. 31
12. Interrater Reliability on Each Session ....... 32
13. Interr.ater Reliability: Individual Officer-Observer Correlations ........................ 33
14. Test-Retest Reliabilities for Decision andTest Scores .................................. 35
viii
TABLE PAGE
15. Analyses of Variance for Between Session Rater BAC Estimates for Officer-Same, Officer-Different, Observer-Same, Observer-Different ..... 36
16. Pre-Training Data Form 43
17. Post-Training Data Form .......................... 44
18. Data Obtained from Stopees during Ridealongs ..... 51
19. Age and Sex Distribution of Four Groups of Stopees during the Field Evaluation .............. 53
20. Stops and Arrests Made during the Field Evaluation as a Function of Officer Grouping and Study Phase ...... 56
21. BACs of Released Stopees as a Function of Officer Grouping and Phase of the Study .......... 58
22. Before Training Decision Matrix 59
23. Arrests, Available BAC's, and Mean BAC as a function of Officer Grouping and Study Phase ...................................... 61
24. Mean Absolute Value Difference Between Estimated
BACs and Actual BACs of arrestees giving blood or Urine Tests ...................................... 64
25. Distribution of Stopees According to BAC and Arrest Probability Before and After Training as a Function of BAC 66
26. Most Common Reasons for Stopping a Driver during Field Evaluation 67
LIST OF FIGURES
FIGURE
1. Nystagmus Device ................................. 6
2. Regression of Angle of Onset on BAC for the Right and Left Eyes 8
3. Angle of Onset as a Function of Time of Day for the Right and Left Eyes under Two Alcohol Conditions ....................................... 10
ix
FIGURE PAGE
4. Assignment of Participants to Cells Accordingto BAC and Drinking History on Session 1and 2 .......................................... 15
5. Three Phase Design ............................. 40
6. Device for Obtaining Anonymous Breath Samples... 46
x
CHAPTER I: INTRODUCTION,
Alcohol use contributes to a large proportion of the fatal and injury related accidents nationwide. Currently, attempts to deter the drinking driver consist of informing the public of the hazards of driving while impaired (DWI) and of the threat and consequences of being arrested. Unfortunately, the perceived risk by the public is quite low, since the combined probability of having an accident or of being arrested for one DWI trip is estimated to be 0.00089 (Summers and Harris, 1978) or less than one in 1000.
One reason for the low probability of being arrested in a DWI trip is that large deficiencies exist in the detection and arrest of drivers with blood alcohol concentrations (BACs) over 0.10%. Drivers on the road, as estimated by Beitel, Sharp, and Glauz (1975), are three times as likely to have a BAC in the range of 0.10% to 0.14% as in the 0.15% to 0.19% range. In contrast, the probability of an arrested driver having a BAC in the 0.10% to 0.14% range is half as great as that of having a BAC in the 0.15% to 0.19% range. This deficit may be directly attributed to the police officer in the field, who must detect and arrest the alcohol impaired driver.
The discrepancy between the distribution of BACs among drivers and the distribution of BACs among arrestees results from the following: (1) the high BAC driver makes more frequent driving errors which are detected by the police; (2) decisions to arrest are easier to make with the highly intoxicated stopee; and (3) many police officers are not motivated to arrest drunk drivers, especially those with lower BACs. These discrepancies may be at least partially offset by training police officers to discriminate BAC levels more effectively by using a standardized field sobriety test battery.
A. PRELIMINARY ASSESSMENT OF FIELD SOBRIETY TESTS
Much of the available literature on sobriety testing comes from countries in which a medical examination by a physician is required to determine intoxication. For example, Finland has no statutory blood alcohol limits for driving, but the courts give severe penalties for driving under the influence of alcohol. Pentilla, Tenhu, and Kataja (1971) examined the sobriety test performance of 6839 Finnish drivers suspected of driving under the influence of alcohol. In this study, the test battery included: walking, gait in turning, balance, finger-to-nose, picking up matches, counting backwards, time and place orientation, and observations of speech and general behavior. The three most sensitive tests were counting backwards by threes from 102, balancing with the eyes open, and walking down a corridor with eyes closed. The counting test, however, was particularly difficult for people of low socioeconomic background.
1
In a subsequent study, these investigators (Pentilla, Tenhu, and Kataja, 1974) analyzed the test records of 495 individuals in order to develop an optimal test battery. The most important change from previously used tests was the inclusion of observations of the eyes, (e.g., gaze nystagmus, post-rotational nystagmus, pupillary diameter, and pupillary reaction to light) and the walk-the-line test. The gaze nystagmus and the walk-the-line tests proved to be the best for predicting the BAC, whereas physicians' subjective estimates of the level of intoxication were found to be of no value.
In New Zealand a medical examination is given in cases where a driver suspected of driving while intoxicated pleads not-guilty. Simpson-Crawford and Slater (1971) have developed a clinical examination consisting entirely of eye signs of alcohol intoxication. Their six point "oculiser scale" includes the following: (1) conjunctivae are suffused (i.e., "bloodshot" eyes); (2) the eyelids drag behind when the eyeball moves up and down; (3) the pupillary light reflex is slowed; (4) peripheral vision is diminished; (5) nystagmus is seen when the eyes follow a moving object; and (6) the pupils tend to be dilated.
Burns and Moskowitz (1977) evaluated a number of sobriety tests currently used by police in the United States to determine their relationship to intoxication. Based upon preliminary pilot work, the following teats were selected for an evaluation study: one-leg
stand; walk-and-turn; finger-to-nose; finger count, alcohol gaze
nystagmus; tracing; Romberg body sway; subtraction; backward
counting; and letter cancellation. Ten police officers
administered these tests to 238 participants. The participants were light, moderate, and heavy drinkers who had consumed enough alcohol to produce a BAC in the range of 0% to 0.152. All of the tests were found to be sensitive to alcohol, but a reduced "best test set" was determined by means of stepwise discriminant
analyses. The three "best" tests were (1) the one-leg-stand; (2)
the walk-and-turn; and (3) alcohol gaze nystagmus. This recommended test battery could correctly classify more than 83% of the evaluation study participants with respect to whether they were above or below a BAC of 0.10%.
B. PILOT WORK WITH THE SELECTED TEST BATTERY
The purpose of Phase I of this contract (DOT-HS-8-1970) was to complete the laboratory development and validation of the sobriety test battery identified by Burns and Moskowitz (1977). First, the development of the test battery involved identifying variables, in addition to alcohol, which influence performance on the test battery. As a result of this identification, standardized administration and scoring procedures were developed. A literature review of the variables affecting the three test battery is included in Appendix A. A summary of the pilot work aiming at standardizing the scoring and administration procedures is included in this chapter.
2
1. Standardization
Cronbach (1970) defines a standardized test as being "one in which the procedures, apparatus, and scoring have been fixed so that precisely the same testing procedures can be followed at differcnt times and places." The process of gathering normative data is also called "standardization," but this process is not very profitable until the procedures and scoring have been standardized.
The first step in standardizing a field sobriety test battery is to determine what aspects of the test battery make the tests particularly sensitive to alcohol intoxication. That is, the first step is to fine-tune the tests to best discriminate between the intoxicated person and the sober person. These variables most sensitive to alcohol intoxication are discussed in Appendix A.
Testing is a social relationship in which the interactions between the tester and the testee are very important. These interactions between stopee and police officer will be impossible to
standardize. For example, we have found during police ridealongs that most stopees are fairly calm about getting a ticket, although 30% to 40% will argue with the officer. About 5%'of the stopees
can be very hostile, however1 displayin; behavior ranging from temper tantrums to hysterics. Intoxicated stopees, who are
generally the ones given sobriety tests, are much more likely to
display these behavior extremes. Hostile behavior, or the police
reactions to it, is impossible to duplicate in the laboratory situation for purposes of standardization.
The police officer, in scoring the field sobriety tests, is interested both in how well the suspect can perform (i.e., is the individual impaired?) and how well the stopee's performance
compares with that expected from drivers at various BACs. The primary reason that a field sobriety battery is given (i.e., instead of using a portable breath analyzer) is to show that the
driver's performance is impaired. In this sense, the field
sobriety teats must be content referenced, so that the police
officer can observe what the suspect can do. However, the police officer in some areas also may know from experience that no matter how impaired the suspect's performance is, the suspect will not be convicted of driving while intoxicated unless the individual's BAG is above 0.155 or convicted of reckless driving unless the individual's BAC, is above 0.10%. Thus, the police officer is also interested in a norm-referenced test so that he can estimate the suspect's BAC.
2. Field Observation
A critical phase of our pilot testing involved observing a highly efficient traffic team working out of the Los Angeles Central Police Facility which specializes in arresting intoxicated drivers. These officers were all using nystagmus in their sobriety testing. We noticed from observing their arrestees that the angle of onset of the nystagmus, which occurs as they follow a moving object to the side with their eyes, occurs with fewer degrees of lateral
3
deviation (i.e., with less lateral movement). as the BAG increases. In addition, the magnitude of the nystagmus at extreme lateral deviations is much larger with increasing BACs (i.e., the jerking movement is larger).
Second, we learned that a divided attention task could be incorporated into the walk-and-turn test by having the suspect stand heel-to-toe on the line while the directions of the test are being explained. An intoxicated person can typically either listen to the instructions or keep his balance, but cannot do both.
3. Pilot Subjects
Twenty-five subjects were given alcohol and run as pilot subjects in the laboratory. Initially, three subjects were used to rule out many of the unimportant variables in the three tests. Fifteen subjects were then run to determine the effectiveness of the more important variables and to aid in determining how the test battery should be scored. Five subjects were tested hourly for 18 hours -both sober and at a BAC of 0.10% -- to determine the combined influence of alcohol and fatigue. Finally, we also tested 42 sober subjects for nystagmus in order to determine the effects of age, visual acuity, and alcoholism history on the incidence of nystagmus in sober subjects. The results of these pilot studies are
summarized below as they relate to each of the three tests in the
sobriety test battery.
a. Walk-and-Turn Test. The suspect is asked to assume P.
.heel-to-toe position on a designated line, with his/her arms at the sides, while the remainder of the instructions are given. He or
she is then told to make nine heel-to-toe steps on the line, t<c turn around keeping one foot on the line, and to return in nine
heel-to-toe steps. The suspect is requested to watch his/her feet at all times, making sure that every step is heel-to-toe and that the steps are taken in a straight line.
Asking the suspect to balance heel-to-toe while listening to the rest of the task instructions effectively creates a divided attention task in this test. We found that this addition greatly improved the sensitivity of the test to alcohol. Intoxicated subjects either keep their balance, while ignoring the subsequent instructions, or are unable to keep their balance while listening to the instructions. The sensitivity of this addition to the task supports the contention of Moskowitz (1973) that divided attention
tasks are very sensitive to alcohol intoxication.
Requesting that people "watch their feet" while performing this test also increases its sensitivity to alcohol, but makes the task difficult for people with monocular vision (i.e., poor depth perception). Performing the walk-and-turn task with the eyes open with enough light to see some frame of reference is essential if sober individuals are to perform the test without difficulty. Finally, we found that the time taken to walk the line and the number of steps taken were relatively unimportant variables in terms of altering the sensitivity of the test to alcohol.
4
Certain individuals have difficulty with this test when sober, including: people over 65 years of age; people with back, leg, or middle-ear problems; and people with high-heeled shoes (over two inches). We recommend that only the nystagmus test be used with the first four categories of stopees, while people with high-heeled shoes should be asked to remove them.
StendardisxAg this test for eveV7 possible road etndit ion 6'sc belrond the eeegQ of this pra net. so we recommend that the walk-and-turn test be performed on a dry, hard, levei, non51ippery surface and under relatively safe conditons. If these requirements cannot be met at roadside, we recommend that the suspect be asked to perform the test elsewhere or that only the nystagmus test be
used. The test also requires a line which the police officer can manufacture. Finally, the police officer and the suspect should be able to communicate fluently. Performance of this test was not worse under the combination of alcohol and fatigue in the 24 hour pilot study of circadian effects, than under alcohol alone.
b. One-Leg Stand Test. The suspect is asked to stand with his/her heels together, feet at a slight angle and arms at the sides. He or she is then asked to raise one leg about six inches off the ground (i.e., with both legs kept straight) and to hold that position while counting rapidly from 1001 to 1030. Either leg may be raised.
Generally, few variables alter the sensitivity of the one-leg stand test. The most sensitive variable was time. We found that a suspect at a BAC of 0.10% might easily keep his/her bal. an cc for 20-25 seconds, but would likely falter after that time period. Consequently, the officer must ask the stopee to count aloud from 1001 to 1030 in order to estimate the passage of 30 seconds.
Two other important variables are that: (1) the suspect must be able to see in order to orient himself or herself; and (2) the
police officer must stand back from the suspect in order not to provide an artifical reference frame which could distract the
suspect. Generally, if the stopee cannot see or orient with respect to a perpendicular frame of reference, then this test will be difficult to perform even if sober.
Certain individuals will have difficulty performing this test under sober conditions, including: people over 65 years of age; people with leg, back, or middle ear problems; people who are overweight by 50 or more pounds. These individuals should only be given the nystagmus test. Suspects who are wearing over two-inch heels should remove them before performing the test.
The one-leg stand test should be performed only on a hard, dry, level, nonslippery surface under relatively safe conditions. When these requirements are not met at roadside, then the stopee should be asked to perform the test elsewhere or only the nystagmus test should be used. Performance on the one-leg stand test was no worse than alcohol alone under the combination of alcohol and fatigue in the 24 hour circadian pilot study.
5
*
L
I
*
*
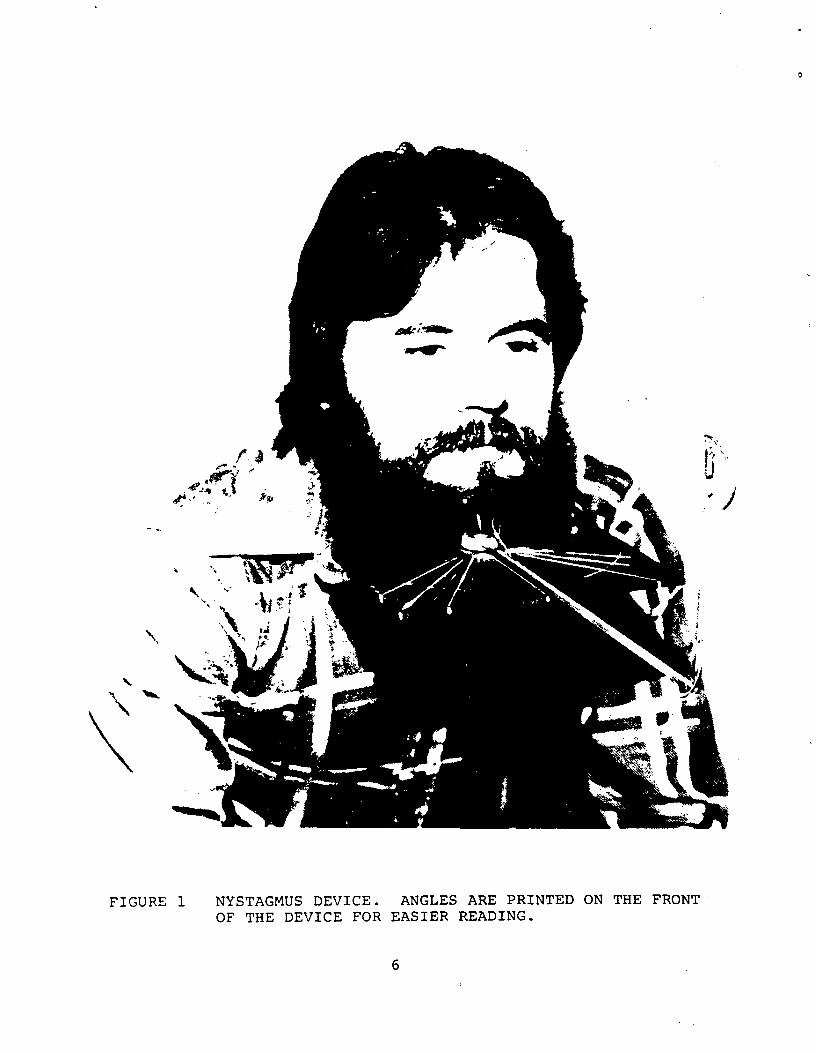
FIGURE 1 NYSTAGMUS DEVICE. ANGLES ARE PRINTED ON THE FRONTOF THE DEVICE FOR EASIER READING.
6
C. Gaze Nystagmus Test. Gaze nystagmus is a jerking movement of the eyes that sometimes can be seen when the eyes are deviated to their lateral extremes (Toglia, 1976). The jerking has a slow and fast phase, with the fast phase being in the direction of the gaze (Goldberg, 1.963). Gaze nystagmus is considered to be pathological when it occurs at a less extreme lateral gaze (Toglia, 1976), such as with brain damage or depressant drugs.
We checked for nvstagmus in 42 sober individuals, including 27 former alcoholics and 25 staff members. Approximately half of the people tested showed a slight nystagmus in at least one eye when their eyes were deviated maximally. The occurrence of nystagmus in these sober individuals was not related to (1) age, (2) visual acuity, or (3) a history of alcoholism. We did notice that the maximal angle of deviation, measured twice by each of two observers using the device shown in Figure 1 was 3.03 degrees larger in the left eye than in the right eye (t, 40, 5.8, p .001). This
occurred in 28 of the 42 subjects and was not related to hau•ledness. We saw no tendency for nystagmus to occur more often in one eye than. the other.
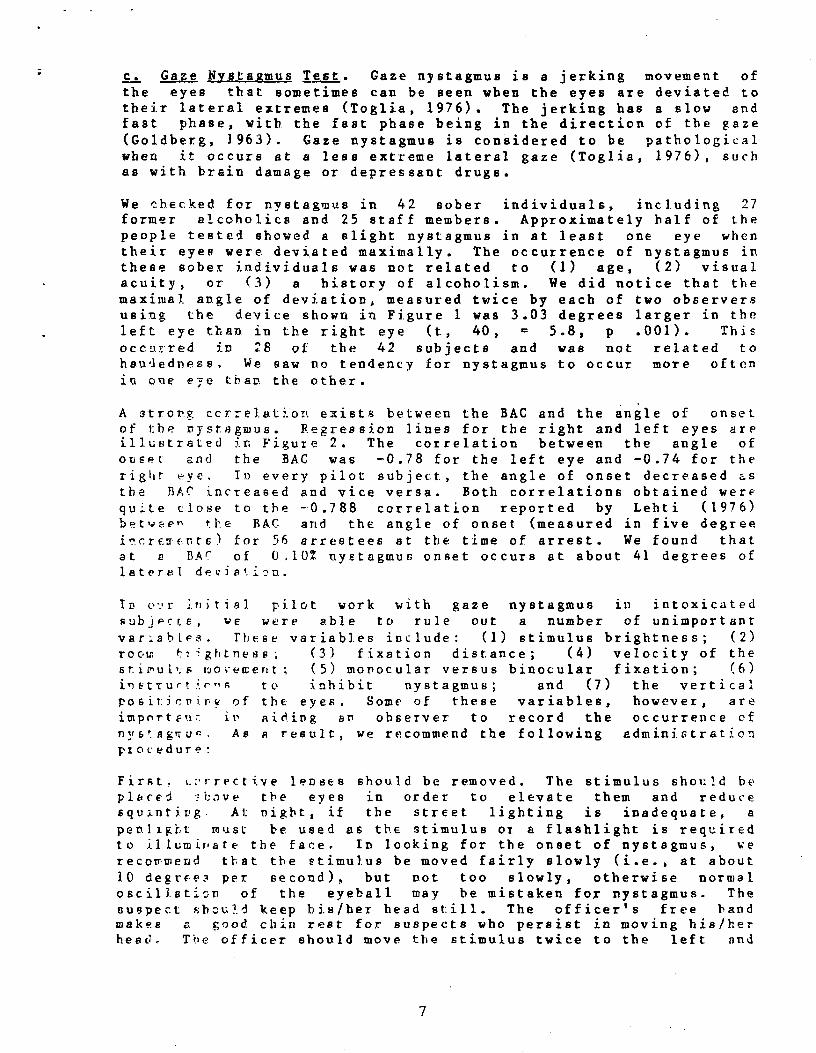
A strong ccr.:elation exists between the BAC and the angle of onset of the nystagmus. Regression lines for the right and left eyes are illustrated in Figure 2. The correlation between the angle of onset and the BAC was -0.78 for the left eye and -0.74 for the right eye. In every pilot subject, the angle of onset decreased as the BAC increased and vice versa. Both correlations obtained were quite close to the -0.788 correlation reported by Lehti (1976) between tl,e BAG and the angle of onset (measured in five degree incre:IE:r.-ts) for 56 arrestees at the time of arrest. We found that at a BAr of 0.10% nystagmus onset occurs at about 41 degrees of lateral deviation.
In o•2r initial pilot work with gaze nystagmus in intoxicated
subjects, we were able to rule out a number of unimportant
variables. These variables include: (1) stimulus brightness; (2) room t74ghtness; (3) fixation distance; (4) velocity of the stioul':s tuoveaent; (5) monocular versus binocular fixation; (6) i^ttrurti.^na to inhibit nystagmus; and (7) the vertical positioning of the eyes, Some of these variables, however, are impnrtF'ir it aiding an observer to record the occurrence of n«6!egtru-. As a result, we recommend the following administration procedure:
First. t.'rrective lenses should be removed. The stimulus should be plbcei ^bove the eyes in order to elevate them and reduce squ;_nti.ng. At night, if the street lighting is inadequate, a penlight must be used as the stimulus Or a flashlight is required to it lumir,ate the face. In looking for the onset of nystagmus, we recommend that the stimulus be moved fairly slowly (i.e., at about 10 degrE-e2- per second), but not too slowly, otherwise normal oscill.sticn of the eyeball may be mistaken for nystagmus. The suspect should keep his/her head still. The officers free hand makes a good. chin rest for suspects who persist in moving his/her head.. The officer should move the stimulus twice to the left and
7
FIGURE 2
REGRESSION OF ANGLE OF ONSET ON SAC FOR THE R f-1; ; AND Ur T EYES
Key: R. Eye Y=58.C1+(-152.71)X
--- L. Eye Y=55. 13+(-138.18) X
r_.
00
R 50.U z H
E+
z 40^
G.0
N 0 z 20
0 .02 .04 .06 .08
3Lj)OD ALCOHOL : G ]^'F,NTT TIO i " i
.10 .12
*
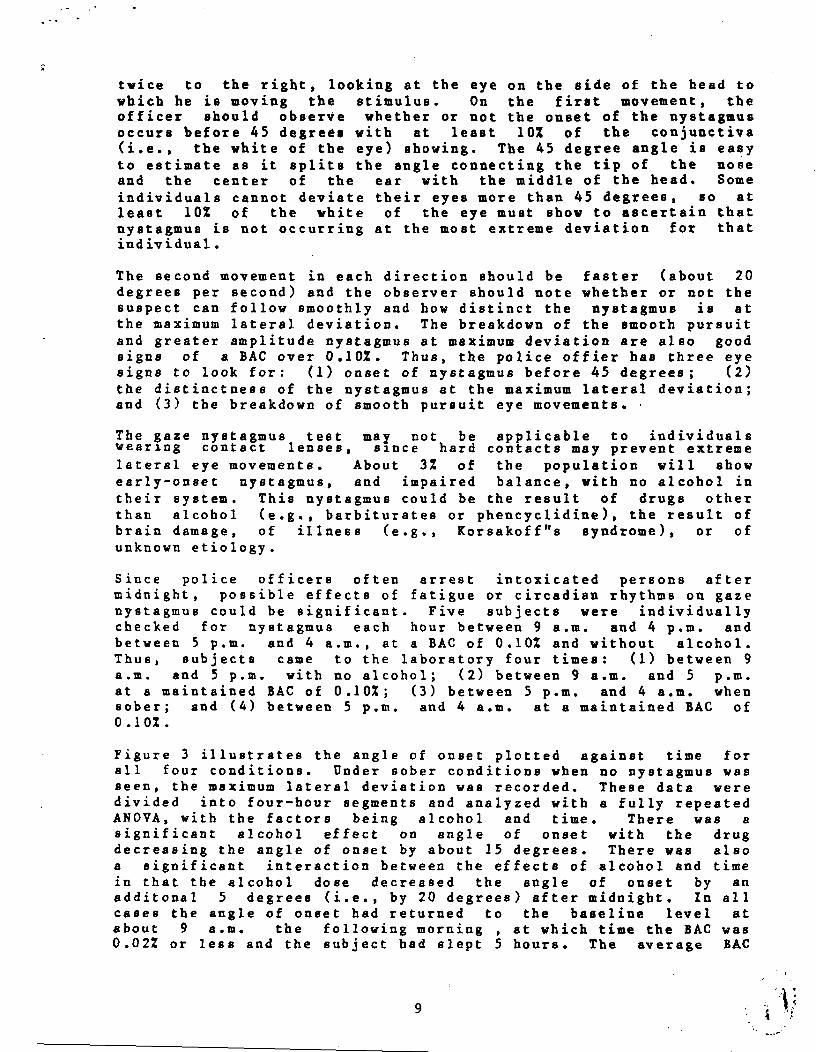
twice to the right, looking at the eye on the side of the head towhich he is moving the stimulus. On the first movement, theofficer should observe whether or not the onset of the nystagmusoccurs before 45 degrees with at least 10% of the conjunctiva(i.e., the white of the eye) showing. The 45 degree angle is easyto estimate as it splits the angle connecting the tip of the noseand the center of the ear with the middle of the head. Someindividuals cannot deviate their eyes more than 45 degrees, so atleast 10% of the white of the eye must show to ascertain thatnystagmus is not occurring at the most extreme deviation for thatindividual.
The second movement in each direction should be faster (about 20degrees per second) and the observer should note whether or not thesuspect can follow smoothly and how distinct the nystagmus is atthe maximum lateral deviation. The breakdown of the smooth pursuitand greater amplitude nystagmus at maximum deviation are also goodsigns of a BAC over 0.102. Thus, the police offier has three eyesigns to look for: (1) onset of nystagmus before 45 degrees; (2)the distinctness of the nystagmus at the maximum lateral deviation;and (3) the breakdown of smooth pursuit eye movements.
The gaze nystagmus test may not be applicable to individualswearing contact lenses, since hard contacts may prevent extremelateral eye movements. About 32 of the population will showearly-onset nystagmus, and impaired balance, with no alcohol intheir system. This nystagmus could be the result of drugs otherthan alcohol (e.g., barbiturates or phencyclidine), the result ofbrain damage, of illness (e.g., Korsakoff"s syndrome), or ofunknown etiology.
Since police officers often arrest intoxicated persons aftermidnight, possible effects of fatigue or circadian rhythms on gazenystagmus could be significant. Five subjects were individuallychecked for nystagmus each hour between 9 a.m. and 4 p.m. andbetween 5 p.m. and 4 a.m., at a BAC of 0.10% and without alcohol.Thus, subjects came to the laboratory four times: (1) between 9a.m. and 5 p.m. with no alcohol; (2) between 9 a.m. and 5 p.m.at a maintained BAC of 0.10%; (3) between 5 p.m. and 4 a.m. whensober; and (4) between 5 p.m. and 4 a.m. at a maintained BAC of0.102.
Figure 3 illustrates the angle of onset plotted against time forall four conditions. Under sober conditions when no nystagmus wasseen, the maximum lateral deviation was recorded. These data weredivided into four-hour segments and analyzed with a fully repeatedANOVA, with the factors being alcohol and time. There was asignificant alcohol effect on angle of onset with the drugdecreasing the angle of onset by about 15 degrees. There was alsoa significant interaction between the effects of alcohol and timein that the alcohol dose decreased the angle of onset by anadditonal 5 degrees (i.e., by 20 degrees) after midnight. In allcases the angle of onset had returned to the baseline level atabout 9 a.m* the following morning , at which time the BAC was0.02% or less and the subject had slept 5 hours. The average BAC
9
*
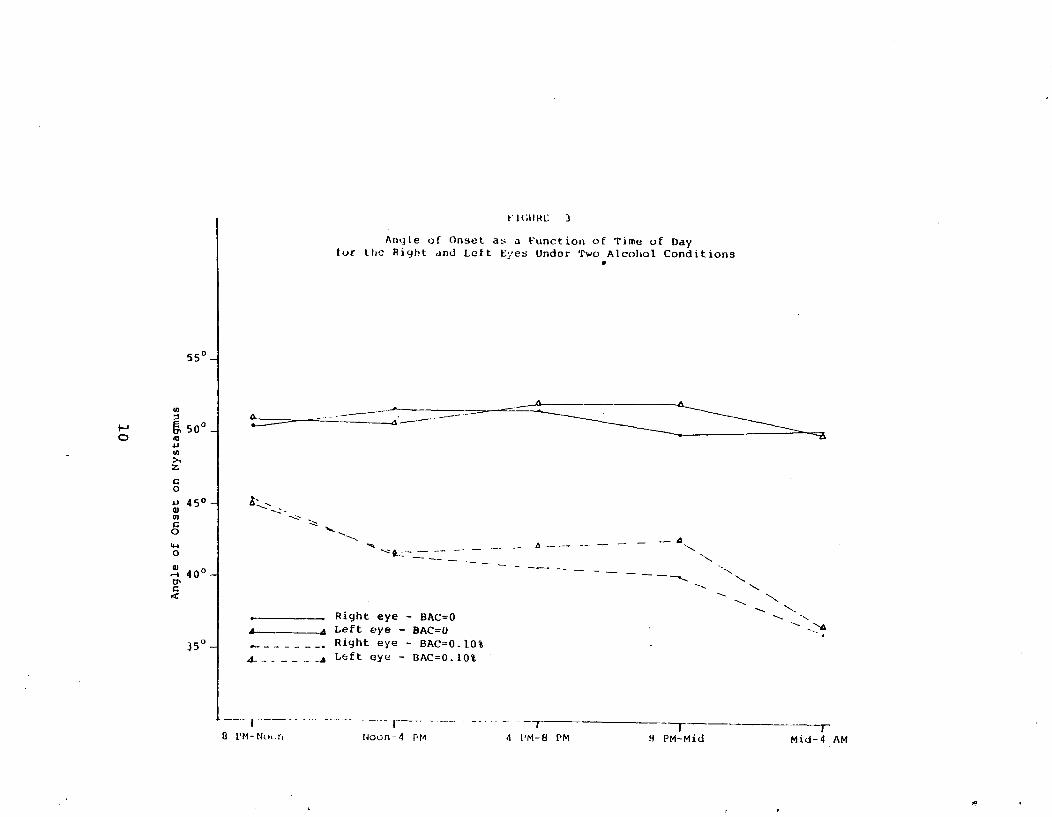
F1GI IIt L' 3
Angle of Onset as a Function of Time of Day for the Right and Left Eyes Under Two Alcohol Conditions
550 -I
U,
J:500 _I r0
o 45 ° a)U) cQ
w a 0
Right eye - BAC=O A . Left eye - BAC=O
J5° -I Right eye - BAC=O. 108 A_.__ - _A Left eye - DAC=0.10%
0 I'M-Nu .n Noun-4 PM 4 I'M-8 PM H PM-Mid Mid-4 AM
A

fluctuation between test periods under alcohol was less than 0.01%. When the observed BAC was introduced as a covariate, only the interaction between the effects of the drug and time remained significant.
11
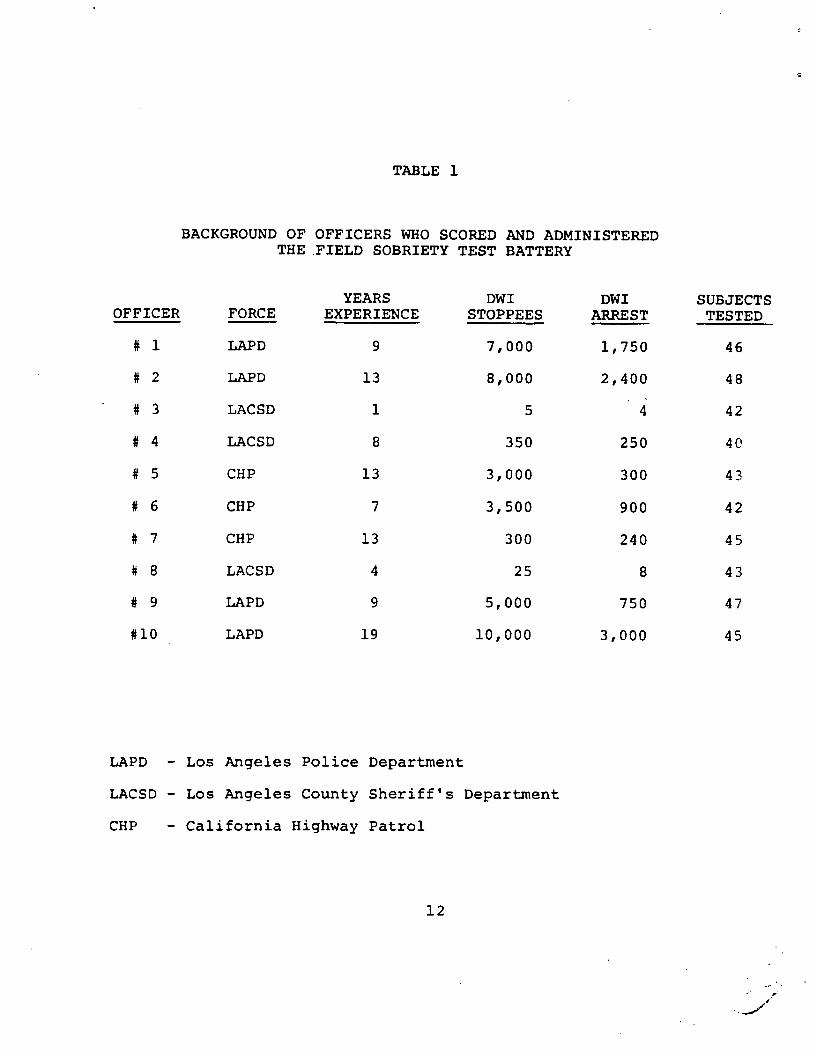
TABLE 1
BACKGROUND OF OFFICERS WHO SCORED AND ADMINISTERED THE FIELD SOBRIETY TEST BATTERY
YEARS DWI DWI SUBJECTS OFFICER FORCE EXPERIENCE STOPPEES ARREST TESTED
# 1 LAPD 9 7,000 1,750 46
# 2 LAPD 13 8,000 2,400 48
# 3 LACSD 1 5 4 42
# 4 LACSD 8 350 250 40
# 5 CHP 13 3,000 300 43
# 6 CHP 7 3,500 900 42
# 7 CHP 13 300 240 45
# 8 LACSD 4 25 8 43
# 9 LAPD 9 5,000 750 47
#10 LAPD 19 10,000 3,000 45
LAPD - Los Angeles Police Department
LACSD - Los Angeles County Sheriff's Department
CHP - California Highway Patrol
12
CHAPTER II: LABORATORY EVALUATION OF THE MA-ST BATTERY
Once the scoring and administration procedures had been standardized, a laboratory study was conducted to evaluate the validity and reliability of the standardized test battery. Ten police officers administered and scored the tests. They also made judgements as to whether the subject (i.e., the testee) was too impaired to drive, whether the testee should be arrested, and estimated the person's BAC. Each police officer tested approximately 30 people with BACs ranging from zero to 0.18%. The performance of each testee was also scored and evaluated by a trained observer so that interrater reliabilities could be assesssed. In addition, half of the subjects returned to the laboratory and were retested under an identical alcohol dose. Thus, test-retest reliabilities were also assessed. This chapter details the procedures involved in the laboratory evaluation and presents conclusions regarding the validity and reliability of the test battery.
A. LABORATORY PROCEDURES
1. Police Officers, Observers, and Laboratory Participants
Ten police officers were recruited to administer the test battery. The officers came from various police agencies in the Los Angeles area and varied considerably in experience as indicated in Table 1. Two trained research assistants served as observers.
A total of 297 individuals participated in the study, including 202 males and 95 females. One of the 95 females, dosed to 0.05%, was unable to participate in the evaluation due to illness. One hundred forty five of the 296 first-time participants returned for a second session.
Table 2 compares the age and sex of the 296 participants with the age and sex of the 3128 stopees from the field evaluation (see Chapters 3 and 4) and the 384 stopees who were suspected of being under the influence of alcohol by the police in the field evaluation. The distributions are quite close, except that fewer people suspected of being under the influence of alcohol were female in the field. In addition, individuals under 21, who could not be given alcohol in the laboratory, represented 23.8% of all stopees and 14.2% of the stopees suspected of drinking.
The experience of the SCRI staff in administering alcohol to people with different drinking histories indicates that dosing limits must be set according to drinking history to avoid overdosing subjects. Volunteers with a "heavy" drinking history, as determined by the Q-F-V questionnaire of Cahalan, Cisin, and Crossley (1969), can be dosed to a maximum BAC of 0.15%; those with a "moderate" drinking history can be dosed to a maximum of 0.11%; and those with a "light" drinking history can be dosed to a maximum of 0.05%. In order to include light, moderate, and heavy drinkers in the
13
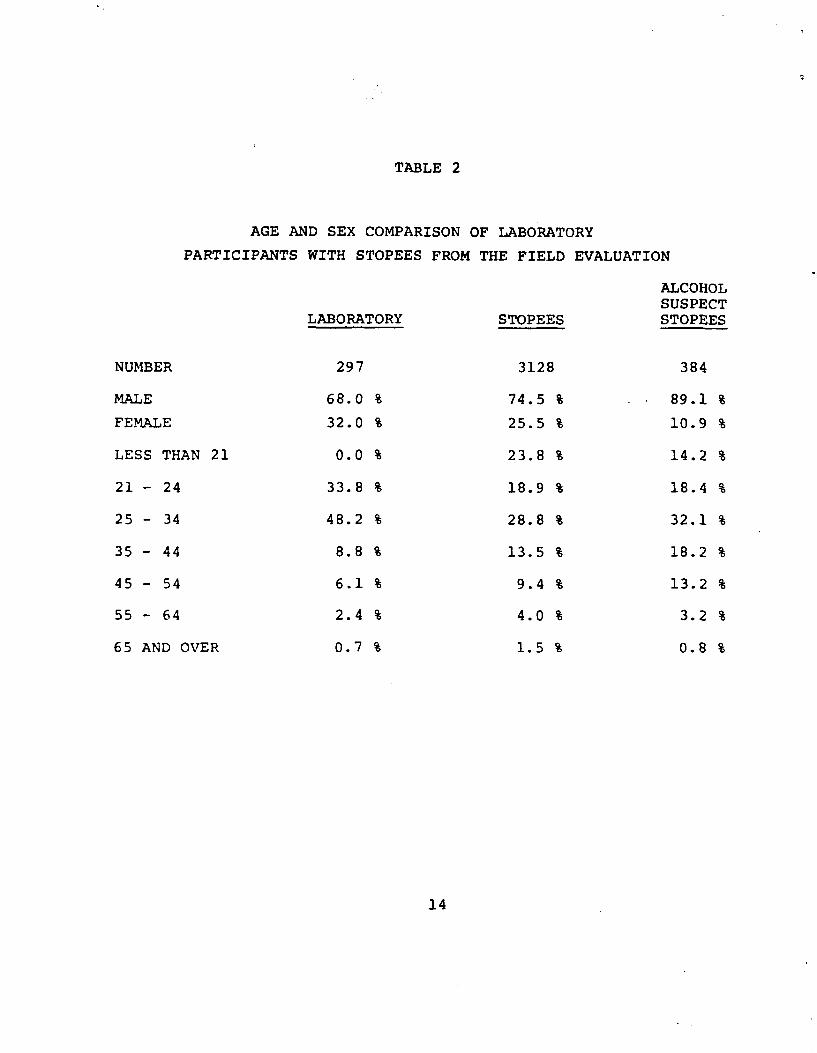
TABLE 2
AGE AND SEX COMPARISON OF LABORATORY
PARTICIPANTS WITH STOPEES FROM THE FIELD EVALUATION
ALCOHOL SUSPECT
LABORATORY STOPEES STOPEES
NUMBER 297 3128 384
MALE 68.0 % 74.5 % 89.1 %
FEMALE 32.0 % 25.5 % 10.9 %
LESS THAN 21 0.0 % 23.8 % 14.2 %
21 - 24 33.8 % 18.9 % 18.4 %
25 - 34 48.2 % 28.8 % 32.1 %
35 - 44 8.8 % 13.5 % 18.2 %
45 - 54 6.1 % 9.4 % 13.2 %
55 - 64 2.4 % 4.0 % 3.2 %
65 AND OVER 0.7 % 1.5 % 0.8 %
14
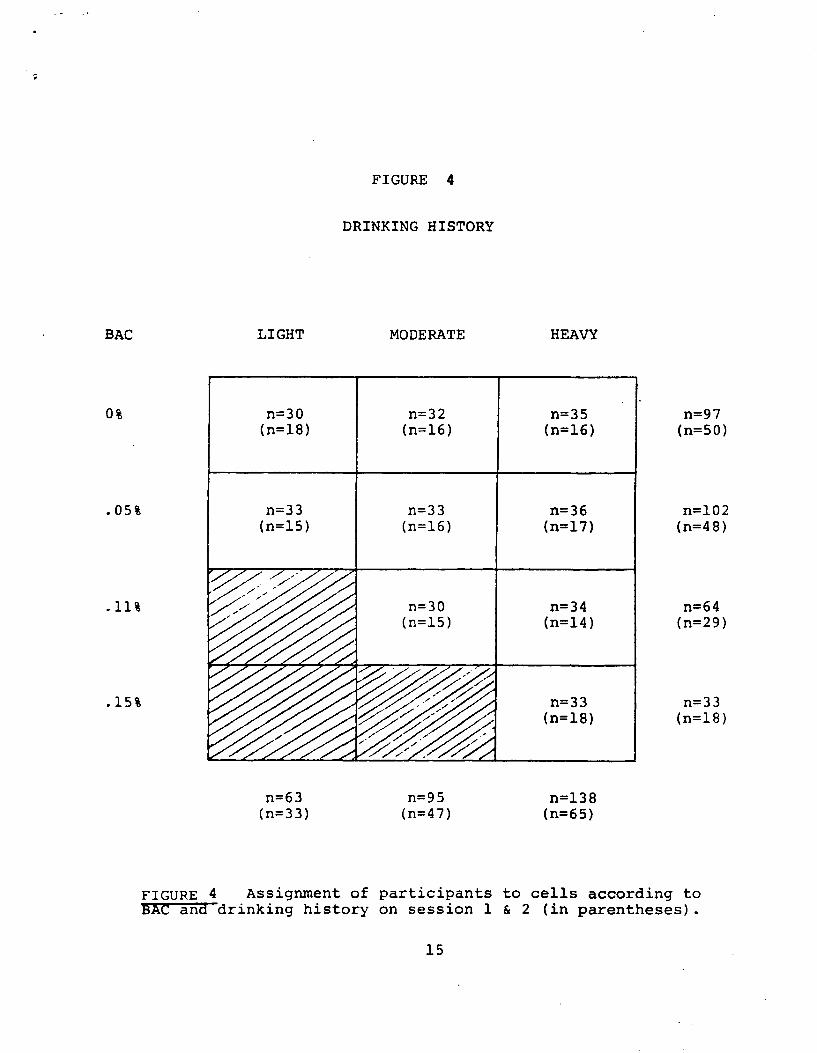
FIGURE 4
DRINKING HISTORY
BAC LIGHT
0% n=30 (n=18)
.05% n=33 (n=15)
.15%
n=63 (n= 33)
MODERATE
n=32 (n=16)
n=33 (n=16)
n=30 (n=15)
n=95 (n=47)
HEAVY
n=35 (n=16)
n=36 (n=17)
n=34 (n=14)
n=33 (n=18)
n=138 (n= 65)
n=97 (n=50)
n=102 (n=48)
n=64 (n=29)
n=33 (n=18)
FIGURE 4 Assignment of participants to cells according toSAC and drinking history on session 1 & 2 (in parentheses).
15
.laboratory evaluation, together with a wide range of alcohol doses (i.e., placebo to 0.15%), the design illustrated in Figure 4 was used. Each cell should contain approximately 33 first-session participants and 17 returnees (in parentheses in the figure), so the greatest shortfall in any cell was 3 subjects.
Of the 296 original participants, 60 (20.3%) reported being stopped by the police while driving after drinking. These 60 participants included 44 heavy drinkers, 14 moderate drinkers, and 2 light drinkers.
2. Training Procedures for Police Officers
Officers were trained in pairs during a half day training session several days prior to testing participants. Each officer was given a copy of the training manual, which was similar to the manual submitted as volume 2 of this report, and was requested to read it. At the training session held at SCRI, the Project Director then went through the manual page by page with each officer, clarifying difficulties and emphasizing important items.
The officers were then asked to estimate lateral deviation angles of the eyes using the device illustrated in Figure 1. This procedure amounted to covering the markings on the device and asking the officers to estimate 30 and 45 degrees of lateral deviation on the eyes of various staff members. For this training we typically used one staff member whose eyes would only deviate to about 43 degrees and another whose eyes would deviate as much as 65 degrees. The officers were given immediate feedback on their estimations and, if they had trouble, other people were brought in for testing until they could estimate the angles within three degrees of the reading on the device three consecutive times.
Finally, two to four people, several of whom had been drinking, were tested with the entire field sobriety test battery. One staff member-with no vision in his left eye and a bad left inner-ear (i.e., his ability to balance when sober was markedly impaired) was always included among the people tested. This preliminary testing allowed the Project Director to observe each officer administering the test battery. This training procedure brought all officers to a criterion level of performance in test battery administration.
3. Testing Procedures
a. Participants. Subjects were required to agree not to consume any alcohol for 24 hours prior to arriving at SCRI and not to consume any food for at least four hours prior to their arrival. Approximately 95% to 97% of the volunteers complied with these requests. Three people arrived at SCRI with a BAC of 0.05% or greater and 12 people admitted eating prior to their arrival at SCRI.
Volunteers were also asked not to consume any drugs for 24 hours prior to their testing. We were especially concerned about drugs which might produce additive effects with alcohol, so each subject
16
was tested for nystagmus using the device pictured in Figure 1 prior to being given alcohol. Individuals showing moderate to strong nystagmus at their maximum deviation were given a placebo dose. These people were high risks for being "false positive" classifications (i.e., the police officers would classify them as being over 0.10% when they were not) when tested. Thus, the placebo group was actually biased so that actual roadside decisions might be better than the laboratory decision, depending upon the unknown factor of the incidence of drug use among police stopees. SCRI chose to increase the probability of a false positive classification with these people rather than risk that they had consumed drugs which.might cause them to become seriously ill if they also consumed alcohol in the laboratory. However, only 13 such individuals were found representing 4.4% of our subjects. Although actually at a zero BAC, only one of these individuals was estimated to be over 0.10% by the officers and four of them were estimated to be over 0.10% by the SCRI observers.
Participants were scheduled on weekend days between May 6, 1979, and July 1, 1979. During each of these sessions, two subjects were asked to arrive at SCRI at the same time at prescheduled 15 minute intervals between 7:30 a.m. and noon. Thirty eight time slots per fty thus were allowed for subjects estimating that approximately
people would actually come to tie laboratory.
Subjects were each given three drinks containing orange juice mixed with vodka according to their assigned dose level. Each of the three drinks was to be consumed in a half hour. The importance of drinking all three drinks for the study was stressed, but subjects were also advised to stop drinking if they thought that continuing might make them ill. Eight people (2.9%) failed to consume all three drinks. These subjects, except for the female who became ill and was never tested, were reclassified into a lower alcohol dose group.
One half hour after finishing the last drink, a subject's BAC, as measured by analysis of breath samples by an Intoximeter, and angle of onset for nystagmus, measured with the device measured in Figure 1, were determined by a trained research assistant. This information was withheld from the participants, who were then shown to a room where an officer and an observer were located for testing purposes. After the testing had been completed, a second BAC was taken on the Intoximeter and the subject was told the approximate time he or she could leave the laboratory. No subject was allowed to leave until his or her BAC fell below 0.03%. Subjects were then given lunch (also dinner for those staying long enough). Each participant, prior to leaving, was asked whether or not he or she wished to participate a second time. Returnees were then selected by the Project Director from a list of those desiring to return. Those who fit the needs of the study in terms of dose (i.e., subjects were given the same dose on the return session) and drinking history were asked to return. No subject desiring to return was given feedback about his or her performance or dose level until the completion of the second session.
17
2
b. Officers and observers. Officers and observers reported to the laboratory about 9 a.m. to set themselves up in the testing rooms. Each officer-observer pair was isolated from contact with the participants and with the other officer-observer pair. On the first testing day officer-observer pairs remained together the entire day. On the second testing day the two observers switched places. Finally, on the third testing day (i.e., the repeat session), the two observers switched places after testing about seven participants. Officers and observers are collectively called "raters" or "testers" in the remainder of this report.
Participants were tested at 15 minute intervals between 9 a.m. and p.m. When a subject reported for testing, he or she was quizzed
by the officer (1) on how such alcohol had been consumed; (2) on how intoxicated he or she felt; and (3) on any medical problems which might contribute to poor performance. The officers also asked the participant to blow into his hand to determine if an odor of alcohol was present. Appendix B contains the entire list of questions asked by the officer, together with the test instructions, the scoring sheet and the decision sheet. The observers generally asked whatever questions the officer might have skipped or forgotten.
A number of the participants, despite being advised to behave as they would if they had been stopped at roadside by a police officer, promptly informed the testers that they were much too drunk to drive a car. This information was often very misleading, because the placebo effect for light drinkers in this study was very strong. Heavy drinkers, on the other hand, tended to say that they would have no trouble driving even when they had been dosed to 0.15%. All participants were given three drinks, regardless of the alcohol dose, so they generally informed the police officer that they had consumed three drinks. The testers were not able to get much more information from questioning the laboratory participants than they would from questioning roadside stopees. Some of the responses to the officers' questions may have been quite unusual for roadside stopees, since our subjects were not afraid of being arrested and a strong placebo effect is not likely to occur at roadside. When questioned about the content of the drinks, the answers included the following: "orange juice;" "they were about like you would get at a bar" (this was a placebo subject); "the first two just tasted like water, but I'd tip the bartender for the last one."
After questioning the participant, the officer administered the field sobriety tests described in Chapter I using the instructions given in Appendix B. Finally, after the participant left the testing room, the officer and the observer independently (1) decided whether they would arrest the individual, if that person had been stopped at roadside; (2) decided whether the individual was too impaired. to drive; and (3) attempted to estimate the BAC of the individual to within 0.012. For the latter two judgements they also included a confidence rating, consisting of a number from one to ten with ten being the most confident. Decision criteria, based on the pilot tests for the project, were included on the
18
decision sheet (also given in Appendix B) but were not necessarily followed by the testers. After the participants left the room, the observer was allowed to comment upon the officer's administration of the test battery if such comments seemed warranted.
B. TEST BATTERY VALIDITY
Validity refers to the degree to which a test measures what it is designed to measure, which in the case of field sobriety tests, is the impairment produced by alcohol. The primary criterion by which the test battery was evaluated, the Intoximeter reading, presents a problem because no absolute impairment threshold exists for alcohol. Individuals vary in alcohol tolerance. An infrequent drinker may be severely impaired at a BAC of 0.05%, whereas a heavy drinker may show only minimal impairment at this level. Experienced traffic officers in Los Angeles claim they do not use BAC as an arrest criterion and only arrest when they feel that a driver is too impaired to drive. Their only concern for BAC is that a conviction may not be obtained, regardless of the amount of impairment, if the BAC is too low. This is a common' problem in states that do not have Rer se laws (i.e., automatic conviction when the BAC is above a particular level).
The average BAC of those arrested for DWI across the United States is 0.17% (NHTSA, 1972). The primary goals of a standardized field sobriety test battery are to lower the average BAC of the arrestees, to give police officers a more sensitive index of impairment, and to give police officers more consistent evidence for court use. Because of the problems mentioned above, these goals are not synonymous. Thus, the criteria for determining the validity of the test battery are not straightforward. The Intoximeter reading, the most objective criterion available, is used in this report.
1. BAC Estimates
Since both police officers and observers estimated the BAC of each participant, one measure of the validity of the test battery is to compare the estimated BAC with the actual BAC. The mean difference between these two measures indicates whether or not their errors of estimation were unbiased (i.e., were consistently overestimated or underestimated). The mean absolute difference between these two measures indicates the average amount of error.
The mean BAC estimate of the officers differed from the actual BAC readings by 0.0005%. None of the officer's estimates were significantly different from the actual BAC reading. That is, overestimates and underestimates cancelled each other, indicating that the errors were unbiased. One observer, however, consistently overestimated the BAC by an average of 0.0126% (t 221-4.67, p< .001).
The means for the absolute value of the differences between the
19
estimated BAC and the actual BAC for each officer and each observer are given in Table 3. The absolute value of the differences between the officer estimates and the actual BACe averaged 0.030% (s•0.026) and the same average was obtained for the absolute differences between the observer estimates and the actual BACs.
2, Impairment and Arrest Decisions.
The officers and observers were also asked to decide whether or not an individual was too impaired to drive and whether or not the individual should be arrested. The raters agreed that they would "arrest" participants estimated in the range of 0.06% to 0.08% who were obviously impaired. Test performance, using the criteria given in Appendix B, was used to index impairment.
No officer ever arrested a person that he did not also rate as being impaired. Conversely, few participants were rated as being impaired who were not also "arrested." The three officers from the Los Angeles County Sheriff's Department, who generally had the least field experience, were exceptions and only "arrested" 60% to 75% of those they considered to be too impaired to drive. The data indicate that when an officer made a "no arrest" or a "not impaired" decision, his estimated BAC on the average was less than the actual BAC. On the other hand, when an officer made a decision to "arrest" or decided that the participant was "impaired", then his estimate of the BAC was generally higher than the actual BAC. This trend is probably even more pronounced in the field evaluation.
Table 4 gives the percentage of subjects at each dose level who were "arrested" or considered "impaired". These data clearly indicate that the officers used more conservative criteria.-'than the observers. Consequently, observers "hit" virtually all participants given higher doses of alcohol, but at the cost of "arresting" more low dose subjects.
The individual rater's "arrest" and "impaired" criteria were calculated by determining the estimated BAC at which these decisions were made. Tables 5 and 6 present each rater's "arrest" and "impaired" criteria, respectively. Some officers were not consistent with their criteria, so the value was taken to be the estimated BAC for which more "arrest" (or "impaired") decisions were made than "nonarrest" (or "nonimpaired") decisions. Overall, the officers' arrest criterion was 0.08%. However, a few placebo subjects were "arrested" because their performance indicated substantial impairment. In many cases, these were genuine placebo effects.
3, Ability t4 Classify Subiects with Respect to 0.10% BAC.
If the sole criterion used by an officer for arresting a driver under the influence of alcohol were a BAC of 0.10%, then how accurately could BACs be judged using the test battery scores? In contract DOT-BS-5-01242, officers were able to correctly classify 76% of the participants with regard to a BAC of 0.10%, using the
20
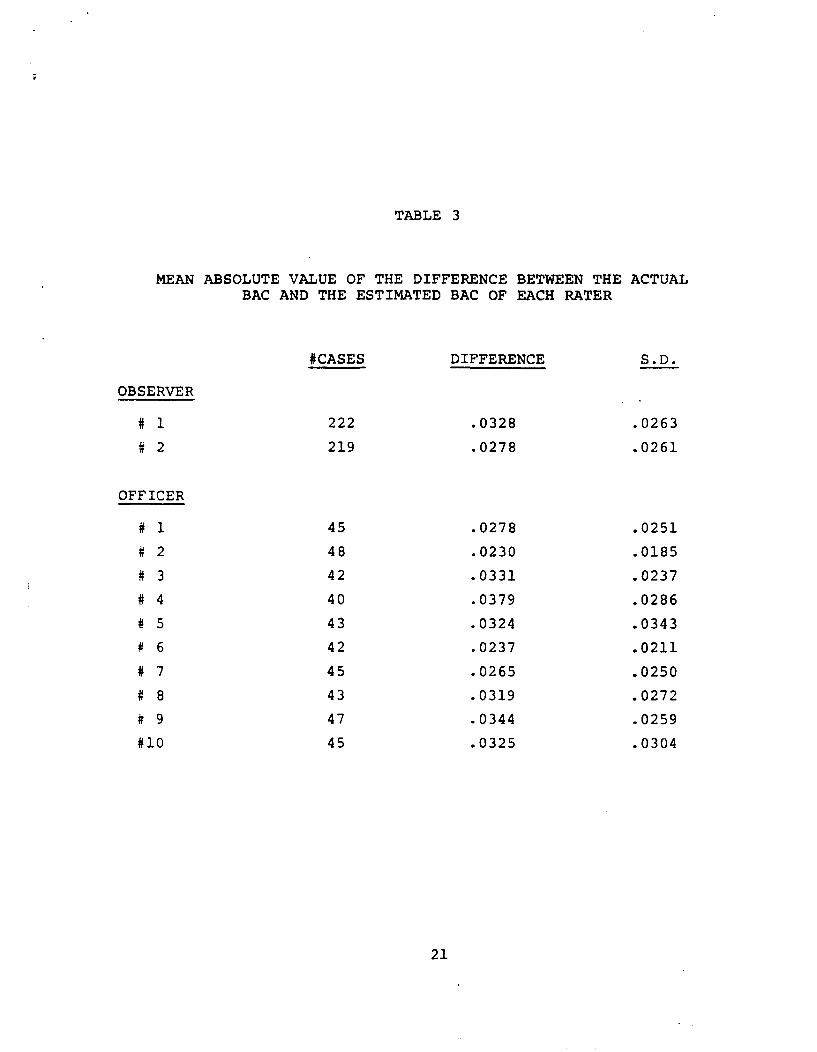
TABLE 3
MEAN ABSOLUTE VALUE OF THE DIFFERENCE BETWEEN THE ACTUAL BAC AND THE ESTIMATED BAC OF EACH RATER
#CASES DIFFERENCE S.D.
OBSERVER
# 1 222 .0328 .0263
# 2 219 .0278 .0261
OFFICER
# 1 45 .0278 .0251
# 2 48 .0230 .0185
# 3 42 .0331 .0237
# 4 40 .0379 .0286
# 5 43 .0324 .0343
# 6 42 .0237 .0211
# 7 45 .0265 .0250
# 8 43 .0319 .0272
# 9 47 .0344 .0259
#10 45 .0325 .0304
21
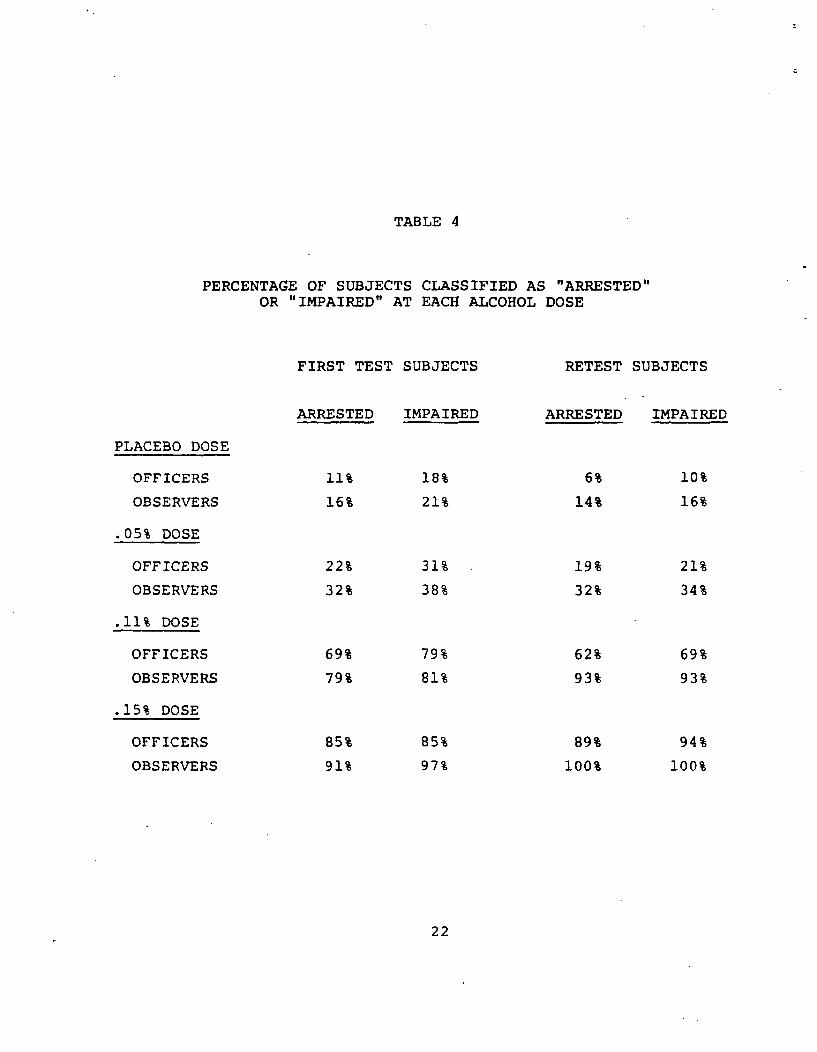
TABLE 4
PERCENTAGE OF SUBJECTS CLASSIFIED AS "ARRESTED"OR "IMPAIRED" AT EACH ALCOHOL DOSE
FIRST TEST SUBJECTS RETEST SUBJECTS
ARRESTED IMPAIRED ARRESTED IMPAIRED
PLACEBO DOSE
OFFICERS 11% 18% 6% 10%
OBSERVERS 16% 21% 14% 16%
.05% DOSE
OFFICERS 22% 31% 19% 21%
OBSERVERS 32% 38% 32% 34%
.11% DOSE
OFFICERS 69% 79% 62% 69%
OBSERVERS 79% 81% 93% 93%
.15% DOSE
OFFICERS 85% 85% 89% 94%
OBSERVERS 91% 97% 100% 100%
22
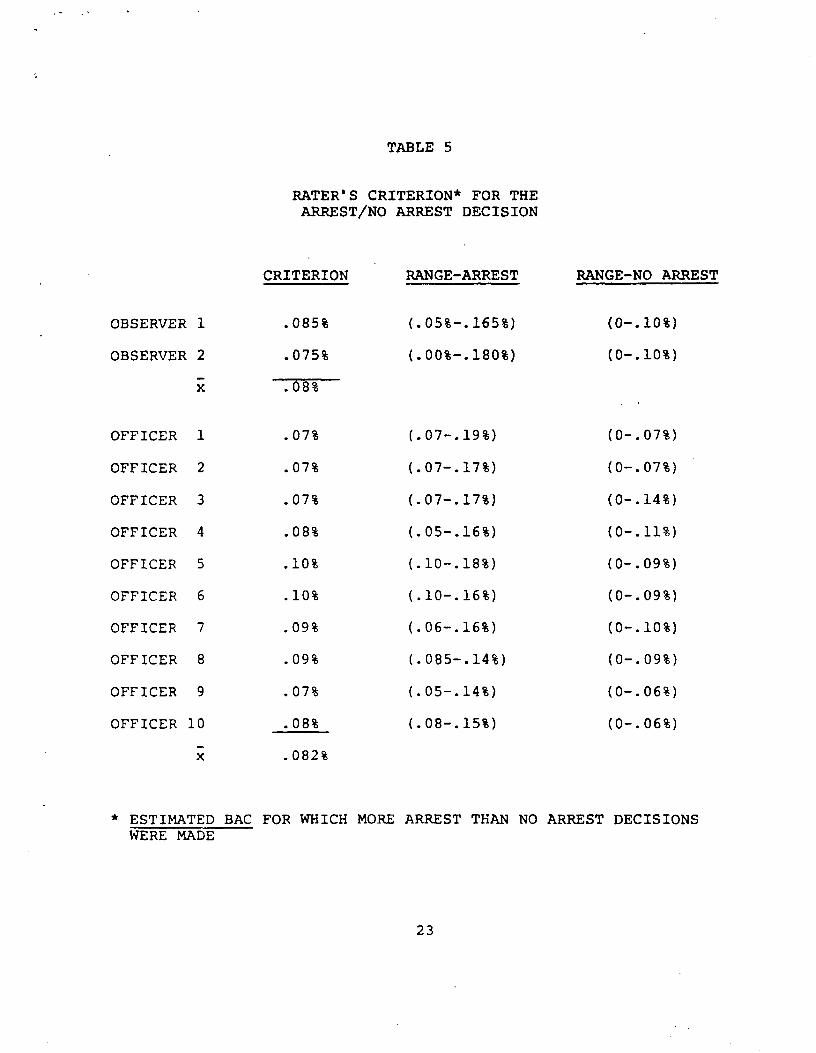
TABLE 5
RATER'S CRITERION* FOR THEARREST/NO ARREST DECISION
CRITERION
OBSERVER 1 .085%
OBSERVER 2 .075%
x .08%
OFFICER 1 .07%
OFFICER 2 .07%
OFFICER 3 .07%
OFFICER 4 .08%
OFFICER 5 .10%
OFFICER 6 .10%
OFFICER 7 .09%
OFFICER 8 .09%
OFFICER 9 .07%
OFFICER 10 .08%
x .082%
RANGE-ARREST
(.05%-.165%)
(.00%-.180%)
(.07-.19%)
(.07-.17%)
(.07-.17%)
(.05-.16%)
(.10-.18%)
(.10-.16%)
(.06-.16%)
(.085-.14%)
(.05-.14%)
(.08-.15%)
RANGE-NO ARREST
(0-.10%)
(0-.10%)
(0-.07%)
(0-.07%)
(0-.14%)
(0-.11%)
(0-.09%)
(0-.09%)
(0-.10%)
(0-.09%)
(0-.06%)
(0-.06%)
* ESTIMATED BAC FOR WHICH MORE ARREST THAN NO ARREST DECISIONS WERE MADE
23
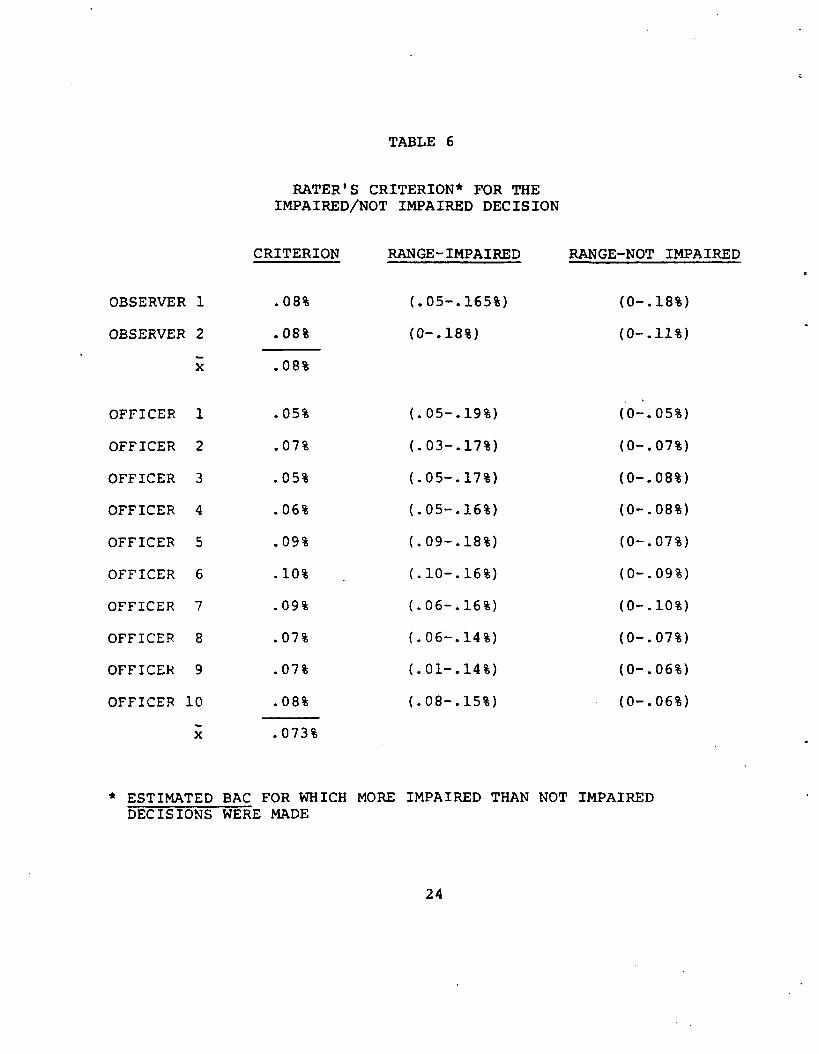
TABLE 6
RATER'S CRITERION* FOR THEIMPAIRED/NOT IMPAIRED DECISION
CRITERION
OBSERVER 1 .08%
OBSERVER 2 .08%
x .08%
OFFICER 1 .05%
OFFICER 2 .07%
OFFICER 3 .05%
OFFICER 4 .06%
OFFICER 5 .09%
OFFICER 6 .10%
OFFICER 7 .09%
OFFICER 8 .07%
OFFICER 9 .07%
OFFICER 10 .08%
X .073%
RANGE-IMPAIRED
(.05-.165%)
(0-.18%)
(.05-.19%)
(.03-.17%)
(.05-.17%)
(.05-.16%)
(.09-.18%)
(.10-.16%)
(.06-.16%)
(.06-.14%)
(.01-.14%)
(.08-.15%)
RANGE-NOT IMPAIRED
(0-.18%)
(0-.11%)
(0-.05%)
(0-.07%)
(0-.08%)
(0-.08%)
(0-.07%)
(0-.09%)
(0-.10%)
(0-.07%)
(0-.06%)
(0-.06%)
* ESTIMATED BAC FOR WHICH MORE IMPAIRED THAN NOT IMPAIRED DECISIONS WERE MADE
24
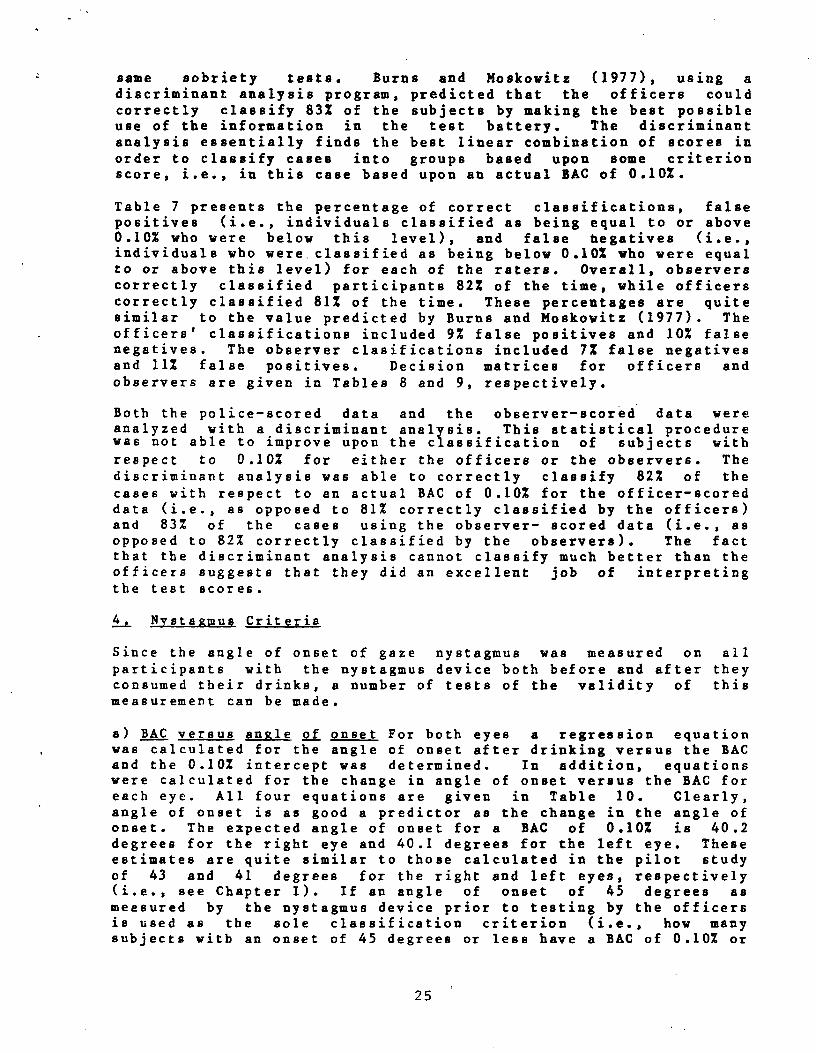
same sobriety tests. Burns and Moskowitz (1977), using a discriminant analysis program, predicted that the officers could correctly classify 831 of the subjects by making the best possible use of the information in the test battery. The discriminant analysis essentially finds the best linear combination of scores in order to classify cases into groups based upon some criterion score, i.e., in this case based upon an actual BAC of 0.10%.
Table 7 presents the percentage of correct classifications, false positives (i.e., individuals classified as being equal to or above 0.10% who were below this level), and false Negatives (i.e., individuals who were. classified as being below 0.10% who were equal to or above this level) for each of the raters. Overall, observers correctly classified participants 82% of the time, while officers correctly classified 81% of the time. These percentages are quite similar to the value predicted by Burns and Moskowitz (1977). The officers' classifications included 9% false positives and 10% false negatives. The observer clasifications included 7% false negatives and 11% false positives. Decision matrices for officers and observers are given in Tables 8 and 9, respectively.
Both the police-scored data and the observer-scored data were analyzed with a discriminant analysis. This statistical procedure was not able to improve upon the classification of subjects with respect to 0.10% for either the officers or the observers. The discriminant analysis was able to correctly classify 82% of the cases with respect to an actual BAC of 0.10% for the officer-scored data (i.e., as opposed to 81% correctly classified by the officers) and 83% of the cases using the observer- scored data (i.e., as opposed to 82% correctly classified by the observers). The fact that the discriminant analysis cannot classify much better than the officers suggests that they did an excellent job of interpreting the test scores.
4. ystazmus Criteria
Since the angle of onset of gaze nystagmus was measured on all participants with the nystagmus device both before and after they consumed their drinks, a number of tests of the validity of this measurement can be made.
a) BAC versus angle of onset For both eyes a regression equation was calculated for the angle of onset after drinking versus the BAC and the 0.102 intercept was determined. In addition, equations were calculated for the change in angle of onset versus the BAC for each eye. All four equations are given in Table 10. Clearly, angle of onset is as good a predictor as the change in the angle of onset. The expected angle of onset for a BAC of 0.10% is 40.2 degrees for the right eye and 40.1 degrees for the left eye. These estimates are quite similar to those calculated in the pilot study of 43 and 41 degrees for the right and left eyes, respectively (i.e., see Chapter I). If an angle of onset of 45 degrees as measured by the nystagmus device prior to testing by the officers is used as the sole classification criterion (i.e., how many subjects with an onset of 45 degrees or less have a BAC of 0.10% or
25
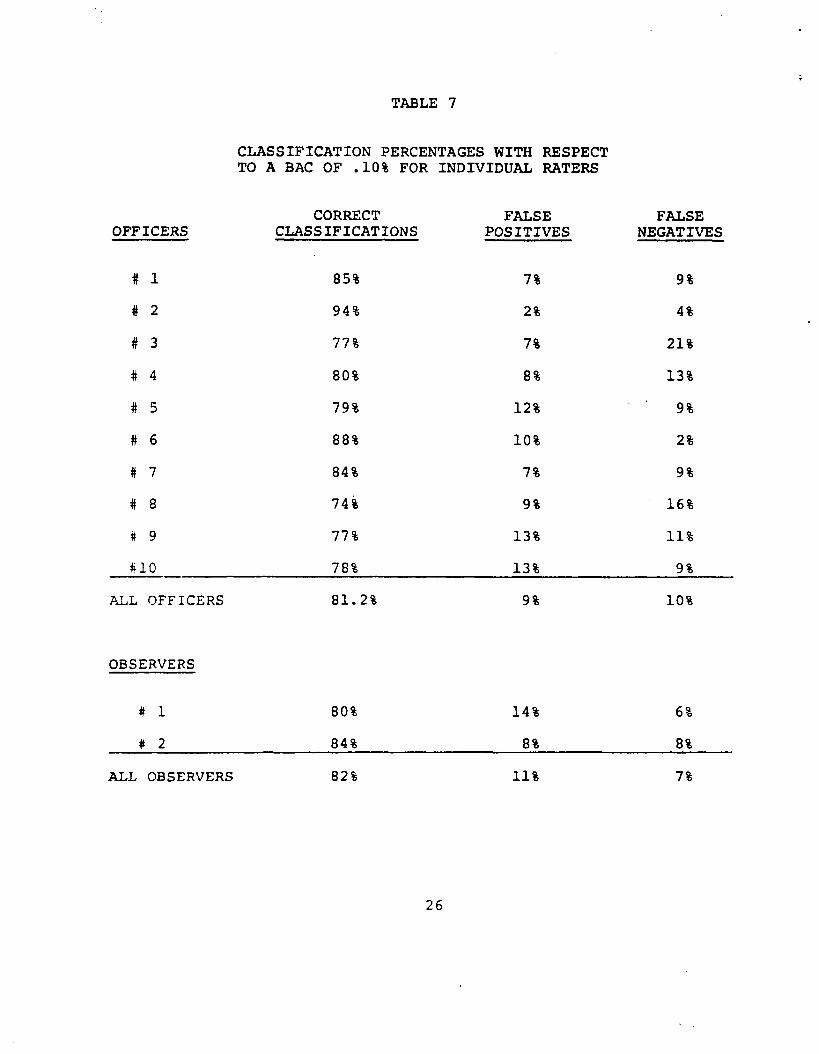
TABLE 7
CLASSIFICATION PERCENTAGES WITH RESPECT TO A BAC OF .10% FOR INDIVIDUAL RATERS
CORRECT FALSE FALSE OFFICERS CLASSIFICATIONS POSITIVES NEGATIVES
# 1 85% 7% 9%
# 2 94% 2% 4%
# 3 77% 7% 21%
# 4 80% 8% 13%
# 5 79% 12% 9%
# 6 88% 10% 2%
# 7 84% 7% 9%
# 8 74% 9% 16%
# 9 77% 13% 11%
#10 78% 13% 9%
ALL OFFICERS 81.2% 9% 10%
OBSERVERS
# 1 80% 14% 6%
# 2 84% 8% 8%
ALL OBSERVERS 82% 11% 7%
26
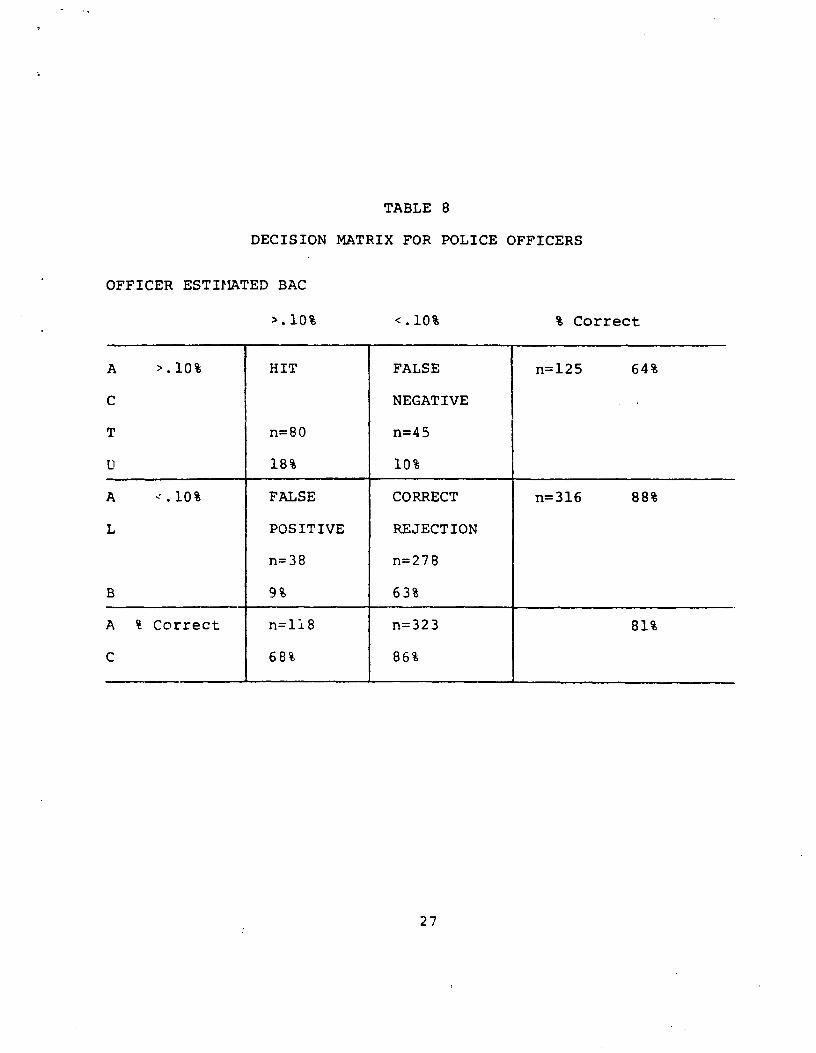
TABLE 8
DECISION MATRIX FOR POLICE OFFICERS
OFFICER ESTIMATED BAC
>. 10%
A >.10% HIT FALSE n=125 64%
C NEGATIVE
T n=80 n=45
U 18% 10%
A =.10% FALSE CORRECT n=316 88%
L POSITIVE REJECTION
n=38 n=278
B 9% 63%
A % Correct n=118 n=323 81%
C 68% 86%
<.10% % Correct
27
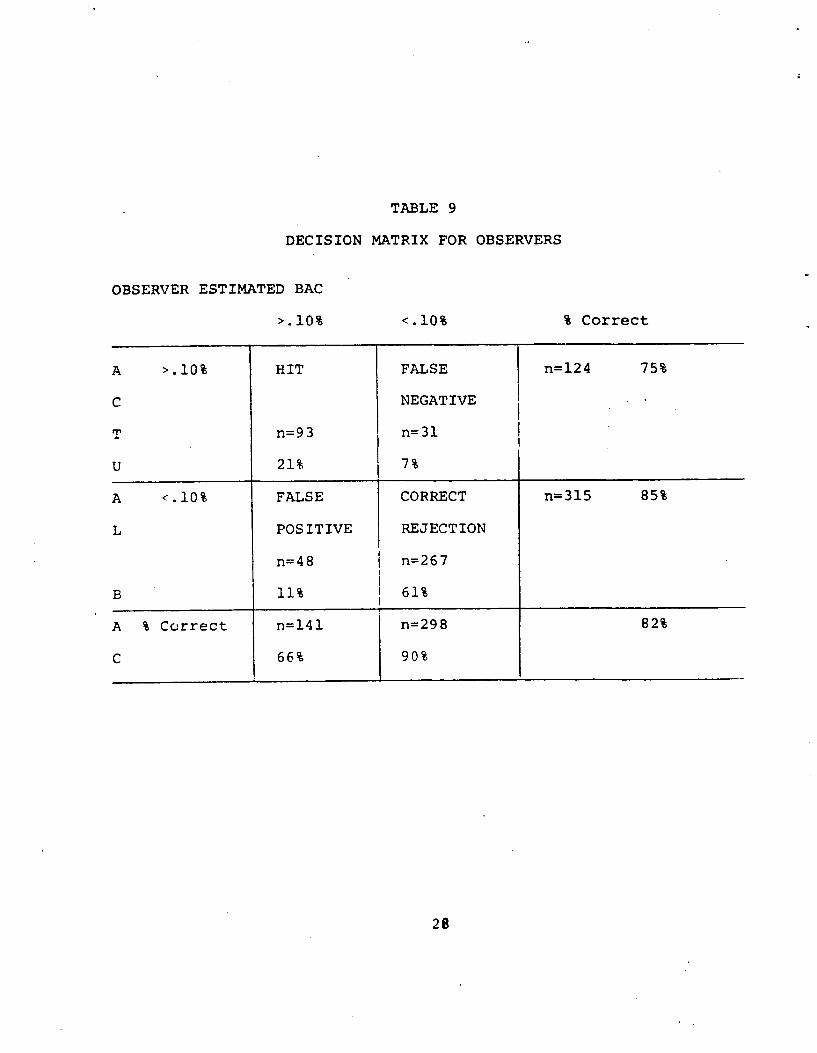
TABLE 9
DECISION MATRIX FOR OBSERVERS
OBSERVER ESTIMATED BAC
>.10%
A >.10% HIT
C
T n=93
U 21%
A <.10% FALSE
L POSITIVE
n=48
B 11%
A % Correct n=141
C 66%
<.10%
FALSE
NEGATIVE
n=31
7%
CORRECT
REJECTION
n=267
61%
n=298
90%
`k Correct
n=124 75%
n=315 85%
82%
28
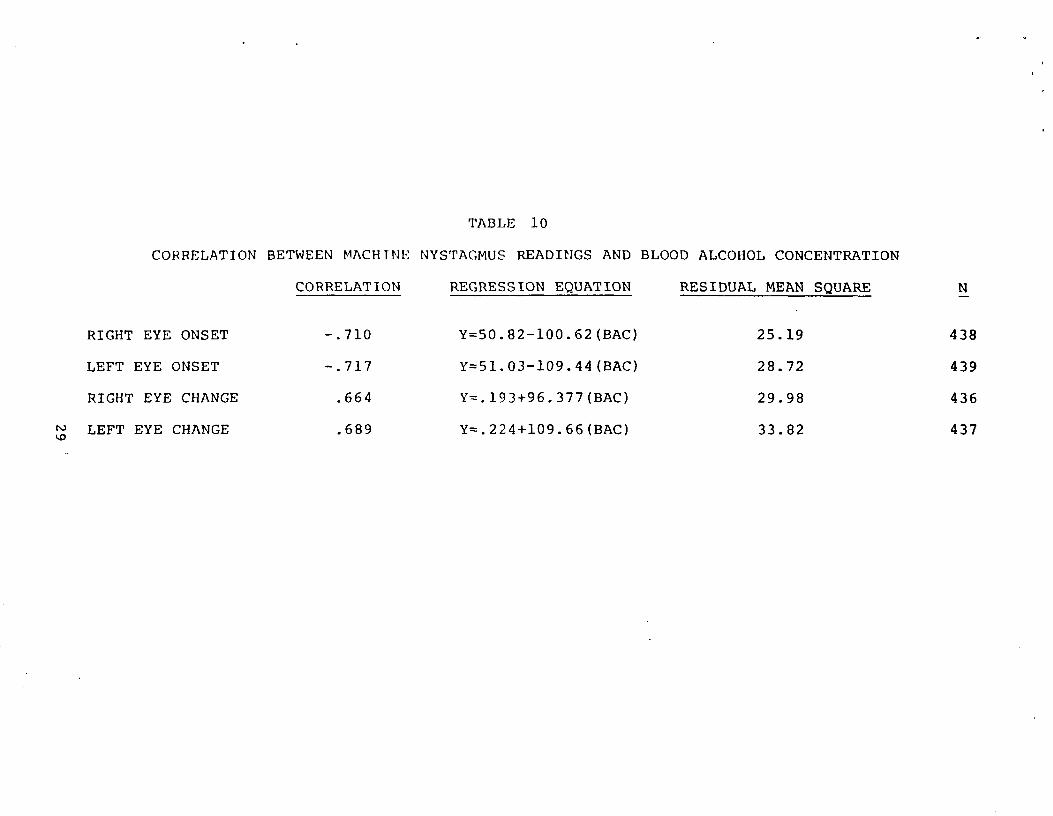
TABLE 10
CORRELATION BETWEEN PIACHTNE NYSTAGMUS READINGS AND BLOOD ALCOHOL CONCENTRATION
CORRELATION REGRESSION EQUATION RESIDUAL MEAN SQUARE N
RIGHT EYE ONSET
LEFT EYE ONSET
RIGHT EYE CHANGE
t1i LEFT EYE CHANGE
-.710
-.717
.664
.689
Y=50.82-100.62(BAC)
Y=51.03-109.44(BAC)
Y=.193+96.377(BAC)
Y=.224+109.66(BAC)
25.19
28.72
29.98
33.82
438
439
436
437
more, etc?), then 78% of the participants can be correctly classified with respect to a BAC of 0.10%. When the machine angle of onset is entered into a discriminant analysis, 88.2% of the participants could be correctly classified with respect to a BAC of 0.10%. Clearly, nystagmus angle of onset is an excellent tool for predicting the BAC when it is measured with sufficient precision.
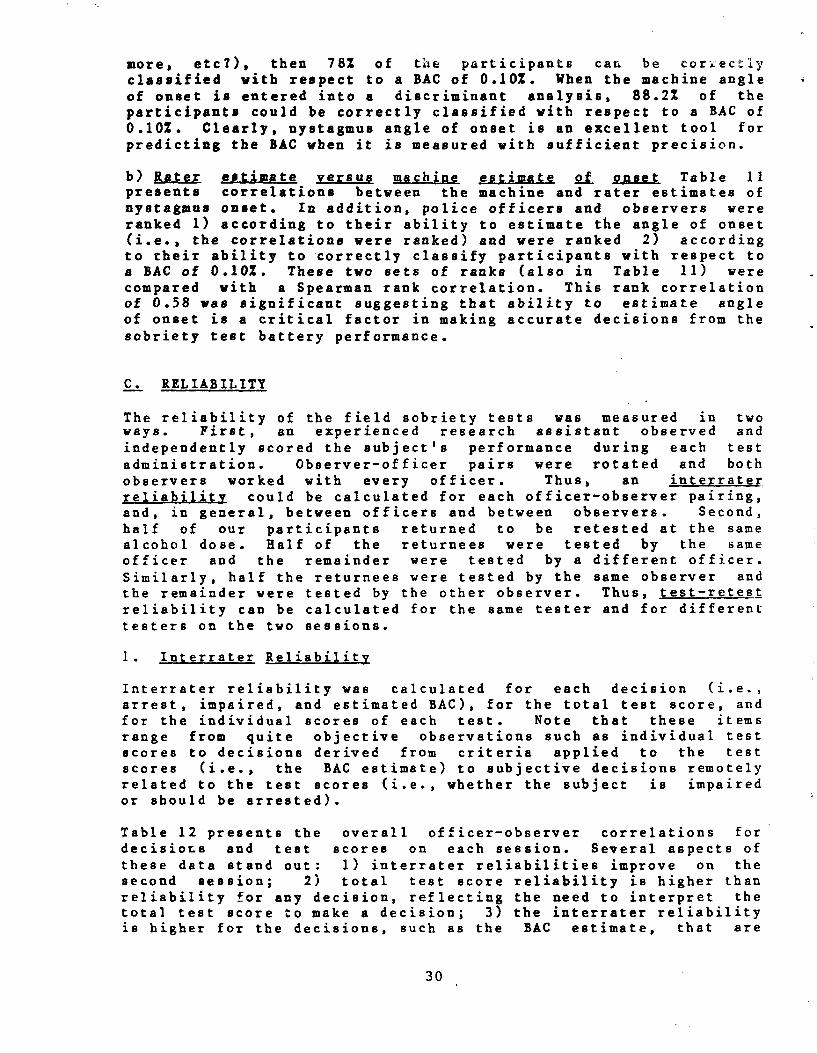
b) Rater estimate versus machine estimate of onset Table 11 presents correlations between the machine and rater estimates of nystagmus onset. In addition, police officers and observers were ranked 1) according to their ability to estimate the angle of onset (i.e., the correlations were ranked) and were ranked 2) according to their ability to-correctly classify participants with respect to a BAC of 0.10%. These two sets of ranks (also in Table 11) were compared with a Spearman rank correlation. This rank correlation of 0.58 was significant suggesting that ability to estimate angle of onset is a critical factor in making accurate decisions from the sobriety test battery performance.
C. RELIABILITY
The reliability of the field sobriety tests was measured in two ways. First, an experienced research assistant observed and independently scored the subject's performance during each test administration. Observer-officer pairs were rotated and both observers worked with every officer. Thus, an interrater reliability could be calculated for each officer-observer pairing, and, in general, between officers and between observers. Second, half of our participants returned to be retested at the same alcohol dose. Half of the returnees were tested by the same officer and the remainder were tested by a different officer. Similarly, half the returnees were tested by the same observer and the remainder were tested by the other observer. Thus, test-retest reliability can be calculated for the same tester and for different testers on the two sessions.
1. Interrater Reliability
Interrater reliability was calculated for each decision (i.e., arrest, impaired, and estimated BAC), for the total test score, and for the individual scores of each test. Note that these items range from quite objective observations such as individual test scores to decisions derived from criteria applied to the test scores (i.e., the BAC estimate) to subjective decisions remotely related to the test scores (i.e., whether the subject is impaired or should be arrested).
Table 12 presents the overall officer-observer correlations for decisions and test scores on each session. Several aspects of these data stand out: 1) interrater reliabilities improve on the second session; 2) total test score reliability is higher than reliability for any decision, reflecting the need to interpret the total test score to make a decision; 3) the interrater reliability is higher for the decisions, such as the BAC estimate, that are
30
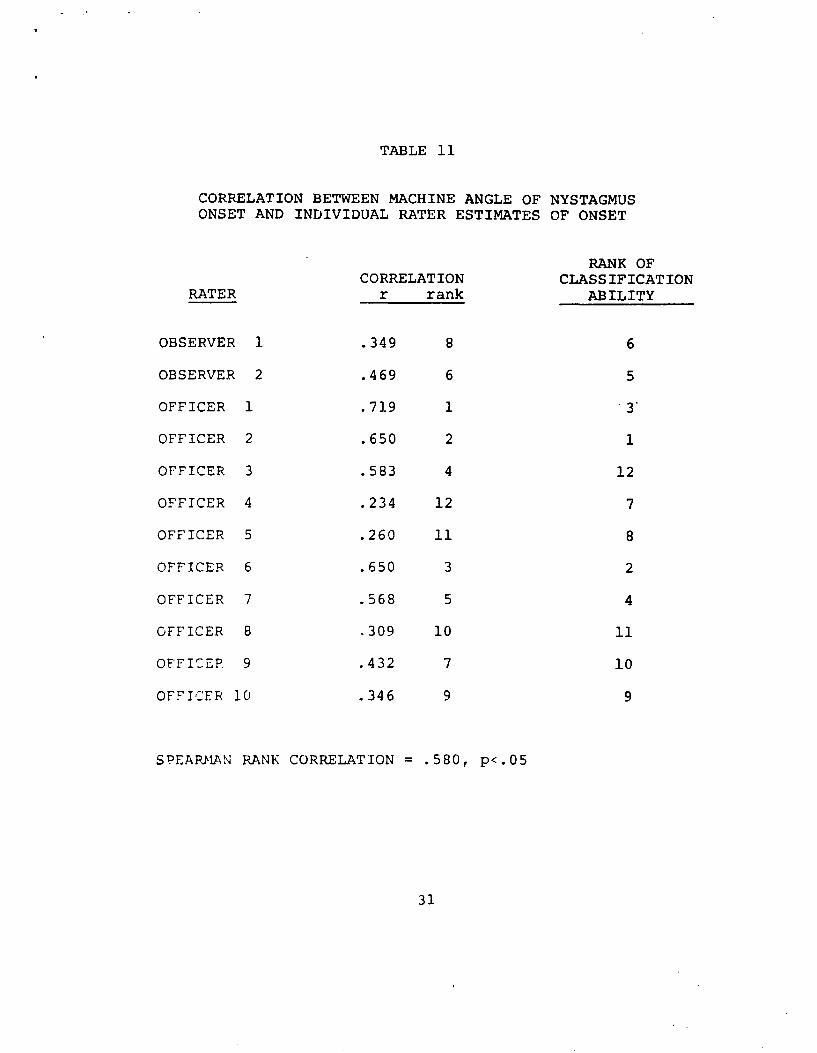
TABLE 11
CORRELATION BETWEEN MACHINE ANGLE OF NYSTAGMUSONSET AND INDIVIDUAL RATER ESTIMATES OF ONSET
RANK OF CORRELATION CLASSIFICATION
RATER r rank ABILITY
OBSERVER 1 .349 8 6
OBSERVER 2 .469 6 5
OFFICER 1 .719 1 3'
OFFICER 2 .650 2 1
OFFICER 3 .583 4 12
OFFICER 4 .234 12 7
OFFICER 5 .260 11 8
OFFICER 6 .650 3 2
OFFICER 7 .568 5 4
OFFICER 8 .309 10 11
OFFICER 9 .432 7 10
OFFICER 10 .346 9 9
SPEARMAN RANK CORRELATION = .580, p<.05
31
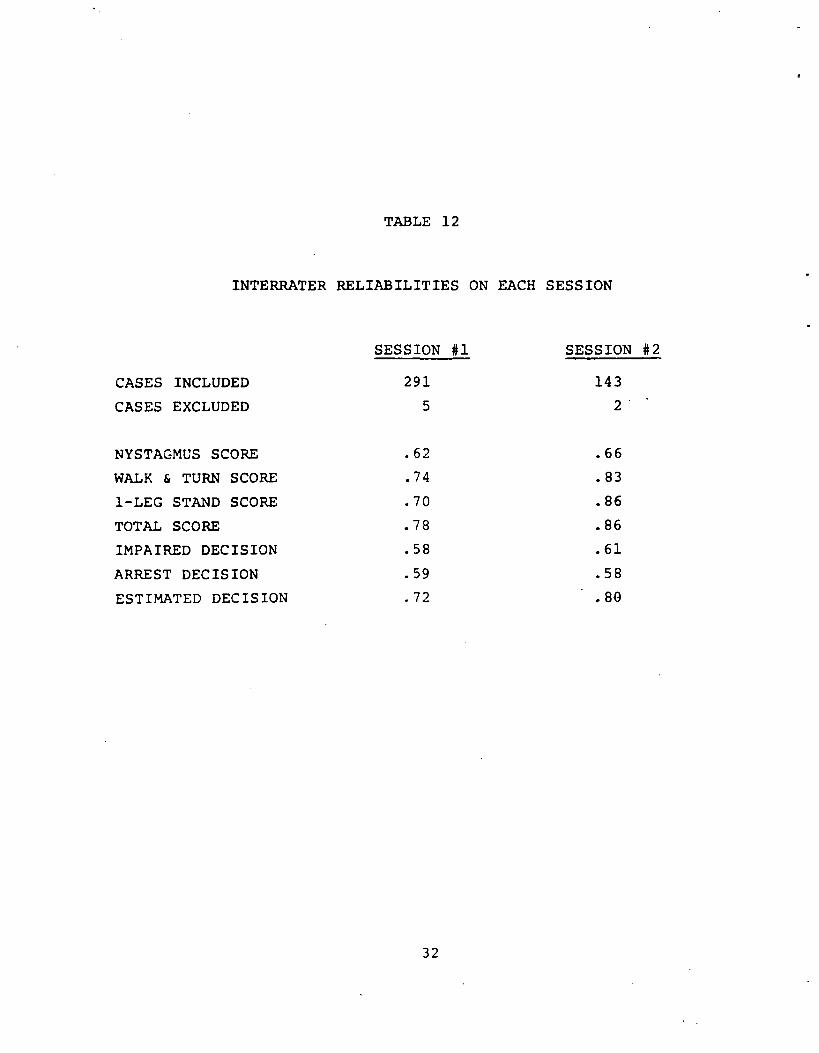
TABLE 12
INTERRATER RELIABILITIES ON EACH SESSION
CASES INCLUDED
CASES EXCLUDED
NYSTAGMUS SCORE
WALK & TURN SCORE
1-LEG STAND SCORE
TOTAL SCORE
IMPAIRED DECISION
ARREST DECISION
ESTIMATED DECISION
SESSION #1 SESSION #2
291 143
5 2
.62 .66
.74 .83
.70 .86
.78 .86
.58 .61
.59 .58
.72 .80
32
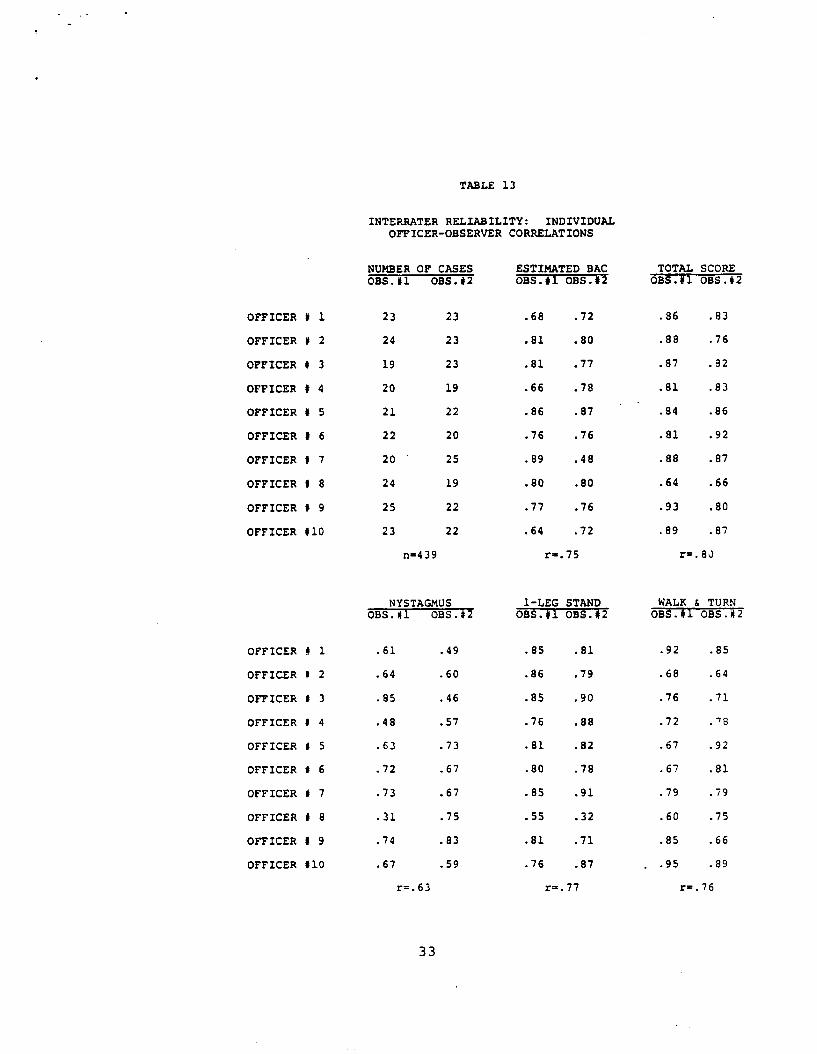
TABLE 13
INTERRATER RELIABILITY: INDIVIDUALOFFICER-OBSERVER CORRELATIONS
NUMBER OF CASES ESTIMATED BAC TOTAL SCORE OBS.#1 OBS.#2 OSS. OBS.#2 OBS.Y oI BS.#2
OFFICER # 1 23 23 .68 .72 .86 .83
OFFICER # 2 24 23 .81 .80 .88 .76
OFFICER # 3 19 23 .81 .77 .87 .32
OFFICER # 4 20 19 .66 .78 .81 .83
OFFICER # 5 21 22 .86 .87 .84 .86
OFFICER # 6 22 20 .76 .76 .81 .92
OFFICER # 7 20 25 .89 .48 .88 .87
OFFICER # 8 24 19 .80 .80 .64 .66
OFFICER # 9 25 22 .77 .76 .93 .80
OFFICER #10 23 22 .64 .72 .89 .87
n-439 r-.75 r=.8J
NYSTAGMUS 1-LEG STAND WALK & TURN OBS.# OBS.# OBS.1 OBS.# OBS. OBS.#2
OFFICER # 1 .61 .49 .85 .81 .92 .85
OFFICER # 2 .64 .60 .86 .79 .68 .64
OFFICER 0 3 .85 .46 .85 .90 .76 .71
OFFICER # 4 .48 .57 .76 .88 .72 .78
OFFICER 8 5 .63 .73 .81 .82 .67 .92
OFFICER 1 6 .72 .67 .80 .78 .67 .81
OFFICER 0 7 .73 .67 .85 .91 .79 .79
OFFICER # 8 .31 .75 .55 .32 .60 .75
OFFICER # 9 .74 .83 .81 .71 .85 .66
OFFICER #10 .67 .59 .76 .87 . .95 .89
r=.63 r=.77 r=. 76
33
most directly related to objective criteria such as the LAC estimate; and 4) the interrater reliability for the nystagmus score is not as high as expected, suggesting that the officers would profit from further training and practice with nystagmus.
The interrater reliabilities are clearly related to the extent to which the item is objective or objectively based. For example, test scores, which are behavioral ratings, reflect 1) the participant's performance; 2) the rater's understanding of the behavior being rated (i.e., how well the rater understands what constitutes "putting one's foot down"); and 3) the rater's ability and motivation to record what happens. Decision scores, on the other hand, are based upon the test scores plus a subjective interpretation of the test scores in terms of some criteria. Thus, the results are not surprising.
Poor observations on the part of several individuals could lower the overall within-session correlation between the officer and the observer. Thus, correlations were computed for each officer-observer pairing for the individual test scores and for the BAC estimate. These correlations are presented in Table 13. Overall, these data are quite encouraging. For the estimated BAC, 802 of the Pearson correlations are above 0.7 with only one below0.6. For the total test scores, 85% of the correlations are above 0.8 and all of them are above 0.6.
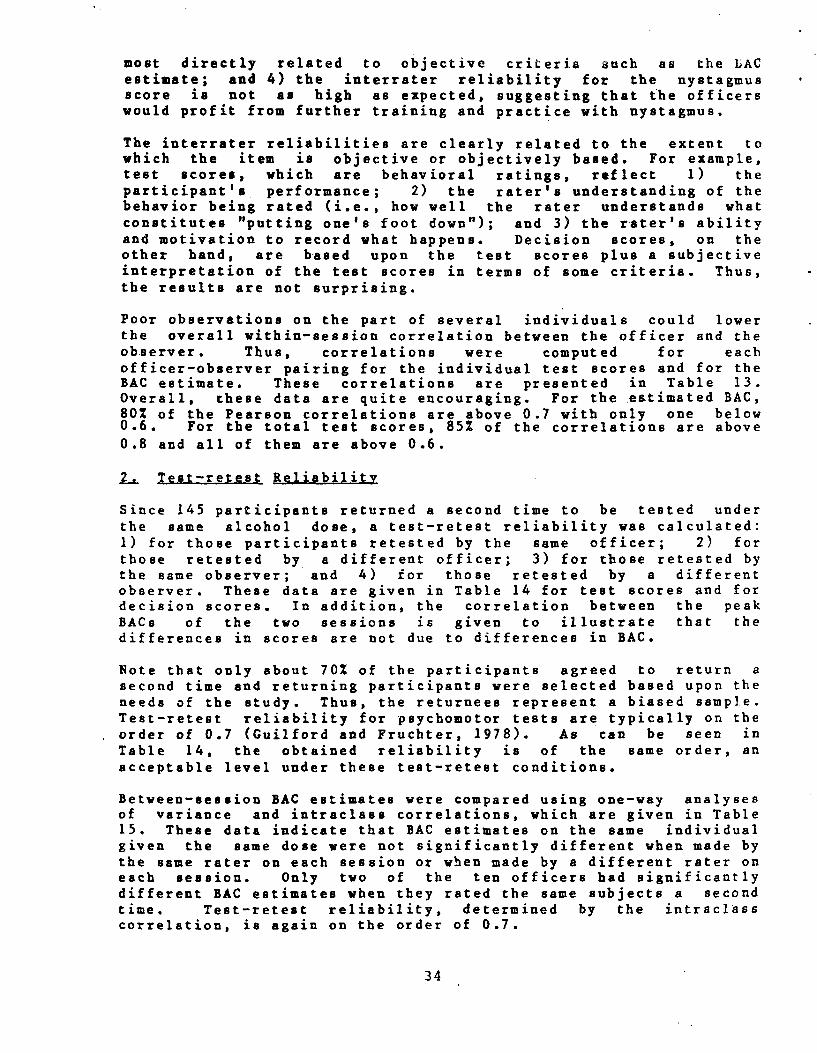
2. Test-retest Reliability
Since 145 participants returned a second time to be tested under the same alcohol dose, a test-retest reliability was calculated: 1) for those participants retested by the same officer; 2) for those retested by a different officer; 3) for those retested by the same observer; and 4) for those retested by a different observer. These data are given in Table 14 for test scores and for decision scores. In addition, the correlation between the peak BACs of the two sessions is given to illustrate that the differences in scores are not due to differences in BAC.
Note that only about 70% of the participants agreed to return a second time and returning participants were selected based upon the needs of the study. Thus, the returnees represent a biased sample. Test-retest reliability for psychomotor tests are typically on the order of 0.7 (Guilford and Fruchter, 1978). As can be seen in Table 14, the obtained reliability is of the same order, an acceptable level under these test-retest conditions.
Between-session BAC estimates were compared using one-way analyses of variance and intraclass correlations, which are given in Table 15. These data indicate that BAC estimates on the same individual given the same dose were not significantly different when made by the same rater on each session or when made by a different rater on each session. Only two of the ten officers had significantly different BAC estimates when they rated the same subjects a second time. Test-retest reliability, determined by the intraclass correlation, is again on the order of 0.7.
34
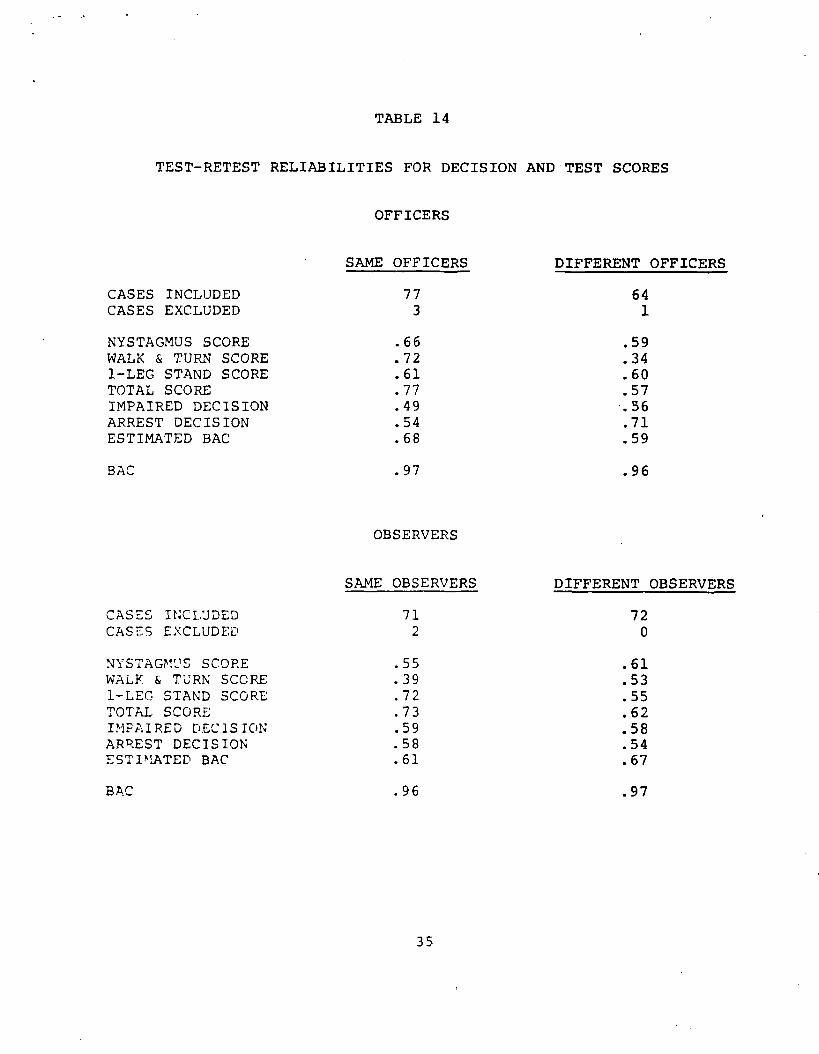
TABLE 14
TEST-RETEST RELIABILITIES FOR DECISION AND TEST SCORES
CASES INCLUDED CASES EXCLUDED
NYSTAGMUS SCORE WALK & TURN SCORE 1-LEG STAND SCORE TOTAL SCORE IMPAIRED DECISION ARREST DECISION ESTIMATED BAC
BAC
CASES INCLUDED CASES EXCLUDED
NYSTAGMUS SCORE WALK & TURN SCORE 1-LEG STAND SCORE TOTAL SCORE IMPAIRED DECISION ARREST DECISION ES T IM:ATED BAC
BAC
OFFICERS
SAME OFFICERS
773
.66
.72
.61
.77
.49
.54
.68
.97
OBSERVERS
SAME OBSERVERS
712
.55
.39
.72
.73
.59
.58
.61
.96
DIFFERENT OFFICERS
641
.59
.34
.60
.57
.56
.71
.59
.96
DIFFERENT OBSERVERS
720
.61
.53
.55
.62
.58
.54
.67
.97
35
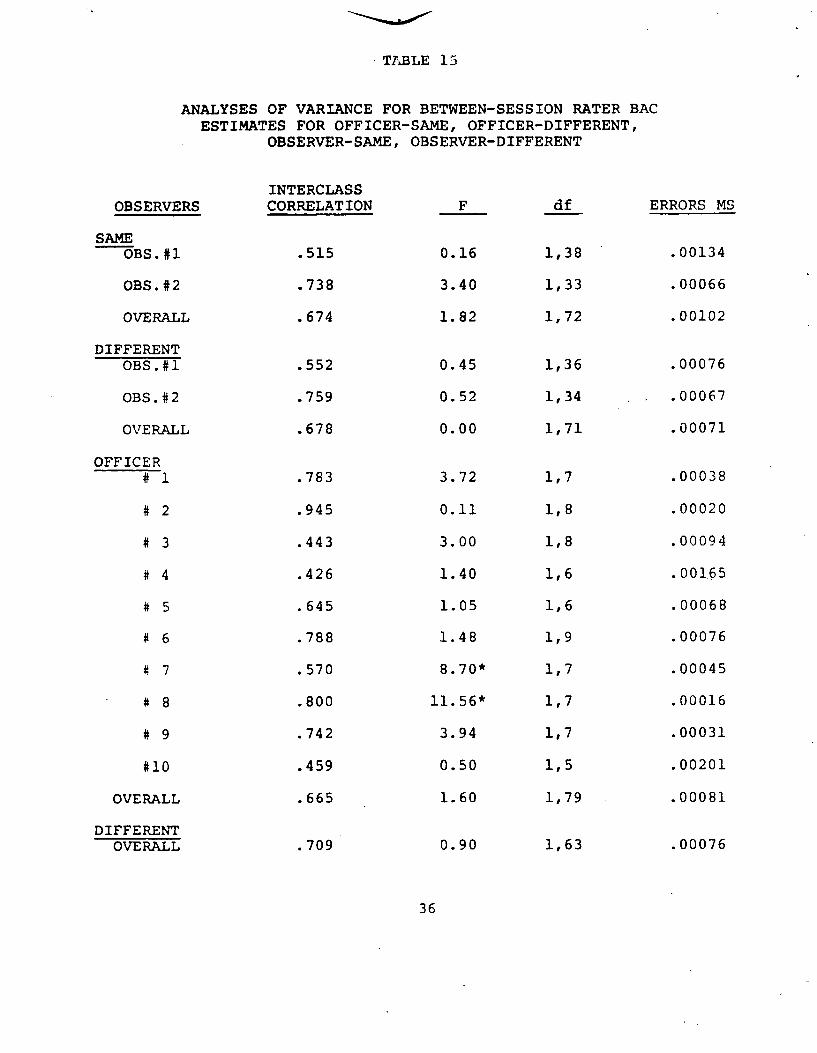
TABLE 15
ANALYSES OF VARIANCE FOR BETWEEN-SESSION RATER BAC ESTIMATES FOR OFFICER-SAME, OFFICER-DIFFERENT,
OBSERVER-SAME, OBSERVER-DIFFERENT
INTERCLASS CORRELATION
.515
.738
.674
.552
.759
.678
.783
.945
.443
.426
.645
.788
.570
.800
.742
.459
.665
.709
OBSERVERS
SAME OBS.#1
OBS. #2
OVERALL
DIFFERENT OBS.#1
OBS.#2
OVERALL
OFFICER # 1
# 2
# 3
# 4
# 5
# 6
# 7
# 8
# 9
#10
OVERALL
DIFFERENT OVERALL
F
0.16
3.40
1.82
0.45
0.52
0.00
3.72
0.11
3.00
1.40
1.05
1.48
8.70*
11.56*
3.94
0.50
1.60
0.90
df
1,38
1,33
1,72
1,36
1,34
1,71
1,7
1,8
1,8
1,6
1,6
1,9
1,7
1,7
1,7
1,5
1,79
1,63
ERRORS MS
.00134
.00066
.00102
.00076
.00067
.00071
.00038
.00020
.00094
.001.65
.00068
.00076
.00045
.00016
.00031
.00201
.00081
.00076
36
CHAPTER III: FIELD EVALUATION PROCEDURES
The primary question addressed by the field evaluation was whether police officers, by using the sobriety test battery, can improve their arrest/release decisions at roadside. Three types of data were collected to answer this question. First, feasibility data were collected by talking to police officers and their superiors about the test battery, observing the test battery being administered and scored in the field, and talking to police officers about their court experiences. Second, participating officers were asked to complete data forms on every traffic stop they made during the three month study. Third, SCRI staff members rode with each participating officer at least three times during the study. Breath samples were obtained from released stopees during the ridealongs.
A. POLICE AGENCY
Four of the 17 stations of the Los Angeles County Sheriff's Department were selected for participation in the study. The four stations were selected by the traffic division of the Sheriff's Department. We were told that the primary selection criteria were: (1) a cooperative administration within the station; and (2) the availability of traffic cars to be assigned to the project.
The Sheriff's Department services unincorporated areas of Los Angeles County and cities within the county that contract with them for police services. Traffic work is only done in contract cities that request it. The California Highway Patrol provides traffic services to unincorporated county areas.
The Sheriff's Department has been providing traffic services in this manner since 1956. Due to the major emphasis of the agency on crime and the relatively short amount of time that traffic services have been provided, traffic duty is not highly regarded by most of the deputies. One deputy said that the general attitude is that "the only thing lower than a traffic cop is a meter maid." Thus, we were not surprised that most of the better traffic deputies that we rode with talked about leaving police work as soon as they found something better to do. We believe that the deputies participating in the study probably still are quite representative of the average traffic officer in the United States, based upon our experiences working with police officers nationally.
The traffic sergeants we worked with were highly dedicated men who are concerned about the DWI problem and about traffic enforcement in general. In addition, the Los Angeles County Sheriff's Department was the California state agency involved in the ASAP program, which may have contributed to their eagerness to participate in this program.
The four stations assigned to help SCRI with the field evaluation represented different sections of the Los Angeles Metropolitan
37
Area.
li Station A. Station A serviced an upper middle class city of 42,000. The population is about 95% Caucasian and about 5% Hispanic. Although the city is surrounded by Metropolitan Los Angeles, it is quite like a rural mid-America city. The traffic lights start to flash red at 10 p.m. and few cars can be seen except on one of the state highways which runs through the city. Much of the drinking and driving found in the city results from intoxicated people driving away from a nearby racetrack. A secondary problem results from teenage parties in which as many as several hundred teenagers flock to a house where a drinking (drug?) party is being held. The police usually break up these parties, making few or no arrests, although we estimate that a majority of the drivers leaving these parties are legally intoxicated.
Five traffic officers from Station A participated in the field evaluation. Three deputies worked shifts from 2 p.m. to 10 p.m. or from 3 p.m. to 11 p.m. The remaining two deputies worked 11 p.m. to 7 a.m. shifts.
2. Station B. We worked with three traffic deputies from Station B patrolling a working class city of approximately 29,000. The population is about 75% Caucasian with the other 25% being composed of various minority groups. A lot of young people, who would like to live near the beach but cannot afford beach rentals, live in this city. Drinking and driving is a common problem in this section of Los Angeles.
The traffic sergeant at this station is very dedicated to keeping statistics on traffic accidents and tickets written. He has convinced his deputies that the more tickets they write the fewer accidents the city will have. Three traffic deputies working this city participated in the field evaluation. They work shifts of 2 P.M. to 10 p.m., 3 p.m. to 11 p.m., and 4 p.m. to midnight.
3. Station C Station C services a heavy industrial community of about 100,000 people. Its population is 402 middle class white, 40% middle class black, and 20% other minorities. Deputies estimate that the city has well over 100 bars.
Six traffic deputies participated in the program, excluding one of the original seven who was eliminated for lack of cooperation. Each of the deputies worked p.m. shifts, ranging from 2 p.m. to 10 p.m. and 6 p.m. to 2 a.m. Station C has a well organized and cooperative traffic administration.
4. Station This station services several contract cities and five traffic cars from the entire area participated in the program at the beginning. Two cars regularly worked 11 p.m. to 7 a.m. shifts and specialized in arresting intoxicated drivers. The other
38

three officers were from crime .units, but were reassigned to traffic care to participate in the field evaluation. These three deputies had some interest in making drunk driving arrests, but no interest in making traffic stops. All of them, during ridealongs, expressed a desire to return to crime unit duty.
We received little cooperation from the traffic administration at this station, and that administration changed twice during the field evaluation. During the course of the study the evening shift deputies filled out very few forms. When we questioned them, they claimed the forms were "at home." By the time we discovered that these deputies actually were not filling out forms, the traffic administration had been changed. Thus, the three p.m. deputies were dropped from the study for noncooperation. In addition, one of the a.m. shift deputies stopped filling out forms as soon as he was trained on the test battery. As a result, only one deputy from this station completed the field evaluation. Ironically, while these problems were occurring, three deputies from Station C were disabled from two separate accidents involving intoxicated drivers.
B. STUDY DESIGN
The requirements of the field evaluation included: (1) obtaining sufficient baseline data against which the officers' performance following training could be compared; (2) having a control group
to account for such factors as the time of year (i.e., the Christmas Holidays) during which the study was undertaken; and (3) the need to train all the participating deputies as a reward to the participating stations for their cooperation. Thus, a three phase design, illustrated in Figure 5, was undertaken.
Phase I began between December 7th and 12th of 1979. The different starting dates were due to the fact that staff members could only visit one station at a time for startup instructions. In addition, most stations had to be visited more than once because all deputies involved usually were not present at the first visit. During Phase I baseline information was collected by all deputies.
Phase II began between January 12th and 19th of 1980. Officers from Station A and Station D were trained on the test battery on
the weekend of January 12th. Officers from Station B were trained on the test battery on January 19th. One officer from Station A vent into the hospital for surgery on January 13th and did not return to duty until late January. Consequently, he was trained with the control group. Since four deputies from Station D were dropped from the study (see discussion above), a total of eight officers were trained at the beginning of Phase II and these constituted the experimental group. Seven officers (i.e., six from Station C plus the one from Station A) constituted the control group.
Phase III began on February 1st at which time all of the control group deputies were trained. The experimental group deputies continued filling out forms and using the test battery during Phase
39
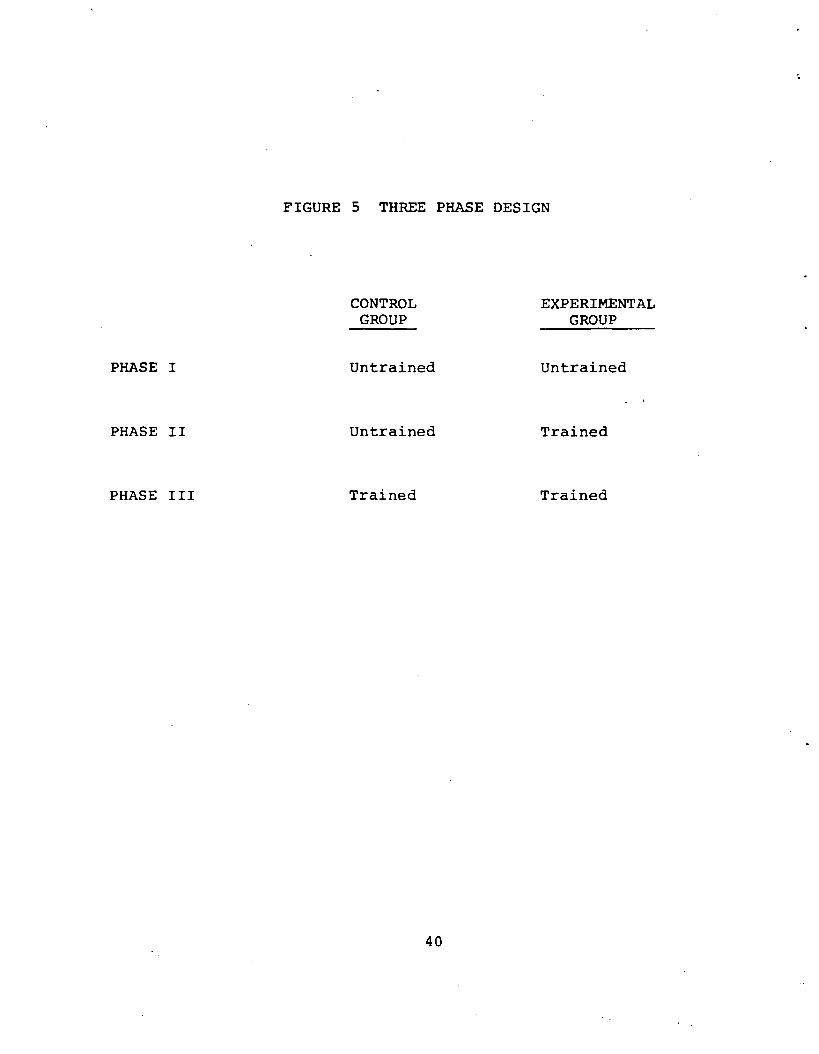
FIGURE 5 THREE PHASE DESIGN
PHASE I
CONTROL GROUP
Untrained
EXPERIMENTAL GROUP
Untrained
PHASE II Untrained Trained
PHASE III Trained Trained
40
II.I. Phase III ended on February 16th for the six Station C deputies, as a number of them were transferred to new assignments at this time. The remaining deputies continued to collect data until February 29th.
C. TRAINING PbLICE OFFICERS
The deputies were trained in small groups during half day sessions. Each deputy was given a training manual, similar to the one used in the laboratory evaluation. This training manual covered the history and purpose of a standardized field sobriety test; the meaning and importance of the nystagmus test; administrative procedures, including conditions under which the tests had to be administered to be considered valid; scoring procedures; and decision criteria.
The Project Director reviewed the reasons for a standardized test battery quite thoroughly so that the deputies would show as little resistance as possible to learning and using standardized scoring and administrative procedures. This review included the fact that: (1) If every officer scored and administered the test battery in the s$me yay theq every officer should get the same score for agiven intoxicated driver. As a result, the test battery scores would be more meaningful as court evidence and would also allow police departments to collect their own data and develop norms. (2) General acceptance of a given test score by the courts as indicative of impairment could also help officers in filing drug charges for low BAC cases, since the test scores would still show that the stopee was impaired.
The Project Director then reviewed the meaning and importance of the nystagmus test, covering various signs of intoxication that can be seen in the eyes. The officers were informed of theoretical speculations about the reason that nystagmus occurs under alcohol and the differences between Alcohol Gaze Nystagmus, which appears to be neural in origin, and Positional Alcohol Nystagmus, which is vestibular in origin. This information is given in the literature review in Appendix A of this report. In addition, the officers were informed of other potential causes of gaze nystagmus (e.g., drugs, brain damage, etc.).
The deputies were then informed of what to look for in the eyes in order to determine whether or not to arrest a stopee (see gaze nystagmus section, Chapter I). Half the deputies present then went to another room where they were informed of the importance of estimating the angle of onset of nystagmus and practiced estimating 35, 40, and 45 degrees using the device pictured in Figure 1. Officers working a.m. shifts were told to use 35 degrees as a criterion, while p.m. shift officers were told to use 45 degrees as a criterion. Officers were required to practice on each other until they could estimate all three angles on each other within three degrees on three consecutive occasions.
The other half of the deputies viewed a videotape in which subjects
41
1
performed the two balance tests. The deputies viewed the test administration and performance of three subjects at a time, scoring each performance as they saw it. The Project Director and the deputies then discussed the scoring until there was some agreement. The tape of the three cases was then replayed so that the deputies could see why it should be scored the way it was. Then, the videotape was played for the next three subjects in the same manner. This process was repeated until the end of the videotape. We found that the majority of the deputies had little problem with the scoring by the time the last section of the tape was played. Those with problems generally knew how to score a given subject, but disagreed on specific criteria.
The two groups of deputies reversed training when both sections had finished. That is, the first group of deputies viewed the videotape, and the second group of deputies practiced estimating angles with the nystagmus device.
At the end of the session, all the deputies were brought back to a central location for questions and summary statements. SCRI staff members then made every effort to ride with each newly trained officer to observe them administrating and scoring the 'test battery in the field. On-the-spot corrections were made at this time and all additional questions concerning administration and scoring were answered. Answers to questions which were not covered in the original training session were then incorporated into subsequent training sessions. Since a total of four training sessions were given during the field evaluation, very few questions remained by the time the fourth session was conducted.
D. DATA COLLECTION
Data Forms
During baseline data collection (i.e., Phase I for the experimental group and Phase I and II for the control group), officers filled out the data forms indicated in Table 16. For most stopees, officers were only asked to fill in basic information contained in the top half of the form. Thus, they might check that a stopee was a 25 year old, Black male, who was stopped at 2235 hours on a Wednesday for speeding on a residential city street. The rest of the form would be left blank unless the officer suspected that the stopee had been drinking or taking drugs, in which case he would make the appropriate check mark on the form. If behavioral tests were given, then the officer would indicate the nature of the tests and whether or not the stopee passed each test. If the stopee was arrested, then the type of chemical analysis was indicated, the BAC was recorded, and the officer checked% whether the suspect was released or booked.
If blood or urine was taken, then the fluid was sent to the Sheriff's Forensic Crime Laboratory for analysis. Often results would not be available for four to six weeks. Deputies were asked to put a file number (i.e., the police case number) on the form if
42
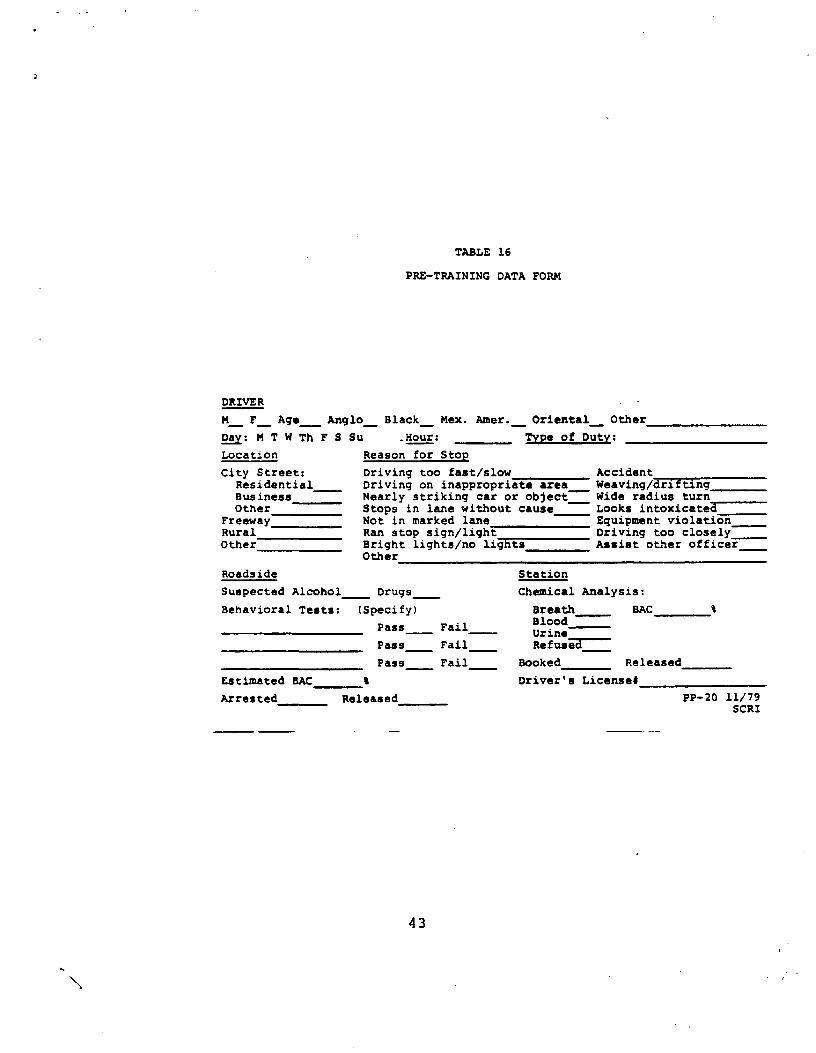
TABLE 16
PRE-TRAINING DATA FORM
DRIVER
M_ F_ Age_ Anglo_ Black_ Mex. Amer._ Oriental_ Other
±j: M T W Th F S Su Hour: Type of Duty:
Location Reason for Stop
City street: Driving too fast/slow Accident Residential Driving on inappropriate area Weaving/drifting Business Nearly striking car or object! Wide radius turn Other Stops in lane without cause Looks intoxicate3
Freeway Not in marked lane Equipment violation Rural Ran stop sign/light Driving too closely Other Bright lights/no lights Assist other officer
Other
Roadside Station
Suspected Alcohol - Drugs Chemical Analysis:
Behavioral Tests: (Specify) Breath BAC BloodPass Fail Urine
Pass Fail Refused-
Pass Fail Booked Released
Estimated BAC I Driver's License#
Arrested Released PP-20 11/79 SCRI
43
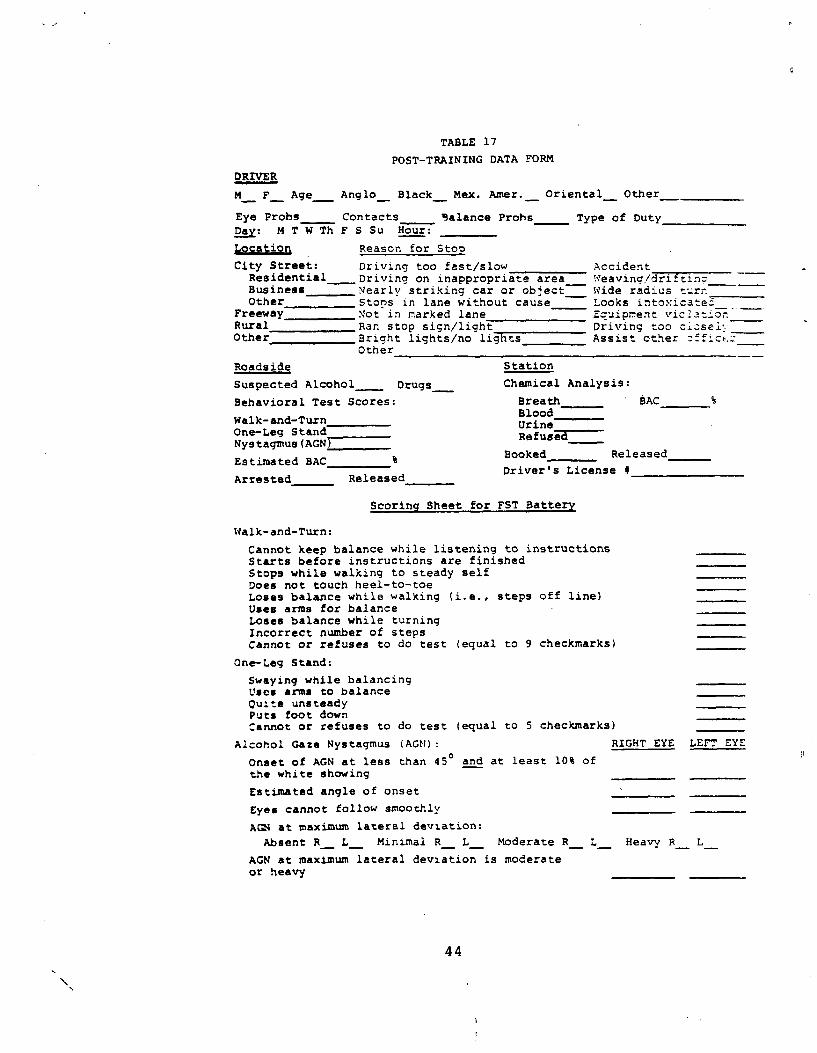
TABLE 17
POST-TRAINING DATA FORM
DRIVER
M_ F_ Age_ Anglo` Black_ Mex. Amer.- Oriental- Other_
Eye Probs Contacts 9alance Prohs Type of Duty Day: M T W Th F S Su Hour:
Location Reason for Stop
City Street: Driving too fast/slow Accident Residential Driving on inappropriate area W'eavinc/drifting Business Nearly striking car or object- Wide radius Other Stops in lane without cause Looks intoxicated _
Freeway Not in narked lane Ecuipr..ent viclat:or. Rural Ran stop sign/light Driving too ciosei-.Other Bright lights/no lights Assist other
Other
Roadside Station
Suspected Alcohol Drugs_ Chemical Analysis:
Behavioral Test Scores: Breath SAC Blood
Walk-and-Turn Urine One-Leg Stand Refuses Nystagmus(AGN)
Booked Released Estimated BAC %
Driver's License (1Arrested Released
Scoring Sheet for FST Battery
Walk-and-Turn:
Cannot keep balance while listening to instructions Starts before instructions are finished Stops while walking to steady self Does not touch heel-to-toe Loses balance while walking (i.e., steps off line) Uses arms for balance Loses balance while turning Incorrect number of steps Cannot or refuses to do test (equal to 9 checkmarks)
One-Leg Stand:
Swaying while balancing Uses arms to balance Quite unsteady Puts foot down Cannot or refuses to do test (equal to 5 checkmarks)
Alcohol Gaze Nystagmus (AGN): RIGHT EYE LEFT EYE
Onset of AGN at less than 45° and at least 10% of the white showing
Estimated angle of onset
eyes cannot follow smoothly
AGN at maximum lateral deviation:
Absent R, L_ Minimal R_ L_ Moderate R_ L-_ Heavy R_ L_
AGN at maximum lateral deviation is moderate or heavy
44
blood or urine was taken so we could obtain the results of the analysis. The data on several arrests during Phase I were not available to us because the deputies forgot to include this information. Probably more blood samples than normal were taken during the course of this study because the Sheriff's Department switched from using the Intoximeter to the Intoxilyzer at about the same time the' field evaluation began. Many deputies were unfamiliar with the operation of the Intoxilyzer.
After the deputies were trained in the sobriety test battery, they were asked to fill out the forms given in Table 17. This form is exactly like the previous form except that it includes a scoring sheet for the three test battery. Thus, when giving a field sobriety test, officers were asked to check the problems the stopee had with each test and record the number of checkmarks for each test and the total test score.
Officers were not required to identify themselves on the data forms before they had been trained on the test battery. Thus, an officer who frequently released drivers he or she suspects to be legally intoxicated would not be inhibited from indicating this on his/her data forms. After the officers were trained, however, we required them to initial their data forms so that we could determine if any of them were having difficulty scoring the sobriety tests. In addition, the officers' initials enabled us to identify each officer's pre-training data forms. Only one officer seemed inhibited by the need to identify himself, and tended to fill out more forms after we requested that the forms be initialed.
One problem that arose in filling out both data forms was that most deputies waited until the end of their shift to fill out their forms. At this point in time all forms were completed at once from their police logs. We urged the deputies to fill out the forms immediately, but our urgings did not help as most of them continued to fill out the forms at the end of the shift. We then stressed the importance of filling out forms for suspects given sobriety tests, so that the tests would be properly scored. We doubt that most officers complied with this request except when observers were in the car.
2. Ridealon& Data
Two staff members from SCRI rode with the participating deputies throughout the field evaluation. The two staff members included the Project Director and one of the observers from the laboratory evaluation. One staff member rode with each deputy one or two times during every phase of the field evaluation.
One purpose of the ridealongs was to obtain feasibility data on the sobriety test battery, including the deputies' attitudes about arresting intoxicated drivers, their ability to administer and score the test battery at roadside, and the reaction of the stopees to the test battery. Some of the deputies were a little nervous about having an observer with them at first. But they were told to do everything they normally did and pretend that we were not in the
45
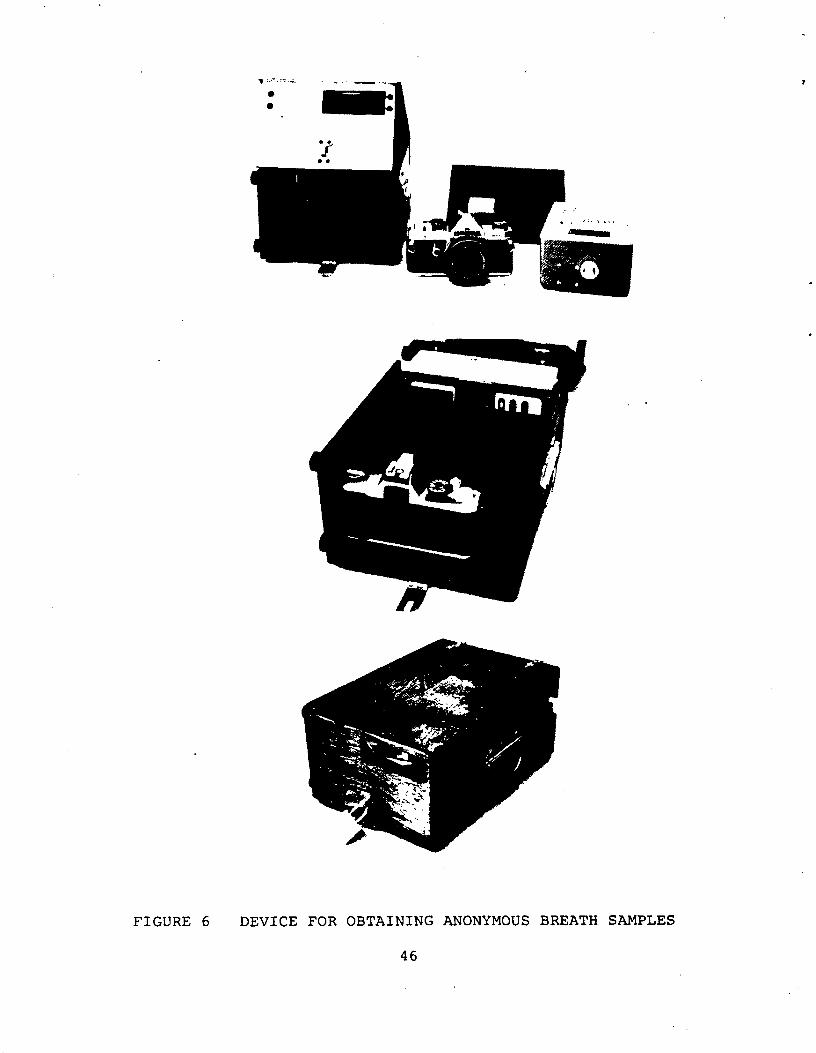
FIGURE 6 DEVICE FOR OBTAINING ANONYMOUS BREATH SAMPLES
46
*
*
*
*
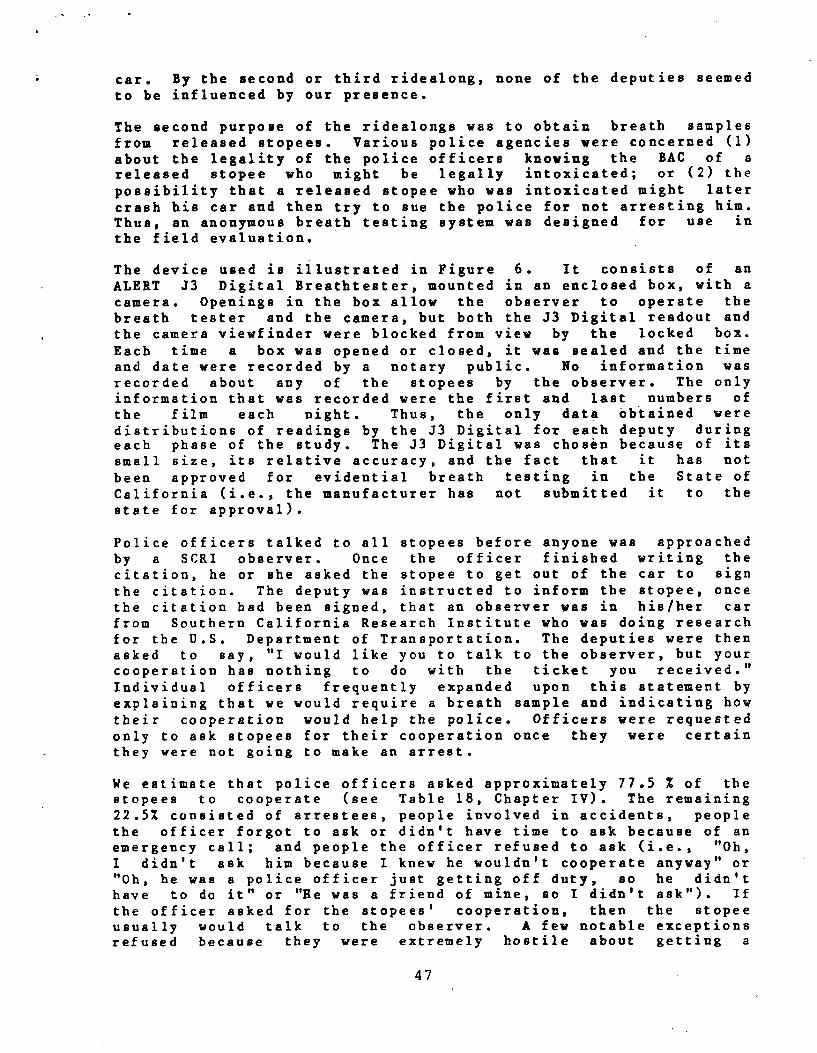
car. By the second or third ridealong, none of the deputies seemed to be influenced by our presence.
The second purpose of the ridealongs was to obtain breath samples from released stopees. Various police agencies were concerned (1) about the legality of the police officers knowing the BAC of a released stopee who might be legally intoxicated; or (2) the possibility that a released stopee who was intoxicated might later crash his car and then try to sue the police for not arresting him. Thus, an anonymous breath testing system was designed for use in the field evaluation.
The device used is illustrated in Figure 6. It consists of an ALERT J3 Digital Breathtester, mounted in an enclosed box, with a camera. Openings in the box allow the observer to operate the breath tester and the camera, but both the J3 Digital readout and the camera viewfinder were blocked from view by the locked box. Each time a box was opened or closed, it was sealed and the time and date were recorded by a notary public. No information was recorded about any of the stopees by the observer. The only information that was recorded were the first and last numbers of the film each night. Thus, the only data obtained were distributions of readings by the J3 Digital for each deputy during each phase of the study. The J3 Digital was chosen because of its small size, its relative accuracy, and the fact that it has not been approved for evidential breath testing in the State of California (i.e., the manufacturer has not submitted it to the state for approval).
Police officers talked to all stopees before anyone was approached by a SCRI observer. Once the officer finished writing the citation, he or she asked the stopee to get out of the car to sign
the citation. The deputy was instructed to inform the stopee, once the citation had been signed, that an observer was in his/her car from Southern California Research Institute who was doing research for the D.S. Department of Transportation. The deputies were then asked to say, "I would like you to talk to the observer, but your cooperation has nothing to do with the ticket you received."
Individual officers frequently expanded upon this statement by explaining that we would require a breath sample and indicating how
their cooperation would help the police. Officers were requested only to ask stopees for their cooperation once they were certain they were not going to make an arrest.
We estimate that police officers asked approximately 77.5 % of the stopees to cooperate (see Table 18, Chapter IV). The remaining 22.5% consisted of arrestees, people involved in accidents, people the officer forgot to ask or didn't have time to ask because of an emergency call; and people the officer refused to ask (i.e., "Oh,
didn't ask him because I knew he wouldn't cooperate anyway" or "Oh, he was a police officer just getting off duty, so he didn't have to do it" or "He was a friend of mine, so I didn't ask"). If the officer asked for the atopees' cooperation, then the stopee usually would talk to the observer. A few notable exceptions refused because they were extremely hostile about getting a
47
I
citation.
The observer approached each stopee and made the following statement:
HELLO, I'M.._...FROM SOUTHERN.......CALIFORNIA RESEARCH INSTITUTE. WE ARE...DOING A RESEARCH PROJECT FOR THE U.S....DEPARTMENT OF TRANSPORTATION. AS PART...OF THIS RESEARCH, I AM ASKING EVERYONE..STOPPED BY THIS OFFICER TONIGHT TO BLOW.INTO THE MOUTHPIECE OF THIS BOX. AS YOU.CAN SEE, THE BOX IS LOCKED AND SEALED...SO THAT IF YOU HAVE BEEN DRINKING WE....WON'T KNOW ABOUT IT UNTIL THE FILM IN...THE CAMERA IS DEVELOPED IN A WEEK OR TWOEVEN AFTER THE FILM IS DEVELOPED, WE....WON'T HAVE ANY WAY TO ASSOCIATE THE.....READING OBTAINED WITH YOU ...............
At this point, the device was held up with the mouthpiece in the direction of the stopee. Often we would have to answer additional questions, such as:
o...Is the mouthpiece clean?
ANSWER: YES, WE PUT A NEW MOUTHPIECE ON FOR EVERY PERSON.
o...Why are you doing this research?
ANSWER: TO OBTAIN A DISTRIBUTION OF ALCOHOL READINGS ON PEOPLE STOPPED TONIGHT THAT THE OFFICER HAS DECIDED NOT TO ARREST.
o...How does this thing work? (meaning the anonymous breath test system)..
ANSWER: YOU BLOW INTO THIS MOUTHPIECE WHICH OPERATES A PORTABLE ,,BREATH TESTER LOCATED HERE. AFTER ABOUT FOUR SECONDS, THIS LIGHT WILL GO OFF AND THE MACHINE WILL INDICATE HOW MUCH ALCOHOL IT READS. THE READING APPEARS DOWN HERE SO NEITHER YOU NOR I CAN SEE IT. HOWEVER, THIS CAMERA IS POINTED TOWARD THE READING, SO I WILL JUST TAKE A PICTURE OF IT. ONCE THE FILM IS DEVELOPED, WE WILL KNOW WHAT THE READING IS, BUT WILL NO LONGER KNOW WHO YOU ARE.
o...I bad a couple of drinks tonight, how do I know you are telling we the truth and aren't going to have me arrested if the reading is above a particular level?
ANSWER: WE EXPLAINED AS MUCH AS POSSIBLE ABOUT THE ANONYMITY OF THE SYSTEM AND EMPHASIZED THAT THE BOX WAS SEALED, SO THAT WE WOULD NOT BE ABLE TO OPEN IT UNTIL THE SEAL WAS BROKEN. IN ADDITION, WE INDICATED THAT THE BREATH TESTING DEVICE WAS NOT APPROVED BY THE
48
STATE, SO THAT THE READING COULD NOT BE USED IN COURT.
o...Wil1 you send me the results of this test?
ANSWER: NO, WE WILL NEVER BE ABLE TO ASSOCIATE ANY PARTICULAR READING WITH YOU.
Approximately 85% of the stopees who were asked agreed to provide us with a sample. Most of the refusals were people who were still very hostile about getting a citation, although approximately 5% of the refusals were people (usually female) who claimed it was too embarassiug to be seen giving a breath sample at roadside. In every case, whenever a suspect showed some hesitancy by admitting to drinking, we were able to convince them of their anonymity and obtain a breath sample. Occasionally, admitted drinkers would not blow hard enough to enable us to obtain a valid sample. After three bad samples we stopped requesting additional blows.
People ie.volved in traffic accidents were never asked to provide breath eamples. Thus, we avoided the possibility of having civil suits brought against us or having our data subpoenaed.
49
CHAPTER IV: EVALUATION OF THE FIELD STUDY
Fifteen police officers completed the field evaluation, filling out a total of 3128 forms during the three phase study. The fifteen officers worked 685.5 eight-hour shifts in total during the study. Thus, the officers averaged 4.56 data forms per shift during the three phase study (ranging from 0.47 to 9.02 forms per shift). We calculated the number of traffic stops per ridealong, defining a traffic stop as one for which a form should have been completed. The deputies, on the average, made 7.00 traffic stops per ridealong. This estimate may be slightly inflated, since some of the officers probably were making more stops than normal during the ridealongs. However, we estimate, using this conservative figure, that deputies filled out forms for approximately 65.1% of the stops for which they should have completed data forms. Four officers filled out forms at a rate of less than 40% of that which we projected from the ridealongs. Based upon discussions with the various traffic sergeants, we feel that our data are very incomplete for three of these deputies, but that the fourth deputy made more stops than normal during the ridealongs.
The deputies made 413 traffic stops during the 59 ridealongs. A breakdown of the data available from these stops is given in Table 18 for each group of officers during each phase of the evaluation.
In summary, 6.5% of the stopees were arrested during each of the ridealong sessions (as compared with 7.4% of the stopees for which
we have data forms). Another 6.8% of the stopees were involved in traffic accidents but not arrested; 9.2% were not asked by the officers to provide breath samples; 11.4% were asked to provide breath samples, but refused; and 66.1% of the stopees provided anonymous breath samples. Thus, we have BAC information on 72.6% of the stopees--those who were arrested and those who voluntarily provided samples. Among the released stopees who were asked to provide bzeatb samples, 85.3% agreed. The majority of the refusals said they would not cooperate because they were given a citation.
These data were analyzed with regard to three basic issues: (1)
What is the nature of the stopee population?; (2) Is the test battery effective?; and (3) Is large scale implementation of the test battery feasible?
A. THE NATURE OF THE STOPEE POPULATION
One of the objectives of the field study was to determine the nature of the stopee population. The police data forms were designed with this objective in mind in that information was requested on the age, sex, and race of each stopee. Data on the characteristics of the stopee population, derived from the 3128 forms completed by the officers, were tabulated. Given that the officers did not fill out forms on all of their stopees, the data
may be somewhat biased. For example, certain officers filled out many more forms than other officers, so their biases, if any, could be reflected in the data presented in this report. However, our estimates seem comparable to other estimates of the stopee population (e.g., Harris et al., 1980).
50
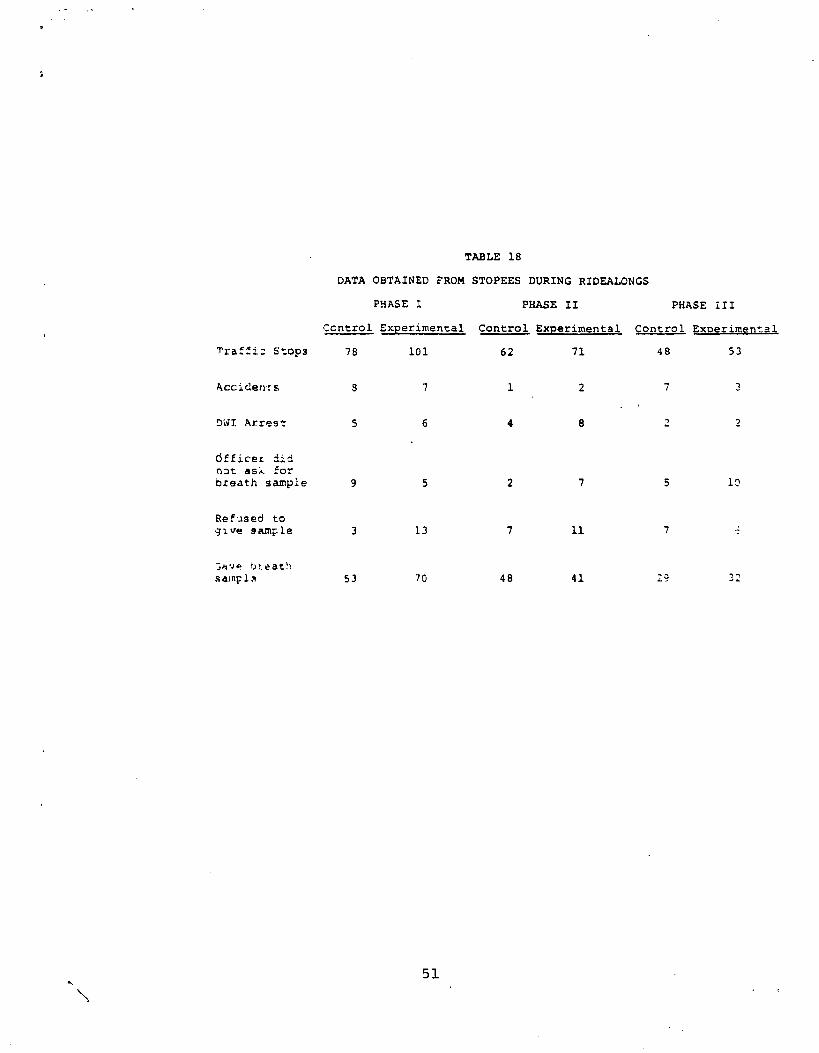
TABLE 18
DATA OBTAINED FROM STOPEES DURING RIDEALONGS
PHASE I PHASE II PHASE ill
Ccntrol Experimental Control Experimental Control Experimental
Traffic Stops 78 101 62 71 48 53
Accidents 9 7 1 2 7 3
DWI Arrest 5 6 4 8 2 2
dfficez did not ask for breath sample 9 5 2 7 5 10
Refused to give Sample 3 13 7 11 7
;avo ) eat: samp1^t 53 70 48 41 29 32
51
The age distributions of four population samples are given in Table 19. These samples include: (1) all of the stopees; (2) stopees suspected of consuming alcohol or drugs; (3) arrested stopees; and (4) people involved in accidents during the study.
The stopees as a whole tend to be younger than the people involved in accidents or the DWI arrestees. Those suspected of consuming alcohol fall between the stopees and arrestees in terms of age. However, for all four groups the mode fell into the 20-24 year old age group.
People over 65 represented only 1.5% of the stopees, and only one person in this age range was suspected of consuming alcohol prior to driving. People over 60 constituted 3.4% of the stopee population, but accounted for 7.6% of the accidents.
2. Sex
Table 19 also indicates the sex distribution of the same four categories of stopees. The 3128 stopees consisted af-2329 (74.5%) males and 799 (25.5%) females. Males in this data may be overrepresented since male officers (only one deputy was female) showed a slight tendency not to give females tickets, which would be reflected in the number of forms completed for females.
One female out of every 19.0 female stopees was suspected of consuming alcohol prior to driving, as compared with one male out of every 6.8 male stopees. Thus, those suspected of driving after drinking consisted of 342 males (89.1%) and 42 females (10.9%).
If a female was suspected of DWI, then her chances of being arrested were slightly less than that of a male suspected of DWI. Of the 42 females suspected of driving after drinking, 21 (50%) were arrested. Of the 342 males suspected of driving after drinking, 194 (56.7%) were arrested. The DWI arrestees were 90.2% male and 9.8% female.
The population of stopees involved in an accident was 82.7% male and 17.3% female. However, only 52 accidents were reported in our data forms.
3. Race
The data on the racial makeup of the stopees may be the most biased of all of the population data in the field study. The cities represented in the field evaluation tended to have minority sections. If a given deputy was assigned to a minority area, then most of his/her stopees would be minorities. Thus, the tendency for certain officers to fill out many more forms than others could highly influence these data.
Our sample of stopees consisted of 53.3% Caucasians, primarily because two of the three cities from which most of our data came
52
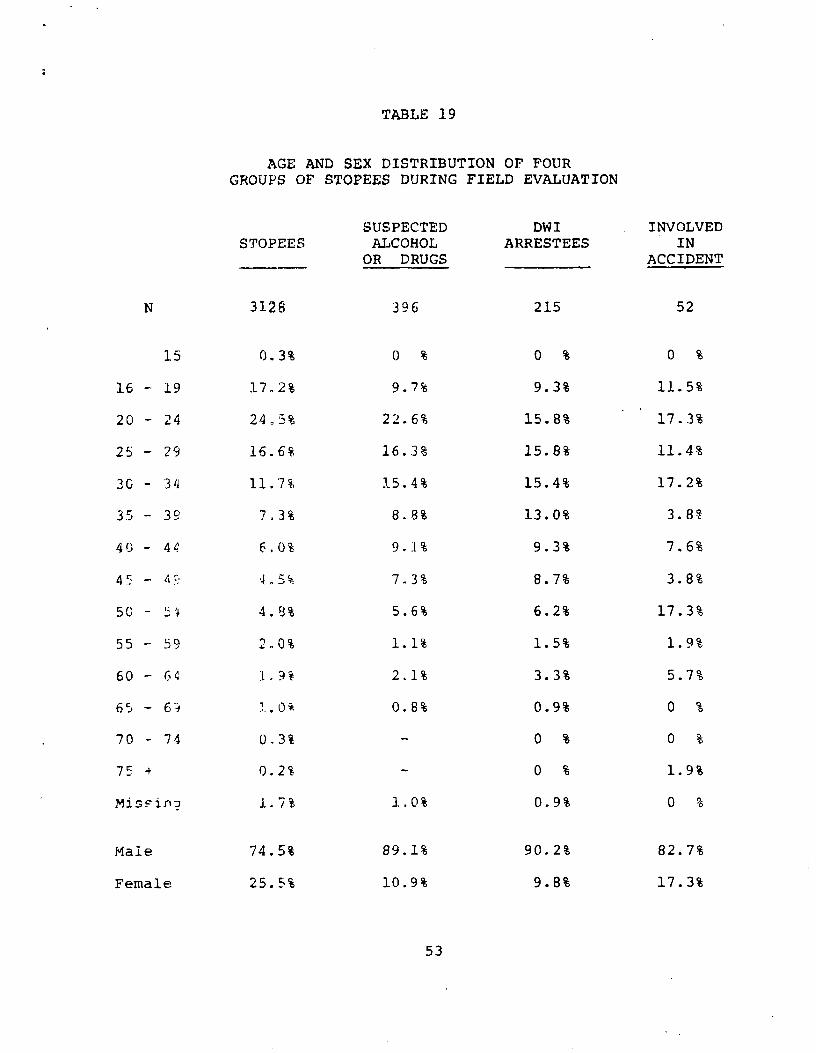
TABLE 19
AGE AND SEX DISTRIBUTION OF FOUR GROUPS OF STOPEES DURING FIELD EVALUATION
SUSPECTED DWI INVOLVED STOPEES ALCOHOL ARRESTEES IN
OR DRUGS ACCIDENT
N 3128 396 215 52
15 0.3% 0 % 0 % 0 %
16 - 19 17.2% 9.7% 9.3% 11.5%
20 - 24 245% 22.6% 15.8% 17.3%
25 - 29 16.6% 16.3% 15.8% 11.4%
30 - 34 11.7% 15.4% 15.4% 17.2%
35 - 3 9 7.3% 8.8% 13.0% 3.8%
40 - 44 6,0% 9.1% 9.3% 7.6%
45 7.3% 8.7% 3.8%
50 - :^ 4.93% 5.6% 6.2% 17.3%
55 59 -- 2..0% 1.1% 1.5% 1.9%
60 - 64 1.9% 2.1% 3.3% 5.7%
65 - 6'^ '..0% 0.8% 0.9% 0 %
70 - 74 0.3% 0 % -- 0 %
75 -+ 0.2% - 0 % 1.9%
MisFinu 1.7% 1.0% 0.9% 0 %
Male 74.5% 89.1% 90.2% 82.7%
Female 25.5% 10.9% 9.8% 17.3%
53
consisted of largely Caucasian populations. Blacks, Latins, Orientals, and other minorities constitute 19.0%, 17.8%, 3.9%, and 3.3% of our stopees, respectively.
Interestingly, Caucasians and Latina were much more likely to be suspected of consuming alcohol before driving than Blacks or Orientals. The rates were one of 6.6 etopees for Caucasians; one of 6.8 stopees for Latins; one of 17.4 stope.es for Blacks; and one of 24.6 stopees for Orientals. Once a stopee was suspected of DWI, however, we found no greater tendency for deputies to arrest any one group than any other.
B. TEST BATTERY EFFECTIVENESS
The most crucial questions to be answered during the field evaluation of the sobriety test battery include: (1) Will the percentage of stopees arrested increase after the test battery is introduced? (2) Will police officers make more accurate decisions with respect to a BAC of 0.10% after being trained on the test battery? (3) Will the mean BAC of arrested drivers be reduced after the test battery is introduced? (4) Will police officers more accurately estimate the BAC levels of stopees after being trained on the test battery? (5) In addition, the ridealong data should provide an estimate of the percentage of police stopees, as opposed to drivers on the highway who have been drinking and who are legally intoxicated.
In answering these questions, both ridealong data and officer-completed forms are available. The ridealong data are as complete as possible and provide BAC distributions of released stopees. However, the ridealong data represent only a small sample of the drivers stopped by the participating deputies during the field evaluation. In addition, these data may be somewhat biased because an observer was present. The officer-completed forms, on the other hand, cover the entire field evaluation. However, these data are less complete and do not provide actual BAC information on released stopees.
As discussed before, the biggest problem with the field evaluation was, officer participation. We began with 20 deputies, but had to
eliminate five because of poor attitude or lack of cooperation. Three of the remaining deputies filled out very few data forms (less than 40% of their probable stops) and a fourth deputy made no DWI arrests during the entire field study. Thus, out of the original 20 deputies, only 11 provided us with sufficient arrest data to be of value. Even among these 11 officers, there was considerable variation in the number of arrests made. As a result, trends are reported, but the data are not appropriate for significance testing; the assumptions for underlying statistics which would be of interest are not met by the data. However, virtually every trend reported is in the direction of improved performance resulting from the test battery. The potential utility of the test battery appears to be supported.
54
I F-111-1 the Percentage Q , atoveea yho. are arrested increase after .raining 9A g test battery?
By examining the procedural steps in the officers' handling of the intoxicated stopee, we can anticipate how the test battery might increase the percentage of stopees who are arrested. Many intoxicated drivers, especially those with a high alcohol tolerance, probably are never stopped by the police because cues for detecting them are not sensitive enough. Instead, most of the stopees will have made serious driving errors. Many of these driving errors may be attributable to impairment other than alcohol intoxication, such as-a woman who has just had her purse stolen and is too upset to concentrate on driving; a diabetic person in need of insulin; a married couple arguing; an elderly man driving too carefully, etc. These people generally are not given sobriety tests, because they do not smell of alcohol or because their other problems are obvious.
If the officer detects an alcohol odor, then the driver probably will be asked to get out of the car. Once this occurs, the officer typically will continue a low-key interrogation of the ,stopee and administer behavioral tests. The officer then must make a decision to arrest or release the stopee based upon his/her estimate of how intoxicated the driver is. Unfortunately, the arresting officer's decision is frequently based upon personal factors (see feasibility section.), rather than upon the estimated BAC of the driver. For example, during the field evaluation, approximately 5% of the stopees suspected of drinking alcohol were released despite the fact that the stopee's officer-estimated BAC was over 0.10%. These cases included four stopees for whom the BAC was at least 0.20%, as estimated by the officer.
The averagE police officer does not, under any circumstances, wish try ur!_st a suspect with a low BAC (i.e., below 0.10%) and will often err by opting to release rather than risk a false arrest.
The test battery probably will have its greatest impact at this point t-y increasing the percentage of stopees who are arrested, reducing the false negatives.
Table 2C gives the number of stopees, the number of arrestees, and the percentage of stopees who are arrested for both groups of
officers, control and experimental, during each phase of the field evaluation. A larger percentage of stopees might have been arrested during Phase I because of the number of drinking drivers on tho road during the Christmas-New Years' Holiday Season. Indeed, the control officers arrested 6.6% of their stopees during Phase 1, but only 2.2% of their stopees during Phase II. The experimental group officers, in contrast, increased the percentage of stopees arrested from 7.7% during Phase I to 9.1% after their training in Phase II. The control group also increased their
arrest percentage after their training from 2.2% in Phase II to 5.0% in Phase III. During Phase III the percentage of arrestees
dropped from 9.1% to 8.2% for the already-trained experimental group officers, but remained above pretraining levels.
55
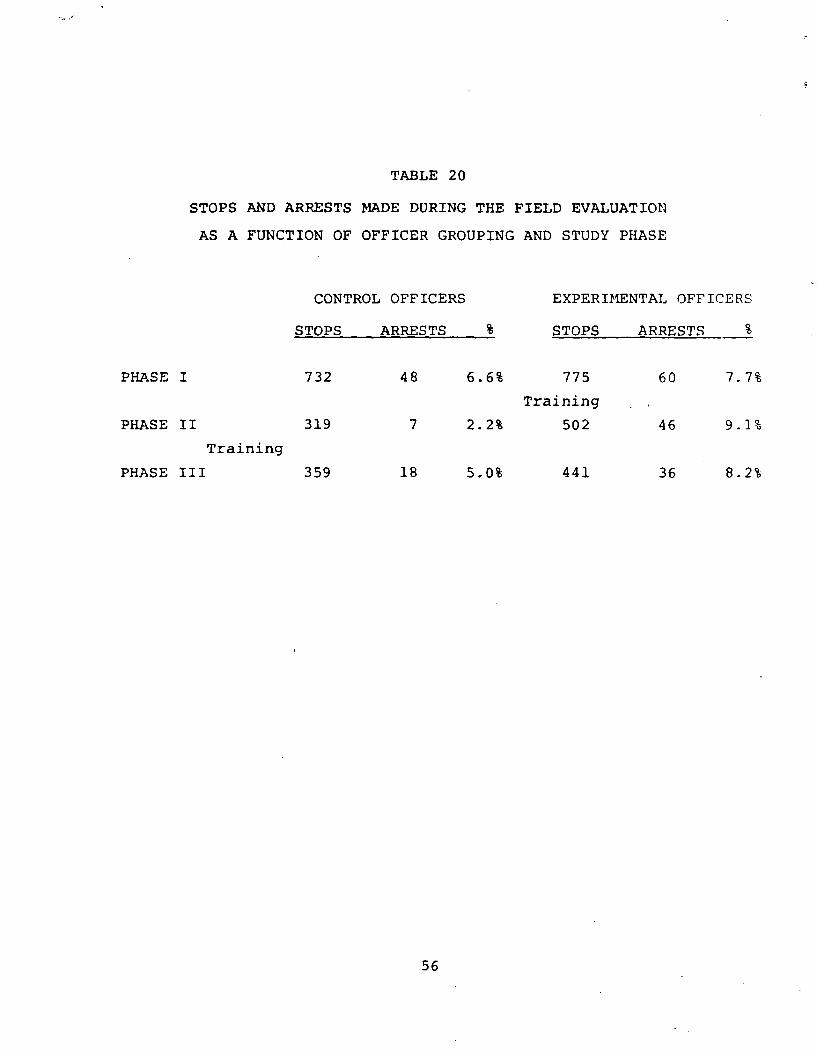
TABLE 20
STOPS AND ARRESTS MADE DURING THE FIELD EVALUATION
AS A FUNCTION OF OFFICER GROUPING AND STUDY PHASE
CONTROL OFFICERS EXPERIMENTAL OFFICERS
STOPS ARRESTS % STOPS ARRESTS %
PHASE I 732 48 6.6% 775 60 7.7%
Training
PHASE II 319 7 2.2% 502 46 9.1%
Training
PHASE III 359 18 5.0% 441 36 8.2%
56
When all of the data are classified into trained versus untrained periods, the officers arrested 6.3% of their stopees prior to training and 7.6% of their stopees after training. This represents a 20.1% increase in arrest rates which could have a substantial effect on DWI arrests nationally if a large number of trained officers were to maintain such an increase.
2. Will police officers pLakg more accurate decisions with respect to a BAC of 0.10% after being trained on the test battery?
The finding that police officers arrested a greater percentage of their stopees after being trained on the test battery could result from: (1) an increase in the exposure of the deputies to drinking drivers as a result of their training on the test battery (e.g., officers might seek out intoxicated drivers by staying near bars or they might alter the type of stops they make, both of which might increase the percentage of their stopees who were drinking); (2) a change in officers' arrest criterion after training due to increased confidence in their ability to make accurate arrest decisions; (3) pressure from superiors to perform well after they had been trained; or (4) a desire to make more arrests because they had just received training in field sobriety testing (i.e., the Hawthorne effect).
The BAC data obtained during the ridealongs may be biased. These data. as discussed earlier in this chapter, represent only 59 eight-hour shifts out of 685.5 shifts worked by the deputies during the three month study (i.e., or 8.6% of the shifts). In addition, deputi.ev may have been influenced by the presence of an observer during the ridealongs and BAC information is available on only 72.6% c:' the released and arrested stopees (although 85.3% of the released stopees asked agreed to provide breath samples).
Nev€rthel€ss, the BAC data from the ridealongs is the best data availa':1e to determine (a) if the deputies were more exposed to drir"'rg drivers after their training or (b) if the officers were stle tc a:ake more accurate decisons after being trained on the test battr-rv.
at E.yp(^pjre to Drinking Drivers Table 21 gives the number of r16ealc^g BACs collected for each group of officers during the
three phased of the field evaluation. The percentage of drinking drilexs and legally intoxicated drivers is also given in the table. Clearly, rJur limited sample of BACa indicates that officers were not t r re "exposed" to drinking drivers after training than before tr.inicg. Drinking drivers constituted 35.2% of the before training sample of 125 BACs and 34.7% of the after training sample of 101 BACs. Legally intoxicated drivers constituted 18.4% of the before training sample and 14.9% of the after training sample. Thus, the officers, if anything, are less exposed to drinking drivers after training than before -- primarily due to the high percentage of drinking drivers (i.e., 41.9%) among police stopees during the Holiday season of Phase I.
i
b. ^.c::uracv of Decisions Table 22 gives decision matrices before and after training for the ridealong stopees for whom a BAC is
57
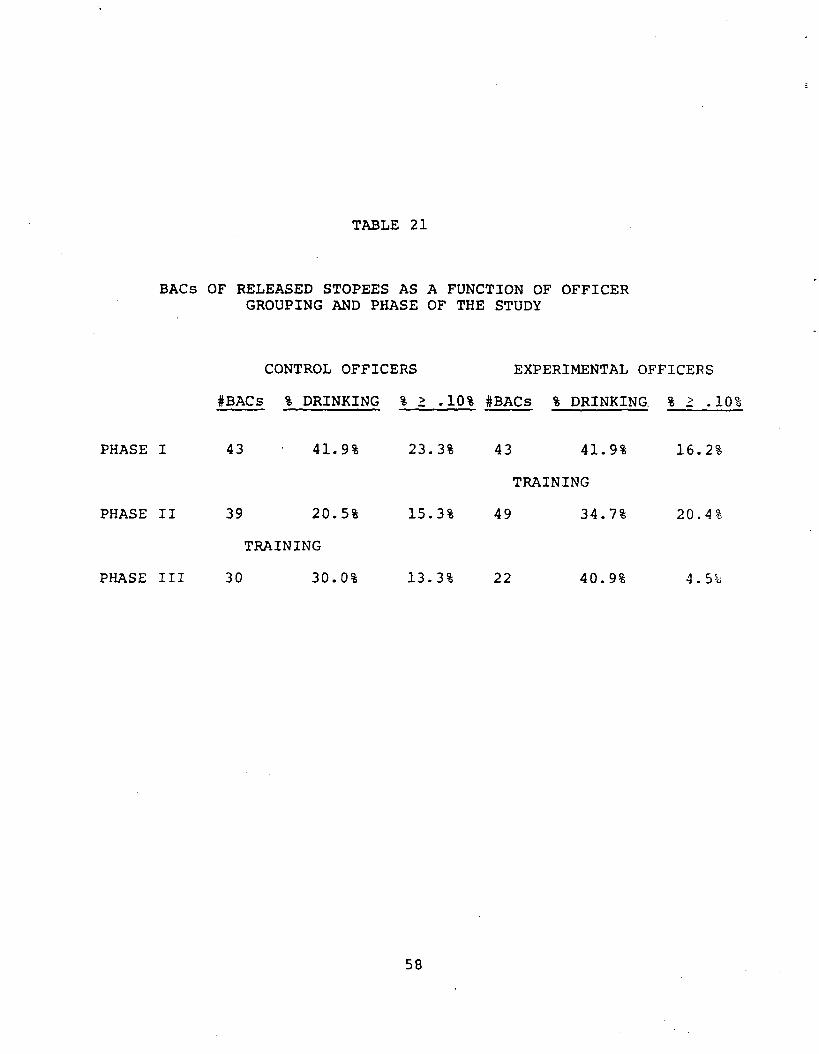
TABLE 21
BACs OF RELEASED STOPEES AS A FUNCTION OF OFFICER GROUPING AND PHASE OF THE STUDY
CONTROL OFFICERS EXPERIMENTAL OFFICERS
#BACs % DRINKING % 2 .10% #BACs I DRINKING, % ? .10%
PHASE I 43 41.9% 23.3% 43 41.9% 16.2%
TRAINING
PHASE II 39 20.5% 15.3% 49 34.7% 20.4%
TRAINING
PHASE III 30 30.0% 13.3% 22 40.9% 4.5%
58
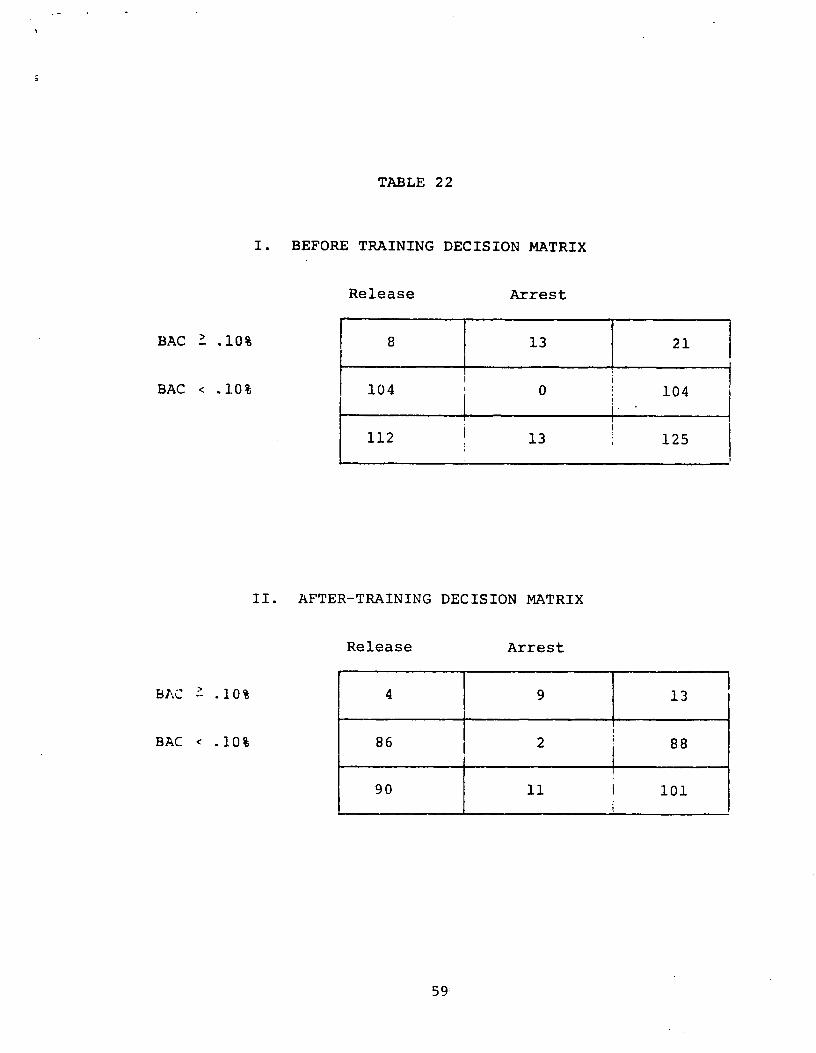
TABLE 22
1. BEFORE TRAINING DECISION MATRIX
Release Arrest
BAC '_ .10% 8 13 21
BAC < .1.0% 104 0 104
112 13 125
II. AFTER-TRAINING DECISION MATRIX
Release Arrest
BAC ' .10% 4 9 13
BAC < . 10% 86 2 88
90 11 1 101
59
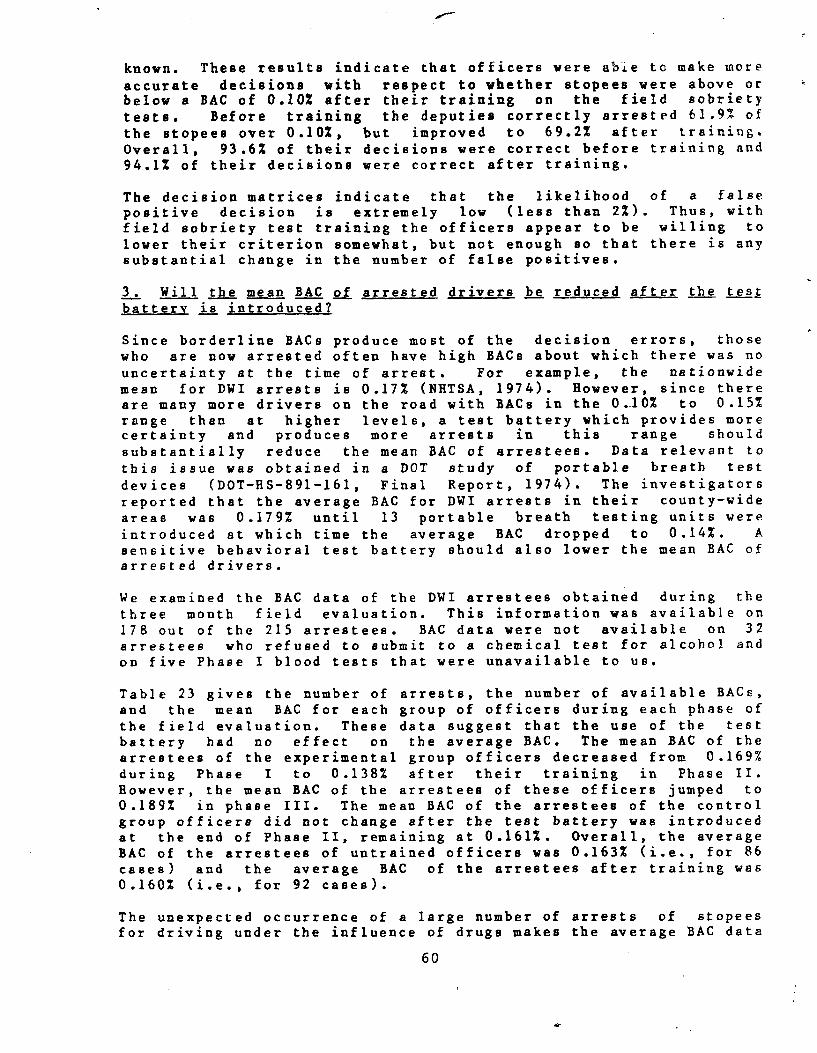
known. These results indicate that officers were able to make more accurate decisions with respect to Whether stopees were above or below a BAC of 0.10% after their training on the field sobriety tests. Before training the deputies correctly arrested 61.9% of the stopees over 0.10%, but improved to 69.2% after training. Overall, 93.6% of their decisions were correct before training and 94.1% of their decisions were correct after training.
The decision matrices indicate that the likelihood of a false positive decision is extremely low (less than 2%). Thus, with field sobriety test training the officers appear to be willing to lower their criterion somewhat, but not enough so that there is any substantial change in the number of false positives.
3. Will the mean BAC of arrested drivers be reduced after the test battery is introduced?
Since borderline BACs produce most of the decision errors, those who are now arrested often have high BACs about which there was no
uncertainty at the time of arrest. For example, the nationwide
mean for DWI arrests is 0.17% (NHTSA, 1974). However, since there are many more drivers on the road with BACs in the 0.10% to 0.15% range than at higher levels, a test battery which provides more certainty and produces more arrests in this range should
substantially reduce the mean BAC of arrestees. Data relevant to this issue was obtained in a DOT study of portable breath test
devices (DOT-HS-891-161, Final Report, 1974). The investigators
reported that the average BAC for DWI arrests in their county-wide areas was 0.179% until 13 portable breath testing units were
introduced at which time the average BAC dropped to 0.14%. A
sensitive behavioral test battery should also lower the mean SAC of arrested drivers.
We examined the BAC data of the DWI arrestees obtained during the three month field evaluation. This information was available on 178 out of the 215 arrestees. BAC data were not available on 32 arrestees who refused to submit to a chemical test for alcohol and on five Phase I blood tests that were unavailable to us.
Table 23 gives the number of arrests, the number of available BACs, and the mean BAC for each group of officers during each phase of
the field evaluation. These data suggest that the use of the test battery had no effect on the average BAC. The mean BAC of the arrestees of the experimental group officers decreased from 0.169% during Phase I to 0.138% after their training in Phase II. However, the mean BAC of the arrestees of these officers jumped to 0.189% in phase III. The mean BAC of the arrestees of the control group officers did not change after the test battery was introduced at the end of Phase II, remaining at 0.161%. Overall, the average BAC of the arrestees of untrained officers was 0.163% (i.e., for 86 cases) and the average BAC of the arrestees after training was 0.160% (i.e., for 92 cases).
The unexpected occurrence of a large number of arrests of stopees for driving under the influence of drugs makes the average BAC data
60
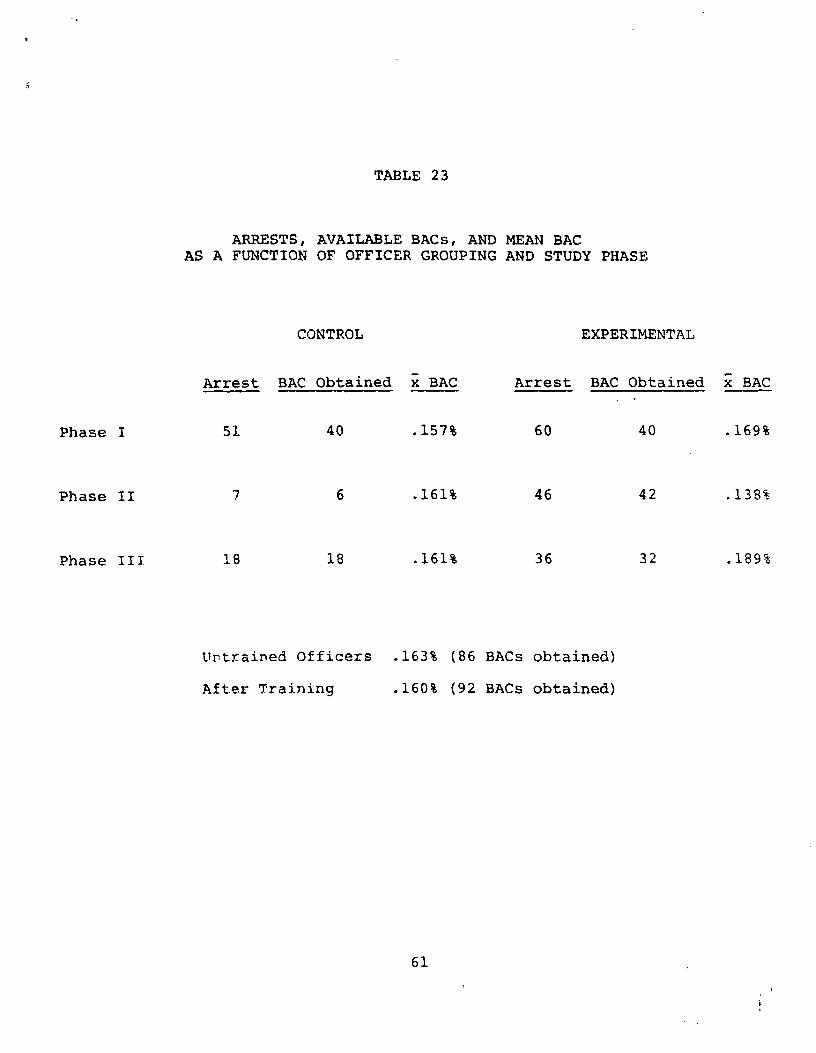
TABLE 23
ARRESTS, AVAILABLE BACs, AND MEAN BAC AS A FUNCTION OF OFFICER GROUPING AND STUDY PHASE
CONTROL EXPERIMENTAL
Arrest BAC Obtained x BAC Arrest BAC Obtained x BAC
Phase I 51 40 .157% 60 40 .169%
Phase II 7 6 .161% 46 42 .138%
Phase III 18 18 .161% 36 32 .189%
Urtrained Officers .163% (86 BACs obtained)
After Training .160% (92 BACs obtained)
61
of the arrestees ambiguous in terms of alcohol alone. In addition, the occurrence of 32 chemical test refusals probably biases the data. These two sources of error on the mean BAC of arrested drivers are discussed below.
a. Drug Arrests. Twenty four arrestees were suspected of being under the influence of drugs or under the influence of alcohol and drugs. Another six of the stopees were suspected of having taken drugs, but were not arrested. Four other arrestees were estimated by police officers to have BACs of 0.20% or greater, but had actual BACs of zero. An arrestee must be very impaired for police officers, no matter how skilled, to estimate the BAC at 0.20% or greater.
The above cases could be excluded from the analysis, but not all of them legitimately should be excluded. Several officers routinely suspected their arrestees of being under the influence of both alcohol and drugs and we have no clear indication of how valid their suspicions were. Other officers suspect drugs only after they see a low BAC reading. These could be legitimate suspicions or attempts by officers to cover themselves for an arrestee with a low BAC reading.
b. Refusals. Thirty two of the arrestees refused any sort of chemical test. For example, many arrestees with prior DWI
convictions, especially those driving under suspended licenses, routinely refused all chemical tests. Sixty nine percent of the refusing drivers were over 30 years of age (as compared with only 58% of the arrestees) suggesting that life experience may play a role in refusing a chemical test.
The mean BAC, as estimated by the officers, for the refusals was 0.198;, as compared with a mean estimated BAC of 0.171% for all arrestees. Since 72% of the refusals occurred during Phase I, the actual BAC of all of the arrestees before training may be much higher than the mean BACs given in Table 23 for Phase I. Thus, the refusals could have substantially altered the outcome of the field evaluation.
4. Will police officers more accurately estimate the BAC levels of s o ees after being trained on the test battery?.
Police officers, trained in administering and scoring the test battery as part of the laboratory evaluation, were able to estimate the BAG of laboratory participants to within 0.03% (i.e., the mean absolute value difference). As part of the field evaluation, we were concerned with whether or not police officers in the field would be able to do as well as in the laboratory once exposed to the test battery. In addition, we were interested in what changes might occur in police officer estimates of BACs in the field before and after the test battery was introduced. However, we encountered several problems in gathering these data.
a. Few stopees are tested. Our sample of laboratory participants probably represent the stopee population quite well, but those who
62
were given sobriety tests in the field represent a subset of this population biased toward high BACs. During the entire three month field evaluation, only 322 stopees (10.3x) were given field sobriety tests as compared with 441 field sobriety tests given during the laboratory study. Since we estimate that approximately 30% of the atopees had been drinking, only 37% of the drinking drivers who are stopped are given field sobriety tests. Before training, 10.2% of the stopees were tested, and after training, 10.4% of the stopees were tested. Thus, while all participants in the laboratory evaluation were given the field sobriety tests, only a small proportion of the stopees are actually given field sobriety tests, The stopees tested are those who smell strongly of alcohol or who look intoxicated, so they are probably biased toward having a high BAC.
b. Most j Ile officers' BAC estimates were invalid. The only stopees for whom an actual BAC was available to compare with an officer's estimate of the BAC were the DWI arrestees, since BAC data on released stopees taken during the ridealongs were anonymous.. Unfortunately, most officers filled in their data forms at the end of each shift, so they probably often knew the actual BACs of those arrestees who were given breath tests. ' Thus, the only valid data obtained in the field study comparing officer estimated BACs with actual BACs probably were for the 73 arrestees who were given blood or urine tests.
c.. Blood and urine data were obtained on a biased samp le ,off a res Lc. . These 73 arrestees probably represent a very different population than our laboratory subjects who were selected to represent the stopee population. Approximately one third of the arrestees given blood or urine tests were suspected of being under the Influence of drugs and all of them were considered to be highly impaired by the arresting officer. Moreover, these arrestees represent a much wider range of BACs (0% to 0.30%) than our laboratory participants (0% to 0.18%). Thus, we would not expect the absolute value of the differences between the estimated and actual BACs for these subjects to be equivalent to the laboratory situation.
di G yen tteb problems.. the accuracy o1 the officers'. BAC S_111 aC s ;ended 12 bg more accurate after training. Table 24 gives the absolute mean difference between the actual BAC and the estimated BAC for each officer before and after training. Also given are the number of arrestees represented by each mean. In
many instances the officer did not have an arrestee who requested a b1oo:' or urine test during a particular phase of the study. There
were only six officers for whom we have data both before and after training. These six officers improved their estimates by an average of 0.0175% (a - 0.028) after their training. For the 11 officers for whom we have some data, the average BAC estimate was off by 0.077% before training (s - 0.043, n - 7) and the average BAC estimate was off by 0.0537% after training (s - 0.031, n a 10). The effect of training was not significant, but was in the expected dire;:tion.
63
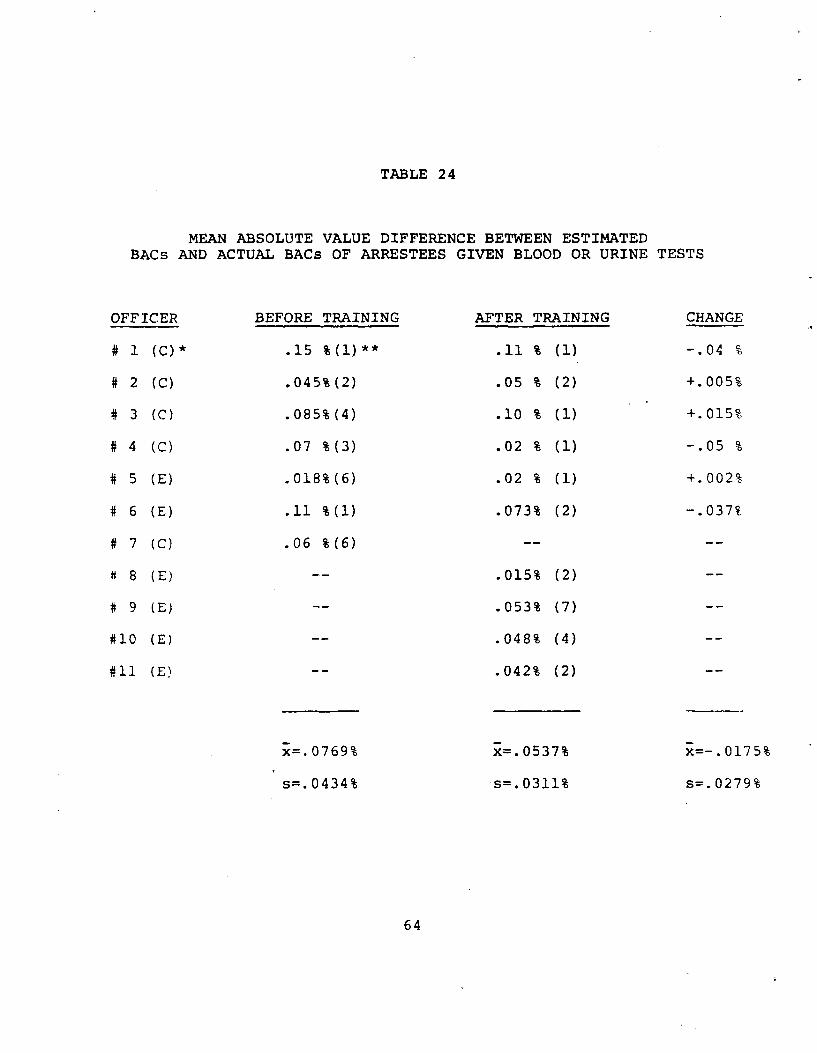
TABLE 24
MEAN ABSOLUTE VALUE DIFFERENCE BETWEEN ESTIMATEDBACs AND ACTUAL BACs OF ARRESTEES GIVEN BLOOD OR URINE TESTS
OFFICER
# 1 (C) *
# 2 (C)
# 3 (C)
# 4 (C)
# 5 (E)
# 6 (E)
# 7 (C)
8 (E)
# 9 (E)
#10 (E)
#11 (E)
BEFORE TRAINING
.15 %(l)**
.045%(2)
.085%(4)
.07 %(3)
.018%(6)
.11 %(1)
.06 %(6)
x=.0769%
s=. 0434%
AFTER TRAINING
.11 % (1)
.05 % (2)
.10 % (1)
.02 % (1)
.02 % (1)
.073% (2)
.015% (2)
.053% (7)
.048% (4)
.042% (2)
x=.0537%
s=.0311%
CHANGE
-.04 o
+.005%
+.015%
-.05 %
+.002%
-.037%
x=-.0175%
s=. 0279%
64
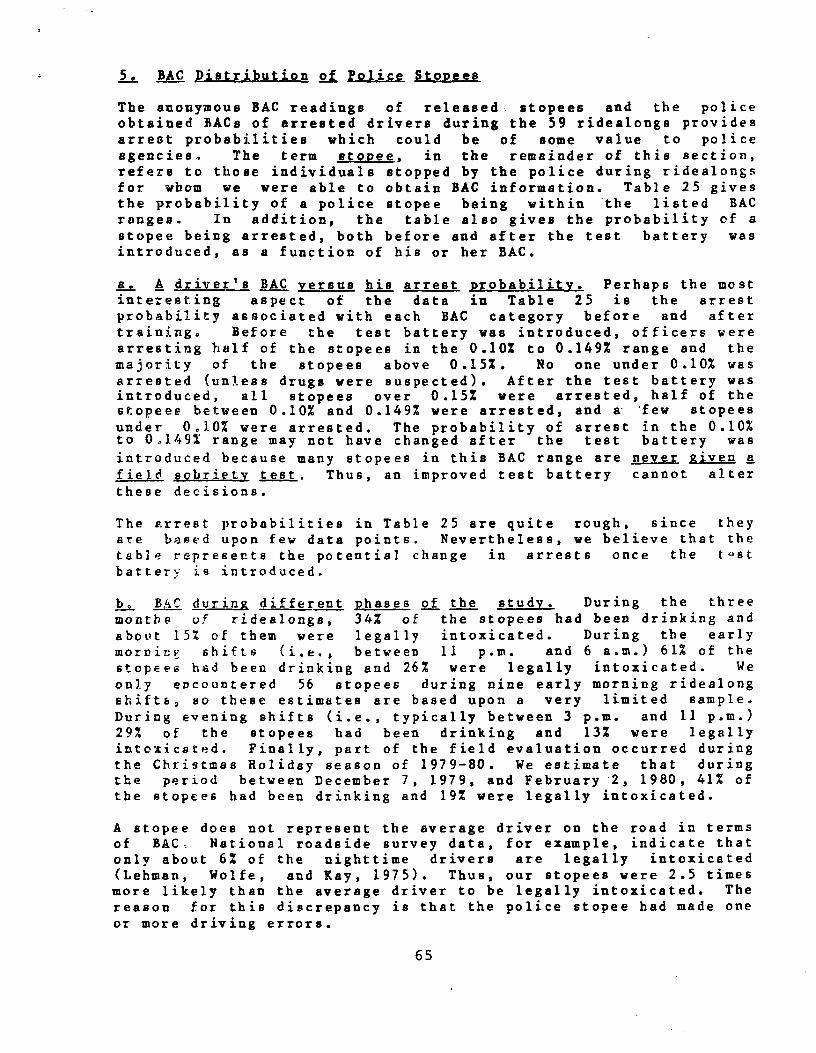
S5L BAC Distribution off, Police Stopees
The anonymous BAC readings of released. stopees and the police obtained BACs of arrested drivers during the 59 ridealongs provides arrest probabilities which could be of some value to police agencies. The term stopee, in the remainder of this section, refers to those individuals stopped by the police during ridealongs for whom we were able to obtain BAC information. Table 25 gives the probability of a police stopee being within the listed BAC ranges. In addition, the table also gives the probability of a stopee being arrested, both before and after the test battery was introduced, as a function of his or her BAC.
a. A driver's BAC versus his arrest probability. Perhaps the most interesting aspect of the data in Table 25 is the arrest probability associated with each BAC category before and after training. Before the test battery was introduced, officers were arresting half of the stopees in the 0.10% to 0.149% range and the majority of the stopees above 0.15%. No one under 0.10% was arrested (unless drugs were suspected). After the test battery was introduced, all stopees over 0.15% were arrested, half of the stopeee between 0.10% and 0.149% were arrested, and a- 'few stopees under 0.10% were arrested. The probability of arrest in the 0.10% to 0.149% range may not have changed after the test battery was
introduced because many stopees in this BAC range are never given a field sobriety test. Thus, an improved test battery cannot alter
these decisions.
The arrest probabilities in Table 25 are quite rough, since they are based upon few data points. Nevertheless, we believe that the table represents the potential change in arrests once the t-st battery is introduced.
b A.^ during different phases of the study. During the three monthe of ridealongs, 34% of the stopees had been drinking and about 15% of them were legally intoxicated. During the early morning shifts (i.e., between 11 p.m. and 6 a.m.) 61% of the stopees had been drinking and 26% were legally intoxicated. We only encountered 56 stopees during nine early morning ridealong shifts, so these estimates are based upon a very limited sample. During evening shifts (i.e., typically between 3 p.m. and 11 p.m.) 29% of the stopees had been drinking and 13% were legally intoxicated. Finally, part of the field evaluation occurred during the Christmas Holiday season of 1979-80. We estimate that during the period between December 7, 1979, and February 2, 1980, 41% of the stopees had been drinking and 19% were legally intoxicated.
A stopee does not represent the average driver on the road in terms of BAC: National roadside survey data, for example, indicate that only about 6% of the nighttime drivers are legally intoxicated (Lehman, Wolfe, and Kay, 1975). Thus, our stopees were 2.5 times more likely than the average driver to be legally intoxicated. The reason for this discrepancy is that the police stopee had made one or more driving errors.
65
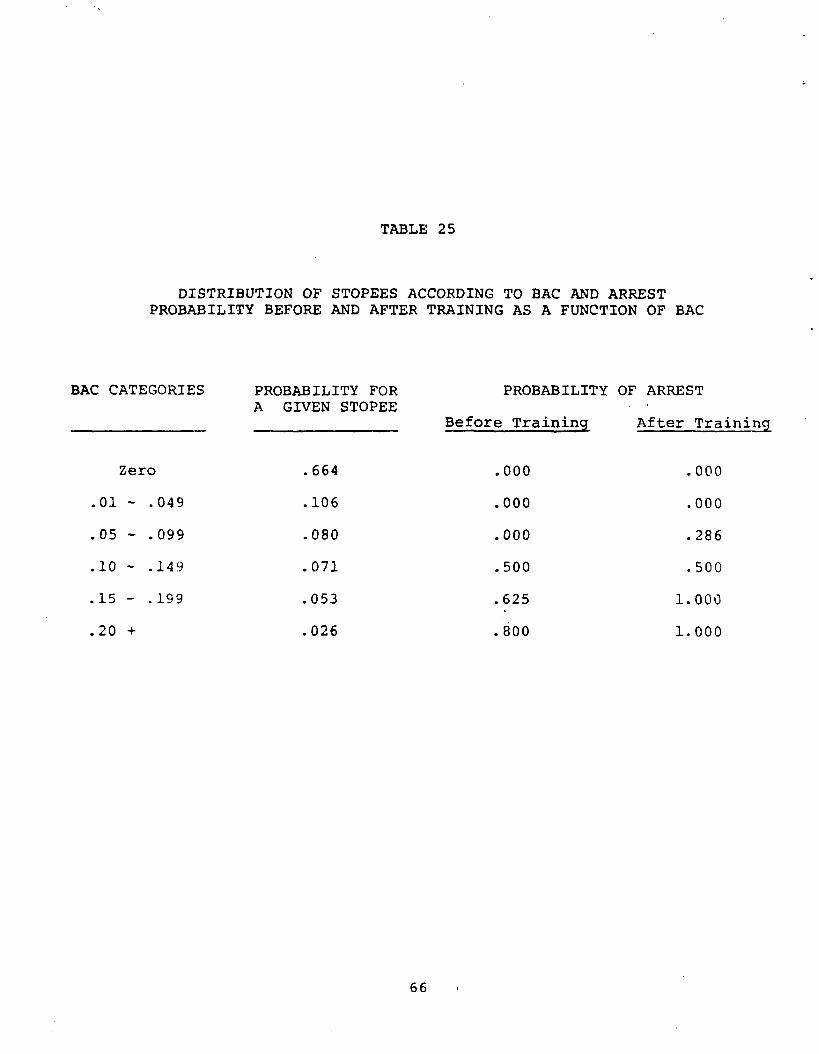
TABLE 25
DISTRIBUTION OF STOPEES ACCORDING TO BAC AND ARRESTPROBABILITY BEFORE AND AFTER TRAINING AS A FUNCTION OF BAC
BAC CATEGORIES PROBABILITY FOR PROBABILITY OF ARREST A GIVEN STOPEE
Before Training After Training
Zero .664 .000 .000
.01 - .049 .106 .000 .000
.05 - .099 .080 .000 .286
.10 - .149 .071 .500 .500
.15 - .199 .053 .625 1.000
.20 + .026 .800 1.000
66
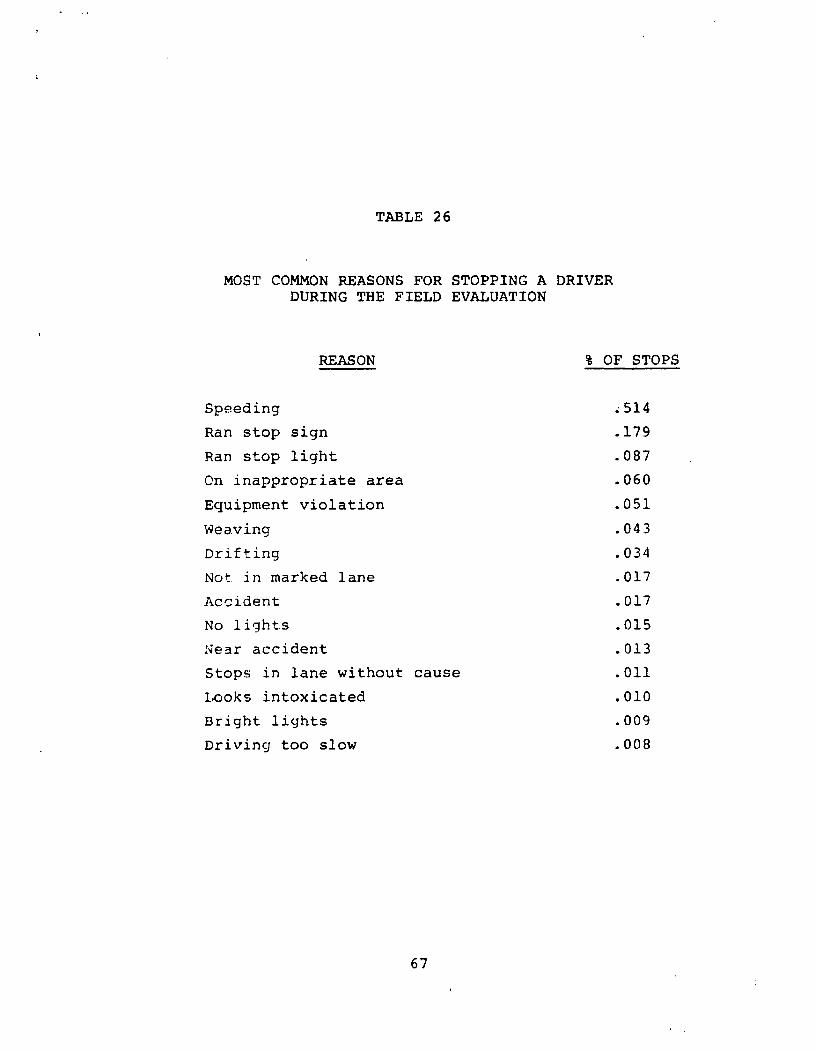
TABLE 26
MOST COMMON REASONS FOR STOPPING A DRIVERDURING THE FIELD EVALUATION
REASON % OF STOPS
Speeding .514
Ran stop sign .179
Ran stop light .087
On inappropriate area .060
Equipment violation .051
Weaving .043
Drifting .034
Not. in marked lane .017
Accident .017
No lights .015
Near accident .013
Stops in lane without cause .011
Looks intoxicated .010
Bright lights .009
Driving too slow .008
67
c. BAC versus type j driving error. Table 26 gives the 15 most coaaon driving errors made by all stopees during the field evaluation and the probability of occurrence during the field evaluation. More than half of the police stops were for speeding, since most of the participating deputies had radar equipped cars. Harris et al. (1980) estimate that the probability of someone driving 10 mph over the speed limit having a BAC over O.10% is about 0.37. Based upon our police officer estimates of the BAC of the stopees, only 5.1% of the speeders were over 0.10%, which is probably less than the percentage of legally intoxicated drivers on the road. On the other hand, Harris estimates the probability of someone stopped for weaving having a BAC of 0.10% or greater to be 0.60. During the field evaluation 58.5% of those stopped for weaving were estimated to be legally intoxicated by our police officers. Thus, a police officer has some control over the number of intoxicated stopees he or she encounters by controlling the type of stops made during a shift. Generally, we believe that the distribution of stops indicated in Table 26 are probably quite representative of those made by the average traffic patrol.
C. FEASIBILITY
Virtually every police officer known to us who is interested in enforcing DWI laws recognizes the need for a research based, standardized field sobriety test battery. Thus, overall acceptability of an improved test battery seems highly favorable.
A number of critical issues concerning the feasibility of the test battery still exist and should be addressed before widespread introduction of the test battery occurs. These issues include:
(1) the police attitude toward DWI arrests; (2) police acceptance of standardized administration and scoring techniques; and (3)
preset BAC criteria for the test battery.
1. Police Attitude toward DWI Arrests
A police officer's attitude toward DWI arrests is of extreme importance in determining whether or not a standardized field sobriety test battery will be used. Law enforcement officers generally reflect society's attitudes toward drunk drivers. Little (1968) found that while most people interviewed disapproved of DWI, they were not particularly concerned about any consequences to themselves. The drunk driver is not particularly visible and the consequences of drunk driving do not impact directly on most people. Consequently, the public considers police activities other than traffic patrol, such as protecting lives and property from criminals, as being of prime importance. Frequently, even the drunk driver who kills is not considered to be a criminal by the public, or even by some police officers, but merely someone who was unfortunate.
Public attitude is highly influential in determining police attitudes toward DWI. The potential influence on law enforcement is probably greatest at the municipal level where police respond
68
directly to community demands. In areas with heavy crime rates and small budgets, the DWI problem is likely to be virtually ignored. In districts with lower crime rates, such as those participating in the field evaluation, more emphasis usually is placed on traffic enforcement, including DWI enforcement. Even then, however, persons getting tickets for hazardous moving violations frequently complain that the police should be catching criminals instead of harassing innocent citizens.
Individual police officers may also have their own personal reasons for not arresting for DWI. One participating deputy, for example, insisted that his primary life interest was in making his marriage work so that he avoided anything that might force him to work overtime, including DWI arrests. Other reasons police avoid such arrests include: they drink and drive themselves; they don't fully understand the consequences of alcohol impairment; the arrest process requires too much overtime for which they do not get extra pay; they receive poor support in the courts; DWI enforcement is not encouraged by their immediate supervisor; they prefer other kinds of enforcement activities; and/or many other reasons. Factors influencing DWI arrests have ,been studied previously in other NHTSA contracts (NETSA, 1972; Young and Co., 1974; Oates, 1974; Hawkins et al, 1976).
A standardized field sobriety test battery is not a cure for poor police attitudes. Officers who avoid DWI arrests will probably continue to avoid them for the same reasons. Officers who use the test battery and find that it makes their job easier and helps them get convictions may make more arrests once they are given the test battery as a tool.
A number of factors also could cause the introduction of the test battery to have a negative effect on police attitudes, including: (1) Officers may find they are arresting more drivers under 0.10% requiring them to fill out an arrest report even though the driver is released at the station. (2) Officers may find that more arrests in the 0.10% to 0.15% range are being plea-bargained since they are more plentiful. Plea-bargaining discourages police officers from making similar arrests. (3) More DWI arrests may cause a back up of cases in the courts and result in considerable plea-bargaining regardless of the BAC.
2. Policg Acceptance of Standardized Administration and Scoring Procedures,
Most officers concerned with DWI enforcement see the need for a standardized test battery, in the sense that every officer would administer the same tests in the same way. However, officers are reluctant to use an elaborate scoring system or even any scoring system. This resistance appears to be the result of a reluctance
to use anything very complicated and the probable lack of understanding of the benefits and purpose of standardized scoring.
The training of officers during the field evaluation was very extensive. SCRI staff members were convinced that every officer
69
completing the training could correctly administer and score the test battery. Unfortunately, some officers forgot or ignored most of the administration procedures, except those associated with nystagmus, by the time their second post-training ridealong occurred. These officers appeared to believe that they were still administering "the one-leg stand test" or the "walk and turn test" and that differences in the administration procedure were unimportant.
SCRI observers, when present during ridealongs, requested that all sobriety tests be scored immediately. Nevertheless, we suspect that many officers filled out their scoring sheets at the end of their shift or at the time they completed the arrest report for that individual. Most police officers have remarkable memories for detail, but we still suspect that many advantages of standardized scoring are lost when the scoring is left to memory.
Failure to have sobriety tests which are consistently administered and scored probably results in the acquittal of numerous DWI defendants. Pressure from the courts and from police superiors for consistency is one possible way for standardized procedures to be adopted. In order for this to happen, we believe that the standardized administration and scoring procedures should be incorporated into the police arrest forms.
3. Set BAC Levels
The sobriety test battery was introduced into the field evaluation using arrest criteria that were set to a BAC of 0.10% during the laboratory studies. Several problems arose with these criteria.
First, laboratory procedures are as exact as possible, while arrest procedures tend to err in favor of the arrestee. For example, in the laboratory a BAC reading of 0.099% is rounded to 0.10% except in figuring decision matrices where 0.099% is treated as being less than 0.102. For a DWI arrestee this reading would be considered 0.092 at all times.
Second, the field sobriety test is- designed to help the police officer estimate whether the stopee is legally intoxicated at the time of the testing. Unfortunately, an actual BAC reading may not be obtained for over an hour after the decision t.o arrest is made. Thus, a stopee with a BAC correctly estimated at 0.12% may have a reading of 0.098% (i.e., which is rounded to 0.092) when an actual chemical test finally is obtained. In most cases, this individual would be released immediately and no charges would be filed.
Occasionally, an officer in California may still follow through with an arrest if the chemical test is in the 0.08% to 0.09% range. One officer informed us of such a case during the field study. The prosecutor handling the case, without consulting the arresting officer, merely asked the defendant if he would accept two moving violations. The defendant argued for just a speeding ticket and it was granted.
70
SCRI has adjustable arrest criteria associated with the test
battery. Local law enforcement officials might select their own
arrest criteria, based upon what their courts will accept.
Otherwise, many low BAC drivers may be arrested resulting in more plea-bargaining and negative police attitudes toward using the standardized test battery.
71
CHAPTER v:, CONCLUSIONS AND RECOMMENDATIONS
A, CONCLUSIONS.
The major objectives of this project have been to (1) complete the laboratory development and validation of the sobriety test battery, which was initially identified under Contract No. DOT-HS-5-01242, and to (2) assess in the field its feasibility and effectiveness when used by the police for estimating BAC and facilitating the identification of those drivers with BACs greater than or equal to 0.10%.
Administration, scoring, and interpretation procedures and criteria for the three-test battery have been refined and evaluated. Under laboratory conditions, and in the hands of adequately trained personnel, the test battery is a sensitive index of BAC and of impairment. Based on exhaustive analysis of the laboratory evaluation data, we conclude that the tests are optimally developed and standardized, and no further laboratory work is recommended.
The laboratory data indicate that police officers established an average test performance criterion such that they made "arrest" decisions at a mean BAC of 0.08% and higher. Their estimates of BACs differed from actual BACs, as measured by Intoximeter, by 0.03% (s - 0.005%). They also were able to correctly classify 81% of the laboratory subjects in terms of being above or below 0.10% BAC. Reliability measures produced correlations in the range of 0.60 to 0.80 for test-retest reliability and also for interrater reliability.
This project has confirmed the findings of DOT-HS-5-01242 that gaze nystagmus is an outstandingly useful tool for the officer at roadside. An additional important finding is that 'angle of onset' of the characteristic jerking motion of the eyes, as a sole measure, enabled officers to correctly classify 78% of the laboratory subjects. For this measure to be maximally useful, officers should be trained to estimate the angle of onset with considerable precision. With precise measurement of the angle of onset 88% of the laboratory participants could have been correctly classified,.
The second project objective, evaluation of the test battery in the field, also has been met with a limited sample. Additional field evaluation is recommended.
The limited field evaluation was carried out as a three-phase study. Officers were assigned to an experimental or control group, and over three time periods filled out data forms on all stopees. The variable of interest for the different time periods was "untrained" on the three-test battery versus "trained" to administer and score the tests. SCRI staff members also collected data by riding with participating officers to observe test administration and scoring and to obtain anonymous breath samples for BAC analysis from stopees who were released.
72
I
The questions addressed by the analysis of the field data were: (1) Did the number of arrests increase after police officers were trained to use the test battery? (2) Were the officers better able to discriminate 0.10% BACs as a result of using the test battery? (3) Did the mean BAC of arrested drivers decline after introduction of the test battery? (4) Were the officers better able to detect impairment as a result of using the test battery? Definitive answers to the questions cannot be offered, based on the limited nature of this field study, but the data do clearly suggest positive results due to use of the battery. A 20% increase in arrest rates occurred. Officers were able tp make more accurate decisions relative to BACs of 0.10%, and it appears that they were better able to estimate BACs.
B. RECOMMENDATIONS
Major effort is needed for a subsequent field evaluation, repeating essentially the same study design with a sample which is both larger and broader. Areas which caused difficulty in obtaining data and which are therefore critical issues in, design of additional study, include the following:
1. Police Attitude and Motivation
Extremely serious problems result when there is a lack of interest and cooperation by individual officers, by supervisory personnel, or by agencies. Good data, and ultimately effective utilization of the test battery on a large scale, requires motivation at these various levels to cooperate with the research and to give high priority to the arrest of alcohol-impaired drivers.
The greatest impact of the tests will be realized if law enforcement agencies and officers, recognizing the sensitivity of nystagmus as an index of BAC, routinely check the eyes of all stopees, As the data from the project have demonstrated, many alcobcl.-impaired drivers are being released without any testing at rosdsi.de, A routine examination of all stopees for nystagmus would more effectively detect the drinking driver than the current observational methods which rely on odor, slurred speech, or other obvious signs of intoxication.
2. Adeyuste Time Frame for Data Collection
Experience in the Los Angeles urban area, where traffic density is relatively heavy, indicates that eight traffic stops per shift is the mcriinnw average number which can be expected. A project schedule should be based on this estimate.
The disposition of arrested DWI cases by the courts is important data which has not been dealt with in this or earlier studies. Officers, at the present, often express frustration over what they perceive as lack of support by the courts and the futility of arresting DWI's who will plea-bargain a lesser charge and experience only minimum penalty. The situation may be either
73
worsened or improved by many more arrests and arrests at lower BACs, depending on action taken by the courts. Clearly, interactions with the courts is an important component of effective DWI deterrence, and thus should be included in the field evaluation. The project schedule should be long enough to permit development of contacts with the judiciary and the final disposition of DWI charges which arise during the evaluation period.
3, Ot er Considerations
Many law enforcement agencies continue to operate units with two officers, particularly on nighttime shifts. For example, both the California Highway Patrol and the Los Angeles Police Department have two officers in traffic patrol units. If such agencies are involved in the field evaluation (and to routinely exclude all of those with two-officer units would introduce unacceptable biases into the data), then the number of officers would double, and clearly there will be a substantial increase in the costs of training and supervision.
Obtaining law enforcement cooperation is a major effort, in and of itself, requiring considerable time. The various agencies which have worked cooperatively with SCRI during the execution of two DWI projects have had serious concerns about legal issues involved in the field evaluation, including the following: (1) If permission
is given to obtain breath samples, the agencies require guarantees that the samples be anonymous. Their legitimate concern is that if a driver whose BAC exceeds 0.102 is released and subsequently is involved in an accident, the BAC reading may be subpoenaed as evidence and the police agency could be held liable for having released an impaired driver. (2) Stopees may feel embarrassed and harassed by being asked for a breath sample. Agencies typically are acutely aware of public relations problems and thus object to introducing research procedures which the public will not like. (3) If the field study reveals that officers actually are releasing a large proportion of high BAC drivers, then this information may become widely known and may be used as criticism against the agency.
These issues are neither trivial nor easily resolved. If the agency's policy makers rule that particiption in the research is not approved, then little recourse remains. The authority of agency directors is absolute, and local units of state police, for example, will not cooperate without full approval of the appropriate supervisors and administrators.
The ridealong system is an important component of the field study plan. SCRI recommends that sufficient personnel be assigned to the project to permit one observer for each six traffic patrol units.
In summary, SCRI recommends that the field evaluation of the three--test battery be completed with a major effort. A period of 18 months is recommended in order to carry out the study on a nationwide basis with diverse law enforcement agencies.
74
REFERENCES
Aschan, G. Different types of alcohol nystagmus. Acts Qtolarvigol. SavDlement, 1958, 140, 69-78.
Aschan, G. and Bergetedt, M. Positional alcohol nystagmus (PAN) in man following repeated alcohol doses. Acts Otolaryngol. Supplement, 1975, 330, 15-29.
Aschan, G., Bergetedt, M., and Goldberg, L. The effect of some antihistaminic drugs on positional alcohol nystagmus. Acts Otolarvngol Supplement, 1958, 140. 79.
Aschan, G., Bergstedt, M., Goldberg, L., and Laurell, L. Positional nystagmus in man during and after alcohol intoxication. Quarter-1- Journal of Studies on Alcohol, 1956, 17, 381-405.
Baloh, R., Konrad, H., and Honrubia, V. Vestibulo-ocular function in patients with cerebellar atrophy. Neurology., 1975, 25, 160-168.
Bardy,A., Elomaa, E., Huhmar, E., and Lehtovoara, R. Postural sway in adults: Normal values effect of alcohol ingestion. Acta NeurolqZica Sc.gndinavica Sunplement., 1978, 573, 278.
Barees, E., Cooke, N., King, A., and Passmore, R. Observations on the metabolism of alcohol in man. British Journal of Nutrition, 1965, 1.1, 485-489.
Begbie, G. The effects of alcohol and of varying amount of visual ivformation on a balancing test. Ergonomics, 1966, 9, 325-333.
Beitcl, G.: Shaip, M., and Glarez, W. Probability of arrest while driving under the influence of alcohol. Journal of Studies RR Alcc^aj, 1975, 36, 109-116.
Bender. y , sr.d O'Brien, F. The influence of barbiturates on vari^us forms of nystagmus. American Journal of Ovthalmology, 1946 , 1541 -1552.
Burns. K., atd Mcskovitz, H. Psvchophvsical tests for DWI arrest. (DOT--B5-5-01242). Washington, D. C.: U.S. Department of Transportstion, NETSA, 1977.
Cehalen, D., Cisin, I., and Crossley, H. American drinking pia ;er, New Brunswick: Rutgers Center of Alcohol Studies, 1969.
Collins, W. Manipulation of arousal and its effects on human vestibular nystagmus induced by caloric irregation and angular accelerations, Aerospace Medecine, 1963, 124-129.
Collins, W., Schroeder, D., and Hill, R. Some effects of alcohol on vestibular responses. Advances jn Oto-Rhino-La ryngology, 1973,
75
19, 295-303.
Cronbacb, L. Essentials gi psychological testing. New York: Harper and Row, 1970.
Franks, H., Hensley, U., Hensley, W., Starmer, G., and Teo, R. The relationship between alcohol dosage and performance decrement in humans. Journ l off, Studies gn Alcohol, 1976, IL, 3.
Fregly, A., Bergetedt, M., and Graybiel, A. Relationships between blood alcohol, positional alcohol nystagmus and postural equilibrium. Quarterly Journal of Studies on Alcohol, 1967, 28, 11-21.
Fregly, A., Graybiel, A. and Smith, M. Walk on floor eyes closed (WOFEC): A new addition to an ataxia test battery. Aerospace Medecine, 1972,.395-399.
Goldberg, L. Effects and after-effects of alcohol, tranquilizers, and fatigue on ocular phenomena. In J.D.J. Harvard (Ed.), Alcohol and road traffic. London: British Medical Association; 1963.
Goldberg, L. Behavioral and physiological effects of alcohol on man. Psychosomatic Medecine, 1966, 28, 570-595.
Guilford, J. and Fruchter, B. Fundamental statistics in psychology aid education. New York: McGraw-Hill, 1978.
Barris, D., Dick, R., Casey, S., and Jarosz, C. The isu detection of. driving while intoxicated: field test of visual cues and detection methods. (Contract No. DOT HS-7-1538). Washington, D. C.., Department of Transportation, NHTSA, 1980.
Hawkins, T., Scrimglour, G., Krenck, R., and Dreyer, C. Summary of ASAP' lea is 12t application to state and local programs (Vol, I).
ASAP. jjndin£s. (Contract No. DOT BS-5-01155). Washington, D. C.: Department of Transportation, NHTSA, 1976.
Hill, A., Collins, W., and Schroeder, D. Influence of alcohol on posi.tic:+a: nyetagmus over 32 hour periods. Annals of Otology, Rhir.ulogy, and Lary ngology. 1973, 82, 103.
Bowure, 1. and Templeton, W. Human spatial orientation. New York: Wiley, 1966.
Lehmar, R., Wolfe, A., and Kay, R. A computer archive o ASAP rQadei.dE breath tenting surveys. 1970-1974. Ann Arbor: University of Mic.bigau, Highway Safety Research Institute, 1975.
Lehti, P. The effect of blood alcohol concentration of the onset of gaze nyetagmus. Blutalkohol, 1976, 13, 411-414.
Liden, C., Lo-,?eioy, F., and Costello, C. Nine cases of poisoning -- ph.eny;•lidine. Journal of the American Medical Association, 1975, 234, 513-5.16.
76
Little, J. A theory and empirical study of what deters drinking drivers, if, when, and why. Administration kAj 'ew, 1968, 23, 23-57; 167-193.
Mizoi, Y., Hishida, S., and Maeba, Y. Diagnosis of alcohol intoxication by the optokinetic test. Ouarterly Journal of Studies pu ,A ,cggj:, 1969, 30, 1-14.
Money, K., and Myles, W. Heavy water nyatagmus and effects of alcohol. Nature, 1974, 247, 404-405.
Money, K. and Myles, W. Motion sickness and other vestibulo--gastric illness. In R. Nauton (Ed.): The vestibular
d system. New Tork: Academic Press, 1975.
Moskowitz, H. Laboratory studies of the effects of alcohol on some variables related to driving. Journal of Safety Research, 1973, 5, 185.199
Murpbree, B., Price, L., and Greenburg, L. Effect of congeners in alcoholic beverages on the incidence of nystagmus,. Quarterly Journal of Studies on Alcohol, 1966, 26, 201-213.
National Bi.ghway Traffic and Safety Administration. Alcohol safety ac ion projects: Evaluation o operations _ 1972. Volume II: detailed ana s's. (DOT-HS-800-874) Washington, D. C., 1972.
Nationel highway Traffic and Safety Administration. Alcohol safety action rroiects: Evaluation of operations _ 1974. (DQT-B3-801-707). Washington, D. C., 1974.
Ni;.:,xikt.jien, C. The influence of an auditory task on Romberg's tea:.: ik healthy people and neurological patients. Procedures gL
g_ Rd Sjk¢posium International dg Posturographic Smolenice. September, 1973. Pp. 11-19.
Uat.pe. T. F c ohs influencing arrests for. alcohol related traffic g^2Lr. (Contract No. DOT-HS-801-230). Washington, D. C.:
Depart.uienit of Tianaportation, NETSA, 1974.
OcatF-ve'.d, W. Effect of gravity on positional alcohol nystagmus (FAN', Clinical Aviation and Aerospace Medecine, 1970, 41, 557
Pen'tilg. A., Teuhu, M., and Kataja, M. Clinical examination for in cases 21 suspected drunken driving. Statistical
and Reee*zch Bureau of TALJA. Iso Roobertinkatu 20, Helsinki 13, Finland. 1971.
Pentt ja, 1., lenhu, M., and Kataja, M. Examination o1 alcohol in tcxp.: ion in, caaea of suspected drunken drivers II. Liikevneturva, Iso Roobertinkatu 20, 00120 Helsinki 12, Finland, 1974
77
Rashbass, C. Barbiturate nystagmus and the mechanisms of visual fixation. Nature, 1959, 183, 897-898.
Rashbass, C. The relationship between saccadic and smooth tracking eye movements. Journal ot Physiology. 1961, 199, 326-358.
Robinson, D. Eye movement control in primates. Science, 1968, 161, 1219 - 1224.
Ryback, R. and Dowd, P. Aftereffects of various alcoholic beverages on positional nystagmus and coriolis acceleration. Clinical Aviation and Aerospace Medecine, 1970, 429-435.
Schroeder, D. Alcohol and disorientation related responses= I. Nystagmus and "vertigo" during caloric and optokinetic stimulation. (FAA-AM-71-6). Oklahoma City: Federal Aviation Administration, 1971a.
Schroeder, D. Alcohol and disorientation related responses. II. Nystagmus and "vertigo" during angular acceleration. (FAA-AM-71-16). Oklahoma City: Federal Aviation Administration, 1971b.
Simpson-Crawford, T., and Slater, S. Eye signs in suspected drinking drivers: Clinical examination in relation to blood alcohol. New Zealand Medical Journal, 1971, j, 92-96.
Summers, L. and Harris, D. The general deterrence of driving
while intoxicated _ Volumes I and II. (Contract No. DOT-HS-803-582). Washington, D. C.: Department of Transportation, NHTSA, 1978.
Toglia, J. Electronystaamography: Technical aspects and atlas.. Springfield, Ill.: C.C. Thomas, 1976.
Umeda, Y. and Sakata, E. Alcohol and the oculomotor system. Annals 2j Otology. Rhinology. and Laryngologv. 1978, 87, 392-398.
Wilkinson, I., Rime, R. and Purnell, M. Alcohol and human eye movement. Brain, 1974, 97, 785-792.
Wilson, A., Barboriak, J., and Kass, W. Effects of alcoholic beverages and cogeners on psychomotor skills in old and young
subjects. Quarterly Journal 21 Studies on Alcohol. 1970, 5, 115-129.
Young, A. C. and Co. Effective highway safety traffic offense adjudication. (Contract No. DOT-HS-801-216). Washington, D.C.: Department of Transportation, NHTSA, 1974.
78
APPENDIX A
A. Alcohol And Nystagmus
Nystagmus refers to a jerking of the eyes which may be pendular (equal on both sides) or asymmetric with a slow and fast phase (Toglia, 1'976). Alcohol appears to influence a number of different kinds of nystagmus, including: positional nystagmus (Aschan, 1958; Goldberg, 1963), post-rotational nystagmus (Schroder, 1971b), caloric nystagmus (Schroeder, 1971a), optokinetic nystagmus (Schroeder, 1971a), gaze nystagmus (Aschan, 1958; Lehti, 1976).
If all of these forms of nystagmus are considered, then the literature on alcohol and nystagmus is quite large and somewhat contradictory. However, by studying the mechanisms producing nystagmus, the literature can easily be sorted.
Essentially, alcohol can influence nystagmus in two ways: (1) mechanically by acting on the vestibular system, and (2) neurologically.
I., Vestibilar Mechanisms (See Howard and Templeton, 1966)
In van, three semicircular canals, joined at right angles, are located in each inner ear. The canals are filled with fluid, called endolymph. A swelling or ampulla is located in each canal and contains the sensory transducer of the canal. Essentially, the cilia of a number of sensory cells project into a common gelatinous mass; the cupula. This cupula is hinged at one end, so that it can swing from side to side with the ampulla. In the upright position, the cupula forms an effective seal, preventing the leakage of endolyaph past that point.
The semicircular canals respond to angular acceleration, such as in a head movement, which causes the endolymph to lag behind the head movement (i.e., the fluid moves) and deflects the copula. Deflection of the cupula discharges the sensory cells and provides the sensation of movement. With constant angular acceleration, the system provides accurate information for the first ten seconds or so ovJ then underestimates the amount of acceleration. If the person is then held at a constant velocity, then the cupula catches up to the skull movement (i.e., it returns to normal position) and the sensation is one of slowing down and eventually (in about 20 secoude) of stopping. If the person is stopped, then he or she will vemsv s sudden acceleration in the opposite direction because the bead tie aqw Blower than the endolymph, which causes the cupula to deflect in the opposite direction. If the person remains stopped, then the cupula returns to its level position giving a sensation of slowing down and stopping.
Since the three semicircular canals in each ear are at right angles, we can sense angular acceleration in any direction. When visual information conflicts with the sensation of motion, one feels dizzy and may feel sick. However, the mere sensation of
79
movement may produce illness in some individuals.
The vestibular system interacts with the visual system by producing alternating fast and slow eye movements (i.e., nystagmus) in addition to the sensation of movement. Nystagmus is produced because the eyes lag behind the angular acceleration, so a "brain center" makes periodic adjustments in order to maintain adequate foveal fixation. For example, one can move one's head back and forth and still maintain fixation.
Unfortunately, angular acceleration is not the only stimulus which will cause cupular deflection. The cupula and endolymph both have the same specific gravity. A very slight change in the specific gravity of either the fluid or the cupula may result in a cupular deflection, because the system becomes sensitive to gravity with certain head positions. Money and Miles (1975) claim that a change in the specific gravity of 3 parts in 100,000 will make the system sensitive to gravity.
Alcohol and some other drugs can alter the balance in specific gravity (Money and Miles, 1974; 1975). The base of the cupula has a rich blood supply. Foreign substances in the blood will diffuse rapidly into the cupula because of its proximity to the blood and alter the specific gravity of the cupula with respect to the endolymph. The direction of the nystagmus (i.e., the fast phase) will depend upon whether the drug makes the specific gravity of the cupula greater or less than that of the endolymph.
For example, within one hour after consuming alcohol a positional alcohol nystagmus (PAN) will occur. That is, if from supine position one rolls one's head to the side (i.e., so that the cupula is subject to gravity), a nystagmus, called PAN I, occurs in which the fast eye movements are down (e.g., Aschan and Bergated, 1975). Approximately four hours after drinking, the nystagmus stops. This is probably because sufficient alcohol has defused into the endolymph so that its specific gravity equals that of the cupula. Finally, as alcohol is eliminated from the blood stream, the endolympb ends up with a greater concentration of alcohol than the cupula. At this point, a positional nystagmus occurs in which the fast eye movements are up (PAN II). PAN II may persist up to 20 hours after consuming alcohol -- long after alcohol has been elimiuated from the bloodstream (Bill, Collins, and Schroeder, 1973). In fact, under conditions of increased gravity, PAN II has been found up to 40 hours after drinking alcohol (Oosterveld, 1970). The change in specific gravity also explains why the presence of congeners in alcohol can increase the amount of positional nystagmus (Murphree, Price, Greenberg, 1966; Ryback and Dowd, 1970). Excellent reviews of the PAN phenomenon are contained in Aschan, Bergstedt, Goldberg, and Laurell (1956); Fregly, Bergatedt, and Graybiel (1967); Hill, Collins, and Schroeder (1973); Aschan and Bergstedt (1975); Aschan (1958); and Goldberg (1953).
PAN I intensity provides a rather good indication of the peak BAC (Goldberg, 1963), but not of the duration of the intoxication. PAN
80
I
A
II intensity has been correlated with hangover effects (Goldberg, 1963).
2i Neural Mechanisms
Alcohol affects nystagmus in an indirect way -- by inhibiting the neural mechanisms involved in maintaining visual fixation. In some instances, visual fixation acts to inhibit nystagmus. Thus, if a vestibular signal tells one that rotation is occurring while visual information conflicts, then the visual information usually wins but often at the expense of producing nausea.
Irrigating the ears with warm or cold water starts the endolymph fluid moving and produces a nystagmus called caloric nystagmus (e.g., Schroeder, 1971a). Visual fixation will inhibit this nystagmus, but not after taking alcohol (Schroeder 1971a). Similarly, rotational nystagmus or post-rotational nystagmus can also be suppressed by visual fixation. But fixation again is ineffective after taking alcohol (Schroeder, 1971b). Both rotational and caloric nystagmus, however, are also reduced by low levels of arousal, suggesting the alcohol suppression may also be due to thQ sedative effect of tks drug (Oollins, 1963,; 1973)_
In all of the above examples, nystagmus is produced by vestibular
activation and alcohol acts to suppress that nystagmus. However, alcohol reduces nystagmus that is not produced by vestibular activation. Optokinetic nystagmus, for example, is produced by watching a rotating drum covered with alternating black and white vertical strips (Mizoi, Hishida, and Maeba, 1969). It consists of
a slow component in the direction of the moving object (or strips) and a quick phase in the opposite direction. Mizoi, Hishida, and Maeba (1969) describe four phases of optokinetic nystagmus: First, the slow eye movements keep up with the movement of the object. Second, the slow phase eye movements accelerate, but cannot keep up with the stimulus. Third, the slow phase attains its maximum speed. An average person can typically follow a moving object up to 30 degrees per second. Finally, the eye movement fails. Alcohol impairs optokinetic nystagmus by reducing the maximum speed that can be obtained (Mizoi et al., 1969).
The slow eye movements mentioned in connection with optokinetic nystagmus are called "smooth pursuit" movements (Rashbass, 1961; Robinson, 1968). This system for moving the eyes (1) requires a moving stimulus; (2) is virtually autonomic; and (3) is concerned primarily with matching the speed of the eye with the speed of the target (Robinson, 1968). These movements appear to function in providing a stable image on the retina (Rashbass, 1961). Smooth movements do nothing to correct for the position of the target, which is the function of the much faster "saccadic" eye movement system (Rashbass, 1961; Robinson, 1968).
The smooth pursuit system appears to be particularly vulnerable to the effects of alcohol (Wilkinson, Rime, and Purnell, 1974). This system normally can track movement at up to 30 degrees per second. Alcohol, however, reduces the maximal tracking speed and, in
81
s
sufficient concerntration, may eliminate smooth pursuit movementsentirely. When the BAC is high enough, only the saccadic system(which adjusts the eye for target position when the positiondifference is above some threshold) remains. Thus, at asufficiently high BAC, one can only follow a moving object with aseries of saccadic jerks.
3. Gaze HvstaAmus
Rashbass (1959) claims that the inability to maintain visual fixation is responsible for gaze nystagmus, a jerking movement of the eyes when they are deviated laterally. He argues that only the smooth pursuit system is involved in bringing the eye to a single spot. When the eyes are deviated to the side, slow drifting movements will occur toward the center depending upon the amount of lateral deviation and the ability of the smooth pursuit system to counteract these drifts. When the smooth pursuit system is inhibited by drugs such as alcohol or barbiturates, the slow drifts become large enough that saccadic jerks are required to maintain the lateral gaze.
Gaze nystagmus can be seen in 50-60% of all individuals if their eyes are deviated to the extremes, but it is considered to be pathological when it occurs at less extreme (i.e., 40 degrees) deviations (Toglia, 1976). Gaze nystagmus occurs with some types of brain damage (Baloh, Konrad, and Honruba, 1975), but it provides little localizing value in detecting the brain damage except to direct one's attention away from the peripheral labyrinths of the vestibular system. The data of Baloh et al (1975) does support Rashbass' theory in that pathological gaze nystagmus correlates with fixation instability. Five of their six patients with fixation instability also showed pathological gaze nystagmus.
Gaze nystagmus occurs under several different drugs, including alcohol (i.e., Aschan, 1958), barbiturates (e.g., Bender, O'Brien, 1946), antihistamines (Aschan, Bergstedt, and Goldberg, 1958) and phencyclidine (Linden, Lovejoy, and Costello, 1975). A number of other drugs may also produce gaze nystagmus, but most of the evidence is contained in clinical case reports.
Although some articles mention the occurrence of alcohol gaze nystagmus, few detail which parameters are important. Lehti (1976) indicated that the angle of onset from the midpoint of the visual field decreases as a function of increasing BAC. His data suggest that at a BAC of 0.10%, gaze nystagmus will occur at about 51 degrees and, at a BAC of 0.20%, gaze nystagmus will occur at about 29 degrees. The correlation between the angle of onset and the BAC was - .788 for 56 individuals.
Most other studies in which gaze nystagmus has been measured involve a cutoff point of 30-40 degrees. Use of a cutoff may explain some of their conclusions. For example, Aschan (1958) used a cutoff of 40 degrees and reported that gaze nystagmus had a distinct threshold BAC of approximately 0.06%. Umeda and Sakata (1978) used a cutoff of 30 degrees and concluded that it was one of
82
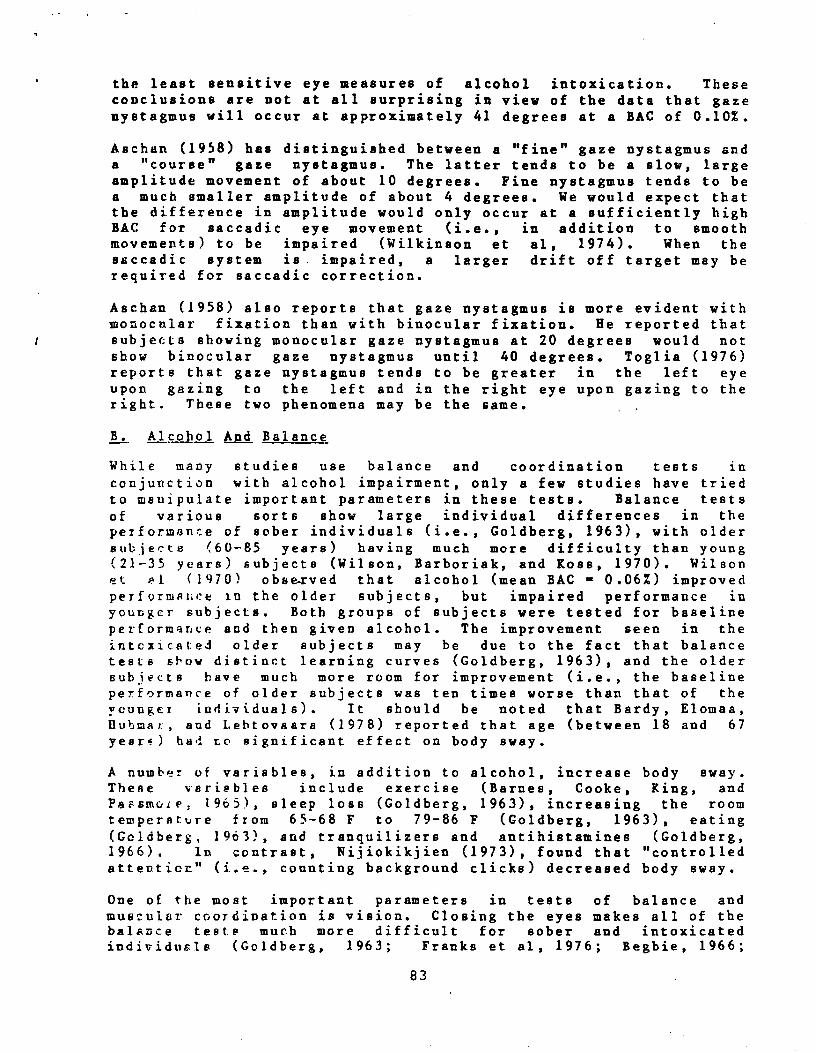
I
the least sensitive eye measures of alcohol intoxication. These conclusions are not at all surprising in view of the data that gaze nystagmus will occur at approximately 41 degrees at a BAC of 0.10%.
Aschan (1958) has distinguished between a "fine" gaze nystagmus and a "course" gaze nystagmus. The latter tends to be a slow, large amplitude movement of about 10 degrees. Fine nystagmus tends to be a much smaller amplitude of about 4 degrees. We would expect that the difference in amplitude would only occur at a sufficiently high BAC for saccadic eye movement (i.e., in addition to smooth movements) to be impaired (Wilkinson et al, 1974). When the saccadic system is. impaired, a larger drift off target may be required for saccadic correction.
Aschan (1958) also reports that gaze nystagmus is more evident with monocular fixation than with binocular fixation. He reported that subjects showing monocular gaze nystagmus at 20 degrees would not show binocular gaze nystagmus until 40 degrees. Toglia (1976) reports that gaze nystagmus tends to be greater in the left eye upon gazing to the left and in the right eye upon gazing to the right. These two phenomena may be the same.
B. Alcohol And Balance
While many studies use balance and coordination tests in conjunction with alcohol impairment, only a few studies have tried to manipulate important parameters in these tests. Balance tests
of various sorts show large individual differences in the performance of sober individuals (i.e., Goldberg, 1963), with older sub•jecte (60-85 years) having much more difficulty than young (21-35 years) subjects (Wilson, Barboriak, and Ross, 1970). Wilson et a.1 (1970) obse-rved that alcohol (mean BAC - 0.06%) improved performance in the older subjects, but impaired performance in younger subjects. Both groups of subjects were tested for baseline performance and then given alcohol. The improvement seen in the intcxicated older subjects may be due to the fact that balance tests show distinct learning curves (Goldberg, 1963), and the older subiects have much more room for improvement (i.e., the baseline performance of older subjects was ten times worse than that of the younger individuals). It should be noted that Bardy, Elomaa, IIuhmar, and Lehtovaara (1978) reported that age (between 18 and 67 years) had to significant effect on body sway.
A number of variables, in addition to alcohol, increase body sway. These variables include exercise (Barnes, Cooke, Ring, and Passmo:e, 1965), sleep loss (Goldberg, 1963), increasing the room temperature from 65•-68 F to 79-86 F (Goldberg, 1963), eating (Goldberg, 1963), and tranquilizers and antihistamines (Goldberg, 1966). In contrast, Nijiokikjien (1973), found that "controlled attentier" (i.e., counting background clicks) decreased body sway.
One of the most important parameters in tests of balance and mus:ular coordination is vision. Closing the eyes makes all of the balance tests much more difficult for sober and intoxicated individuals (Goldberg, 1963; Franks et al, 1976; Begbie, 1966;
83
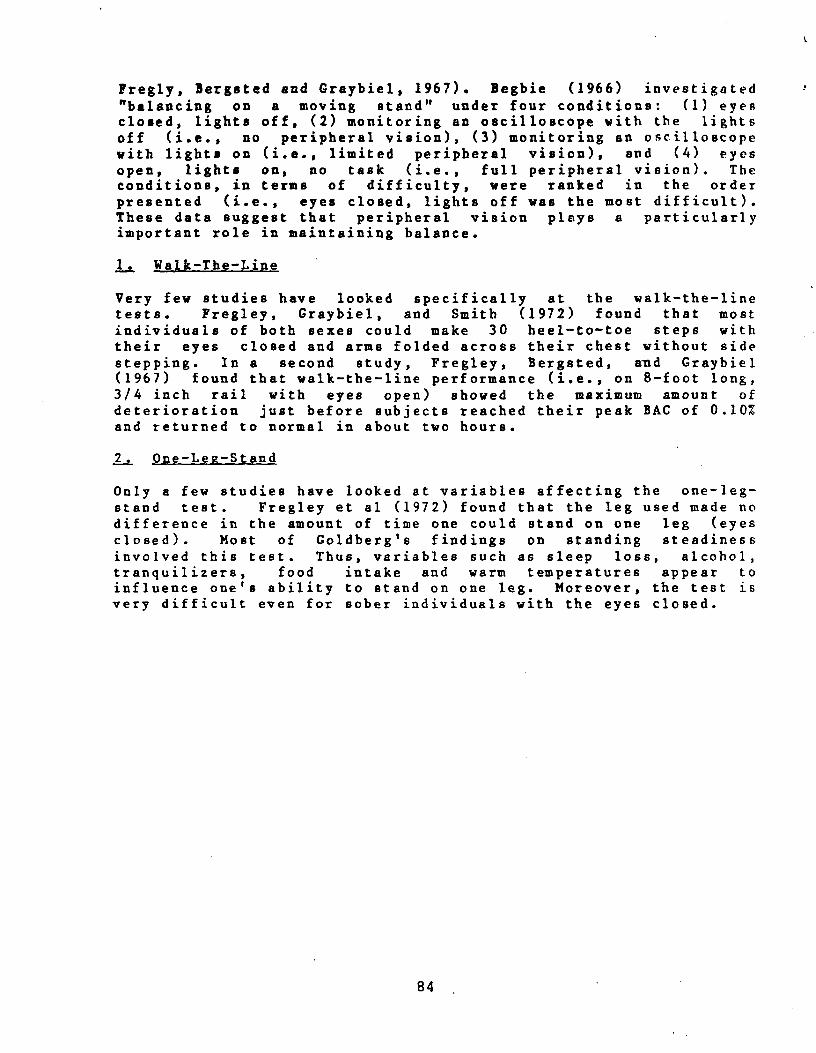
t
Fregly, Bergsted and Graybiel, 1967). Begbie (1966) investigated "balancing on a moving stand" under four conditions: (1) eyes closed, lights off, (2) monitoring an oscilloscope with the lights off (i.e., no peripheral vision), (3) monitoring an oscilloscope with lights on (i.e., limited peripheral vision), and (4) eyes open, lights on, no task (i.e., full peripheral vision). The conditions, in terms of difficulty, were ranked in the order presented (i.e., eyes closed, lights off was the most difficult). These data suggest that peripheral vision plays a particularly important role in maintaining balance.
1. Walk-The-Line
Very few studies have looked specifically at the walk-the-line tests. Fregley, Graybiel, and Smith (1972) found that most individuals of both sexes could make 30 heel-to-toe steps with their eyes closed and arms folded across their chest without side stepping. In a second study, Fregley, Bergeted, and Graybiel (1967) found that walk-the-line performance (i.e., on 8-foot long, 3/4 inch rail with eyes open) showed the maximum amount of deterioration just before subjects reached their peak BAC of 0.10% and returned to normal in about two hours.
2_, One-Lest-Stand
Only a few studies have looked at variables affecting the one-legstand test. Fregley et al (1972) found that the leg used made no difference in the amount of time one could stand on one leg (eyes closed). Most of Goldberg's findings on standing steadiness involved this test. Thus, variables such as sleep loss, alcohol, tranquilizers, food intake and warm temperatures appear to influence one's ability to stand on one leg. Moreover, the test is very difficult even for sober individuals with the eyes closed.
84
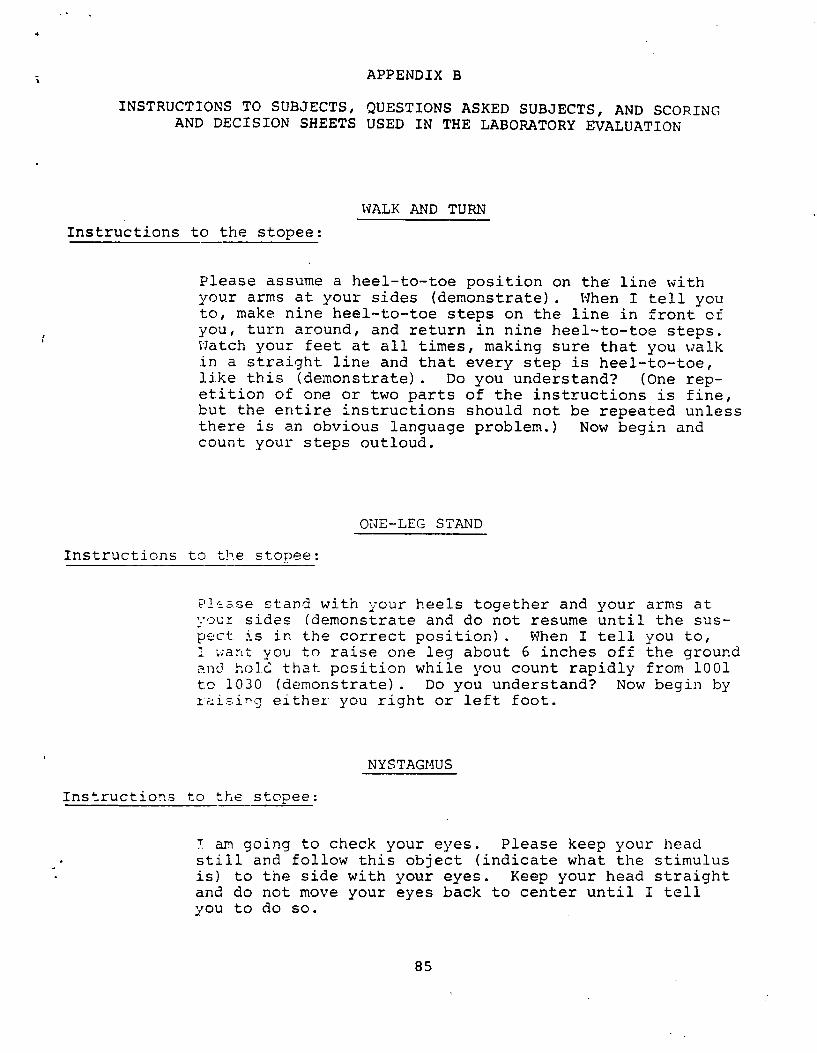
APPENDIX B
INSTRUCTIONS TO SUBJECTS, QUESTIONS ASKED SUBJECTS, AND SCORING AND DECISION SHEETS USED IN THE LABORATORY EVALUATION
WALK AND TURN
Instructions to the stopee:
Please assume a heel-to-toe position on the line with your arms at your sides (demonstrate). When I tell you to, make nine heel-to-toe steps on the line in front of you, turn around, and return in nine heel-to-toe steps. Watch your feet at all times, making sure that you walk in a straight line and that every step is heel-to-toe, J.i.ke this (demonstrate). Do you understand? (One repetition of one or two parts of the instructions is fine, but the entire instructions should not be repeated unless there is an obvious language problem.) Now begin and count your steps outloud.
ONE-LEG STAND
Instructions to the stopee:
Please stand with your heels together and your arms at vour sides (demonstrate and do not resume until the suspect is in the correct position). When I tell you to, I ;rant you to raise one leg about 6 inches off the ground anc3 hoIc: that position while you count rapidly from 1001 to 1030 (demonstrate). Do you understand? Now begin by 2ai=:ing either you right or left foot.
NYSTAGMUS
Instructions to the stopee:
T am going to check your eyes. Please keep your head still and follow this object (indicate what the stimulus is) to the side with your eyes. Keep your head straight and do not move your eyes back to center until I tell you to do so.
85
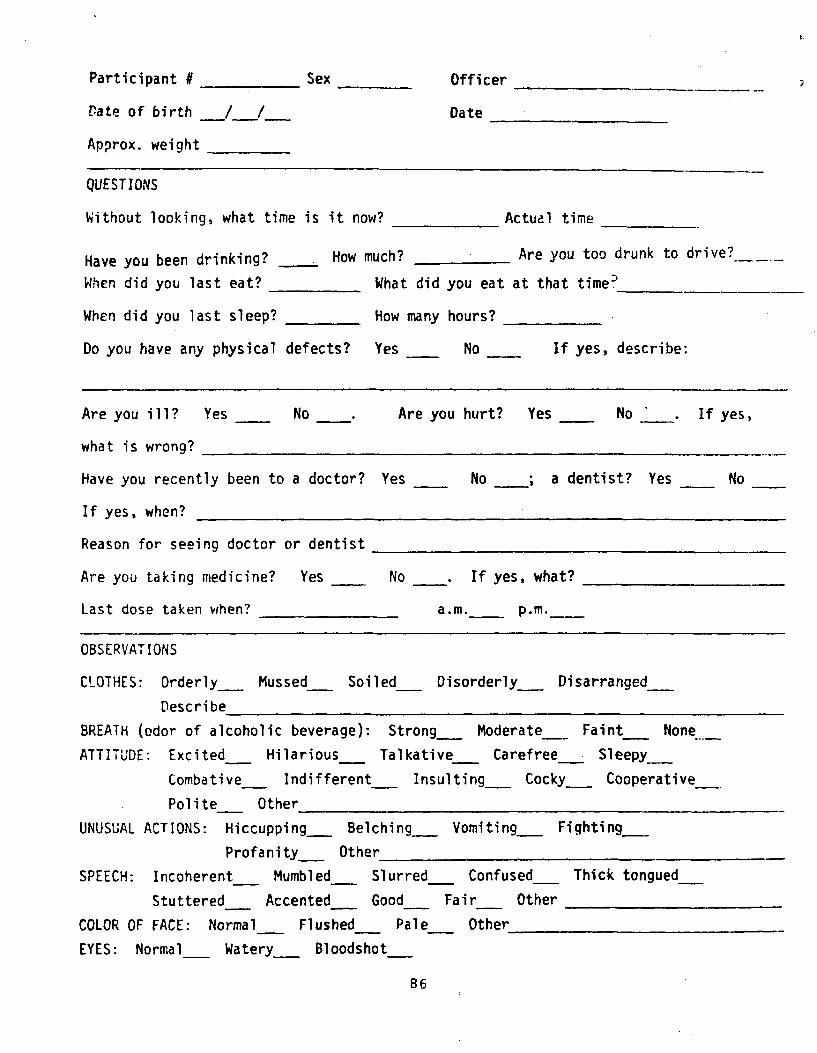
Participant # Sex Officer
Bate of birth / / Date
Approx. weight
QUESTIONS
Without looking, what time is it now? Actual time
Have you been drinking? How much? Are you too drunk to drive?.__ _____
When did you last eat? What did you eat at that time'
When did you last sleep? How many hours?
Do you have any physical defects? Yes No If yes, describe:
Are you ill? Yes No Are you hurt? Yes No If yes,
what is wrong?
Have you recently been to a doctor? Yes No ; a dentist? Yes No
If yes, when?
Reason for seeing doctor or dentist
Are you taking medicine? Yes No If yes, what?
Last dose taken when? a.m.
OBSERVATIONS
CLOTHES: Orderly Mussed Soiled Disorderly Disarranged
Describe
BREATH (odor of alcoholic beverage): Strong Moderate Faint None-
ATTITUDE: Excited Hilarious Talkative Carefree Sleepy
Combative Indifferent Insulting Cocky Cooperative
Polite Other
UNUSUAL ACTIONS: Hiccupping Belching Vomiting Fighting
Profanity Other
SPEECH: Incoherent Mumbled Slurred Confused Thick tongued_
Stuttered Accented Good Fair Other
COLOR OF FACE: Normal Flushed Pale Other _
EYES: Normal Watery Bloodshot
86
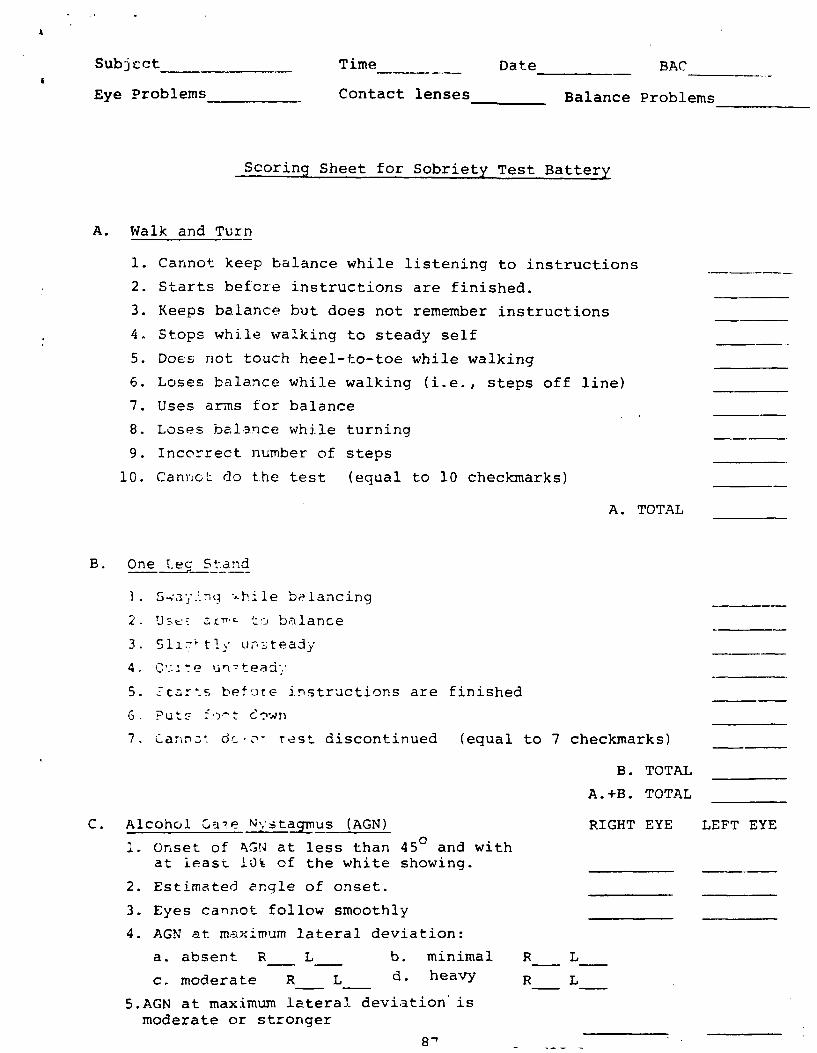
Subject Time Date BAC-
Eye Problems Contact lenses Balance Problems
Scoring Sheet for Sobriety Test Battery
A. Walk and Turn
1. Cannot keep balance while listening to instructions
2. Starts before instructions are finished.
3. Keeps balance but does not remember instructions
4. Stops while walking to steady self
5. Does not touch heel-to-toe while walking
6. Loses balance while walking (i.e., steps off line)
7. Uses arms for balance
8. Loses balance while turning
9. Incorrect number of steps
10. Cannot do the test (equal to 10 checkmarks)
A. TOTAL
B. One-Leg Stand
1. .ri;r3J:."iq -^hi1e balancing
2. 'J_t:: ar** t•^) balance
3. Sli-`tl unsteady
4.
5. - c, : s before instructions are finished
6. Puts cc.sn
7. ^annc^ ar Test discontinued (equal to 7 checkmarks)
B. TOTAL
A.+B. TOTAL
C. Alcohol Gale N stagmus (AGN) RIGHT EYE LEFT EYE
1. Onset of AGW at less than 450 and withat least 10% of the white showing.
2. Estimated angle of onset.
3. Eyes cannot follow smoothly
4. AGN at maximum lateral deviation:
a. absent R L b. minimal R L
c. moderate R L d. heavy R L
5.AGN at maximum lateral. deviation' ismoderate or stronger
8'
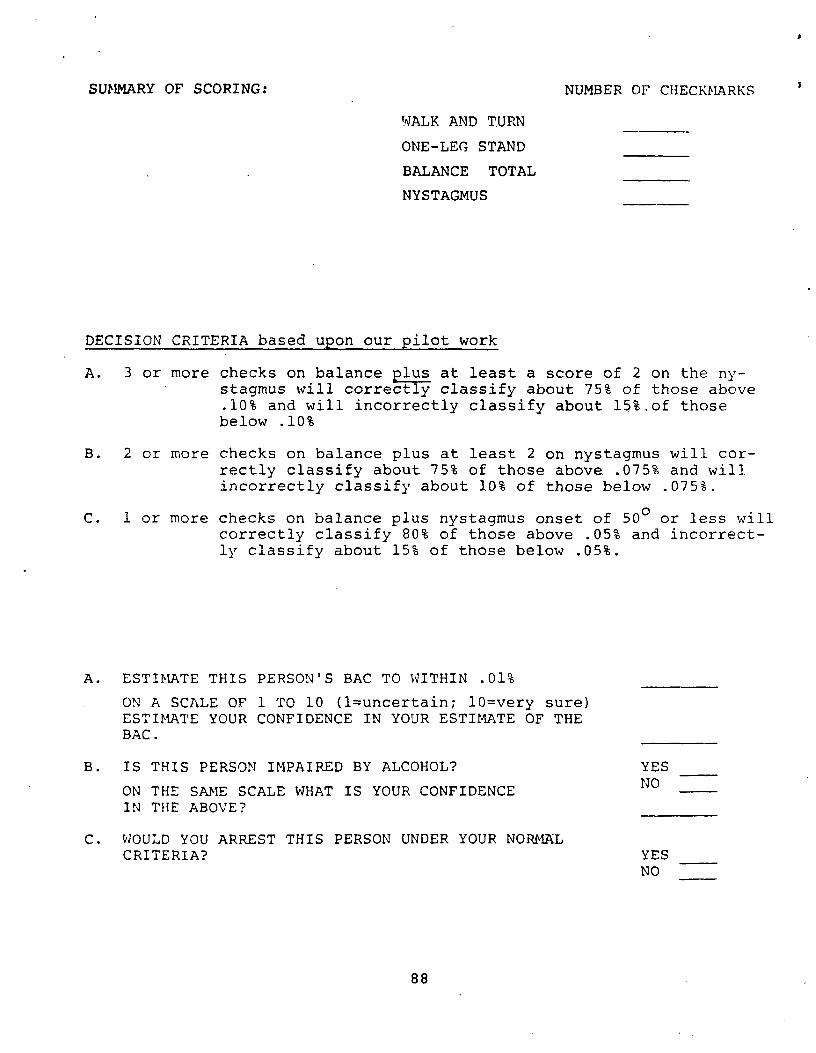
I SUMMARY OF SCORING: NUMBER OF CHECKMARKS
WALK AND TURN
ONE-LEG STAND
BALANCE TOTAL
NYSTAGMUS
DECISION CRITERIA based upon our pilot work
A. 3 or more checks on balance plus at least a score of 2 on the nystagmus will correctly classify about 75% of those above .10% and will incorrectly classify about 15%,of those below .10%
B. 2 or more checks on balance plus at least 2 on nystagmus will correctly classify about 75% of those above..075% and will incorrectly classify about 10% of those below .075%.
C. 1 or more checks on balance plus nystagmus onset of 500 or less will correctly classify 80% of those above .05% and incorrectly classify about 15% of those below .05%.
A. ESTIMATE THIS PERSON'S BAC TO WITHIN .01%
ON A SCALE OF 1 TO 10 (1=uncertain; 10=very sure) ESTIMATE YOUR CONFIDENCE IN YOUR ESTIMATE OF THE BAC.
B. IS THIS PERSON IMPAIRED BY ALCOHOL? YES NO
ON THE SAME SCALE WHAT IS YOUR CONFIDENCE IN THE ABOVE?
C. WOULD YOU ARREST THIS PERSON UNDER YOUR NORMAL CRITERIA? YES
NO
88