Embed Size (px)
Citation preview

SRAC Twenty-third Annual Progress Report, December, 2010 15
Development and Evaluation of Pond Inventory Methods
Reporting PeriodMay 1, 2007 - August 31, 2010
Funding Level Year 1 .................................................................... $157,818Year 2 .................................................................... $137,158Total ....................................................................... $294,976
DEVELOPMENT AND EVALUATION OFPOND INVENTORY METHODS
Participants Louisiana State University ................................... Ray McClain, Robert RomaireMississippi State University ................................ Doug MinchewUniversity of Arkansas at Pine Bluff ................ David Heikes, Steeve Pomerleau, Yong-Woo LeeUniversity of Florida ........................................... Craig WatsonUniversity of Mississippi ..................................... James Chambers, John Heffington
PROJECT OBJECTIVES
1. Determine the most accurate and reliable methodologies for estimating ornamental fish density andsize distribution in commercial ponds.
2. Determine the most accurate and reliable methodologies for estimating crawfish density and sizedistribution in experimental ponds and develop a means to estimate annual yield and harvest sizefrom sampling methodologies.
3. Modify the Aquascanner Catfish SONAR system to size individual catfish collected from commer-cial catfish ponds.
4. Develop and evaluate several down-looking and low frequency side-scan sonar technologies todetermine numbers of channel catfish in ponds.
5. Develop and evaluate a catfish trawl and portable computing technologiesto estimate size distribu-tion and biomass in catfish production ponds.
16 SRAC Twenty-third Annual Progress Report, December, 2010
Development and Evaluation of Pond Inventory Methods
PROGRESS AND PRINCIPAL ACCOMPLISHMENTS
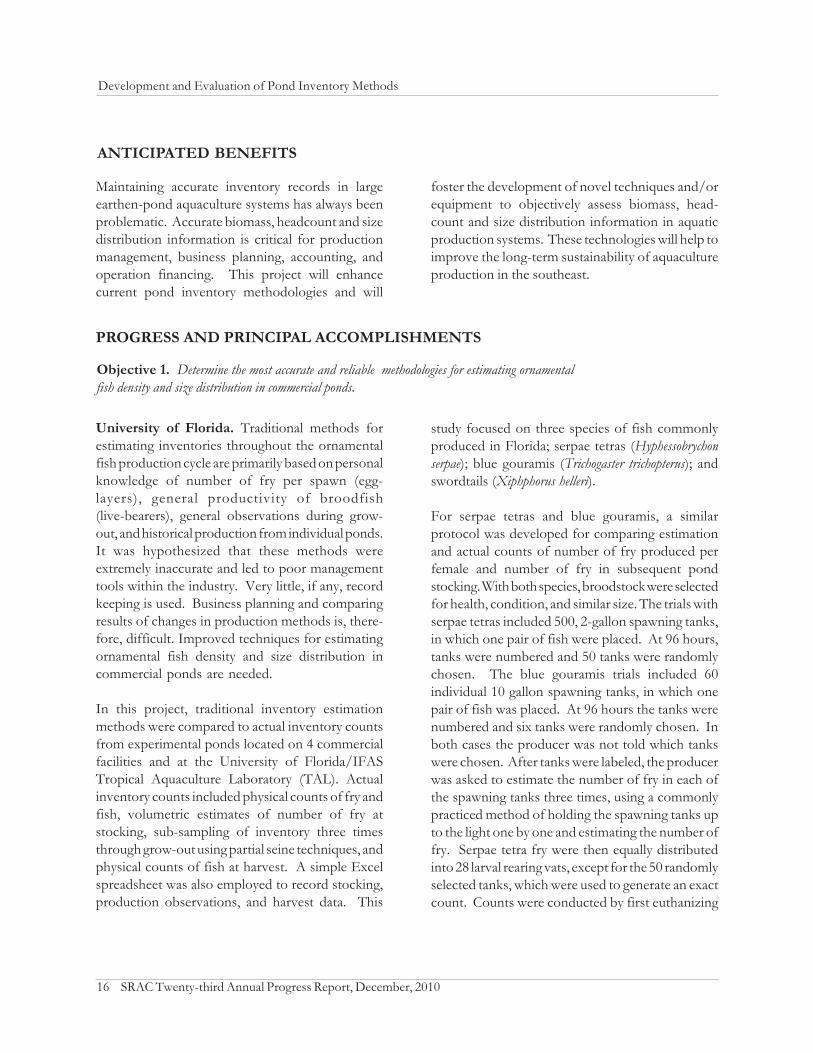
ANTICIPATED BENEFITS
Maintaining accurate inventory records in largeearthen-pond aquaculture systems has always beenproblematic. Accurate biomass, headcount and sizedistribution information is critical for productionmanagement, business planning, accounting, andoperation financing. This project will enhancecurrent pond inventory methodologies and will
foster the development of novel techniques and/orequipment to objectively assess biomass, head-count and size distribution information in aquaticproduction systems. These technologies will help toimprove the long-term sustainability of aquacultureproduction in the southeast.
Objective 1. Determine the most accurate and reliable methodologies for estimating ornamentalfish density and size distribution in commercial ponds.
University of Florida. Traditional methods forestimating inventories throughout the ornamentalfish production cycle are primarily based on personalknowledge of number of fry per spawn (egg-layers), general productivity of broodfish(live-bearers), general observations during grow-out, and historical production from individual ponds.It was hypothesized that these methods wereextremely inaccurate and led to poor managementtools within the industry. Very little, if any, recordkeeping is used. Business planning and comparingresults of changes in production methods is, there-fore, difficult. Improved techniques for estimatingornamental fish density and size distribution incommercial ponds are needed.
In this project, traditional inventory estimationmethods were compared to actual inventory countsfrom experimental ponds located on 4 commercialfacilities and at the University of Florida/IFASTropical Aquaculture Laboratory (TAL). Actualinventory counts included physical counts of fry andfish, volumetric estimates of number of fry atstocking, sub-sampling of inventory three timesthrough grow-out using partial seine techniques, andphysical counts of fish at harvest. A simple Excelspreadsheet was also employed to record stocking,production observations, and harvest data. This
study focused on three species of fish commonlyproduced in Florida; serpae tetras (Hyphessobrychonserpae); blue gouramis (Trichogaster trichopterus); andswordtails (Xiphphorus helleri).
For serpae tetras and blue gouramis, a similarprotocol was developed for comparing estimationand actual counts of number of fry produced perfemale and number of fry in subsequent pondstocking. With both species, broodstock were selectedfor health, condition, and similar size. The trials withserpae tetras included 500, 2-gallon spawning tanks,in which one pair of fish were placed. At 96 hours,tanks were numbered and 50 tanks were randomlychosen. The blue gouramis trials included 60individual 10 gallon spawning tanks, in which onepair of fish was placed. At 96 hours the tanks werenumbered and six tanks were randomly chosen. Inboth cases the producer was not told which tankswere chosen. After tanks were labeled, the producerwas asked to estimate the number of fry in each ofthe spawning tanks three times, using a commonlypracticed method of holding the spawning tanks upto the light one by one and estimating the number offry. Serpae tetra fry were then equally distributedinto 28 larval rearing vats, except for the 50 randomlyselected tanks, which were used to generate an exactcount. Counts were conducted by first euthanizing
SRAC Twenty-third Annual Progress Report, December, 2010 17
Development and Evaluation of Pond Inventory Methods
the fry in each spawning tank and transferring fryfrom one spawning tank at a time into a clean, whitebucket. Fry were counted by carefully aspiratingeach fry into a 1-ml pipette. For the blue gouramis,the six tanks which were randomly selected wereeuthanized and then hand counted using the samemethod. The actual count was then compared to theproducer’s estimates.
Fry from each remaining tank were then reared for3 weeks before being stocked into two grow-outponds (6-feet deep, 0.04-acres). The producer wasagain asked to estimate the number of juvenile fishstocked into each of the two grow-out ponds, andselected 10 vats for each pond. To generate ourcount we randomly selected eight vats and countedeach juvenile. For the blue gouramis, a simplereduction method was employed to enumerate thefry in two, 10 gallon tubs which are used to transportfry to the ponds. The water was gently mixed tomaximize equal distribution of fry in the watervolume, and three individual 50-mL samples werecounted. These reduction estimates were thencompared to the producers visual tub estimates. Thefry were then stocked into 2 growout ponds. Allgrow-out ponds were visually monitored twicedaily by the producer and study staff during dailyfeedings and weekly for the duration of the 4-monthgrow-out cycle. Actual harvest numbers weresupplied by the producer which reflected exact salesreceipts. For the swordtail trials, two commercialproducers and ponds at the Tropical AquacultureLaboratory were used. Attempts to assess inventorieson two participating commercial facilities werediscontinued due to catastrophic losses whichoccurred on both farms during both summersduring this study. Using data collected at theTropical Aquaculture Laboratory, we were able toevaluate expected production of swordtails in openponds. Based on previous data from tank studies,predicted production = 1.32 fry/female/day. Fiveponds were each stocked with 200 female and50 male swordtails, and fed a standard diet for12 weeks (note: 12 weeks is the typical time needed
to reach market size for swordtails).
Use of a simple Excel spread sheet to accuratelyrecord stocking dates, number stocked, regularobservations, and harvest data has proven costeffective and beneficial to farms employing it. Anunexpected result is that the local USDA FarmService Agency is now using the Excel sheetsdeveloped as a handout to producers enrolling in theNAP program as an example of the data they arerequesting during a disaster program. Numbers offry generated in hatcheries for serpae tetras and bluegouramis using traditional methods of estimating bysight were grossly underestimated by 3.8 to 4.2 and8.2 to 8.5 times, respectively. In individual tanks, themagnitude of the difference between actual countsand the producer’s estimates increased dramaticallyas the total number of fish in the tank increased.However, the producer’s estimate of the amount ofjuveniles stocked into each pond was more accurate,and exceeded the actual estimate only by 9.78%.This showed that significant losses are incurredduring the larval rearing stage. Better nutrition (i.e.simply increasing the amount of artemia fed to thelarval rearing tanks) has led to increased survival atthis stage and decreased man-hours in setting upbreeding tanks. Similarly, the blue gourami trialshowed that actual harvest data was significantly lessthan anticipated. Lowering the stocking rates has
Results at a glance...
Improved inventory methods based onthis project are being applied by acommercial ornamental fish producer tomore than 60 species of fish, resulting insignificant improvement in productionefficiency. Another producer reportsincreased revenues of almost $400,000using improved methods based, in part,on this project.

18 SRAC Twenty-third Annual Progress Report, December, 2010
Development and Evaluation of Pond Inventory Methods
resulted in similar harvest numbers indicating thatinitial larval survival is possible and that fewerbroodstock are required.
Physical counts of egg-layer fry are now recom-mended for all species, at least initially, as opposedto using visual estimates. Savings and increasedproduction have resulted in a 50% reduction in therequired broodstock, man-hours, and grow-outtime for one farm participating, and they have nowemployed these methods to 60 varieties of fish.Another producer reports similar percentages andincreased revenues of $392,000 based on improvedmanagement. Several problems occurred with thisproject as designed. Periodic sampling of fish inopen ponds, during production, using seine netsproved unacceptable and ineffective. Fish captured,counted, and returned to the pond experiencedmortalities, and sampling was extremely inaccurateusing a partial seine method. Increasing the portionof the pond seined to increase the accuracy resulted
in increased mortalities. This method is not recom-mended for farmers to assess standing crop duringproduction of the species studied. The summerweather in west central Florida during both years ofthis study resulted in catastrophic losses on both ofthe commercial swordtail farms studied, whichresulted in no usable data. However, work con-ducted at the Tropical Aquaculture Laboratory hasbeen useful, as previous to this study there was nodata available to accurately predict this productionin open ponds. Ponds were harvested and all fishcounted, resulting in an average total inventory of20,292 fish, 90% of what was predicted. Based onthis, farms can anticipate an average production of1.18 fry/female/day in open ponds after 12 weeksof production for swordtails. Recommendationsbased on results of these studies are being imple-mented in Extension programs for ornamental fishproducers.
Objective 2. Determine the most accurate and reliable methodologies for estimating crawfish densityand size distribution in experimental ponds and develop a means to estimate annual yield and harvestsize from sampling methodologies.
Louisiana State University Agricultural Center.Crawfish farming in Louisiana depends upon naturalreproduction from indigenous or supplementedbroodstock to populate ponds. This subjects growersto great variation in yield and harvest size due tolarge natural variations in adult survival andreproductive success from year to year and pond topond. Furthermore, these problems are exacerbatedby a lack of predictability and a reliable means ofassessing pond inventory. Currently, there is noreliable means of accurately determining the successor failure of young-of-the-year recruitment. Withouta means of determining population density andstructure prior to initiation of harvesting, economicand business planning and implementation ofcorrective measures are not viable tools for theproducer. Therefore, this project attempted to
eliminate natural recruitment and instead accomplishthe task of populating ponds with stocking ofhatchlings at known numbers. This was done so thatsystematic sampling efforts could be employedwith the intent of establishing some kind ofrelationship between sampling (with different gear)and known populations, and furthermore, todetermine if harvest results could be relativelyassociated with sampling outcomes.
A rice crop was established during the summers of2006 and 2007 in 12, 1-acre experimental plots atthe LSU AgCenter’s Rice Research Station. Followingrice harvest, the pond was managed for crawfishproduction according to typical rice-crawfishrotational practices in the region. Ponds were notstocked with brood crawfish and fields were

SRAC Twenty-third Annual Progress Report, December, 2010 19
Development and Evaluation of Pond Inventory Methods
Results at a glance...
additionally treated with a pyrethroid insecticideprior to the permanent flood to eliminate migrantcrawfish into the field. Ponds were completelydrained and re-flooded with fresh water after 3days. Crawfish populations were subsequentlyestablished by stocking of hatchlings, spawned underlaboratory conditions, at known densities and atpredetermined timing post flooding. Treatments
consisted of a low (3 crawfish/m2) or high (6 to 7crawfish/m2) stocking rate and either single or multipleage classes (biweekly over two months) in a factorialarrangement of treatments.
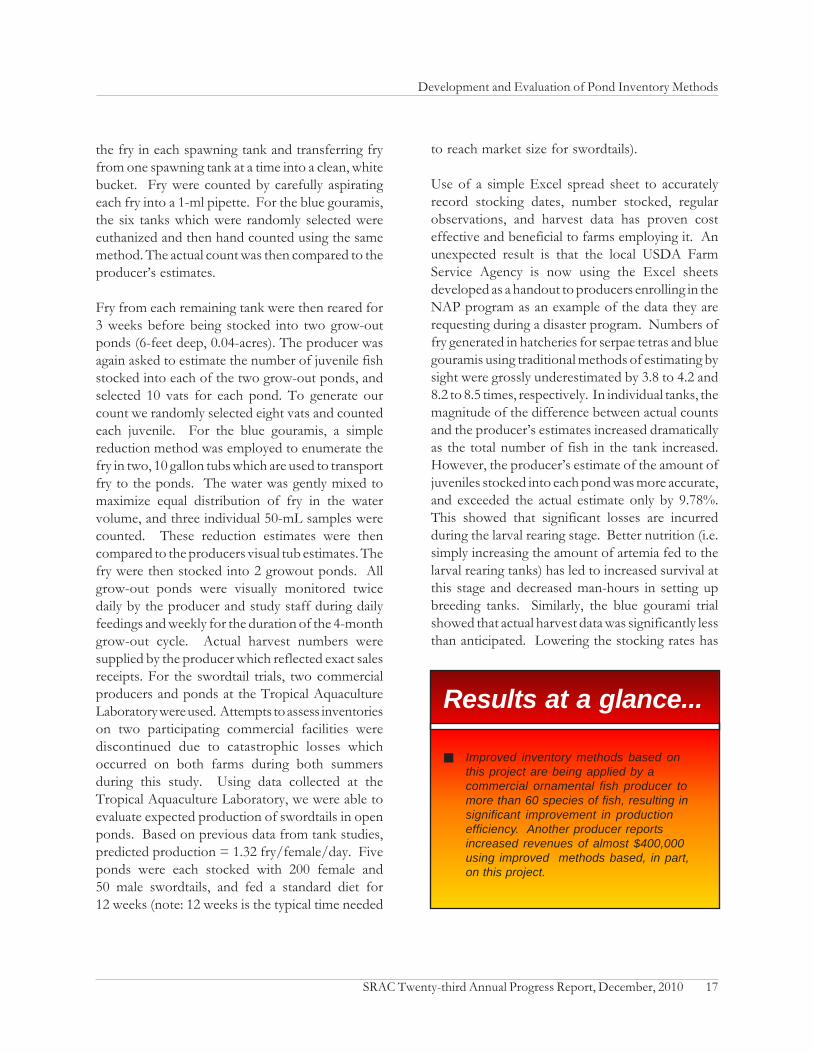
Systematic population sampling was conducted priorto initiation of harvests and consisted of employingfour sampling gear: large mesh traps, consisting ofstandard 0.75-inch square mesh pyramid traps, smallmesh traps, consisting of common 0.25-inch wiremesh minnow traps with 1.25-inch funnel openingsat each end, long handle dip nets (3-mm mesh), andspecially constructed drop sampling devices (0.5-m2
surface area; Figure 1). The drop sampler consistedof a metal cylinder that was rigged to slide up anddown on three legs with a trigger that allowed theunit to be “set” in the up position with 50 feet ofrope, whereby the unit could be placed in the pondsome distance and triggered from the levee toprevent disturbing of crawfish during sampling.When “dropped,” the sampler formed an enclosureentrapping any crawfish that were captured withinthe interior of the cylinder. Water was pumped outand crawfish counted and sized. Crawfish catch,
Figure 1. A dropsampler, set and readyto trip with a slight tugon the rope from thelevee. Crawfish areretrieved by pumpingout the water from thecaisson while thecylinder walls are incontact with the mudbottom, exposingcrawfish trappedwithin.
Results at a glance...
Sampling with test traps, dip-net sweeps,and a passive experimental samplergenerally were good indicators ofrelative crawfish recruitment density andpotential yield. The most accurate pondinventory methodologies were those thatsampled around the pond margin ratherthan in the pond interior and occurredseveral months after the simulatedrecruitment period.
20 SRAC Twenty-third Annual Progress Report, December, 2010
Development and Evaluation of Pond Inventory Methods
total and by size category, were noted for eachsampling effort.
Annual yield of market-size crawfish averaged 194pounds/acre for year 1 and 360 pounds/acre foryear 2, which was lower than the state wide averageof about 600 pounds/acre. Average overall capturerate based on number of crawfish stocked was12.8% in year 1 and 26.2% in year 2. This seems low,but without a means to accurately assess recruitmentdensity in commercial ponds, it is unknown howwell these numbers represent the percent recoveryof commercial operations. Correlation coefficient isa measure of how well one group of datacorresponds to a second group of data. Sampling
efficacy was highly variable from year to year andfrom gear to gear in this study; but in general,sampling results using baited large-mesh traps (latein the season) and the passive drop sampler werewell correlated to both stocking density and yield.
While these findings provided a basic foundationfor better understanding of the relationships betweeninitial recruitment numbers, surviving populationdensity and resulting yields in crawfish aquaculturesuggests that timely sampling has merit for assessingrelative population inventories. Further research isneeded to develop applied management optionsand recommendations for maximizing profits basedon sampling outcomes.
Objective 3. Modify the Aquascanner Catfish SONAR system to size individual catfish collectedfrom commercial catfish ponds.
National Center for Physical Acoustics at theUniversity of Mississippi. Pond production ofchannel catfish is the largest sector of domesticaquaculture. Pond management strategies can becompromised because of inaccurate inventoriesresulting in continuous culture for several yearswithout a total harvest. Research was proposed touse an acoustic system to provide the size distributionof a pond to aid management decisions whichrequire inventory information. A current method todetermine the size distribution of a pond is to pull asub-sample seine net across a pond to obtain asample of the fish and manually weigh them in atime-consuming process. The work presented herestill uses a sub-sample seine net to collect a sample offish but uses acoustic backscatter from the fish asthey swim back to the pond to determine the sizedistribution of the fish in lieu of the manual weightmeasurements.
A prototype acoustic measurement system (Figures 2and 3) was assembled and tested in various com-mercial and research ponds in the Mid-south. Thesystem consisted of a SONAR system operating at
460 kHz placed on top of a PVC floatation systemwhich was attached to a 6-inch PVC pipe extendingfrom the float into the pond. The pipe allowed fishto swim back into the pond after being seined andalso acted to restrict fish movement relative to theSONAR’s active element, thereby reducing varia-tion in sound reflection due to fish orientation. Asfish pass through the pipe, they are pinged byacoustic pulses and the return echo amplitude isrecorded and stored on the unit for future analysis.Measurements were made in pens and ponds at theUniversity of Arkansas Pine Bluff as well as com-mercial ponds at Wilmot, AR. In the preliminarytests, both the acoustic reflections as well as theactual fish weights were collected, on a fish-by-fishbasis, to develop an empirical prediction routinerelating fish weight to acoustic reflection, also knownas the target strength. This prediction routine waslater used in blind tests on ponds in Wilmot, AR, PineBluff, AR (UAPB) and the National WarmwaterAquaculture Center (NWAC) in Stoneville, MS. Theresults from the acoustics predictions were com-pared against actual measured weights to determineefficacy.

SRAC Twenty-third Annual Progress Report, December, 2010 21
Development and Evaluation of Pond Inventory Methods
Measurements show a trend of increasing reflectivity,or target strength, with increasing weight of fish, butthe variances between predicted and measuredweights for individual fish are larger than expected.For instance some small fish (0.5 pound) returnedecho amplitudes comparable to larger (5 pound)brood fish. It is supposed that fish movement,changes in orientation or entrained air bubbles as fish
swim back into the pond from the flotation devicemay be responsible for the variations. The data alsoshowed a point of diminishing returns in that largerand larger fish return a diminishingly smaller increasein target strength (Figure 4). Echoes from fishweighing 8 pounds, for example, were are notmarkedly different than 4-pound fish. Such a scenario,in an inversion process which uses the acoustic echo
Figure 2. Thecatfish sizingsystem withelectronics andbattery mountedon board andbubbler system inplace to providecalibrated signalin data.
Figure 3.ModifiedAquascannerCatfish SONARsystem being usedto measureindividual fish.

22 SRAC Twenty-third Annual Progress Report, December, 2010
Development and Evaluation of Pond Inventory Methods
to predict the weight of the fish, makes electronicerrors problematic in potentially predicting largefish weights. The use of the data, in a statistical sensehowever, may have value. While predicted fishweights differ from actual weights for individualfish (mitigating the technology for use in say vaccinedelivery), the errors may cancel so that predictionsfor a large enough sample, may be useful.
Two blind tests were taken at Pine Bluff andWilmot, AR. The model predicted average fishweights of 1.42 pounds/fish and 2.15 pounds/fishfor populations that had measured average weightsof 1.43 and 2.34 pounds/fish, respectively, givingerrors of -0.5% to -8%. Four additional blindmeasurements were later taken at Stoneville, MS.These tests consistently under-predicted measuredfish weight by an average of 30%. It is unclear if thisdiscrepancy is due to local pond-specific issues, thedistribution of sizes in the fish population, anequipment-specific issue or some other factor. Theprediction model used was developed to minimizeerrors of both the average weight and standarddeviation in weight of a sample. It may well be that
improvements can be made in estimating the averageweight of a sample but presumably this will come atthe expense of the accuracy of the standard deviation.It is also possible that improvements (andconsistency) in how the fish move through the pipemay reduce variations in the reflectivity of the fishwhich should improve predictions. Data and theprediction algorithm are being investigated furtheras part of a graduate thesis.
Results at a glance...
An acoustic backscatter system hasbeen built to measure the target strengthof individual fish from a harvestedpopulation. A relationship between fishweight and acoustical target strength wasdeveloped into a model that can beused to predict the population weightdistribution of the fish harvested.
-70
-65
-60
-55
-50
-45
-40
0 2 4 6 8 10
Measured weight (lbs)
TS (d
B)
netpen 1netpen 2brood pond
Figure 4. Relationshipbetween target strength(TS) and measured fishweight from a pond atPine Bluff, Arkansas.

SRAC Twenty-third Annual Progress Report, December, 2010 23
Development and Evaluation of Pond Inventory Methods
Objective 4. Develop and evaluate several down-looking and low frequency side-scan sonartechnologies to determine numbers of channel catfish in ponds.
Mississippi State University. Previous work withcustom-fabricated side-scanning SONAR showedthat the technology may have application for pond-scale counting of fish as part of inventory assessmentin catfish farming. Advances in the private sector onother applications of side-scanning SONAR showedfurther promise, with the possibility of not onlyassessing fish numbers, but also individual fish weights,which could then be combined to provide popula-tion size distributions and total fish biomass.
Initial research focused on testing a 997cHumminbird® side-imaging SONAR. Thetransducer has down-looking as well as side-scanningcapabilities. The side-imaging SONAR must bemoving to operate properly; therefore, it wasmounted on a boat with a trolling motor. Testingshowed that the side-scan mode produced excellentimages of the pond bottom and various structuralfeatures in both shallow and deep water but must beoperated at 455 kHz in shallow water because thehigher frequency saturates the water column makingimaging impossible. The down-looking modeworked well in deeper water but not in water as
shallow as most catfish ponds. This preliminarywork showed that side-scanning SONAR can beused to image fish, and therefore may have thepotential to be calibrated to obtain data on fish sizes.
Further work used a DIDSON 300M unit withassociated hardware and software. The DIDSON300M can be operated at either a high- (1.8 MHz)or low- (1.1 MHz) frequency. The DIDSON unitwas deployed using a custom-made, adjustablesystem that allows quick deployment to the desireddepth and rapid re-deployment for multiplesampling. Details of the deployment system anddata-processing options for the DIDSON unit canbe obtained from Dr. C.D. Minchew at MississippiState University.
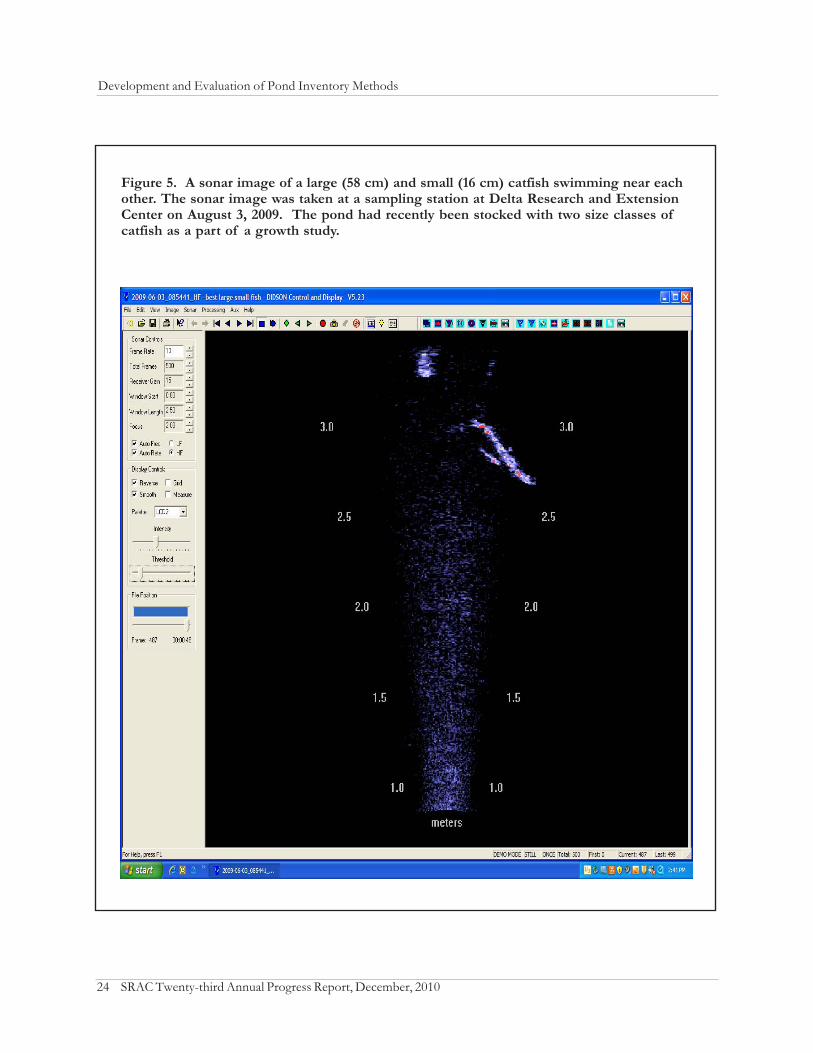
The strength of the DIDSON sonar for studyingcatfish in shallow production ponds is its ability torecord recognizable images of fish in turbid pondsand process that data to obtain estimates of fish size.Useable images have been taken with both the low-and high-frequency beams. Under ideal conditions,ranges of the high- and low-frequency beams are1 to 15 m and 1 to 35 m, respectively. However, inthe present study, the useful range of the two sonarbeams was limited to about 8 m (high frequency)and 16 m (low frequency). While the low frequencybeam has a longer range, it is limited in its ability toimage small fish. Therefore, the high-frequencysetting was used to image obtain the followingimages. Figure 5 shows a large and small catfishswimming together. Fish were sized using theDIDSON “measure tool.” The fingerling was16 cm (6.3 inches) and the larger fish was 58 cm(22.8 inches).
Although not a part of this study, it is clear that theDIDSON has the potential to be useful in studyingcatfish behavior. It could be used to observe thebehavior of pond cultured catfish in response to
Results at a glance...
The DIDSON sonar with its sophisticatedsoftware can detect, identify, and measurecatfish cultured in shallow, turbid waters.Catfish as small as 4 inches and as largeas 30 inches have been detected,imaged, and measured using sonar datafiles collected at multiple sampling sites inculture ponds stocked with mixed sizes offish. Such data could be used to developpopulation size distributions forcommercial ponds.
24 SRAC Twenty-third Annual Progress Report, December, 2010
Development and Evaluation of Pond Inventory Methods
Figure 5. A sonar image of a large (58 cm) and small (16 cm) catfish swimming near eachother. The sonar image was taken at a sampling station at Delta Research and ExtensionCenter on August 3, 2009. The pond had recently been stocked with two size classes ofcatfish as a part of a growth study.

SRAC Twenty-third Annual Progress Report, December, 2010 25
Development and Evaluation of Pond Inventory Methods
Figure 6. Raw data image of feeding fish.
Objective 5. Develop and evaluate a catfish trawl and portable computing technologies to estimatethe size distribution and biomass in catfish production ponds.
University of Arkansas at Pine Bluff. Estimatingbiomass and size distribution of catfish in earthenproduction ponds has always been difficult. Accurateinventory estimates are often needed for managementconsiderations, business planning, and operation
financing. New inventory tools and methodologiesare needed to help catfish producers obtain accurateinventory data from large earthen pond systems.The objective of this study was to develop acommercial-scale sampling apparatus and then
seining, grading, low oxygen, and feeding. Forexample, Figure 6 shows an image collected whilecatfish were being fed fed using a tractor-pulledfeeder. Additional images were collected during a
severe dissolved oxygen depletion. Both events(feeding and response to low oxygen) are moreimpressive when examined while running the videoof each event rather than as still pictures.
26 SRAC Twenty-third Annual Progress Report, December, 2010
Development and Evaluation of Pond Inventory Methods
determine if it could be used to collect accurateinventory data.
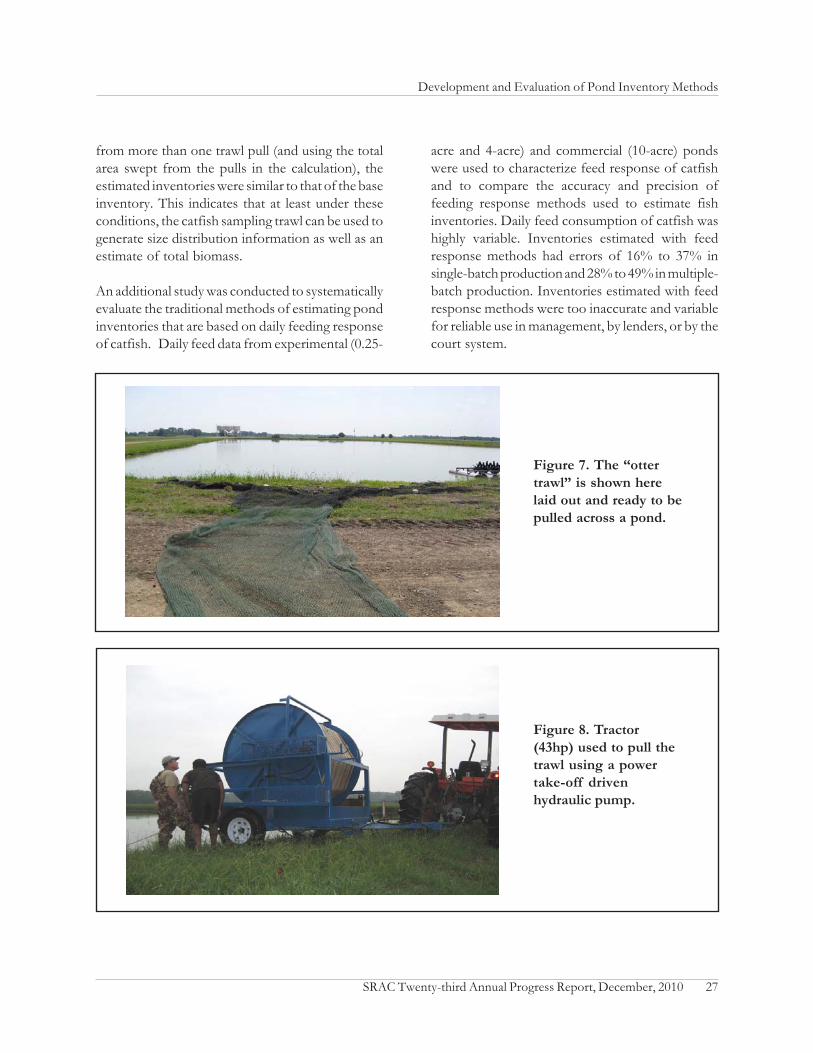
We started with two standard pieces of equipmentthat are commercially available; a hydraulic seine reel,and a standard “otter trawl.” The idea was to devisea mechanism that would allow us to lay the ottertrawl on the levee on one side of pond, and then pullit through the pond with a rope to the opposite leveeto collect our sample. Previously published dataindicated that the trawl would need to move throughthe pond at about 5 feet/second in order to catchcatfish consistently. With that in mind, we madeseveral modifications to the seine reel to ensure thetrawl would travel at that speed. First, we outfittedthe seine reel with a hydraulic system that could bepowered by the 540-rpm PTO of any 30-hp (orlarger) tractor. This was necessary because thestandard hydraulic systems on most fish farm tractorswere not designed to deliver the amount of powernecessary for this application. We also increased thecenter drum diameter by welding cross bars to theinside of the spool and decreased the size of theprimary drive sprocket to increase the rotationalspeed. We used an otter trawl, which is a funnel-shaped net with a 30-foot-wide mouth, and “otterboards” that are designed to pull the net open as itmoves through the water. Several modificationswere made to the original trawl design, includingreducing the size and weight of the otter boards,adding mud rollers to the mud line, and removingthe trap at the head of the cod end (Figures 7 and 8).Detailed equipment design specifications for thecatfish sampling rig can be obtained from DavidHeikes, Aquaculture and Fisheries Center, Universityof Arkansas at Pine Bluff.
The sampling trawl was tested in a series of trialsconducted in large commercial ponds in Arkansasand Mississippi and also under controlled, replicatedconditions at the National Warmwater AquacultureCenter, in Stoneville, MS. In the first commercialpond trials, we wanted to document the performanceof the trawl both with and without the use of feeding
to attract fish to the trawls path. Each pond waspulled one time without feeding in the morning andthen pulled again after feeding in the afternoon.Following the trawl events in each pond, the entirepond was seined three times using a small meshfingerling seine to determine the actual inventory.Fish captured by the trawl were returned to thepond before seining in each trial. Fish caught by thetrawl were individually weighed and the sizedistribution compared to samples taken from theactual population caught in the seining events. Resultsof this trial showed us that the frequency distributionof sizes of catfish caught in the trawl pulls was notsignificantly different from that obtained from seining.A second trial with a similar protocol was conductedin six, 4-acre ponds at Stoneville. While trawlingwith feeding caught more fish in each pull, there wasno difference in average weight or size distributionbetween the two trawling methods. These resultsalso indicated that a single trawl pull, either with orwithout feeding, resulted in an accurate sizedistribution. However, a single trawl pull, which issimilar to the technique known in fisheries as the“swept area method”, was inadequate for estimatingtotal pond biomass. These results led to a third trialin the same 4-acre ponds at Stoneville to determineif multiple trawl pulls (without feeding) could lead toa better estimate of total biomass. When theinventory was estimated from pooling the catches
Results at a glance...
The sampling trawl techniquesdeveloped in this project have beenadopted commercially on a limitedbasis. Using fish-size distribution datagenerated from fish captured by trawling,managers are able to more accuratelyidentify ponds that are ready for harvestand to schedule harvest dates for pondsthat are not currently ready.
SRAC Twenty-third Annual Progress Report, December, 2010 27
Development and Evaluation of Pond Inventory Methods
from more than one trawl pull (and using the totalarea swept from the pulls in the calculation), theestimated inventories were similar to that of the baseinventory. This indicates that at least under theseconditions, the catfish sampling trawl can be used togenerate size distribution information as well as anestimate of total biomass.
An additional study was conducted to systematicallyevaluate the traditional methods of estimating pondinventories that are based on daily feeding responseof catfish. Daily feed data from experimental (0.25-
acre and 4-acre) and commercial (10-acre) pondswere used to characterize feed response of catfishand to compare the accuracy and precision offeeding response methods used to estimate fishinventories. Daily feed consumption of catfish washighly variable. Inventories estimated with feedresponse methods had errors of 16% to 37% insingle-batch production and 28% to 49% in multiple-batch production. Inventories estimated with feedresponse methods were too inaccurate and variablefor reliable use in management, by lenders, or by thecourt system.
Figure 7. The “ottertrawl” is shown herelaid out and ready to bepulled across a pond.
Figure 8. Tractor(43hp) used to pull thetrawl using a powertake-off drivenhydraulic pump.

28 SRAC Twenty-third Annual Progress Report, December, 2010
Development and Evaluation of Pond Inventory Methods
PUBLICATIONS, MANUSCRIPTS, OR PAPERS PRESENTED
Heffington, J.D., J.P. Chambers, D. Heikes, S. Pomerleau, and N. Stone. 2006. Using acoustic backscatter to determinethe size distribution of channel catfish in a commercial pond. Proceedings of the 3rd Joint Meeting of theAcoustical Society of America and Japan 120:3106.
Heffington, J.D., J.P. Chambers, B. Goodwiller, R. Beecham and D. Heikes. 2010. Development and use of an acousticdevice to estimate size distribution of catfish in commercial ponds. Proceedings of the 160th Meeting of theAcoustical Society of America, Cancun, Mexico.
Heffington, J.D., J.P. Chambers, B. Goodwiller. 2010. Development and evaluation of an acoustic device to estimatesize distribution in catfish production ponds. Proceedings of the 6th Meeting of the Mid-South Chapter of theAcoustical Society of America, Conway, Arkansas.
McClain, W.R., R.P. Romaire, and J.J. Sonnier. 2007. Assessment of sampling and harvest yields when crawfish pondsare populated only by stocking of hatchlings. LSU Agricultural Center, Rice Research Station Annual ResearchReport 99:233-246.
McClain, W.R., R.P. Romaire, and J.J. Sonnier. 2008. Assessment of sampling and harvest yields when crawfish pondsare populated only by stocking hatchlings. LSU Agricultural Center, Rice Research Station Annual ResearchReport 100:188-201.
Sudhakaran, P.O. 2009. Improved inventory techniques in commercial catfish (Ictalurus punctatus) ponds. Master’s Thesis.University of Arkansas at Pine Bluff, August 2009.
Sudhakaran, P.O., D. Heikes, C. Engle and S. Pomerleau. 2010. Evaluation of a trawl to estimate the inventory of catfishin commercial ponds. Aquaculture America 2010, 1-6 March 2010, San Diego, California.