Embed Size (px)
Citation preview
Development and Evaluation of an Air-to-Air Combat Debriefing System
Using a Head-Mounted Display
TR94-068 December 1994
Elton Philip Amburn
Department of Computer Science CB #3175, Sitterson Hall UNC-Chapel Hill Chapel Hill, NC 27599-3175
UNC is an Equal Opportunity/Affirmative Action Institution.

Development and Evaluation of an Air-to-Air Combat Debriefing
System Using a Head-Mounted Display
by
Elton Philip Amburn, B.A., M.S.
Lt Col, USAF
A Dissertation submitted to the faculty of The University of North Carolina at
Chapel Hill in partial fulfillment of the requirements for the degree of Doctor of
Philosophy in the Department of Computer Science.
Chapel Hill
1994
Approved by:
----------------Advisor
________________ Reader
________________ Reader
----------------Reader
________________ Reader

Development and Evaluation of an Air-to-Air Combat Debriefing System
Using a Head-Mounted Display (Under the direction of Frederick P. Brooks, Jr.)
Abstract
The United States Air Force Red Flag exercise is the premier training
experience for fighter pilots. An instrumented range to the north of Nellis AFB,
Nevada provides information about aircraft in a Red Flag exercise. The Red Flag
Measurement and Debriefing System transmits messages on the high-activity
aircraft at a rate of 10 messages per second. These messages contain data such as
position, orientation, pilot actions and aerodynamic variables.
This research created and evaluated a computer system for replay and
evaluation of Red Flag air-to-air combat training data. This system can display the
air combat data either on a workstation console (a 19-inch CRT) or in a
head-mounted display (HMD). A human-performance experiment compared the
effectiveness of replaying air combat data using these two display options.
Experienced fighter pilots from the 422nd Test and Evaluation Squadron, 57th Test
Group, Nellis Air Force Base, Nevada served as subjects for the experiment. Using
a computer system to replay and evaluate this type of data is not new; however,
using a head-mounted display and evaluating its effectiveness is new.
Quantitative and qualitative data were collected in the human-performance
experiment. The quantitative data were collected from probe questions asked
during mission replay. The answers to probe questions were used to compute
sensitivity as a measure of the effectiveness of the display types. There was no
statistically significant difference between the sensitivity of a subject when using
the HMD or the 19-inch CRT. However, there was a trend in the subject's
performance which favored the HMD. The qualitative data was quite clear and
showed a statistically significant difference in the preference of the 19-inch CRT
over the HMD.
II

Acknowledgements
Many people have helped me during this effort, and I am very appreciative
to each one.
Lt Col David Neyland of ARPA/ ASTO provided financial support for this
project. Without that support, this effort could not have been completed. ARPA
funds made it possible to complete the head-mounted display and travel to Nellis
AFB, NV.
Lt Col 'Snake' Richardson, commander of the 422nd Test and Evaluation
Squadron, was enthusiastic and helpful. He readily volunteered the pilots of the
squadron to serve as subjects for the human-performance experiment.
I appreciate the support and encouragement I received from the Air Force
Institute of Technology. It was invaluable that I could work on this project while
on the faculty of the Electrical and Computer Engineering department.
Brook Chalfant was a terrific help with her technical editing. She did an
amazing job of reading a document and making suggestions.
Bill Marshak provided essential help with all aspects of the experiment. I
have to thank him for the many discussions on statistics. He was also the member
of my committee in Dayton, and that fostered many discussions about the research
and the document. Bill has an interesting hobby - being on people's dissertation
committees and helping them finish. Terrific hobby!
I thank Fred Brooks for a multitude of things. I appreciate his willingness
to help me with my PhD after I left Chapel Hill. Throughout this project his
vision, abilities, and attention to detail were extraordinary. His life is an example,
both professionally and personally.
I absolutely could not have done this without my family. My daughters,
Rachel, Sarah and Elizabeth, were just terrific. They were encouraging and loving
- what a help. Patty, my wife, I thank you for your love, encouragement and
support. You had two suggestions that made an enormous difference - why not
111

consider your AFIT research for your dissertation and why not go in on Saturdays
to get your dissertation done.
Finally, in the overall scheme of life, the important considerations lie not
with computer science and other technologies but with eternal issues. The Lord
Jesus helped me in many ways throughout this effort, and I appreciate His help.
However, there are issues much more pressing than head-mounted displays, air
combat data, etc.
Elton Philip. Amburn
JV

Table of Contents
List of Figures
List of Tables .
I. Introduction
1.1 Introduction .
1.2 Red Flag Exercise .
1.3 Thesis Statement
1.4 Approach
Page
X
XII
1
1
1
3
3
L5 Summary of Results of tfie Human-Performance Experiment 5
II.
1.6 Overview ............... .
Red Flag Exercises and Nellis AFB Organizations·
2.1 Introduction ....
2.2 Red Flag Exercises
2.3 Red Flag Measurement and Debriefing System .
2.4 Red Flag Range . . . . . . . . . . . . . . . . . .
6
7
7
8
10
11
2.5 57th Test Group and 422nd Test and Evaluation Squadron 11
III. Head-Mounted Displays and Systems
3.1 Introduction ....... .
3.2 Components of HMD-based Systems
3.2.1 Image Generation
3.2.2 Tracking . . . . .
v
15
15
16
16
18

3.2.3 Head-Mounted Displays
3.3 AFIT-developed HMDs ...
3.3.1 HMD-I and HMD-II
3.3.2 HMD-III ...... .
3.3.3 Summary of AFIT HMDs
3.4 USAF Applications of HMD Systems
Page
18
19
19
19
26
27
3.4.1 Flight Simulators with HMDs 27
3.4.2 Supercockpit - Pilot Aiding in the Fighter Cockpit 33
3.4.3 Virtual Environment Debrief Interface 34
3.5 Summary . . . . . . . . . . . . . . . . . . .
IV. Evolution of the AFIT Red Flag Data Replay Systems
4.1 Introduction .............. .
4.2 Initial Red Flag Data Replay Software
4.2.1 Data Extraction and Interpolation
4.2.2 RF-I Software Organization
4.2.3 RF-1 Example .
4.3 Software Library
37
38
38
38
39
41
42
43
4.3.1 I/0 Devices 43
4.3.2 Polhemus Interface, Window Interface and Geome-
try Model Rendering 43
4.3.3 Software Reuse . . . 44
4.4 Geometric Models of Terrain .
4.5 RF-11
4.5.1
4.5.2
4.5.3
4.5.4
System Description
Red Flag Telemetry Data
User Interface for HMD .
User Interface for Console Display
4.5.5 RF-II .....
Vl
45
45
46
48
50
51
55

v.
VI.
Human- Performance Experiment
5.1 Introduction . . . . ..
5.2 Setup for the Human-Performance Experiment .
5.3 Experimental Design .............. .
Page
58
58
58
61
5.3.1 Two Red Flag Missions and Probe Questions . 62
5.3.2 Methods and Experimental Variables
Experimental Results ..
6.1 Introduction .
6.2 Information about the Subjects
6.3 Quantitative Data ...... .
6.3.1 Measuring Subject Performance Using the Theory
64
70
70
70
70
of Signal Detection . . . . . . . . . . . . 71
6.3.2 Statistical Analysis of Quantitative Data 81
6.3.3 Analysis of HMO Viewpoint Changes and Sensitivity 85
6.3.4 Analysis of CD Viewpoint Changes and Sensitivity 85
6.4 Qualitative Data . . . . . . . . . . . . .
6.4.1 Surveys on Display Evaluations
6.4.2 Open-Ended Questions ...
6.5 Summary of Experimental Findings .
86
86
89
91
VII. Conclusions, Lessons Learned, and Recommendations for Future Work 92
7.1 Introduction ......... .
7.2 Conclusions and Observations
92
92
7.2.1 Quantitative Measure of Display Performance 92
7.2.2 Survey Data . . . . 95
7.3 Contributions to Knowledge
7.4 Lessons Learned . . . .
7.4.1 User Interface
Vll
96
97
97
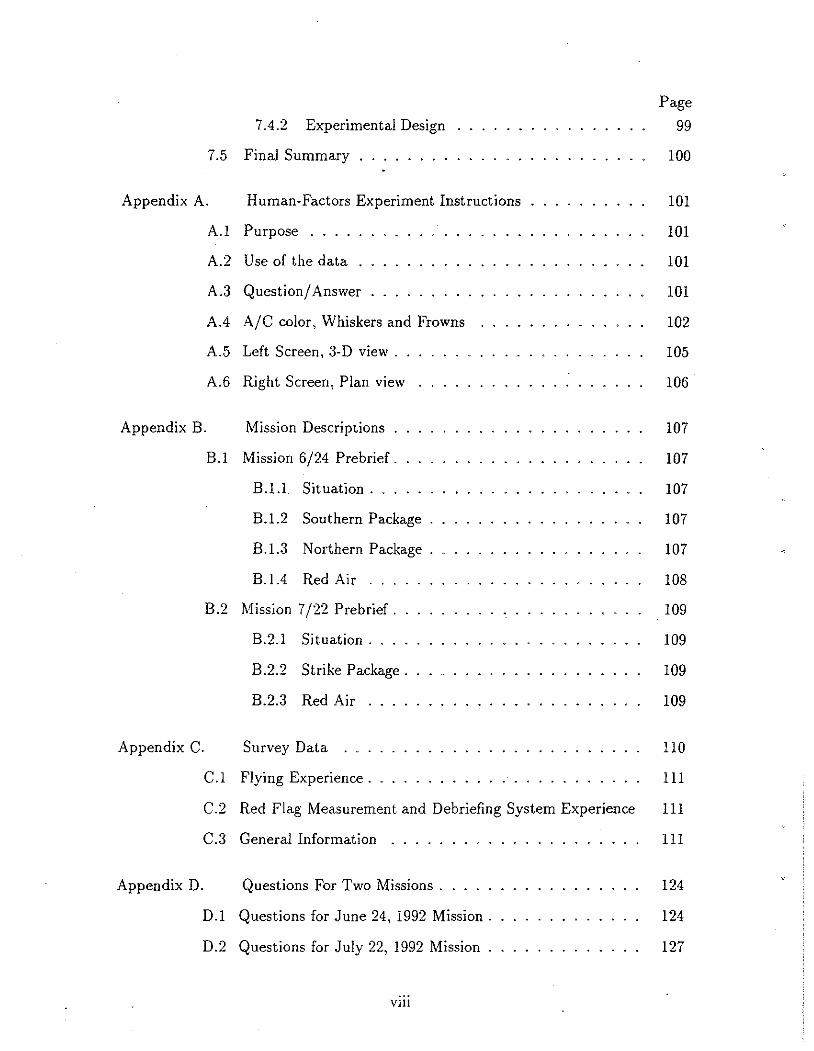
7 .4.2 Experimental Design
7.5 Final Summary ....... .
Appendix A. Human-Factors Experiment Instructions
Appendix B.
A.1 Purpose ....
A.2 Use of the data
A.3 Question/ Answer
A.4 A/C color, Whiskers and Frowns
A.5 Left Screen, 3-D view ..
A.6 Right Screen, Plan view
Mission Descriptions .
B. I Mission 6/24 Prebrief.
B.l.l Situation ...
B.l.2 Southern Package
B.l.3 Northern Package .
B.!A Red Air ...
B.2 Mission 7/22 Prebrief .
Appendix C.
B.2.1 Situation ...
B.2.2 Strike Package .
B.2.3 Red Air
Survey Data ..
Page
99
100
101
101
101
101
102
105
106
107
107
107
107
107
108
109
109
109
109
110
C.! Flying Experience. 111
C.2 Red Flag Measurement and Debriefing System Experience 111
C.3 General Information .....
Appendix D. Questions For Two Missions .
D.l Questions for June 24, 1992 Mission.
D.2 Questions for July 22, 1992 Mission .
VJII
111
124
124
127

Appendix E. Open-Ended Questions ................... .
Bibliography
IX
Page
130
137

List of Figures Figure
1. RFMDS Range Airspace (RFMDS 92, page 2-2) .
Page
12
2. RFMDS System Diagram (RFMDS 92, page 2-3) 14
3. HMD-III Block Diagram . . . . . . . . . . . . . . 20
4. Red CRT Spectral Energy Distribution (from Imaging and Sensing
Technology) . . . . . . . . . . . . . . . . . . . . . . . . . . . . . . . . 21
5. Green CRT Spectral Energy Distribution (from Imaging and Sensing
Technology) . . . . . . . . . . . . . . . . . . . . . . . . . . . . . . . . 21
6. Blue CRT Spectral Energy Distribution (from Imaging and Sensing
Technology) . . . . . . . . . 22
7. Normalized Energy Band Pass for Dichroic Filters (from Newport Op-
tics) . . . . . . . . . . . . . . . . . . . . . . 22
8. 50% Transmission Values for Dichroic Filters . 23
9. Measured Spectral Energy Distribution of HMD-III . 24
10. HMD-III . . . . . . . . . . . . 25
11. HMD-III Optics Arrangement 25
12. HMD-III Control Unit . . . . . 26
13. FOHMD Physical Layout (Welch 84:347) 30
14. FOHMD Optics (Welch 84:348) . . . . . . 30
15. PancakeWindow™ Display (from Buchroeder 89:55) 31
16. Functional Components for a Virtual Cockpit (Furness 86a:226) 35
17. Hardware Configuration for RF-1 39
18. RF-1 Sample Image 42
19. Data Flow for RF-II 46
20. Block Diagram of RF-II 47
X

Figure
21. CIS Dimension 6 Trackball
Parre 0
48
22. Range Time Message Format· (Message Catalog 1992: A-92) 49
23. RFMDS Display Types and Default Locations (RFMDS 92, 4-5) 52
24. RF-II Sample Image Using the Console Display 56
25. RF-II Sample Image Using the HMD-system.
26. Experimental Set-Up using HMD-Ill ....
27. Experimental Set· Up using Console Display
28. Central neural effect (decision axis) as a basis for human decision-
making (D'Amato 70:159) ..... .
57
60
60
14
29. Receiver operative characteristic (ROC) (Kantowitz 83:88) . 76
30. Calculation of response criterion (after Kantowitz 83:98) . . 80
31. Mean and Standard Errors of the Mean for Sensitivity Data 82
32. Scattergram of HMD Sensitivity and Number of Viewpoint Changes 85
33. Scattergram of CD Sensitivity and Number of Viewpoint Changes 86
XI

List of Tables Table Page
1. Comparison of COMPU-SCENE IV and Silicon Graphics Onyx with
Reality Engine (Basic Configurations of Both Machines Compared) 17
2. Characteristics of AFIT HMDs . 26
3. Selected Military HMD Systems 28
4. AFHRL FOHMD Performance Goals (Hanson 83:263) 32
5. Software for Red Flag Data Display at AFIT . . . . . 38
6. Mouse- Button Presses and Associated Actions for Initial Red Flag Dis-
play System . . . . . . . . . . . . . . . . . . . 40
7. Mouse-Button Presses and Actions for RF-II 51
8. Ordering of Subjects and Display Option 65
9. Subject Experience . . . . . . . . . . . . . 70
10. Subject Performance when Answering Questions
11. Theory of Signal Detection True/False Table
12. Sensitivity, d', for Subjects ......... .
13. Encoded Answers Comparing HMO to RFMDS
14. Encoded Answers Comparing CD to RFMDS .
71
72
81
88
89
15. (HtoR- CtR) Values for the Seven Questions and t-test Results 90
Xll

Glossary
• A/ A - air-to-air.
• A/G - air-to-ground.
• ACMI - air combat maneuvering instrumentation. Type of instrumented
aircraft training range that preceded RFMDS.
• AIT - air intercept trainer. A training system for A/ A engagements in an
F-16.
• AFIT - Air Force Institute of Technology; the graduate school of the United
States Air Force, located at Wright-Patterson AFB OH.
• CCS - control and computation system of RFMDS.
• CD - console display.
• closure velocity - the rate of approach of one aircraft to another.
• DMA - Defense Mapping Ageney.
• DDS - display and debriefing system of RFMDS.
• DTED - digital terrain elevation data; a product of DMA.
• exchange ratio - ratio of enemy airplane kills to friendly airplane losses.
• false alarm - the observer responds yes and the display did not contain
signal.
• field of regard - the total field-of-view as seen from all eye positions within
the computer-generated environment.
• field-of-view- the angle in space covered by a display relative to a single eye
position. {Latham 91 ).
• probability of false alarm - the ratio of false positive responses to
opportunities for false positives.
Xlll

• GCI - ground-control intercept radar.
• hit - the observer correctly detects the signal.
• HMD - head-mounted display.
• HUD - head-up display.
• LCD - liquid-crystal display.
• MAC - Military Airlift Command (now part of Air Mobility Command).
• merge - the time and place where the Blue force meets the Red force.
• MFD - multi-function display. A display in a military cockpit, usually
CRT -based, where the pilot can request multiple screens of information.
• mutual support - a measure of whether or not aircraft are poised to help
others.
• NGC - normalized Gaussian curve, e.g., mean of zero and standard deviation
of one.
• nm - nautical mile.
• no-drop - RFMDS provides the ability to have fighters drop bombs on the
Red Flag range and RFMDS computes the bomb impact. As a result, the
pilot can deliver simulated bombs and get scored on the accuracy of delivery.
• ownship - a pilot's aircraft. In the human-performance experiment this is an
aircraft that the subject considers his own.
• PACAF - Pacific Air Forces.
• pairing - set of two aircraft. RFMDS provides a pairing option which will
list a set of variables describing the relationship between two aircraft. This
set of variables includes closure velocity, angle of tail, etc.
• probability of hit - the number of questions where the subject answered yes
and the correct answer was yes divided by the total number of questions
correctly answered yes.
XIV

• reactivity - the degree to which a person or system responds to a stimulus;
bodily response to or activity aroused by a stimulus.
• response criterion - the magnitude of a central neural effect that is selected
by the subject to determine whether a signal is present (answer yes) or a
signal is not present (answer no) [sometimes called criterion value].
• RFMDS - Red Flag measurement and debriefing system.
• RF-I- original version of the AFIT Red Flag Data Replay Software.
• RF-II- second version of the AFIT Red Flag Data Replay Software.
• SA -situation awareness (sometimes situational awareness). A term
describing how well a pilot understands his or her current situation.
• SAC - Strategic Air Command (now part of Air Combat Command).
• SGI - Silicon Graphics Incorporated.
• TAC - Tactical Air Command (now part of the Air Combat Command).
• TD - target designation. The HUD has a symbol, usually the outline of a
rectangle that identifies what object is currently selected, and if the pilot
fired a weapon, the target is inside the TD box.
• TSD - theory of signal detection.
• USAFE - United States Air Forces Europe.
• VE - virtual environment.
• wingman - AF fighters work in pairs, an aircraft and wingman. Your
wingman is your partner, flying another airplane and pairing up with you.
XV

Development and Evaluation of an Air-to-Air Combat Debriefing
System Using a Head-Mounted Display
I. Introduction
1.1 Introduction
Head-mounted display systems, while not a new idea, are the focus of
considerable interest. This interest is manifested in areas as diverse as research
programs in universities and games in the entertainment industry. Likewise,
interest can be found in both the technical and the popular press. This interest is
in large part the result of recent technological advances in the display and
workstation offerings that have made head-mounted display systems possible.
Design and evaluation of systems using head-mounted displays (HMD) are
increasingly important. The Air Force Institute of Technology has been
investigating, for the past several years, the military use of HMD technology in
ground-based applications. This research concentrates on the development and
evaluation of an HMD-based system for debriefing training exercises. This research
includes design and construction of software and HMD hardware, and concludes
with a human-performance study to assess the effectiveness of the system.
1.2 Red Flag Exercise
For USAF fighter pilots, the Red Flag exercises held at Nellis Air Force
Base (AFB), Nevada present some of the most challenging and beneficial training
available. Several times a year, fighter squadrons from bases around the world

come to Nellis AFB for a Red Flag exercise. These visitors take on the role of the
Blue force and train against the organization that runs the school, the Red force.
As the air combat takes place over the desert, data such as position, speed
and weapons firing are broadcast about the aircraft on both sides. Up to 36
aircraft can be equipped with newer electronics pods and become the high-activity
aircraft. For these high-activity aircraft, flight information is transmitted 10 times
per second to telemetry recording stations. In addition to monitoring position and
orientation, simulated weapons systems can be employed; the success or failure of
the weapons delivery is calculated and directly effects the training evaluation.
When a pilot or a simulated ground threat fires a weapon, the Red Flag
Measurement and Debriefing System (RFMDS) calculates the missile path and
computes a probability of kill. If an aircraft is hit, the Range Training Officer
directs that aircraft to leave the engagement area for a specified period of time.
After one to two minutes the Range Training Officer usually allows the aircraft to
return to the engagement and rejoin the acti_on.
As flight information is transmitted to ground stations on the range and
eventually back to the main Red Flag building, it is displayed in real time and
saved onto magnetic tape. After a one- to two-hour training mission, all the
participants gather in a large auditorium, and the mission commander conducts a
debrief of all aspects of the mission. During this time, the mission commander
relies on RFMDS to depict the actions taken by aircraft on both sides, and he can
selectively review the success or failure of any element of the Blue and Red forces.
Evaluation of the participant's actions is often extremely frank and unforgiving;
the seriousness of the training is clear.
RFMDS controls two large display screens in the front of the auditorium to
enable several hundred people to see a computer re-enactment of the action. A 2-D
plan view (from an overhead viewpoint) shows what happened in the entire theater
of operation, providing a bird's-eye view of the engagement. An alternate side-on
2

view, usually on the second screen, shows relative positions, particularly altitudes
of the aircraft.
Although RFMDS is a valuable tool, its display capabilities have limitations
that are readily apparent. For example, when viewing an engagement from the
bird's-eye view, one cannot always tell whether participants are close to one
another or several thousand feet apart. Since an air engagement is a demanding
3-D environment, the capabilities of an HMD system might provide a valuable,
additional tool for reviewing Red Flag and other similar training data.
My question, after seeing missions planned, executed, and evaluated, was:
How effective would a head-mounted display be in the replay and review of
air-to-air engagement data?
1.3 Thesis Statement
Head-mounted display technology provides a more effective visual
display for the individual replay and evaluation of air-to-air training
data than conventional methods using screen displays.
1.4 Approach
To experiment with an HMD application and evaluate the system's
effectiveness, we developed inexpensive HMD systems and used Red Flag training
data to create a synthetic environment. The three major _parts of this research are:
• Creation of a synthetic environment using RFMDS exercise data for
animated elements and Defense Mapping Agency (DMA) digital terrain
elevation data ( DTED) for terrain models.
• Design and construction of relatively inexpensive head-mounted display
systems with off-the-shelf components.
• A human-performance experiment to provide both qualitative and
quantitative evaluations of the effectiveness of HMDs in this application.
3

This research project began with a trip to the Red Flag facility at Nellis
AFB, NV. I was among a group from the Air Force Institute of Technology (AFIT)
allowed to observe BGen Phil Drew, commander of the 65th Air Division, and his
staff in April 1987. We watched his staff prepare the Air Tasking Order; we
watched on RFMDS as the mission was executed; and then we listened to the mass
debrief where RFMDS was used extensively.
After returning from Nellis in 1987, I envisioned and directed the following
MS thesis efforts over the next few years, all organized around the central idea of
placing an observer in the training area using virtual environment (VE) technology:
• Robert Rebo: design and construction of an inexpensive, full-color,
head-mounted display, HMD-I (Rebo 88).
• Gary Lorimor: integration of time-dependent, 3-D telemetry data from Red
Flag exercises into a virtual environment (Lorimor 88).
• Robert Filer: design and construction of HMD-Il (Filer 89).
• Donald Duckett: creation of polygonal models of terrain at various levels of
detail using digital terrain elevation data from the Defense Mapping Agency
(Duckett 91 ).
• John Brunderman: object-oriented collection of C++ classes for rendering
geometry on the Silicon Graphics Iris 4D workstations (Brunderman 91).
Lorimor completed the first AFIT Red Flag Data Replay system, RF-I, in
1988. The second AFIT system, RF-II, was completed in 1993. The advances and
modifications included rehosting the software on new Silicon Graphics equipment
(SGI 4D/440 VGXT workstation), using Polhemus FastTrak™ magnetic tracking
equipment, and using HMD-III, the third of the AFIT-developed HMDs. The last
portion of this project was a human-performance experiment comparing the
effectiveness of an HMD to a console display for computer-based replay and
evaluation of training data.
4
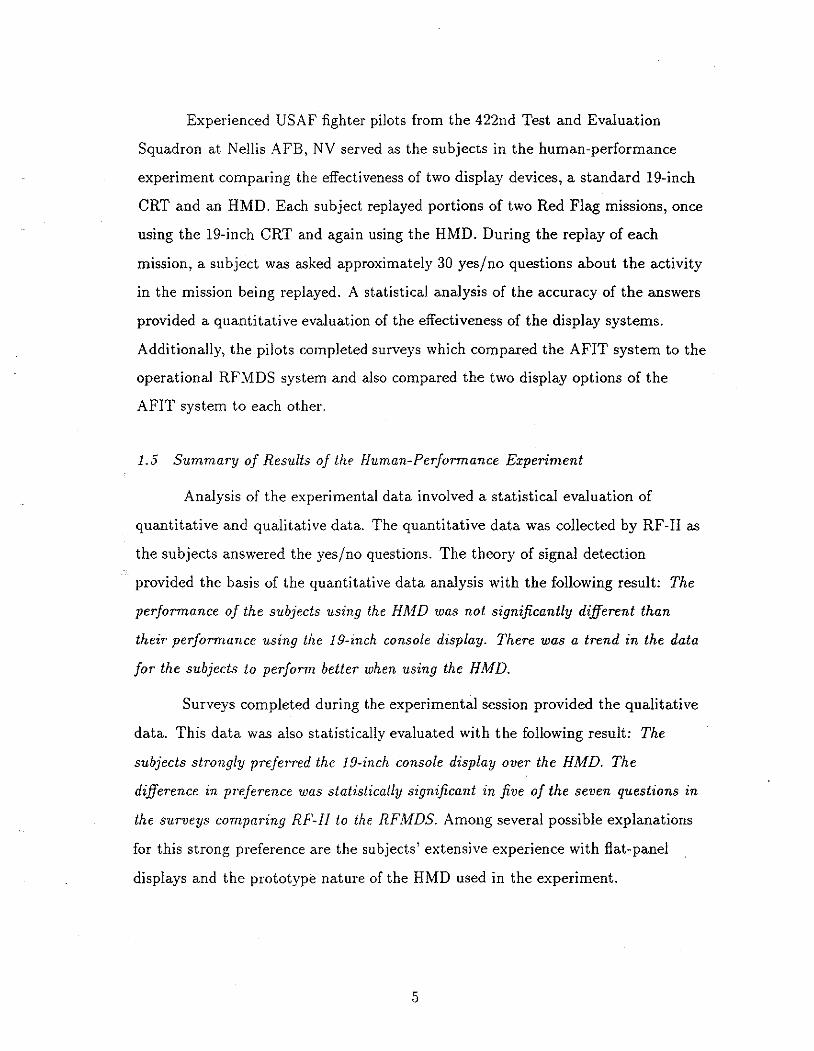
Experienced USAF fighter pilots from the 422nd Test and Evaluation
Squadron at Nellis AFB, NV served as the subjects in the human-performance
experiment comparing the effectiveness of two display devices, a standard 19-inch
CRT and an HMD. Each subject replayed portions of two Red Flag missions, once
using the 19-inch CRT and again using the HMD. During the replay of each
mission, a subject was asked approximately 30 yes/no questions about the activity
in the mission being replayed. A statistical analysis of the accuracy of the answers
provided a quantitative evaluation of the effectiveness of the display systems.
Additionally, the pilots completed surveys which compared the AFIT system to the
operational RFMDS system and also compared the two display options of the
AFIT system to each other.
1.5 Summa1·y of Results of the Human-Performance Experiment
Analysis of the experimental data involved a statistical evaluation of
quantitative and qualitative data. The quantitative data was collected by RF-II as
the subjects answered the yes/no questions. The theory of signal detection
provided the basis of the quantitative data analysis with the following result: The
performance of the subjects using the HMD was not significantly different than
their performance using the 1 g-inch console display. There was a trend in the data
for the subjects to perform better when using the HMD.
Surveys completed during the experimental session provided the qualitative
data. This data was also statistically evaluated with the following result: The
subjects strongly preferred the 19-inch console display over the HMD. The
difference in preference was statistically significant in five of the seven questions in
the surveys comparing RF-II to the RFMDS. Among several possible explanations
for this strong preference are the subjects' extensive experience with flat-panel
displays and the prototype nature of the HMD used in the experiment.
5

1.6 Overview
The remainder of this document is organized as follows: Chapter II
describes the application and the USAF Red Flag training system. Chapter III
provides an overview of USAF head-mounted display systems and describes
head-mounted display development at AFIT over the past five years. Chapter IV
describes the software to replay RFMDS data using workstations and
head-mounted displays. Chapter V presents the design of the human-performance
experiment which compares the two display techniques used to replay RFMDS
data. Chapter VI reports the analysis of the data from the human-performance
experiment. Chapter VI! lists conclusions and recommendations for future work
and includes a discussion of lessons learned.
6

II. Red Flag Exercises and Nellis AFB Organizations
2.1 Introduction
This chapter presents a brief description of the Red Flag training exercises
and some of the associated organizations at Nellis Air Force Base, Nevada, all of
which are integral parts of this research. Particular attention is given to the Red
Flag Measurement and Debriefing System (RFMDS) because of its central
importance in this work. RFMDS, operational since 1987, is routinely used to
replay and evaluate Red Flag training exercises as it displays the activity of all the
aircraft participating in an exercise. The replay capability of RFMDS is of
considerable _value to the pilots involved in the training.
Analysis of combat losses in real aerial engagements motivated the idea of
training fighter pilots against fighter pilots flying over an instrumented range.
During the Vietnam conflict, the exchange ratio between US forces and enemy
forces had dropped to an alarming level. During World War II the overall exchange
ratio was approximately 14:1. But in Vietnam, the overall Navy exchange ratio had
dropped to 2.3: 1. Statistics from the other services were approximately the same.
(Ault 89:36). Captain Frank Ault, USN, was commissioned to complete a detailed
study of the experiences of US Navy pilots during the Vietnam conflict. He was
directed to determine why the exchange ratio between US forces and enemy forces
had declined so dramatically. Capt A ult created five expert study teams to
concentrate on Naval aviation, and in 1969, he delivered to the Naval leadership a
study with 242 recommendations (Ault 89).
Among other findings, the report indicated that too often in a combat
situation, neither the pilot nor the aircraft he was flying had ever before launched a
live missile. Ault's findings and the subsequent actions by military leadership

launched the idea of "live ranges," including the Navy's Top Gun facility, Air Force
and Navy Air Combat Maneuvering Ranges, and the Air Force Red Flag range.
2.2 Red Flag Exercises
The Air Force conducts various training exercises throughout the year. Each
of these exercises, identified as Flag exercises (for example Red Flag, Blue Flag,
Green Flag), has a specific training purpose, such as tactical operations, command
and control, and electronic warfare. Red Flags, Green Flags and Maple Flags are
tactical fighter exercises conducted on the electronically instrumented range at
. Nellis Air Force Base, NV.
Fighter squadrons of the United States and allied nations come to Nellis
AFB to participate in Flag exercises. When a squadron deploys to an exercise, the
units arrive not only with the pilots and airplanes, but also with the maintenance
personnel and the senior staff of the squadron. The senior staff is responsible for
planning the employment of the squadron in the exercise and is frequently
responsible for two missions or "go's" per day. Mission commanders and flight
commanders plan the actions of their components of the exercise. The pilots plan,
fly and debrief one mission a day. This process easily can take more than 12 hours.
The debriefing of a training exercise has changed dramatically since earlier
days of diagrams on a chalk board. Today 's debriefs use cockpit video tapes and
systems such as RFMDS, with which computers display in real-time the position,
orientation and actions of the aircraft. After a training exercise, all of this data
and equipment is available to both pilots and analysts for replay and evaluation.
These Flag exercises and associated capabilities, including the instrumented
range and the planning and debriefing capabilities, provide realistic training to
experienced aircrews.
The 414th Composite Training Squadron is responsible for the maintenance
and operation of Red Flag exercises and RFMDS. The Nellis AFB NV brochure
8

provides the following description of the Red Flag organization, the Flag exercises
and the RFMDS (Nellis Brochure 92):
Entering its 17th year, the mission of the 414th Composite Training Squadron (Red Flag) is to maximize the combat readiness and survivability of participants by providing a realistic training environment and a forum that encourages a free exchange of ideas. To accomplish this, combat units from the United States and several allied countries engage in realistic combat training scenarios carefully conducted within the Nellis range complex. The concept is based on lessons learned from as far back as World War II - if aircrews receive realistic training in peacetime, both their effectiveness and survivability in actual combat increase dramatically. This concept was clearly validated during Operation Desert Storm.
In a typical Red Flag exercise, Blue Forces (friendly) engage Red Forces (hostile) in realistic combat situations. Blue Forces comprise units from TAC, SAC, MAC, USAFE, PACAF, Air National Guard, US Air Force Reserve, Army, Navy, Marines and allied air forces. They are led by a Blue Force planning staff director who orchestrates the employment plan. Red Forces are composed of Red Flag's Adversary Tactics Division, flying the F-16 and providing realistic air threats through the emulation of enemy tactics. They are often augmented by other US Air Force, Navy, and Marine units flying in concert with electronic ground defenses and communications and radar-jamming equipment. Additionally, the Red Force command and control organization simulates a realistic manual integrated air defense system.
In 1987, Red Flag completed the installation of the Red Flag Measurement and Debriefing System. RFMDS is a computer hardware and software network that provides real-time monitoring, post-mission reconstruction, participant pairings, and integration of range targets and threats. Blue Force commanders now can objectively assess mission effectiveness and validate tactical lessons learned.
A typical Flag exercise year includes one Green Flag (an electronic-combat-oriented exercise), one Canadian Maple Flag and four Red Flags. Each Red Flag normally involves a variety of interdiction, attack, air superiority, defense suppression, airlift, air refueling and reconnaissance aircraft. In a 12-month period, more than 500 aircraft fly over 20,000 sorties, while training more than 5,000 aircrews and 14,000 support and maintenance personnel.
Long before a "Flag" begins, the Red Flag staff conducts a planning conference where unit representatives and planning staff members develop the size and scope of their participation. All aspects of the exercise, including billeting, transportation, range coordination,
9
munitions scheduling, scenarios development, etc., are designed to be as realistic as possible, fully exercising each participating unit's capabilities and objectives.
Since combat is no place to train aircrews, Red Flag provides a peacetime "battlefield" within which our combat air forces can train. Within this battlefield aircrews train to fight together, survive together and win together.
2.3 Red Flag Measurement and Debriefing System
The Red Flag Measurement and Debriefing System (RFMDS) is an integral
part of the training environment at Nellis AFB, and it is a significant upgrade over
its predecessor, the Air Combat Maneuvering and Instrumentation (ACMI)
systems.
An overview of RFMDS, taken from (RFMDS 92), follows:
The Red Flag Measurement and Debriefing System (RFMDS) is an advanced training facility developed to improve aircrew proficiency and evaluate aircrew effectiveness in tactical air combat. The RFMDS supports Red Flag and other aircrew training exercises at Nellis AFB, Nevada.
All maneuvers of aircraft in the RFMDS arena are displayed, as they occur, at the Display and Debriefing Subsystem (DDS) on the ground. At the same time, they are recorded for post-mission debriefing and analysis.
Training support includes:
• Air Combat Maneuvering (ACM) Activities- Training in air-to-air weapons employment against adversary forces under realistic but controlled ACM engagement conditions.
• Antiradiation Missile (ARM) Activities - Training in ballistic weapons delivery, guided weapons delivery, and the associated aircraft flight attitudes and dynamics, against a known point target or target complex.
• Electronic Warfare (EW) Activities- Training in threat recognition, self-protection, and defense suppression techniques in a dynamic, coordinated EW environment.
These activities can be exercised individually in training missions or combined as desired to provide fully integrated tactical training in
10

advanced strike operations. Physically, the RFMDS consists of four major subsystems:
• Aircraft Instrumentation Subsystem (AIS)
• Tracking Instrumentation Subsystem (TIS)
• Control and Computational Subsystem (CCS)
• Display and Debriefing Subsystem (DDS)
These subsystems track aircraft movements; collect data on employment of simulated air-to-air, air-to-ground, or ground-to-air weapons; calculate weapons trajectories; monitor the activities of Nellis threat emitters; and display all of this information at the DDS for monitoring and control of the live mission while simultaneously recording it for debrief replay.
2.4 Red Flag Range
The Red Flag Measurement and Debriefing System (RFMDS) is connected
to an instrumented range, depicted in Figure 1, that encompasses a 95x60 nautical
mile area north of Nellis Air Force Base, NV. Up to 36 aircraft at one time can be
instrumented for full state-vector information and weapons firing. The full
state-vector includes position, velocity, acceleration, attitude, true airspeed, angles
of attack and sideslip (RFMDS 92).
Figure 2 is a diagram of the system configuration for RFMDS. As
high-activity aircraft maneuver over the instrumented range, the aircraft
instrumentation subsystem (AIS) measures and transmits aircraft flight data to
ground stations. Ground equipment receives and transmits the information to
master stations and eventually back to the Red Flag building (building 201).
Within that building, computer equipment receives, stores and displays the data.
2.5 57th Test Group and 422nd Test and Evaluation Squadron
The 57th Test Group and a component of the 57th, the 422nd Test and
Evaluation Squadron (TES), played pivotal roles in this research. The Nellis AFB
11
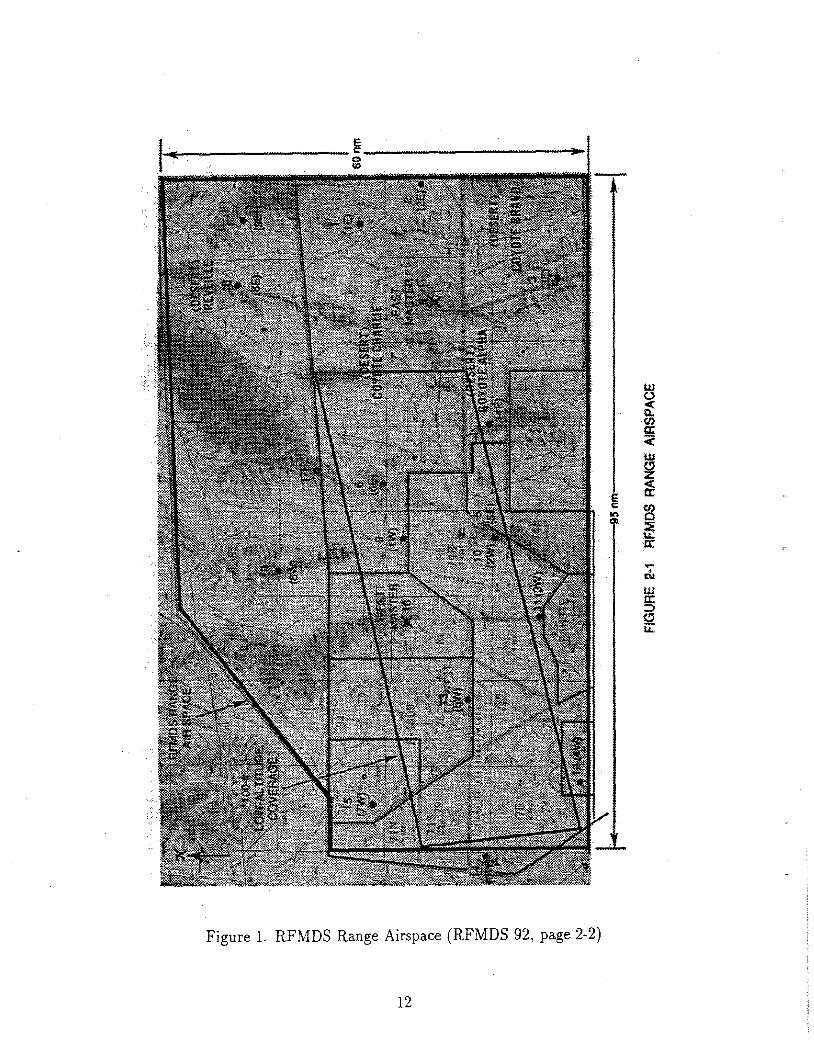
Figure l. RFMDS Range Airspace (RFMDS 92, page 2-2)
12

brochure gives a description of the mission of these two organizations
(Nellis Brochure 92):
... the 57th Test Group conducts operational tests, tactics development, special evaluation and software management of A-10, F-15, F-15E, F-111, and F-117A fighter aircraft. The group also manages and publishes the tactical air forces multi-command tactics manuals, bulletins and reports used by commanders, staffs and aircrews to develop tactical airpower worldwide. The 57th TG includes two squadrons and a detachment.
The 422nd Test and Evaluation Squadron conducts operational tests for A-10, F-15, F-15E and F-16 aircraft and associated weapons, subsystems and support equipment. It also provides tactical expertise and support for technical order development, validation and verification for the Tactical Air Forces.
Pilots assigned to the 422nd TES were subjects for the human-performance
experiment. These pilots, because of their responsibility for operational test and
evaluation of fighters in the USAF inventory, have been frequent users of RFMDS.
Their expertise in Air Force fighter tactics and their frequent use of RFMDS made
them well-qualified subjects.
13

g m
'i·
/
I I I I i/
,:?
Figure 2. RFMDS System Diagram (RFMDS 92, page 2-3)
14
:E "' t; l:; ,_ a: :r .. ::>
"' ~ Ia a:
"' w 0 0 w g ~
:::;; ~ (!) < i5 :::;; I!! ~ {/)
"' 0 :::;; u.. cr:
'l' N
w ; u..

III. Head-Mounted Displays andSystems
3.1 Introduction
We developed two virtual environment (VE) systems, RF-I and RF-II, for
displaying air combat training data from the USAF Red Flag range. Both RF-I
and RF-II used a Silicon Graphics workstation for image generation, a Polhemus
6-degree-of-freedom magnetic tracker, and a fully enclosed color head-mounted
display (HMD).
The basic components of a visual VE system are an image generator and a
display, and if an HMD is used, head location and orientation tracking is also
required. Recent advances in technology have significantly improved the
components and reduced the costs of HMD-based VE systems.
The first part of this chapter discusses the components of an HMD-based
VE system - image generator, tracking equipment and HMDs. We used
commercially available equipment whenever possible. However, throughout this
research effort, commercially available HMDs that would meet system requirements
were either not available or not affordable. Consequently, at the Air Force Institute
of Technology, we built three HMDs between 1988 and 1993, and I present a
detailed description of the third HMD.
The final section of this chapter contains an overview of the two main USAF
applications of HMD-based systems, flight simulation and pilot aiding in the
cockpit. My research and work at the USAF Armstrong Laboratories in Phoenix,
Arizona addresses a third application area - review and evaluation of training data.

3.2 Components of HMD-based Systems
This section provides a description of how we approached the three main
components of an HMD-based system; image generation, tracking and
head-mounted displays. Both Red Flag Data Replay systems developed at AFIT,
RF-I and RF-II, used commercial equipment for image generation and head
tracking. HMDs proved to be the most difficult challenge we faced. Since there
were no commercially available and affordable HMDs that could provide the
resolution and full-color image that we needed, we undertook HMD development
and construction.
3.2.1 Image Generation. Desk-side workstations are now available that
provide image-generation capabilities equal to or beyond the capabilities of
multi-million-dollar image-generation systems used in both commercial and
military flight simulators. For example, consider a Martin Marietta (formerly
General Electric) COMPU-SCENE IV, which is a well-known image generator used
in flight simulators; and a Silicon Graphics (SGI) Onyx™ with a Reality
Engine™ graphics pipeline, which is a state-of-the-art, desk-side workstation.
Table 1 presents a comparison of these two systems. COMPU-SCENE IV
technology became commercially available in late 1986; the Onyx/RE workstation
became commercially available in 1993.
Cost drove us to use desk-side workstations, since we could not afford a
COMPU-SCENE IV image generator. During the development of RF-I, the
rendering capabilities of the SGI 3130 limited the complexity of the images. We
were particularly hindered by the lack of a real-time z-buffer. However, during the
development of RF-II, we moved to the SGI 4D series of workstations, starting
with a 4D-85GT and moving to a 4D/440VGXT. The 4D/440VGXT workstations
have the same polygon rendering speed as an Onyx/RE; however, the RE has a
considerably improved texture-mapping performance.
16

Capability COMPU-SCENE IV (MM 89) SGI Onyx/RE (RE Graphics) Video resolution 2 high-resolution 1 high-resolution channel (3 alternatives) channels ( 1023 lines) (1024 lines/1280 pixels/line)
4 medium-resolution 1 medium-resolution channel channels ( 675 line) (1024 X 768)
8 low-resolution 1 low-resolution channel channels ( 525 line) (640 X 480)
Geometric 8 moving models each with unlimited number of moving complexity 6 DOF models (user programmed)
(COMPU-SCENE controlled) Maximum number 4000 (update rate unlimited, (but update rate of visible maintained at 60 HZ) slows as number increases) polygons 450,000 meshed, textured
triangles/sec (maximum) Color 8 color tables with 48 bits/pixel, 12 bits each
256 entries each for red, green, blue, alpha selected from 4096
different colors Texturing 3-D texture on terrain 2-D and 3-D texture capability 2-D texture on any on any polygons
object polygon Update rate Update rate maintained, at 30HZ 7,000 anti-aliased
objects not rendered textured polygons when scene too complex
Non-linear Yes No correction for dome projection
Table 1. Comparison of COMPU-SCENE IV and Silicon Graphics Onyx with Reality Engine (Basic Configurations of Both Machines Compared)
17

3.2.2 Tracking. Tracking head motion in an HMD-based system is
essential, since head motion modifies the image to be presented to the wearer of the
HMD. RF-I and RF-II both use magnetic tracking systems by Polhemus. RF-I uses
the Polhemus 3-Space tracker, and RF-II uses the Polhemus Fastrak.
The Fastrak is specified to track with a resolution (not accuracy) of 0.002
inches/inch of range and .025° orientation when the receiver is within 30 inches of
the transmitter. With one receiver the Fastrak can sample at 120 updates/second.
The latency of the device is reported to be 4.0 milliseconds from the center of the
receiver measurement period to beginning of transfer from the output port. A host
computer can connect to the Fastrak with either IEEE-488 or RS-232 interfaces;
with the RS-232 interface the baud rate can range from 300 to 58,600.
3.2.3 Head-Mounted Displays. HMD technology has directly benefited
from the miniaturization of TV technology and from commercial interest. For
many years, the only HMDs available were specially built, one-of-a-kind units that
were quite expensive. This began to change in 1989 when VPL offered the
Eyephone™ at a cost of about $10,000. It was a full-color HMD, based on
liquid-crystal display (LCD) TVs.
Today more than I 0 companies offer a wide variety of HMDs. The industry
newsletter, Real Time Gmphics, presents an excellent survey of many of the
commercially available HMDs, ranging in price from $6000 to $2-3 million
(Latham 93) . Commercial HMDs use three technologies to present an image in
front of a person's eyes: (1) miniature CRTs, (2) LCD panels or (3) fiber-optic
cables to relay the image from an image source, usually a projector of some sort.
Important properties of an HMD are:
• Full color or monochrome
• Contrast or color saturation
• Image resolution
18

• Field of view
• Weight
• Commercial product or one-of-a-kind research system
• Cost
3.3 AFIT-developed HMDs
In early 1988, as the project to display Red Flag data was begun, no
affordable, commercially available, color HMDs existed. Several research
organizations had constructed HMDs; some color whereas others were black and
white. Some used CRTs whereas others used LCD TVs.
From 1988 through 1993 we built three custom-made HMDs at AFIT. The
following sections provide an overview of the first two AFIT HMDs and a detailed
description of HMD-III.
3.3.1 HMD-I and HA1D-II. Robert Rebo constructed AFIT's first
head-mounted display, HMD-I, in 1988 and Robert Filer constructed AFIT's
HMD-II in 1989. Both HMDs used color LCD TVs and custom head-mounts.
While the two units were similar, HMD-II was an improvement over HMD-I
because it was easier to wear and had better optics (Rebo 88), (Filer 89).
Both of these HMDs were capable of a stereoscopic display, but we did not
have the video circuitry needed to alternate left-eye and right-eye images from the
SGI workstations to the two TV s. Consequently, although capable of stereoscopic
display, we sent the same image to both eyes and created a biocular display.
3.3.2 HMD-III. Dr James Mills, of the AFIT Physics Department, and I
designed AFIT's HMD-III. The most significant change was moving from LCD
image sources to miniature CRTs. Three l-inch CRTs with red, green and blue
phosphors were optically combined to create a full-color image with 480 lines x 640
19

pixels, creating a head-worn projection TV. Figure 3 diagrams the initial optics
design, which included beam-splitters, dichroic filters, mirrors and lenses.
green
blue
BS# - beam splitter # M# - mirror number #
Imaging Lens
Figure 3. HMD-III Block Diagram
M6
/Field Lens
The full-color image is completed by the second dichroic filter, BS2. We
based the projection TV approach on three l-inch CRTs from Imaging and Sensing
Technology (IST). Each CRT has a different phosphor. We selected Pl phosphor
for green, Pll phosphor for blue and P22 phosphor for red. Figures 4, 5 and 6
present the spectral energy distributions for these three phosphors as described in
IST product literature. Since the energy occurs in a narrow band for each of these
phosphors, we used dichroic filters (used in positions BSl and BS2 in the block
diagram) to combine the images from the CRTs into a full-color image.
Figure 7 is the transmission specification from the Newport Optics catalog
for the HL.xx dichroic filters. Newport identified these filters with HL. followed by
one or two digits. We used the 45° incident-angle curves HL.4 and HL.6 to match
the peaks of the energy from the CRTs, see Figure 8. Filter HL.6, in position BSl,
passes red and reflects green. Filter HL.4, in position BS2, passes red and green
but reflects blue.
20

Phosphor-Nearest Equivalent (EIA) • P22R
Special Cbaracterislics A meou,Jfn·$1'l0r1·pem.~c:ncc. c:fllctenl rP.<'l phos:'lhor: red component •n colcr P•Ct .. lle d!S;}Iif'{S _.)..su used for photographic recording.
Typical SpeW~~ Ener;y DillributiGa
·or--r~r-,--,--,--,-,-,--r--r-o
,,~~~~~~--4---1-4~--~~~ '"~-1---t--~--+---t-----~---+--~--~ "f-t--+--t---t---t--1-t--t--+~
f,,~·--t-~f--+--+-~f--+-i~--+-~---1 ~ c;-+-+-+-t--+--+-lHI--+-+--1 • ~ c ~ f---+--~
t C3f---f---+--~--t---f---+-H++---Hf-~~
O•f--+--+ :~~-,~~,_~,.~,---~-~o-~~~-~~A""~L~ooo~~ .. ~~,oo~-;?~--~--
Figure 4. Red CRT Spectral Energy Distribution (from Imaging and Sensing Technology)
Phosphor · GJ Nearest Equivalent (EIA) • Pl
Special Characteristics An e!io:; en· grP.en :-:-rosp'lcr weH SU•ted for displa~~ U:;f..'d 1n h g"'-hn{)htness CIWIJot'~l! COI""OII10nS /.!so :nc gree.1 COM;:x)"lenl ol COlOr piCtU!t;> UiSIJ a~'S.
Typical Spectral Energy Dislriblllion
' -'
I I I I . I I
• ,_ r-'
' '
I I I - \ -
., I i J " ""' '~ ~ '"' ~ ,. '
,_
Figure 5. Green CRT Spectral Energy Distribution (from Imaging and Sensing Technology)
21

PbospbOf · IE Nurest Equivalent (EIA} • P11
SpeciM CUradlltsllcs A l.ii..C nhOq>">Or d-*Y hog~ r~ .«o.t'Cy liSCO on ~~-COlOr "'wt!IJI~ Wfil' SUito=d lot "'QQI anc:l \AI.'1t'hgh ~.(l!Jbe)r ~ I IW".m)ng
I' (\ I I ·-
'I I /I\ \ \ -
' I 1/ II '
-I
I • '-..!. I I
C>
oo
O> .~l/-;.. " .. .. .
~ - • L ~ k ~ ~ ~ ~ -W....,.."'ffl',.,_,
Figure 6. Blue CRT Spectral Energy Distribution (from Imaging and Sensing Technology)
100
~ .-
HLx:x I"</
VI j
---:;jf
0 ~ -- /}a- . 0.1 1.2
Figure 7. Normalized Energy Band Pass for Dichroic Filters (from Newport Optics)
22
•

Long Wave Pass 50%T (nm)
Code o• 45°
HI.. I 400 365 HL.2 450 410 HL.3 500 455 HL.4 550 500 HL.S 600 550 HL.6 650 595 HL.7 700 640 HL.S 750 685 HL.9 800 730 HL.IO 850 775 HI.. II 900 820 HL.J2 950 870 HL.l3 1000 915 HL.l4 1050 960 HL.I5 1100 1005
Figure 8. 50% Transmission Values for Dichroic Filters
How was the light energy actually distributed as a result of the optics and
l-inch CRTs in HMD-III? I measured the light leaving the eyepiece of HMD-III
using a McPherson Model 218 0.3 meter scanning monochromator, a Products for
Research photomultiplier tube and a Keithly Instruments Model 4145
picoammeter. All this equipment was provided by the AFIT Physics department.
I used a small fiber-optics bundle to transfer light from the microscope
eyepiece of HMD-III to the input slit of the monochromator. The photomultiplier
tube, attached to the output slit of the monochromator, measured the light energy
leaving the monochromator. The picoammeter measured the output of the
photomultiplier tube and produced an analog measure of the strength of the light.
Figure 9 shows the spectral energy distribution of HMD-III.
HMD-III was completed in January 1993; .see Figure 10 for a picture.
Figure 11 shows the final optics layout. Figure 12 shows the control circuitry for
the miniature CRTs. A commercial firm improved the original design. One change
replaced the LEEP optics with a microscope viewer. This increased the exit pupil
size from 3 millimeters to 7 millimeters. An additional benefit of the microscope
23

Spectral Enegery Distribution of HM~III
'spectrum.d' -
0.9
0.8
0 .7
,... 01 ~
0 .6
c w
0.5 G> .~
i a: 0.4
0.3
0.2
0.1
0 350 400 450 500 550 600 650 700
Wavelength (nanometers)
Figure 9. Measured Spectral Energy Distribution of HMD-111
viewer was an inter-pupillary distance adjustment with a range of 55 to 75
millimeters. Exit pupil, a measure of the size of a real image formed by an optical
system, is an important issue when lenses are a part of an optics system. The
larger the exit pupil, the easier it is to view the image. However, the size, weight
and cost of the associated optics increases with exit pupil size. An inter-pupiilary
distance adjustment made using the system easier, because it helped users align
the exit pupil of the optics with the entrance pupil of their eyes.
With this design we achieved the goal of TV resolution. However, because
we used three miniature CRTs for a single image, there was no practical way to
generate a stereoscopic display with HMD-Ill. (It would have required three more
miniature CRTs and associated optics to generate the second image or an
electronically controlled shutter.) Consequently, HMD-III offered only a biocular
display.
24
•

Figure 10. HMD-III
Figure ll. HMD-III Optics Arrangement
25

Figure 12. HMD-III Control Unit
3.3.3 Summary of AFIT HMDs. J:he three AFIT HMDs were built over
a span of five years, starting with HMD-I, which was put together with limited
funds, and culminating with HMD-III which provided good resolution, but at a
much higher cost. Table 2 summarizes important characteristics of these three
HMDs.
HMD-I HMD-II HMD-III full-color Yes Yes Yes FOV 50°hx40°v 40°hx40°v 50°hx40°v Resolution 220h x 140v 210h x 140v 640h x 480v weight 3.5 lbs 5 lbs 9 lbs Commercial No No No Product Parts Cost $1,000 $1,500 $20,000
+ $25,000 for fabrication
Table 2. Characteristics of AFIT HMDs
26

3.4 USAF Applications of HMD Systems
The two principal USAF applications of head-mounted or helmet-mounted
display systems are flight training systems and cockpit systems. Most of this USAF
work with HMD systems occurs at two locations, Wright-Patterson Air Force Base
(AFB) OH and Williams AFB AZ. The Human Resource Directorate at Williams
AFB deals with training systems, and the Crew Systems Directorate at
Wright-Patterson AFB deals with airborne crew stations. Both organizations are
part of Armstrong Laboratory.
Table 3 presents a summary of the USAF systems reviewed. I have three
reasons for focusing on these three systems. First, flying is the focus of these
systems. Second, this set has a system for each of the three types of
image-generation technology used in HMDs- fiber-optic, LCD and CRT. Third,
the three systems are examples of USAF applications of HMDs. Two of the
systems are representative of the two well-established application areas of flight
simulation and cockpit display. The third system is an experimental one for
mission evaluation system - a potentially new application area.
3.4 .1 Flight Simulators with HMDs. A major responsibility of the
Aircrew Training Research Division of AFHRL is to evaluate visual displays and
advanced simulators to determine their ability to train aircrews for a variety of
missions. A critical part of any flight simulator is the visual presentation, and
visual systems are a significant portion of the total system cost. AFHRL has
investigated a variety of ways to present visual information in a flight simulator,
including projectors displaying images on a traditional spherical dome surface with
a radius of 24 feet; rear-projection on a dome-like device called the Display for
Advanced Research and Training (DART); and a variety of head-mounted displays.
The DART is a unique device with pentagonal panels arranged in a
dodecahedron (Thomas 91). Each panel serves as the screen for a Barco projector.
27

Organization Task HMD Enclosed/ Color technology See Through
AFHRL Flight Simulation FOHMD See Through AL Cockpit Displays CRT See Through AFHRL Post-mission evaluation LCD Enclosed .. AFHRL. Air Force Human Resources Laboratory, Williams Air Force Base, AZ
AL: Armstrong Laboratory, Wright-Patterson Air Force Base, 0 H FOHMD: fiber-optic head-mounted display
Table 3. Selected Military HMD Systems
y N y
AFHRL uses a COMPU-SCENE IV to generate eight channels of imagery and
surrounds the pilot to produce a compelling sense of immersion.
Over several years, AFHRL has developed several simulator designs. The
experimental simulators have ranged from 24-foot .dome simulators using
state-of-the-art image generators to HMDs using a variety of image generators from
PCs to workstations. Geltmacher provides an interesting overview of AFHRL's
ongoing research and experimentation with flight simulator technology
( Geltmacher 88) .
Geltmacher observed that one of the benefits of an HMD-based approach is
that it is a comparatively inexpensive way to provide a full field-of-regard i.e., the
ability to see all around. Field-of-regard describes how much of the environment a
viewer can potentially see, while field-of-view describes how much of the
environment a user can see at one time. Pilots, especially those specializing in
air-to-air engagements, depend heavily on looking all around. Both the dome and
the DART provide a full field-of-regard with the human visual system limiting the
field-of-view. An HMD-based system provides a full field-of-regard, but the
field-of-view is limited by the optics and image display system of the HMD.
AFHRL has experimented with a variety of HMD systems, ranging from
their high-resolution fiber-optic-based system to HMDs using LCD screens and
monochrome, l-inch diameter CRTs. Although AFHRL has developed several
28

HMDs, the best known of their systems is the fiber-optic helmet-mounted display
(FOHMD), developed in a US/Canadian joint program; the main contractor is
CAE/Link.
3.4.1.1 Fiber-Optic Helmet-Mounted Display (FOHMD) Flight
Simulator. Hanson indicates that the driving reason for creating FOHMD was to
reduce the cost of surrounding the pilot with imagery (Hanson 83). A
weapons-system trainer using a spherical dome display easily can cost $10 - $40
million, depending on many factors such as the fidelity of the trainer, whether a
new building must be built, or whether a motion-platform is used. Since much of
the cost is related to the large dome display, an HMD may reduce the cost of flight
simulation significantly.
Figure 13 presents the equipment layout of FOHMD. The pilot sits in a
cockpit shell with working gauges and dials, and a throttle and stick for flight
control. The optics and tracking devices mount on a standard aircraft helmet. The
pilot has four fiber-optic ropes draped behind him, and GE light-valve projectors
send light down these fiber-optic bundles. The imagery to each eye has a
high-resolution component and a wide-angle, lower-resolution component; hence
the four fiber-optic ropes. A Martin Marietta COMPU-SCENE IV creates the
out-the-window imagery.
Figure 14 presents a schematic of the unique optical system of the
FOHMD. On the helmet, at the other end of the fiber-optic cables, beam splitters
and Farrand Pancake Windows™ create wide-field-of-view optics focused at
infinity. Pancake Windows are light weight and use a combination of a curved
mirror and quarter-wave optical plates as shown in the top part of Figure 15. The
curved partial reflectors create an infinity focus. One problem with the Pancake
Window is significant light loss; Hanson reports a 99% light loss through the
Pancake Windows (Hanson 83:266). The lower half of Figure 15 shows two
options for mounting Pancake Windows in front of the eyes.
29

Figure 13. FOHMD Physical Layout (Welch 84:347)
ri!RE-OPTJC
""" -F-+J -+-r:.-:: +-
YJO£ HELD -PIIOJ[CTI~ L£1115
PLOt07Z
Figure 14. FOHMD Optics (Welch 84:348)
30

t
-__ .. ,..... GHOST IMAGE:
POLARIZER
t
~UARTU 1/AY£ PI,AT£$
Principle of ~he Pancake ~indowTM
·""-, 4LTER•ATI VE •E®UES • "
ND IEM CD ... IMU (I "PitOVEO TWSM ISS! OM) U~£CTtO OES I GN NAS
MAXI"UM En kELl£F, L~ T&>N~KJSSIOK
Two distinctive embod~~nts of the Pancake WindowiM principle.
Figure 15. Pancake Window™ Display (from Buchroeder 89:55) 31

The FOHMD system performance goals, presented by Hanson, are outlined
in Table 4 (Hanson 83:263). Two different lenses can be placed in the eyepiece for
the high-resolution image. With one set of the lenses in place, the high-resolution
image is presented in a 25°h x 18°v FOV. With the other set of lenses in place, the
high-resolution image is presented in a 40°h x 30°v FOV.
Parameter Goal Resolution 2-3 arc minute/pixel Displayed Instantaneous FOV 135° X 60° Displayed High-Resolution FOV 25°h x 18°v or 40°h x 30°v Inset Resolution 1.5 arc minute/pixel. Background Resolution 5.0 arc minute/pixel Apparent luminance 80 foot-lamberts Color Full
Table 4. AFHRL FOHMD Performance Goals (Hanson 83:263)
Helmet tracking is an integral part of any HMD-based flight simulator. The
first prototype FOHMD simulator used a mechanical tracker built by AFHRL.
Welch et. a!. provided three reasons AFHRL chose a mechanical tracker:
"simplicity, well-defined accuracy, and speed of response." The resolution of the
mechanical tracker was 6 arc minutes and a new position sample was taken every
17 milliseconds (60HZ). However, lag time was a noticeable problem
(Welch 84:356). List reported that the simulated scene would lag between two and
three frametimes (one frametime = 33 1/3 msec) (List 83).
Hanson describes why a head-coupled visual simulator has more of a
problem with lag than a standard simulator (Hanson 83:266).
Although the FO HMD seems to provide the solution to brightness, resolution and FOV problems inherent in conventional flight simulators, there are special factors which much be considered when using a head-coupled visual simulator. For instance, visual scene lag becomes a critical problem. Conventional simulators must currently only generate imagery fast enough to keep up with aircraft movement. The most rapid movement of a modern fighter aircraft is a roll with typical accelerations of approximately 600 degrees/sec2 and maximum values
32

up to 1200 degrees/sec2• In contrast, maximum head acceleration can be 6,000 degrees/sec2
• Therefore, head-coupled visual simulators must be much more responsive. The fastest commercially available image generators can generate and display a visual scene in three fields (one field equals 16 2/3 milliseconds). If throughput for the position sensor is added to that of the CIG (computer image generator), then the total lag time approaches four to five fields. This effect will create pronounced errors in the displayed imagery.
To address the lag problem, AFHRL experimented with head-motion
prediction. Early work used angular accelerometers in conjunction with a
mechanical tracker (List 83). The mechanical tracker provided 6
degrees-of-freedom, but AFHRL software predicted only the 3 orientation values.
The angular accelerometers were noisy, causing further problems. Later work at
AFHRL used Polhemus magnetic tracking systems with prediction based on
angular rate sensors. CAE, the prime contractor for FOHMD, has extended this
work on prediction, but that work is proprietary (Kelly 94).
3.4.2 . Supercockpit - Pilot Aiding in the Fighter Cockpit. Investigating
new crew-station capabilities is one of the tasks of the Armstrong Laboratory (AL)
at Wright-Patterson AFB OH. For many years, Thomas Furness directed a project
entitled Super Cockpit. Furness described this project as a revolutionary
crew-station concept, needed because of the ever-increasing complexity of the
modern cockpit (Furness 86b ). The intent for the station was to involve the pilot's
head, eyes, hands, ears and voice in the aircraft. Included in the concept was a
speech synthesizer to tell the pilot of aircraft status, including warning messages.
Head, hand and eye tracking enabled the system to know where the pilot is looking
and what he is doing. An image generator uses a stored terrain data base and a
data link to positioning systems to present a registered image of the aircraft's
position. Voice input allows the pilot to select views on the variety of
multi-function displays in the cockpit as well as select and arm different weapons.
33

In September 1982 a prototype virtual cockpit or super cockpit system,
called Visually-Coupled Airborne Systems Simulator (VCASS) became operational.
A system description is summarized here (Furness 86a) .
The VCASS headgear uses two l-inch diameter, monochrome CRTs as the
image sources. The stereoscopic optical system presents the images to the wearer
in a 80° horizontal by 60° vertical visual field. VCASS has sophisticated specially
built optics that provide an inter-pupillary distance adjustment and a variable field
of view._ Normally the optics are set for a 120° horizontal by 60° vertical FOV with
40° overlap. The VCASS headgear weighs 5.86 pounds. Figure 16 is a block
diagram of VCASS.
VCASS uses a combination of equipment for image generation. An Evans
and Sutherland PS 1 system creates a vector display of flight information and
Silicon Graphics Iris 3130 workstations creates the out-the-window images. VCASS
tracks both the pilot's head and one hand using a Polhemus 3-Space tracker. DEC
equipment computes the real-time flight dynamics calculations, originally VCASS
used PDP-lls and later micro Vaxiii workstations.
3.4.3 Virtual Environment Debrief Interface. The previous sections
describe two representative HMD-based systems oriented toward the two mature
USAF applications of flight simulation and pilot aiding. A relatively new
application area for HMD-systems is the replay and evaluation of training data.
The Virtual Environment Debrief Interface, developed at Armstrong
Laboratories, Williams AFB, AZ, is for replay and evaluation of a pilot's
performance in an air-to-air trainer. Mowafy describes a system for replaying a
training session conducted on an air-intercept part-task trainer for F-16 pilots
(Mowafy 93). The air-intercept trainer (AIT) helps pilots define and implement air
intercept strategies. Pilots pay particular attention to the switches and symbols
used in the F-16 for air-to-air engagements. The AIT provides a head-up display, a
multi-function display (MFD) and a radar display. The HUD is a transparent
34

:::1 ()q
Digital Bus "' ..,
1 (1) ,_. 0">
21 ::;
" A!C State ,.. -c;· Info ::;
g:.. 0 Navigation -0 3 '0 Internetting -0 ::; (1)
"' A/C Systems_ ,.. "'
""' 0' Status c.n ..,
'" Sensors ~ -;:\.
Others -" £..
~ " ~ ~. -~ 21 .., "' (1)
"' "' (X) 0">
'" ;.:, ...., 0"> ~
Sensor Aiming
Graphics
Generator
Voice Synthesis
Voice
Controller
Graphics . 1 Helmet D1sp ay
&
Processor Video Electronics
HeadPos
Hand Pos
Weapon Discrete Aiming Outputs
Helmet Tracking
Electronics
Head-Mounted Unit r----------------1
Headset
Microphone
~ J- CRT I I - ________ ..J
Hand-Mounted Unit
(Magnetic Sensor)
Cockpit-Mounted Unit
(Magnetic Radiator)

plate, positioned just above the cockpit dashboard, that presents flight information
to the pilot while also allowing him to see the outside world. An MFD is a CRT
surrounded by a collection of buttons, and the pilot can use the buttons to select
one of several different display options, such as RADAR, weapons storage, attitude
direction indicator, etc. A typical intercept takes place in a 40-square-mile area
and up to 50,000 feet in altitude. Throughout an AIT mission, the system will
sample flight trajectories of all the aircraft in the engagement at 1 Hz. In the
replay this sam pled information re-creates radar displays for analysis.
The Virtual Environment Debrief Interface (VirDI) is a project using virtual
environment techniques to support an AIT mission debrief. Two principal
functions of the system are:
1. To replay the data set describing the air intercept data.
2. To assist the pilot in constructing a mental image of the air intercept space.
To use the system, a pilot starts on the F-16 Air Intercept Trainer. After the pilot
completes the training session in the simulator, he can replay the air intercept in a
virtual environment. An ASCII data file describing the training mission is
transferred to an IBM PC-compatible computer (25 MHz 80386) with an XTAR
FALCON-PC™ graphics board. The HMD is a Virtual Research Flight Helmet™,
a stereoscopic HMD using color LCD displays with 210h x 140v color pixel
resolution and LEEP™ wide-angle optics. Tracking is done by an Ascension Flock
of Birds™, a magnetic tracking system. The pilot can replay the air intercept in
either of two postures. He can wear the HMD and walk around in a circular area
with an 8-foot radius. Or, he can be seated and use a 6-degree-of-freedom spaceball
to augment the head-tracker and control his movement through the training area.
VirDI maps the 40-square-mile training area to a room measuring 10' x 10' x 8'.
36

3.5 Summary
This chapter presents several r~lated topics. The beginning sections contain
an overview of the basic components of an HMD-based system: an image
generator, a tracker and an HMD. To create HMD-based systems we found it
necessary to construct HMDs. The middle sections of this chapter present the
history of the three AFIT HMDs. The final sections of this chapter present a
classification of USAF applications of HMDs and three example systems. The
example HMD-based flight simulator and the cockpit-based pilot aiding system are
representative of the two main USAF applications of HMDs. However, there is a
third potential USAF use of HMDs - mission replay and evaluation. The Virtual
Environment Debrief Interface project and the AFIT Red Flag Data Replay
Systems are examples of this type of HMD-based systems.
37
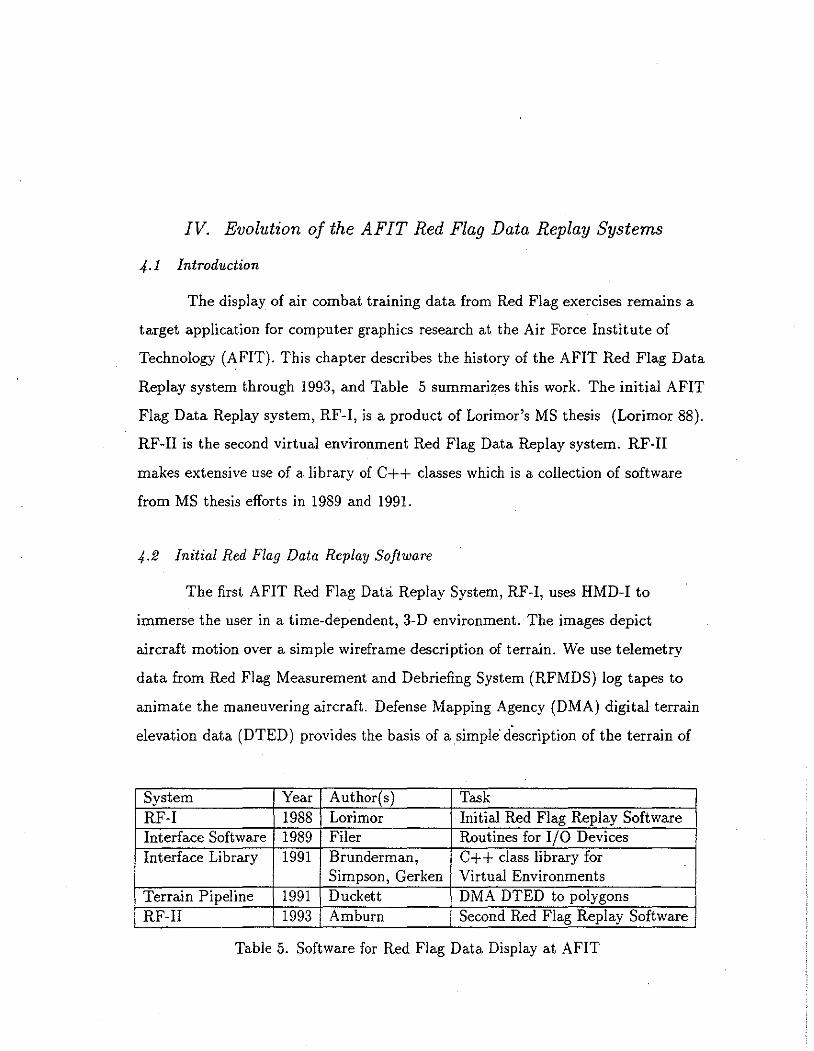
IV. Evolution of the AFIT Red Flag Data Replay Systems
4.1 Introduction
The display of air combat training data from Red Flag exercises remains a
target application for computer graphics research at the Air Force Institute of
Technology (AFIT). This chapter describes the history of the AFIT Red Flag Data
Replay system through 1993, and Table 5 summarizes this work. The initial AFIT
Flag Data Replay system, RF-I, is a product of Lorimor's MS thesis (Lorimor 88).
RF-II is the second virtual environment Red Flag Data Replay system. RF·II
makes extensive use of a library of C++ classes which is a collection of software
from MS thesis efforts in 1989 and 1991.
4.2 Initial Red Flag Data Replay Software
The first AFIT Red Flag Data. Replay System, RF-I, uses HMD-I to
immerse the user in a time-dependent, 3-D environment. The images depict
aircraft motion over a simple wireframe description of terrain. We use telemetry
data from Red Flag Measurement and Debriefing System (RFMDS) log tapes to
animate the maneuvering aircraft. Defense Mapping Agency (DMA) digital terrain
elevation data (DTED) provides the basis of a simple· d~scription of the terrain of
System Year Author(s) Task RF-I 1988 Lorimor Initial Red Flag Replay Software Interface Software 1989 Filer Routines for I/0 Devices Interface Library 1991 Brunderman, C++ class library for
Simpson, Gerken Virtual Environments Terrain Pipeline 1991 Duckett DMA DTED to polygons RF-II 1993 Amburn Second Red Flag Replay Software
Table 5. Software for Red Flag Data Display at AFIT

the Red Flag range. The user can move his viewpoint through the environment
and look in any direction or attach his viewpoint to any aircraft for a cockpit view.
System
I Console
19-inch CRT
Silicon
Graphics RGB-NTSC AFIT
Iris 3130 encoder HMD-1
Workstation
i Polhemus
Mouse and 3-Space Keyboard Tracker
Figure 17. Hard ware Configuration for RF- I
Figure 17 shows a block diagram of the hardware configuration of RF-I. It
uses a Polhemus 3-Space magnetic tracking system for head tracking. A Silicon
Graphics Incorporated (SGI) Iris 3130 workstation is the image generator and
controls the I/0 devices. The image presented to the user is biocular, i.e., the same
image to both eyes. HMD-I is capable of a stereo display, but we did not have the
necessary hardware to control the display of a left-eye and right-eye set of images
from the SGI workstation to the two LCD TVs. The user manipulates his view by
head motion and button presses on the SGI three-button mouse. Various
combinations of mouse button presses, described in Table· 6, cause the user to
move forward, backward or attach the viewpoint to any aircraft. A limited number
of keyboard commands are available to control the replay, for example starting and
stopping the action or moving to a specific time.
4.2.1 Data Extraction and Interpolation. A preprocessing step extracts
data from RFMDS log tapes, but this operation is done only once for each tape.
RFMDS records the position and orientation data for the 36 high-activity aircraft
at the rate of ten records per second per aircraft. Six log tapes of actual Red Flag
39

Left Middle
0 - not pressed 1 -pressed
0 0 0 1
LOS - along line of sight A C - aircraft
0 1 1 0
Right Action 1 Forward LOS 1 Fast Forward LOS 0 Backward LOS 0 Toggle Attach/Detach AC
Table 6. Mouse-Button Presses and Associated Actions for Initial Red Flag Display System
training exercises, provided by the Red Flag organization at Nellis AFB NV,
contain over 150 MBytes of data for each mission. The preprocessing step filters
the data to one record per second per aircraft. This step produces a disk file of the
data for each mission that is only 10-15 MBytes.
WhenRF-1 reads one of the disk files of extracted data, all the information
is kept in an array in memory. At each second of the exercise data, there is a
direction cosine matrix and three coordinate values to describe each aircraft's
orientation and position. All this data uses a right-handed coordinate system on
the Red Flag range with its origin at 37 degrees, 37 minutes 30 seconds N, 116
degrees 0 minutes 0 seconds W. The positive y-axis points to the North and the
positive x-axis points to the East.
To take aircraft data sam pled at one record per second and make the
motion appear smooth, RF- I uses linear interpolation to compute intermediate
values. We independently compute the x,y and z components of position and
orientation (specified as direction cosines). For example, the position of an aircraft
at time 19 hours 40 minutes and 20 seconds (19,40,20) comes directly from stored
data. The position of an aircraft at (19,40,20.2) is the position at (19,40,20) + .2 *
[position at (19,40,21) ·position at (19,40,20)].
40

Linearly interpolating position is perfectly reasonable. However, linear
interpolation of direction cosines is not linear interpolation of orientation.
Nontheless, both RF-1 and RF-II use linear interpolation of direction cosines.
Lorimor tried this technique and he determined that the appearance of the
resulting motion was acceptable.
4.2.2 RF-I Software Organization.
replay loop:
loop poll the Polhemus tracker
RF-I uses the following interactive
linearly interpolate position and direction cosines for aircraft get the next position records for aircraft check for user input read Polhemus tracker data update viewing parameters display the image
end loop
The interface with the Polhemus 3-space tracker consists of two parts. The
first part, the poll, sends the command from RF-1 to the tracker and directs it to
start sampling the current position and orientation of the sensor. The second part,
the read, examines the Unix RS-232 input buffer. If a complete data record exists,
it controls the viewpoint for the next image.
The following list is the set of goals Lorimor had for RF-I.
1. The system can display 3-D images in the head-mounted display in near
real-time. The 3-D effect is from a perspective projection.
2. A user can manipulate the engagement data base to specific points in time in
the engagement sequence.
3. The engagement data base is the basis for the motion of flat-shaded images of
aircraft over wireframe terrain.
4. The user can move anywhere desired in the environment.
5. The user can travel with any object within the environment.
41

The Silicon Graphics Iris 3130 does not have a real-time z-buffer capability,
and that fact limited what we could demand of RF-I. Without a real-time z-buffer,
RF-I uses flat-shaded, filled polygons for the aircraft and a wireframe mesh for the
terrain. The terrain is drawn first and then the aircraft, but no hidden-surface
processing is done.
4.2.3 RF-I Example. Figure 18 shows an example image from RF-I.
The terrain comes from six DMA DTED cells that describe the area in and around
the Red Flag range. The six cells are from an area bounded by 37° N and 39° N
and ll4°W and ll7°W. Sampling this DTED at a resolution of one elevation value
every 5 nautical miles creates a complete terrain description of 3456 line segments.
The aircraft models are all flat-shaded polygons, and models range in size
from 9 polygons for the F-5 to 13 polygons for the F-15. With this database
complexity, the system delivers 6-10 frames per second.
Figure 18. RF-I Sample Image
42

4.3 Software Library
RF-II has several advantages over RF-I, and much of that is the result of
better SGI equipment. RF-II uses newer SCI hardware (an SGI 4D/440VGXT
versus an SGI 3130) and better SGI software (an improved windowing system,
expanded SGI graphics library, and an AT&T C++ compiler). RF-II gains easy
access to these capabilities through a set of C++ classes - software collected from
several MS thesis efforts.
This library of C++ classes provides three capabilities that directly benefit
RF-II: 1) control of serial I/0 devices using an RS-232 connection- particularly
useful to RF-II is the Polhemus interface, 2) interface to the SGI 4D window
system and 3) reading, storage and rendering of geometry. This library works on a
number of SGI 4D workstations. We developed the software on an SGI 4D/85GT
and we moved it to an SGI 4D/440VGXT.
It was essential to re-host the AFIT Red Flag Data Replay system to the
newer SGI workstations. We did not have an object-oriented language available to
Lorimor when he wrote RF-I. When I ported RF-II to the newer SGI workstations,
the library of C++ classes made that job fairly easy. The final portion of this
section offers some observations about the benefits to this project of software reuse.
4 .3.1 I/0 Devices. Filer's thesis work provides a contribution to the
software library, in addition to his construction of HMD-II (described in Chapter
3). Filer's software includes I/0 device handling routines that control an RS-232C
interface using Unix system calls. His approach to the control of serial-interface
devices in general remains an integral part of our virtual environment software. His
software, written in C, is now the foundation of a set of C++ classes for I/0
interfaces (Filer 89).
4.3.2 Polhemus Interface, Window Interface and Geometry Model
Rendering. Software from Gerken's thesis provides an interface to the Polhemus
43

tracker. Based on Filer's interface software, Gerken's classes can control a
Polhemus 3-Space and a Polhemus Fastrak (Gerken 91).
Software from Simpson's thesis creates an easy-to-use interface to the SGI
window manager. It frees the user from learning SGI-specific calls and makes it
easy to create multiple windows and to direct graphics to a specified window
(Simpson 91 ). RF-II makes extensive use of these capabilities.
Brunderman 's contribution is a collection of C++ classes for managing
geometry descriptions, including reading from disk, storing in memory, and
rendering. His software can read and display terrain files from Duckett's terrain
pipeline (described below). Brunderman's software made it easy for RF-II to use a
polygonal description of DMA DTED (Brunderman 91).
4.3.3 Software Reuse. Software reuse is an important topic in software
engineering. There is no easy way to estimate how much time I saved by reusing
code, but I believe it saved me at least 6-9 months. Here are some specifics with
respect to software resue in the development of RF-II.
I created RF-II over a three-month period using RF-I as a starting point.
Creating RF-II from RF-I was made much easier l-,y using the C++ classes for the
Polhemus interface, the SGI windowing interface, and the polygon rendering
software.
Lorimor spent 6-7 months creating the initial version of RF-I, which has
2050 source lines of C code. Brunderman, Simpson, Gerken and Filer each spent
6-8 months on their MS thesis efforts. RF-II has 11,200 lines of code, and almost
all of the code is C++. RF-II uses four of RF-I's routines (271 lines of C code)
without change. RF-Iluses, without change, 9 C++ classes representing over
11,000 lines of C++ code.
These C++ classes are reusable because they provide a tested abstract data
type that makes it easy to accomplish a particular task. One example is the C++
encapsulation of Filer's I/ 0 routines. A challenging task, when using the Unix
44

operating system, is gaining access to a specific I/ 0 port and establishing its
operating characteristics, such as baud rate, operating mode, etc. The constructor
of the RS 232 port class includes Unix-specific calls using ioctl to configure a port.
The user of that class simply specifies port number, baud rate and operating mode
(raw or canonical). Most of the people using this class do not know how to use
ioctl for Unix port control- that was written and tested by Filer and works well.
Brunderman's geometry class is another example of a useful abstract data
type. ~endering a geometric description using SGI's graphics library (GL) is
efficient but npt simple. Brunderman encapsulates his approach to reading and
rendering geometry in a C++ class he calls geomclass. MakeNewGeom is a method
of geomclass that creates an internal description of a geometric model, and when it
is time to view that geometry, the method Render makes all the necessary GL calls
to view the model.
4-4 Geometric Models of Terrain
Duckett's software is a set of utilities, organized in a Unix-style pipeline,
that starts with Defense Mapping Agency (DMA) Digital Terrain Elevation Data
(DTED) and creates polygonal descriptions of terrain at multiple levels-of-detail
(Duckett 91 ). DMA produces several data products for use in simulation, and
DTED is a popular one. DTED Level 1 is regularly spaced elevation data at 3
arc-second spacing, which is approximately 100 meter separation at US latitudes.
DTED is organized in cells with sides that are 1 degree of latitude by 1 degree of
longitude. The 1.44 million elevation values in a cell are stored in a 2-D grid with
1201 points along each edge; filtering of that dense data is essential to reduce the
polygon count for real-time display.
4-5 RF-II
The library described above is the basis for RF-II, the second AFIT Red
Flag Data Replay System. This system uses the newer SGI 4D series of
45

workstations to create shaded, raster images. RF-II can operate on the SGI Indigo
Elan and on the SGI 4D series, Models 4D/85GT through the 4D/440VGXT.
RF-II's user interface includes both an HMD interface and a console interface. I
patterned the console interface after the actual Red Flag Measurement and
Debriefing System (RFMDS) console interface.
EXTRACT
DMA
DTED
TERRAIN
PIPELINE
REDA..AGDATA
REPLAY SYS1EM
mouse keyboard trackball head
tracker
HMD-lll
Console
Figure 19. Data Flow for RF-II
4 .5.1 System Description. Figure 19 presents the data flow for RF- II.
The Red Flag range description is flat-shaded, filled polygons, created using
Duckett's terrain pipeline. A coarse filtering of the DMA DTED data reduces the
polygon count to a manageable size. The terrain description comes from six DMA
DTED cells at latitudes N37° and N38° and longitudes Wll5°, Wll6° and Wll7°.
(DTED cells are identified by the latitude and longitude of their southwest corner.)
Creating a terrain description is not part of the sequence of running RF-II. A single
terrain description is used over and over again.
As with RF-I, a preprocessing step extracts telemetry data from an RFMDS
data tape. However, the RF-I preprocessing tool expects RFMDS Control and
46

Computation System (CCS) tapes, while the RF-II preprocessing tool expects Red
Flag DDS (Display and Debriefing System) tapes. These data on maneuvering
aircraft and the polygonal terrain description create the virtual environment for
the replay.
Polhemus Fastrak I
_...., HMD-III HMD-III control unit
SGI 40/440 VGXT
1----RGB-NTSC TV monitor encoder
I \ 19-inch system console
I mouse I I keyboard
Figure 21. CIS Dimension 6 Trackball
4.5.2 Red Flag TelemetTy Data. I developed new extraction routines for
the 1993 version of the Red Flag Data Replay software, principally because the
Control and Computation Subsystem (CCS) log tapes Lorimor used in 1988 could
not he found. If we had found the tapes, we would have used them again. In 1993
we asked for and received six new data tapes, hut they were DDS log tapes. CCS
and DDS tape formats are quite different.
The DDS log tapes are 1/2-inch, 6250 bpi tapes and hold approximately 150
MBytes of data. These tapes contain binary-formatted data with one tape record
per second of telemetry data. Each tape record contains a variable number of
messages of 15 different message types. The specific message formats are described
in (Message Catalog 1992), and the next two sections provide a brief synopsis of
two of the most important messages for this project.
4.5.2.1 Range Time Message. The Range Time message is a
simple one of fixed length, and serves as a good introduction to the RFMDS
message formats. According to the Message Catalog "The Range Time message
48

supplies the DDS with the current local time of day and indicates to the DDS that
the link from the CCS to the DDS is operational" (Message Catalog 1992:A-92).
Figure 22 shows the three-word format of the range time message.
The vertical parity word, shown as the third word of Figure 22, supports
error-checking of the message. Each bit in that word is an exclusive-or of all the
bits in the message at the same location. For instance, bit 1 of the vertical parity
word is the exclusive-or of bit 1 of all but the last word in the message. All
RFMDS messages have a vertical parity word.
BIT/ WORD
0 MESSAGE LABEL
2 2 2 2 2 2
3LOCKS
HOURS M!Nt."XE:S SECONDS
2
Range 'l'ime ~1essage
Figure 22. Range Time Message Format (Message Catalog 1992: A-92)
4.5.2.2 Maneuver Data Message. The Maneuver Data message is
a variable-length message and is considerably more complicated than the Range
Time message. The Message Catalog states, "The Maneuver Data message supplies
the DDS with dynamic aircraft data for both alphanumeric and 3-D display. All
system information for up to 36 high-activity aircraft will be included in this
message" (Message Catalog 1992: A -69).
This message, broadcast 10 times per second, ranges from 24 to 794 32-bit
words long and can contain information on 1 to 36 aircraft. Each message contains
data on all high-activity aircraft, including the following:
1. Range position: x,y, and z in feet (origin of the range coordinate system is at
37 deg, 37 min 30 sec N, 116 deg W).
2. Orientation: heading, pitch and roll in degrees
49

3. Angle of attack, a, and angle of sideslip, {3
4. Rate of climb and x,y, and z velocity components
.4.5.2.3 Output Disk File. The extraction program takes a DDS
log tape data file and creates a disk file of the telemetry messages needed. The user
may specify how many records per aircraft per second will be kept to permit
parametric filtering of the data. Successive runs of the extraction program can
produce additional disk files with more or fewer records per aircraft per second.
For visual evaluation of a Red Flag training exercise, one record per aircraft per
second works well. For a more detailed analysis of an engagement, such as
evaluating missile shot data, the sampling rate might need to be increased.
The output disk file is Red Flag DDS telemetry messages written to disk
with the telemetry data recorded in a binary format. Lorimor used a slightly
different scheme. He converted data on the Red Flag CCS log tapes into an ASCII
disk file. The 1993 Replay software reads disk files of either format and loads the
aircraft information into internal data structures to prepare for replay. Being able
to read disk files in both formats proved helpful during testing of RF-II; it allowed
us to examine the same Red Flag data with RF-I and RF-II.
4.5.3 User Interface for HMD. As with RF-I, the user controls RF-II
through the use of a three-button mouse, head orientation, and a limited number of
keyboard commands. Of course, using the keyboard is awkward. One may wear
the HMD and look down to see the keyboard. More often, someone else uses the
keyboard and responds to the voice commands of the user.
The HMD user interface of RF-II is similar to the HMD user interface of
RF-I. There are some new features to support the human-performance experiment.
Table 7 describes the new interpretation of mouse button presses. The combination
of mouse button presses and head motion allows a viewer to examine the entire
50

Left Middle Right Action 0 0 1 Toggle in-trail/detached from ownship 0 1 0 Overhead (Plan) view 1 0 0 Toggle between two views,
both behind and above ownship
Table 7. Mouse-Button Presses and Actions for RF-II
engagement area. In the human-performance experiment, we ask the subject to
concentrate on the actions and environment of a particular aircraft called ownship.
Figure 25 is an image when the user is in trail. Here the viewpoint is 500
feet behind the aircraft. Initially, the user is looking right up the tail pipes of the
aircraft. However, by rotating his head, the user can look all around the
environment. However, the viewer's position remains tied to the aircraft's position,
always 500 feet behind the aircraft. This position is the current aircraft's position
minus 500 ti.mes the aircraft's current unit-length velocity vector.
The left screen in Figure 24 shows the engagement after the user has
detached the viewpoint from ownship. Here the viewpoint is stationary. Aircraft
move all around the user. The user can be in trail for a while and then press the
right mouse button. If the user is in trail and looking at ownship and then presses
the right mouse button, his position is set to the last updated viewpoint and the
aircraft flies away.
RF-II still supports many of the keyboard actions from Lorimor's system,
RF-I, including starting and stopping the replay, going to a specific exercise time,
and adjusting the viewing volume for a zoom-in or zoom-out effect.
4.5.4 User Interface for Console Display . A subset of capabilities
available to the RFMDS display operator guided the design of the console display
interface for RF-II. Section 4.5.4.1 presents a summary of RFMDS display options,
taken from (RFMDS 92). Section 4.5.4.2 presents a description of the console
display options of RF-II.
51

4.5.4.1 RFMDS Console Display Options. The RFMDS display
options fall into three types: two-dimensional graphics, three-dimensional graphics,
and alphanumerics. An Adage 4180 color vector system generates the graphical
displays for RFMDS. Perkin-Elmer 3250 computers function as both the Control
and Computational System (CCS) and the Display and Debriefing System (DDS)
for RFMDS. Each RFMDS DDS console has three CRT displays; the default
locations for these displays are shown in Figure 23.
2*D GRAPHICS
PLAN VIEW
3·D GRAPHICS
CENTROID PILOT VIEW THREAT BORESIGHT GROUND TARGET RADAR SWEEP FIRE OPTIONS MENU
Center
ALPHANUMERICS
RANGE STATUS EXERCISE DATA Fl..IGHT DATA QUICK-LOOK OATA PlLOTDATA THREATOATA ENGINEERING OATA. SUMMARY OATA
Right
Figure 23. RFMDS Display Types and Default Locations (RFMDS 92, 4-5)
When a group of pilots use RFMDS for a mission debrief, usually one of the
pilots conducts the debrief and an RFMDS expert serves as the RFMDS console
operator. This approach allows the pilot in charge of the debrief to stand by a set
of frosted panels which have rear projection. The console operator selects two of
the three displays from an RFMDS console and these are. shown on the two rear
projection panels. The pilot conducting the debrief requests options, and the
console operator does his best to satisfy the request.
The RFMDS plan view is a 2-D overhead view which displays low-activity
and high-activity aircraft, aircraft trails and ground threats. This view affords
zoom, pan and scale options to allow the user to examine the Red Flag exercise
over any part of the Red Flag range.
52

Of the several 3-D views, the two used most often are the views that
RFMDS calls centroid view and pilot view. All of these views are classified as 3-D
because they present a perspective projection of the range with a user-controllable
VleW.
The centroid view shows high-activity aircraft and their associated missile
lock indicators, indicating when an aircraft has radar-lock and/or infrared lock. It
also shows ground threats and their status, targets, and stylized terrain features.
The centroid view gets its name because the physical center of the display maps to
the center point of up to four selected objects. The RFMDS console operator may
select up to four of the high-activity aircraft or threats. Thumbwheels permit the
operator to modify the elevation and azimuth angles of the viewpoint. The
centroid view also supports eight distance scales: 100, 50, 25, 12.5, 6, 3 1.5 and
0. 75 nautical miles. An autocentroid button selects automatic distance scaling
which will keep all the selected items in view.
The pilot view displays only high-activity aircraft, and the viewpoint is from
the pilot's position of the selected aircraft. An attitude indicator in the upper left
of the screen indicates aircraft orientation. The display shows a horizon line, sun
position, outlines of the basic cockpit shape, and all visible high-activity aircraft.
In the pilot view, the RFMDS console operator may select a view looking straight
a!Jead (the 12 o'clock position), as well as looking around the aircraft at 3,6 and 9
o'clock positions.
The remaining 3-D display choices each provide a viewpoint from
ground-based elements. The ground target view shows 3-D views centered on target
sites. The radar sweep shows a 3-D view centered on a ground control intercept
radar site. The threat boresight shows a 3-D view along the boresight of the
selected threat.
The third screen has nine display options that are all alphanumeric displays
of data designed to support replay analysis, including data such as distance
between aircraft, weapons status, and flight parameters.
53
4-5-4.2 Console Display Options for RF-Il. The console display
uses the standard 19-inch CRT of the Silicon Graphics workstation. Two windows, .
each 640 x 640 pixels, are always present. The left window is always a 3-D view
and the right window is always a 2-D plan view. (See Figure 24.) I reversed the
location of the two RF-II windows from the default ordering of displays at RFMDS
DDS consoles since the mouse, normally on the right side of a workstation display,
controls the 2-D plan view.
The left window display, patterned after the RFMDS 3-D views, uses four of
the six degrees-of-freedom of the CIS dimension 6TM trackball and several keys on
the keyboard. Twisting and pushing the trackball modifies the view, both the
current viewpoint and the direction the viewer is looking. Twisting the trackball
rotates the view left and right and pitches it up and down. Pushing the ball
forward moves the viewpoint forward along the line-of-sight, while pulling the ball
moves the viewpoint backward along the line-of-sight. Pushing the ball down or
pulling the ball up moves the viewpoint up and down (i.e., change in elevation),
and the system prevents the viewpoint from going underground. Sideways motion
and rolling is not supported in software, although that data is available from the
trackbalL
Two keys are particularly useful in controlling the viewpoint. The C key
places the viewpoint directly behind a selected aircraft. For instance, typing
c 5<CR>
will place the viewpoint behind aircraft number 5. The I key is a toggle; it places
the viewer in trail or detaches the viewpoint from the position of ownship. Ownship
is a term that usually indicates the aircraft that a pilot flies. Here we use the term
to indicate the aircraft that a person is watching most closely.
I patterned the right window display after the RFMDS plan view. The right
window presents a plan view with North always toward the top. The mouse allows
the user to pan the display. Three function keys, Fl, F2 and F3, allow the user to
54

select different zoom factors. The image zooms around the center of the window.
Function key F1 selects the largest zoom factor, and with this setting both the
width and the height of the window for the 2-D view map to 100 miles. With
Function key F2, both the width and height of the window map to 20 miles. With
Function key F3, both the width and height of the window map to 10 miles .
. ,(.5.5 RF-II. RF-II, created five years after RF-I, benefits from several
advances in hardware and software. With access to a Silicon Graphics Iris 4D
440/VGXT, filled, colored polygons describe planes and terrain. Hardware
z-buffering solves the hidden surface problem. RF-II provides this increased
complexity and still delivers 8-10 frames per second.
Figures 24 and 25 are example images from RF-II. Figure 24 shows an
image from RF-II in the console display mode with two screens, the left screen a
3-D perspective view and the right screen a plan view. Figure 25 shows an image
from RF-II in the Head-Mounted Display mode with a single view controlled by
head-tracking and mouse button presses; this figure also shows an example of the
in trail option. (Figure 25 is a photograph of an image on the console of the SGI
workstation at the same resolution of an image in HMD-III.) The viewer is
currently in trail of aircraft 7, an F-15. A bandit (enemy aircraft), aircraft 34, is
crossing from right to left at the top of the image.
The terrain model is from an area bounded by 37° Nand 39° Nand ll4°W
and ll7°W, which is approximately 120 miles North/South by 180 miles
East/West. I used Duckett's software and sampled this DTED at one elevation
value every 2 nautical miles to produce a terrain description of 150 blocks, each
with 72 polygons.
55
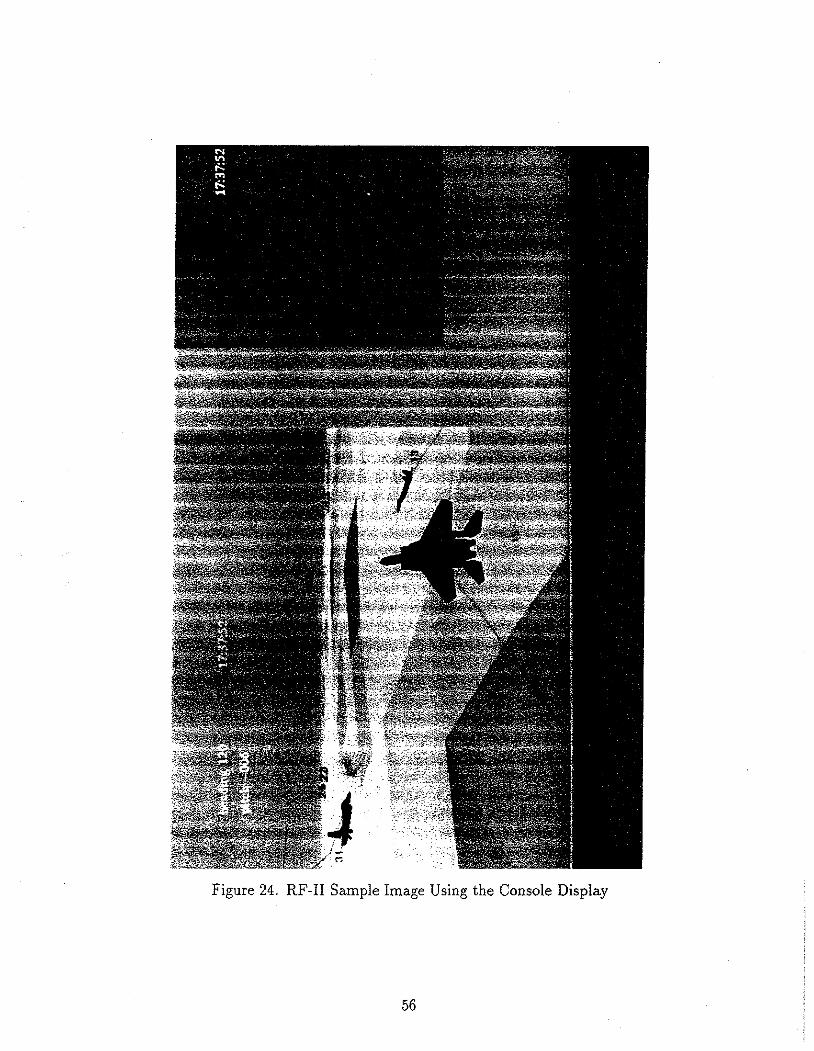
Figure 24. RF-II Sample Image Using the Console Display
56

Figure 25. RF-II Sample Image Using the HMD-system
57

V. Human-Performance Experiment
5.1 Introduction
The human-performance experiment compared the effectiveness of two
display techniques, a head-mounted display (HMD) and a console display (CD)
using a 19-inch CRT. The focus of the experiment was on how well these two
display techniques conveyed information to pilots replaying and evaluating Red
Flag missions.
Since the application was debriefing an air combat training mission, we
reasoned that it introduced minimal interference to stop the replay of the action
and ask a question. That is, we decided to stop the replay, ask a question to
determine how well the subject was understanding the situation, and then resume
the replay with minimal interruption. This concept led to the use of the probe
technique as the primary method of measuring subject performance while
reviewing air combat training data.
5.2 Setup for the Human-Performance Experiment
I traveled to Nellis AFB, NV in June 1993 to conduct the experiment. I
shipped all the required equipment, including the CIS dimension 6™ trackball,
HMD-III, RGB-NTSC encoder, a wooden framework to offload the weight of
HMD-III, and miscellaneous cables. Silicon Graphics provided an SGI workstation
on loan during the experiment.
Three people at AFIT helped in the choice of which HMD to use for the
experiment, HMD-II or HMD-III. Two of these people were pilots working on their
MS program at AFIT. HMD-II offered the advantages of lighter weight and
comfort. HMD-III offered increased resolution, but it was much heavier. The

wooden "gallows" structure helped offload weight from the wearer. A velcro loop,
attached to the bottom of the frame, permitted the wearer to use his arm to help
rotate HMD-III. (In Figure 26, the wearer has his left index finger hooked in the
velcro loop.) All three people preferred HMD-III over HMD-II for the debriefing
application.
This equipment set-up at Nellis AFB included:
1. Silicon Graphics Iris Crimson workstation with VGX graphics pipeline,
including 19-inch CRT, mouse and keyboard.
2. HMD-III and supporting equipment, such as power supply box, cables and
RGB-NTSC converter, to provide observers a glimpse of what the HMD
wearer was seemg.
3. Wooden "gallows" to off-load the weight of the HMD from the wearer.
4. CIS Dimension 6 trackball.
Figures 26 and 27 show RF-II equipment in the AFIT graphics laboratory.
Figure 26 is the HMD experimental equipment set up and Figure 27 shows RF-II
using the console display.
Fifteen experienced USAF fighter pilots assigned to the 422nd Test and
Evaluation Squadron (TES) served as subjects for the human-performance
experiment. These pilots were well-qualified subjects because of their experience in
tactics development and equipment testing. Their experience gained during tactics
development included frequent use of RFMDS. Consequently, these subjects were
experienced at using RFMDS to debrief missions. These pilots were also involved
in testing new equipment such as helmet-mounted sights, new formats for
in-cockpit displays, etc. As a result, these men had been involved in experimental
work before and they had served as subjects in experiments before.
Thirteen pilots completed an entire experimental session. Two sessions were
incomplete; one because of a computer malfunction, and the other because one
59

Figure 26. Experimental Set-Up using HMD-III
Figure 27. Experimental Set-Up using Console Display
60

pilot had a problem using HMD-III. He was unable to fuse the two images from the
microscope eyepiece into a single image. I had seen this before with a few test
subjects in the AFIT graphics laboratory, but this was the first and only pilot who
experienced the problem.
5.3 Experimental Design
Each subject participated in a single, two-hour session during which both
display types were used. The session started with an overview of the experiment,
followed by two trials, one for each display type (HMD and CD). Subjects
completed four surveys throughout the session. RF-II collected each subject's
answers to the probe questions during the two trials.
The experimental session began with a presentation of the experiment's
purpose. I explained to each subject that we would use this data to compare the
effectiveness·of displays and assured them that we would not use this data in any
official USAF actions or evaluations. Next, I described how RF-II would present
the questions, the fact that they would answer all questions with a yes or no, and
how to use the mouse to answer the questions and to express a confidence in the
answer. Appendix A has a printed copy of the instructions used to brief the
subjects.
Each of the two trials in an experimental session consisted of a training
segment, a pre-brief, and an experimental segment during which RF-II collected
quantitative data. The training segment gave the subject experience with the user
interface for the display system. RF-II presented six sample questions, and I
encouraged each subject to continue experimenting with the user interface until he
felt ready to proceed .. The pre-brief was next and described the training scenario
for the selected Red Flag mission. Appendix B contains the information used
during the pre-brief for the two selected missions, June 24, 1992 and July 22, 1992.
Each subject completed four surveys during the session; Appendix C has
copies of the blank surveys. The Subject Survey asked the pilot about amount of
61

flying time, types of aircraft flown, etc. The answers to these questions provided
some interesting insights. In particular two facts became readily apparent. First,
the 422 TES had provided experienced pilots. The amount of flying time and types
and numbers of airplanes clearly established the experience of the subjects.
Second, the job of conducting operational test and evaluation at Nellis AFB
frequently involved the use of the RFMDS; these subjects had considerable
experience in mission evaluation. Several of the pilots indicated that they used
RFMDS one to two weeks each month.
The remaining three surveys asked the subject to compare display systems.
The second and third surveys asked the subject to compare the displays of RF-II to
the displays of the operational Red Flag Measurement and Debriefing System
(RFMDS). The fourth survey asked the subject to compare the two display options
of RF:n.
5. 3.1 Two Red Flag Missions and Probe Questions. In the spring of
1993 we received five Display and Debriefing System (DDS) data tapes of Red Flag
exercises. The DDS tapes were of missions from June 24, 1992; June 25, 1992; July
21, 1992; July 22, 1992; and July 28, 1992. Mr. Bob Shaw, of Fighter Command
International, served as a subject-matter expert during the development of the
human-performance experiment. Mr. Shaw has 20 years of experience as a military
pilot, and he wrote a book on fighter tactics and basic fighter maneuvers
(Shaw 85).
Mr. Shaw and I selected one segment from the June 24th mission and
another segment from the July 22nd mission. We used the criteria that the two
missions had to be similar and that we could generate suitable probe questions. He
explained that although no two missions are identical, these two were similar.
In both segments, a four-ship flight of F-15s started the exercise in the
southeastern part of the Red Flag range. In both segments these F -15s acted as
escorts for the strike package, i.e., the planes that were to put bombs on target.
62

Finally, in both segments, the F -15s engaged enemy aircraft within minutes of the
start of the segment.
I realized early in this process that measuring a subject's understanding of
the replay of an engagement would be difficult. I used signal detection theory to
measure each subject's sensitivity, in this case a subject's ability to decide whether
or not a particular situation existed. This presented us with the difficult task of
developing questions that could be answered yes or no and that evaluated how well
a subject understood the engagement.
While developing the questions, we decided that a subject would be asked
to do the following. He would be asked to concentrate on a particular aircraft
called ownship. He would be asked to keep track of ownship, ownship and wingman
(a two-ship unit called an element), the other element in the flight of four F-15s,
the strike package, and enemy aircraft. The questions would ask about these four
aircraft, what was happening to other components of the Blue force (friendly) and
what components of the Red Force (enemy) were doing.
All the questions were spatially oriented and generally fell into three
categories:
• Where is your flight or element, and what is it doing?
• Where is your flight or element in relation to the strike package(s)?
• Where are enemy aircraft relative to your flight or element?
Appendix D contains all the questions associated with both segments, but here are
a few examples of the yes or no questions.
You are on the left side of your formation.
The closest threats to your flight are operating as a four-ship line abreast formation.
Relative to your aircraft, your strike package ~s behind you and low.
63

The southern element of your flight 2s under the greater threat.
Your flight 2s climbing.
5.3.2 Methods and Experimental Variables. Identifying the independent
and dependent variables is crucial to the design of a human-performance
experiment. Marshak states that independent variables are thought to be causes
and dependent variables are thought to be effects (Marshak 92a:l4). A
human-performance experiment should be designed to investigate the cause-effect
relationship between the independent and dependent variables.
Confounding variables are potential causes in the environment which are
under study that systematically distort the measurement of cause-effect
relationships.
5.3.2.1 Independent Variables. Display type is the independent
variable in this experiment. I used a straightforward, repeated-measure comparison
between the effectiveness of information transfer when using the head-mounted
display (HMD) and that when using the console di~play (CD). Each subject used
both display types, but the order of HMD, CD, and the pairing of mission with
display type were randomly assigned and counterbalanced to prevent any
confounding effect of sequence. Table 8 shows how the choice of first mission
segment and of display type were ordered among the subjects. A hardware error
occurred during the session with Subject 4, so I used that mission and display
ordering for Subject 7. Subject 6 was unable to use HMD-III, so I used that
mission and display ordering for Subject 8. Consequently, the experiment produced
information from 13 complete sessions and partial information from two additional
sesswns.
Each session followed the format listed below, with approximate time for
each step inside the parentheses.
64

Subject TRIAL 1 Number MISSION DISPLAY
1 6/24 HMD
2 6/24 CD
3 7/22 HMD
4 7/22 CD
5 6/24 HMD
6 6/24 CD
7 7/22 CD
8 6/24 CD
9 7/22 HMD
10 7/22 CD
ll 6/24 HMD
12 6/24 CD
13 7/22 HMO
14 7/22 CD
15 6/24 HMO
HMD - head mounted display opt10n CD - console display option
TRIAL 2 DATE/ MISSION DISPLAY TIME
0900 7/22 CD 2 Jun 93
1100 7/22 HMD 2 Jun 93
1400 6/24 CD 2 Jun 93
1600 6/24 HMD 2 Jun 93
0900 7/22 CD 3 Jun 93
llOO 7/22 HMD 3 Jun 93
1400 6/24 HMD 3 Jun 93 HMD
1630 7/22 HMD 3 Jun 93
1000 6/24 CD 4 Jun 93
0745 6/24 HMD 7 Jun 93
0900 7/22 CD 7 Jun 93
ll30 7/22 HMO 7 Jun 93
1400 6/24 CD 7 Jun 93
1600 6/24 HMD 7 Jun 93
0900 7/22 CD 8 Jun 93
Table 8. Ordering of Subjects and Display Option
65
DATE/ TIME
1030 2 Jun 93
1200 2 Jun 93
1500 2 Jun 93
1700 2.Jun 93
1000 3 Jun 93
1200 3 Jun 93
1500 3 Jun 93
1730 3 Jun 93
llOO 4 Jun 93
0815 7 Jun 93
1000 7 Jun 93
1300 7 Jun 93
1500 7 Jun 93
1700 7 Jun 93
1015 8 Jun 93

• Subject Survey (5 mins)
• Instructions/Motivation for the experiment (5 mins)
• Training session for display type 1 (10 mins)
• Pre-brief scenario for 1st display test (5 mins)
• 1st display test (10 mins)
• Questionnaire comparing display type 1 to RFMDS (5 mins)
• Training session for display type 2 (10 mins)
• Pre-brief scenario for 2nd display test (5 mins)
• 2nd display test (10 mins)
• Questionnaire comparing display type 2 to RFMDS (5 mins)
• Questionnaire comparing display types 1 and 2 (5 mins)
• Open-ended question/answer session with subject (10 mins)
5.3.2.2 Confounding Variables. The User Interfaces (Uls) of the
two display options were different. This complicated measuring the effectiveness of
the two display types and was a confounding variable. I modeled the UI of the CD
after the keyboard controls of RFMDS as described in Section 4.5.4. The UI for
the HMD was a modification of the HMD user interface of RF-I.
A second potential confound resulted from the number of times subjects
shifted viewpoints. I noticed that frequent pauses occurred during debriefings with
RFMDS when the person conducting the briefing asks the RFMDS console
operator to change the view on the console displays. These pauses presented
additional time to study the displays and increased the subject's chance to
maintain awareness. We could have prevented this by blanking the screens during
viewpoint changes, but this would have made such changes difficult to control. We
decided to keep track of the number of times the viewpoint was changed and to
correlate this data with other performance measures.
66

5.3.2.3 Dependent Measures. Does a measurable difference exist
in the effectiveness of the two display types; CD and HMD? Or, stated another
way, is one display type more effective than the other in communicating
information about an air-to-air combat training engagement? The answer to this
question lies in what is called situation awareness (SA). SA is defined as the
aircrew member's mental awareness of the events occurring both in and around the
aircraft. The RFMDS recreates the just-experienced air combat in such a way that
the pilots can better understand what occurred. SA embodies this understanding
of the complex events of air combat and is critical to a pilot's effectiveness. Those
who have been most successful in air combat are thought to have exceptional SA.
Measuring SA is difficult. The most serious problem of measuring SA is
reactivity, i.e., the degree to which the techniques used in a measurement perturb
the values being measured. It is nearly impossible to make SA measurements
without disrupting the process that is being measured. Overcoming, or at least
minimizing, reactivity is a continuing challenge. The most fruitful method used to
date is single probe questions (Marshak 92b ).
Iconic Visual Memory
Sperling conducted several human memory studies during which he briefly
displayed an array of letters to his subjects. The following description is based on
Ashcraft's summary of several years of Sperling's work (Ashcraft 94).
In one set of trials, Sperling presented twelve letters in an array of three
rows of four letters each. Subjects were shown the array of letters for 50 msec
followed by a blank postexposure field for a variable length of time, from 0 to 5
seconds. Then, the subjects were asked to report all the letters from the display.
Subjects averaged 4.5 letters correct for the display of 12 letters, or 35% accuracy.
Sperling then conducted studies that extended the previous experiment by
modifying how the subject was asked to report information. Rather than using the
whole-report condition where a subject was asked to report any and all letters,
Sperling used a partial-report condition where a subject was asked to report a
67

subset of the letters. He used an audio tone and directed the subjects to report one
of the three rows. However, the tone was sounded after the display of both the
entire array of letters and the postexposure field. In this experiment, the subject's
performance was 76% correct. Sperling reasoned that all the letters of the display
were available in iconic memory initially, but then faded more rapidly than the
subject could report them.
In other experiments, Sperling presented 18 letters in the display with
parti?-1-report performance indicating that 17 of the 18 letters (94%) were available
in iconic memory. Subsequent work by Sperling revealed that iconic memory not
only degrades quickly over time, but it is also affected by subsequent visual
stimulus.
Other Variations on the Probe Question Technique
Endsley used SAG AT to study SA in aircraft simulations (Endsley 88).
The SAG AT procedure freezes the simulation and asks the aircrew a series of as
many as 10 probe questions about their current situation.
Marshak, et. al. used a variation of the probe question method. Their
subjects watched one of two forms of moving map display- earth-centric or
egocentric. The subject's task was to watch an aircraft symbol navigate a complex
course filled with terrain, threat and target information. Their version of the probe
question method paused the simulation and asked a single question about the
momentary situation. This question was a magnitude estimate of flight parameters
or distance to objects on the map display. Performance was uneven, as subjects
either were not very aware of the information or could not report it effectively
(Marshak 87).
Marshak suggested an alternative method of measuring SA for this study,
using a variation of the probe question method (Marshak 92b ). As in
(Marshak 87), this approach would pause the simulation and ask a single question.
However, the subjects would answer each question yes or no, rather than asking for
a magnitude estimate. Measuring SA in this manner presents two advantages ..
68
First, it minimizes the mental overhead associated with the measurement. Mental
overhead might have affected the magnitude estimates Marshak et a!. employed . .
We reasoned that the recognition method would be less demanding
(Marshak 92b ). Second, forcing the subject's answers to be yes or no permits us to
analyze the data using theory of signal detection (TSD) (Swets 64).
69

VI. Experimental Results
6.1 Introduction
This chapter presents the analysis of the data collected during the
human-performance experiment. The first section of this chapter summarizes
general inforrrl:ation about the subjects. The following sections present the data
and analysis; first the quantitative data and then the qualitative data.
6.2 Information about the Subjects
Table 9 summarizes general characteristics of the subjects in the
human-performance experiment. These USAF pilots were unpaid volunteers, with
their time and effort provided by the commander of the 422 Test and Evaluation
Squadron. Several of the pilots were willing, and some were even eager to
participate in the experiment. The amount of total flying time and hours in a
fighter clearly establish the subjects as experienced fighter pilots; 1000 hours is a
significant amount of time in a fighter.
6. 3 Quantitative Data
The subjects' answers to questions posed during the two debriefs provided
the quantitative data. We developed 34 probe questions for the replay of the June
24th mission and 29 probe questions for the replay of the July 22nd mission. Table
Category Mean I Minimum I Maximum I Flying Time 2149 hours 980 3000 Hours in Fighter 1919 hours 980 2500 Age 33 years 29 38
Table 9. Subject Experience

Subject HMD CD Number Hits FA #V Hits FA #Y
1 14/16 2/18 163 15/16 4/13 60 2 12/16 3/13 126 13/16 4/18 14 3 16/16 6/13 231 11/16 5/18 55 5 14/16 3/18 126 13/16 2/13 13 7 11/16 8/18 121 13/16 5/13 39 8 16/16 5/13 116 11/16 4/18 17 9 12/16 2/18 165 7/16 3/13 14 10 14/16 3/18 116 15/16 5/13 16 11 16/16 3/18 116 13/16 6/13 21 12 12/16 5/13 92 14/16 2/18 23 13 12/16 5/13 221 13/16 4/18 24 14 15/16 5/18 141 15/16 4/13 49 15 9/16 6/18 124 13/16 6/13 8
FA- False Alarms # V- Number of viewpoint changes
Table 10. Subject Performance when Answering Questions
10 shows the performance of the subjects when answering the probe questions
during the experiment. The table lists t.he frequency of hits (number of yes answers
when the answer should have been yes) and the frequency of false alarms (number
of yes answers when the answer should have been no). Table 10 also lists the
number of viewpoint changes during each replay.
6.3.1 Measuring Subject Performance Using the Theory of Signal
Detection . Approximately 35 years ago graduate students from psychology and
electrical engineering at the University of Michigan found. themselves sharing
offices. The engineers were concerned with signal detection and the psychologists
were concerned with the response of human beings to visual and auditory input.
During discussions about their respective research tasks they noticed many
similarities. As a result of this interaction, the theory of signal detection has been
applied to human signal detection and has had a profound effect on experimental
psychology (Kantowitz 83).
71
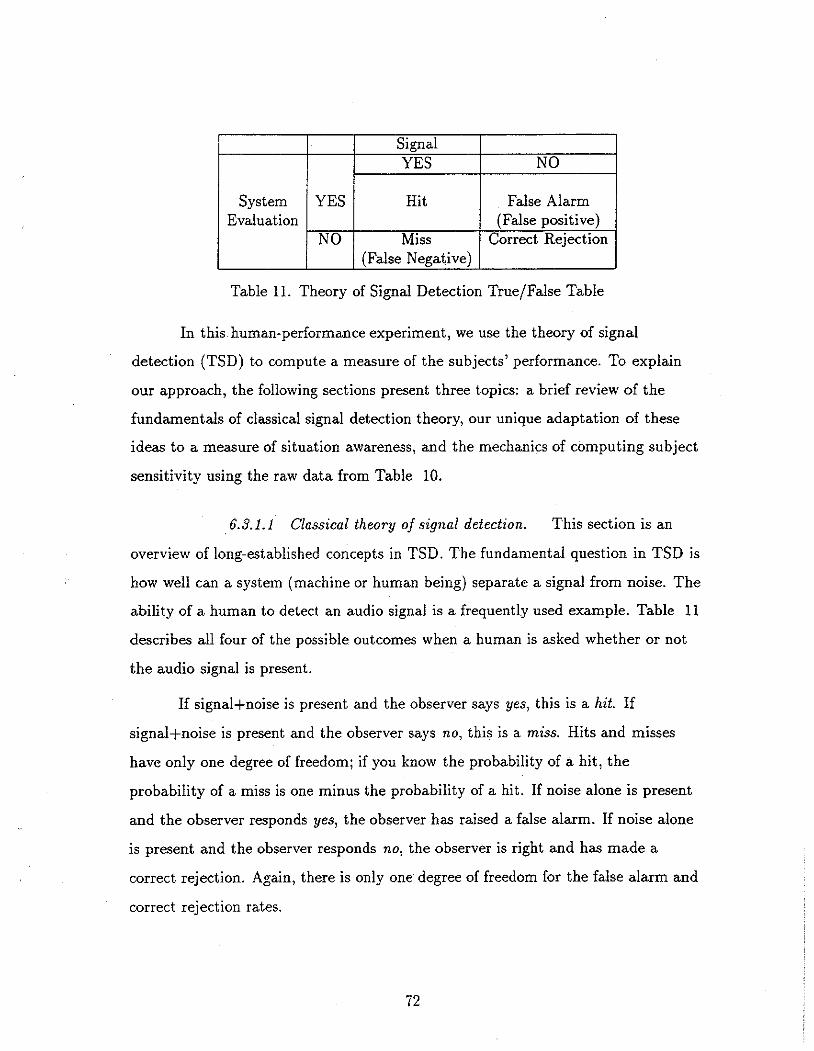
Signal YES NO
System YES Hit False Alarm Evaluation (False positive)
NO Miss Correct Rejection (False Negative)
Table 11. Theory of Signal Detection True/False Table
In this human-performance experiment, we use the theory of signal
detection (TSD) to compute a measure of the subjects' performance. To explain
our approach, the following sections present three topics: a brief review of the
fundamentals of classical signal detection theory, our unique adaptation of these
ideas to a measure of situation awareness, and the mechanics of computing subject
sensitivity using the raw data from Table 10.
6.3.1.1 Classical theory of signal detection. This section is an
overview of long-established concepts in TSD. The fundamental question in TSD is
how well can a system (machine or human being) separate a signal from noise. The
ability of a human to detect an audio signal is a frequently used example. Table 11
describes all four of the possible outcomes when a human is asked whether or not
the audio signal is present.
If signal+noise is present and the observer says yes, this is a hit. If
signal+noise is present and the observer says no, this is a miss. Hits and misses
have only one degree of freedom; if you know the probability of a hit, the
probability of a miss is one minus the probability of a hit. If noise alone is present
and the observer responds yes, the observer has raised a false alarm. If noise alone
is present and the observer responds no, the observer is right and has made a
correct rejection. Again, there is only one degree of freedom for the false alarm and
correct rejection rates.
72
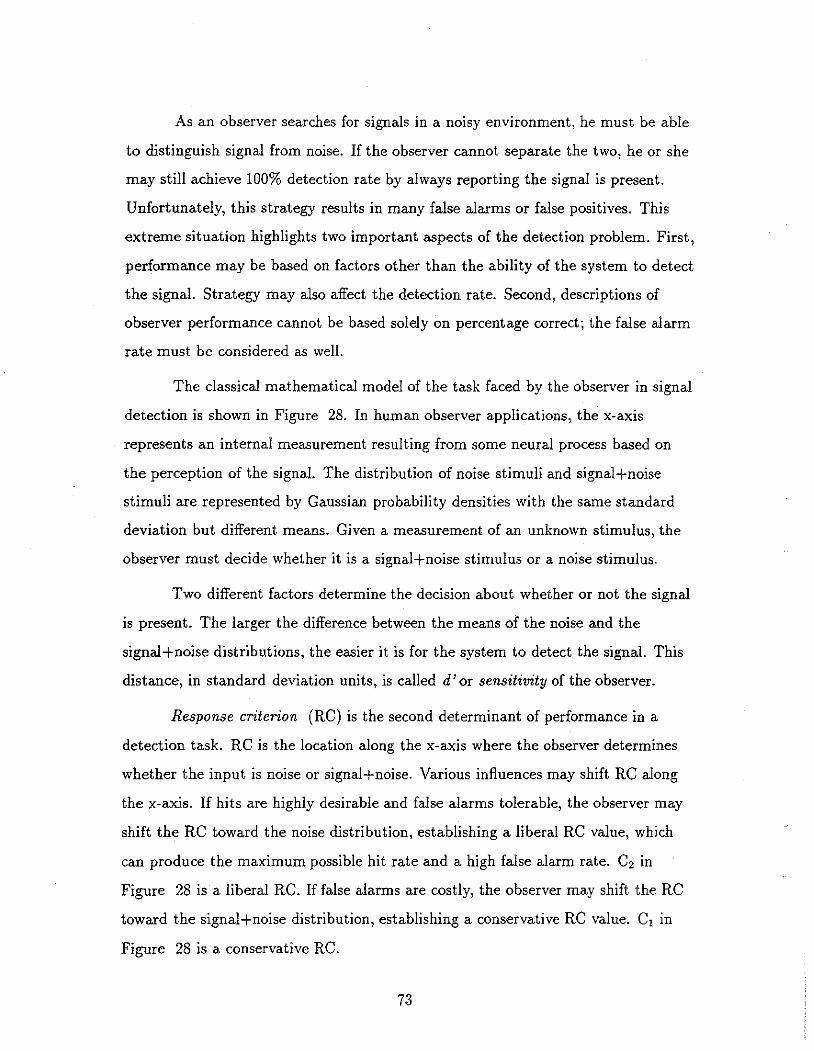
As an observer searches for signals in a noisy environment, he must be able
to distinguish signal from noise. If the observer cannot separate the two, he or she
may still achieve 100% detection rate by always reporting the signal is present.
Unfortunately, this strategy results in many false alarms or false positives. This
extreme situation highlights two important aspects of the detection problem. First,
performance may be based on factors other than the ability of the system to detect
the signal. Strategy may also affect the detection rate. Second, descriptions of
observer performance cannot be based solely on percentage correct; the false alarm
rate must be considered as well.
The classical mathematical model of the task faced by the observer in signal
detection is shown in Figure 28. In human observer applications, the x-axis
represents an internal measurement resulting from some neural process based on
the perception of the signal. The distribution of noise stimuli and signal+ noise
stimuli are represented by Gaussian probability densities with the same standard
deviation but different means. Given a measurement of an unknown stimulus, the
observer must decide whether it is a signal+noise stimulus or a noise stimulus.
Two different factors determine the decision about whether or not the signal
is present. The larger the difference between the means of the noise and the
signal+noise distributions, the easier it is for the system to detect the signal. This
distance, in standard deviation units, is called d' or sensitivity of the observer.
Response criterion (RC) is the second determinant of performance in a
detection task. RC is the location along the x-axis where the observer determines
whether the input is noise or signal+noise. Various influences may shift RC along
the x-axis. If hits are highly desirable and false alarms tolerable, the observer may
shift the RC toward the noise distribution, establishing a liberal RC value, which
can produce the maximum possible hit rate and a high false alarm rate. C2 in
Figure 28 is a liberal RC. If false alarms are costly, the observer may shift the RC
toward the signal+noise distribution, establishing a conservative RC value. C1 in
Figure 28 is a conservative RC.
73

d' ~------------------~
E N
y
c2
!sJ'il
X= domain of stimulus (frequency, energy, etc.) Y = probability of x
~SN cl
EN = probability density of noise only stimulus given stimulus domain EsN = probability density of signal +noise stimulus given stimulus domain fN(x;) =probability of membership of x; in the noise distribution fsN(x;) =probability of membership of x; in the signal+noise distribution
X
c; = potential response criterion for deciding between noise and signal+noise d' = operator sensitivity when distinguishing between noise and signal+noise J.!N = mean of EN J.!SN = mean of EsN
Figure 28. Central neural effect (decision axis) as a. basis for human decisionmaking (D'Amato 70:159)
74

D'Amato offers the following description ot the signal detection task from
the viewpoint of human decision-making (D'Amato 70:157).
Virtually every discriminative performance may be considered to be the outcome of two classes of information. First there is the information about the to-be-discriminated stimuli themselves, which is mainly a function of the stimulus parameters in the situation and the individual's sensory apparatus; sensitivity is a measure of this contribution. Then there are numerous variables- such as the subject's motivation, his knowledge about the likelihood that certain stimuli will appear, the gains and penalties associated with certain responses - which, though independent of sensitivity, nevertheless influence discriminative behavior; collectively they are thought to affect the subject 's· response criterion.
D'Amato goes on to describe how TSD can be used to distinguish between
sensitivity and response criterion (D'Amato 70:158).
The problem is to detect a signal, say a sine wave embedded in a white-noise background .... Consider, then, a subject whose task is to respond signal or no signal to indicate whether, during a well-defined interval, a signal was present in addition to the noise background. The first major assumption is that, although the physical stimuli in the situation, the noise (N) and the signal plus noise (SN) are nominally constant, their sensory effects vary from presentation to presentation in a way that is adequately represented by the normal (Gaussian) distribution .... It is also assumed by TSD that the distribution of the noise stimulus (EN) can be represented on the same continuum as that occupied by the distribution of signal plus noise ( EsN ), as shown in Figure 28. It is not difficult to imagine that the sensory effects of the two stimuli converge somewhere in the central nervous system, where for purposes of decision-making, their various properties are summarized by a single quantity .... For our own part let us assume that N and SN generate central neural effects which take the form of normal distributions, EN and EsN, which we refer to as the decision axis.
A significant advantage of TSD measures is that they are independent of
each other. Whatever the strategy the observer adopts, the sensitivity to the signal
does not change. We can display the interaction of d' and RC on a receiver
operating characteristic (ROC) curve.
75

An ROC curve is a summary of the behavior of an observer in a detection
task as the response criterion varies. Figure 29 from (Kantowitz 83) shows two
sample ROC curves. The solid diagonal line is the chance line, where the
probability of false alarms is equal to the probability of hits. As the sensitivity of
an observer (or system) increases, the ROC curve moves closer to the (0,1) corner.
The more conservative the response criterion employed, the closer the performance
will be to the (0,0) corner. The more liberal the response criterion employed, the
closer the performance will be to the (1,1) corner. Consequently, the ROC curve
gives an indication of both sensitivity and response criteria .
., "' : 0.5 f
0.5 1.0
False alarm rate
Figure 29. Receiver operative characteristic (ROC) (Kantowitz 83:88)
6.3.1.2 Measuring Situation Awareness with TSD. Following
TSD, we characterize the information that surrounds an aircrew member as a
mixture of noise (N) and signal plus noise (SN). When we ask the subject a
76

question such as "Is there an enemy fighter at Six O'Clo.ck?" (i.e. immediately
behind, the most dangerous place), the pilot may respond yes or no.
Consider the following example, based on ideas from (Kantowitz 83).
Suppose we ask a pilot to determine whether or not another aircraft is a friend or
foe. The pilot must answer yes or no to the question "Is the aircraft directly ahead
of your aircraft a friend?" A pilot might combine a number of factors to determine
an answer, including a visual identification, information from other pilots in the
area, and information from the on-board IFF (identification friend/foe) equipment.
When the pilot combines all the selected factors and makes a yes or no
determination, he is using his previously established RC. The combination of
factors produces something that can be thought of as an index, and when that
index is equal to or exceeds the RC, the evaluation is yes. Otherwise, the index is
less than the RC and the evaluation is no.
How can we measure a subject's performance while doing this type of task?
Did the subject say yes every time the aircraft being evaluated was actually a
friend? (We call it a hit when the subject says yes when the answer is yes.) Did the
subject say yes when the aircraft was actually a foe? (We call this a false alarm.)
Now, let us relate this identification friend/foe task to Figure 28. Each
subject combines some set of data into an index, and we use two curves to model
how the index relates to the samples. One curve, EN, models the distribution of
index values for foe aircraft. A second curve, EsN, models the distribution of index
values for friend aircraft. A pair of these curves characterizes a subject's
performance in a discrimination task. The separation between the centers of the
two curves represents a subject's sensitivity, i.e., his ability to distinguish between
a signal+noise (yes) and noise (no). In the friend/foe determination, the separation
between the center of a subject's curves measures how well a pilot can discriminate
between friend and foe aircraft.
77

6.3.1.3 Using subject sensitivity as a measure of Situation
Awareness. The preceding description of TSD is sufficient for simple situations
where noise and signal+noise differ along a single dimension. If an observer is
listening for a single frequency tone in a background of white noise, the perception
serves as a basis of a decision. If neural response (the x-axis) exceeds the current
RC, the observer pushes the button and reports hearing the tone. We can compute
a d' for any amplitude of tone based on hit and false alarm rates.
What about a more complex stimulus? Suppose the observer had to listen
for either of two different tones. In this situation, the description of what
constitutes a signal is ill-defined. Such a study might be conducted in the following
fashion. Each stimulus (noise or signal+noise, with a signal consisting of tone 1,
tone 2, or both tones) would be presented for a fixed interval and after termination
of the stimulus the observer would be presented with a question. The question
might be "Was tone 1 present?", "\Vas tone 2 present?", or "Were both tones
present?" The observer could respond with _either yes or no. The ambiguity of the
signal would force the observer to search short-term memory (recall the stimulus is
off when the question is asked) to determine whether or not the particular stimulus
was present. This is a more complex task than the case of simple signals. However,
there is no reason why d' cannot be computed for this situation as well.
Consider the situation of the subjects examining Red Flag air combat
training data. The subjects watch the display, which is a highly complex signal.
They must maintain awareness of multiple aspects of the scenario being replayed:
hostile aircraft position, friendly aircraft position, altitude, airspeed, etc. Blanking
the replay and posing a yesjno question about the scenario represents the same
type of situation as described above with the two-tone task. The subject must
search short-term memory to determine whether the question should be answered
yes or no. If the subject responds yes and that is the correct answer, it is a hit. If
the subject responds yes and the correct answer is no, he has raised a false alarm.
The TSD measured' can be computed from these hit and false alarm rates.
78

Withholding determination of the signal until after the display is blanked
means the observer must search short-term memory to make the determination_
The subject does not know what to evaluate until the probe question is presented.
Consequently, the probe questions force a query of short-term memory and the
subject is forced to make a yes/no determination. This approach is similar to
Sperling's work, described earlier, with the tachistoscope and rows of letters
(Ashcraft 94).
6.3.1.4 Calculating Subject Sensitivity. RF-II collected the
subject's yesj no answers to approximately 30 questions. This data, presented in
Table 10, provide a hit and false alarm rate for both display types for each subject.
Appendix B of (Kantowitz 83) describes a method of computing sensitivity using
hit and false alarm rates, and the following description summarizes that approach.
There are two steps in the computation of d'. Both steps involve placing a
normalized Gaussian curve (NGC), i.e., a mean of zero and a standard deviation of
one. The first step is to locate the NGC representing the noise signal so that its
center is at zero. Next, we locate the RC by using the false alarm rate.
In the first step we are only dealing with the NGG that models the subject's
response to questions with a correct answer of no, EN. This is identified in the top
part of Figure 30 as the portion of the NGC for EN to the right of the response
criterion, C.
For example, consider a subject with a false alarm rate of 14/68 = .21. The
subject's false alarm rate indicates that his response criterion was set so that 21%
of the area of this curve needs to be to the right of the response criterion. A table
of the NGC indicates that 21% of the area under the curve is to the right of .8.
Consequently, this subject used a response criterion value of .8.
In the second step of the computation of d', we need to locate the NGC that
models the subject's response to questions with a correct answer of yes, EsN. This
signal+noise curve needs to be to the right of the curve for noise. (See the bottom
79

A,ru:=0.21
X c
0 •• ,.
Figure 30. Calculation of response criterion (after Kantowitz 83:98)
part of Figure 30.) We position the signal+noise curve using the hit rate. The
area under the signal+noise curve that is to the right of the RC is the hit rate.
To continue with the example, suppose the subject with a false alarm rate
of .21 has a hit rate of 28/32 = .875. The NGC is symmetric and consequently the
area under the curve from the mid-point to infinity in either direction is .5. For
this example, the area from RC to the midpoint needs to be .875 - .5 or .375. The
table of NGC values indicates the value associated with an area of .375 is 1.15. We
now have enough information to compute the subject's sensitivity, the separation
of the center of the two curves, .8 + 1.15 = 1.95
Using the data from Table lO and the approach described above, I
calculated a sensitivity for both display types for each subject. Table 12 lists these
calculated sensitivities for the 13 subjects. Figure 31 graphically depicts the
means and standard errors of the means of the calculated sensitivities.
80
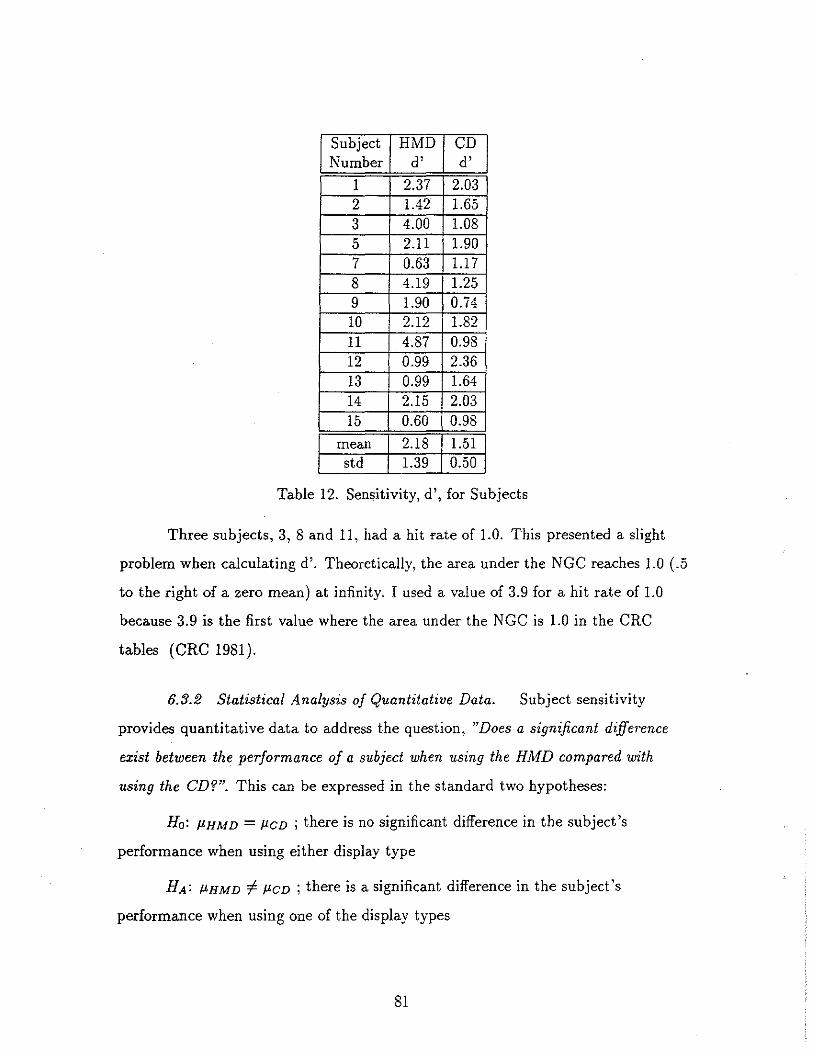
Subject HMD CD Number d' d'
1 2.37 2.03 2 1.42 1.65 3 4.00 1.08 5 2.11 1.90 7 0.63 1.17 8 4.19 1.25 9 1.90 0.74 10 2.12 1.82 11 4.87 0.98 12 0.99 2.36 13 0.99 1.64 14 2.15 2.03 15 0.60 0.98
mean 2.18 1.51 std 1.39 0.50
Table 12. Sensitivity, d', for Subjects
Three subjects, 3, 8 and 11, had a hit fate of 1.0. This presented a slight
problem when calculating d'. Theoretically, the area under the NGC reaches 1.0 (.5
to the right of a zero mean) at infinity. I used a value of 3.9 for a hit rate of 1.0
because 3.9 is the first value where the area under the N GC is 1.0 in the CRC
tables (CRC 1981).
6.3.2 Statistical Analysis of Quantitative Data. Subject sensitivity
provides quantitative data to address the question, "Does a significant difference
exist between the performance of a subject when using the HMD compared with
using the CD?". This can be expressed in the standard two hypotheses:
Ha: JlHMD = JlCD ; there is no significant difference in the subject's
performance when using either display type
HA: JlHMD # JlCD ; there is a significant difference in the subject's
performance when using one of the display types
81

Sensitivity Mean and Standard Error of the Mean 3r-------------~----------------------------,
" ,;. ·~ 'Q .. e !f,
2.5
2
1.5
0.5
'dprime.data' -'dprimesem.data' ........,.
T 1
0~----L-----~----------------~------~----J d'HMD d'CDS
Figure 31. Mean and Standard Errors of the Mean for Sensitivity Data
I used SAS on a Sun workstation for data analysis. SAS is an integrated
system of software products for data management, analysis and presentation. (SAS
System is a product of the SAS Institute Inc. of Cary NC.)
t test
A dependent t-test determines whether there was a significant difference
between the sensitivities of the two sets of data. For this experimental data, with
12 degrees of freedom, the t statistic is t(l2) = -1.50. However, the t calculated
would need to be± 1.782 for a significance level of 0.05. (The probability that this
difference occurred by chance alone is 15%.) Consequently, there is no significant
difference between the subjects' performances when they use the HMD or the CD.
F test
The dependent t-test assumes homogeneity of variance, and the variance of
these HMD and CD data in Table 12 shows a considerable difference in the
variability. An F-test checks the variability, and it indicated that the data did not
82

satisfy the t-test assumption. F(1,12) = SJwvfsbn = 1.512 /.522 = 8.43. (This
expression describes an F-test with 12 degrees of freedom. The value of the F-test
is the ratio of the sample variances, and for the sensitivity data, the ratio is 8.43.)
From a table of the F distribution with a = 0.05 with 12 degrees of freedom for
both sample sets, the critical number is 2.69. The F value calculated for these data
indicated that the difference in the variances was too high and violated the
homogeneity of variance assumption. I used the non-parametric Wilcoxon test for
an additional analysis of the data.
Wilcoxon test
The Wilcoxon test is a non-parametric test that can evaluate the
distribution of the d' values from the two sample sets. This test is a rank-sum test.
The rank, or ordered position, of the data from both measurements is assigned in
increasing numerical order from the smallest sample value to the largest. The
Wilcoxon test determines if the distribution of the samples from the two sets is
significantly different.
I used the Wilcqxon test in SAS to analyze the subject sensitivity data, and
it produced the same result. There is no statistically significant difference between
the sensitivity of two sample sets, HMD and CD.
Relationship between Subject Interests and Performance
In the initial survey, the subjects provided information about their age, the
number of flying hours and their experience with RFMDS. They also told about
their interest in video games and flight simulators. For the thirteen subjects, I
computed a point biserial correlation between interest in video games and
sensitivity as well as interest in flight simulators and sensitivity.
Of the thirteen subjects, five indicated that they liked video games. The
point biserial correlation coefficient of interest in video games and sensitivity with
the HMD was -0.38, well below the critical value of 0.532 for 12 degrees of freedom
and a = 0.05 for a two-tailed test. The point biserial correlation coefficient of
83

interest in video games and sensitivity with the CD was ·0.279, again well below the
critical value listed above.
Seven of the thirteen subjects indicated that they liked flight simulators.
The point biserial correlation coefficient of interest in flight simulators and
sensitivity with the HMD was 0.0053, well below the critical value of 0.532. The
point biserial correlation coefficient of interest in flight simulators and sensitivity
with the CD was 0.061, again well below the critical value for significance.
A final correlation tested the relationship between age and sensitivity. The
Pearson produd moment correlation of age and sensitivity with the HMD was
r.(12d/) = 0.131, which indicated no significant relationship between age and
sensitivity with the HMD. The Pearson product moment correlation of age with
sensitivity with the CD was r.(l2df) = 0.360, and although higher, it also indicated
that there was n.ot a significant relationship between age and sensitivity with the
CD.
Confidence Levels
Another type of data that we had planned to collect was the level of
confidence of the subjects when they provided the yes/no answers. To gather this
data, the subjects were directed to not only indicate yes or no but to indicate
confidence by using one of six boxes, three for yes and three for no. The intent was
that the user would be able to use the mouse and indicate three levels of confidence
for yes answers and three levels of confidence for. no answers. Appendix A has a
diagram of the screen presented by RF-Il when requesting an answer. However,
mechanical problems with the mouse rendered the data worthless. It was difficult
for the subjects to accurately position the mouse pointer, and occasionally the
subjects had to make a significant effort to get the pointer into the desired yes or
no category, much less indicate confidence.
84

Scattergram of view changes and d'
Another issue of interest in the quantitative data was if a relationship
existed between the number of view changes and the measured sensitivity of the
subject. Two scattergrams, Figures 32 and 33, present graphs of the sensitivity
versus the number of viewpoint changes along with regression lines.
" -~ .> ·iji c • "'
4.5
4
3.5
3
2.5
2
1.5
Scattergram: HMO Sensitivity vs Viewpoint Changes
•
"scathmd.data" -o '"scathmdreg.data" ----·
•
•
•• 0.5 L_ ___ _.... ____ _,_ _ _:. __ ....:.._ ___ __. ____ ..J
0 50 100 150 200 250 Viewpoint Changes
Figure 32. Scattergram of HMD Sensitivity and Number of Viewpoint Changes
6.3.3 Analysis of HMD Viewpoint Changes and Sensitivity. The
Pearson product moment correlation of sensitivity and nu.mber of viewpoint
changes using the HMD was r(12dfJ = 0.152. This low correlation value indicated
that there was no relationship between sensitivity and number of viewpoint
changes. The coefficient of determination was r 2 (12df) = 0.023; indicating only
2.3% of the variance of the two variables can be explained by their relationship.
6.3.4 Analysis of CD Viewpoint Changes and Sensitivity. The Pearson
product moment correlation of sensitivity and number of viewpoint changes using
the CD was 1:( 12df) = 0.213. Again, this low correlation value indicated no
85

" -~ :~ 0 • <I)
2.4
2.2
2
1.8
1.6
1.4
1.2
0.8
•
Scattergram· CDS Sensitivity vs Viewpoint Changes
•
•
"'scatcds.data"' ~ ·scatcdlsreg.data• -----
-----------------------~---------------!-------------------------------------------------------
• • •
•
• 0.6~------~----~~------~------~------~------~
0 10 20 30 40 50 60 Viewpoint Changes
Figure 33. Scattergram of CD Sensitivity and Number of Viewpoint Changes
significant relationship between sensitivity and number of viewpoint changes. The
coefficient of determination was r 2 ( 12df) = 0.045; indicating only 4.5% of the
variance of the two variables can be explained by their relationship.
6.4 Qualitative Data
The pilots completed four subjective surveys during a session. The first
survey, already discussed, provided general information about the subject's
background and experience. Three surveys asked for a comparison of display
systems. Two of the surveys asked the subject to compare the RF-II displays to
RFMDS, and the last survey asked for a comparison of the two RF-II displays to
each other. Finally, at the end of the session, I asked each subject six open-ended
questions.
6.4.1 Surveys on Display Evaluations. The three surveys for display
comparisons were very similar; Appendix C contains copies of the survey
86

questions. In two surveys the subject compared the AFIT head-mounted display
system or console display system to the operational RFMDS displays. For the third
survey, the subject compared the two AFIT displays.
Below is a list of the seven questions that the subjects answered when
comparing the HMD option of RF-II to RFMDS. The questions for the console
display option of RF·II are the same and in the same order, with CD replacing
HMD.
1. The HMD system made RFMDS data easier to understand.
2. The HMD controls made it easier to manipulate the view of the
RFMDS data.
3. I found it eas~er to understand the spatial relationships between
aircraft using the HMD system compared to RFMDS.
4. My awareness of the overall engagement was better with the HMD
than with RFMDS.
5. My awareness of my mission element's situation (four ship or two
ship, as appropriate) in the engagement was better with the HMD than
with RFMDS.
6. My awareness of my aircraft's situation in the engagement was
better with HMD than with RFMDS.
7. Overall, I would prefer the HMD system to the current RFMDS
system for individual review of air-to-air engagements.
Si

I Subject I Q1 Q2 Q3 Q4 Q5 Q6 Q7
1 3 3 5 5 3 3 5 2 3 2 3 5 5 5 6 3 3 2 4 2 3 3 2 4 5 5 5 5 4 5 6 5 2 2 2 2 3 4 2 7 7 7 7 7 7 6 7 8 5 6 5 5 5 5 5 9 7 6 7 7 7 7 7 10 3 3 3 5 2 1 5 11 3 2 3 4 5 2 2 12 6 6 6 6 6 6 6 13 6 3 6 6 6 6 6 14 6 7 7 6 6 5 7 15 2 3 1 3 3 3 2
mean 4.36 4.07 4.57 4.79 4.64 4.36 4.86 std 1.82 1.98 1.53 1.53 1.65 1.74 1.99
Table 13. Encoded Answers Comparing HMD to RFMDS
Each question was answered on a scale from Strongly Agree to Strongly
Disagree and additionally Unsure, as shown below. This is a Lickert scale
procedure as described in (Marshak 92a).
l-------l-------l-------1-------l-------l-------l
Strongly Agree Mildly No Mildly Disagree Strongly Unsure
Agree Agree Opinion Disagree Disagree
To analyze the answers, I mapped the responses to the numbers 1 through
8; with Strongly Agree mapping to 1, Strongly Disagree mapping to 7, and Unsure
mapping to 8. Table 13 shows the encoded answers for 14 subjects when
comparing the HMD of RF-II to RFMDS. Table 14 has the encoded answers for 14
subjects when comparing the CD of RF-II to RFMDS.
The subjects compared the display options of RF-II to a standard they
knew, RFMDS displays. Using the encoded answers, I computed a
question-by-question difference between a subject's comparison of the HMD to
88

I Subject I Q1 I Q2 I Q3 I Q4 \ Q5 I Q6 ) Q7 I 1 3 2 2 3 3 3 2 2 2 3 2 6 6 4 2 3 2 1 3 3 5 3 3 4 5 5 5 5 5 5 5 5 3 1 2 3 3 3 2 7 6 6 6 6 6 6 6 8 3 3 3 5 3 3 3 9 2 4 6 5 6 6 4
10 3 5 4 3 5 2 5 11 1 1 1 1 1 1 1 12 6 6 6 6 6 6 6 13 2 2 2 2 2 2 2 14 6 5 2 5 5 5 6 15 1 1 1 3 2 2 1
mean 3.21 3.21 3.21 4.00 4.14 3.64 3.43 std 1.80 1.92 1.85 1.62 1.75 1.69 1.87
. Table 14. Encoded Answers Comparing CD to RFMDS
,, RFMDS (HtoR) and the same subject's comparison of the CD to RFMDS (CtoR).
A difference of 0 indicated that a subject evaluated HMD and CD to be equivalent.
A non-zero difference indicated that a subject preferred HMD over CD or
vice-versa. Since I computed HtoR- CtoR, a positive difference indicated a
preference of CD over HMD (the encoding scheme assigned higher numbers when
RFMDS was preferred).
Using the encoded answers to these questions, I could address the following
issue. Was there a significant difference in the subjects' evaluations of the HMD
and the CD? Table 15 shows the differences of HtoR- CtoR. I analyzed these
differences with a dependent t-test and Table 15 also presents these results.
For questions !,2,3,6 and 7 the t-statistic was statistically significant and
established the subjects' strong preference of the console display over the
head-mounted display.
89

Subject Q1 Q2 Q3 Q4 Q5 Q6 Q7
1 0 1 3 2 0 0 3 2 1 -1 1 -1 -1 1 4 3 1 1 1 -1 -2 0 -1 4 0 0 0 0 -1 0 1 5 -1 1 0 -1 0 1 0 7 1 1 1 1 1 0 1 8 2 3 2 0 2 2 2 9 5 2 1 1 1 1 3 10 0 -2 -1 2 -3 -1 0 11 2 1 2 3 4 1 1 12 0 0 0 0 0 0 0 13 4 1 4 4 4 4 4 14 0 2 5 1 1 0 1 15 1 2 0 0 1 1 1
mean 1.14 0.86 1.36 .79 .5 .71 1.43 std 1.66 1.29 1.69 1.53 1.99 1.20 1.55
t-statistic 2.58* 2.48* 3.00* 1.93 .94 2.22* 3.44*
Table 15. (HtoR- CtR) Values for the Seven Questions and t-test Results
6.4.2 Open-Ended Questions. At the end of the session, I asked the
subjects six open-ended questions in an attempt to gather some general
information about the experience. The following list contains the six questions I
asked along with a brief summary of the answers. Appendix E has a complete list
of the questions and answers.
1. When you replay a mission on RFMDS, what are you looking for? Situation
Awareness/Mutual Support.
Overhead view. Relationship of ownship to bandits. Big picture of what all
participants are doing.
2. Did CRT display provide usable subset of RFMDS capabilities?
Yes.
3. Was there anything you liked about wearing the HMD? immersion,
headtracked view.
90

No. Not really. Not over console display.
4. What problems/complaints do you have about the HMD? weight, lag, FOV.
Limited vision. Field of view. Only one view - not two as with console
display. Comfort.
5. Familiarity with CRT displays/new HMD- would experience/additional
training help with HMD?
Probably. Maybe.
6. If you w<;re getting paid $100 for every right answer - which system would
you use and why?
Console display.
6.5 Summary of Experimental Findings
1. The quantitative data has a trend that indicates subjects performed better
using the HMD; however, the difference was not statistically significant.
2. The data indicates no correlation between number of viewpoint changes and
performance.
3. The qualitative data was clear; the subjects strongly preferred the console
display over the HMD.
91

VII. Conclusions, Lessons Learned, and Recommendations for
Future Work
7.1 Introduction
At the start of this project, I expected that a person using a head-mounted
display would be able to better understand air-to-air combat training dataand
would outperform a person using a console-display. While this performance
difference did occur, the advantage was not enough to achieve statistical
significance. This chapter discusses the implications of this outcome to this study
and future studies on systems that use head-mounted displays (HMD).
7.2 Conclusions and Observations
This section revisits the two main results of the human-performance
experiment. The first finding was the lack of a statistically significant difference
between the sensitivities of a subject when using the HMD and the console display
(CD). The second finding was the statistically significant difference in the subjects'
preference of the CD over the HMD.
7.2.1 Quantitative Measure of Display Performance. The
human-performance experiment used probe questions to measure the subjects'
understanding of the replay of Red Flag air-to-air combat data. Using the theory
of signal detection, we computed a sensitivity for each observer for both displays.
There was no statistical significance between the subjects' computed sensitivity
when using the two display options- HMD or CD.
There are four possible explanations for the lack of a significant difference in
subject performance when using the two display types.

1. The most straightforward explanation is that there is no difference in subject
performance. If this is the case, then RF-II's HMD-based presentation of the
air combat training data does not provide any added benefit over RF-II's
CD-based presentation.
When considering this explanation, it is important to remember the
non-significant trend in favor of the performance of subjects using the HMD,
in spite of subjective preference of the CD.
2. Another explanation is that the difference exists, but the experiment was not
able to measure the effect. Two factors might have caused this. First, poor
statistical power due to a limited number of subjects could have hidden the
effect. The pool of qualified subjects in this area is small and access is
difficult. Second, the differences in performance might have been masked by
the poor quality of the virtual environment equipment or a confound due to
user interface familiarity.
The virtual environment equipment used in this experiment is barely
adequate. HMD-III is heavy and it is not a stereoscopic display. HMDs are
now commercially available that are better, but they were just becoming
available at the time of the experiment. Trackers have problems with range
and lag. Computer image-generation using commercial off-the-shelf
workstations is a solved problem for scenes of modest complexity, although
the state-of-the-art workstations are expensive.
3. The subjects were all experts. The results might have been different if the
subjects had been novices. The benefits of an HMD might be more significant
for novices than for experts. Using level of expertise as an independent
variable in future experiments would be interesting.
4. A final explanation is that the use of probe questions and the computed
sensitivity of the subject does not adequately measure a subject's SA. I
believe this unique approach of measuring SA to be sound, but this
93

combination of probe questions and a computed sensitivity using standard
TSD principles is new. I recommend additional tests using this approach and
additional efforts to validate this technique.
In my opinion, the best explanation is a combination of two factors, the
quality of the virtual environment equipment and its user-interface and the level of
expertise of the subjects.
I offer three conclusions based on the quantitative data.
1. Adding an HMD to an interactive 3-D graphics program does not
automatically provide benefits or improvements, even when the
user task requires a high degree of spatial comprehension.
We do not know when or if HMDs should be used in real-world applications.
Identifying characteristics of applications that can benefit from the use of an
HMD will not be an easy task, and additional human-performance
experiments will be essential. I think it is worth repeating that there was a
non-significant trend favoring subject performance with the HMD. However,
the subjects, already experts at using a CRT-based system, strongly preferred
the CD presentation.
2. Expert subjects already have techniques and methods for
performing a task. Changing the way an expert works requires a
compelling advantage.
Experienced pilots, who were also experts at debriefing missions using
RFMDS, served as subjects for this human-performance experiment. They
were not particularly motivated to change significantly how they did their
jobs. These pilots had already developed expert-level skills using existing
techniques. Answers to the questions in the subjective surveys indicated that
the pilots were not impressed or overwhelmed with an HMD-based system.
Three reasons for this are clear. First, HMD-III was awkward to wear and
had a limited field-of-view, 40°. Second, all the subjects were well trained on
94

a CRT-based system and received limited training using RF-Ils HMD
interface. Third, a virtual environment using HMD-III was not exciting to an
expert - especially an expert who pilots high-performance aircraft as a job!
3. Quantitative measurement of subject performance is difficult.
I offer the following anecdotes to describe the range of subject involvement
and interest.
An F-15 pilot was using the HMD and when one of the questions was posed
to him, he said "! wasn't looking at that part of the engagement." This
subject was quite serious about using the system and examining the
engagement. He might have missed the question, but that question probably
did not assess what the subject was understanding.
A second example is quite different. An F-16 pilot came to his session with a
sandwich in one hand and explained he had been up almost all of the night
before and that he was pretty tired. When he wore the HMD, he crossed his
legs, sat with his chin on his hand and said "OK, what do I do now?".
A wide range of subject interest and motivation was apparent in even this
small sample of 15 people. However, the relationship between interest and
performance was not clear. The F-15 pilot mentioned above, subject 2, did
better with the CD than with the HMD. The F-16 pilot mentioned above,
subject 7, also did better with the CD. Both of subject 7's sensitivity values
were lower than subject 2's sensitivity values. However, although subject 2
was one of the more supportive and interested of the subjects, his sensitivity
values were below average.
7.2.2 Survey Data. The subjects' answers to the questionnaires made it
clear that they preferred the CD over the HMD. Of particular interest is the fact
that the subjects strongly preferred the CD, even though there was a trend for
them to perform better when using the HMD. This disparity between measured
performance and preference is both important and quite interesting. Frequently,
95

user interface designs are based on subject preference, and often they are based on
the preference of expert users. At a minimum, the data from this experiment
indicates that there may be times when subject preference does not match subject
performance.
A confounding factor here is certainly the experience of the subjects with
RFMDS, the existing debriefing system. (I did not realize the level of expertise of
these subjects with RFMDS until the experiment was underway.) However, I
contend that this only heightens the significance of the disparity. Subjects with a
minimal amount of training with the HMD-based presentation performed better
than with a CD-based presentation very similar to the one they frequently use.
7.3 Contributions to Knowledge
The contributions of this research can be organized into three areas:
• The design and development of two successive prototype HMD-based
software systems for· debriefing actual air-to-air combat training data.
Using an HMD for debriefing actual air-to-air combat training data is a
previously untested application, and RF-I and RF-H are prototype
applications of HMDs. The virtual reality field needs experience with
HMD-based systems, particularly in actual work situations.
• The design and construction of three successive prototype HMDs; two using
LCDs and the third using miniature CRTs.
A satisfactory HMD is still an elusive goal. While weight and packaging
remain problems with HMDs, my main concern is resolution. Current LCDs
are not adequate for debriefing air combat training data. Miniature CRT
technology, particularly field-sequential CRTs, hold significant promise.
• A human-performance experiment comparing the effectiveness of two
different display techniques for a particular application, which used a unique
adaptation of the theory of signal detection to test display effectiveness.
96

Conducting human-performance experiments is important in establishing
the directions for virtual environment research. I am convinced that the field of
virtual environments needs this type of experimentation to investigate the value of
virtual environment systems.
7.4 Lessons Learned
As a final review of this human-performance experiment the fundamental
question is - Was the experiment a fair comparison? In the following sections, I
present a critical review of the design and implementation of the experiment and
give suggestions for future experiments. All of these suggestions focus on
techniques to ensure a fair test between the HMD-based presentation and the
CD-based presentation. This discussion concentrates on the user interface of RF-II
and the design of the experiment.
1.4.1 User Interface. The combination of user interface and display
determine the effectiveness of a visual presentation. An HMD is merely a type of
display. The potential benefits of an HMD-based system are immersion, a natural
and easy-to-use interface, and a 3-D presentation of the data.
1.4.1.1 Immersion. Immersion is a difficult attribute to quantify.
When using HMD-III, the subject can look in any direction and see the
presentation of air combat training data, but the limited field-of-view of HMD-III
certainly detracts from the sense of immersion.
Improved HMD equipment with a wider FOV and reduced weight will
provide a stronger sense of immersion. Two HMDs became available just as this
human-performance experiment was underway in June 1993. Kaiser ElectroOptics
sold their first color SIM EYE™ during May 1993 after approximately two months
of marketing. This system has a 40° field-of-view with a field-sequential, full-color,
1000-line display. An updated system with a 60° FOV became available in the Fall
of 1993 (Hepburn 94). At about the same time, Fake Space Labs was completing
97
the full-color Binocular Omni-Orientation Monitor (BOOM) using field-sequential
miniature CRTs. In March 1993 their first engineering system was shown at a
conference, and in May and June of 1993 they shipped two full-color BOOMs as
products (McDowall 94). Since both of these systems use field-sequential miniature
CRTs, I would have needed a Silicon Graphics Onyx with a Reality Engine and the
necessary microcode to produce the required field-sequential video signal.
An additional factor that effects the sense of immersion in an HMD-based
system is lag. RF- II did not use any techniques to reduce the effect of lag. Work is
underway, both. at UNC and AFIT, in the use of prediction techniques to reduce
the effect of lag in VE systems.
1.4.1.2 Natural and easy-to-use interface. With RF-II using the
HMD, the user is in the airspace over the instrumented range and head rotation
determines view direction. RF-II does not use head position data. The user makes
instantaneous viewpoint location changes with mouse button presses.
What does this user interface not include and what are some alternatives?
First, by not tracking head position, there is not support for head-motion parallax.
This is one of several 3-D cues which is sacrificed by this user interface.
Second, RF-II's user interface makes the observer seem as though he is a
giant at the instrumented range. Small airplane icons are moving around and the
observer can see at least 100 miles. Chung's work suggests an alternative approach
to view control. He describes an orbital mode where the user selects different views
based on head orientation. His application was targeting radiation therapy
treatment beams, but this idea might also work well in this application
(Chung 94). Although not based on what a giant would see when looking down on
the range, this technique would allow easy selection of different views of the air
combat training data. Whether or not this would be preferable to mouse button
presses is an open question; Chung's subjects liked the orbital mode.
98

7.4.1.3 3-D. A display can use many cues to present a 3-D
display including stereoscopic views, perspective projection, hidden surface
elimination, and kinetic depth effect. RF-II uses only perspective projection and
hidden surface elimination. Stereoscopic views are not possible with the biocular
HMD-III. Kinetic depth effect should have been included. This would have
involved either modifying the viewpoint as a result of changes in head position or
permitting the user to rotate the world being viewed.
1.4.2 Experimental Design. I gained a great deal of appreciation of the
difficulty in measuring human performance. This difficult task is quite involved and
the experimenter must be careful from the start when determining independent
and dependent variables all the way to the end when drawing conclusions based on
the data collected.
I am satisfied with the choice of display type as the independent variable
and sensitivity as the dependent variable. I think examining situational awareness
with probe questions is a good technique. One of the contributions of this work is a
new way of measuring situational awareness. Additional effort might be well spent
in looking for ways to validate sensitivity calculated in this way. This could take
the form of an experiment where multiple types of probe questions examine a
subject's understanding. Some of these probe questions would be answered yes or
no while others would be more complicated and ask for the recall of information
such as with SAGAT and Marshak's map display experiments (Endsley 88),
(Marshak 87).
Before I started the experiment, I knew that the pilots of the 422nd Test
and Evaluation Squadron were familiar with RFMDS. However, I did not know
that many of them use RFMDS two weeks out of every month! Their level of
expertise raises some issues.
Did I have the subjects train long enough with the HMD before measuring
their performance? A 10 minute training session is certainly short. I asked each
99

subject to continue working with the HMD interface until comfortable, but that
was clearly a very subjective decision. One possibility would have been to have the
subjects train to some measurable level of performance before collecting data. This
could have been accomplished by having the subjects continue to answer probe
questions until the percentage correct fell above a certain level over a period of
time, say 75% correct for the questions presented during the last 3 minutes.
Does the level of expertise of the subjects have a direct bearing on
performance and acceptance of an HMD? Follow-on efforts should compare
performance with an HMD and a CD where expertise is not a confounding variable.
7.5 Final Summary
The attempt to judge the relative merits of the presentation of information
using an HMD and a CD was only partially successfuL Experienced users of a CD
system, who showed strong preference for a CD when asked, gained only a small
but not statistically significant advantage when using an HMD. Confounding
variables may have prevented achieving a significant difference. More research is
necessary to support the intuitive belief that HMDs can provide significant
advantages in real applications. I believe it would be worthwhile to conduct this
experiment again, with better equipment, to examine whether or not the quality of
the equipment was a confounding factor.
100
Appendix A. Human-Factors Experiment Instructions
These are the instructions that were presented to each subject at the start
of a session.
A.l Purpose
This human factors experiment is designed to compare the effectiveness of a
head-worn display device to a standard CRT. This is a theoretical investigation
and is not a preliminary step in any USAF program.
This project is NOT investigating the use of this technology in the cockpit.
A.2 Use of the data
The data collected are to be used to compare the effectiveness of head-worn
devices to standard CRTs in communicating information. None of this data will be
sent to Brooks AFB, or in any other way used in official USAF actions regarding
an individual's career or status.
A.3 Question/Answer
All the questions are to be answered yes or no. It is possible to specify a
level of confidence in your answer. You will be presented with six boxes, numbered
from 1 to 6. Boxes numbered 1-3 represent a no answer, while boxes numbered 4-6
represent a yes answer. The range of numbers allows you to indicate the confidence
m your answer.
101

Box number Indicates
1 Absolutely No
2 Probably No
3 Not sure, guess no
4 Not sure, guess yes
5 Probably Yes
6 Absolutely Yes
To answer a question, use the mouse, position the mouse pointer in the box
that represents your answer, and press the right mouse button.
The questions are spatially oriented and generally fall into the following
three categories:
• Where is your flight or element and what are they doing?
• Where is your flight or element in relation to the strike package(s)?
• Where are enemy A/C relative to your flight or element?
There are some questions that ask how your A/C is positioned relative to
other A/C, such as Is the threat on your tail high? or Is your second element high
relative to your element? Each of the terrain blocks is 2nm on a side, and some of
the questions ask if some other participant is 2nm from you or 10nm from you.
The questions are not intended to be tricky. For instance, we do not ask if someone
is 2nm from you when the answer is 2.5nm. We would ask if someone is lOnm
when they are actually 20nm and expect a no answer.
A.4 A/C color, Whiskers and Frowns
The aircraft shapes, the RFMDS number and the trails (indicating the A/C
position over the last 5 seconds) are color-coded. Blue indicates friendly force A/C,
but there is no color identification of mission. Red indicates enemy force A/C.
Occasionally, the RFMDS number and the trail will be turned white on some A/C.
102

This occurs when the telemetry data indicates that RFMDS identifies that A/C as
dead.
The A/C icons are are approximately 100 times the actual size. While the
shape is patterned after the real A/C, you cannot use the appearance of the A/C
to estimate distances.
This system uses a modified representation of RFMDS whiskers and frowns.
For IR missile lock (AIM-9), the system shows a coarse screen immediately in front
of the A/C. For Radar missile lock (AIM-7), the system shows a set of lines coming
from the nose and spreading out.
103
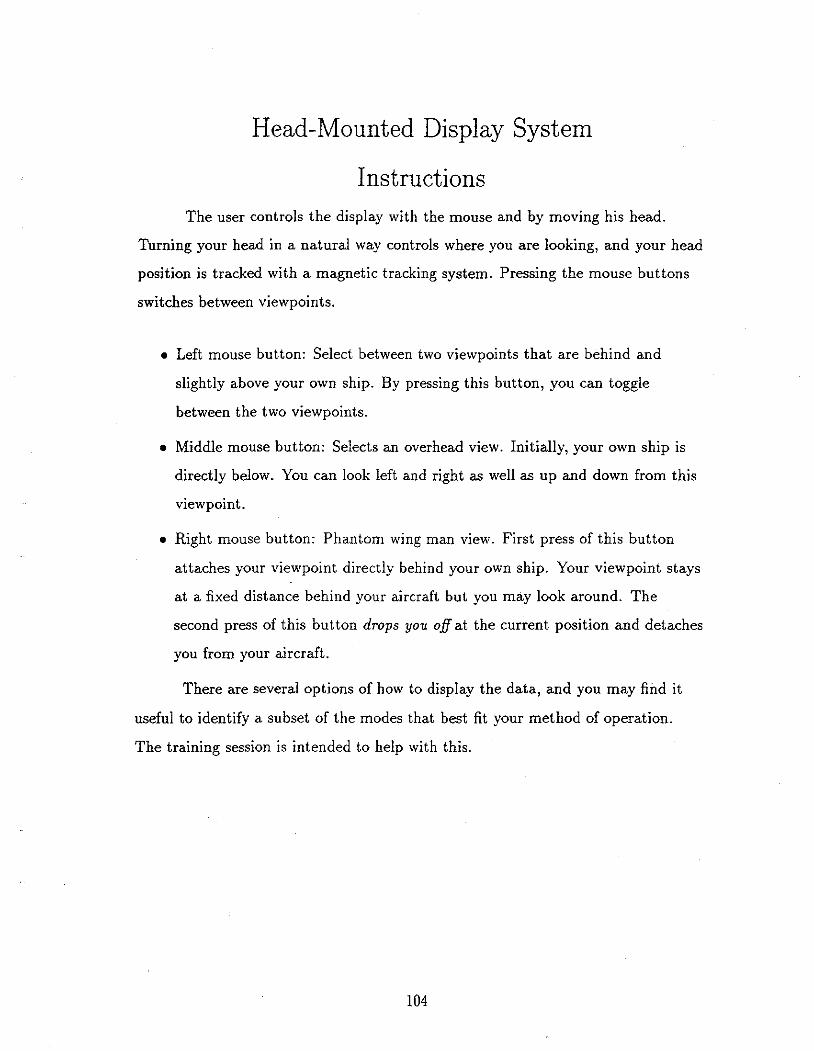
Head-Mounted Display System
Instructions The user controls the display with the mouse and by moving his head.
Turning your head in a natural way controls where you are looking, and your head
position is tracked with a magnetic tracking system. Pressing the mouse buttons
switches between viewpoints.
• Left mouse button: Select between two viewpoints that are behind and
slightly above your own ship. By pressing this button, you can toggle
between the two viewpoints.
• Middle mouse button: Selects an overhead view. Initially, your own ship is
directly below. You can look left and right as well as up and down from this
viewpoint.
• Right mouse button: Phantom wing man view. First press of this button
attaches your viewpoint directly behind your own ship. Your viewpoint stays
at a fixed distance behind your aircraft but you may look around. The
second press of this button drops you off at the current position and detaches
you from your aircraft.
There are several options of how to display the data, and you may find it
useful to identify a subset of the modes that best fit your method of operation.
The training session is intended to help with this.
104
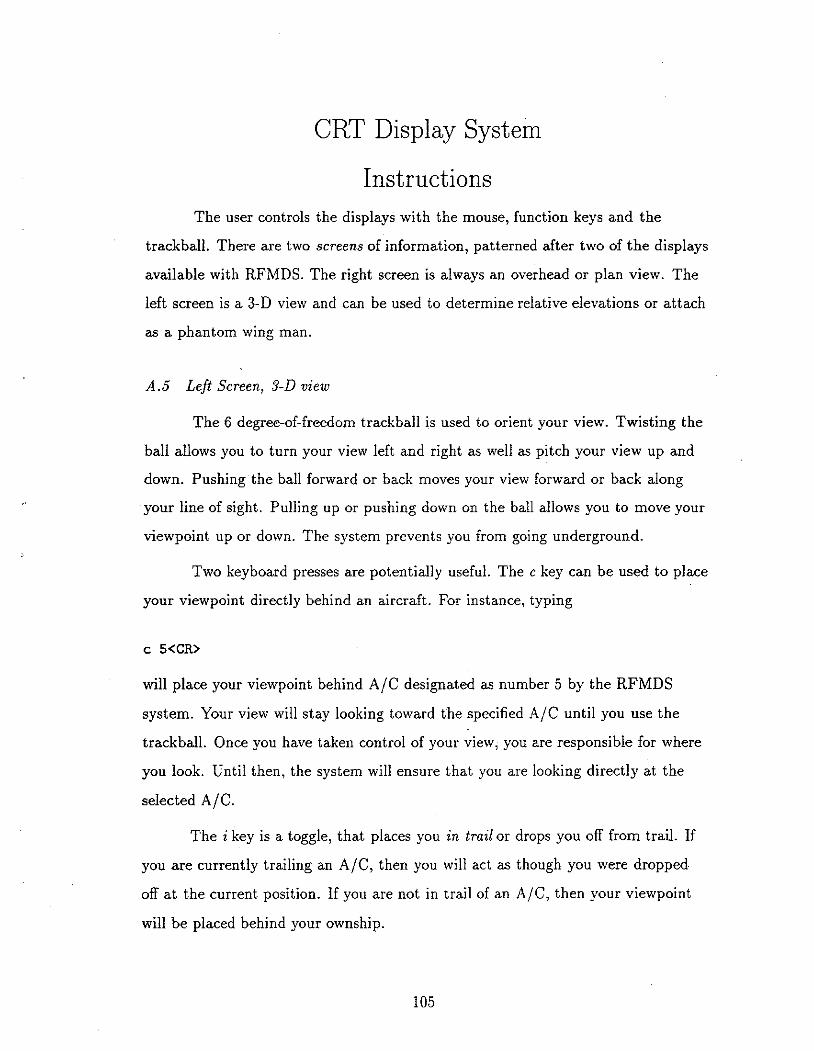
CRT Display Systein
Instructions The user controls the displays with the mouse, function keys and the
trackball. There are two screens of information, patterned after two of the displays
available with RFMDS. The right screen is always an overhead or plan view. The
left screen is a 3-D view and can be used to determine relative elevations or attach
as a phantom wing man.
A.5 Left Screen, 3-D view
The 6 degree-of-freedom trackball is used to orient your view. Twisting the
ball allows you to turn your view left and right as well as pitch your view up and
down. Pushing the ball forward or back moves your view forward or back along
your line of sight. Pulling up or pushing down on the ball allows you to move your
viewpoint up or down. The system prevents you from going underground.
Two keyboard presses are potentially useful. The c key can be used to place
your viewpoint directly behind an aircraft. For instance, typing
c 5<CR>
will place your viewpoint behind A/C designated as number 5 by the RFMDS
system. Your view will stay looking toward the specified A/C until you use the
trackball. Once you have taken control of your view, you are responsible for where
you look. Until then, the system will ensure that you are looking directly at the
selected AfC.
The i key is a toggle, that places you in trail or drops you off from trail. If
you are currently trailing an A/C, then you will act as though you were dropped
off at the current position. If you are not in trail of an A/C, then your viewpoint
will be placed behind your ownship.
105

A. 6 Right Screen, Plan view
This screen is always an overhead view with North to the top. The mouse
can be used to pan this display and three function keys, Fl, F2 and F3 can be used
to zoom in and out on the area.
To pan around the range, push the left mouse button and move the mouse
while keeping the left mouse button pressed. Use the three function keys to provide
different zoom factors. The initial view has the Fl setting, F2 brings you in closer
and F3 provides the closest view. The image zooms in around the center of the
screen. If you wish to see something closer, place it close to the center of t)le right
screen and then use F2 or F3.
There are several options of how to display the data, and you may find it
useful to identify a subset of the modes that best fit your method of operation.
The training session is intended to help with this.
106
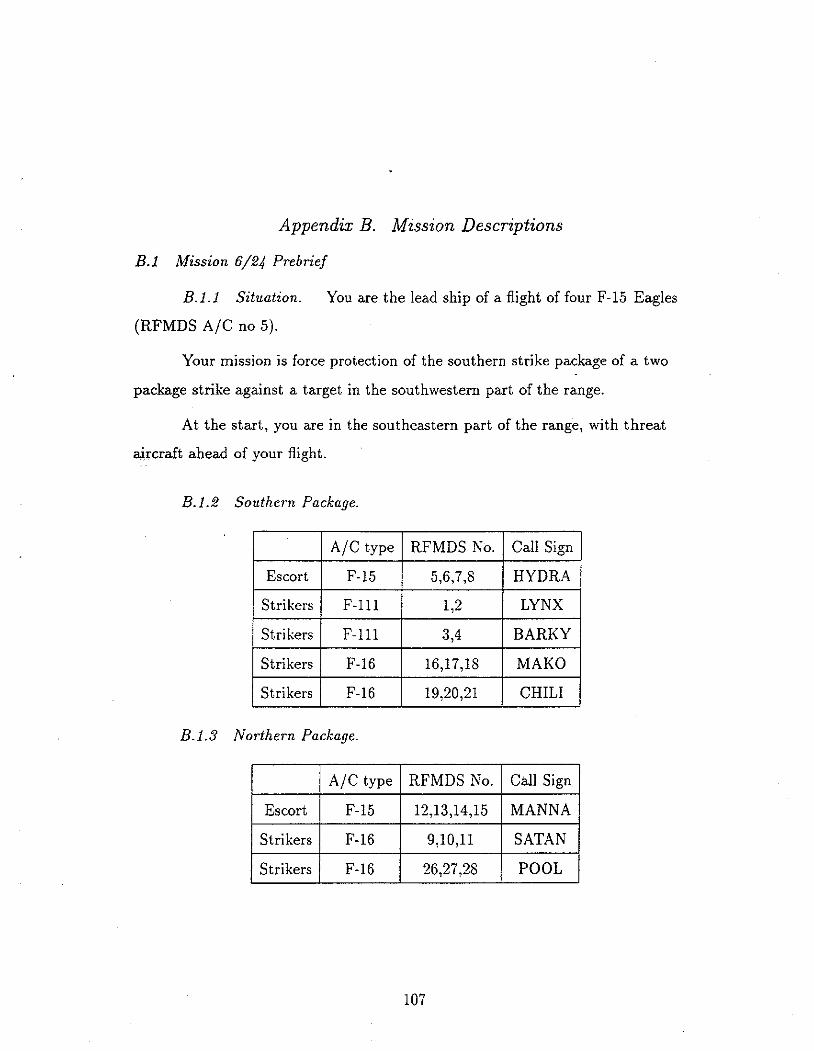
Appendix B. Mission Descriptions
B.l Mission 6/24 Prebrief
B.l.l Situation. You are the lead ship of a flight of four F-15 Eagles
(RFMDS A/C no 5).
Your mission is force protection of the southern strike package of a two
package strike against a target in the southwestern part of the range.
At the start, you are in the southeastern part of the range, with threat
aircraft ahead of your flight.
B.1.2 Southern Package.
A/C type RFMDS No. Call Sign
Escort F-15 5,6,7,8 HYDRA
Strikers F-111 1,2 LYNX
Strikers F-111 3,4 BARKY
Strikers F-16 16,17,18 MAKO
Strikers F-16 19,20,21 CHILI
B.1.3 Northern Package.
A/C type RFMDS No. Call Sign
Escort F-15 12,13,14,15 MANNA
Strikers F-16 9,10,11 SATAN
Strikers F-16 26,27,28 POOL
107

B.1.4 Red Air.
AfC type RFMDS No. Call Sign
Bandits F-16 29-32 LYRE
Bandits F-16 33-36 MIGG
108

B.2 Mission 7/22 Prebrief
B.2.1 Situation. You are the lead ship of a flight of four F-15 Eagles
(RFMDS A/C no 7).
Your mission is air superiority in support of a large strike package targeted
against a southwestern range complex. The strike package is in the North at the
start.
At the start you are in the southeastern part of the range, with threat
aircraft ahead of your flight.
B.2.2 Strike Package.
A/C type RFMDS No. Call Sign
Escort F-15 I
7,8,9,10 WEDGY
Escort F-15 17,18,19,20 HYDRA
Escort F-15 25,26,27,28 ARSON
Strikers F-Ill 2,3,4 LYNX
Strikers F-lll 5,6 BARKY
Strikers F-16 11,12,13 MAKO
Strikers F-16 14,15,16 CHILI
Strikers F-16 21,22,23,24 SATAN
B.2.3 Red Air.
A/C type RFMDS No. Call Sign
Bandits F-16 29-32 MANNA
Bandits F-16 33-36 MIGG
109

Appendix C. Survey Data
Each subject completed the SUBJECT SURVEY at the start of a session. It
asks for general information including amount of flying time, types of aircraft as
well as asking two questions about a subject's use of the Red Flag Measurement
and Debriefing System (RFMDS) in his current job.
During the experiment each subject used the AFIT Red Flag Data Replay
system two times, once with the console display and another time with the HMD.
Questionnaires asked for subjective evaluations of the AFIT system compared to
RFMDS, and the final questionnaire asked for a subjective comparison of the two
display options of the AFIT system.
The SUBJECT SURVEY and the three QUESTIONNAIRES follow on the
next few pages.
llO

SUBJECT SURVEY
Air Force Institute of Technology
Red Flag Replay System
Subject Number: --------
C.J Flying Experience
1. How much flying time do you have? -----------
2. How much flying time do you have in a fighter? -----------
3. Which airplanes have you flown? ----------------
4. What is your speciality? (air-to-air, air-to-ground, ... )?
C.2 Red Flag Measurement and Debriefing_ System Experience
1. You have been a participant in how many Red Flag/Green Flag training
exercises? -----------
2. How often do you use RFMDS in your current job?
C.3 General Information
l. What is your age? -----------
2. Do you enjoy video games? ----------------
3. Do you enjoy flight simulators? ----------------
4. Have you ever worn a virtual environment, head-mounted device?
111

QUESTIONNAIRE
Air Force Institute of Technology
Red Flag Replay System
DEBRIEF DATA REPRESENTATION STUDY
HEAD-MOUNTED DISPLAY(HMD) VERSION
SUBJECT #: _________ _
ORDER 1st 2nd
INSTRUCTIONS: Subjectively rate each of the characteristics of the
display based on its relative performance compared to the Red Flag
Measurement and Debriefing System (RFMDS) at Nellis AFB, NV. The
absolute value of your answer need not be perfect, but try
and make the judgments consistent across questions. Mark the
line which best describes your opinion. If you do not understand
the question or are unsure of the answer, feel free to choose
the "UNSURE" response. You may make comments on any response or at
the end of the survey.
1. The HMD system made RFMDS data easier to understand.
l-------l-------l-------l-------1-------l-------l Strongly Agree Mildly No Mildly Disagree Strongly Unsure
Agree Agree Opinion Disagree Disagree
Comments (if any):
112

2. The HMD controls made it easier to manipulate the v1ew of the
RFMDS data.
l-------l-------l-------l-------1-------l-------l
Strongly Agree Mildly No Mildly Disagree Strongly Unsure
Agree Agree Opinion Disagree Disagree
Comments (if any):
3. I found it easier to understand the spatial relationships between
aircraft using the HMD system compared to RFMDS.
l-------l-------l-------l-------l-------l-------1
Strongly Agree Mildly No Mildly Disagree Strongly Unsure
Agree Agree Opinion Disagree Disagree
Comments (if any):
4. My awareness of the overall engagement was better with the HMD
than with RFMDS.
l-------1-------l-------l-------l-------l-------l
Strongly Agree Mildly No Mildly Disagree Strongly Unsure
Agree Agree Opinion Disagree Disagree
113

Comments (if any):
5. My awareness of my mission element's situation (four ship or two
ship, as appropriate) in the engagement was better with the HMD than
with RFMDS.
l-------l-------l-------l-------1-------l-------l Strongly Agree
Agree
Mildly
Agree
Comments (if any):
No Mildly Disagree Strongly Unsure
Opinion Disagree Disagree
6. My awareness of my aircraft's situation in the engagement was
better with HMD than with RFMDS.
l-------l-------l-------l-------l-------1-------l Strongly Agree
Agree
Mildly
Agree
Comments (if any):
No Mildly Disagree Strongly Unsure
Opinion Disagree Disagree
114

7. Overall, I would prefer the HMD system to the current RFMDS
system for individual review of air-to-air engagements.
1-------l-------l-------l-------l-------l-------l
Strongly Agree
Agree
Mildly
Agree
Comments (if any):
No Mildly Disagree Strongly Unsure
Opinion Disagree Disagree
8. If you have any other comments about your experience as a
subject, feel free to write them here. Feel free to use the back
if you need more room.
Thank you for your cooperation in this study
115

QUESTIONNAIRE
Air Force Institute of Technology
Red Flag Replay System
DEBRIEF DATA REPRESENTATION STUDY
CONSOLE DISPLAY(CD) VERSION
SUBJECT #: _________ _
ORDER 1st 2nd
INSTRUCTIONS: Subjectively rate each of the characteristics of the
display based on its relative performance compared to the Red Flag
Measurement and Debriefing System (RFMDS) at Nellis AFB, NV. The
absolute value of your answer need not be perfect, but try and
make the judgments consistent across questions. Mark the line which
best describes your opinion. If you do not understand the question
or are unsure of the answer, feel free to choose the "UNSURE"
response. You may make comments on any response or at the end
of the survey.
1. The CD system made RFMDS data easier to understand.
1-------l-------l-------l-------l-------l----~--1
Strongly Agree Mildly No Mildly Disagree Strongly Unsure
Agree Agree Opinion Disagree Disagree
Comments (if any):
116

2. The CD controls made it easier to manipulate the vie~ of the
RFMDS data.
l-------l-------l-------l-------l-------l-------1
Strongly Agree
Agree
Mildly
Agree
Comments (if any):
No Mildly Disagree Strongly Unsure
Opinion Disagree Disagree
3. I found it easier to understand the spatial relationships bet~een
aircraft using the CD system compared to RFMDS.
l-------l-------l-------1-------1~------l-------l
Strongly Agree
Agree
Mildly
Agree
Comments (if any):
No Mildly Disagree Strongly Unsure
Opinion Disagree Disagree
4. My a~areness of the overall engagement ~as ~ith the CD than
~ith RFMDS.
l-------l-------1-------l-------l-------l-------l
Strongly Agree
Agree
Mildly
Agree
No Mildly Disagree Strongly Unsure
Opinion Disagree Disagree
117

Comments (if any):
5. My awareness of my mission element's situation (four ship or
two ship, as appropriate) in the engagement was better with the
CD than with RFMDS.
l-------1-------l-------l-------l-------l-------l
Strongly Agree Mildly No Mildly Disagree Strongly Unsure
Agree Agree Opinion Disagree Disagree
Comments (if any):
6. My awareness of my aircraft's situation in the engagement
was better with the CD than with RFMDS.
1-------l-------l-------l-------l-------l-------l Strongly Agree Mildly No Mildly Disagree Strongly Unsure
Agree Agree Opinion Disagree Disagree
Comments (if any):
118

7. Overall, I would prefer the CD system to the current RFMDS system
for individual review of air-to-air engagements.
1-------l-------l-------l-------l-------l-------l Strongly Agree
Agree
Mildly
Agree
Comments (if any):
No Mildly Disagree Strongly Unsure
Opinion Disagree Disagree
8. If you have any other comments about your exper1ence as a
subject, feel free to write them here. Feel free to use the back
if you need more room.
Thank you for your cooperation in this study
119
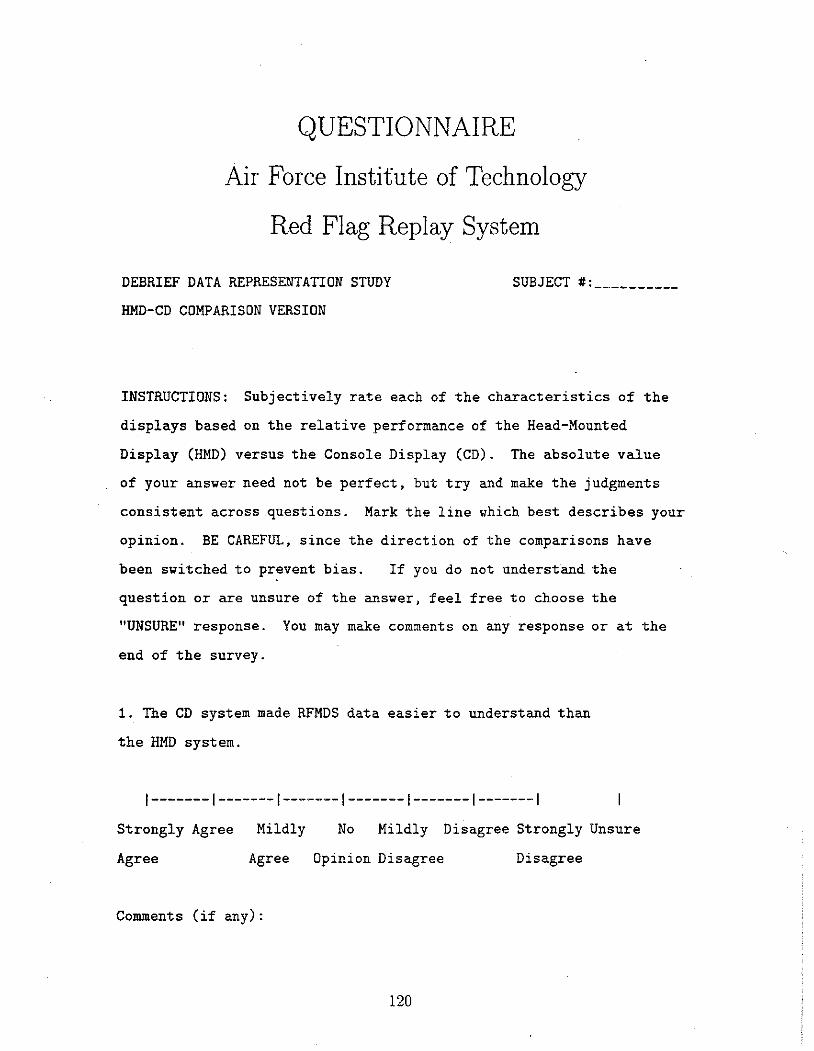
QUESTIONNAIRE
Air Force Institute of Technology
Red Flag Replay System
DEBRIEF DATA REPRESENTATION STUDY
HMD-CD COMPARISON VERSION
SUBJECT #: _________ _
INSTRUCTIONS: Subjectively rate each of the characteristics of the
displays based on the relative performance of the Head-Mounted
Display (HMD) versus the Console Display (CD). The absolute value
of your ansver need not be perfect, but try and make the judgments
consistent across questions. Mark the line vhich best describes your
opinion. BE CAREFUL, since the direction of the comparisons have
been svitched to prevent bias. If you do not understand the
question or are unsure of the ansver, feel free to choose the
"UNSURE" response. You may make comments on any response or at the
end of the survey.
1. The CD system made RFMDS data easier to understand than
the HMD system.
l-------l-------l-------l-------l-------l-------1
Strongly Agree
Agree
Mildly
Agree
Comments (if any):
No Mildly Disagree Strongly Unsure
Opinion Disagree Disagree
120

2. The HMD controls for view selection were easier to manipulate
than the CD controls.
l-------1-------l-------l-------l-------l-------l Strongly Agree Mildly No Mildly Disagree Strongly Unsure
Agree Agree Opinion Disagree Disagree
Comments (if any):
3. I found it easier to understand the spatial relationships between
aircraft using the CD system compared with the HMD system.
l-------l-------l-------l-------l-------1-------l Strongly Agree Mildly No Mildly Disagree Strongly Unsure
Agree Agree Opinion Disagree Disagree
Comments (if any):
4. My awareness of the overall engagement was better with the
CD than with the HMD.
l-------l-------l-------l-------l-------l-------1
Strongly Agree Mildly No Mildly Disagree Strongly Unsure
Agree Agree Opinion Disagree Disagree
121

Comments (if any):
5. My awareness of my mission element's situation (four ship or
two ship, as appropriate) in the engagement vas better with the
HMD than vi th the CD.
l-------l-------l-------l-------l-------1-------l Strongly Agree
Agree
Mildly
Agree
Comments (if any):
No Mildly Disagree Strongly Unsure
Opinion Disagree Disagree
6. My awareness of my aircraft's situation ~n the engagement was
better with the CD than with the HMD.
l-------l-------l-------l-------1-------l---~---1
Strongly Agree
Agree
Mildly
Agree
Comments (if any):
No Mildly Disagree Strongly Unsure
Opinion Disagree Disagree
122

7. Overall, I would prefer the HMD system to the CD system for
individual review of air-to-air engagements.
l-------l-------1-------l-------l-------l-------l
Strongly Agree Mildly No Mildly Disagree Strongly Unsure
Agree Agree Opinion Disagree Disagree
Comments (if any):
8. If you have any other comments about your experience as a
subject, feel free to write them here. Feel free to use the back
if you need more room.
Thank you for your cooperation in this study!
123

Appendix D. Questions For Two Missions
These are the questions associated with the two mission segments. The
format for each question is one line with the time the question is to be asked and
the correct answer. Following that is one or more lines for the text of the questions.
A blank line indicates the end of a question.
D.J Questions for June 24, 1992 Mission
17 32 45 n
You are on the left side of your formation.
17 32 50 y The nearest threat aircraft are loY, relative to your flight
17 32 55 n
The threat formation is a 4-ship box.
17 33 08 n
Your flight is betYeen the strike package and all the threat aircraft.
17 33 15 y The leading bandit aircraft is threatening the strikers.
17 33 25 y Your closest threat 1s south, 7 nm from your aircraft, loY.
17 33 32 y The strikers are all beloY their closest threat.
17 33 40 n
The closest threats to your flight are operating as a four-ship line abreast formation.
124

17 33 45 n Your flight has split into two independent two-ships.
17 33 55 n
The strikers are south of your flight about 10nm.
17 34 00 y The eagle on the left of your formation is farthest to the rear.
17 34 10 n You are the aircraft in your flight nearest the threat .
17 34 25 y Relative to your aircraft, your strike package is behind you and low.
17 34 30 y Elements of your strike package have performed a defensive reaction.
17 34 40 n Your flight is between all bandits and the strikers.
17 34 55 n
The nearest threat to your flight is right, low.
17 35 05 y Your wingman is at your left 9 o'clock, level, about 2nm.
17 35 14 y A single bandit is converting on the nearest element of your strike package .
17 35 25 n
Your flight is under attack by a bandit 2-ship.
17 35 31 y Your wingman is now below your altitude.
17 35 40 n The most threatening bandit is converting on your southernmost element from below.
17 35 45 n Your strike package is in a trail formation .
125
•

17 35 55 n
Your second element is to the north.
17 35 59 y One of your flight members is inverted .
17 36 10 y The southern element of your flight is under the greater threat .
17 36 17 n Your flight is climbing.
17 36 25 n Your threat sector is your right, rear quarter.
17 36 32 n Your two ship element is performing a right defensive in-place turn
17 36 42 n The threat is splitting your element from below.
17 36 55 y Your flight has now split into two, autonomous elements.
17 37 00 y The lead element of the northern strike package is 6 n.m at your left 9 o'clock.
17 37 OS y Your second element is about 10 nm behind you
17 37 12 y Your second element is being threatened from behind
17 37 20 n The greatest threat to your element is on your nose,
126
and above.
low.

D.2 Questions for July 22, 1992 Mission
17 34 55 y
Your formation is a four-ship, line abreast (wall).
17 35 07 n
You are on the right side of your formation.
17 35 15 n The most immediate threat to your flight is 2 nm at your left, 9 o'clock, low.
17 35 22 y Your second element is split high.
17 35 30 n
The strikers are 10 nm in trail of your flight.
17 35 38 y Your second element is reacting to a threat from the north.
17 35 45 y Your flight has split into two independent two ships.
17 35 52 n
Your wingman is at your right 3 o'clock at 2 nm.
17 36 00 y Your second element is high to the north.
17 36 15 y Your primary threat sector is to the north.
17 36 22 y Your second element is headed away from your flight.
17 36 30 n The nearest threat to the right of your element is low.
17 36 45 n A bandit 2-ship is attacking your element from the rear.
17 36 55 n
127

You are the aircraft in your element closest to' the threat.
17 37 05 y Your element is in a right, in-place turn.
17 37 12 y The closest bandit is overhead.
17 37 20 n Your wingman is low on your nose.
17 37 28 y The strike package is on your left side.
17 37 35 y Your element is now in a trail formation.
17 37 50 n
Your element is headed south.
17 37 57 y The nearest threat aircraft is high, headed in the opposite direction.
17 38 10 y Your wingman is splitting to the north
17 38 20 y The bandits ahead of you are low.
17 38 27 y You and your w1ngman are headed in opposite directions.
17 38 35 n
The strike package is on your nose, 10nm, low.
17 38 44 n
Your wingman is high at your left 7 o'clock.
17 38 50 n You are between all the threats and the strike package.
17 39 05 y You are closing the range with your wingman.
128

17 39 20 n
The nearest friendly aircraft are to your right and low.
129

Appendix E. Open-Ended Questions
At the end of the experimental session, I asked the subjects six open-ended
questions hoping to get additional insights into their evaluation of the displays.
The answers of the subjects were recorded as notes and are transcribed below.
However, there are a few answers that are particularly interesting.
Measuring situation awareness is difficult and there is no single definition
that everyone uses. The probe questions we used to measure SA concentrated on
spatial relationships and general information about the engagement. These
characteristics match well with the subjects' answers to question 1. Subjects 1, 4
and 14 specifically mentioned spatial relationships or big picture and several other
subjects described closely related ideas. This correspondence between probe
question content and subject evaluations was encouraging.
Almost every subject indicated that the CD option of RF-II was a good,
usable subset of RFMDS display options. Also, almost every subject disliked the
HMD option. These universally held preferences might well be a result of
experience, but for whatever reason, these feelings were widely held.
Here is the complete list of subject answers to the six questions.
1. When you replay a mission on RFMDS, what are you looking for?
Situation Awareness/Mutual Support.
Subj. 1. Overhead view, side (vertical) view, and cockpit view. Pairing data
important with alphanumeric information.
Subj. 2. Spatial relationships of threats and RFMDS flight data. Execution
ranges for tactics use pairings. Was formation set? When looking at
threat/did you see and understand the situation when airborne (from GCI,
130

others)? RFMDS helps build a tactical picture and look at tactics. It helps
build your SA and review who builds it GCI, other flight members. Helps
evaluate execution decisions - you, element, strikers, threat reactions (you to
him).
Subj. 3. How well did we do things? Did A/ A portion work, did A/G
portion work?
Subj. 4. Big picture. Allows review of communication in headset. I can zoom
in on engagement, then when over, zoom out again. I occasionally use side
view; easy to zoom in on any A/G attack .
Subj. 5. RF sortie- as blue side approaches did they know who was ahead of
them? Are you in formation to protect strikers? Helpful to look at shots and
see what defensive maneuvers were taken. Why didn't someone shoot, take
defensive action. As a 4-ship splits, review the reasons. Did you have SA?
Helpful to have visual look as you get into merge. If wingman shot, did we
know bandit was there? We can examrne flow plans and aircraft position.
Was game plan effective? Did bandits slip past and get into strike package?
Subj. 6. Missing
Subj. 7. Pause with RFMDS a real plus. Putting on HMD after
flying-unlikely. RFMDS very good. Moving around with HMD very
disorienting. Wingman to you - don't harp on it. Concentrate more on where
are bad guys? Where are bad guys in relation to strikers?
Subj. 8. Initial picture of formation and tactics with vertical view. With
some certainty, who is targeting who, TD boxes important. Time is
important. When were shots taken? Did shots time out? Need enough
fidelity to measure/determine maneuvering.
Subj. 9. SA
Subj. 10. Overall flow of plan; was it on time? Review of Red Air game plan
- when did they commit. Where was my flight with respect to package?
131

What engagements relative to my flight? RFMDS helps with
Intra-flight /Inter-flight information.
Subj. 11. Depends on what I'm debriefing- overall package- overhead, large
view - stop at points in time and use zoom and pair options. Occasionally I
use side view, usually during real time replay. Individual element- cockpit
views and smaller scale. Liked trackball of RF-II and the trail view.
Subj. 12. Didn't ask questions- he was late.
Subj. 13. Was tactic executed? Was it effective? Were there holes that
allowed threat A/C to gain advantage? Did anyone die? Why? (poor
judgement or excellent work by threat.) Mutual support? How was that
evidenced?
Subj. 14. Big picture- not just what you are doing.
Subj. 15. Always know our formation - already know that. Who killed me?
Audio valuable. Do not like no-drop RFMDS.
2. Did CRT display provide usable subset of RFMDS capabilities?
Subj. 1. Pretty good - cockpit view, back view marginally useful.
Subj. 2. Yes. need quick vertical scan.
Subj. 3. Missed pause option of RFMDS.
Subj. 4. Can see everything here that you can on RFMDS. Need
pairing/exact ranges.
Subj. 5. With big package seldom concentrate on single A/C.
Subj. 6. Missing
Subj. 7. Yes.
Subj. 8. Yes.
Subj. 9. Yes.
132
Subj. 10. Yes, within limits, wireframe display does help with pairing.
Terrain too coarse.
Subj. 11. Yes.
Subj. 12. Didn't ask questions- he was late.
Subj. 13. Yes.
Subj. 14. Yes. The spatial orientation is fleeting, better to toggle side to top.
Subj. 15. Yes.
3. Was there anything you liked about wearing the HMD? Immersion,
headtracked view.
Subj. l. Not really. (I don't think so)
Subj. 2. Not over console display.
Subj. ~· Losing vision a real problem; lag a real problem.
Subj. 4. Not really, 90% of time draw on chalk board and use overhead view
of RFMDS. 2-D and 3-D "big" part of SA.
Subj. 5. Know where you should have been looking when using head tracked
motion.
Subj. 6. Missing
Subj. 7. No. The user interface was ok.
Subj. 8. No.
Subj. 9. No.
Subj. 10. Much easier to manipulate views, liked head tracking.
Subj. 11. Not really. Needs freeze, time changes 5x, lOx, search backward 5x,
lOx. Want to see below display and do an element debrief.
Subj. 12. Didn't ask questions - he was late.
Subj. 13. Just what I saw in jet.
133

Subj. 14. For just one person's view- good. Good for cockpit view.
Subj. 15. Both azimuth and elevation (head tracking) a plus.
4. What problems/complaints do you have about the HMD? weight,
lag, FOV?
Subj. 1. Weight, lag, FOV.
Subj. 2. FOV; adjustments difficult; not comfortable.
Subj. 3. Losing vision a real problem, lag a real problem.
Subj. 4. Off boresight/positioning, couldn't quite match up, turn around and
view. World view /don't track head, just bring up overhead view.
Subj. 5. Lost some view. Head movement uncomfortable (awkward).
Subj. 6. Missing
Subj. 7. Time to start up/get in.
Subj. 8. One view at a time.
Subj. 9. Weight, lag, FOV.
Subj. 10. Limited FOV, only one screen at a time. Missed plan view.
Subj. 11. Weight, bulkiness, FOV.
Subj. 12. Didn't ask questions- he was late.
Subj. 13. Too focused, just see what "eyepieces" show. Can't interact.
Subj. 14. Comfort; bulky. Too slow to slew; lag.
Subj. 15. FOV; no peripheral vision! Incorporate bubble/dome type of
display. Cumbersome; exit pupil a problem.
5. Familiarity with CRT displays/new HMD- would
experience/additional training help with HMD?
Subj. 1. Utility is at question. This is expensive. It is hard to adjust the
HMD, not beneficial. Not much depth perception.
134

Subj. 2. Some bias possible.
Subj. 3. No good comparison.
Subj. 4. Bias, yes, some, but fly with NVGs feels the same. FOV a big
problem.
Subj. 5. Yes, probably.
Subj. 6. Missing
Subj. 7. Didn't ask questions.
Subj. 8 .. Maybe.
Subj. 9. No.
Subj. 10. Probably large bias; really like 3 screens of RFMDS - use centroid
view with 45 degree tilt.
Subj. 11. Maybe, individual ACMI at Luke, Tyndall.
Subj. 12. Didn't ask questions - he was late.
Subj. 13. No answer.
Subj. 14. No. Multiple, comparable images better.
Subj. 15. Maybe, some- not a big problem.
6. If you were getting paid $100 for every right answer - which system
would you use and why?
Subj. 1. Right now, CRT. HMDs in cockpit, not for debrief.
Subj. 2. Prefer CD.
Subj. 3. Vision a problem.
Subj. 4. CD! "Tailpipe" view very seldom. FOV a major problem.
Subj. 5. CD. Would like to play with HMD system.
Subj. 6. Missing
Subj. 7. HMD
135

Subj. 8. CD
Subj. 9. CD
Subj. 10 CD, because of overall awareness- HMD for individual. A/G
Subj. 11. CD
Subj. 12. Didn't ask questions - he was late.
Subj. 13. CD
J3ubj. 14. CD
Subj. 15. CD, as it exists now. HMD with much better technology.
136

Ashcraft 94.
Ault 89.
Buchroeder 89.
Brunderman 91.
MM 89.
Chung 94.
Bibliography
Ashcraft, M. (1994) Human Memory and Cognition Harper Collins New York, NY.
Ault, Frank W. (Spring 1989). The Ault Report Revisited, The Hook, pp 36-39.
Buchroeder, R. (1989, March 17). Helmet-Mounted Displays. Tutorial presented at the SPIE 1989 Symposia on Aerospace Sensing, Orlando, FA.
Brunderman, John (1991). Design and Application of an Object-Oriented Graphical Database Management System for Synthetic Environments. Air Force Institute of Technology MS Thesis, AFIT /GA/ENG/91D-Ol.
Compu-Scene IV Image Generator Product Specification ( 1989). Simulation and Control Systems Department, Martin-Marietta Corporation, Daytona Beach, FL.
Chung, James (1994). Intuitive Navigation in the Targeting of Radiation Therapy Treatment Beams. University of North Carolina at Chapel Hill PhD Dissertation.
CRC 1981. CRC (1981). CRC Standard Mathematical Tables, 26th Edition CRC Press.
Message Catalog 1992. Cubic Defense Systems (1992, March 31). Appendix A Message Catalog of the Computer Program Performance Specification for the Control and Computation Subsystem (CCS). (Report Number SP1507-198C.)
D'Amato 70. D'Amato, M.R. (1970). Experimental Psychology, Methodology, Psychophysics, and Learning, McGraw-Hill, New York.
Duckett 91. Duckett, Donald (1991). The Application of Statistical Estimation Techniques to Terrain Modeling. Air Force Institute of Technology MS Thesis, AFIT fGCEfENG/91D-02.
Endsley 88. Endsley, M. (1988). Situation Awareness Global Assessment Technique (SAGAT). Proceedings of National Aerospace and Electronics Conference (NAECON).
Filer 89. Filer, Robert (1989). A 3-D Virtual Environment Display System. Air Force Institute of Technology MS Thesis, AFIT fGCS/ENGf89D-2.
137
Fisher 86.
Furness 86a.
Furness 86b.
Gerken 91.
Geltmacher 88.
Hanson 83.
Hepburn 94.
Kantowitz 83.
Kelly 94.
Latham 93.
Latham 91.
List 83.
Lorimor 88.
Marshak 87.
Fisher, Scott., Michael McGreevy, J. Humphries, W. Robinett (1986, October 23-24). Virtual Environment Display System. Proceedings 1986 Workshop on Interactive 3-D Graphics ACM Press.
Furness, Thomas A. (1986, January 23-25). Putting Humans Into Virtual Space. Proceedings of the Conference on Aerospace Simulation II. pp. 214-229.
Furness, Thomas A. (1986). The Super Cockpit and its Human Factors Challenges. Proceedings of the Human Factors Society pp. 48-52.
Gerken, Mark (1991). An Event Driven State-Based Interface for Synthetic Environments. Air Force Institute of Technology MS Thesis, A FIT /GCS/ENG/91D-07 ..
Geltmacher, Hal (1988, October). Recent Advances in Computer Image Generation Simulation. Aviation, Space, and Environmental Medicine, 59, A-39 to A-45.
Hanson, Caroline. (1993, November). Fiber Optic Helmet Mounted Display: A Cost Effective Approach to Full Visual Flight Simulation. Proceedings of the Interservice/Industry Training Equipment Conference (5th) (pp. 262-268). DTIC AD-P003 482.
Hepburn, Frank. (1994, June). Personal communication.
Kantowitz, Barry and Robert Sorkin (1983). Human Factors: Understanding People-System Relationships John Wiley and Sons, Inc.
Kelly, George (1994, April). personal communication.
Latham, Roy. (1993). Real Time Graphics 2(2) pp. 8-11.
Latham, Roy. (1991). The Dictionary of Computer Graphics Technology and Applications Springer-Verlag.
List, Uwe, Nonlinear Prediction of Head Movements for Helmet-Mounted Displays AFHRL Technical Paper 83-45, December 1983, DTIC A136590.
Lorimor, Gary. (1988). Real-Time Display of Time Dependent Data Using a Head-Mounted Display. Air Force Institute of Technology MS Thesis, AFIT /GEfENG/88D-22.
Marshak, William, Kuperman Gil, Ramsey, E., and Wilson, D. (1987). Situation awareness in map displays. Proceedings of the Human Factors Society, 31, pp. 533-535.
138
Marshak 92a.
Marshak 92b.
McDowall 94.
Mowafy 93.
Reba 88.
RFMDS 92.
Shaw 85.
Simpson 91.
RE Graphics.
Swets 64.
Thomas 91.
Woodruff 85.
Welch 84.
Marshak, William. (1992). Psychology 300, Research Design Course Notes for Psychology Course at Wright State University, Dayton, OH.
Marshak William. (1992, August). Personal communication.
McDowall, Ian. (1994, June) Personal communication.
Mowafy, Lynn, and Miller, Lori. (1993). Visualizing Spatial Relationships: Training Fighter Pilots in a Virtual Environment Debrief Interface Armstrong Laboratory 1993 Human Resources Directorate Technical Report (in press).
Reba, Robert. (1988). A Helmet-Mounted Virtual Environment Display System. Air Force Institute of Technology MS Thesis, AFIT/GCS/ENG/88D-17.
Stanford Research Institute International. (1992, May). Red Flag Measurement and Debrief System Users Manual.
Shaw, Robert L. (1985). Fighter Combat, Tactics and Maneuvering Annapolis, MD: Naval Institute Press.
Simpson, Dennis. (1991). An Application of the Object Oriented Paradigm to a Flight Simulator. Air Force Institute of Technology MS Thesis, AFIT /GCS/ENG/91D-22.
Silicon Graphics Inc. (1993). RealityEngine/RealityEngine2
Graphics Subsystems
Swets, J.A. (Ed.) (1964). Signal detection and recognition by human observers. New York: Wiley.
Thomas, Melvin, Gale Reining, and George Kelly, (1991 February 26-28). The Display for Advanced Research and Training: An "Inexpensive" Answer To Tactical Simulation. Proceedings of the SPIE Conference on Large-Screen-Projection, Avionic, Helmet-Mounted Displays 14 56 pp. 65-75.
Woodruff, Robert et.al. (1985, May). Advanced Simulator for Pilot Training and Helmet-Mounted Visual Display Configuration Comparisons. Technical Report AFHRL-TR-84-65/DTIC AD-A155 326, Air Force Human Resources Laboratory, Operations Training Division.
Welch, Brian; Shenker, Martin. (1984, September). The Fiber-Optic Helmet-Mounted Display. 1g84 Image Ill Conference Proceedings, pp. 346-361. DTIC AD-A148-636.
139

Nellis Brochure 92. 1992 Nellis AFB Bmchure, lv!ARCOA Publishing Inc, San Diego CA (Produced under contract to Fighter Weapons Center, Nellis AFB, NV).
140