Embed Size (px)
Citation preview
DEVELOPMENT AND CHARACTERIZATION OF RAFFIA PALM FIBER
REINFORCED POLYMER MATRIX COMPOSITES
A Thesis Submitted to the College of
Graduate and Postdoctoral Studies
In Partial Fulfillment of the Requirements
For the Degree of Master of Science
In the Department of Mechanical Engineering
University of Saskatchewan
Saskatoon
By
Opeoluwa Elijah Fadele
© Copyright Opeoluwa Elijah Fadele, December 2017. All rights reserved.
i
PERMISSION TO USE
In presenting this thesis in partial fulfillment of the requirements for a Postgraduate degree from
the University of Saskatchewan, I agree that the Libraries of this University may make it freely
available for inspection. I further agree that permission for copying of this thesis in any manner, in
whole or in part, for scholarly purposes may be granted by Prof. Ikechukwuka Oguocha and Prof.
Akindele Odeshi, the professors who supervised my thesis work or in their absence, by the Head
of the Department or the Dean of the College in which my thesis work was done. It is understood
that any copying or publication or use of this thesis or parts thereof for financial gain shall not be
allowed without my written permission. It is also understood that due recognition shall be given to
me and to the University of Saskatchewan in any scholarly use which may be made of any material
in my thesis.
Requests for permission to copy or to make other uses of materials in this thesis in whole or part
should be addressed to:
Head of the Department of Mechanical Engineering
57 Campus Drive
University of Saskatchewan
Saskatoon, Saskatchewan S7N 5A9
Canada
OR
Dean
College of Graduate and Postdoctoral Studies
University of Saskatchewan
116 Thorvaldson Building, 110 Science Place
Saskatoon, Saskatchewan S7N 5C9
Canada
ii
ABSTRACT
Due to high energy consumption and environmental pollution generated in the processing and use
of synthetic fibers, the need for replacement of these fibers with natural fibers in composites
manufacture has increased. The advantages of natural fibers over synthetic fibers include low cost,
biodegradability and non-toxicity. In this study, as received raffia palm fibers (RPF) and those
whose surface were chemically modified using 10 wt.% NaOH for 5 h at 60oC and 0.6 M H2SO4
for 2 h at 100oC were compression molded to produce HDPE matrix composites containing 5, 10,
20, and 30 wt.% of RPFs. Morphological, thermal, tensile, physical and structural properties of the
fibers before and after treatment were investigated using scanning electron microscopy (SEM),
differential scanning calorimetry (DSC), InstronTM machine and Fourier transform infrared
spectroscopy (FTIRS). The effects of chemical treatments of the fiber and varying fiber loadings
on the mechanical, physical and thermal properties of RPFs reinforced HDPE composites were
investigated. Mechanical and thermal properties of the composites were investigated using
InstronTM machine and the differential scanning calorimetry (DSC), respectively. The effect of
chemical modification on water uptake of the composites was also studied.
Surface chemical treatment of the RPFs by soaking in 10 wt.% NaOH for 5 h at 60oC or 0.6 M
H2SO4 for 2 h at 100oC resulted in 22% increase in the cellulose content of the fiber. SEM results
showed that the RPF comprises of several elemental fibers, which are tightly packed together with
each having its lumen at the center. FTIR spectroscopy results indicated reduction and
disappearance of some non-cellulosic components in the treated RPFs. Although, there was an
increase in the degradation temperature of the treated fibers, tensile strength and water absorption
capacity of the treated fibers reduced in comparison to non-treated fibers. The use of RPFs (surface
treated or not) in reinforcing HDPE led to increase in tensile modulus, flexural strength, flexural
modulus and crystallization temperature of the composite when compared to unreinforced HDPE.
The rate of water absorption for composites containing treated fibers is lower than that for
composites containing untreated fiber. The tensile strength, impact strength and melting
temperature of HDPE decreased with addition of either untreated or treated RPFs. Results also
showed that increasing fiber content decreased the tensile strength, flexural strength, impact energy
and the melting temperature of the composites. However, increase in tensile modulus, flexural
iii
modulus, water absorption and crystallization temperature of the composites was observed as the
fiber content was increased.

iv
ACKNOWLEDGEMENTS
I would like to express my sincere gratitude to my supervisors, Prof. Ikechukwuka Oguocha and
Prof. Akindele Odeshi for the opportunity to carry out my M.Sc. study under their guidance. The
kindness, time, professional and scientific contributions to the success of my study are deeply
appreciated. The contributions of Prof. Duncan Cree and Prof. Tabil Lope, my advisory committee
members are greatly appreciated. I thank Dr. Majid Soleimani for his time, advice, insightful and
valuable comments which have remarkably contributed to the success of this study.
My appreciations also go to Mr. Rob Peace and Dr. Chithra Karunakaran for their time, advice and
patience in training me on most of the equipment used during my MSc. program. The extensive
technical support received from Mr. Nan Fang Zhao, Dr. Melanie Fauchoux, Prof. Lee Wilson and
Abdalla Karoyo in carrying out many of my experiments is also acknowledged. My appreciation
also goes to Fraser Waldie my contact at Nova Chemicals Corporation who ensure I got the right
HDPE polymer for my research. I am grateful.
I would like to sincerely appreciate the efforts of my parents, Pastor and Pastor (Mrs.) Fadele for
their support, prayers, words of encouragement; they gave to me both morally and financially. I
pray that the Almighty God will give them life and strength to eat the good fruit of their labour. To
my uncle (Pastor James Fadel) who took it upon himself to see me succeed in my academic pursuit,
daddy I am eternally grateful.
To my friends Emmanuel Awoyele, Ahmed Tiamiyu, and Jimmy Fung, your contribution and
moral supports towards the completion of this thesis cannot be quantified. Thank you. Lastly, I am
very grateful to everybody who has been a source of help, inspiration and guide, and my second
family (Jesus House Family), I am grateful to have met you. God, bless you all.

v
DEDICATION
I DEDICATE MY THESIS FIRST TO THE SOURCE OF ALL LIFE AND MY KING
(JESUS), TO MY PARENTS, AND MY UNCLE, YOU MEAN SO MUCH MORE TO ME.

vi
TABLE OF CONTENTS
PERMISSION TO USE …...……………………………………………………………………..i
ABSTRACT …………………………..……………………………………………………...…..ii
ACKNOWLEDGEMENTS ………..……………………………………………………….…..iv
DEDICATION ……………………….…………………………………………………………..v
TABLE OF CONTENTS …………………………………………………………………….....vi
LIST OF TABLES ………………………………...…………………………………………....xi
LIST OF FIGURES ………………………………………………..………………………….xiii
LIST OF ABBREVIATIONS AND SYMBOLS ……………………………………….......xviii
CHAPTER 1: INTRODUCTION …………………………………….…..……………..1
1.1 Overview ……………………………………………………………………………………..1
1.2 Objectives …………………………………………………………………………………….3
1.3 Thesis organization …………………………………………………………….…………….3
CHAPTER 2: LITERATURE REVIEW ………………………………………...….….4
2.1 Composites Materials …………………………………………………………….…………..4
2.2 Classification of Composite Materials Based on the Matrix …………………..…………….4
2.2.1 Metal Matrix Composites ………………………………………………………….....5
2.2.2 Ceramics Matrix Composites ………………………………………………………...5
2.2.3 Polymer Matrix Composites ……………………………………………………….....6
2.3 Type of Reinforcements for Composite Materials …………………………………………...6
2.3.1 Particles ……………………………………………………………………………....6
2.3.2 Whiskers ………………………………………………………………………..….....7
2.3.3 Fibers ………………………………………………………………………………....7
2.3.3.1 Synthetic Fibers ……………………………………………………………....7
2.3.3.2 Natural Fibers ………………………………………………………………...7
2.4 Chemical Composition of Natural Fibers ……………………………………………………8
2.5 Characterization of Natural Fibers ………………………………………………………….10
vii
2.5.1 Moisture Adsorption ……………………………………………………………..….11
2.5.2 Water Absorption …………………………………………………………………...12
2.5.3 Thermal Conductivity ………………………………………………………….........12
2.5.4 Thermal Analysis of Natural Fibers ………………………………………………...12
2.5.5 FTIR and Raman Spectroscopy …………………………………………………......13
2.6 Chemical Treatment of Natural Fibers ………………………………………………….......13
2.6.1 Sodium Hydroxide (NaOH) Treatment …………………………………………......14
2.6.2 Sulphuric Acid (H2SO4) Treatment …………………………………………………15
2.6.3 Silane Treatment ……………………………………………………………….........15
2.7 Processing Techniques for Natural Fiber Reinforced Composites ……………….…….......16
2.7.1 Extrusion Molding and Extrusion Compounding ………………………...…….......16
2.7.2 Compression Molding …………………………………………………………........18
2.7.3 Injection Molding ……………………………………………………………….......18
2.8 Characterization of Natural Fibers Reinforced Polymer Matrix Composites …………........19
2.8.1 Water Absorption ……………………………………………………………….......19
2.8.2 Thermal Properties …………………………………………………………….........20
2.8.3 Mechanical Properties ……………………………………………………………...21
2.9 Application of Natural Fiber Reinforced Polymer Matrix Composites ………………….....22
2.10 Summary ………………………………………………………………………………..….22
CHAPTER 3: MATERIALS AND EXPERIMENTAL METHODS ……...………...24
3.1 Materials …………………………………………………….................................................24
3.2 Characterization of Raffia Palm Fibers (RPF) .…………………………………………......25
3.2.1 Length Measurement …………………………………………………………..........25
3.2.2 Density Measurement …...…………………………………………………..............25
3.2.3 Determination of Chemical Composition of RPFs ……………………………….....27
3.2.4 Sample Preparation for Microscopy …...…...……………………………………….28
3.2.5 Mid Infrared Spectromicroscopy (Mid – IRS) ..……………………………….........28
3.2.6 Tensile Test ……………………………………………………………………........30
3.2.7 Statistical Analysis ……………………....…………………………………….........30
3.2.8 Moisture Adsorption of RPFs ……………………………………………………….31
viii
3.2.9 Water Absorption of RPFs ………………………………………………………….32
3.2.10 X-ray Diffraction (XRD) ……………………………...…………………………….32
3.2.11 Chemical Treatments of RPFs …………………………...………………………….33
3.2.12 Colour Measurement ………….…………………………………………………….34
3.2.13 Differential Scanning Calorimetry (DSC) .………………………………………….35
3.2.14 FTIR and Raman Spectroscopy ……………………………………………………..36
3.3 Manufacture of RPF Reinforced High Density Polyethylene Composites …………..….….37
3.3.1 Extrusion Machine and Process of Mixture ……………………………...…...…….38
3.3.2 Compression Molding Equipment and Process ……………………………………..40
3.4 Characterization of RPF Reinforced HDPE Composites ………………..………………….42
3.4.1 Density Measurement …..……………..…………………………………………….42
3.4.2 Tensile Test of Composites ……………………………………...………………….43
3.4.3 Flexural Test of Composites ...……………..……………………………….……….45
3.4.4 Charpy Impact Test of Composites .……………..………………...……….……….46
3.4.5 Water Absorption .……………..……………………………………..…….……….48
3.4.6 Thermal Analysis .……………..………………………………..………….……….48
3.4.7 Microscopic Investigations of Composites .……………..………………………….49
CHAPTER 4: RESULTS AND DISCUSSION .……………………………………….50
4.1 Characterization of Raffia Palm Fiber (RPF) .……………..……………………….……….50
4.1.1 Chemical Composition of RPF .……………..………………………………...…….50
4.1.2 Microstructure of RPF .……………..……………………………….………...…….53
4.1.3 Moisture Adsorption and Water Absorption .……...………………………….…….57
4.1.4 Mechanical Properties .……………..……………………………….………...…….60
4.1.5 Statistical Analysis .……………..……………………………….…………....…….64
4.1.6 Colour Measurements of RPFs .……………..……………………....………...…….66
4.1.7 Synchrotron Based Fourier Transform Infrared Spectromicroscopy .…….......…….67
4.1.8 FT-Infrared and Raman Spectroscopy .……………..…………………….......…….71
4.1.9 X-ray Diffraction .……………..……………….…………………....………...…….74
4.1.10 DSC Measurements .……………..……………………….………....………...…….75
4.2 Characterization of RPF Reinforced Polymer Composite .……………..………….....…….79
ix
4.2.1 The Effect of Fiber Addition on the Density of High Density Polyethylene ....…….80
4.2.2 Tensile Properties Raffia Palm Fiber Reinforced HDPE .…………………….…….83
4.2.3 Fractography of Failed Tensile Specimens .……………..……………….…...…….85
4.2.4 The Effect of Fiber Reinforcement on the Flexural Properties of HDPE .………….87
4.2.5 The Effect of Fiber Addition on the Energy Absorbed of HDPE .….…...…....…….89
4.2.6 SEM Analysis of Fractured Charpy Impact Samples .……………..……….....…….91
4.2.7 The Effect of Fiber Addition on Thermo-Physical Properties of HDPE .…….…….92
4.2.8 The Influence of Fiber Addition on the Water Absorption Capacity of HDPE …….96
4.3 Summary .……………..……………………............................................………...…… 99
CHAPTER 5: CONCLUSIONS AND RECOMMENDATIONS ……………...…...101
5.1 Conclusions ……………..……………………...............................................………...…...101
5.2 Recommendations for Future Work ……………..……………………............................…102
REFERENCES ………..……………………......................................................…………..…103
APPENDICES ..………...…..……………………............................................………...…… 119
APPENDIX A …..…………..……………………............................................………...…… 120
Ankom Fiber ADF, NDF and ADL Methods
APPENDIX B …..…………..……………………............................................………...…… 131
Statistical Analysis of Variation of RPF Colour with Fiber Treatment
APPENDIX C …..…………..……………………............................................………...…… 134
Result and Statistical Analysis of the Effect of Fiber Content and Fiber Treatment on the
Density of RPF reinforced HDPE
APPENDIX D …..…………..……………………............................................………...…… 139
Result and Statistical Analysis of the Effect of Fiber Content and Fiber Treatment on the
Tensile Properties of RPF reinforced HDPE
APPENDIX E …..…………..……………………............................................………...…… 148
Result and Statistical Analysis of the Effect of Fiber Content and Fiber Treatment on the
Flexural Properties of RPF reinforced HDPE
x
APPENDIX F …..…………..……………………............................................………...…… 157
Result and Statistical Analysis of the Effect of Fiber Content and Fiber Treatment on the
Impact Strength of RPF reinforced HDPE
APPENDIX G …..…………..……………………............................................………...…… 166
Result of the Effect of Fiber Content and Fiber Treatment on the Density of RPF
reinforced HDPE
APPENDIX H …..…………..……………………............................................………...…… 167
Result and Statistical Analysis of the Effect of Fiber Content and Fiber Treatment on the
Water Absorption Behaviour of RPF reinforced HDPE
xi
LIST OF TABLES
Table 2.1 Chemical composition of some natural fibers. 10
Table 2.2 Mechanical properties of some natural and synthetic fibers. 11
Table 3.1 Humidity generator setup parameters. 31
Table 4.1 Chemical composition (as received basis) of raffia palm fibers. 51
Table 4.2 Chemical composition (dry matter basis) of raffia palm fibers. 52
Table 4.3 Mechanical properties of chemically treated raffia palm fibers. 64
Table 4.4 ANOVA test results for tensile strength of raffia palm fibers with varying fiber
lengths of 45, 70, 95, 120 and 145 mm.
64
Table 4.5 ANOVA test results for %elongation for 25 mm gauge length of raffia palm
fibers with varying fiber lengths of 45, 50, 55, 60, 65, 70 and 75 mm.
65
Table 4.6 ANOVA test results for tensile strength for 50 mm gauge length of raffia palm
fibers with varying crosshead speed of 0.5, 1, 1.5 and 2 mm/min.
65
Table 4.7 ANOVA test results of fiber treatments on the tensile strength at 45 mm fiber
length of raffia palm fibers.
66
Table 4.8 ANOVA test results of fiber treatments on % elongation at 25 mm gauge length
of raffia palm fibers.
66
Table 4.9 Variation of raffia palm fiber colour with NaOH and H2SO4 treatment. 66
Table 4.10 Thermal properties of untreated and treated raffia palm fibers obtained from
differential scanning calorimetry analysis.
79
Table B.1 ANOVA results for colour variations of raffia palm fibers with fiber treatment. 131
Table C.1 Effect of raffia palm fiber addition on the density of high density polyethylene
composites.
134
Table C.2 SigmaPlot two-way analysis of variance of the effect of fiber content and fiber
treatment on the density of raffia palm fiber reinforced high density
polyethylene.
134
Table D.1 Effect of raffia palm fiber addition on the tensile properties of high density
polyethylene composites.
139
Table D.2 SigmaPlot two-way analysis of variance of the effect of fiber content and fiber
treatment on the tensile strength of raffia palm fiber reinforced high density
polyethylene.
139
xii
Table D.3 SigmaPlot two-way analysis of variance of the effect of fiber content and fiber
treatment on the Young’s modulus of raffia palm fiber reinforced high density
polyethylene.
143
Table E.1 Effect of raffia palm fiber content on the flexural properties of high density
polyethylene composites.
148
Table E.2 SigmaPlot two-way analysis of variance of the effect of fiber content and fiber
treatment on the flexural strength of raffia palm fiber reinforced high density
polyethylene.
148
Table E.3 SigmaPlot two-way analysis of variance of the effect of fiber content and fiber
treatment on the flexural modulus of raffia palm fiber reinforced high density
polyethylene.
152
Table F.1 Impact properties of unreinforced and raffia palm fiber reinforced high density
polyethylene at different temperatures.
157
Table F.2 SigmaPlot three-way analysis of variance of the effect fiber content, fiber
treatment and temperature on the impact strength of raffia palm fiber reinforced
high density polyethylene.
158
Table G.1 Effect of untreated and treated raffia palm fibers on thermo-physical properties
of high density polyethylene composites.
166
Table H.1 Effect of untreated and treated raffia palm fibers on water absorption behaviour
of high density polyethylene composites.
167
Table H.2 SigmaPlot two-way analysis of variance of the effect fiber content and fiber
treatment on the water absorption behaviour of raffia palm fiber reinforced high
density polyethylene.
167

xiii
LIST OF FIGURES
Figure 1.1 Photo showing (a) the location of raffia palm tree and (b) raffia palm tree. 2
Figure 2.1 Classification of natural fibers according to origin. 8
Figure 2.2 Applications of natural fiber reinforced polymer matrix composites. 23
Figure 3.1 Photographs of raffia palm fiber (a) before cleaning and (b) after washing and
drying.
24
Figure 3.2 Flowchart for raffia palm fiber processing, treatment and characterization. 25
Figure 3.3 Images of (a) weighing instrument for ground raffia palm fibers and (b) gas
pycnometer instrument for density measurement.
26
Figure 3.4 Ankom 200 fiber analyzer used for determining the chemical composition of
raffia palm fibers.
27
Figure 3.5 Image showing (a) frozen raffia palm fibers in liquid nitrogen and (b) Leica
CM1950 cryostat machine.
28
Figure 3.6 Bruker Vertex 70v Interferometer / Hyperion 3000 IR Microscope. 29
Figure 3.7 Picture showing schematic drawing of a single raffia palm fiber prepared for
tensile test.
30
Figure 3.8 Humidity generator used for moisture absorption measurement. 32
Figure 3.9 Images of sodium hydroxide solution (a) before treatment and (b) after
treatment
34
Figure 3.10 Images of sulfuric acid solution (a) before treatment and (b) after treatment. 34
Figure 3.11 HunterLab spectrocolorimeter used for colour measurements. 35
Figure 3.12 Renishaw Raman inVia Reflex microscope. 36
Figure 3.13 Flowchart for raffia palm fiber reinforced high density polyethylene composite
processing and characterization.
37
Figure 3.14 Processing chart showing the mixing of untreated, alkaline and acidic treated
raffia palm fibers with high density polyethylene to make raffia palm fiber
reinforced high density polyethylene composites. M1 = 5 wt.%, M2 = 10 wt.%,
M3 = 20 wt.%, M4 = 30 wt.% of fiber, NT = no treatment of the fiber, T1 =
treatment with 10% w/v aqueous NaOH solution at 60oC for 5 h, T2 =
treatment with 0.6 M H2SO4 solution at 100oC for 2 h.
38

xiv
Figure 3.15 Twin screw extrusion machine for producing extrudates required for
composites manufacture.
39
Figure 3.16 Images of (a) water bath and (b) cooling strand pelletizer. 39
Figure 3.17 Retsch knife grinding mill. 40
Figure 3.18 Images of the (a) mold, mold releasing agent and molding plates and (b)
compression molding machine.
40
Figure 3.19 Images of composites plates from extruded pellets showing surface porosity. 41
Figure 3.20 Images of composites plates from ground extruded pellets (no surface
porosity).
42
Figure 3.21 Apparatus used for measuring densities of compression molded composites and
high-density polyethylene.
43
Figure 3.22 Dog-bone shaped specimens for tensile test. 44
Figure 3.23 InstronTM tensile machine equipped with a clip-on extensometer for determining
Young’s modulus of test specimens.
44
Figure 3.24 A picture showing a typical flexural test on a sample of 10% composites. 45
Figure 3.25 Charpy impact testing machine used in this study. 47
Figure 3.26 Broaching machine used in notching the charpy impact samples. 47
Figure 3.27 Charpy impact test samples. 48
Figure 3.28 Water absorption tests on composites. 49
Figure 3.29 A photograph of the scanning electron microscope used for microstructural
investigations.
49
Figure 4.1 Scanning electron micrographs showing transverse cross-section of (a) untreated,
(b) alkaline treated and (c) acidic treated raffia palm fibers.
53
Figure 4.2 Scanning electron micrograph showing enlarged view of the inner section
(lumen) of raffia palm fiber (transverse section).
54
Figure 4.3 Scanning electron micrograph showing enlarged view of the middle section
(cortex) of raffia palm fiber (transverse section).
55
Figure 4.4 Scanning electron micrographs showing the longitudinal surface of untreated
raffia palm fibers.
56
Figure 4.5 Scanning electron micrographs showing the longitudinal surface of raffia palm
fibers treated with NaOH.
56
xv
Figure 4.6 Scanning electron micrographs showing the longitudinal surface of raffia palm
fibers treated with sulphuric acid.
57
Figure 4.7 Moisture adsorption behaviour of untreated raffia palm fiber at 50% relative
humidity and 23oC.
58
Figure 4.8 Water absorption behaviour of untreated raffia palm fiber. 59
Figure 4.9 Water absorption behaviour of alkali and acidic treated raffia palm fiber. 60
Figure 4.10 A typical stress-strain curve obtained for a raffia palm fiber at room temperature. 61
Figure 4.11 Variation of fiber strength to fiber length. 61
Figure 4.12 Variation of percentage elongation to fracture of raffia palm fibers with fiber
length.
63
Figure 4.13 Variation of tensile strength of raffia palm fibers with the crosshead speed. 63
Figure 4.14 Synchrotron based Fourier transform infrared spectra of untreated raffia palm
fiber.
68
Figure 4.15 Synchrotron base Fourier transform infrared spectromicroscopy imaging of the
transverse section of untreated raffia palm fiber showing (a) the map region of
interest and chemical distribution of (b) cellulose (1165 cm-1), (c) lignin (1503
cm-1) and (d) pectin (1750 cm-1).
69
Figure 4.16 Synchrotron base Fourier transform infrared spectromicroscopy imaging of the
lower left region of untreated raffia palm fiber showing (a) the map region of
interest and chemical distribution of (b) cellulose (1165 cm-1), (c) lignin (1503
cm-1) and (d) pectin (1750 cm-1).
71
Figure 4.17 Fourier transform infrared spectra of untreated, alkali and acid treated raffia palm
fibers.
72
Figure 4.18 Raman spectra of (a) untreated, (b) alkali and (c) acidic treated raffia palm fibers. 73
Figure 4.19 Result of X-ray diffraction analysis on untreated, alkaline and acidic treated raffia
palm fibers.
74
Figure 4.20 Differential scanning calorimetry thermograms obtained for untreated (a) air-
dried at 23oC and (b) oven-dried raffia palm fibers at 60oC.
76
Figure 4.21 Differential scanning calorimetry thermograms obtained for alkaline treated raffia
palm fiber.
77
Figure 4.22 Differential scanning calorimetry thermograms obtained for acidic treated raffia
palm fiber.
78
xvi
Figure 4.23 Effect of fiber content and chemical treatment on the bulk density of raffia
palm fiber reinforced high density polyethylene composites.
80
Figure 4.24 A comparison of the bulk densities of untreated raffia palm fiber reinforced high
density polyethylene composites obtained from measurements and those
determined from the rule of mixture.
81
Figure 4.25 A comparison of the bulk densities of NaOH treated raffia palm fiber reinforced
high density polyethylene composites obtained from measurements and those
determined from the rule of mixture.
82
Figure 4.26 A comparison of the bulk densities of H2SO4 treated raffia palm fiber reinforced
high density polyethylene composites obtained from measurements and those
determined from the rule of mixture.
82
Figure 4.27 Effect of fiber content and chemical treatment on tensile strength of raffia palm
fiber reinforced high density polyethylene composites.
83
Figure 4.28 Effect of fiber content and chemical treatment on Young’s modulus of raffia palm
fiber reinforced high density polyethylene composites.
84
Figure 4.29 SEM micrographs of fracture surfaces of tensile specimens of high density
polyethylene composites reinforced with (a) 5 wt.% untreated, (b) 30 wt.%
untreated, (c) 5 wt.% NaOH treated, (d) 30 wt.% NaOH treated, (e) 5 wt.% H2SO4
treated and (f) 30 wt.% H2SO4 treated raffia palm fibers.
86
Figure 4.30 Effect of fiber content and fiber treatment on flexural strength of raffia palm fiber
reinforced high density polyethylene matrix composites.
88
Figure 4.31
Effect of fiber content and fiber treatment on flexural modulus of raffia palm fiber
reinforced high density polyethylene matrix composites.
88
Figure 4.32 Effect of fiber content on the impact energy absorbed of high density polyethylene
composites reinforced with untreated raffia palm fibers.
90
Figure 4.33 Effect of fiber content on the impact energy absorbed of high density polyethylene
composites reinforced with NaOH treated raffia palm fibers.
90
Figure 4.34 Effect of fiber content on the impact energy absorbed of high density polyethylene
composites reinforced with H2SO4 treated raffia palm fibers.
91
Figure 4.35 Scanning electron micrographs of charpy impact fracture surfaces at room
temperature of high density polyethylene composites reinforced with (a) 5
92

xvii
wt.% untreated, (b) 30 wt.% untreated, (c) 5 wt.% NaOH treated, (d) 30 wt.%
NaOH treated, (e) 5 wt.% H2SO4 treated and (f) 30 wt.% H2SO4 treated raffia
palm fibers.
Figure 4.36 Effect of fiber content and fiber treatment on melting temperature of raffia palm
fiber reinforced high density polyethylene matrix composites.
93
Figure 4.37 Effect of fiber content and fiber treatment on crystallization temperature of raffia
palm fiber reinforced high density polyethylene matrix composites.
94
Figure 4.38 Effect of fiber content and fiber treatment on fractional crystallinity of raffia palm
fiber reinforced high density polyethylene matrix composites.
95
Figure 4.39 Effect of fiber content on the water absorption behaviour of high density
polyethylene composites reinforced with untreated raffia palm fibers.
97
Figure 4.40 Effect of fiber content on the water absorption behaviour of high density
polyethylene composites reinforced with of NaOH treated raffia palm fibers.
97
Figure 4.41 Effect of fiber content on the water absorption behaviour of high density
polyethylene composites reinforced with H2SO4 treated raffia palm fibers.
98
Figure 4.42 Typical scanning electron micrograph showing the presence of pores in high
density polyethylene compression molded samples.
99
xviii
LIST OF ABBREVIATIONS AND SYMBOLS
ABBREVIATIONS
𝑎∗ Chromacity coordinates (green to red)
ADF Acid detergent fiber
ADL Acid detergent lignin
𝑏 Flexural sample width (mm)
𝑏∗ Chromacity coordinates (blue to yellow)
𝐵𝐺 Between groups
CI Crystallinity index
CMC Ceramics matrix composite
𝑑 Flexural sample thickness (mm)
𝐷 Deflection of flexural sample (mm)
𝐷𝑓 Degree of freedom
DMB Dry matter basis
DSC Differential scanning calorimeter
𝐸 Young’s modulus (GPa)
𝐸𝑓 Flexural modulus (GPa)
𝐸𝑖 Impact energy (J)
FRP Fiber reinforced polymer or Fiber reinforce plastic
FRPC Fiber reinforced polymer composite
FTIR Fourier transform infrared
FTIRS Fourier transform infrared spectroscopy
HDPE High density polyethylene
𝐿 Length of support span (mm)
𝐿∗ Chromacity coordinates (white to black)
Lo Gauge length (mm)
𝑚 Slope of the load-deflection curve
MMC Metal matrix composite
𝑀𝑆 Mean square
MSDC Modulated differential scanning calorimeter
NDF Neutral detergent fiber
xix
NF Natural fiber
NFRP Natural fiber reinforced polymer
NT Non-treated
𝑃 Flexural load (N)
PMC Polymer matrix composite
𝑟 Maximum flexural strain
𝑅 Crosshead speed (mm/min)
RH Relative humidity
RPF Raffia palm fiber
RT Room temperature (23oC)
SEM Scanning electron microscope
SF Synthetic fiber
𝑆𝑆 Sum of squares
Tm Melting temperature (oC)
𝑊𝐺 Within groups
XRD X-ray Diffraction
𝑍 Rate of straining of the outer fiber (mm/min)
SYMBOLS
∆𝐸 Colour index
𝜌𝑐 Density of composite (gcm-3)
𝜌𝑓 Density of fiber (gcm-3)
𝜌𝑙 Density of liquid (gcm-3)
𝜎𝑓 Flexural strength (MPa)
𝜎𝑡 Tensile strength (MPa)
1
CHAPTER 1
INTRODUCTION
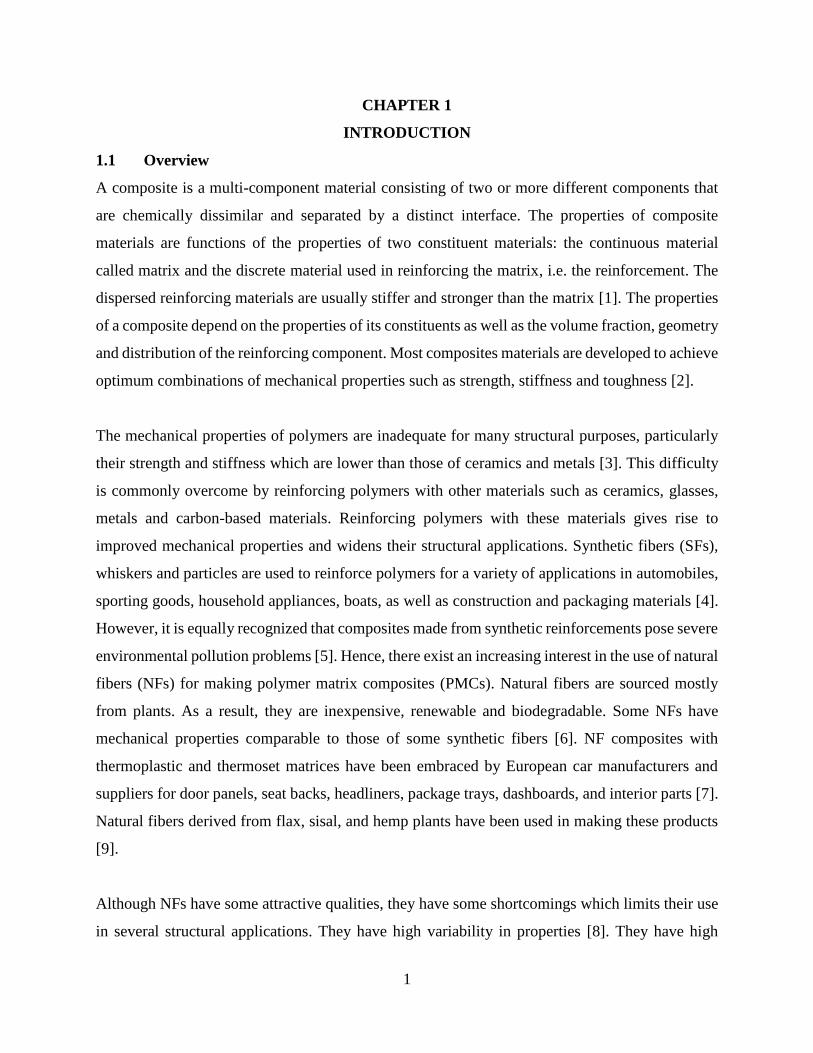
1.1 Overview
A composite is a multi-component material consisting of two or more different components that
are chemically dissimilar and separated by a distinct interface. The properties of composite
materials are functions of the properties of two constituent materials: the continuous material
called matrix and the discrete material used in reinforcing the matrix, i.e. the reinforcement. The
dispersed reinforcing materials are usually stiffer and stronger than the matrix [1]. The properties
of a composite depend on the properties of its constituents as well as the volume fraction, geometry
and distribution of the reinforcing component. Most composites materials are developed to achieve
optimum combinations of mechanical properties such as strength, stiffness and toughness [2].
The mechanical properties of polymers are inadequate for many structural purposes, particularly
their strength and stiffness which are lower than those of ceramics and metals [3]. This difficulty
is commonly overcome by reinforcing polymers with other materials such as ceramics, glasses,
metals and carbon-based materials. Reinforcing polymers with these materials gives rise to
improved mechanical properties and widens their structural applications. Synthetic fibers (SFs),
whiskers and particles are used to reinforce polymers for a variety of applications in automobiles,
sporting goods, household appliances, boats, as well as construction and packaging materials [4].
However, it is equally recognized that composites made from synthetic reinforcements pose severe
environmental pollution problems [5]. Hence, there exist an increasing interest in the use of natural
fibers (NFs) for making polymer matrix composites (PMCs). Natural fibers are sourced mostly
from plants. As a result, they are inexpensive, renewable and biodegradable. Some NFs have
mechanical properties comparable to those of some synthetic fibers [6]. NF composites with
thermoplastic and thermoset matrices have been embraced by European car manufacturers and
suppliers for door panels, seat backs, headliners, package trays, dashboards, and interior parts [7].
Natural fibers derived from flax, sisal, and hemp plants have been used in making these products
[9].
Although NFs have some attractive qualities, they have some shortcomings which limits their use
in several structural applications. They have high variability in properties [8]. They have high
2
affinity to water which is caused by cellulose and hemicellulose of NFs. This results in poor
bonding and swelling in NF-reinforced PMCs and, consequently, poor mechanical performance.
The use of chemical treatments and coupling agents could be effective in enhancing bonding with
polymers. In composites fabrication, if the coupling between the reinforcement and the matrix is
poor, a coupling agent will be needed for good mechanical properties.
Although several studies have been carried out to investigate the use of natural fibers such as flax
[8–11], sisal [12–14], hemp [15–17], jute [18–20], kenaf [16,21–23], abaca [24–26], banana
[3,20,27], coir [28–30] and ramie [31–33] in making PMCs, very little attention has been given to
the potential use of raffia palm fiber in these composites [5]. Raffia palm fiber is a natural vegetable
fiber like sisal, banana and abaca, which are extracted from the leaflets of raffia palm tree – Raphia
farinifera (Fig. 1.1b).
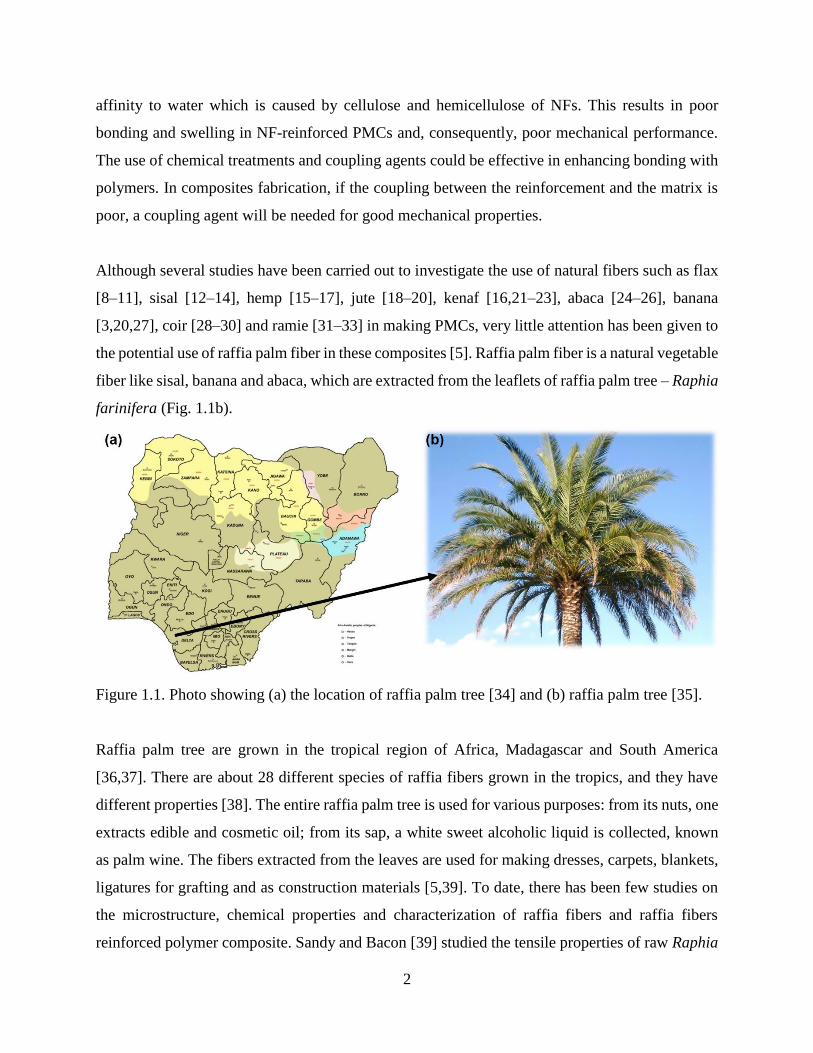
Figure 1.1. Photo showing (a) the location of raffia palm tree [34] and (b) raffia palm tree [35].
Raffia palm tree are grown in the tropical region of Africa, Madagascar and South America
[36,37]. There are about 28 different species of raffia fibers grown in the tropics, and they have
different properties [38]. The entire raffia palm tree is used for various purposes: from its nuts, one
extracts edible and cosmetic oil; from its sap, a white sweet alcoholic liquid is collected, known
as palm wine. The fibers extracted from the leaves are used for making dresses, carpets, blankets,
ligatures for grafting and as construction materials [5,39]. To date, there has been few studies on
the microstructure, chemical properties and characterization of raffia fibers and raffia fibers
reinforced polymer composite. Sandy and Bacon [39] studied the tensile properties of raw Raphia
3
farinifera from Madagascar. Anike et al. [40] investigated the effects of alkali treatments on the
tensile and hardness properties of raffia palm fiber reinforced polyester resin composite. Elenga et
al. [5,38,41] reported on the microstructure, physical and tensile properties of raw and alkali
treated Raphia textilis. Different characterization techniques such as scanning electron microscope
(SEM), X-ray diffraction (XRD), Fourier transform infrared spectroscopy (FTIRS) and Instron
testing machine were used. However, the effects of reinforcing HDPE with varying weight
fractions of raw, alkaline and sulphuric acid treated Raphia farinifera (from Nigeria) are yet to be
studied.
1.2 Objectives
The long-term goal of the present research is to develop and characterize raffia palm fiber
reinforced polymer composites using high density polyethylene as the matrix for structural
application. To realize this goal, the following specific objectives were pursued:
1. Optimization of the surface chemistry of raffia palm fibers (RPFs) for enhanced interfacial
adhesion with polymers.
2. Determination of the effects of surface modification on mechanical and physical properties
of RPFs reinforced high density polyethylene.
After the realization of my objectives, my major research contributions to knowledge are:
1. The use of synchrotron Mid-IR to understand the spatial distribution and concentration of
chemical compositions of raffia palm fibers.
2. The effects of chemical treatments on the water absorption behaviour of raffia palm fibers.
1.3. Thesis Organization
This thesis consists of five chapters. An overview of the project and research objectives are
presented in Chapter 1. A review of previous work relevant to the research topic is provided in
Chapter 2. Experimental materials and procedures including composite synthesis and
characterization are discussed in Chapter 3. Chapter 4 presents and discusses the research results
obtained from tests conducted in Chapter 3. The conclusions drawn from the analysis of the tests
results and recommendations for future work are provided in Chapter 5.

4
5
CHAPTER 2
LITERATURE REVIEW
This chapter reviews the different characterization techniques associated with NFs, different
technique used in manufacturing NFs reinforced polymer matrix composites. It also includes some
techniques used in characterizing NFs reinforced polymer matrix composites and its applications.
2.1 Composites Materials
The aim of combining different materials in a composite is to produce a superior and unique
material that combines the desired properties of the constituent materials while retaining their
identities in the new product [42]. The driving force behind the development of most existing
composites is their capability to be designed to provide the targeted material behavior [43].
Development of new composites materials has continued to attract attention in the manufacturing
industry, as it offers opportunity to use weak materials with other desirable properties by simply
strengthening them with stronger and stiffer reinforcing components such as fibers, whiskers or
particles.
2.2 Classification of Composite Materials
Depending on the matrix material, a composite may be classified as metal, polymer, or ceramic
matrix composite. In general, metals and polymers are reinforced with fibers, whiskers or particles
to increase strength or stiffness or both. For ceramic-matrix composites, the reinforcing component
is added mostly to improve fracture toughness [2]. For fiber-reinforced composites, the matrix
material binds the fibers together and acts as the medium through which an externally applied
stress is transmitted and distributed to the fibers through the interface while only a very small
proportion of the applied load is carried by the matrix material [2]. The matrix also protects the
individual fibers from surface damage due mechanical abrasion or chemical attack from the
environment. The strength of the interface between the matrix and reinforcing component
generally controls the mechanical properties of a composite [44].
6
2.2.1 Metal Matrix Composites (MMCs)
A metal matrix composites (MMCs) consists of a metal matrix that is reinforced by a ceramic
fibers or particles to enhance stiffness and strength. Most MMCs commonly produced are based
on light metal alloy matrices, especially magnesium, aluminum and titanium alloys. High
temperature cobalt and nickel-based alloys are also reinforced with ceramic particles to create a
class of MMCs called cermets. [45]. Reinforcing A359 aluminum alloy with 20 vol.% ceramic
silicon carbide particles resulted in the production of car brake discs with high wear resistance and
good mechanical strength [45]. Ceramic fiber reinforced aluminum alloys have been developed
for making propeller shafts used in automobile. This resulted in a 50% weight reduction in
comparison to the conventional steel shafts, and reduced number of applied bearings [45]. Lee and
Sue [46] studied the effect of dynamic impact on carbon fiber reinforced 7075 Al matrix
composites. It was found that the dynamic strength of the composite increased by 35%. Plasma
electrolytic oxidation (PEO) method was used to make aluminum alloy 383- SiO2 particle
composites for use in the production of engine block cylinder liners [47]. This reduced weight and
manufacturing cost, while wear resistance increased by 85%.
2.2.2 Ceramics Matrix Composites (CMCs)
Ceramics have certain attractive properties such as high stiffness, hardness, compressive strength
and relatively low density [48]. However, they are brittle and have low fracture toughness. CMCs
are developed to retain the desirable properties of ceramics while compensating for their
weaknesses in term of low tensile strength and poor fracture toughness. Matrices used for CMCs
include alumina (Al2O3), boron carbide (B4C), and boron nitride (BN) while the reinforcements
are secondary materials which are usually ceramic fibers, whiskers or particles. The main reason
for developing CMCs is to achieve substantial increases in toughness [49]. Short fibers have been
successfully used in reinforcing CMCs. These reinforcements impede the propagation of cracks in
the brittle ceramic matrix. [48]. TiC fiber reinforced alumina (Al2O3) composites have been
commercially produced by hot pressing. TiC reinforced alumina composites exhibit excellent wear
resistance [50].

7
2.2.3 Polymer Matrix Composites (PMCs)
Polymers have low density and good chemical resistance compared to metallic materials. This
makes them choice materials for aerospace applications especially in the fabrication of the fuselage
and wings [42]. However, low strength and poor stiffness of polymers limits their structural
applications in most cases. The poor mechanical properties of polymers are overcome by
reinforcement with suitable particles, whiskers or fibers. Most polymer matrix composites (PMCs)
consist of thermosetting or thermoplastic polymer matrix reinforced with particles, short or long
fibers. In addition, the matrix often determines the maximum service temperature because it
softens, melts, or degrades at a much lower temperature than the reinforcing component [2]. When
two or more reinforcements are combined in a PMC composite, it is called a hybrid composite.
Advantages of hybrids over conventional PMCs include balanced strength and stiffness, improved
toughness and impact resistance, and reduced weight [48]. Fiber reinforced polymers (FRPs) find
wide application in aerospace structures (control surfaces, etc., in airplanes, for the rotor assembly
in helicopters), sports equipment (shafts for golf clubs, handles of rackets), marine structures and
in automobile (racing cars) among others [49].
2.3 Type of Reinforcements
Composites are also classified as particle reinforced, fiber reinforced or whisker reinforced
composite depending whether fiber, whiskers or particles are used as reinforcement.
2.3.1 Particles
Some of the particles commonly used in reinforcing a metal matrix composite include aluminum
oxide (Al2O3), titanium carbide (TiC), and silicon carbide (SiC) [51–53]. The particles can be
spherical, disk-shaped, rod shaped, and plate shaped. The difference between particles and other
reinforcing materials is in the aspect ratio. Particles have an aspect ratio close to unity [54]. Several
studies have reported increase in hardness and wear resistance of composite materials when
particles are used as reinforcements [52,55,56]. However, a decrease in the tensile strength of the
material was also reported by some of these authors [52,55].
8
2.3.2 Whiskers
Whiskers are monocrystalline material with extremely high strength. They have diameters similar
to fibers, yet they are short and have low length-to-diameter (l/d) ratio i.e. aspect ratio compared
to fibers [57]. The use of whiskers in reinforcing either metal, ceramic or polymer matrices results
in strength improvement of the matrices [58]. However, whiskers are not used extensively as
reinforcement in composites due to their high production cost.
2.3.3 Fibers
Fiber is a thin thread of natural or artificial material, generally circular in cross-section. It is a
material whose length is many times greater than its diameter, having an aspect ratio greater than
100, and can be either continuous or discontinuous [59,60]. Fiber reinforcement is used to enhance
both the strength and stiffness of composites [48]. In fiber-reinforced composites, the fiber is often
considered to be the principal constituent since it carries the major share of the load. Materials that
are classified as fibers are either polycrystalline or amorphous, and have small diameters [2]. There
are two types of fibers namely: natural fibers and man-made or synthetic fibers.
2.3.3.1 Synthetic Fibers (SFs)
Synthetic fibers are man-made fibers such as carbon fibers, aramid fibers, and glass fibers. They
have been used in reinforcing polymers and metals producing high performance materials for
structural applications [42]. Although composites reinforced with synthetic fibers possess superior
mechanical properties, they have some severe drawbacks that include high cost, poor recyclability
and non-biodegradability [6].
2.3.3.2 Natural Fibers (NFs)
Natural fibers are gaining increasing attention as alternative to synthetic fibers because they are
renewable, abundantly available and environmental friendly. NFs are classified based on their
origin (Fig. 2.1). They are sourced from animals (wool and silk), minerals (asbestos) and plants.

9
Figure 2.1 Classification of natural fibers according to origin [61].
The extraction part of a plant is the main difference between bast and leaf vegetable fibers. Bast
fibers are extracted from the stem of a plant, while leaf fibers are gotten from the leaflets of a plant
[62]. The use of NFs as reinforcing materials in both thermoplastic and thermoset matrix
composites provides positive environmental benefits with respect to ultimate disposability and
sustainability [63]. The mechanical properties of these composites depend mainly on (i) the
properties of the fiber, (ii) the properties of the polymer and (iii) the nature and strength of the
fiber-matrix interface [2].
2.4 Chemical Composition of Natural Fibers
Natural fibers are composed mainly of cellulose, hemicellulose, lignin, wax, pectin, and other
materials. Among these, cellulose, hemicellulose and lignin are the basic components of NFs
accounting for mechanical properties [64]. Cellulose is the major components in NFs. It is a natural
occurring polymer consisting of D-glucopyranose or D-glucose units (C6H12O6), which are linked
10
together by β-1, 4-glucosidic bonds [64–66]. Hence, the repeating units in cellulose is referred to
as anhydro-cellulobiose, having a linear structure [64]. Cellulose is highly crystalline, with little
amorphous region [65]. Hemicellulose consist of branched, short chains groups of polysaccharides
with a lower degree of polymerization than cellulose [65]. The branch structured nature makes
hemicellulose highly amorphous, hence, their mechanical properties are lower in comparison to
cellulose [64,66]. The changes in fiber dimension with regards to environmental conditions is
mostly attributed to hemicellulose swelling due to the water absorbed [66]. Lignin has a complex
3-dimensional polymer structure and it is amorphous [65]. Guaiacyl, syringyl, and p-
hydroxyphenyl moieties are the three basic building blocks for lignin, and it is distributed
throughout secondary cell wall, having high concentration in the middle lamella [65,66]. Both
hemicellulose and lignin acts as the glue that holds the cell wall of each individual fibers in a fiber
bundle together [66].
The chemical composition (cellulose, hemicellulose, and lignin contents) of NFs before and after
treatment can be determined using different techniques. The use of crude fiber analysis by the
Association of Official Analytical Chemists (AOAC) standard [67,68] in determining the chemical
compositions of NFs has been reported by several authors [69–73]. Also the use of detergent fiber
analysis developed by Peter Van Soest with the aid of Ankom 200 Fiber AnalyzerTM machine has
been reported by several authors [28,74–77] to be efficient in determining the chemical
compositions of NFs. One of the limitations of detergent fiber analysis is that it cannot quantify
the amount of pectin present in NFs. The standard acid detergent fiber (ADF) method 5 [78],
neutral detergent fiber (NDF) method 6 [79] and acid detergent lignin (ADL) method 8 [80]
procedures were followed (details are provided in Appendix A). The percentages of cellulose,
hemicellulose and lignin content are determined from the following equations:
Lignin (% dry matter) = ADL
Cellulose (% dry matter) = ADF – ADL
Hemicellulose (% dry matter) = NDF – ADF
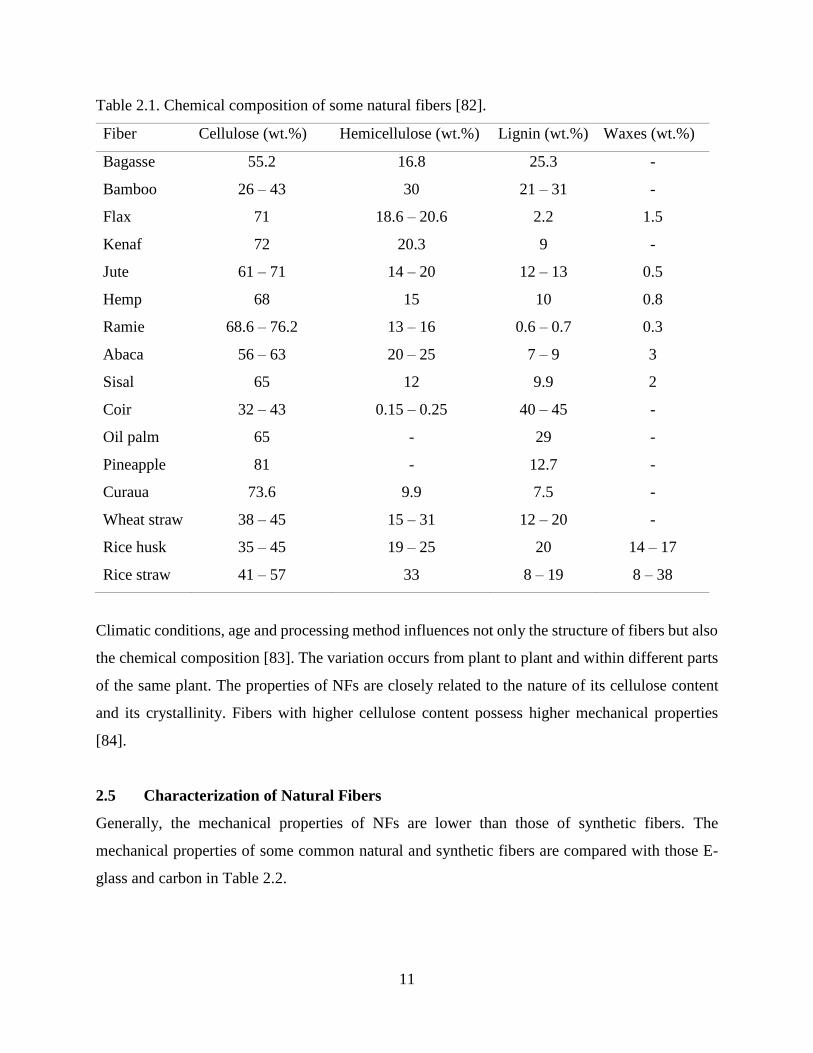
Table 2.1 shows the range of the average chemical constituents for a wide variety plant fiber. Their
chemical compositions vary depending on the origin of the fiber [81].
11
Table 2.1. Chemical composition of some natural fibers [82].
Fiber Cellulose (wt.%) Hemicellulose (wt.%) Lignin (wt.%) Waxes (wt.%)
Bagasse 55.2 16.8 25.3 -
Bamboo 26 – 43 30 21 – 31 -
Flax 71 18.6 – 20.6 2.2 1.5
Kenaf 72 20.3 9 -
Jute 61 – 71 14 – 20 12 – 13 0.5
Hemp 68 15 10 0.8
Ramie 68.6 – 76.2 13 – 16 0.6 – 0.7 0.3
Abaca 56 – 63 20 – 25 7 – 9 3
Sisal 65 12 9.9 2
Coir 32 – 43 0.15 – 0.25 40 – 45 -
Oil palm 65 - 29 -
Pineapple 81 - 12.7 -
Curaua 73.6 9.9 7.5 -
Wheat straw 38 – 45 15 – 31 12 – 20 -
Rice husk 35 – 45 19 – 25 20 14 – 17
Rice straw 41 – 57 33 8 – 19 8 – 38
Climatic conditions, age and processing method influences not only the structure of fibers but also
the chemical composition [83]. The variation occurs from plant to plant and within different parts
of the same plant. The properties of NFs are closely related to the nature of its cellulose content
and its crystallinity. Fibers with higher cellulose content possess higher mechanical properties
[84].
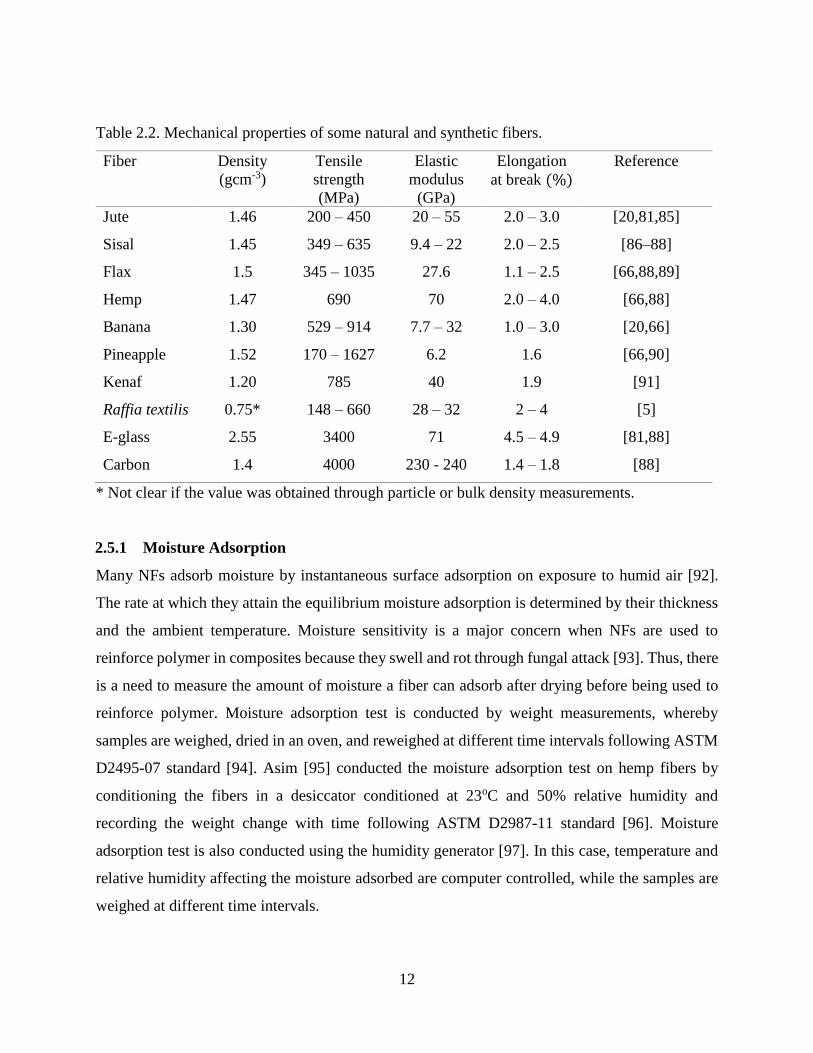
2.5 Characterization of Natural Fibers
Generally, the mechanical properties of NFs are lower than those of synthetic fibers. The
mechanical properties of some common natural and synthetic fibers are compared with those E-
glass and carbon in Table 2.2.
12
Table 2.2. Mechanical properties of some natural and synthetic fibers.
Fiber Density
(gcm-3)
Tensile
strength
(MPa)
Elastic
modulus
(GPa)
Elongation
at break (%)
Reference
Jute
Sisal
Flax
1.46
1.45
1.5
200 – 450
349 – 635
345 – 1035
20 – 55
9.4 – 22
27.6
2.0 – 3.0
2.0 – 2.5
1.1 – 2.5
[20,81,85]
[86–88]
[66,88,89]
Hemp 1.47 690 70 2.0 – 4.0 [66,88]
Banana 1.30 529 – 914 7.7 – 32 1.0 – 3.0 [20,66]
Pineapple 1.52 170 – 1627 6.2 1.6 [66,90]
Kenaf 1.20 785 40 1.9 [91]
Raffia textilis 0.75* 148 – 660 28 – 32 2 – 4 [5]
E-glass
Carbon
2.55
1.4
3400
4000
71
230 - 240
4.5 – 4.9
1.4 – 1.8
[81,88]
[88]
* Not clear if the value was obtained through particle or bulk density measurements.
2.5.1 Moisture Adsorption
Many NFs adsorb moisture by instantaneous surface adsorption on exposure to humid air [92].
The rate at which they attain the equilibrium moisture adsorption is determined by their thickness
and the ambient temperature. Moisture sensitivity is a major concern when NFs are used to
reinforce polymer in composites because they swell and rot through fungal attack [93]. Thus, there
is a need to measure the amount of moisture a fiber can adsorb after drying before being used to
reinforce polymer. Moisture adsorption test is conducted by weight measurements, whereby
samples are weighed, dried in an oven, and reweighed at different time intervals following ASTM
D2495-07 standard [94]. Asim [95] conducted the moisture adsorption test on hemp fibers by
conditioning the fibers in a desiccator conditioned at 23oC and 50% relative humidity and
recording the weight change with time following ASTM D2987-11 standard [96]. Moisture
adsorption test is also conducted using the humidity generator [97]. In this case, temperature and
relative humidity affecting the moisture adsorbed are computer controlled, while the samples are
weighed at different time intervals.
13
2.5.2 Water Absorption
As mentioned previously in Section 1.1, NFs are highly hydrophilic in nature and are permeable
to water. Water uptake in these fibers depends greatly on the morphology and chemical structures
[98,99]. Bio-fibers are primarily composed of cellulose, hemicellulose, lignin, and waxy particles.
Among these components hemicellulose is primarily responsible for the water absorption
behaviour of NFs [10,11,100]. Ana et al. [101] reported that the lignin component which is a
hydrophobic compound, has little or no effect on the water absorption capacity of NFs. Studies
have also indicated that penetration of water into the fibers occurs through the micro pores present
on the fiber surface [102,103].
2.5.3 Thermal Conductivity
Thermal conductivity describes a material’s ability to transport heat from high to low temperature
region [104]. NFs used in reinforcing polymer matrices have low thermal conductivity and are
good insulators. Different method have been employed in measuring thermal conductivity of NFs,
such as transient line-source [105,106], transient plane source (TPS) [107–109], laser flash [109–
112] and steady-state heat transfer [113–116]. Li et al. [106] measured the thermal conductivity of
flax fibers with the use of the line-source method. He reported the thermal conductivity of flax
fibers used in reinforcing HDPE to be 0.119 W/moC. Alausa et al. [114] reported that the thermal
conductivity of Raphia hookeri using steady state heat transfer to be 0.056 W/mK. Damfeu et al.
[116] studied the thermal conductivity of different NFs using steady-state heat transfer. He
observed that the thermal conductivities of kapok, coconut and rattan fibers are 0.045 W/mK,
0.055 W/mK, and 0.07 W/mK respectively.
2.5.4 Thermal Analysis of Natural Fibers
The melting temperature (Tm) of a solid is the temperature at which it changes from solid to liquid
state. Thus, thermal stability of fibers is very important in processing NFs reinforced composites.
Since natural fibers are ligno-cellulosic and consist mainly of lignin, hemicellulose and cellulose,
their cell walls undergo decomposition with increasing processing temperature [100]. Thermal
stability of NFs was studied by several authors [95,117–120] with the aid of differential scanning
calorimetry (DSC) and/or thermogravimetric analysis (TGA). Asim [95] studied the thermal
14
properties of hemp fibers using a Perkin-Elmer Simultaneous Thermal Analyzer 6000 equipment
at a heating rate of 10ºC/min from room temperature to 450ºC. A small peak around 50oC was
observed corresponding to loss of moisture. Two other broad exothermic peaks were observed at
about 270oC and 360oC, which were attributed to decomposition of hemicellulose and cellulose
respectively. Oliveira and D’Almeida [117] studied the thermal properties of tururi fibers using a
Perkin-Elmer, model Pyris Diamond equipment, from 20 to 200ºC under inert (N2) atmosphere at
a heating rate of 10ºC/min. Three main peaks were observed. A broad endothermic peak occurred
around 110ºC which was associated with dehydration of water. Two exothermic peaks were
identified at approximately 270ºC and 360ºC. These were associated with thermal decompositions
of hemicellulose and cellulose, respectively. Ananda [120] studied the thermal properties of flax
fibers using a DSC model Q2000, TA Instruments at a heating rate of 20oC from 20 to 400oC. An
endothermic peak at around 107oC attributed to water evaporation from flax fibers was observed.
Two exothermic peaks at around 349oC and 381oC were attributed to the degradation temperature
of lignin and cellulose respectively.
2.5.5 FTIR and Raman Spectroscopy
Chemical treatments can alter the surface chemistry of NFs. Quantitative evaluation of some of
these changes can be studied using Fourier Transform Infrared (FTIR) and Raman spectroscopy.
These spectroscopic techniques help in identifying the different functional groups present in the
fibers before and after chemical treatments [72]. Reduction in the intensity of some functional
groups peak, shift in the spectra and disappearance of some functional groups aid in ascertaining
the alterations that occur during chemical treatments of the fibers [121].
2.6 Chemical Treatment of Natural Fibers
The use of natural fibers in reinforcing polymer is not without its own challenges. The major
challenges include poor interfacial adhesion, and poor compatibility between the hydrophilic fiber
and the hydrophobic matrix causing fiber swelling within the matrix. There is also the difficulty
in homogenous mixing the NFs and polymers. Due to the difference in chemical structure between
fibers and polymer, obtaining a strong bonding between these fibers and polymer matrices can be
very challenging. A weak fiber matrix bond will lead to ineffective stress transfer throughout the
fiber-matrix interface. Therefore, chemical treatment of NFs is required to improved bonding and

15
therefore enhanced composite performance. These treatments are usually based on the use of
reagents with functional groups that can react with the fibers and change their surface chemistry.
The commonly used chemical treatments in modifying the surface chemistry of NFs and improving
their compatibility with hydrophobic polymers include, sodium hydroxide, silane, sulphuric acid,
benzoylation, permanganate and peroxide treatment among others. Surface treatment of fibers is
used to reduce their tendency for moisture absorption and thereby facilitates greater compatibility
with the polymer matrix [103].
2.6.1 Sodium Hydroxide (NaOH) Treatment
Mercerization is an economical and effective method used for improving the interfacial
incompatibility between the matrix and the fiber. It has also proven to reduce water uptake of
fibers. It improves the adhesive characteristics of the fiber surface by removing natural waxy
materials, hemicellulose and artificial impurities, and produce good surface topography [102].
During this chemical treatment, the surface of the fibers are cleaned to ensure the removal of
impurities, which reduces the fiber surface roughness and water absorption capacity via the
removal of hydroxyl groups present on the fiber structure [6,93] as shown in equation 2.1.
Fiber cell − OH + NaOH → Fiber cell − O−Na+ + H2O [6] (2.1)
The effect of NaOH treatment depends on the concentration of the alkaline solution, its
temperature and the treatment time duration. Optimum conditions for mercerization increases the
degree of bonding at the polymer-fiber interface [93]. Anike et al. [40] studied the effect of alkali
treatment on mechanical properties of raffia palm fiber reinforced polyester matrix composite.
After alkali treatment of the fiber, two of its components (i.e. hemicellulose and the lignin) were
removed. This improved the tensile strength as well as the modulus of elasticity of the composite
produced with the treated fiber, in comparison with those containing untreated fibers. Elenga et al.
[41] studied the effects of alkali treatment on the surface chemistry and properties of raffia fiber
by treating the fiber with different concentrations (2.5, 5 and 10 wt.%) of sodium hydroxide
(NaOH) so as to preserve the cellulose part of the fiber but dissolving the hemicellulose and the
lignin portions. The results showed that higher concentration of sodium hydroxide attacked the
cellulose, leading to fiber weakening. The use of sodium hydroxide in treating NFs increases the
fiber surface area for good adhesion with the matrix. Good adhesion between the matrix and the
fiber is needed for improved mechanical properties.
16
2.6.2 Sulphuric Acid (H2SO4) Treatment
Treatment of NFs with dilute acids is widely used and it is reported to be effective in hydrolyzing
hemicellulose from NFs, thereby exposing their cellulose content [122]. Dilute acid treatment is
also effective in modifying the surface chemistry of NFs by removing almost 100% of hemi-
cellulose from cellulose and lignin [123]. Treatment with sulphuric acid (H2SO4) is most
commonly used, while other acids such as hydrochloric acid (HCl), phosphoric acid (H3PO4), and
nitric acid (HNO3) have also been used [124]. Process parameters such as temperature, acid
concentration, exposure time, and solid-to-liquid ratio determine the product yield during acid
treatment. Soleimani et al. [69] pretreated oat hull fiber with 0.1 N of H2SO4 at 130oC for 40 min.
They reported that more than 95% of the hemicellulose was hydrolyzed. Grewal et al. [123]
pretreated oat hull fibers with 1.2 N of H2SO4 at 99oC for 80 min under continuous stirring at an
agitation speed of 300 rpm with a solid-liquid ratio of 1:10 (w/w). They also reported that more
than 95% of the hemicellulose was extracted.
2.6.3 Silane Treatment
The use of silane in chemically modifying NFs has been reported in several studies to have been
effective in enhancing the interface between the fibers and polymer matrix composites [125–128].
Zhou et al. [126] studied the effect of silane treatment on the microstructure of sisal fibers. 0.2
mol/L of 3 – aminopropyltri-ethoxysilane (APS) and N – (2 – aminoethyl) – 3 – aminopropyltri-
methoxysilane (AAPTS) coupling agent were used in modifying sisal fibers at room temperature
for 72 h. 1 g of sisal fibers per 100 mL of silane solution was maintained. After treatment, the
fibers were washed several times in an 80/20 (v/v) ethanol/water mixture. Thereafter, the fibers
were subjected to a Soxhlet extraction in ethanol to remove unreacted silane molecules and dried
at room temperature. After treatment they observed non-cellulosic components of the fibers were
removed from FTIR results. They also observed new absorption bands in the region from 800 to
1800 cm-1 which corresponds to silane coupling agents. The presence of this band is an indication
that silane was successfully grafted on to the fiber surface, enhancing a stronger interface when
used in reinforcing polymers. Gonzalez et al. [127,128] investigated the effect of chemical
treatments on the mechanical properties of henequen fibers reinforced HDPE matrix composite.
The fibers were treated with 2% (w/v) NaOH solution at room temperature for 1 h denoted as
17
FIBNA. After treatment, the fibers were washed and dried at 60oC for 24 h. The fibers were also
treated with 0.033% (w/w) vinyltris (2 – methoxy – ethoxy) silane solution at room temperature
for 1 h denoted as FIBSIL. The pH of the solution was kept at 3.5. After treatment, the fibers were
washed and dried at 60oC for 24 h. Also, after washing of the fibers which were treated with 2%
NaOH, they were further immersed in 0.033% silane solution. This fiber was denoted as
FIBNASIL. From FTIR and adsorption isotherm analysis, they observed that the amount of silane
adsorbed onto the FIBNASIL fibers and removal of non-cellulosic components was higher in
comparison to FIBSIL fibers. They attributed the increase in silane adsorbed in the FIBNASIL
fiber to the fact that pre-treatment of fibers in alkali solution gave a larger amount of exposed
cellulose on the fiber prior to silane treatment. They observed an increase in tensile properties of
the composite when the fibers were pre-treated with alkali solution and finally with a silane
coupling agent.
2.7 Processing Techniques for Natural Fiber Reinforced Composites
Polymer matrix composite materials are formed into shape using different processing technologies
such as extrusion, compression, rotational, and injection molding techniques. Processing of NF
reinforced polymer composites is based on mixing of short NFs and polymer matrix followed by
subsequent molding [115]. Thermoplastics offer many advantages over thermosets.
Thermoplastics offer design flexibility and ease of molding complex parts [100]. The two common
methods for processing NF-reinforced polymer composites are injection molding and compression
molding. Both are usually preceded by extrusion molding to attain a uniform dispersion of fibers
in the melted polymer.
2.7.1 Extrusion Molding and Extrusion Compounding
Extrusion is a molding process where a melted material (polymer) is forced to go through a die
orifice, providing a long and continuous product, whose cross-section is determined by the shape
of the die [48]. Extrusion compounding is a molding process where polymer melts with other
additives (i.e. fibers) are extruded through the die, and the final product is known as a compound
or composite [54]. In operating the extrusion compounding machine, mixture of materials (powder
polymers and ground fibers) are fed into the extrusion barrel through the hopper, and conveyed
through the barrel by rotating screw. Electrical heaters placed around the barrel ensures total melt
18
of the material. The heaters are set at varying temperature to help melt the material gradually. The
rotating screw aside from pushing the melted material through the die orifice also serves several
functions as divided into sections. In the feed section, the rotating screw help convey the material
from the hopper through the barrel. As the material is heated and transformed into liquid, the
rotating screw helps removed any entrapped air in the barrel by compressing the melted material.
In the metering section, the rotating screw helps in homogenizing the material while providing
sufficient pressure in pushing the melted material through the die opening [48]. The extrudates are
cooled by the surrounding air and with the use of a water-bath, which is attached to the end of the
die orifice.
Most composites consisting of natural fibers and thermoplastics are produced by extrusion. During
this process, the processing temperature is considered a limiting factor especially when it concerns
the use of natural fibers [129]. Above 160ºC and in the presence of oxygen, the fibers can undergo
thermal oxidation resulting in darkening and, at higher temperatures, mechanical degradation will
occur. Thus, the temperature in the extruder should be high enough to ensure the melting of the
polymer and low enough to avoid burning of the fiber [74]. Therefore, the use of twin screw
extruders has been preferred for the direct incorporation of short natural fibers and polymer matrix
as against a single screw extruder [115]. It allows the possibility of controlling the energy
introduction via screw configuration and processing conditions, in such a way that a lower process
temperature can be reliably ensured. The purpose of this equipment is to provide adequate
impregnation and homogenization of the polymer matrix and natural fibers mixture.
Li et al. [9] produced flax fiber reinforced high density polyethylene (HDPE) composites samples
using both the extrusion and injection molding machines. A mixture of the fiber and HDPE was
fed through a large hopper into the twin-screw extruder. The controlled extruder parameters were
the screw speed and temperature. The twin-screw was rotated to convey, melt, mix and pump the
material out, while the screw speed was maintained at 150 rpm. The extrusion barrel zone
temperature was set to different temperatures (90, 120. 130, 140, and 160ºC) for gradual melting
of the polymer in order to ensure uniform mixing with the fibers [48]. The extrudate (pellets)
taking the geometry of the die (i.e. six hole die with a diameter of 3 mm each) were produced,
which were further processed using the conventional molding techniques [130].
19
2.7.2 Compression Molding
In this molding process, pellets of the composite produced via an extruder are transferred into a
mold cavity, where a compressed plate taking the shape of the mold cavity is produced. In
operating the compression-molding machine both the upper, lower compression plates (platen) and
mold are preheated. Preheating the compression plates and mold reduces molding time and
pressure, and produces a more homogeneous finished piece [2]. Afterwards, the material is placed
in the mold and closed, after which heat, and pressure are applied to melt the material causing the
material to become viscous taking the shape of the mold geometry.
El-Shekeil et al. [23,131] studied the mechanical properties of kenaf fibers reinforced polyurethane
composite plates production via compression molding. The blend of intermediate materials was
placed into the mold, where heat and pressure were applied to form the composite plates. Prior to
full press, specimens were pre-heated for 7 min at 190°C. The contact with the hot mold plasticizes
the materials, which takes the form of the mold cavity with the aid of the applied pressure [132].
Hot pressing was then carried out at a temperature around 190°C for 10 min and the mixture was
cooled under pressure to room temperature.
2.7.3 Injection Molding
The injection molding is also an important molding technique used in composite molding.
Injection molding can manufacture geometrically complex components with accurate dimensions
[74]. It has high production cycle when the mold contains more than one cavity so that multiple
parts are produced per cycle [48]. The working operation of the injection molding machine is much
like the extrusion molding machine. It has a barrel that conveys the material from the hopper to
the die, while heating and mixing the material. A non-return valve is mounted near the tip of the
screw, which prevents the melted material from flowing backward along the screw threads. Aside
from the injection unit, the whole machine also has a clamping unit whose functions are to: hold
the two halves of the mold in proper alignment with one another; open and close the mold at the
appropriate time in the molding cycle; and keeping the mold closed during injection [48].
20
Ramadevi et al. [133] studied the mechanical properties of abaca fiber reinforced polypropylene
composite plates produced with the use of injection molding machine. A blend of mixture of the
ground fibers and polymer were dried up at 80oC for 24 h. The mixture was then poured into the
injection machine and molding was carried out at a temperature range of 150 – 180oC and a
pressure of 20 kN/mm2. The temperature of the mold was kept constant at 80oC for 24 h. Li et al.
[134] studied the effect of injection molding processing parameters on the mechanical properties
of flax fiber reinforced polyethylene composites. During injection molding, two set of temperature
range (168 – 188oC and 177 – 200oC) and pressure (4.8 and 6.9 MPa) were varied respectively
with different fiber weight composite. The highest tensile and flexural strength were found in the
30% weight fraction processed at low injection temperature (168 – 188oC) and pressure (4.8 MPa).
2.8 Characterization of Natural Fiber Reinforced Polymer Matrix Composites
The properties of natural fiber reinforced polymer matrix composites depend on those of the
individual components and their interfacial compatibility. Stress transfer and load distribution
efficiency at the interface is determined by the degree of adhesion between the components [93].
2.8.1 Water Absorption
Water absorption is a major challenge posed when NFs are used to reinforce polymer matrices. It
causes breakdown of the fiber-matrix interface resulting in swelling of the fibers, loss in the
efficiency of load transfer between the matrix and the fibers, and ultimately to reduction in strength
and stiffness of the composites [135]. The rate of water uptake by NFs reinforce polymer
composites depends on factors such as temperature, fiber volume fraction, fiber orientation, fiber
type, area of exposed surfaces, interfacial bonding, and porosity [136]. A general method following
ASTM D570-98 standard [137] has been used in determining the water absorption capacity of NFs
reinforced polymer composites. Water absorption measurement is used to shed light into which
material is responsible for water absorbed in the composite and its effects on the mechanical,
thermal, and dimensional properties of the composite [138,139]. It is therefore important that the
challenge posed by water absorption is addressed so that NFs may be considered as a viable
reinforcement in composite manufacture [140].
21
One way to reduce water absorption in NFs is using compatibilizers which enhance interfacial
adhesion between fibers and polymer matrices. Examples of compatibilizers used in composite
manufacturing are maleic anhydride grafted polypropylene (PP-g-MA), maleic anhydride grafted
SEBS (SEBS-g-MA), and maleated polypropylene (MAH-g-PP). The use of chemical treatment
on NFs has also been reported to reduce their water absorption capacity and to maintain the
integrity of the interface in case of exposure of the natural fiber reinforced polymer to water.
Arbelaiz et al. [10] investigated the use of maleic anhydride-polypropylene copolymer (MAPP) as
compatibilizer in the water absorption properties of flax fiber reinforced polypropylene
composites. They observed that the use of MAPP reduced the rate of water absorption in the
modified composites in comparison to composites without MAPP. They reported that reduction in
the rate of water absorption in composites modified using MAPP is due to the improved interfacial
adhesion. They observed that the rate of water absorption in the composites was linear for a period
until it attained saturation. Maya et al. [102] evaluated the water absorption characteristics of sisal
and oil palm composites treated with varying concentrations of sodium hydroxide (NaOH). They
reported that the composites containing fibers treated with 0.5% NaOH showed the highest water
uptake, while those treated with 4% NaOH samples exhibited the minimum water uptake. It was
observed that as the concentration of NaOH increases, the adhesion between the fiber and the
matrix increases, and the uptake of water decreases. They also observed that hydrophilic character
of NFs was responsible for water uptake in the composites, and as the volume percent of fibers
increase, there was a corresponding increase in the rate of water absorption [102]. They also
reported a two-stage water saturation level, which was due to prolonged exposure of the swollen
samples in water [102].
2.8.2 Thermal Properties
The fact that NFs are mixed with molten polymers during processing influences the final thermal
(melting temperature, crystallization temperature and thermal conductivity) properties of the
composites. The thermal properties (melting and crystallization temperature) of NFs reinforced
polymer composites was studied by several authors [9,106,119,141,142] with the aid of differential
scanning calorimetry (DSC) and/or thermogravimetric analysis (TGA). Li et al. [9,106]
investigated the addition of flax fiber on the melting temperature of high density polyethylene
(HDPE). The test was performed using a TG-DSC 111 machine from room temperature to 250oC
22
at a heating rate of 5oC/min. They reported the melting point of HDPE to be 139.3oC, which was
found to decrease with the addition of flax fibers. It was reported that the decrease in melting
temperature of the composites is because flax fiber requires low energy to be heated up in
comparison to HDPE. They also investigated the effect of fiber addition on the thermal
conductivity of HDPE [106]. The transient line source method at temperature of between 170 and
200oC was used. The thermal conductivity observed for HDPE was 0.4281 W/moC. It was reported
that with the addition of flax fibers and as the fiber content increased, there was a corresponding
decrease in the thermal conductivity of the composite. It was reported that the decrease in thermal
conductivity of the composites is due to a lower thermal conductivity of the flax fiber compared
to that of HDPE. Tajvidi and Takemura [141] studied the effect of kenaf fibers addition on the
thermal degradation of polypropylene (PP) using DSC from room temperature to 200oC at a
heating rate of 20oC/min. Approximately, 10 mg of the ground composite was heated in aluminum
pan, while an empty pan of the same material was used as the reference. They observed a slight
reduction and increase in the melting and crystallization temperatures, respectively. It was reported
that kenaf fibers acts as a nucleating agent, thereby increasing the crystallization temperature of
the composites.
2.8.3 Mechanical Properties
The mechanical properties of NF reinforced polymer matrix composites depend on a number of
factors such as volume fraction of the fibers, fiber–matrix adhesion, stress transfer at the interface,
and orientation of the fibers [100]. The tensile properties of PMCs depend on the interfacial
strength achieved between the fibers and polymer matrix since fibers have much higher strength
and stiffness values than those of the matrices [143]. El-Shekeil et al. [23] studied the influence of
kenaf fiber addition on the tensile and flexural properties of polyurethane thermoplastics according
to ASTM D-638 [144] and ASTM 790 [145] standards respectively. They reported that low fiber
loading resulted in low tensile strength. This was attributed to inefficient transfer of load from the
matrix to the fibers through the interface. Maximum strength of kenaf fiber reinforced
polyurethane composite (i.e. 33.5 MPa) was reached with 30 wt.% fiber loading. At high fiber
loading of 40 and 50 wt.% there was a decrease in the tensile strength of the composite, due to
high agglomeration and ineffective stress transfer. They reported an increase in the Young’s
modulus of the composites as the fiber content increased. They observed that as the fiber content
23
in the composite increase, there was a corresponding increase in both the flexural strength and
modulus. Li et al. [9] studied the influence of flax fiber addition on the mechanical properties of
high density polyethylene (HDPE). They reported that flax fiber reinforced HDPE containing 30
wt.% fiber gave the highest flexural strength and modulus, which are 51% and 128% respectively
over that of pure HDPE. The tensile strength of HDPE composite containing 5 wt.% fiber increased
by 1%, while a 17% increase in the strength was reported for HPDE composite containing 30 wt.%
fiber.
2.9 Application of Natural Fiber Reinforced Polymer Matrix Composites
The applications of natural fiber reinforced polymer matrix composites are growing rapidly in
many engineering fields. These composites find use in various industrial and structural
applications, such as aircraft, automotive, sporting goods, marine, infrastructure, electronics,
furniture and building construction industries as shown in Fig 2.2 [92,146].
Natural fiber reinforced polymer matrix composites are used in the production various parts of an
automobile [6]. The manufacturing process for making parts to be used in industrial applications
requires good finishes, which can be achieved with compression molding. Examples of
compression molded automotive parts using natural fiber reinforced polymer matrix composites
include, bumper covers, roof frames, door frames, door panels, engine valve covers, dash boards
and truck car mats [92].
2.10 Summary
The literature review shows that the use of NFs as a potential substitute to synthetic fibers in
reinforcing polymer matrices has increased in recent years due to environmental concerns. This
chapter reviewed the chemical, physical, mechanical and thermal properties of NFs as well as the
composites. Among the reviews on NFs, there were missing comprehensive study on the chemical
composition, spatial distribution and concentration of the chemical compositions, water absorption
behaviour and thermal properties of raffia palm fibers. Also, there are no comprehensive studies
on the effect of chemical treatments and varying fiber contents on the physical, mechanical and
thermal properties of raffia palm fiber reinforced HDPE composites using extrusion and
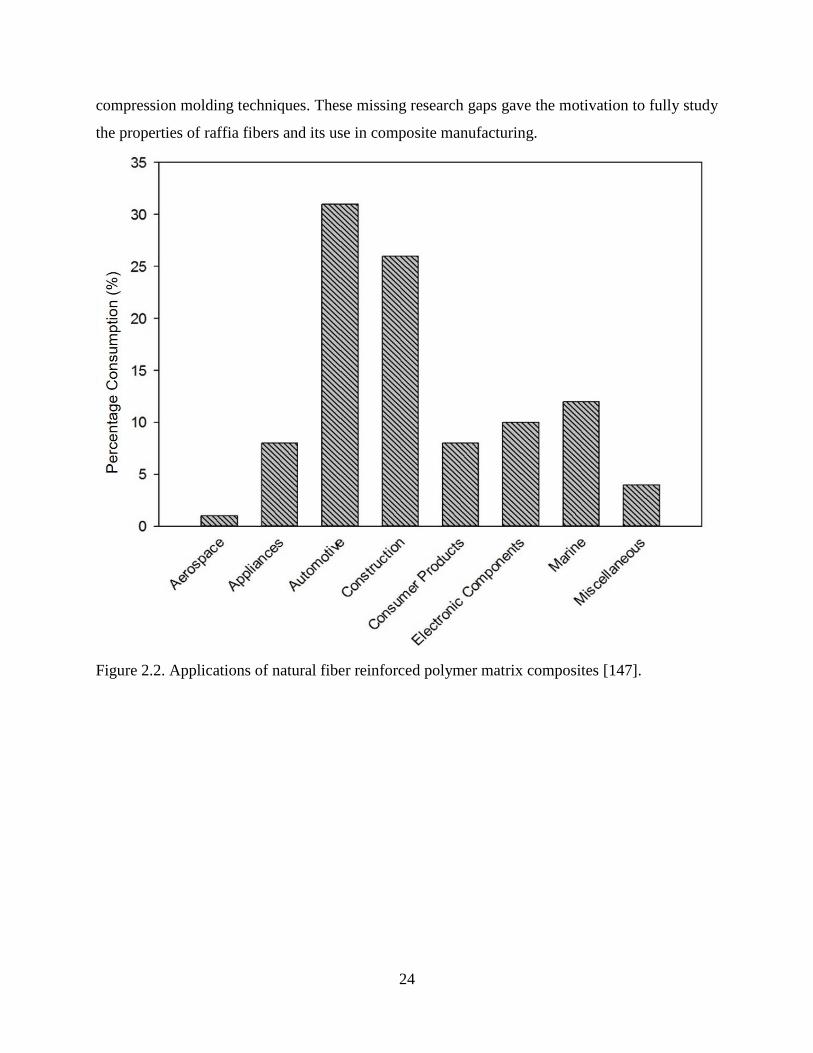
24
compression molding techniques. These missing research gaps gave the motivation to fully study
the properties of raffia fibers and its use in composite manufacturing.
Figure 2.2. Applications of natural fiber reinforced polymer matrix composites [147].

25
CHAPTER 3
MATERIALS AND EXPERIMENTAL METHODS
This chapter presents and discusses the experimental materials used and procedures followed to
achieve the objectives of this research mention in Section 1.2 of Chapter 1.
3.1 Materials
The raw raffia palm fibers (RPFs) used in this study were obtained from southern Nigeria. For ease
of processing and characterization, the remnant binders were manually removed, and the resulting
raw fibers were subsequently cleaned in 2% detergent to remove oily substances and other
impurities on the fiber surface. After cleaning, the fibers were dried in an oven at 70ºC for 24 h
and subsequently air-cooled to room temperature. Figure 3.1 shows the images of raffia palm fibers
before and after cleaning.
Figure 3.1. Photographs of raffia palm fiber (a) before cleaning and (b) after washing and drying.
The diameter of the cleaned RPFs was determined using a micrometer screw gauge. Twenty-eight
fibers were chosen at random and diameter measurements were taken at ten locations along the
fiber length. The average diameter obtained was 1.53 ± 0.29 mm. Figure 3.2 shows the flow chart
for raffia palm fiber processing, treatment and characterization.
The high-density polyethylene (HDPE) used as the matrix for this study was supplied in powder
form by Nova Chemicals Corporation, Calgary, AB. HDPE was selected as the matrix material
due to its low melting point, availability, low cost, and ease of processing at temperature below
the degradation temperature of natural fibers.
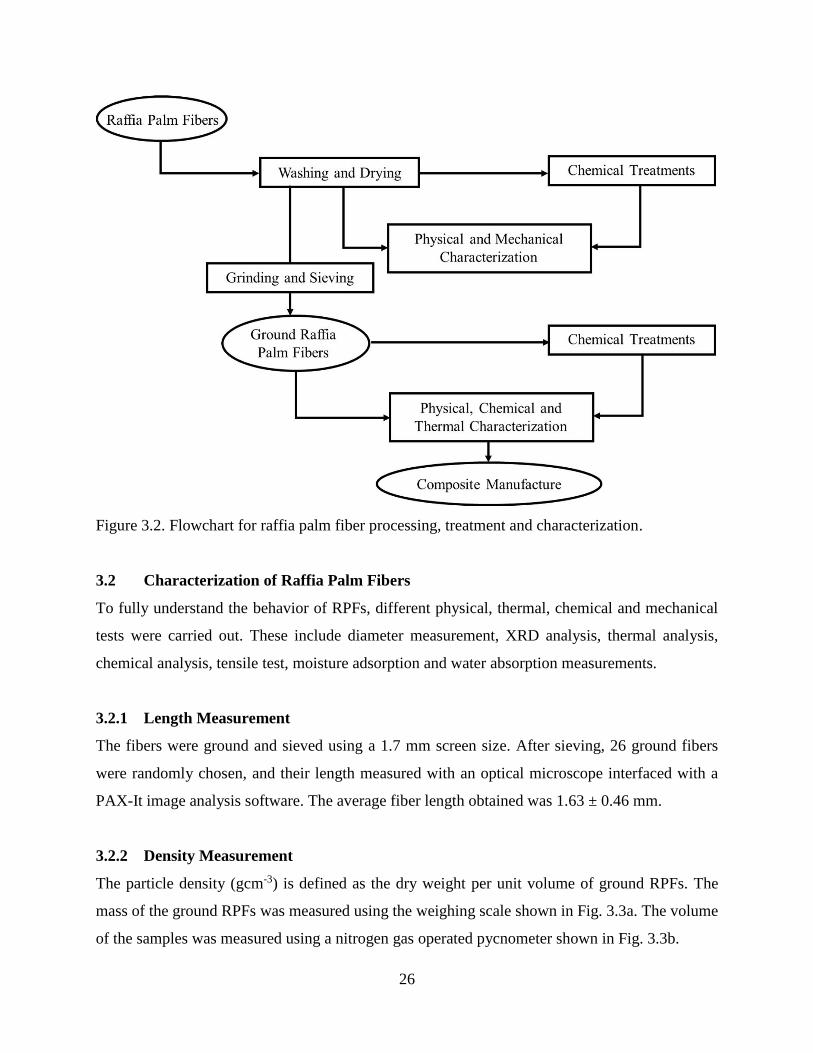
26
Figure 3.2. Flowchart for raffia palm fiber processing, treatment and characterization.
3.2 Characterization of Raffia Palm Fibers
To fully understand the behavior of RPFs, different physical, thermal, chemical and mechanical
tests were carried out. These include diameter measurement, XRD analysis, thermal analysis,
chemical analysis, tensile test, moisture adsorption and water absorption measurements.
3.2.1 Length Measurement
The fibers were ground and sieved using a 1.7 mm screen size. After sieving, 26 ground fibers
were randomly chosen, and their length measured with an optical microscope interfaced with a
PAX-It image analysis software. The average fiber length obtained was 1.63 ± 0.46 mm.
3.2.2 Density Measurement
The particle density (gcm-3) is defined as the dry weight per unit volume of ground RPFs. The
mass of the ground RPFs was measured using the weighing scale shown in Fig. 3.3a. The volume
of the samples was measured using a nitrogen gas operated pycnometer shown in Fig. 3.3b.
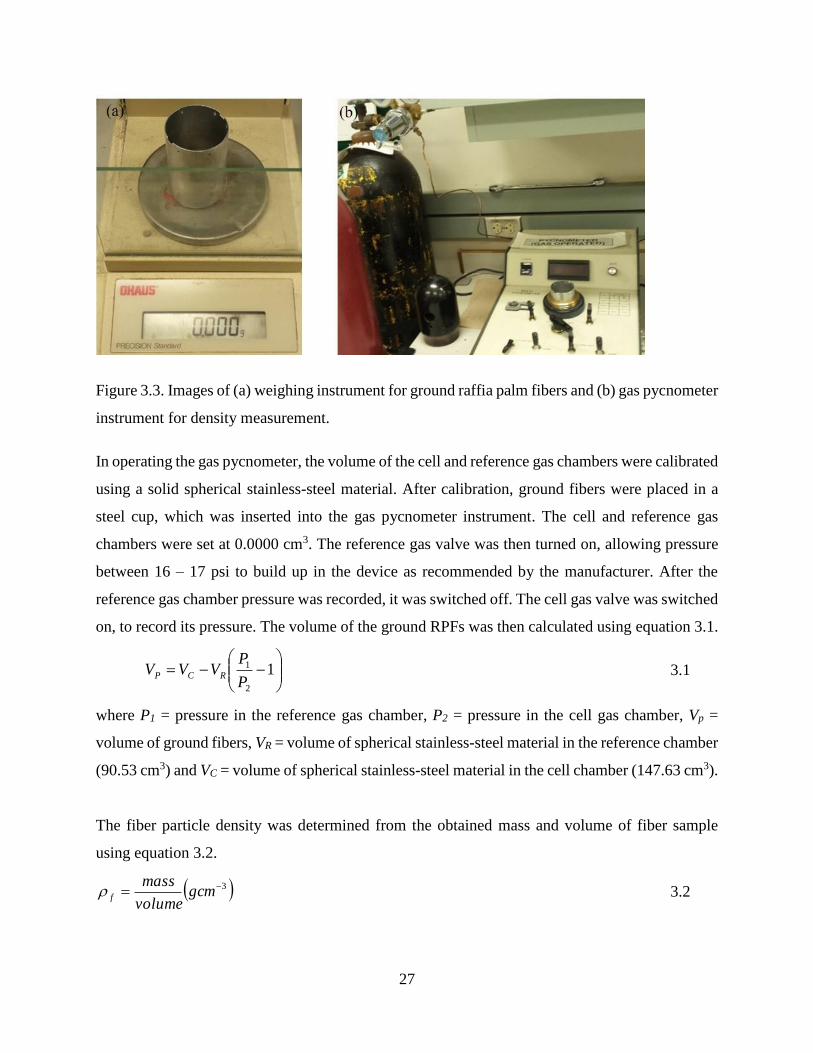
27
Figure 3.3. Images of (a) weighing instrument for ground raffia palm fibers and (b) gas pycnometer
instrument for density measurement.
In operating the gas pycnometer, the volume of the cell and reference gas chambers were calibrated
using a solid spherical stainless-steel material. After calibration, ground fibers were placed in a
steel cup, which was inserted into the gas pycnometer instrument. The cell and reference gas
chambers were set at 0.0000 cm3. The reference gas valve was then turned on, allowing pressure
between 16 – 17 psi to build up in the device as recommended by the manufacturer. After the
reference gas chamber pressure was recorded, it was switched off. The cell gas valve was switched
on, to record its pressure. The volume of the ground RPFs was then calculated using equation 3.1.
1
2
1
P
PVVV RCP 3.1
where P1 = pressure in the reference gas chamber, P2 = pressure in the cell gas chamber, Vp =
volume of ground fibers, VR = volume of spherical stainless-steel material in the reference chamber
(90.53 cm3) and VC = volume of spherical stainless-steel material in the cell chamber (147.63 cm3).
The fiber particle density was determined from the obtained mass and volume of fiber sample
using equation 3.2.
3 gcmvolume
massf 3.2
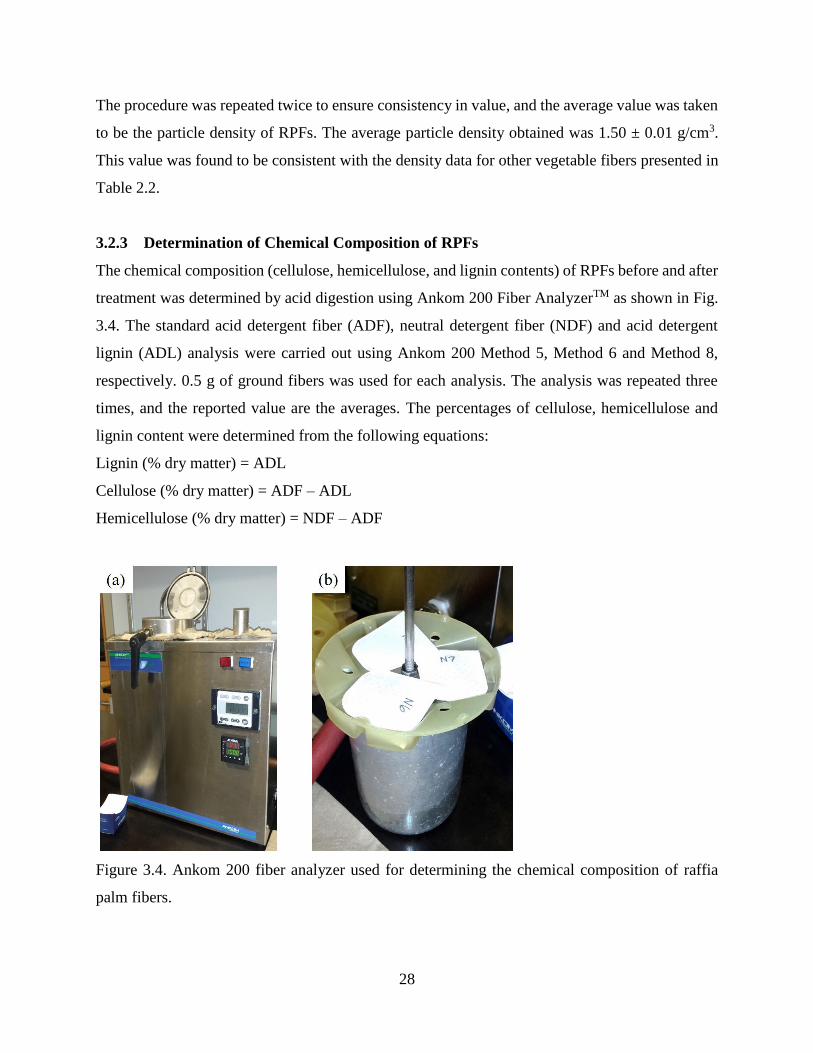
28
The procedure was repeated twice to ensure consistency in value, and the average value was taken
to be the particle density of RPFs. The average particle density obtained was 1.50 ± 0.01 g/cm3.
This value was found to be consistent with the density data for other vegetable fibers presented in
Table 2.2.
3.2.3 Determination of Chemical Composition of RPFs
The chemical composition (cellulose, hemicellulose, and lignin contents) of RPFs before and after
treatment was determined by acid digestion using Ankom 200 Fiber AnalyzerTM as shown in Fig.
3.4. The standard acid detergent fiber (ADF), neutral detergent fiber (NDF) and acid detergent
lignin (ADL) analysis were carried out using Ankom 200 Method 5, Method 6 and Method 8,
respectively. 0.5 g of ground fibers was used for each analysis. The analysis was repeated three
times, and the reported value are the averages. The percentages of cellulose, hemicellulose and
lignin content were determined from the following equations:
Lignin (% dry matter) = ADL
Cellulose (% dry matter) = ADF – ADL
Hemicellulose (% dry matter) = NDF – ADF
Figure 3.4. Ankom 200 fiber analyzer used for determining the chemical composition of raffia
palm fibers.
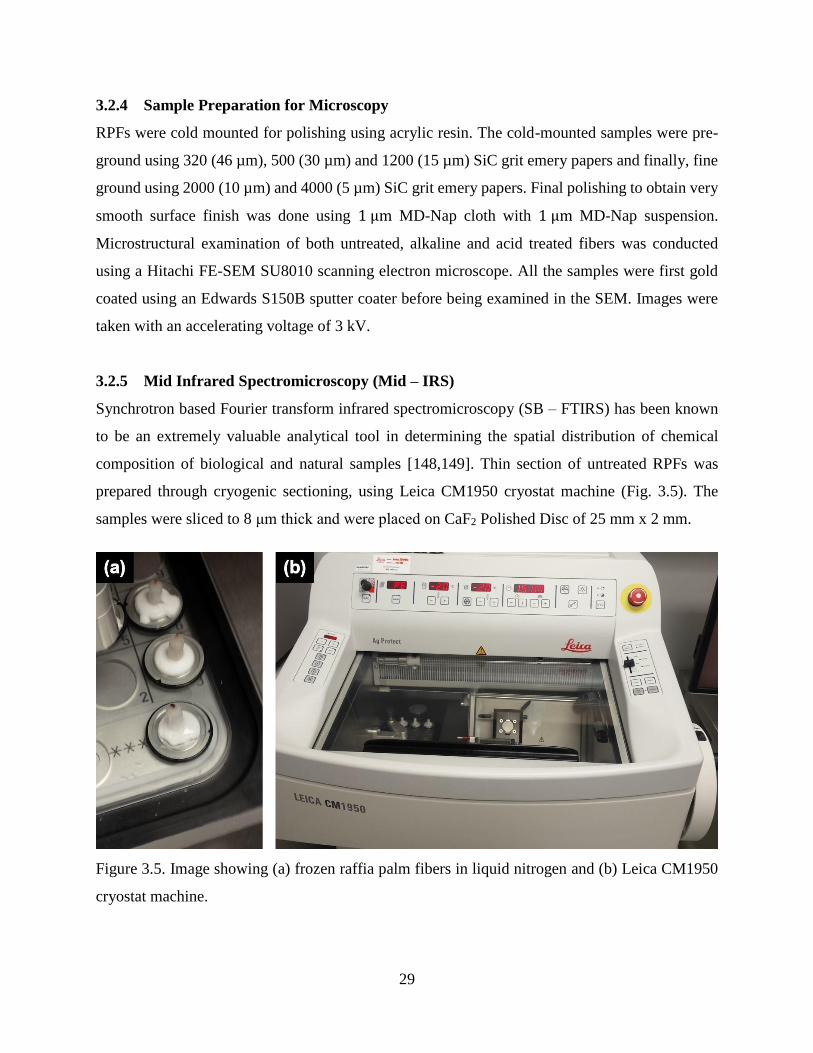
29
3.2.4 Sample Preparation for Microscopy
RPFs were cold mounted for polishing using acrylic resin. The cold-mounted samples were pre-
ground using 320 (46 µm), 500 (30 µm) and 1200 (15 µm) SiC grit emery papers and finally, fine
ground using 2000 (10 µm) and 4000 (5 µm) SiC grit emery papers. Final polishing to obtain very
smooth surface finish was done using 1 μm MD-Nap cloth with 1 μm MD-Nap suspension.
Microstructural examination of both untreated, alkaline and acid treated fibers was conducted
using a Hitachi FE-SEM SU8010 scanning electron microscope. All the samples were first gold
coated using an Edwards S150B sputter coater before being examined in the SEM. Images were
taken with an accelerating voltage of 3 kV.
3.2.5 Mid Infrared Spectromicroscopy (Mid – IRS)
Synchrotron based Fourier transform infrared spectromicroscopy (SB – FTIRS) has been known
to be an extremely valuable analytical tool in determining the spatial distribution of chemical
composition of biological and natural samples [148,149]. Thin section of untreated RPFs was
prepared through cryogenic sectioning, using Leica CM1950 cryostat machine (Fig. 3.5). The
samples were sliced to 8 μm thick and were placed on CaF2 Polished Disc of 25 mm x 2 mm.
Figure 3.5. Image showing (a) frozen raffia palm fibers in liquid nitrogen and (b) Leica CM1950
cryostat machine.

30
Images were collected using the Bruker Vertex 70v Interferometer Hyperion 3000 IR Microscope
(Fig. 3.6). The synchrotron radiation Fourier transform infrared spectroscopic technique was used
with the microscope, equipped with a focal plane array (FPA) detector at the mid-Infrared
beamline (01B1-1), Canadian Light Source Saskatoon.
Figure 3.6. Bruker Vertex 70v Interferometer / Hyperion 3000 IR Microscope.
A tile of 170 X 170 μm step size having 4,096 data points was mapped in both the x and y directions
of the fiber. A complete IR spectrum was collected at each spot (400-4000 cm-1) with a resolution
of 4 cm-1 in transmission mode. For the background spectrum, 128 scans were collected and
averaged. At each sampling point, 256 scans were collected and averaged. The data collected were
analyzed using OPUS software (Bruker, Version 7.0).
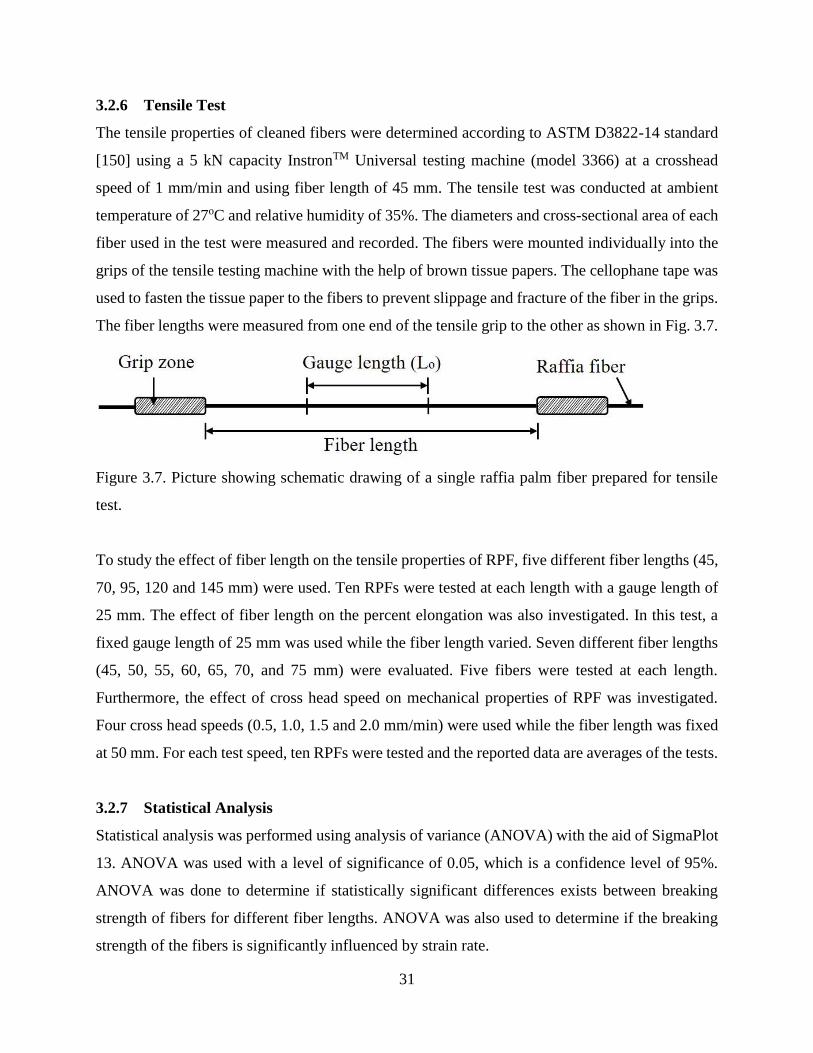
31
3.2.6 Tensile Test
The tensile properties of cleaned fibers were determined according to ASTM D3822-14 standard
[150] using a 5 kN capacity InstronTM Universal testing machine (model 3366) at a crosshead
speed of 1 mm/min and using fiber length of 45 mm. The tensile test was conducted at ambient
temperature of 27oC and relative humidity of 35%. The diameters and cross-sectional area of each
fiber used in the test were measured and recorded. The fibers were mounted individually into the
grips of the tensile testing machine with the help of brown tissue papers. The cellophane tape was
used to fasten the tissue paper to the fibers to prevent slippage and fracture of the fiber in the grips.
The fiber lengths were measured from one end of the tensile grip to the other as shown in Fig. 3.7.
Figure 3.7. Picture showing schematic drawing of a single raffia palm fiber prepared for tensile
test.
To study the effect of fiber length on the tensile properties of RPF, five different fiber lengths (45,
70, 95, 120 and 145 mm) were used. Ten RPFs were tested at each length with a gauge length of
25 mm. The effect of fiber length on the percent elongation was also investigated. In this test, a
fixed gauge length of 25 mm was used while the fiber length varied. Seven different fiber lengths
(45, 50, 55, 60, 65, 70, and 75 mm) were evaluated. Five fibers were tested at each length.
Furthermore, the effect of cross head speed on mechanical properties of RPF was investigated.
Four cross head speeds (0.5, 1.0, 1.5 and 2.0 mm/min) were used while the fiber length was fixed
at 50 mm. For each test speed, ten RPFs were tested and the reported data are averages of the tests.
3.2.7 Statistical Analysis
Statistical analysis was performed using analysis of variance (ANOVA) with the aid of SigmaPlot
13. ANOVA was used with a level of significance of 0.05, which is a confidence level of 95%.
ANOVA was done to determine if statistically significant differences exists between breaking
strength of fibers for different fiber lengths. ANOVA was also used to determine if the breaking
strength of the fibers is significantly influenced by strain rate.
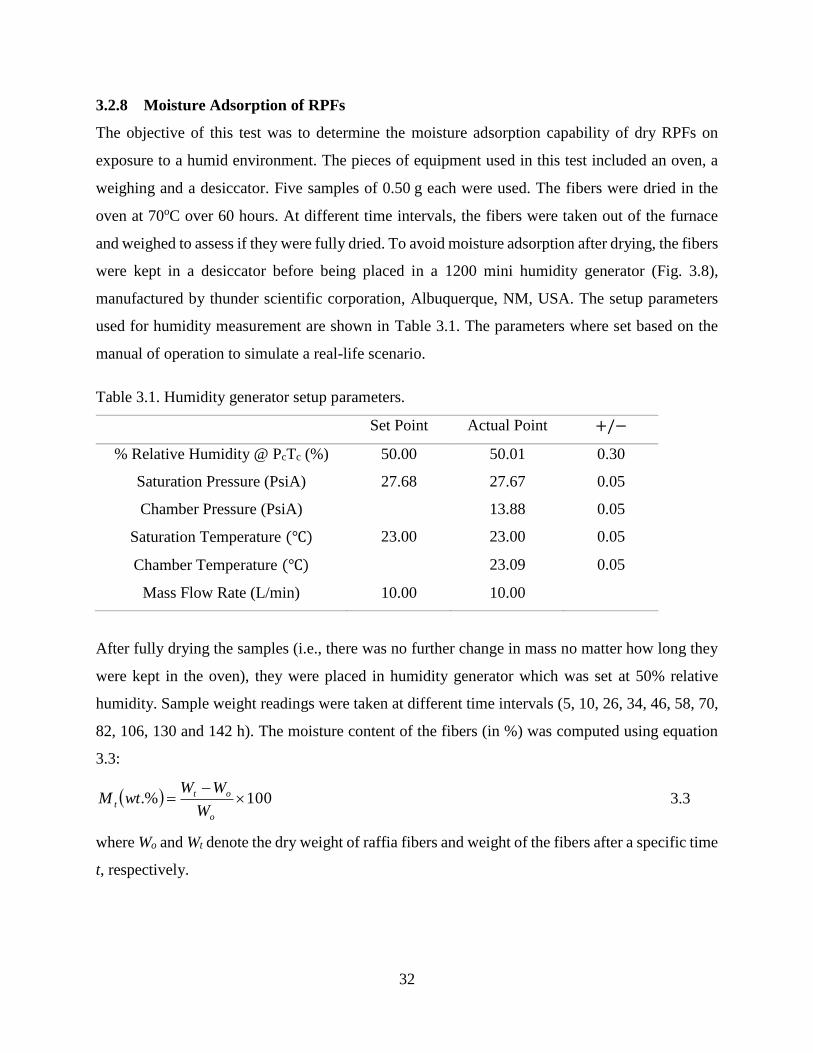
32
3.2.8 Moisture Adsorption of RPFs
The objective of this test was to determine the moisture adsorption capability of dry RPFs on
exposure to a humid environment. The pieces of equipment used in this test included an oven, a
weighing and a desiccator. Five samples of 0.50 g each were used. The fibers were dried in the
oven at 70oC over 60 hours. At different time intervals, the fibers were taken out of the furnace
and weighed to assess if they were fully dried. To avoid moisture adsorption after drying, the fibers
were kept in a desiccator before being placed in a 1200 mini humidity generator (Fig. 3.8),
manufactured by thunder scientific corporation, Albuquerque, NM, USA. The setup parameters
used for humidity measurement are shown in Table 3.1. The parameters where set based on the
manual of operation to simulate a real-life scenario.
Table 3.1. Humidity generator setup parameters.
Set Point Actual Point +/−
% Relative Humidity @ PcTc (%) 50.00 50.01 0.30
Saturation Pressure (PsiA) 27.68 27.67 0.05
Chamber Pressure (PsiA) 13.88 0.05
Saturation Temperature (℃) 23.00 23.00 0.05
Chamber Temperature (℃) 23.09 0.05
Mass Flow Rate (L/min) 10.00 10.00
After fully drying the samples (i.e., there was no further change in mass no matter how long they
were kept in the oven), they were placed in humidity generator which was set at 50% relative
humidity. Sample weight readings were taken at different time intervals (5, 10, 26, 34, 46, 58, 70,
82, 106, 130 and 142 h). The moisture content of the fibers (in %) was computed using equation
3.3:
100.%
o
ot
tW
WWwtM 3.3
where Wo and Wt denote the dry weight of raffia fibers and weight of the fibers after a specific time
t, respectively.
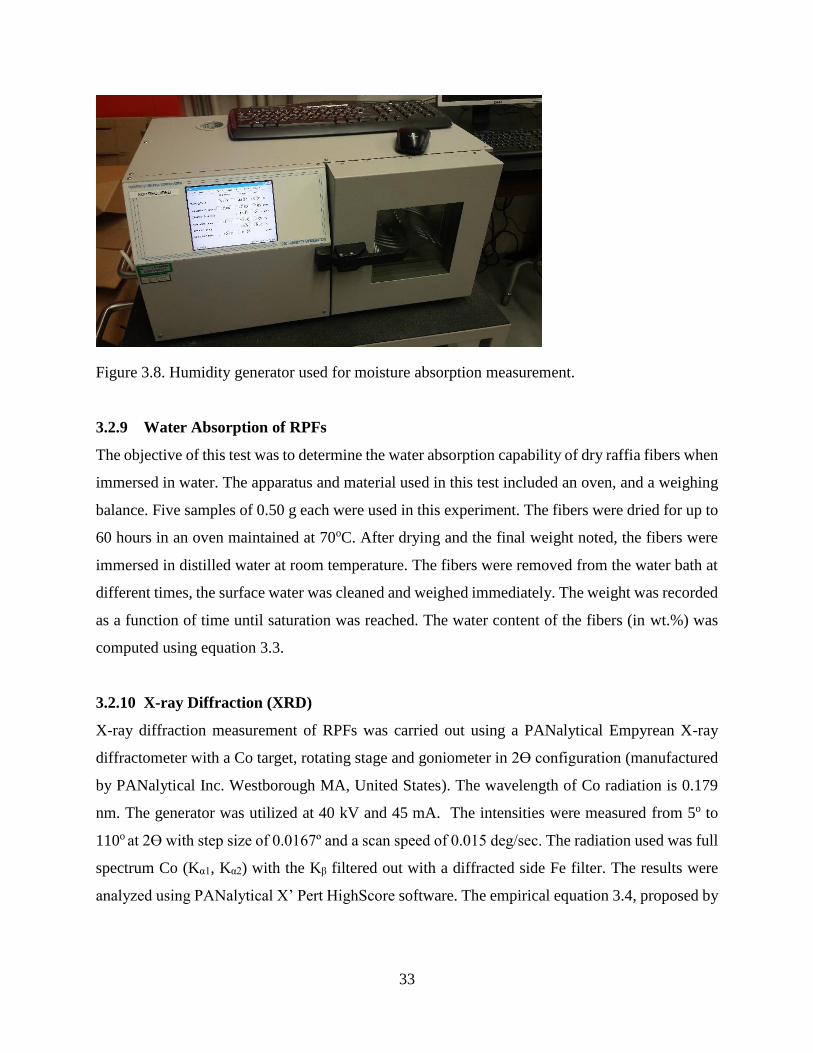
33
Figure 3.8. Humidity generator used for moisture absorption measurement.
3.2.9 Water Absorption of RPFs
The objective of this test was to determine the water absorption capability of dry raffia fibers when
immersed in water. The apparatus and material used in this test included an oven, and a weighing
balance. Five samples of 0.50 g each were used in this experiment. The fibers were dried for up to
60 hours in an oven maintained at 70oC. After drying and the final weight noted, the fibers were
immersed in distilled water at room temperature. The fibers were removed from the water bath at
different times, the surface water was cleaned and weighed immediately. The weight was recorded
as a function of time until saturation was reached. The water content of the fibers (in wt.%) was
computed using equation 3.3.
3.2.10 X-ray Diffraction (XRD)
X-ray diffraction measurement of RPFs was carried out using a PANalytical Empyrean X-ray
diffractometer with a Co target, rotating stage and goniometer in 2ϴ configuration (manufactured
by PANalytical Inc. Westborough MA, United States). The wavelength of Co radiation is 0.179
nm. The generator was utilized at 40 kV and 45 mA. The intensities were measured from 5o to
110o at 2ϴ with step size of 0.0167º and a scan speed of 0.015 deg/sec. The radiation used was full
spectrum Co (Kα1, Kα2) with the Kβ filtered out with a diffracted side Fe filter. The results were
analyzed using PANalytical X’ Pert HighScore software. The empirical equation 3.4, proposed by
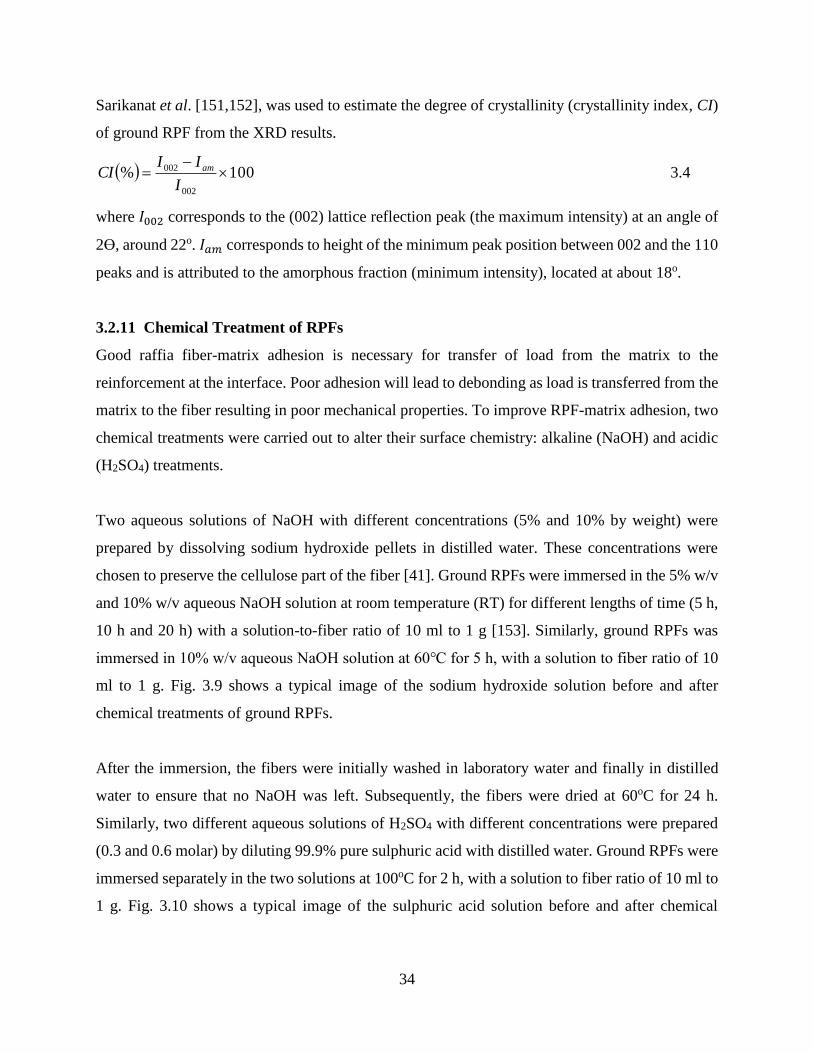
34
Sarikanat et al. [151,152], was used to estimate the degree of crystallinity (crystallinity index, CI)
of ground RPF from the XRD results.
100%002
002
I
IICI am 3.4
where 𝐼002 corresponds to the (002) lattice reflection peak (the maximum intensity) at an angle of
2ϴ, around 22o. 𝐼𝑎𝑚 corresponds to height of the minimum peak position between 002 and the 110
peaks and is attributed to the amorphous fraction (minimum intensity), located at about 18o.
3.2.11 Chemical Treatment of RPFs
Good raffia fiber-matrix adhesion is necessary for transfer of load from the matrix to the
reinforcement at the interface. Poor adhesion will lead to debonding as load is transferred from the
matrix to the fiber resulting in poor mechanical properties. To improve RPF-matrix adhesion, two
chemical treatments were carried out to alter their surface chemistry: alkaline (NaOH) and acidic
(H2SO4) treatments.
Two aqueous solutions of NaOH with different concentrations (5% and 10% by weight) were
prepared by dissolving sodium hydroxide pellets in distilled water. These concentrations were
chosen to preserve the cellulose part of the fiber [41]. Ground RPFs were immersed in the 5% w/v
and 10% w/v aqueous NaOH solution at room temperature (RT) for different lengths of time (5 h,
10 h and 20 h) with a solution-to-fiber ratio of 10 ml to 1 g [153]. Similarly, ground RPFs was
immersed in 10% w/v aqueous NaOH solution at 60℃ for 5 h, with a solution to fiber ratio of 10
ml to 1 g. Fig. 3.9 shows a typical image of the sodium hydroxide solution before and after
chemical treatments of ground RPFs.
After the immersion, the fibers were initially washed in laboratory water and finally in distilled
water to ensure that no NaOH was left. Subsequently, the fibers were dried at 60oC for 24 h.
Similarly, two different aqueous solutions of H2SO4 with different concentrations were prepared
(0.3 and 0.6 molar) by diluting 99.9% pure sulphuric acid with distilled water. Ground RPFs were
immersed separately in the two solutions at 100oC for 2 h, with a solution to fiber ratio of 10 ml to
1 g. Fig. 3.10 shows a typical image of the sulphuric acid solution before and after chemical

35
treatments of ground RPFs. After the immersion, the fibers were washed in laboratory water and
then in distilled water. Subsequently, they were dried at 60oC for 24 h.
Figure 3.9. Images of sodium hydroxide solution (a) before treatment and (b) after treatment.
Figure 3.10. Images of sulfuric acid solution (a) before treatment and (b) after treatment.
3.2.12 Colour Measurement
A physical change accompanying the chemical treatments of RPFs is the colour. Therefore, after
alkaline and acidic treatments of RPFs, colour measurements were carried out to ascertain the
variation in colour between non-treated and treated RPFs. A HunterLabTM spectrocolorimeter (Fig.
3.11) with a port size of 30 mm in diameter was used for the measurement. Approximately 2 g of
36
fibers was used to determine the Hunter 𝐿∗, a∗, and 𝑏∗coordinates. The value of L∗ coordinate
represents the whiteness component (0 = black, and 100 = white); the a* coordinate represents
greenness to redness (−a∗ = green, and +a∗ = red); and b∗ coordinate represents blueness to
yellowness (−b∗ = blue, and +b∗ = yellow).
Figure 3.11. HunterLab spectrocolorimeter used for colour measurements.
Thus, an increase in L∗, a∗, and b∗ denotes more white, red and yellow colours, respectively. The
variation of colour (∆E) was estimated in comparison to the raw fiber using equation 3.5 [48].
5.0222 bbaaLLE ttt 3.5
where the coordinates with subscript t are for treated RPFs, while those without subscripts are for
untreated RPFs. The whiteness (L∗) and chromacity coordinates (a∗ and b∗) for each sample were
measured in 10 replicates and the average values of the results are presented.
3.2.13 Differential Scanning Calorimetry (DSC)
Thermal analysis of NFs yield information about their thermal stability [63]. Thermal analysis
study was carried out using a 2910 V4.4E (TA instruments, USA) modulated differential scanning
calorimeter (MDSC). Each scan was performed in an open aluminum pan under argon gas from
room temperature to 390oC at a heating rate of 5 ºC/min. Approximately 10 mg of ground RPFs
was used.
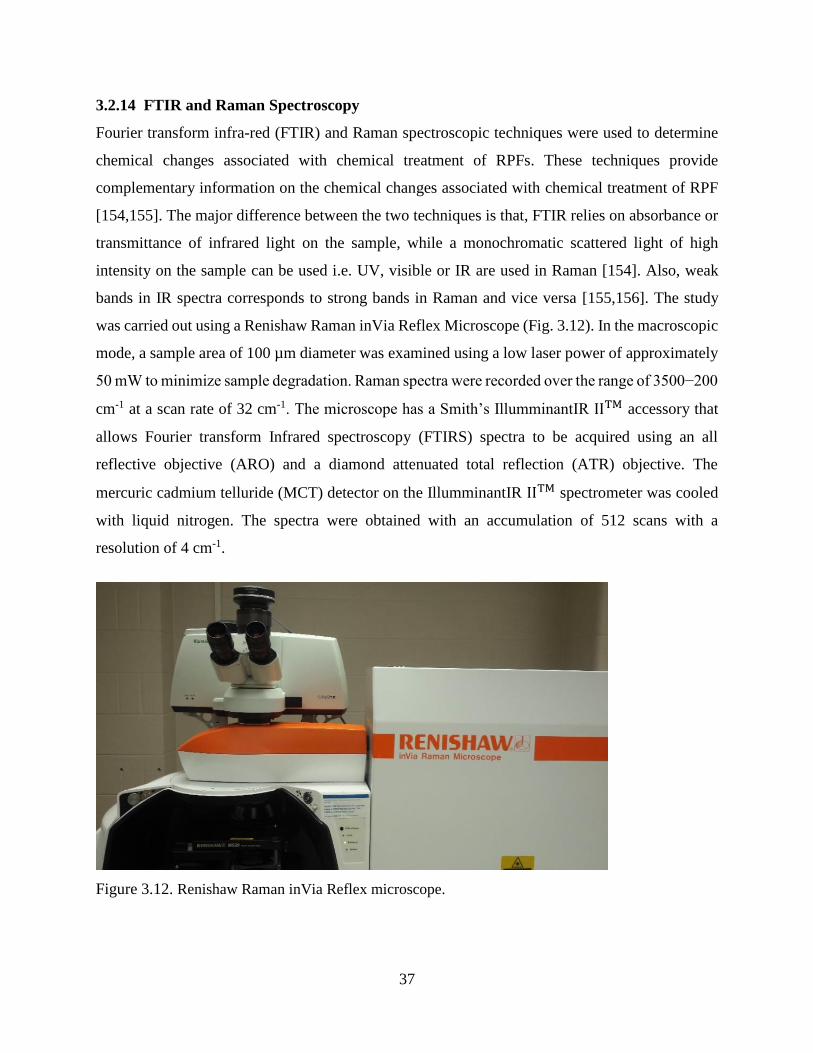
37
3.2.14 FTIR and Raman Spectroscopy
Fourier transform infra-red (FTIR) and Raman spectroscopic techniques were used to determine
chemical changes associated with chemical treatment of RPFs. These techniques provide
complementary information on the chemical changes associated with chemical treatment of RPF
[154,155]. The major difference between the two techniques is that, FTIR relies on absorbance or
transmittance of infrared light on the sample, while a monochromatic scattered light of high
intensity on the sample can be used i.e. UV, visible or IR are used in Raman [154]. Also, weak
bands in IR spectra corresponds to strong bands in Raman and vice versa [155,156]. The study
was carried out using a Renishaw Raman inVia Reflex Microscope (Fig. 3.12). In the macroscopic
mode, a sample area of 100 µm diameter was examined using a low laser power of approximately
50 mW to minimize sample degradation. Raman spectra were recorded over the range of 3500−200
cm-1 at a scan rate of 32 cm-1. The microscope has a Smith’s IllumminantIR IITM accessory that
allows Fourier transform Infrared spectroscopy (FTIRS) spectra to be acquired using an all
reflective objective (ARO) and a diamond attenuated total reflection (ATR) objective. The
mercuric cadmium telluride (MCT) detector on the IllumminantIR IITM spectrometer was cooled
with liquid nitrogen. The spectra were obtained with an accumulation of 512 scans with a
resolution of 4 cm-1.
Figure 3.12. Renishaw Raman inVia Reflex microscope.

38
3.3 Manufacture of Raffia Palm Fiber Reinforced High Density Polyethylene Composites
Figure 3.13 shows the flow chart for raffia palm fibers reinforced high density polyethylene
processing and characterization. Prior to use in composites manufacture, the fibers were dried at
60oC for 24 h to eliminate moisture. After drying, 5%, 10%, 20%, and 30% by mass of untreated,
alkaline and acidic treated RPFs were mixed with HDPE. Figure 3.14 illustrates the processing
chart used.
Figure 3.13. Flowchart for raffia palm fiber reinforced high density polyethylene composite
processing and characterization.
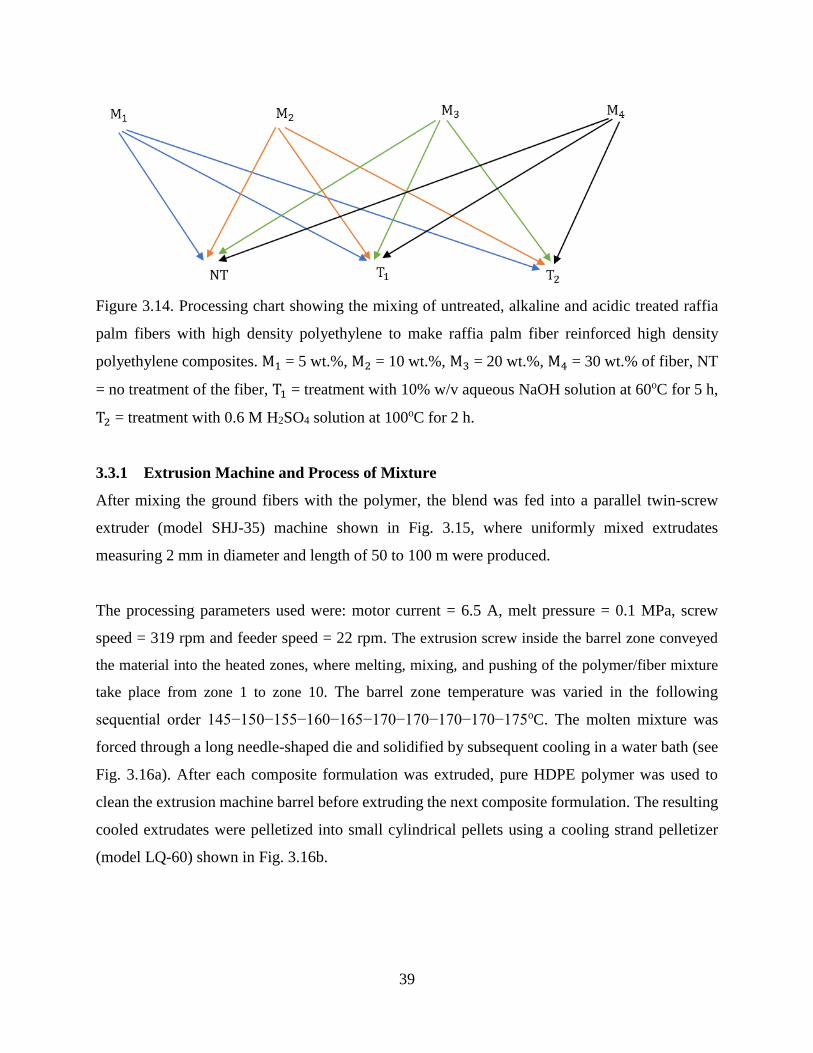
39
Figure 3.14. Processing chart showing the mixing of untreated, alkaline and acidic treated raffia
palm fibers with high density polyethylene to make raffia palm fiber reinforced high density
polyethylene composites. M1 = 5 wt.%, M2 = 10 wt.%, M3 = 20 wt.%, M4 = 30 wt.% of fiber, NT
= no treatment of the fiber, T1 = treatment with 10% w/v aqueous NaOH solution at 60oC for 5 h,
T2 = treatment with 0.6 M H2SO4 solution at 100oC for 2 h.
3.3.1 Extrusion Machine and Process of Mixture
After mixing the ground fibers with the polymer, the blend was fed into a parallel twin-screw
extruder (model SHJ-35) machine shown in Fig. 3.15, where uniformly mixed extrudates
measuring 2 mm in diameter and length of 50 to 100 m were produced.
The processing parameters used were: motor current = 6.5 A, melt pressure = 0.1 MPa, screw
speed = 319 rpm and feeder speed = 22 rpm. The extrusion screw inside the barrel zone conveyed
the material into the heated zones, where melting, mixing, and pushing of the polymer/fiber mixture
take place from zone 1 to zone 10. The barrel zone temperature was varied in the following
sequential order 145−150−155−160−165−170−170−170−170−175oC. The molten mixture was
forced through a long needle-shaped die and solidified by subsequent cooling in a water bath (see
Fig. 3.16a). After each composite formulation was extruded, pure HDPE polymer was used to
clean the extrusion machine barrel before extruding the next composite formulation. The resulting
cooled extrudates were pelletized into small cylindrical pellets using a cooling strand pelletizer
(model LQ-60) shown in Fig. 3.16b.
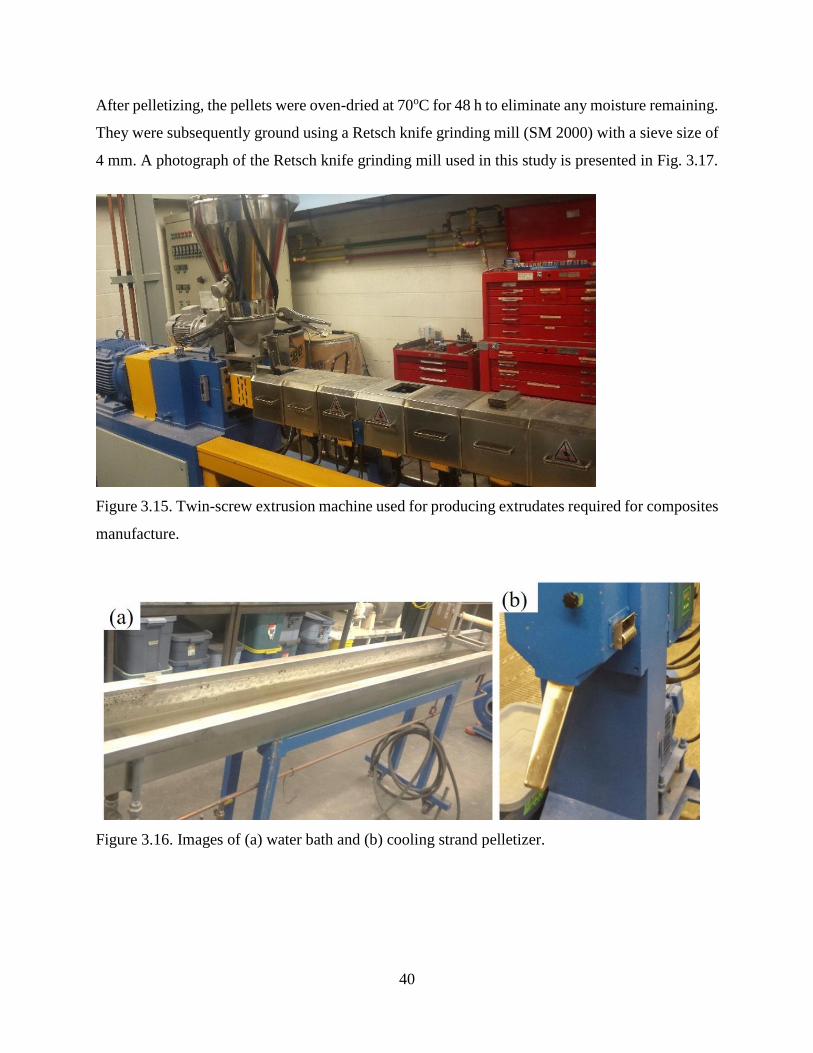
40
After pelletizing, the pellets were oven-dried at 70oC for 48 h to eliminate any moisture remaining.
They were subsequently ground using a Retsch knife grinding mill (SM 2000) with a sieve size of
4 mm. A photograph of the Retsch knife grinding mill used in this study is presented in Fig. 3.17.
Figure 3.15. Twin-screw extrusion machine used for producing extrudates required for composites
manufacture.
Figure 3.16. Images of (a) water bath and (b) cooling strand pelletizer.
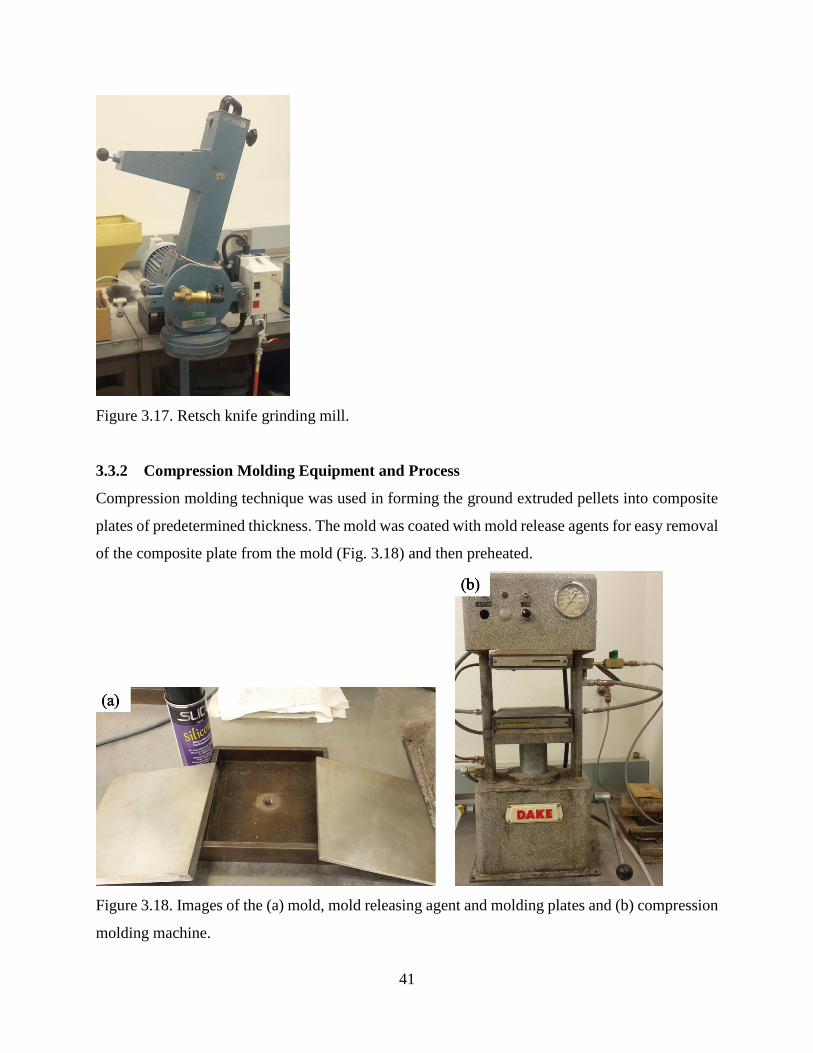
41
Figure 3.17. Retsch knife grinding mill.
3.3.2 Compression Molding Equipment and Process
Compression molding technique was used in forming the ground extruded pellets into composite
plates of predetermined thickness. The mold was coated with mold release agents for easy removal
of the composite plate from the mold (Fig. 3.18) and then preheated.
Figure 3.18. Images of the (a) mold, mold releasing agent and molding plates and (b) compression
molding machine.
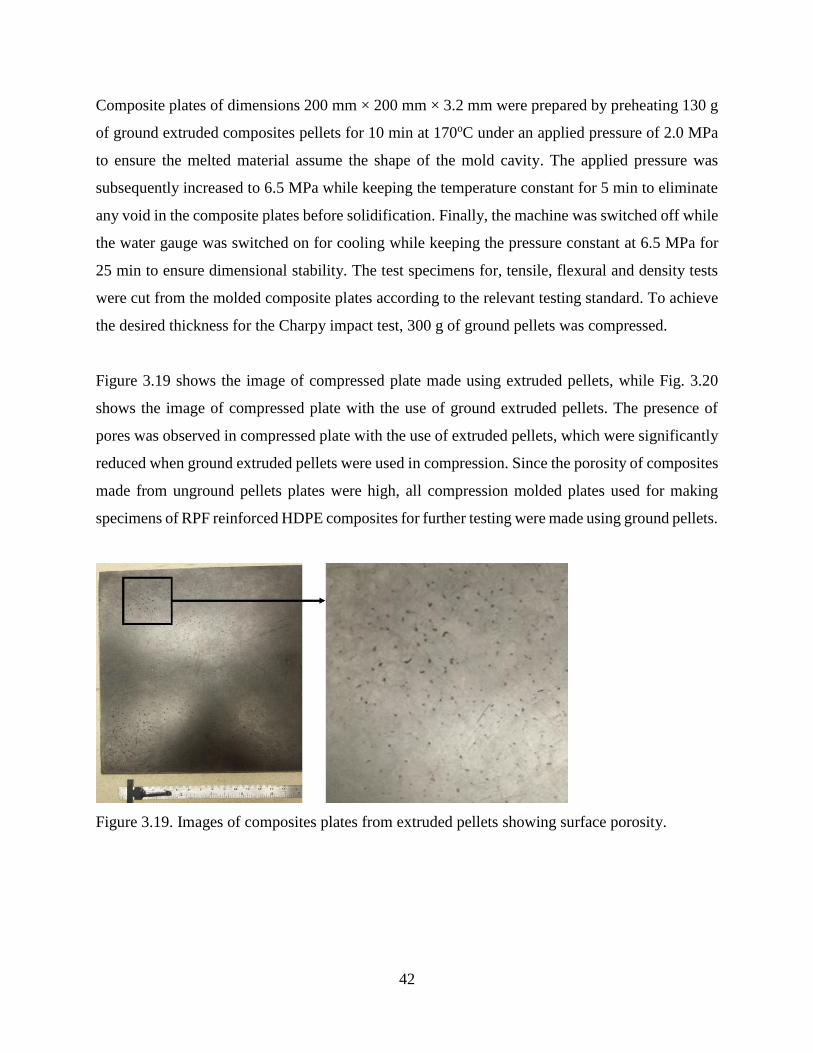
42
Composite plates of dimensions 200 mm × 200 mm × 3.2 mm were prepared by preheating 130 g
of ground extruded composites pellets for 10 min at 170oC under an applied pressure of 2.0 MPa
to ensure the melted material assume the shape of the mold cavity. The applied pressure was
subsequently increased to 6.5 MPa while keeping the temperature constant for 5 min to eliminate
any void in the composite plates before solidification. Finally, the machine was switched off while
the water gauge was switched on for cooling while keeping the pressure constant at 6.5 MPa for
25 min to ensure dimensional stability. The test specimens for, tensile, flexural and density tests
were cut from the molded composite plates according to the relevant testing standard. To achieve
the desired thickness for the Charpy impact test, 300 g of ground pellets was compressed.
Figure 3.19 shows the image of compressed plate made using extruded pellets, while Fig. 3.20
shows the image of compressed plate with the use of ground extruded pellets. The presence of
pores was observed in compressed plate with the use of extruded pellets, which were significantly
reduced when ground extruded pellets were used in compression. Since the porosity of composites
made from unground pellets plates were high, all compression molded plates used for making
specimens of RPF reinforced HDPE composites for further testing were made using ground pellets.
Figure 3.19. Images of composites plates from extruded pellets showing surface porosity.

43
Figure 3.20. Images of composites plates from ground extruded pellets (no surface porosity).
3.4 Characterization of RPF Reinforced HDPE Composites
The mechanical and physical properties of the RPFs reinforced HDPE matrix composites
developed in this study were determined by conducting several tests. Microstructure of fractured
surfaces of specimens after mechanical testing was examined using scanning electron
microscopes.
3.4.1 Density Measurement
Samples measuring 12.5 mm × 12.5 mm × 3.2 mm were used for density measurement. Figure
3.21 shows the apparatus used. The specimens were weighed first in air (M1) and reweighed while
immersed in a liquid (ethanol) of known density (M2). The density of the specimen was calculated
using equation 3.6:
lcMM
M
21
1 3.6
where 𝜌𝑐 and 𝜌𝑙 are the densities of the specimen and liquid, respectively. The density of ethanol
is 0.789 g/cm³.

44
Figure 3.21. Apparatus used for measuring densities of compression molded composites and high-
density polyethylene.
3.4.2 Tensile Test of Composites
Tensile test was conducted using a InstronTM (model 5500R) machine according to ASTM D638
standard [144]. The test was conducted at ambient temperature (23oC) and 20% relative humidity.
The test specimens were cut into dog-bone shape of dimension 150 mm × 20 mm × 3.2 mm using
a hydraulic cutter. Fig. 3.22 shows typical tensile test specimens. Five specimens were tested for
each composite formulation with a load cell of 5 kN and crosshead speed of 5 mm/min. An
extensometer with a 50-mm gauge length was attached to the test specimens as shown in Fig 3.23
to obtain stress-strain measurements for Young’s modulus determination.
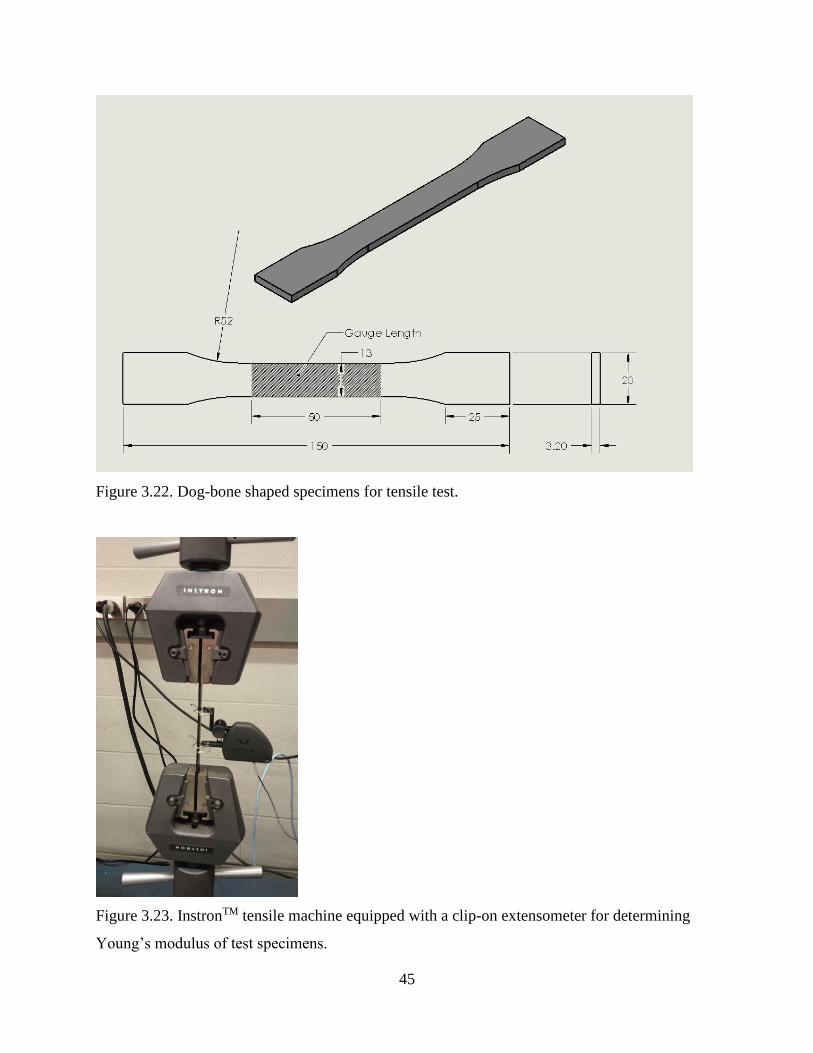
45
Figure 3.22. Dog-bone shaped specimens for tensile test.
Figure 3.23. InstronTM tensile machine equipped with a clip-on extensometer for determining
Young’s modulus of test specimens.
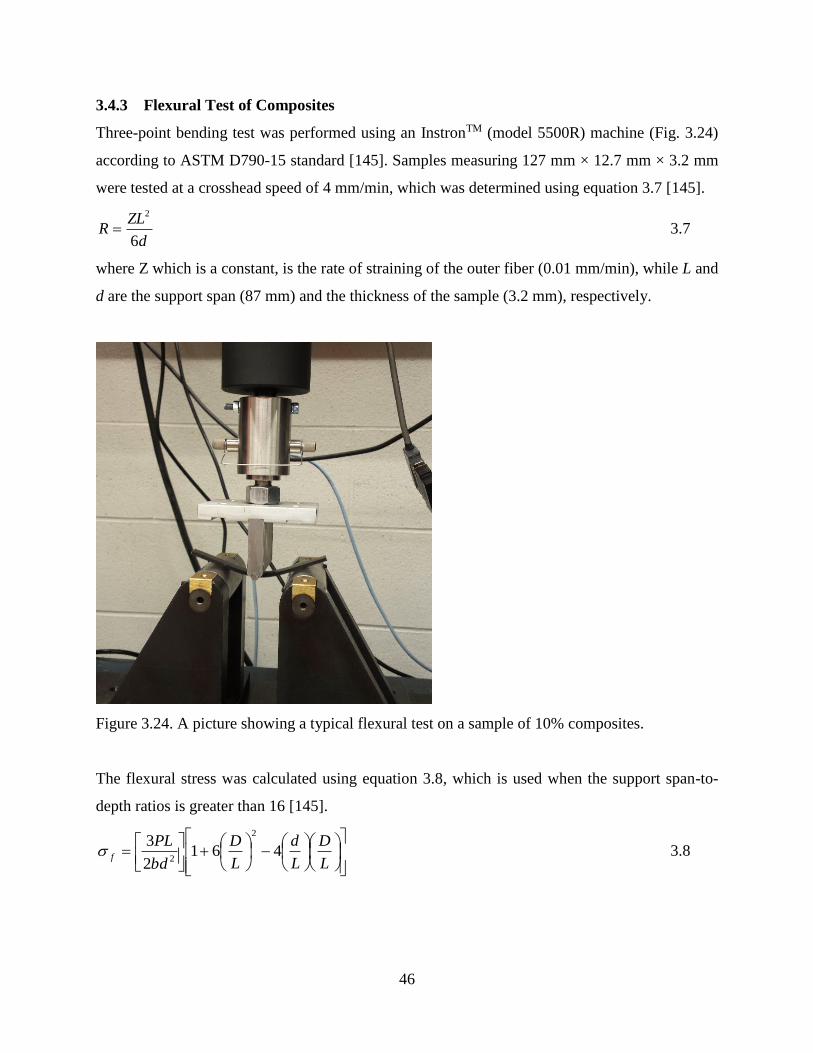
46
3.4.3 Flexural Test of Composites
Three-point bending test was performed using an InstronTM (model 5500R) machine (Fig. 3.24)
according to ASTM D790-15 standard [145]. Samples measuring 127 mm × 12.7 mm × 3.2 mm
were tested at a crosshead speed of 4 mm/min, which was determined using equation 3.7 [145].
d
ZLR
6
2
3.7
where Z which is a constant, is the rate of straining of the outer fiber (0.01 mm/min), while L and
d are the support span (87 mm) and the thickness of the sample (3.2 mm), respectively.
Figure 3.24. A picture showing a typical flexural test on a sample of 10% composites.
The flexural stress was calculated using equation 3.8, which is used when the support span-to-
depth ratios is greater than 16 [145].
L
D
L
d
L
D
bd
PLf 461
2
32
2 3.8
47
where 𝜎𝑓, P, b, and D are the stress in the outer fiber at midpoint (MPa), the load at given point on
the load-deflection curve (N), the width of the beam tested (12.7 mm), and the maximum deflection
(mm), respectively.
The flexural modulus was calculated using equation 3.9 [145]:
3
3
4bd
mLE f 3.9
where 𝐸𝑓, and m are the flexural modulus and the slope of the initial straight-line portion of the
load-deflection curve, respectively. Five samples were tested for the matrix material and each
formulation of the composite materials. Therefore, the bending test results presented in this thesis
are the averages obtained for the ten tests.
3.4.4 Charpy Impact Test of Composites
Toughness of a polymeric materials can be determined by measuring the impact properties of such
material. The higher the impact energy of the material, the higher the toughness. Charpy impact
test was performed using an Instron impact tester (Fig. 3.25) on both unreinforced HDPE and RPFs
reinforced HDPE. The tests were carried out according to ASTM D 6110-10 standard [157].
Test samples measuring 55 mm (length) x 7.5 mm (thickness) x 10 mm (width) were notched using
a broaching machine as shown in Fig. 3.26. Figure 3.27 shows the dimension of the charpy test
samples with a notched depth, radius and angle of 1.75 mm, 0.25 mm and 22.5° respectively. Five
specimens tested for each composite formulation were conditioned in a chiller to attain 0oC, -20oC
and -40oC respectively. The energy absorbed per unit area (𝐸𝑖) was calculated using equation 3.10
[158] and the reported energy absorbed per unit area (𝐸𝑖) are the average values.
db
EE a
i
3.10
where E𝑎, b and d are the energy absorbed, width and thickness of each sample were measured
and recorded, respectively.
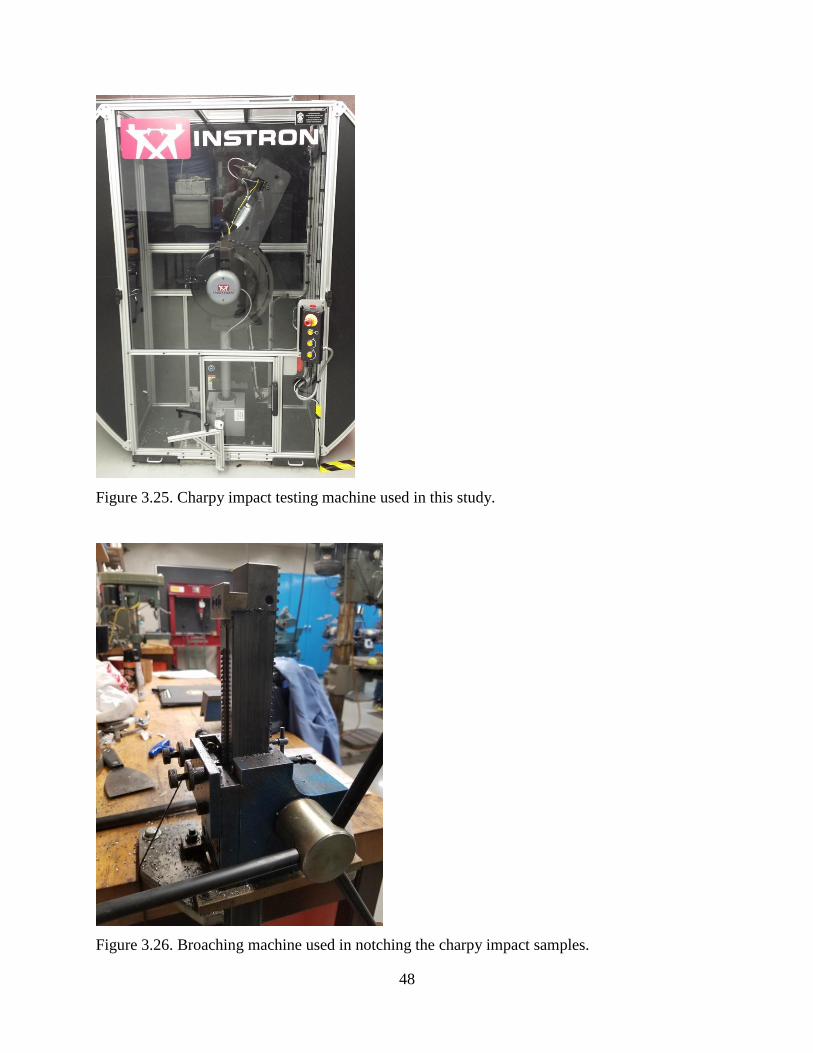
48
Figure 3.25. Charpy impact testing machine used in this study.
Figure 3.26. Broaching machine used in notching the charpy impact samples.
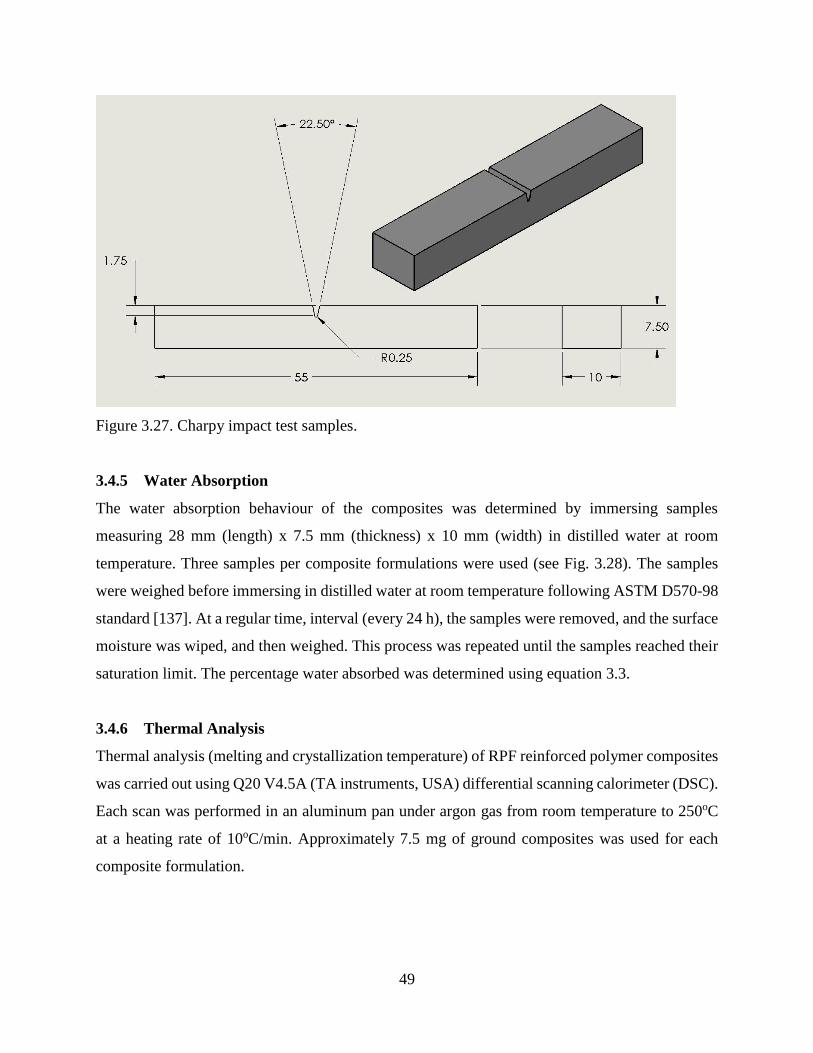
49
Figure 3.27. Charpy impact test samples.
3.4.5 Water Absorption
The water absorption behaviour of the composites was determined by immersing samples
measuring 28 mm (length) x 7.5 mm (thickness) x 10 mm (width) in distilled water at room
temperature. Three samples per composite formulations were used (see Fig. 3.28). The samples
were weighed before immersing in distilled water at room temperature following ASTM D570-98
standard [137]. At a regular time, interval (every 24 h), the samples were removed, and the surface
moisture was wiped, and then weighed. This process was repeated until the samples reached their
saturation limit. The percentage water absorbed was determined using equation 3.3.
3.4.6 Thermal Analysis
Thermal analysis (melting and crystallization temperature) of RPF reinforced polymer composites
was carried out using Q20 V4.5A (TA instruments, USA) differential scanning calorimeter (DSC).
Each scan was performed in an aluminum pan under argon gas from room temperature to 250oC
at a heating rate of 10oC/min. Approximately 7.5 mg of ground composites was used for each
composite formulation.
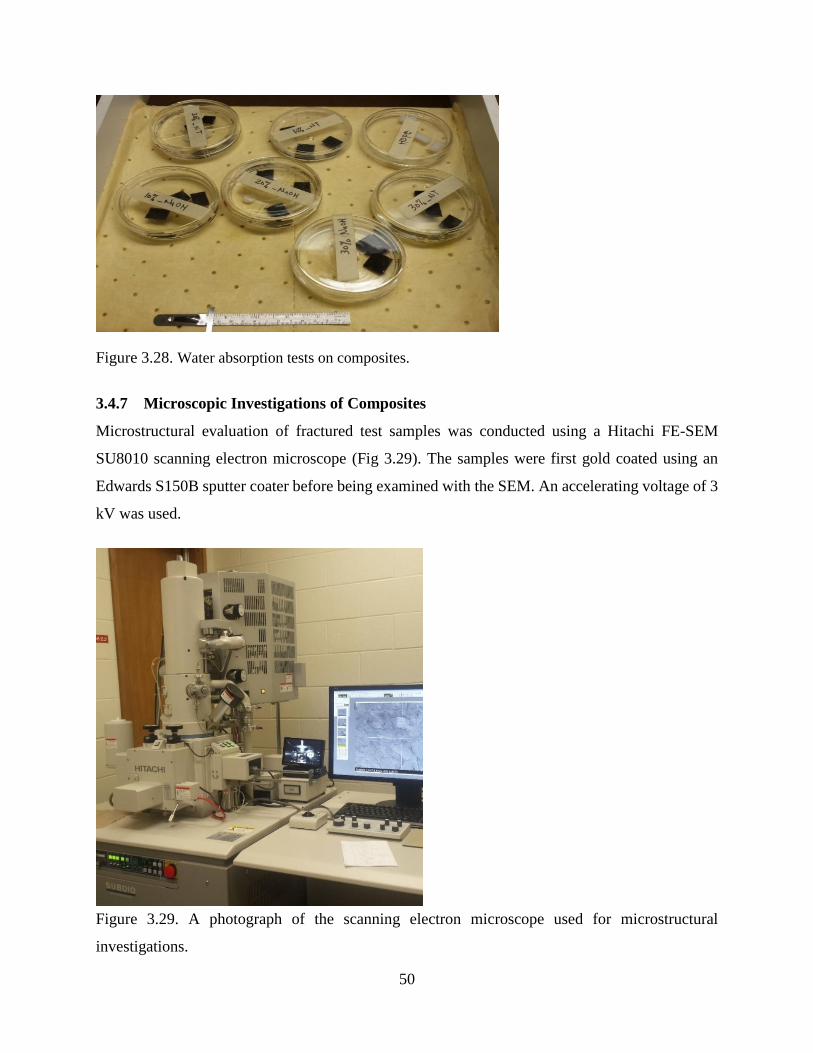
50
Figure 3.28. Water absorption tests on composites.
3.4.7 Microscopic Investigations of Composites
Microstructural evaluation of fractured test samples was conducted using a Hitachi FE-SEM
SU8010 scanning electron microscope (Fig 3.29). The samples were first gold coated using an
Edwards S150B sputter coater before being examined with the SEM. An accelerating voltage of 3
kV was used.
Figure 3.29. A photograph of the scanning electron microscope used for microstructural
investigations.

51
CHAPTER 4
RESULTS AND DISCUSSION
The results obtained from the experimental investigations in Chapter 3 are presented and discussed
in this chapter. It contains two major sections, the first of which focuses on characterization of
raffia fibers. The second section contains results of characterization of the composites developed
using raffia palm fibers and HDPE.
4.1 Characterization of Raffia Palm Fiber (RPF)
Characterization of RPF include the determination of its chemical composition, mechanical and
thermal properties, crystallinity, water and moisture absorption behaviour, among others.
4.1.1 Chemical Composition of RPF
The results of compositional analysis in the “as-received” basis of RPF before and after chemical
treatment with varying concentrations of NaOH and H2SO4 is presented in Table 4.1. Table 4.2
shows the results of chemical composition of RPF in the “dry matter” basis. The “dry matter” basis
indicates the composition levels in a sample based on its dry matter content, excluding the presence
of moisture. Hence, it eliminates the dilution effect of the water, thereby providing the essential
common basis for a direct comparison of the chemical composition contents of NFs. The dry matter
basis (DMB) chemical composition was calculated from the as-received using equation 4.1 [159].
100%%100
(%)-(%)
moisture
contentreceivedAsDMB 4.1
An increase (average value of 19 ± 3%) in the cellulose content was recorded after NaOH
treatment. However, only a slight change (average value of 4 ± 8%) in the hemi-cellulose content
in relation to non-treated RPFs was recorded. The cellulose content of the fiber is very important
because it provides strength and stability. Mechanical properties of NFs depend on it [24,88,98].
Of all NaOH treated fibers, it was observed that the fibers treated with 10% NaOH solution at 60oC
for 5 h exhibit the highest cellulose content. Therefore, this formulation was used in modifying the
surface chemistry of RPFs for composite fabrication.
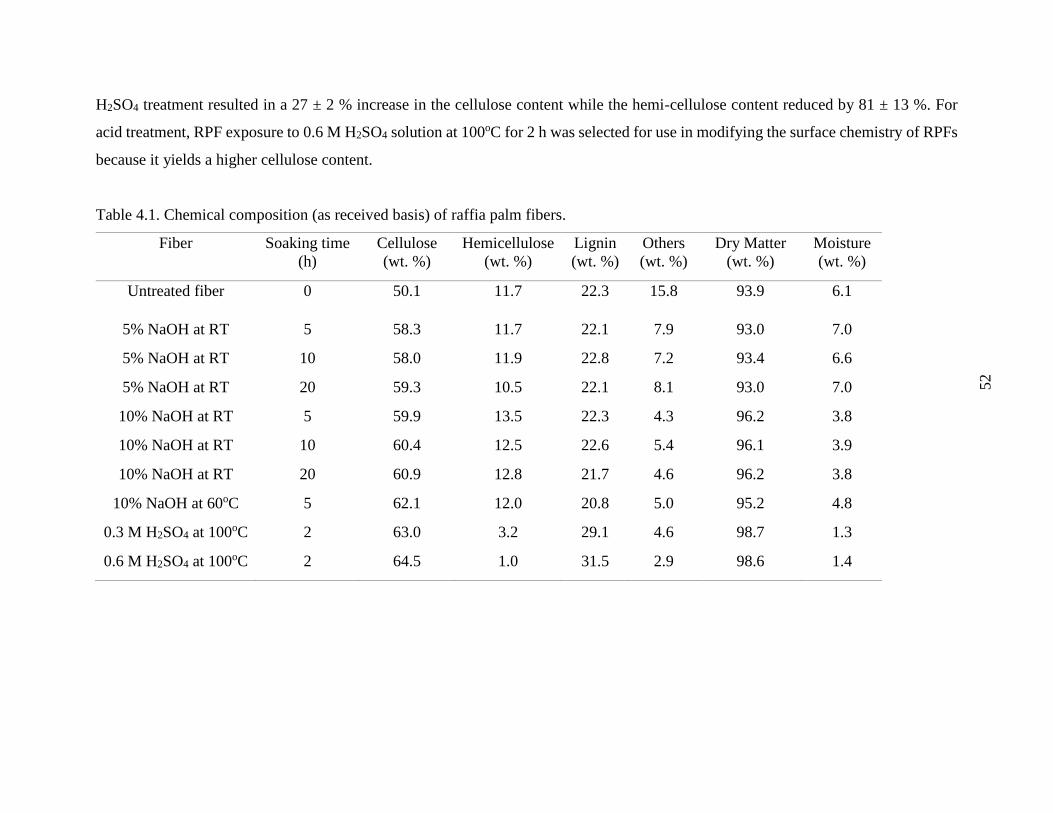
52
H2SO4 treatment resulted in a 27 ± 2 % increase in the cellulose content while the hemi-cellulose content reduced by 81 ± 13 %. For
acid treatment, RPF exposure to 0.6 M H2SO4 solution at 100oC for 2 h was selected for use in modifying the surface chemistry of RPFs
because it yields a higher cellulose content.
Table 4.1. Chemical composition (as received basis) of raffia palm fibers.
Fiber Soaking time
(h)
Cellulose
(wt. %)
Hemicellulose
(wt. %)
Lignin
(wt. %)
Others
(wt. %)
Dry Matter
(wt. %)
Moisture
(wt. %)
Untreated fiber 0 50.1 11.7 22.3 15.8 93.9 6.1
5% NaOH at RT 5 58.3 11.7 22.1 7.9 93.0 7.0
5% NaOH at RT 10 58.0 11.9 22.8 7.2 93.4 6.6
5% NaOH at RT 20 59.3 10.5 22.1 8.1 93.0 7.0
10% NaOH at RT 5 59.9 13.5 22.3 4.3 96.2 3.8
10% NaOH at RT 10 60.4 12.5 22.6 5.4 96.1 3.9
10% NaOH at RT 20 60.9 12.8 21.7 4.6 96.2 3.8
10% NaOH at 60oC 5 62.1 12.0 20.8 5.0 95.2 4.8
0.3 M H2SO4 at 100oC 2 63.0 3.2 29.1 4.6 98.7 1.3
0.6 M H2SO4 at 100oC 2 64.5 1.0 31.5 2.9 98.6 1.4
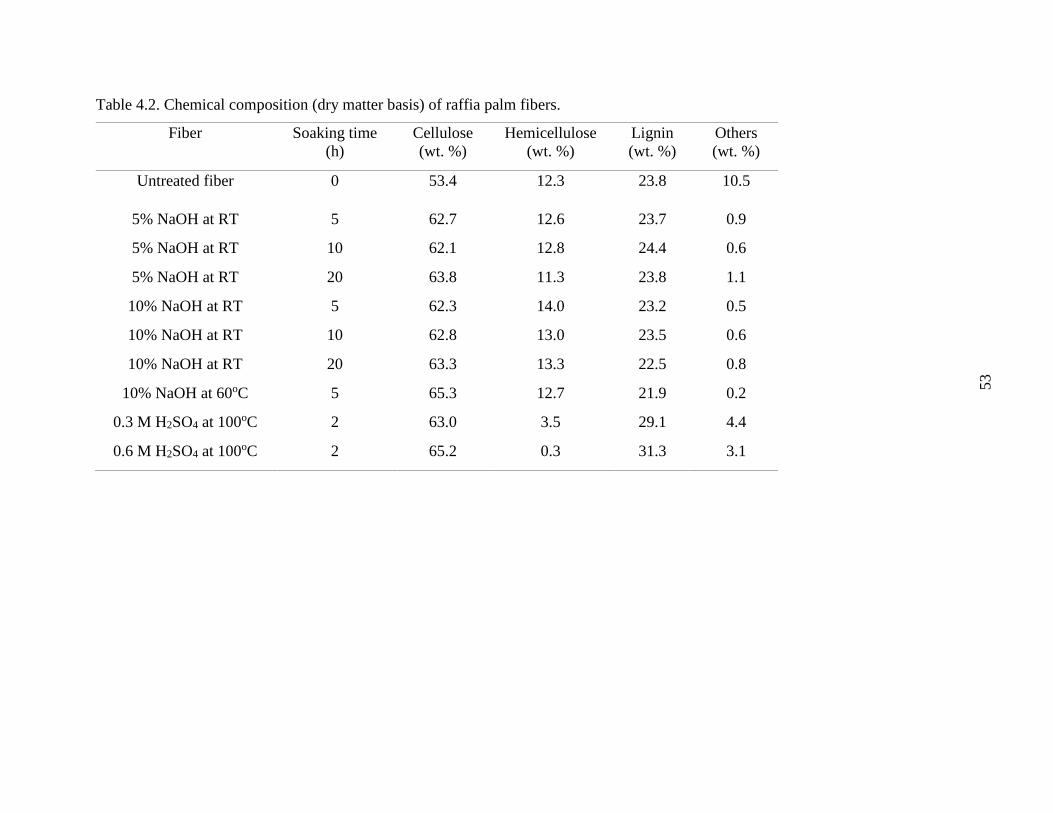
53
Table 4.2. Chemical composition (dry matter basis) of raffia palm fibers.
Fiber Soaking time
(h)
Cellulose
(wt. %)
Hemicellulose
(wt. %)
Lignin
(wt. %)
Others
(wt. %)
Untreated fiber 0 53.4 12.3 23.8 10.5
5% NaOH at RT 5 62.7 12.6 23.7 0.9
5% NaOH at RT 10 62.1 12.8 24.4 0.6
5% NaOH at RT 20 63.8 11.3 23.8 1.1
10% NaOH at RT 5 62.3 14.0 23.2 0.5
10% NaOH at RT 10 62.8 13.0 23.5 0.6
10% NaOH at RT 20 63.3 13.3 22.5 0.8
10% NaOH at 60oC 5 65.3 12.7 21.9 0.2
0.3 M H2SO4 at 100oC 2 63.0 3.5 29.1 4.4
0.6 M H2SO4 at 100oC 2 65.2 0.3 31.3 3.1

54
4.1.2 Microstructure of RPF
Figure 4.1(a) shows typical SEM micrographs of the transverse section of an untreated RPF. The
section has an oval shape with an average diameter of 1.53 mm. The micrograph indicates three
distinct regions: an inner region (lumen) labeled 1, a middle region (cortex) labeled 2 and an outer
surface (epidermis) labeled 3. Between the outer surface and the inner core, there are two radial
pathways labeled 4, which probably serve as conduits for water/moisture exchange between the
core of the fiber and the environment. After chemical treatments, the microstructure of the
transverse sections of alkali and acidic treated RPFs were relatively the same in shape and
morphology as shown in Fig. 1(b and c) in comparison to untreated fiber (Fig. 1a).
Figure 4.1. Scanning electron micrographs showing transverse cross-section of (a) untreated, (b)
alkaline treated and (c) acidic treated raffia palm fibers.
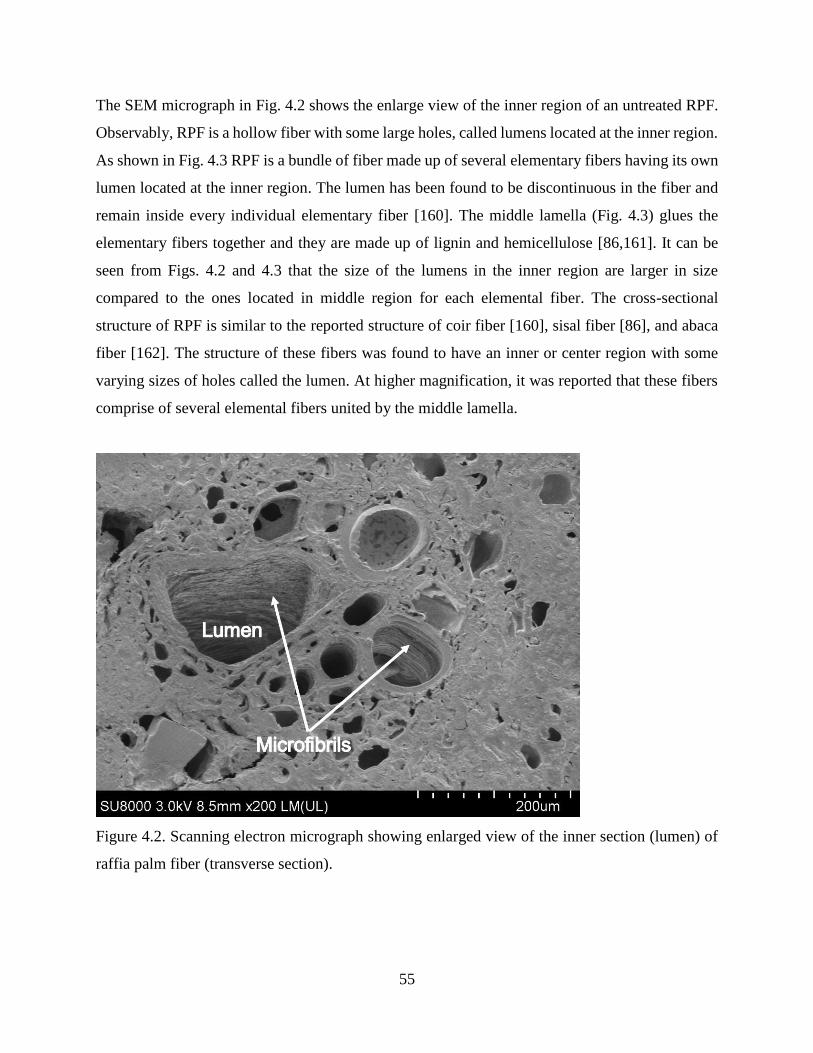
55
The SEM micrograph in Fig. 4.2 shows the enlarge view of the inner region of an untreated RPF.
Observably, RPF is a hollow fiber with some large holes, called lumens located at the inner region.
As shown in Fig. 4.3 RPF is a bundle of fiber made up of several elementary fibers having its own
lumen located at the inner region. The lumen has been found to be discontinuous in the fiber and
remain inside every individual elementary fiber [160]. The middle lamella (Fig. 4.3) glues the
elementary fibers together and they are made up of lignin and hemicellulose [86,161]. It can be
seen from Figs. 4.2 and 4.3 that the size of the lumens in the inner region are larger in size
compared to the ones located in middle region for each elemental fiber. The cross-sectional
structure of RPF is similar to the reported structure of coir fiber [160], sisal fiber [86], and abaca
fiber [162]. The structure of these fibers was found to have an inner or center region with some
varying sizes of holes called the lumen. At higher magnification, it was reported that these fibers
comprise of several elemental fibers united by the middle lamella.
Figure 4.2. Scanning electron micrograph showing enlarged view of the inner section (lumen) of
raffia palm fiber (transverse section).
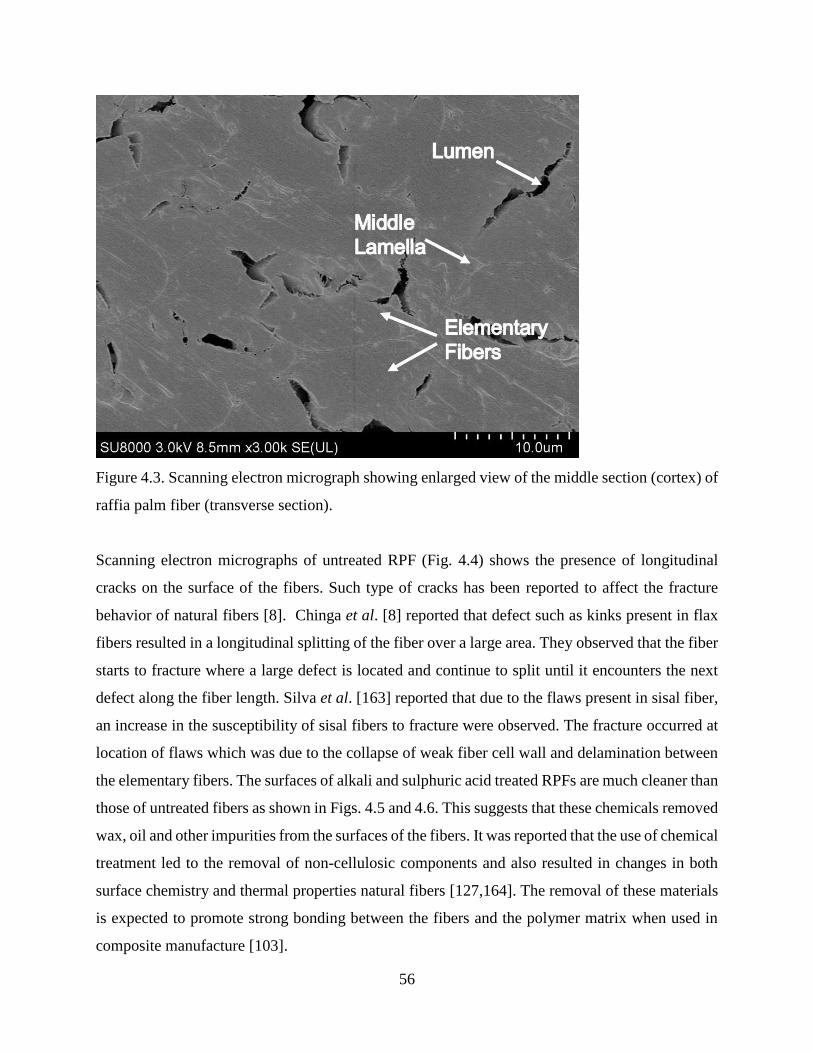
56
Figure 4.3. Scanning electron micrograph showing enlarged view of the middle section (cortex) of
raffia palm fiber (transverse section).
Scanning electron micrographs of untreated RPF (Fig. 4.4) shows the presence of longitudinal
cracks on the surface of the fibers. Such type of cracks has been reported to affect the fracture
behavior of natural fibers [8]. Chinga et al. [8] reported that defect such as kinks present in flax
fibers resulted in a longitudinal splitting of the fiber over a large area. They observed that the fiber
starts to fracture where a large defect is located and continue to split until it encounters the next
defect along the fiber length. Silva et al. [163] reported that due to the flaws present in sisal fiber,
an increase in the susceptibility of sisal fibers to fracture were observed. The fracture occurred at
location of flaws which was due to the collapse of weak fiber cell wall and delamination between
the elementary fibers. The surfaces of alkali and sulphuric acid treated RPFs are much cleaner than
those of untreated fibers as shown in Figs. 4.5 and 4.6. This suggests that these chemicals removed
wax, oil and other impurities from the surfaces of the fibers. It was reported that the use of chemical
treatment led to the removal of non-cellulosic components and also resulted in changes in both
surface chemistry and thermal properties natural fibers [127,164]. The removal of these materials
is expected to promote strong bonding between the fibers and the polymer matrix when used in
composite manufacture [103].
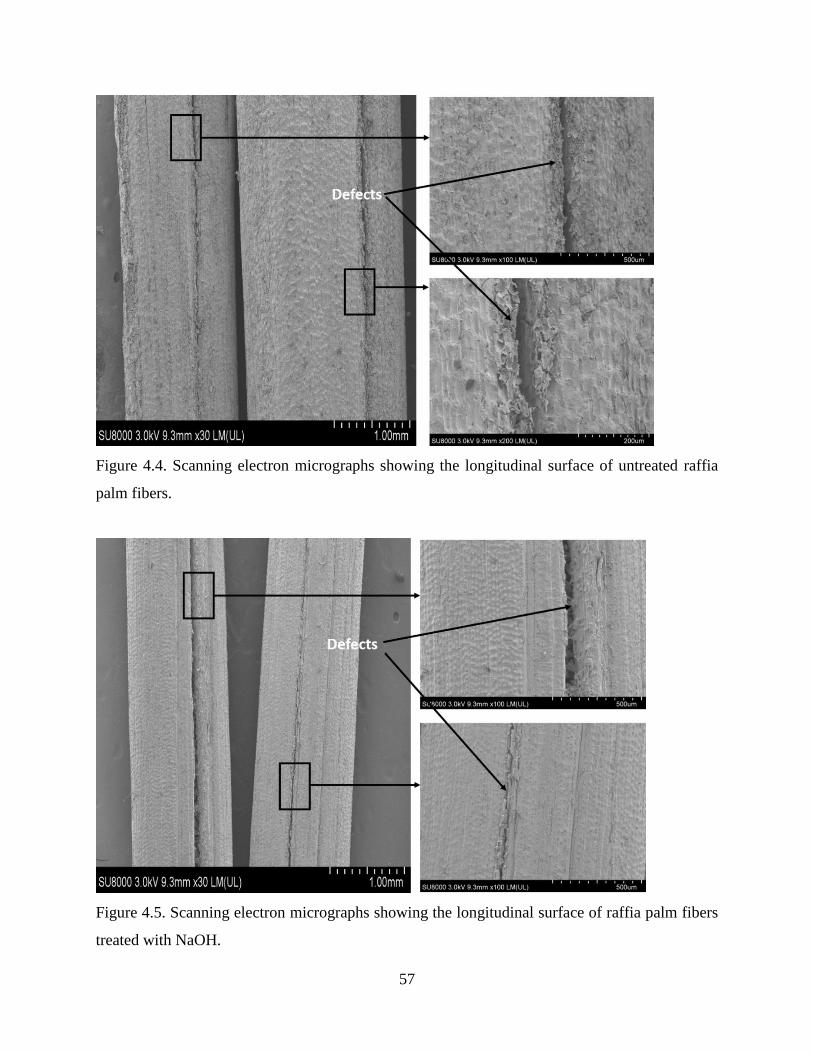
57
Figure 4.4. Scanning electron micrographs showing the longitudinal surface of untreated raffia
palm fibers.
Figure 4.5. Scanning electron micrographs showing the longitudinal surface of raffia palm fibers
treated with NaOH.
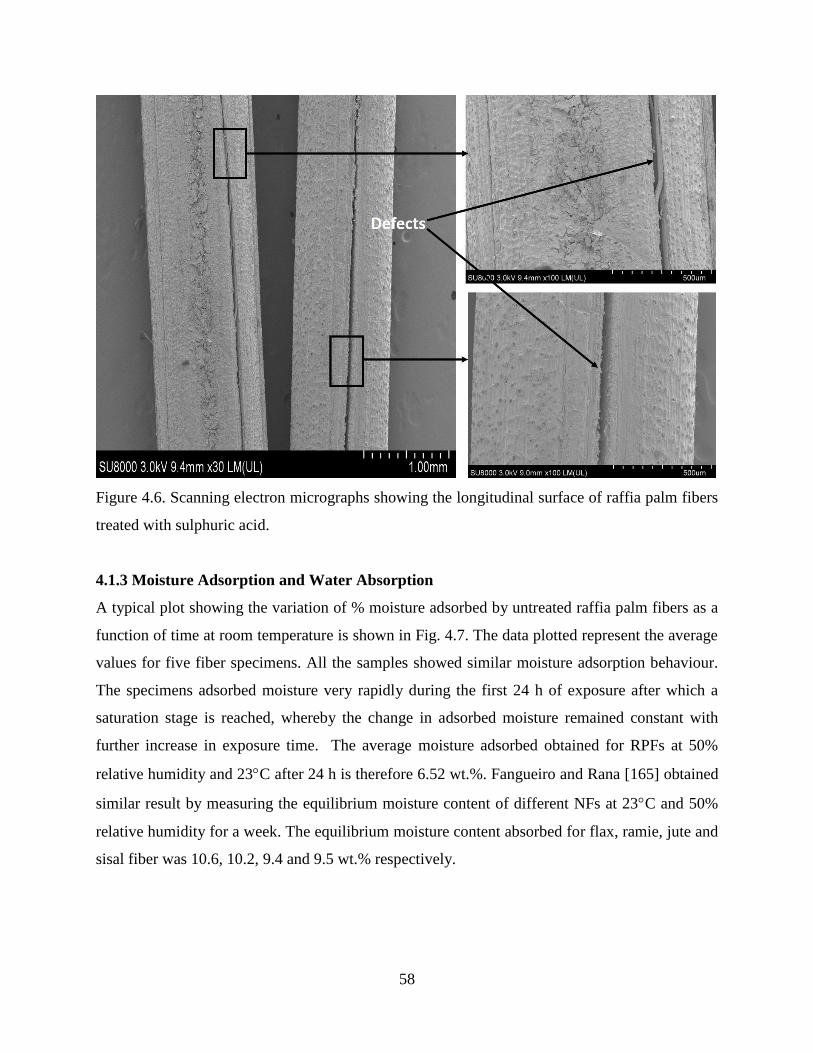
58
Figure 4.6. Scanning electron micrographs showing the longitudinal surface of raffia palm fibers
treated with sulphuric acid.
4.1.3 Moisture Adsorption and Water Absorption
A typical plot showing the variation of % moisture adsorbed by untreated raffia palm fibers as a
function of time at room temperature is shown in Fig. 4.7. The data plotted represent the average
values for five fiber specimens. All the samples showed similar moisture adsorption behaviour.
The specimens adsorbed moisture very rapidly during the first 24 h of exposure after which a
saturation stage is reached, whereby the change in adsorbed moisture remained constant with
further increase in exposure time. The average moisture adsorbed obtained for RPFs at 50%
relative humidity and 23C after 24 h is therefore 6.52 wt.%. Fangueiro and Rana [165] obtained
similar result by measuring the equilibrium moisture content of different NFs at 23C and 50%
relative humidity for a week. The equilibrium moisture content absorbed for flax, ramie, jute and
sisal fiber was 10.6, 10.2, 9.4 and 9.5 wt.% respectively.
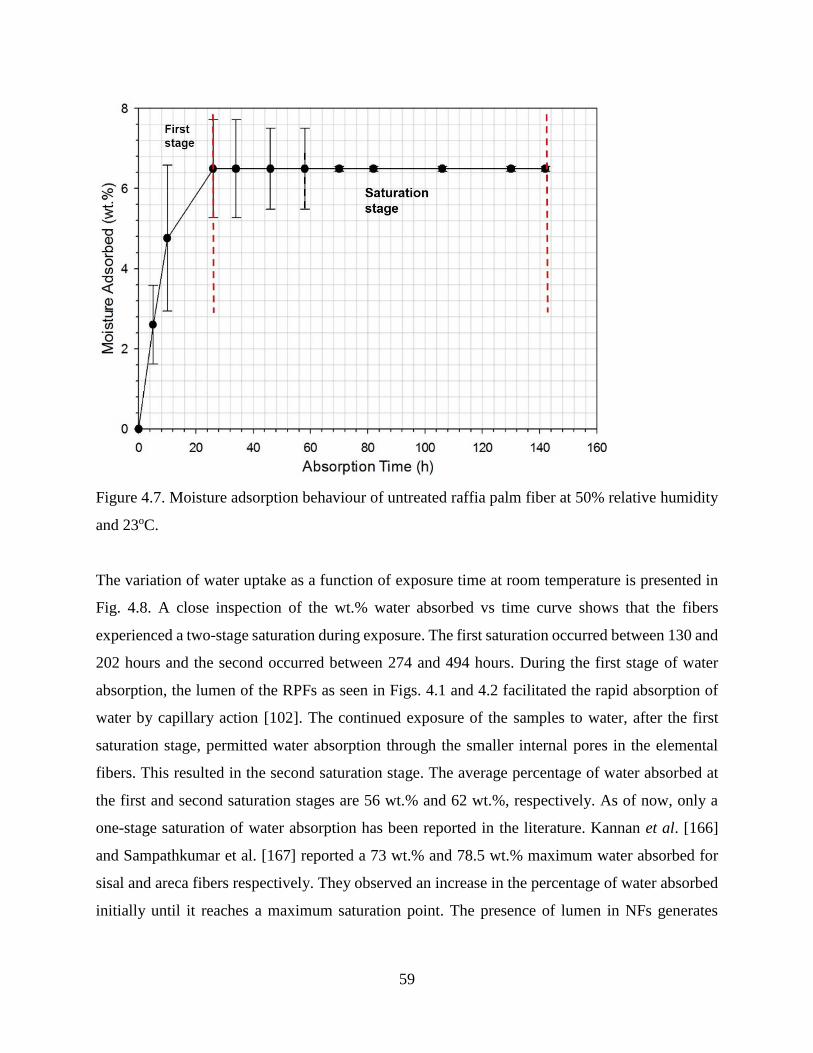
59
Figure 4.7. Moisture adsorption behaviour of untreated raffia palm fiber at 50% relative humidity
and 23oC.
The variation of water uptake as a function of exposure time at room temperature is presented in
Fig. 4.8. A close inspection of the wt.% water absorbed vs time curve shows that the fibers
experienced a two-stage saturation during exposure. The first saturation occurred between 130 and
202 hours and the second occurred between 274 and 494 hours. During the first stage of water
absorption, the lumen of the RPFs as seen in Figs. 4.1 and 4.2 facilitated the rapid absorption of
water by capillary action [102]. The continued exposure of the samples to water, after the first
saturation stage, permitted water absorption through the smaller internal pores in the elemental
fibers. This resulted in the second saturation stage. The average percentage of water absorbed at
the first and second saturation stages are 56 wt.% and 62 wt.%, respectively. As of now, only a
one-stage saturation of water absorption has been reported in the literature. Kannan et al. [166]
and Sampathkumar et al. [167] reported a 73 wt.% and 78.5 wt.% maximum water absorbed for
sisal and areca fibers respectively. They observed an increase in the percentage of water absorbed
initially until it reaches a maximum saturation point. The presence of lumen in NFs generates
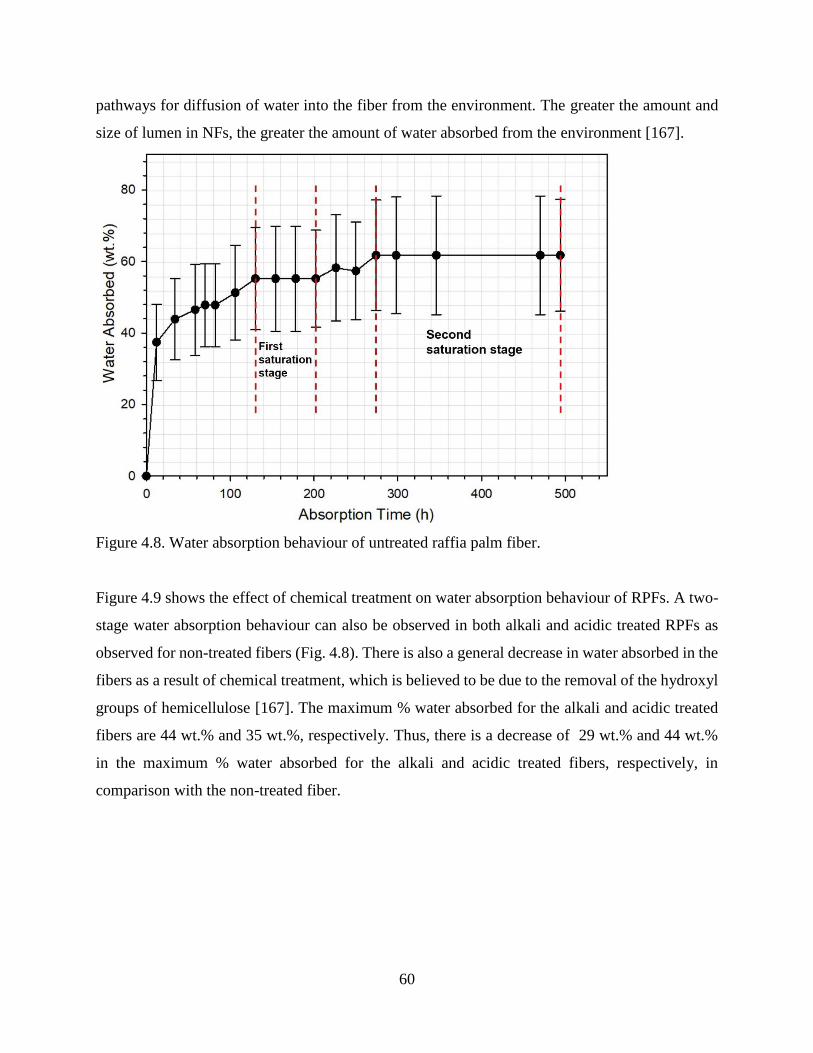
60
pathways for diffusion of water into the fiber from the environment. The greater the amount and
size of lumen in NFs, the greater the amount of water absorbed from the environment [167].
Figure 4.8. Water absorption behaviour of untreated raffia palm fiber.
Figure 4.9 shows the effect of chemical treatment on water absorption behaviour of RPFs. A two-
stage water absorption behaviour can also be observed in both alkali and acidic treated RPFs as
observed for non-treated fibers (Fig. 4.8). There is also a general decrease in water absorbed in the
fibers as a result of chemical treatment, which is believed to be due to the removal of the hydroxyl
groups of hemicellulose [167]. The maximum % water absorbed for the alkali and acidic treated
fibers are 44 wt.% and 35 wt.%, respectively. Thus, there is a decrease of 29 wt.% and 44 wt.%
in the maximum % water absorbed for the alkali and acidic treated fibers, respectively, in
comparison with the non-treated fiber.
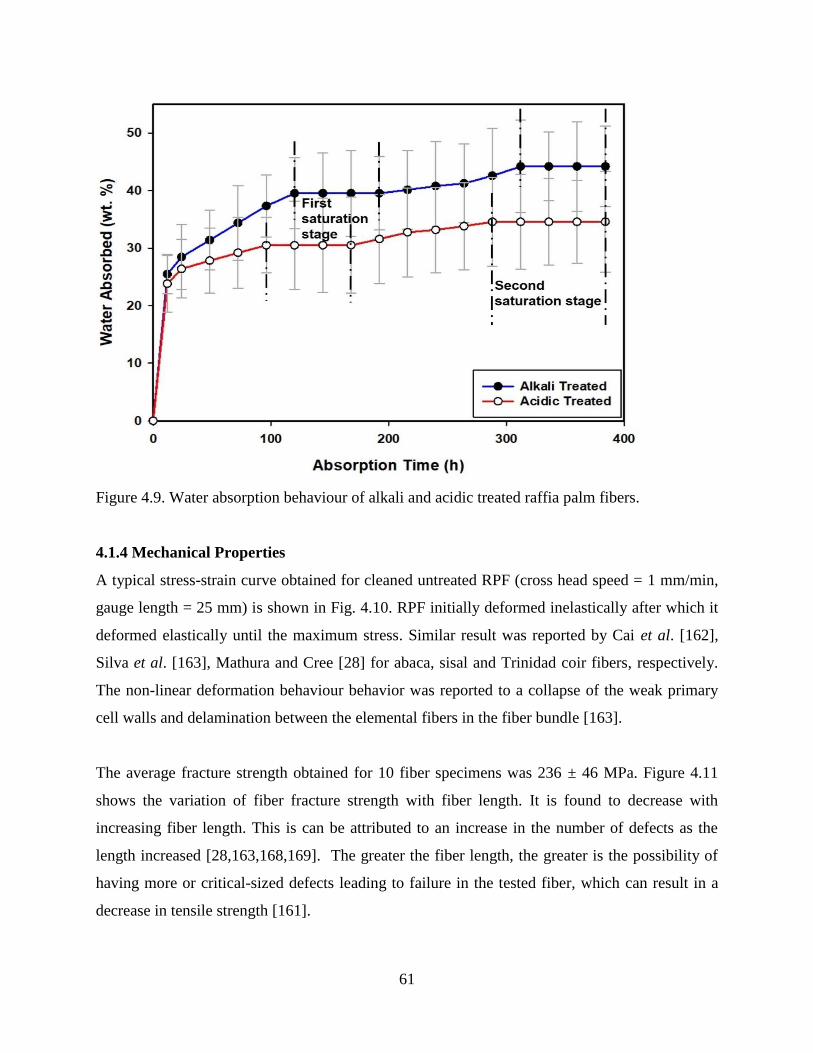
61
Figure 4.9. Water absorption behaviour of alkali and acidic treated raffia palm fibers.
4.1.4 Mechanical Properties
A typical stress-strain curve obtained for cleaned untreated RPF (cross head speed = 1 mm/min,
gauge length = 25 mm) is shown in Fig. 4.10. RPF initially deformed inelastically after which it
deformed elastically until the maximum stress. Similar result was reported by Cai et al. [162],
Silva et al. [163], Mathura and Cree [28] for abaca, sisal and Trinidad coir fibers, respectively.
The non-linear deformation behaviour behavior was reported to a collapse of the weak primary
cell walls and delamination between the elemental fibers in the fiber bundle [163].
The average fracture strength obtained for 10 fiber specimens was 236 ± 46 MPa. Figure 4.11
shows the variation of fiber fracture strength with fiber length. It is found to decrease with
increasing fiber length. This is can be attributed to an increase in the number of defects as the
length increased [28,163,168,169]. The greater the fiber length, the greater is the possibility of
having more or critical-sized defects leading to failure in the tested fiber, which can result in a
decrease in tensile strength [161].

62
Figure 4.10. A typical stress-strain curve obtained for a raffia palm fiber at room temperature.
Figure 4.11. Variation of fiber strength to fiber length.
The average fracture strength value obtained in this study is quite different to the breaking strength
value reported for Raphia textilis by Elenga et al. (average value of 500 ± 97 MPa) [5] obtained

63
from Congo, and Raphia farinifera by Sandy and Bacon (average value of 500 ± 80 MPa) [39]
gotten from Madagascan. The difference in the species and location of raffia fibers investigated
by the authors in reference [5,39] in comparison to raffia palm fiber in this study could be the
reason for the difference in the reported average strengths.
The effect of fiber length on the percentage elongation to fracture under tensile loading is
summarized in Fig. 4.12, while Fig. 4.13 shows the variation of fracture strength at a fixed fiber
length with increasing crosshead speed. There appears to be no appreciable influence of fiber
length on percentage elongation to fracture. Mukherjee and Satyanarayana [168] reported that
under applied stress, as the length of sisal fiber increases, there were little or no changes in the %
elongation of the fiber. This behaviour was attributed to the stiff nature of NFs [170]. Similarly,
crosshead speed does not have any remarkable effect on the fracture strength of the fibers.
Mukherjee and Satyanarayana [168] and Tomczak et al. [169] investigated the effect of varying
strain on the tensile strength of Sisal and Curaua fibers respectively. They reported that NFs having
a crystallinity index above 50% subjected to high testing speed (between 2 and 50 mm/min) will
behave like a viscoelastic material with crystalline region bearing most of the applied stress
resulting in increased strength. However, at low speeds, the fibers will behave like a viscous liquid
while the amorphous region bears a major portion of the applied load resulting in little or no
remarkable effect on the fracture strength. This is in agreement with the results of the effects of
crosshead speed on fracture strength obtained in this study.
The effect of chemical treatment on the tensile properties of RPFs is presented in Table 4.3. The
tensile strength of alkaline and sulfuric acid treated fibers reduced by 47% and 89%, respectively,.
This may be due to the concentration of solutions and exposure time used. Edeerozey et al. [21]
reported that increasing alkali concentration from 6 to 9% resulted in significant reduction in the
tensile strength of kenaf fibers (from 239 to 165 MPa). Similar result was reported by Mahjoub et
al. [91] on the tensile properties of kenaf fibers. He reported a decrease in the tensile strength and
modulus of kenaf fiber due to increasing concentration (5, 7, 10 and 15%) of NaOH solution and
immersion time.
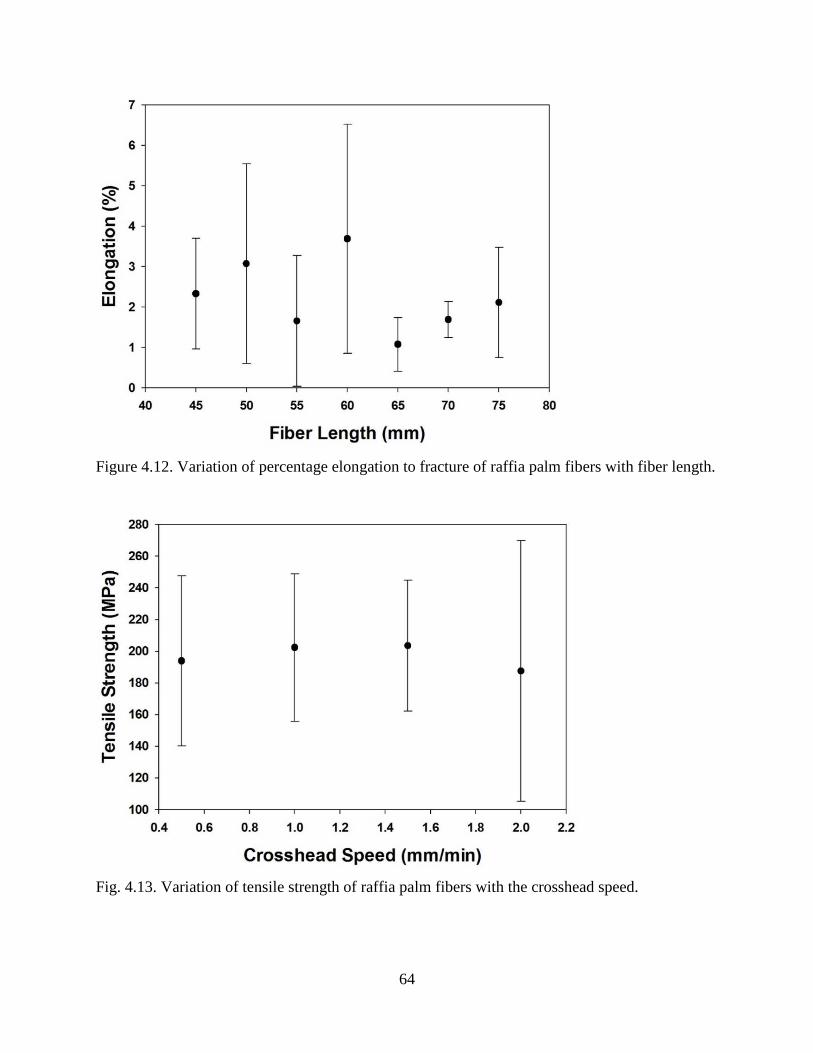
64
Figure 4.12. Variation of percentage elongation to fracture of raffia palm fibers with fiber length.
Fig. 4.13. Variation of tensile strength of raffia palm fibers with the crosshead speed.
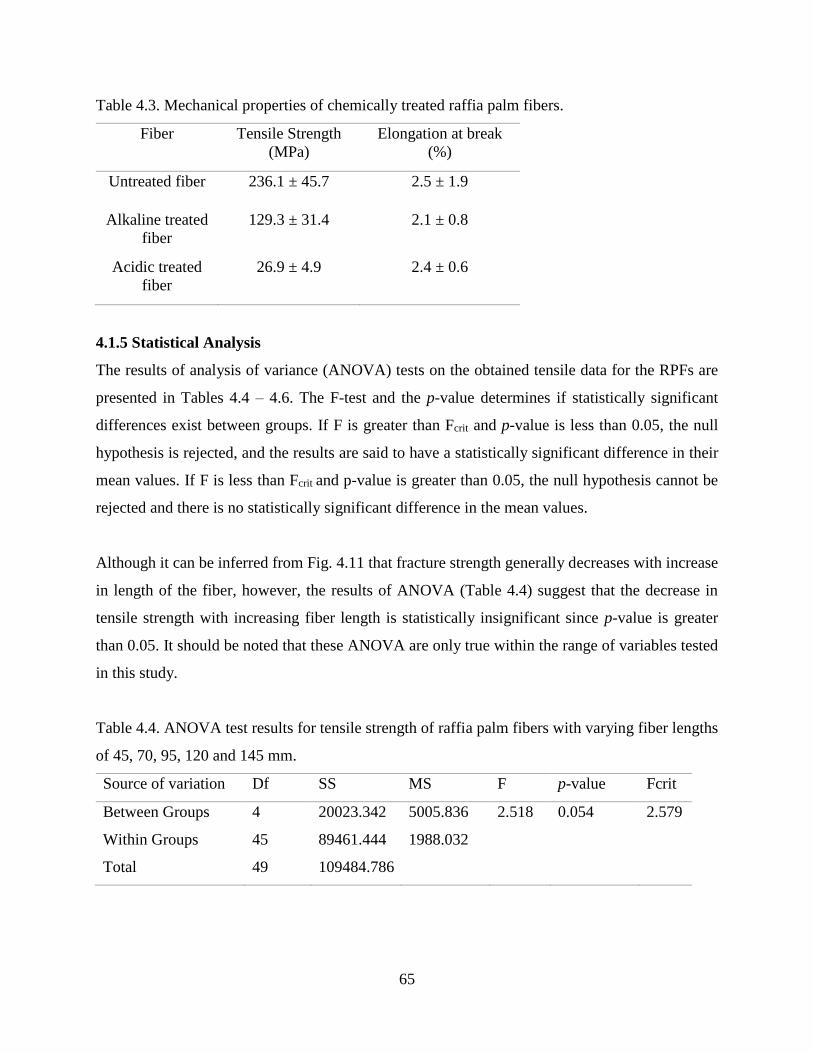
65
Table 4.3. Mechanical properties of chemically treated raffia palm fibers.
Fiber Tensile Strength
(MPa)
Elongation at break
(%)
Untreated fiber 236.1 ± 45.7 2.5 ± 1.9
Alkaline treated
fiber
129.3 ± 31.4 2.1 ± 0.8
Acidic treated
fiber
26.9 ± 4.9 2.4 ± 0.6
4.1.5 Statistical Analysis
The results of analysis of variance (ANOVA) tests on the obtained tensile data for the RPFs are
presented in Tables 4.4 – 4.6. The F-test and the p-value determines if statistically significant
differences exist between groups. If F is greater than Fcrit and p-value is less than 0.05, the null
hypothesis is rejected, and the results are said to have a statistically significant difference in their
mean values. If F is less than Fcrit and p-value is greater than 0.05, the null hypothesis cannot be
rejected and there is no statistically significant difference in the mean values.
Although it can be inferred from Fig. 4.11 that fracture strength generally decreases with increase
in length of the fiber, however, the results of ANOVA (Table 4.4) suggest that the decrease in
tensile strength with increasing fiber length is statistically insignificant since p-value is greater
than 0.05. It should be noted that these ANOVA are only true within the range of variables tested
in this study.
Table 4.4. ANOVA test results for tensile strength of raffia palm fibers with varying fiber lengths
of 45, 70, 95, 120 and 145 mm.
Source of variation Df SS MS F p-value Fcrit
Between Groups 4 20023.342 5005.836 2.518 0.054 2.579
Within Groups 45 89461.444 1988.032
Total 49 109484.786
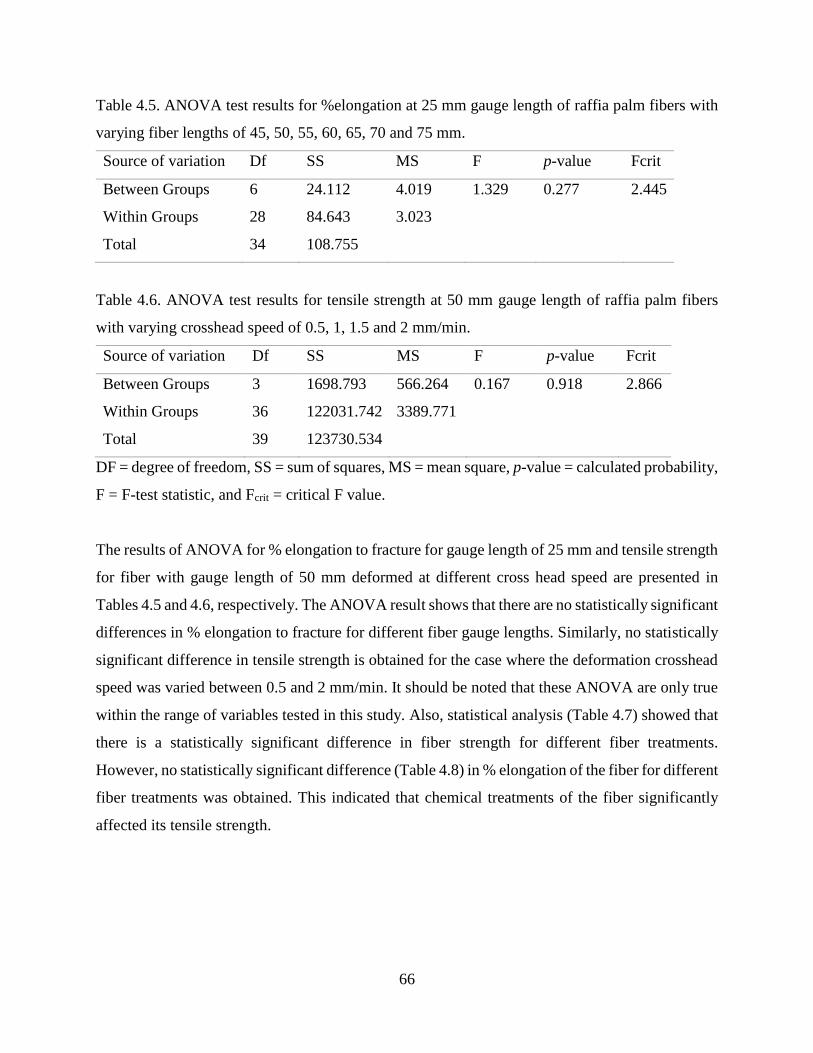
66
Table 4.5. ANOVA test results for %elongation at 25 mm gauge length of raffia palm fibers with
varying fiber lengths of 45, 50, 55, 60, 65, 70 and 75 mm.
Source of variation Df SS MS F p-value Fcrit
Between Groups 6 24.112 4.019 1.329 0.277 2.445
Within Groups 28 84.643 3.023
Total 34 108.755
Table 4.6. ANOVA test results for tensile strength at 50 mm gauge length of raffia palm fibers
with varying crosshead speed of 0.5, 1, 1.5 and 2 mm/min.
Source of variation Df SS MS F p-value Fcrit
Between Groups 3 1698.793 566.264 0.167 0.918 2.866
Within Groups 36 122031.742 3389.771
Total 39 123730.534
DF = degree of freedom, SS = sum of squares, MS = mean square, p-value = calculated probability,
F = F-test statistic, and Fcrit = critical F value.
The results of ANOVA for % elongation to fracture for gauge length of 25 mm and tensile strength
for fiber with gauge length of 50 mm deformed at different cross head speed are presented in
Tables 4.5 and 4.6, respectively. The ANOVA result shows that there are no statistically significant
differences in % elongation to fracture for different fiber gauge lengths. Similarly, no statistically
significant difference in tensile strength is obtained for the case where the deformation crosshead
speed was varied between 0.5 and 2 mm/min. It should be noted that these ANOVA are only true
within the range of variables tested in this study. Also, statistical analysis (Table 4.7) showed that
there is a statistically significant difference in fiber strength for different fiber treatments.
However, no statistically significant difference (Table 4.8) in % elongation of the fiber for different
fiber treatments was obtained. This indicated that chemical treatments of the fiber significantly
affected its tensile strength.
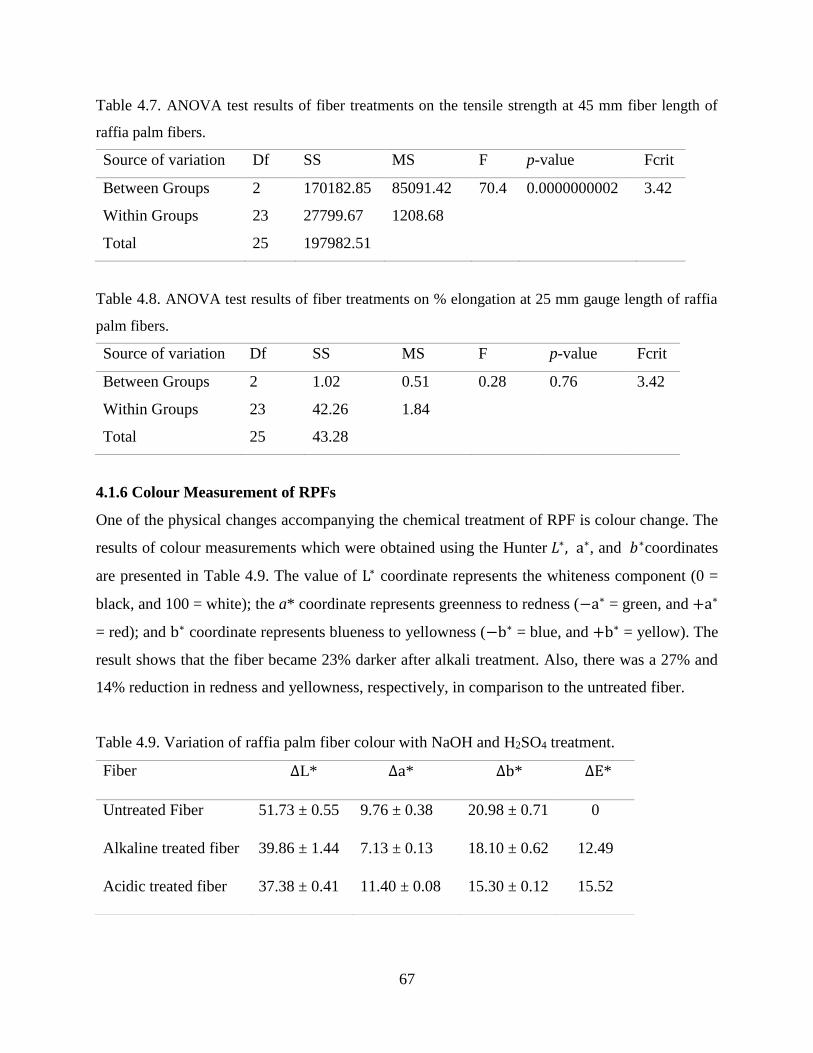
67
Table 4.7. ANOVA test results of fiber treatments on the tensile strength at 45 mm fiber length of
raffia palm fibers.
Source of variation Df SS MS F p-value Fcrit
Between Groups 2 170182.85 85091.42 70.4 0.0000000002 3.42
Within Groups 23 27799.67 1208.68
Total 25 197982.51
Table 4.8. ANOVA test results of fiber treatments on % elongation at 25 mm gauge length of raffia
palm fibers.
Source of variation Df SS MS F p-value Fcrit
Between Groups 2 1.02 0.51 0.28 0.76 3.42
Within Groups 23 42.26 1.84
Total 25 43.28
4.1.6 Colour Measurement of RPFs
One of the physical changes accompanying the chemical treatment of RPF is colour change. The
results of colour measurements which were obtained using the Hunter 𝐿∗, a∗, and 𝑏∗coordinates
are presented in Table 4.9. The value of L∗ coordinate represents the whiteness component (0 =
black, and 100 = white); the a* coordinate represents greenness to redness (−a∗ = green, and +a∗
= red); and b∗ coordinate represents blueness to yellowness (−b∗ = blue, and +b∗ = yellow). The
result shows that the fiber became 23% darker after alkali treatment. Also, there was a 27% and
14% reduction in redness and yellowness, respectively, in comparison to the untreated fiber.
Table 4.9. Variation of raffia palm fiber colour with NaOH and H2SO4 treatment.
Fiber ΔL* Δa* Δb* ΔE*
Untreated Fiber 51.73 ± 0.55 9.76 ± 0.38 20.98 ± 0.71 0
Alkaline treated fiber 39.86 ± 1.44 7.13 ± 0.13 18.10 ± 0.62 12.49
Acidic treated fiber 37.38 ± 0.41 11.40 ± 0.08 15.30 ± 0.12 15.52
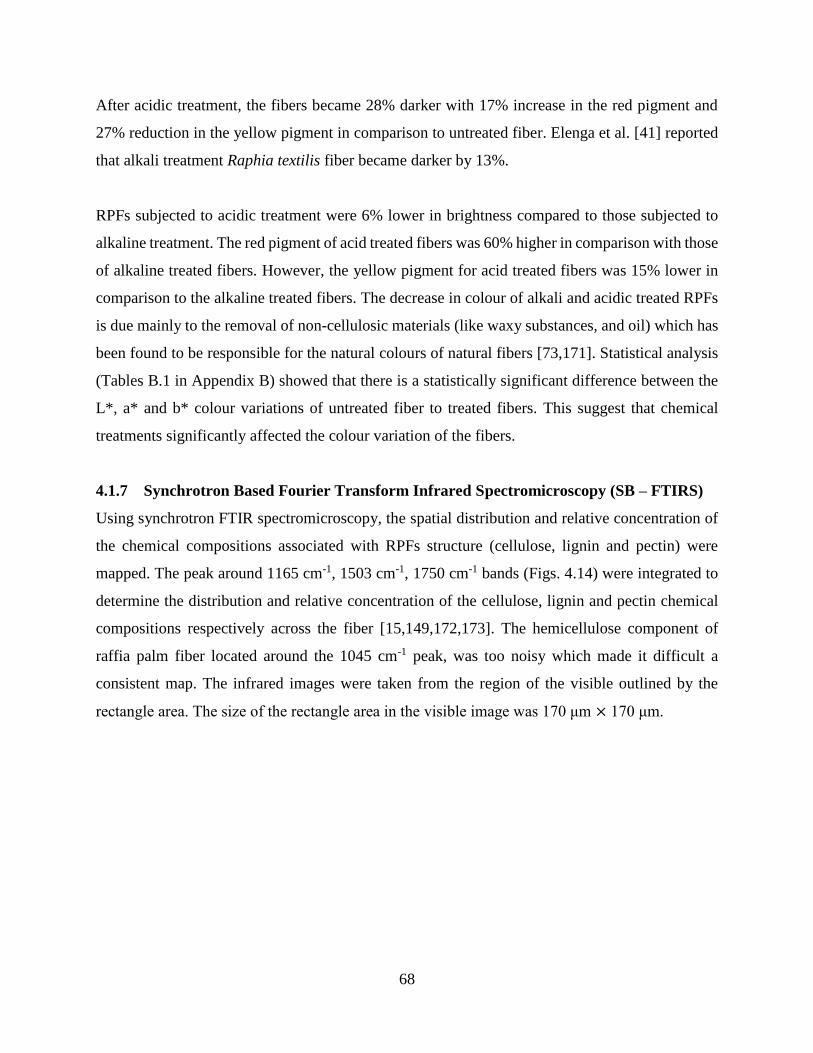
68
After acidic treatment, the fibers became 28% darker with 17% increase in the red pigment and
27% reduction in the yellow pigment in comparison to untreated fiber. Elenga et al. [41] reported
that alkali treatment Raphia textilis fiber became darker by 13%.
RPFs subjected to acidic treatment were 6% lower in brightness compared to those subjected to
alkaline treatment. The red pigment of acid treated fibers was 60% higher in comparison with those
of alkaline treated fibers. However, the yellow pigment for acid treated fibers was 15% lower in
comparison to the alkaline treated fibers. The decrease in colour of alkali and acidic treated RPFs
is due mainly to the removal of non-cellulosic materials (like waxy substances, and oil) which has
been found to be responsible for the natural colours of natural fibers [73,171]. Statistical analysis
(Tables B.1 in Appendix B) showed that there is a statistically significant difference between the
L*, a* and b* colour variations of untreated fiber to treated fibers. This suggest that chemical
treatments significantly affected the colour variation of the fibers.
4.1.7 Synchrotron Based Fourier Transform Infrared Spectromicroscopy (SB – FTIRS)
Using synchrotron FTIR spectromicroscopy, the spatial distribution and relative concentration of
the chemical compositions associated with RPFs structure (cellulose, lignin and pectin) were
mapped. The peak around 1165 cm-1, 1503 cm-1, 1750 cm-1 bands (Figs. 4.14) were integrated to
determine the distribution and relative concentration of the cellulose, lignin and pectin chemical
compositions respectively across the fiber [15,149,172,173]. The hemicellulose component of
raffia palm fiber located around the 1045 cm-1 peak, was too noisy which made it difficult a
consistent map. The infrared images were taken from the region of the visible outlined by the
rectangle area. The size of the rectangle area in the visible image was 170 μm × 170 μm.
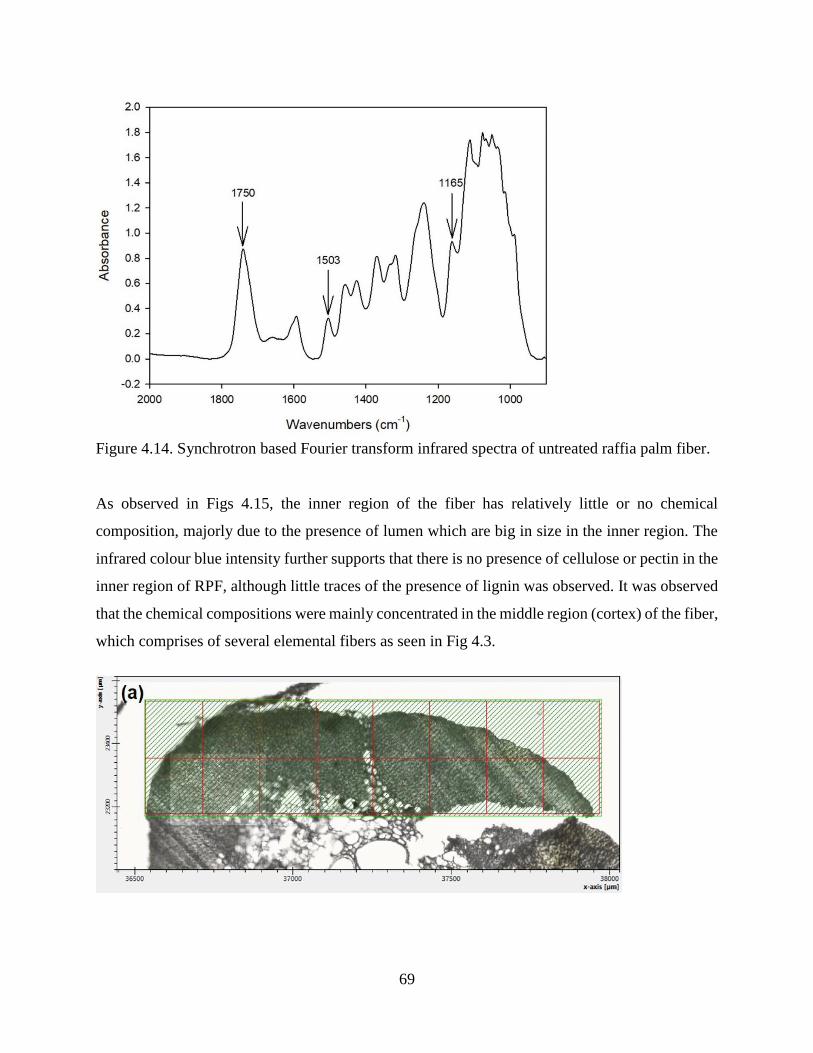
69
Figure 4.14. Synchrotron based Fourier transform infrared spectra of untreated raffia palm fiber.
As observed in Figs 4.15, the inner region of the fiber has relatively little or no chemical
composition, majorly due to the presence of lumen which are big in size in the inner region. The
infrared colour blue intensity further supports that there is no presence of cellulose or pectin in the
inner region of RPF, although little traces of the presence of lignin was observed. It was observed
that the chemical compositions were mainly concentrated in the middle region (cortex) of the fiber,
which comprises of several elemental fibers as seen in Fig 4.3.
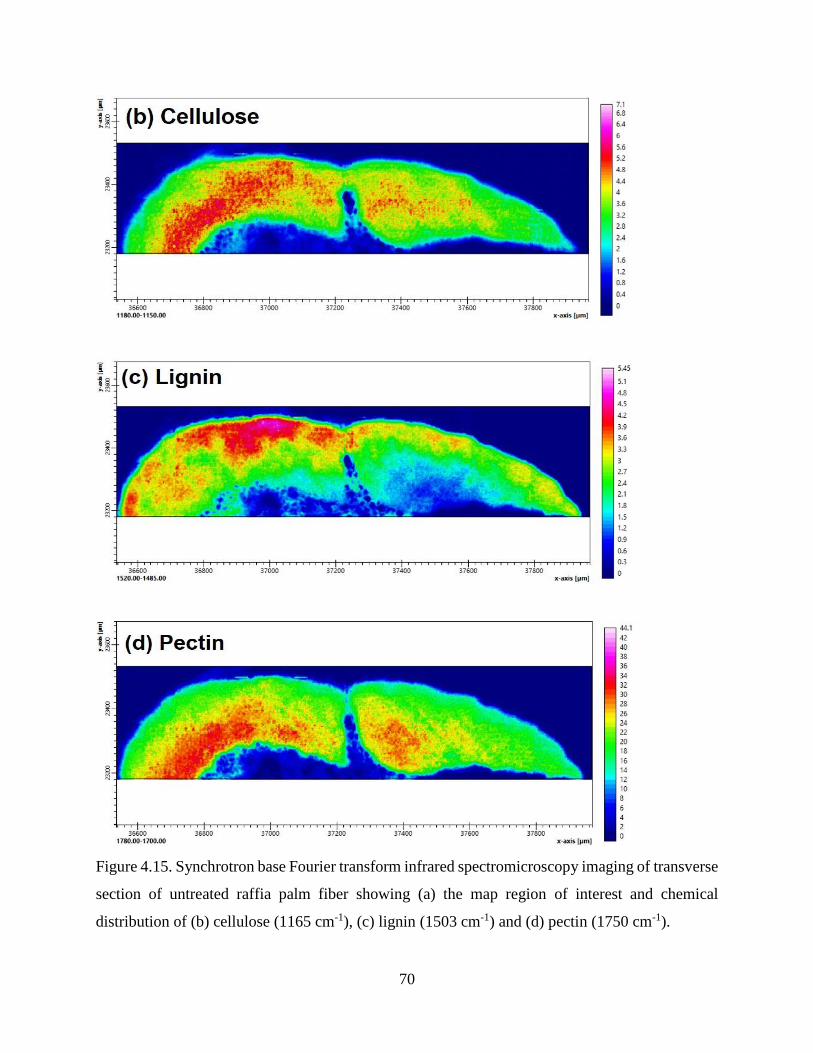
70
Figure 4.15. Synchrotron base Fourier transform infrared spectromicroscopy imaging of transverse
section of untreated raffia palm fiber showing (a) the map region of interest and chemical
distribution of (b) cellulose (1165 cm-1), (c) lignin (1503 cm-1) and (d) pectin (1750 cm-1).
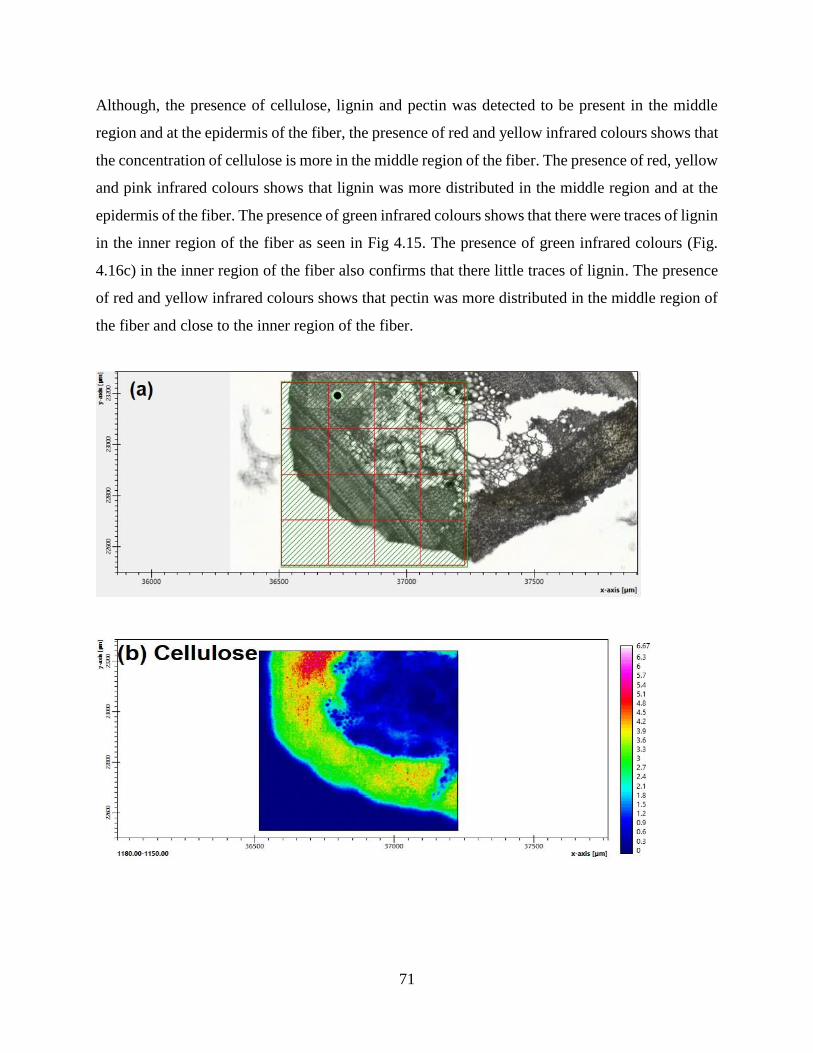
71
Although, the presence of cellulose, lignin and pectin was detected to be present in the middle
region and at the epidermis of the fiber, the presence of red and yellow infrared colours shows that
the concentration of cellulose is more in the middle region of the fiber. The presence of red, yellow
and pink infrared colours shows that lignin was more distributed in the middle region and at the
epidermis of the fiber. The presence of green infrared colours shows that there were traces of lignin
in the inner region of the fiber as seen in Fig 4.15. The presence of green infrared colours (Fig.
4.16c) in the inner region of the fiber also confirms that there little traces of lignin. The presence
of red and yellow infrared colours shows that pectin was more distributed in the middle region of
the fiber and close to the inner region of the fiber.
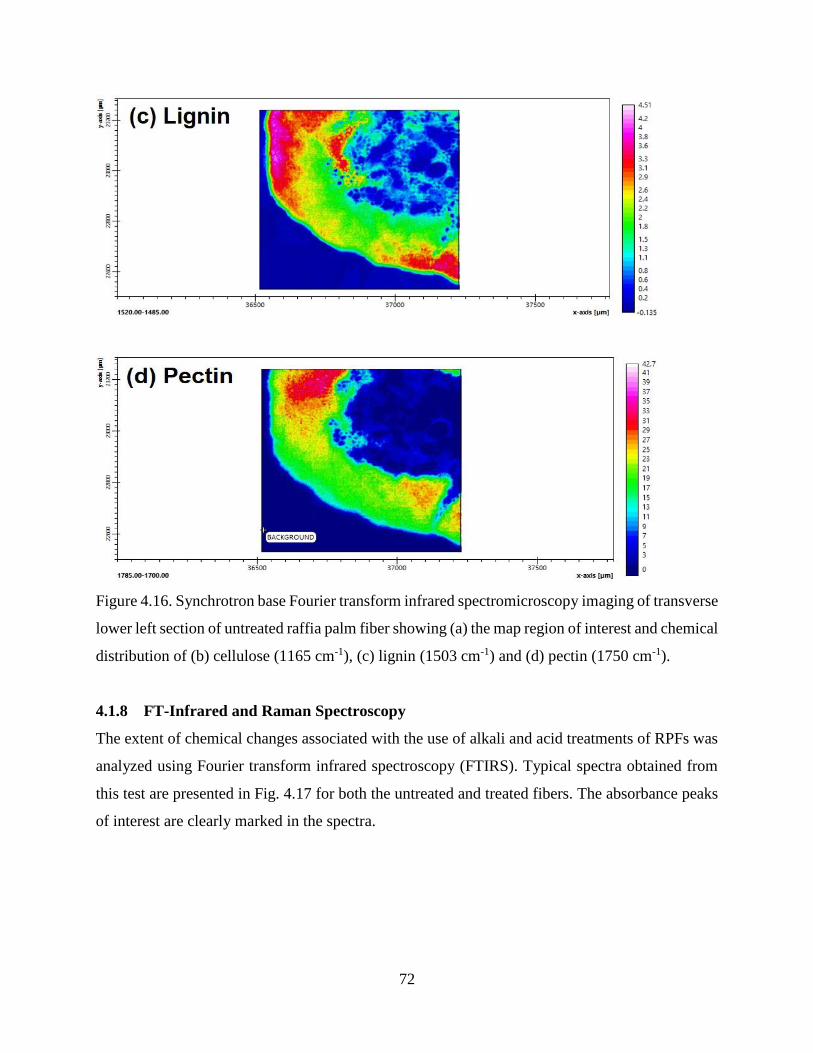
72
Figure 4.16. Synchrotron base Fourier transform infrared spectromicroscopy imaging of transverse
lower left section of untreated raffia palm fiber showing (a) the map region of interest and chemical
distribution of (b) cellulose (1165 cm-1), (c) lignin (1503 cm-1) and (d) pectin (1750 cm-1).
4.1.8 FT-Infrared and Raman Spectroscopy
The extent of chemical changes associated with the use of alkali and acid treatments of RPFs was
analyzed using Fourier transform infrared spectroscopy (FTIRS). Typical spectra obtained from
this test are presented in Fig. 4.17 for both the untreated and treated fibers. The absorbance peaks
of interest are clearly marked in the spectra.
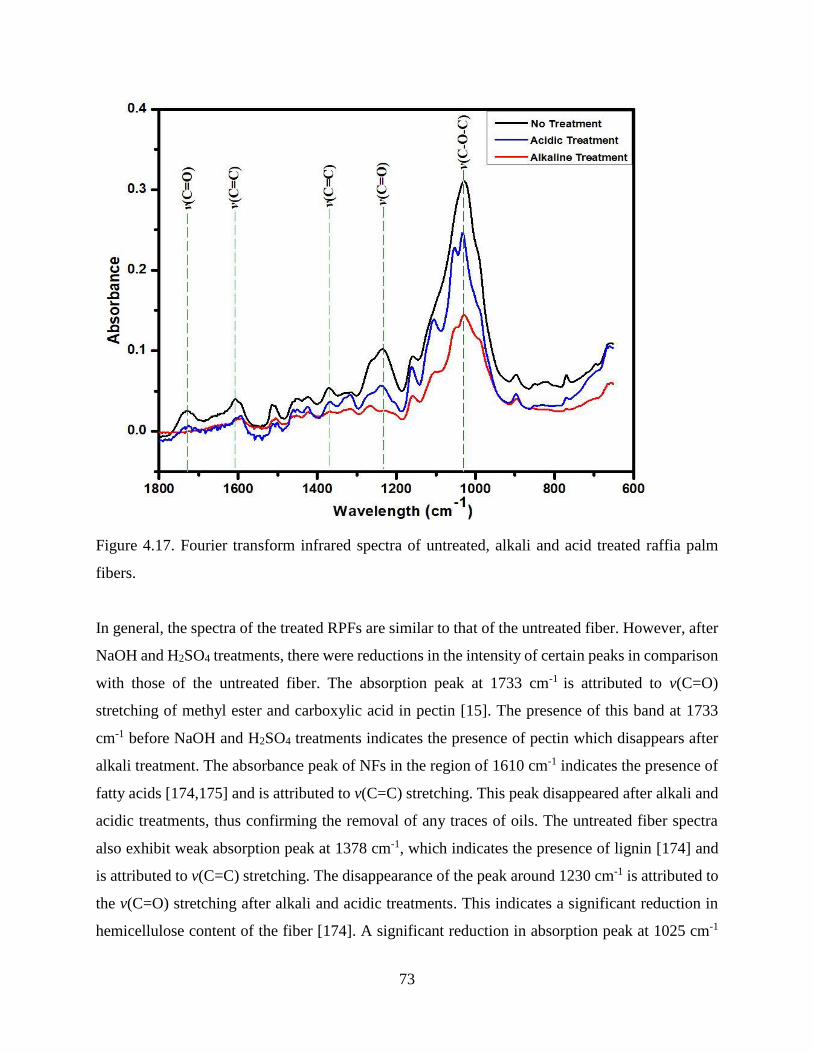
73
Figure 4.17. Fourier transform infrared spectra of untreated, alkali and acid treated raffia palm
fibers.
In general, the spectra of the treated RPFs are similar to that of the untreated fiber. However, after
NaOH and H2SO4 treatments, there were reductions in the intensity of certain peaks in comparison
with those of the untreated fiber. The absorption peak at 1733 cm-1 is attributed to v(C=O)
stretching of methyl ester and carboxylic acid in pectin [15]. The presence of this band at 1733
cm-1 before NaOH and H2SO4 treatments indicates the presence of pectin which disappears after
alkali treatment. The absorbance peak of NFs in the region of 1610 cm-1 indicates the presence of
fatty acids [174,175] and is attributed to v(C=C) stretching. This peak disappeared after alkali and
acidic treatments, thus confirming the removal of any traces of oils. The untreated fiber spectra
also exhibit weak absorption peak at 1378 cm-1, which indicates the presence of lignin [174] and
is attributed to v(C=C) stretching. The disappearance of the peak around 1230 cm-1 is attributed to
the v(C=O) stretching after alkali and acidic treatments. This indicates a significant reduction in
hemicellulose content of the fiber [174]. A significant reduction in absorption peak at 1025 cm-1
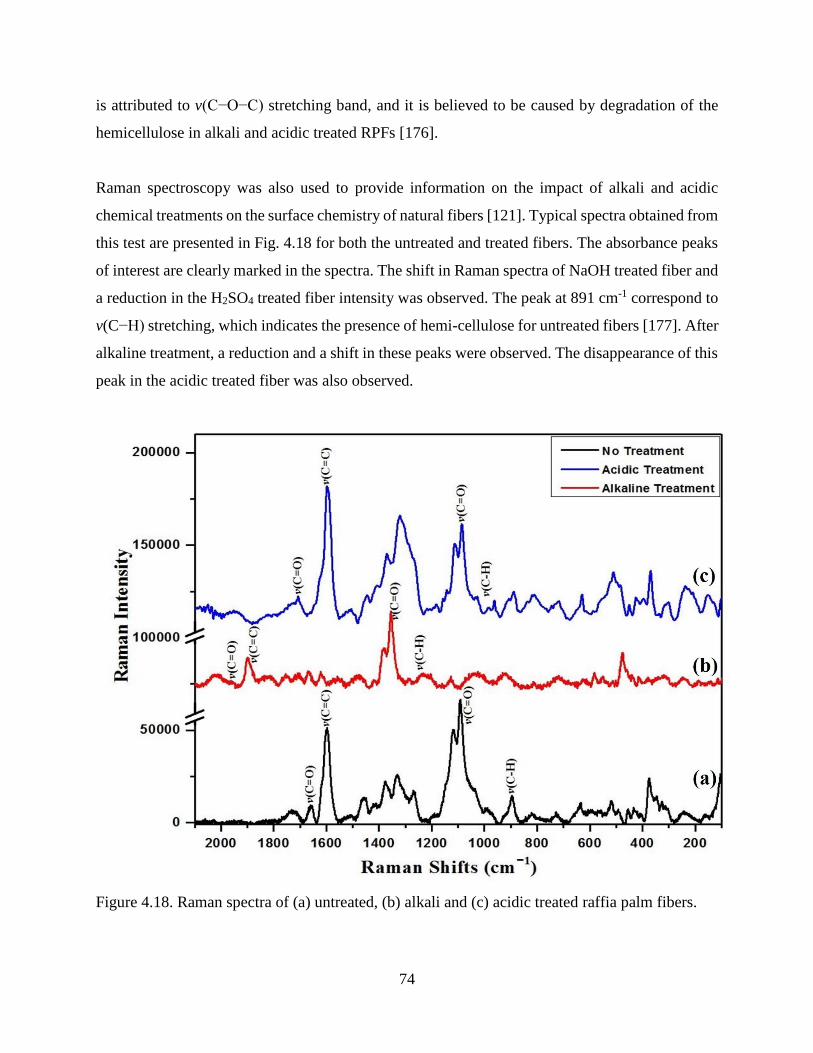
74
is attributed to v(C−O−C) stretching band, and it is believed to be caused by degradation of the
hemicellulose in alkali and acidic treated RPFs [176].
Raman spectroscopy was also used to provide information on the impact of alkali and acidic
chemical treatments on the surface chemistry of natural fibers [121]. Typical spectra obtained from
this test are presented in Fig. 4.18 for both the untreated and treated fibers. The absorbance peaks
of interest are clearly marked in the spectra. The shift in Raman spectra of NaOH treated fiber and
a reduction in the H2SO4 treated fiber intensity was observed. The peak at 891 cm-1 correspond to
v(C−H) stretching, which indicates the presence of hemi-cellulose for untreated fibers [177]. After
alkaline treatment, a reduction and a shift in these peaks were observed. The disappearance of this
peak in the acidic treated fiber was also observed.
Figure 4.18. Raman spectra of (a) untreated, (b) alkali and (c) acidic treated raffia palm fibers.
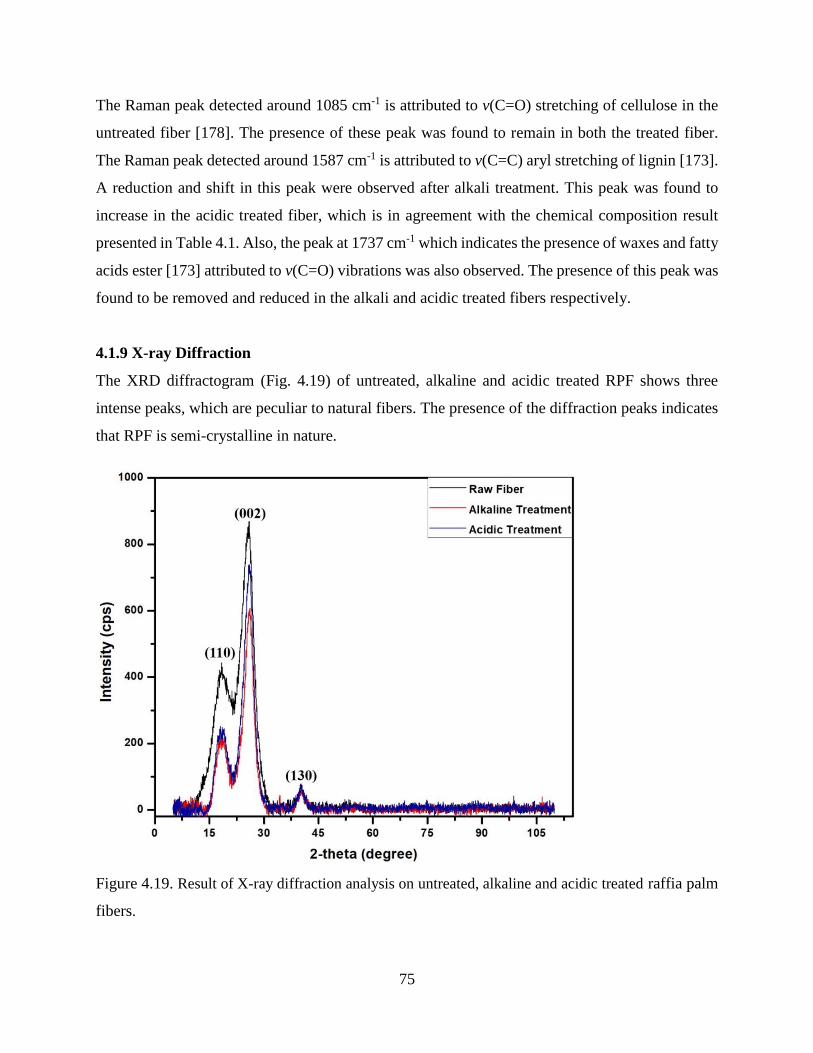
75
The Raman peak detected around 1085 cm-1 is attributed to v(C=O) stretching of cellulose in the
untreated fiber [178]. The presence of these peak was found to remain in both the treated fiber.
The Raman peak detected around 1587 cm-1 is attributed to v(C=C) aryl stretching of lignin [173].
A reduction and shift in this peak were observed after alkali treatment. This peak was found to
increase in the acidic treated fiber, which is in agreement with the chemical composition result
presented in Table 4.1. Also, the peak at 1737 cm-1 which indicates the presence of waxes and fatty
acids ester [173] attributed to v(C=O) vibrations was also observed. The presence of this peak was
found to be removed and reduced in the alkali and acidic treated fibers respectively.
4.1.9 X-ray Diffraction
The XRD diffractogram (Fig. 4.19) of untreated, alkaline and acidic treated RPF shows three
intense peaks, which are peculiar to natural fibers. The presence of the diffraction peaks indicates
that RPF is semi-crystalline in nature.
Figure 4.19. Result of X-ray diffraction analysis on untreated, alkaline and acidic treated raffia palm
fibers.
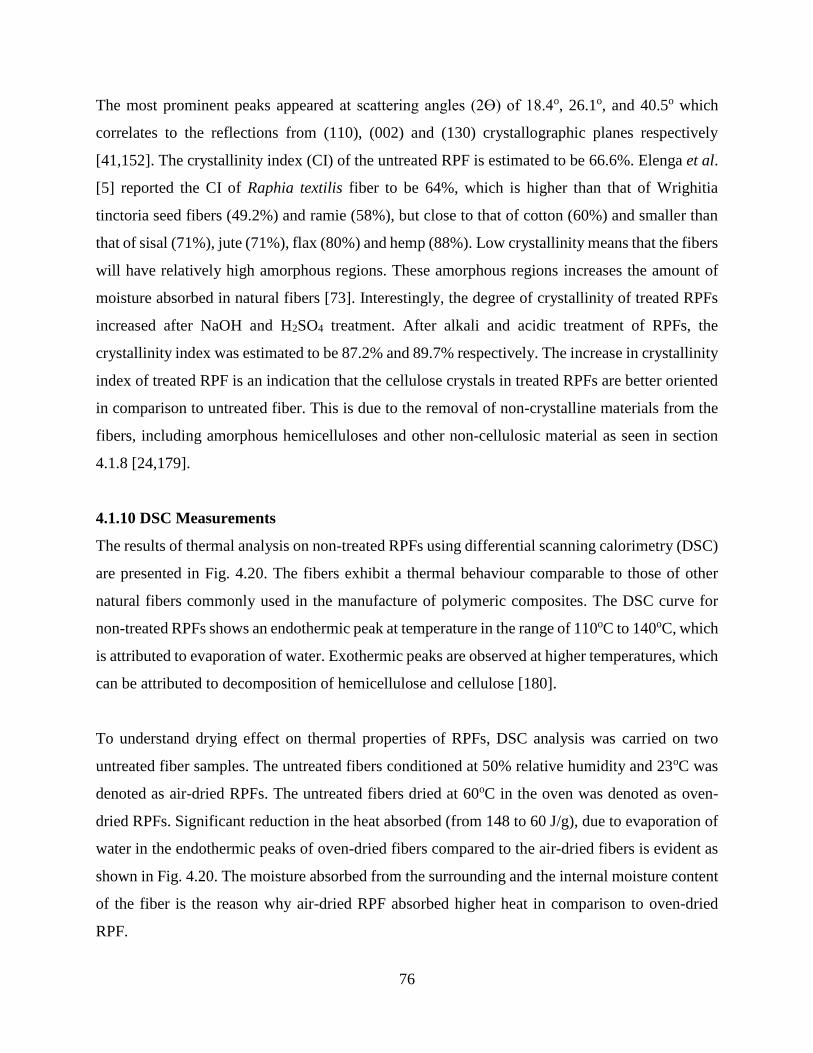
76
The most prominent peaks appeared at scattering angles (2ϴ) of 18.4o, 26.1o, and 40.5o which
correlates to the reflections from (110), (002) and (130) crystallographic planes respectively
[41,152]. The crystallinity index (CI) of the untreated RPF is estimated to be 66.6%. Elenga et al.
[5] reported the CI of Raphia textilis fiber to be 64%, which is higher than that of Wrighitia
tinctoria seed fibers (49.2%) and ramie (58%), but close to that of cotton (60%) and smaller than
that of sisal (71%), jute (71%), flax (80%) and hemp (88%). Low crystallinity means that the fibers
will have relatively high amorphous regions. These amorphous regions increases the amount of
moisture absorbed in natural fibers [73]. Interestingly, the degree of crystallinity of treated RPFs
increased after NaOH and H2SO4 treatment. After alkali and acidic treatment of RPFs, the
crystallinity index was estimated to be 87.2% and 89.7% respectively. The increase in crystallinity
index of treated RPF is an indication that the cellulose crystals in treated RPFs are better oriented
in comparison to untreated fiber. This is due to the removal of non-crystalline materials from the
fibers, including amorphous hemicelluloses and other non-cellulosic material as seen in section
4.1.8 [24,179].
4.1.10 DSC Measurements
The results of thermal analysis on non-treated RPFs using differential scanning calorimetry (DSC)
are presented in Fig. 4.20. The fibers exhibit a thermal behaviour comparable to those of other
natural fibers commonly used in the manufacture of polymeric composites. The DSC curve for
non-treated RPFs shows an endothermic peak at temperature in the range of 110oC to 140oC, which
is attributed to evaporation of water. Exothermic peaks are observed at higher temperatures, which
can be attributed to decomposition of hemicellulose and cellulose [180].
To understand drying effect on thermal properties of RPFs, DSC analysis was carried on two
untreated fiber samples. The untreated fibers conditioned at 50% relative humidity and 23oC was
denoted as air-dried RPFs. The untreated fibers dried at 60oC in the oven was denoted as oven-
dried RPFs. Significant reduction in the heat absorbed (from 148 to 60 J/g), due to evaporation of
water in the endothermic peaks of oven-dried fibers compared to the air-dried fibers is evident as
shown in Fig. 4.20. The moisture absorbed from the surrounding and the internal moisture content
of the fiber is the reason why air-dried RPF absorbed higher heat in comparison to oven-dried
RPF.
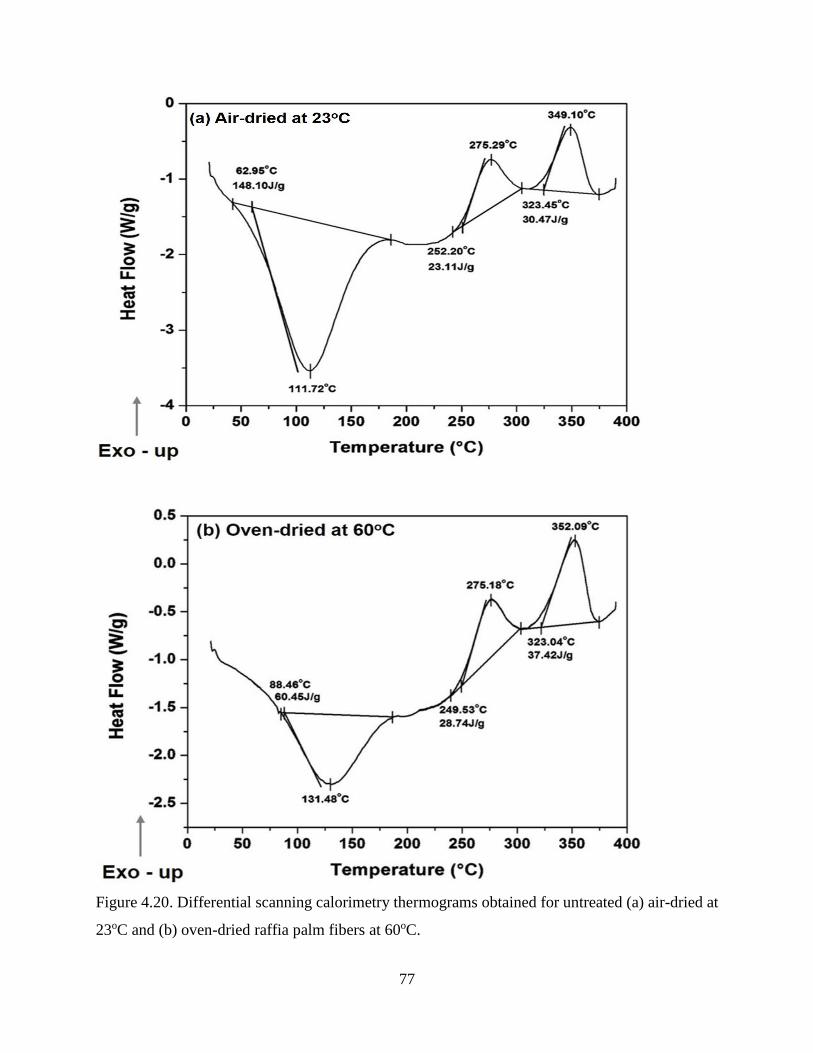
77
Figure 4.20. Differential scanning calorimetry thermograms obtained for untreated (a) air-dried at
23oC and (b) oven-dried raffia palm fibers at 60oC.

78
Furthermore, to understand the effect of fiber treatment on its thermal properties, both the alkali
and acidic treated RPFs were oven-dried at 60oC for 24 h. The DSC curves as shown in Figs. 4.21
and 4.22 reveals that there was an overall increase in the amount of heat generated, Tg value,
degradation temperature of hemicellulose and cellulose for the alkali and acidic treated fibers. A
previous study using FT-IR and Raman spectroscopy [15] indicated that structural changes in
natural fiber due to chemical treatments are likely to have direct effect on their thermal degradation
characteristics.
Figure 4.21. Differential scanning calorimetry thermogram obtained for alkaline treated raffia
palm fiber.
The removal of non-cellulosic components and increase in cellulose content after chemical
treatments leads to increase in the enthalpy values and degradation temperature of RPFs as
presented in Table 4.10. Similar results of an increase in the decomposition temperature of
cellulose from 357oC − 367oC for hemp fiber was reported by Hao [181]. The increase in the
amount of heat absorbed and degradation temperature of both hemi-cellulose and cellulose of
alkaline and acidic treated RPFs corresponds with the disappearance of the C=O band in the FTIR
spectra of the treated fibers. From FTIR and Raman results, it is apparent that this band’s

79
disappearance significantly affected the thermal degradation of the RPFs. This is probably because
more non-cellulosic materials were removed resulting in high degree of crystalline structural order,
which requires a higher degradation temperature [15].
Figure 4.22. Differential scanning calorimetry thermogram obtained for acidic treated raffia palm
fiber.
Initial degradation of RPFs started at 130oC and 96oC for alkali and acidic treated fibers
respectively, with a broad endotherm that indicates the evaporation of water molecules in the fiber
[182]. It also suggests that the fibers experienced glass transition stage at this peak temperatures
[181]. The second decomposition stage (i.e. the two exothermic peaks) is due to the degradation
of cellulosic substances such as hemi-cellulose and cellulose respectively [183]. The degradation
process involves two distinct stages. The low temperature decomposition (first exothermic peak)
observed in the temperature range 250oC - 300oC, can be attributed to the thermal degradation of
the hemicelluloses − the least thermally stable lignocellulosic component. The second
decomposition process (second exothermic peak) is observed in the temperature range 300oC −
400oC and can be attributed to the decomposition of cellulose [141]. The degradation temperature
of hemicellulose and cellulose obtained in this study is in agreement with the results published by
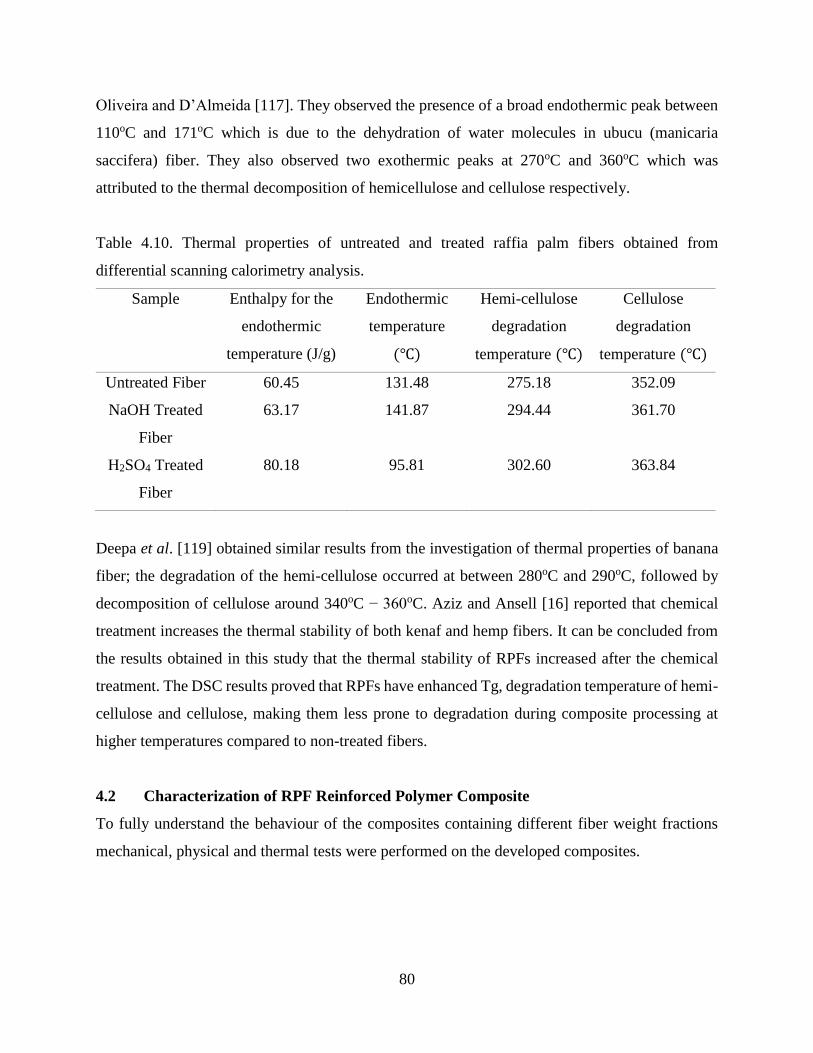
80
Oliveira and D’Almeida [117]. They observed the presence of a broad endothermic peak between
110oC and 171oC which is due to the dehydration of water molecules in ubucu (manicaria
saccifera) fiber. They also observed two exothermic peaks at 270oC and 360oC which was
attributed to the thermal decomposition of hemicellulose and cellulose respectively.
Table 4.10. Thermal properties of untreated and treated raffia palm fibers obtained from
differential scanning calorimetry analysis.
Sample Enthalpy for the
endothermic
temperature (J/g)
Endothermic
temperature
(℃)
Hemi-cellulose
degradation
temperature (℃)
Cellulose
degradation
temperature (℃)
Untreated Fiber 60.45 131.48 275.18 352.09
NaOH Treated
Fiber
63.17 141.87 294.44 361.70
H2SO4 Treated
Fiber
80.18 95.81 302.60 363.84
Deepa et al. [119] obtained similar results from the investigation of thermal properties of banana
fiber; the degradation of the hemi-cellulose occurred at between 280oC and 290oC, followed by
decomposition of cellulose around 340oC − 360oC. Aziz and Ansell [16] reported that chemical
treatment increases the thermal stability of both kenaf and hemp fibers. It can be concluded from
the results obtained in this study that the thermal stability of RPFs increased after the chemical
treatment. The DSC results proved that RPFs have enhanced Tg, degradation temperature of hemi-
cellulose and cellulose, making them less prone to degradation during composite processing at
higher temperatures compared to non-treated fibers.
4.2 Characterization of RPF Reinforced Polymer Composite
To fully understand the behaviour of the composites containing different fiber weight fractions
mechanical, physical and thermal tests were performed on the developed composites.
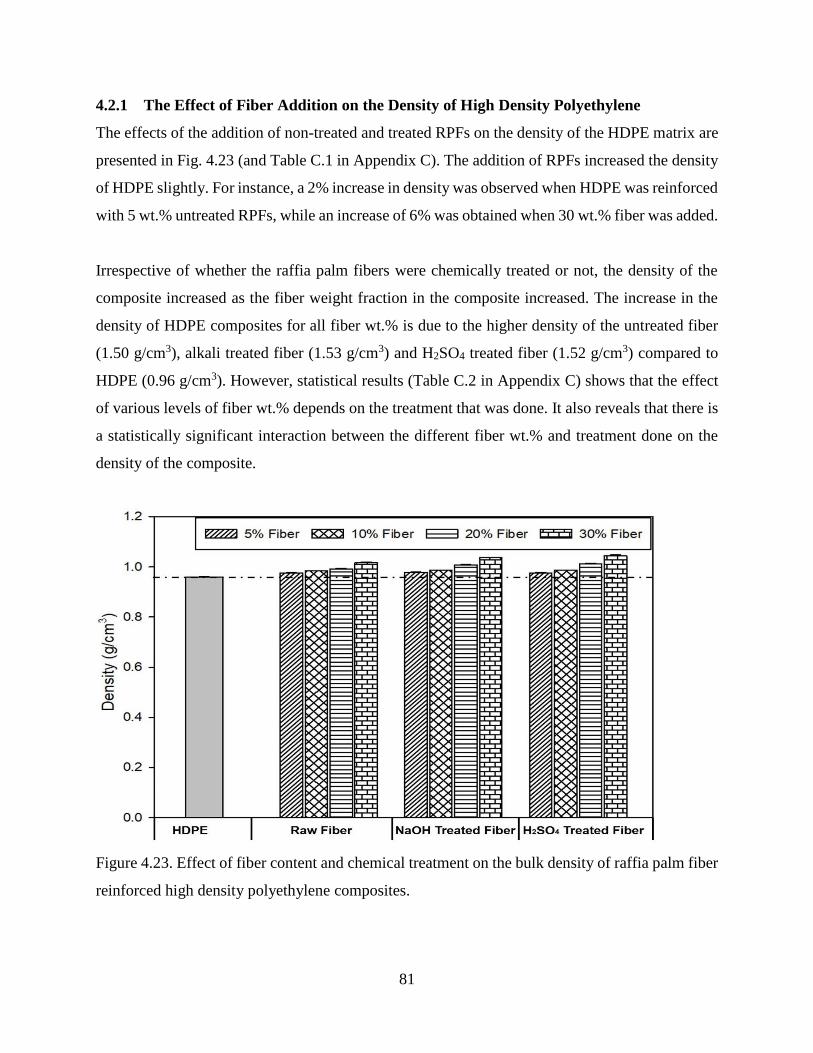
81
4.2.1 The Effect of Fiber Addition on the Density of High Density Polyethylene
The effects of the addition of non-treated and treated RPFs on the density of the HDPE matrix are
presented in Fig. 4.23 (and Table C.1 in Appendix C). The addition of RPFs increased the density
of HDPE slightly. For instance, a 2% increase in density was observed when HDPE was reinforced
with 5 wt.% untreated RPFs, while an increase of 6% was obtained when 30 wt.% fiber was added.
Irrespective of whether the raffia palm fibers were chemically treated or not, the density of the
composite increased as the fiber weight fraction in the composite increased. The increase in the
density of HDPE composites for all fiber wt.% is due to the higher density of the untreated fiber
(1.50 g/cm3), alkali treated fiber (1.53 g/cm3) and H2SO4 treated fiber (1.52 g/cm3) compared to
HDPE (0.96 g/cm3). However, statistical results (Table C.2 in Appendix C) shows that the effect
of various levels of fiber wt.% depends on the treatment that was done. It also reveals that there is
a statistically significant interaction between the different fiber wt.% and treatment done on the
density of the composite.
Figure 4.23. Effect of fiber content and chemical treatment on the bulk density of raffia palm fiber
reinforced high density polyethylene composites.
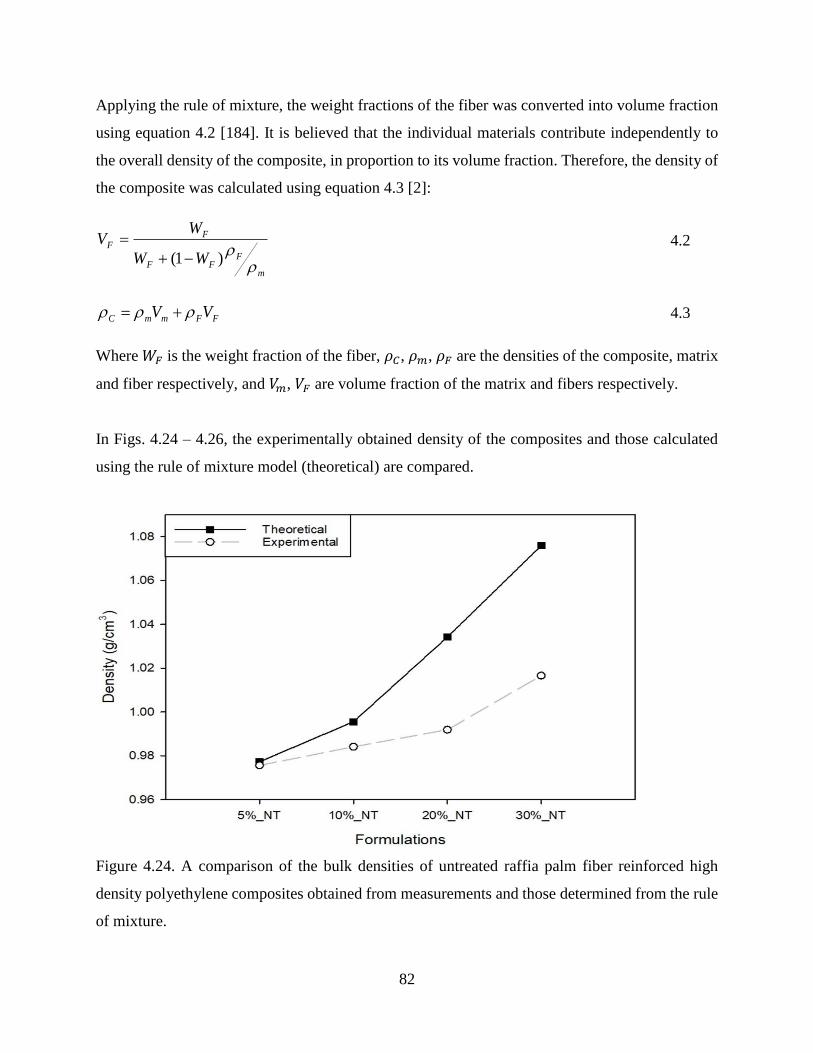
82
Applying the rule of mixture, the weight fractions of the fiber was converted into volume fraction
using equation 4.2 [184]. It is believed that the individual materials contribute independently to
the overall density of the composite, in proportion to its volume fraction. Therefore, the density of
the composite was calculated using equation 4.3 [2]:
m
FFF
FF
WW
WV
)1(
4.2
FFmmC VV 4.3
Where 𝑊𝐹 is the weight fraction of the fiber, 𝜌𝐶, 𝜌𝑚, 𝜌𝐹 are the densities of the composite, matrix
and fiber respectively, and 𝑉𝑚, 𝑉𝐹 are volume fraction of the matrix and fibers respectively.
In Figs. 4.24 – 4.26, the experimentally obtained density of the composites and those calculated
using the rule of mixture model (theoretical) are compared.
Figure 4.24. A comparison of the bulk densities of untreated raffia palm fiber reinforced high
density polyethylene composites obtained from measurements and those determined from the rule
of mixture.
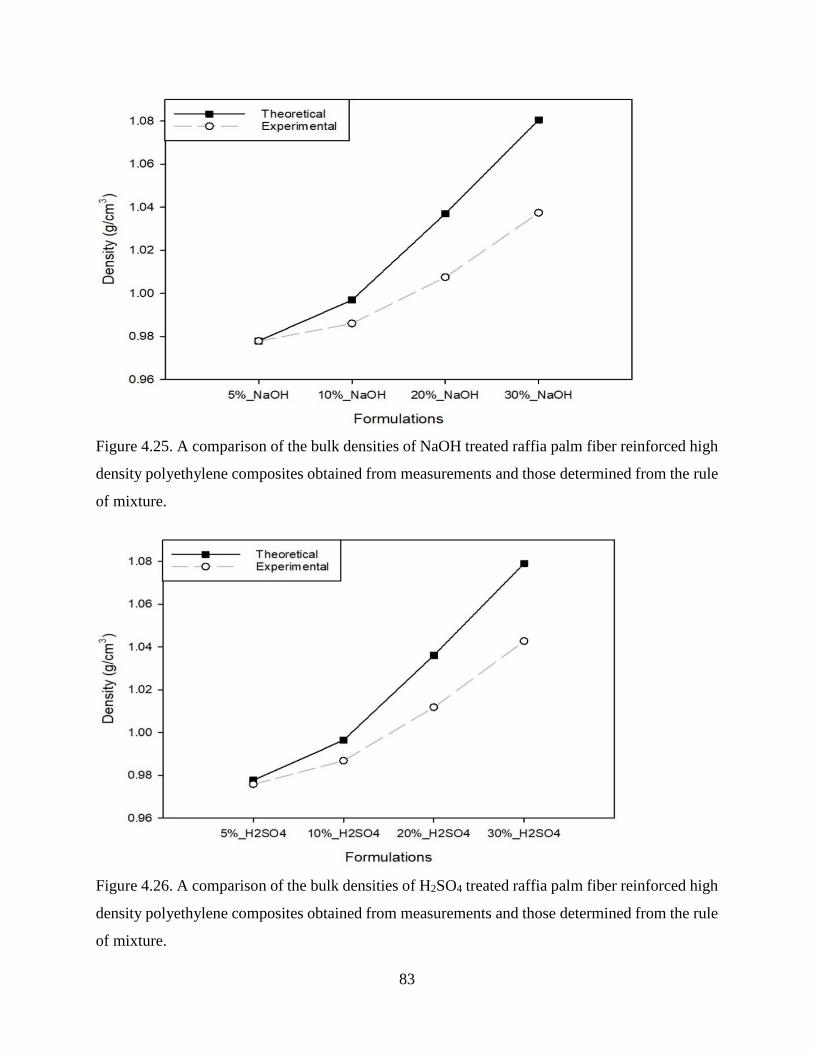
83
Figure 4.25. A comparison of the bulk densities of NaOH treated raffia palm fiber reinforced high
density polyethylene composites obtained from measurements and those determined from the rule
of mixture.
Figure 4.26. A comparison of the bulk densities of H2SO4 treated raffia palm fiber reinforced high
density polyethylene composites obtained from measurements and those determined from the rule
of mixture.
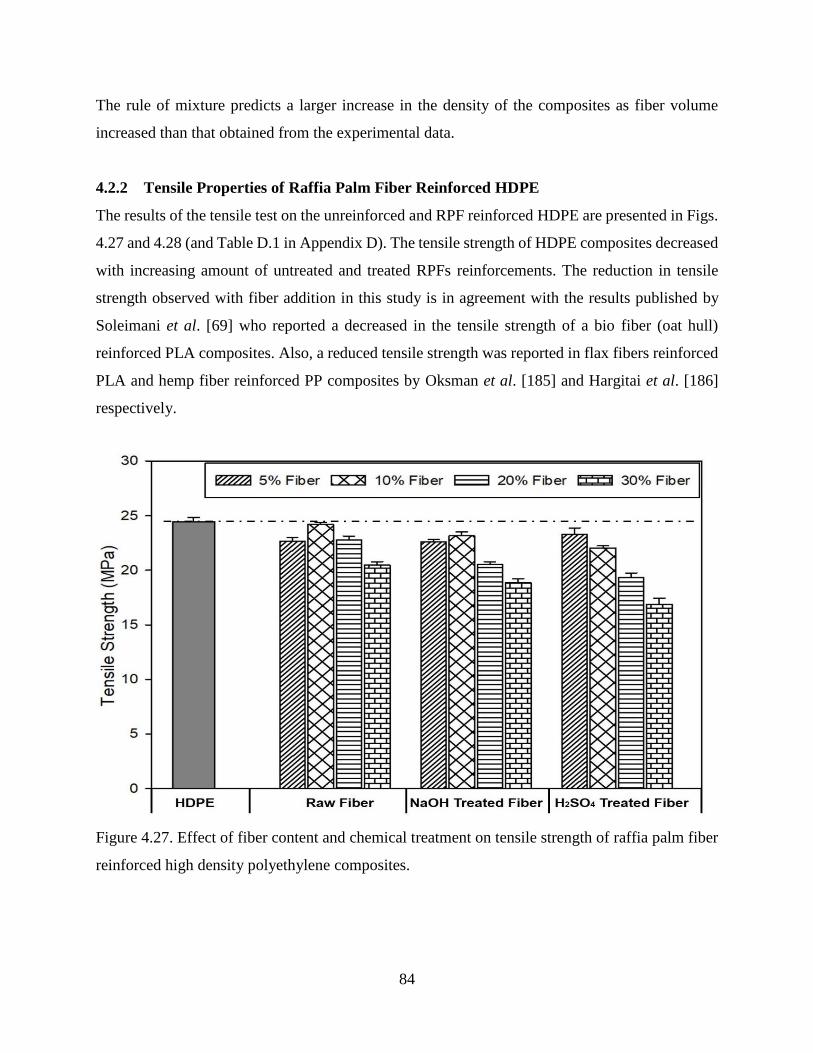
84
The rule of mixture predicts a larger increase in the density of the composites as fiber volume
increased than that obtained from the experimental data.
4.2.2 Tensile Properties of Raffia Palm Fiber Reinforced HDPE
The results of the tensile test on the unreinforced and RPF reinforced HDPE are presented in Figs.
4.27 and 4.28 (and Table D.1 in Appendix D). The tensile strength of HDPE composites decreased
with increasing amount of untreated and treated RPFs reinforcements. The reduction in tensile
strength observed with fiber addition in this study is in agreement with the results published by
Soleimani et al. [69] who reported a decreased in the tensile strength of a bio fiber (oat hull)
reinforced PLA composites. Also, a reduced tensile strength was reported in flax fibers reinforced
PLA and hemp fiber reinforced PP composites by Oksman et al. [185] and Hargitai et al. [186]
respectively.
Figure 4.27. Effect of fiber content and chemical treatment on tensile strength of raffia palm fiber
reinforced high density polyethylene composites.
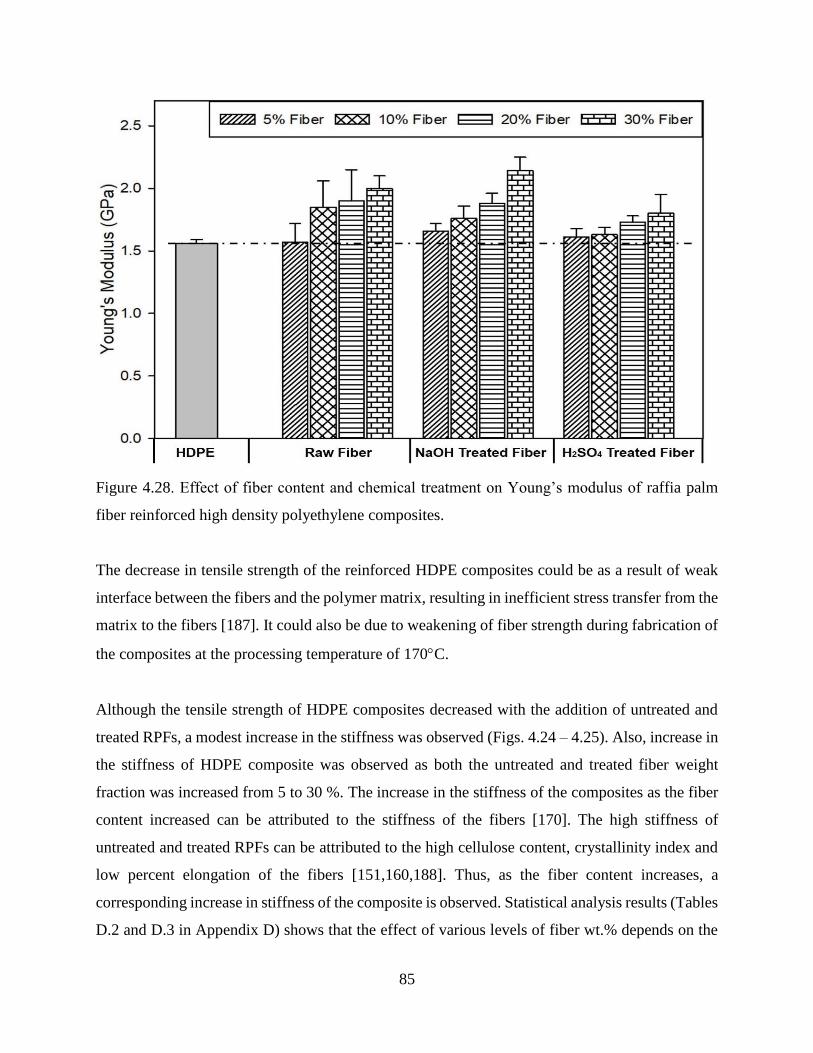
85
Figure 4.28. Effect of fiber content and chemical treatment on Young’s modulus of raffia palm
fiber reinforced high density polyethylene composites.
The decrease in tensile strength of the reinforced HDPE composites could be as a result of weak
interface between the fibers and the polymer matrix, resulting in inefficient stress transfer from the
matrix to the fibers [187]. It could also be due to weakening of fiber strength during fabrication of
the composites at the processing temperature of 170C.
Although the tensile strength of HDPE composites decreased with the addition of untreated and
treated RPFs, a modest increase in the stiffness was observed (Figs. 4.24 – 4.25). Also, increase in
the stiffness of HDPE composite was observed as both the untreated and treated fiber weight
fraction was increased from 5 to 30 %. The increase in the stiffness of the composites as the fiber
content increased can be attributed to the stiffness of the fibers [170]. The high stiffness of
untreated and treated RPFs can be attributed to the high cellulose content, crystallinity index and
low percent elongation of the fibers [151,160,188]. Thus, as the fiber content increases, a
corresponding increase in stiffness of the composite is observed. Statistical analysis results (Tables
D.2 and D.3 in Appendix D) shows that the effect of various levels of fiber wt.% depends on the

86
treatment that was done. It also reveals that there is a statistically significant interaction between
the different fiber wt.% and treatment done on the tensile strength and Young’s modulus of the
composite. A similar study by Arrakhiz et al. [189] on the mechanical properties of LDPE
composites shows that the addition of doum fibers enhanced the stiffness of the polymer matrix
while the tensile strength decreased. Also, Hargitai et al. [186] reported an increase in the stiffness
of polypropylene (PP) when reinforced with hemp fiber in comparison to unreinforced PP.
4.2.3 Fractography of Failed Tensile Specimens
SEM micrographs showing the fracture surfaces of the composites subjected to tensile loads are
presented in Fig. 4.29. The failure modes included fiber pull-out, fiber splitting, debonding, and
fiber fracture. The SEM micrograph (Figs. 29 a - b) shows that there are gaps between the polymer
and untreated fibers which is an indication of poor bonding between the matrix and the fiber. As
reported earlier (section 4.1.4), chemical treatments reduced the tensile strength of RPFs which
led to weaker fibers. Therefore, the decrease in tensile strength of treated RPFs reinforced HDPE
composites could be as a result of the low tensile strength reported for the treated fibers. Due to
the low tensile strength of the treated fibers, the fracture failure [as shown in Figs. 4.29 (c-e)] of
the treated fibers reinforced HDPE composite was mainly due to fiber fracture and splitting. Also
at higher fiber content, the decrease in the tensile strength of HDPE composites could be as a result
of inefficient stress transfer due to fiber agglomeration in the matrix [180].
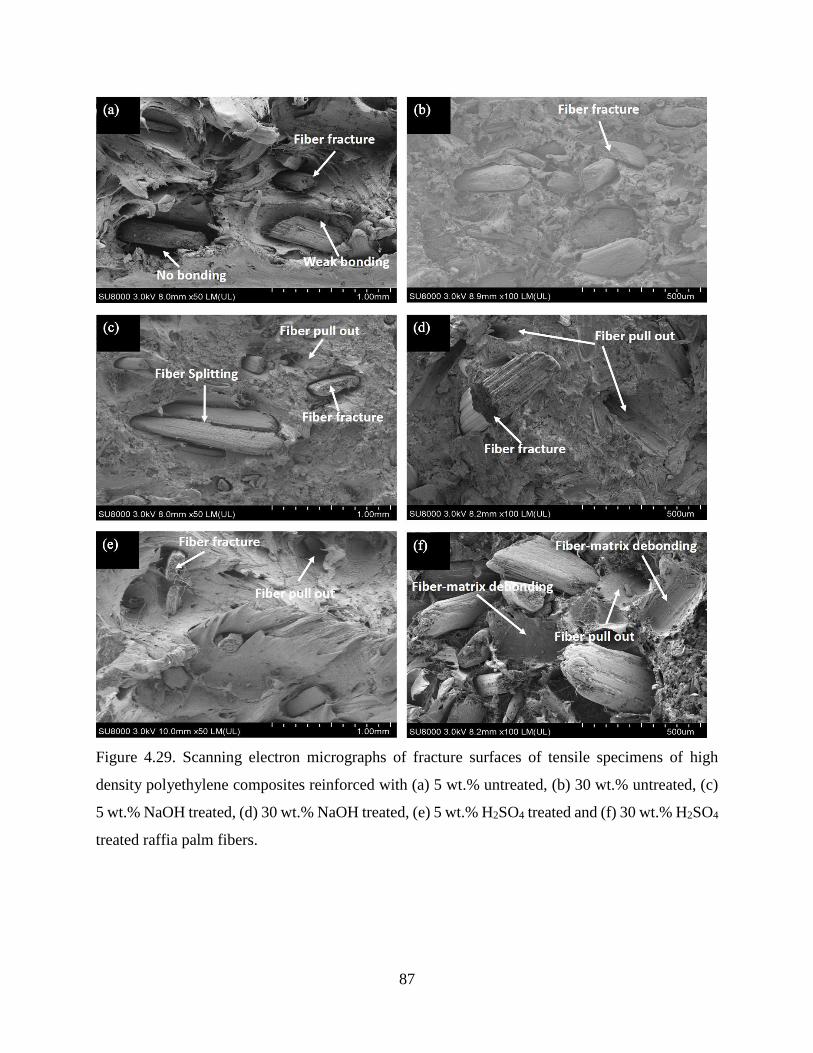
87
Figure 4.29. Scanning electron micrographs of fracture surfaces of tensile specimens of high
density polyethylene composites reinforced with (a) 5 wt.% untreated, (b) 30 wt.% untreated, (c)
5 wt.% NaOH treated, (d) 30 wt.% NaOH treated, (e) 5 wt.% H2SO4 treated and (f) 30 wt.% H2SO4
treated raffia palm fibers.
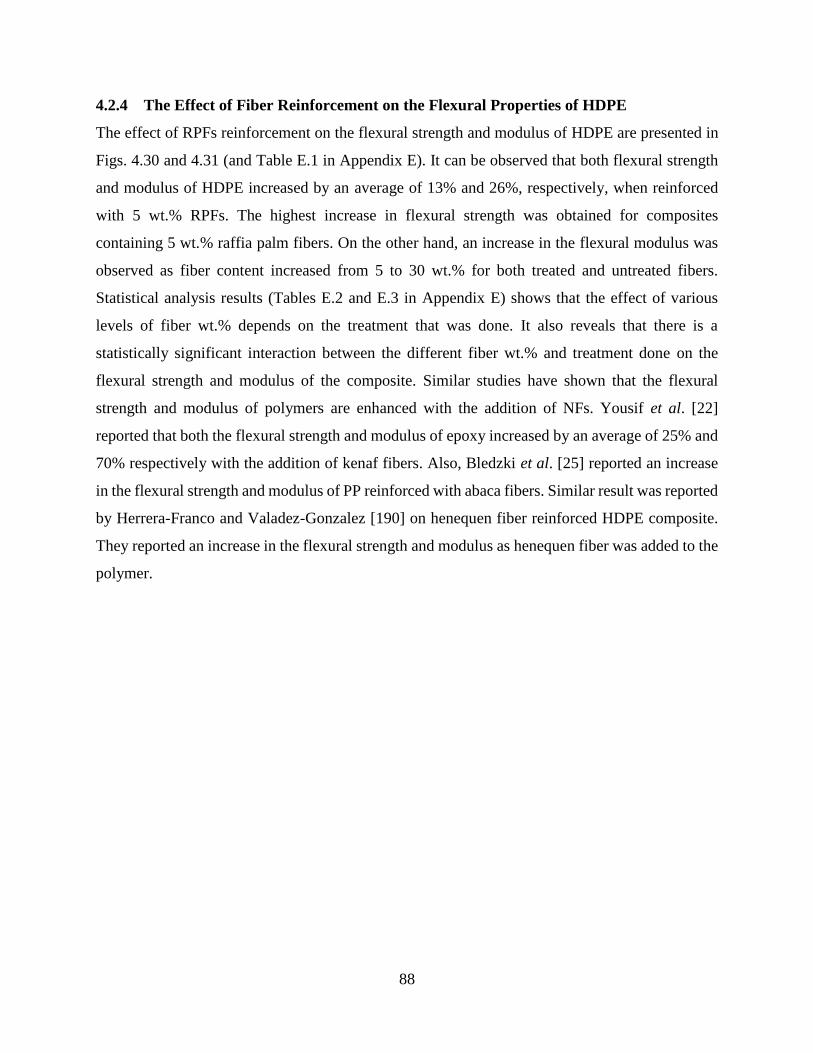
88
4.2.4 The Effect of Fiber Reinforcement on the Flexural Properties of HDPE
The effect of RPFs reinforcement on the flexural strength and modulus of HDPE are presented in
Figs. 4.30 and 4.31 (and Table E.1 in Appendix E). It can be observed that both flexural strength
and modulus of HDPE increased by an average of 13% and 26%, respectively, when reinforced
with 5 wt.% RPFs. The highest increase in flexural strength was obtained for composites
containing 5 wt.% raffia palm fibers. On the other hand, an increase in the flexural modulus was
observed as fiber content increased from 5 to 30 wt.% for both treated and untreated fibers.
Statistical analysis results (Tables E.2 and E.3 in Appendix E) shows that the effect of various
levels of fiber wt.% depends on the treatment that was done. It also reveals that there is a
statistically significant interaction between the different fiber wt.% and treatment done on the
flexural strength and modulus of the composite. Similar studies have shown that the flexural
strength and modulus of polymers are enhanced with the addition of NFs. Yousif et al. [22]
reported that both the flexural strength and modulus of epoxy increased by an average of 25% and
70% respectively with the addition of kenaf fibers. Also, Bledzki et al. [25] reported an increase
in the flexural strength and modulus of PP reinforced with abaca fibers. Similar result was reported
by Herrera-Franco and Valadez-Gonzalez [190] on henequen fiber reinforced HDPE composite.
They reported an increase in the flexural strength and modulus as henequen fiber was added to the
polymer.
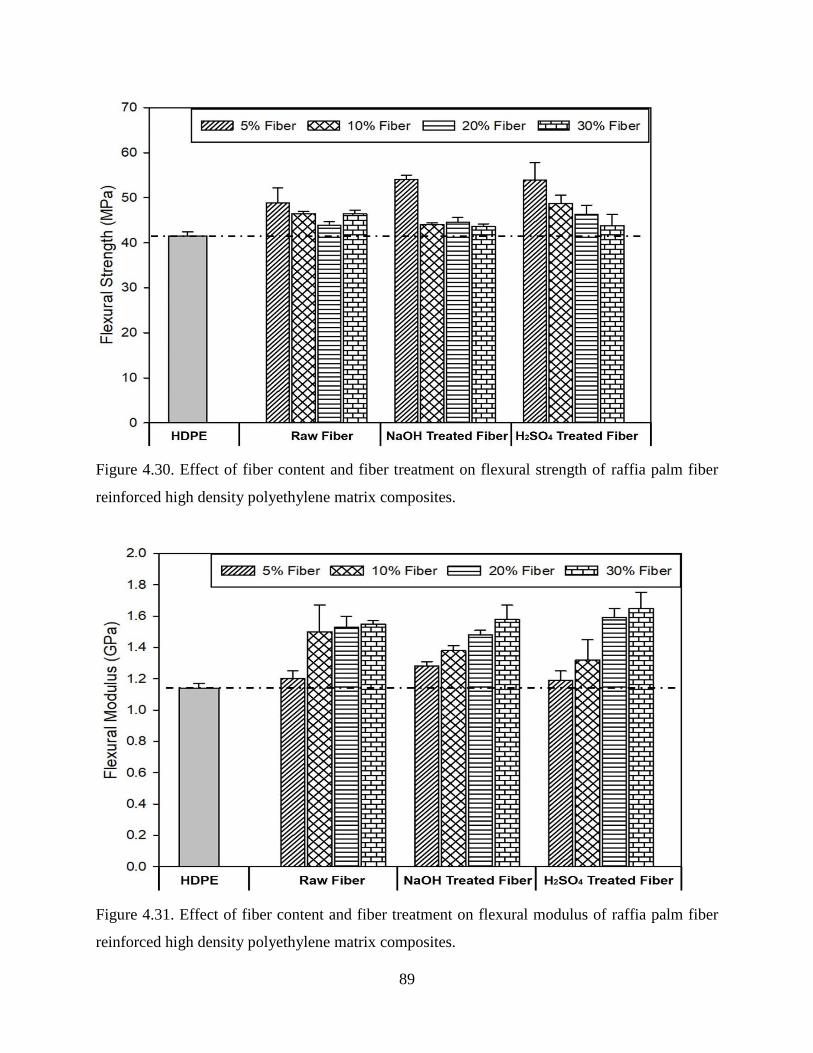
89
Figure 4.30. Effect of fiber content and fiber treatment on flexural strength of raffia palm fiber
reinforced high density polyethylene matrix composites.
Figure 4.31. Effect of fiber content and fiber treatment on flexural modulus of raffia palm fiber
reinforced high density polyethylene matrix composites.
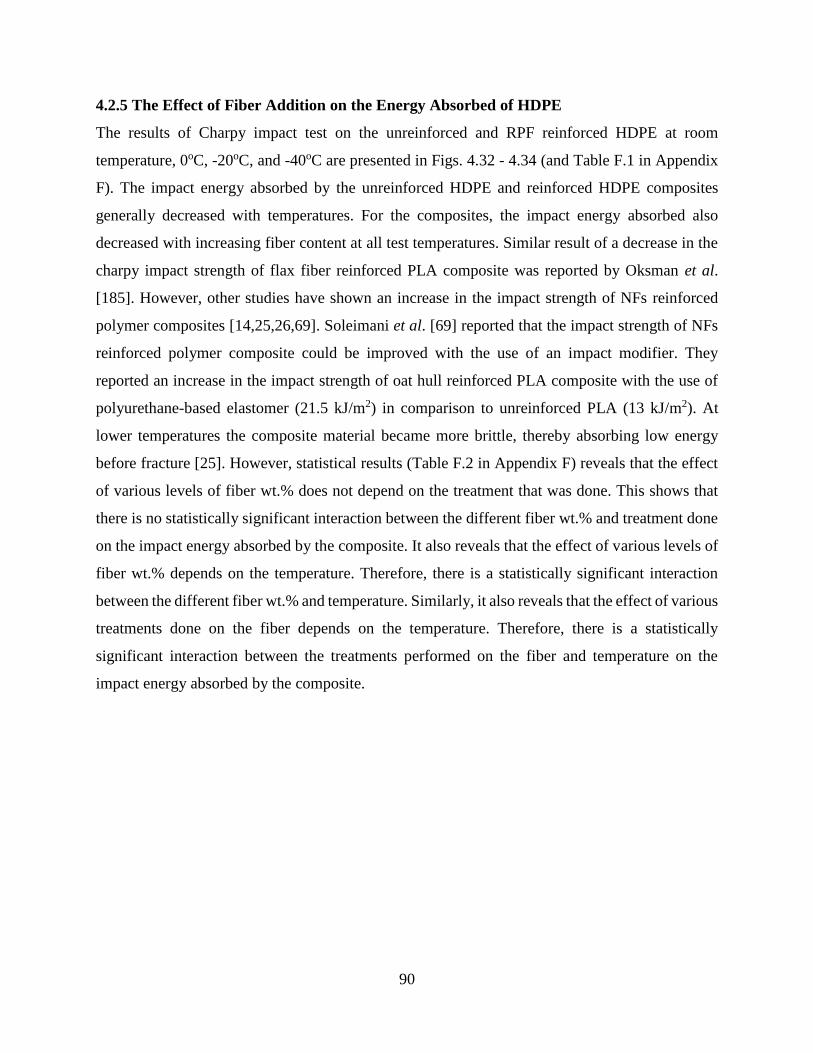
90
4.2.5 The Effect of Fiber Addition on the Energy Absorbed of HDPE
The results of Charpy impact test on the unreinforced and RPF reinforced HDPE at room
temperature, 0oC, -20oC, and -40oC are presented in Figs. 4.32 - 4.34 (and Table F.1 in Appendix
F). The impact energy absorbed by the unreinforced HDPE and reinforced HDPE composites
generally decreased with temperatures. For the composites, the impact energy absorbed also
decreased with increasing fiber content at all test temperatures. Similar result of a decrease in the
charpy impact strength of flax fiber reinforced PLA composite was reported by Oksman et al.
[185]. However, other studies have shown an increase in the impact strength of NFs reinforced
polymer composites [14,25,26,69]. Soleimani et al. [69] reported that the impact strength of NFs
reinforced polymer composite could be improved with the use of an impact modifier. They
reported an increase in the impact strength of oat hull reinforced PLA composite with the use of
polyurethane-based elastomer (21.5 kJ/m2) in comparison to unreinforced PLA (13 kJ/m2). At
lower temperatures the composite material became more brittle, thereby absorbing low energy
before fracture [25]. However, statistical results (Table F.2 in Appendix F) reveals that the effect
of various levels of fiber wt.% does not depend on the treatment that was done. This shows that
there is no statistically significant interaction between the different fiber wt.% and treatment done
on the impact energy absorbed by the composite. It also reveals that the effect of various levels of
fiber wt.% depends on the temperature. Therefore, there is a statistically significant interaction
between the different fiber wt.% and temperature. Similarly, it also reveals that the effect of various
treatments done on the fiber depends on the temperature. Therefore, there is a statistically
significant interaction between the treatments performed on the fiber and temperature on the
impact energy absorbed by the composite.
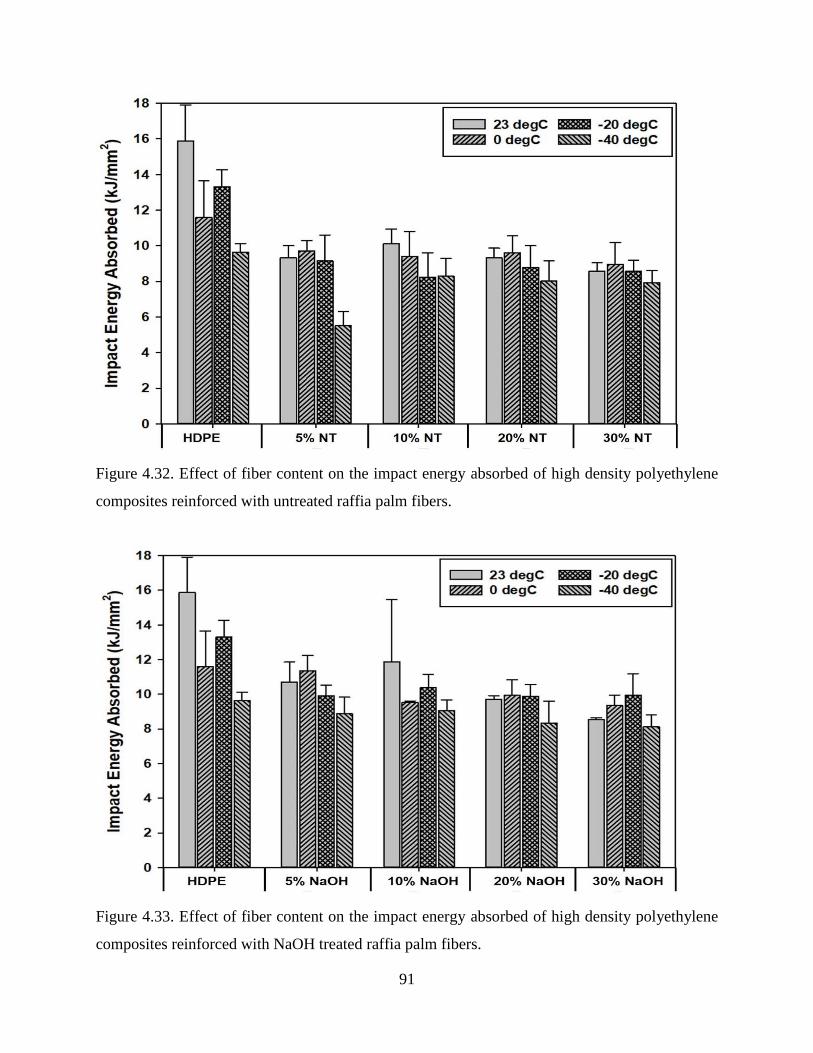
91
Figure 4.32. Effect of fiber content on the impact energy absorbed of high density polyethylene
composites reinforced with untreated raffia palm fibers.
Figure 4.33. Effect of fiber content on the impact energy absorbed of high density polyethylene
composites reinforced with NaOH treated raffia palm fibers.
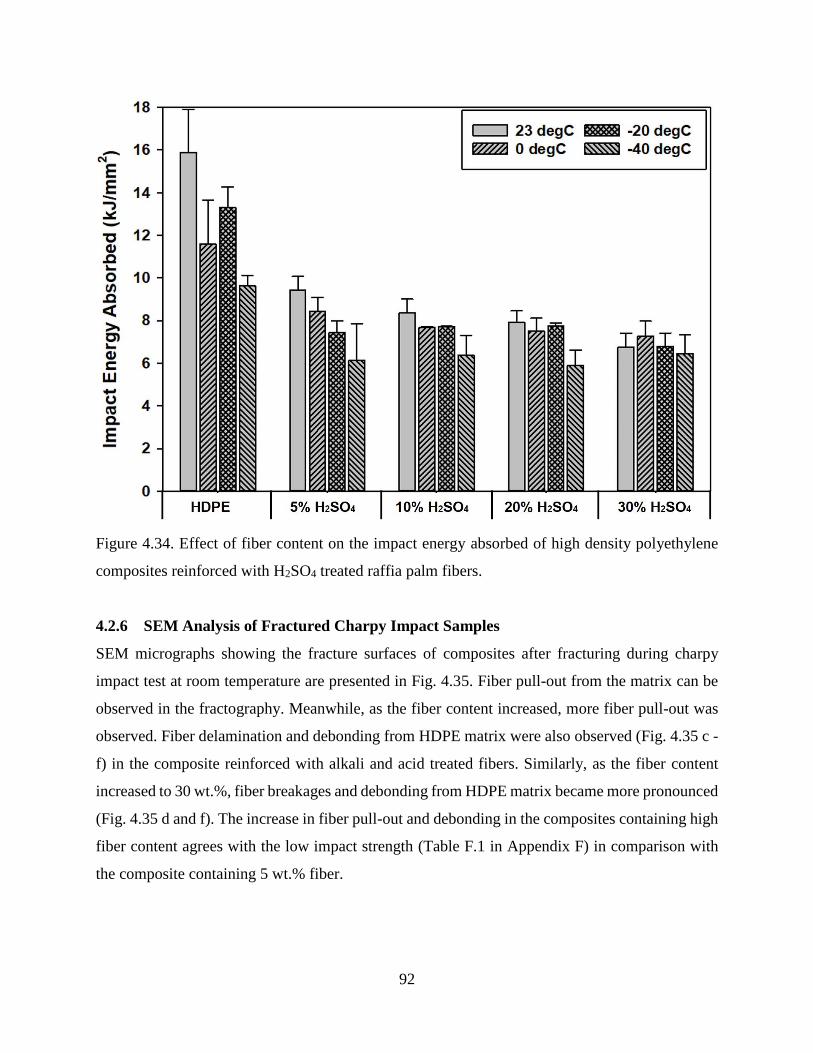
92
Figure 4.34. Effect of fiber content on the impact energy absorbed of high density polyethylene
composites reinforced with H2SO4 treated raffia palm fibers.
4.2.6 SEM Analysis of Fractured Charpy Impact Samples
SEM micrographs showing the fracture surfaces of composites after fracturing during charpy
impact test at room temperature are presented in Fig. 4.35. Fiber pull-out from the matrix can be
observed in the fractography. Meanwhile, as the fiber content increased, more fiber pull-out was
observed. Fiber delamination and debonding from HDPE matrix were also observed (Fig. 4.35 c -
f) in the composite reinforced with alkali and acid treated fibers. Similarly, as the fiber content
increased to 30 wt.%, fiber breakages and debonding from HDPE matrix became more pronounced
(Fig. 4.35 d and f). The increase in fiber pull-out and debonding in the composites containing high
fiber content agrees with the low impact strength (Table F.1 in Appendix F) in comparison with
the composite containing 5 wt.% fiber.
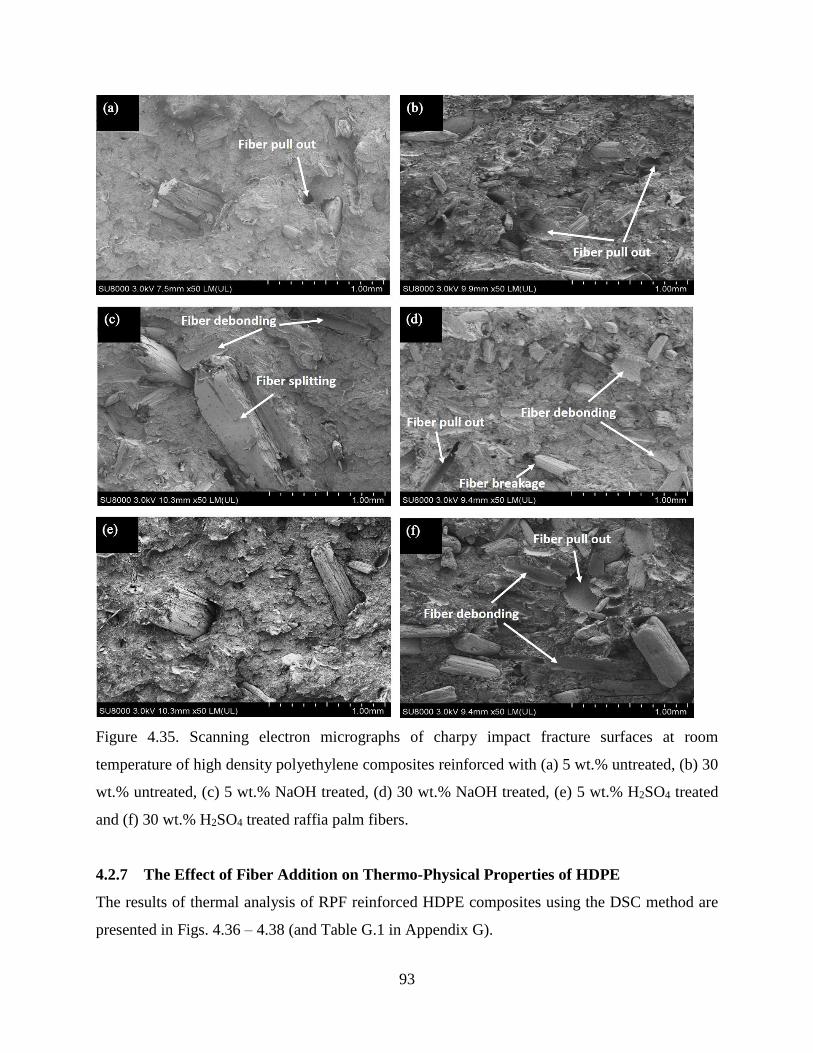
93
Figure 4.35. Scanning electron micrographs of charpy impact fracture surfaces at room
temperature of high density polyethylene composites reinforced with (a) 5 wt.% untreated, (b) 30
wt.% untreated, (c) 5 wt.% NaOH treated, (d) 30 wt.% NaOH treated, (e) 5 wt.% H2SO4 treated
and (f) 30 wt.% H2SO4 treated raffia palm fibers.
4.2.7 The Effect of Fiber Addition on Thermo-Physical Properties of HDPE
The results of thermal analysis of RPF reinforced HDPE composites using the DSC method are
presented in Figs. 4.36 – 4.38 (and Table G.1 in Appendix G).
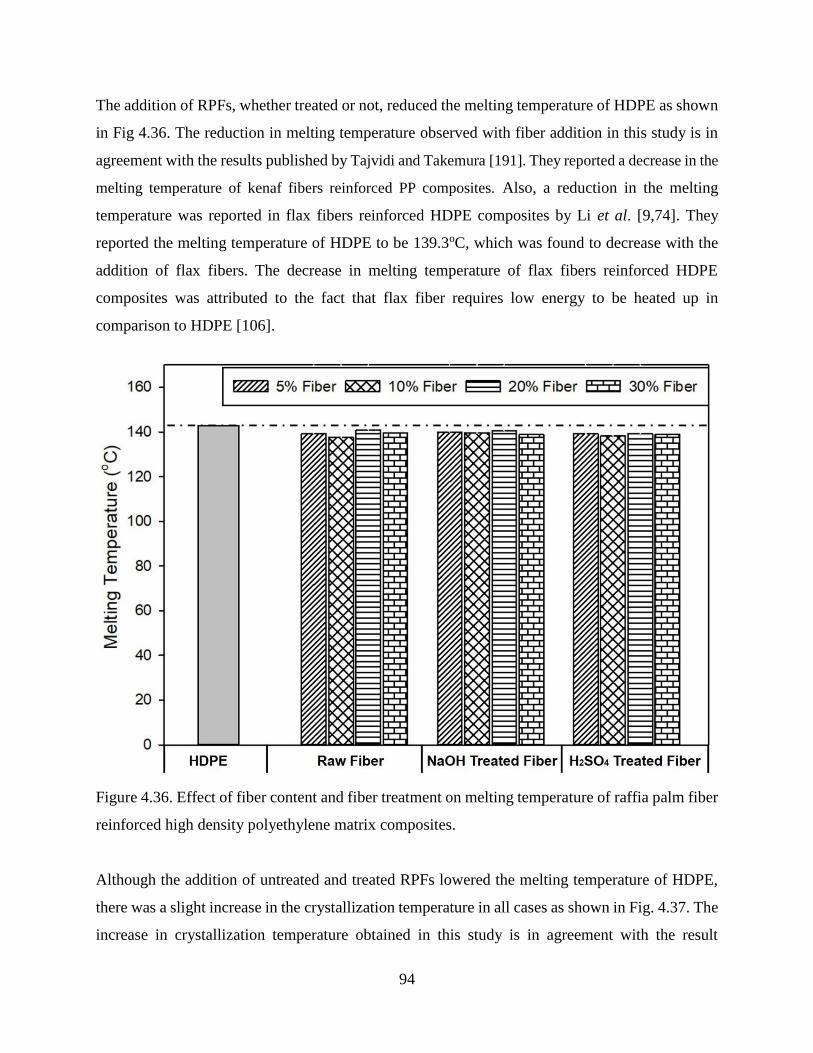
94
The addition of RPFs, whether treated or not, reduced the melting temperature of HDPE as shown
in Fig 4.36. The reduction in melting temperature observed with fiber addition in this study is in
agreement with the results published by Tajvidi and Takemura [191]. They reported a decrease in the
melting temperature of kenaf fibers reinforced PP composites. Also, a reduction in the melting
temperature was reported in flax fibers reinforced HDPE composites by Li et al. [9,74]. They
reported the melting temperature of HDPE to be 139.3oC, which was found to decrease with the
addition of flax fibers. The decrease in melting temperature of flax fibers reinforced HDPE
composites was attributed to the fact that flax fiber requires low energy to be heated up in
comparison to HDPE [106].
Figure 4.36. Effect of fiber content and fiber treatment on melting temperature of raffia palm fiber
reinforced high density polyethylene matrix composites.
Although the addition of untreated and treated RPFs lowered the melting temperature of HDPE,
there was a slight increase in the crystallization temperature in all cases as shown in Fig. 4.37. The
increase in crystallization temperature obtained in this study is in agreement with the result
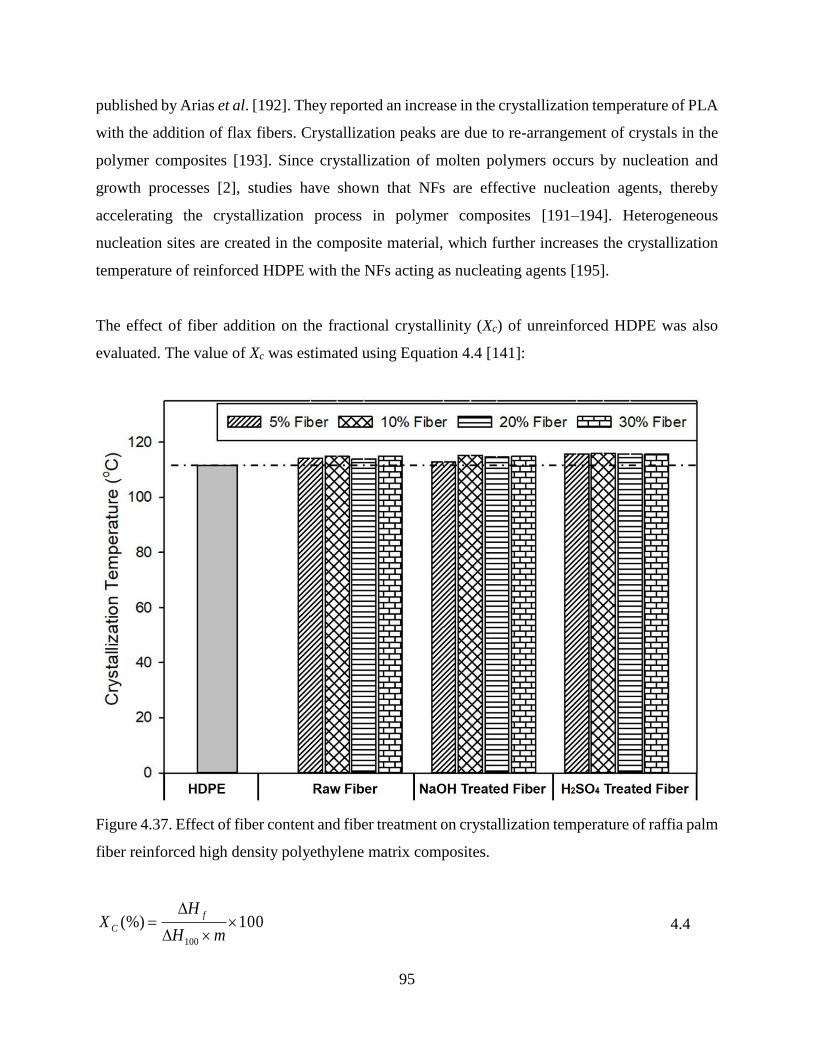
95
published by Arias et al. [192]. They reported an increase in the crystallization temperature of PLA
with the addition of flax fibers. Crystallization peaks are due to re-arrangement of crystals in the
polymer composites [193]. Since crystallization of molten polymers occurs by nucleation and
growth processes [2], studies have shown that NFs are effective nucleation agents, thereby
accelerating the crystallization process in polymer composites [191–194]. Heterogeneous
nucleation sites are created in the composite material, which further increases the crystallization
temperature of reinforced HDPE with the NFs acting as nucleating agents [195].
The effect of fiber addition on the fractional crystallinity (Xc) of unreinforced HDPE was also
evaluated. The value of Xc was estimated using Equation 4.4 [141]:
Figure 4.37. Effect of fiber content and fiber treatment on crystallization temperature of raffia palm
fiber reinforced high density polyethylene matrix composites.
100(%)100
mH
HX
f
C 4.4

96
where ∆𝐻𝑓, 𝑚, ∆𝐻100, are respectively the heat of fusion of the sample, mass fraction of polymer
in the composites and heat of fusion of 100% crystalline polymer. The ∆𝐻100 value of HDPE is
290 J/g [196]. The heats of fusion of the samples were determined by integrating the areas under
their respective melting peaks.
It was found that as the amount of RPFs increased, there was a slight increase in the crystallinity
of the reinforced HDPE (Fig. 4.38). Due to the creation of heterogeneous nucleation sites, which
resulted in an increase in the crystallization temperature of HDPE composites with the addition
NFs, an increase in the crystallinity of the polymer was reported in other studies [197,198]. The
increase in crystallinity obtained in this study agrees with the result published by Tajvidi and
Takemura [191]. They reported an increase in the crystallinity of HDPE with the addition of kenaf
fibers. Also, an increase in the crystallinity of PP with the addition of sisal fibers was reported by
Ibrahim et al. [14].
Figure 4.38. Effect of fiber content and fiber treatment on fractional crystallinity of raffia palm
fiber reinforced high density polyethylene matrix composites.
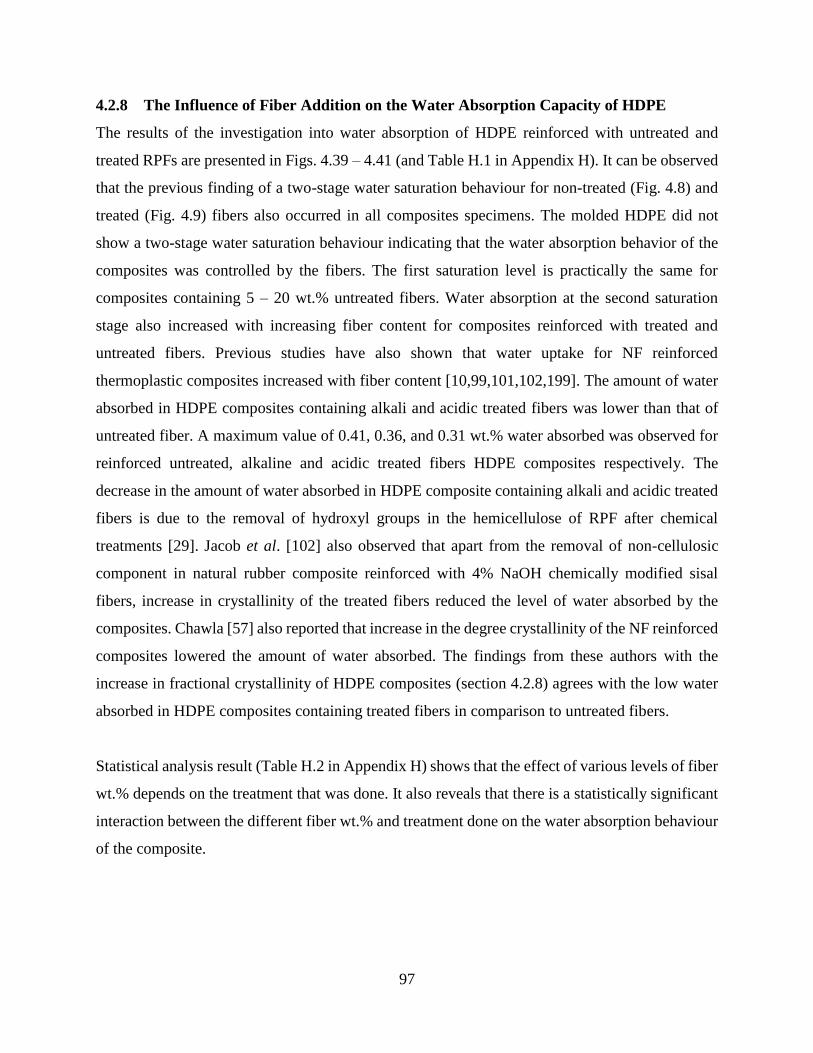
97
4.2.8 The Influence of Fiber Addition on the Water Absorption Capacity of HDPE
The results of the investigation into water absorption of HDPE reinforced with untreated and
treated RPFs are presented in Figs. 4.39 – 4.41 (and Table H.1 in Appendix H). It can be observed
that the previous finding of a two-stage water saturation behaviour for non-treated (Fig. 4.8) and
treated (Fig. 4.9) fibers also occurred in all composites specimens. The molded HDPE did not
show a two-stage water saturation behaviour indicating that the water absorption behavior of the
composites was controlled by the fibers. The first saturation level is practically the same for
composites containing 5 – 20 wt.% untreated fibers. Water absorption at the second saturation
stage also increased with increasing fiber content for composites reinforced with treated and
untreated fibers. Previous studies have also shown that water uptake for NF reinforced
thermoplastic composites increased with fiber content [10,99,101,102,199]. The amount of water
absorbed in HDPE composites containing alkali and acidic treated fibers was lower than that of
untreated fiber. A maximum value of 0.41, 0.36, and 0.31 wt.% water absorbed was observed for
reinforced untreated, alkaline and acidic treated fibers HDPE composites respectively. The
decrease in the amount of water absorbed in HDPE composite containing alkali and acidic treated
fibers is due to the removal of hydroxyl groups in the hemicellulose of RPF after chemical
treatments [29]. Jacob et al. [102] also observed that apart from the removal of non-cellulosic
component in natural rubber composite reinforced with 4% NaOH chemically modified sisal
fibers, increase in crystallinity of the treated fibers reduced the level of water absorbed by the
composites. Chawla [57] also reported that increase in the degree crystallinity of the NF reinforced
composites lowered the amount of water absorbed. The findings from these authors with the
increase in fractional crystallinity of HDPE composites (section 4.2.8) agrees with the low water
absorbed in HDPE composites containing treated fibers in comparison to untreated fibers.
Statistical analysis result (Table H.2 in Appendix H) shows that the effect of various levels of fiber
wt.% depends on the treatment that was done. It also reveals that there is a statistically significant
interaction between the different fiber wt.% and treatment done on the water absorption behaviour
of the composite.
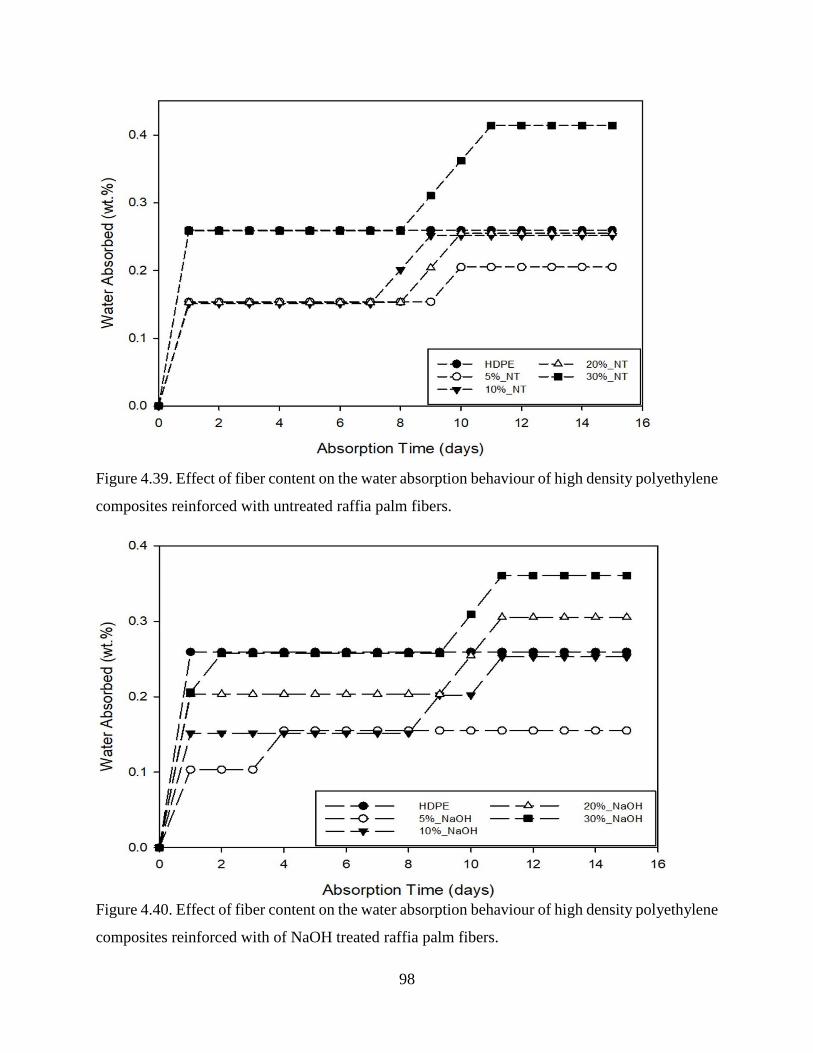
98
Figure 4.39. Effect of fiber content on the water absorption behaviour of high density polyethylene
composites reinforced with untreated raffia palm fibers.
Figure 4.40. Effect of fiber content on the water absorption behaviour of high density polyethylene
composites reinforced with of NaOH treated raffia palm fibers.
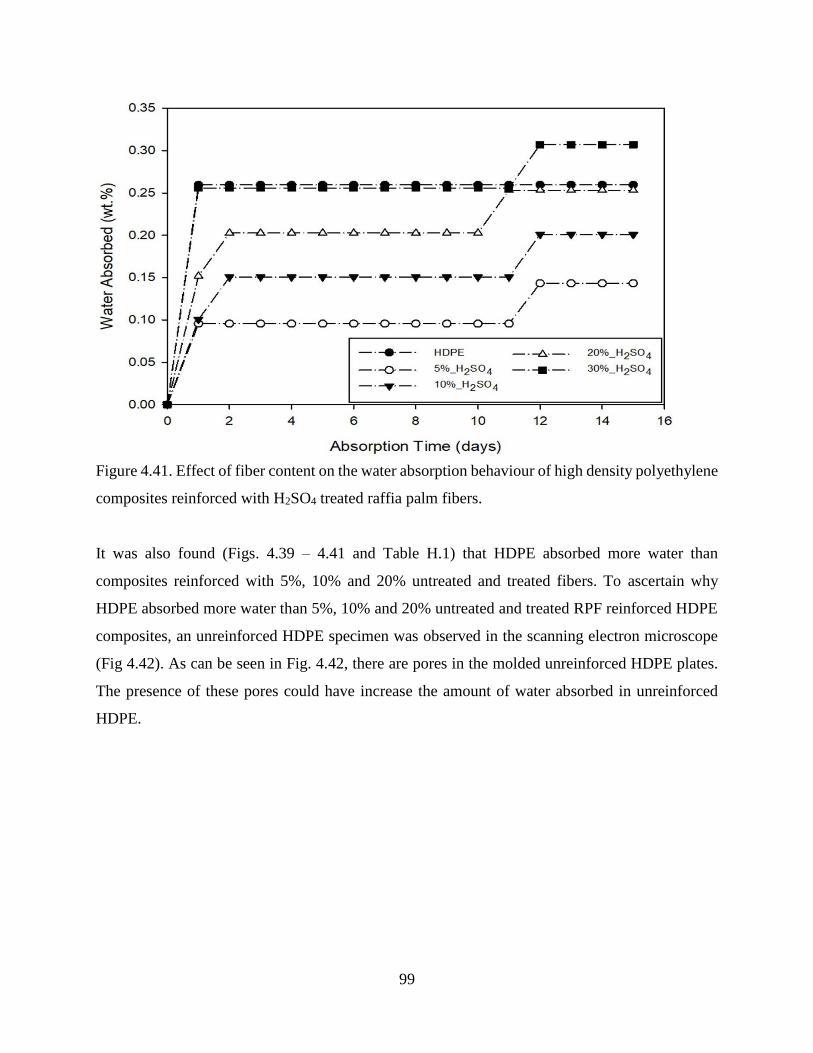
99
Figure 4.41. Effect of fiber content on the water absorption behaviour of high density polyethylene
composites reinforced with H2SO4 treated raffia palm fibers.
It was also found (Figs. 4.39 – 4.41 and Table H.1) that HDPE absorbed more water than
composites reinforced with 5%, 10% and 20% untreated and treated fibers. To ascertain why
HDPE absorbed more water than 5%, 10% and 20% untreated and treated RPF reinforced HDPE
composites, an unreinforced HDPE specimen was observed in the scanning electron microscope
(Fig 4.42). As can be seen in Fig. 4.42, there are pores in the molded unreinforced HDPE plates.
The presence of these pores could have increase the amount of water absorbed in unreinforced
HDPE.
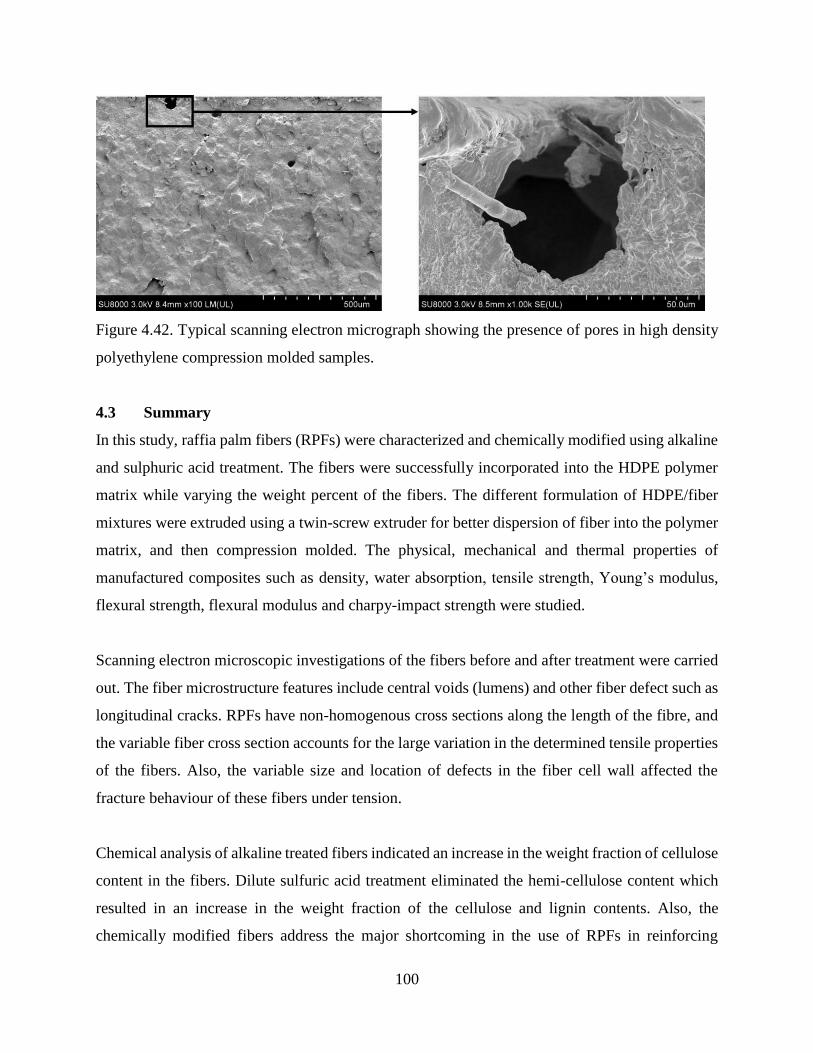
100
Figure 4.42. Typical scanning electron micrograph showing the presence of pores in high density
polyethylene compression molded samples.
4.3 Summary
In this study, raffia palm fibers (RPFs) were characterized and chemically modified using alkaline
and sulphuric acid treatment. The fibers were successfully incorporated into the HDPE polymer
matrix while varying the weight percent of the fibers. The different formulation of HDPE/fiber
mixtures were extruded using a twin-screw extruder for better dispersion of fiber into the polymer
matrix, and then compression molded. The physical, mechanical and thermal properties of
manufactured composites such as density, water absorption, tensile strength, Young’s modulus,
flexural strength, flexural modulus and charpy-impact strength were studied.
Scanning electron microscopic investigations of the fibers before and after treatment were carried
out. The fiber microstructure features include central voids (lumens) and other fiber defect such as
longitudinal cracks. RPFs have non-homogenous cross sections along the length of the fibre, and
the variable fiber cross section accounts for the large variation in the determined tensile properties
of the fibers. Also, the variable size and location of defects in the fiber cell wall affected the
fracture behaviour of these fibers under tension.
Chemical analysis of alkaline treated fibers indicated an increase in the weight fraction of cellulose
content in the fibers. Dilute sulfuric acid treatment eliminated the hemi-cellulose content which
resulted in an increase in the weight fraction of the cellulose and lignin contents. Also, the
chemically modified fibers address the major shortcoming in the use of RPFs in reinforcing

101
polymer matrix composite. It was observed that the water absorption of reinforced HDPE
composites was influenced by the addition of fibers. Also, composites reinforced with sulphuric
acid treated fibers showed the lowest water absorbed, in comparison to composites reinforced with
alkali treated and non-treated fibers. The mechanical properties of HDPE reinforced composites
(especially Young’s modulus, flexural strength and flexural modulus) are higher than that of
unreinforced HDPE.
102
CHAPTER 5
CONCLUSIONS AND RECOMMENDATIONS
In this research work, fiber reinforced polymer matrix composites were developed from raffia palm
fibers and high-density polyethylene (HDPE) using extrusion and compression molding
techniques. The mechanical and physical properties related to both the fiber and composites were
investigated.
5.1 Conclusions
The following conclusions are made based on the experimental results and analysis of the data:
1. Chemical treatment of raffia palm fibers with NaOH and H2SO4 changed both the
morphological and chemical properties of the fiber. The surfaces of the treated fiber are much
cleaner than those of untreated fibers which suggests the removal of removed wax, oil and
impurities from the surfaces of the fibers by the chemicals.
2. Structural changes occur in the non-cellulosic components of RPFs after alkali and acidic
treatments as revealed by FTIRS and Raman. Certain chemical groups were removed upon
chemical treatment, thereby rendering fewer hydroxyl groups in the fiber available for
reactions.
3. The crystallinity index of the RPFs increase by chemical treatment. The highest crystallinity
index of 89.7% was observed for the acid treated fiber.
4. DSC results showed an increase in the thermal degradation temperature of RPFs chemical
composition in the treated fibers in comparison to untreated fiber.
5. An increase in the density of the composites was observed for both untreated, alkaline and
acidic treated fibers. As the fiber content of the composites increased, there was a
corresponding increase in the density of the composites. A 2% increase in density was
observed when HDPE was reinforced with 5wt. % untreated RPFs, while an increase of 6%
was obtained when 30 wt.% fiber was added.
6. Young’s modulus, flexural strength, flexural modulus, water absorption capacity, and
fractional crystallinity of HDPE composites increases as the fiber content of the composites
is increased. In contrast, the tensile strength, charpy-impact strength and melting temperature
of the composites decreased when compared with unreinforced HDPE.
103
5.2 Recommendations for Future Work
For future research work, the following recommendations are suggested:
1. NaOH and H2SO4 chemical treatments were used in this study to modify the surface chemistry
of the fiber. Other treatments such as silane, acetylation, sodium chlorite, and the use of
coupling agents such as maleic anhydride-polypropylene (MAPP), maleic anhydride grafted
polyethylene (MA-g-PE) may also be considered. These treatments and couplings can further
improve the interfacial adhesion in the composite.
2. Optimizing the processing conditions in extrusion molding technique may be investigated in
future work, for example investigating the effect of extrusion screw speed between 120 and
170 rpm on composites performance.
3. Investigation the use of synchrotron Mid-IR to map the hemicellulose component of raffia
palm fiber.
104
REFERENCES
1. Brigante, D. New Composite Materials: Selection, Design and Application. Springer Int.
Publ. Switz. 2014, 1–179, doi:10.1007/978-3-319-01637-5.
2. William D. Callister, J.; Rethwisch, D. G. Materials Science and Engineering: An
Introduction 9E. John Wiley Sons, Inc 2014, 9, 266–267.
3. J. Santhosh; N. Balanarasimman; R. Chandrasekar; Raja, S. Study of Properties of Banana
Fiber Reinforced Composites. Int. J. Res. Eng. Technol. 2014, 3, 144–150.
4. Thiruchitrambalam, M.; Athijayamani, A.; Sathiyamurthy, S.; Thaheer, A. S. A. A Review
on the Natural Fiber-Reinforced Polymer Composites for the Development of Roselle Fiber-
Reinforced Polyester Composite. J. Nat. Fibers 2010, 7, 307–323.
5. Elenga, R. G.; Dirras, G. F.; Goma Maniongui, J.; Djemia, P.; Biget, M. P. On the
microstructure and physical properties of untreated raffia textilis fiber. Compos. Part A
Appl. Sci. Manuf. 2009, 40, 418–422.
6. Mohammed, L.; Ansari, M. N. M.; Pua, G.; Jawaid, M.; Islam, M. S. A Review on Natural
Fiber Reinforced Polymer Composite and Its Applications. Int. J. Polym. Sci. 2015,
doi:10.1155/2015/243947.
7. Holbery, J.; Houston, D. Natural-fibre-reinforced polymer composites in automotive
applications. Jom 2006, 58, 80–86.
8. Chinga-carrasco, G.; Aslan, M.; Sørensen, B. F.; Madsen, B. Strength variability of single
flax fibres. J. Mater. Sci. 2011, 46, 6344–6354.
9. Li, X.; Tabil, L. G.; Panigrahi, S.; Crerar, W. J. The Influence of Fiber Content on Properties
of Injection Molded Flax Fiber-HDPE Biocomposites. CSBE/SCGAB, Edmonton, AB
Canada, 2006, doi:10.13031/2013.22101.
10. Arbelaiz, A.; Fernández, B.; Ramos, J. A.; Retegi, A.; Llano-Ponte, R.; Mondragon, I.
Mechanical properties of short flax fibre bundle/polypropylene composites: Influence of
matrix/fibre modification, fibre content, water uptake and recycling. Compos. Sci. Technol.
2005, 65, 1582–1592.
11. Aslan, M. Characterisation of Flax Fibres and Flax Fibre Composites: being cellulose based
sources of materials. Phd Thesis; Tech. Univ. Denmark 2012, 18–45.
12. Joseph, K.; Thomast, S.; Pavithran, C. Effect of chemical treatment on the tensile properties
of short sisal fibre-reinforced polyethylene composites. Polym. 1996, 37, 5139–5149.
105
13. Li, Y.; Mai, Y.-W.; Ye, L. Sisal fibre and its composites: a review of recent developments.
Compos. Sci. Technol. 2000, 60, 2037–2055.
14. Ibrahim, I. D.; Jamiru, T.; Sadiku, R. E.; Kupolati, W. K.; Agwuncha, S. C. Dependency of
the Mechanical Properties of Sisal Fiber Reinforced Recycled Polypropylene Composites
on Fiber Surface Treatment, Fiber Content and Nanoclay. J. Polym. Environ. 2017, 25, 427–
434.
15. Ouajai, S.; Shanks, R. A. Composition, structure and thermal degradation of hemp cellulose
after chemical treatments. Polym. Degrad. Stab. 2005, 89, 327–335.
16. Aziz, S. H.; Ansell, M. P. The effect of alkalization and fibre alignment on the mechanical
and thermal properties of kenaf and hemp bast fibre composites: Part 1 - polyester resin
matrix. Compos. Sci. Technol. 2004, 64, 1219–1230.
17. Elkhaoulani, A.; Arrakhiz, F. Z.; Benmoussa, K.; Bouhfid, R.; Qaiss, A. Mechanical and
thermal properties of polymer composite based on natural fibers: Moroccan hemp
fibers/polypropylene. Mater. Des. 2013, 49, 203–208.
18. Khan, F.; Ahmad, S. R. Chemical modification and spectroscopic analysis of jute fibre.
Polym. Degrad. Stab. 1996, 52, 335–340.
19. Corrales, F.; Vilaseca, F.; Llop, M.; Girones, J.; Mendez, J. A.; Mutje, P. Chemical
modification of jute fibers for the production of green-composites. J. Hazard. Mater. 2007,
144, 730–735.
20. Pujari, S.; Ramakrishna, A.; Kumar, M. S. Comparison of Jute and Banana Fiber
Composites : A Review. Int. J. Curr. Eng. Technol. 2014, 121–126,
doi:10.14741/ijcet/spl.2.2014.22.
21. Edeerozey, A. M. M.; Akil, H. M.; Azhar, A. B.; Ariffin, M. I. Z. Chemical modification of
kenaf fibers. Mater. Lett. 2007, 61, 2023–2025.
22. Yousif, B. F.; Shalwan, A.; Chin, C. W.; Ming, K. C. Flexural properties of treated and
untreated kenaf/epoxy composites. Mater. Des. 2012, 40, 378–385.
23. El-Shekeil, Y. A.; Sapuan, S. M.; Abdan, K.; Zainudin, E. S. Influence of fiber content on
the mechanical and thermal properties of Kenaf fiber reinforced thermoplastic polyurethane
composites. Mater. Des. 2012, 40, 299–303.
24. Cai, M.; Takagi, H.; Nakagaito, A. N.; Li, Y.; Waterhouse, G. I. N. Effect of alkali treatment
on interfacial bonding in abaca fiber-reinforced composites. Compos. Part A Appl. Sci.

106
Manuf. 2016, 90, 589–597.
25. Bledzki, A. K.; Mamun, A. A.; Faruk, O. Abaca fibre reinforced PP composites and
comparison with jute and flax fibre PP composites. Express Polym. Lett. 2007, 1, 755–762.
26. Punyamurthy, R.; Sampathkumar, D. Abaca Fiber Reinforced Epoxy Composites :
Evaluation of Impact Strength. Int. J. Sci. Basic Appl. Res. 4531, 305–317.
27. Ronald Aseer, J.; Sankaranarayanasamy, K.; Jayabalan, P.; Natarajan, R.; Priya Dasan, K.
Morphological, Physical, and Thermal Properties of Chemically Treated Banana Fiber. J.
Nat. Fibers 2013, 10, 365–380.
28. Mathura, N.; Cree, D. Characterization and mechanical property of Trinidad coir fibers. J.
Appl. Polym. Sci. 2016, 1–9, doi:10.1002/app.43692.
29. Mir, S. S.; Hasan, M.; Hasan, S. M. N.; Hossain, M. J.; Nafsin, N. Effect of Chemical
Treatment on the Properties of Coir Fiber Reinforced Polypropylene and Polyethylene
Composites. Polym. Compos. 2015, 1259–1265, doi:10.1002/pc.
30. S, J.; Deka, H.; Varghese, T. O.; Nayak, S. K. Recent Development and Future Trends in
Coir Fiber-Reinforced Green Polymer Composites: Review and Evaluation. Polym.
Compos. 2016, 37, 3296–3309.
31. Lavoratti, A.; Romanzini, D.; Amico, S. C.; Zattera, A. J. Influence of Fibre Treatment on
the Characteristics of Buriti and Ramie Polyester Composites. Polym. Polym. Compos.
2017, 25, 247–256.
32. Zhang, Y.; Wen, B.; Cao, L.; Li, X.; Zhang, J. Preparation and properties of unmodified
ramie fiber reinforced polypropylene composites. J. Wuhan Univ. Technol. Sci. Ed. 2015,
30, 198–202.
33. Barkoula, N. M.; Alcock, B.; Cabrera, N. O.; Peijs, T. Fatigue properties of highly oriented
polypropylene tapes and all-polypropylene composites. Polym. Polym. Compos. 2008, 16,
101–113.
34. File:Afro asiatic peoples nigeria.png - Wikimedia Commons Available online:
https://commons.wikimedia.org/wiki/File:Afro_asiatic_peoples_nigeria.png (accessed on
Nov 28, 2017).
35. Free Stock Photo 117-palm_trees_2928.JPG | freeimageslive Available online:
https://www.freeimageslive.co.uk/free_stock_image/palmtrees2928jpg (accessed on Nov
28, 2017).
107
36. The map of Nigeria Available online: https://thesheet.ng/at-last-apc-bows-to-pressure-to-
setup-committee-on-restructuring-nigeria-look/ (accessed on Oct 23, 2017).
37. Kocak, D.; Merdan, N.; Evren, O. B. Research into the specifications of woven composites
obtained from raffia fibers pretreated using the ecological method. Text. Res. J. 2015, 85,
302–315.
38. Elenga, R. G.; Dirras, G. F.; Maniongui, J. G.; Mabiala, B. Thin-layer drying of Raffia
textilis fiber. BioResources 2011, 6, 4135–4144.
39. Sandy, M.; Bacon, L. Tensile testing of raffia. J. Mater. Sci. Lett. 2001, 20, 529–530.
40. Anike, D.; Onuegbu, T.; Ogbu, I.; Alaekwe, I. The Effect of Alkali Treatment on the Tensile
Behaviour and Hardness of Raffia Palm Fibre Reinforced Composites. Am. J. Polym. Sci.
2014, 4, 117–121.
41. Elenga, R. G.; Djemia, P.; Tingaud, D.; Chauveau, T.; Maniongui, J. G.; Dirras, G. Effects
of Alkali Treatment on the Microstructure, Composition, and Properties of the Raffia textilis
Fiber. Bioresour. Peer-reviewed online J. 2013, 8, 2934–2949.
42. Saba, O. S. Manufacture and Characterization of Fiber Reinforced Epoxy for Application
in Cowling Panels of Recreational Aircraft. MSc. Thesis; Univ. Saskatchewan, Saskatoon,
Canada 2014, 116.
43. Harrigan, W. C. Commercial processing of metal matrix composites. Mater. Sci. Eng. A
1998, 244, 75–79.
44. Pickering, K. L. Properties and Performance of Natural Fibre Composites. Woodhead
Maney Publ. Limited, Cambridge, England, UK 2011.
45. Kaczmar, J. W.; Pietrzak, K.; Wlosinski, W. The production and application of metal matrix
composite materials. J. Mater. Process. Technol. 2000, 106, 58–67.
46. Lee, W. S.; Sue, W. C. Dynamic Impact and Fracture Behaviour of Carbon Fiber Reinforced
7075 Aluminum Metal Matrix Composite. J. Compos. Mater. 2000, 34, 1821–1841.
47. Zhang, P.; Nie, X.; Henry, H.; Zhang, J. Preparation and tribological properties of thin oxide
coatings on an Al383/SiO2 metallic matrix composite. Surf. Coatings Technol. 2010, 205,
1689–1696.
48. Groover, M. P. Fundamentals of Modern Manufacturing: Materials, Processes, and
Systems. John Wiley Sons, Inc. Danvers, Massachusetts, USA 2010, 4, 1025.
49. Lee, W. B.; Ralph, B.; Yuen, H. C. Materials Processing Technology The processing of
108
metal matrix composites - an overview. J. Mater. Process. Technol. 1997, 63, 339-353.
50. Ralph, B.; Yuen, H. C.; Lee, W. B. The processing of metal matrix composites — an
overview. J. Mater. Process. Technol. 1997, 63, 339–353.
51. Sayuti, M.; Sulaiman, S.; Vijayaram, T. R.; Baharudin, B. T. H. T.; Arifin, M. K. A. Chapter
18: Manufacturing and Properties of Quartz (SiO2) Particulate Reinforced Al-11.8% Si
Matrix Composites. Intech, Rijeka, Croat. 2012, 411–430, doi 10.5772/48095.
52. Sulaiman, S.; Sayuti, M.; Samin, R. Mechanical properties of the as-cast quartz particulate
reinforced LM6 alloy matrix composites. J. Mater. Process. Technol. 2008, 201, 731–735.
53. Ejiofor, J. U.; Reddy, R. G. Developments in the processing and properties of particulate
Al-Si composites. JOM 1997, 49, 31–37.
54. Salit, M. S.; Jawaid, M.; Bin, N.; Hoque, E. Manufacturing of Natural Fibre Reinforced
Polymer Composites. Springer Int. Publ. Cham, Switz. 2015, 393, doi:10.1007/978-3-319-
07944-8.
55. H.L. Rizkalla and A. Abdulwahed Some mechanical properties of metal-non metal Al-SiO2
particulate composites. J. Mater. Process. Technol. 1996, 56, 398–403.
56. Ertürk, A. T.; Şahin, M.; Aras, M. Tribological Behavior of SiC Particulate Reinforced
AA5754 Matrix Composite Under Dry and Lubricated Conditions. Trans. Indian Inst. Met.
2017, 70, 1233–1240.
57. Chawla, K. K. Composite Materials: Science and Engineering. Springer Sci. New York, USA
2013, 3, 533.
58. Yang, J. S.; Park, Y. H.; Park, B. G.; Park, I. M.; Park, Y. H. Microstructure and mechanical
properties of Alborex + SiC p / AS52 hybrid metal matrix composites. Int. J. Cast Met. Res.
2008, 21, 231–235.
59. Campbell, F. C. Manufacturing Processes for Advanced Composites. Elsevier Adv. Technol.
Oxford, UK 2003.
60. B. Terry and G. Jones Metal matrix composites. Elsevier Adv. Technol. Mayf. House,
Oxford UK 1990.
61. Zhu, J.; Zhu, H.; Njuguna, J.; Abhyankar, H. Recent development of flax fibres and their
reinforced composites based on different polymeric matrices. Materials (Basel). 2013, 6,
5171–5198.
62. Jain, A.; Rastogi, D.; Chanana, B. Bast and leaf fibres : A comprehensive review. Int. J.
109
Home Sci. 2016, 2, 313–317.
63. A. S. Singha and V. K. Thakur Mechanical properties of natural fibre reinforced polymer
composites. Indian Acad. Sci. 2006, 31, 1–6.
64. Bledzki, A. K.; Gassan, J. Composites reinforced with cellulose based fibers. Prog. Polym.
Sci. 1999, 24, 221–274.
65. Rowell, R.; Pettersen, R.; Tshabalala, M. Handbook of Wood Chemistry and Wood
Composites: Cell Wall Chemistry. CRC Press. Taylor Fr. Group, Boca Raton, Florida, USA
2012, 35–74, doi:10.1201/b12487-5.
66. Chang Hong, R. wood A Review on Natural Fibre- Based Composites-Part I: Structure,
Processing and Properties of Vegetable Fibres. J. Nat. Fibers 2004, 1, 37–41.
67. Möller, J. Gravimetric Determination of Acid Detergent Fiber and Lignin in Feed:
Interlaboratory Study. J. AOAC Int. 2009, 92, 74–90.
68. Fay, J. P.; Guaita, M. S.; Danelón, J. L.; Chifflet, S.; Wawrzkiewicz, M.; Fernández, H. M.;
Ross, D. A. Evaluation of Two Procedures to Determine Acid and Neutral Detergent Fibers
in Ruminant Feeds of the Temperate Region of Argentina. J. AOAC Int. 2005, 88, 995–997.
69. Soleimani, M.; Tabil, L. G.; Oguocha, I.; Fung, J. Interactive Influence of Biofiber
Composition and Elastomer on Physico-Mechanical Properties of PLA Green Composites.
J. Polym. Environ. 2017, 1–11, doi:10.1007/s10924-017-0967-8.
70. Fiore, V.; Scalici, T.; Valenza, A. Characterization of a new natural fiber from Arundo
donax L. as potential reinforcement of polymer composites. Carbohydr. Polym. 2014, 106,
77–83.
71. Grewal, R. K. Investigations on biocomposites from oat hull and biodegradable polymers.
MSc. Thesis; Univ. Saskatchewan, Saskatoon, Canada 2015, 1–55.
72. Tibolla, H.; Pelissari, F. M.; Menegalli, F. C. Cellulose nanofibers produced from banana
peel by chemical and enzymatic treatment. LWT - Food Sci. Technol. 2014, 59, 1311–1318.
73. Reddy, N.; Yang, Y. Structure and properties of natural cellulose fibers obtained from
sorghum leaves and stems. J. Agric. Food Chem. 2007, 55, 5569–5574.
74. Li, X. Development of Flax Fiber Reinforced Polyethylene Biocomposites by Injection
Molding. Phd Thesis; Univ. Saskatchewan, Saskatoon, Canada 2008, 241.
75. Soleimani, M.; Tabil, L.; Panigrahi, S.; Opoku, A. The effect of fiber pretreatment and
compatibilizer on mechanical and physical properties of flax fiber-polypropylene
110
composites. J. Polym. Environ. 2008, 16, 74–82.
76. Fadele, O.; Oguocha, I. N.; Odeshi, A.; Soleimani, M. (067) The effect of alkalization on
properties of raffia palm fiber. Proc. 26th CANCAM 2017, 6–9.
77. Jin, W.; Singh, K.; Zondlo, J. Pyrolysis Kinetics of Physical Components of Wood and
Wood-Polymers Using Isoconversion Method. Agriculture 2013, 3, 12–32.
78. Ankom Technology Acid Detergent Fiber in Feeds - Filter Bag Technique. Method 5 2000,
6–7.
79. Ankom Technology Neutral Detergent Fiber in Feeds - Filter Bag Technique. Method 6
2011, 10–11.
80. Ankom Technology Determining Acid Detergent Lignin in Beakers. Method 8 2013, 11–
12.
81. Buitrago, B.; Jaramillo, F.; Gomez, M. Some Properties of Natural Fibers (Sisal, Pineapple,
and Banana) in Comparison to Man-Made Technical Fibers (Aramide, Glass, Carbon). J.
Nat. Fibers 2015, 12, 357–367.
82. Faruk, O.; Bledzki, A. K.; Fink, H. P.; Sain, M. Biocomposites reinforced with natural
fibers: 2000-2010. Prog. Polym. Sci. 2012, 37, 1552–1596.
83. Bledzki, A. K.; Gassan, J. Composites reinforced with cellulose based fibres. Prog. Polym.
Sci. 1999, 24, 221–274.
84. Tan, B.; Ching, Y.; Poh, S.; Abdullah, L.; Gan, S. A Review of Natural Fiber Reinforced
Poly(Vinyl Alcohol) Based Composites: Application and Opportunity. Polymers (Basel).
2015, 7, 2205–2222.
85. Roe, P. J.; Ansell, M. P. Jute-reinforced polyester composites. J. Mater. Sci. 1985, 20,
4015–4020.
86. Ernestina, M.; Fidelis, A.; Vitorino, T.; Pereira, C.; Dias, R.; Filho, T. The effect of fiber
morphology on the tensile strength of natural fibers. J. Mater. Res. Technol. 2013, 2, 149–
157.
87. Bisanda, E. T. N.; Ansell, M. P. Properties of sisaI-CNSL composites. J. Mater. Sci. 1992,
27, 1690–1700.
88. Bledzki, A. K.; Gassan, J. Composites reinforced with cellulose based fibres. Prog. Polym.
Sci. 1999, 24, 221–274.
89. Charlet, K.; Jernot, J. P.; Gomina, M.; Bréard, J.; Morvan, C.; Baley, C. Influence of an
111
Agatha flax fibre location in a stem on its mechanical, chemical and morphological
properties. Compos. Sci. Technol. 2008, 69, 1399–1403.
90. Devi, L. U.; Bhagawan, S. S.; Thomas, S. Dynamic Mechanical Properties of Pineapple
Leaf Fiber Polyester Composites. Polym. Polym. Compos. 2011, 32, 1741–1750.
91. Mahjoub, R.; Yatim, J. M.; Mohd Sam, A. R.; Hashemi, S. H. Tensile properties of kenaf
fiber due to various conditions of chemical fiber surface modifications. Constr. Build.
Mater. 2014, 55, 103–113.
92. Mallick, P. K. Fiber Reinforced Composites: Materials, Manufacturing and Design. CRC
Press. Florida, USA 2008, 3, 619.
93. Wallenberger, F. T.; Weston, N. Natural Fibers, Plastics and Composites. Kluwer Acad.
Publ. Massachusetts, USA 2004, 370.
94. ASTM D2495-07 Standard Test Method for Moisture in Cotton by Oven-Drying. ASTM
Int. U.S.A 2007.
95. Shahzad, A. A Study in Physical and Mechanical Properties of Hemp Fibres. Adv. Mater.
Sci. Eng. 2013, 1–10, doi: 10.1155/2013/325085.
96. ASTM D2987/D2987M−11 Standard Test Method for Moisture Content of Asbestos Fiber.
ASTM Int. U.S.A 2012.
97. Corporation, T. S. Model 1200 Humidity Generator. Thunder Sci. New Mex. 2017.
98. Reddy, N.; Yang, Y. Biofibers from agricultural byproducts for industrial applications.
Trends Biotechnol. 2005, 23, 22–27.
99. Mulinari, D. R.; Voorwald, H. J. C.; Cioffi, M. O. H.; Rocha, G. J.; Da Silva, M. L. C. P.
Surface modification of sugarcane bagasse cellulose and its effect on mechanical and water
absorption properties of sugarcane bagasse cellulose/ HDPE composites. BioResources
2010, 5, 661–671.
100. Nabi, S. D.; Jog, J. P. Natural Fiber Polymer Composites : A Review. Adv. Polym. Technol.
1999, 18, 351–363.
101. Espert, A.; Vilaplana, F.; Karlsson, S. Comparison of water absorption in natural cellulosic
fibres from wood and one-year crops in polypropylene composites and its influence on their
mechanical properties. Compos. Part A Appl. Sci. Manuf. 2004, 35, 1267–1276.
102. Jacob, M.; Varughese, K. T.; Thomas, S. Water sorption studies of hybrid biofiber-
reinforced natural rubber biocomposites. Biomacromolecules 2005, 6, 2969–2979.

112
103. Kabir, M. M.; Wang, H.; Lau, K. T.; Cardona, F. Chemical treatments on plant-based
natural fibre reinforced polymer composites: An overview. Compos. Part B Eng. 2012, 43,
2883–2892.
104. T. Behzad; Sain, M. A Short Review on Rubber / Clay Nanocomposites With Emphasis on
Mechanical Properties. Polym. Eng. Sci. 2007, 47, 21–25.
105. ASTM D5930-16 Standard Test Method for Thermal Conductivity of Plastics by Means of
a Transient. ASTM Int. U.S.A 2017.
106. Li, X.; Tabil, L. G.; Oguocha, I. N.; Panigrahi, S. Thermal diffusivity, thermal conductivity,
and specific heat of flax fiber-HDPE biocomposites at processing temperatures. Compos.
Sci. Technol. 2008, 68, 1753–1758.
107. Kalaprasad, G.; Pradeep, P.; Mathew, G.; Pavithran, C.; Thomas, S. Thermal conductivity
and thermal diffusivity analyses of low-density polyethylene composites reinforced with
sisal, glass and intimately mixed sisal/glass fibres. Compos. Sci. Technol. 2000, 60, 2967–
2977.
108. Mangal, R.; Saxena, N. S.; Sreekala, M. S.; Thomas, S.; Singh, K. Thermal properties of
pineapple leaf fiber reinforced composites. Mater. Sci. Eng. A 2003, 339, 281–285.
109. Loong, T. T.; Salleh, H. A review on measurement techniques of apparent thermal
conductivity of nanofluids. IOP Conf. Ser. Mater. Sci. Eng. 2017, 226, doi:10.1088/1757-
899X/226/1/012146.
110. Jiang, L.; Lu, Y. J.; Tang, K.; Wang, Y. D.; Wang, R.; Roskilly, A. P.; Wang, L.
Investigation on heat and mass transfer performance of novel composite strontium chloride
for sorption reactors. Appl. Therm. Eng. 2017, 121, 410–418.
111. Leena, M.; Srinivasan, S. A comparative study on thermal conductivity of TiO2/ethylene
glycol–water and TiO2/propylene glycol–water nanofluids. J. Therm. Anal. Calorim. 2017,
1–12, doi:10.1007/s10973-017-6616-6.
112. Zhang, D.; Zhao, Z.; Wang, B.; Li, S.; Zhang, J. Investigation of a new type of composite
ceramics for thermal barrier coatings. Mater. Des. 2016, 112, 27–33.
113. Mounika, M.; Ramaniah, K.; Ratna Prasad, A. V.; Rao, K. M.; Hema Chandra Reddy, K.
Thermal conductivity characterization of bamboo fiber reinforced polyester composite. J.
Mater. Environ. Sci. 2012, 3, 1109–1116.
114. Alausa, S. K.; Oyesiku, O. O.; Aderibigbe, J. O.; Akinola, O. S. Thermal properties of
113
Calamus deërratus , Raphia hookeri and synthetic board in building design in Southwestern
Nigeria. African J. Plant Sci. 2011, 5, 281–283.
115. Kim, S. W.; Lee, S. H.; Kang, J. S.; Kang, K. H. Thermal conductivity of thermoplastics
reinforced with natural fibers. Int. J. Thermophys. 2006, 27, 1873–1881.
116. Damfeu, J. C.; Meukam, P.; Jannot, Y. Modeling and measuring of the thermal properties
of insulating vegetable fibers by the asymmetrical hot plate method and the radial flux
method: Kapok, coconut, groundnut shell fiber and rattan. Thermochim. Acta 2016, 630,
64–77.
117. Oliveira, A. K. F.; d’Almeida, J. R. M. Characterization of ubuçu (Manicaria saccifera)
natural fiber mat. Polym. from Renew. Resour. 2014, 5, 13–28.
118. Rwawiire, S.; Tomkova, B. Morphological, Thermal, and Mechanical Characterization of
Sansevieria trifasciata Fibers. J. Nat. Fibers 2015, 12, 201–210.
119. Deepa, B.; Abraham, E.; Cherian, B. M.; Bismarck, A.; Blaker, J. J.; Pothan, L. A.; Leao,
A. L.; de Souza, S. F.; Kottaisamy, M. Structure, morphology and thermal characteristics
of banana nano fibers obtained by steam explosion. Bioresour. Technol. 2011, 102, 1988–
1997.
120. Tripathy, A. C. Characterization of Flax Fibres and the Effect of Different Drying Methods
for Making Biocomposites. MSc. Thesis; Univ. Saskatchewan, Saskatoon, Canada 2009,
124.
121. Jähn, A.; Schröder, M. W.; Füting, M.; Schenzel, K.; Diepenbrock, W. Characterization of
alkali treated flax fibres by means of FT Raman spectroscopy and environmental scanning
electron microscopy. Spectrochim. Acta - Part A 2002, 58, 2271–2279.
122. Abril, D.; Abril, A. Ethanol from lignocellulosic biomass techno-economic.pdf. Cienc. e
Investig. Agrar. 2009, 36, 177–190.
123. Grewal, R. K.; Soleimani, M.; Tabil, L. G. Investigations on biocomposites from oat hull
and biodegradable polymers. Can. Soc. Bioeng. 2015, 15, 1–9.
124. Taherzadeh, M. J.; Karimi, K. Pretreatment of lignocellulosic wastes to improve ethanol
and biogas production: A review. Int J of Pol Sci; 2008; 9; doi: 10.3390/ijms9091621.
125. Wang, B.; Panigrahi, S.; Tabil, L.; Crerar, W.; Sokansanj, S.; Braun, L. Modification of flax
fibres by chemical treatment. Can. Soc. Eng. Agric. Food Biol. Syst. 2003, 3, 6–9.
126. Zhou, F.; Cheng, G.; Jiang, B. Effect of silane treatment on microstructure of sisal fibers.
114
Appl. Surf. Sci. 2014, 292, 806–812.
127. Gonzalez, A. V; Cervantes-Uc, J. M.; Olayo, R.; Herrera-Franco, P. J. Effect of fiber surface
treatment on the fiber-matrix bond strength of natural fiber reinforced composites. Compos.
Part B Eng. 1999, 30, 309–320.
128. Valadez-Gonzalez, A.; Cervantes-Uc, J.; Olayo, R.; Herrera-Franco, P. . Chemical
modification of henequén fibers with an organosilane coupling agent. Compos. Part B Eng.
1999, 30, 321–331.
129. Paulo Aparecido dos Santos, J. C. G.; Amarasekera, J.; Moraes, G. Natural Fibers Plastic
Composites for Automotive Applications. SABIC Innov. Plast. 2006, 6, 1–9.
130. Bürkle, E.; Scheel, G.; Darnedde, L. Energy-efficient processing of natural fiber-reinforced
plastics. Kunststoffe Int. 2009, 99, 25–29.
131. S.M. Sapuan Y.A. El-Shekeil Fei-ling Pua, F. M. A.-O.; Sapuan, S. M.; Pua, F.; El-Shekeil,
Y. A.; AL-Oqla, F. M. Mechanical properties of soil buried kenaf fibre reinforced
thermoplastic polyurethane composites. Mater. Des. 2013, 50, 467–470.
132. Biron, M. Thermosets and Composites: Material Selection. Applications, Manufacturing
and Cost Analysis. Elsevier Publ. House, Oxford, UK 2014.
133. Punyamurthy, R.; Sampathkumar, D.; Ranganagowda, R. P. G.; Bennehalli, B.; Srinivasa,
C. V. Mechanical properties of abaca fiber reinforced polypropylene composites: Effect of
chemical treatment by benzenediazonium chloride. J. King Saud Univ. - Eng. Sci. 2015, 29,
289–294.
134. Satya Panigrahi; Xue Li; Lope Tabil Injection moulding processing of flax fibre- reinforced
polyethylene biocomposites. Int. Conf. Flax Other Bast Plants 2008, 83, 399–407.
135. Bagherpour, S. Chapter 6: Fibre Reinforced Polyester Composites. Intech, Rijeka, Croat.
2012, 135–166, doi:10.5772/2748.
136. Deng, H.; Reynolds, C. T.; Cabrera, N. O.; Barkoula, N.-M.; Alcock, B.; Peijs, T. The water
absorption behaviour of all-polypropylene composites and its effect on mechanical
properties. Compos. Part B Eng. 2010, 41, 268–275.
137. ASTM D570-98 ASTM D570 – 98 – Standard Test Method for Water Absorption of
Plastics. ASTM Int. U.S.A 2014.
138. Susskind, L.; Jain, R. Fiber Reinforced Polymer (FRP) Composites for Infrastructure
Applications; 2013; 55; ISBN 08956308.
115
139. Wang, W.; Sain, M.; Cooper, P. A. Study of moisture absorption in natural fiber plastic
composites. Compos. Sci. Technol. 2006, 66, 379–386.
140. Dhakal, H. N.; Zhang, Z. Y.; Richardson, M. O. W. Effect of water absorption on the
mechanical properties of hemp fibre reinforced unsaturated polyester composites. Compos.
Sci. Technol. 2007, 67, 1674–1683.
141. Tajvidi, M.; Takemura, A. Thermal Degradation of Natural Fiber-reinforced Polypropylene
Composites. J. Thermoplast. Compos. Mater. 2010, 23, 281–298.
142. Aydin, M.; Tozlu, H.; Kemaloglu, S.; Aytac, A.; Ozkoc, G. Effects of Alkali Treatment on
the Properties of Short Flax Fiber-Poly (Lactic Acid) Eco-Composites. J. Polym. Environ.
2011, 19, 11–17.
143. Ku, H.; Wang, H.; Pattarachaiyakoop, N.; Trada, M. A review on the tensile properties of
natural fiber reinforced polymer composites. Compos. Part B Eng. 2011, 42, 856–873.
144. ASTM D638-14 Standard Test Method for Tensile Properties of Plastics. ASTM Int. U.S.A
2014.
145. ASTM D790-15 Standard Test Methods for Flexural Properties of Unreinforced and
Reinforced Plastics and Electrical Insulating Materials. ASTM Int. U.S.A 2017.
146. Mohammed, L.; Ansari, M. N. M.; Pua, G.; Jawaid, M.; Islam, M. S. A Review on Natural
Fiber Reinforced Polymer Composite and Its Applications. Int. J. Polym. Sci. 2015,
doi:10.1155/2015/243947.
147. Mohanty, A. K.; Misra, M.; Drzal, L. T. Natural Fibers, Biopolymers, and Biocomposites;
2005; ISBN 978-0-8493-1741-5.
148. Dumas, P.; Miller, L. The use of synchrotron infrared microspectroscopy in biological and
biomedical investigations. Vib. Spectrosc. 2003, 32, 3–21.
149. Yu, P.; McKinnon, J. J.; Christensen, C. R.; Christensen, D. A. Imaging molecular
chemistry of pioneer corn. J. Agric. Food Chem. 2004, 52, 7345–7352.
150. ASTM D3822/D3822M-14 Standard Test Method for Tensile Properties of Single Textile
Fibers. ASTM Int. U.S.A 2015.
151. Sarikanat, M.; Seki, Y.; Sever, K.; Durmuşkahya, C. Determination of properties of Althaea
officinalis L. (Marshmallow) fibres as a potential plant fibre in polymeric composite
materials. Compos. Part B Eng. 2014, 57, 180–186.
152. Park, S.; Baker, J. O.; Himmel, M. E.; Parilla, P. A.; Johnson, D. K. Cellulose crystallinity
116
index: measurement techniques and their impact on interpreting cellulase performance.
Biotechnol. Biofuels 2010, doi:10.1186/1754-6834-3-10.
153. Mohanta, N.; Acharya, S. Fiber surface treatment: Its effect on structural, thermal, and
mechanical properties of Luffa cylindrica fiber and its composite. J. Compos. Mater. 2015,
doi:10.1177/0021998315615654.
154. Turunen, M. J.; Saarakkala, S.; Rieppo, L.; Helminen, H. J.; Jurvelin, J. S.; Isaksson, H.
Comparison between infrared and raman spectroscopic analysis of maturing rabbit cortical
bone. Appl. Spectrosc. 2011, 65, 595–603.
155. Schrader, B. Infrared and Raman Spectroscopy: Methods and Applications. VCH Publ. Inc.,
New York, USA 1995, ISBN 3-527-26446–9.
156. Blackwell, J.; Vasko, P. D.; Koenig, J. L. Infrared And Raman Spectra Of Native Cellulose
From Cell Wall Of Valonia Ventricosa. J. Appl. Phys. 1970, 41, 4375–4379.
157. ASTM D6110-10 Standard Test Method for Determining the Charpy Impact Resistance of
Notched Specimens of Plastics. ASTM Int. U.S.A 2010.
158. Al-Bahadly, E. A. The Mechanical Properties of Natural Fiber Composites. Phd Thesis;
Swinburne Univ. Technol. Melbourne, Aust. 2013, 1–228.
159. Jurgens, M. H.; Bregendahl, K. Animal Feeding and Nutrition. Kendall Hunt Publ. Co.
2007, 10, 100–105.
160. Tran, L. Q. N.; Minh, T. N.; Fuentes, C. A.; Chi, T. T.; Van Vuure, A. W.; Verpoest, I.
Investigation of microstructure and tensile properties of porous natural coir fibre for use in
composite materials. Ind. Crops Prod. 2015, 65, 437–445.
161. Wang, F.; Shao, J.; Keer, L. M.; Li, L.; Zhang, J. The effect of elementary fibre variability
on bamboo fibre strength. Mater. Des. 2015, 75, 136–142.
162. Cai, M.; Takagi, H.; Nakagaito, A. N.; Katoh, M.; Ueki, T.; Waterhouse, G. I. N.; Li, Y.
Influence of alkali treatment on internal microstructure and tensile properties of abaca
fibers. Ind. Crops Prod. 2015, 65, 27–35.
163. Silva, F. de A.; Chawla, N.; Filho, R. D. de T. Tensile behavior of high performance natural
(sisal) fibers. Compos. Sci. Technol. 2008, 68, 3438–3443.
164. Cicala, G.; Cristaldi, G.; Latteri, A. Composites Based on Natural Fibre Fabrics. Woven
Fabr. Eng. 2010, 317–342, doi:10.5772/10465.
165. Fangueiro, R.; Rana, S. Natural Fibres : Advances in Science and Technology Towards
117
Industrial Applications. Springer Nat. 2015, 12, 37–43.
166. Kannan, R.; Anand, A. V.; Hariprasad, V.; Singh, R. A.; Jayalakshmi, S.; Arumugam, V.
Effect of Cashew Nut Shell Oil (Cardanol) on Water Absorption and Mechanical
Characteristics of Sisal Fibers. Proc. Int. Conf. Recent Innov. Prod. Eng. MIT 2017, 91–92,
ISBN: 978-93-86256-65-2.
167. Sampathkumar, D.; Punyamurth, R.; Venkateshappa, S. C. Effect of Chemical Treatment
on Water Absorption of Areca Fiber. J. Appl. Sci. Res. 2012, 8, 5298–5305.
168. Mukherjee, P. S.; Satyanarayana, K. G. Structure and properties of some vegetable fibres.
J. Mater. Sci. 1984, 19, 3925–3934.
169. Tomczak, F.; Satyanarayana, K. G.; Sydenstricker, T. H. D. Studies on lignocellulosic fibers
of Brazil : Part III – Morphology and properties of Brazilian curaua fibers. Compos. Part A
Appl. Sci. Manuf. 2007, 38, 2227–2236.
170. Obasi, H. C. Properties of raphia palm interspersed fibre filled high density polyethylene.
Adv. Mater. Sci. Eng. 2013, 2–6, doi:10.1155/2013/932143.
171. Rokbi, M.; Osmani, H.; Imad, A.; Benseddiq, N. Effect of chemical treatment on flexure
properties of natural fiber-reinforced polyester composite. Procedia Eng. 2011, 10, 2092–
2097.
172. Yu, P. Molecular chemistry imaging to reveal structural features of various plant feed
tissues. J. Struct. Biol. 2005, 150, 81–89.
173. Edwards, H. G.; Farwell, D. W.; Webster, D. FT Raman microscopy of untreated natural
plant fibres. Spectrochim. acta. Part A 1997, 53, 2383–2392.
174. Mwaikambo, L. Y.; Ansell, M. P. Chemical modification of hemp, sisal, jute, and kapok
fibers by alkalization. J. Appl. Polym. Sci. 2002, 2222–2234, doi:10.1002/app.10460.
175. Chan, C. H.; Chia, C. H.; Zakaria, S.; Ahmad, I.; Dufresne, A. Production and
characterisation of cellulose and nano- crystalline cellulose from kenaf core wood.
BioResources 2013, 8, 785–794.
176. Udoetok, I. A.; Wilson, L. D.; Headley, J. V Quaternized Cellulose Hydrogels as Sorbent
Materials and Pickering Emulsion Stabilizing Agents. Materials (Basel). 2016, 9, 1-16.
177. Himmelsbach, D. S.; Akin, D. E. Near-infrared Fourier-transform Raman spectroscopy of
flax (Linum usitatissimum L.) stems. J. Agric. Food Chem. 1998, 46, 991–998.
178. Gierlinger, N.; Schwanninger, M.; Reinecke, A.; Burgert, I. Molecular changes during

118
tensile deformation of single wood fibers followed by Raman microscopy.
Biomacromolecules 2006, 7, 2077–2081.
179. Kaushik, V. K.; Kumar, A.; Kalia, S. Effect of Mercerization and Benzoyl Peroxide
Treatment on Morphology, Thermal Stability and Crystallinity of Sisal Fibers. Int. J. Text.
Sci. 2012, 1, 101–105.
180. Martins, M. A.; Pessoa, J. D. C.; Gonçalves, P. S.; Souza, F. I.; Mattoso, L. H. C. Thermal
and mechanical properties of the acai fiber/natural rubber composites. J. Mater. Sci. 2008,
43, 6531–6538.
181. Hao, A. Mechanical and Thermal Properties of Kenaf Polypropylene Nonwoven
Composites. Phd Thesis; Univ. Texas, Texas, USA 2013, 19–30.
182. Saravanakumar, S. S.; Kumaravel, A.; Nagarajan, T.; Sudhakar, P.; Baskaran, R.
Characterization of a novel natural cellulosic fiber from Prosopis juliflora bark. Carbohydr.
Polym. 2013, 92, 1928–1933.
183. Wong, S.; Shanks, R.; Hodzic, A. Interfacial improvements in poly (3-hydroxybutyrate)-
flax fibre composites with hydrogen bonding additives. Compos. Sci. Technol. 2004, 64,
1321–1330.
184. Messiry, M. El Theoretical analysis of natural fiber volume fraction of reinforced
composites. Alexandria Eng. J. 2013, 52, 301–306.
185. Oksman, K.; Skrifvars, M.; Selin, J. F. Natural fibres as reinforcement in polylactic acid
(PLA) composites. Compos. Sci. Technol. 2003, 63, 1317–1324.
186. Hargitai, H.; Racz, I.; Anandjiwala, R. D. Development of HEMP Fiber Reinforced
Polypropylene Composites. J. Thermoplast. Compos. Mater. 2008, 21, 165–174.
187. George, J.; Sreekala, M.; Thomas, S. A review on interface modification and
characterization of natural fiber reinforced plastic composites. Polym. Eng. Sci. 2001, 41,
1471–1485.
188. Wang, B. Pre-treatment of Flax Fibers for use in Rotationally Molded Biocomposites. MSc.
Thesis; Univ. Saskatchewan, Saskatoon, Canada 2004, 447–463,
doi:10.1177/0731684406072526.
189. Arrakhiz, F. Z.; El Achaby, M.; Malha, M.; Bensalah, M. O.; Fassi-Fehri, O.; Bouhfid, R.;
Benmoussa, K.; Qaiss, a. Mechanical and thermal properties of natural fibers reinforced
polymer composites: Doum/low density polyethylene. Mater. Des. 2013, 43, 200–205.
119
190. Herrera-Franco, P. J.; Valadez-Gonzalez, A. A study of the mechanical properties of short
natural-fiber reinforced composites. Compos. Part B Eng. 2005, 36, 597–608.
191. Tajvidi, M.; Takemura, A. Effect of Fiber Content and Type, Compatibilizer, and Heating
Rate on Thermogravimetric Properties of Natural Fiber High Density Polyethylene
Composites. Polym. Compos. Compos. 2009, 16, 101–113.
192. Arias, A.; Heuzey, M. C.; Huneault, M. A. Thermomechanical and crystallization behavior
of polylactide-based flax fiber biocomposites. Cellulose 2013, 20, 439–452.
193. Johari, A. P.; Mohanty, S.; Kurmvanshi, S. K.; Nayak, S. K. Influence of Different Treated
Cellulose Fibers on the Mechanical and Thermal Properties of Poly(lactic acid). ACS
Sustain. Chem. Eng. 2016, 4, 1619–1629.
194. Dong, Y.; Ghataura, A.; Takagi, H.; Haroosh, H. J.; Nakagaito, A. N.; Lau, K. Composites :
Part A Polylactic acid (PLA) biocomposites reinforced with coir fibres : Evaluation of
mechanical performance and multifunctional properties. Compos. Part A 2014, 63, 76–84.
195. Bernland, K. M. Nucleating and clarifying polymers. MSc. Thesis; Luleå Univ. Technol.
2010, 12–19.
196. Chen, C.; Xu, R.; Chen, X.; Xie, J. Influence of cocrystallization behavior on structure and
properties of HDPE / LLDPE microporous membrane. J. Polym. Res. 2016, 1–9,
doi:10.1007/s10965-016-0935-3.
197. Mathot, V. B. F. Crystallization of polymers: A personal view on a lifetime in research. J.
Therm. Anal. Calorim. 2010, 102, 403–412.
198. Macauley, N. J.; Harkin-Jones, E. M. A.; Murphy, W. R. The Influence of Nucleating
Agents on the Extrusion and Thermoforming of Polypropylene. Polym. Eng. Sci. 1998, 3,
516–523.
199. Takemura, K. Effect of Water Absorption on Mechanical Properties of Hemp Fiber
Reinforced Composite. Key Eng. Mater. 2009, 161–164,
doi:10.4028/www.scientific.net/KEM.417-418.161.

120
APPENDICES
121
APPENDIX A
Acid Detergent Fiber in Feeds - Filter Bag Technique (for A200 and A200I)
Definition: This method determines Acid Detergent Fiber, which is the residue remaining after
digesting with H2SO4 and CTAB. The fiber residues are predominantly cellulose and lignin.
Scope: This method is applicable to grains, feeds, forages, and all fiber-bearing material.
Apparatus
1. Analytical Balance – capable of weighing 0.1 mg.
2. Oven – capable of maintaining a temperature of 102 ± 2°C.
3. Digestion instrument – capable of performing the digestion at 100 ± 0.5°C and maintaining
a pressure of 10 – 25 psi. The instrument must be capable of creating a similar flow around
each sample to ensure uniformity of extraction (ANKOM200 with 65 rpm agitation,
ANKOM Technology).
4. Filter Bags – constructed from chemically inert and heat resistant filter media, capable of
being heat sealed closed and able to retain 25-micron particles while permitting solution
penetration (F57 and F58, ANKOM Technology).
5. Heat sealer – sufficient for sealing the filter bags closed to ensure complete closure (1915,
ANKOM Technology).
6. Desiccant Pouch – collapsible sealable pouch with inside that enables the removal of air
from around the filter bags (Moisture Stop weigh pouch, ANKOM Technology).
7. Marking pen – solvent and acid resistant (F08, ANKOM Technology).
Reagents
1. Acid Detergent Solution – Add 20 g cetyl trimethylammonium bromide (CTAB) to 1L
1.00 N H2SO4 previously standardized (premixed chemical solution available from
ANKOM). Agitate and heat to aid solution.
CAUTION 1: Sulfuric acid is a strong acid and will cause severe burns. Protective clothing
should be worn when working with this acid. Always add acid to water and not the reverse.
ADF Method – Method 5
122
CAUTION 2: CTAB will irritate mucous membranes. A dust mask and gloves should be
worn when handling this chemical.
Sample Preparation
Grind samples in a centrifugal mill with a 2mm screen or cutter type (Wiley) mill with a 1 mm
screen. Samples ground finer may have particle loss from the filter bags and result in low values.
1. Use a solvent resistant marker to label the filter bags to be used in the analysis.
2. Weigh and record the weight of each empty filter bag (W1) and zero the balance.
NOTE: Do not pre-dry filter bags. Any moisture will be accounted for by the blank bag
correction.
3. Place 0.45 – 0.50g of prepared sample in up to 23 of the bags and record the weight (W2)
of each. Avoid placing the sample in the upper 4mm of the bag.
4. Include at least one empty bag in the run to determine the blank bag correction (C1).
NOTE: A running average blank bag correction factor (C1) should be used in the
calculation of fiber. The inclusion of at least one blank bag in each run is mainly used as
an indicator of particle loss. A C1 larger than 1.0000 indicates that sample particles were
lost from filter bags and deposited on the blank bag during the extraction. Any fiber
particle loss from the filter bags will generate erroneous results. If particle loss is observed
then the grinding method needs to be evaluated.
5. Using a heat sealer, completely seal each filter bag closed within 4mm of the top to
encapsulate the sample.
NOTE: Use sufficient heat to completely seal the filter bags and allow enough cool time
(2 sec) before raising the heat sealer arm to remove each bag from the heat sealer.
6. Pre-extract only samples containing > 5% fat: Extract samples by placing bags with
samples into a container with a top. Pour enough acetone into the container to cover the
bags and secure the top.
CAUTION 3: Acetone is extremely flammable. Avoid static electricity and use a fume
hood when handling. Shake the container 10 times and allow the bags to soak for 10
minutes. Repeat with fresh acetone. Pour out acetone and place bags on a wire screen to
air-dry.
123
Exception – Roasted soybean: Due to the processing of roasted soy a modification to the
extraction is required. Place roasted soy samples into a container with a top. Pour enough
acetone into the container to cover the bags and secure the top. Shake the container 10
times and pour off the acetone. Add fresh acetone and allow samples to soak for twelve
hours. After the soak time, pour out the acetone and place the bags on a wire screen to air-
dry.
7. To eliminate sample clumping, spread the sample uniformly inside the filter bags by
shaking and flicking the bags.
8. Place up to 3 bags on each of eight Bag Suspender Trays (maximum of 24 bags). Stack
the trays on the center post of the Bag Suspender with each level rotated 120 degrees in
relation to the tray below it. Place the empty 9th tray on top.
NOTE: All nine trays must be used regardless of the number of bags being processed.
9. Verify that the Exhaust Hose is connected to the instrument and securely positioned in the
drain.
10. Turn the instrument Power Switch to the ON position.
11. Before inserting the Bag Suspender into the Vessel, read the Temperature Controller on
the instrument. If the temperature is higher than room temperature, fill the Vessel with
cold tap water. The temperature on the Controller will decrease. When the value on the
Controller reaches its lowest number and starts to increase, open the Exhaust Valve and
exhaust the water. Repeat this process until the number on the Temperature Controller
equilibrates to room temperature.
12. Open the Vessel Lid and insert the Bag Suspender with bags into the Vessel and place the
Bag Suspender Weight on top of the empty 9th tray to keep the Bag Suspender submerged.
13. When processing 24 sample bags, add 1900-2000 mL of ambient temperature AD solution
to the fiber analyzer vessel. If processing less than 20 bags, add 100 mL/bag of AD solution
(use minimum of 1500 mL to ensure Bag Suspender is covered).
14. Turn Agitate and Heat ON and confirm agitation.
15. Set the timer for 60 minutes and close the lid.
16. When the ADF extraction is complete, turn Agitate and Heat OFF.
17. Open the drain valve (slowly at first) and exhaust the hot solution before opening the
Vessel Lid.
124
NOTE: The solution in the Vessel is under pressure. The exhaust valve needs to be opened
to release the pressure and solution prior to opening the Vessel Lid.
18. After the solution has been exhausted, close the exhaust valve and open the Vessel Lid.
Add 1900-2000 mL of 70-90°C rinse water. Turn Agitate on and rinse for 5 minutes. If
the Heat is ON, the Vessel Lid should be closed. If the Heat is OFF, the Vessel Lid can be
open. Repeat 5-minute hot water rinses 2 more times. Just before draining the 3rd rinse,
test the water with pH paper. If acid is present repeat rinses until neutral.
19. After the rinsing procedures are complete, open the Vessel Lid and remove the filter bags.
Gently press out excess water from the bags. Place bags in a 250ml beaker and add enough
acetone to cover the bags and soak for 3-5 minutes.
20. Remove the filter bags from the acetone and place them on a wire screen to air-dry.
Completely dry in an oven at 102 ± 2°C. (In most ovens the filter bags will be completely
dry within 2-4 hours.)
NOTE: Do not place bags in the oven until the acetone in the bags has completely
evaporated.
21. Remove the filter bags from the oven and immediately place them directly into a
collapsible desiccant pouch and flatten to remove any air. Cool to ambient temperature
and weigh the filter bags (W3). NOTE: Do not use a conventional desiccator container.
Calculations
% ADF (as-received basis) = 2
113 ))((100
W
CWW
Where:
W1 = Bag tare weight
W2 = Sample weight
W3 = Dried weight of bag with fiber after extraction process
C1 = Blank bag correction (running average of final oven-dried weight divided by original blank
bag weight)
125
Neutral Detergent Fiber in Feeds - Filter Bag Technique (for A200 and A200I)
Definition: This method determines Neutral Detergent Fiber, which is the residue remaining after
digesting in a detergent solution. The fiber residues are predominantly hemicellulose, cellulose,
and lignin.
Scope: This method is applicable to grains, feeds, forages, and all fiber-bearing material.
Apparatus
1. Analytical Balance – capable of weighing 0.1 mg.
2. Oven – capable of maintaining a temperature of 102 ± 2°C.
3. Digestion instrument – capable of performing the digestion at 100 ± 0.5°C and maintaining
a pressure of 10 – 25 psi. The instrument must be capable of creating a similar flow around
each sample to ensure uniformity of extraction (ANKOM200 with 65 rpm agitation,
ANKOM Technology).
4. Filter Bags – constructed from chemically inert and heat resistant filter media, capable of
being heat sealed closed and able to retain 25-micron particles while permitting solution
penetration (F57 and F58, ANKOM Technology).
5. Heat sealer – sufficient for sealing the filter bags closed to ensure complete closure (1915,
ANKOM Technology).
6. Desiccant Pouch – collapsible sealable pouch with inside that enables the removal of air
from around the filter bags (Moisture Stop weigh pouch, ANKOM Technology).
7. Marking pen – solvent and acid resistant (F08, ANKOM Technology).
Reagents
1. Neutral Detergent Solution—Add 30g Sodium dodecyl sulfate (USP), 18.61g
Ethylenediaminetetraacetic disodium salt (dehydrate), 6.81g Sodium borate, 4.56g
Sodium phosphate dibasic (anhydrous), and 10.0ml Triethylene glycol to 1L distilled H2O
(premixed chemical solution available from ANKOM Technology). Check that pH is from
6.9 to 7.1. Agitate and heat to aid solution.
NDF Method – Method 6

126
CAUTION 1: Powdered chemicals will irritate mucous membranes. A dust mask and
gloves should be worn when handling these chemicals.
2. Alpha-amylase—Heat-stable bacterial alpha-amylase: activity = 17,400 Liquefon Units /
ml (FAA, ANKOM Technology).
3. Sodium sulfite—Na2SO3, anhydrous (FSS, ANKOM Technology).
Sample Preparation
Grind samples in a centrifugal mill with a 2-mm screen or cutter type (Wiley) mill with a 1 mm
screen. Samples ground finer may have particle loss from the filter bags and result in low values.
1. Use a solvent resistant marker to label the filter bags to be used in the analysis.
2. Weigh and record the weight of each empty filter bag (W1) and zero the balance. NOTE:
Do not pre-dry filter bags. Any moisture will be accounted for by the blank bag correction.
3. Place 0.45 – 0.50g of prepared sample in up to 23 of the bags and record the weight (W2)
of each. Avoid placing the sample in the upper 4mm of the bag.
4. Include at least one empty bag in the run to determine the blank bag correction (C1).
NOTE: A running average blank bag correction factor (C1) should be used in the
calculation of fiber. The inclusion of at least one blank bag in each run is mainly used as
an indicator of particle loss. A C1 larger than 1.0000 indicates that sample particles were
lost from filter bags and deposited on the blank bag during the extraction. Any fiber
particle loss from the filter bags will generate erroneous results. If particle loss is observed
then the grinding method needs to be evaluated.
5. Using a heat sealer, completely seal each filter bag closed within 4mm of the top to
encapsulate the sample. NOTE: Use sufficient heat to completely seal the filter bags and
allow enough cool time (2 sec) before raising the heat sealer arm to remove each bag from
the heat sealer.
6. Pre-extract only samples containing > 5% fat: Extract samples by placing bags with
samples into a container with a top. Pour enough acetone into the container to cover the
bags and secure the top.
CAUTION 2: Acetone is extremely flammable. Avoid static electricity and use a fume
hood when handling. Shake the container 10 times and allow bags to soak for 10 minutes.
Repeat with fresh acetone. Pour out acetone and place bags on a wire screen to air-dry.
Exception – Roasted soybean: Due to the processing of roasted soy a modification to the
127
extraction is required. Place roasted soy samples into a container with a top. Pour enough
acetone into the container to cover the bags and secure the top. Shake the container 10
times and pour off the acetone. Add fresh acetone and allow samples to soak for twelve
hours. After the soak time, pour out the acetone and place the bags on a wire screen to dry.
7. To eliminate sample clumping, spread the sample uniformly inside the filter bags by
shaking and flicking the bags.
8. Place up to 3 bags on each of eight Bag Suspender Trays (maximum of 24 bags). Stack
the trays on the center post of the Bag Suspender with each level rotated 120 degrees in
relation to the tray below it. Place the empty 9th tray on top.
NOTE: All nine trays must be used regardless of the number of bags being processed.
9. Verify that the Exhaust Hose is connected to the instrument and securely positioned in the
drain.
10. Turn the instrument Power Switch to the ON position.
11. Open the Vessel Lid and insert the Bag Suspender with bags into the Vessel and place the
Bag Suspender weight on top of the empty 9th tray to keep the Bag Suspender submerged.
12. When processing 24 sample bags, add 1900-2000 mL of ambient temperature ND solution
to the fiber analyzer vessel. If processing less than 20 bags, add 100 mL/bag of ND solution
(use minimum of 1500 mL to ensure Bag Suspender is covered). Add 20 g (0.5 g per 50
mL of ND solution) of sodium sulfite and 4.0 mL of alpha-amylase to the solution in the
vessel.
13. Turn Agitate and Heat ON and confirm agitation.
14. Set the timer for 75 minutes and close the lid.
15. When the NDF extraction is complete, turn Agitate and Heat OFF.
16. Open the drain valve (slowly at first) and exhaust the hot solution before opening the
Vessel Lid. NOTE: The solution in the Vessel is under pressure. The exhaust valve needs
to be opened to release the pressure and solution prior to opening the Vessel Lid.
17. After the solution has been exhausted, close the exhaust valve and open the Vessel Lid.
Add 1900-2000 mL of 70-90°C rinse water and 4.0 mL of alpha-amylase to the first and
second rinses. Turn Agitate on and rinse for 5 minutes. If the Heat is ON, the Vessel Lid
should be closed. If the Heat is OFF, the Vessel Lid can be open. Repeat 5-minute hot
water rinse 1 more time for a total of 3 rinses.
128
18. When the NDF extraction and rinsing procedures are complete, open the Vessel Lid and
remove the filter bags. Gently press out excess water from the bags. Place bags in a 250ml
beaker and add enough acetone to cover bags and soak for 3-5 minutes.
19. Remove the filter bags from the acetone and place them on a wire screen to air-dry.
Completely dry in an oven at 102 ± 2°C. (In most ovens the filter bags will be completely
dry within 2-4 hours.) NOTE: Do not place bags in the oven until the acetone in the bags
has completely evaporated.
20. Remove the filter bags from the oven and immediately place them directly into a
collapsible desiccant pouch and flatten to remove any air. Cool to ambient temperature
and weigh the filter bags (W3). NOTE: Do not use a conventional countertop or cabinet
desiccator.
Calculations
% NDF (as-received basis) = 2
113 ))((100
W
CWW
Where:
W1 = Bag tare weight
W2 = Sample weight
W3 = Dried weight of bag with fiber after extraction process
C1 = Blank bag correction (running average of final oven-dried weight divided by original blank
bag weight)
129
Reagents
Sulfuric acid (72% by weight) – ANKOM Technology FSA72 or dilute reagent grade H2SO4 to a
specific gravity of 1634 g/L at 20°C (24.00N) by adding 1200 g H2SO4 to 350 ml H2O in a 1 L
MCA volumetric flask with cooling. Standardize this solution to 1634 g/L at 20°C specific gravity
by removing solution and adding H2O or H2SO4 as required.
Safety Precautions
Acetone is highly flammable. Use fume hood when handling acetone and avoid inhaling or contact
with skin. Ensure that all the acetone has evaporated before placing in the oven.
Wear rubber gloves and face shield when handling sulfuric acid.
Always add sulfuric acid to water. If acid contacts skin, wash with copious amounts of water.
Apparatus
a) Filtration device – ANKOM Technology – F57 Filter Bags
b) Impulse bag sealer – ANKOM Technology – 1915 Heat Sealer
c) Desiccator – ANKOM Technology – Desiccant/Moisture Stop pouch – X45
d) 2L & 3L Beaker
Procedure
1) Grind the sample to pass through a 1 mm screen (2mm screen when using a cyclone
mill).
2) Weigh each Filter Bag (W1), record the weight, and tare the balance.
3) Add 0.5 g (± 0.05 g) of air-dried sample (W2) directly into each Filter Bag.
4) Weigh and seal one (1) blank bag and include it in the digestion to determine the
blank bag correction (C1).
5) Seal the bags closed 4 mm from the open edge using the heat sealer.
6) Spread the sample uniformly inside each filter bag by flicking the bag to eliminate
clumping.
7) Perform ADF determinations using Fiber Analyzer (See ADF Procedure).
Method 8 – determining Acid Detergent Lignin in beakers
130
8) After performing ADF determinations, place dried bags with samples into a 3 L
beaker and completely cover the bags with 72% H2SO4 (approximately 250 ml).
Bags must be completely dry and at ambient temperature before adding
concentrate acid. If moisture (even ambient moisture) is present in the bags, heat
generated by the H2SO4 and H20 reaction will adversely affect the results.
9) Place a 2 L beaker inside the 3 L beaker to keep bags submerged. Agitate the bags
at the start and at 30minute intervals by gently pushing and lifting the 2 L beaker up
and down approximately 30 times.
10) After 3 hours pour off the H2SO4 and rinse with tap water to remove all acid.
If acid remains in the bags when they go into the oven, the samples will burn,
resulting in values that are higher than they should be.
11) Repeat rinses until pH paper shows neutral color when touching the bags. Rinse
with approximately 250 ml of acetone for 3 minutes to remove the water. Handle
the bags gently during rinsing. Fine lignin particles can exit the filter if not
handled carefully.
WARNING – Do NOT place bags in an oven until all acetone has evaporated.
13) Remove the bags from the oven and place them directly into Desiccant/Moisture
Stop pouches and flatten to remove air. Cool to ambient temperature and weigh the
bags (W3).
14) Prepare each bag for the ash procedure.

131
14.1) Fold each bag from bottom to top. Because the bags are
wider at the top than at the bottom, there will be a little
extra material on each side after the first fold.
14.2) Fold each bag from right to left. The extra material now
lines up on left side.
14.3) Heat seal the bag at the location of the extra material.
15) Ash the bags in pre-weighed crucibles (30 or 50 ml) at 525oC for 3 hours or until C-
free. Cool and calculate weight loss (W4).
16) Calculate blank bag ash correction (C2) using weight loss upon ignition of a blank
bag sequentially run through ADF and lignin steps.
17) Calculate percent ADL.
ADL (as-received basis) = 2
113 100))((
W
CWW
ADLDM (DM basis) = DMW
CWW
2
113 100))((
ADLOM (DM basis) = DMW
CWW
2
214 100))((
Where:
W1 = Bag tare weight
W2 = Sample weight
W3 = Weight after extraction process
W4 = Weight of Organic Matter (OM) (weight loss on ignition of bag and fiber residue)
C1 = Blank bag correction (final oven-dried weight/original blank bag weight)
C2 = Ash corrected blank bag (Loss of weight on ignition of bag/original blank bag)
DM = Dry Matter
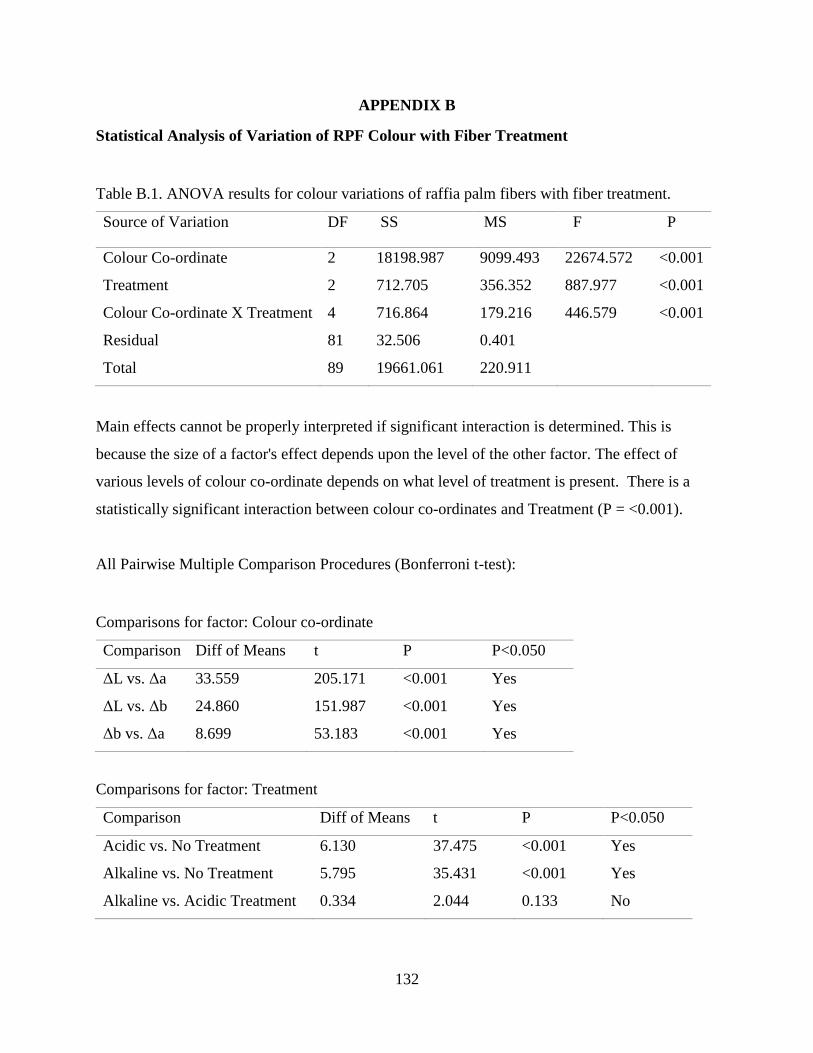
132
APPENDIX B
Statistical Analysis of Variation of RPF Colour with Fiber Treatment
Table B.1. ANOVA results for colour variations of raffia palm fibers with fiber treatment.
Source of Variation DF SS MS F P
Colour Co-ordinate 2 18198.987 9099.493 22674.572 <0.001
Treatment 2 712.705 356.352 887.977 <0.001
Colour Co-ordinate X Treatment 4 716.864 179.216 446.579 <0.001
Residual 81 32.506 0.401
Total 89 19661.061 220.911
Main effects cannot be properly interpreted if significant interaction is determined. This is
because the size of a factor's effect depends upon the level of the other factor. The effect of
various levels of colour co-ordinate depends on what level of treatment is present. There is a
statistically significant interaction between colour co-ordinates and Treatment (P = <0.001).
All Pairwise Multiple Comparison Procedures (Bonferroni t-test):
Comparisons for factor: Colour co-ordinate
Comparison Diff of Means t P P<0.050
ΔL vs. Δa 33.559 205.171 <0.001 Yes
ΔL vs. Δb 24.860 151.987 <0.001 Yes
Δb vs. Δa 8.699 53.183 <0.001 Yes
Comparisons for factor: Treatment
Comparison Diff of Means t P P<0.050
Acidic vs. No Treatment 6.130 37.475 <0.001 Yes
Alkaline vs. No Treatment 5.795 35.431 <0.001 Yes
Alkaline vs. Acidic Treatment 0.334 2.044 0.133 No
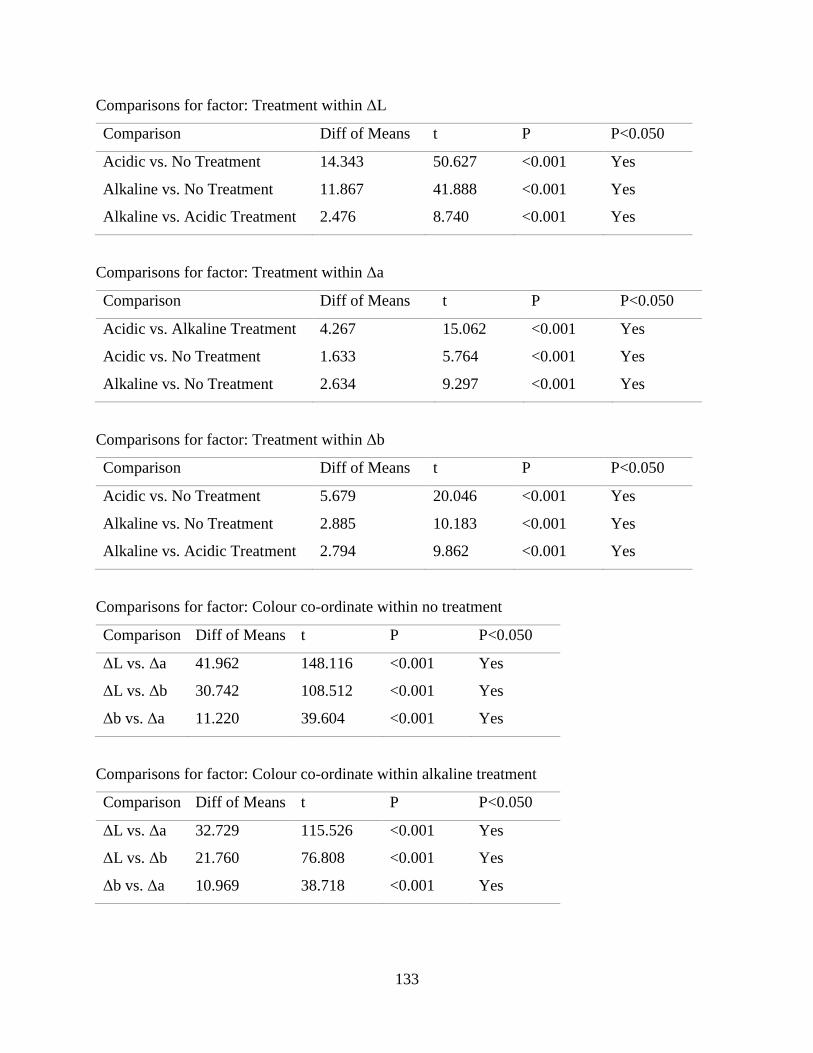
133
Comparisons for factor: Treatment within ΔL
Comparison Diff of Means t P P<0.050
Acidic vs. No Treatment 14.343 50.627 <0.001 Yes
Alkaline vs. No Treatment 11.867 41.888 <0.001 Yes
Alkaline vs. Acidic Treatment 2.476 8.740 <0.001 Yes
Comparisons for factor: Treatment within Δa
Comparison Diff of Means t P P<0.050
Acidic vs. Alkaline Treatment 4.267 15.062 <0.001 Yes
Acidic vs. No Treatment 1.633 5.764 <0.001 Yes
Alkaline vs. No Treatment 2.634 9.297 <0.001 Yes
Comparisons for factor: Treatment within Δb
Comparison Diff of Means t P P<0.050
Acidic vs. No Treatment 5.679 20.046 <0.001 Yes
Alkaline vs. No Treatment 2.885 10.183 <0.001 Yes
Alkaline vs. Acidic Treatment 2.794 9.862 <0.001 Yes
Comparisons for factor: Colour co-ordinate within no treatment
Comparison Diff of Means t P P<0.050
ΔL vs. Δa 41.962 148.116 <0.001 Yes
ΔL vs. Δb 30.742 108.512 <0.001 Yes
Δb vs. Δa 11.220 39.604 <0.001 Yes
Comparisons for factor: Colour co-ordinate within alkaline treatment
Comparison Diff of Means t P P<0.050
ΔL vs. Δa 32.729 115.526 <0.001 Yes
ΔL vs. Δb 21.760 76.808 <0.001 Yes
Δb vs. Δa 10.969 38.718 <0.001 Yes

134
Comparisons for factor: Colour co-ordinate within acidic treatment
Comparison Diff of Means t P P<0.050
ΔL vs. Δa 25.986 91.725 <0.001 Yes
ΔL vs. Δb 22.078 77.930 <0.001 Yes
Δb vs. Δa 3.908 13.794 <0.001 Yes
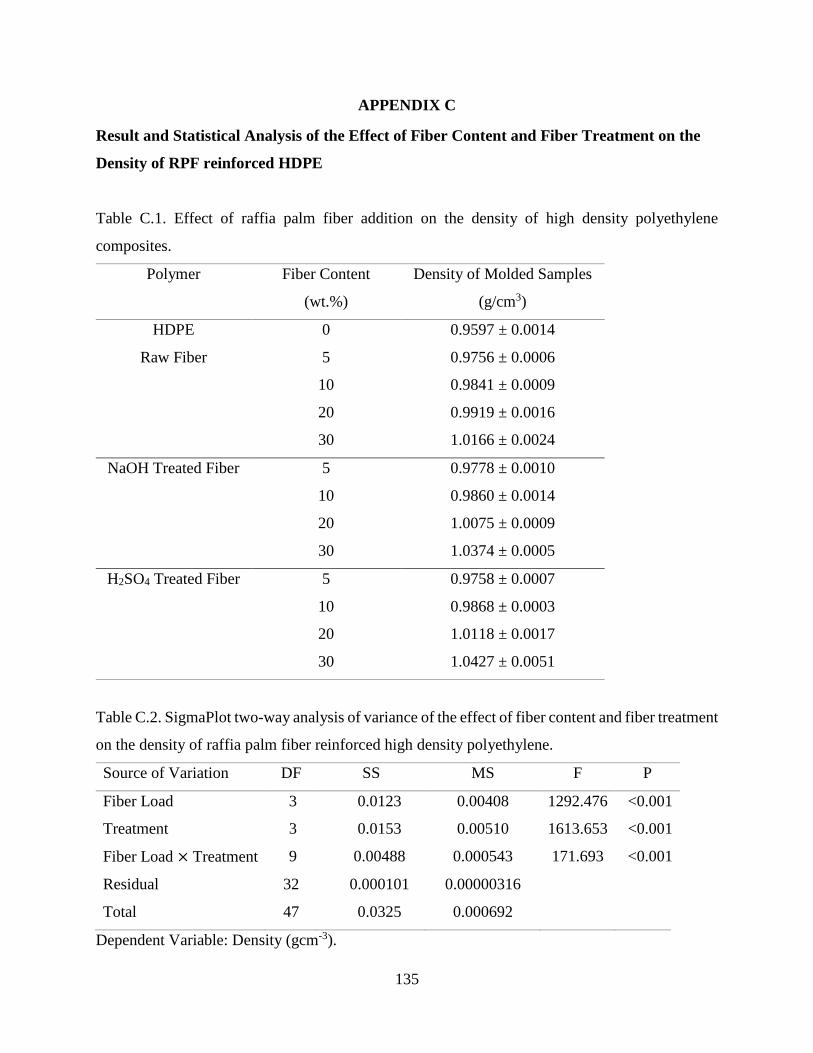
135
APPENDIX C
Result and Statistical Analysis of the Effect of Fiber Content and Fiber Treatment on the
Density of RPF reinforced HDPE
Table C.1. Effect of raffia palm fiber addition on the density of high density polyethylene
composites.
Polymer Fiber Content
(wt.%)
Density of Molded Samples
(g/cm3)
HDPE 0 0.9597 ± 0.0014
0.9756 ± 0.0006
0.9841 ± 0.0009
0.9919 ± 0.0016
1.0166 ± 0.0024
Raw Fiber 5
10
20
30
NaOH Treated Fiber 5 0.9778 ± 0.0010
0.9860 ± 0.0014
1.0075 ± 0.0009
1.0374 ± 0.0005
10
20
30
H2SO4 Treated Fiber 5 0.9758 ± 0.0007
0.9868 ± 0.0003
1.0118 ± 0.0017
1.0427 ± 0.0051
10
20
30
Table C.2. SigmaPlot two-way analysis of variance of the effect of fiber content and fiber treatment
on the density of raffia palm fiber reinforced high density polyethylene.
Source of Variation DF SS MS F P
Fiber Load 3 0.0123 0.00408 1292.476 <0.001
Treatment 3 0.0153 0.00510 1613.653 <0.001
Fiber Load × Treatment 9 0.00488 0.000543 171.693 <0.001
Residual 32 0.000101 0.00000316
Total 47 0.0325 0.000692
Dependent Variable: Density (gcm-3).
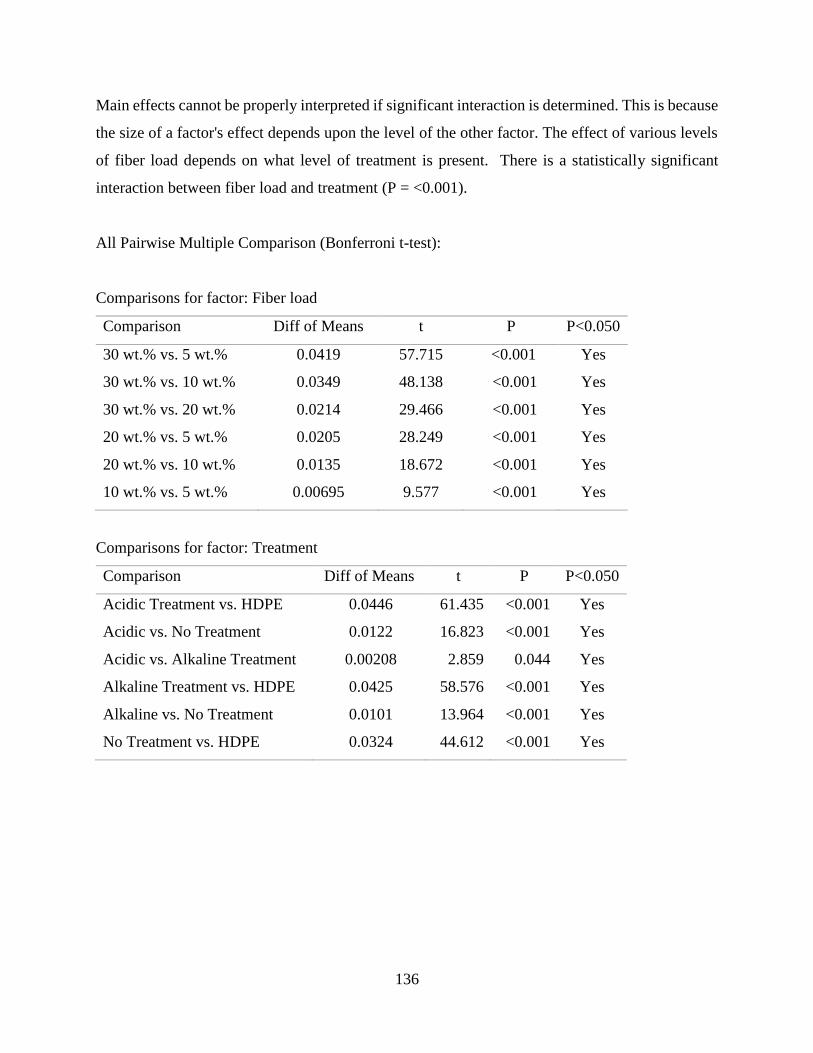
136
Main effects cannot be properly interpreted if significant interaction is determined. This is because
the size of a factor's effect depends upon the level of the other factor. The effect of various levels
of fiber load depends on what level of treatment is present. There is a statistically significant
interaction between fiber load and treatment (P = <0.001).
All Pairwise Multiple Comparison (Bonferroni t-test):
Comparisons for factor: Fiber load
Comparison Diff of Means t P P<0.050
30 wt.% vs. 5 wt.% 0.0419 57.715 <0.001 Yes
30 wt.% vs. 10 wt.% 0.0349 48.138 <0.001 Yes
30 wt.% vs. 20 wt.% 0.0214 29.466 <0.001 Yes
20 wt.% vs. 5 wt.% 0.0205 28.249 <0.001 Yes
20 wt.% vs. 10 wt.% 0.0135 18.672 <0.001 Yes
10 wt.% vs. 5 wt.% 0.00695 9.577 <0.001 Yes
Comparisons for factor: Treatment
Comparison Diff of Means t P P<0.050
Acidic Treatment vs. HDPE 0.0446 61.435 <0.001 Yes
Acidic vs. No Treatment 0.0122 16.823 <0.001 Yes
Acidic vs. Alkaline Treatment 0.00208 2.859 0.044 Yes
Alkaline Treatment vs. HDPE 0.0425 58.576 <0.001 Yes
Alkaline vs. No Treatment 0.0101 13.964 <0.001 Yes
No Treatment vs. HDPE 0.0324 44.612 <0.001 Yes
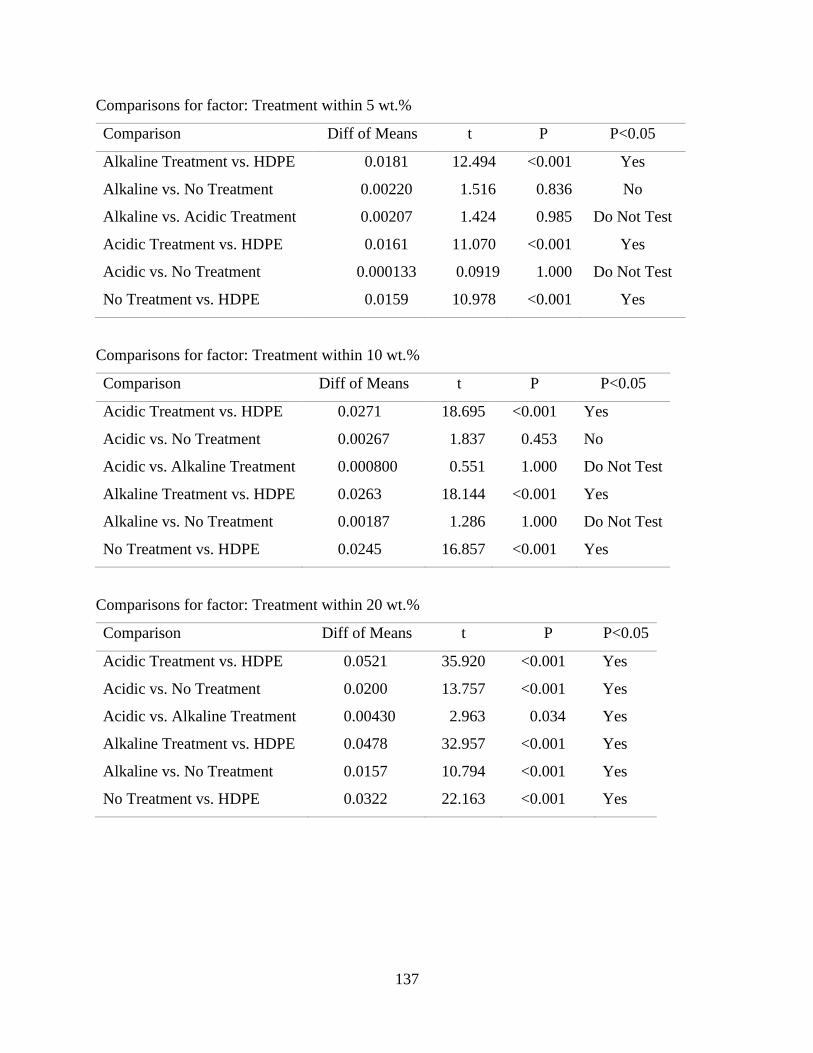
137
Comparisons for factor: Treatment within 5 wt.%
Comparison Diff of Means t P P<0.05
Alkaline Treatment vs. HDPE 0.0181 12.494 <0.001 Yes
Alkaline vs. No Treatment 0.00220 1.516 0.836 No
Alkaline vs. Acidic Treatment 0.00207 1.424 0.985 Do Not Test
Acidic Treatment vs. HDPE 0.0161 11.070 <0.001 Yes
Acidic vs. No Treatment 0.000133 0.0919 1.000 Do Not Test
No Treatment vs. HDPE 0.0159 10.978 <0.001 Yes
Comparisons for factor: Treatment within 10 wt.%
Comparison Diff of Means t P P<0.05
Acidic Treatment vs. HDPE 0.0271 18.695 <0.001 Yes
Acidic vs. No Treatment 0.00267 1.837 0.453 No
Acidic vs. Alkaline Treatment 0.000800 0.551 1.000 Do Not Test
Alkaline Treatment vs. HDPE 0.0263 18.144 <0.001 Yes
Alkaline vs. No Treatment 0.00187 1.286 1.000 Do Not Test
No Treatment vs. HDPE 0.0245 16.857 <0.001 Yes
Comparisons for factor: Treatment within 20 wt.%
Comparison Diff of Means t P P<0.05
Acidic Treatment vs. HDPE 0.0521 35.920 <0.001 Yes
Acidic vs. No Treatment 0.0200 13.757 <0.001 Yes
Acidic vs. Alkaline Treatment 0.00430 2.963 0.034 Yes
Alkaline Treatment vs. HDPE 0.0478 32.957 <0.001 Yes
Alkaline vs. No Treatment 0.0157 10.794 <0.001 Yes
No Treatment vs. HDPE 0.0322 22.163 <0.001 Yes

138
Comparisons for factor: Treatment within 30 wt.%
Comparison Diff of Means t P P<0.05
Acidic Treatment vs. HDPE 0.0830 57.187 <0.001 Yes
Acidic vs. No Treatment 0.0261 17.960 <0.001 Yes
Acidic vs. Alkaline Treatment 0.00527 3.629 0.006 Yes
Alkaline Treatment vs. HDPE 0.0777 53.558 <0.001 Yes
Alkaline vs. No Treatment 0.0208 14.331 <0.001 Yes
No Treatment vs. HDPE 0.0569 39.227 <0.001 Yes
Comparisons for factor: Fiber load within no treatment
Comparison Diff of Means t P P<0.05
30 wt.% vs. 5 wt.% 0.0410 28.249 <0.001 Yes
30 wt.% vs. 10 wt.% 0.0325 22.369 <0.001 Yes
30 wt.% vs. 20 wt.% 0.0248 17.064 <0.001 Yes
20 wt.% vs. 5 wt.% 0.0162 11.185 <0.001 Yes
20 wt.% vs. 10 wt.% 0.00770 5.305 <0.001 Yes
10 wt.% vs. 5 wt.% 0.00853 5.879 <0.001 Yes
Comparisons for factor: Fiber load within Alkaline Treatment
Comparison Diff of Means t P P<0.05
30 wt.% vs. 5 wt.% 0.0596 41.064 <0.001 Yes
30 wt.% vs. 10 wt.% 0.0514 35.414 <0.001 Yes
30 wt.% vs. 20 wt.% 0.0299 20.601 <0.001 Yes
20 wt.% vs. 5 wt.% 0.0297 20.463 <0.001 Yes
20 wt.% vs. 10 wt.% 0.0215 14.813 <0.001 Yes
10 wt.% vs. 5 wt.% 0.00820 5.650 <0.001 Yes
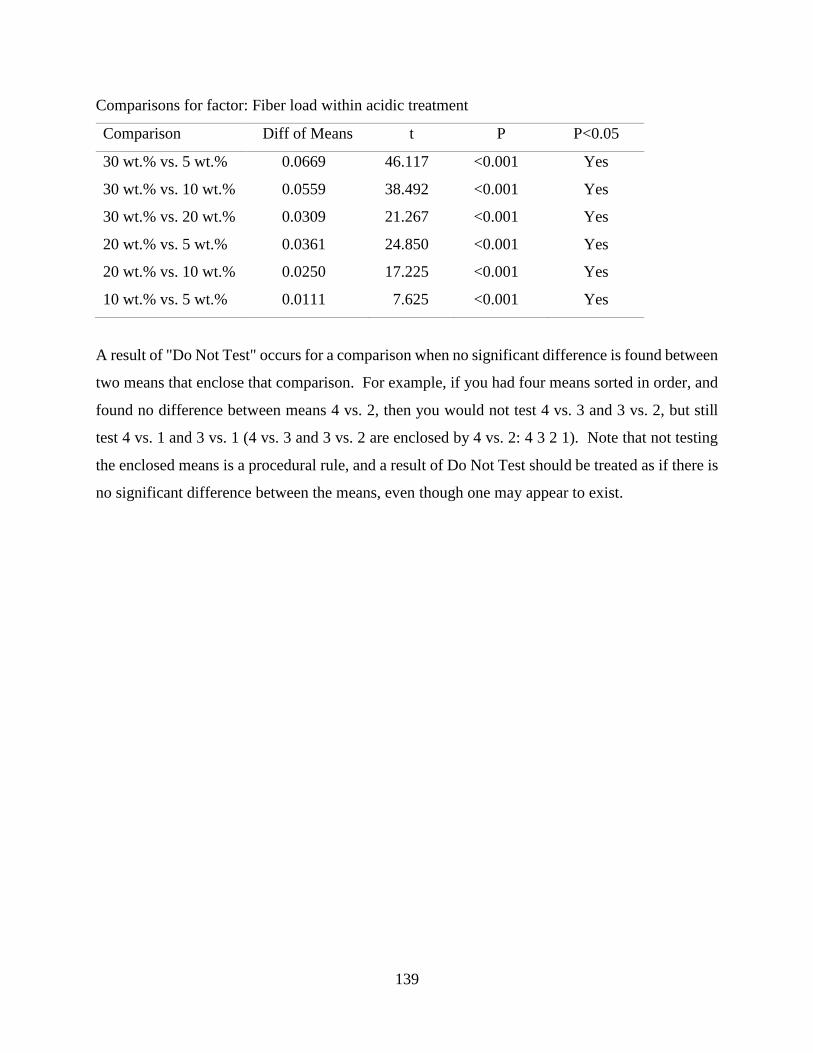
139
Comparisons for factor: Fiber load within acidic treatment
Comparison Diff of Means t P P<0.05
30 wt.% vs. 5 wt.% 0.0669 46.117 <0.001 Yes
30 wt.% vs. 10 wt.% 0.0559 38.492 <0.001 Yes
30 wt.% vs. 20 wt.% 0.0309 21.267 <0.001 Yes
20 wt.% vs. 5 wt.% 0.0361 24.850 <0.001 Yes
20 wt.% vs. 10 wt.% 0.0250 17.225 <0.001 Yes
10 wt.% vs. 5 wt.% 0.0111 7.625 <0.001 Yes
A result of "Do Not Test" occurs for a comparison when no significant difference is found between
two means that enclose that comparison. For example, if you had four means sorted in order, and
found no difference between means 4 vs. 2, then you would not test 4 vs. 3 and 3 vs. 2, but still
test 4 vs. 1 and 3 vs. 1 (4 vs. 3 and 3 vs. 2 are enclosed by 4 vs. 2: 4 3 2 1). Note that not testing
the enclosed means is a procedural rule, and a result of Do Not Test should be treated as if there is
no significant difference between the means, even though one may appear to exist.
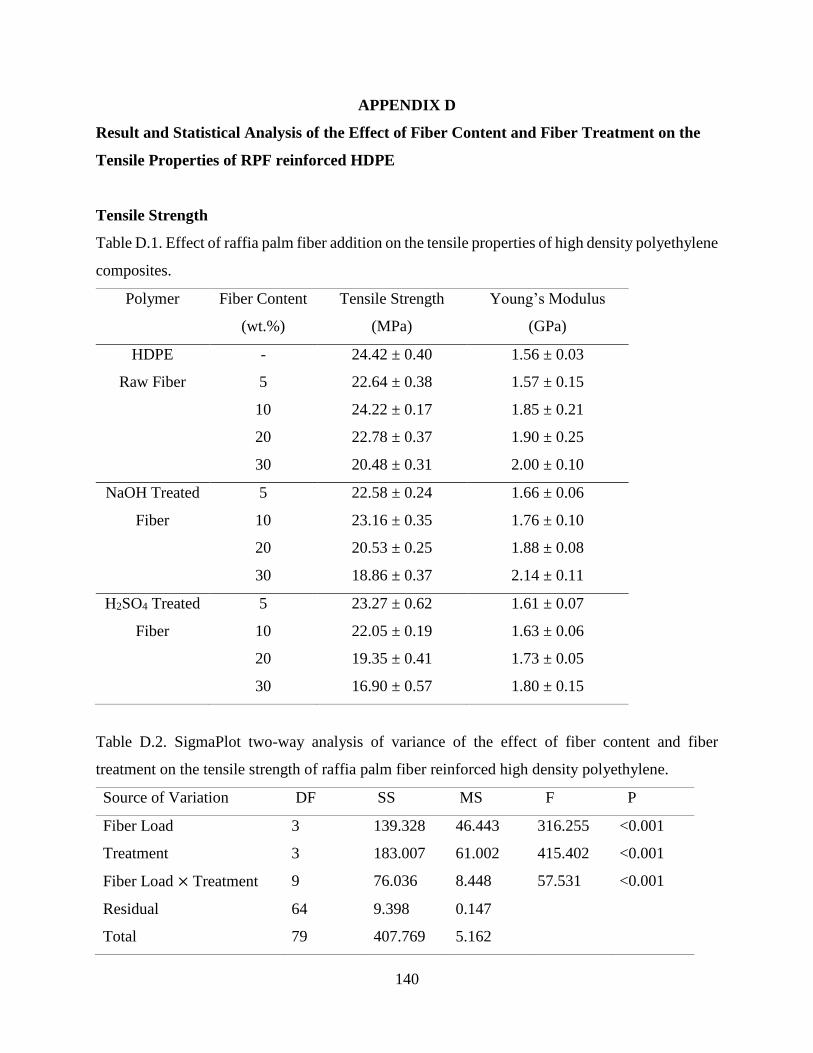
140
APPENDIX D
Result and Statistical Analysis of the Effect of Fiber Content and Fiber Treatment on the
Tensile Properties of RPF reinforced HDPE
Tensile Strength
Table D.1. Effect of raffia palm fiber addition on the tensile properties of high density polyethylene
composites.
Polymer Fiber Content
(wt.%)
Tensile Strength
(MPa)
Young’s Modulus
(GPa)
HDPE
Raw Fiber
-
5
10
20
30
24.42 ± 0.40
22.64 ± 0.38
24.22 ± 0.17
22.78 ± 0.37
20.48 ± 0.31
1.56 ± 0.03
1.57 ± 0.15
1.85 ± 0.21
1.90 ± 0.25
2.00 ± 0.10
NaOH Treated
Fiber
5
10
20
30
22.58 ± 0.24
23.16 ± 0.35
20.53 ± 0.25
18.86 ± 0.37
1.66 ± 0.06
1.76 ± 0.10
1.88 ± 0.08
2.14 ± 0.11
H2SO4 Treated
Fiber
5
10
20
30
23.27 ± 0.62
22.05 ± 0.19
19.35 ± 0.41
16.90 ± 0.57
1.61 ± 0.07
1.63 ± 0.06
1.73 ± 0.05
1.80 ± 0.15
Table D.2. SigmaPlot two-way analysis of variance of the effect of fiber content and fiber
treatment on the tensile strength of raffia palm fiber reinforced high density polyethylene.
Source of Variation DF SS MS F P
Fiber Load 3 139.328 46.443 316.255 <0.001
Treatment 3 183.007 61.002 415.402 <0.001
Fiber Load × Treatment 9 76.036 8.448 57.531 <0.001
Residual 64 9.398 0.147
Total 79 407.769 5.162
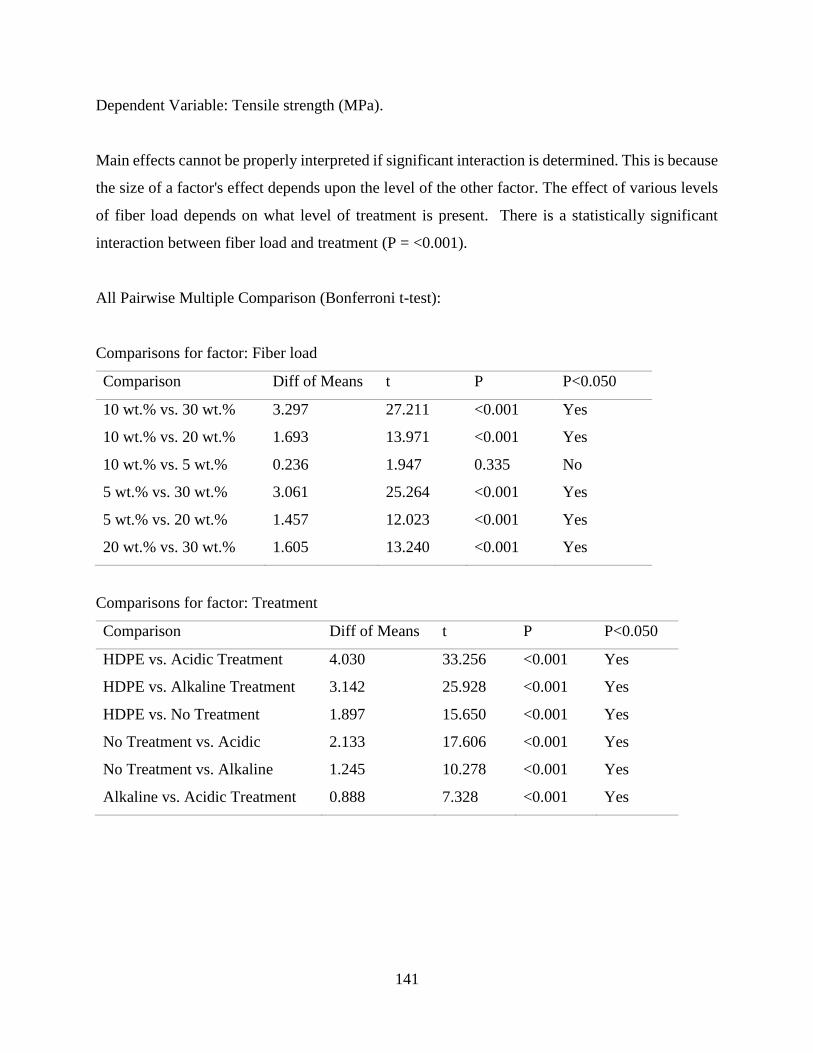
141
Dependent Variable: Tensile strength (MPa).
Main effects cannot be properly interpreted if significant interaction is determined. This is because
the size of a factor's effect depends upon the level of the other factor. The effect of various levels
of fiber load depends on what level of treatment is present. There is a statistically significant
interaction between fiber load and treatment (P = <0.001).
All Pairwise Multiple Comparison (Bonferroni t-test):
Comparisons for factor: Fiber load
Comparison Diff of Means t P P<0.050
10 wt.% vs. 30 wt.% 3.297 27.211 <0.001 Yes
10 wt.% vs. 20 wt.% 1.693 13.971 <0.001 Yes
10 wt.% vs. 5 wt.% 0.236 1.947 0.335 No
5 wt.% vs. 30 wt.% 3.061 25.264 <0.001 Yes
5 wt.% vs. 20 wt.% 1.457 12.023 <0.001 Yes
20 wt.% vs. 30 wt.% 1.605 13.240 <0.001 Yes
Comparisons for factor: Treatment
Comparison Diff of Means t P P<0.050
HDPE vs. Acidic Treatment 4.030 33.256 <0.001 Yes
HDPE vs. Alkaline Treatment 3.142 25.928 <0.001 Yes
HDPE vs. No Treatment 1.897 15.650 <0.001 Yes
No Treatment vs. Acidic 2.133 17.606 <0.001 Yes
No Treatment vs. Alkaline 1.245 10.278 <0.001 Yes
Alkaline vs. Acidic Treatment 0.888 7.328 <0.001 Yes
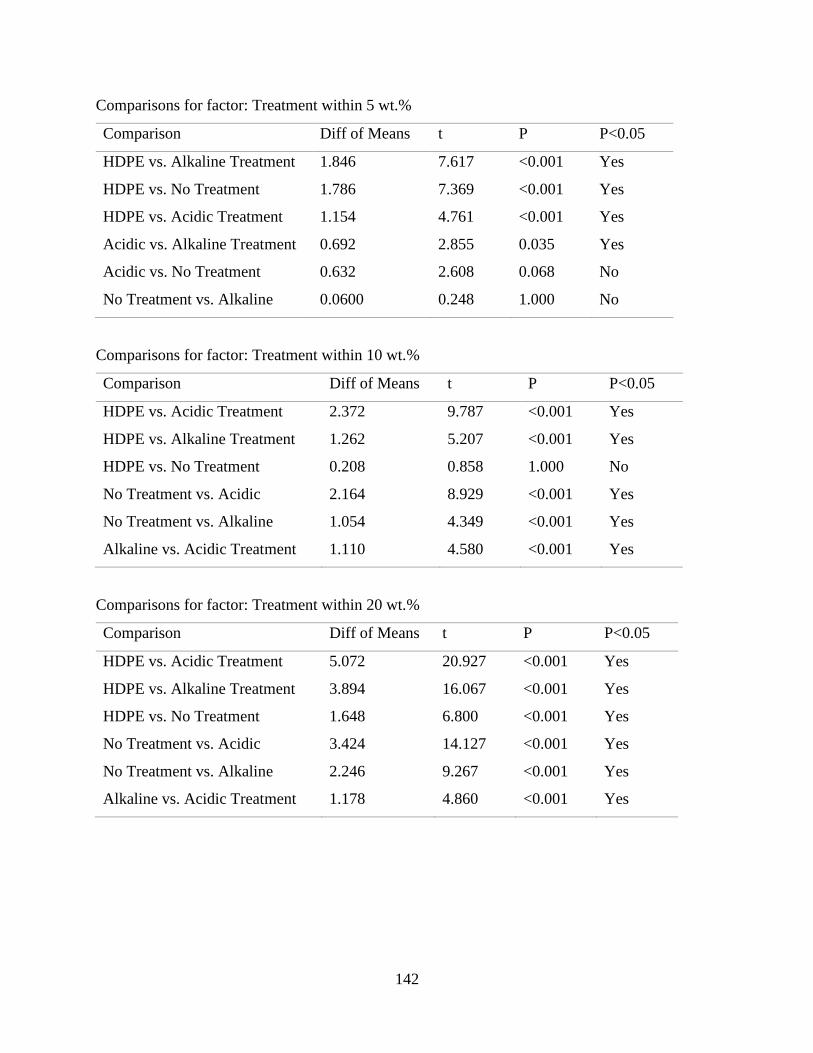
142
Comparisons for factor: Treatment within 5 wt.%
Comparison Diff of Means t P P<0.05
HDPE vs. Alkaline Treatment 1.846 7.617 <0.001 Yes
HDPE vs. No Treatment 1.786 7.369 <0.001 Yes
HDPE vs. Acidic Treatment 1.154 4.761 <0.001 Yes
Acidic vs. Alkaline Treatment 0.692 2.855 0.035 Yes
Acidic vs. No Treatment 0.632 2.608 0.068 No
No Treatment vs. Alkaline 0.0600 0.248 1.000 No
Comparisons for factor: Treatment within 10 wt.%
Comparison Diff of Means t P P<0.05
HDPE vs. Acidic Treatment 2.372 9.787 <0.001 Yes
HDPE vs. Alkaline Treatment 1.262 5.207 <0.001 Yes
HDPE vs. No Treatment 0.208 0.858 1.000 No
No Treatment vs. Acidic 2.164 8.929 <0.001 Yes
No Treatment vs. Alkaline 1.054 4.349 <0.001 Yes
Alkaline vs. Acidic Treatment 1.110 4.580 <0.001 Yes
Comparisons for factor: Treatment within 20 wt.%
Comparison Diff of Means t P P<0.05
HDPE vs. Acidic Treatment 5.072 20.927 <0.001 Yes
HDPE vs. Alkaline Treatment 3.894 16.067 <0.001 Yes
HDPE vs. No Treatment 1.648 6.800 <0.001 Yes
No Treatment vs. Acidic 3.424 14.127 <0.001 Yes
No Treatment vs. Alkaline 2.246 9.267 <0.001 Yes
Alkaline vs. Acidic Treatment 1.178 4.860 <0.001 Yes
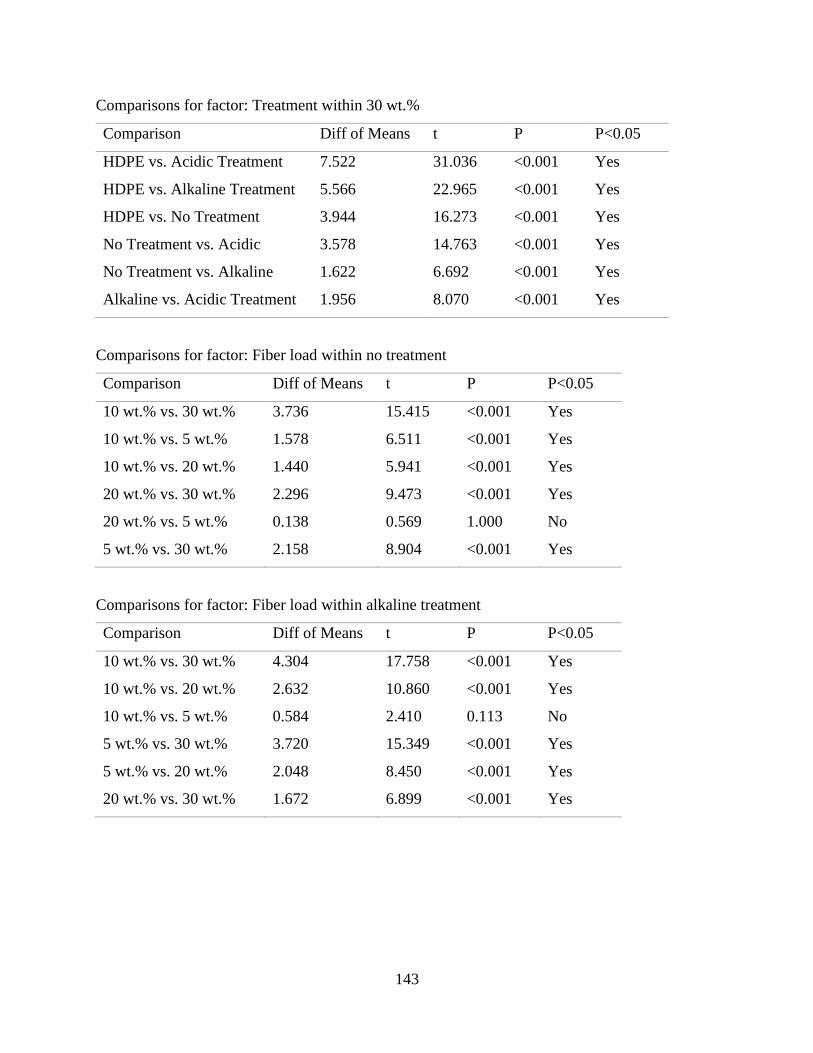
143
Comparisons for factor: Treatment within 30 wt.%
Comparison Diff of Means t P P<0.05
HDPE vs. Acidic Treatment 7.522 31.036 <0.001 Yes
HDPE vs. Alkaline Treatment 5.566 22.965 <0.001 Yes
HDPE vs. No Treatment 3.944 16.273 <0.001 Yes
No Treatment vs. Acidic 3.578 14.763 <0.001 Yes
No Treatment vs. Alkaline 1.622 6.692 <0.001 Yes
Alkaline vs. Acidic Treatment 1.956 8.070 <0.001 Yes
Comparisons for factor: Fiber load within no treatment
Comparison Diff of Means t P P<0.05
10 wt.% vs. 30 wt.% 3.736 15.415 <0.001 Yes
10 wt.% vs. 5 wt.% 1.578 6.511 <0.001 Yes
10 wt.% vs. 20 wt.% 1.440 5.941 <0.001 Yes
20 wt.% vs. 30 wt.% 2.296 9.473 <0.001 Yes
20 wt.% vs. 5 wt.% 0.138 0.569 1.000 No
5 wt.% vs. 30 wt.% 2.158 8.904 <0.001 Yes
Comparisons for factor: Fiber load within alkaline treatment
Comparison Diff of Means t P P<0.05
10 wt.% vs. 30 wt.% 4.304 17.758 <0.001 Yes
10 wt.% vs. 20 wt.% 2.632 10.860 <0.001 Yes
10 wt.% vs. 5 wt.% 0.584 2.410 0.113 No
5 wt.% vs. 30 wt.% 3.720 15.349 <0.001 Yes
5 wt.% vs. 20 wt.% 2.048 8.450 <0.001 Yes
20 wt.% vs. 30 wt.% 1.672 6.899 <0.001 Yes
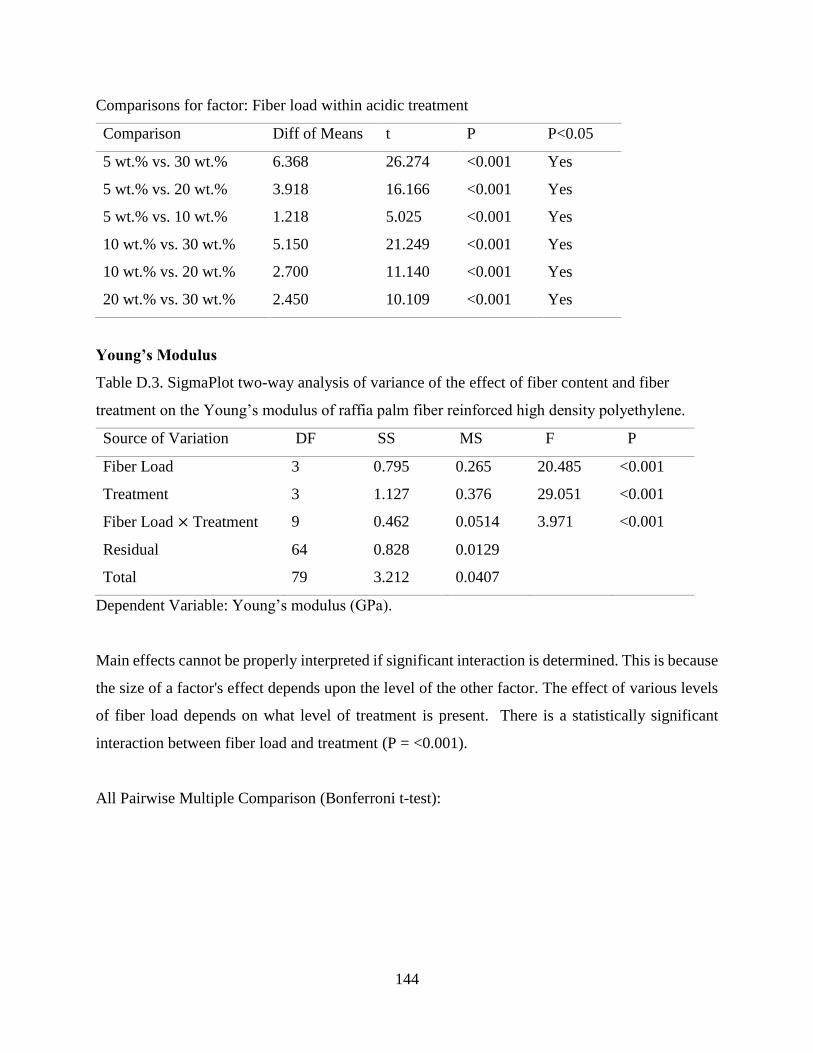
144
Comparisons for factor: Fiber load within acidic treatment
Comparison Diff of Means t P P<0.05
5 wt.% vs. 30 wt.% 6.368 26.274 <0.001 Yes
5 wt.% vs. 20 wt.% 3.918 16.166 <0.001 Yes
5 wt.% vs. 10 wt.% 1.218 5.025 <0.001 Yes
10 wt.% vs. 30 wt.% 5.150 21.249 <0.001 Yes
10 wt.% vs. 20 wt.% 2.700 11.140 <0.001 Yes
20 wt.% vs. 30 wt.% 2.450 10.109 <0.001 Yes
Young’s Modulus
Table D.3. SigmaPlot two-way analysis of variance of the effect of fiber content and fiber
treatment on the Young’s modulus of raffia palm fiber reinforced high density polyethylene.
Source of Variation DF SS MS F P
Fiber Load 3 0.795 0.265 20.485 <0.001
Treatment 3 1.127 0.376 29.051 <0.001
Fiber Load × Treatment 9 0.462 0.0514 3.971 <0.001
Residual 64 0.828 0.0129
Total 79 3.212 0.0407
Dependent Variable: Young’s modulus (GPa).
Main effects cannot be properly interpreted if significant interaction is determined. This is because
the size of a factor's effect depends upon the level of the other factor. The effect of various levels
of fiber load depends on what level of treatment is present. There is a statistically significant
interaction between fiber load and treatment (P = <0.001).
All Pairwise Multiple Comparison (Bonferroni t-test):
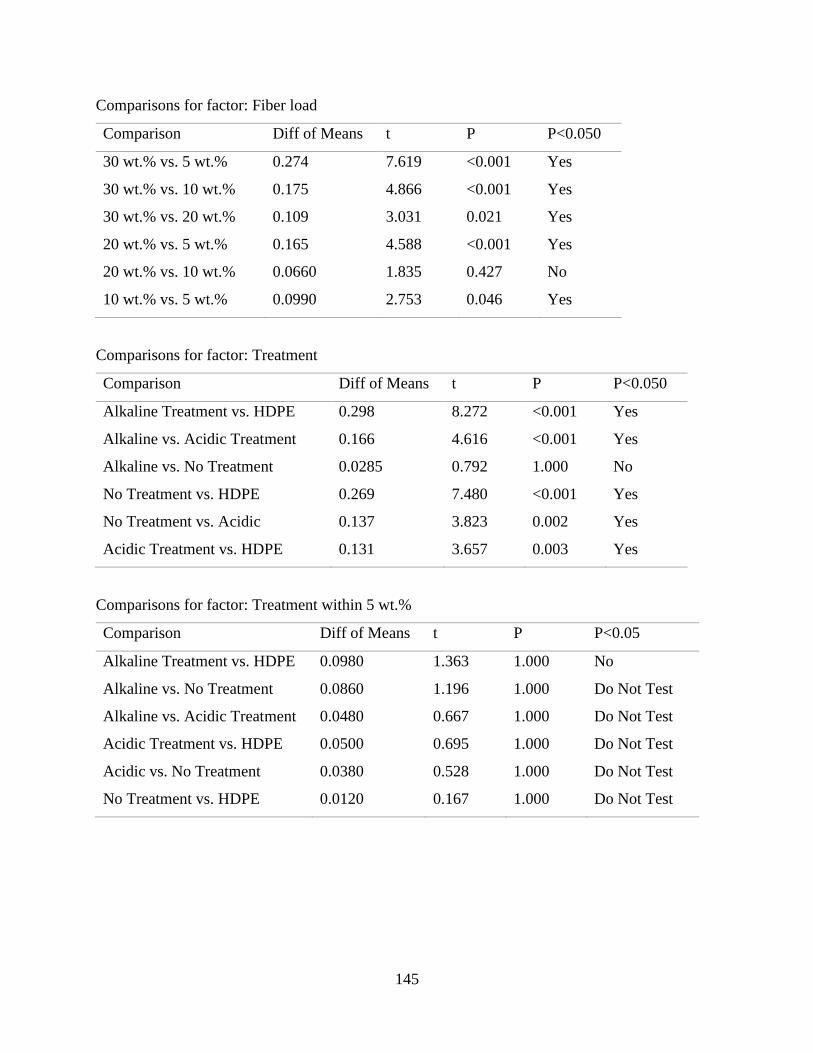
145
Comparisons for factor: Fiber load
Comparison Diff of Means t P P<0.050
30 wt.% vs. 5 wt.% 0.274 7.619 <0.001 Yes
30 wt.% vs. 10 wt.% 0.175 4.866 <0.001 Yes
30 wt.% vs. 20 wt.% 0.109 3.031 0.021 Yes
20 wt.% vs. 5 wt.% 0.165 4.588 <0.001 Yes
20 wt.% vs. 10 wt.% 0.0660 1.835 0.427 No
10 wt.% vs. 5 wt.% 0.0990 2.753 0.046 Yes
Comparisons for factor: Treatment
Comparison Diff of Means t P P<0.050
Alkaline Treatment vs. HDPE 0.298 8.272 <0.001 Yes
Alkaline vs. Acidic Treatment 0.166 4.616 <0.001 Yes
Alkaline vs. No Treatment 0.0285 0.792 1.000 No
No Treatment vs. HDPE 0.269 7.480 <0.001 Yes
No Treatment vs. Acidic 0.137 3.823 0.002 Yes
Acidic Treatment vs. HDPE 0.131 3.657 0.003 Yes
Comparisons for factor: Treatment within 5 wt.%
Comparison Diff of Means t P P<0.05
Alkaline Treatment vs. HDPE 0.0980 1.363 1.000 No
Alkaline vs. No Treatment 0.0860 1.196 1.000 Do Not Test
Alkaline vs. Acidic Treatment 0.0480 0.667 1.000 Do Not Test
Acidic Treatment vs. HDPE 0.0500 0.695 1.000 Do Not Test
Acidic vs. No Treatment 0.0380 0.528 1.000 Do Not Test
No Treatment vs. HDPE 0.0120 0.167 1.000 Do Not Test
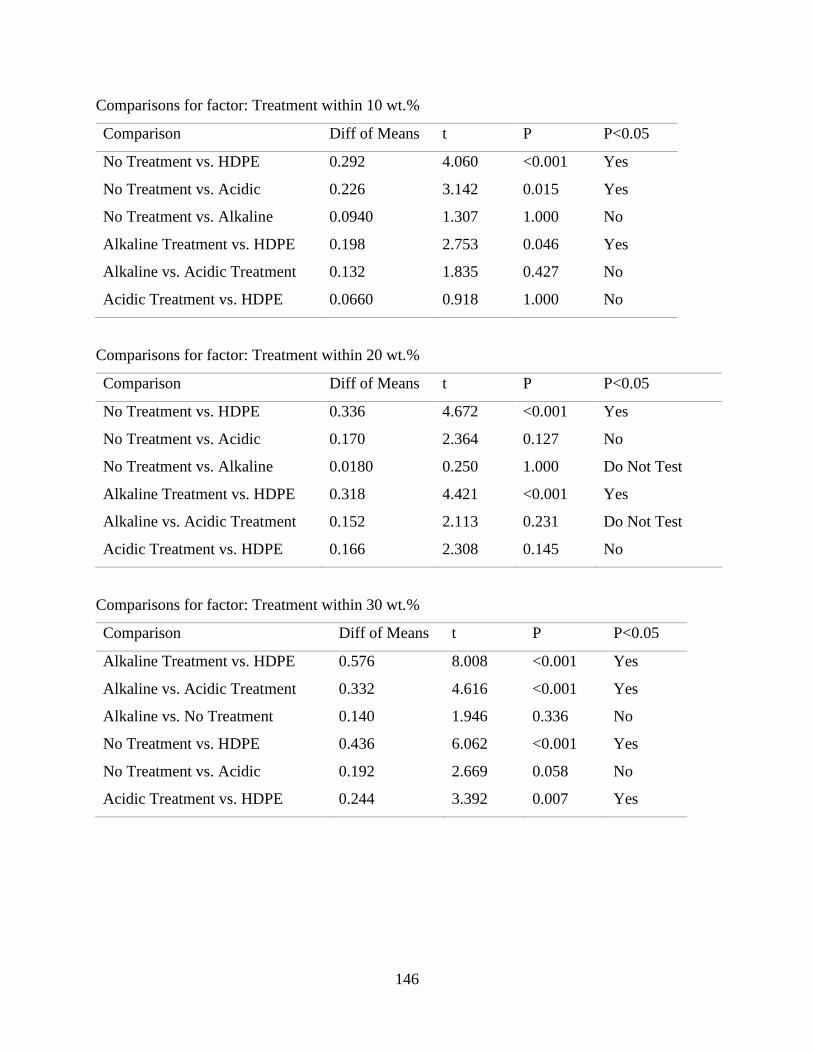
146
Comparisons for factor: Treatment within 10 wt.%
Comparison Diff of Means t P P<0.05
No Treatment vs. HDPE 0.292 4.060 <0.001 Yes
No Treatment vs. Acidic 0.226 3.142 0.015 Yes
No Treatment vs. Alkaline 0.0940 1.307 1.000 No
Alkaline Treatment vs. HDPE 0.198 2.753 0.046 Yes
Alkaline vs. Acidic Treatment 0.132 1.835 0.427 No
Acidic Treatment vs. HDPE 0.0660 0.918 1.000 No
Comparisons for factor: Treatment within 20 wt.%
Comparison Diff of Means t P P<0.05
No Treatment vs. HDPE 0.336 4.672 <0.001 Yes
No Treatment vs. Acidic 0.170 2.364 0.127 No
No Treatment vs. Alkaline 0.0180 0.250 1.000 Do Not Test
Alkaline Treatment vs. HDPE 0.318 4.421 <0.001 Yes
Alkaline vs. Acidic Treatment 0.152 2.113 0.231 Do Not Test
Acidic Treatment vs. HDPE 0.166 2.308 0.145 No
Comparisons for factor: Treatment within 30 wt.%
Comparison Diff of Means t P P<0.05
Alkaline Treatment vs. HDPE 0.576 8.008 <0.001 Yes
Alkaline vs. Acidic Treatment 0.332 4.616 <0.001 Yes
Alkaline vs. No Treatment 0.140 1.946 0.336 No
No Treatment vs. HDPE 0.436 6.062 <0.001 Yes
No Treatment vs. Acidic 0.192 2.669 0.058 No
Acidic Treatment vs. HDPE 0.244 3.392 0.007 Yes

147
Comparisons for factor: Fiber load within no treatment
Comparison Diff of Means t P P<0.05
30 wt.% vs. 5 wt.% 0.424 5.895 <0.001 Yes
30 wt.% vs. 10 wt.% 0.144 2.002 0.297 No
30 wt.% vs. 20 wt.% 0.1000 1.390 1.000 Do Not Test
20 wt.% vs. 5 wt.% 0.324 4.505 <0.001 Yes
20 wt.% vs. 10 wt.% 0.0440 0.612 1.000 Do Not Test
10 wt.% vs. 5 wt.% 0.280 3.893 0.001 Yes
Comparisons for factor: Fiber load within alkaline treatment
Comparison Diff of Means t P P<0.05
30 wt.% vs. 5 wt.% 0.478 6.646 <0.001 Yes
30 wt.% vs. 10 wt.% 0.378 5.255 <0.001 Yes
30 wt.% vs. 20 wt.% 0.258 3.587 0.004 Yes
20 wt.% vs. 5 wt.% 0.220 3.059 0.019 No
20 wt.% vs. 10 wt.% 0.120 1.668 0.601 Do Not Test
10 wt.% vs. 5 wt.% 0.1000 1.390 1.000 Do Not Test
Comparisons for factor: Fiber load within acidic treatment
Comparison Diff of Means t P P<0.05
30 wt.% vs. 5 wt.% 0.194 2.697 0.054 No
30 wt.% vs. 10 wt.% 0.178 2.475 0.096 Do Not Test
30 wt.% vs. 20 wt.% 0.0780 1.084 1.000 Do Not Test
20 wt.% vs. 5 wt.% 0.116 1.613 0.670 Do Not Test
20 wt.% vs. 10 wt.% 0.100 1.390 1.000 Do Not Test
10 wt.% vs. 5 wt.% 0.0160 0.222 1.000 Do Not Test
A result of "Do Not Test" occurs for a comparison when no significant difference is found between
two means that enclose that comparison. For example, if you had four means sorted in order, and
found no difference between means 4 vs. 2, then you would not test 4 vs. 3 and 3 vs. 2, but still
test 4 vs. 1 and 3 vs. 1 (4 vs. 3 and 3 vs. 2 are enclosed by 4 vs. 2: 4 3 2 1). Note that not testing
148
the enclosed means is a procedural rule, and a result of Do Not Test should be treated as if there is
no significant difference between the means, even though one may appear to exist.
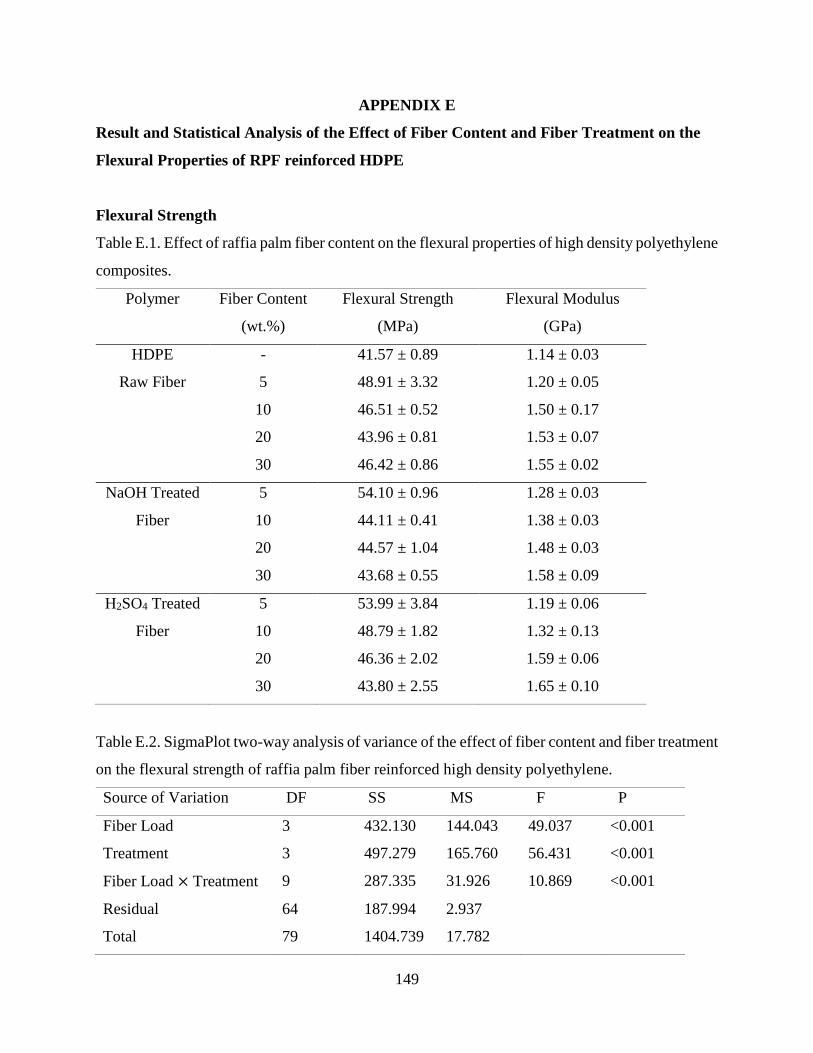
149
APPENDIX E
Result and Statistical Analysis of the Effect of Fiber Content and Fiber Treatment on the
Flexural Properties of RPF reinforced HDPE
Flexural Strength
Table E.1. Effect of raffia palm fiber content on the flexural properties of high density polyethylene
composites.
Polymer Fiber Content
(wt.%)
Flexural Strength
(MPa)
Flexural Modulus
(GPa)
HDPE
Raw Fiber
-
5
10
20
30
41.57 ± 0.89
48.91 ± 3.32
46.51 ± 0.52
43.96 ± 0.81
46.42 ± 0.86
1.14 ± 0.03
1.20 ± 0.05
1.50 ± 0.17
1.53 ± 0.07
1.55 ± 0.02
NaOH Treated
Fiber
5
10
20
30
54.10 ± 0.96
44.11 ± 0.41
44.57 ± 1.04
43.68 ± 0.55
1.28 ± 0.03
1.38 ± 0.03
1.48 ± 0.03
1.58 ± 0.09
H2SO4 Treated
Fiber
5
10
20
30
53.99 ± 3.84
48.79 ± 1.82
46.36 ± 2.02
43.80 ± 2.55
1.19 ± 0.06
1.32 ± 0.13
1.59 ± 0.06
1.65 ± 0.10
Table E.2. SigmaPlot two-way analysis of variance of the effect of fiber content and fiber treatment
on the flexural strength of raffia palm fiber reinforced high density polyethylene.
Source of Variation DF SS MS F P
Fiber Load 3 432.130 144.043 49.037 <0.001
Treatment 3 497.279 165.760 56.431 <0.001
Fiber Load × Treatment 9 287.335 31.926 10.869 <0.001
Residual 64 187.994 2.937
Total 79 1404.739 17.782
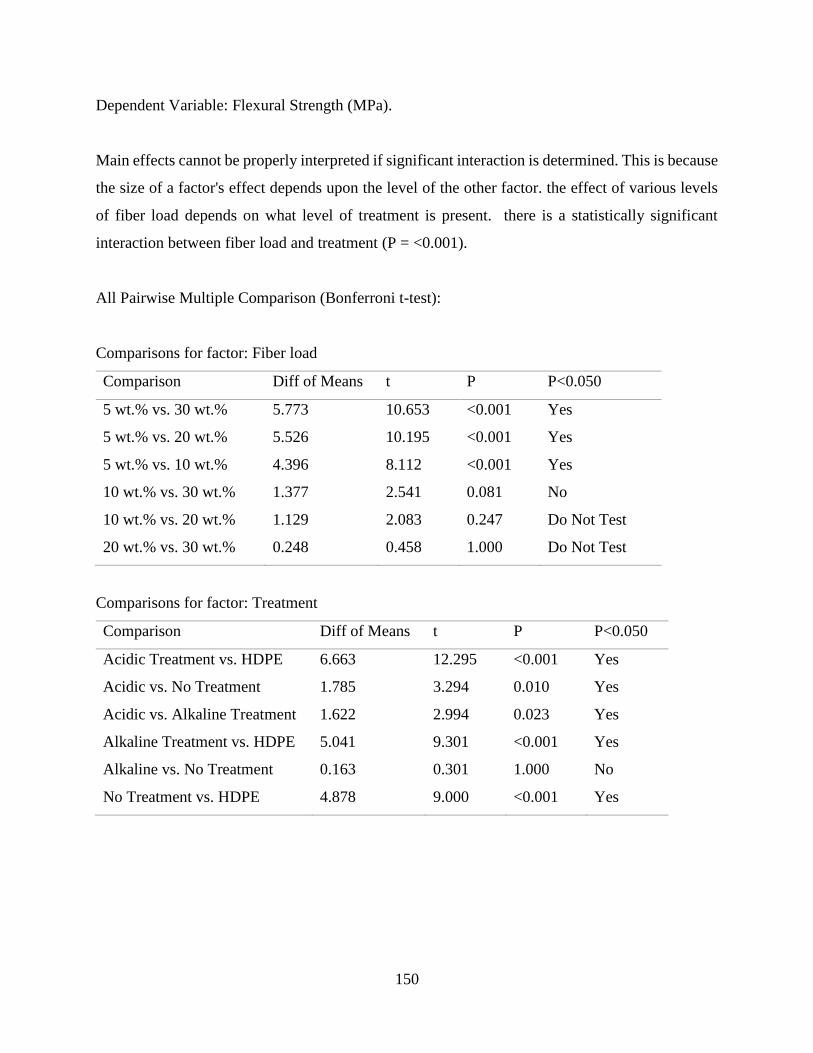
150
Dependent Variable: Flexural Strength (MPa).
Main effects cannot be properly interpreted if significant interaction is determined. This is because
the size of a factor's effect depends upon the level of the other factor. the effect of various levels
of fiber load depends on what level of treatment is present. there is a statistically significant
interaction between fiber load and treatment (P = <0.001).
All Pairwise Multiple Comparison (Bonferroni t-test):
Comparisons for factor: Fiber load
Comparison Diff of Means t P P<0.050
5 wt.% vs. 30 wt.% 5.773 10.653 <0.001 Yes
5 wt.% vs. 20 wt.% 5.526 10.195 <0.001 Yes
5 wt.% vs. 10 wt.% 4.396 8.112 <0.001 Yes
10 wt.% vs. 30 wt.% 1.377 2.541 0.081 No
10 wt.% vs. 20 wt.% 1.129 2.083 0.247 Do Not Test
20 wt.% vs. 30 wt.% 0.248 0.458 1.000 Do Not Test
Comparisons for factor: Treatment
Comparison Diff of Means t P P<0.050
Acidic Treatment vs. HDPE 6.663 12.295 <0.001 Yes
Acidic vs. No Treatment 1.785 3.294 0.010 Yes
Acidic vs. Alkaline Treatment 1.622 2.994 0.023 Yes
Alkaline Treatment vs. HDPE 5.041 9.301 <0.001 Yes
Alkaline vs. No Treatment 0.163 0.301 1.000 No
No Treatment vs. HDPE 4.878 9.000 <0.001 Yes

151
Comparisons for factor: Treatment within 5 wt.%
Comparison Diff of Means t P P<0.05
Alkaline Treatment vs. HDPE 12.524 11.554 <0.001 Yes
Alkaline vs. No Treatment 5.184 4.782 <0.001 Yes
Alkaline vs. Acidic Treatment 0.110 0.101 1.000 No
Acidic Treatment vs. HDPE 12.414 11.452 <0.001 Yes
Acidic vs. No Treatment 5.074 4.681 <0.001 Yes
No Treatment vs. HDPE 7.340 6.771 <0.001 Yes
Comparisons for factor: Treatment within 10 wt.%
Comparison Diff of Means t P P<0.05
Acidic Treatment vs. HDPE 7.222 6.663 <0.001 Yes
Acidic vs. Alkaline Treatment 4.688 4.325 <0.001 Yes
Acidic vs. No Treatment 2.286 2.109 0.233 No
No Treatment vs. HDPE 4.936 4.554 <0.001 Yes
No Treatment vs. Alkaline 2.402 2.216 0.182 No
Alkaline Treatment vs. HDPE 2.534 2.338 0.135 No
Comparisons for factor: Treatment within 20 wt.%
Comparison Diff of Means t P P<0.05
Acidic Treatment vs. HDPE 4.792 4.421 <0.001 Yes
Acidic vs. No Treatment 2.404 2.218 0.181 No
Acidic vs. Alkaline Treatment 1.796 1.657 0.615 Do Not Test
Alkaline Treatment vs. HDPE 2.996 2.764 0.045 Yes
Alkaline vs. No Treatment 0.608 0.561 1.000 Do Not Test
No Treatment vs. HDPE 2.388 2.203 0.187 No
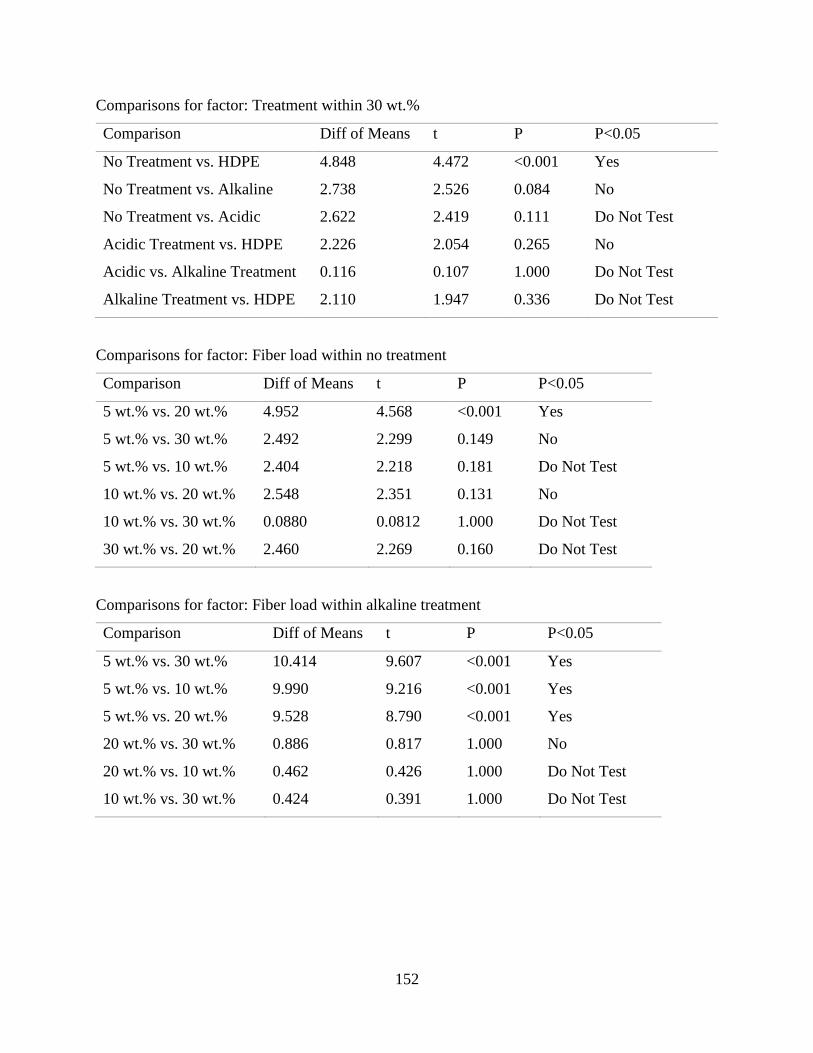
152
Comparisons for factor: Treatment within 30 wt.%
Comparison Diff of Means t P P<0.05
No Treatment vs. HDPE 4.848 4.472 <0.001 Yes
No Treatment vs. Alkaline 2.738 2.526 0.084 No
No Treatment vs. Acidic 2.622 2.419 0.111 Do Not Test
Acidic Treatment vs. HDPE 2.226 2.054 0.265 No
Acidic vs. Alkaline Treatment 0.116 0.107 1.000 Do Not Test
Alkaline Treatment vs. HDPE 2.110 1.947 0.336 Do Not Test
Comparisons for factor: Fiber load within no treatment
Comparison Diff of Means t P P<0.05
5 wt.% vs. 20 wt.% 4.952 4.568 <0.001 Yes
5 wt.% vs. 30 wt.% 2.492 2.299 0.149 No
5 wt.% vs. 10 wt.% 2.404 2.218 0.181 Do Not Test
10 wt.% vs. 20 wt.% 2.548 2.351 0.131 No
10 wt.% vs. 30 wt.% 0.0880 0.0812 1.000 Do Not Test
30 wt.% vs. 20 wt.% 2.460 2.269 0.160 Do Not Test
Comparisons for factor: Fiber load within alkaline treatment
Comparison Diff of Means t P P<0.05
5 wt.% vs. 30 wt.% 10.414 9.607 <0.001 Yes
5 wt.% vs. 10 wt.% 9.990 9.216 <0.001 Yes
5 wt.% vs. 20 wt.% 9.528 8.790 <0.001 Yes
20 wt.% vs. 30 wt.% 0.886 0.817 1.000 No
20 wt.% vs. 10 wt.% 0.462 0.426 1.000 Do Not Test
10 wt.% vs. 30 wt.% 0.424 0.391 1.000 Do Not Test
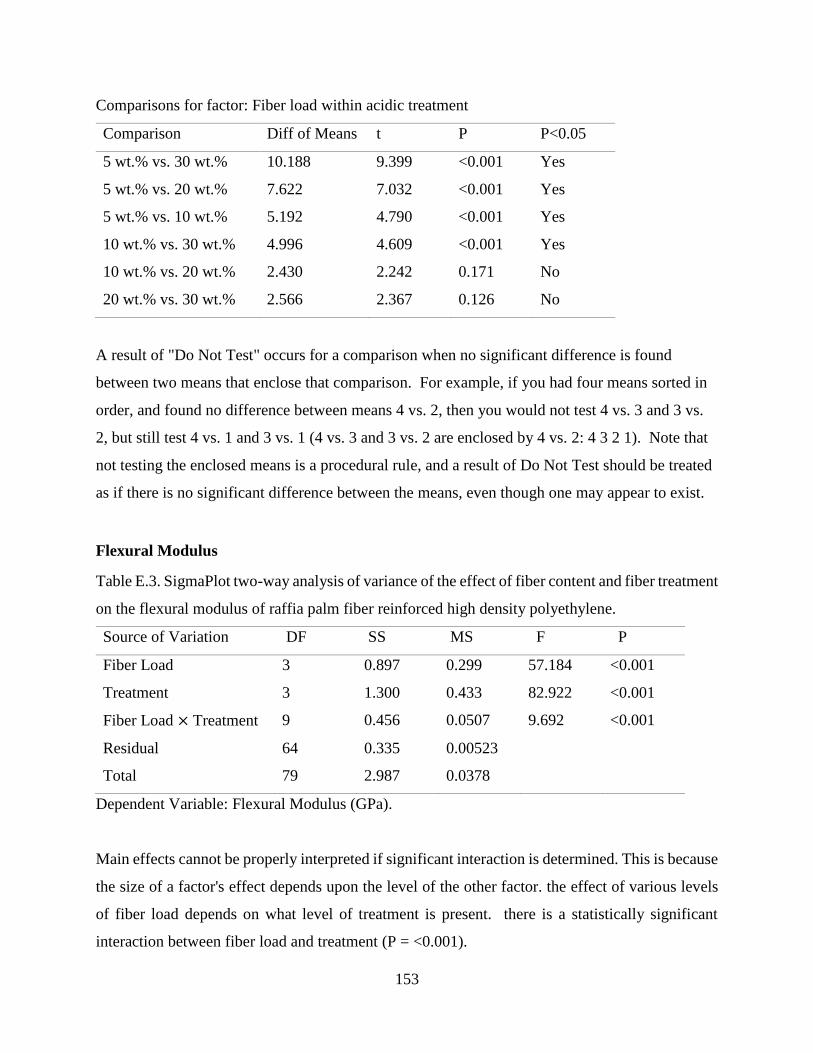
153
Comparisons for factor: Fiber load within acidic treatment
Comparison Diff of Means t P P<0.05
5 wt.% vs. 30 wt.% 10.188 9.399 <0.001 Yes
5 wt.% vs. 20 wt.% 7.622 7.032 <0.001 Yes
5 wt.% vs. 10 wt.% 5.192 4.790 <0.001 Yes
10 wt.% vs. 30 wt.% 4.996 4.609 <0.001 Yes
10 wt.% vs. 20 wt.% 2.430 2.242 0.171 No
20 wt.% vs. 30 wt.% 2.566 2.367 0.126 No
A result of "Do Not Test" occurs for a comparison when no significant difference is found
between two means that enclose that comparison. For example, if you had four means sorted in
order, and found no difference between means 4 vs. 2, then you would not test 4 vs. 3 and 3 vs.
2, but still test 4 vs. 1 and 3 vs. 1 (4 vs. 3 and 3 vs. 2 are enclosed by 4 vs. 2: 4 3 2 1). Note that
not testing the enclosed means is a procedural rule, and a result of Do Not Test should be treated
as if there is no significant difference between the means, even though one may appear to exist.
Flexural Modulus
Table E.3. SigmaPlot two-way analysis of variance of the effect of fiber content and fiber treatment
on the flexural modulus of raffia palm fiber reinforced high density polyethylene.
Source of Variation DF SS MS F P
Fiber Load 3 0.897 0.299 57.184 <0.001
Treatment 3 1.300 0.433 82.922 <0.001
Fiber Load × Treatment 9 0.456 0.0507 9.692 <0.001
Residual 64 0.335 0.00523
Total 79 2.987 0.0378
Dependent Variable: Flexural Modulus (GPa).
Main effects cannot be properly interpreted if significant interaction is determined. This is because
the size of a factor's effect depends upon the level of the other factor. the effect of various levels
of fiber load depends on what level of treatment is present. there is a statistically significant
interaction between fiber load and treatment (P = <0.001).

154
All Pairwise Multiple Comparison (Bonferroni t-test):
Comparisons for factor: Fiber load
Comparison Diff of Means t P P<0.050
30 wt.% vs. 5 wt.% 0.275 12.029 <0.001 Yes
30 wt.% vs. 10 wt.% 0.145 6.342 <0.001 Yes
30 wt.% vs. 20 wt.% 0.0435 1.903 0.369 No
20 wt.% vs. 5 wt.% 0.232 10.126 <0.001 Yes
20 wt.% vs. 10 wt.% 0.102 4.440 <0.001 Yes
10 wt.% vs. 5 wt.% 0.130 5.686 <0.001 Yes
Comparisons for factor: Treatment
Comparison Diff of Means t P P<0.050
No Treatment vs. HDPE 0.302 13.188 <0.001 Yes
No Treatment vs. Alkaline 0.0150 0.656 1.000 No
No Treatment vs. Acidic 0.00700 0.306 1.000 Do Not Test
Acidic Treatment vs. HDPE 0.295 12.881 <0.001 Yes
Acidic vs. Alkaline Treatment 0.00800 0.350 1.000 Do Not Test
Alkaline Treatment vs. HDPE 0.286 12.532 <0.001 Yes
Comparisons for factor: Treatment within 5 wt.%
Comparison Diff of Means t P P<0.05
Alkaline Treatment vs. HDPE 0.140 3.062 0.019 Yes
Alkaline vs. Acidic Treatment 0.0940 2.056 0.263 No
Alkaline vs. No Treatment 0.0800 1.750 0.510 Do Not Test
No Treatment vs. HDPE 0.0600 1.312 1.000 No
No Treatment vs. Acidic 0.0140 0.306 1.000 Do Not Test
Acidic Treatment vs. HDPE 0.0460 1.006 1.000 Do Not Test

155
Comparisons for factor: Treatment within 10 wt.%
Comparison Diff of Means t P P<0.05
No Treatment vs. HDPE 0.352 7.698 <0.001 Yes
No Treatment vs. Acidic 0.172 3.762 0.002 Yes
No Treatment vs. Alkaline 0.118 2.581 0.073 No
Alkaline Treatment vs. HDPE 0.234 5.118 <0.001 Yes
Alkaline vs. Acidic Treatment 0.0540 1.181 1.000 No
Acidic Treatment vs. HDPE 0.180 3.937 0.001 Yes
Comparisons for factor: Treatment within 20 wt.%
Comparison Diff of Means t P P<0.05
Acidic Treatment vs. HDPE 0.442 9.667 <0.001 Yes
Acidic vs. Alkaline Treatment 0.102 2.231 0.175 No
Acidic vs. No Treatment 0.0520 1.137 1.000 Do Not Test
No Treatment vs. HDPE 0.390 8.529 <0.001 Yes
No Treatment vs. Alkaline 0.0500 1.094 1.000 Do Not Test
Alkaline Treatment vs. HDPE 0.340 7.436 <0.001 Yes
Comparisons for factor: Treatment within 30 wt.%
Comparison Diff of Means t P P<0.05
Acidic Treatment vs. HDPE 0.510 11.154 <0.001 Yes
Acidic vs. No Treatment 0.106 2.318 0.142 No
Acidic vs. Alkaline Treatment 0.0780 1.706 0.557 Do Not Test
Alkaline Treatment vs. HDPE 0.432 9.448 <0.001 Yes
Alkaline vs. No Treatment 0.0280 0.612 1.000 Do Not Test
No Treatment vs. HDPE 0.404 8.835 <0.001 Yes

156
Comparisons for factor: Fiber load within no treatment
Comparison Diff of Means t P P<0.05
30 wt.% vs. 5 wt.% 0.344 7.523 <0.001 Yes
30 wt.% vs. 10 wt.% 0.0520 1.137 1.000 No
30 wt.% vs. 20 wt.% 0.0140 0.306 1.000 Do Not Test
20 wt.% vs. 5 wt.% 0.330 7.217 <0.001 Yes
20 wt.% vs. 10 wt.% 0.0380 0.831 1.000 Do Not Test
10 wt.% vs. 5 wt.% 0.292 6.386 <0.001 Yes
Comparisons for factor: Fiber load within alkaline treatment
Comparison Diff of Means t P P<0.05
30 wt.% vs. 5 wt.% 0.292 6.386 <0.001 Yes
30 wt.% vs. 10 wt.% 0.198 4.330 <0.001 Yes
30 wt.% vs. 20 wt.% 0.0920 2.012 0.291 No
20 wt.% vs. 5 wt.% 0.200 4.374 <0.001 Yes
20 wt.% vs. 10 wt.% 0.106 2.318 0.142 No
10 wt.% vs. 5 wt.% 0.0940 2.056 0.263 No
Comparisons for factor: Fiber load within acidic treatment
Comparison Diff of Means t P P<0.05
30 wt.% vs. 5 wt.% 0.464 10.148 <0.001 Yes
30 wt.% vs. 10 wt.% 0.330 7.217 <0.001 Yes
30 wt.% vs. 20 wt.% 0.0680 1.487 0.851 No
20 wt.% vs. 5 wt.% 0.396 8.661 <0.001 Yes
20 wt.% vs. 10 wt.% 0.262 5.730 <0.001 Yes
10 wt.% vs. 5 wt.% 0.134 2.931 0.028 No
A result of "Do Not Test" occurs for a comparison when no significant difference is found
between two means that enclose that comparison. For example, if you had four means sorted in
order, and found no difference between means 4 vs. 2, then you would not test 4 vs. 3 and 3 vs.
2, but still test 4 vs. 1 and 3 vs. 1 (4 vs. 3 and 3 vs. 2 are enclosed by 4 vs. 2: 4 3 2 1). Note that

157
not testing the enclosed means is a procedural rule, and a result of Do Not Test should be treated
as if there is no significant difference between the means, even though one may appear to exist.
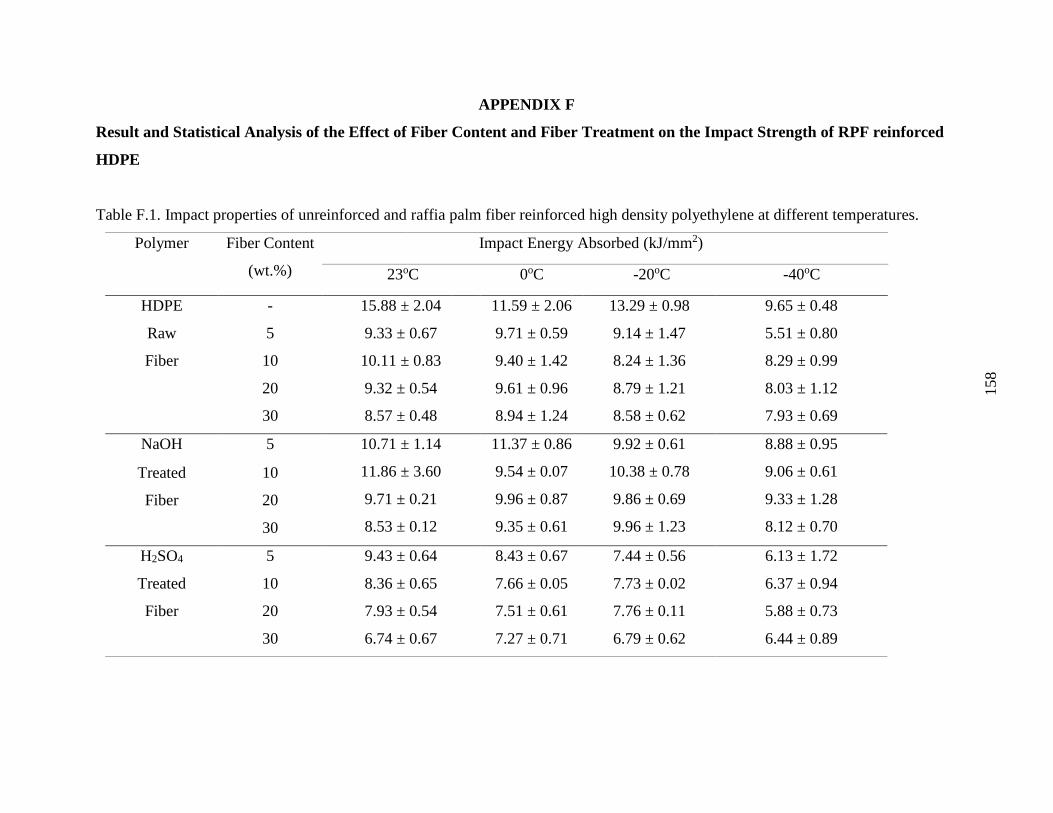
158
APPENDIX F
Result and Statistical Analysis of the Effect of Fiber Content and Fiber Treatment on the Impact Strength of RPF reinforced
HDPE
Table F.1. Impact properties of unreinforced and raffia palm fiber reinforced high density polyethylene at different temperatures.
Polymer Fiber Content
(wt.%)
Impact Energy Absorbed (kJ/mm2)
23oC 0oC -20oC -40oC
HDPE - 15.88 ± 2.04
9.33 ± 0.67
10.11 ± 0.83
9.32 ± 0.54
8.57 ± 0.48
11.59 ± 2.06
9.71 ± 0.59
9.40 ± 1.42
9.61 ± 0.96
8.94 ± 1.24
13.29 ± 0.98
9.14 ± 1.47
8.24 ± 1.36
8.79 ± 1.21
8.58 ± 0.62
9.65 ± 0.48
5.51 ± 0.80
8.29 ± 0.99
8.03 ± 1.12
7.93 ± 0.69
Raw 5
Fiber 10
20
30
NaOH 5 10.71 ± 1.14
11.86 ± 3.60
9.71 ± 0.21
8.53 ± 0.12
11.37 ± 0.86
9.54 ± 0.07
9.96 ± 0.87
9.35 ± 0.61
9.92 ± 0.61
10.38 ± 0.78
9.86 ± 0.69
9.96 ± 1.23
8.88 ± 0.95
9.06 ± 0.61
9.33 ± 1.28
8.12 ± 0.70
Treated 10
Fiber 20
30
H2SO4 5 9.43 ± 0.64
8.36 ± 0.65
7.93 ± 0.54
6.74 ± 0.67
8.43 ± 0.67
7.66 ± 0.05
7.51 ± 0.61
7.27 ± 0.71
7.44 ± 0.56
7.73 ± 0.02
7.76 ± 0.11
6.79 ± 0.62
6.13 ± 1.72
6.37 ± 0.94
5.88 ± 0.73
6.44 ± 0.89
Treated 10
Fiber 20
30
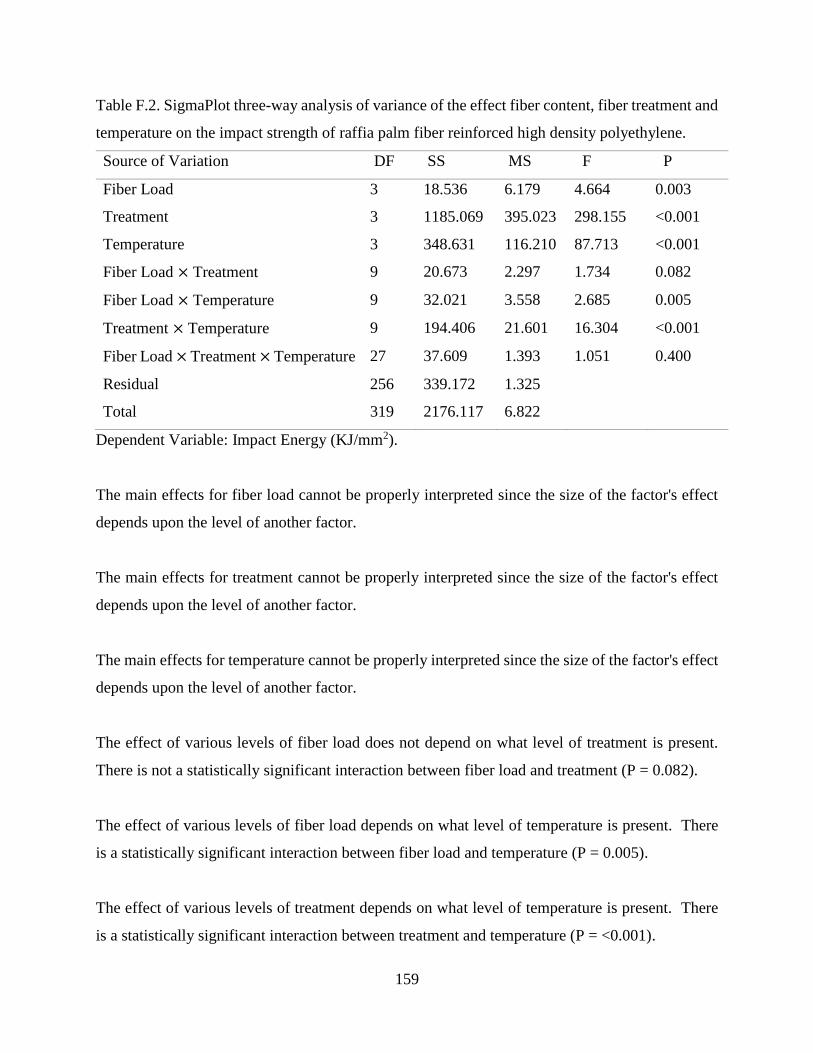
159
Table F.2. SigmaPlot three-way analysis of variance of the effect fiber content, fiber treatment and
temperature on the impact strength of raffia palm fiber reinforced high density polyethylene.
Source of Variation DF SS MS F P
Fiber Load 3 18.536 6.179 4.664 0.003
Treatment 3 1185.069 395.023 298.155 <0.001
Temperature 3 348.631 116.210 87.713 <0.001
Fiber Load × Treatment 9 20.673 2.297 1.734 0.082
Fiber Load × Temperature 9 32.021 3.558 2.685 0.005
Treatment × Temperature 9 194.406 21.601 16.304 <0.001
Fiber Load × Treatment × Temperature 27 37.609 1.393 1.051 0.400
Residual 256 339.172 1.325
Total 319 2176.117 6.822
Dependent Variable: Impact Energy (KJ/mm2).
The main effects for fiber load cannot be properly interpreted since the size of the factor's effect
depends upon the level of another factor.
The main effects for treatment cannot be properly interpreted since the size of the factor's effect
depends upon the level of another factor.
The main effects for temperature cannot be properly interpreted since the size of the factor's effect
depends upon the level of another factor.
The effect of various levels of fiber load does not depend on what level of treatment is present.
There is not a statistically significant interaction between fiber load and treatment (P = 0.082).
The effect of various levels of fiber load depends on what level of temperature is present. There
is a statistically significant interaction between fiber load and temperature (P = 0.005).
The effect of various levels of treatment depends on what level of temperature is present. There
is a statistically significant interaction between treatment and temperature (P = <0.001).
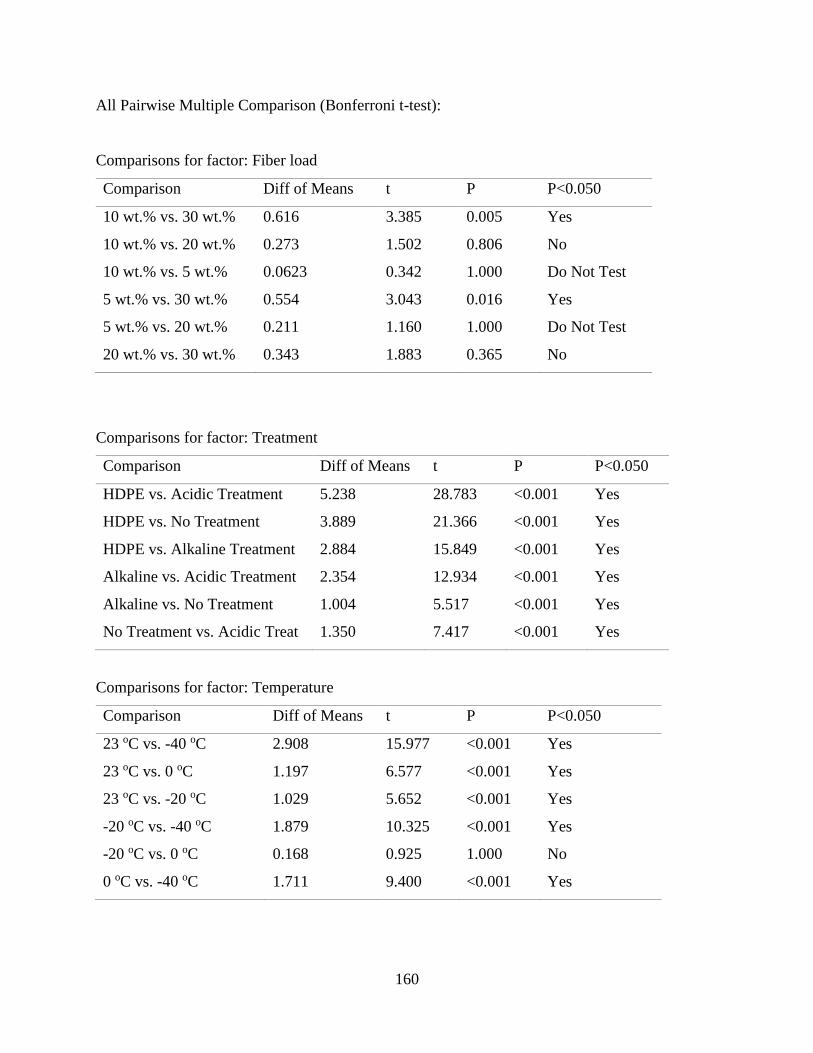
160
All Pairwise Multiple Comparison (Bonferroni t-test):
Comparisons for factor: Fiber load
Comparison Diff of Means t P P<0.050
10 wt.% vs. 30 wt.% 0.616 3.385 0.005 Yes
10 wt.% vs. 20 wt.% 0.273 1.502 0.806 No
10 wt.% vs. 5 wt.% 0.0623 0.342 1.000 Do Not Test
5 wt.% vs. 30 wt.% 0.554 3.043 0.016 Yes
5 wt.% vs. 20 wt.% 0.211 1.160 1.000 Do Not Test
20 wt.% vs. 30 wt.% 0.343 1.883 0.365 No
Comparisons for factor: Treatment
Comparison Diff of Means t P P<0.050
HDPE vs. Acidic Treatment 5.238 28.783 <0.001 Yes
HDPE vs. No Treatment 3.889 21.366 <0.001 Yes
HDPE vs. Alkaline Treatment 2.884 15.849 <0.001 Yes
Alkaline vs. Acidic Treatment 2.354 12.934 <0.001 Yes
Alkaline vs. No Treatment 1.004 5.517 <0.001 Yes
No Treatment vs. Acidic Treat 1.350 7.417 <0.001 Yes
Comparisons for factor: Temperature
Comparison Diff of Means t P P<0.050
23 oC vs. -40 oC 2.908 15.977 <0.001 Yes
23 oC vs. 0 oC 1.197 6.577 <0.001 Yes
23 oC vs. -20 oC 1.029 5.652 <0.001 Yes
-20 oC vs. -40 oC 1.879 10.325 <0.001 Yes
-20 oC vs. 0 oC 0.168 0.925 1.000 No
0 oC vs. -40 oC 1.711 9.400 <0.001 Yes
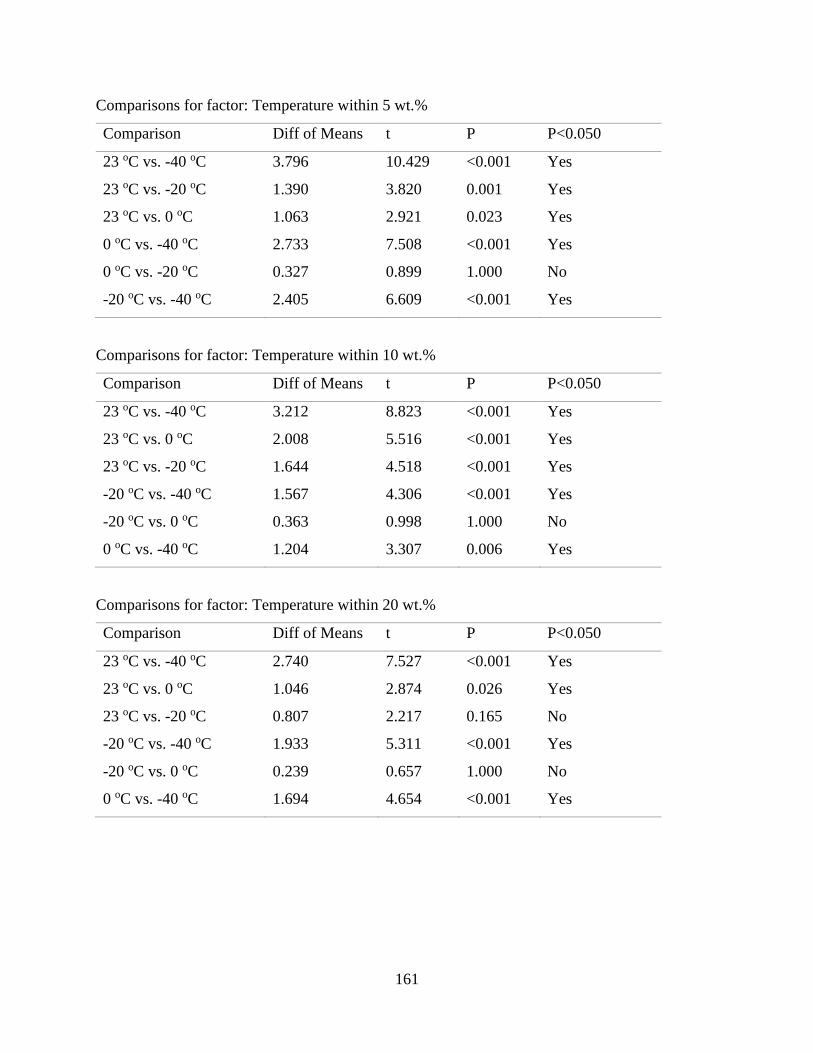
161
Comparisons for factor: Temperature within 5 wt.%
Comparison Diff of Means t P P<0.050
23 oC vs. -40 oC 3.796 10.429 <0.001 Yes
23 oC vs. -20 oC 1.390 3.820 0.001 Yes
23 oC vs. 0 oC 1.063 2.921 0.023 Yes
0 oC vs. -40 oC 2.733 7.508 <0.001 Yes
0 oC vs. -20 oC 0.327 0.899 1.000 No
-20 oC vs. -40 oC 2.405 6.609 <0.001 Yes
Comparisons for factor: Temperature within 10 wt.%
Comparison Diff of Means t P P<0.050
23 oC vs. -40 oC 3.212 8.823 <0.001 Yes
23 oC vs. 0 oC 2.008 5.516 <0.001 Yes
23 oC vs. -20 oC 1.644 4.518 <0.001 Yes
-20 oC vs. -40 oC 1.567 4.306 <0.001 Yes
-20 oC vs. 0 oC 0.363 0.998 1.000 No
0 oC vs. -40 oC 1.204 3.307 0.006 Yes
Comparisons for factor: Temperature within 20 wt.%
Comparison Diff of Means t P P<0.050
23 oC vs. -40 oC 2.740 7.527 <0.001 Yes
23 oC vs. 0 oC 1.046 2.874 0.026 Yes
23 oC vs. -20 oC 0.807 2.217 0.165 No
-20 oC vs. -40 oC 1.933 5.311 <0.001 Yes
-20 oC vs. 0 oC 0.239 0.657 1.000 No
0 oC vs. -40 oC 1.694 4.654 <0.001 Yes
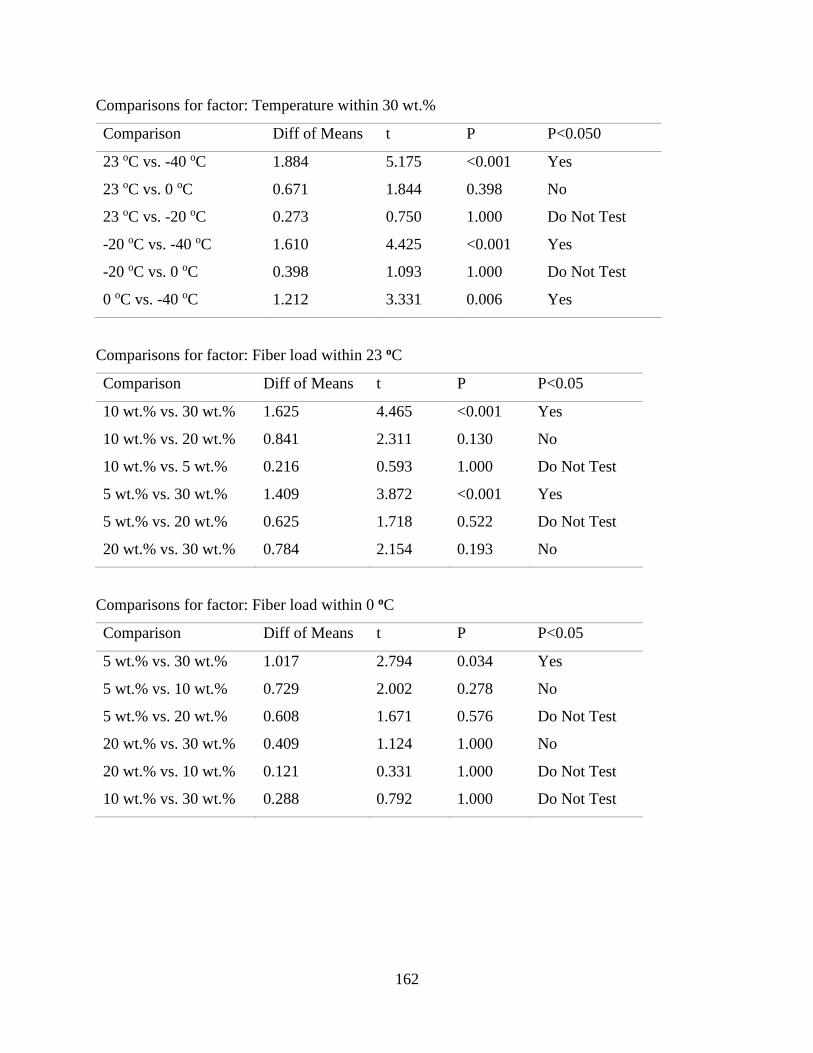
162
Comparisons for factor: Temperature within 30 wt.%
Comparison Diff of Means t P P<0.050
23 oC vs. -40 oC 1.884 5.175 <0.001 Yes
23 oC vs. 0 oC 0.671 1.844 0.398 No
23 oC vs. -20 oC 0.273 0.750 1.000 Do Not Test
-20 oC vs. -40 oC 1.610 4.425 <0.001 Yes
-20 oC vs. 0 oC 0.398 1.093 1.000 Do Not Test
0 oC vs. -40 oC 1.212 3.331 0.006 Yes
Comparisons for factor: Fiber load within 23 oC
Comparison Diff of Means t P P<0.05
10 wt.% vs. 30 wt.% 1.625 4.465 <0.001 Yes
10 wt.% vs. 20 wt.% 0.841 2.311 0.130 No
10 wt.% vs. 5 wt.% 0.216 0.593 1.000 Do Not Test
5 wt.% vs. 30 wt.% 1.409 3.872 <0.001 Yes
5 wt.% vs. 20 wt.% 0.625 1.718 0.522 Do Not Test
20 wt.% vs. 30 wt.% 0.784 2.154 0.193 No
Comparisons for factor: Fiber load within 0 oC
Comparison Diff of Means t P P<0.05
5 wt.% vs. 30 wt.% 1.017 2.794 0.034 Yes
5 wt.% vs. 10 wt.% 0.729 2.002 0.278 No
5 wt.% vs. 20 wt.% 0.608 1.671 0.576 Do Not Test
20 wt.% vs. 30 wt.% 0.409 1.124 1.000 No
20 wt.% vs. 10 wt.% 0.121 0.331 1.000 Do Not Test
10 wt.% vs. 30 wt.% 0.288 0.792 1.000 Do Not Test
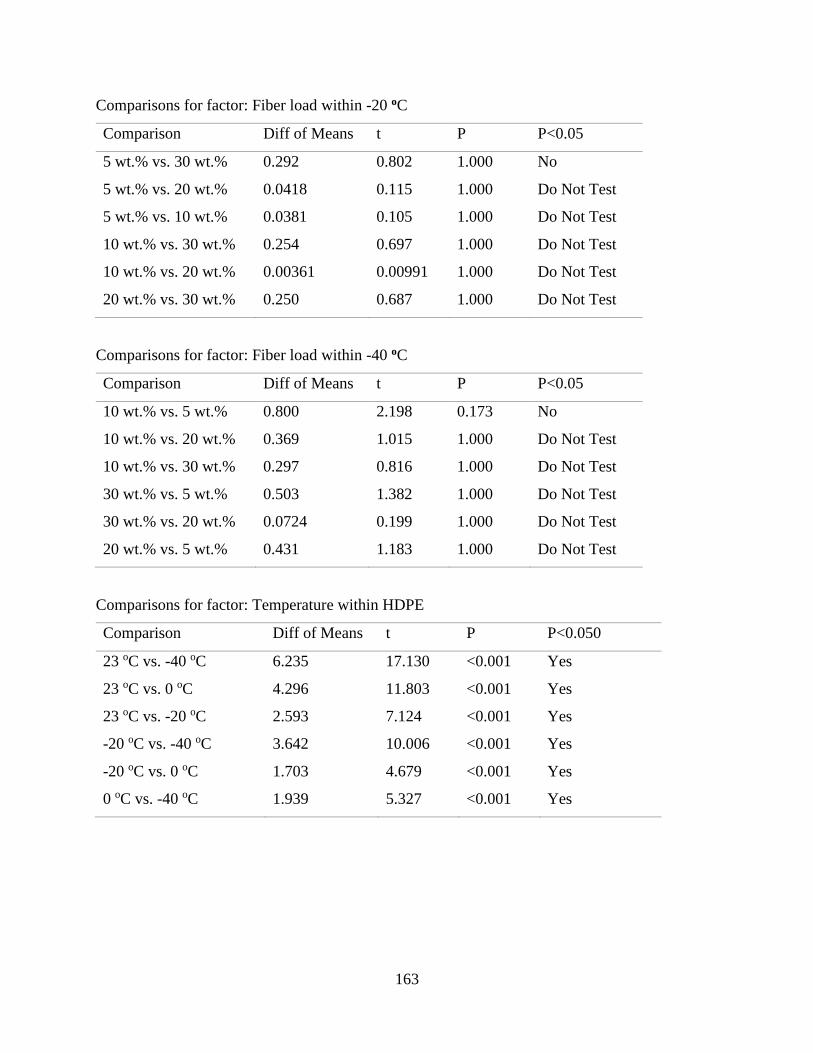
163
Comparisons for factor: Fiber load within -20 oC
Comparison Diff of Means t P P<0.05
5 wt.% vs. 30 wt.% 0.292 0.802 1.000 No
5 wt.% vs. 20 wt.% 0.0418 0.115 1.000 Do Not Test
5 wt.% vs. 10 wt.% 0.0381 0.105 1.000 Do Not Test
10 wt.% vs. 30 wt.% 0.254 0.697 1.000 Do Not Test
10 wt.% vs. 20 wt.% 0.00361 0.00991 1.000 Do Not Test
20 wt.% vs. 30 wt.% 0.250 0.687 1.000 Do Not Test
Comparisons for factor: Fiber load within -40 oC
Comparison Diff of Means t P P<0.05
10 wt.% vs. 5 wt.% 0.800 2.198 0.173 No
10 wt.% vs. 20 wt.% 0.369 1.015 1.000 Do Not Test
10 wt.% vs. 30 wt.% 0.297 0.816 1.000 Do Not Test
30 wt.% vs. 5 wt.% 0.503 1.382 1.000 Do Not Test
30 wt.% vs. 20 wt.% 0.0724 0.199 1.000 Do Not Test
20 wt.% vs. 5 wt.% 0.431 1.183 1.000 Do Not Test
Comparisons for factor: Temperature within HDPE
Comparison Diff of Means t P P<0.050
23 oC vs. -40 oC 6.235 17.130 <0.001 Yes
23 oC vs. 0 oC 4.296 11.803 <0.001 Yes
23 oC vs. -20 oC 2.593 7.124 <0.001 Yes
-20 oC vs. -40 oC 3.642 10.006 <0.001 Yes
-20 oC vs. 0 oC 1.703 4.679 <0.001 Yes
0 oC vs. -40 oC 1.939 5.327 <0.001 Yes
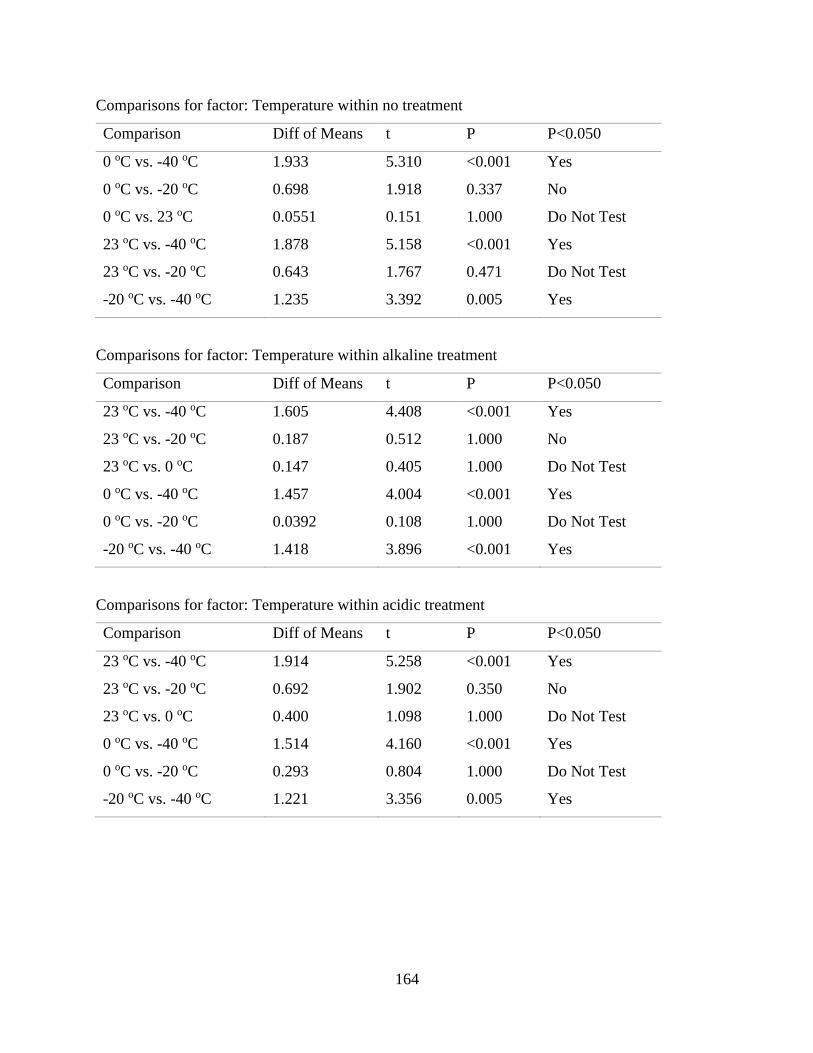
164
Comparisons for factor: Temperature within no treatment
Comparison Diff of Means t P P<0.050
0 oC vs. -40 oC 1.933 5.310 <0.001 Yes
0 oC vs. -20 oC 0.698 1.918 0.337 No
0 oC vs. 23 oC 0.0551 0.151 1.000 Do Not Test
23 oC vs. -40 oC 1.878 5.158 <0.001 Yes
23 oC vs. -20 oC 0.643 1.767 0.471 Do Not Test
-20 oC vs. -40 oC 1.235 3.392 0.005 Yes
Comparisons for factor: Temperature within alkaline treatment
Comparison Diff of Means t P P<0.050
23 oC vs. -40 oC 1.605 4.408 <0.001 Yes
23 oC vs. -20 oC 0.187 0.512 1.000 No
23 oC vs. 0 oC 0.147 0.405 1.000 Do Not Test
0 oC vs. -40 oC 1.457 4.004 <0.001 Yes
0 oC vs. -20 oC 0.0392 0.108 1.000 Do Not Test
-20 oC vs. -40 oC 1.418 3.896 <0.001 Yes
Comparisons for factor: Temperature within acidic treatment
Comparison Diff of Means t P P<0.050
23 oC vs. -40 oC 1.914 5.258 <0.001 Yes
23 oC vs. -20 oC 0.692 1.902 0.350 No
23 oC vs. 0 oC 0.400 1.098 1.000 Do Not Test
0 oC vs. -40 oC 1.514 4.160 <0.001 Yes
0 oC vs. -20 oC 0.293 0.804 1.000 Do Not Test
-20 oC vs. -40 oC 1.221 3.356 0.005 Yes
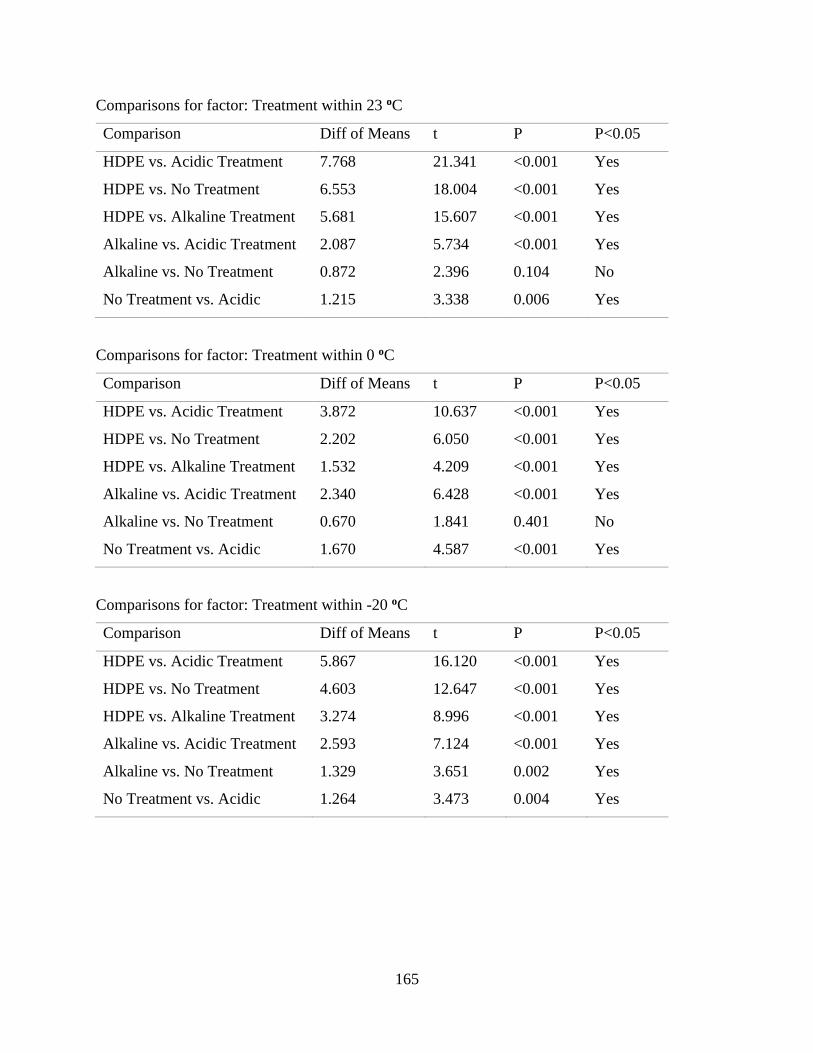
165
Comparisons for factor: Treatment within 23 oC
Comparison Diff of Means t P P<0.05
HDPE vs. Acidic Treatment 7.768 21.341 <0.001 Yes
HDPE vs. No Treatment 6.553 18.004 <0.001 Yes
HDPE vs. Alkaline Treatment 5.681 15.607 <0.001 Yes
Alkaline vs. Acidic Treatment 2.087 5.734 <0.001 Yes
Alkaline vs. No Treatment 0.872 2.396 0.104 No
No Treatment vs. Acidic 1.215 3.338 0.006 Yes
Comparisons for factor: Treatment within 0 oC
Comparison Diff of Means t P P<0.05
HDPE vs. Acidic Treatment 3.872 10.637 <0.001 Yes
HDPE vs. No Treatment 2.202 6.050 <0.001 Yes
HDPE vs. Alkaline Treatment 1.532 4.209 <0.001 Yes
Alkaline vs. Acidic Treatment 2.340 6.428 <0.001 Yes
Alkaline vs. No Treatment 0.670 1.841 0.401 No
No Treatment vs. Acidic 1.670 4.587 <0.001 Yes
Comparisons for factor: Treatment within -20 oC
Comparison Diff of Means t P P<0.05
HDPE vs. Acidic Treatment 5.867 16.120 <0.001 Yes
HDPE vs. No Treatment 4.603 12.647 <0.001 Yes
HDPE vs. Alkaline Treatment 3.274 8.996 <0.001 Yes
Alkaline vs. Acidic Treatment 2.593 7.124 <0.001 Yes
Alkaline vs. No Treatment 1.329 3.651 0.002 Yes
No Treatment vs. Acidic 1.264 3.473 0.004 Yes
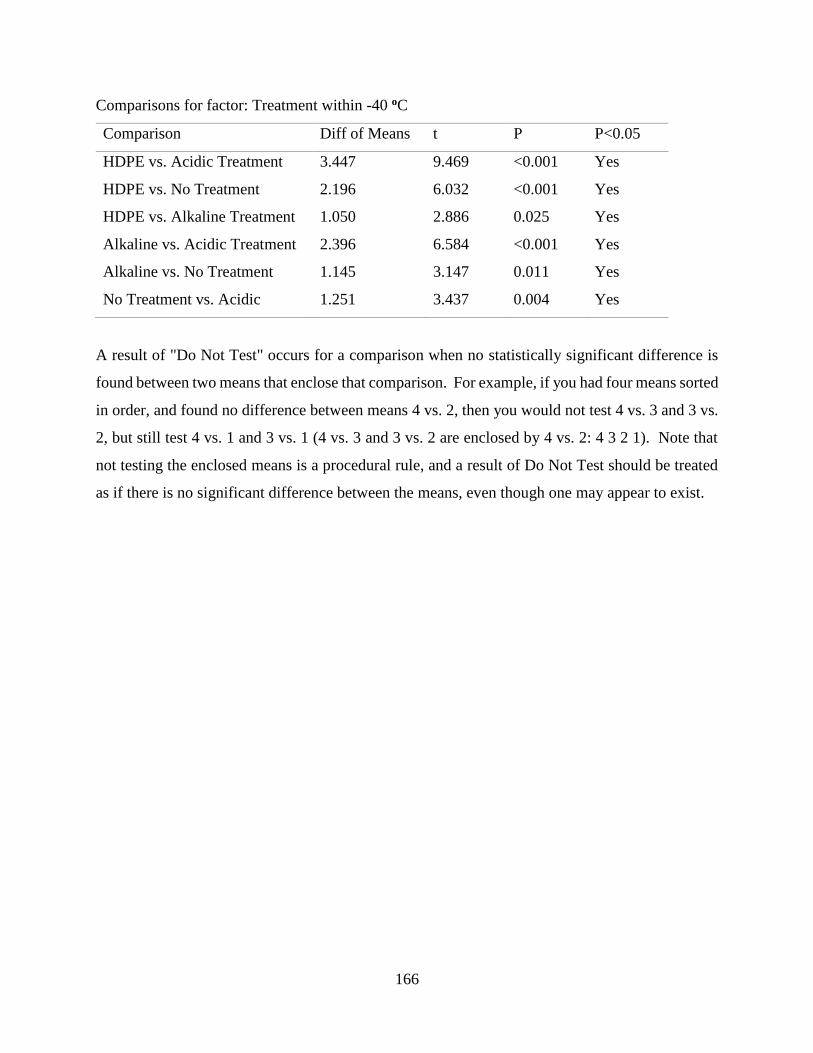
166
Comparisons for factor: Treatment within -40 oC
Comparison Diff of Means t P P<0.05
HDPE vs. Acidic Treatment 3.447 9.469 <0.001 Yes
HDPE vs. No Treatment 2.196 6.032 <0.001 Yes
HDPE vs. Alkaline Treatment 1.050 2.886 0.025 Yes
Alkaline vs. Acidic Treatment 2.396 6.584 <0.001 Yes
Alkaline vs. No Treatment 1.145 3.147 0.011 Yes
No Treatment vs. Acidic 1.251 3.437 0.004 Yes
A result of "Do Not Test" occurs for a comparison when no statistically significant difference is
found between two means that enclose that comparison. For example, if you had four means sorted
in order, and found no difference between means 4 vs. 2, then you would not test 4 vs. 3 and 3 vs.
2, but still test 4 vs. 1 and 3 vs. 1 (4 vs. 3 and 3 vs. 2 are enclosed by 4 vs. 2: 4 3 2 1). Note that
not testing the enclosed means is a procedural rule, and a result of Do Not Test should be treated
as if there is no significant difference between the means, even though one may appear to exist.
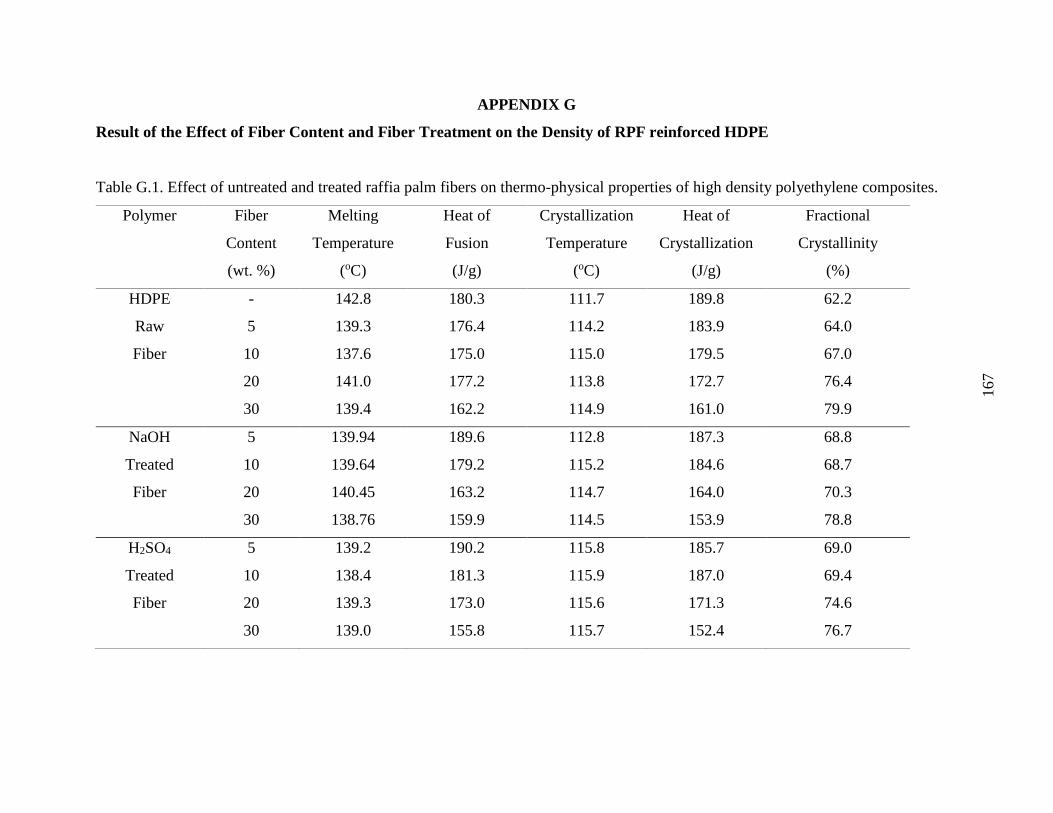
167
APPENDIX G
Result of the Effect of Fiber Content and Fiber Treatment on the Density of RPF reinforced HDPE
Table G.1. Effect of untreated and treated raffia palm fibers on thermo-physical properties of high density polyethylene composites.
Polymer Fiber
Content
(wt. %)
Melting
Temperature
(oC)
Heat of
Fusion
(J/g)
Crystallization
Temperature
(oC)
Heat of
Crystallization
(J/g)
Fractional
Crystallinity
(%)
HDPE - 142.8 180.3 111.7 189.8 62.2
Raw 5 139.3 176.4 114.2 183.9 64.0
Fiber 10 137.6 175.0 115.0 179.5 67.0
20 141.0 177.2 113.8 172.7 76.4
30 139.4 162.2 114.9 161.0 79.9
NaOH 5 139.94 189.6 112.8 187.3 68.8
Treated 10 139.64 179.2 115.2 184.6 68.7
Fiber 20 140.45 163.2 114.7 164.0 70.3
30 138.76 159.9 114.5 153.9 78.8
H2SO4 5 139.2 190.2 115.8 185.7 69.0
Treated 10 138.4 181.3 115.9 187.0 69.4
Fiber 20 139.3 173.0 115.6 171.3 74.6
30 139.0 155.8 115.7 152.4 76.7
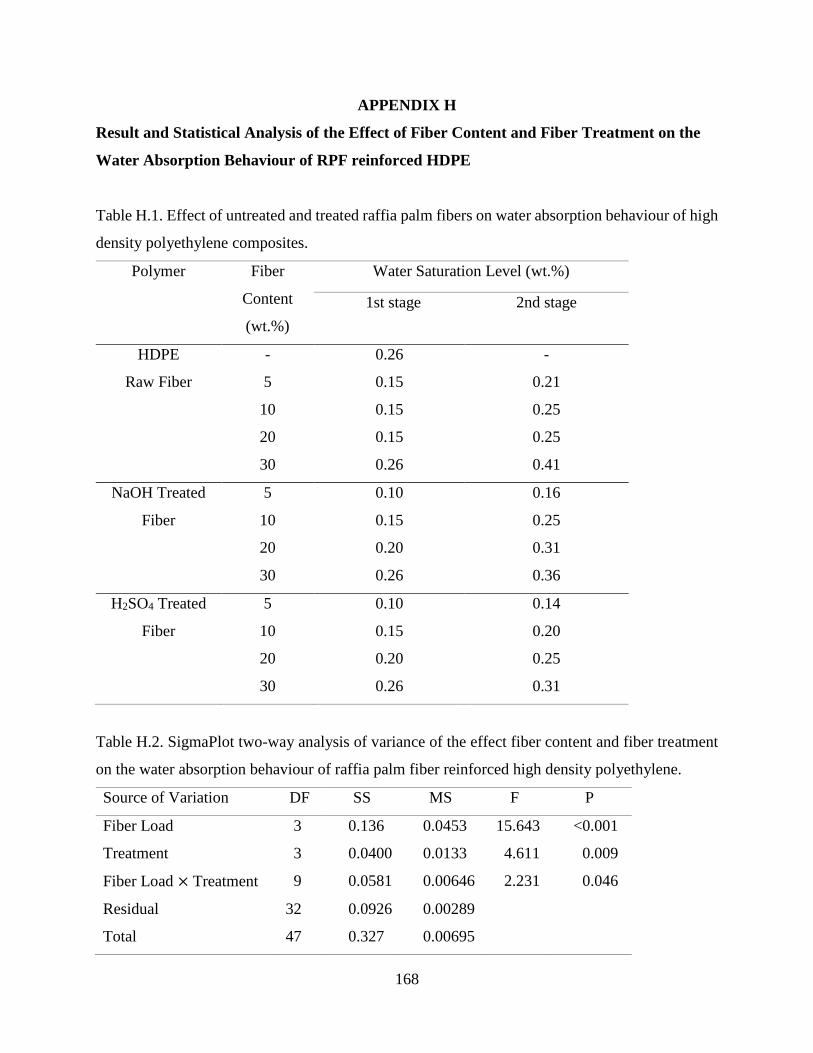
168
APPENDIX H
Result and Statistical Analysis of the Effect of Fiber Content and Fiber Treatment on the
Water Absorption Behaviour of RPF reinforced HDPE
Table H.1. Effect of untreated and treated raffia palm fibers on water absorption behaviour of high
density polyethylene composites.
Polymer Fiber
Content
(wt.%)
Water Saturation Level (wt.%)
1st stage 2nd stage
HDPE - 0.26 -
0.21
0.25
0.25
0.41
Raw Fiber 5 0.15
10 0.15
20 0.15
30 0.26
NaOH Treated 5 0.10 0.16
Fiber 10 0.15 0.25
20 0.20 0.31
30 0.26 0.36
H2SO4 Treated 5 0.10 0.14
Fiber 10 0.15 0.20
20 0.20 0.25
30 0.26 0.31
Table H.2. SigmaPlot two-way analysis of variance of the effect fiber content and fiber treatment
on the water absorption behaviour of raffia palm fiber reinforced high density polyethylene.
Source of Variation DF SS MS F P
Fiber Load 3 0.136 0.0453 15.643 <0.001
Treatment 3 0.0400 0.0133 4.611 0.009
Fiber Load × Treatment 9 0.0581 0.00646 2.231 0.046
Residual 32 0.0926 0.00289
Total 47 0.327 0.00695
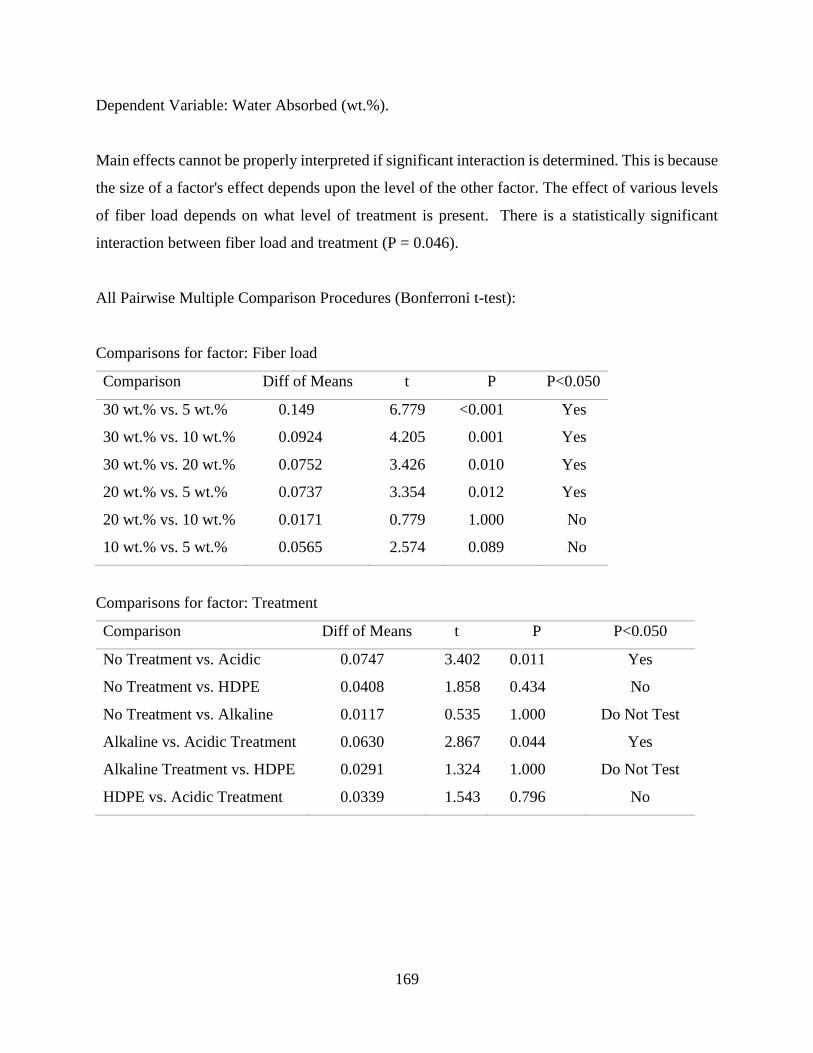
169
Dependent Variable: Water Absorbed (wt.%).
Main effects cannot be properly interpreted if significant interaction is determined. This is because
the size of a factor's effect depends upon the level of the other factor. The effect of various levels
of fiber load depends on what level of treatment is present. There is a statistically significant
interaction between fiber load and treatment (P = 0.046).
All Pairwise Multiple Comparison Procedures (Bonferroni t-test):
Comparisons for factor: Fiber load
Comparison Diff of Means t P P<0.050
30 wt.% vs. 5 wt.% 0.149 6.779 <0.001 Yes
30 wt.% vs. 10 wt.% 0.0924 4.205 0.001 Yes
30 wt.% vs. 20 wt.% 0.0752 3.426 0.010 Yes
20 wt.% vs. 5 wt.% 0.0737 3.354 0.012 Yes
20 wt.% vs. 10 wt.% 0.0171 0.779 1.000 No
10 wt.% vs. 5 wt.% 0.0565 2.574 0.089 No
Comparisons for factor: Treatment
Comparison Diff of Means t P P<0.050
No Treatment vs. Acidic 0.0747 3.402 0.011 Yes
No Treatment vs. HDPE 0.0408 1.858 0.434 No
No Treatment vs. Alkaline 0.0117 0.535 1.000 Do Not Test
Alkaline vs. Acidic Treatment 0.0630 2.867 0.044 Yes
Alkaline Treatment vs. HDPE 0.0291 1.324 1.000 Do Not Test
HDPE vs. Acidic Treatment 0.0339 1.543 0.796 No
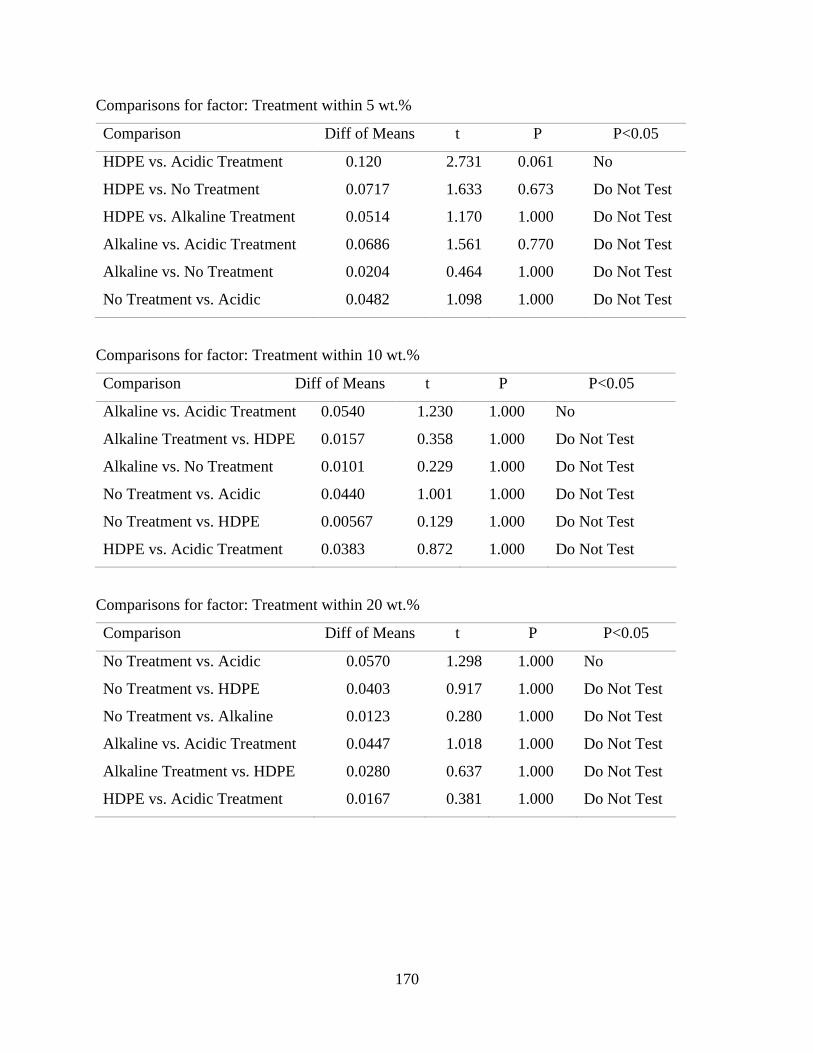
170
Comparisons for factor: Treatment within 5 wt.%
Comparison Diff of Means t P P<0.05
HDPE vs. Acidic Treatment 0.120 2.731 0.061 No
HDPE vs. No Treatment 0.0717 1.633 0.673 Do Not Test
HDPE vs. Alkaline Treatment 0.0514 1.170 1.000 Do Not Test
Alkaline vs. Acidic Treatment 0.0686 1.561 0.770 Do Not Test
Alkaline vs. No Treatment 0.0204 0.464 1.000 Do Not Test
No Treatment vs. Acidic 0.0482 1.098 1.000 Do Not Test
Comparisons for factor: Treatment within 10 wt.%
Comparison Diff of Means t P P<0.05
Alkaline vs. Acidic Treatment 0.0540 1.230 1.000 No
Alkaline Treatment vs. HDPE 0.0157 0.358 1.000 Do Not Test
Alkaline vs. No Treatment 0.0101 0.229 1.000 Do Not Test
No Treatment vs. Acidic 0.0440 1.001 1.000 Do Not Test
No Treatment vs. HDPE 0.00567 0.129 1.000 Do Not Test
HDPE vs. Acidic Treatment 0.0383 0.872 1.000 Do Not Test
Comparisons for factor: Treatment within 20 wt.%
Comparison Diff of Means t P P<0.05
No Treatment vs. Acidic 0.0570 1.298 1.000 No
No Treatment vs. HDPE 0.0403 0.917 1.000 Do Not Test
No Treatment vs. Alkaline 0.0123 0.280 1.000 Do Not Test
Alkaline vs. Acidic Treatment 0.0447 1.018 1.000 Do Not Test
Alkaline Treatment vs. HDPE 0.0280 0.637 1.000 Do Not Test
HDPE vs. Acidic Treatment 0.0167 0.381 1.000 Do Not Test

171
Comparisons for factor: Treatment within 30 wt.%
Comparison Diff of Means t P P<0.05
No Treatment vs. HDPE 0.189 4.304 <0.001 Yes
No Treatment vs. Acidic 0.150 3.406 0.011 Yes
No Treatment vs. Alkaline 0.0651 1.481 0.890 No
Alkaline Treatment vs. HDPE 0.124 2.823 0.049 Yes
Alkaline vs. Acidic Treatment 0.0846 1.925 0.379 No
Acidic Treatment vs. HDPE 0.0394 0.898 1.000 No
Comparisons for factor: Fiber load within no treatment
Comparison Diff of Means t P P<0.05
30 wt.% vs. 5 wt.% 0.261 5.937 <0.001 Yes
30 wt.% vs. 10 wt.% 0.183 4.175 0.001 Yes
30 wt.% vs. 20 wt.% 0.149 3.387 0.011 Yes
20 wt.% vs. 5 wt.% 0.112 2.551 0.094 No
20 wt.% vs. 10 wt.% 0.0346 0.788 1.000 Do Not Test
10 wt.% vs. 5 wt.% 0.0774 1.762 0.525 Do Not Test
Comparisons for factor: Fiber load within alkaline treatment
Comparison Diff of Means t P P<0.05
30 wt.% vs. 5 wt.% 0.175 3.993 0.002 Yes
30 wt.% vs. 10 wt.% 0.108 2.465 0.116 No
30 wt.% vs. 20 wt.% 0.0960 2.186 0.217 Do Not Test
20 wt.% vs. 5 wt.% 0.0794 1.807 0.481 No
20 wt.% vs. 10 wt.% 0.0123 0.279 1.000 Do Not Test
10 wt.% vs. 5 wt.% 0.0671 1.528 0.818 Do Not Test
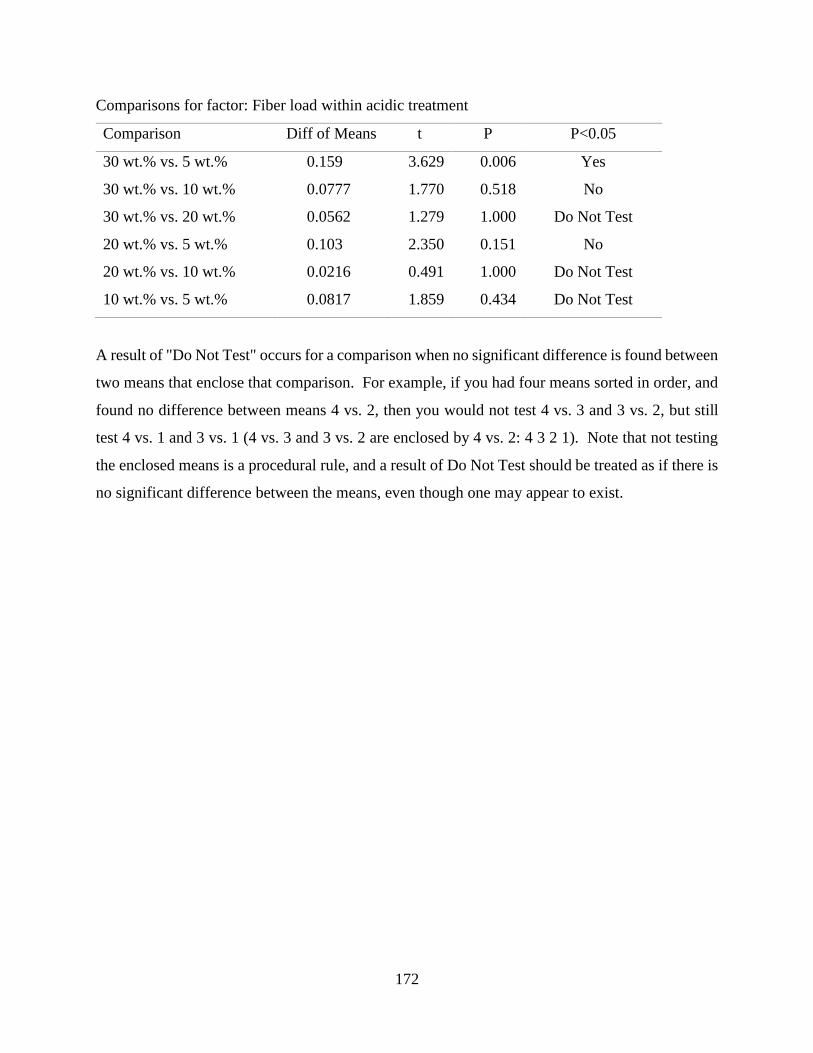
172
Comparisons for factor: Fiber load within acidic treatment
Comparison Diff of Means t P P<0.05
30 wt.% vs. 5 wt.% 0.159 3.629 0.006 Yes
30 wt.% vs. 10 wt.% 0.0777 1.770 0.518 No
30 wt.% vs. 20 wt.% 0.0562 1.279 1.000 Do Not Test
20 wt.% vs. 5 wt.% 0.103 2.350 0.151 No
20 wt.% vs. 10 wt.% 0.0216 0.491 1.000 Do Not Test
10 wt.% vs. 5 wt.% 0.0817 1.859 0.434 Do Not Test
A result of "Do Not Test" occurs for a comparison when no significant difference is found between
two means that enclose that comparison. For example, if you had four means sorted in order, and
found no difference between means 4 vs. 2, then you would not test 4 vs. 3 and 3 vs. 2, but still
test 4 vs. 1 and 3 vs. 1 (4 vs. 3 and 3 vs. 2 are enclosed by 4 vs. 2: 4 3 2 1). Note that not testing
the enclosed means is a procedural rule, and a result of Do Not Test should be treated as if there is
no significant difference between the means, even though one may appear to exist.