Embed Size (px)
Citation preview
Development and Application of New Modified Poly(styrene-divinylbenzene) Adsorbents and Chromatography
Stationary Phases
Volume 1 PS-DVB Heptadecyl Ketone, Chloromethyl PS-DVB, and
Octadecoxy Methyl PS-DVB
PROF. DR. MOHD MARSIN SANAGI ASSOC. PROF. DR AHMEDY ABU NAIM
ASSOC. PROF. DR ASIAH HUSSAIN SRI HILMA SIREGAR MOHD SANI SARJADI
NORSYARIZA ABD AZIZ
End of Project Report IRPA Project Number 09-02-06-0074-EA211
Vote number 74091
FACULTY OF SCIENCE
UNIVERSITI TEKNOLOGI MALAYSIA
NOVEMBER 2006
ii
Development and Application of New Modified
Poly(styrene-divinylbenzene) Adsorbents and Chromatography Stationary Phases
Volume 1:
PS-DVB Heptadecyl Ketone, Chloromethyl PS-DVB, and Octadecoxy Methyl PS-DVB
PROF. DR. MOHD MARSIN SANAGI (PROJECT LEADER)
ASSOC. PROF. DR AHMEDY ABU NAIM (RESEARCHER) ASSOC. PROF. DR ASIAH HUSSAIN (RESEARCHER)
SRI HILMA SIREGAR (RESEARCH STUDENT) MOHD SANI SARJADI (RESEARCH STUDENT)
NORSYARIZA ABD AZIZ (RESEARCH ASSISTANT)
End of Project Report IRPA Project Number 09-02-06-0074-EA211
Vote number 74091
FACULTY OF SCIENCE
UNIVERSITI TEKNOLOGI MALAYSIA
NOVEMBER 2006
iii
UTM/RMC/F/0024 (1998)
UNIVERSITI TEKNOLOGI MALAYSIA
BORANG PENGESAHAN LAPORAN AKHIR PENYELIDIKAN
TAJUK PROJEK: DEVELOPMENT AND APPLICATION OF NEW MODIFIED
POLY(STYRENE-DIVINYLBENZENE) ADSORBENTS AND CHROMATOGRAPHY STATIONARY PHASES. VOLUME 1: PS-DVB HEPTADECYL KETONE, CHLOROMETHYL PS-DVB, AND OCTADECOXY METHYL PS-DVB
Saya MOHD MARSIN BIN SANAGI
(HURUF BESAR) mengaku membenarkan Laporan Akhir Penyelidikan ini disimpan di Perpustakaan Universiti Teknologi Malaysia dengan syarat-syarat kegunaan seperti berikut :
1. Laporan Akhir Penyelidikan ini adalah hak milik Universiti Teknologi Malaysia.
2. Perpustakaan Universiti Teknologi Malaysia dibenarkan membuat salinan untuk tujuan rujukan sahaja.
3. Perpustakaan dibenarkan membuat penjualan salinan Laporan Akhir Penyelidikan ini bagi kategori TIDAK TERHAD.
4. *Sila tandakan ( )
(Mengandungi maklumat yang berdarjah keselamatan atau kepentingan Malaysia seperti yang termaktub di dalam AKTA RAHSIA RASMI 1972) (Mengandungi maklumat TERHAD yang telah ditentukan oleh organisasi/badan di mana penyelidikan dijalankan)
(TANDATANGAN KETUA PENYELIDIK) Nama & Cop Ketua Penyelidik
Tarikh: _______________________
SULIT TERHAD TIDAK TERHAD
CATATAN: * Jika Laporan Akhir Penyelidikan ini SULIT atau TERHAD, sila lampirkan surat daripada pihak berkuasa/organisasi berkenaan dengan menyatakan sekali sebab dan tempoh Laporan Akhir Penyelidikan ini perlu dikelaskan sebagai SULIT atau TERHAD.
30 November 2006
iv
ACKNOWLEDGEMENTS
We would like to thank to the Research Management Centre, Universiti Teknologi
Malaysia (UTM), and the Ministry of Science, Technology, and Innovation (MOSTI) for
endowment of the research grant Project number 09-02-06-0074-EA211 (Vote number
74091).
We also would like to thank all technical and supporting staff members of the
Department of Chemistry namely, Faculty of Science, especially En Ayob Jabal, Pn Mek
Zum, En. Kadir, En. Hairol, En. Hamzah, En. Azmi, and Puan Maryam who have have
rendered excellent research services. Also thanks to students who have helped us in this
research, especially See Hong Heng, Norashikin, Fairol Zukry, Tham Ee Mun and Yong
Bee Chee.
v
ABSTRACT Poly(styrene-divinyl benzene) (PS-DVB) resin is an attractive adsorbent for extraction and separation of various types of compounds due to its stability over the pH range of 1-14. However, PS-DVB resin is known to have hydrophobic surfaces that highly retain non-polar compounds while poorly retain polar compounds. To improve its use in the separation or extraction of polar compounds, PS-DVB resin must be chemically or physically bonded to hydrophilic groups to reduce its hydrophobic surface. The objectives of this project were to modify PS-DVB phases by introducing moieties that can increase the dispersive forces and lower the hydrophobicity of the PS-DVB phases and to examine the characteristics and applications of the modified PS-DVB adsorbents. The PS-DVB adsorbents were prepared by suspension polymerization method with polyvinyl alcohol as the suspension stabilizer at a stirring speed of 1000 rpm for 20 h. In the first approach (Volume 1), the synthesized PS-DVB adsorbents were subjected to modifications that consisted of (i) Friedel-Crafts acylation reaction using stearoyl chloride as an acylation agent to produce PS-DVB heptadecyl ketone, (ii) Chloromethylation reaction to produce chloromethyl PS-DVB in the presence of chloromethyl styrene, and (iii) Williamson ether reaction using sodium metal and octadecanol as reaction agents to produce octadecoxy methyl PS-DVB. The synthesized adsorbents were characterized by FTIR spectroscopy, SEM, nitrogen adsorption analysis and thermogravimetric analysis. Solid phase extraction (SPE) studies of test compounds, namely nitrobenzene, 2-chlorophenol, benzaldehyde, butyrophenone, and p-cresol were carried out using SPE tubes packed with the synthesized adsorbents. The recoveries obtained for the home-made PS-DVB were in the range of 7% to 72% with relative standard deviations of 1% to 10%. Increased percentages of recovery (35%-83%) with the relative standard deviations of 2%-7% were obtained using PS-DVB heptadecyl ketone. Highest recovery percentages (67%-100%) were obtained using commercial C18-silica adsorbent. Highest breakthrough volume was achieved for PS-DVB heptadecyl ketone adsorbent, i.e. 30.60 mL of 20 ppm nitrobenzene and 20.47 mL of 20 ppm 2-chlorophenol. Lowest breakthrough volume was obtained for octadecoxy methyl PS-DVB adsorbent (1.03 mL of 20 ppm nitrobenzene and 1.00 mL of 20 ppm 2-chlorophenol). PS-DVB heptadecyl ketone has been proven suitable to be used as SPE adsorbent in the future.
vi
ABSTRAK
Resin poli(stirena-divinil benzena) (PS-DVB) merupakan penjerap yang menarik untuk pengekstrakan dan pemisahan pelbagai jenis sebatian disebabkan kestabilannya pada julat pH 1-14. Walau bagaimanapun, resin PS-DVB diketahui mempunyai permukaan yang hidrofobik yang sangat menahan sebatian tak berkutub manakala tidak menahan sebatian berkutub. Untuk memperbaiki penggunaan bahannya dalam pemisahan atau pengekstrakan sebatian berkutub, resin PS-DVB mesti diikat secara kimia atau fizik kepada kumpulan hidrofilik untuk mengurangkan kehidrofobikan permukaannya. Objektif projek ini ialah untuk mengubahsuai fasa PS-DVB dengan memasukkan moieti yang boleh meningkatkan daya serakan dan mengurangkan kehidrofobikan fasa tersebut dan untuk menkaji ciri-ciri dan penggunaan PS-DVB terubahsuai itu. Penjerap PS-DVB telah disediakan dengan kaedah pembolimeran ampaian dengan alkohol polyvinil sebagai penstabil ampaian pada kelajuan putaran 1000 rpm selama 20 j. Dalam pendekatan yang pertama (Jilid 1), penjerap PS-DVB yang telah disentesis telah dimodifikasi melalui kaedah (i) Tindak balas pengasilan Friedel-Crafts menggunakan stearoil klorida sebagai agen pengasilan untuk menghasilkan PS-DVB heptadekil keton, (ii) Tindak balas pengklorometilan untuk menghasilkan klorometil PS-DVB dengan kehadiran klorometil stirena, dan (iii) Tindak balas eter Williamson menggunakan logam natrium dan oktadekanol sebagai agen tindak balas eter untuk menghasilkan oktadekoksi metil PS-DVB. Penjerap yang telah disintesis itu dilakukan pencirian menggunakan spektroskopi FTIR, SEM, analisis penjerap nitrogen and analisis termogravimetri. Kajian pengekstrakan fasa pepejal (SPE) bagi beberapa sebatian organik terpilih seperti nitrobenzena, 2-klorofenol, benzaldehid, butirofenon dan p-kresol dijalankan dengan menggunakan tiub SPE yang dipadatkan dengan penjerap yang disintesis. Pertambahan peratus perolehan semula (35%-83%) dengan sisihan piawai relatif 2%-7% dihasilkan dengan menggunakan PS-DVB heptadekil keton. Peratus perolehan semula yang tertinggi (67%-100%) dihasilkan oleh bahan penjerap C18-silika komersial. Penentuan kemunculan isipadu untuk beberapa bahan penjerap menunjukkan bahawa kemunculan isipadu yang tertinggi dihasilkan oleh PS-DVB heptadekil keton, iaitu 30.60 mL untuk nitrobenzena 20 ppm dan 20.47 mL untuk 2-klorofenol 20 ppm. Kemunculan isipadu yang terendah dihasilkan oleh bahan penjerap oktadekoksi metil PS-DVB (1.03 mL untuk nitrobenzena 20 ppm dan 1.00 mL untuk 2-klorofenol 20 ppm. PS-DVB heptadekil keton terbukti sesuai digunakan sebagai bahan penjerap SPE di masa hadapan.
vii
CONTENTS
(VOLUME 1)
CHAPTER TITLE PAGE
ACKNOWLEDGEMENTS iv
ABSTRACT v
ABSTRAK vi
CONTENTS vii
LIST OF SYMBOLS xi
LIST OF TABLES xiii
LIST OF FIGURES xiv
LIST OF APPENDICES xvii
1 INTRODUCTION 1
1.1 General Background 1
1.2 Problem Background 3
1.3 Aim and Objectives 6
1.3.1 Aim of Sesearch
6
1.3.2 Objectives of Sesearch
6
1.4 Scope of Sesearch 6
1.5 Outline of Project Report 7
2 LITERATURE REVIEW 8
2.1 Free Radical Polymerization 8
2.1.1 Initiation 9
viii
2.1.2 Propagation 10
2.1.3 Termination 11
2.2 Suspension Polymerization 12
2.2.1 Types of Pores 15
2.3 Poly(styrene-divinylbenzene) 16
2.3.1 Chemical Modification of PS-DVB Resins 18
2.4 Application of Modified PS-DVB Resins 24
2.5 Octadecyl Silane Bonded Silica (C18-silica) 26
2.6 Materials and Method for Solid-Phase Extraction (SPE) 27
3 METHODOLOGIES 30
3.1 Materials and Reagents 30
3.2 Synthesis 33
3.2.1 Preparation of PS-DVB and Its Derivatives 33
3.2.2 Friedel-Crafts Acylation of PS-DVB by Using Stearoyl
Chloride 34
3.2.3 Chloromethylation of PS-DVB 35
3.2.4 Preparation of benzyl hexyl ether as a reaction model 35
3.2.5 Preparation of Octadecoxy Methyl PS-DVB
(PS-DVB-CH2-O-C18H37) 36
3.3 Characterization 36
3.4 Solution Preparations 38
3.4.1 Stock Solution Preparation 38
3.4.2 Sample Aqueous Solution Preparation 38
3.4.3 Sample for GC Peak Identification 38
3.5 Solid Phase Extraction 39
3.5.1 SPE Tube Packing 39
3.5.2 Conditioning and Elution of SPE Tube 39
3.5.3 Determination of Percentage Recovery 41
3.5.4 Determination of Response Factor 42
3.5.5 Determination of Concentration and Recovery Values
of Test Compound 43
ix
3.5.6 Hypothesis Test 44
3.5.7 Determination of Breakthrough Volume 45
4 PREPARATION AND PHYSICAL CHARACTERIZATION
OF PS-DVB AND MODIFIED PS-DVB ADSORBENTS 47
4.1 Introduction 47
4.2 Preparation of PS-DVB 48
4.3 Physical Characterization of Unmodified PS-DVB 49
4.3.1 Vibration Spectroscopic Characterization 49
4.3.2 Characterizations of Particle Size, Surface Morphology
and Pore Width/Volume by Scanning Electron
Microscopy and Nitrogen Adsorption Analysis 51
4.3.3 Thermal Stability by Thermogravimetric Analysis 57
4.4 Physical Characterization of Modified PS-DVB 60
4.4.1.1 Introducing Heptadecyl Ketone (C17H35CO-) onto
PS-DVB 60
4.4.1.2 Introducing Chloromethyl Group (CH2Cl) onto
PS-DVB 62
4.4.1.3 Williamson Ether Reaction 65
4.4.1.3a Preparation of Benzyl Hexyl Ether as Reaction Model 66
4.4.1.3b Introducing Octadecoxy (C18H37-O-) onto Chloromethyl
PS-DVB 67
4.4.2 Characterization of modified PS-DVB by Scanning
Electron Microscopy 70
4.4.3 Characterization by Thermogravimetry (TG) and
Derivative Thermogravimetry (DTG) 73
5 APPLICATION OF PS-DVB AND MODIFIED PS-DVB IN SOLID
PHASE EXTRACTION 77
5.1 Introduction 77
x
5.2 Identification of Peaks for Test Compounds and Internal
Standard 78
5.3 Determination of Response Factor for Test Compounds and
Internal Standard 80
5.4 Efficiency of Home-made PS-DVB, PS-DVB Heptadecyl
Ketone, and C18-Silica Adsorbents 81
5.5 Hypothesis Test 85
5.6 Measurement of Breakthrough Volume 86
6 CONCLUSIONS AND SUGGESTIONS 93
6.1 Conclusions 93
6.2 Suggestions 97
REFERENCES 99
APPENDICES 108
xi
LIST OF SYMBOL/ABBREVIATION/NOTATIONS/TERMS
PS-DVB - Poly(styrene-divinylbenzene)
SPE - Solid Phase Extraction
ppm - Parts per Million
GC - Gas Chromatogaphy
FID - Flame Ionization Detector
FTIR - Fourier Transform Infrared
IR - Infrared
p - Para
μL - Micro liter
mL - Mili Liter
v/v - Volume per Volume
KBr - Potassium Bromide
mg - Mili Gram
mm - Mili Meter
kPa - Kilo Pascal
MX - Test Compound Concentration (ppm)
MS - Internal Standard Concentration (ppm)
FS - Internal Standard Response Factor
FX - Test Compound Response Factor
AS - Internal Standard Peak Area
AX - Test Compound Peak Area
σ - Population Variance
n1 - Size of Sample
H0 - Null Hypothesis
H1 - Alternative Hypothesis
α - Level of Significance
v - Degree of Freedom
X - Mean
s - Standard Deviation
tR - Retention Time
IS - Internal Standard
xii
R.S.D. - Relative Standard Deviation
ODS - Octadecylsilica
%R - Percentage of Recovery
c - Effluent Concentation
c0 - Influent Concentration
c/c0 - The ratio of Effluent Concentration to Influent Concentration.
SEM - Scanning Electron Microscopy
BET Method - Brunauer, Emmet and Teller Method
BJH Method - Barrer, Joiyner and Halenda Mehtod
TG - Thermogravimetric
xiii
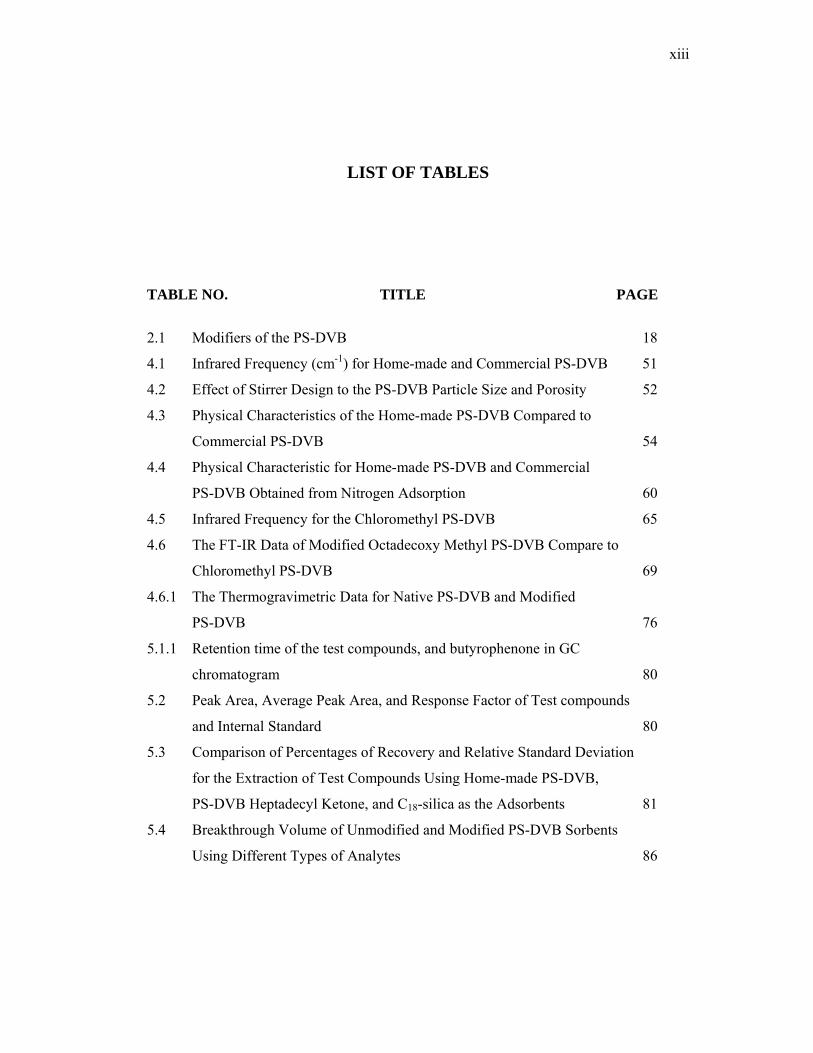
LIST OF TABLES
TABLE NO. TITLE PAGE
2.1 Modifiers of the PS-DVB 18
4.1 Infrared Frequency (cm-1) for Home-made and Commercial PS-DVB 51
4.2 Effect of Stirrer Design to the PS-DVB Particle Size and Porosity 52
4.3 Physical Characteristics of the Home-made PS-DVB Compared to
Commercial PS-DVB 54
4.4 Physical Characteristic for Home-made PS-DVB and Commercial
PS-DVB Obtained from Nitrogen Adsorption 60
4.5 Infrared Frequency for the Chloromethyl PS-DVB 65
4.6 The FT-IR Data of Modified Octadecoxy Methyl PS-DVB Compare to
Chloromethyl PS-DVB 69
4.6.1 The Thermogravimetric Data for Native PS-DVB and Modified
PS-DVB 76
5.1.1 Retention time of the test compounds, and butyrophenone in GC
chromatogram 80
5.2 Peak Area, Average Peak Area, and Response Factor of Test compounds
and Internal Standard 80
5.3 Comparison of Percentages of Recovery and Relative Standard Deviation
for the Extraction of Test Compounds Using Home-made PS-DVB,
PS-DVB Heptadecyl Ketone, and C18-silica as the Adsorbents 81
5.4 Breakthrough Volume of Unmodified and Modified PS-DVB Sorbents
Using Different Types of Analytes 86
xiv
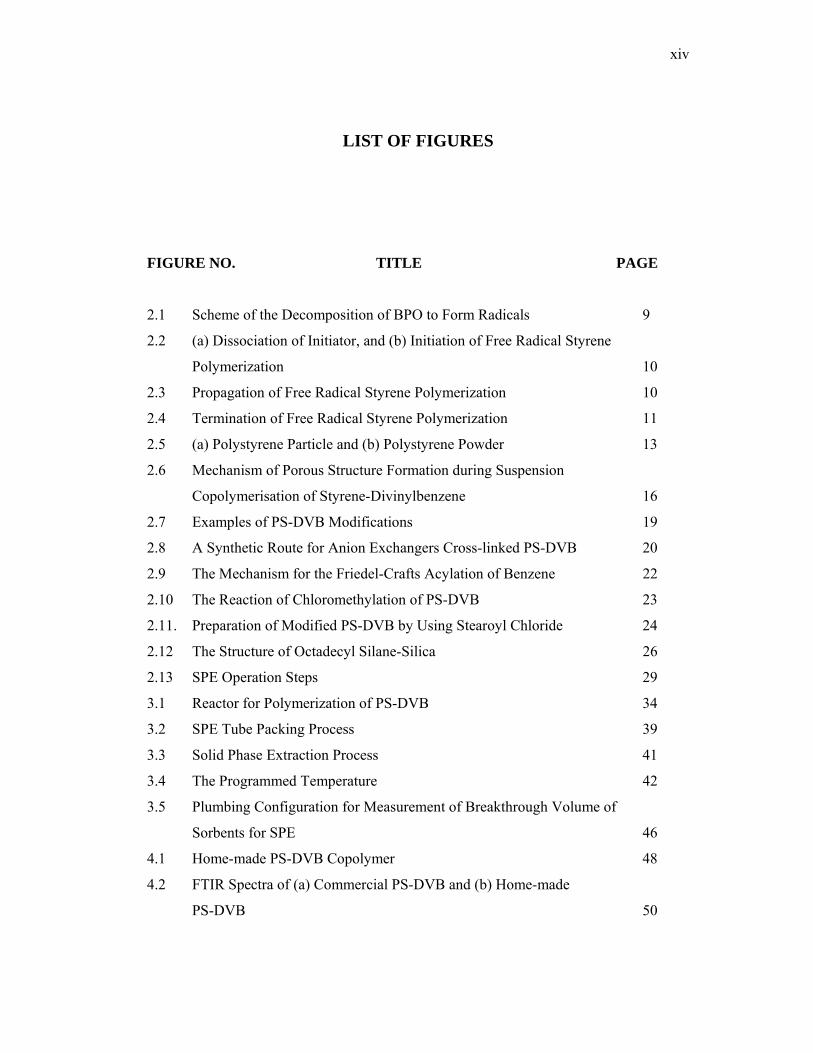
LIST OF FIGURES
FIGURE NO. TITLE PAGE
2.1 Scheme of the Decomposition of BPO to Form Radicals 9
2.2 (a) Dissociation of Initiator, and (b) Initiation of Free Radical Styrene
Polymerization 10
2.3 Propagation of Free Radical Styrene Polymerization 10
2.4 Termination of Free Radical Styrene Polymerization 11
2.5 (a) Polystyrene Particle and (b) Polystyrene Powder 13
2.6 Mechanism of Porous Structure Formation during Suspension
Copolymerisation of Styrene-Divinylbenzene 16
2.7 Examples of PS-DVB Modifications 19
2.8 A Synthetic Route for Anion Exchangers Cross-linked PS-DVB 20
2.9 The Mechanism for the Friedel-Crafts Acylation of Benzene 22
2.10 The Reaction of Chloromethylation of PS-DVB 23
2.11. Preparation of Modified PS-DVB by Using Stearoyl Chloride 24
2.12 The Structure of Octadecyl Silane-Silica 26
2.13 SPE Operation Steps 29
3.1 Reactor for Polymerization of PS-DVB 34
3.2 SPE Tube Packing Process 39
3.3 Solid Phase Extraction Process 41
3.4 The Programmed Temperature 42
3.5 Plumbing Configuration for Measurement of Breakthrough Volume of
Sorbents for SPE 46
4.1 Home-made PS-DVB Copolymer 48
4.2 FTIR Spectra of (a) Commercial PS-DVB and (b) Home-made
PS-DVB 50
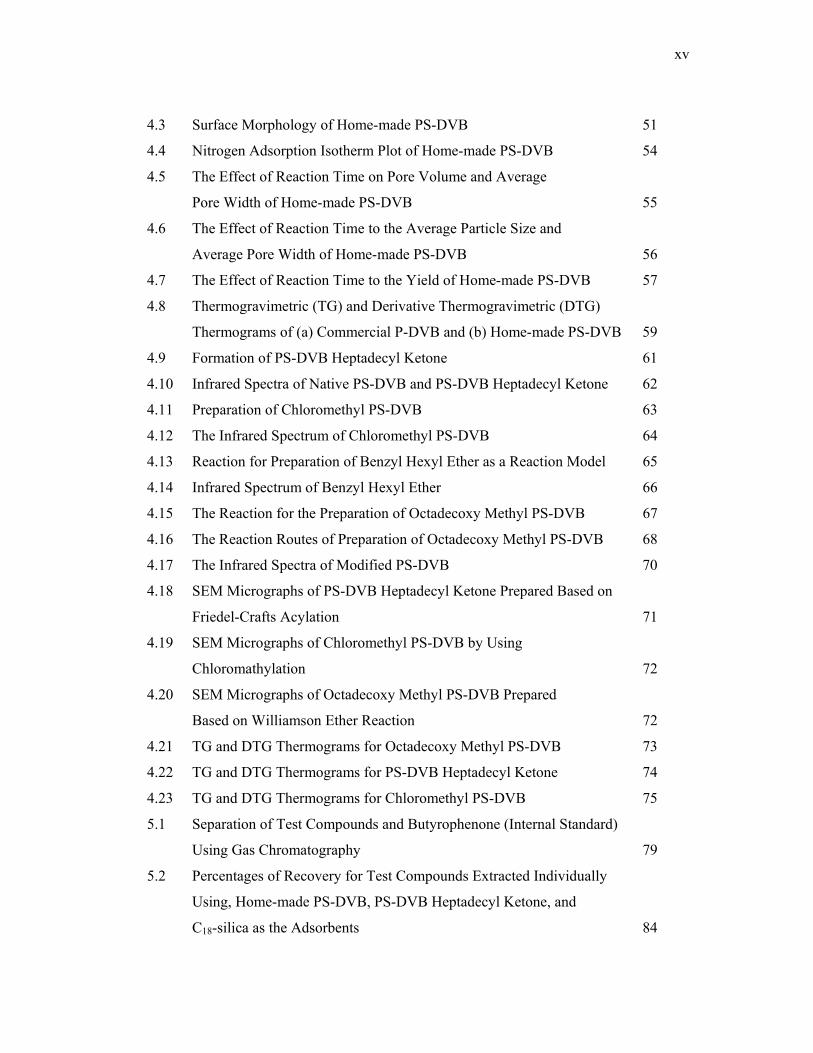
xv
4.3 Surface Morphology of Home-made PS-DVB 51
4.4 Nitrogen Adsorption Isotherm Plot of Home-made PS-DVB 54
4.5 The Effect of Reaction Time on Pore Volume and Average
Pore Width of Home-made PS-DVB 55
4.6 The Effect of Reaction Time to the Average Particle Size and
Average Pore Width of Home-made PS-DVB 56
4.7 The Effect of Reaction Time to the Yield of Home-made PS-DVB 57
4.8 Thermogravimetric (TG) and Derivative Thermogravimetric (DTG)
Thermograms of (a) Commercial P-DVB and (b) Home-made PS-DVB 59
4.9 Formation of PS-DVB Heptadecyl Ketone 61
4.10 Infrared Spectra of Native PS-DVB and PS-DVB Heptadecyl Ketone 62
4.11 Preparation of Chloromethyl PS-DVB 63
4.12 The Infrared Spectrum of Chloromethyl PS-DVB 64
4.13 Reaction for Preparation of Benzyl Hexyl Ether as a Reaction Model 65
4.14 Infrared Spectrum of Benzyl Hexyl Ether 66
4.15 The Reaction for the Preparation of Octadecoxy Methyl PS-DVB 67
4.16 The Reaction Routes of Preparation of Octadecoxy Methyl PS-DVB 68
4.17 The Infrared Spectra of Modified PS-DVB 70
4.18 SEM Micrographs of PS-DVB Heptadecyl Ketone Prepared Based on
Friedel-Crafts Acylation 71
4.19 SEM Micrographs of Chloromethyl PS-DVB by Using
Chloromathylation 72
4.20 SEM Micrographs of Octadecoxy Methyl PS-DVB Prepared
Based on Williamson Ether Reaction 72
4.21 TG and DTG Thermograms for Octadecoxy Methyl PS-DVB 73
4.22 TG and DTG Thermograms for PS-DVB Heptadecyl Ketone 74
4.23 TG and DTG Thermograms for Chloromethyl PS-DVB 75
5.1 Separation of Test Compounds and Butyrophenone (Internal Standard)
Using Gas Chromatography 79
5.2 Percentages of Recovery for Test Compounds Extracted Individually
Using, Home-made PS-DVB, PS-DVB Heptadecyl Ketone, and
C18-silica as the Adsorbents 84

xvi
5.3 Breakthrough Volume Curves for (a) Nitrobenzene and (b) 2-Chlorophenol
Using PS-DVB as the Adsorbent 88
5.4 Breakthrough Volume Curves for (a) Nitrobenzene and (b) 2-Chlorophenol
Using PS-DVB Heptadecyl Ketone as the Adsorbent 90
5.5 Breakthrough Volume Curves for (a) Nitrobenzene and (b) 2-Chlorophenol
Using Chloromethyl PS-DVB as the Adsorbent 91
5.6 Breakthrough Volume Curves for (a) Nitrobenzene and (b) 2-Chlorophenol
Using Octadecoxy MethylPS-DVB as the Adsorbent 91
xvii
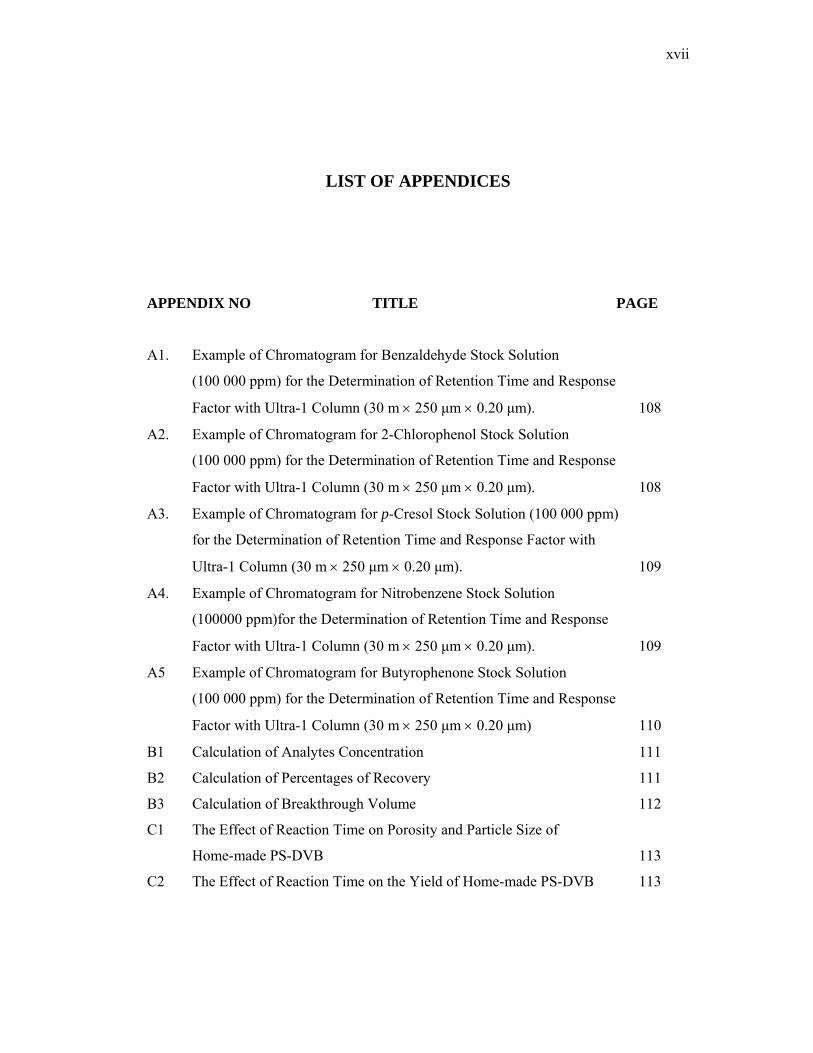
LIST OF APPENDICES
APPENDIX NO TITLE PAGE
A1. Example of Chromatogram for Benzaldehyde Stock Solution
(100 000 ppm) for the Determination of Retention Time and Response
Factor with Ultra-1 Column (30 m × 250 μm × 0.20 μm). 108
A2. Example of Chromatogram for 2-Chlorophenol Stock Solution
(100 000 ppm) for the Determination of Retention Time and Response
Factor with Ultra-1 Column (30 m × 250 μm × 0.20 μm). 108
A3. Example of Chromatogram for p-Cresol Stock Solution (100 000 ppm)
for the Determination of Retention Time and Response Factor with
Ultra-1 Column (30 m × 250 μm × 0.20 μm). 109
A4. Example of Chromatogram for Nitrobenzene Stock Solution
(100000 ppm)for the Determination of Retention Time and Response
Factor with Ultra-1 Column (30 m × 250 μm × 0.20 μm). 109
A5 Example of Chromatogram for Butyrophenone Stock Solution
(100 000 ppm) for the Determination of Retention Time and Response
Factor with Ultra-1 Column (30 m × 250 μm × 0.20 μm) 110
B1 Calculation of Analytes Concentration 111
B2 Calculation of Percentages of Recovery 111
B3 Calculation of Breakthrough Volume 112
C1 The Effect of Reaction Time on Porosity and Particle Size of
Home-made PS-DVB 113
C2 The Effect of Reaction Time on the Yield of Home-made PS-DVB 113
CHAPTER 1
INTRODUCTION
1.1 General Background
Thousands of polymers have been synthesized and more are likely to be
produced in the future. Functionalized polymers have found various applications as
supports in solid phase synthesis, such as chromatographic packing, polymer
supported catalysts and starting materials for the synthesis of ion exchange resins.
The suspension copolymerization of styrene with divinylbenzene has been developed
by Kun and Kunin [1] to produce poly(styrene-divinyl benzene) (PS-DVB). This
material has been widely used as a stationary phase for high performance liquid
chromatography (HPLC) and matrices of a great number of ion exchangers.
Previous workers [2] have found that macro-porous PS-DVB is prepared as a
result of phase separation during the copolymerization in the presence of inert
diluents. The inert diluents are extracted after copolymerization and porous structure
is obtained. Polymers, solvents or non-solvents of polystyrene or mixture of them
may be used as diluents giving various types of pore size distribution.
2
PS-DVB copolymers have a hydrophobic surface and overcome many of the
limitations of bonded silicas, especially those related to the limited pH stability in the
presence of the silanol group [3]. PS-DVB is often used as sorbents in reversed-
phase (RP) liquid chromatography [4]. Usually, porous PS-DVB packing materials
are employed because they provide a large surface area. Commercially available
porous PS-DVB packing includes Amberlite XAD-2, PLRP-S, and PRP-1. While
PS-DVB packing has many advantages, such as chemical stability at high and low
pH and the absence of residual silanol groups, they suffer from the disadvantage of
yielding lower chromatographic efficiencies than silica-based octadecylsilyl bonded
phase packing of the same particle size.
Since 1990s, chemically modified resins have been developed and applied to
the trace enrichment of polar substances. These sorbents have excellent
hydrophobicity and yield higher recoveries than unmodified ones and have found
great applications in solid phase extraction (SPE) for sample preparation in
environmental analysis [5]. One of the possible chemical modifications of resin is by
using Williamson ether reaction. The Williamson ether reaction was named after
Alexander William Williamson (1824-1904). The Williamson ether synthesis is an
example of a nucleophilic substitution reaction. The nucleophile is an alkoxide
anion, which displaces a halide ion, typically chloride or bromide, from a primary
haloalkane. The alkoxide can be generated by addition of metallic sodium to the
corresponding alcohol. Although the Williamson ether synthesis is a general method
for the laboratory production of ethers, there are some limitations to its use. Since the
alkoxide ion is a strong base, their use is limited to primary unhindered alkylating
agents. Otherwise, elimination competes strongly with the nucleophilic substitution
for the reactant molecules. Sometimes, the reaction is run in a solvent, which fosters
the SN2 process [6-7].
Solid-phase extraction has recently come into the focus of interest and offers
a viable alternative to the conventional sample preparation methods [5, 8, 9]. SPE
has evolved to be a powerful tool for isolation and concentration of trace analytes in
a variety of sample matrices. Nowadays, the most frequently used design in off-line
SPE is the cartridge or the syringe barrel. They are usually made of polypropylene
or polyethylene and filled with packing material having different functional groups.
3
The solid sorbent is contained between two 20-μm polypropylene frits. Cartridges
vary from as little as 100 mg to 1 g or more. Syringe barrels range in size from 1 to
25 mL and packing weights from 50 mg to 10 g. Solvent reservoirs may be used at
the top of the syringe barrels to increase the total volume (50-1000 mL) [8].
The breakthrough volumes can describe the characteristics of adsorbents. To
record a breakthrough curve, after proper equilibration of the SPE cartridge, a
solution of analyte is pumped directly to the detector (cartridge in the bypass
position) to determine its absorbance signal. The cartridge is switched in-line
causing the UV signal to drop to baseline level because the analyte is retained on the
cartridge. Upon breakthrough, the UV signal will rise back to its initial level. The
volume of analyte solution that can flow through the cartridge before breakthrough
occurs is the “breakthrough volume” and is used as the measure of the extraction
capacity [10].
This sesearch was set to explore the methods of preparing of PS-DVB
stationary phases, their modification, characterization, as well as application in
analytical separation. PS-DVB beads were synthesized based on suspension
polymerization from its monomers, styrene, and divinyl-benzene. A new PS-DVB
modification method was carried out by introducing octadecoxy group (C18H37-0-)
onto the PS-DVB back bone.
1.2 Problem Background
The beginning of the era of synthetic polymers for ion exchange is generally
attributed to the work of B. A. Adams and E. L. Holmes at the Chemical Research
Laboratory, Teddington, England [11]. Although the phenomenon of water softening
by ion-exchange was known at the time of their collaboration, the deionization of
water required stable materials capable of performing both cation and anion
exchange.
4
A polymer is a chemical species of high molecular weight. It is made up of
repeating low-molecular weight units. These repeating units are termed monomers
and the compounds are reacted to form a polymer. There are two types of polymers
namely, natural and synthetic polymers [12]. The PS-DVB polymers are
manufactured as general sorbents and they are often chosen for SPE works because
the loading properties of organic carbon are superior to those of silica-based
adsorbent [13]. Leon-Gonzalez and co-workers [3] have found that the chemically
modified PS-DVB resin can adsorbed wide variety of organic analytes efficiently.
They have a higher sorption capacity for the more polar compounds than their
unmodified analogues do.
Balakhrisnan and Ford [14] have found that the suspension polymerization is
widely used in polymerization of styrene. The major factors controlling the particle
size are surface tension, densities of aqueous and monomer phases, viscosities of
aqueous and monomer phases, diameters of stirrer and kettle, and stirring speed.
Their research on particle size effects in polymer supported organic synthesis and
polymer supported phase transfer catalysis requires cross linked polystyrenes of a
wide range of sizes with chloromethyl group that can be converted easily to polymer
bound.
Masque et al. [5] described the application of unmodified and modified PS-
DVB to the analysis of group of polar phenolic compounds. They have used on-line
and the off-line SPE to determine pollutants in environmental waters. The
advantages of on-line SPE are the higher sensitivity, absence of organic solvents and
less manipulation of the samples, which leads to greater precision, and makes it
easier for it to be automated. The functional polymer networks have gained great
importance in many fields of scientific research as well as for industrial applications.
The interest stems from the variety of possible modifications of their chemical and
physical properties. Claudio et al. [15] said that increasing environmental concerns in
waste water treatment has lead to the use of organic ligands anchored to solid
supports in order to remove and recover important metal ions from aqueous solution.
5
The use of polymeric resins in reversed-phase high performance liquid
chromatography (RP-HPLC) has grown dramatically, since an increasing number of
polymeric columns are commercially available. The application of silica-based
supports is limited by the low stability of silica at alkaline pH values and by the
unwanted interactions between polar solutes and remaining free silanol groups not
covered by the hydrophobic ligands. In particular, PS-DVB-based resins show a high
stability over the pH range 1-14 and provide excellent separations. Additionally, PS-
DVB particles permit the introduction of numerous functional groups that change
their surface chemistry and hence the chromatographic selectivity [16].
Porous PS-DVB based resins have proven to be very effective for SPE of a
wide variety of organic compounds from predominantly aqueous samples. Their
effectiveness is enhanced by chemical introduction of polar groups, such as acetyl,
and sulfonic acid [17]. However, these modified PS-DVB resins were poorly
extracted small toward polar organic compounds such as alcohols, aldehydes,
ketones and carboxilyc acids. Consequently, when SPE is carried out in extremely
acidic or basic media, reversed-phase polymeric sorbents (generally based on PS-
DVB) are used. The PS-DVB has much lower backgrounds due to improvements in
manufacturing processes. The PS-DVB was used as an adsorbent material has
demonstrated to provide improved recoveries for phenolic compounds as compared
to the traditional and more commonly applied C18 material [17].
Silica based packing materials are widely used in high performance liquid
chromatography (HPLC) because of their mechanical stability and wide variety of
derivatizations, as well as their relatively higher column efficiency. Unfortunately,
silica based supports also possess a series of drawbacks. One is their inherent low
chemical stability at pH above 8 and below 2. This drawback can cause dissolution
of the silica support and loss of the bonded phase. In general, ideal ion-exchange
packing materials for HPLC are mechanically stable, chemically inert, hydrophilic
with no irreversible adsorption, and highly efficient. To overcome the stability
problem of silica, researchers have turned their attention to polymeric supports. PS-
DVB-based supports have been studied and utilized the most, due to their chemical
stability in both strong base and acid. Recently, HPLC ion exchange stationary
phase have been developed from the PS-DVB matrix by applying a hydrophilic
6
coating on the surface. However, the column efficiency could not match that of most
silica-based column [18]. It is of interest, therefore, to explore new techniques to
treat the surface of PS-DVB beads in order to obtain more variable absorbent.
1.3 Aim and Objectives
1.3.1 Aim of Sesearch
The aim of this sesearch is to develop a new chemically modified PS-DVB
resin by introducing octadecoxy group (C18H37-O-) onto the PS-DVB backbone. The
new modified PS-DVB is compared with unmodified PS-DVB and other modified
PS-DVB and these phases are applied as adsorbents in solid phase extraction.
1.3.2 Objectives of Project
The objectives of this research are:
a) To synthesize PS-DVB adsorbent using suspension polymerization technique.
b) To produce modified PS-DVB adsorbents by Friedel-Crafts acylation reaction,
chloromethylation, and Williamson ether reaction.
c) To characterize and study the performance of the adsorbents.
d) To apply the developed modified PS-DVB resins to SPE analysis.
1.4 Scope of Sesearch
The following are the scopes of sesearch:
a. Preparation PS-DVB and modification of PS-DVB via
i. Friedel-Crafts acylation
ii. Chloromethylation
iii. Williamson ether reaction
7
b. Study of the physical characteristics of PS-DVB and modified PS-DVB by using:
i. Fourier transform infrared spectrophotometry (FTIR)
ii. Scanning electron microscopy (SEM)
iii. Thermogravimetric analysis (TGA)
iv. Nitrogen adsorption analysis (NA)
c. Study of the chemical characteristics of PS-DVB and modified PS-DVB by using:
i. Solid phase extraction (SPE)
ii. Gas chromatography (GC)
1.5 Outline of the Project Report
This project report consists of six chapters. Chapter 1 presents general
background of this sesearch, research aim, research objectives and scope. Chapter 2
compiles the literature reviews and theoretical background on PS-DVB, modification
of PS-DVB and its application as an adsorbent for chemical analysis. The
procedures for characterization and application of the synthesized materials are
presented in Chapter 3. Chapter 4 reports the results and discusses the preparation of
PS-DVB, and modified PS-DVB. Chapter 5 describes the characterization and
application of unmodified and modified PS-DVB as an adsorbent in the
chromatographic analysis. The concluding Chapter 6 summarizes this project report
by presenting the overall conclusions and suggestions for future sesearch.
CHAPTER 2
LITERATURE REVIEW
2.1 Free Radical Polymerization
One of the most common and useful reactions for making polymers is the free
radical polymerization. It is used to make polymers from vinyl monomers, that is,
from small molecules containing carbon-carbon double bonds. Free radical
polymerization reactions are of enormous importance in technology. The monomers
of these reactions are available in large quantities from the photochemical industry,
and the polymers obtained from these monomers form the foundation of much of the
polymer industry as explained by Allcock et al [19].
The polymerization reactions used in this project are based on free radical
polymerization. It consists of three basic steps: initiation, propagation, and
termination. In the initiation step, radicals are needed to begin the development of the
polymer chain. In the propagation step, free radicals are added to monomer units.
The polymer chain will then begin to form with the addition of one monomer unit at
a time. The reaction is a very rapid process, and it has been calculated that
approximately 1500 monomer units will attach to form a polymer chain in one
second. The termination step of free radical polymerization stops a free radical in
one of three ways. First, coupling termination; this can be found between free radical
9
styrene molecules. Second, disproportionation; it is the conjunction of two polymer
chains. One of the polymer chains is saturated and the other is unsaturated; both fuse
by transfer of hydrogen radical to form a single polymer unit. The third step,
termination sequence that consists of a combination of both coupling and
disproportionation reactions [12].
2.1.1 Initiation
The initiation of a free radical chain takes place by addition of a free radical
(R·) to a vinyl molecule. Free radical initiation can occur through application of heat
(thermal), photochemical, and ionization. Peroxides such as benzoyl peroxide (BPO),
require temperatures in the range of 40-60oC for decomposition and free radical
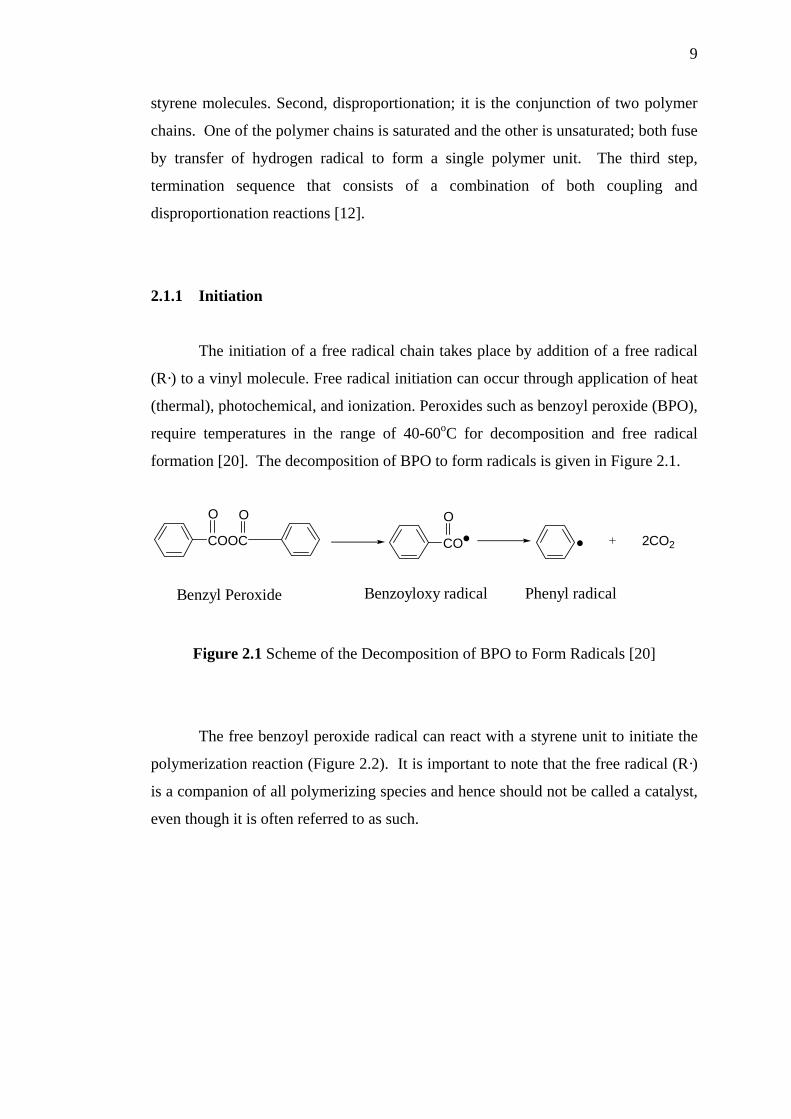
formation [20]. The decomposition of BPO to form radicals is given in Figure 2.1.
COOC CO 2CO2
OO O
Benzyl Peroxide Benzoyloxy radical Phenyl radical
Figure 2.1 Scheme of the Decomposition of BPO to Form Radicals [20]
The free benzoyl peroxide radical can react with a styrene unit to initiate the
polymerization reaction (Figure 2.2). It is important to note that the free radical (R·)
is a companion of all polymerizing species and hence should not be called a catalyst,
even though it is often referred to as such.
10
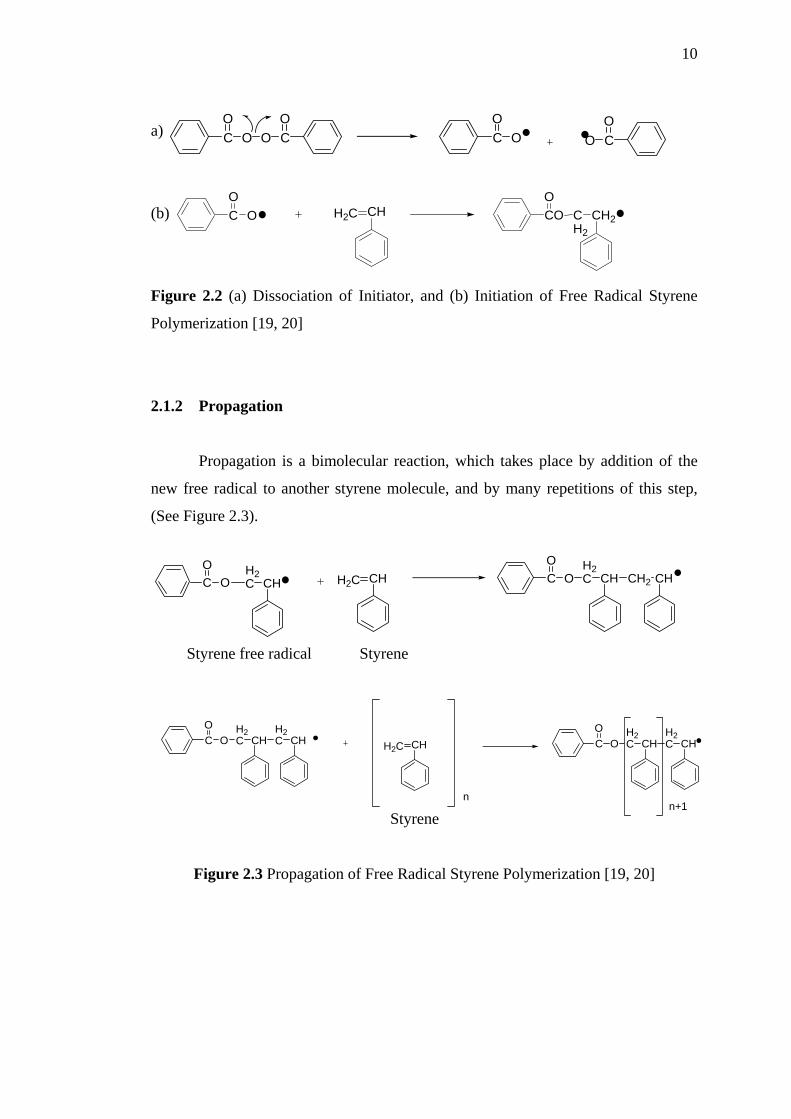
C O O COO
CO
O O COa)
CO
O H2C CH COO
CH2
CH2(b)
Figure 2.2 (a) Dissociation of Initiator, and (b) Initiation of Free Radical Styrene
Polymerization [19, 20]
2.1.2 Propagation
Propagation is a bimolecular reaction, which takes place by addition of the
new free radical to another styrene molecule, and by many repetitions of this step,
(See Figure 2.3).
H2C CH H2C CH C O
O H2C CH CH2 CHC O
O
Styrene free radical Styrene
CO
OH2C CH
H2C CH H2C CH
n
CO
OH2C CH
H2C CH
1
n+ Styrene
Figure 2.3 Propagation of Free Radical Styrene Polymerization [19, 20]
11
2.1.3 Termination
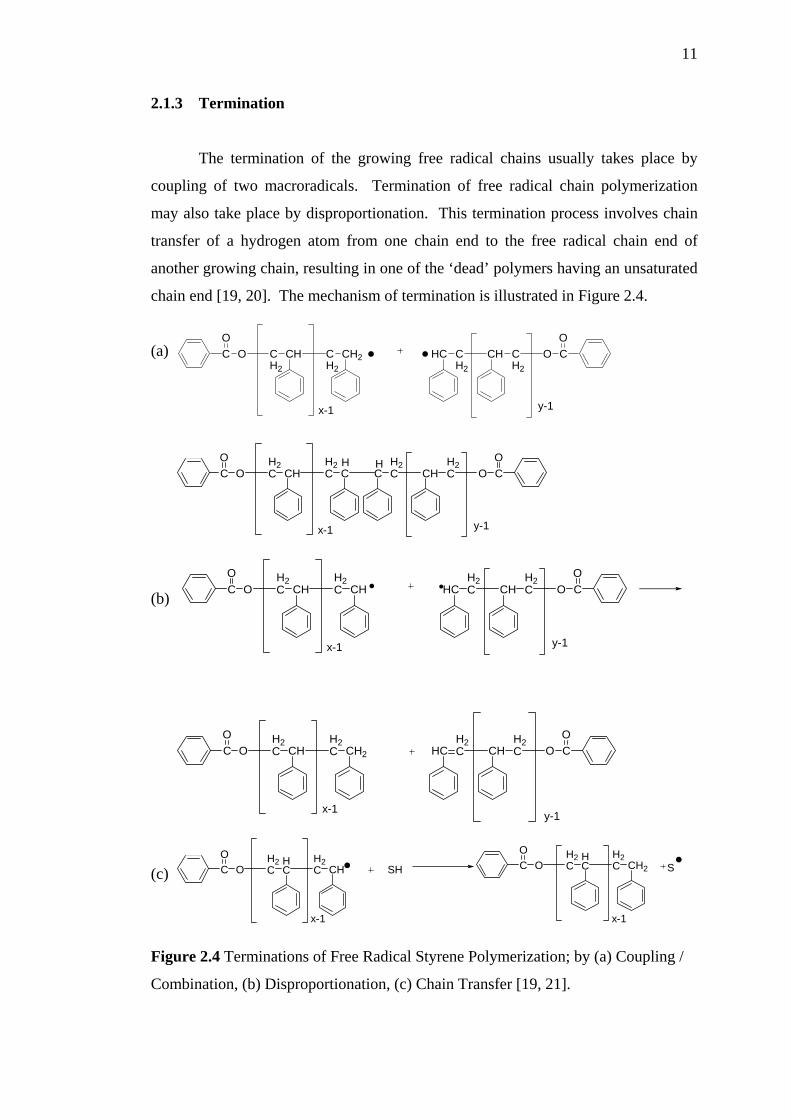
The termination of the growing free radical chains usually takes place by
coupling of two macroradicals. Termination of free radical chain polymerization
may also take place by disproportionation. This termination process involves chain
transfer of a hydrogen atom from one chain end to the free radical chain end of
another growing chain, resulting in one of the ‘dead’ polymers having an unsaturated
chain end [19, 20]. The mechanism of termination is illustrated in Figure 2.4.
CO
O CH2
CH CH2
CH2
x-1
HC CH2
CH CH2
O CO
y-1
(a)
CO
OH2C CH
H2C C
x-1
CH2C CH
H2C O C
O
y-1
HH
CO
OH2C CH
H2C CH
x-1
HCH2C CH
H2C O C
O
y-1
CO
OH2C CH
H2C CH2
x-1
HCH2C CH
H2C O C
O
y-1
(b)
CO
OH2C
HC
H2C CH SH C
OO
H2C
HC
H2C CH2 S
x-1 x-1
(c)
Figure 2.4 Terminations of Free Radical Styrene Polymerization; by (a) Coupling /
Combination, (b) Disproportionation, (c) Chain Transfer [19, 21].
12
2.2 Suspension Polymerization
Hoffman and Delbruch were the first to develop suspension polymerization in
1909 [21]. In suspension polymerization the initiator is soluble in the monomer
phase, which is dispersed by comminuting into the dispersion medium (usually
water) to form droplets. The solubility of the dispersed monomer (droplet) phase and
also the resultant polymer in the dispersion medium are usually low. The volume
fraction of the monomer phase is usually within the range 0.1-0.5 mL.
Polymerization reactions may be performed at lower monomer volume fractions, but
are not usually economically viable. At higher volume fractions, the concentration
of continuous phase may be insufficient to fill the space between droplets.
Polymerization proceeds in the droplet phase and in most cases occur by a free
radical mechanism. Suspension polymerization usually requires the addition of small
amounts of a stabilizer to hinder coalescence and break-up of droplets during
polymerization. Suspension polymerization is a polymerization process in which the
monomer, or mixture of monomers, is dispersed by mechanical agitation in a liquid
phase, usually water, in which the monomer droplets are polymerized while they are
dispersed by continuous agitation. This process is used for polymerization of PS-
DVB where styrene is dispersed in fine droplets into water [22-23].
The free radical initiators are exclusively organic peroxides that need to be
soluble in styrene and insoluble in water. The size of the droplets can be adjusted by
numerous parameters such as addition of colloids, stirring conditions, reactor
geometry, etc. Only organic peroxides initiate suspension polymerization. If the
monomer is insoluble in water, bulk polymerization can be carried out in suspended
droplets, i.e. monomer is mechanically dispersed. The water phase becomes the heat
transfer medium. Since it is a continuous phase, viscosity changes are very little as
the monomer converts to polymer, so the heat transfer is very good. In this system,
the monomer must be either insoluble in water or only slightly soluble in water, so
that when it polymerizes it becomes insoluble in water. The two differences between
emulsion and suspension polymerization are [23-24]: (a) the suspension
polymerization is a mechanical process, and must have a stabilizing agent until the
droplets are far apart, and (b) the emulsion polymerization is a chemical process
which requires a surfactant to make the monomer “emulsify”.
13
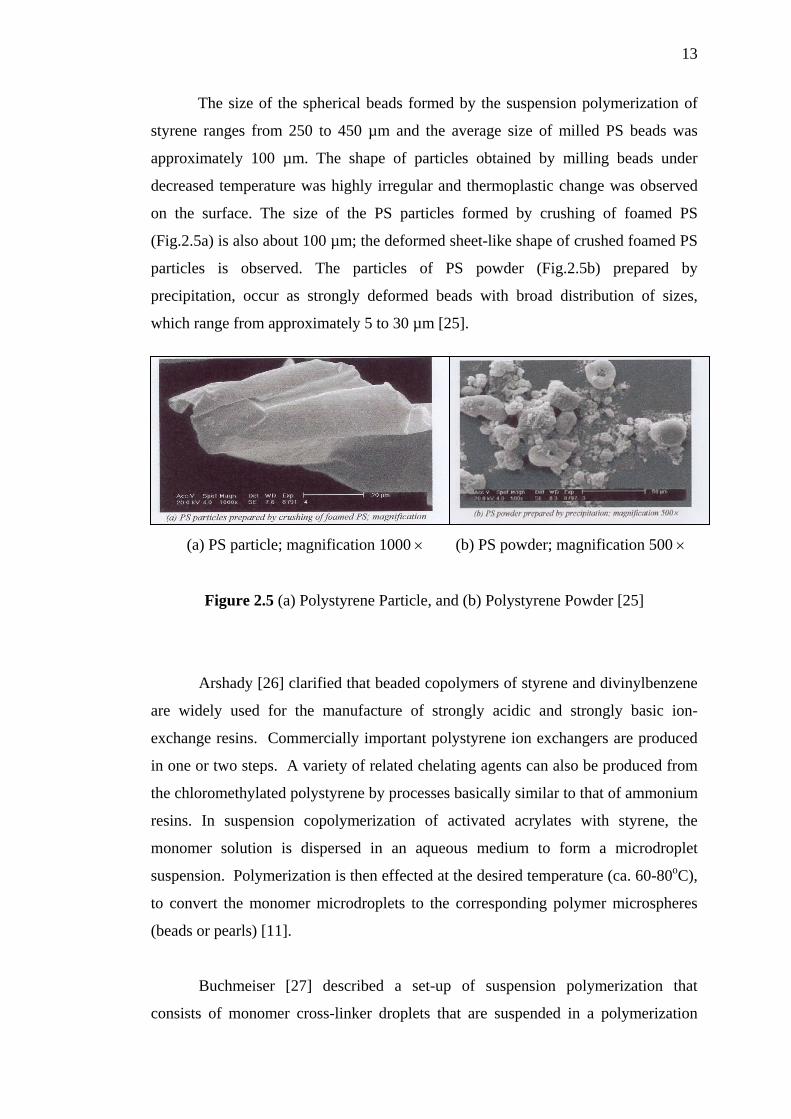
The size of the spherical beads formed by the suspension polymerization of
styrene ranges from 250 to 450 µm and the average size of milled PS beads was
approximately 100 µm. The shape of particles obtained by milling beads under
decreased temperature was highly irregular and thermoplastic change was observed
on the surface. The size of the PS particles formed by crushing of foamed PS
(Fig.2.5a) is also about 100 µm; the deformed sheet-like shape of crushed foamed PS
particles is observed. The particles of PS powder (Fig.2.5b) prepared by
precipitation, occur as strongly deformed beads with broad distribution of sizes,
which range from approximately 5 to 30 µm [25].
(a) PS particle; magnification 1000 × (b) PS powder; magnification 500 ×
Figure 2.5 (a) Polystyrene Particle, and (b) Polystyrene Powder [25]
Arshady [26] clarified that beaded copolymers of styrene and divinylbenzene
are widely used for the manufacture of strongly acidic and strongly basic ion-
exchange resins. Commercially important polystyrene ion exchangers are produced
in one or two steps. A variety of related chelating agents can also be produced from
the chloromethylated polystyrene by processes basically similar to that of ammonium
resins. In suspension copolymerization of activated acrylates with styrene, the
monomer solution is dispersed in an aqueous medium to form a microdroplet
suspension. Polymerization is then effected at the desired temperature (ca. 60-80oC),
to convert the monomer microdroplets to the corresponding polymer microspheres
(beads or pearls) [11].
Buchmeiser [27] described a set-up of suspension polymerization that
consists of monomer cross-linker droplets that are suspended in a polymerization
14
medium. For suspension polymerization, there are two phases, water and organic
(oil), and the starting point may be 10 parts of the former and 1 part of the latter
(v/v). The initiator used can be water-soluble or organic-soluble (benzoyl peroxide,
2,2’-azo-bis-isobutyryl nitrile (AIBN) ) but organic-soluble initiators are more often
used.
Suspension polymerization probably remains the most widely practiced
method of producing polystyrene. The advantage of suspension process over mass
processes is the excellent temperature control that can be obtained through the
suspending medium, water. This allows for rapid heat removal and shorter
polymerization times. The separation is much easier than in solution polymerization.
[21, 23].
Suspension polymerization is extensively employed. Styrene, methyl
methacrylate, vinyl chloride, and vinyl acetate are polymerized by suspension
process. The process is also referred to as bead, pearl, or granular polymerization
because of the forms in which the final products may be obtained. The monomer is
dispersed as droplets in water. The monomer droplet size is maintained by
mechanical agitation and the addition of stabilizers. Various types of stabilizers are
used to prevent agglomeration of the monomer droplets. A protective colloidal
agent, often poly (vinyl alcohol) (PVA), is added to prevent coalescence of the
droplets. The initiators used are soluble in the monomer droplets. Each monomer
droplet is considered to be a small bulk polymerization system. Heat control in
suspension polymerization is relatively easy. However, near the end, the particles
become hard and are recovered by filtration. Because the liquid is water-based,
solvent recovery and treatment problems are minimal. The product usually must be
washed, dried, and freed of additives [22, 24].
Arshady [26] explained that the most important feature of organic (oil)/water
suspension polymerization is the formation of a droplet suspension of the monomer
in water (the suspension medium) and the maintenance of the individual droplets
throughout the polymerization process. Droplet formation in an organic (oil)-water
mixture is most appropriately accomplished by mechanical stirring, although other
forms of mixing can also be employed. By suspension polymerization, the
15
copolymers produced are in beaded form. It was found that different diluents
generated formation of uniform polymer networks with an in-homogeneity mostly
related to the kind and amount of inert diluents used
2.2.1 Types of Pores
Porosity and surface area in both inorganic and organic supports can be
controlled easily during production. For organic resins, gelation and/or precipitation
processes that take place during the conversion of liquid micro droplets to solid
micro beads determine porosity. For example, polystyrene beads produced in the
presence of 1-2% divinylbenzene (DVB) without a monomer diluent have a very low
surface area (<1 m2/g) with no real porosity or very small pores. However, by using
higher DVB concentrations and a monomer diluent, polymer beads with wide range
of porosities can be produced, depending on the proportions of DVB and monomer
diluent.
Solid material commonly contains one or more groups of pores, whose size
and volume depend on preparation method. The pores are classified into different
classes depending on their size [28]:
• Micropores (size < 2 nm)
• Mesopores (2 nm < size <50 nm)
• Macropores (size > 50 nm)
Matrix porosity is the basis of support characteristics in chromatography, and
determines the fraction range of the support. Resin porosity may also affect the
support performance in other applications such as affinity chromatography, and
solid-phase synthesis. The specific pore volume and pore size distribution in the
swollen state may be substantially different from those measured in the dry state
[29]. Figure 2.6 illustrates the formation of porous structure of PS-DVB.
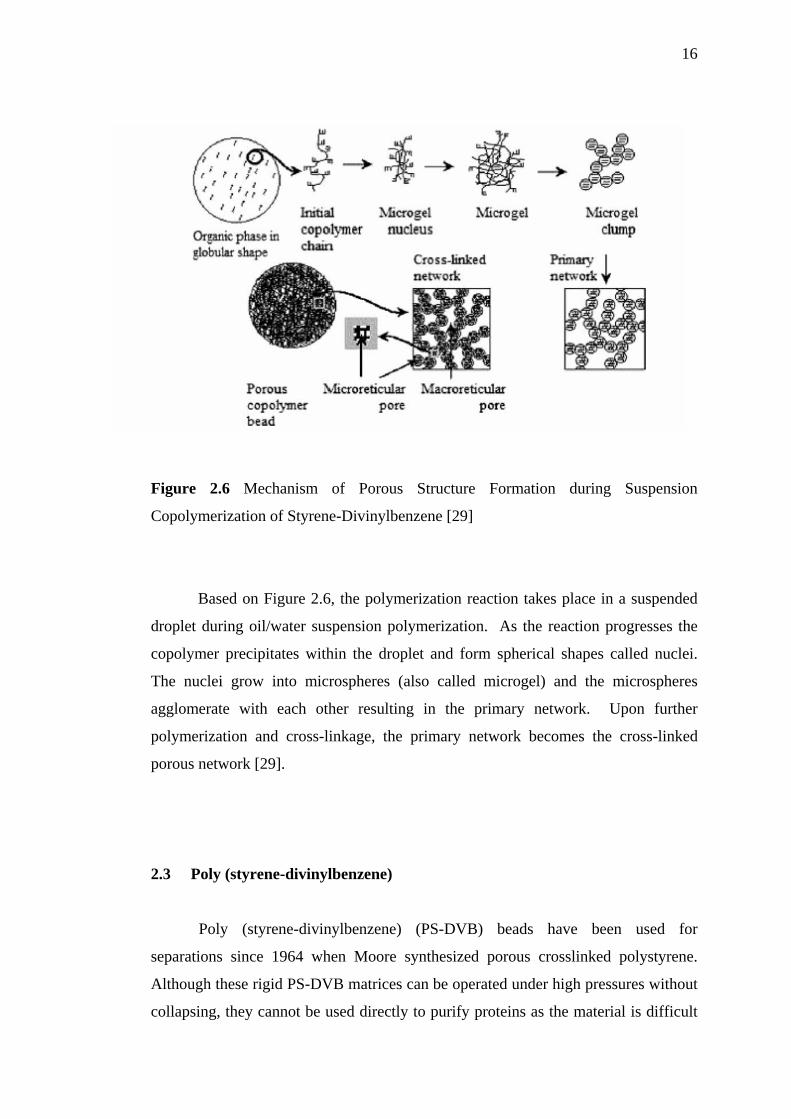
16
Figure 2.6 Mechanism of Porous Structure Formation during Suspension
Copolymerization of Styrene-Divinylbenzene [29]
Figure 2.6 Mechanism of Porous Structure Formation during Suspension
Copolymerization of Styrene-Divinylbenzene [29]
Based on Figure 2.6, the polymerization reaction takes place in a suspended
droplet during oil/water suspension polymerization. As the reaction progresses the
copolymer precipitates within the droplet and form spherical shapes called nuclei.
The nuclei grow into microspheres (also called microgel) and the microspheres
agglomerate with each other resulting in the primary network. Upon further
polymerization and cross-linkage, the primary network becomes the cross-linked
porous network [29].
2.3 Poly (styrene-divinylbenzene)
Poly (styrene-divinylbenzene) (PS-DVB) beads have been used for
separations since 1964 when Moore synthesized porous crosslinked polystyrene.
Although these rigid PS-DVB matrices can be operated under high pressures without
collapsing, they cannot be used directly to purify proteins as the material is difficult
17
to derivatise with affinity ligands and hydrophobic interactions between the matrix
and protein often result in irreversible adsorption or loss yield. The recent trend
towards modification of PS-DVB with hydrophilic groups to mask its hydrophobic
surface aimed at improving its use in protein chromatography has produced both
covalently bonded carboxylic groups and adsorbed hydrophilic groups [30].
In the course of polymerization, initially homogeneous mixture of reaction
components separates into two phases, one of which is cross-linked polymer and the
other pure diluents [18]. The densely cross-linked regions in copolymers do not
collapse entirely, with the removal of the inert diluents after polymerization and part
of the volume, which primarily contained the diluents, appears as pores. Layadene et
al. [2] have found that the use of precipitant diluents in the preparation of porous
styrene-divinylbenzene copolymers give low specific surface area and high porous
volume copolymer beads. The porous structure formation has been attributed to
phase separation of the copolymer formed during the polymerization process. The
selection of diluents as a precipitant is important in determining the porous structure
of the polymer beads. For many applications, the presence of meso- and/or macro-
pores is a key requirement to minimize diffusional limitations.
Coutinho et al. [1] put in plain words that when styrene-divinylbenzene are
copolymerized by a suspension process in the presence of a good solvent for the
polymer chains (good diluents), two kinds of porous structures can be obtained: gel
or macroporous. At low DVB content the final structure is an expanded gel. When
the DVB content and dilution degree are high, a macroporous copolymer is obtained.
On the other hand, when the diluents are a poor solvent for the polymer chains (bad
diluents), phase separation during the polymerization process takes places and is
responsible for the formation of macroporous structures. When mixtures of good and
bad diluents are used the copolymers present a porous structure with intermediary
characteristic in relation to the copolymers prepared with the pure diluents.
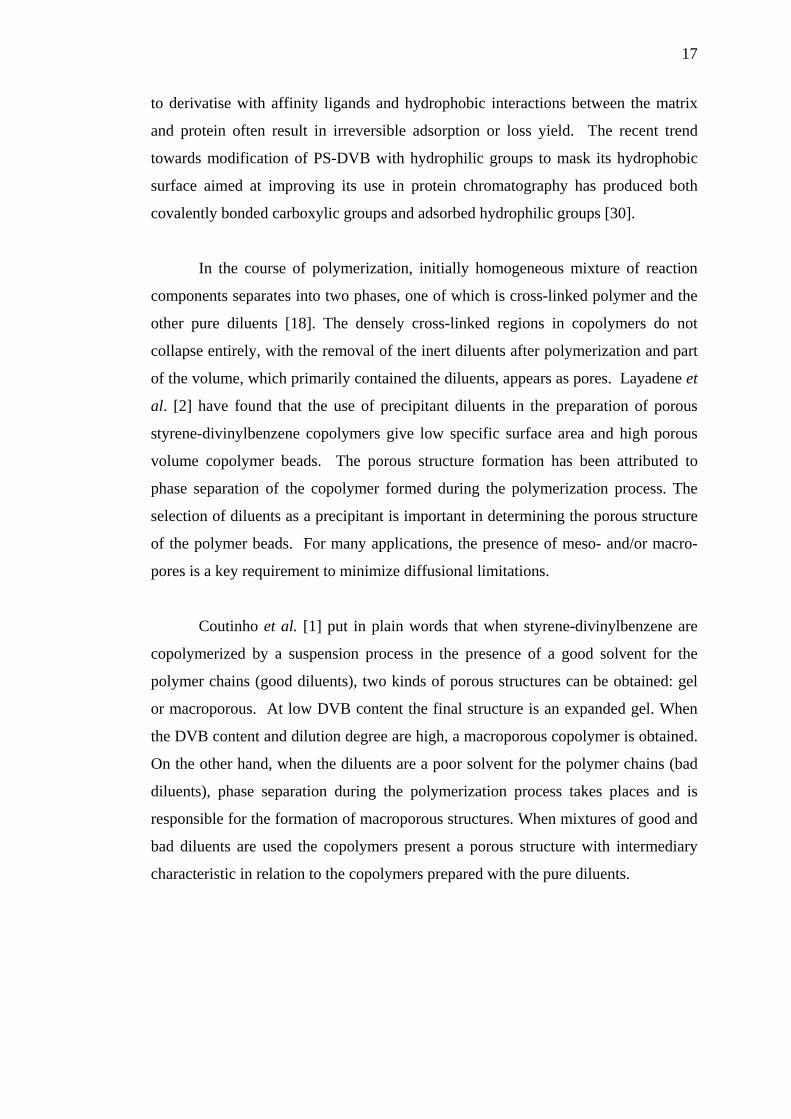
18
2.3.1. Chemical Modification of PS-DVB Resin
Poly (styrene-divinylbenzene) has greater analyte retention, mainly for polar
compounds, than bonded silica because their hydrophobic surface contains a
relatively larger number of active aromatic sites that allow π-π interactions.
Nevertheless, sorbents based on PS-DVB have some drawbacks, such as their lack of
selectivity and low breakthrough volumes for highly polar compounds, which leads
to their incomplete extraction from predominantly aqueous samples. These
drawbacks can be largely overcome by using modified resins obtained by attaching
polar groups to the aromatic ring on the PS-DVB. These groups are listed in Table
2.1.
Table 2.1: Modifiers of the PS-DVB [3]
Group Structure Acetyl
C CH3
O
Hydroxymethyl CH2OH O
C Benzoyl
CO
HOOC
2,4-Dicarboxylbenzoyl
CO
HOOC
COOH o-Carboxybenzoyl SO3 sulfonate
-CH2-N(CH3)3+
Trimethylammonium
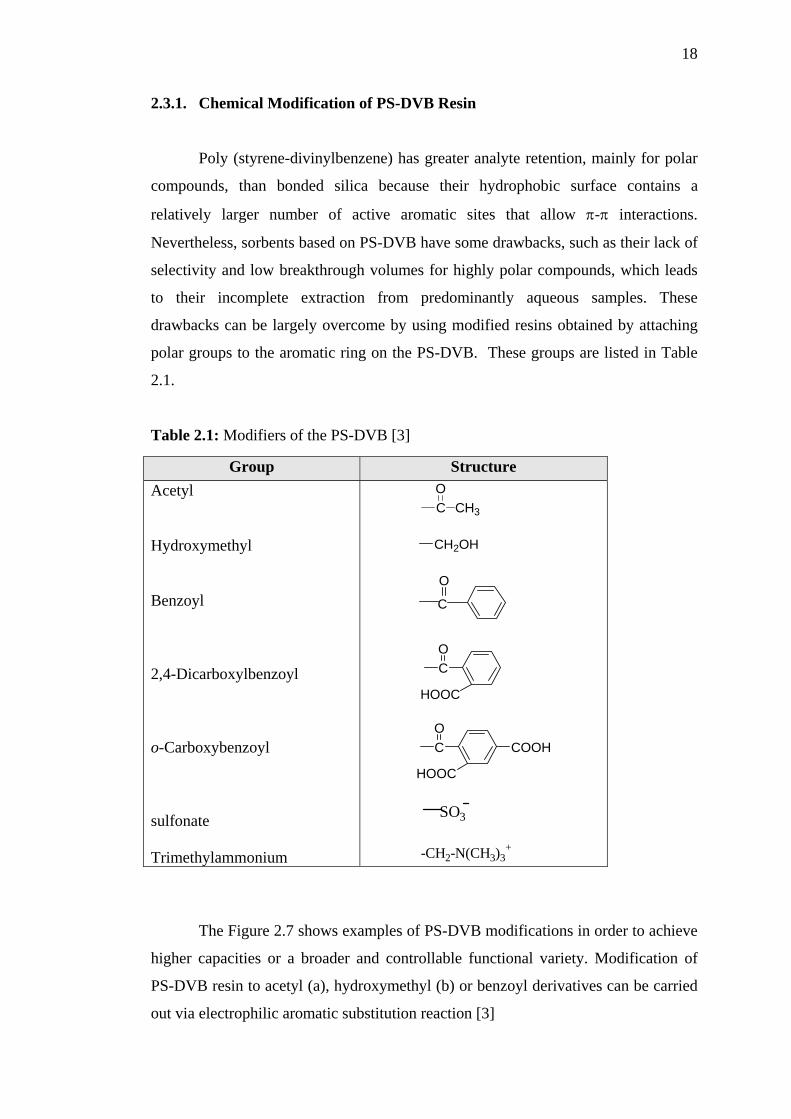
The Figure 2.7 shows examples of PS-DVB modifications in order to achieve
higher capacities or a broader and controllable functional variety. Modification of
PS-DVB resin to acetyl (a), hydroxymethyl (b) or benzoyl derivatives can be carried
out via electrophilic aromatic substitution reaction [3]
19
O2N
CO
COOH
CO
C
O
O
CO
CO
O
CO
AlCl3AlCl3
PhCOCl
CH2OH
CH3COCl
AlCl3
CH2OH
COH3C
AlCl3
HOOC
COOH
CO
NO2
COOH
COOH
SnCl2
ZnCl2
ClCH2OCH3
CH2Cl
H2C N(CH3)+Cl-
H2SO4
SO3H
N(CH3)3
COOH
CO
COOH
Figure 2.7 Examples of PS-DVB Modifications [3]
20
Poinescu et al. [31] have developed macroreticular network synthesis based
on the styrene-divinylbenzene copolymers. There has been increasing interest in
using such materials as chromatographic packing supports or porous starting
structure for the ion exchangers. Styrene copolymerized with a small amount of
DVB results in gel-type copolymers, which are characterized by a swollen state
porosity. The modification of PS-DVB by two chemical groups, acetyl and benzoyl,
and retained more polar compounds than the unmodified resin.
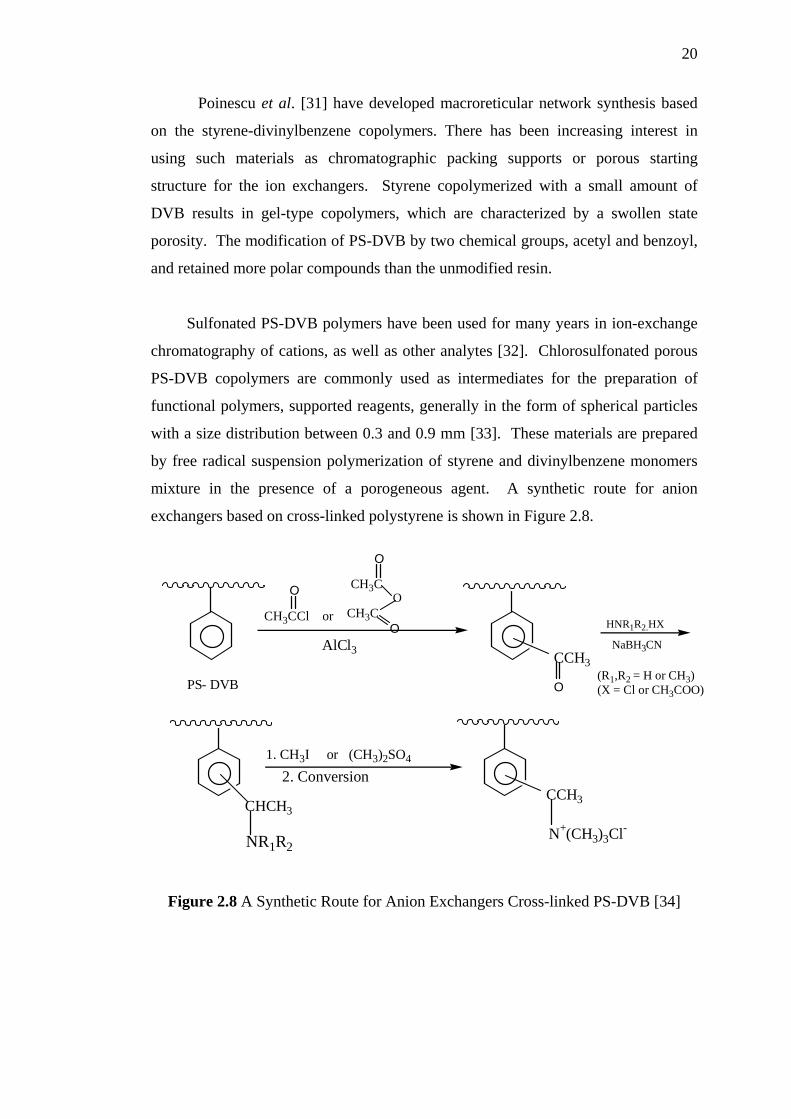
Sulfonated PS-DVB polymers have been used for many years in ion-exchange
chromatography of cations, as well as other analytes [32]. Chlorosulfonated porous
PS-DVB copolymers are commonly used as intermediates for the preparation of
functional polymers, supported reagents, generally in the form of spherical particles
with a size distribution between 0.3 and 0.9 mm [33]. These materials are prepared
by free radical suspension polymerization of styrene and divinylbenzene monomers
mixture in the presence of a porogeneous agent. A synthetic route for anion
exchangers based on cross-linked polystyrene is shown in Figure 2.8.
CH3C
O
OCH3C
O
CCH3
O
NaBH3CNAlCl3
CHCH3
P S- DVB
NR1R2
CCH3
HNR1R2.HX
(R1,R2 = H or CH3)(X = Cl or CH3COO)
1. CH3I or (CH3)2SO4
2. Conversion
CH3CCl or
N+(CH3)3Cl-
O
Figure 2.8 A Synthetic Route for Anion Exchangers Cross-linked PS-DVB [34]
21
Masque et al. [5] have described the application of chemically modified resin
obtained from porous cross-linked PS-DVB phase in the determination of phenolic
compounds in water. The PS-DVB resin was chemically modified by two chemical
groups (acetyl and benzoyl), retained more polar compounds than the unmodified
resin. The unmodified PS-DVB matrix has a total pore volume of 0.69 cm3/g, and
this volume drops to around 0.4 cm3/g for all the modified matrices. Bacquet et al.
[35] described the chlorosulfonation of styrene-divinylbenzene copolymer
characterized by a modification of the textural parameters. The copolymer specific
surface area was initially low, and on chlorosulfonation treatment, decrease to a
value of 1 m2/g, characteristic of unswollen gel type resins. However, no effect of
the chlorosulfonation on the porous volume and particles mean diameter was
observed with varying reaction parameters.
Xu and Xizhang [34] described the application of Friedel-Crafts reaction on
cross-linked polystyrene to prepare acetylated cross-linked polystyrene. The general
procedure is as follows: cross-linked polystyrene, swollen in suitable solvent is
related with acetyl chloride or acetic anhydride in the presence of anhydrous
aluminum, stannic or zinc chloride as catalyst to yield acetylated product. The
solvents could be carbon disulfide, nitrobenzene, dichloromethane, and
dichloroethane. These solutions are not only good swelling agents for cross-linked
polystyrene, but also good carriers of Friedel-Crafts catalysts.
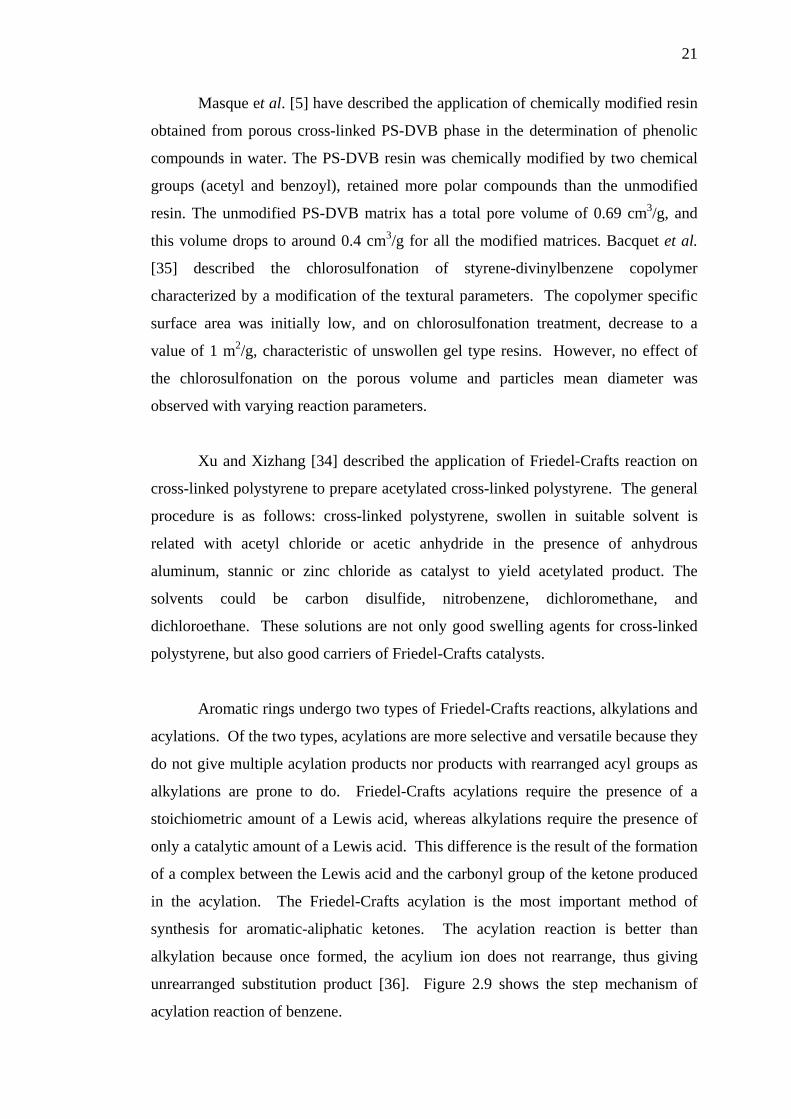
Aromatic rings undergo two types of Friedel-Crafts reactions, alkylations and
acylations. Of the two types, acylations are more selective and versatile because they
do not give multiple acylation products nor products with rearranged acyl groups as
alkylations are prone to do. Friedel-Crafts acylations require the presence of a
stoichiometric amount of a Lewis acid, whereas alkylations require the presence of
only a catalytic amount of a Lewis acid. This difference is the result of the formation
of a complex between the Lewis acid and the carbonyl group of the ketone produced
in the acylation. The Friedel-Crafts acylation is the most important method of
synthesis for aromatic-aliphatic ketones. The acylation reaction is better than
alkylation because once formed, the acylium ion does not rearrange, thus giving
unrearranged substitution product [36]. Figure 2.9 shows the step mechanism of
acylation reaction of benzene.
22
Step 1: The acyl halide reacts with the Lewis acid to form a more electrophilic C, an acylium ion
Step 2: The π electrons of the aromatic C=C act as a nucleophile, attacking the electrophilic C+
. This step destroys the aromaticity giving the cyclohexadienyl cation intermediate.
Step 3: Removal of the proton from the sp3
C bearing the acyl- group reforms the C=C and the aromatic system, generating HCl and regenerating the active catalyst.
Figure 2.9 The Mechanism for the Friedel-Cafts Acylation of Benzene [36]
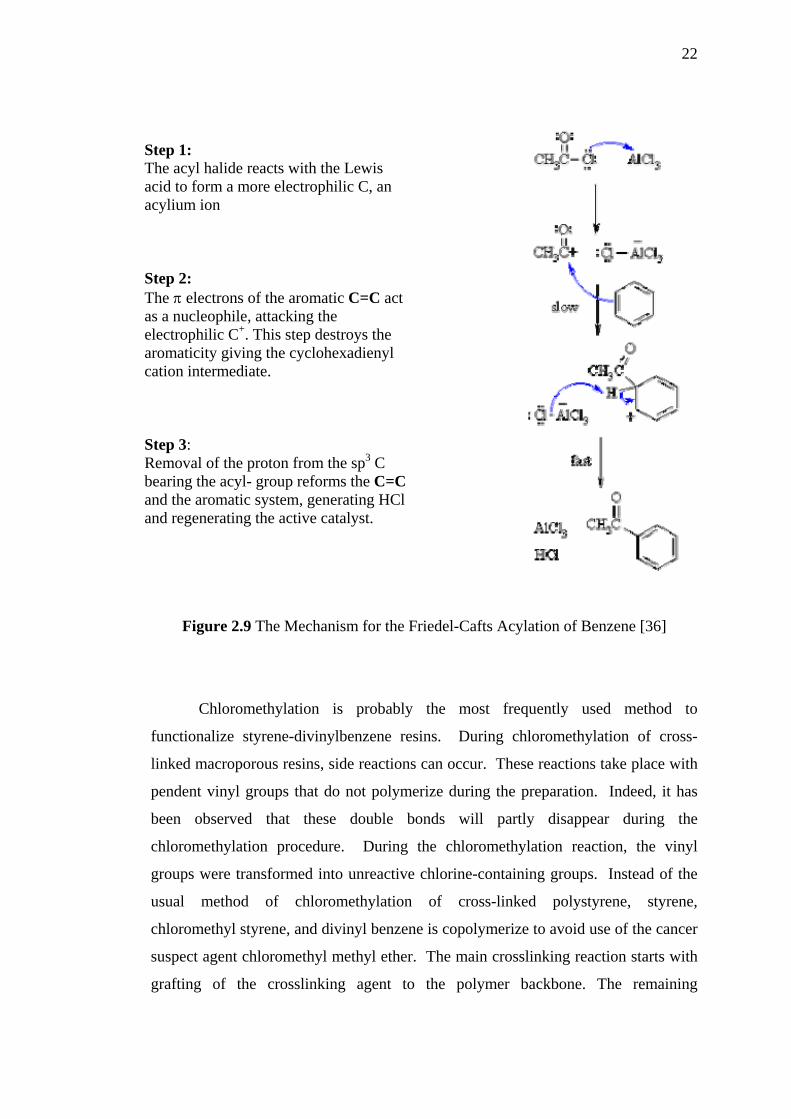
Chloromethylation is probably the most frequently used method to
functionalize styrene-divinylbenzene resins. During chloromethylation of cross-
linked macroporous resins, side reactions can occur. These reactions take place with
pendent vinyl groups that do not polymerize during the preparation. Indeed, it has
been observed that these double bonds will partly disappear during the
chloromethylation procedure. During the chloromethylation reaction, the vinyl
groups were transformed into unreactive chlorine-containing groups. Instead of the
usual method of chloromethylation of cross-linked polystyrene, styrene,
chloromethyl styrene, and divinyl benzene is copolymerize to avoid use of the cancer
suspect agent chloromethyl methyl ether. The main crosslinking reaction starts with
grafting of the crosslinking agent to the polymer backbone. The remaining
23
chloromethyl group can react with a styrene unit of the polymer chain [37-38].
Figure 2.10 shows a mechanism of chloromethylation of PS-DVB.
CH2-CH
CH2-CH-CH2-CH -CH2-CH
CH2-CH-CH2=CH-CH2=CH
CH2-CH
PS-DVB-CH2Cl
CH2=CH
St yrene
+
CH2=CH
CH2=CHDivinylbenzene
BPO
initiator
CH =CH
+
CH2ClChloromethyl styrene
CH2-CH
CH2Cl
CH2-CH
CH2Cl
2
Figure 2.10 The Reaction of Chloromethylation of PS-DVB
Dumont and Fritz [39] have shown that the modification of a XAD-4 and a
spherical PS-DVB resin by incorporating different functional groups into the
polymer has a major effect on the retention activities of various analytes. More
hydrophobic resins have been prepared by the Friedel-Crafts reaction of different
alkylchlorides with the benzene ring of the polymer. In a way, the type of functional
group incorporated in the resin can control the hydrophobicity of the resin. In
contrast to the resin described in the present work, most of the commercially
available polymeric supports for HPLC are generally prepared by suspension
polymerization followed by a size classification procedure.
24
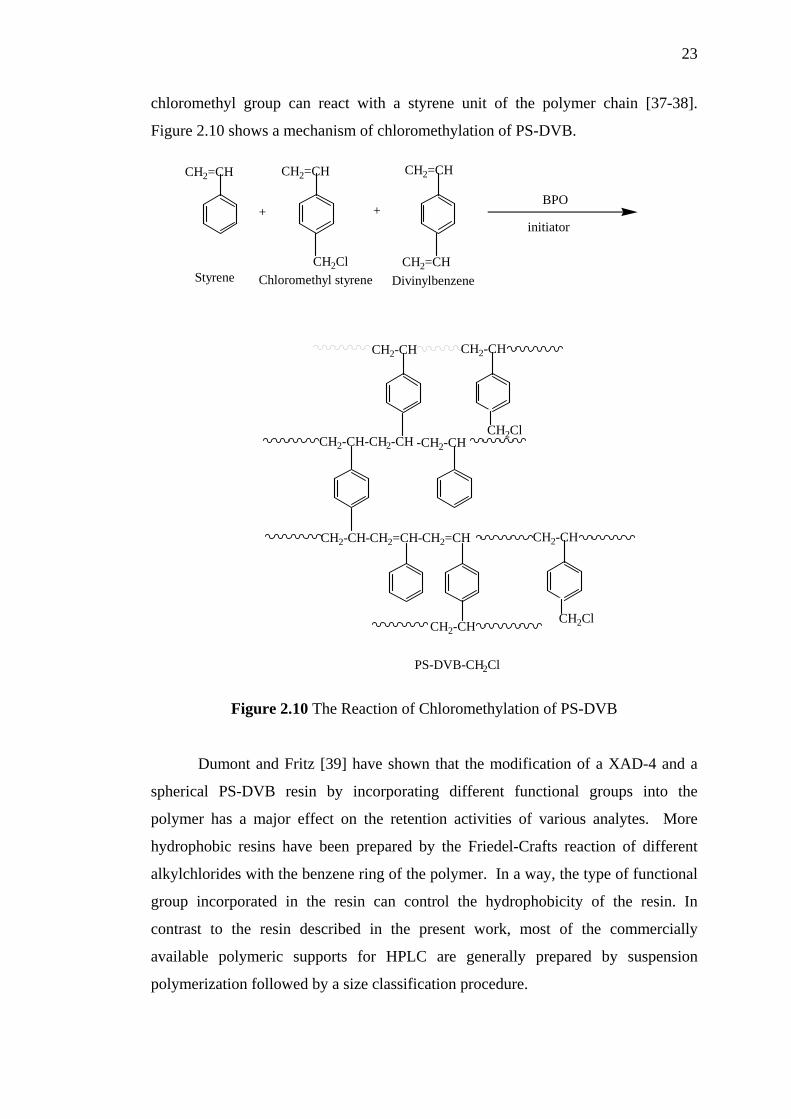
Acylation allows a variety of functionalization to be achieved. These
transformations are normally carried out easily from an acylating agent by means of
the Friedel-Crafts reaction using nitrobenzene as the solvent and aluminum chloride
as the catalyst. In a previous work carried out in the laboratory [40], the stearoyl
chloride as an acylating agent was prepared by conversion of stearic acids with
thionyl chloride, SOCl2. The stearoyl chloride was further used in Friedel-Crafts
acylation (Figure 2.11).
CH2CH PS
+ C17H35
C ClAlCl3
CH2CH PS
C=O
C17H35
O
Figure 2.11 Preparation of Modified PS-DVB by Using Stearoyl Chloride [40]
The reaction progresses rapidly, usually requiring no more than 2 hours. It was
experienced that for reaction times greater than 2 hours, decomposition or
degradation occurred and the total yield markedly decreased. Also it is notable that
the reaction should be performed at ambient temperature to protect the resin from
over swelling and correspondingly crushing [41].
2.4. Application of Modified PS-DVB Resin
Dominic and Howard [42] explained that the polystyrene-divinylbenzene
matrices have been used in chromatography for many years and these matrices can
be operated under high pressures without compression. Chemically modified PS-
DVB resins have also been developed and used in the SPE of polar compounds
mainly from aqueous samples. Masque and Galia [43] described the synthesis and
25
SPE application of a new chemically modified PS-DVB resin for the analysis of
pesticides and phenolic compounds in environmental waters.
A wide range of organic compounds in drinking and surface water could be
adsorbed on a hydroxylated PS-DVB cartridge and then eluted with acetone ethyl
acetate. If the hydroxylated PS-DVB cartridges were eluted with toluene; the polar
interactions were strong enough to retain phythalic acid and monoesters while the
diesters were smoothly desorbed [13].
The use of PS-DVB polymers as an adsorbent material has been demonstrated
to provide improved recoveries for phenolic compounds as compared to the
traditional and more commonly applied C18 material [44]. Fritz and Schmidt shown
that [45] modified porous polystyrene-divinylbenzene resins containing polar groups
are superior for SPE of organic solutes from aqueous samples.
Smigol and Svec [46] reported pore-size specific functionalizations for the
separation of proteins and small hydrocarbons. For that purpose, large polymer
pores were provided with phenyl groups in the presence of hydrophilic groups. In
contrast, small pores were provided with much higher phenyl content.
Since porous polystyrene resins have hydrophobic surface, Sun and Fritz [47]
have proposed the insertion of an acetyl or hydroxymethyl group into porous PS-
DVB to provide a more hydrophilic surface, which can be easily wetted by water
alone. Schmidt et al. [48] explored the result obtained when acetyl-PS-DVB resins
are incorporated into SPE membranes, using them to extract phenols from water.
Powell [44] has studied hydroxymethyl-or-acetyl-PS-DVB for preconcentration of
pollutant compounds. It was found that acetyl resin retained triazines such as
attrazine better than the hydroxymethyl modified material, but recovery of phenol
was very poor.
26
2.5. Octadecyl Silane Bonded Silica (C18-silica)
Silica based stationary phases remain, after several decades of development,
the first choice for most separations. Silica has several limitations. It has low
thermal and pH stability, and the silanol activity of the specific phase must be
considered when a silica-based column is used for the separation of basic analytes.
The silanol activity of a silica-based column originates in the accessible residual
silanol groups present on the surface even after it is chemically modified. The Figure
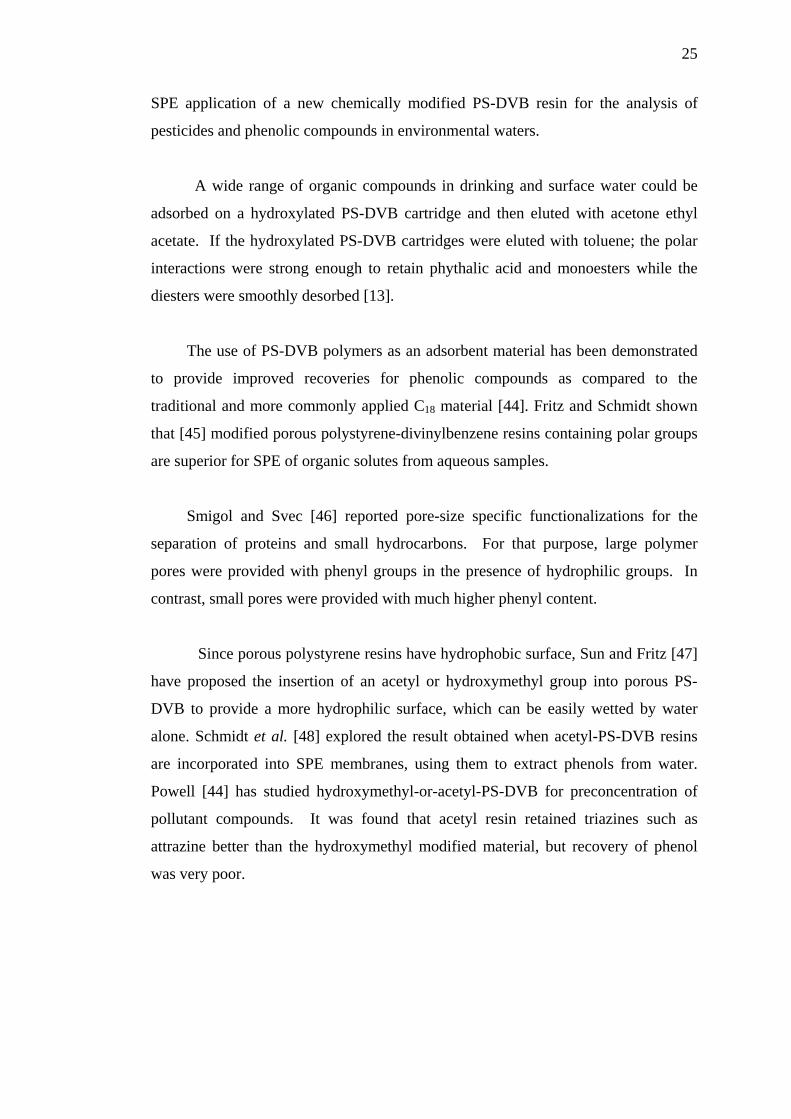
2.12 shows the structure of the octadecyl silane-silica [49].
O Si
CH3
CH3
(CH2)17 CH3
Figure 2.12 The Structure of Octadecyl Silane-Silica
C18-silica is a non-polar SPE sorbent that contains octadecyl (C18) functional
groups bonded to the surface of silica that alter their retentive properties. Modified
silica with C18 reversed-phase sorbent is one of the most widely used packing
materials for SPE because of its greater capacity compared to other bonded silica,
such as the C8 and CN types [3]. The mechanisms of retention are based on
hydrophobic interactions between the solutes and the stationary phase (Van der
Waals forces) and on secondary interactions such as hydrogen bonding and dipole-
dipole forces (hydrophilic or polar interactions) [3, 51, 52]. C18-silica has a non-polar
characteristic due to the octadecyl groups on the surface and the silanol groups
present allows the polar and ionic secondary interactions between the adsorbent and
the solutes [53].
Numerous applications report the use of C18-silica, as indicated by the studies
reported for water. In particular, organometallic compounds can be retained on this
sorbent due to possible hydrophobic interactions. Bare C18-silica can also retain a
fraction of inorganic trace elements, probably due to the presence of silanol groups
on its surface [50].
27
2.6. Materials and Methods for Solid-Phase Extraction (SPE)
Solid-phase extraction (SPE) with porous solid particles goes back to the early
1970’s. However, SPE has become more popular recently due the need to replace
liquid extraction procedures, which use large quantities of organic solvents.
Considerable attention is now being paid to solid-phase extraction (SPE) as a way to
isolate and preconcentrate desired components from a sample matrix. In addition to
being fast, efficient and easily automated, SPE is a clean analytical procedure. In
SPE the extractant is a porous, particulate solid which has a large surface area
available for interaction with the liquid sample solution [54].
Fritz and Masso [55] found that one problem with extraction materials is the
inability of aqueous solutions to adequately wet their surface, which is usually
hydrophobic. This is true for both C18-silica and underivatized polystyrene-
divinylbenzene resin. Pretreatment of the resin column or cartridge with methanol is
usually necessary to obtain better surface contact with the aqueous solution. Fritz et
al. [56] explained that SPE is fast and effective, and can provide concentration
factors of 100-fold or more. Solid phase extraction has become the preferred
technique for sample pre concentration. Being a multistage method, it is more
efficient than simple liquid-liquid extraction, more easily automated and much less
polluting than liquid extraction techniques that often use relatively larges volumes of
organic solvent. Very little chemical waste is produced. In general, polymeric
sorbents such as PS-DVB retain organic analytes more strongly than silica-based
materials.
SPE can be divided into two major categories:
Type I: Single-equilibrium methods in which each analyte partitions between a
liquid or gaseous sample and a solid extractant. The type I methods often
give a lower but fixed percentage extraction. SPE type I methods are usually
done on micro scale (solid phase micro extraction, SPME).
Type II: Multi-equilibrium methods in which the sample flows through a bed of a
solid extractant. Since a typical device may contain 20 or more theoretical
plates, retention of analytes is generally more complete than with single-
28
equilibrium methods. Type II methods usually give nearly complete
extraction of the desired analytes. A current challenge is to do type II
extractions quickly and efficiently on a smaller scale, the bed of solid
extractant must also be made smaller [55].
The particle size also needs to be made smaller to speed up the rate of mass
transfer of analytes from the liquid samples to the solid extractant. Perhaps the best
way to accomplish this is to use a resin-loaded membrane such as the 3M Empore
series. However, it is important to have intimate contact between the predominately
aqueous samples and the surfaces of the solid extractant particles.
When SPE has to be carried out in extremely acidic or basic media, reversed-
phase polymeric sorbents (generally based on PS-DVB) are used. In addition to their
broader pH-stability range that increases the flexibility of the methods, these kinds of
sorbents have a greater surface area per gram and they show relatively selective for
analytes with aromatic ring because of the specific π-π interactions. In an attempt to
improve the efficiency of SPE procedures, materials based on polymers other than
PS-DVB have been tested. One important parameter to be taken into account in SPE
is the selectivity of the stationary phases, especially when compounds are to be
extracted from complex matrices, since the man objective is to remove interferences
prior to the analysis. SPE materials based on silica and polystyrene-divinylbenzene
stationary phases are generally non-selective and can lead to difficulties with
interference co-extracted. [3].
SPE method always consists of the three to four successive steps, as
illustrated in Figure 2.13 [50]. First, the solid sorbent should be conditioned using an
appropriate solvent, followed by the same solvent as the sample solvent. This step is
crucial, as it enables the wetting of the packing material and the solvation of the
functional groups. The second step is the percolation of the sample through the solid
sorbent. Depending on the system used, volumes can range from 1 mL to 1 L. The
third step (which is optional) may be the washing of the solid sorbent with an
appropriate solvent, having low elution strength, eliminate matrix components that
have been retained by the solid sorbent, without displacing the analytes. The final
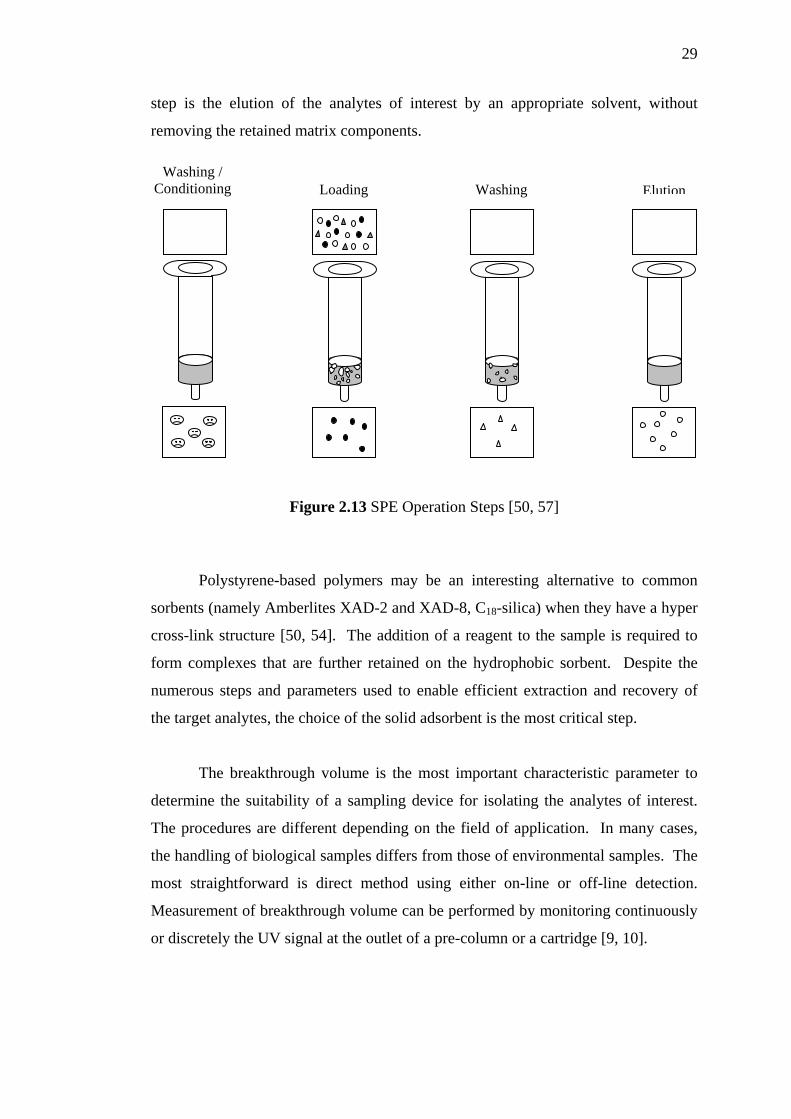
29
step is the elution of the analytes of interest by an appropriate solvent, without
removing the retained matrix components.
Loading Washing /
Conditioning Washing Elution
Figure 2.13 SPE Operation Steps [50, 57]
Polystyrene-based polymers may be an interesting alternative to common
sorbents (namely Amberlites XAD-2 and XAD-8, C18-silica) when they have a hyper
cross-link structure [50, 54]. The addition of a reagent to the sample is required to
form complexes that are further retained on the hydrophobic sorbent. Despite the
numerous steps and parameters used to enable efficient extraction and recovery of
the target analytes, the choice of the solid adsorbent is the most critical step.
The breakthrough volume is the most important characteristic parameter to
determine the suitability of a sampling device for isolating the analytes of interest.
The procedures are different depending on the field of application. In many cases,
the handling of biological samples differs from those of environmental samples. The
most straightforward is direct method using either on-line or off-line detection.
Measurement of breakthrough volume can be performed by monitoring continuously
or discretely the UV signal at the outlet of a pre-column or a cartridge [9, 10].
CHAPTER 3
METHODOLOGIES
This chapter discusses about materials and procedures used in the preparation
of PS-DVB, and modification of PS-DVB by Friedel-Crafts acylation, chloro-
methylation, and Williamson ether reaction.
3.1 Materials and Reagents
The following materials were used in the preparation PS-DVB, and
modification of PS-DVB.
Styrene Monomer
The styrene monomer used in this research was from Fluka Chemika
(Switzerland) (99%, stabilized with 0.005% 4-tert-butylcatecol). The styrene
monomer was washed consecutively with 10% sodium hydroxide (50 mL × 3) and
distilled water (50 mL × 3) prior to use.
31
Divinylbenzene
Technical-grade divinylbenzene (DVB) used as the crosslinker in laboratory
grade (70-85%) stabilized with 0.2% 4-tert-butylcatecol obtained from Merck
(Schuchardt, Germany) and Fluka Chemika. The DVB was purified with 10%
sodium hydroxide (50 mL × 3) and distilled water (50 mL × 3) before use. The
procedure was carried out for each PS-DVB synthesis.
Benzoyl Peroxide
Benzoyl peroxide (BPO) used as initiator for the PS-DVB synthesis was from
BDH. The BPO was purified by washing with chloroform and poured into cold
methanol and filtered with sintered funnel. The product was stored in a refrigerator
at 4οC. The average molecular weight of the BPO used was 130.19 g/mol; its density
was 0.919 g/mL.
Stabilizers
Polyvinyl alcohol (PVA) and polyvinyl pyrrolidone (PVP) were used as the
stabilizer in this work. Each stabilizer was dissolved in distilled water before use.
The PVA, with an average molecular weight of 125,000 g/mol was obtained from
Merck (Schuchardt, Germany) and Fluka Chemika (Switzerland).
Stearoyl chloride
Stearoyl chloride (CH3(CH2)16COCl) used in this research has an average
molecular weight of 302.93 g/mol, and density of 0.908 g/mL. It was obtained from
Merck (Schuchardt, Germany) and Fluka Chemika (Switzerland).
Chloromethyl-styrene (4-vinylbenzyl chloride)
Chloromethyl styrene (H2C=CHC6H4CH2Cl) used in this research has an
average molecular weight of 152.62 g/mol, and density of 1.083 g/mL. It was
obtained from Merck (Schuchardt, Germany) and Fluka Chemika (Switzerland).
32
1-Octadecanol (octadecyl alcohol)
1-Octadecanol (CH3(CH2)17OH) used in this research has a molecular weight
of 270.50 g/mol, and melting point of 56-58oC. It was obtained from Merck
(Schuchardt, Germany) and Fluka Chemika (Switzerland).
Nitrobenzene
Nitrobenzene (C6H5NO2) used in this research has an average molecular
weight of 123.11 g/mol, and boiling point of 83-84oC. It was obtained from Merck
(Schuchardt, Germany).
2-Chlorophenol
2-Chlorophenol (C6H5ClO) used in this research has an average molecular
weight of 128.56 g/mol, and boiling point of 62-63oC. It was obtained from Fluka
Chemika (Switzerland).
Methanol
Methanol used in this research was obtained from Merck (Schuchardt,
Germany).
p-Cresol
p-Cresol used was technical grade, obtained from Riedel-de-Haën
(Switzerland).
Benzaldehyde
Benzaldehyde used was technical grade, obtained from Riedel-de-Haën
(Switzerland).
33
Butyrophenone
Butyrophenone used was technical grade, obtained from Fluka Chemika
(Switzerland).
3.2 Synthesis
3.2.1 Preparation of PS-DVB and Its Derivatives
The PS-DVB synthesis was carried out in a reactor equipped with a
mechanical stirrer, thermometer, nitrogen purge inlet, oil bath and the temperature
set at 70οC (Fig.3.1). Poly vinyl alcohol (PVA) (1.0 g) and deionized distilled water
(500 mL) were added to the reactor and stirred until dissolution was complete. The
above solution was diluted to 500 mL. After the solution temperature reached 70°C
(isothermal conditions), the reactor was purged with nitrogen gas. Divinyl benzene
(9.6 g), styrene (120 g) (8% by weight) and benzoyl peroxide (1.2 g) were premixed
and added to the reactor. The reaction mixture was mechanically stirred for 15 h,
and the speed of stirrer was at 900 rpm. It was then filtered off, washed with distilled
water and dried. The beads obtained were sieved to separate the 200-400 mesh
portions (75-38 μm). This part was suspended in 10% aqueous solution of HCl (v/v)
and stirred for 1 h at 50°C. Then it was filtered, washed with distilled water and
dried at 80°C for 12 h. The yield was 129.70 g (99.16%) as white powder; IR υmax
(KBr) cm-1: 1598.9 (m, C=C aromatic), 751.2 (s, monosubstituted benzene), 696.2 (s,
monosubstituted benzene).
34
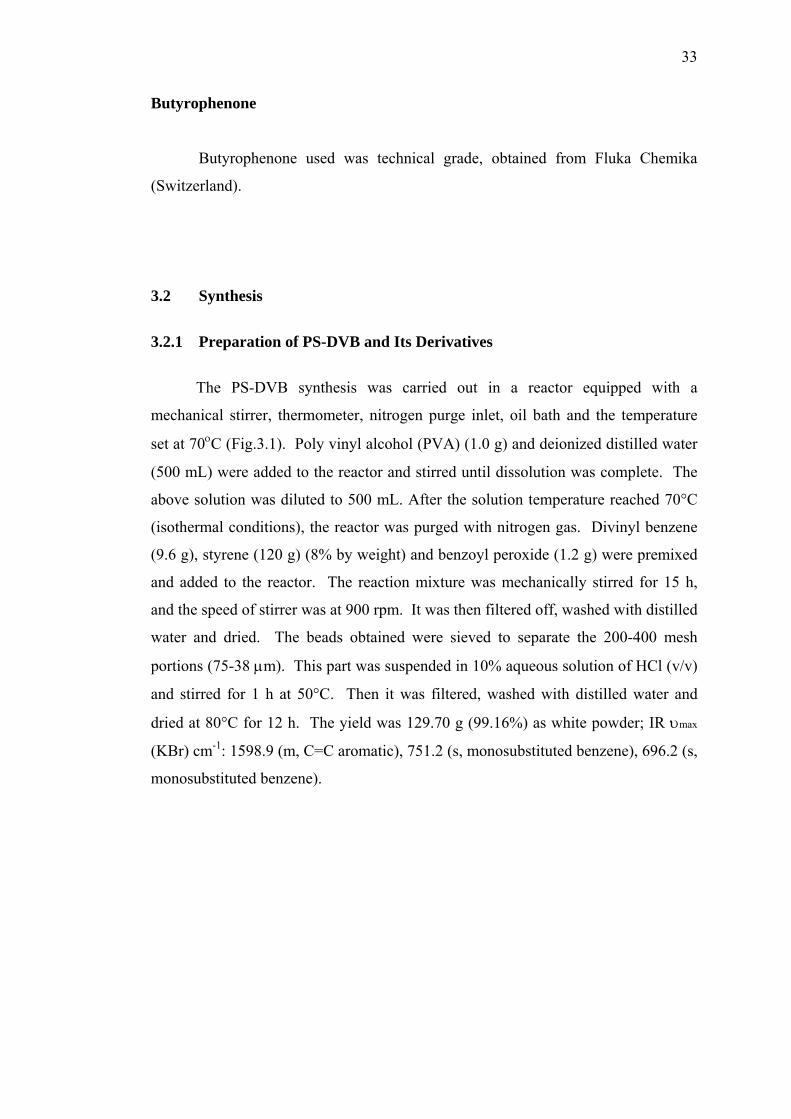
Figure 3.1 Reactor for Polymerization of PS-DVB
3.2.2 Friedel-Crafts Acylation of PS-DVB by Using Stearoyl Chloride
Stearoyl chloride (1.10 mL) was dissolved in 1,2-dichloroethane (24 mL) in a
round-bottomed flask (250 mL) at room temperature. The temperature of the
solution was lowered to 0oC in an ice bath, and purged with nitrogen gas. PS-DVB
powder (2.04 g) was gradually added to the above acid chloride solution while
stirring magnetically at 0oC. At the end of addition, it was allowed to stir for 30 min
at this temperature and then AlCl3 (1.92 g) portion was added to this mixture. After
60 min of stirring at 0oC, the temperature of the reaction was raised to room
temperature. The reaction was carried out overnight. The mixture was then filtered
off and the solid was washed according to the following procedure: (i) 10% aqueous
solution of HCl (v/v) (5 × 20 mL); (ii) 10% aqueous solution of NaOH (w/v) (5 × 20
mL); and (iii) distilled water (5 × 20 mL). The yield of brown powder was 12.56 g
(44.10%); IR υmax (KBr) cm-1: 1677.90 (w, C=O stretching), and 1603.7 (w, C=O
stretching).
35
3.2.3 Chloromethylation of PS-DVB
The poly vinyl alcohol (PVA) (1.0 g) and deionized distilled water (500 mL)
were added to the reactor equipped with a mechanical stirrer, thermometer, nitrogen
purge inlet, and oil bath. The temperature of the mixture was set at 70°C and stirred
until dissolution was completed. After the solution temperature reached 70°C
(isothermal conditions), the reactor was purged with nitrogen gas. Divinyl benzene
(12.16 mL), styrene (69.12 mL), chloromethyl styrene (24.20 mL) and benzoyl
peroxide (1.2 g) were premixed and added to the reactor. The reaction mixture was
mechanically stirred for 15 h, and the speed of stirrer was 900 rpm. The mixture was
filtered and the solid was washed with distilled water and dried at 80°C for 12 h to
yield a white powder (74.73 g, 70.85%); IR υmax (KBr) cm-1: 758.0 (s, C-Cl
stretching), and 698.2 (s, C-Cl stretching).
3.2.4 Preparation of Benzyl Hexyl Ether as a Reaction Model
Dried hexanol (25 mL) was placed in a round-bottomed flask (250 mL) fitted
with a Liebig-type reflux condenser. Clean sodium (0.575 g) in small pieces was
added to hexanol and warmed under reflux until all the sodium has reacted (2 h).
The reaction was allowed to proceed overnight, by which time all the sodium will
have reacted. Benzyl chloride (5 g) was added to the flask and the mixture brought to
reflux gently for 2 h. The crude ether was distilled off and most of the hexanol still
present in the crude ether was removed by heating under reflux for 2 h with a large
excess of sodium and distilled until no more liquid passes over. The residue was
benzyl hexyl ether (3.54 g, 13.32%) in the form of a yellow powder; IR υmax (KBr)
cm-1: 1614.3 (m, C=C stretching phenyl), 1562.2 (s, C=C aromatic), 1452.3 (s, C=C
aromatic), and 1107.1 (w, C-O ether).
36
3.2.5 Preparation of Octadecoxy Methyl PS-DVB (PS-DVB-CH2-O-C18H37)
1-Octadecanol (204 g) in dried toluene (250 mL) was placed in a round-
bottomed flask (500 mL) fitted with a Liebig-type reflux condenser and clean sodium
(5.75 g) in small pieces was warmed under reflux until all the sodium has reacted (2
h). The reaction was allowed to proceed overnight, by which time all the sodium had
reacted. The p-chloromethyl PS-DVB (39 g) (20 mL) was distilled to get the crude
ether (product). The crude ether was again distilled to remove most of toluene and
benzene a large excess of sodium until no more liquid passes over. The PS-DVB-
CH2-O-C18H37 was collected and excess of CH3 (CH2)17ONa was removed by
dissolving and heating in toluene. Then the crude ether was filtered, and dried under
vacuum. The residue was octadecoxy methyl PS-DVB (2.46 g, 1.23%) g; IR υmax
(KBr) cm-1: 1562.2 (m, C=C aromatic), 1467.7 (m, C=C aromatic), and 1058.8 (w,
C-O ether).
3.3 Characterizations
The products obtained in this research were characterized as follows:
A. The Fourier transform infrared (FTIR) spectra of the polymer were recorded
with a Shimadzu-8300 spectrometer (Kyoto, Japan) in the range of 4000-400 cm-1.
Small amounts of potassium bromide (KBr) and polymer samples were mixed with a
ground mortar and pestle. The mixture was placed in the mini press, and the screws
were tightened to squeeze the KBr and polymer mixture into a thin, semi-transparent
disk. The mini-press containing the disks was then placed into FTIR instrument and
an infrared laser was passed through the disk at a different wavelengths.
B. The shape and surface texture of the particles have been monitored by
observation with a scanning electron microscope (SEM) (Philips XL-40). The sample
was done by grinding into fine powder before adhering them onto a flat surfaced of
an aluminum sample stub that was stuck with a double-sided carbon tape. The
doubled-sided carbon tape was used to eliminate any possible discharged of powder
37
sample from the surface of the sample stub while scanning was done. The sample
studied comprise of commercial sample, thus may need to be coated with gold before
SEM investigation. The sprinkled sample was placed in a Bio Rad SEM coating
system apparatus to be coated with gold using a gold spulter at 10-1 Mbar. The
purpose of the coating is to ensure that the sample is able to withstand electron
bombardment without causing any charging effect. In order to see the morphology of
the sample, a Philip XL40 microscope was used with the energy 15.0 kV couple with
EDX analyzer. The sample was bombarded using an electron gun with a tungsten
filament under 25kV resolution to get the required magnification image.
C. The pore size and surface area of copolymers samples (specific surface area,
in m2/g ) were determined by BJH (Barrer, Joiyner and Halenda) and BET
(Brunauer, Emmet and Teller) methods from low temperature nitrogen adsorption
isotherms after degassing at 60oC / l. m. Pa for 3 hours on a micromeritic apparatus
(ASAP 2010, USA). Micrometrics ASAP 2010 instrument was used for the nitrogen
adsorption analysis at temperature -196 oC (boiling temperature of liquid nitrogen) in
order to determine the catalyst surface area and porosity. The sample, weighed at 0.5
g was out gassed at 120ºC for 5 hours and left under vacuum to cool to room
temperature before measurement. The adsorption-desorption process was done
automatically under nitrogen and took a few hours for the whole process to complete
depending on the types of sample.
D. The thermal gravimetric analyzer (TGA) was conducted using a Mettler
Toledo Thermal analyzer (TC-15). The TA controller in air was set at a rate of
12οC/min within a temperature range of 100-800οC. Thermogravimetric analysis
(TGA) suspends a sample on a highly sensitive balance over a precisely controlled
furnace. Usually heating rates of 10-20°C/min are used to look for broad
decomposition stages, while slower heating rates around 1°C/min are better for
isolating individual events. Decomposition in air indicates the processes, which may
occur before ignition, while their absence or delay under nitrogen is indicative of a
condensed phase decomposition mechanism. Sample sizes are usually kept as small
as possible; within the limits of the apparatus this is usually around 5 mg per run.
38
3.4 Solution Preparations
3.4.1 Stock Solution Preparation
Stock solutions of test compounds (100,000 ppm) were prepared by weighing
benzaldehyde (2.5 g), butyrophenone (2.5 g), 2-chlorophenol (2.5 g), p-cresol (2.5 g)
and nitrobenzene (2.5 g) separately in five 25-mL volumetric flasks and each
compound was dissolved and diluted in methanol to 25 mL. Butyrophenone was
used as the internal standard.
3.4.2 Sample Aqueous Solution Preparation
The aqueous sample solution for SPE containing individual test compounds
were prepared by adding stock solutions (each 100,000 ppm) of benzaldehyde (0.1
mL), p-cresol (0.1 mL), 2-chlorophenol (0.1 mL) and nitrobenzene (0.1 mL) into
four separate 10-mL volumetric flasks, respectively and each solution was then
diluted to 10 mL with deionized water. Thus, the aqueous sample solution prepared
contained 1% (v/v) of methanol and the concentrate of each compounds in 1000
ppm. An aqueous solution containing a mixture of the four test compounds were
prepared by adding benzaldehyde stock solution (0.1 mL), p-cresol stock solution
(0.1 mL), 2-chlorophenol stock solution (0.1 mL) and nitrobenzene stock solution
(0.1 mL) into a 10 mL volumetric flask and then diluted to the mark with deionized
water. Therefore, the solution contained 4% (v/v) of methanol. The concentration of
each test compounds in 1000 ppm.
3.4.3 Sample for GC Peak Identification
For the peak identification purpose, a mixture solution was prepared by
adding 0.1 mL of each stock solution into a 5-mL volumetric flask and then diluted
to 5 mL with methanol to give 2000 ppm of each compound. 1 μL of this mixture
was injected into the gas chromatograph.
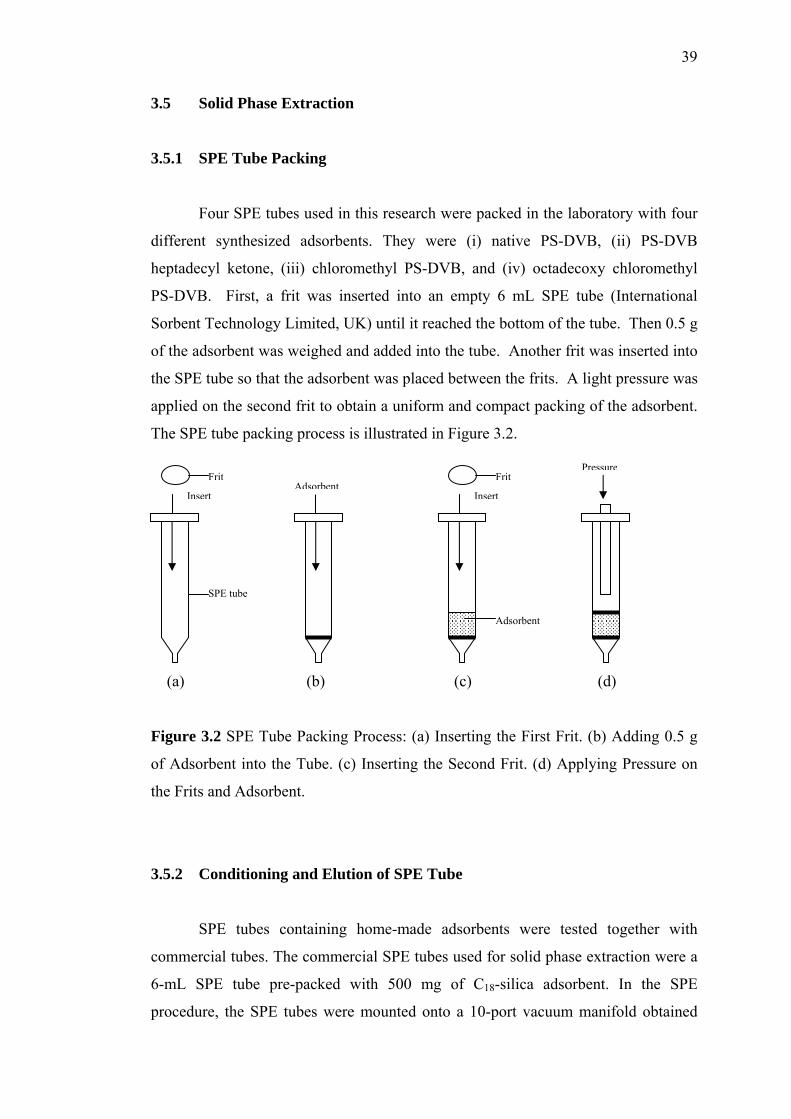
39
3.5 Solid Phase Extraction
3.5.1 SPE Tube Packing
Four SPE tubes used in this research were packed in the laboratory with four
different synthesized adsorbents. They were (i) native PS-DVB, (ii) PS-DVB
heptadecyl ketone, (iii) chloromethyl PS-DVB, and (iv) octadecoxy chloromethyl
PS-DVB. First, a frit was inserted into an empty 6 mL SPE tube (International
Sorbent Technology Limited, UK) until it reached the bottom of the tube. Then 0.5 g
of the adsorbent was weighed and added into the tube. Another frit was inserted into
the SPE tube so that the adsorbent was placed between the frits. A light pressure was
applied on the second frit to obtain a uniform and compact packing of the adsorbent.
The SPE tube packing process is illustrated in Figure 3.2.
Adsorbent
SPE tube
Frit
Insert
Adsorbent
Frit
Insert
Pressure
(a) (b) (c) (d)
Figure 3.2 SPE Tube Packing Process: (a) Inserting the First Frit. (b) Adding 0.5 g
of Adsorbent into the Tube. (c) Inserting the Second Frit. (d) Applying Pressure on
the Frits and Adsorbent.
3.5.2 Conditioning and Elution of SPE Tube
SPE tubes containing home-made adsorbents were tested together with
commercial tubes. The commercial SPE tubes used for solid phase extraction were a
6-mL SPE tube pre-packed with 500 mg of C18-silica adsorbent. In the SPE
procedure, the SPE tubes were mounted onto a 10-port vacuum manifold obtained
40
from Vac-Master (International Sorbent Technology), connected to an EYELA A-3S
Aspirator (Tokyo Rikakikai Co. Limited, Japan). Regulating the air pressure release
valve controlled the flow rate of the sample solution.
Five SPE tubes used in this research were (i) C18-silica adsorbent, (ii) PS-
DVB adsorbent, (iii) PS-DVB heptadecyl ketone adsorbent, (iv) chloromethyl PS-
DVB adsorbent, and (v) octadecoxy methyl PS-DVB. These tubes were connected on
a 10-port vacuum manifold that was connected to a water aspirator. Centrifuge tubes
were placed beneath the SPE tubes inside the vacuum manifold to collect the eluate.
Before use, the SPE tubes were rinsed with 12 mL of methanol to remove
impurities, and then dried (by vacuum suction). They were then conditioned with 2
mL of methanol to serve as an “activating” solvent and left to soak for 2 minutes
before methanol was drawn off. The aqueous sample solution (10 mL) was sucked
through the tube by vacuum manifold, connected by a water aspirator, with the
vacuum adjusted to give a flow rate of 1 mL/min. After passage of the aqueous
sample, the tube was then rinsed with 2 mL of deionised water to remove impurities
and was dried by vacuum suction for a few minutes. Elution was performed with
four 1 mL portions of methanol. The eluate was collected into a centrifuge tube.
The internal standard (0.05 mL) (butyrophenone) (100,000 ppm) was added into the
centrifuge tube and the eluate was made up to 5 mL with methanol. All the eluates
were stored in the freezer before injection into the gas chromatography. This SPE
process was repeated twice to obtain three replicates runs. Figure 3.3 shows the solid
phase extraction process.
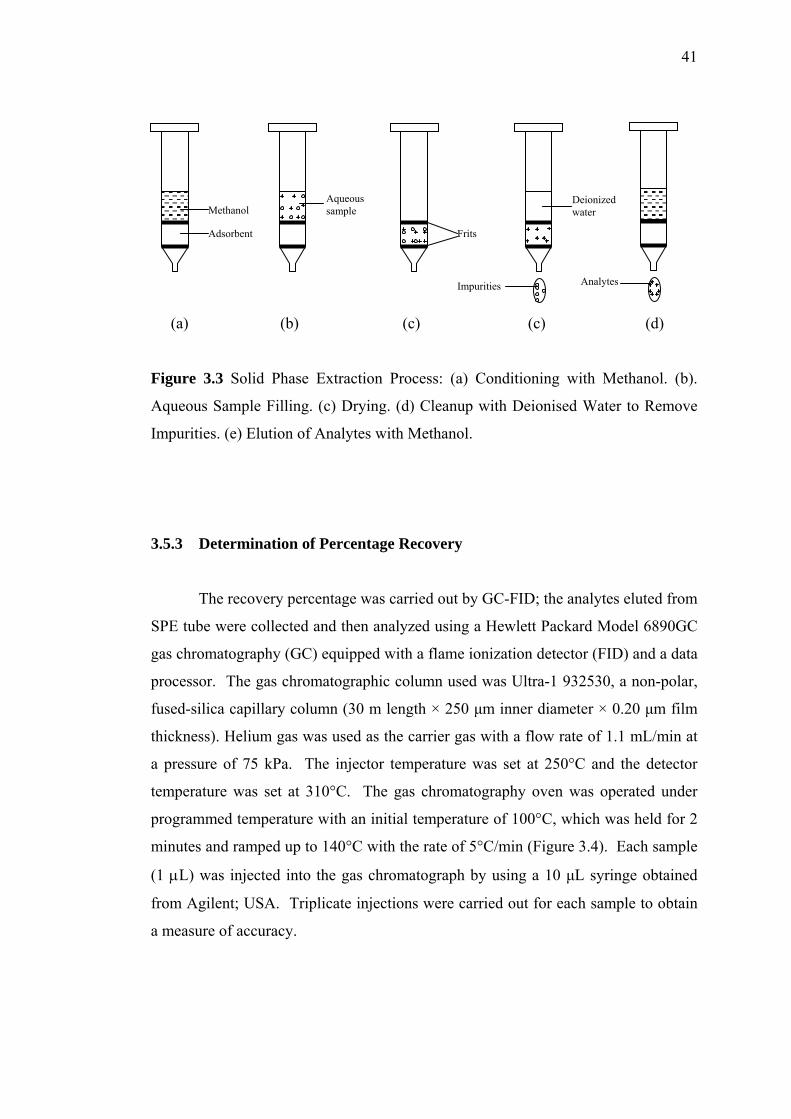
41
Methanol
Adsorbent
Aqueous sample
Frits
Impurities Analytes
Deionized water
(a) (b) (c) (c) (d)
Figure 3.3 Solid Phase Extraction Process: (a) Conditioning with Methanol. (b).
Aqueous Sample Filling. (c) Drying. (d) Cleanup with Deionised Water to Remove
Impurities. (e) Elution of Analytes with Methanol.
3.5.3 Determination of Percentage Recovery
The recovery percentage was carried out by GC-FID; the analytes eluted from
SPE tube were collected and then analyzed using a Hewlett Packard Model 6890GC
gas chromatography (GC) equipped with a flame ionization detector (FID) and a data
processor. The gas chromatographic column used was Ultra-1 932530, a non-polar,
fused-silica capillary column (30 m length × 250 μm inner diameter × 0.20 μm film
thickness). Helium gas was used as the carrier gas with a flow rate of 1.1 mL/min at
a pressure of 75 kPa. The injector temperature was set at 250°C and the detector
temperature was set at 310°C. The gas chromatography oven was operated under
programmed temperature with an initial temperature of 100°C, which was held for 2
minutes and ramped up to 140°C with the rate of 5°C/min (Figure 3.4). Each sample
(1 μL) was injected into the gas chromatograph by using a 10 μL syringe obtained
from Agilent; USA. Triplicate injections were carried out for each sample to obtain
a measure of accuracy.
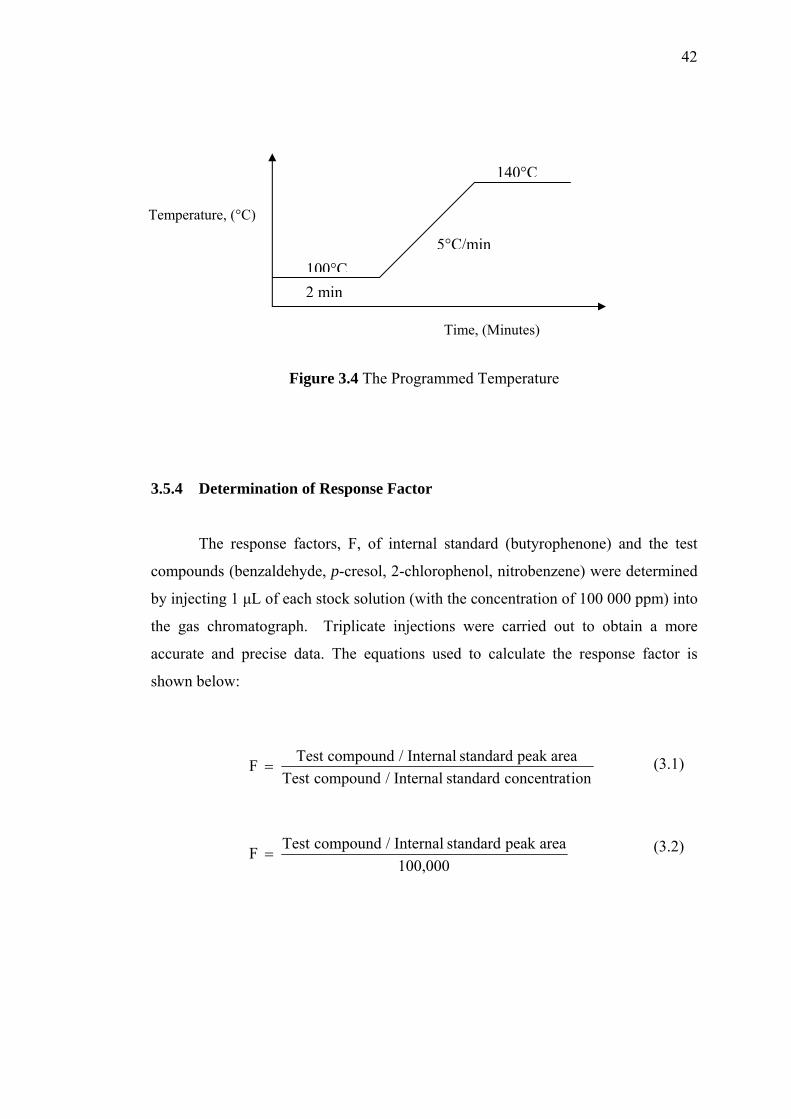
42
ionconcentratstandardInternal / compoundTestareapeak standard Internal / compoundTest F =
000,100areapeakstandardInternal / compoundTest F =
Figure 3.4 The Programmed Temperature
3.5.4 Determination of Response Factor
The response factors, F, of internal standard (butyrophenone) and the test
compounds (benzaldehyde, p-cresol, 2-chlorophenol, nitrobenzene) were determined
by injecting 1 μL of each stock solution (with the concentration of 100 000 ppm) into
the gas chromatograph. Triplicate injections were carried out to obtain a more
accurate and precise data. The equations used to calculate the response factor is
shown below:
(3.1)
(3.2)
Temperature, (°C)
5°C/min
2 min100°C
140°C
Time, (Minutes)
43
3.5.5 Determination of Concentration and Recovery Values of Test
Compounds
The concentration of each test compound was calculated using the response
factor obtained previously as shown below.
SS
X
X
SX M ion,Concentrat
AA
FF M ion,Concentrat ××= (3.3)
MX = Test compound concentration (ppm)
MS = Internal standard concentration (ppm)
FS = Internal standard response factor
FX = Test compound response factor
AS = Internal standard peak area
AX = Test compound peak area
The equations for calculating the recovery values are as follows:
FactorDilution % 100 extraction beforeion concentrat sSample'
M Recovery % X ××= (3.4)
50 % 100
100,000M Recovery % X ××= (3.5)
extraction before volumescompound'Test extractionafter volumescompound'Test Factor tion =
Dilu (3.6)
50 mL0.1mL 5.0 Factor Dilution ==
(3.7)
Dilution factor for internal standard is:
100 mL0.05
mL 5.0 Factor Dilution == (3.8)
44
3.5.6 Hypothesis Test
Hypothesis test was carried out to prove whether there is a significant
difference among the data obtained. Here, t-test was carried out as the hypothesis
test where the population variance, σ12 and σ2
2 was unknown and assumed
difference, σ12 ≠ σ2
2 and the size of sample, n1 and n2 is small (n1 < 30, n2 < 30).
Null hypothesis, H0 = μ1 - μ2 = μο = 0
Alternative hypothesis, H1 = μ1 - μ2 > 0
Level of significance, α = 0.05
2
22021
test ss - - =
XXt μ (3.9)
2
1
1
n
n+
1 - nns
1 - n
ns
nn freedom, of ee 22
21⎜⎝ ⎠
=v (3.10)
s
Degr
2
2
22
1
1
21
222
⎟⎟⎠
⎞⎜⎜⎝
⎛
+⎟⎟⎠
⎞⎜⎜⎝
⎛
⎟⎟⎞
+s21⎜
⎛
μ1 - μ2 = Difference between two population’s mean
X1 = Mean for Sample 1
X2 = Mean for Sample 2
s1 = Standard deviation for Sample 1
s2 = Standard deviation for Sample 2
n1 = Numbers of data in Sample 1
n2 = Numbers of data in Sample 2
ν = Degree of freedom
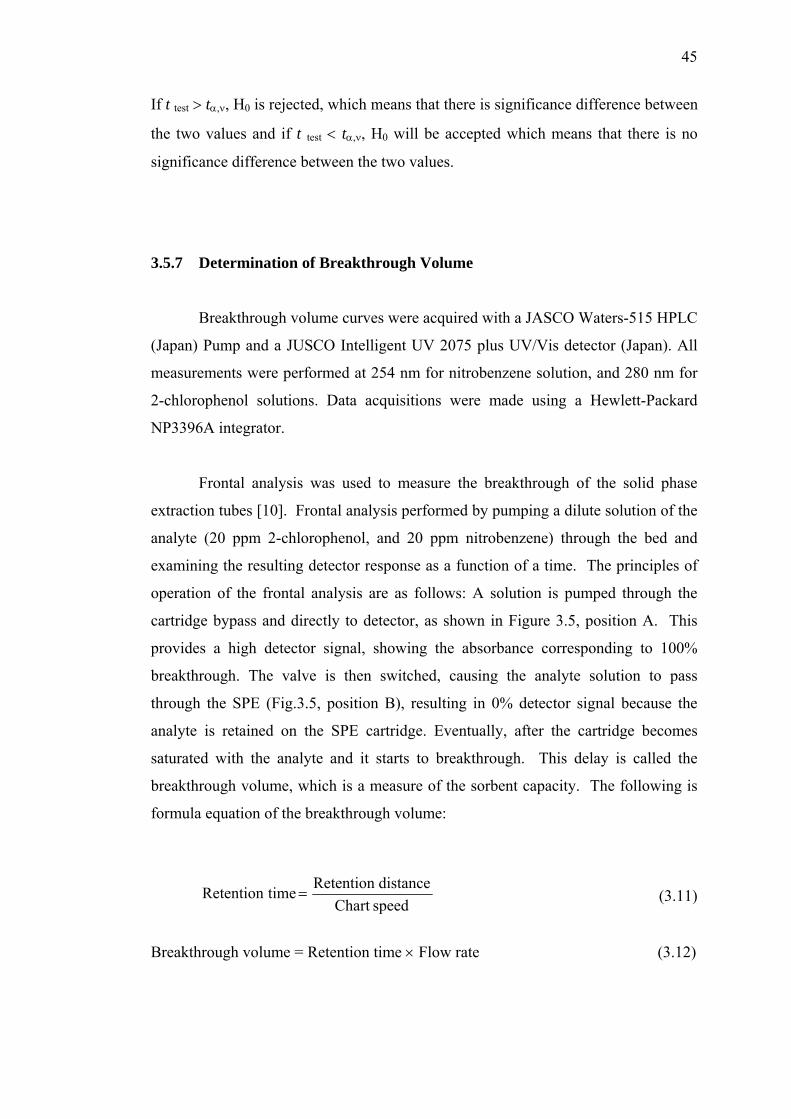
45
If t test > tα,ν, H0 is rejected, which means that there is significance difference between
the two values and if t test < tα,ν, H0 will be accepted which means that there is no
significance difference between the two values.
3.5.7 Determination of Breakthrough Volume
Breakthrough volume curves were acquired with a JASCO Waters-515 HPLC
(Japan) Pump and a JUSCO Intelligent UV 2075 plus UV/Vis detector (Japan). All
measurements were performed at 254 nm for nitrobenzene solution, and 280 nm for
2-chlorophenol solutions. Data acquisitions were made using a Hewlett-Packard
NP3396A integrator.
Frontal analysis was used to measure the breakthrough of the solid phase
extraction tubes [10]. Frontal analysis performed by pumping a dilute solution of the
analyte (20 ppm 2-chlorophenol, and 20 ppm nitrobenzene) through the bed and
examining the resulting detector response as a function of a time. The principles of
operation of the frontal analysis are as follows: A solution is pumped through the
cartridge bypass and directly to detector, as shown in Figure 3.5, position A. This
provides a high detector signal, showing the absorbance corresponding to 100%
breakthrough. The valve is then switched, causing the analyte solution to pass
through the SPE (Fig.3.5, position B), resulting in 0% detector signal because the
analyte is retained on the SPE cartridge. Eventually, after the cartridge becomes
saturated with the analyte and it starts to breakthrough. This delay is called the
breakthrough volume, which is a measure of the sorbent capacity. The following is
formula equation of the breakthrough volume:
speedChartdistanceRetentiontimeRetention = (3.11)
Breakthrough volume = Retention time × Flow rate (3.12)
46
Position A: 100% signal equilibration Valve 1 Position Position B: Breakthrough monitoring Valve 1 Position
SPE Cartridge
Detector Solvent Delivery Unit
Valve 1
Figure 3.5 Plumbing Configurations for Measurement of Breakthrough Volume of
Sorbents for SPE
CHAPTER 4
PREPARATION AND PHYSICAL CHARACTERIZATION OF
PS-DVB AND MODIFIED PS-DVB ADSORBENTS
4.1 Introduction
In the past few decades, a functional polymer network has gained great
importance in many fields of scientific research as well as for industrial applications.
In this research, a series of porous poly (styrene-divinylbenzene) (PS-DVB)
copolymers were prepared by aqueous suspension polymerization in the presence of
diluents that act as precipitants. Three different methods were utilized to modify the
PS-DVB copolymer: (i) Friedel-Crafts acylation reaction by using stearoyl chloride
as acylation agent, (ii) chloromethylation by using chloromethyl styrene and (iii) A
novel modification method based on Williamson ether reaction that formed ether
linkage on to PS-DVB. The chemically modified PS-DVB adsorbents were further
examined using physical characterization methods.
This chapter presents and discussion the experimental data obtained in the
preparation and physical characterization of the adsorbents. The latter includes
characterization and interpretation by infrared analysis, nitrogen adsorption analysis,
scanning electron microscopy, and thermogravimetric analysis of the modified PS-
DVB as well as the unmodified PS-DVB adsorbents. Chemical characterization of
the adsorbents was also performed on the absorbents through solid phase extraction
(SPE) analysis and these are discussed in Chapter 5.
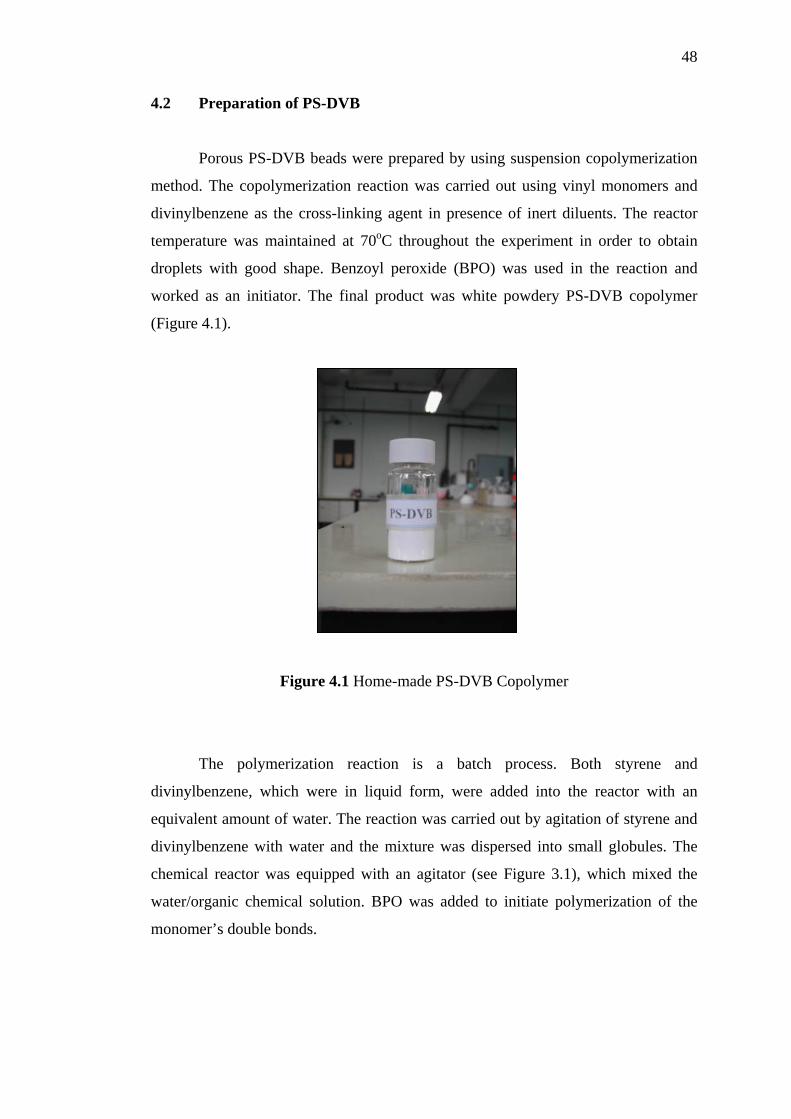
48
4.2 Preparation of PS-DVB
Porous PS-DVB beads were prepared by using suspension copolymerization
method. The copolymerization reaction was carried out using vinyl monomers and
divinylbenzene as the cross-linking agent in presence of inert diluents. The reactor
temperature was maintained at 70oC throughout the experiment in order to obtain
droplets with good shape. Benzoyl peroxide (BPO) was used in the reaction and
worked as an initiator. The final product was white powdery PS-DVB copolymer
(Figure 4.1).
Figure 4.1 Home-made PS-DVB Copolymer
The polymerization reaction is a batch process. Both styrene and
divinylbenzene, which were in liquid form, were added into the reactor with an
equivalent amount of water. The reaction was carried out by agitation of styrene and
divinylbenzene with water and the mixture was dispersed into small globules. The
chemical reactor was equipped with an agitator (see Figure 3.1), which mixed the
water/organic chemical solution. BPO was added to initiate polymerization of the
monomer’s double bonds.
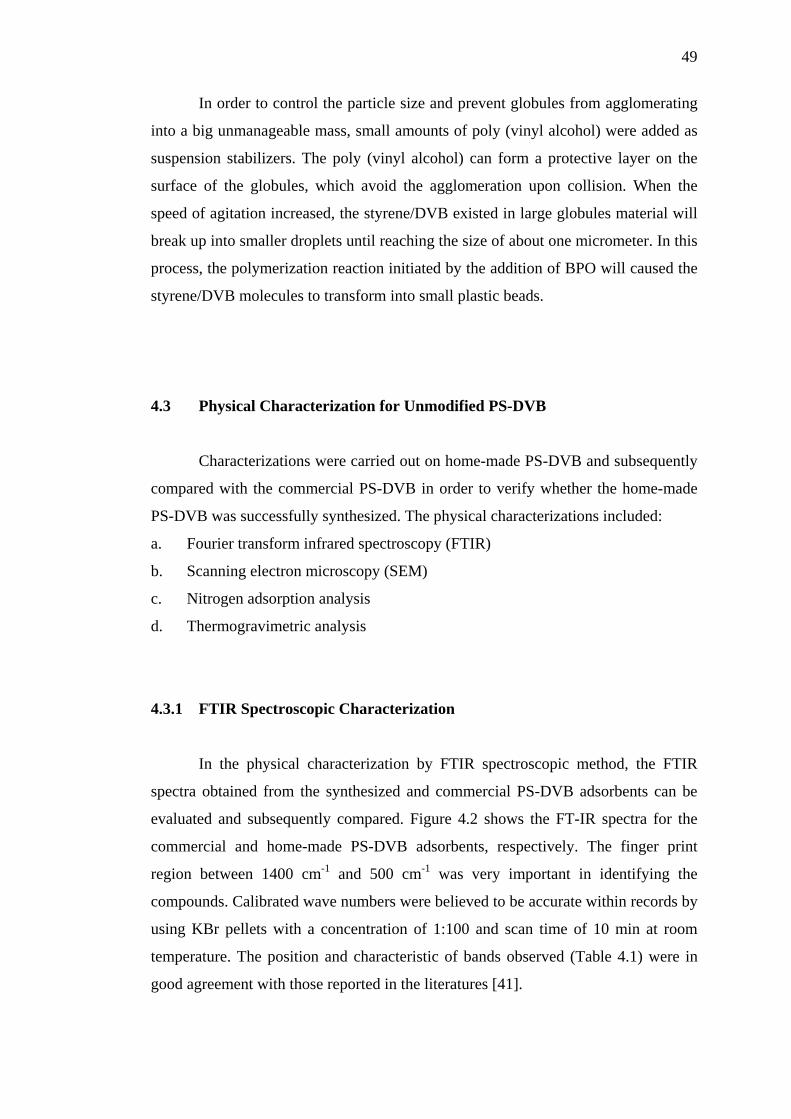
49
In order to control the particle size and prevent globules from agglomerating
into a big unmanageable mass, small amounts of poly (vinyl alcohol) were added as
suspension stabilizers. The poly (vinyl alcohol) can form a protective layer on the
surface of the globules, which avoid the agglomeration upon collision. When the
speed of agitation increased, the styrene/DVB existed in large globules material will
break up into smaller droplets until reaching the size of about one micrometer. In this
process, the polymerization reaction initiated by the addition of BPO will caused the
styrene/DVB molecules to transform into small plastic beads.
4.3 Physical Characterization for Unmodified PS-DVB
Characterizations were carried out on home-made PS-DVB and subsequently
compared with the commercial PS-DVB in order to verify whether the home-made
PS-DVB was successfully synthesized. The physical characterizations included:
a. Fourier transform infrared spectroscopy (FTIR)
b. Scanning electron microscopy (SEM)
c. Nitrogen adsorption analysis
d. Thermogravimetric analysis
4.3.1 FTIR Spectroscopic Characterization
In the physical characterization by FTIR spectroscopic method, the FTIR
spectra obtained from the synthesized and commercial PS-DVB adsorbents can be
evaluated and subsequently compared. Figure 4.2 shows the FT-IR spectra for the
commercial and home-made PS-DVB adsorbents, respectively. The finger print
region between 1400 cm-1 and 500 cm-1 was very important in identifying the
compounds. Calibrated wave numbers were believed to be accurate within records by
using KBr pellets with a concentration of 1:100 and scan time of 10 min at room
temperature. The position and characteristic of bands observed (Table 4.1) were in
good agreement with those reported in the literatures [41].
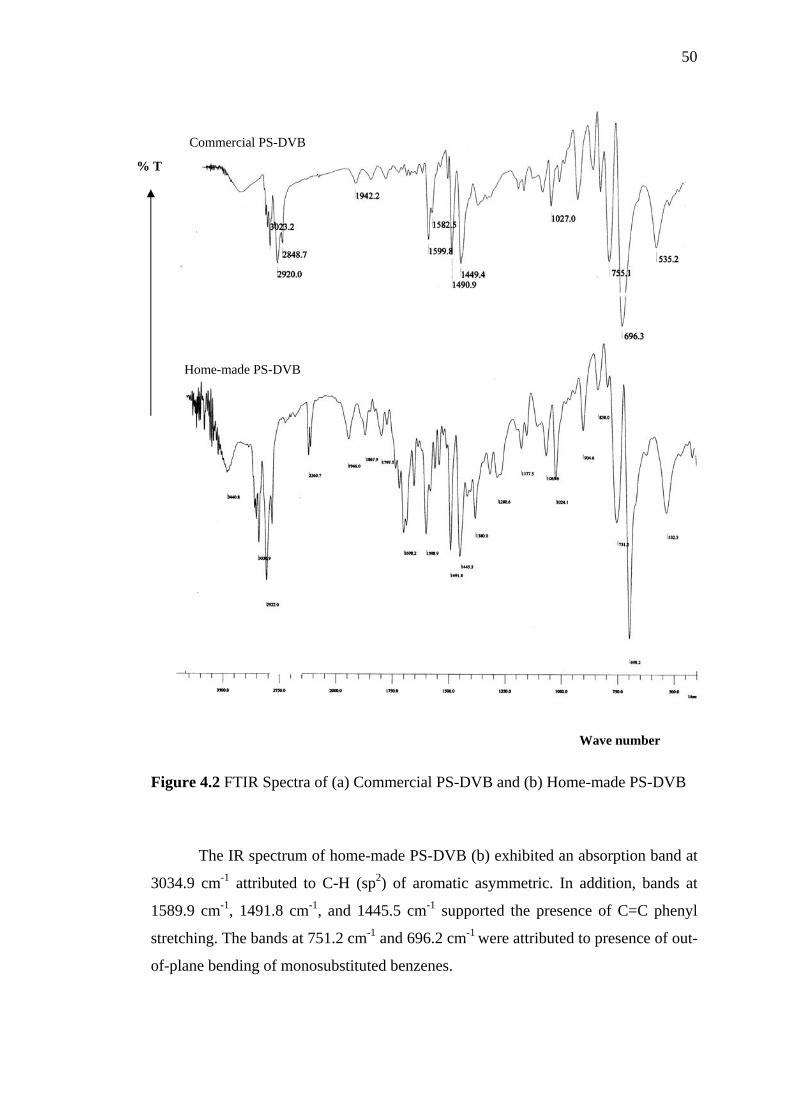
50
Wave number
% T
Home-made PS-DVB
Commercial PS-DVB
Figure 4.2 FTIR Spectra of (a) Commercial PS-DVB and (b) Home-made PS-DVB
The IR spectrum of home-made PS-DVB (b) exhibited an absorption band at
3034.9 cm-1 attributed to C-H (sp2) of aromatic asymmetric. In addition, bands at
1589.9 cm-1, 1491.8 cm-1, and 1445.5 cm-1 supported the presence of C=C phenyl
stretching. The bands at 751.2 cm-1 and 696.2 cm-1 were attributed to presence of out-
of-plane bending of monosubstituted benzenes.
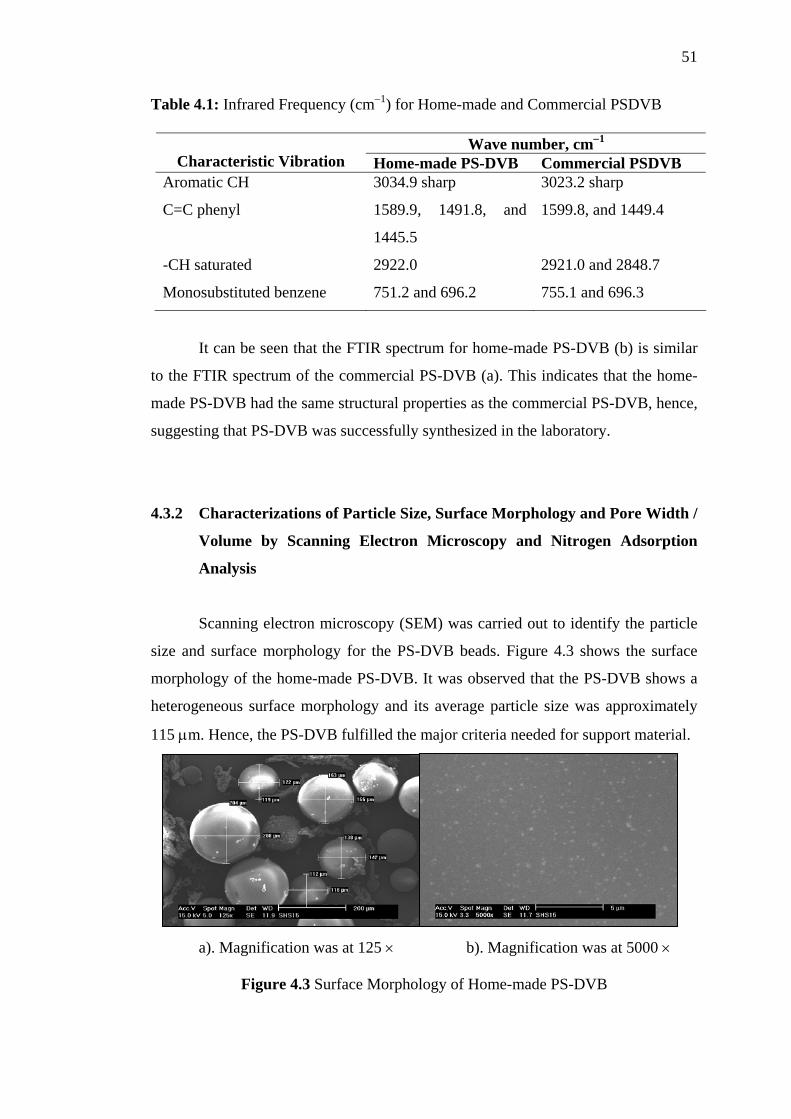
51
Table 4.1: Infrared Frequency (cm−1) for Home-made and Commercial PSDVB
Wave number, cm−1 Characteristic Vibration Home-made PS-DVB Commercial PSDVB
Aromatic CH
C=C phenyl
-CH saturated
Monosubstituted benzene
3034.9 sharp
1589.9, 1491.8, and
1445.5
2922.0
751.2 and 696.2
3023.2 sharp
1599.8, and 1449.4
2921.0 and 2848.7
755.1 and 696.3
It can be seen that the FTIR spectrum for home-made PS-DVB (b) is similar
to the FTIR spectrum of the commercial PS-DVB (a). This indicates that the home-
made PS-DVB had the same structural properties as the commercial PS-DVB, hence,
suggesting that PS-DVB was successfully synthesized in the laboratory.
4.3.2 Characterizations of Particle Size, Surface Morphology and Pore Width /
Volume by Scanning Electron Microscopy and Nitrogen Adsorption
Analysis
Scanning electron microscopy (SEM) was carried out to identify the particle
size and surface morphology for the PS-DVB beads. Figure 4.3 shows the surface
morphology of the home-made PS-DVB. It was observed that the PS-DVB shows a
heterogeneous surface morphology and its average particle size was approximately
115 μm. Hence, the PS-DVB fulfilled the major criteria needed for support material.
a). Magnification was at 125 × b). Magnification was at 5000 ×
Figure 4.3 Surface Morphology of Home-made PS-DVB
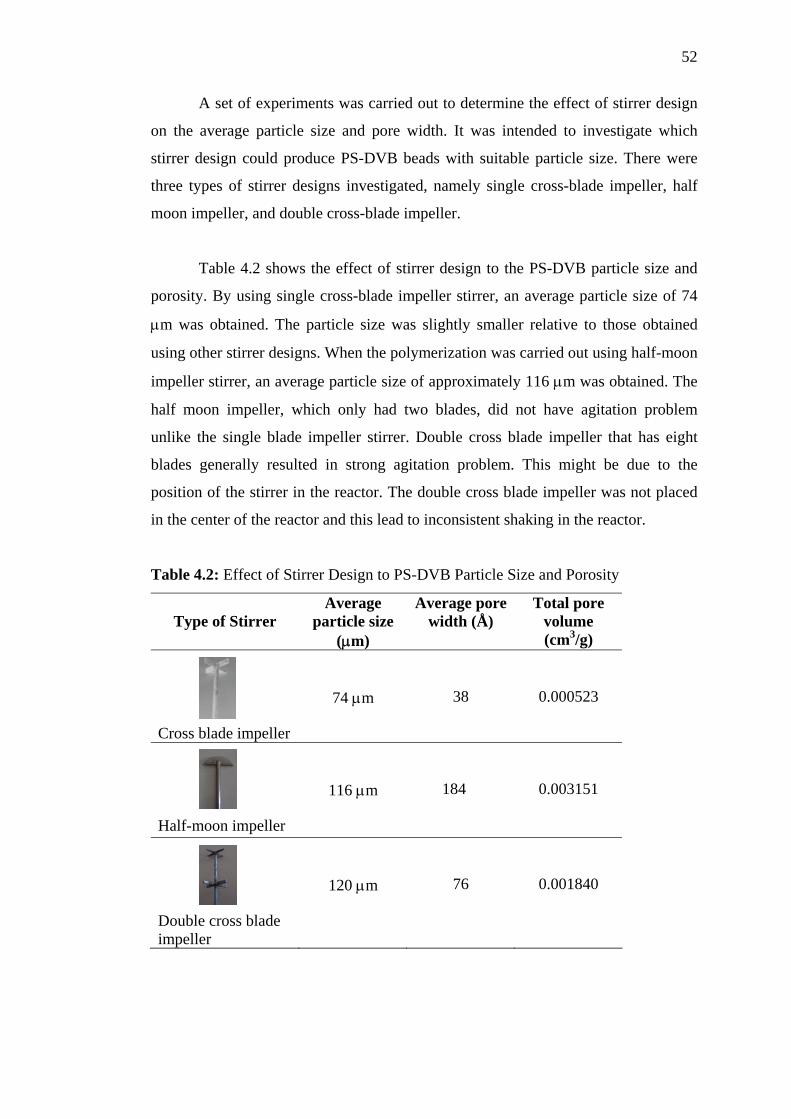
52
A set of experiments was carried out to determine the effect of stirrer design
on the average particle size and pore width. It was intended to investigate which
stirrer design could produce PS-DVB beads with suitable particle size. There were
three types of stirrer designs investigated, namely single cross-blade impeller, half
moon impeller, and double cross-blade impeller.
Table 4.2 shows the effect of stirrer design to the PS-DVB particle size and
porosity. By using single cross-blade impeller stirrer, an average particle size of 74
μm was obtained. The particle size was slightly smaller relative to those obtained
using other stirrer designs. When the polymerization was carried out using half-moon
impeller stirrer, an average particle size of approximately 116 μm was obtained. The
half moon impeller, which only had two blades, did not have agitation problem
unlike the single blade impeller stirrer. Double cross blade impeller that has eight
blades generally resulted in strong agitation problem. This might be due to the
position of the stirrer in the reactor. The double cross blade impeller was not placed
in the center of the reactor and this lead to inconsistent shaking in the reactor.
Table 4.2: Effect of Stirrer Design to PS-DVB Particle Size and Porosity
Type of Stirrer
Average particle size
(μm)
Average pore width (Å)
Total pore volume (cm3/g)
0.000523 38 74 μm
Cross blade impeller
184
0.003151 116 μm
Half-moon impeller
76
0.001840 120 μm
Double cross blade impeller
53
Among the various factors that influence the particle size of the product,
stirring speed is the most important factor that provides a relatively convenient
means of particle size control for most practical purposes. The particle size can be
controlled by the adjustment of the stirring speed. These limits depend on the size
and the configuration of the polymerization reactor (including its stirring
arrangement). For the laboratory preparation involving a total volume of about
500 mL, the stirring speed can be varied in the range of 200 to 1000 rpm. The stirring
speed of 900 rpm was chosen in our study.
The home-made PS-DVB was further characterized by using nitrogen
adsorption analysis. The nitrogen adsorption analysis was carried out to identify the
types of pore of the home-made PS-DVB. Pore width and pore volume are the results
usually obtained from this analysis. Pore width is an important parameter that
describes the pore structure of a porous copolymer. The pore volume and the average
pore width of copolymer particles usually depend on the reaction time and stirrer
design. The reaction times used in our study were 1 h, 5 h, 10 h, 15 h, and 20 h. The
reaction time optimization was aimed to find out the optimal reaction time required
to produce PS-DVB adsorbents with high average pore width with acceptable pore
volume. A good adsorbent usually give wide average pore width and pore volume.
This can lead to high adsorption capacity for the adsorbent.
Table 4.3 shows physical characteristics of the home-made PS-DVB
compared to commercial PS-DVB. In can be observed that the average pore width
for the home-made PS-DVB was 184 Å, which can be classified as mesopores.
Mesopores usually exist with the pore width in the range of 20 Å-500 Å. The pores
are irregular, voids between clusters of globules (mesopores) or voids inside a
globule (micropores). The hydrodynamic volume of the dissolved molecules controls
access to the pores. Molecules will only enter into those pores that are able to
accommodate their size while smaller pores remain inaccessible for stearic reasons
[48].
54
Table 4.3: Physical Characteristics of the Home-made PS-DVB Compared to
Commercial PS-DVB
Sample Average pore
width (Å))) Total pore
volume(cm3/g) Home-made PS-DVB Commercial PS-DVB
184 60
0.003151
0.001009
The home-made PS-DVB was found to have low BET surface area, similar to
commercial PS-DVB. Due to the small BET surface area (<10 m2/g), the instrument
was unable to analyze the sample accurately. From the result obtained (Figure 4.4), it
can be seen that the isotherm adsorption for home-made PS-DVB was generally not
well formed.
+ Adsorption ο Desorption
Figure 4.4 Nitrogen Adsorption Isotherm Plot of Home-made PS-DVB
Figure 4.5 shows the effect of reaction time to the porosity and particle size
of PS-DVB. It can be observed that when reaction time was set at 1 h, the pore width
of PS-DVB was approximately 35 Å. Highest average pore width value and pore
volume were obtained when the reaction time was fixed at 15 h with a value of
55
300 Å. However, a significant decrease of pore width was noted when the reaction
time was increased to 20 h, due to 65 Å compare to others. The average pore width
was somewhat in linear ratio with pore volume. This represent that the pore width
was directly proportional to the pore volume.
Legend Pore Volume Average pore width
18.37 18.4
26.66
80.56
12.5835
76
164
300
65
0
10
20
30
40
50
60
70
80
90
0 5 10 15 20 25
Time reaction (h)
P
Figure 4.5 The Effect of Reaction Time on Pore Volume and Average Pore Width of
Home-made PS-DVB
The particle size was generally affected by the total reaction time. Figure 4.6
shows the effect of reaction time on the average particle size and average pore width
for PS-DVB. It can be seen that when the reaction time was 1 h, the particle size for
PS-DVB was 117 μm. The highest average pore width value and pore volume were
obtained when the reaction time was increased to 15 h. However, when the reaction
time was further increased to 20 h, the particle size became smaller and fine with
particle size was decreased to 93 μm. Hence, reaction time at 15 h was chosen as the
optimum reaction time for our study.
ore
vol
e3
x
)
0
50
100
150
200
250
300
350
Ave
rage
por
e w
idth
( A
ngst
rom
)
10-4
g-1
(c
mum
56
Legend Average pore width Average particle size
117
110 108 10693
3576
164
300
65
0
20
40
60
80
100
120
140
0 5 10 15 20 25
Time reaction (h)
Ave
rage
par
ticle
size
( μm
)
0
50
100
150
200
250
300
350
Ave
rage
por
e w
idth
( Αng
stro
m)
Figure 4.6 The Effect of Reaction Time to the Average Particle Size and Average
Pore Width of Home-made PS-DVB
The reaction time also affected the amount of PS-DVB obtained after reaction
was completed. In our research, it was found that longer reaction times tend to
increase the total amount of PS-DVB obtained. Figure 4.7 shows the effect of the
reaction time to the yield of home-made PS-DVB. It can be seen that when the
reaction time was 1 h, the yield was only 13.50 g. This was probably due to the
reaction time that was not long enough for complete copolymerization reaction.
When the reaction time was increased to 5 h, the yield increased dramatically to
61.88 g. However, when the reaction time was further increased to 20 h, a maximum
yield of 126.62 g was obtained. Hence, it can be concluded that the yield increases
with increased reaction time until it reaches a maximum value after complete
reaction.
In general, the total amount of PS-DVB yield was low for short reaction time
(<5 h) but the yield increased for longer reaction time (10-20 h). It was noted that
when polymerization was stopped at 1-5 h, the product obtained contain strong odor
of styrene. On the other hand, there was no styrene odor of the final products
obtained with reaction time of 10 h or longer where the yield began to level off and
reached a high value of 126.62 g for the reaction time of 20 h. Based on the mass
balance theory, the yield of product was 129.60 g. It means that the yield of product
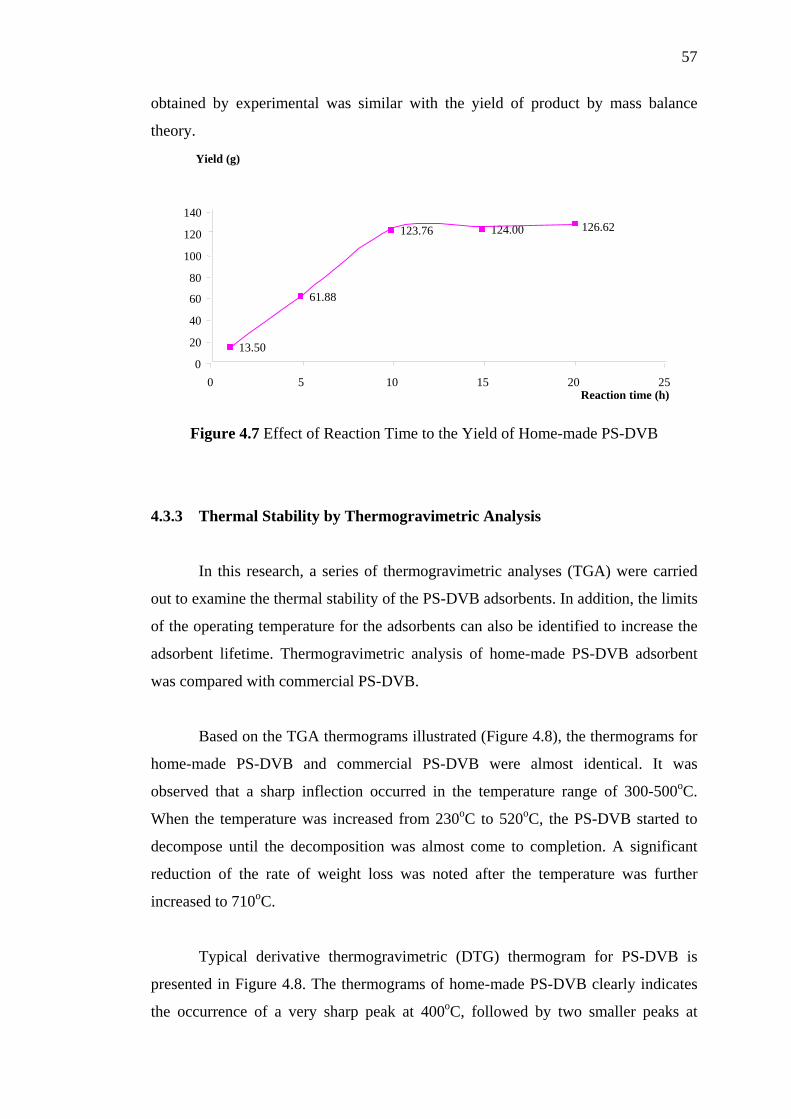
57
obtained by experimental was similar with the yield of product by mass balance
theory.
Yi eld (g)
61.88
123.76 124.00 126.62
0 20 40 60 80
100 120 140
0 5 10 15 20 25Reaction time (h)
13.50
Figure 4.7 Effect of Reaction Time to the Yield of Home-made PS-DVB
4.3.3 Thermal Stability by Thermogravimetric Analysis
In this research, a series of thermogravimetric analyses (TGA) were carried
out to examine the thermal stability of the PS-DVB adsorbents. In addition, the limits
of the operating temperature for the adsorbents can also be identified to increase the
adsorbent lifetime. Thermogravimetric analysis of home-made PS-DVB adsorbent
was compared with commercial PS-DVB.
Based on the TGA thermograms illustrated (Figure 4.8), the thermograms for
home-made PS-DVB and commercial PS-DVB were almost identical. It was
observed that a sharp inflection occurred in the temperature range of 300-500oC.
When the temperature was increased from 230oC to 520oC, the PS-DVB started to
decompose until the decomposition was almost come to completion. A significant
reduction of the rate of weight loss was noted after the temperature was further
increased to 710oC.
Typical derivative thermogravimetric (DTG) thermogram for PS-DVB is
presented in Figure 4.8. The thermograms of home-made PS-DVB clearly indicates
the occurrence of a very sharp peak at 400oC, followed by two smaller peaks at
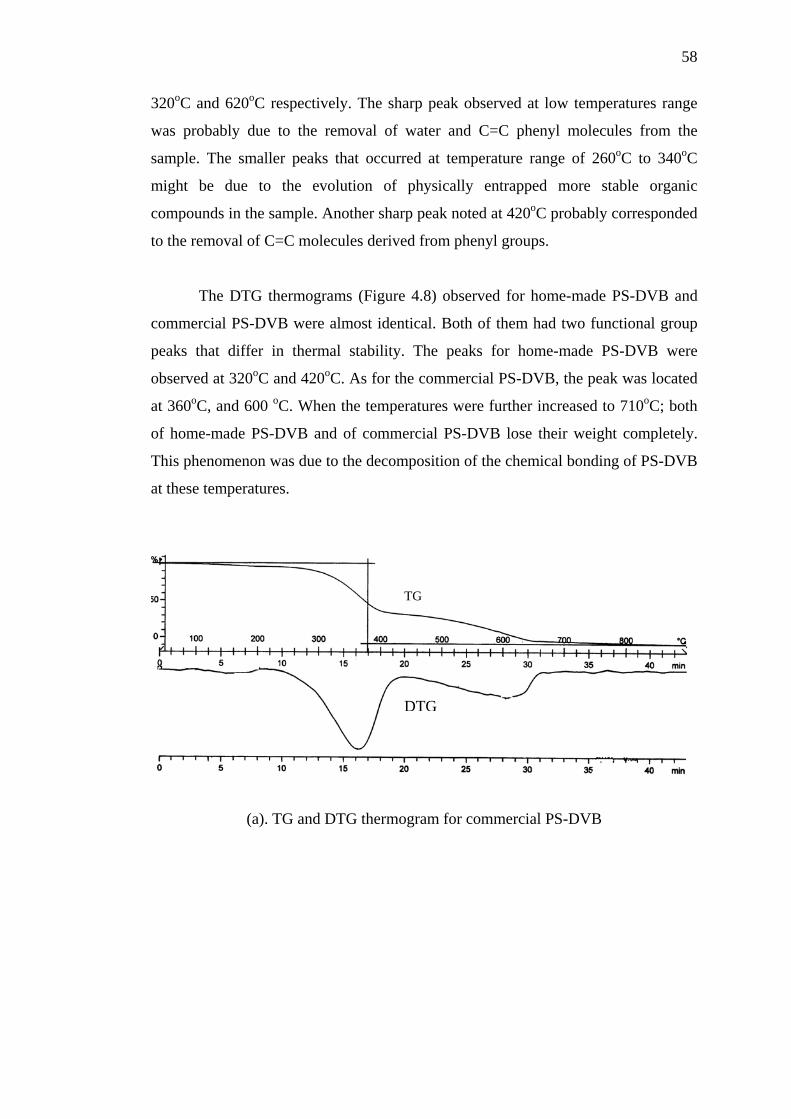
58
320oC and 620oC respectively. The sharp peak observed at low temperatures range
was probably due to the removal of water and C=C phenyl molecules from the
sample. The smaller peaks that occurred at temperature range of 260oC to 340oC
might be due to the evolution of physically entrapped more stable organic
compounds in the sample. Another sharp peak noted at 420oC probably corresponded
to the removal of C=C molecules derived from phenyl groups.
The DTG thermograms (Figure 4.8) observed for home-made PS-DVB and
commercial PS-DVB were almost identical. Both of them had two functional group
peaks that differ in thermal stability. The peaks for home-made PS-DVB were
observed at 320oC and 420oC. As for the commercial PS-DVB, the peak was located
at 360oC, and 600 oC. When the temperatures were further increased to 710oC; both
of home-made PS-DVB and of commercial PS-DVB lose their weight completely.
This phenomenon was due to the decomposition of the chemical bonding of PS-DVB
at these temperatures.
TG
DTG
(a). TG and DTG thermogram for commercial PS-DVB
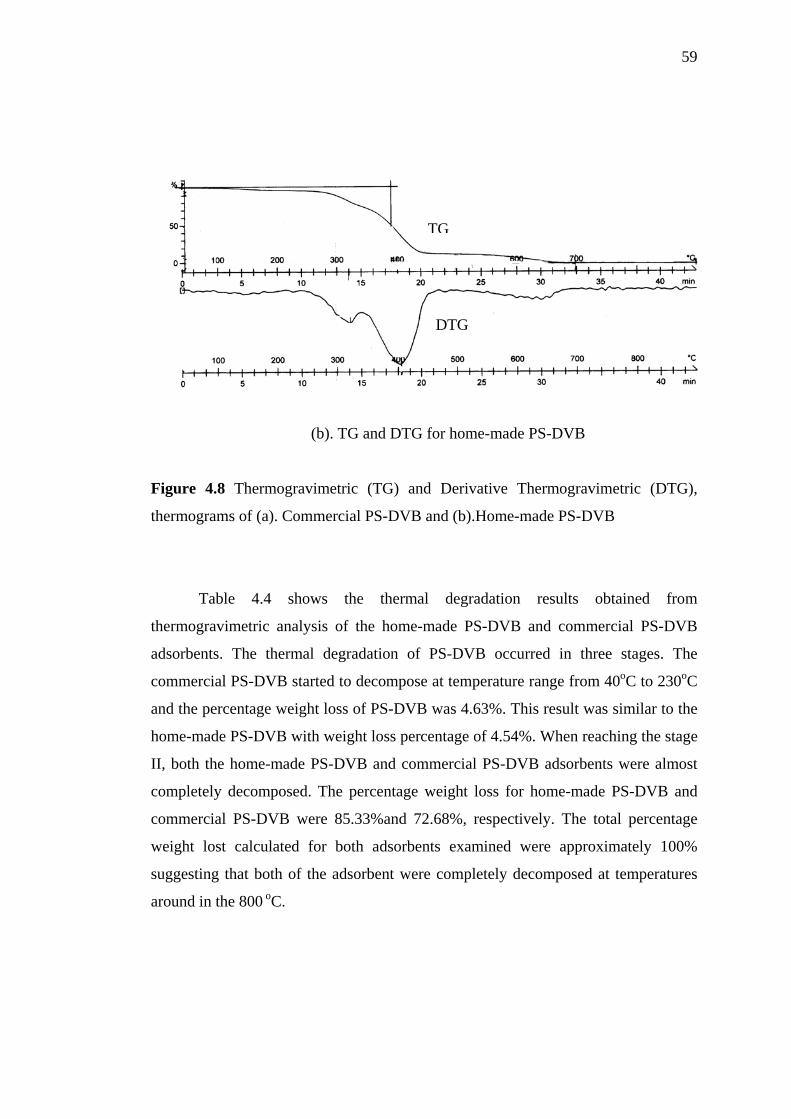
59
TG
DTG
(b). TG and DTG for home-made PS-DVB
Figure 4.8 Thermogravimetric (TG) and Derivative Thermogravimetric (DTG),
thermograms of (a). Commercial PS-DVB and (b).Home-made PS-DVB
Table 4.4 shows the thermal degradation results obtained from
thermogravimetric analysis of the home-made PS-DVB and commercial PS-DVB
adsorbents. The thermal degradation of PS-DVB occurred in three stages. The
commercial PS-DVB started to decompose at temperature range from 40oC to 230oC
and the percentage weight loss of PS-DVB was 4.63%. This result was similar to the
home-made PS-DVB with weight loss percentage of 4.54%. When reaching the stage
II, both the home-made PS-DVB and commercial PS-DVB adsorbents were almost
completely decomposed. The percentage weight loss for home-made PS-DVB and
commercial PS-DVB were 85.33%and 72.68%, respectively. The total percentage
weight lost calculated for both adsorbents examined were approximately 100%
suggesting that both of the adsorbent were completely decomposed at temperatures
around in the 800 oC.
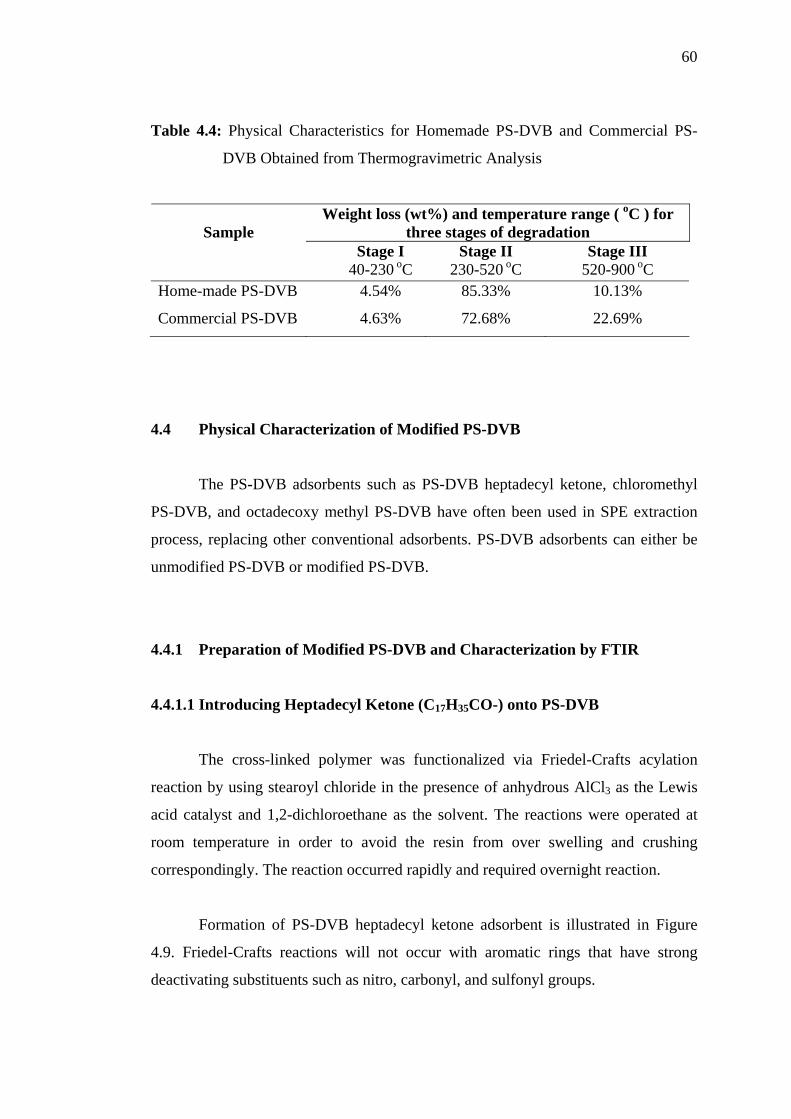
60
Table 4.4: Physical Characteristics for Homemade PS-DVB and Commercial PS-
DVB Obtained from Thermogravimetric Analysis
Weight loss (wt%) and temperature range ( oC ) for three stages of degradation
Sample
Stage I 40-230 oC
Stage II 230-520 oC
Stage III 520-900 oC
Home-made PS-DVB
Commercial PS-DVB
4.54%
4.63%
85.33%
72.68%
10.13%
22.69%
4.4 Physical Characterization of Modified PS-DVB
The PS-DVB adsorbents such as PS-DVB heptadecyl ketone, chloromethyl
PS-DVB, and octadecoxy methyl PS-DVB have often been used in SPE extraction
process, replacing other conventional adsorbents. PS-DVB adsorbents can either be
unmodified PS-DVB or modified PS-DVB.
4.4.1 Preparation of Modified PS-DVB and Characterization by FTIR
4.4.1.1 Introducing Heptadecyl Ketone (C17H35CO-) onto PS-DVB
The cross-linked polymer was functionalized via Friedel-Crafts acylation
reaction by using stearoyl chloride in the presence of anhydrous AlCl3 as the Lewis
acid catalyst and 1,2-dichloroethane as the solvent. The reactions were operated at
room temperature in order to avoid the resin from over swelling and crushing
correspondingly. The reaction occurred rapidly and required overnight reaction.
Formation of PS-DVB heptadecyl ketone adsorbent is illustrated in Figure
4.9. Friedel-Crafts reactions will not occur with aromatic rings that have strong
deactivating substituents such as nitro, carbonyl, and sulfonyl groups.
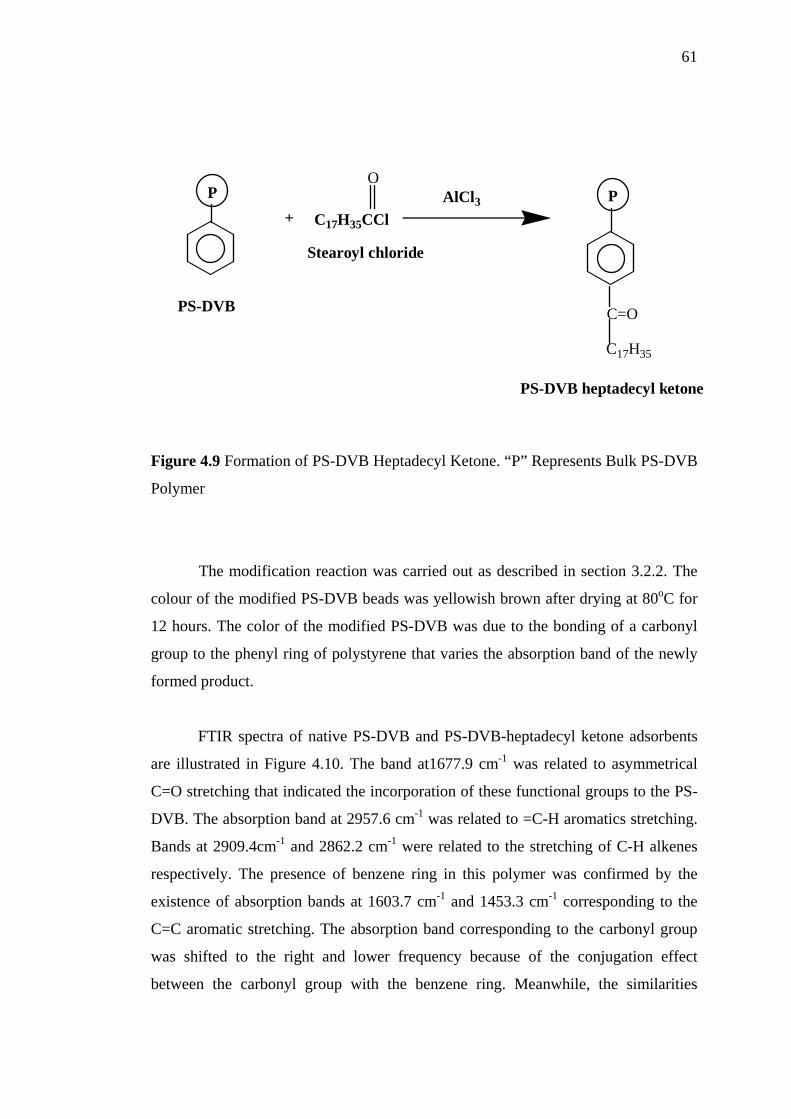
61
+ C17H35CClAlCl3
Stearoyl chloride
PS-DVB heptadecyl ketone
P P
C=O
C17H35
PS-DVB
O
Figure 4.9 Formation of PS-DVB Heptadecyl Ketone. “P” Represents Bulk PS-DVB
Polymer
The modification reaction was carried out as described in section 3.2.2. The
colour of the modified PS-DVB beads was yellowish brown after drying at 80oC for
12 hours. The color of the modified PS-DVB was due to the bonding of a carbonyl
group to the phenyl ring of polystyrene that varies the absorption band of the newly
formed product.
FTIR spectra of native PS-DVB and PS-DVB-heptadecyl ketone adsorbents
are illustrated in Figure 4.10. The band at1677.9 cm-1 was related to asymmetrical
C=O stretching that indicated the incorporation of these functional groups to the PS-
DVB. The absorption band at 2957.6 cm-1 was related to =C-H aromatics stretching.
Bands at 2909.4cm-1 and 2862.2 cm-1 were related to the stretching of C-H alkenes
respectively. The presence of benzene ring in this polymer was confirmed by the
existence of absorption bands at 1603.7 cm-1 and 1453.3 cm-1 corresponding to the
C=C aromatic stretching. The absorption band corresponding to the carbonyl group
was shifted to the right and lower frequency because of the conjugation effect
between the carbonyl group with the benzene ring. Meanwhile, the similarities
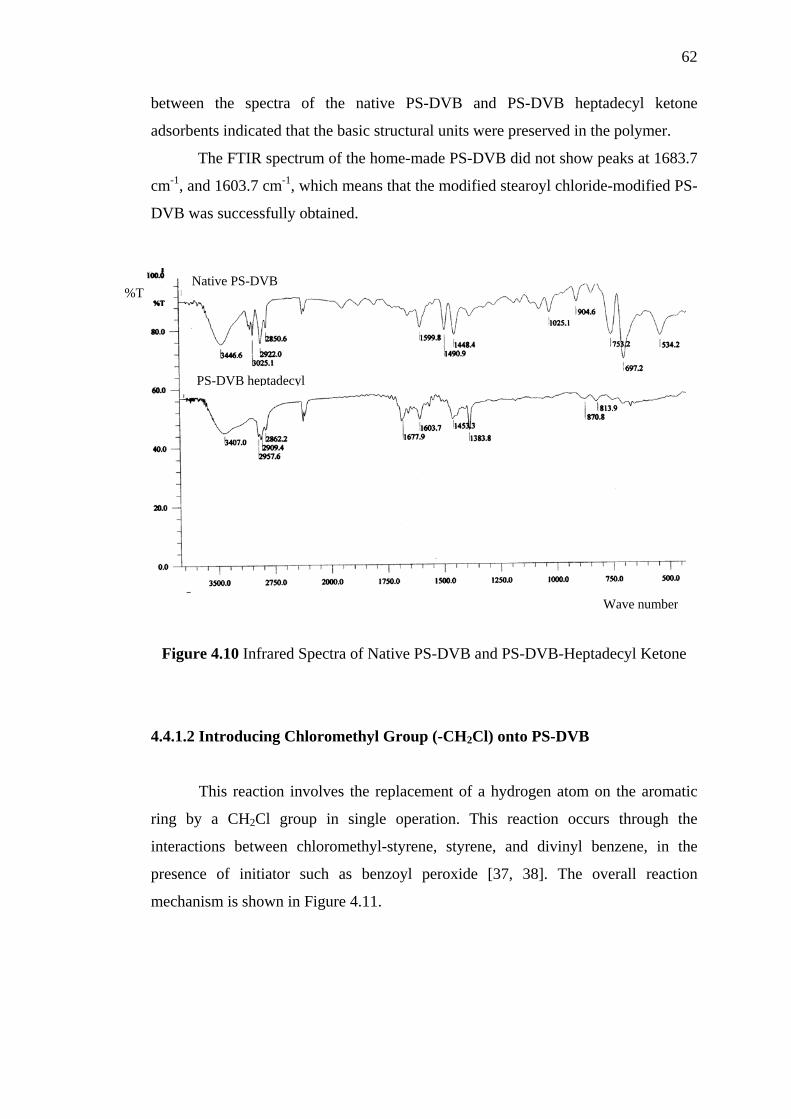
62
between the spectra of the native PS-DVB and PS-DVB heptadecyl ketone
adsorbents indicated that the basic structural units were preserved in the polymer.
The FTIR spectrum of the home-made PS-DVB did not show peaks at 1683.7
cm-1, and 1603.7 cm-1, which means that the modified stearoyl chloride-modified PS-
DVB was successfully obtained.
Native PS-DVB
PS-DVB heptadecyl
%T
Wave number
Figure 4.10 Infrared Spectra of Native PS-DVB and PS-DVB-Heptadecyl Ketone
4.4.1.2 Introducing Chloromethyl Group (-CH2Cl) onto PS-DVB
This reaction involves the replacement of a hydrogen atom on the aromatic
ring by a CH2Cl group in single operation. This reaction occurs through the
interactions between chloromethyl-styrene, styrene, and divinyl benzene, in the
presence of initiator such as benzoyl peroxide [37, 38]. The overall reaction
mechanism is shown in Figure 4.11.
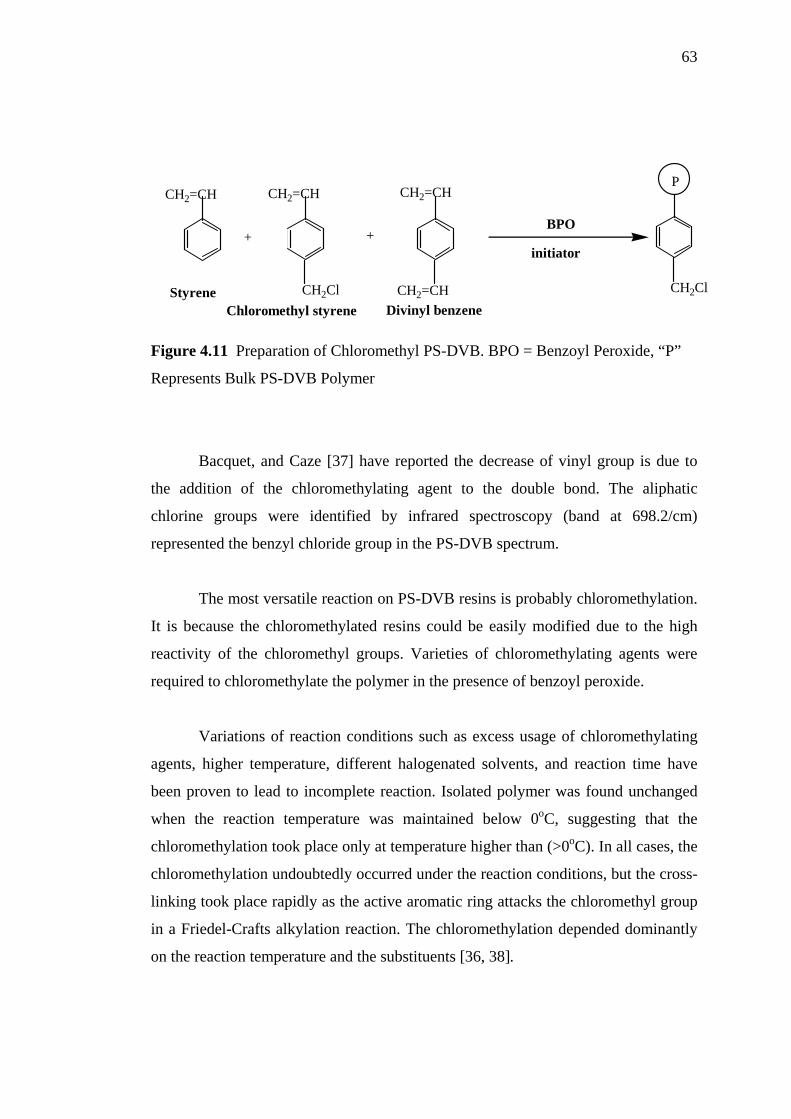
63
CH2=CH
Styrene
+
CH2=CH
CH2=CHDivinyl benzene
BPO
initiator
CH2=CH
+
CH2ClChloromethyl styrene
CH2Cl
P
Figure 4.11 Preparation of Chloromethyl PS-DVB. BPO = Benzoyl Peroxide, “P”
Represents Bulk PS-DVB Polymer
Bacquet, and Caze [37] have reported the decrease of vinyl group is due to
the addition of the chloromethylating agent to the double bond. The aliphatic
chlorine groups were identified by infrared spectroscopy (band at 698.2/cm)
represented the benzyl chloride group in the PS-DVB spectrum.
The most versatile reaction on PS-DVB resins is probably chloromethylation.
It is because the chloromethylated resins could be easily modified due to the high
reactivity of the chloromethyl groups. Varieties of chloromethylating agents were
required to chloromethylate the polymer in the presence of benzoyl peroxide.
Variations of reaction conditions such as excess usage of chloromethylating
agents, higher temperature, different halogenated solvents, and reaction time have
been proven to lead to incomplete reaction. Isolated polymer was found unchanged
when the reaction temperature was maintained below 0oC, suggesting that the
chloromethylation took place only at temperature higher than (>0oC). In all cases, the
chloromethylation undoubtedly occurred under the reaction conditions, but the cross-
linking took place rapidly as the active aromatic ring attacks the chloromethyl group
in a Friedel-Crafts alkylation reaction. The chloromethylation depended dominantly
on the reaction temperature and the substituents [36, 38].
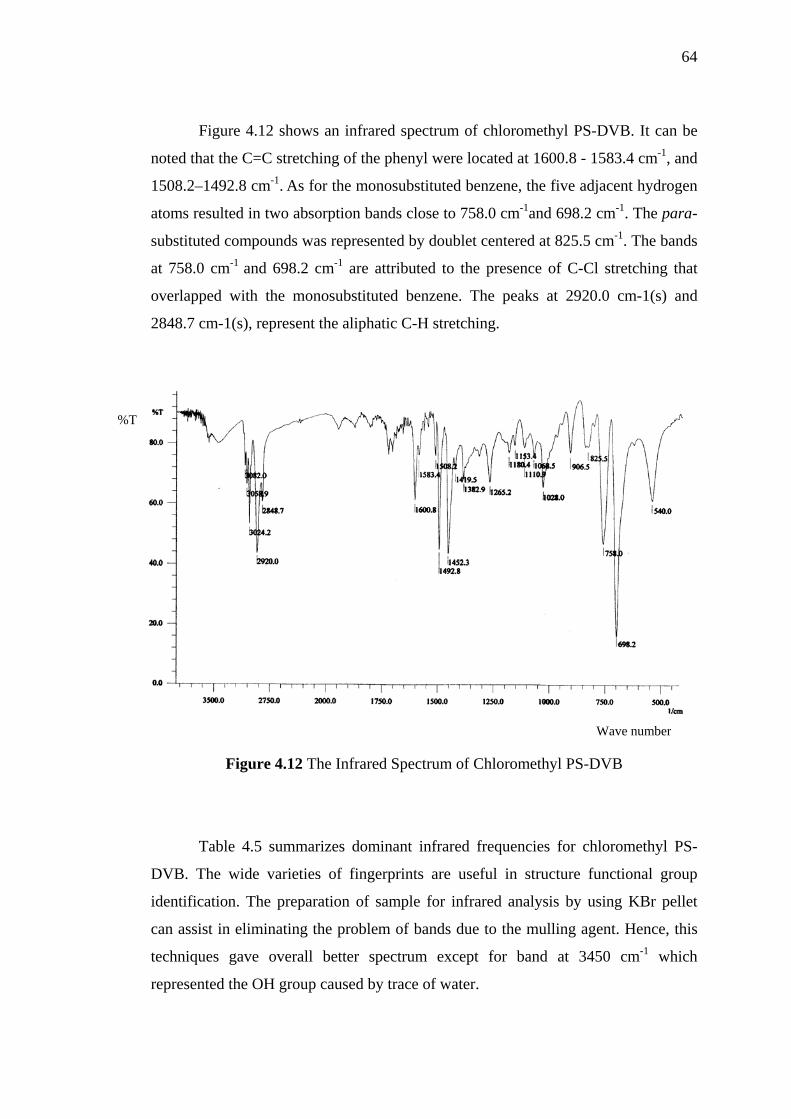
64
Figure 4.12 shows an infrared spectrum of chloromethyl PS-DVB. It can be
noted that the C=C stretching of the phenyl were located at 1600.8 - 1583.4 cm-1, and
1508.2–1492.8 cm-1. As for the monosubstituted benzene, the five adjacent hydrogen
atoms resulted in two absorption bands close to 758.0 cm-1and 698.2 cm-1. The para-
substituted compounds was represented by doublet centered at 825.5 cm-1. The bands
at 758.0 cm-1 and 698.2 cm-1 are attributed to the presence of C-Cl stretching that
overlapped with the monosubstituted benzene. The peaks at 2920.0 cm-1(s) and
2848.7 cm-1(s), represent the aliphatic C-H stretching.
Wave number
%T
Figure 4.12 The Infrared Spectrum of Chloromethyl PS-DVB
Table 4.5 summarizes dominant infrared frequencies for chloromethyl PS-
DVB. The wide varieties of fingerprints are useful in structure functional group
identification. The preparation of sample for infrared analysis by using KBr pellet
can assist in eliminating the problem of bands due to the mulling agent. Hence, this
techniques gave overall better spectrum except for band at 3450 cm-1 which
represented the OH group caused by trace of water.
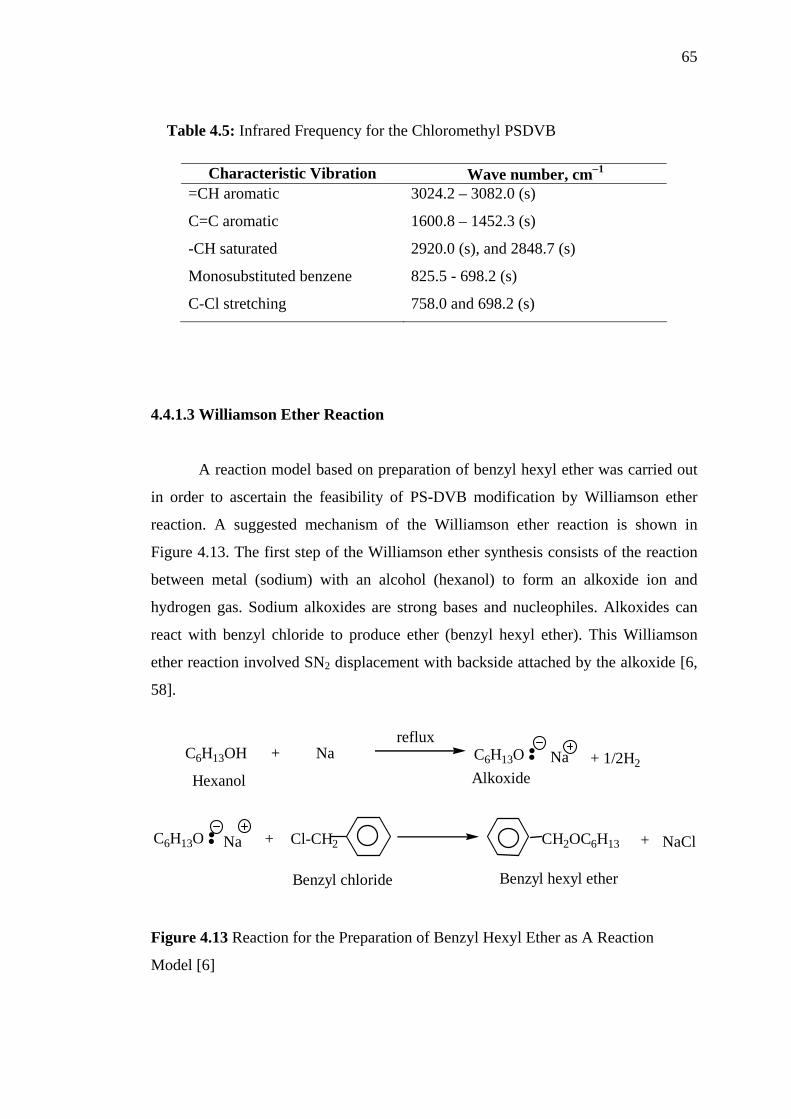
65
Table 4.5: Infrared Frequency for the Chloromethyl PSDVB
Characteristic Vibration Wave number, cm−1
=CH aromatic
C=C aromatic
-CH saturated
Monosubstituted benzene
C-Cl stretching
3024.2 – 3082.0 (s)
1600.8 – 1452.3 (s)
2920.0 (s), and 2848.7 (s)
825.5 - 698.2 (s)
758.0 and 698.2 (s)
4.4.1.3 Williamson Ether Reaction
A reaction model based on preparation of benzyl hexyl ether was carried out
in order to ascertain the feasibility of PS-DVB modification by Williamson ether
reaction. A suggested mechanism of the Williamson ether reaction is shown in
Figure 4.13. The first step of the Williamson ether synthesis consists of the reaction
between metal (sodium) with an alcohol (hexanol) to form an alkoxide ion and
hydrogen gas. Sodium alkoxides are strong bases and nucleophiles. Alkoxides can
react with benzyl chloride to produce ether (benzyl hexyl ether). This Williamson
ether reaction involved SN2 displacement with backside attached by the alkoxide [6,
58].
reflux
Hexanol
+
Benzyl chloride
CH2OC6H13 + NaCl
Benzyl hexyl ether
C6H13OH + Na C6H13O
C6H13O Na Cl-CH2
NaAlkoxide
+ 1/2H2
Figure 4.13 Reaction for the Preparation of Benzyl Hexyl Ether as A Reaction
Model [6]
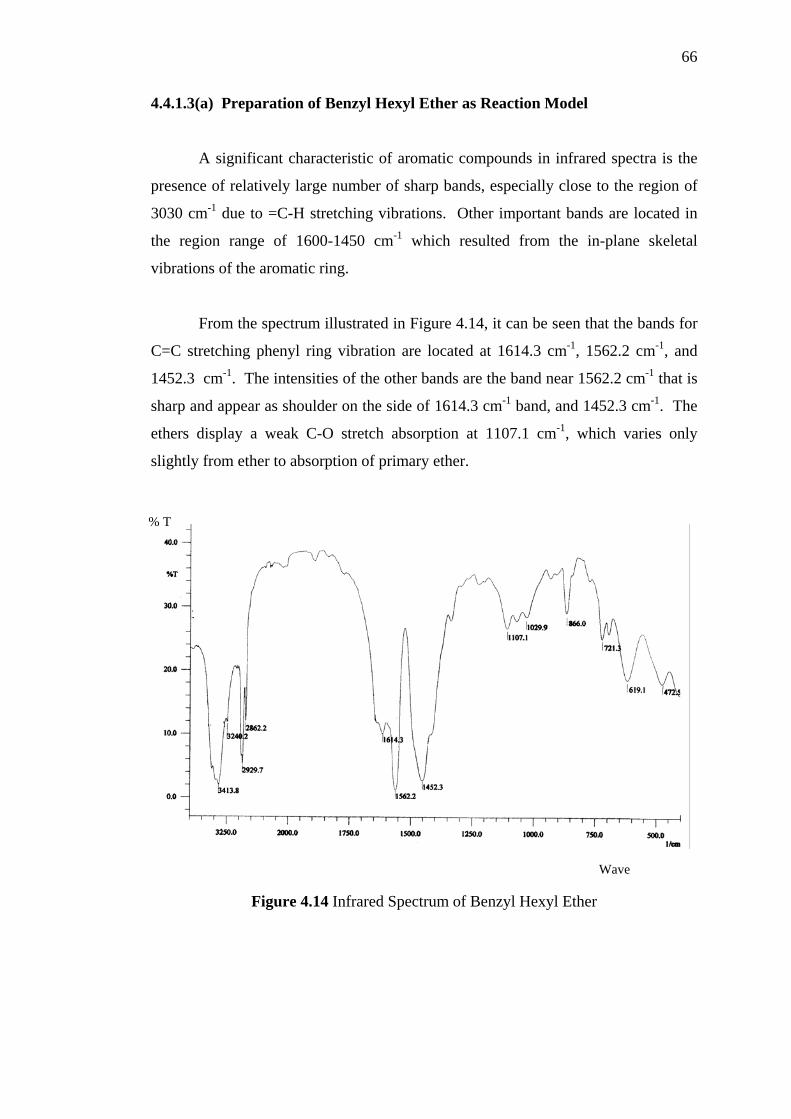
66
4.4.1.3(a) Preparation of Benzyl Hexyl Ether as Reaction Model
A significant characteristic of aromatic compounds in infrared spectra is the
presence of relatively large number of sharp bands, especially close to the region of
3030 cm-1 due to =C-H stretching vibrations. Other important bands are located in
the region range of 1600-1450 cm-1 which resulted from the in-plane skeletal
vibrations of the aromatic ring.
From the spectrum illustrated in Figure 4.14, it can be seen that the bands for
C=C stretching phenyl ring vibration are located at 1614.3 cm-1, 1562.2 cm-1, and
1452.3 cm-1. The intensities of the other bands are the band near 1562.2 cm-1 that is
sharp and appear as shoulder on the side of 1614.3 cm-1 band, and 1452.3 cm-1. The
ethers display a weak C-O stretch absorption at 1107.1 cm-1, which varies only
slightly from ether to absorption of primary ether.
Wave
% T
Figure 4.14 Infrared Spectrum of Benzyl Hexyl Ether
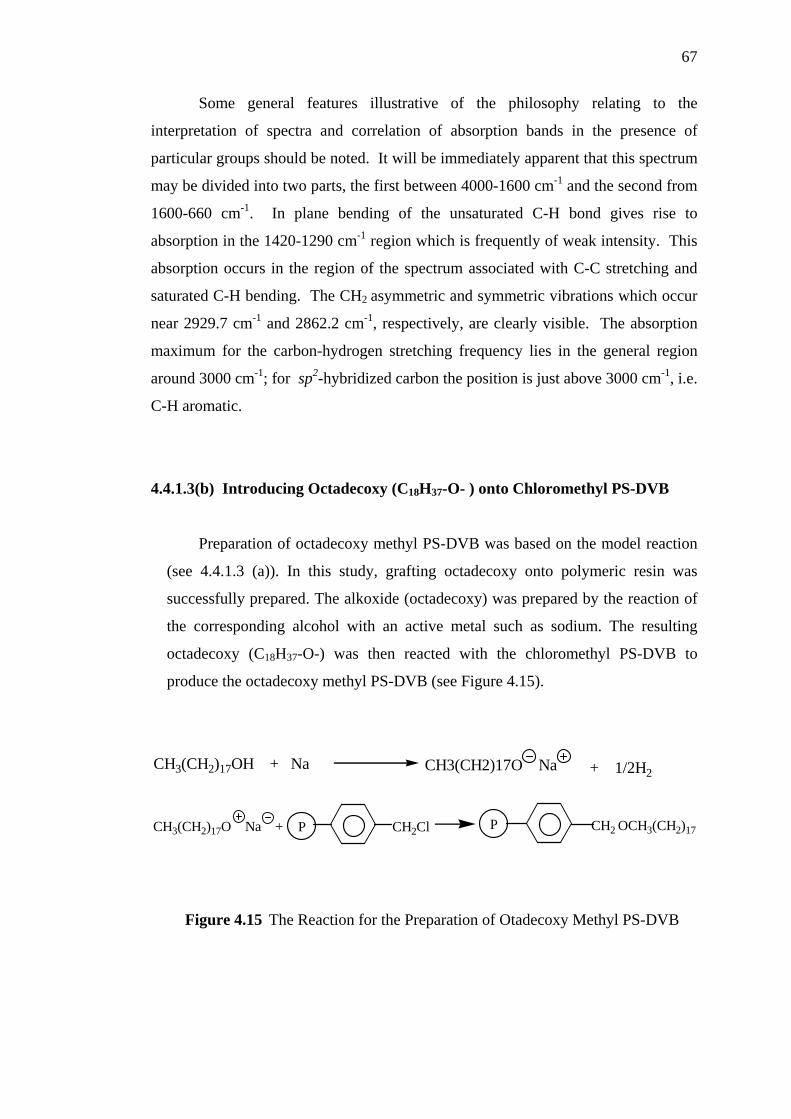
67
Some general features illustrative of the philosophy relating to the
interpretation of spectra and correlation of absorption bands in the presence of
particular groups should be noted. It will be immediately apparent that this spectrum
may be divided into two parts, the first between 4000-1600 cm-1 and the second from
1600-660 cm-1. In plane bending of the unsaturated C-H bond gives rise to
absorption in the 1420-1290 cm-1 region which is frequently of weak intensity. This
absorption occurs in the region of the spectrum associated with C-C stretching and
saturated C-H bending. The CH2 asymmetric and symmetric vibrations which occur
near 2929.7 cm-1 and 2862.2 cm-1, respectively, are clearly visible. The absorption
maximum for the carbon-hydrogen stretching frequency lies in the general region
around 3000 cm-1; for sp2-hybridized carbon the position is just above 3000 cm-1, i.e.
C-H aromatic.
4.4.1.3(b) Introducing Octadecoxy (C18H37-O- ) onto Chloromethyl PS-DVB
Preparation of octadecoxy methyl PS-DVB was based on the model reaction
(see 4.4.1.3 (a)). In this study, grafting octadecoxy onto polymeric resin was
successfully prepared. The alkoxide (octadecoxy) was prepared by the reaction of
the corresponding alcohol with an active metal such as sodium. The resulting
octadecoxy (C18H37-O-) was then reacted with the chloromethyl PS-DVB to
produce the octadecoxy methyl PS-DVB (see Figure 4.15).
CH 3(CH2)17OH + Na CH3(CH2)17O Na + 1/2H2
+CH
3(CH2)17O Na P P CH2 OCH3(CH2)17CH2Cl
Figure 4.15 The Reaction for the Preparation of Otadecoxy Methyl PS-DVB
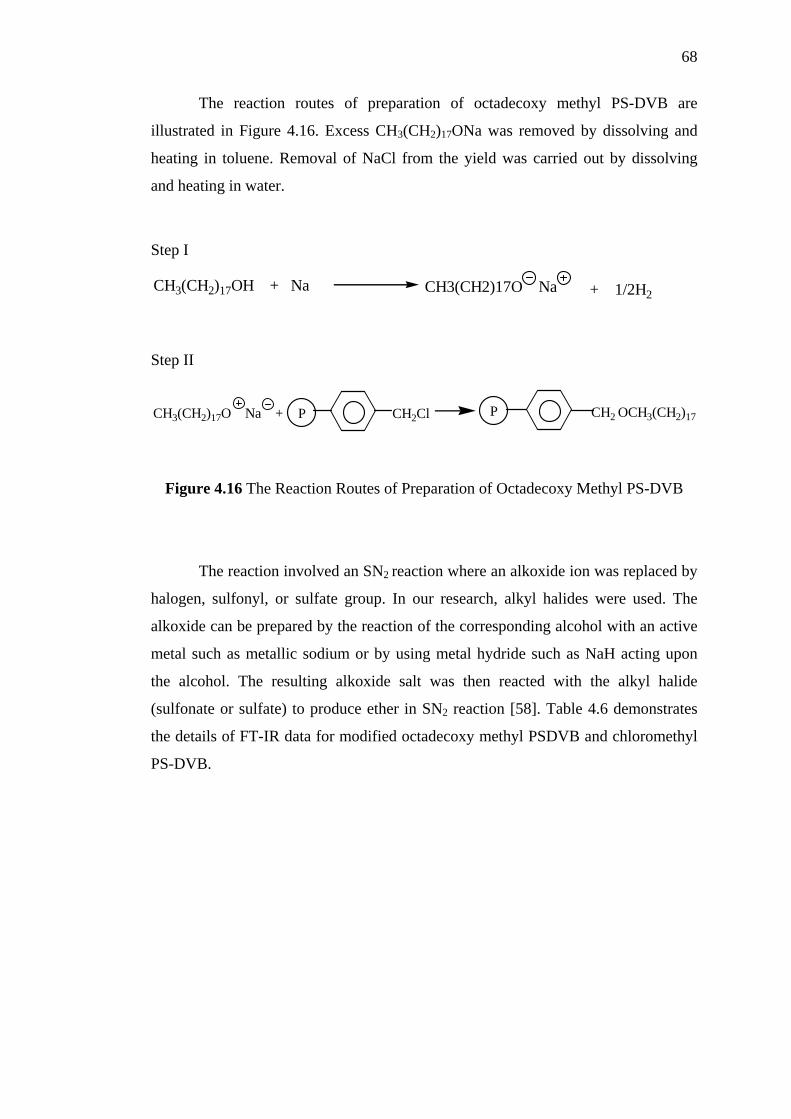
68
The reaction routes of preparation of octadecoxy methyl PS-DVB are
illustrated in Figure 4.16. Excess CH3(CH2)17ONa was removed by dissolving and
heating in toluene. Removal of NaCl from the yield was carried out by dissolving
and heating in water.
Step I
CH3(CH
2)17OH + Na CH3(CH2)17O Na + 1/2H2 Step II
+CH3(CH
2 )17O Na P P CH2 OCH3(CH2)17CH2Cl
Figure 4.16 The Reaction Routes of Preparation of Octadecoxy Methyl PS-DVB
The reaction involved an SN2 reaction where an alkoxide ion was replaced by
halogen, sulfonyl, or sulfate group. In our research, alkyl halides were used. The
alkoxide can be prepared by the reaction of the corresponding alcohol with an active
metal such as metallic sodium or by using metal hydride such as NaH acting upon
the alcohol. The resulting alkoxide salt was then reacted with the alkyl halide
(sulfonate or sulfate) to produce ether in SN2 reaction [58]. Table 4.6 demonstrates
the details of FT-IR data for modified octadecoxy methyl PSDVB and chloromethyl
PS-DVB.
69
Table 4.6: The FT-IR Data of Modified Octadecoxy Methyl PSDVB Compare to
Chloromethyl PS-DVB
Wave number, cm−1 Characteristic Vibration Chloromethyl PS-DVB
(PSDVB-CH2Cl) Octadecoxy methyl PS-DVB
(PSDVB-CH2-O-C18H37) =CH aromatic C=C stretching phenyl ring -CH2 asymmetric and symmetric vibrations Monosubstituted benzene C-Cl stretching
C-O-C (ether)
3024.2, 3058.9, (s) 1600.8 -1452,3 (s) 2920.0, and 2848.7 (s) 758.0, and 698.2 (s) 698.2 (s) None
None 1562.2 (s), 1467.7 (s) 2918.1, 2850.6 (s) 721.3 (w) None 1058.8 (w)
Figure 4.17 shows the infrared spectra of chloromethyl PS-DVB compared
with octadecoxy methyl PS-DVB. Figure 4.17(b) shows an IR spectrum of
octadecoxy methyl PS-DVB. It exhibited bands for C-O at 1058.8 cm-1 and while
stretching bands at 1562.2 cm-1 and 1467.7 cm-1 were atrributed for C=C of phenyl
stretching. The presence of a band centered at 2918.1 cm-1 was atrributed to C-H
strongly of the octyl chain. The absorption of CH2 asymmetric bands for
chloromethyl PS-DVB and octadecoxy methyl PS-DVB were noted at region around
2918.1 cm-1 and 2850.6 cm-1, respectively. The bands at 1562.2 cm-1 and 1467.7 cm-1
were related to in-plane bond stretching for phenyl ring. Based on the spectra
obtained, significant differences of intensity at 698.2 cm-1 (due to C-Cl stretching)
and 1058 cm-1 (due to C-O-C stretching) regions were observed.
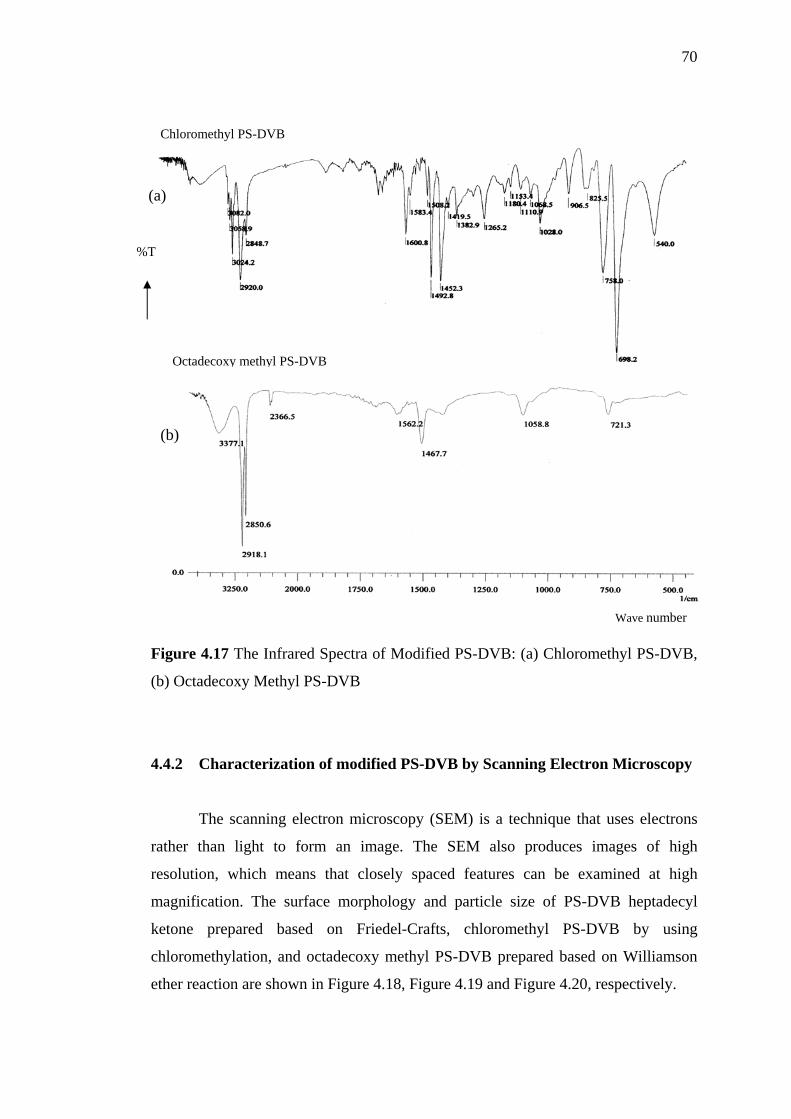
70
%T
Wave number
Chloromethyl PS-DVB
Octadecoxy methyl PS-DVB
(a)
(b)
Figure 4.17 The Infrared Spectra of Modified PS-DVB: (a) Chloromethyl PS-DVB,
(b) Octadecoxy Methyl PS-DVB
4.4.2 Characterization of modified PS-DVB by Scanning Electron Microscopy
The scanning electron microscopy (SEM) is a technique that uses electrons
rather than light to form an image. The SEM also produces images of high
resolution, which means that closely spaced features can be examined at high
magnification. The surface morphology and particle size of PS-DVB heptadecyl
ketone prepared based on Friedel-Crafts, chloromethyl PS-DVB by using
chloromethylation, and octadecoxy methyl PS-DVB prepared based on Williamson
ether reaction are shown in Figure 4.18, Figure 4.19 and Figure 4.20, respectively.
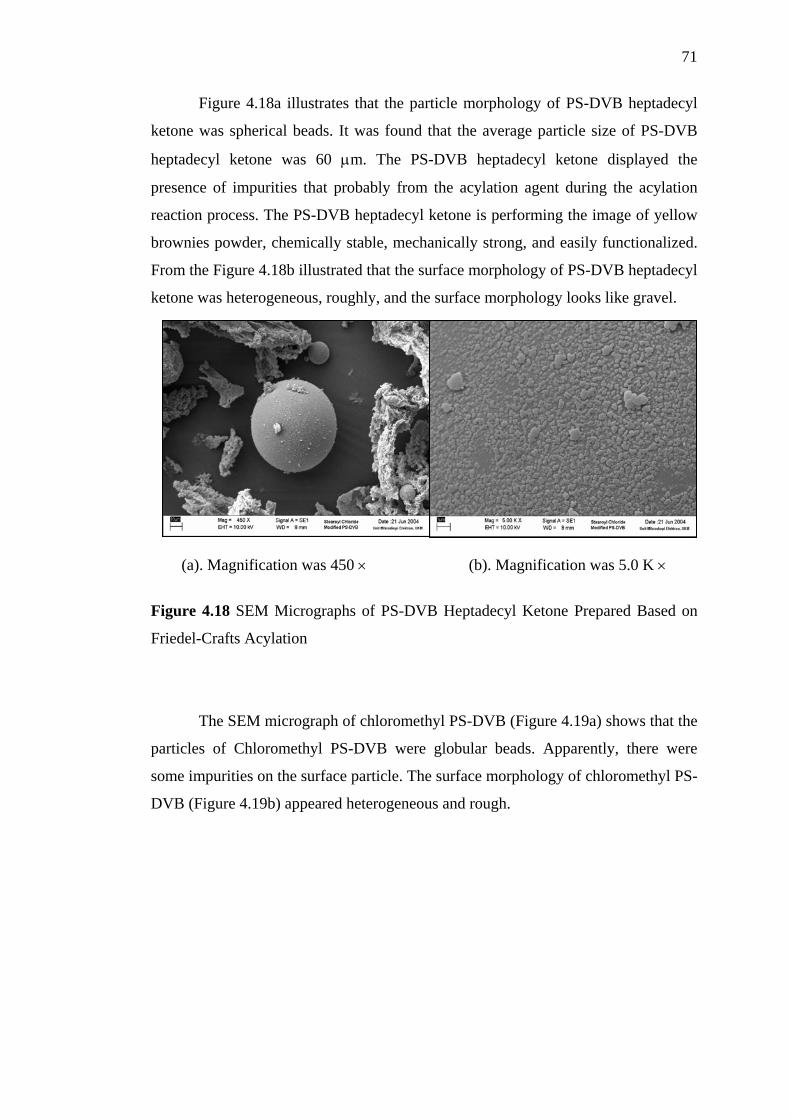
71
Figure 4.18a illustrates that the particle morphology of PS-DVB heptadecyl
ketone was spherical beads. It was found that the average particle size of PS-DVB
heptadecyl ketone was 60 μm. The PS-DVB heptadecyl ketone displayed the
presence of impurities that probably from the acylation agent during the acylation
reaction process. The PS-DVB heptadecyl ketone is performing the image of yellow
brownies powder, chemically stable, mechanically strong, and easily functionalized.
From the Figure 4.18b illustrated that the surface morphology of PS-DVB heptadecyl
ketone was heterogeneous, roughly, and the surface morphology looks like gravel.
(a). Magnification was 450 × (b). Magnification was 5.0 K ×
Figure 4.18 SEM Micrographs of PS-DVB Heptadecyl Ketone Prepared Based on
Friedel-Crafts Acylation
The SEM micrograph of chloromethyl PS-DVB (Figure 4.19a) shows that the
particles of Chloromethyl PS-DVB were globular beads. Apparently, there were
some impurities on the surface particle. The surface morphology of chloromethyl PS-
DVB (Figure 4.19b) appeared heterogeneous and rough.
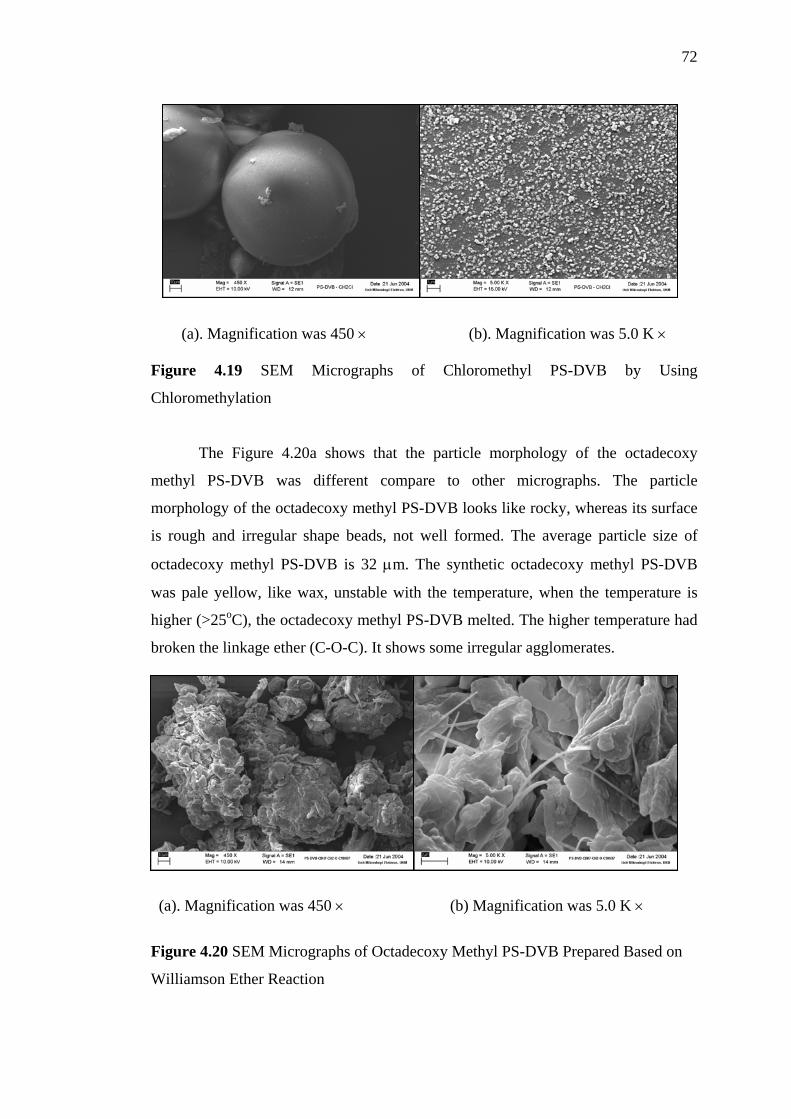
72
(a). Magnification was 450 × (b). Magnification was 5.0 K ×
Figure 4.19 SEM Micrographs of Chloromethyl PS-DVB by Using
Chloromethylation
The Figure 4.20a shows that the particle morphology of the octadecoxy
methyl PS-DVB was different compare to other micrographs. The particle
morphology of the octadecoxy methyl PS-DVB looks like rocky, whereas its surface
is rough and irregular shape beads, not well formed. The average particle size of
octadecoxy methyl PS-DVB is 32 μm. The synthetic octadecoxy methyl PS-DVB
was pale yellow, like wax, unstable with the temperature, when the temperature is
higher (>25oC), the octadecoxy methyl PS-DVB melted. The higher temperature had
broken the linkage ether (C-O-C). It shows some irregular agglomerates.
(a). Magnification was 450 × (b) Magnification was 5.0 K ×
Figure 4.20 SEM Micrographs of Octadecoxy Methyl PS-DVB Prepared Based on
Williamson Ether Reaction
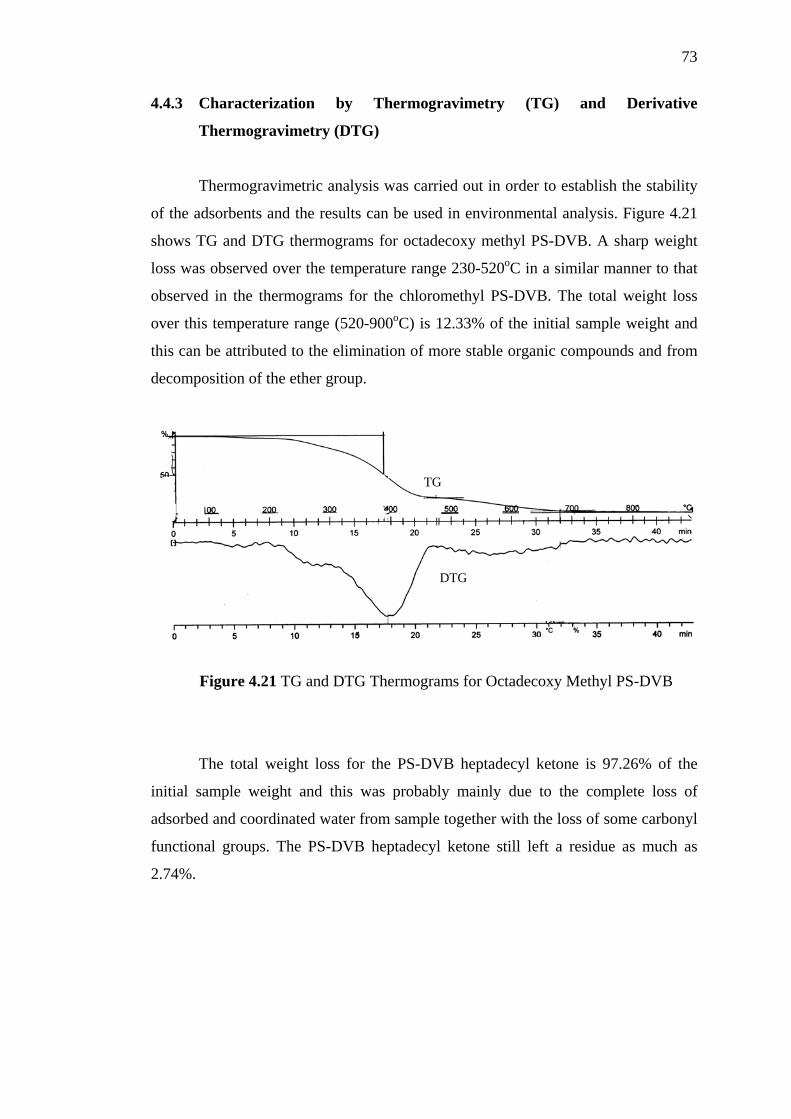
73
4.4.3 Characterization by Thermogravimetry (TG) and Derivative
Thermogravimetry (DTG)
Thermogravimetric analysis was carried out in order to establish the stability
of the adsorbents and the results can be used in environmental analysis. Figure 4.21
shows TG and DTG thermograms for octadecoxy methyl PS-DVB. A sharp weight
loss was observed over the temperature range 230-520oC in a similar manner to that
observed in the thermograms for the chloromethyl PS-DVB. The total weight loss
over this temperature range (520-900oC) is 12.33% of the initial sample weight and
this can be attributed to the elimination of more stable organic compounds and from
decomposition of the ether group.
TG
DTG
Figure 4.21 TG and DTG Thermograms for Octadecoxy Methyl PS-DVB
The total weight loss for the PS-DVB heptadecyl ketone is 97.26% of the
initial sample weight and this was probably mainly due to the complete loss of
adsorbed and coordinated water from sample together with the loss of some carbonyl
functional groups. The PS-DVB heptadecyl ketone still left a residue as much as
2.74%.
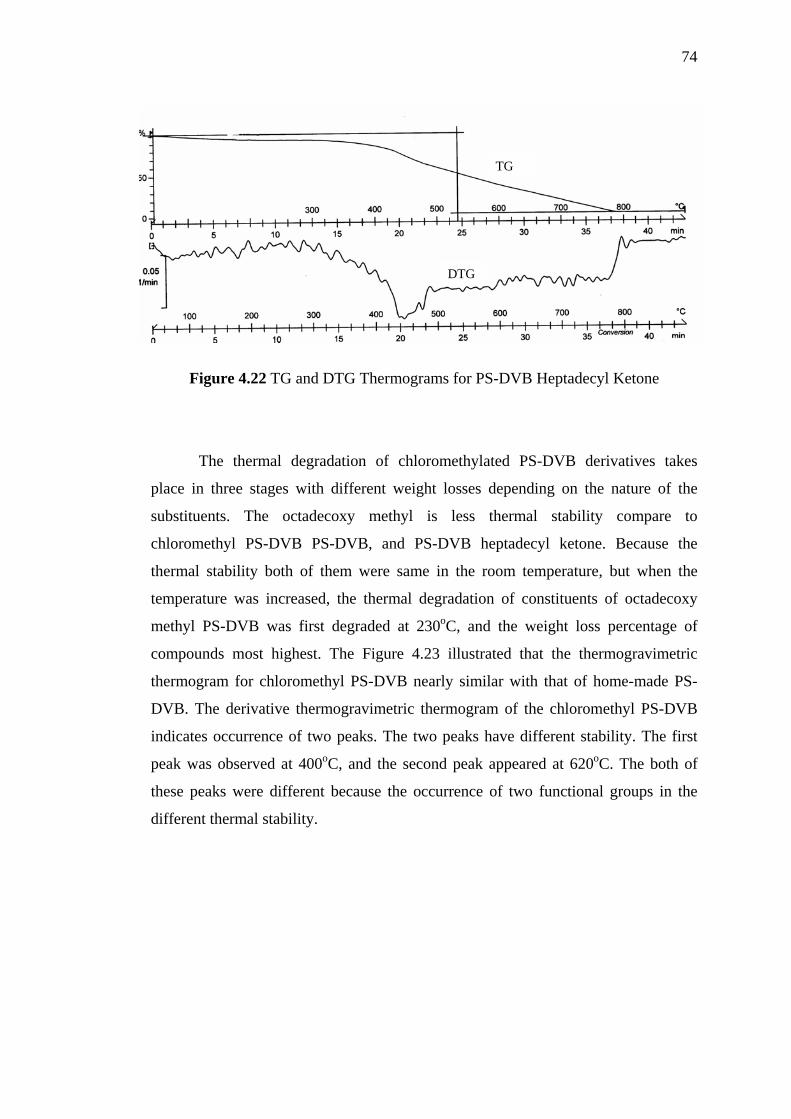
74
TG
DTG
Figure 4.22 TG and DTG Thermograms for PS-DVB Heptadecyl Ketone
The thermal degradation of chloromethylated PS-DVB derivatives takes
place in three stages with different weight losses depending on the nature of the
substituents. The octadecoxy methyl is less thermal stability compare to
chloromethyl PS-DVB PS-DVB, and PS-DVB heptadecyl ketone. Because the
thermal stability both of them were same in the room temperature, but when the
temperature was increased, the thermal degradation of constituents of octadecoxy
methyl PS-DVB was first degraded at 230oC, and the weight loss percentage of
compounds most highest. The Figure 4.23 illustrated that the thermogravimetric
thermogram for chloromethyl PS-DVB nearly similar with that of home-made PS-
DVB. The derivative thermogravimetric thermogram of the chloromethyl PS-DVB
indicates occurrence of two peaks. The two peaks have different stability. The first
peak was observed at 400oC, and the second peak appeared at 620oC. The both of
these peaks were different because the occurrence of two functional groups in the
different thermal stability.
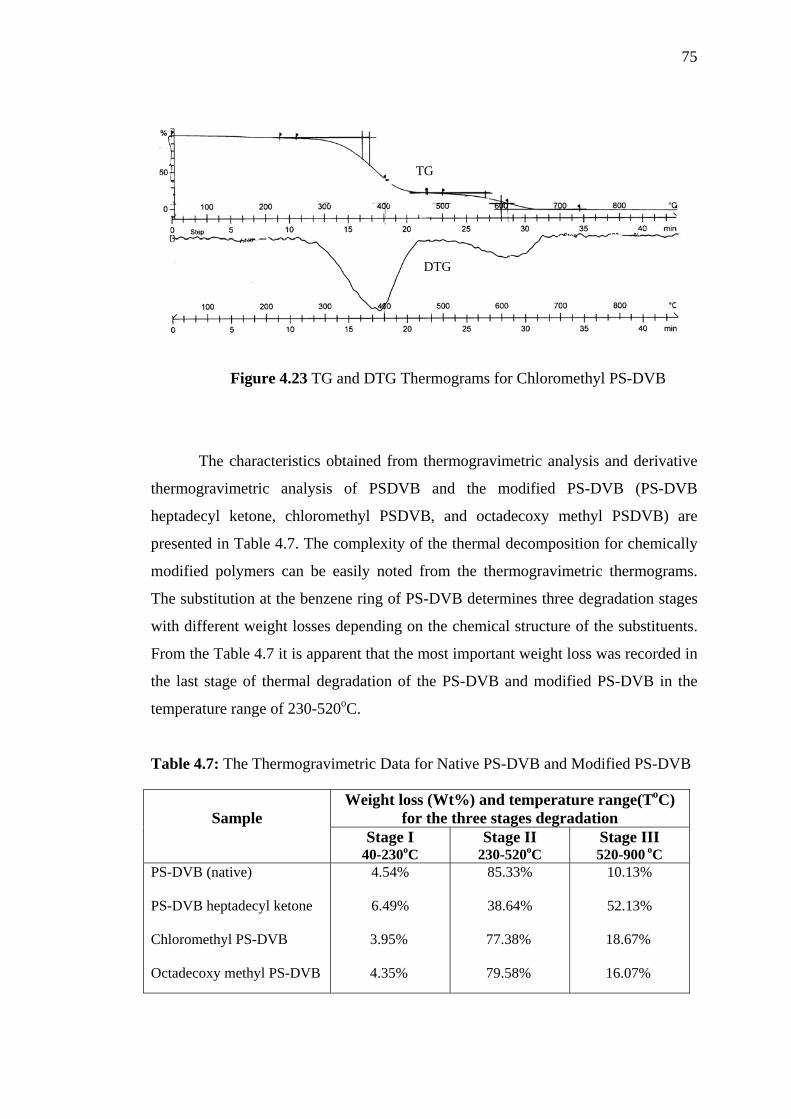
75
TG
DTG
Figure 4.23 TG and DTG Thermograms for Chloromethyl PS-DVB
The characteristics obtained from thermogravimetric analysis and derivative
thermogravimetric analysis of PSDVB and the modified PS-DVB (PS-DVB
heptadecyl ketone, chloromethyl PSDVB, and octadecoxy methyl PSDVB) are
presented in Table 4.7. The complexity of the thermal decomposition for chemically
modified polymers can be easily noted from the thermogravimetric thermograms.
The substitution at the benzene ring of PS-DVB determines three degradation stages
with different weight losses depending on the chemical structure of the substituents.
From the Table 4.7 it is apparent that the most important weight loss was recorded in
the last stage of thermal degradation of the PS-DVB and modified PS-DVB in the
temperature range of 230-520oC.
Table 4.7: The Thermogravimetric Data for Native PS-DVB and Modified PS-DVB
Weight loss (Wt%) and temperature range(ToC) for the three stages degradation
Sample
Stage I 40-230oC
Stage II 230-520oC
Stage III 520-900 oC
PS-DVB (native) PS-DVB heptadecyl ketone
Chloromethyl PS-DVB Octadecoxy methyl PS-DVB
4.54%
6.49%
3.95%
4.35%
85.33%
38.64%
77.38%
79.58%
10.13%
52.13%
18.67%
16.07%
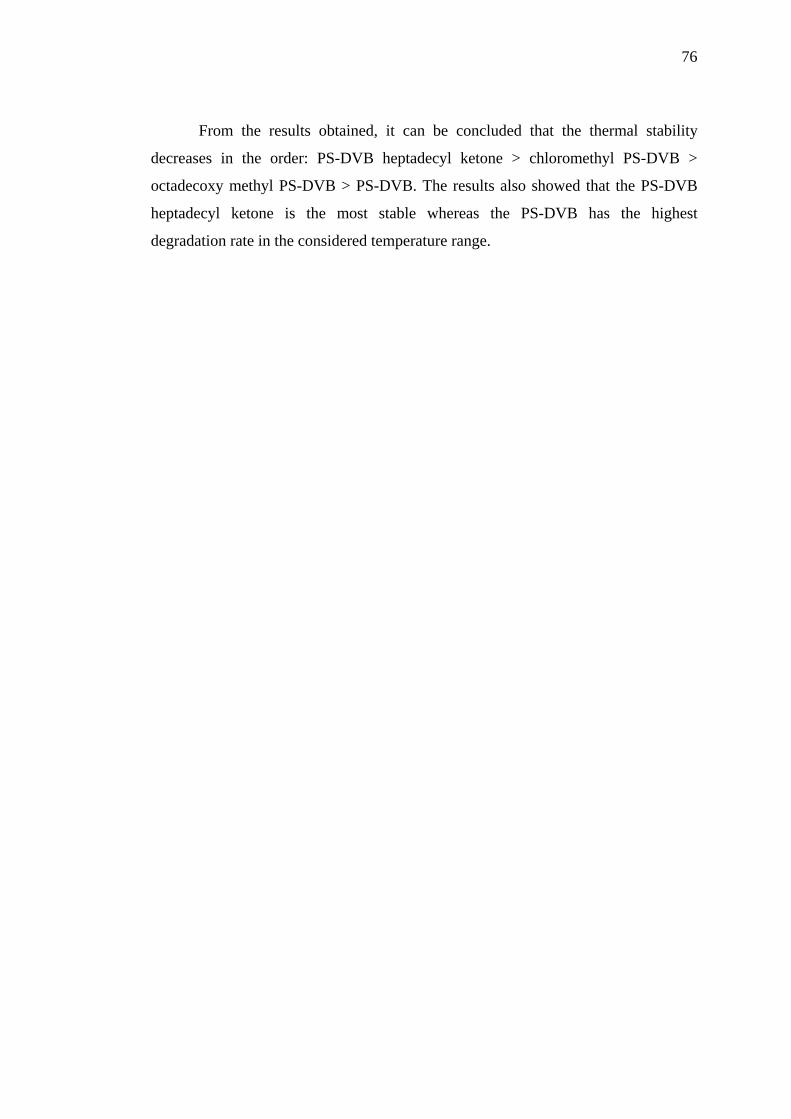
76
From the results obtained, it can be concluded that the thermal stability
decreases in the order: PS-DVB heptadecyl ketone > chloromethyl PS-DVB >
octadecoxy methyl PS-DVB > PS-DVB. The results also showed that the PS-DVB
heptadecyl ketone is the most stable whereas the PS-DVB has the highest
degradation rate in the considered temperature range.
CHAPTER 5
APPLICATION OF PS-DVB AND MODIFIED PS-DVB IN
SOLID PHASE EXTRACTION
5.1 Introduction
This chapter presents and discusses the experimental data obtained in
chemical characterization of the adsorbents through solid phase extraction (SPE)
analysis.
Gas chromatography (GC) is one of the most widely employed analytical
techniques today. The wide acceptance and success of this technique have been due
to such features as simplicity, rapidity of analysis, high sensitivity of detector
systems, efficiency of separations, varied applications, and the use of very small
samples (microgram or smaller). Presently GC is finding use in the concentration of
impurities in the parts per million (ppm) and parts per billion (ppb) ranges and in
addition to the actual measurement of impurities at these levels. Without the use of
GC, many analytical problems could not be solved or would involve more intricate
and time-consuming techniques [59].
78
SPE is selected due to its inherent advantages such as ease of maintenance
and automation, time and cost saving, and prevention of emulsion formation [17].
The principle of SPE is similar to liquid - liquid extraction involving a partitioning of
compounds between two phases. Objectives that can be possibly achieved on SPE
are removal of interfering compounds, pre-concentration of sample, and fractionation
of the sample into different compounds or group of compounds as in classical
chromatography. It also promotes storage of analytes that are unstable in a liquid
medium. Therefore, the SPE process can be carried out either on-line or off-line. The
experimental procedure using the SPE cartridges is known as offline SPE.
The adsorbents used in the research were home-made PS-DVB, PS-DVB
heptadecyl ketone, chloromethyl PS-DVB, and octadecoxy methyl PS-DVB. These
adsorbents were compared with commercial adsorbents, namely commercial PS-
DVB, and octadecyl silane bonded silica. The efficiency of the adsorbents that
utilized in SPE can be easily determined by examining the percentage recovery for
various test compounds. The concentrations and the percentage recovery for each test
compound were calculated using the equations given in 3.3 and 3.4 (Chapter 3).
5.2 Identification of Peaks for Test Compounds and Internal Standard
In this research, gas chromatography was chosen as the separation and
quantitative techniques for the solid phase extraction recovery study of the
adsorbents. The test compounds used in this research were benzaldehyde, 2-
chlorophenol, p-cresol and nitrobenzene. Butyrophenone was chosen as the internal
standard. Identification of each analyte was carried out by comparison of retention
times in chromatogram with standards.
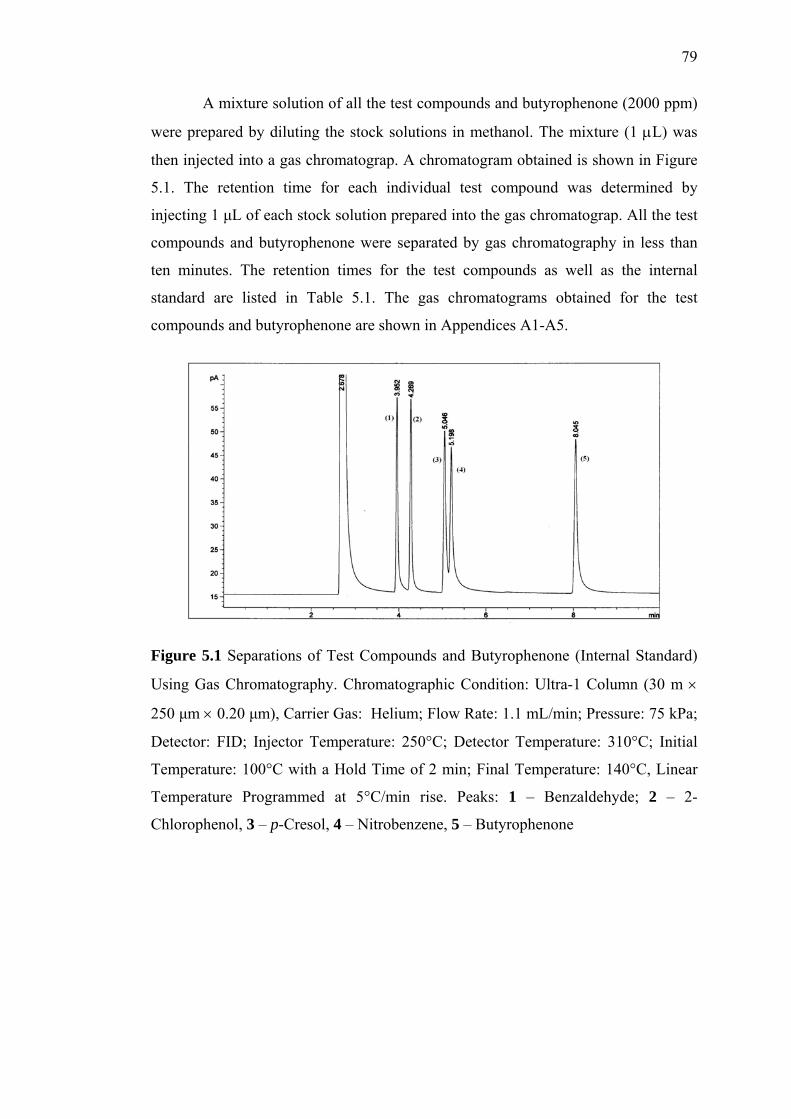
79
A mixture solution of all the test compounds and butyrophenone (2000 ppm)
were prepared by diluting the stock solutions in methanol. The mixture (1 μL) was
then injected into a gas chromatograp. A chromatogram obtained is shown in Figure
5.1. The retention time for each individual test compound was determined by
injecting 1 μL of each stock solution prepared into the gas chromatograp. All the test
compounds and butyrophenone were separated by gas chromatography in less than
ten minutes. The retention times for the test compounds as well as the internal
standard are listed in Table 5.1. The gas chromatograms obtained for the test
compounds and butyrophenone are shown in Appendices A1-A5.
Figure 5.1 Separations of Test Compounds and Butyrophenone (Internal Standard)
Using Gas Chromatography. Chromatographic Condition: Ultra-1 Column (30 m ×
250 μm × 0.20 μm), Carrier Gas: Helium; Flow Rate: 1.1 mL/min; Pressure: 75 kPa;
Detector: FID; Injector Temperature: 250°C; Detector Temperature: 310°C; Initial
Temperature: 100°C with a Hold Time of 2 min; Final Temperature: 140°C, Linear
Temperature Programmed at 5°C/min rise. Peaks: 1 – Benzaldehyde; 2 – 2-
Chlorophenol, 3 – p-Cresol, 4 – Nitrobenzene, 5 – Butyrophenone
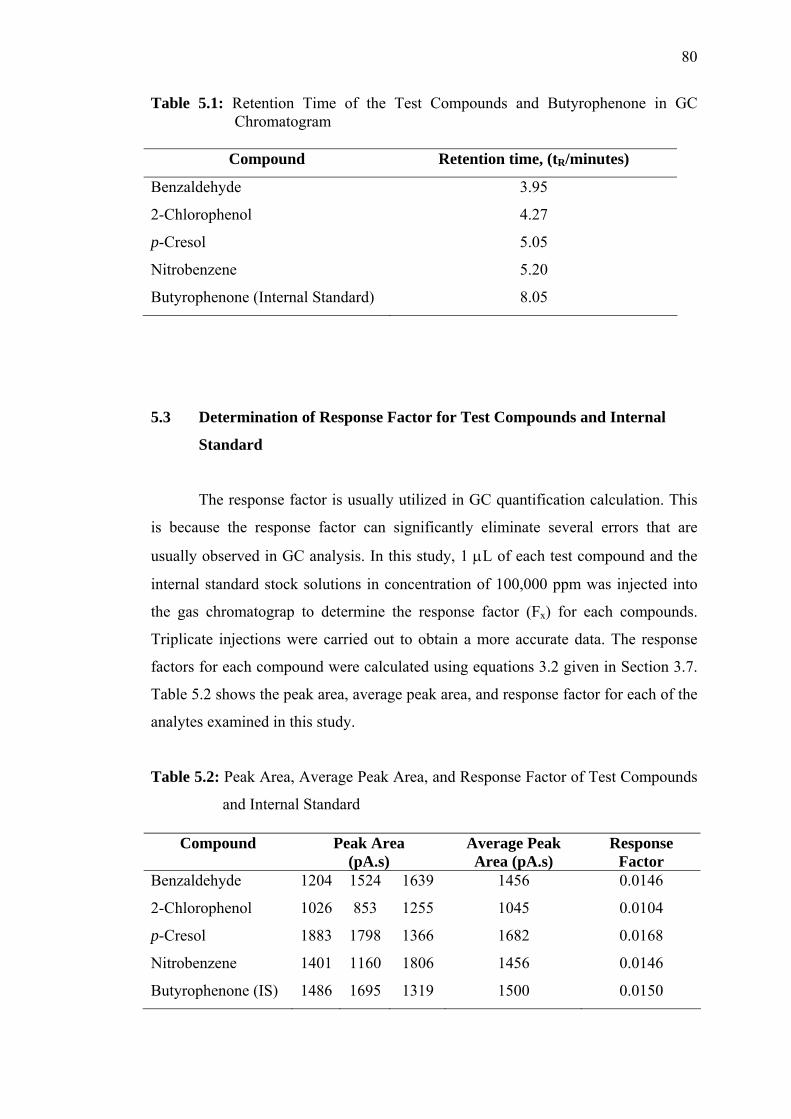
80
Table 5.1: Retention Time of the Test Compounds and Butyrophenone in GC Chromatogram
Compound Retention time, (tR/minutes)
Benzaldehyde 3.95
2-Chlorophenol 4.27
p-Cresol 5.05
Nitrobenzene 5.20
Butyrophenone (Internal Standard) 8.05
5.3 Determination of Response Factor for Test Compounds and Internal
Standard
The response factor is usually utilized in GC quantification calculation. This
is because the response factor can significantly eliminate several errors that are
usually observed in GC analysis. In this study, 1 μL of each test compound and the
internal standard stock solutions in concentration of 100,000 ppm was injected into
the gas chromatograp to determine the response factor (Fx) for each compounds.
Triplicate injections were carried out to obtain a more accurate data. The response
factors for each compound were calculated using equations 3.2 given in Section 3.7.
Table 5.2 shows the peak area, average peak area, and response factor for each of the
analytes examined in this study.
Table 5.2: Peak Area, Average Peak Area, and Response Factor of Test Compounds
and Internal Standard
Compound Peak Area (pA.s)
Average Peak Area (pA.s)
Response Factor
Benzaldehyde 1204 1524 1639 1456 0.0146
2-Chlorophenol 1026 853 1255 1045 0.0104
p-Cresol 1883 1798 1366 1682 0.0168
Nitrobenzene 1401 1160 1806 1456 0.0146
Butyrophenone (IS) 1486 1695 1319 1500 0.0150
81
5.4 Efficiency of Home-made PS-DVB, PS-DVB Heptadecyl Ketone, and
C18-Silica Adsorbents
The efficiency of PS-DVB, and PS-DVB heptadecyl ketone, PS-DVB and
C18-silica in SPE were investigated using various test compounds under individual
and simultaneous extraction conditions. The performances of the home-made PS-
DVB, PS-DVB heptadecyl ketone, and C18-silica were determined by the means of
percentage recovery of test compounds. In order to point out the statistical difference
of these results, t-test was evaluated at a confidence level of 95%. The evaluation of
the statistical test was determined by using the formula given in Section 3.5.6. Table
5.3 shows the comparison of recovery percentages and relative standard deviation
(R.S.D) values obtained using home-made PS-DVB, PS-DVB heptadecyl ketone,
and C18-silica adsorbents. The calculation of concentrations and the percentages
recovery of the test compounds are shown in Appendix B.
Based on the results obtained in Table 5.3, it was observed that the best
recoveries were achieved for all the test compounds using C18-silica as adsorbent.
Meanwhile, the recoveries obtained using home-made PS-DVB and PS-DVB
heptadecyl ketone were slight lower in relative with C18-silica. However, the PS-
DVB heptadecyl ketone showed an overall increase of recovery for all the test
compounds compared to the home-made PS-DVB.
Table 5.3: Comparison of Percentages of Recovery and Relative Standard Deviation
for the Extraction of Test Compounds Using Home-made PS-DVB, PS-
DVB Heptadecyl Ketone, and C18-silica as the Adsorbents
home-made PS-DVB PS-DVB heptadecyl ketone C18-silica Individual extraction
Mixture extraction
Individual extraction
Mixture extraction
Individual extraction
Mixture extraction Compound
% R RSD (%) % R RSD
(%) % R RSD (%) % R RSD
(%) % R RSD (%) % R RSD
(%) Benzaldehyde 55.74 1.58 41.85 9.25 63.63 3.71 67.09 4.04 69.86 4.07 85.77 3.71 2-Chlorophenol 44.33 4.39 15.81 8.50 82.70 6.30 65.30 4.28 83.87 4.26 89.21 6.30 p-Cresol 30.29 5.60 7.41 4.10 46.68 5.06 35.16 3.46 66.67 3.94 72.11 5.06 Nitrobenzene 64.02 5.42 71.01 4..95 69.15 2.67 79.39 2.65 86.42 3.54 76.35 2.67
82
According to the literature [40, 60], if the adsorbent packing process in SPE
tube is less efficient, it will cause the formation of empty space among the adsorbent
particles in the tube. The formation of this empty space will decrease the surface area
of the adsorbent that interact with the analytes, subsequently reduce the efficiency of
the adsorption, and desorption of the adsorbent. Adsorbent with large particle size
will also significantly decrease its surface area and lead to poor recovery percentages
of test compounds. In order to avoid this phenomenon, home-made PS-DVB was
ground and sieved to 400 mesh (38 μm). A total of approximately 500 mg of the
adsorbent was loaded into the SPE tube to form a bed of 1 cm × 1.5 cm I.D. A bed
height of more than 1 cm should be used to ensure good retention of the desired
sample compounds [48]. The resin was closely packed, because loose-packed resin
bed will cause the channeling of the analytes that can lead to poor recoveries.
Loosely packed adsorbent will also result in uncontrollable flow rate when
the SPE was carried out. In SPE system, the flow rate of the sample solution is one of
the most important parameters, which not only affects the recoveries of analytes, but
also controls the time of analysis [61]. Ersöz, et al. [62] reported that the adsorption
of analytes decreases with increasing flow rate. At higher flow rates, the contact time
of analytes with the adsorbent is short. Thus, the mass transport of the analytes to the
reactive sites of the adsorbent will reduce and decrease the retention of the analytes.
The home-made PS-DVB sorbent was closely packed in the tube, a flow rate of
approximately 1 mL/min was used to ensure the interaction between the analytes,
and adsorbent was sufficient and achieved good recoveries of the test compounds.
The low recoveries of PS-DVB might also be due to the hydrophobic surface
of the polymer. The consequence is poor surface contact with predominantly aqueous
solutions. Pretreatment of the PS-DVB with an activating solvent (methanol) must be
carried out to obtain better surface contact with the aqueous solution being extracted.
However, sometimes the activating solvent can gradually leach out of the resin,
causing the extraction to become ineffective [47]. As for PS-DVB heptadecyl ketone,
the hydrophilic character of the introduced functional groups increased its surface
polarity and improved the adsorbent wetting property. It was due to the ability of
polar surface to reduce the surface tension of the water that enabled the aqueous
sample to interact with the resin surface and enhanced the mass transfer of the
83
analytes from the water solution to the sorbents and resulted in higher recovery [3,
63, 43, 39].
For PS-DVB heptadecyl ketone, the recoveries were generally higher than
PS-DVB because the presence of the carbonyl groups on its surface allowed better
interaction with the methanol. On the other hand, ethyl acetate, acetonitrile, and
tetrahydrofuran were highly recommended and reported to be the suitable elution
solvent for PS-DVB and derivatized PS-DVB compared to methanol [8, 40, 47, 13].
Similar observations had also been reported by Schmidt et al. [48] in which the
recoveries for p-cresol was the highest using acetyl-PS-DVB (94%), followed by
underivatized PS-DVB (76%) and C18-silica (19%) when ethyl acetate was used as
the elution solvent.
PS-DVB heptadecyl ketone appeared to show significantly higher recoveries
with lower RSD values for all the test compounds tested compared to home-made
PS-DVB. These results were well expected because chemical modifications of the
PS-DVB with stearoyl groups had improved the efficiency of the SPE process by
increasing polar interactions with the functional groups of the analytes and thus
resulted in higher retention [3, 19, 29]. Similar observations had also been reported
by Masqué, et al. [5] on solid phase extraction of pesticides and phenolic compounds
from water.
The main reason why highest recoveries were achieved for all test
compounds using C18-silica was attributed to the type of elution solvent used in our
research. The elution sample should be allowed that the analytes always involves the
primary and secondary retention mechanisms between the analytes and adsorbent
and the elution solvent utilized should be compatible with the final analysis
technique too. Hence, in this experiment, methanol was chosen as the elution solvent
because it was less toxic compared to other solvent such as acetonitrile [13] and its
volatile characteristic was compatible to the subsequent gas chromatography
analysis. According to previous reports [40, 53, 64], methanol was found to be a
good elution solvent for the extraction of polar compounds using octadecyl silica
adsorbents. This was probably due to the hydroxyl group on methanol that
84
contributed to its polarity and enabled the solubility of analytes retained in the C18-
silica adsorbent.
The two dimensional illustration (Figure 5.2) shows the percentage recovery
of test compounds under individual and simultaneous extraction using home-made
PS-DVB, PS-DVB heptadecyl ketone, and C18-silica as adsorbent. The overall results
demonstrated high recoveries in the range of 67% - 99% using the C18-silica as an
adsorbent. However, lower recoveries in the range of 30%-99% were obtained when
the home-made PS-DVB used as the adsorbent.
0
20
40
60
80
100
120
Benzal
dehy
de
2-Chlo
rophe
nol
p-Cres
ol
Nitrobe
nzen
e
Test compound
Rec
over
y (%
)
C18 silicaPS-DVB PS-DVB heptadecyl ketone
Figure 5.2 Percentages of Recovery for Test Compounds Extracted Individually
Using Home-made PS-DVB, PS-DVB Heptadecyl Ketone, and C18-silica as the
Adsorbents
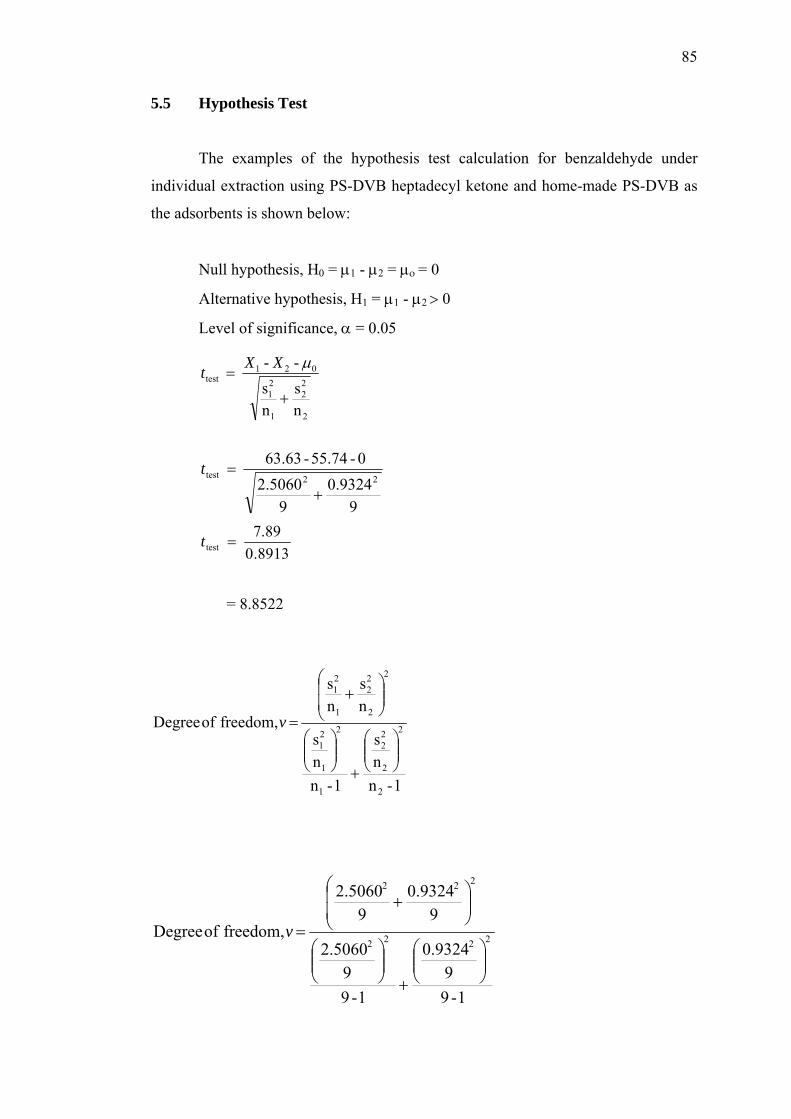
85
5.5 Hypothesis Test
The examples of the hypothesis test calculation for benzaldehyde under
individual extraction using PS-DVB heptadecyl ketone and home-made PS-DVB as
the adsorbents is shown below:
Null hypothesis, H0 = μ1 - μ2 = μο = 0
Alternative hypothesis, H1 = μ1 - μ2 > 0
Level of significance, α = 0.05
2
22
1
21
021test
ns
ns
- - +
=μXXt
90.9324
92.5060
0-55.74-63.63 22test
+
=t
8913.07.89 test =t
= 8.8522
1 - nns
1 - n
ns
ns
ns
freedom, of Degree
2
2
2
22
1
2
1
21
2
2
22
1
21
⎟⎟⎠
⎞⎜⎜⎝
⎛
+⎟⎟⎠
⎞⎜⎜⎝
⎛
⎜⎜
⎝
⎛⎟⎟⎠
⎞+
=v
1-99
0.9324
1-9
9
2.5060
90.9324
92.5060
freedom, of e Degre 2222
222
⎟⎟⎠
⎞⎜⎜⎝
⎛
+⎟⎟⎠
⎞⎜⎜⎝
⎛
⎜⎜
⎝
⎛⎟⎟⎠
⎞+
=v
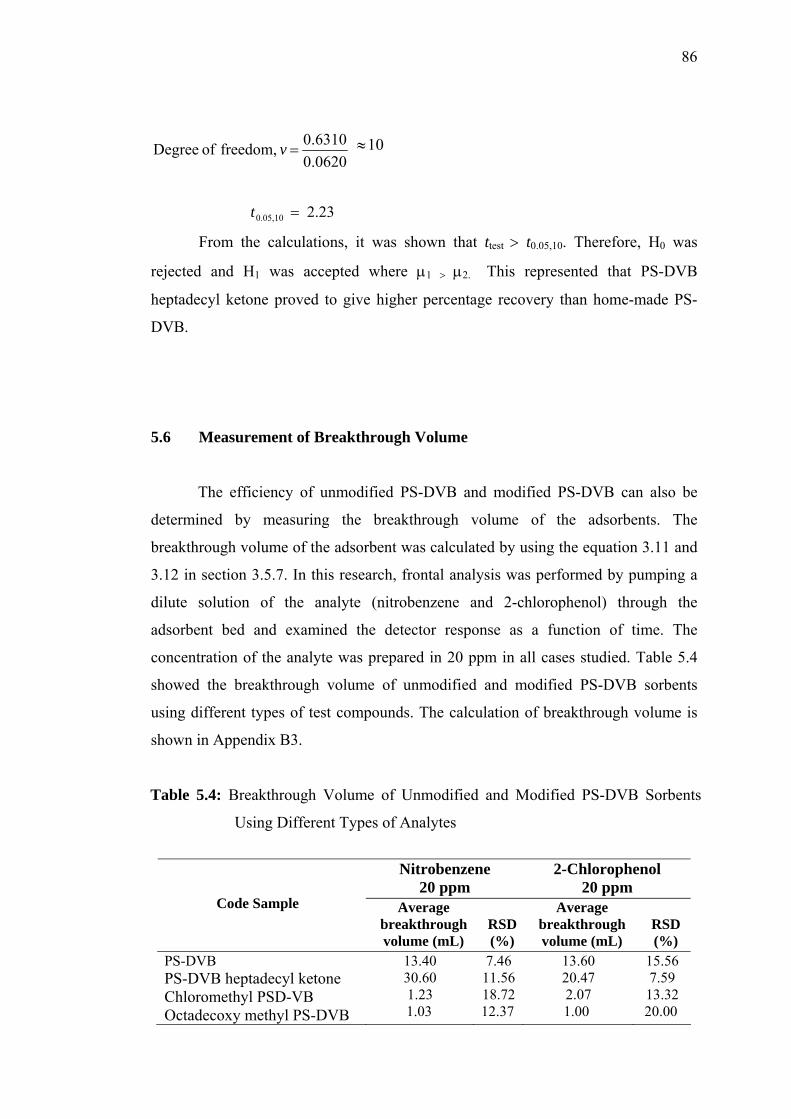
86
0620.06310.0 freedom, of Degree =v 10 ≈
2.23 0.05,10 =t
From the calculations, it was shown that ttest > t0.05,10. Therefore, H0 was
rejected and H1 was accepted where μ1 > μ2. This represented that PS-DVB
heptadecyl ketone proved to give higher percentage recovery than home-made PS-
DVB.
5.6 Measurement of Breakthrough Volume
The efficiency of unmodified PS-DVB and modified PS-DVB can also be
determined by measuring the breakthrough volume of the adsorbents. The
breakthrough volume of the adsorbent was calculated by using the equation 3.11 and
3.12 in section 3.5.7. In this research, frontal analysis was performed by pumping a
dilute solution of the analyte (nitrobenzene and 2-chlorophenol) through the
adsorbent bed and examined the detector response as a function of time. The
concentration of the analyte was prepared in 20 ppm in all cases studied. Table 5.4
showed the breakthrough volume of unmodified and modified PS-DVB sorbents
using different types of test compounds. The calculation of breakthrough volume is
shown in Appendix B3.
Table 5.4: Breakthrough Volume of Unmodified and Modified PS-DVB Sorbents
Using Different Types of Analytes
Nitrobenzene
20 ppm 2-Chlorophenol
20 ppm
Code Sample
Average breakthrough volume (mL)
RSD(%)
Average breakthrough volume (mL)
RSD (%)
PS-DVB PS-DVB heptadecyl ketone Chloromethyl PSD-VB Octadecoxy methyl PS-DVB
13.40 30.60 1.23
1.03
7.46 11.56 18.72 12.37
13.60 20.47 2.07
1.00
15.56 7.59
13.32 20.00
87
The breakthrough volumes for PS-DVB heptadecyl ketone was significantly
higher compared to those observed using other modifiers and unmodified PS-DVB.
The results (Table 5.4) indicate that the highest breakthrough volume for
nitrobenzene was obtained using PS-DVB heptadecyl ketone (30.60 mL), followed
by unmodified PS-DVB (13.40 mL), chloromethyl PS-DVB (1.23 mL), and
octadecoxy methyl PS-DVB (1.03 mL) as the adsorbent. In addition, higher
breakthrough volume was observed for PS-DVB heptadecyl ketone when lower
polarity analyte such as nitrobenzene (30.60mL) compared to the more polar 2-
chlorophenol (20.47 mL). These observations were similar to those described in the
literature [39], which reported that the retention volume and breakthrough volume
for the nitrobenzene was higher than the retention volume and breakthrough volume
for the more polar 2-chlorophenol using PS-DVB heptadecyl ketone. The PS-DVB
heptadecyl ketone is a resin that contains stearoyl chloride functional groups attached
to the benzene rings that alter the PS-DVB heptadecyl ketone retentive properties for
polar compounds. The incorporation of stearoyl groups on PS-DVB improved the
efficiency of the adsorbent by increasing the ability of the adsorbent to undergo polar
interactions with the polar analytes. Higher surface area on the stearoyl chloride-
modified PS-DVB adsorbent allocated higher interactions between solutes and
adsorbent and yielded higher retention of analytes. In addition, the presence of the
polar carbonyl groups on its surface that allowed better contact with solvent.
According to the acid-base Lewis theory, the benzene rings on PS-DVB and
the carbonyl group on PS-DVB heptadecyl ketone can be considered as a Lewis base
while the phenolic compounds (2-chlorophenol) can act as a Lewis acid. However,
the oxygen on the carbonyl group on PS-DVB heptadecyl ketone exhibited larger
dipole moment and resulted in better Lewis base property in relative with the
benzene ring on PS-DVB. Consequently, the interaction of phenolic compounds was
found to be much better by using PS-DVB heptadecyl ketone instead of PS-DVB
adsorbent.
Another possibility that lead to higher breakthrough volume when using PS-
DVB heptadecyl ketone compared to PS-DVB is the porosity and surface area of the
modified adsorbent. PS-DVB heptadecyl ketone is expected to be more porous and
has a relatively smaller pore size and higher surface area compared to the unmodified
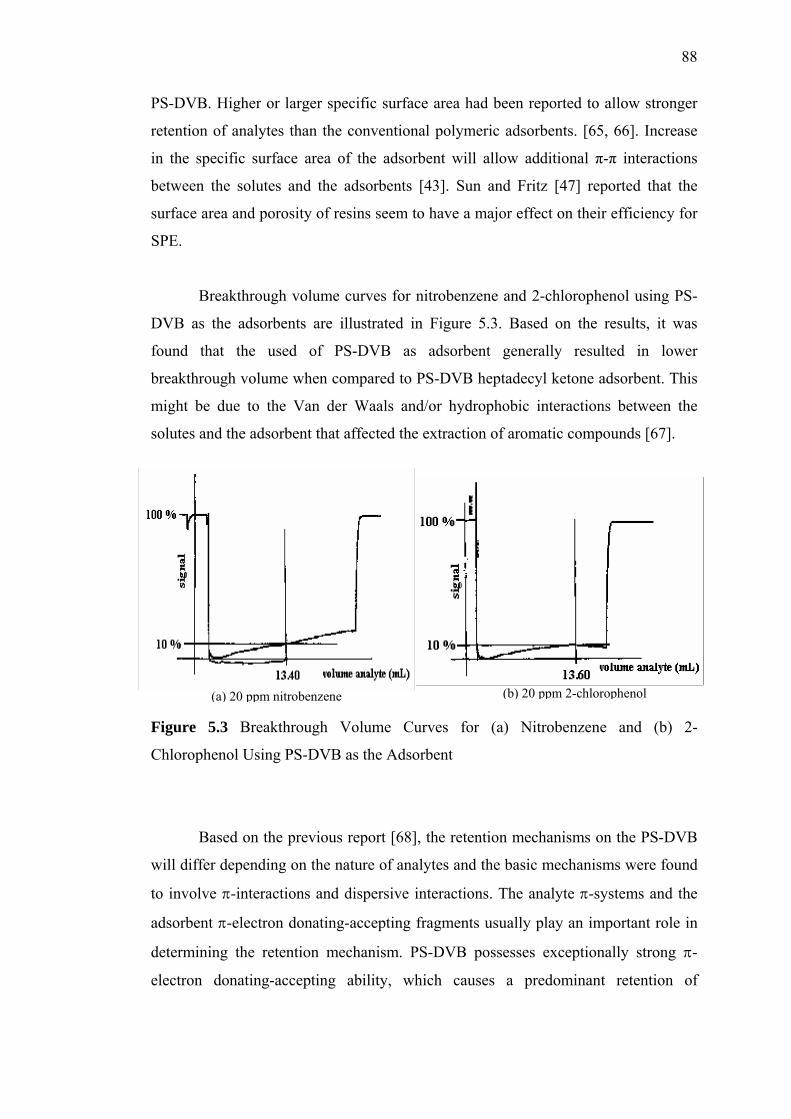
88
PS-DVB. Higher or larger specific surface area had been reported to allow stronger
retention of analytes than the conventional polymeric adsorbents. [65, 66]. Increase
in the specific surface area of the adsorbent will allow additional π-π interactions
between the solutes and the adsorbents [43]. Sun and Fritz [47] reported that the
surface area and porosity of resins seem to have a major effect on their efficiency for
SPE.
Breakthrough volume curves for nitrobenzene and 2-chlorophenol using PS-
DVB as the adsorbents are illustrated in Figure 5.3. Based on the results, it was
found that the used of PS-DVB as adsorbent generally resulted in lower
breakthrough volume when compared to PS-DVB heptadecyl ketone adsorbent. This
might be due to the Van der Waals and/or hydrophobic interactions between the
solutes and the adsorbent that affected the extraction of aromatic compounds [67].
(a) 20 ppm nitrobenzene (b) 20 ppm 2-chlorophenol
Figure 5.3 Breakthrough Volume Curves for (a) Nitrobenzene and (b) 2-
Chlorophenol Using PS-DVB as the Adsorbent
Based on the previous report [68], the retention mechanisms on the PS-DVB
will differ depending on the nature of analytes and the basic mechanisms were found
to involve π-interactions and dispersive interactions. The analyte π-systems and the
adsorbent π-electron donating-accepting fragments usually play an important role in
determining the retention mechanism. PS-DVB possesses exceptionally strong π-
electron donating-accepting ability, which causes a predominant retention of
89
compounds that contain aromatic π-systems or functional groups with lone electron
pairs such as carbonyl and nitro groups.
Previous report [68] also demonstrated an interesting regularity in the
retention of mono-, bi- and trisubstituted benzenes on polystyrene. The retention
increased with an increase of π-electron density gradients in molecules, which are
usually known as local dipoles. The electron resonance structures of the analyte
molecules were found to be applicable for the estimation of their retention. Retention
of bi- and trisubstituted benzenes on polystyrene was poorer than the
monosubstituted benzenes because in bi- and tri-substitution, the magnitude of the
resonance effect was poorer, thus resulted in minimum local π-electron density
dipoles. Therefore, in our study, it can be seen that 2-chlorophenol (bisubstituted
benzene) was less retained in relative with nitrobenzene (monosubstituted benzene)
on the PS-DVB adsorbent.
Breakthrough volume curve of nitrobenzene and 2-chlorophenol using PS-
DVB heptadecyl ketone as the adsorbent is illustrated in Figure 5.4. Based on the
results in Table 5.4, the use of PS-DVB heptadecyl ketone as adsorbent generally
resulted in higher breakthrough volume when compare to PS-DVB adsorbent. In
addition, breakthrough volumes for more polar compounds were generally lower
than the breakthrough volumes for less polar compounds using PS-DVB heptadecyl
ketone as adsorbent. 2-Chlorophenol predicted to be retained on the adsorbent via
primary interaction that involved the hydrogen bonding between the hydrogen from
hydroxyl groups of the analyte and the oxygen from the carbonyl groups on the
adsorbent.
90
(a) 20 ppm nitrobenzene (b) 20 ppm 2-chlorophenol
Figure 5.4 Breakthrough Volume Curves of (a) Nitrobenzene and (b) 2-
Chlorophenol Using PS-DVB Heptadecyl Ketone as the Adsorbent
In general, the breakthrough volumes were much better for nitrobenzene
compared to 2-chlorophenol on PS-DVB heptadecyl ketone adsorbent. Significant
improvement was observed when non-polar compound, nitrobenzene achieved
higher breakthrough volume on modified PS-DVB sorbent in relative with native PS-
DVB. The polymer can act as an electron donor for analytes having electron-
withdrawing or positive electron resonant capacity substituents. The degree of cross-
linking for the copolymer is also an important parameter that can explain the
differences in breakthrough volume among the adsorbents.
91
From Figure 5.5 and Figure 5.6, it was observed that the breakthrough
volume for chloromethyl PS-DVB and octadecoxy methyl PS-DVB were almost
identical. For chloromethyl PS-DVB adsorbent, the breakthrough volumes of
nitrobenzene and 2-chlorophenol as analytes were 1.23 mL, and 2.07 mL,
respectively, while for octadecoxy methyl PS-DVB the values were 1.03 mL and
1.00 mL, respectively.
(a) 20 ppm nitrobenzene (b) 20 ppm 2-chlorophenol
Figure 5.5 Breakthrough Volume Curves of (a) Nitrobenzene and (b) 2-
Chlorophenol Using Chloromethyl PS-DVB as the Adsorbent.
(a) 20 ppm nitrobenzene (b) 20 ppm 2-chlorophenol
Figure 5.6 Breakthrough Volume Curves of (a) Nitrobenzene and (b) 2-Chlorophenol Using Octadecoxy Methyl PS-DVB as the Adsorbent.
92
The unsatisfactory breakthrough volumes for chloromethyl PS-DVB and
octadecoxy methyl PS-DVB adsorbents were mostly attributed to the elution solvent
used in our study. The octadecoxy methyl PS-DVB has been shown to lack of
selectivity on polar compounds such as 2-chlorophenol and less polar compound
such as nitrobenzene.
In this research, a new method based on Williamson ether reaction was used
to modify PS-DVB. The applicability of octadecoxy methyl PS-DVB adsorbent was
the major interest in our current study. Nevertheless, the adsorbent have shown
unsatisfactory breakthrough volumes and poor percentage recovery compared to
other modified adsorbent such as PS-DVB heptadecyl ketone and chloromethyl PS-
DVB. The main reason why octadecoxy methyl PS-DVB adsorbent did not give an
expected high performance could be due to the incomplete preparation of octadecoxy
methyl PS-DVB. Hence, in the future study, the preparation should be improved in
order to avoid the presence of any impurities that will affect the efficiency of the
modified material when utilized as an adsorbent. The poor performance of
synthesized octadecoxy methyl PS-DVB could also probably due to the irregular
shape of the adsorbent particles as shown in Figure 4.20, as compare to spherical
shape particles of PS-DVB (Figure 4.3) and PS-DVB heptadecyl ketone (Figure
4.18). Spherical shaped adsorbents can be packed tightly, less channeling, and give
higher efficiency packing
CHAPTER 6
CONCLUSIONS AND SUGGESTIONS
6.1 Conclusions
In this study, PS-DVB adsorbents have been successfully synthesized and
modified via three different methods. The effects of reaction time and type of stirrer
used for the polymerization were studied in order to obtain suitable set of conditions
for PS-DVB adsorbents with excellent physical properties. The optimum reaction
time for polymerization was for 15 h at 80oC. The results have showed that cross-
blade impeller stirrer gave a particle size of PS-DVB approximately 74 μm.
According to the nitrogen adsorption characterization, the use of a cross-blade
impeller stirrer gave a smaller average pore diameter (38.40 Å) compared to a half-
moon impeller (183.58 Å) and a double cross blade impeller (76.19 Å). The reaction
time indicated that 15 h gave a larger average pore diameter (300.42 Å) compared
with those for 1 h (35.33 Å), 5 h (76.19 Å), 10 h (163.59 Å), and 20 h (65.08 Å).
94
The surface characteristics of unmodified PS-DVB and modified PS-DVB
adsorbents, i.e. PS-DVB heptadecyl ketone, chloromethyl PS-DVB, and octadecoxy
methyl PS-DVB were determined by using fourier transform infrared
spectrofotometry, scanning electron microscopy, thermogravimatric analysis,
nitrogen adsorption analysis. In general, the modified PS-DVB adsorbents were
mesoporous.
The FTIR spectra for home-made PS-DVB (unmodified) were similar to the
FTIR spectra of the commercial PS-DVB suggesting that the home-made PS-DVB
has the same structural properties as the commercial PS-DVB. As for PS-DVB
heptadecyl ketone, the FTIR analysis showed a carbonyl band at 1684.7 cm-1 which
was related to ketonic (C=O) stretching. This indicated the incorporation of the
stearoyl functional groups to the PS-DVB. Meanwhile, the similarities between the
spectra of commercial PS-DVB, home-made PS-DVB and PS-DVB heptadecyl
ketone also suggested that the basic structural units of PS-DVB were preserved in the
polymer.
The SPE efficiencies of the home-made PS-DVB, PS-DVB heptadecyl
ketone adsorbents and C18-silica, were determined by means of percentage recovery
of test compounds. Excellent recoveries of more than 70% and good reproducibility
(R.S.D. between 2% and 7%) were obtained using C18-silica as the adsorbent. When
all the test compounds were extracted simultaneously by C18-silica as the adsorbent,
average recoveries were between 69% and 87% and low relative standard deviation
(R.S.D. between 3% and 4%) were achieved. Overall, both individual and mixture
extractions yield higher recoveries for the compounds of lower polarity, nitrobenzene
and benzaldehyde compared to the more polar compound, p-cresol with the lowest
percentage of recovery. This was attributed to the non-polar nature of the C18-silica
that favours the non-polar interaction between the less polar analytes and the
adsorbent. The only exception was for 2-chlorophenol. It is a more polar compound
but has the highest percentage of recovery due to the accessibility of the analyte to
the polar silanol group of the adsorbents resulted in the hydrogen bonding (between
the analyte and the adsorbents, the polarity of the elution solvent used). 2-
Chlorophenol was the first compound extracted by the newly packed C18-silica SPE
95
tube as there are no interferences present in the newly packed adsorbent, thus yield
higher recovery.
For the home-made PS-DVB, the recoveries for all the four phenolic and
substituted aromatic compounds that have been individually extracted were between
30% and 65% and good reproducibility with relative standard deviation between 1%
and 6% were obtained. All the test compounds were extracted simultaneously, the
average recoveries were between 7% and 72% and low relative standard deviation
with R.S.D. between 4% and 10% were achieved. Overall, for both extractions,
higher recoveries were obtained from the compounds of lower polarity which are
nitrobenzene and benzaldehyde compared to the more polar compounds, 2-
chlorophenol and p-cresol. This was attributed to the non-polar and hydrophobic
nature of the PS-DVB that favours the non-polar interaction between the less polar
analytes and the adsorbent.
For the PS-DVB heptadecyl ketone adsorbent, high recoveries between 63%
and 83% as well as good reproducibility with relative standard deviation between 2%
and 7% were obtained (except for p-cresol that gave a recovery of 46.68%). This
was probably due to the channelling of analytes when the test compounds were
individually extracted. When the entire test compounds were extracted
simultaneously, the average recoveries obtained were between 35% and 80% and
low relative standard deviation between 2% and 5% were achieved. In the individual
extraction, the less polar compounds exhibit lower recoveries compared to the more
polar compounds while in the mixture extraction, highest recoveries were obtained
for the compounds of lower polarity compared to the more polar compounds. Thus,
it can be concluded that for this adsorbent, the less polar analytes will be extracted
through interactions with the hydrophobic part of the polymer, while more polar
analytes will be retained by the carbonyl groups. Subsequently, PS-DVB heptadecyl
ketone is a suitable adsorbent used in solid phase extraction for all types of organic
compounds in a wide polarity range.
96
The best recoveries were achieved with C18-silica while the recoveries
obtained from synthesized PS-DVB and PS-DVB heptadecyl ketone were lower,
which was attributed from the elution solvent that was used. Methanol is a better
elution solvent for the extraction of polar compounds with C18-silica adsorbents due
to its polarity and enables the dissolution of analytes retained in the C18-silica
adsorbent, but is a weak elution solvent for PS-DVB adsorbent because the hydroxyl
group gives poor surface contact with the polymer. However, PS-DVB heptadecyl
ketone has significantly higher recoveries compare to PS-DVB because the presence
of the carbonyl groups on its surface allowed better contact with the methanol. The
incorporation of stearoyl groups on PS-DVB improved the efficiency of the
adsorbent by increasing polar interactions with the polar analytes. Higher surface
area of the PS-DVB heptadecyl ketone allowed more interactions with the solutes
and yielded higher retention of analytes. The strearoyl group hydophilicity increased
the PS-DVB heptadecyl ketone’s surface polarity and enabled the aqueous sample to
have better contact with the resin surface and enhancing the mass transfer of analytes
to the sorbents thus produce higher recoveries.
Based on this study, modified PS-DVB obtained by using stearoyl chloride
was better than using chloromethyl-styrene and linkage ether. The result indicated
that PS-DVB heptadecyl ketone adsorbent has higher breakthrough volume either
using nitrobenzene or 2-chlorophenol as the analytes at 30.60 mL and 20.7 mL,
respectively, with its % R.S.D. was 11.56% and 7.59% compared to other modified
PS-DVB or unmodified PS-DVB. Breakthrough volume for chloromethyl PS-DVB
using nitrobenzene and 2-chlorophenol as the analytes were 1.23 mL and 2.07 mL,
respectively. The breakthrough volumes for octadecoxy methyl PS-DVB were 1.03
mL (nitrobenzene) and 1.00 mL (2-chlorophenol).
Based on the results, PS-DVB heptadecyl ketone was found to be a better
adsorbent compared to other modified and unmodified PS-DVB. But in this study,
the chloromethyl PS-DVB and the octadecoxy methyl PS-DVB had not been
successfully modified and consequently, their breakthrough volume and percentage
recovery were lower compared to unmodified PS-DVB.
97
6.2 Suggestions
Through this study, several important aspects are recommended for future
study in order to gain better performance to modify PS-DVB resins.
The characteristics of PS-DVB beads obtained were different compared to
those of commercial PS-DVB. The average particle size of commercial PS-DVB
beads was small and their shapes were spherical, whereas the average particle size of
the home-made PS-DVB was larger. The home-made PS-DVB particles obtained
were also spherical in shape. In order to get better results in the future, we are on the
lookout for more regular particle size, and homogeneous surface morphology. We
are looking forward to establish the effect of temperature, amount of DVB, and the
design of stirrer. In this study, the concentration of DVB was 8% by weight.
Generally, the percentage of smaller pores increases with larger amounts of DVB,
which 10-20% by weight will likely to give the better results than the previous work.
Higher polymerization temperature results in smaller pores. In this study, the
polymerization temperature was at 70oC. It is expected that the use of higher
temperatures will result in smaller pores and smaller particles.
The steps of modified PS-DVB in this study involved three steps, namely:
• Friedel Crafts acylation
• Chloromethylation of PS-DVB
• Williamson ether reaction
The resulting modified PS-DVB showed a disadvantage where the breakthrough
volumes for the chloromethyl PS-DVB (chloromethylation of PS-DVB) and
octadecoxy methyl PS-DVB were lower compared to unmodified PS-DVB. To solve
this problem, chloromethyl PS-DVB can be prepared by using chloromethyl methyl
ether to produce better adsorbents, and also could be used for non-polar analytes.
In this work, using tubes or cartridges performed SPE. Hence, a bed height
of more than 1 cm is usually used to ensure good retention of the desired sample
compounds. However, this necessitates a relatively large volume of solvent to elute
the adsorbed compounds. Further studies could be conducted by packing a tube with
98
disks 5-7 mm in diameter, cut from resin-loaded membranes. It would be possible to
obtain efficient extraction with very short height of resin membrane. The reason for
this is that the resin particles are closely packed, and evenly dispersed throughout the
membrane. Since the particles are immobilized, it should be possible to avoid the
channelling that would be likely in a tube containing only short height of a loose
resin bed [48].
SPE with chemically modified sorbents has been carried out in the off-line
and on-line modes by León-González and Pérez-Arribas [3]. In this work, SPE was
carried out in the off-line mode. So further studies could be conducted to carry out
SPE with unmodified PS-DVB or modified PS-DVB sorbents in the on-line mode.
On-line procedures use an extraction sorbent in a pre-column. The methods, which
combine SPE with HPLC, are the most frequently used, mainly to determine polar
compounds in water. In the on-line procedures, there is no sample manipulation
between preconcentration and analysis, so loss and contamination risks are avoided.
Further more, detection limits and reproducibility values can be better. The off-line
SPE can solve this problem too by looking for others method to fit in with our
conditions. In this study, the analytes used were nitrobenzene and 2-chlorophenol in
20 ppm, perhaps the concentration of the analytes can be reduced lower than 20 ppm,
or by looking for other analytes, which are more polar to suit the adsorbents.
As discussed previously [8, 40, 47, 13], ethyl acetate, acetonitrile and
tetrahydrofuran are highly recommended and reported to be the suitable elution
solvents for PS-DVB and modified PS-DVB as compared to methanol. Methanol is
a weak elution solvent for PS-DVB adsorbent because present of the hydroxyl group
on methanol makes it less solvate on the surface of the polymer. In this experiment,
methanol was used as the elution solvent that resulted in lower recoveries for both
PS-DVB and modified PS-DVB adsorbents. So, using ethyl acetate or acetonitrile as
the elution solvent for PS-DVB and modified PS-DVB sorbents can carry out further
studies. Higher breakthrough volume for modified PS-DVB or PS-DVB polymeric
resins are well expected by using the recommended elution solvents.
REFERENCES
1. Coutinho, F.M.B., Barbosa, C.C.R., and Rezende, S.M. Copolymers Based
on Styrene and Divinylbenzene Synthesized in the Presence of PE HPA
(Polyethylene Hydroxy Propyl Acrylate) Structural Characterization. J.
Europe. Polym., 1990. 31:1243-1250.
2. Iayedene, F., Guettaf, H., Bencheikh, Z., Saggou, A., and Rabia, I. 2-Ethyl -
Hexanol and n-Heptane Diluents Mixture Effect on Textural Characteristic of
Porous Styrene-Divinylbenzene Copolymer Beads. J. Europe. Polym., 1996.
32:1091-1092.
3. Leon-Gonzalez, M.E., Perez-Arribas, L.V. Chemically Modified Polymeric
Sorbents for Sample Preconcentrations. J. Chromatogr. A, 2000. 902:3-16.
4. Cantwell, F.F., Li, J. Influence of Solvent Uptake and Swelling by Poly
(Styrene-Divinylbenzene) Column Packing on Sample Sorption Rate and
Band Broadening in Reversed Phase Liquid Chromatography. J. Chromatogr.
A, 1999. 835:3-18.
5. Masque, N., Galia, M., Marce, R.M., Borrull, F. Chemically Modified
Polymeric Resin Used as Sorbent in a Solid-Phase Extraction Process to
Determine Phenolic Compounds in Water: J. Chromatogr. A, 1997. 771:55-
61.
6. Rogers V., Smith P.W.G. Text Book of Practical Organic Chemistry. 4th ed.
New York: Longman London. 1978.
100
7. Bethmont, V., Fache, F., and Lemuire, M. Alternative Method to
Williamson’s Synthesis of Ethers. Tetrahedron Letters, 1995. 36:4235-4236.
8. Galceran, M.T., Jouregui, O. Determination of Phenols in Sea Water by
Liquid Chromatography with Electrochemical Detection after Enrichment by
Using Solid-Phase Extraction Cartridges and Disks. Analytica Chimica. Acta,
1995. 304:75-84.
9. Gelencser A., Kiss G., Krivacsy Z., Puchony Z.V., and Hlavay J. A simple
Method for the Determination of Capacity Factor on Solid Phase Extraction
Cartridges. I. J. Chromatogr. A, 1995. 693:217-225.
10. Bert Ooms, J.A., Marvan Gills, G.J., Duinkerken, A.R., Halmingh, O.
Development and Validation of Protocols for Solid-Phase Extraction Coupled
to IC and IC-MS. 2000: 52-57.
11. Abrams I.M., Millar J.R. A History of the Origin and Development of
Macroporous Ion-Exchange Resins. J. Reactive & Functional Polymers,
1997. 35:7-22.
12. Chen, I., Feldman, H., Augenblick J. and Bread Danah. The Development
and Analysis of Water-Repellent Polystyrene Derivatives. J. The PGSS,
1992. 177-200.
13. Jonsson S., Boren, H. Analysis Mono and Diesters of o-Pthalic Acid by Solid
Phase Extraction with Polystyrene-Divinylbenzene Based Polymers. J.
Chromatogr. A, 2002. 963:399-400.
14. Balakrishnan, T., Ford W. Particle Size Control in Suspension Co-
polymerization of Styrene, Chloromethylstyrene and Divinylbenzene. J. Appl.
Polym. Sci., 1982. 27:133-138.
101
15. Claudio L., and Monica, R.M.P. Synthesis of Cross-Linked Resin Based on
Methacrylamide, Styrene and Divinylbenzene Obtained from Polymerization
in Aqueous Suspension. J. Europe. Polym., 2003. 39:291-296.
16. Klampf C.W., and Spanos, E. Separation of Priority Pollutant Phenols on
Chemically Modified Poly (Styrene-Divinylbenzene) Resins by High
Performance Liquid Chromatography. J. Chromatogr. A, 1995. 715:213-218.
17. Diana L.A., James, S.F., Michael, R., Buchemeiser, Norbert, A., and
Gaunther, K.B. New High-Capacity Carboxylic Acid Functionalized Resins
for Solid Phase Extraction of a Broad Range of Organic Compounds. J.
Chromatogr. A, 1997. 786:259-268.
18. Yang, Y.B., Harrison, K., and Kindsvater, J. Characterization of a Novel
Stationary Phase Derived from a Hydrophilic Polystyrene Based on Resin for
Protein Cation-Exchange High Performance Liquid Chromatography. J.
Chromatogr. A, 1996. 723:1-10.
19. Allcock, H.R. and Lampe, F.W. Contemporary Polymer Chemistry. 2nd ed.
Englewood Cliffs, New Jersey: Prentice-Hall. 1990; 5, 47, 50-51, 58, 60, 153
20. Carraher, C.E. and Dekker, M.Jr. Polymer Chemistry. 6th ed. Florida, USA:
Inc. 2003; 194-195, 299-300, 301-302, 310-311
21. Billmeyer, W.F. Text Book of Polymer Science. 3rd ed. London: John Willey
& Sons. 1984.
22. Odion,G. Principles of Polymerization. New York: McGraw-Hill Book
Company. 1970; 18-19, 270
23. Nail Handerson, J. (Ed.). Polymerization reactors and process: Goodyear Tire
Rubber Company: American Chemical Society symposium 104, Washington,
D.C. 1979.
102
24. Arshady, R. Guyot, A. Lin, J. Priddy, D.B. Rusanov, A.L. Sherington, D.C.
Tauer, K. Polymer Synthesis. New York: Spinger-Verlag. 1994.
25. Frantisek K. Homogeneous and Heterogeneous Sulfonation of Polymers. Rev.
Polym. Eng. Sci., 1998. 38:783-792.
26. Arshady, R. Beaded polymer supports and gels II. Physico-Chemical Criteria
and Functionalization. J. Chromatogr. A, 1991. 586:199-219.
27. Buchmeiser, M.R. New Synthetic Ways for the Preparation of High
Performance Liquid Chromatography Supports. J. Chromatogr. A, 2001. 918:
233-266.
28. Leofanti, G., Padovan, M., and Tozzola, G. Surface Area and Pore Texture of
Catalysts. Catalysts Today, 1998. 41:207-219.
29. Munir Ahmed, Mohd.Airf Malik, Shahid Pervez, and Mohd.Raffiq. Effect of
Porosity on Sulfonation of Macroporous Styrene-divinylbenzene Beads. J.
Europe Polym., 2004. 40:1609-1613.
30. Nash, D.C., Greath, G., E., and Howard, A.C. Modification of Polystyrenic
Matrices for the Purification of Proteins Effect of the Adsorption of Poly
(Vinyl Alcohol) on the Characteristics of Polystyrene-Divinylbenzene Beads
for Use in Affinity Chromatography. J. Chromatogr. A, 1997. 758:53-64.
31. Xu, H. and Xizhang H. Preparation of Anion Exchangers by Reductive
Amination of Acetylated Cross-Linked Polystyrene. Reactive and Functional
Polymer, 1999. 42:235-242.
32. Chambers, T.K. and Fritz, J.S. Effect of Polystyrene-Divinylbenzene Resin
Sulfonation on Solute Retention in High Performance Liquid
Chromatography. J. Chromatogr. A, 1997. 797:139-147
103
33. Rabia, I., Zerouk, J., Kerkouche, M.K., and Belkhodja, M. Chemically and
Textural Characteristics of Porous Styrene-Divinylbenzene Copolymers as a
Function of Chlorosulfonation Reaction Parameters. Reactive and Functional
Polymers, 1996. 28:279-28
34. Poinescu, Ig.C. Camelia, B., and Christina, V. Styrene-Divinylbenzene
Copolymers: Influence of the Diluents on Network Porosity. J. Appl. Polym.
Sci., 1984. 29:23-34.
35. Bacquet, M., Salunkhe, M., and Caze, C. Influence of Chlorosulfonation on
Textural Chemical Parameters of Styrene-Divinylbenzene Porous
Copolymers. Reactive Polymer, 1992. 16:61-69
36. Biermann, U. Lutzen, A. Marcel, S.F. and Metzger, J.O. Regioselective
Cationic1,2-and1,4-additions Forming Carbon-Carbon Bond to Methyl
Santalbate a Conjugated Enzyme. J. Org. Chem. Europe., 2000: 3069-3073.
37. Bacquet, M., and, Caze, C. Spatial Distribution of Pendent Vinyl Groups
During Chloromethylation of Macroporous Styrene-Divinylbenzene
Copolymers. Reactive Polymers, 1988. 9:147-153.
38. Theodoropoulos, G. Bouranis, D.L. and Valkanas, G.N. Efficient”One-Pot”
Synthesis of Suspension Crosslinked Sulfonated Polystyrene Via a Friedel-
Crafts Reaction. J. Appl. Polym. Sci., 1992. 46:1461-1465.
39. Dumont, P.J., and Fritz, J.S. Effect of Resin Sulfonation on the Retention of
Polar Organic Compounds in Solid-Phase Extraction. J. Chromatogr. A,
1995. 691:123-131.
40. Salawati Subuh, Mohd.Marsin Sanagi, Ahmedy Abu Naim, and Asiah
Hussain. Pembangunan danPenggunaan Bahan Penjerap dan Fasa Pegun
dalam Analisis Kimia. Laporan Akhir Penyelidikan IRPA Vot 72298,
University Teknologi Malaysia; 2002.
104
41. Mahdavian A.R., and Khoee S. A facile and Efficient Method for Preparation
of Chiral Supported Poly (Styrene-Divinylbenzene) Copolymers. Reactive
and Functional Polymer, 2002. 50:217-223.
42. Dominic, C.N, and Howard, A. Modification of Polystyrenic Matrices for the
Purification of Proteins. II: Effect of the Degree of Glutaraldehyde-Poly
(Vinyl Alcohol) Crosslinking on Various Dyes Ligand Chromatography
Systems: J. Chromatogr. A, 1997. 776:55-63.
43. Masque, N., and Galia, M. New Chemically Modified Polymeric Resin for
Solid Phase Extraction of Pesticides and Phenolic Compounds from Water: J.
Chromatogr. A, 1998. 803:147-155.
44. Powell, M.W. Development of a Binary Solid-Phase Extraction Cartridge
Use in Screening Water Sample for Organic Pollutants. J. Chromatogr. A,
1995. 697:101-105.
45. Schmidt, L., and Fritz, J.S. Ion-Exchange Preconcentration and Group
Separation of Ionic and Neutral Organis Compounds. J. Chromatogr. A,
1993. 640:145.
46. Smigol, V., and Svec, F. Synthesis and Properties of Uniform Beads Based
on Macroporous Copolymer Glycidyl Methacrylate-Ethylene Dimethacrylate:
A way to Improve Separation Media for HPLC. Journal of Appl. Polym. Sci.,
1992. 46:1439.
47. Sun, J.J., and Fritz, J.S. Chemically Modified Resins for Solid Phase
Extraction. J. Chromatogr. A, 1992. 590:197-202.
48. Schmidt, L., Sun, J.J., Hagen, D.F., Markelle, C.G., and Wisted, E.E. Solid-
Phase Extraction of Phenols Using Membranes Loaded with Modified
Polymeric Resins. J. Chromatogr. A, 1993. 641:57-61.
105
49. Dai J., Yang X., and Carr P.W. Comparison of the Chromatography of
Octadecyl Silane Bonded Silica and Polybutadiene-Coated Zirconia Phases
Based on A Diverse Set of Cationic Drugs. J. Chromatogr. A, 2003.
1005:63-82.
50. Camel,V. Solid-Phase Extraction of Trace Elements. Spetrochimica Acta B,
2003. 58:1177-1233.
51. Yu, J.C., Jiang, Z.T., Liu, H.Y., Yu, J. and Zhang, L. β-Cyclodextrin
Epichlorohydrin Copolymer as A Solid-Phase Extraction Adsorbent for
Aromatic Compounds in Water Samples. Anal. Chim. Acta, 2003. 477:93-
101.
52. Lindström, A., Albertsson, A. and Hakkarainen, M. Development of a Solid
Phase Extraction Method for Simultaneously Extraction of Adipic Acid,
Succinic Acid and 1,4-butanediol Formed During Hydrolysis of
Poly(butylenes adipate) and Poly(butylenes succinate). J. Chromatogr. A,
2004. 1022:171-177.
53. Meloa, L.F.C., Collins, C.H. and Jardin, C.S.F. New Materials for Solid-
Phase Extraction and Multiclass High-Performance Liquid Chromatography
Analysis of Pesticides in Grapes: J. Chromatogr. A, 2004. 1032:51-58
54. Mayer, D.L., and Fritz, J.S. Silicate as a Sorbent for Solid Phase Extraction.
J. Chromatogr. A, 1997. 771:45-53.
55. Fritz, J.S., and Masso, J. J. Miniaturized Solid-Phase Extraction with Resin
Disks. J. Chromatogr. A, 2001. 909:79-85.
56. Fritz, J.S., Dumont, P.J., and Schmidt, L.W. Methods and Materials for Solid-
Phase Extraction. J. Chromatogr. A, 1995. 691:133-140.
57. Mohd. Marsin Sanagi. Teknik Pemisahan dalam Analisis Kimia. Universiti
Teknologi Malaysia, Skudai, Johor Darul Ta’zim.1998.
106
58. Aspinall, H.C. Greeves,N. Man Lee, W., Mclver, E.G., and Smith, P.M. An
Improved Williamson Etherification of Hindered Alcohols promoted by 15-
Crown-5 and Sodium Hydride. Tetrahedron Letters, 1997. 38: 4679-4682.
59. Grob, R.L. Modern Practice of Gas Chromatography. 2nd ed. New York:
John Wiley & Sons. 1985; 1-3, 214, 240.
60. Tham Ee Mun, Chemical Characterization and Application of Poly (Styrene-
Divinylbenzene) and C18 Modified PS-DVB Adsorbent: Solid Phase
Extraction (SPE) of Test Compounds. Tesis Ijazah Sarjana Muda Sains.
Universiti Teknologi Malaysia; 2004.
61. Cai, Y.Q., Jiang, G.B., Liu, J.F. and Zhou, Q.X. Multi-Walled Carbon Nano
Tubes Packed Cartridge for the Solid Phase Extraction of Several Phatalates
Esters from Water Samples and Their Determination by High Performance
Liquid Chromatography. Anal. Chim. Acta, 2003. 494:149-156.
62. Ersöz, A., Say, R. and Denizli, A. Ni (II) Ion-Imprinted Solid Phase
Extraction and Preconcentration in Aqueous Solutions by Packed-bed
Columns. Anal. Chim. Acta, 2004. 502:91-97.
63. Bagheri, H. and Mohammadi, A. Pyrrole-based Conductive Polymer as the
Solid-Phase Extraction Medium for the Preconcentration of Environmental
Pollutants in Water Samples Followed by Gas Chromatography with Flame
Ionization and Mass Spectrometry Detection. J. Chromatogr. A, 2003. 1015:
23-30.
64. Yi, L. and Pietrzyk, D.J. Capillary-electrochromatographic Separations with
Copolymeric Reversed Stationary Phase and Ion Exchanger Packed Columns.
J. Chromatogr. A, 2001. 920:367-375.
107
65. Weigel, S., Kallenborn, R. and Hühnerfuss, H. Simultaneous Solid-phase
Extraction of Acidic, Neutral and Basic Pharmaceuticals from Aqueous
Samples at Ambient (Neutral) pH and Their Determination by Gas
Chromatography-Mass Spectrometry. J. Chromatogr. A, 2004. 1023:183-195.
66. Fontanals, N., Galià, M., Marcé, R.M. and Borrull, F. Solid Phase Extraction
of Polar Compounds with a Hydrophilic Copolymeric Sorbent. J.
Chromatogr. A, 2004. 1030:63-68.
67. Klingenberg, A. and Seubert, A. Sulfoacylated Poly (Styrene-
Divinylbenzene) Copolymers as Resins for Cation Chromatography.
Comparison with Sulfonated, Dynamically Coated and Silica Gel Cation
Exchangers. J. Chromatogr. A, 2002. 946: 91-97.
68. Sychov, C.S., Ilyin, M.M., Davankov, V.A. and Sochilina, K.O. Elucidation
of Retention Mechanisms on Hyper Cross-Linked Polystyrene Used as
Column Packing Material for High-Performance Liquid, Chromatography. J.
Chromatogr. A, 2004. 1030:17-24.
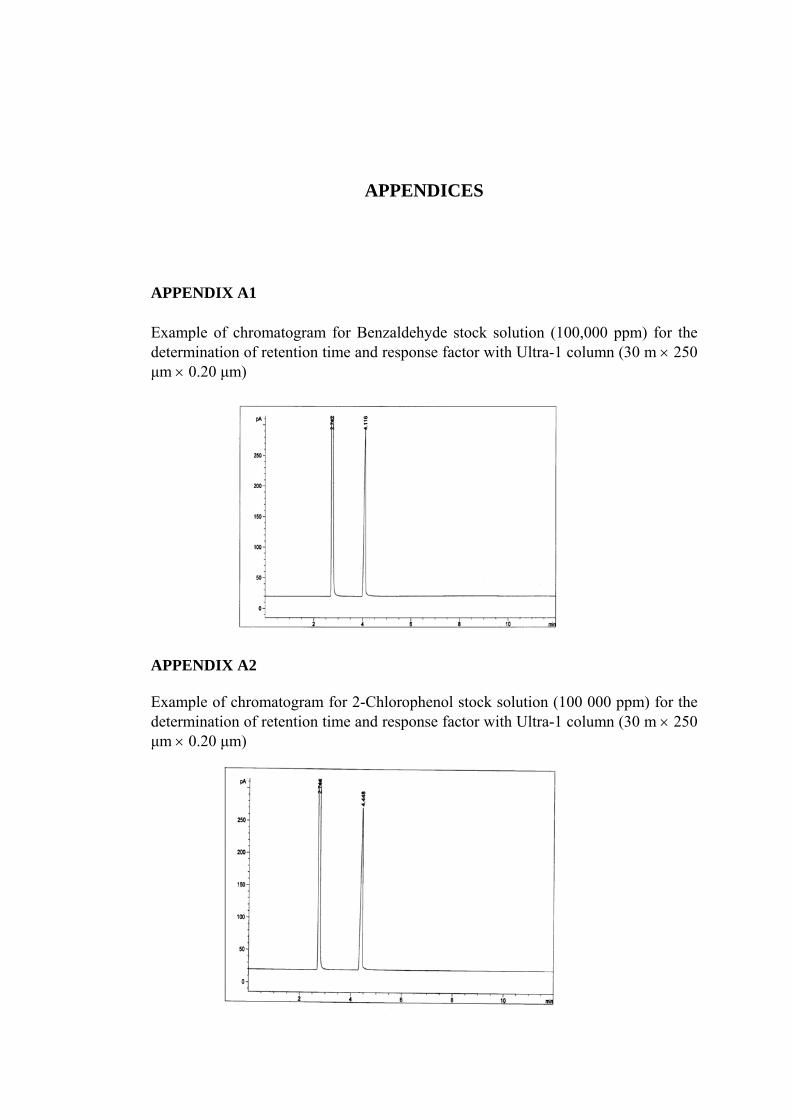
APPENDICES
APPENDIX A1
Example of chromatogram for Benzaldehyde stock solution (100,000 ppm) for the determination of retention time and response factor with Ultra-1 column (30 m × 250 μm × 0.20 μm)
APPENDIX A2 Example of chromatogram for 2-Chlorophenol stock solution (100 000 ppm) for the determination of retention time and response factor with Ultra-1 column (30 m × 250 μm × 0.20 μm)
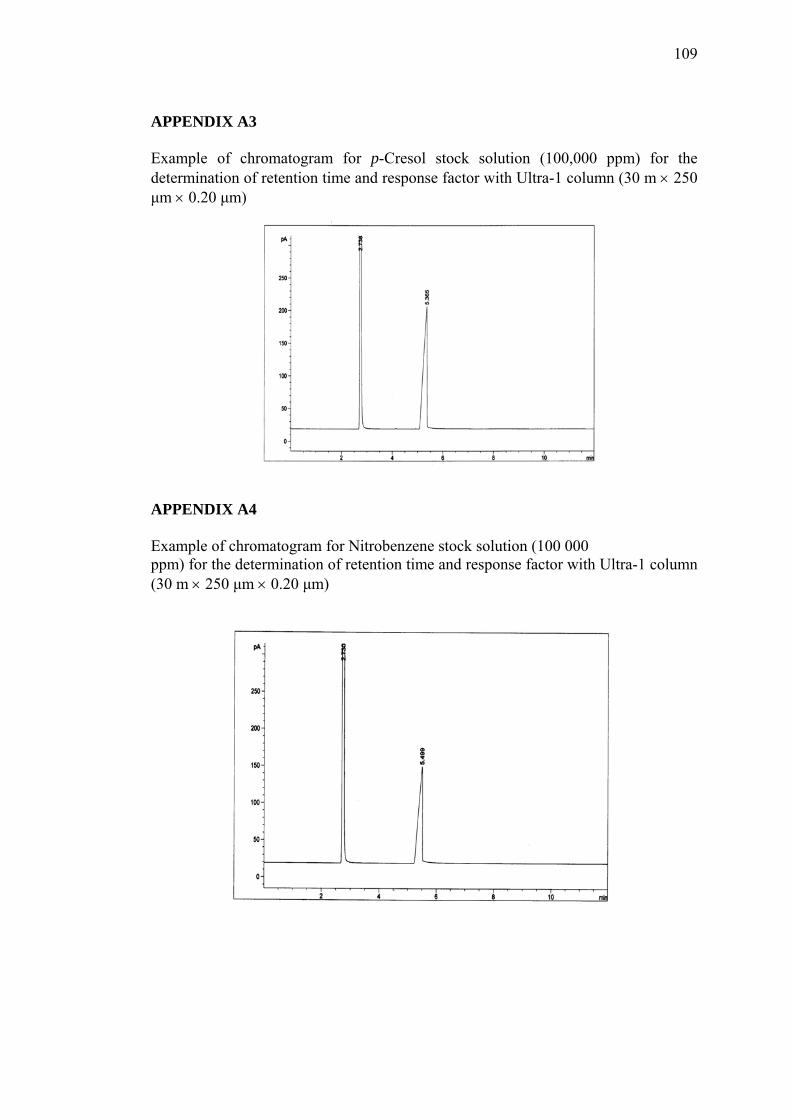
109
APPENDIX A3
Example of chromatogram for p-Cresol stock solution (100,000 ppm) for the determination of retention time and response factor with Ultra-1 column (30 m × 250 μm × 0.20 μm)
APPENDIX A4
Example of chromatogram for Nitrobenzene stock solution (100 000 ppm) for the determination of retention time and response factor with Ultra-1 column (30 m × 250 μm × 0.20 μm)
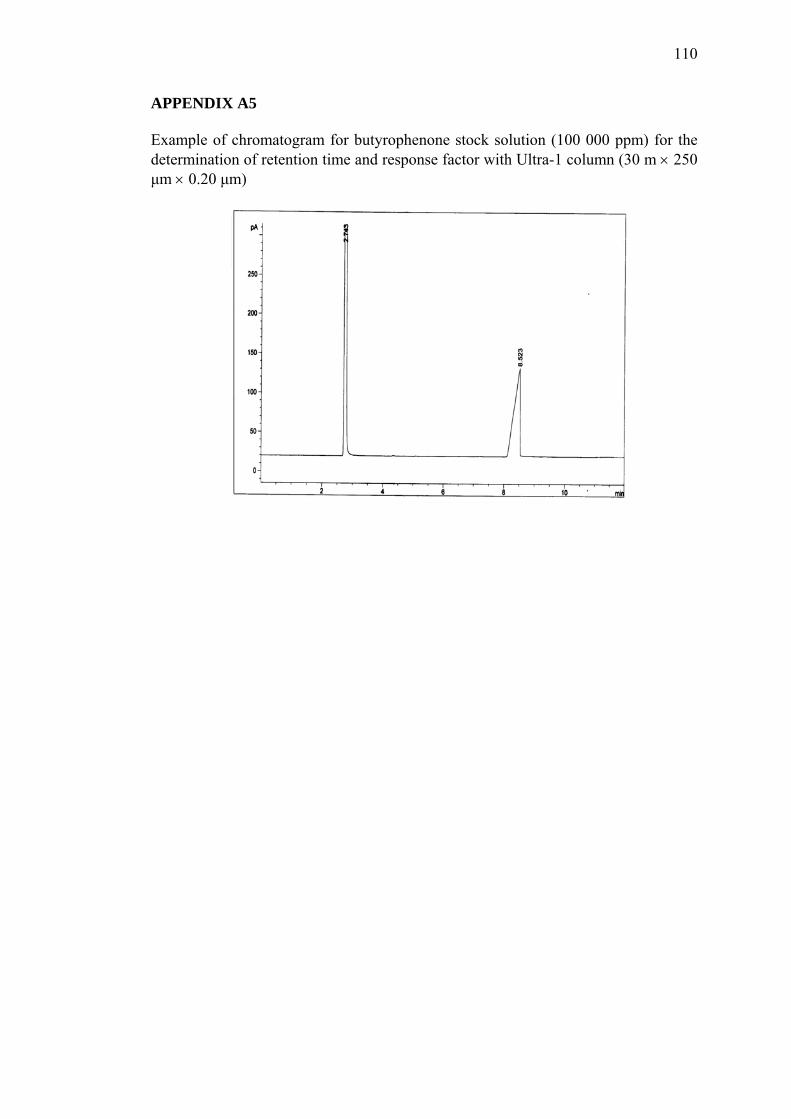
110
APPENDIX A5
Example of chromatogram for butyrophenone stock solution (100 000 ppm) for the determination of retention time and response factor with Ultra-1 column (30 m × 250 μm × 0.20 μm)
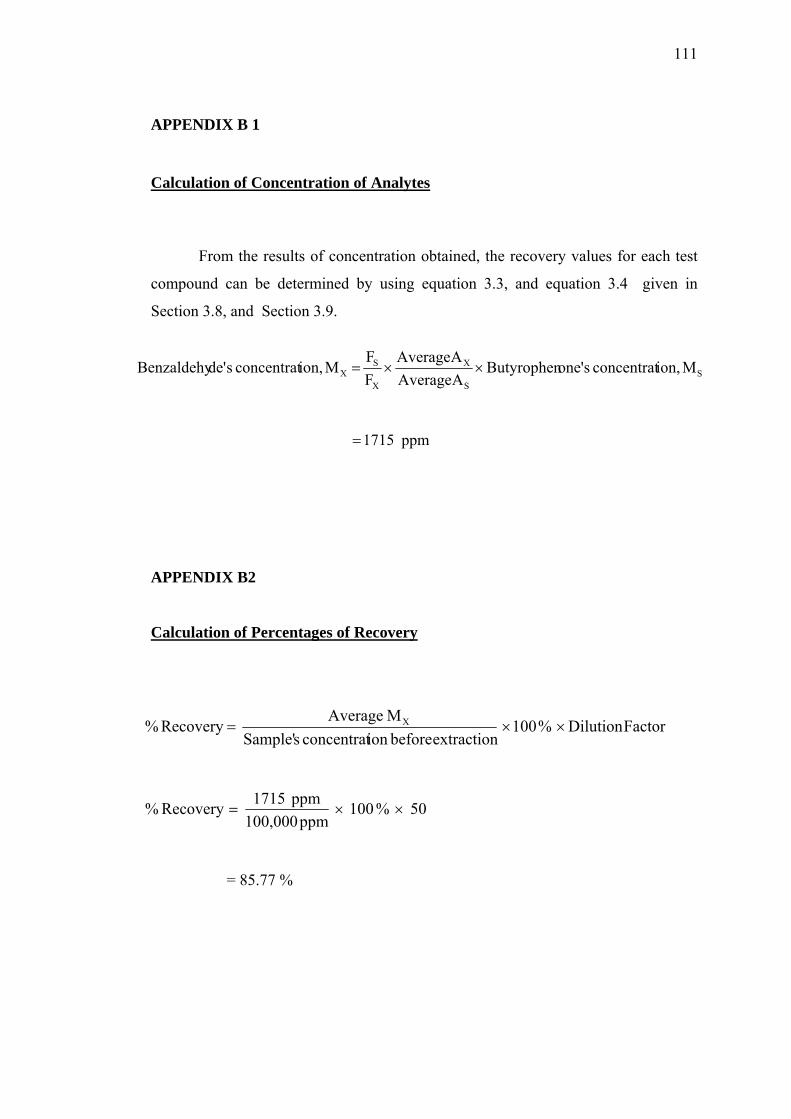
111
APPENDIX B 1 Calculation of Concentration of Analytes
From the results of concentration obtained, the recovery values for each test
compound can be determined by using equation 3.3, and equation 3.4 given in
Section 3.8, and Section 3.9.
SS
X
X
SX M ion,concentrat sone'Butyrophen
A AverageA Average
FF
M ion,concentrat sde'Benzaldehy ××=
ppm 1715 = APPENDIX B2 Calculation of Percentages of Recovery
FactorDilution % 100 extraction beforeion concentrat sSample'
M Average Recovery % X ××=
50 % 100 ppm 100,000
ppm 1715 Recovery % ××=
= 85.77 %
112
APPENDIX B3 Calculation of Breakthrough Volume Where the data:
• The chart speed = 0.5 cm/min
• Flow rate = 1.0 mL/min
• Retention distance =7.20 cm
Based on the equation in 3.1 and 3.2, in Section 3.5.3.
Retention time = 7.20 cm / 0.50 cm/min
Retention time = 14.40 min
The breakthrough volume = 14.40 min x 1.0 mL/min
The breakthrough volume = 14.40 mL
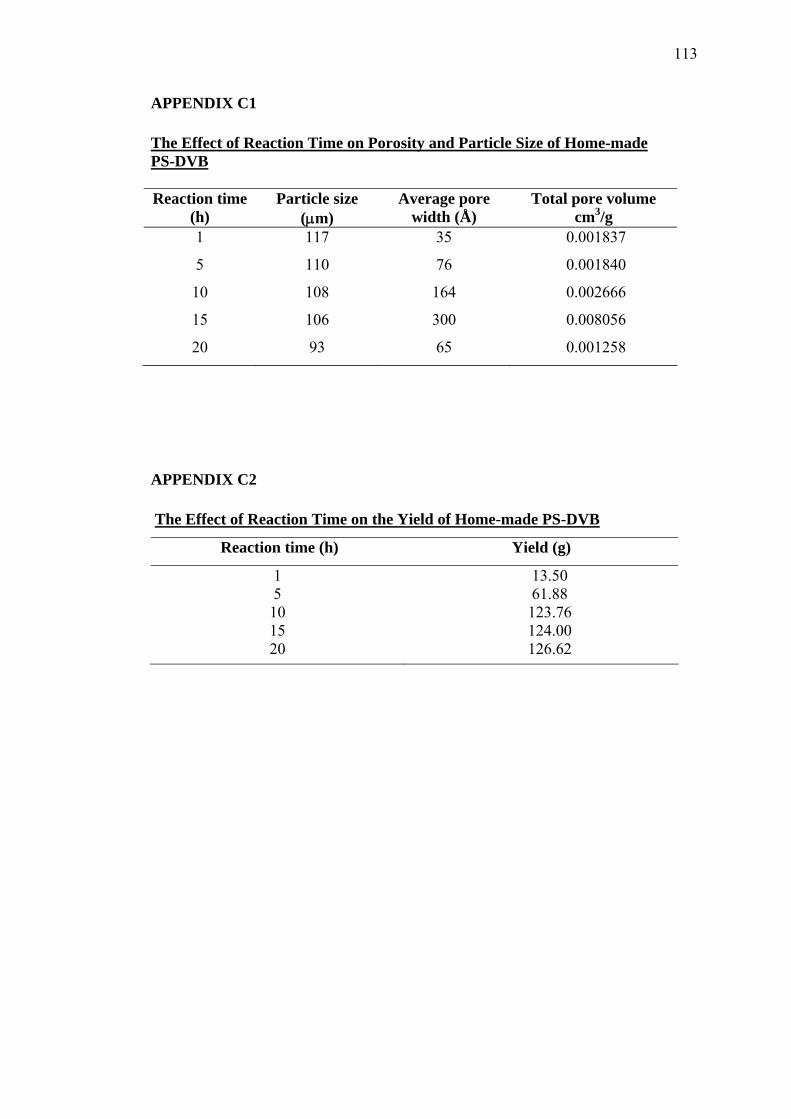
113
APPENDIX C1 The Effect of Reaction Time on Porosity and Particle Size of Home-made PS-DVB Reaction time
(h) Particle size
(μm) Average pore
width (Å) Total pore volume
cm3/g 1
5
10
15
20
117
110
108
106
93
35
76
164
300
65
0.001837
0.001840
0.002666
0.008056
0.001258
APPENDIX C2 The Effect of Reaction Time on the Yield of Home-made PS-DVB
Reaction time (h) Yield (g)
1 5 10 15 20
13.50 61.88 123.76 124.00 126.62
Development and Application of New Modified Poly(styrene-divinylbenzene) Adsorbents and Chromatography
Stationary Phases
Volume 2 p-ethanoyl-PS-DVB, p-2-propanoyl-PS-DVB, and ziconia-
modified PS-DVB
PROF. DR. MOHD MARSIN SANAGI ASSOC. PROF. DR AHMEDY ABU NAIM
ASSOC. PROF. DR ASIAH HUSSAIN SRI HILMA SIREGAR MOHD SANI SARJADI
NORSYARIZA ABD AZIZ
End of Project Report IRPA Project Number 09-02-06-0074-EA211
Vote number 74091
FACULTY OF SCIENCE
UNIVERSITI TEKNOLOGI MALAYSIA
NOVEMBER 2006
ii
Development and Application of New Modified
Poly(styrene-divinylbenzene) Adsorbents and Chromatography Stationary Phases
Volume 2
p-ethanoyl-PS-DVB, p-2-propanoyl-PS-DVB, and ziconia-modified PS-DVB
PROF. DR. MOHD MARSIN SANAGI (PROJECT LEADER)
ASSOC. PROF. DR AHMEDY ABU NAIM (RESEARCHER) ASSOC. PROF. DR ASIAH HUSSAIN (RESEARCHER)
SRI HILMA SIREGAR (RESEARCH STUDENT) MOHD SANI SARJADI (RESEARCH STUDENT)
NORSYARIZA ABD AZIZ (RESEARCH ASSISTANT)
End of Project Report IRPA Project Number 09-02-06-0074-EA211
Vote number 74091
FACULTY OF SCIENCE
UNIVERSITI TEKNOLOGI MALAYSIA
NOVEMBER 2006
iii
UTM/RMC/F/0024 (1998)
UNIVERSITI TEKNOLOGI MALAYSIA
BORANG PENGESAHAN LAPORAN AKHIR PENYELIDIKAN
TAJUK PROJEK: DEVELOPMENT AND APPLICATION OF NEW MODIFIED
POLY(STYRENE-DIVINYLBENZENE) ADSORBENTS AND CHROMATOGRAPHY STATIONARY PHASES. VOLUME 2: p-ETHANOYL-PS-DVB, p-2-PROPANOYL-PS-DVB, AND ZICONIA-MODIFIED PS-DVB
Saya MOHD MARSIN BIN SANAGI
(HURUF BESAR) mengaku membenarkan Laporan Akhir Penyelidikan ini disimpan di Perpustakaan Universiti Teknologi Malaysia dengan syarat-syarat kegunaan seperti berikut :
1. Laporan Akhir Penyelidikan ini adalah hak milik Universiti Teknologi Malaysia.
2. Perpustakaan Universiti Teknologi Malaysia dibenarkan membuat salinan untuk tujuan rujukan sahaja.
3. Perpustakaan dibenarkan membuat penjualan salinan Laporan Akhir Penyelidikan ini bagi kategori TIDAK TERHAD.
4. *Sila tandakan ( )
(Mengandungi maklumat yang berdarjah keselamatan atau kepentingan Malaysia seperti yang termaktub di dalam AKTA RAHSIA RASMI 1972) (Mengandungi maklumat TERHAD yang telah ditentukan oleh organisasi/badan di mana penyelidikan dijalankan)
(TANDATANGAN KETUA PENYELIDIK) Nama & Cop Ketua Penyelidik
Tarikh: _______________________
SULIT TERHAD TIDAK TERHAD
30 November 2006
CATATAN: * Jika Laporan Akhir Penyelidikan ini SULIT atau TERHAD, sila lampirkan surat daripada pihak berkuasa/organisasi berkenaan dengan menyatakan sekali sebab dan tempoh Laporan Akhir Penyelidikan ini perlu dikelaskan sebagai SULIT atau TERHAD.
iv
ACKNOWLEDGEMENTS
We would like to thank to the Research Management Centre, Universiti Teknologi
Malaysia (UTM), and the Ministry of Science, Technology, and Innovation (MOSTI) for
endowment of the research grant Project number 09-02-06-0074-EA211 (Vote number
74091).
We also would like to thank all technical and supporting staff members of the
Department of Chemistry namely, Faculty of Science, especially En Ayob Jabal, Pn Mek
Zum, En. Kadir, En. Hairol, En. Hamzah, En. Azmi, and Puan Maryam who have have
rendered excellent research services. Also thanks to students who have helped us in this
research, especially See Hong Heng, Norashikin, Fairol Zukry, Tham Ee Mun and Yong
Bee Chee.
v
ABSTRACT Poly(styrene-divinyl benzene) (PS-DVB) resin is an attractive adsorbent for extraction and separation of various types of compounds due to its stability over the pH range of 1-14. However, PS-DVB resin is known to have hydrophobic surfaces that highly retain non-polar compounds while poorly retain polar compounds. To improve its use in the separation or extraction of polar compounds, PS-DVB resin must be chemically or physically bonded to hydrophilic groups to reduce its hydrophobic surface. The objectives of this project were to modify PS-DVB phases by introducing moieties that can increase the dispersive forces and lower the hydrophobicity of the PS-DVB phases and to examine the characteristics and applications of the modified PS-DVB adsorbents. The PS-DVB adsorbents were prepared by suspension polymerization method with polyvinyl alcohol as the suspension stabilizer at a stirring speed of 1000 rpm for 20 h. The second approach (Volume 2) explores the development of PS-DVB resins modified with acetyl chloride, chloroacetone and zirconyl chloride. Modifications of the PS-DVB adsorbents were carried out via Friedel-Crafts acylation reaction with acetyl chloride and chloroacetone using Lewis acid catalyst, Grignard reaction of the product with methyl magnesium chloride and reaction of the product with zirconium(IV) oxide chloride octahydrate. The products obtained were characterized using infrared spectroscopy, scanning electron microscopy, nitrogen adsorption analysis and thermal gravimetric analysis. The performance of the PS-DVB-based phases was evaluated by investigating its adsorption-desorption efficiency in solid phase extraction. Comparative recovery studies showed that the p-ethanoyl-PS-DVB and p-2-propanoyl-PS-DVB resins were superior compared to unmodified PS-DVB and ziconia-modified PS-DVB for solid phase extraction of the test compounds 2-chlorophenol, nitrobenzene and propiophenone.
vi
ABSTRAK
Resin poli(stirena-divinil benzena) (PS-DVB) merupakan penjerap yang menarik untuk pengekstrakan dan pemisahan pelbagai jenis sebatian disebabkan kestabilannya pada julat pH 1-14. Walau bagaimanapun, resin PS-DVB diketahui mempunyai permukaan yang hidrofobik yang sangat menahan sebatian tak berkutub manakala tidak menahan sebatian berkutub. Untuk memperbaiki penggunaan bahannya dalam pemisahan atau pengekstrakan sebatian berkutub, resin PS-DVB mesti diikat secara kimia atau fizik kepada kumpulan hidrofilik untuk mengurangkan kehidrofobikan permukaannya. Objektif projek ini ialah untuk mengubahsuai fasa PS-DVB dengan memasukkan moieti yang boleh meningkatkan daya serakan dan mengurangkan kehidrofobikan fasa tersebut dan untuk menkaji ciri-ciri dan penggunaan PS-DVB terubahsuai itu. Penjerap PS-DVB telah disediakan dengan kaedah pembolimeran ampaian dengan alkohol polyvinil sebagai penstabil ampaian pada kelajuan putaran 1000 rpm selama 20 jam. Pendekatan yang kedua (Jilid 2) mengkaji pembangunan PS-DVB terubahsuai dengan asetil klorida, kloroaseton dan zirkonil klorida telah dibangunkan. Pengubahsuaian terhadap penjerap PS-DVB telah dijalankan melalui tindak balas pengakilan Friedel Crafts dengan asetil klorida dan kloroaseton menggunakan mangkin asid Lewis, tindak balas Grignard hasilnya dengan metil magnesium klorida dan tindak balas hasilnya dengan zirkonia(IV) oksida oktahidrat. Bahan penjerap yang dihasilkan dicirikan dengan menggunakan spektroskopi infra merah, mikroskopi imbasan elektron, analisis penjerapan nitrogen dan analisis gravimetri terma. Prestasi bagi fasa pegun berasaskan PS-DVB itu telah dinilai dalam kajian penjerapan-penyahjerapan melalui teknik pengekstrakan fasa pepejal. Perbandingan nilai perolehan semula analit menggunakan metanol sebagai pengelusi menunjukkan bahawa etanoil-PS-DVB dan 2-pentanoil-PS-DVB memberikan nilai perolehan semula yang tinggi berbanding fasa pegun PS-DVB tulen dan PS-DVB terubahsuai zirkonia.
vii
CONTENTS
(VOLUME 1)
CHAPTER TITLE PAGE
ACKNOWLEDGEMENTS iv
ABSTRACT v
ABSTRAK vi
CONTENTS vii
LIST OF TABLES xi
LIST OF FIGURES xiii
LIST OF SYMBOLS xvi
LIST OF APPENDICES xvii
1 INTRODUCTION
1.1 Adsorbents and Chromatography
Stationary Phases 1
1.2 Research Background 2
1.3 Statement of Hypothesis 4
1.4 Research Aim 4
1.5 Research Objectives 4
1.6 Scope of Research 5
1.7 Outline of the Research Report 7
viii
2 LITERATURE REVIEW
2.1 Poly(styrene-divinyl benzene) 8
2.1.1 Advantages and Drawbacks of PS-DVB 9
2.1.2 Chemical Modification of PS-DVB Resin 11
2.2 Suspension Polymerization 13
2.2.1 Modification using The Friedel Crafts Acylation Reaction 15
2.2.2 Modification using the Grignard Reagent 16
2.3 Physical and Chemical Properties of Zirconia 17
2.3.1 Zirconia as a Stationary Phase 19
2.3.2 Polybutadiene-coated Zirconia 21
2.3.3 Polystyrene-coated Zirconia 22
2.3.4 Carbon-coated Zirconia 22
2.3.5 Polymer-coated Carbon-clad Zirconia 23
2.4 Solid Phase Extraction 23
2.4.1 Basic principles of SPE 25
2.4.2 Advantages of the SPE 27
3 EXPERIMENTAL
3.1 Material and Test Compounds 29
3.2 Instrumentation 30
3.3 Preparation of Adsorbents 32
3.3.1 Preparation of PS-DVB resin 33
3.3.2 Friedel Crafts acylation of PS-DVB Using Acetyl Chloride
and Chloroacetone 34
3.3.3 Modification of p-ethanoyl-PS-DVB and p-2-propanoyl-
PS-DVB by Grignard Reaction 35
3.3.4 Modification of p-2-hydroxyl-2-methylethyl-PS-DVB and
p-2-hydroxyl-2-methylpropyl-PS-DVB by
Zirconyl Chloride 37
3.4 Sample Preparation for SPE-GC Study 38
3.5 Preparation of Solid Phase Extraction Column 39
ix
3.6 Solid Phase Extraction Procedure 40
3.7 Temperature Programmed GC-FID 41
3.8 Determination of Response Factor for Internal Standard and Test
Compounds 42
3.8.1 Determination of the Concentration of the Test Compounds 42
3.8.2 Determination of Test Compound’s Recovery Values 43
4 RESULTS AND DISCUSSION
4.1 Preparation of PS-DVB resins 44
4.2 Characterization of Synthesized PS-DVB resin 44
4.2.1 Fourier Transform Infrared (FTIR) Spectroscopy 45
4.2.2 Scanning Electron Microscopy Analysis 47
4.2.3 Thermogravimetry Analysis 49
4.2.4 Nitrogen Adsorption and Desorption Analysis 51
4.2.4.1 Effect of Reaction Time 53
4.2.4.2 Effect of Stabilizer 54
4.2.4.3 Effect of Polymerization Method 55
4.3 Preparation of p-2-zirconyl-2-methylethyl-PS-DVB Chloride 55
4.4 Characterization of Acetyl Chloride Modified PS-DVB 56
4.4.1 Fourier Transform Infrared (FTIR) Spectroscopy 56
4.4.2 Scanning Electron Microscopy Analysis 58
4.4.3 Thermogravimetry Analysis 60
4.4.4 Nitrogen Adsorption and Desorption Analysis 62
4.5 Preparation of p-2-zirconyl-2 -methylpropyl-PS-DVB chloride 67
4.6 Characterization of Chloroacetone modified PS-DVB 67
4.6.1 Fourier Transform Infrared (FTIR) Spectroscopy 67
4.6.2 Scanning Electron Microscopy Analysis 70
4.6.3 Thermogravimetry Analysis 73
4.6.4 Nitrogen Adsorption and Desorption Analysis 75
4.7 Application Of PS-DVB And Modified PS-DVB in Solid
Phase Extraction 78
4.7.1 Retention Times and Response Factors of Analytes 78
x
4.8 Effect of Eluant 80
4.8.1 Methanol as Eluant 80
4.8.2 Acetonitrile as Eluant 83
4.8.3 Ethyl acetate as Eluant 84
5 CONCLUSIONS AND SUGGESTIONS FOR FURTHER STUDY
5.1 Conclusions 85
5.2 Suggestions for Further Study 88
REFERENCES 89
APPENDIX 98
LIST OF PUBLICATIONS 99
xi
LIST OF TABLES
TABLE NO. TITLE PAGE
2.1 Modifier of the PS-DVB 12
2.2 Description of SPE systems with columns (León-González and
Pérez-Abbas, 2000) 25
3.1 Description of materials 29
3.2 Description of test compounds and solvents 30
3.3 Description of PS-DVB modification 38
4.1 Characteristic wave numbers for synthesized PS-DVB resin and
commercial PS-DVB resin 45
4.2 Average particle size of synthesized PS-DVB resin and commercial
PS-DVB resin
47
4.3 Thermogravimetric analysis results for commercial and synthesized
PS-DVB resin at various temperature ranges 50
4.4 Pore and surface characteristic of synthesized PS-DVB resin and
commercial PS-DVB resin 53
4.5 Effect of reaction period on nitrogen adsorption analysis data for
synthesized PS-DVB. 53
4.6 Nitrogen adsorption analysis data for synthesized PS-DVB resin
using different stabilizers 54
4.7 Nitrogen adsorption analysis data for synthesizing PS-DVB resin
by different techniques 55
4.8 Absorbance signals for the functional groups of modification PS-
DVB using acetyl chloride 58
4.9 Thermogravimetric analysis results of modified PS-DVB using
acetyl chloride at various temperature ranges
61
xii
4.10 Pore and surface characteristic of modified-PS-DVB resin 65
4.11 Absorbance signals for the functional groups modification PS-DVB
using chloroacetone 69
4.12 Thermogravimetric analysis results of modified PS-DVB using
chloroacetone at various temperature ranges 74
4.13 Pore and surface characteristic of PS-DVB-modified resin 78
4.14 Retention times and response factors (F) of the solvent, test
compounds and internal standard 79
4.15 Percentage recovery of analytes way methanol, acetonitrile and
ethyl acetate as eluant for different adsorbents: synthesized PS-
DVB, p-ethanoyl-PS-DVB, p-2-propanoyl-PS-DVB, p-2-hydroxyl-
2-methylethyl-PS-DVB, p-2-hydroxyl-2-methylpropyl-PS-DVB, p-
2-zirconyl-2-methylethyl-PS-DVB chloride, and p-2-zirconyl-2-
methylpropyl-PS-DVB chloride
81
xiii
LIST OF FIGURES
FIGURE NO. TITLE PAGE
1.1 A complete reaction scheme 6
2.1 Typical particle sizes obtained in heterogeneous polymerization
techniques (Matyjaszewski and Davis, 1998) 14
2.2 Formation of cation species (a) a carbonium ion (from an alkyl
halide), (b) an acylium ion (from an acyl halide) (Durst and
Gokel, 1980; Olah, 1973) 15
2.3 The addition of the Grignard reagent to (a) an aldehyde, (b)
ketone (Durst and Gokel, 1980; Olah, 1973) 16
2.4 Formation of Grignard reaction (Durst and Gokel, 1980; Olah,
1973) 17
2.5 Reaction of water molecule with zirconia surface (Xu, 1988) 18
2.6 The bridging hydroxyl, being strongly polarized by two
zirconium (IV) ions (Rigney et al., 1990)
19
3.1 A SPE vacuum manifold 31
3.2 Research framework 33
3.3 Reactor for polymerization of PS-DVB resin 34
3.4 System for Friedel Crafts acylation of PS-DVB 35
3.5 System for modification of PS-DVB using Grignard reaction 36
3.6 Steps in the preparation of a SPE column 40
3.7 Steps in solid phase extraction 41
4.1 FTIR spectra of the (a) synthesized PS-DVB resins and (b)
commercial PS-DVB resins 46
4.2 SEM micrographs of (a) Synthesized PS-DVB resin,
magnification 50 × and (b) magnification 5000 ×; (c)
Commercial PS-DVB resin, magnification 50 × and (d)
magnification 5000 × 48
xiv
4.3 Distribution of weight loss percentage against various
temperature ranges for synthesized and commercial PS-DVB
resins 51
4.4 (a) Nitrogen adsorption isotherm and (b) average pore size
distribution of the synthesized PS-DVB resin; (c) Nitrogen
adsorption isotherm and (d) average pore size distribution of the
commercial PS-DVB resin
52
4.5 FTIR spectra of the (a) product 2A, (b) product 2B, and (c)
product 2C 57
4.6 SEM micrographs of (a) product 2A; magnification 50× and
(b) magnification 5000× (c) product 2B; magnification 50× and
(d) magnification 5000× (e) product 2C; magnification 50× and
(f) magnification 5000× 59
4.7 Distribution of weight loss percentage against temperature stage
for modified-PS-DVB resins 62
4.8 (a) Nitrogen adsorption isotherm and (b) average pore size
distribution of the product 2A; (c) Nitrogen adsorption isotherm
and (d) average pore size distribution of the product 2B; (e)
Nitrogen adsorption isotherm and (f) average pore size
distribution of the product 2C 64
4.9 FTIR spectra (a) product 3A, (b) product 3B and (c) product 3C 68
4.10 SEM micrographs of modification PS-DVB using
chloroacetone: (a) product 3A; magnification 50× and (b)
magnification 5000× (c) product 3B; magnification 50× and (d)
magnification 5000× (e) product 3C; magnification 50× and (f)
magnification 5000× 72
4.11 Graph of weight loss percentage against temperature stage for
modified-PS-DVB resins 74
4.12 (a) Nitrogen adsorption isotherm and (b) average pore size
distribution of the product 3A; (c) Nitrogen adsorption isotherm
and (d) average pore size distribution of the product 3B; (e)
Nitrogen adsorption isotherm and (f) average pore size
distribution of the product 3C 77
xv
4.13 Gas chromatogram of the separation of test compounds. Peaks:
(a) methanol, (b) 2-chlorophenol, (c) nitrobenzene, (d)
propiophenone, and (e) butyrophenone. Chromatographic
condition : Ultra-1 column 932530 (30 m × 250 μm × 0.20 μm),
Carrier gas: Helium; flow rate: 1.1 mL min-1; pressure: 75 kpa;
detector: FID; injector temperature: 250°C; detector
temperature: 310°C; initial temperature: 100°C with a hold time
of 2 min; final temperature: 140°C, linear temperature
programmed at 5°C min-1 rise 79
4.14 Percentage recoveries of analytes extracted through different
types of SPE adsorbent using methanol as the eluant 82
4.15 Percentage recoveries of analytes extracted through different
types of SPE columns using acetonitrile as the eluant 83
4.16 Percentage recoveries of analytes extracted through different
types of SPE columns using ethyl acetate as the eluant 84
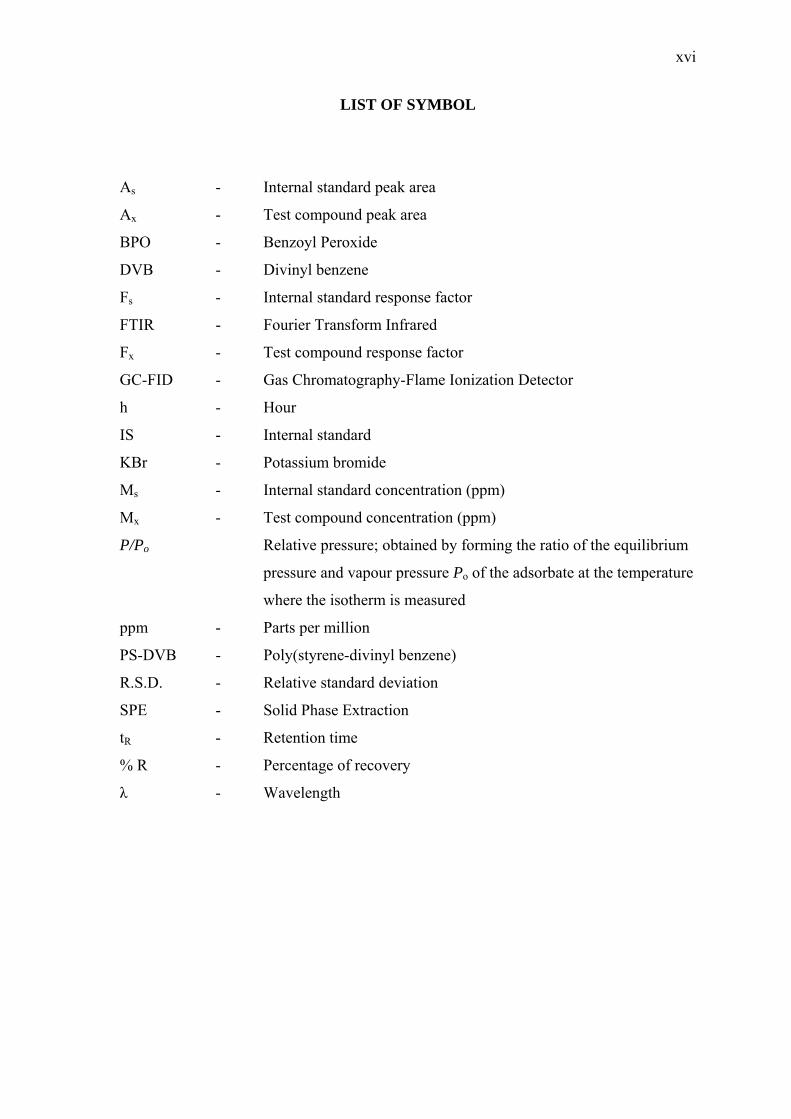
xvi
LIST OF SYMBOL
As - Internal standard peak area
Ax - Test compound peak area
BPO - Benzoyl Peroxide
DVB - Divinyl benzene
Fs - Internal standard response factor
FTIR - Fourier Transform Infrared
Fx - Test compound response factor
GC-FID - Gas Chromatography-Flame Ionization Detector
h - Hour
IS - Internal standard
KBr - Potassium bromide
Ms - Internal standard concentration (ppm)
Mx - Test compound concentration (ppm)
P/Po Relative pressure; obtained by forming the ratio of the equilibrium
pressure and vapour pressure Po of the adsorbate at the temperature
where the isotherm is measured
ppm - Parts per million
PS-DVB - Poly(styrene-divinyl benzene)
R.S.D. - Relative standard deviation
SPE - Solid Phase Extraction
tR - Retention time
% R - Percentage of recovery
λ - Wavelength
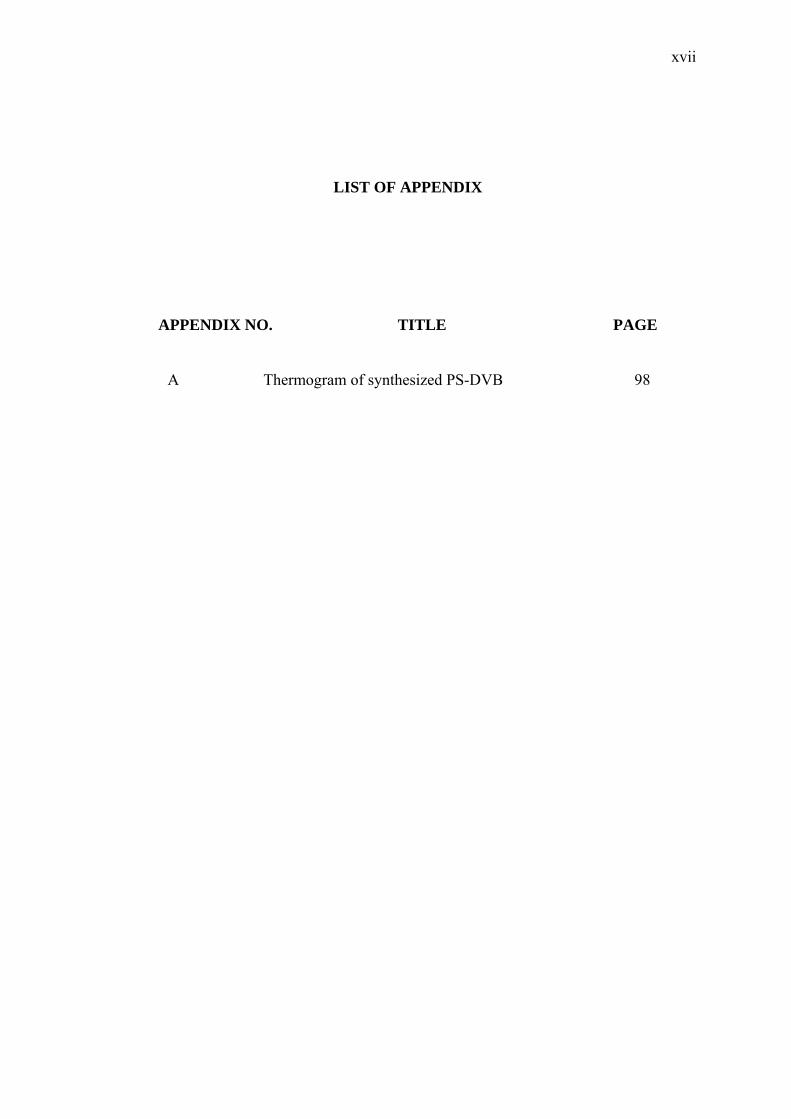
xvii
LIST OF APPENDIX
APPENDIX NO. TITLE PAGE
A Thermogram of synthesized PS-DVB 98
CHAPTER 1
INTRODUCTION
1.1 Adsorbents and Chromatography Stationary Phases
The material on the surface of which adsorption takes place is called the
adsorbent and the substance adsorbed is called the adsorbate (Gurdeep, 1974). The
common surface separating the two phases, where the adsorbed molecules
concentrate is referred to as the interface. The larger the surface area of the
adsorbent, the more is the adsorption. Some examples of the adsorbents are charcoal,
silica gel, metals, polymers and etc. The term adsorption appears to have been
introduced by Kayser in 1881 to connote the condensation of gases on free surfaces,
in contradistinction to gaseous absorption where the molecules of gas penetrate into
the mass of the absorbing solid. Adsorption (strictly, physical adsorption) has now
been internationally defined as the enrichment (i.e. positive adsorption or simply
adsorption) or depletion (i.e. negative adsorption) of one or more components in an
interfacial layer (Gregg and Sing, 1982).
The various forms of chromatography are classified according to the nature of
the mobile and stationary phases. The mobile phase may be gaseous or liquid, while
the stationary phase may be solid or liquid. For example, in gas liquid
chromatography (GLC), the liquid stationary phase is dispersed on an inert solid
2
support. The liquid phase is held on the surface and in the pores of the support, while
the mobile gas phase flows through the spaces between particles (Conder and Young,
1979).
The choice of adsorbents as the proper stationary phase is one of the most
important decisions in column chromatography. The use of adsorbents of porous
polymers and inorganic salt, either porous or non-porous and modified oxides, as
well as surfaces of dense monomolecular polymer layers absorbed on the sufficiently
developed and homogenous surface of non-porous and wide-porous adsorbent, opens
extensive possibilities for selecting and controlling the nature of the adsorbent
surfaces and, therefore, for controlling the selectivity of gas adsorption columns
(Baiulescu and Ilie, 1975). In the last two decades, separation sciences have faced
important developments. Starting with solid-phase extraction (SPE) in the 1980s,
other new techniques, e.g., supercritical fluid extraction (SFE), supercritical fluid
chromatography (SFC) and capillary electrochromatography (CEC) have been
introduced (Liu and Pietrzyk, 2001). Besides these new analytical tools, “classical”
separation techniques such as high performance liquid chromatography (HPLC) have
been further developed and optimized. New inputs from synthetic chemistry and
more efficient analytical tools for their characterization significantly enhanced the
quality of liquid chromatography (LC) supports in terms of stability, reproducibility,
selectivity and efficiency (Buchmeiser, 2001).
1.2 Research Background
The preparation of alternative stationary phase supports in chromatographic
science is an important area that aims to develop new support materials that offer
novel selectivities or overcome the shortcomings of silica supports (Shalliker et al.,
1997). The ideal chromatography support particle should have a high surface area on
which a wide variety of chemical moieties can be irreversibly and inalterably
deposited to provide useful selectivity for a number of separation problems. It should
3
be physically and chemically stable over a wide range of pressure, pH, temperature
and solvent conditions. It should be available in a variety of particle diameters as
well as pore sizes and volumes (Nawrocki et al., 1993).
Microparticulate, macroporous, poly(styrene-divinyl benzene) (PS-DVB)
copolymeric reversed-phase adsorbent have been used very successfully as stationary
phases in HPLC (Liu and Pietrzyk, 2001). Organic beaded polymer supports based
on polystyrene are almost exclusively prepared by emulsion, suspension, dispersion
and precipitation polymerization techniques (Buchmeiser, 2001). However, PS-DVB
resins are known to have hydrophobic surfaces that highly retain non-polar
compounds while poorly retain polar compounds.
Although silica and modified silicas are the most widely used and most useful
chromatographic supports, it is well known that silica and bonded silicas are not
stable outside the range of pH 2 to approximately 8 (Wehrli et al., 1978) . Above pH
8, silica is subjected to attack by alkali and it dissolves. Below approximately pH 2,
the siloxane linkages which hold bonded phases to silica are subjected to hydrolytic
attack and are slowly removed from the surface (Glajeh et al., 1987). The dissolution
of silica and removal of bonded phase is accelerated at high temperature and leads to
changes in retention, selectivity and peak shape, loss of column bed integrity, and
contamination of product in preparative chromatography. The typical commercial
alkyl silane bonded silica phase is seldom used at more than 20-30°C higher than
room temperature because of its instability at high temperature (McNeff et al., 2000).
Another interesting development is in the synthesis and application of
zirconia stationary phases. The surface area of zirconia is low when compared to the
silica supports typically used as chromatographic supports. However, it is important
to recognize when considering the surface area data that true density of monoclinic
zirconia is approximately 5.8 gmL-1 whereas the density of commercial silica is 2.3
gmL-1. Cubic zirconia is reported to have the highest density 6.27 gmL-1 (Nawrocki
et al., 1993). Due to its higher density, the surface area of zirconia is comparable to
that of silica in terms of surface area per unit volume.
4
1.3 Statement of Hypothesis
PS-DVB resins have a hydrophobic surface. To extend its applicability in
extraction or chromatographic performance, the PS-DVB resins should have a
chemical bonding or hydrophilic groups to decrease and mask its hydrophobic
surface. Chemical modification on the PS-DVB resins can be carried out by the
Friedel Craft acylation reaction and Grignard reaction. Zirconia can be then
introduced onto the PS-DVB resin. Zirconia-modified PS-DVB resin is expected to
have lower hydrophobic surface and more stable compared with unmodified PS-
DVB resin.
1.4 Research Aim
The aim of this research is to synthesize new adsorbents based on PS-DVB
resins and study the performance of the adsorbents by physiochemical methods.
1.5 Research Objectives
i. To synthesize PS-DVB adsorbent using the suspension polymerization
method.
ii. To modified PS-DVB adsorbents using three steps or reactions:
(a) Friedel Crafts acylation reaction of PS-DVB with acetyl chloride and
chloroacetone using Lewis acid catalyst;
(b) Grignard reaction of the product (a) with methyl magnesium chloride;
and
5
(c) reaction of the product (b) with zirconium(IV) oxide chloride
octahydrate.
iii. To characterize and study the performance of the new adsorbents by
physiochemical methods.
1.6 Scope of Research
A complete reaction scheme is given in Figure 1.1. In this research, PS-DVB
resins were synthesized using the suspension polymerization method. Optimization
of the suspension polymerization method was carried out by studying the effect of
reaction time, effect of stabilizer and effect of seeding polymerization. The physical
properties of the PS-DVB resins were studied by fourier transform infrared
spectroscopy, scanning electron microscopy, thermogravimetry analysis, and
nitrogen adsorption analysis. Batch of PS-DVB resins which exhibit the most
suitable adsorbent properties such as high surface area, minimum pore size was
chosen to be modified. Comparison of the physical properties of both native and
modified PS-DVB phases was carried out and the performance of the modified PS-
DVB phases was evaluated by investigating its adsorption-desorption efficiency in
solid phase extraction.
6
a) Preparation of PS-DVB resin
CH2 CH
CHCH2
CHCH2
+ P
P P
P
n n
initiator
Styrene Divinyl benzene PS-DVB (1)
b) Preparation of p-2-zirconyl-2-methylethyl-PS-DVB chloride (2C)
p-ethanoyl-PS-DVB (2A) PS-DVB (1)
CCH3
O
C OH
CH3
CH3
CH3
CH3
C OZrOClCH2CN/NaOH
ZrOCl2.8H2O
CH3MgCl
(C2H3)2OCH3CCl
O
CS2/AlCl3
p-2-hydroxyl-2-methylethyl-PS-DVB (2B)
p-2-zirconyl-2-methylethyl-PS-DVB chloride (2C)
c) Preparation of p-2-zirconyl-2-methylpropyl-PS-DVB chloride
O
CH2 OH
CH
Figure 1.1 A complete reaction scheme
3
CH3
C CH2
CH
CH3
C
3
OZrOClCH2CN/NaOH
ZrOCl2.8H2O
CH MgC3 l
(C2H3)2OO
CH2CCH3CH2Cl2/AlCl3
CH3CCH2Cl
PS-DVB (1) p-2-propanoyl-PS-DVB (3A)
p-2-zirconyl-2-methylpropyl- PS-DVB chloride (3C)
p-2-hydroxyl-2-methylpropyl- PS-DVB (3B)
7
1.7 Outline of the Research Report
This research report consists of six chapters. Chapter 1 presents general
background of this research, research aim, research objectives and scope. Chapter 2
compiles the literature reviews and theoretical background on PS-DVB and Zirconia,
modification of PS-DVB and its application as an adsorbent for solid phase
extraction (SPE). The procedures for characterization and application of the
synthesized materials are presented in Chapter 3. Chapter 4 reports the results and
discusses the preparation of PS-DVB, and modification of PS-DVB. It also describes
the characterization and application of unmodified and modified PS-DVB as
adsorbents in the solid phase extraction analysis. The concluding Chapter 5
summarizes this research report by presenting the overall conclusions and
suggestions for future study.
CHAPTER 2
LITERATURE REVIEW
2.1 Poly(styrene-divinyl benzene)
PS-DVB resins are widely used as ion-exchangers (Coutinho et al., 2004;
Chambers and Fritz, 1998; Nash and Chase, 1998; Ohta et al., 2004) polymeric
absorbents (León-González and Pérez-Arribas, 2000), chromatographic separation
media (Li et al., 1997) and as solid supports for organic synthesis (Gauthier et al.,
2004). The PS-DVB resins with fixed pores can be obtained by suspension
polymerization (Coutinho et al., 2004; Maria et al., 2003a and 2003b; Martin et al.,
2003), which is particularly suited to the production of large spherical beads typically
in the range 5-1000 μm. Porous copolymers from a number of related monomers
have also been synthesized by the same technique, e.g., methacrylamide styrene-
divinyl benzene, acylonitrile-divinyl benzene, glycidyl methacrylate-ethyleneglycol
dimethacrylate, methacrylic acid-triethyleneglycol dimethacrylate, acrylic acid-
trietyleneglycol dimethacrylate, acrylamide-ethylene glycol dimethacrylate, 4-
vinylpyridine-divinyl benzene, etc. (Malik et al., 2004).
The PS-DVB resin is prepared by free radical cross-linking copolymerization
of styrene and divinyl benzene monomers in the presence of diluent, which can be a
solvent, a non-solvent or a linear polymer, and is the pore forming agent. In a
9
solvating diluent, macroporous polymers are only produced when the divinyl
benzene concentration is high, and the monomer concentration is diluted. However,
when non-solvating diluents are used, the macroporosity appears at lower
concentrations of divinyl benzene and with less diluted monomers (Legido-Quigley
and Smith, 2004a).
Two groups of PS-DVB resins are commonly described (Howdle et al.,
2000). The first, referred to as gel-type species, are lightly crosslinked, typically
employing 0.5-2 mol % DVB, and rely upon solvation of individual polymer chains
by a thermodynamically good solvent to swell the polymeric network and allow
access to the support. In the swollen state, such resins are soft, compressible, and
relatively fragile in shear. The second, referred to as macroporous species, are
usually more highly crosslinked, and posses a complex system of permanent pores
created by employing a porogen (usually inorganic solvent) in the polymerization.
The pore system can be accessed by thermodynamically poor solvents as well as
good ones, and these resins are more rigid even when in contact with solvent. They
can therefore be employed in packed columns.
2.1.1 Advantages and Drawbacks of PS-DVB
PS-DVB copolymers overcome many of the limitations of bonded silicas,
especially those related to the limited pH stability or the presence of the silanol
groups (Li et al., 1996). The application of silica-based support is limited by the low
stability of silica at alkaline pH values and by the unwanted interactions between
polar solutes and remaining free silanol groups not covered by the hydrophobic
ligand (Hosoya et al., 1995). Porosity and mechanical stability can be altered by
varying the cross-linking through the variation of the DVB content. PS-DVB is not
soluble in water, inert and very hydrophobic. It is white in color and non-toxic, thus
it does not biodegrade easily and does not have toxicity effect on marine life.
10
In the last decade, there has been a growing interest in polymeric materials
for use in reversed-phase high-performance liquid chromatography (HPLC). In
particular, resins based on PS-DVB are stable with eluents from pH 1-14 and give
excellent separations. Some difficulties have been associated with polymeric resins,
such as swelling in the presence of organic solvents. However, rapid improvements
are being made in stability and performance so that polymeric resins can be
considered to be very attractive for HPLC (Sun and Fritz, 1990).
Due to its hydrophobic nature, the synthetic polymer in certain cases can be
used directly as a reversed-phase stationary phase, without the need for further
derivatization. However, there are two commonly derivatization methods of
introducing alkyl groups onto the surface of the synthetic polymer. Firstly, a
monomer such as an alkyl styrene can be included in the polymerization mixture.
However, it must be soluble in the porogen and precipitate when the polymer is
formed. Secondly, the surface of the polymer can be alkylated after formation by
using for example, a strong Friedel Crafts catalyst (alkyl halide in organic solvent)
(Legido-Quigley et al., 2004b).
In general, PS-DVB resins have greater analyte retention, mainly for polar
compounds, than bonded silicas, because their hydrophobic surface contains a
relatively large number of active aromatic sites that allow π-π interactions (León-
González and Pérez-Arribas, 2000). In comparison with silica sorbents, PS-DVB
resin is more stable at acid-base pH concentration and according to Rodriguez et al.
(2000) PS-DVB resin has higher capacity for polar analytes. This can be attributed to
a much larger carbon content (nearly 90% as compared to the maximum 18% of C18-
silica sorbents) but specially to the higher surface-area exhibited by polymers (many
of commercial available ones have areas of >1000 m2g-1 as compared to 200-600
m2g-1 for C18-silica sorbents).
PS-DVB copolymers with partially substituted quaternary ammonium groups
or slightly sulfonated have also been used for SPE of organic solutes, because they
have excellent hydrophilicity, thus extracting polar organic compounds more
efficiently than underivatized resins do (León-González and Pérez-Arribas 2000). In
general, all these derivatized PS-DVB resins are not commercially available, axcept
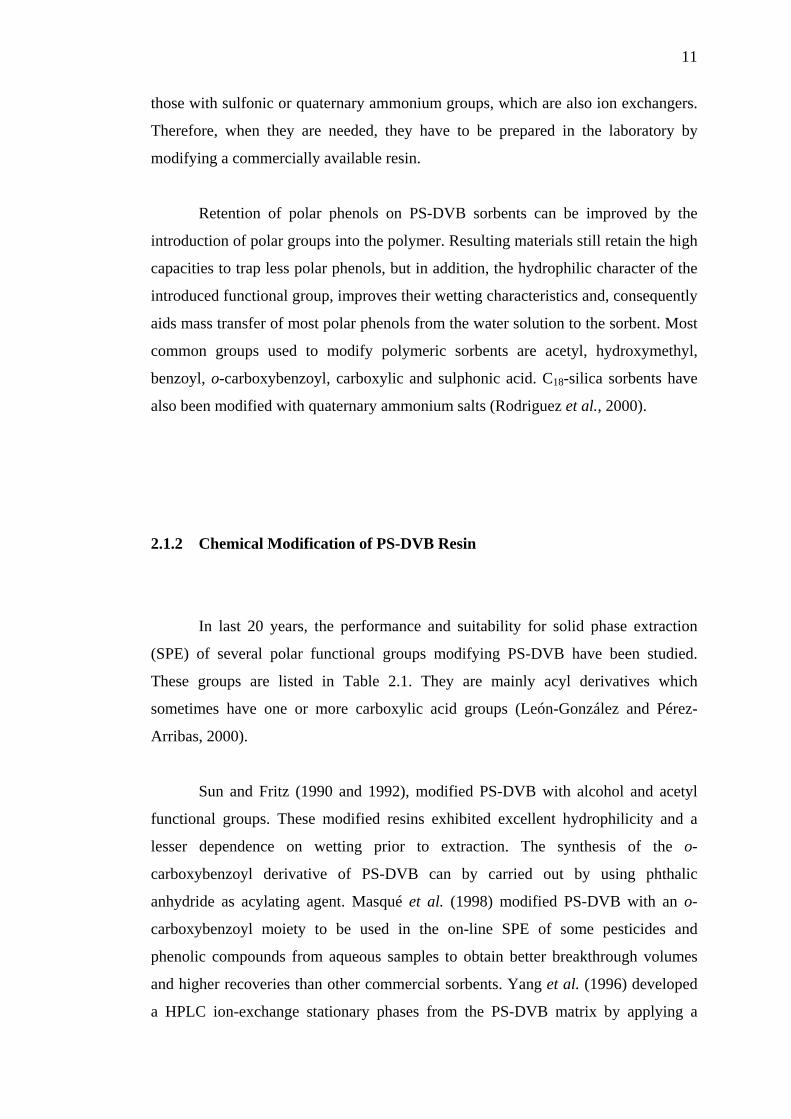
11
those with sulfonic or quaternary ammonium groups, which are also ion exchangers.
Therefore, when they are needed, they have to be prepared in the laboratory by
modifying a commercially available resin.
Retention of polar phenols on PS-DVB sorbents can be improved by the
introduction of polar groups into the polymer. Resulting materials still retain the high
capacities to trap less polar phenols, but in addition, the hydrophilic character of the
introduced functional group, improves their wetting characteristics and, consequently
aids mass transfer of most polar phenols from the water solution to the sorbent. Most
common groups used to modify polymeric sorbents are acetyl, hydroxymethyl,
benzoyl, o-carboxybenzoyl, carboxylic and sulphonic acid. C18-silica sorbents have
also been modified with quaternary ammonium salts (Rodriguez et al., 2000).
2.1.2 Chemical Modification of PS-DVB Resin
In last 20 years, the performance and suitability for solid phase extraction
(SPE) of several polar functional groups modifying PS-DVB have been studied.
These groups are listed in Table 2.1. They are mainly acyl derivatives which
sometimes have one or more carboxylic acid groups (León-González and Pérez-
Arribas, 2000).
Sun and Fritz (1990 and 1992), modified PS-DVB with alcohol and acetyl
functional groups. These modified resins exhibited excellent hydrophilicity and a
lesser dependence on wetting prior to extraction. The synthesis of the o-
carboxybenzoyl derivative of PS-DVB can by carried out by using phthalic
anhydride as acylating agent. Masqué et al. (1998) modified PS-DVB with an o-
carboxybenzoyl moiety to be used in the on-line SPE of some pesticides and
phenolic compounds from aqueous samples to obtain better breakthrough volumes
and higher recoveries than other commercial sorbents. Yang et al. (1996) developed
a HPLC ion-exchange stationary phases from the PS-DVB matrix by applying a
12
hydrophilic coating on the surface. The columns packed with this new packing
material exhibit both high chemical stability and high column efficiency that is
equivalent to that of silica-based packing materials.
Table 2.1: Modifier of the PS-DVB*
Group Structure
Acetyl C CH3
O
Hydroxymethyl
CH2OH
Benzoyl O
C
2,4-dicarboxylbenzoyl C
O
COOH
o-carboxybenzoyl
COOH
O
C COOH
Sulfonate
SO3-
Trimethylammonium
CH2 N(CH3)3+
* (León-González and Pérez-Arribas, 2000)
13
Klingenberg and Seubert (2002) showed that introduction of permanently
bonded sulfonic acid groups onto PS-DVB resins produce strong cation-exchanger
which are stable over a wide range of solvent composition and pH. The resins are
stable over a pH range of 0-14, inert against oxidizing reagents such as nitric acid
and stable against fluoride and hydrofluoric acid. Since sulfonate and
trimethylammonium derivatives are frequently used as ion exchangers in
chromatography and preparative analysis, they are easily commercially available
under different names and characteristics. Typical commercial phases are Hamilton
PRP-X200, Amberlite IRA200, Dowex DR-2030, Sep IC-H (Lida) or NovoClean IC-
H (Alltech) for sulfonate cation-exchange resins, and Hamilton PRP-X100,
Amberlite IRA-900, Dowex 11 or Sep IC-OH (Lida) for trimethyl-ammonium anion-
exchange resins.
Another modified polymer also used for SPE of highly polar compounds is an
anion exchanger based on the commercial MFE-Polymer, which is a polymer of the
hydroxyethylmethacrylate (HEMA) containing quaternary ammonium functional
groups. This sorbent, with particle size of 50 μm, has been packed in a 150 × 4.5 mm
conventional LC chromatographic column, and its efficiency to preconcentrate
phenoxy acid herbicide residues has been studied. Bacquet et al. (1992) has
described the chlorosulfonation of styrene-divinyl benzene copolymer characterized
by a modification of the textural parameters. The copolymer specific surface area
was initially low, and on chlorosulfonation treatment, decrease to a value of 1 m2g-1,
characteristic of unswollen gel type resins.
2.2 Suspension Polymerization
A suspension polymerization is a heterogeneous process, in which slurry of
polymer beads is formed by polymerization of a dispersed phase in a continuous
medium. The range of particle size covered by each technique is shown in Figure 2.1.
The dispersed phase consists of monomer, initiator, chain-transfer agent, and
possibly solvent or blowing agent (porogen), the latter to control the porosity of the
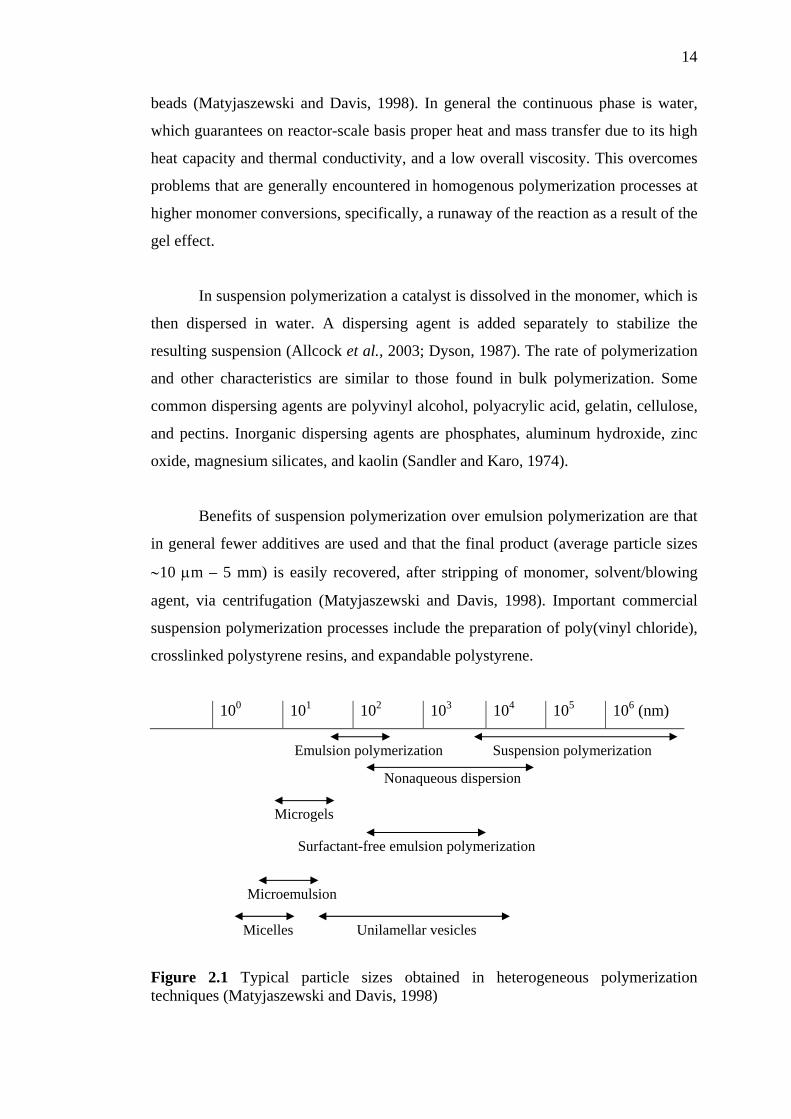
14
beads (Matyjaszewski and Davis, 1998). In general the continuous phase is water,
which guarantees on reactor-scale basis proper heat and mass transfer due to its high
heat capacity and thermal conductivity, and a low overall viscosity. This overcomes
problems that are generally encountered in homogenous polymerization processes at
higher monomer conversions, specifically, a runaway of the reaction as a result of the
gel effect.
In suspension polymerization a catalyst is dissolved in the monomer, which is
then dispersed in water. A dispersing agent is added separately to stabilize the
resulting suspension (Allcock et al., 2003; Dyson, 1987). The rate of polymerization
and other characteristics are similar to those found in bulk polymerization. Some
common dispersing agents are polyvinyl alcohol, polyacrylic acid, gelatin, cellulose,
and pectins. Inorganic dispersing agents are phosphates, aluminum hydroxide, zinc
oxide, magnesium silicates, and kaolin (Sandler and Karo, 1974).
Benefits of suspension polymerization over emulsion polymerization are that
in general fewer additives are used and that the final product (average particle sizes
∼10 μm – 5 mm) is easily recovered, after stripping of monomer, solvent/blowing
agent, via centrifugation (Matyjaszewski and Davis, 1998). Important commercial
suspension polymerization processes include the preparation of poly(vinyl chloride),
crosslinked polystyrene resins, and expandable polystyrene.
100 101 102 103 104 105 106 (nm)
Emulsion polymerization Suspension polymerization
Nonaqueous dispersion
Microgels
Surfactant-free emulsion polymerization
Microemulsion
Micelles Unilamellar vesicles
Figure 2.1 Typical particle sizes obtained in heterogeneous polymerization techniques (Matyjaszewski and Davis, 1998)
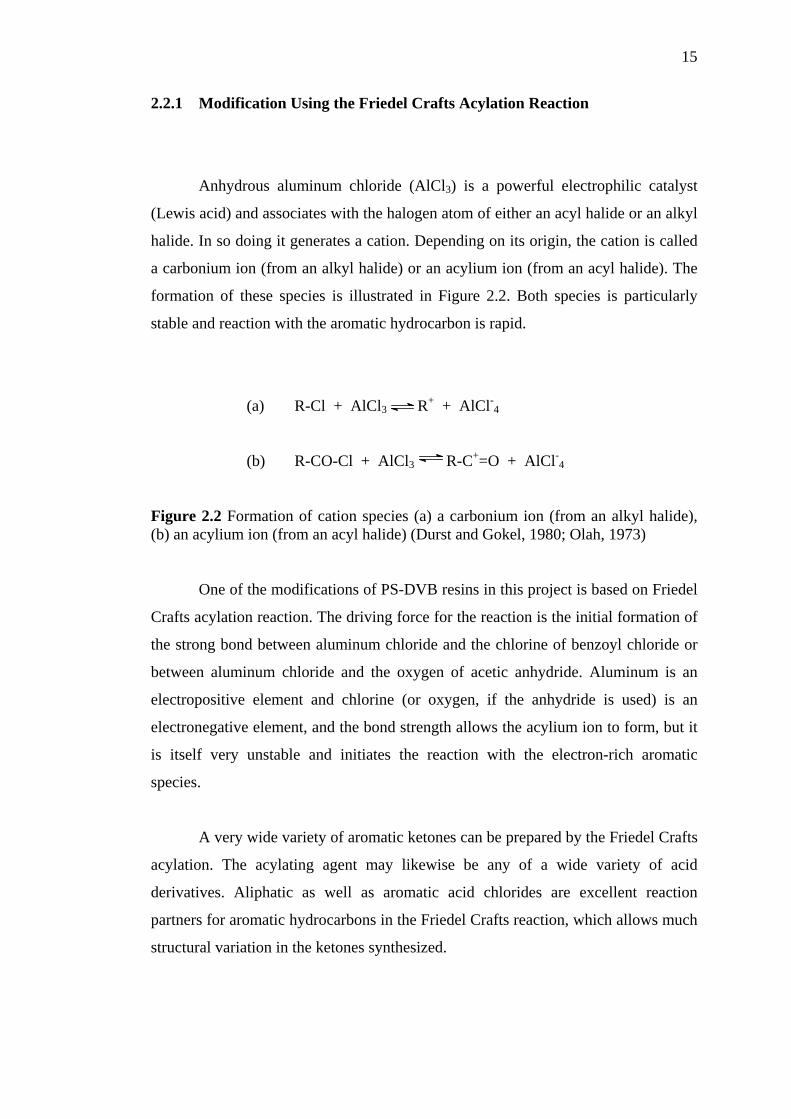
15
2.2.1 Modification Using the Friedel Crafts Acylation Reaction
Anhydrous aluminum chloride (AlCl3) is a powerful electrophilic catalyst
(Lewis acid) and associates with the halogen atom of either an acyl halide or an alkyl
halide. In so doing it generates a cation. Depending on its origin, the cation is called
a carbonium ion (from an alkyl halide) or an acylium ion (from an acyl halide). The
formation of these species is illustrated in Figure 2.2. Both species is particularly
stable and reaction with the aromatic hydrocarbon is rapid.
(a) R-Cl + AlCl3 R+ + AlCl-4
(b) R-CO-Cl + AlCl3 R-C+=O + AlCl-4
Figure 2.2 Formation of cation species (a) a carbonium ion (from an alkyl halide), (b) an acylium ion (from an acyl halide) (Durst and Gokel, 1980; Olah, 1973)
One of the modifications of PS-DVB resins in this project is based on Friedel
Crafts acylation reaction. The driving force for the reaction is the initial formation of
the strong bond between aluminum chloride and the chlorine of benzoyl chloride or
between aluminum chloride and the oxygen of acetic anhydride. Aluminum is an
electropositive element and chlorine (or oxygen, if the anhydride is used) is an
electronegative element, and the bond strength allows the acylium ion to form, but it
is itself very unstable and initiates the reaction with the electron-rich aromatic
species.
A very wide variety of aromatic ketones can be prepared by the Friedel Crafts
acylation. The acylating agent may likewise be any of a wide variety of acid
derivatives. Aliphatic as well as aromatic acid chlorides are excellent reaction
partners for aromatic hydrocarbons in the Friedel Crafts reaction, which allows much
structural variation in the ketones synthesized.
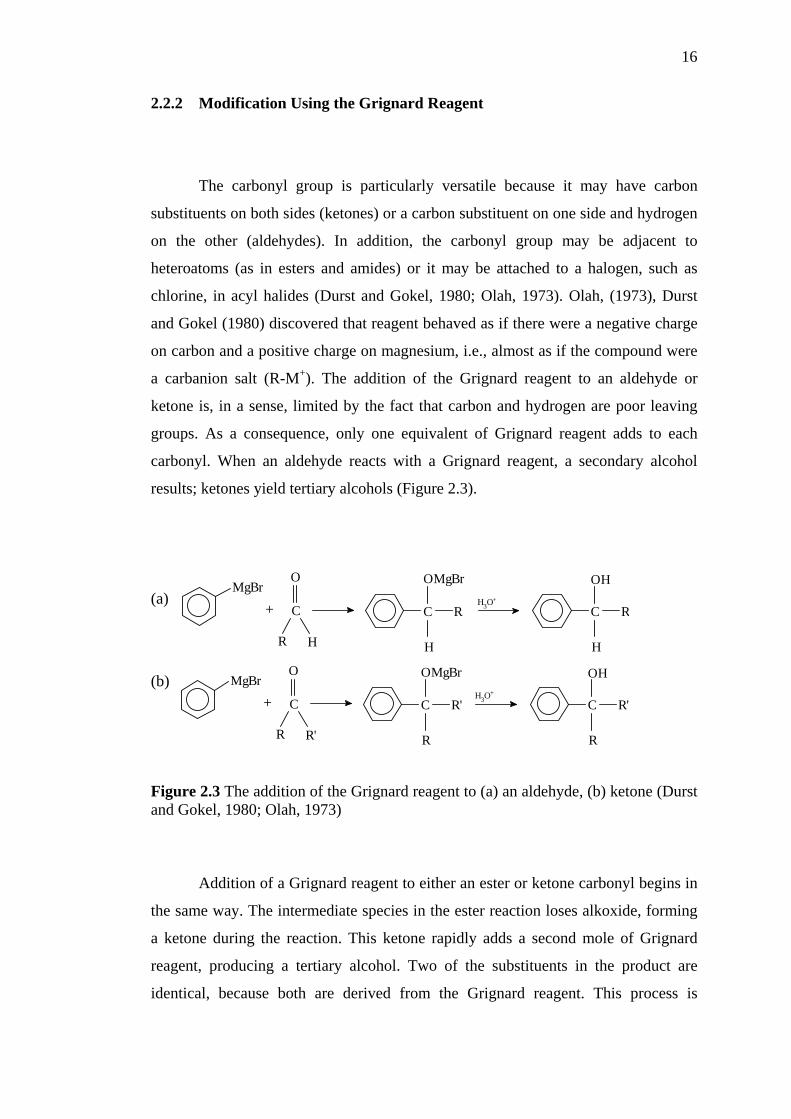
16
2.2.2 Modification Using the Grignard Reagent
The carbonyl group is particularly versatile because it may have carbon
substituents on both sides (ketones) or a carbon substituent on one side and hydrogen
on the other (aldehydes). In addition, the carbonyl group may be adjacent to
heteroatoms (as in esters and amides) or it may be attached to a halogen, such as
chlorine, in acyl halides (Durst and Gokel, 1980; Olah, 1973). Olah, (1973), Durst
and Gokel (1980) discovered that reagent behaved as if there were a negative charge
on carbon and a positive charge on magnesium, i.e., almost as if the compound were
a carbanion salt (R-M+). The addition of the Grignard reagent to an aldehyde or
ketone is, in a sense, limited by the fact that carbon and hydrogen are poor leaving
groups. As a consequence, only one equivalent of Grignard reagent adds to each
carbonyl. When an aldehyde reacts with a Grignard reagent, a secondary alcohol
results; ketones yield tertiary alcohols (Figure 2.3).
MgBr
C
OMgBr
R
H H
RC
OHH3O+
O
C
R H
+
MgBr
C
OMgBr
R'
R R
R'C
OHH3O+
O
C
R R'
+
(a)
(b)
Figure 2.3 The addition of the Grignard reagent to (a) an aldehyde, (b) ketone (Durst and Gokel, 1980; Olah, 1973)
Addition of a Grignard reagent to either an ester or ketone carbonyl begins in
the same way. The intermediate species in the ester reaction loses alkoxide, forming
a ketone during the reaction. This ketone rapidly adds a second mole of Grignard
reagent, producing a tertiary alcohol. Two of the substituents in the product are
identical, because both are derived from the Grignard reagent. This process is
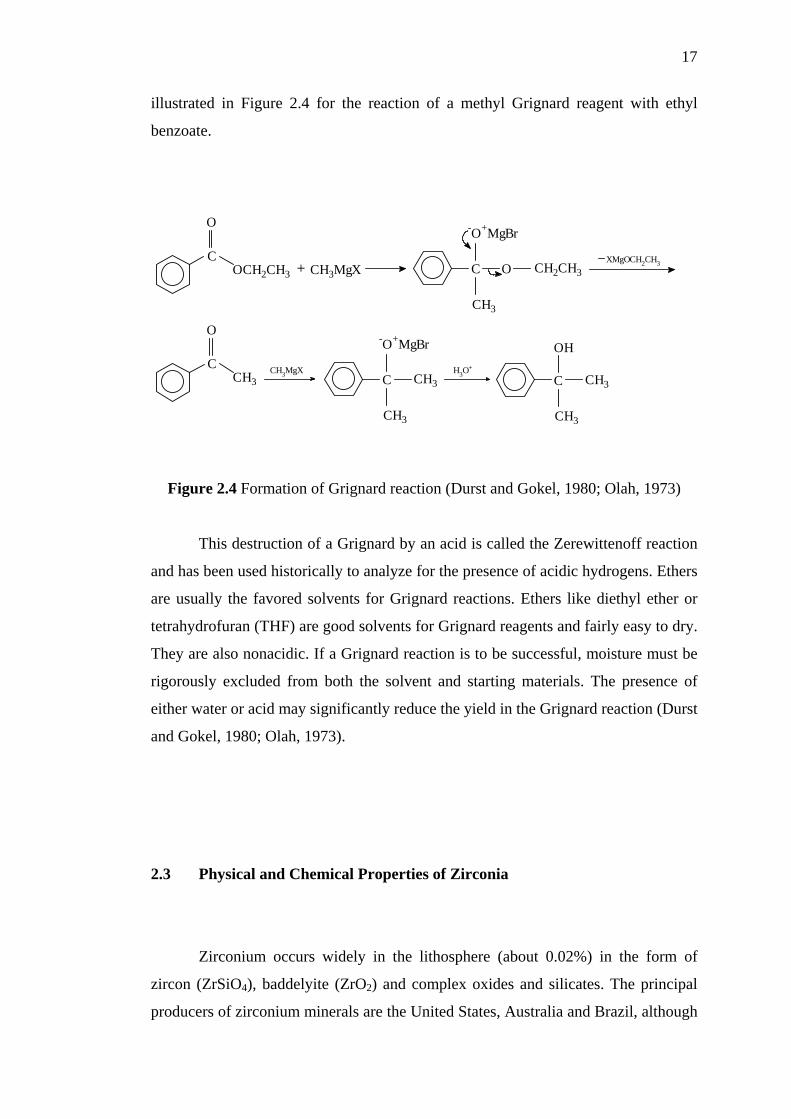
17
illustrated in Figure 2.4 for the reaction of a methyl Grignard reagent with ethyl
benzoate.
+C
O
OCH2CH3 CH3MgX
CH3
-O+MgBr
C O CH2CH3XMgOCH2CH3
H3O+
CH3C
-O+MgBr
CH3
CH3MgXCH3
O
C
CH3
OH
C CH3
Figure 2.4 Formation of Grignard reaction (Durst and Gokel, 1980; Olah, 1973)
This destruction of a Grignard by an acid is called the Zerewittenoff reaction
and has been used historically to analyze for the presence of acidic hydrogens. Ethers
are usually the favored solvents for Grignard reactions. Ethers like diethyl ether or
tetrahydrofuran (THF) are good solvents for Grignard reagents and fairly easy to dry.
They are also nonacidic. If a Grignard reaction is to be successful, moisture must be
rigorously excluded from both the solvent and starting materials. The presence of
either water or acid may significantly reduce the yield in the Grignard reaction (Durst
and Gokel, 1980; Olah, 1973).
2.3 Physical and Chemical Properties of Zirconia
Zirconium occurs widely in the lithosphere (about 0.02%) in the form of
zircon (ZrSiO4), baddelyite (ZrO2) and complex oxides and silicates. The principal
producers of zirconium minerals are the United States, Australia and Brazil, although
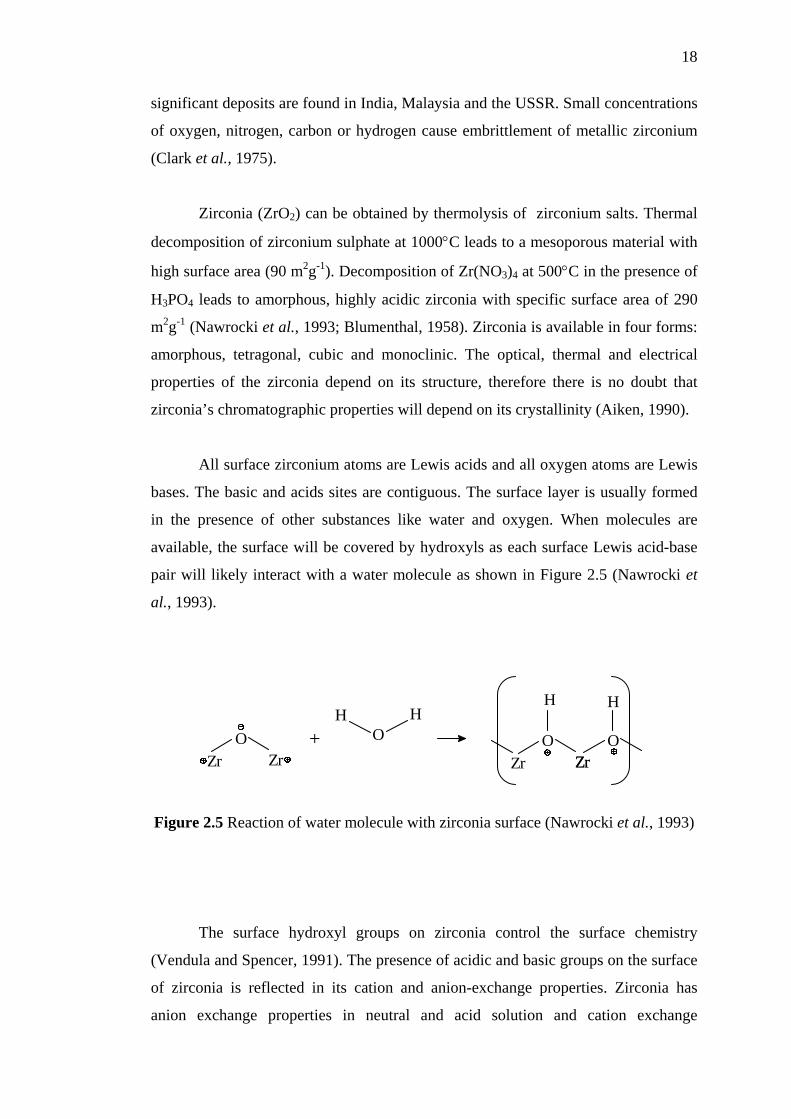
18
significant deposits are found in India, Malaysia and the USSR. Small concentrations
of oxygen, nitrogen, carbon or hydrogen cause embrittlement of metallic zirconium
(Clark et al., 1975).
Zirconia (ZrO2) can be obtained by thermolysis of zirconium salts. Thermal
decomposition of zirconium sulphate at 1000°C leads to a mesoporous material with
high surface area (90 m2g-1). Decomposition of Zr(NO3)4 at 500°C in the presence of
H3PO4 leads to amorphous, highly acidic zirconia with specific surface area of 290
m2g-1 (Nawrocki et al., 1993; Blumenthal, 1958). Zirconia is available in four forms:
amorphous, tetragonal, cubic and monoclinic. The optical, thermal and electrical
properties of the zirconia depend on its structure, therefore there is no doubt that
zirconia’s chromatographic properties will depend on its crystallinity (Aiken, 1990).
All surface zirconium atoms are Lewis acids and all oxygen atoms are Lewis
bases. The basic and acids sites are contiguous. The surface layer is usually formed
in the presence of other substances like water and oxygen. When molecules are
available, the surface will be covered by hydroxyls as each surface Lewis acid-base
pair will likely interact with a water molecule as shown in Figure 2.5 (Nawrocki et
al., 1993).
ZrO
H
ZrO+
H
ZrO
Zr
HH
ZrO
Figure 2.5 Reaction of water molecule with zirconia surface (Nawrocki et al., 1993)
The surface hydroxyl groups on zirconia control the surface chemistry
(Vendula and Spencer, 1991). The presence of acidic and basic groups on the surface
of zirconia is reflected in its cation and anion-exchange properties. Zirconia has
anion exchange properties in neutral and acid solution and cation exchange
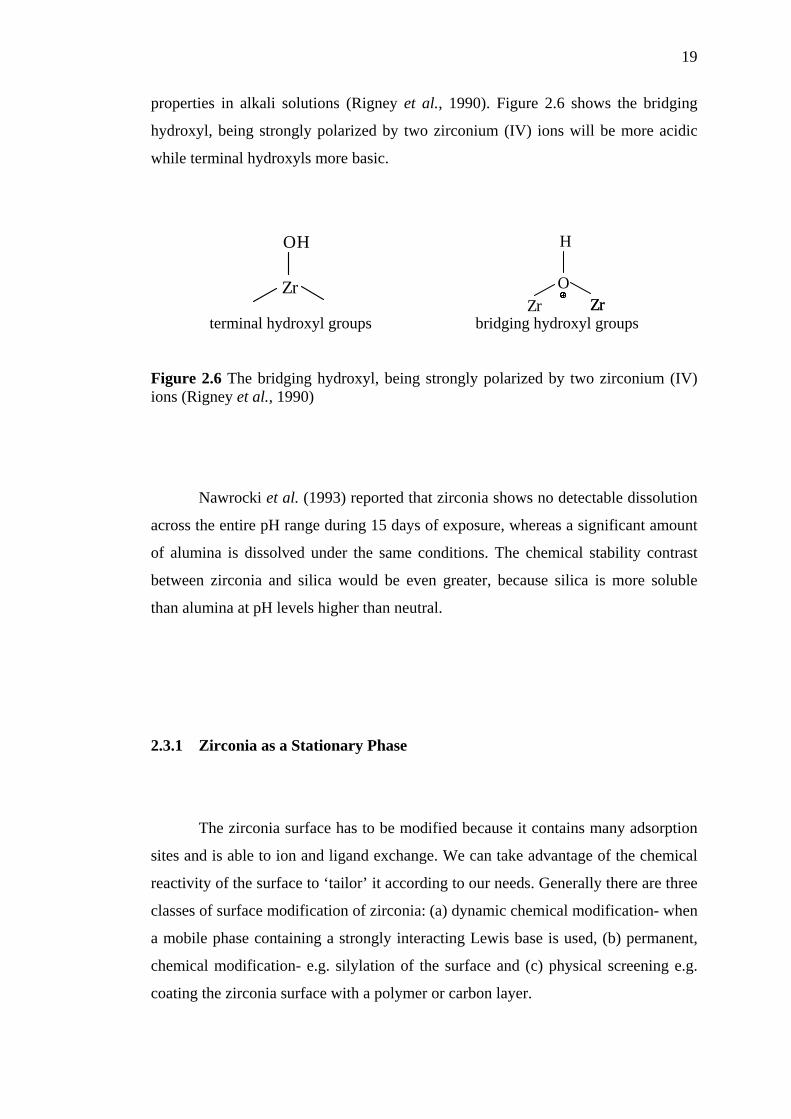
19
properties in alkali solutions (Rigney et al., 1990). Figure 2.6 shows the bridging
hydroxyl, being strongly polarized by two zirconium (IV) ions will be more acidic
while terminal hydroxyls more basic.
H
Zr
O
Zr
H
ZrO
Zr
terminal hydroxyl groups bridging hydroxyl groups
Figure 2.6 The bridging hydroxyl, being strongly polarized by two zirconium (IV) ions (Rigney et al., 1990)
Nawrocki et al. (1993) reported that zirconia shows no detectable dissolution
across the entire pH range during 15 days of exposure, whereas a significant amount
of alumina is dissolved under the same conditions. The chemical stability contrast
between zirconia and silica would be even greater, because silica is more soluble
than alumina at pH levels higher than neutral.
2.3.1 Zirconia as a Stationary Phase
The zirconia surface has to be modified because it contains many adsorption
sites and is able to ion and ligand exchange. We can take advantage of the chemical
reactivity of the surface to ‘tailor’ it according to our needs. Generally there are three
classes of surface modification of zirconia: (a) dynamic chemical modification- when
a mobile phase containing a strongly interacting Lewis base is used, (b) permanent,
chemical modification- e.g. silylation of the surface and (c) physical screening e.g.
coating the zirconia surface with a polymer or carbon layer.
20
Since the surface of zirconia is highly heterogeneous, modification of
zirconia on the surface to create ion-exchangable, hydrophobic and hydrophilic type
phases has been investigated (Hu et al., 2001; Rigney et al., 1990). Mixed oxides
have been used widely as catalysts, but very little attention has been paid to their
application in chromatographic stationary phases. Considerable attention has been
focused on modifying zirconia with inorganic oxides by using sol-gel technique for
improvement of its physicochemical properties.
Ceria, as a common rare earth oxide, has comparable chromatographic
advantages to zirconia, such as high mechanical strength, thermal and chemical
stability. Moreover, both ceria and zirconia are quadrivalent metal oxides, which
affords the possibility for them to stoichometrically match better, leading to
homogeneity of the mixed oxides. Hu et al. (2001) successfully synthesized ceria-
zirconia by the sol-gel process as a new packing material. In comparison with
zirconia, ceria-zirconia composite has a higher specific surface area and appropriate
pore structure. Results showed the stationary phase was promising for the separation
of basic compounds. The new packing material of reversed-phase performance can
be prepared by modification of ceria-zirconia with stearic acid, which is available for
separation of neutral and basic compounds (Hu et al., 2001).
When coated with a thin layer of polybutadiene, zirconia becomes a reversed
phase that is able to withstand extended exposure to mobile phases at pH 14 at a flow
rate of 1 mL min-1 and column temperatures as high as 200°C (McNeff et al., 2000).
The extraordinary thermal stability of this type of column enables rapid analysis of a
series of chlorophenols at 200°C in a purely aqueous mobile phase. The separation
on the polybutadiene-coated zirconia phase column was achieved in less than half the
time required by one of the silica columns and at pH 12, which is inaccessible on
conventional C18 silica phases.
21
2.3.2 Polybutadiene-coated Zirconia
Chemically stable modification of chromatographic of zirconia was
accomplished by deposition and cross-linking of polybutadiene (PBD) as in the
manner for the modification of silica and alumina (Vogelsang et al., 1984). The
result is a remarkably stable reversed-phase support. Analysis of the column effluent
for zirconium by ICP-AES showed no measurable level of zirconium. Under these
same conditions, a commercial polybutadiene-modified alumina column failed due to
bed collapse after 8,000 column volumes (Rigney et al., 1989).
The stability of polybutadiene-modified zirconia and alumina was evaluated
by exposing columns packed with these supports to a mobile phase of 1 M sodium
hydroxide at 100°C. No zirconium was found in the column effuent. In contrast,
alumina dissolves to a significant extent during the first hour of exposure to these
conditions. In fact, after 3.25 hours of exposure, the amount of aluminium dissolved
corresponded to more than 10% of the alumina originally present in the column.
There was evidence of strong, irreversible interactions between certain
solutes and the zirconia support. In fact these interactions were expected based on
considerations of zirconia’s unique surface chemistry. For example, carboxylic acids
and organophosphate solute irreversibly adsorbed. These interactions are analogous
to the well known interactions of amines with an acidic silica surface. Such
interactions lead to problems with peak tailing, poor efficiency, low recoveries and
hysteresis effects. These data leads us to believe that some of the surface sites are
still available for interactions.
By taking advantage of the strong interaction of phosphates with zirconia, the
number of sites could be measured in static adsorption experiments. Even the
thickest layer of PBD allowed about 2.3 μmolm-2 of phosphate to bind to zirconia.
Also chromatographic results confirm that a part of ZrO2-PBD surface is not covered
by the polymer. This leads to a mixed-mode retention mechanism. One possible
strategy for inhibiting interactions with zirconia’s surface is the use of phosphate-
containing mobile phases. Chromatography on ZrO2-PBD can be improved by the
22
addition of phosphate to the mobile phase. This is in contrast with the observed
“substantial deactivation” of silicas coated with PBD .
2.3.3 Polystyrene-coated zirconia
Particles of zirconia coated with polystyrene were used to separate several
mixtures of basic compounds with mobile phase containing HNO3 or NaOH. The
separations of acidic compounds showed lower efficiency even in the presence of an
acidic mobile phase.
2.3.4 Carbon-coated zirconia
Carbon packings differ substantially from other reversed-phase supports.
They are commonly more retentive towards polar compounds and are often more
selective for the separation of isomers and homologues (Knox et al., 1983). They
also have a much greater chemical stability over a wider pH and temperature range
than bonded phases. The drawbacks of carbon packings are often one or more of the
following: poor mechanical stability, low surface area, a heterogenous surface (and
therefore low loading capacity) and non uniform pore structure.
Zirconia particles coated with a carbon layer developed by Rigney et al.
(1990) seem to be substantially different from other carbon supports. The process of
carbon coating is carried out by passing organic vapors over the zirconia particles at
an elevated temperature and reduced pressure. The most common conditions are
700°C and 5-10 Torr. This procedure creates a uniform carbon coating on porous
particles. It is possible to cover more than 97% of the available zirconia surface
(Weber and Carr, 1990).
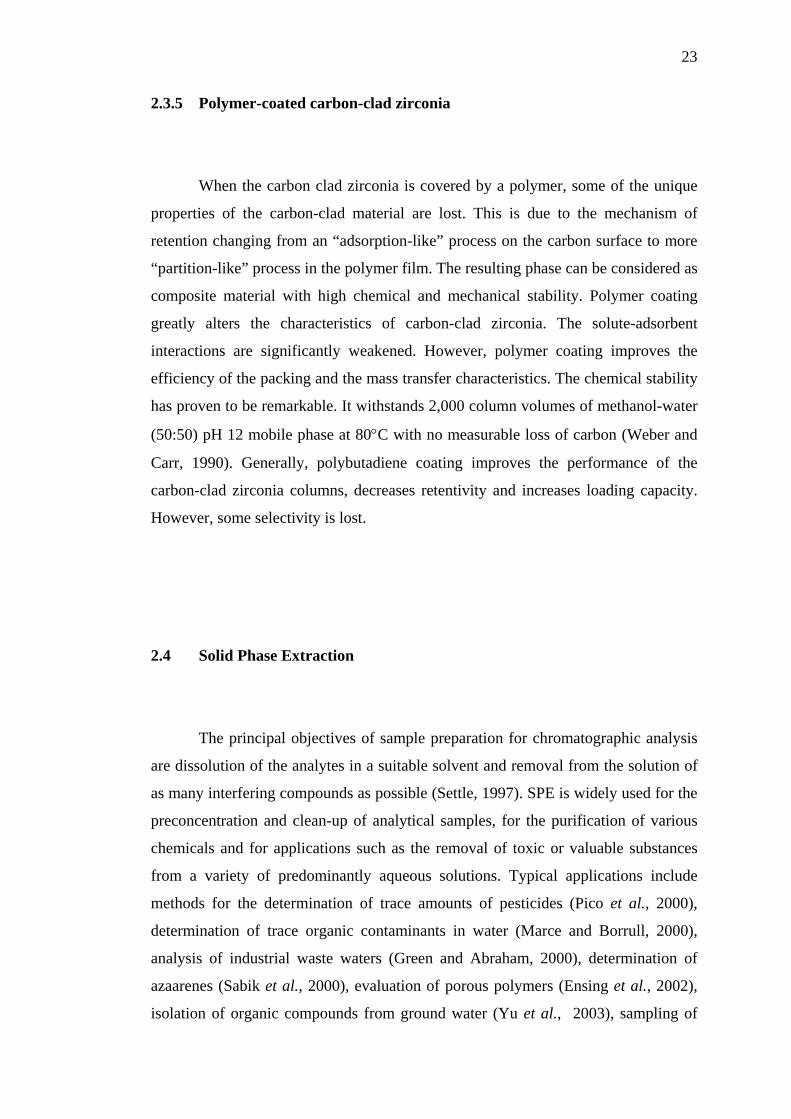
23
2.3.5 Polymer-coated carbon-clad zirconia
When the carbon clad zirconia is covered by a polymer, some of the unique
properties of the carbon-clad material are lost. This is due to the mechanism of
retention changing from an “adsorption-like” process on the carbon surface to more
“partition-like” process in the polymer film. The resulting phase can be considered as
composite material with high chemical and mechanical stability. Polymer coating
greatly alters the characteristics of carbon-clad zirconia. The solute-adsorbent
interactions are significantly weakened. However, polymer coating improves the
efficiency of the packing and the mass transfer characteristics. The chemical stability
has proven to be remarkable. It withstands 2,000 column volumes of methanol-water
(50:50) pH 12 mobile phase at 80°C with no measurable loss of carbon (Weber and
Carr, 1990). Generally, polybutadiene coating improves the performance of the
carbon-clad zirconia columns, decreases retentivity and increases loading capacity.
However, some selectivity is lost.
2.4 Solid Phase Extraction
The principal objectives of sample preparation for chromatographic analysis
are dissolution of the analytes in a suitable solvent and removal from the solution of
as many interfering compounds as possible (Settle, 1997). SPE is widely used for the
preconcentration and clean-up of analytical samples, for the purification of various
chemicals and for applications such as the removal of toxic or valuable substances
from a variety of predominantly aqueous solutions. Typical applications include
methods for the determination of trace amounts of pesticides (Pico et al., 2000),
determination of trace organic contaminants in water (Marce and Borrull, 2000),
analysis of industrial waste waters (Green and Abraham, 2000), determination of
azaarenes (Sabik et al., 2000), evaluation of porous polymers (Ensing et al., 2002),
isolation of organic compounds from ground water (Yu et al., 2003), sampling of
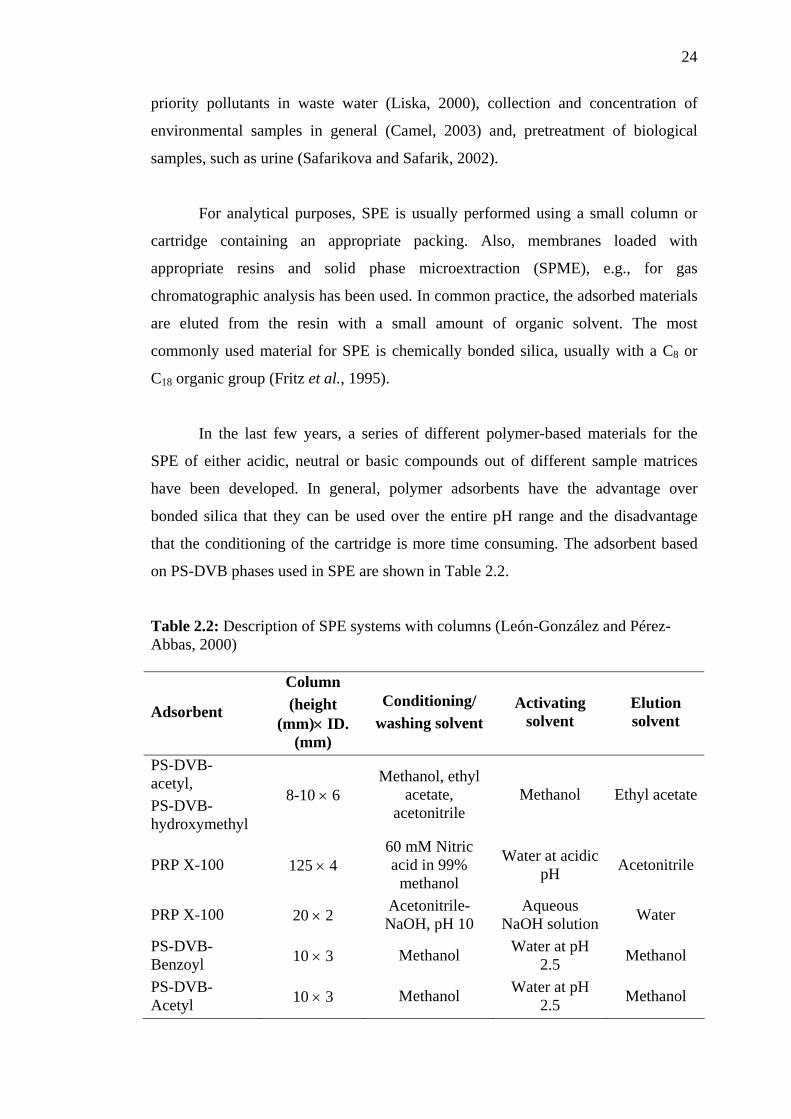
24
priority pollutants in waste water (Liska, 2000), collection and concentration of
environmental samples in general (Camel, 2003) and, pretreatment of biological
samples, such as urine (Safarikova and Safarik, 2002).
For analytical purposes, SPE is usually performed using a small column or
cartridge containing an appropriate packing. Also, membranes loaded with
appropriate resins and solid phase microextraction (SPME), e.g., for gas
chromatographic analysis has been used. In common practice, the adsorbed materials
are eluted from the resin with a small amount of organic solvent. The most
commonly used material for SPE is chemically bonded silica, usually with a C8 or
C18 organic group (Fritz et al., 1995).
In the last few years, a series of different polymer-based materials for the
SPE of either acidic, neutral or basic compounds out of different sample matrices
have been developed. In general, polymer adsorbents have the advantage over
bonded silica that they can be used over the entire pH range and the disadvantage
that the conditioning of the cartridge is more time consuming. The adsorbent based
on PS-DVB phases used in SPE are shown in Table 2.2.
Table 2.2: Description of SPE systems with columns (León-González and Pérez-Abbas, 2000)
Adsorbent
Column (height
(mm)× ID. (mm)
Conditioning/ washing solvent
Activating solvent
Elution solvent
PS-DVB-acetyl, PS-DVB-hydroxymethyl
8-10 × 6 Methanol, ethyl
acetate, acetonitrile
Methanol Ethyl acetate
PRP X-100 125 × 4 60 mM Nitric acid in 99%
methanol
Water at acidic pH Acetonitrile
PRP X-100 20 × 2 Acetonitrile-NaOH, pH 10
Aqueous NaOH solution Water
PS-DVB- Benzoyl 10 × 3 Methanol Water at pH
2.5 Methanol
PS-DVB-Acetyl 10 × 3 Methanol Water at pH
2.5 Methanol
25
Chemically bonded silica and porous polystyrene have several shortcomings
for their use in SPE. First, while silica itself is hydrophilic and alkaline instable, the
hydrocarbon chains make the surface hydrophobic. The consequence is poor surface
contact with predominantly aqueous solutions. Second, porous polystyrene resins
also have a hydrophobic surface. Third, pretreatment of the SPE materials with an
activating solvent such as methanol, acetone or acetonitrile must be used to obtain
better surface contact with the aqueous solution being extracted. The activating
solvent can be leached out of the resin, thereby causing the extraction to become
ineffective. This is especially true if the SPE column becomes dry because air is
sucked into the column. The results are reduced capacity and reproducibility. Fourth,
many types of organic compounds are incompletely extracted from predominantly
aqueous solutions. This problem especially occurs with bonded silica packings. The
target of creating new types of chemically bonded resins is to overcome these
drawbacks.
For an improvement it has been shown that introduction of polar groups into
a PS-DVB resin greatly increases the retention of polar organic compounds. As one
of the first, Sun and Fritz (1990 and 1992) modified PS-DVB with alcohol and acetyl
functional groups. The modified resins exhibited excellent hydrophilicity and a
reduced dependence on wetting prior to solid phase extraction. They also yielded
higher recoveries compared to their unmodified homologues. Furthermore, Schmidt
et al. (1993) shown that also derivatization with other functionalities can be carried
out. They used a sulfonated PS-DVB resin for the simultaneous extraction of bases
and neutrals.
2.4.1 Basic Principles of SPE
The SPE method always consists of three to four successive steps (Camel,
2003; Fontanals et al., 2004; Fritz et al., 1995; Hennion, 1999). First, the solid
sorbent should be conditioned using an appropriate solvent, followed by the same
26
solvent as the sample solvent. This step is crucial as it enables the wetting of the
packing material and the solvation of the functional groups. In addition, it removes
possible impurities initially contained in the sorbent or the packaging. Also, this step
removes the air present in the column and fills the void volume with solvent. The
nature of the conditioning solvent depends on the nature of the solid sorbent.
Typically, for reversed phase sorbent (such as octadecyl-bonded silica), methanol is
frequently used, followed with water or aqueous buffer whose pH and ionic strength
are similar to that of the sample.
Care must be taken not to allow the solid sorbent to dry between the
conditioning and the sample treatment steps, otherwise the analytes will not be
efficiently retained and poor recoveries will be obtained. If the sorbent dries for more
than several minutes, it must be reconditioned. The second step is the percolation of
the sample through the solid sorbent. Depending on the system used, volumes can
range from 1 mL to 1 L. The sample may be applied to the column by gravity,
pumping, aspirated by vacuum or by an automated system. The sample flow-rate
through the sorbent should be low enough to enable efficient retention of the
analytes, and high enough to avoid excessive duration. During this step, the analytes
are concentrated on the sorbent. Even though matrix components may also be
retained by the solid sorbents, some of them pass through, thus enabling some
purification (matrix separation) of the sample.
The third step (which is optional) may be the washing of the solid sorbent
with an appropriate solvent, having low elution strength, to eliminate matrix
components that have been retained by the solid sorbent, without displacing the
analytes. A drying step may also be advisable, especially for aqueous matrices, to
remove traces of water from the solid sorbent. This will eliminate the presence of
water in the final extract, which, in some cases, may hinder the subsequent
concentration of the extract and/or the analysis.
The final step consists of the elution of the analytes of interest by an
appropriate solvent, without removing retained matrix components. The solvent
volume should be adjusted so that quantitative recovery of the analytes is achieved
27
with subsequent low dilution. In addition, the flow-rate should be correctly adjusted
to ensure efficient elution.
2.4.2 Advantages of SPE
Classical liquid-liquid extractions (LLE) of trace elements are usually time-
consuming and labor-intensive. In addition, they require strict control of extraction
conditions, such as temperature, pH and ionic strength. For all these reasons, several
LLE procedures tend to be replaced by SPE methods. SPE technique is attractive as
it reduces consumption of and exposure to solvents, their disposal costs and
extraction time. In addition, SPE can be interfaced on-line with analytical techniques,
such as liquid chromatography (LC) or atomic absorption spectrometry (AAS)
(Edward, 1970, Hennion, 1999 and 2000). SPE can be easily automated, and several
commercially available systems have been recently reviewed. Home-made systems
have also been reported. Its application for preconcentration of trace metals from
different samples is also very convenient due to sorption of target species on the
solid surface in a more stable chemical form than in solution (Camel, 2003; Liska,
2000; Melo et al., 2004). Upon elution of the retained compounds by a volume
smaller than the sample volume, concentration of the extract can be easily achieved.
Hence, concentration factors of up to 1000 may be attained (Nilsson, 2000; Coutinho
et al., 2004).
SPE allows on-site pretreatment, followed by simple storage and
transportation of the pre-treated samples with stability of the retained metallic
species for several days. This point is crucial for the determination of trace elements,
as the transport of the sample to the laboratory and its storage until analysis may
induce problems, especially changes in the speciation (Ensing et al., 2002; León-
González and Pérez-Arribas, 2000).

28
SPE offers the opportunity of selectively extracting and preconcentrating only
the trace elements of interest, thereby avoiding the presence of major ions. It may
also be possible to selectively retain some particular species of a metal, thereby
enabling speciation. This high selectivity may also be used to remove substances
present in the sample that may hinder metal determination, such as lipid substances
in the case of biological samples (Green and Abraham, 2000; Huck and Bonn, 2000).
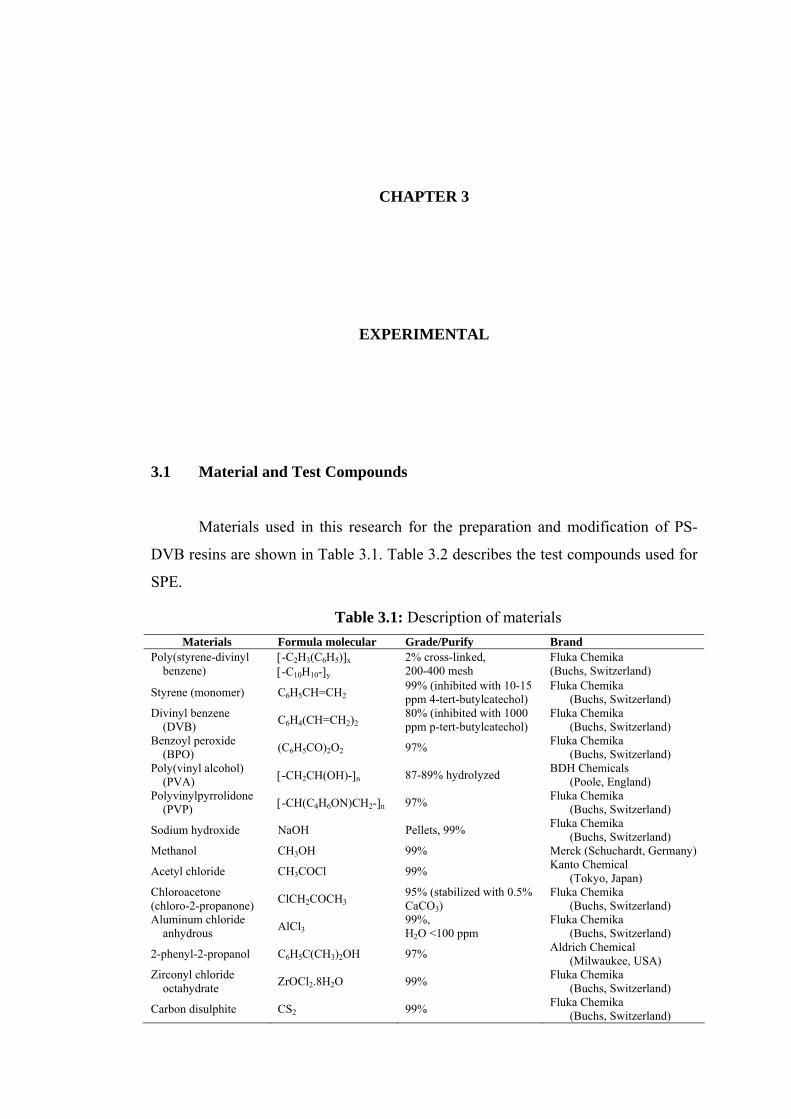
CHAPTER 3
EXPERIMENTAL
3.1 Material and Test Compounds
Materials used in this research for the preparation and modification of PS-
DVB resins are shown in Table 3.1. Table 3.2 describes the test compounds used for
SPE.
Table 3.1: Description of materials Materials Formula molecular Grade/Purify Brand
Poly(styrene-divinyl benzene)
[-C2H3(C6H5)]x [-C10H10-]y
2% cross-linked, 200-400 mesh
Fluka Chemika (Buchs, Switzerland)
Styrene (monomer) C6H5CH=CH299% (inhibited with 10-15 ppm 4-tert-butylcatechol)
Fluka Chemika (Buchs, Switzerland)
Divinyl benzene (DVB) C6H4(CH=CH2)2
80% (inhibited with 1000 ppm p-tert-butylcatechol)
Fluka Chemika (Buchs, Switzerland)
Benzoyl peroxide (BPO) (C6H5CO)2O2 97% Fluka Chemika
(Buchs, Switzerland) Poly(vinyl alcohol)
(PVA) [-CH2CH(OH)-]n 87-89% hydrolyzed BDH Chemicals (Poole, England)
Polyvinylpyrrolidone (PVP) [-CH(C4H6ON)CH2-]n 97% Fluka Chemika
(Buchs, Switzerland)
Sodium hydroxide NaOH Pellets, 99% Fluka Chemika (Buchs, Switzerland)
Methanol CH3OH 99% Merck (Schuchardt, Germany)
Acetyl chloride CH3COCl 99% Kanto Chemical (Tokyo, Japan)
Chloroacetone (chloro-2-propanone) ClCH2COCH3
95% (stabilized with 0.5% CaCO3)
Fluka Chemika (Buchs, Switzerland)
Aluminum chloride anhydrous AlCl3
99%, H2O <100 ppm
Fluka Chemika (Buchs, Switzerland)
2-phenyl-2-propanol C6H5C(CH3)2OH 97% Aldrich Chemical (Milwaukee, USA)
Zirconyl chloride octahydrate ZrOCl2.8H2O 99% Fluka Chemika
(Buchs, Switzerland)
Carbon disulphite CS2 99% Fluka Chemika (Buchs, Switzerland)
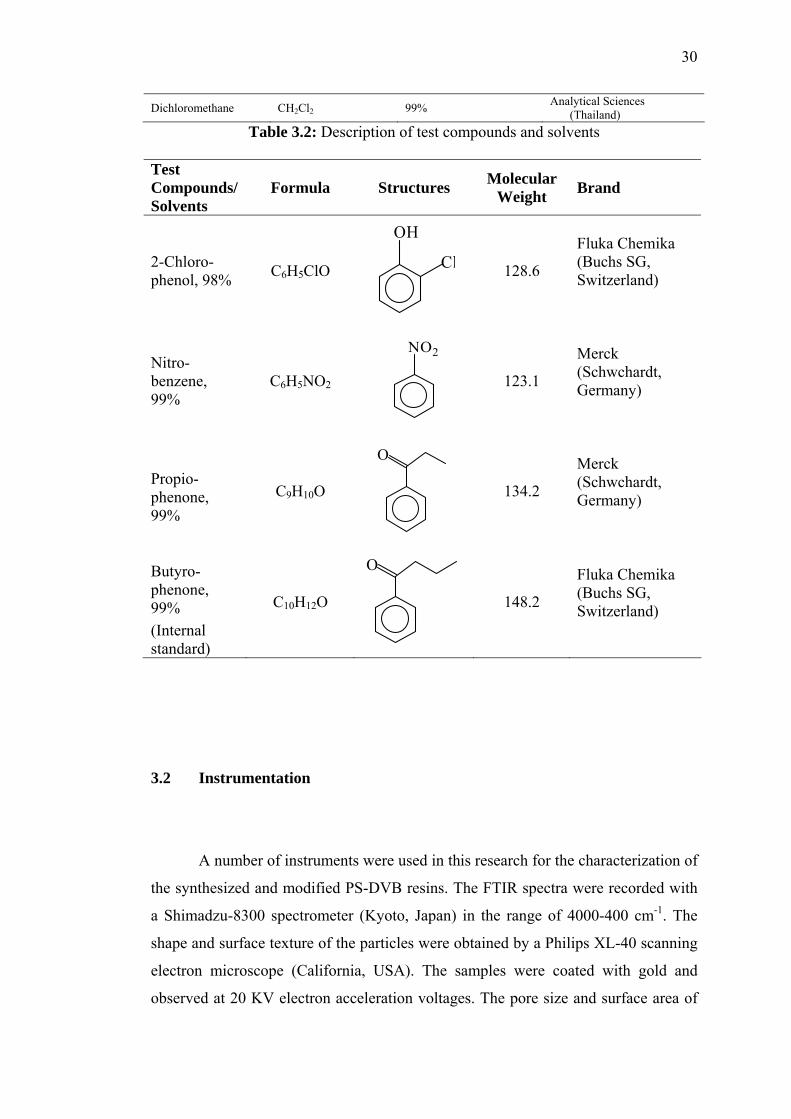
30
Dichloromethane CH2Cl2 99% Analytical Sciences (Thailand)
Table 3.2: Description of test compounds and solvents Test Compounds/ Solvents
Formula Structures Molecular Weight Brand
2-Chloro-phenol, 98% C6H5ClO
OH
Cl
128.6
Fluka Chemika (Buchs SG, Switzerland)
Nitro-benzene, 99%
C6H5NO2
NO2
123.1
Merck (Schwchardt, Germany)
Propio-phenone, 99%
C9H10O
O
134.2
Merck (Schwchardt, Germany)
Butyro-phenone, 99% (Internal standard)
C10H12O
O
148.2
Fluka Chemika (Buchs SG, Switzerland)
3.2 Instrumentation
A number of instruments were used in this research for the characterization of
the synthesized and modified PS-DVB resins. The FTIR spectra were recorded with
a Shimadzu-8300 spectrometer (Kyoto, Japan) in the range of 4000-400 cm-1. The
shape and surface texture of the particles were obtained by a Philips XL-40 scanning
electron microscope (California, USA). The samples were coated with gold and
observed at 20 KV electron acceleration voltages. The pore size and surface area of
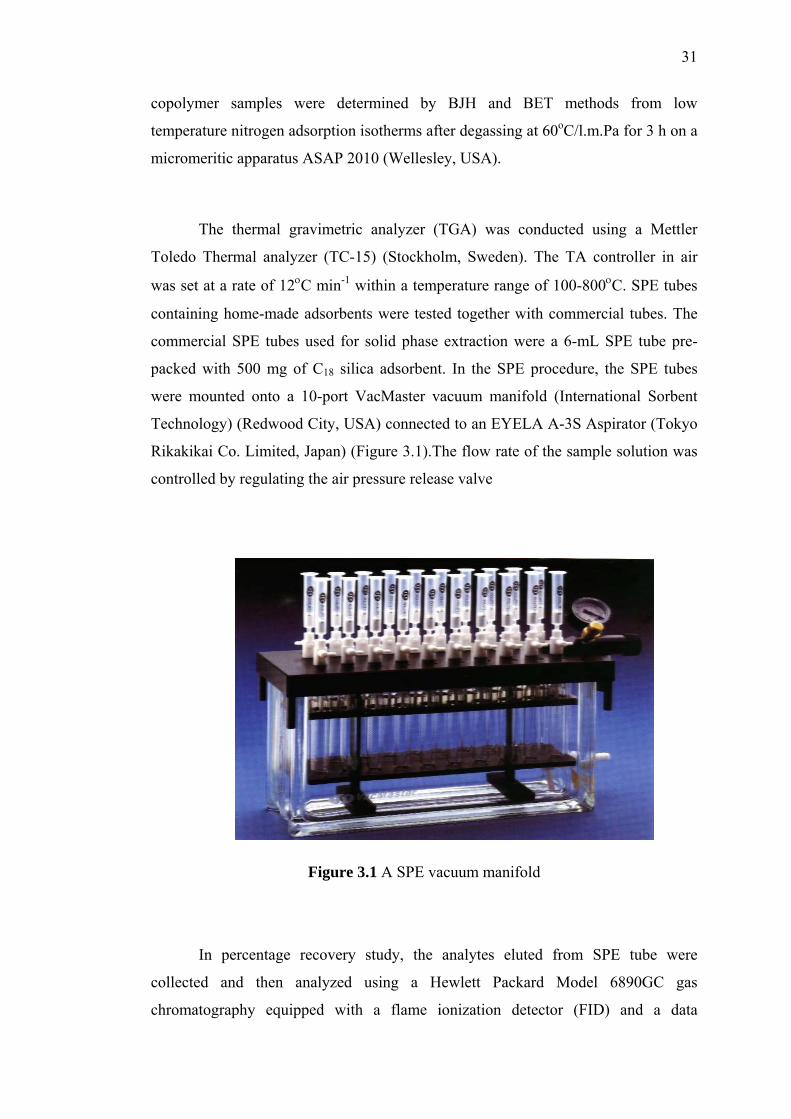
31
copolymer samples were determined by BJH and BET methods from low
temperature nitrogen adsorption isotherms after degassing at 60oC/l.m.Pa for 3 h on a
micromeritic apparatus ASAP 2010 (Wellesley, USA).
The thermal gravimetric analyzer (TGA) was conducted using a Mettler
Toledo Thermal analyzer (TC-15) (Stockholm, Sweden). The TA controller in air
was set at a rate of 12οC min-1 within a temperature range of 100-800οC. SPE tubes
containing home-made adsorbents were tested together with commercial tubes. The
commercial SPE tubes used for solid phase extraction were a 6-mL SPE tube pre-
packed with 500 mg of C18 silica adsorbent. In the SPE procedure, the SPE tubes
were mounted onto a 10-port VacMaster vacuum manifold (International Sorbent
Technology) (Redwood City, USA) connected to an EYELA A-3S Aspirator (Tokyo
Rikakikai Co. Limited, Japan) (Figure 3.1).The flow rate of the sample solution was
controlled by regulating the air pressure release valve
Figure 3.1 A SPE vacuum manifold
In percentage recovery study, the analytes eluted from SPE tube were
collected and then analyzed using a Hewlett Packard Model 6890GC gas
chromatography equipped with a flame ionization detector (FID) and a data
32
processor (Palo Alto, California, USA). The gas chromatographic column used was
Ultra-1 932530, a non-polar, fused-silica capillary column (30 m length × 250 μm
inner diameter × 0.20 μm film thickness) (Oklahoma, USA). Helium gas was used as
the carrier gas with a flow rate of 1.1 mL/min at a pressure of 75 kpa. The injector
temperature was set at 250°C and the detector temperature was set at 310°C. The gas
chromatography oven was operated under programmed temperature with an initial
temperature of 100°C, which was held for 2 minutes and ramped up to 140°C at a the
rate of 5°C min-1. Each sample (1 μL) was injected into the gas chromatograph by
using a 10 μL syringe obtained from Agilent (Little Fall, USA). Triplicate extractions
were carried out for each sample and three injections were carried out for each
extract to obtain a measure of repeatability.
The efficiencies of adsorbents were determined by determining the
percentage of recovery of test compounds by using butyrophenone as internal
standard.
3.3 Preparation of Adsorbents
This section discusses about procedures used in the preparation of PS-DVB,
and modification of PS-DVB by Friedel Crafts acylation, Grignard reaction and
reaction PS-DVB with zirconyl chloride (Figure 3.2).
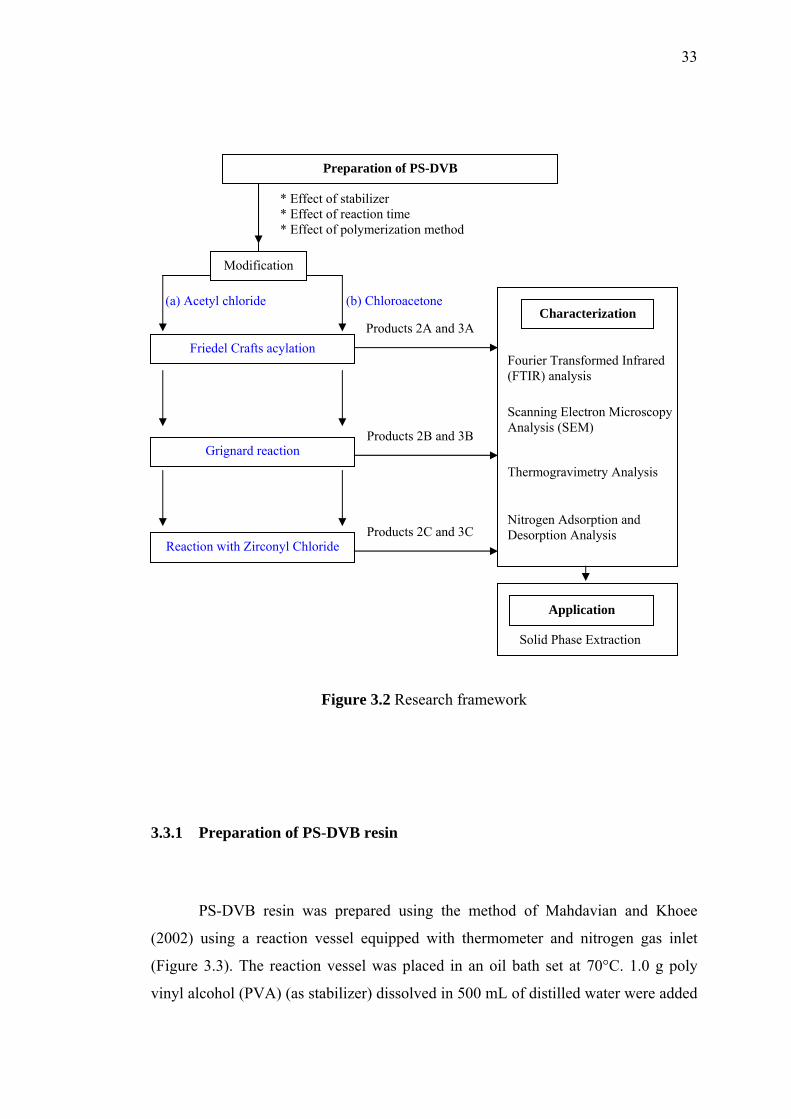
33
* Effect of stabilizer * Effect of reaction time * Effect of polymerization method
Friedel Crafts acylation
Grignard reaction
Reaction with Zirconyl Chloride
Fourier Transformed Infrared (FTIR) analysis
Scanning Electron Microscopy Analysis (SEM)
Nitrogen Adsorption and Desorption Analysis
Thermogravimetry Analysis
(a) Acetyl chloride (b) Chloroacetone Characterization
Modification
Preparation of PS-DVB
Products 2A and 3A
Products 2B and 3B
Products 2C and 3C
Solid Phase Extraction
Application
Figure 3.2 Research framework
3.3.1 Preparation of PS-DVB resin
PS-DVB resin was prepared using the method of Mahdavian and Khoee
(2002) using a reaction vessel equipped with thermometer and nitrogen gas inlet
(Figure 3.3). The reaction vessel was placed in an oil bath set at 70°C. 1.0 g poly
vinyl alcohol (PVA) (as stabilizer) dissolved in 500 mL of distilled water were added
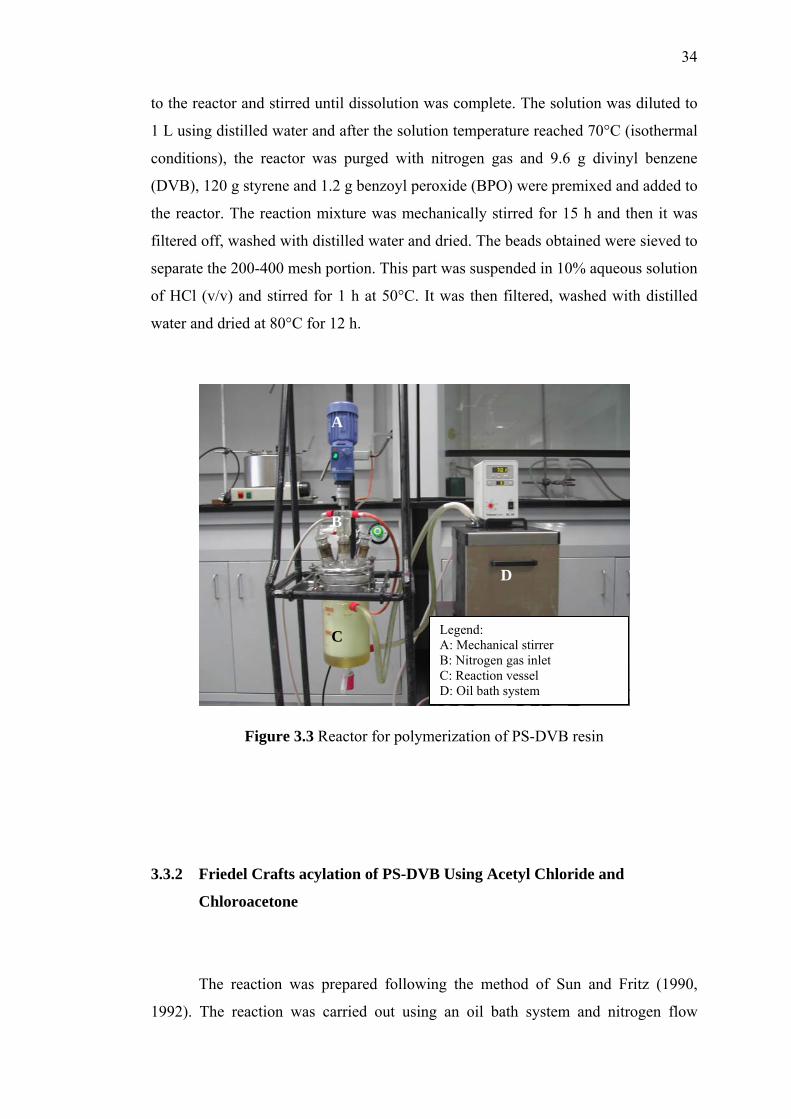
34
to the reactor and stirred until dissolution was complete. The solution was diluted to
1 L using distilled water and after the solution temperature reached 70°C (isothermal
conditions), the reactor was purged with nitrogen gas and 9.6 g divinyl benzene
(DVB), 120 g styrene and 1.2 g benzoyl peroxide (BPO) were premixed and added to
the reactor. The reaction mixture was mechanically stirred for 15 h and then it was
filtered off, washed with distilled water and dried. The beads obtained were sieved to
separate the 200-400 mesh portion. This part was suspended in 10% aqueous solution
of HCl (v/v) and stirred for 1 h at 50°C. It was then filtered, washed with distilled
water and dried at 80°C for 12 h.
A
B
D
Legend: A: Mechanical stirrer B: Nitrogen gas inlet C: Reaction vessel D: Oil bath system
C
Figure 3.3 Reactor for polymerization of PS-DVB resin
3.3.2 Friedel Crafts acylation of PS-DVB Using Acetyl Chloride and
Chloroacetone
The reaction was prepared following the method of Sun and Fritz (1990,
1992). The reaction was carried out using an oil bath system and nitrogen flow
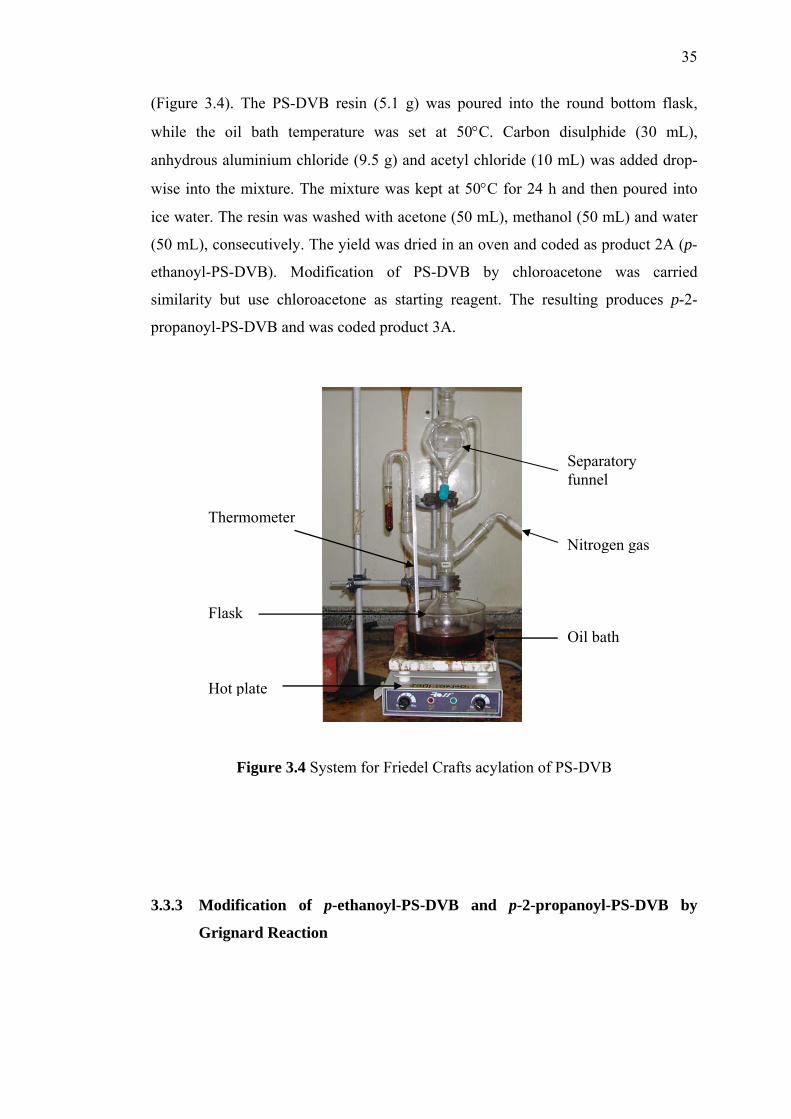
35
(Figure 3.4). The PS-DVB resin (5.1 g) was poured into the round bottom flask,
while the oil bath temperature was set at 50°C. Carbon disulphide (30 mL),
anhydrous aluminium chloride (9.5 g) and acetyl chloride (10 mL) was added drop-
wise into the mixture. The mixture was kept at 50°C for 24 h and then poured into
ice water. The resin was washed with acetone (50 mL), methanol (50 mL) and water
(50 mL), consecutively. The yield was dried in an oven and coded as product 2A (p-
ethanoyl-PS-DVB). Modification of PS-DVB by chloroacetone was carried
similarity but use chloroacetone as starting reagent. The resulting produces p-2-
propanoyl-PS-DVB and was coded product 3A.
Oil bath
Nitrogen gas
Thermometer
Flask
Separatory funnel
Hot plate
Figure 3.4 System for Friedel Crafts acylation of PS-DVB
3.3.3 Modification of p-ethanoyl-PS-DVB and p-2-propanoyl-PS-DVB by
Grignard Reaction
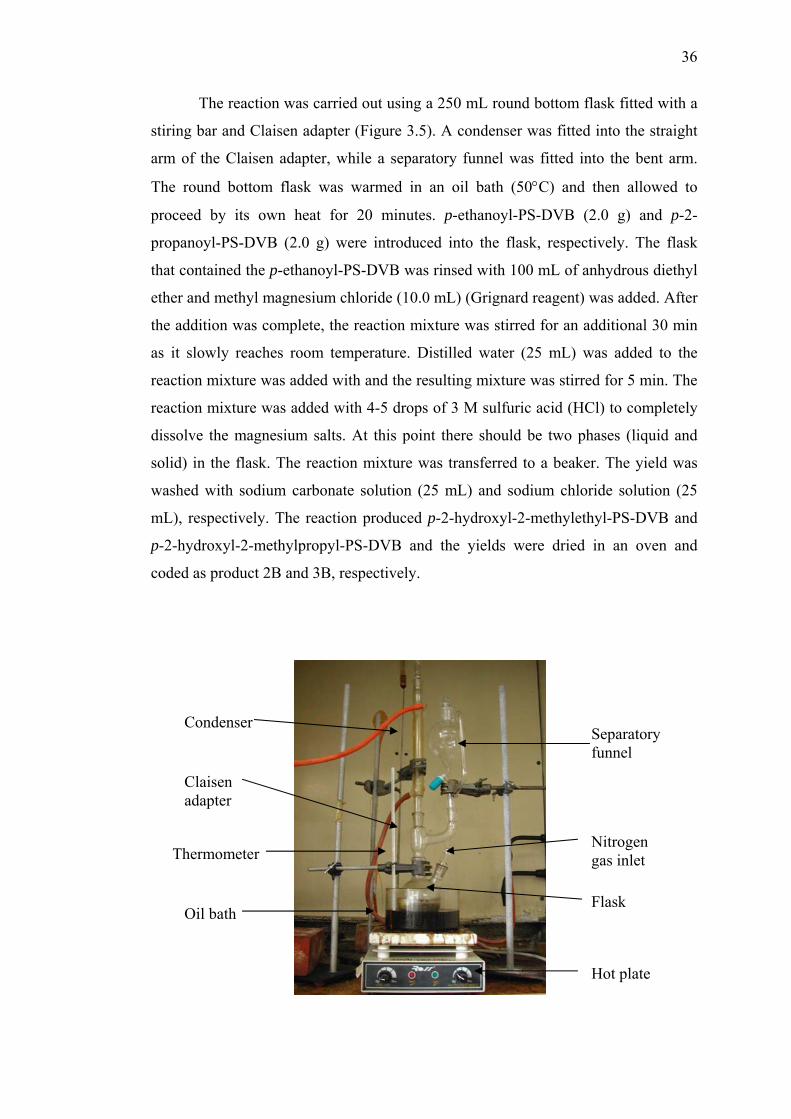
36
The reaction was carried out using a 250 mL round bottom flask fitted with a
stiring bar and Claisen adapter (Figure 3.5). A condenser was fitted into the straight
arm of the Claisen adapter, while a separatory funnel was fitted into the bent arm.
The round bottom flask was warmed in an oil bath (50°C) and then allowed to
proceed by its own heat for 20 minutes. p-ethanoyl-PS-DVB (2.0 g) and p-2-
propanoyl-PS-DVB (2.0 g) were introduced into the flask, respectively. The flask
that contained the p-ethanoyl-PS-DVB was rinsed with 100 mL of anhydrous diethyl
ether and methyl magnesium chloride (10.0 mL) (Grignard reagent) was added. After
the addition was complete, the reaction mixture was stirred for an additional 30 min
as it slowly reaches room temperature. Distilled water (25 mL) was added to the
reaction mixture was added with and the resulting mixture was stirred for 5 min. The
reaction mixture was added with 4-5 drops of 3 M sulfuric acid (HCl) to completely
dissolve the magnesium salts. At this point there should be two phases (liquid and
solid) in the flask. The reaction mixture was transferred to a beaker. The yield was
washed with sodium carbonate solution (25 mL) and sodium chloride solution (25
mL), respectively. The reaction produced p-2-hydroxyl-2-methylethyl-PS-DVB and
p-2-hydroxyl-2-methylpropyl-PS-DVB and the yields were dried in an oven and
coded as product 2B and 3B, respectively.
Thermometer
Oil bath
Condenser
Claisen adapter
Separatory funnel
Hot plate
Flask
Nitrogen gas inlet
37
Figure 3.5 System for modification of PS-DVB using Grignard reaction
3.3.4 Modification of p-2-hydroxyl-2-methylethyl-PS-DVB and p-2-hydroxyl-
2-methylpropyl-PS-DVB by Zirconyl Chloride
Modification of PS-DVB with zirconyl chloride was carried out using the
method of Hussain (1984). For each set of experiment, zirconyl chloride octahydrate
(ZrOCl2.8H2O) (10.0 g) was dissolved in 200 mL of freshly prepared distilled water
in a 250 mL round bottom flask. The flask was warmed in an oil bath to start the
reaction and the reaction was allowed to proceed by its own heat for 20 minutes. p-2-
hydroxyl-2-methylethane-PS-DVB (5.0 g) was added to the first flask and p-2-
hydroxyl-2-methylpentane-PS-DVB (5.0 g) added into the second flask. Each
mixtures was slowly titrated with 1M solution of sodium hydroxide, addition of the
latter being continued until the pH of the resulting solution attained a value of 7.0.
The pH of this solution was closely monitored using a pH meter over a period of 24 h
to verify that a constant pH had been attained.
The gel formed was separated by using a centrifuge and washed with distilled
water (100 mL) until the wash solution was completely free from chloride ions. The
gel was then thawed for 24 h at room temperature, filtered and dried under laboratory
vacuum at 70°C. The yields were coded as p-2-zirconyl-2-methylethyl-PS-DVB
chloride and p-2-zirconyl-2-methylpropyl-PS-DVB chloride, respectively. All
modified PS-DVB resins were coded to reflect their preparation as shown in Table
3.3.
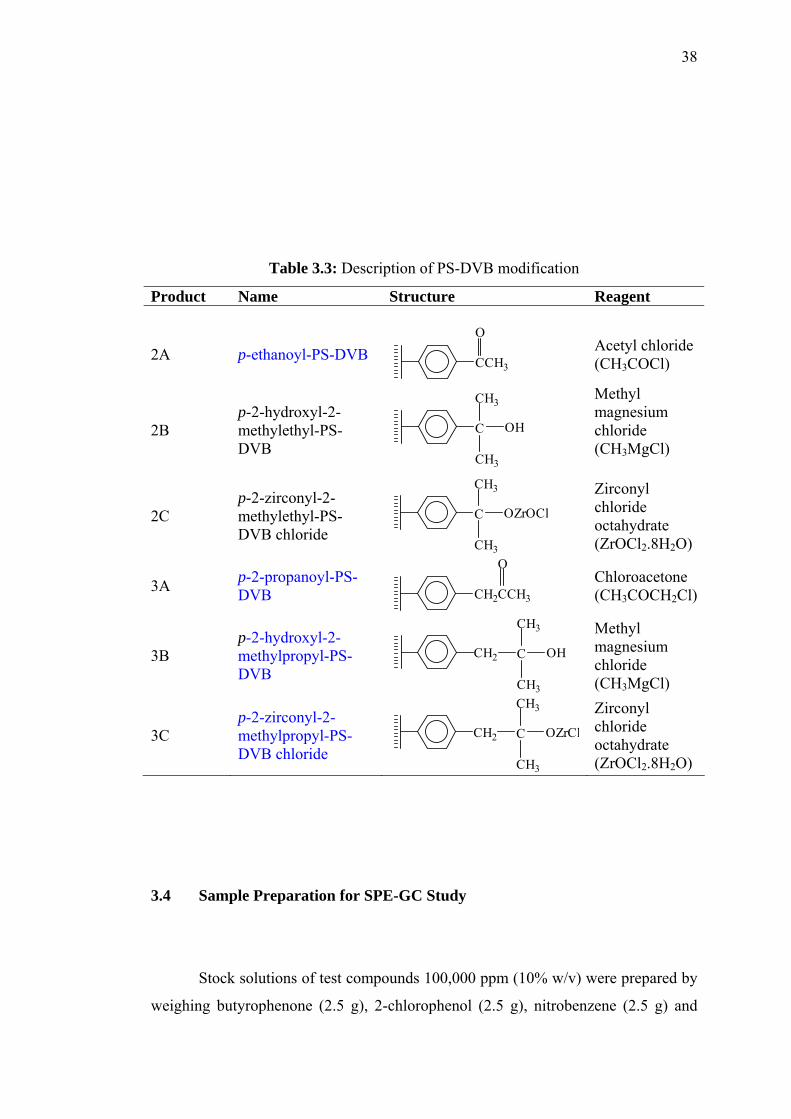
38
Table 3.3: Description of PS-DVB modification
Product Name Structure Reagent
2A p-ethanoyl-PS-DVB CCH3
O
Acetyl chloride (CH3COCl)
2B p-2-hydroxyl-2-methylethyl-PS-DVB
C OH
CH3
CH3
Methyl magnesium chloride (CH3MgCl)
2C p-2-zirconyl-2-methylethyl-PS-DVB chloride
C OZrOCl
CH3
CH3
Zirconyl chloride octahydrate (ZrOCl2.8H2O)
3A p-2-propanoyl-PS-DVB CH2CCH3
O
Chloroacetone (CH3COCH2Cl)
3B p-2-hydroxyl-2-methylpropyl-PS-DVB
CH3
CH3
OHCCH2
Methyl magnesium chloride (CH3MgCl)
3C p-2-zirconyl-2-methylpropyl-PS-DVB chloride
CH3
CH3
OZrClCCH2
Zirconyl chloride octahydrate (ZrOCl2.8H2O)
3.4 Sample Preparation for SPE-GC Study
Stock solutions of test compounds 100,000 ppm (10% w/v) were prepared by
weighing butyrophenone (2.5 g), 2-chlorophenol (2.5 g), nitrobenzene (2.5 g) and
39
propiophenone (2.5 g) in separate 25 mL volumetric flasks and each compound was
dissolved and diluted in methanol to the mark. The stock solutions prepared were
stored in the refrigerator at 4°C. The sample aqueous solution containing individual
test compounds for solid phase extraction were prepared by adding 2-chlorophenol
100,000 ppm (10% w/v) stock solution (0.1 mL), nitrobenzene 100,000 ppm (10%
w/v) stock solution (0.1 mL) and propiohenone 100,000 ppm (10% w/v) stock
solution (0.1 mL) into three separate 10 mL volumetric flasks and each solution was
diluted to the mark with deionized water. Each sample of aqueous solution prepared
therefore contained 1% v/v of methanol. An aqueous solution of the four test
compounds were prepared by adding 2-chlorophenol 100,000 ppm (10% w/v) stock
solution (0.1 mL), nitrobenzene 100,000 ppm (10% w/v) stock solution (0.1 mL) and
propiohenone 100,000 ppm (10% w/v) stock solution (0.1 mL) into a 10 mL
volumetric flask and the solution were diluted to the mark with deionized water. The
sample aqueous solution prepared therefore contained (4% v/v) of methanol.
3.5 Preparation of Solid Phase Extraction Column
A series of SPE columns were prepared using synthesized adsorbents, namely
PS-DVB, p-ethanoyl-PS-DVB, p-2-hydroxyl-2-methylethyl-PS-DVB, p-2-zirconyl-
2-methylethyl-PS-DVB chloride, p-2-propanoyl-PS-DVB, p-2-hydroxyl-2-
methylpropyl-PS-DVB and p-2-zirconyl-2-methylpropyl-PS-DVB chloride (Table
3.4).
Unmodified and modified PS-DVB adsorbents were ground and sieved into
the size range of 400 to 200 mesh by using mortar, pestle and siever. An empty SPE
6 mL tube was prepared. The outlet frit was inserted until it reaches the bottom base
of the SPE tube. Adsorbent (0.5 g) was poured into the SPE tube and the inlet frit
was inserted onto the SPE tube so that the adsorbent was sandwiched between the
two frits. The steps in the preparation of a laboratory-made SPE column are shown in
Figure 3.6.
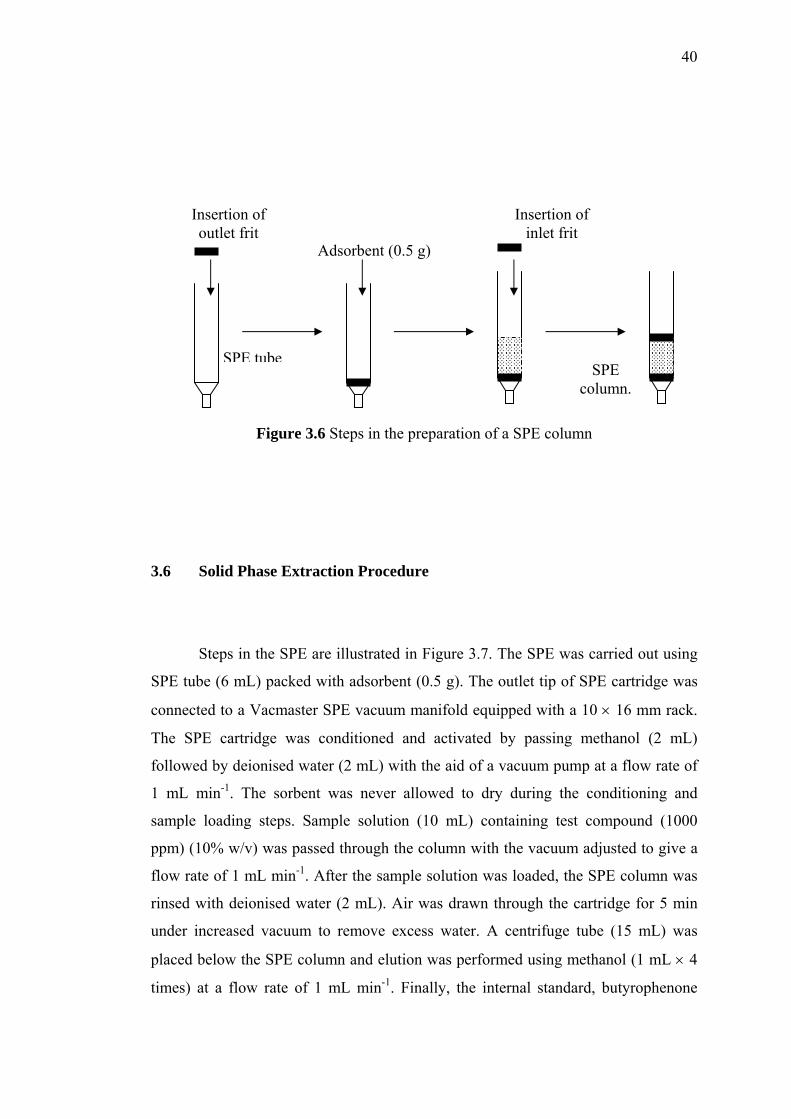
40
SPE tube
Insertion of outlet frit
Adsorbent (0.5 g)
SPE column.
Insertion of inlet frit
Figure 3.6 Steps in the preparation of a SPE column
3.6 Solid Phase Extraction Procedure
Steps in the SPE are illustrated in Figure 3.7. The SPE was carried out using
SPE tube (6 mL) packed with adsorbent (0.5 g). The outlet tip of SPE cartridge was
connected to a Vacmaster SPE vacuum manifold equipped with a 10 × 16 mm rack.
The SPE cartridge was conditioned and activated by passing methanol (2 mL)
followed by deionised water (2 mL) with the aid of a vacuum pump at a flow rate of
1 mL min-1. The sorbent was never allowed to dry during the conditioning and
sample loading steps. Sample solution (10 mL) containing test compound (1000
ppm) (10% w/v) was passed through the column with the vacuum adjusted to give a
flow rate of 1 mL min-1. After the sample solution was loaded, the SPE column was
rinsed with deionised water (2 mL). Air was drawn through the cartridge for 5 min
under increased vacuum to remove excess water. A centrifuge tube (15 mL) was
placed below the SPE column and elution was performed using methanol (1 mL × 4
times) at a flow rate of 1 mL min-1. Finally, the internal standard, butyrophenone
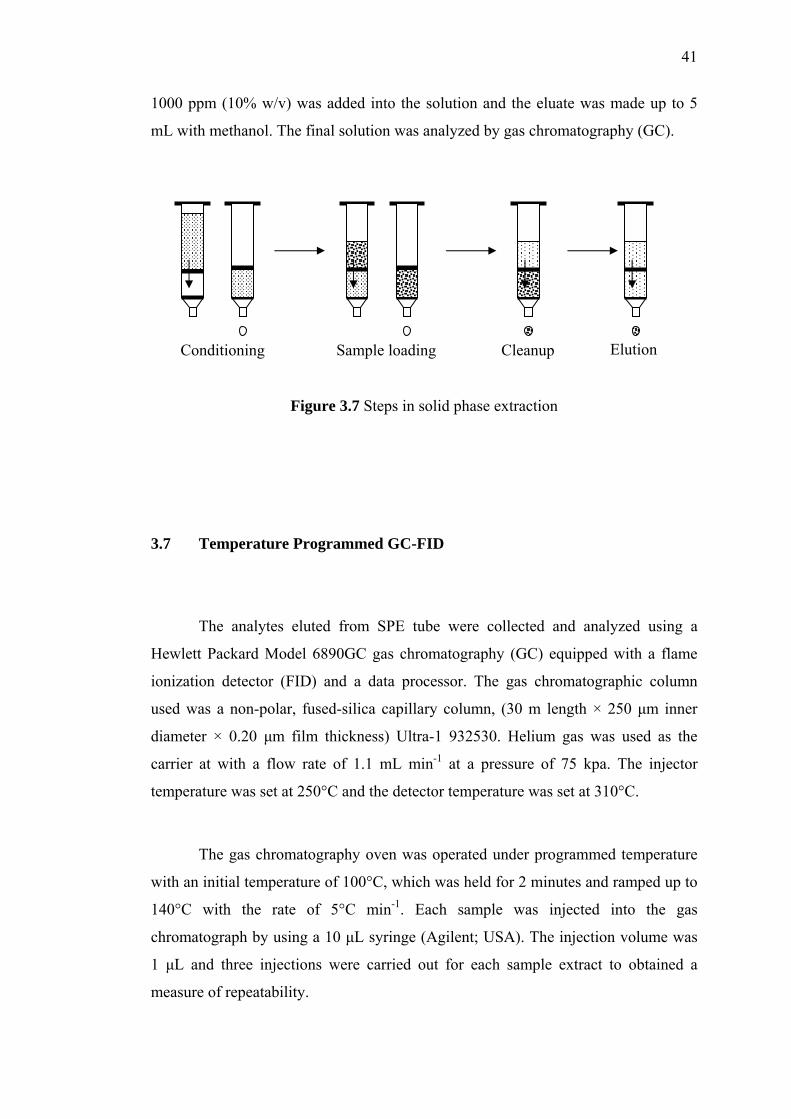
41
1000 ppm (10% w/v) was added into the solution and the eluate was made up to 5
mL with methanol. The final solution was analyzed by gas chromatography (GC).
Elution Conditioning Sample loading Cleanup
Figure 3.7 Steps in solid phase extraction
3.7 Temperature Programmed GC-FID
The analytes eluted from SPE tube were collected and analyzed using a
Hewlett Packard Model 6890GC gas chromatography (GC) equipped with a flame
ionization detector (FID) and a data processor. The gas chromatographic column
used was a non-polar, fused-silica capillary column, (30 m length × 250 μm inner
diameter × 0.20 μm film thickness) Ultra-1 932530. Helium gas was used as the
carrier at with a flow rate of 1.1 mL min-1 at a pressure of 75 kpa. The injector
temperature was set at 250°C and the detector temperature was set at 310°C.
The gas chromatography oven was operated under programmed temperature
with an initial temperature of 100°C, which was held for 2 minutes and ramped up to
140°C with the rate of 5°C min-1. Each sample was injected into the gas
chromatograph by using a 10 μL syringe (Agilent; USA). The injection volume was
1 μL and three injections were carried out for each sample extract to obtained a
measure of repeatability.
42
3.8 Determination of Response Factor for the Internal Standard and Test
Compounds
The response factors, F, for internal standard (butyrophenone) and the test
compounds (2-chlorophenol, nitrobenzene and propiophenone) were determined by
injecting 1 μL of each stock solvent (with a concentration of 100 000 ppm) into the
gas chromatograph. Injections were carried out in triplicate to obtain the precision of
the analysis. The equations used to calculate the response factor, F.
ionConcentratareaPeak F factor, Response = (3.1)
3.8.1 Determination of the Concentration of the Test Compounds
The concentration of each test compound, Mx was calculated as shown below.
SS
X
X
SX M ion,Concentrat
AA
FF M ion,Concentrat ××= (3.2)
MX = Test compound concentration (ppm)
MS = Internal standard concentration (ppm)
FS = Internal standard response factor
FX = Test compound response factor
AS = Internal standard peak area
AX = Test compound peak area
43
3.8.2 Determination of Test Compound’s Recovery Values
The recovery values were calculated as follows:
FactorDilution % 100 extraction beforeion concentrat Sample
M Recovery % X ××=
(3.3)
50 % 100 100,000
M X ××=
where,
extraction before sample of Volume
extractionafter sample of Volume Factor dilution =
50 mL0.1mL 5.0 Factor Dilution ==
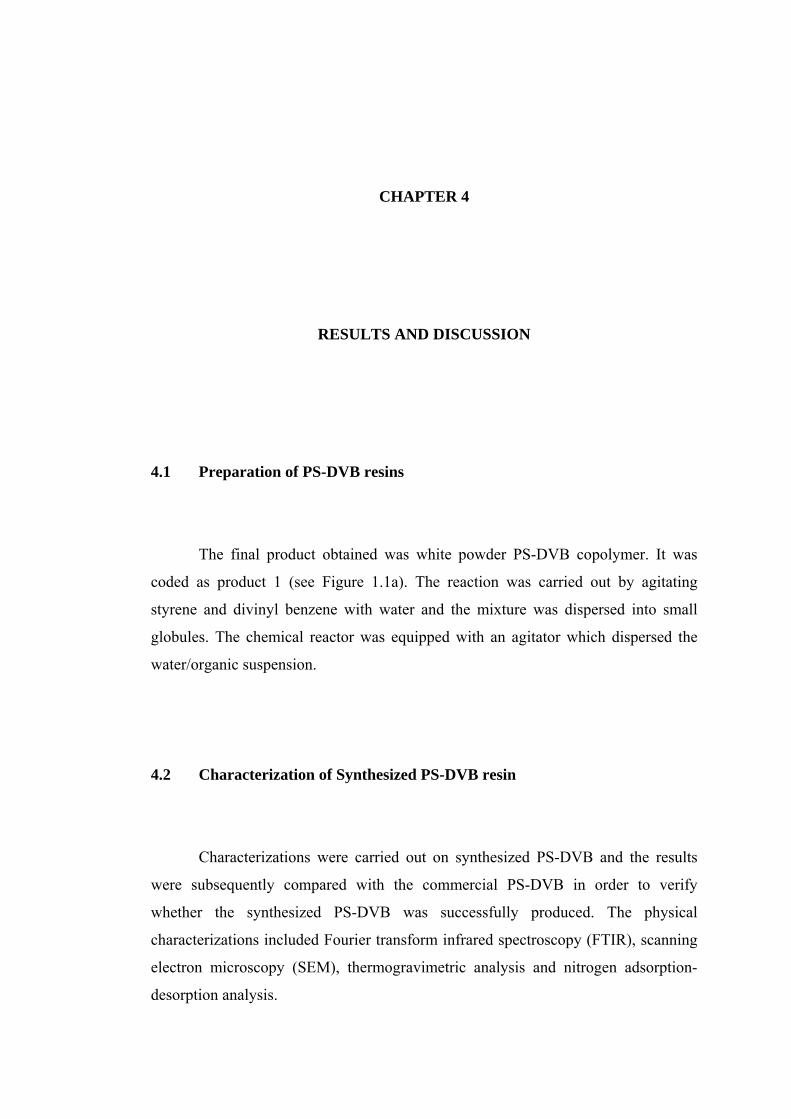
CHAPTER 4
RESULTS AND DISCUSSION
4.1 Preparation of PS-DVB resins
The final product obtained was white powder PS-DVB copolymer. It was
coded as product 1 (see Figure 1.1a). The reaction was carried out by agitating
styrene and divinyl benzene with water and the mixture was dispersed into small
globules. The chemical reactor was equipped with an agitator which dispersed the
water/organic suspension.
4.2 Characterization of Synthesized PS-DVB resin
Characterizations were carried out on synthesized PS-DVB and the results
were subsequently compared with the commercial PS-DVB in order to verify
whether the synthesized PS-DVB was successfully produced. The physical
characterizations included Fourier transform infrared spectroscopy (FTIR), scanning
electron microscopy (SEM), thermogravimetric analysis and nitrogen adsorption-
desorption analysis.
45
4.2.1 Fourier Transform Infrared (FTIR) Spectroscopy
Figure 4.1 shows a FTIR spectrum of synthesized PS-DVB resins and that of
commercial PS-DVB for comparison. It can be observed that the FTIR spectrum of
the synthesized PS-DVB (Figure 4.1(a)) have similar absorption pattern compared
with the FTIR spectrum of commercial PS-DVB resins (Figure 4.1(b)). The finger
print region between 1400 cm-1 and 400 cm-1 is very important in identifying the
compounds. The values and characteristic bands of the compound (Table 4.1) are in
agreement with those reported in the literatures (Mahdavian and Khoee, 2002). The
results suggests that the synthesized PS-DVB had the same structural properties as
the commercial PS-DVB, hence, suggesting that PS-DVB had been successfully
synthesized in the laboratory.
The peak at 3023.2 cm-1 is related to the stretching of the aromatic CH bonds
from the synthesized PS-DVB resins. Another important peak in the infrared spectra
was at 1599.8 and 1490.9 cm-1 for the C=C phenyl stretching. The bands close to
755.1 cm-1 and 696.3 cm-1 region are attributed to the presence of out-of-plane
bending of mono-substituted benzenes.
Table 4.1: Characteristic wave numbers for synthesized PS-DVB resin and commercial PS-DVB resins
Wave number (cm−1) Functional Groups Synthesized PS-DVB Commercial PS-DVB =C-Haromatic 3046.4 3023.2 -CHsaturated 2922.0, 2860.2 2920.0, 2848.7 C=Caromatic 1598.9, 1491.8 1599.8, 1490.9 Monosubstituted benzene 755.1, 697.2 755.1, 696.3
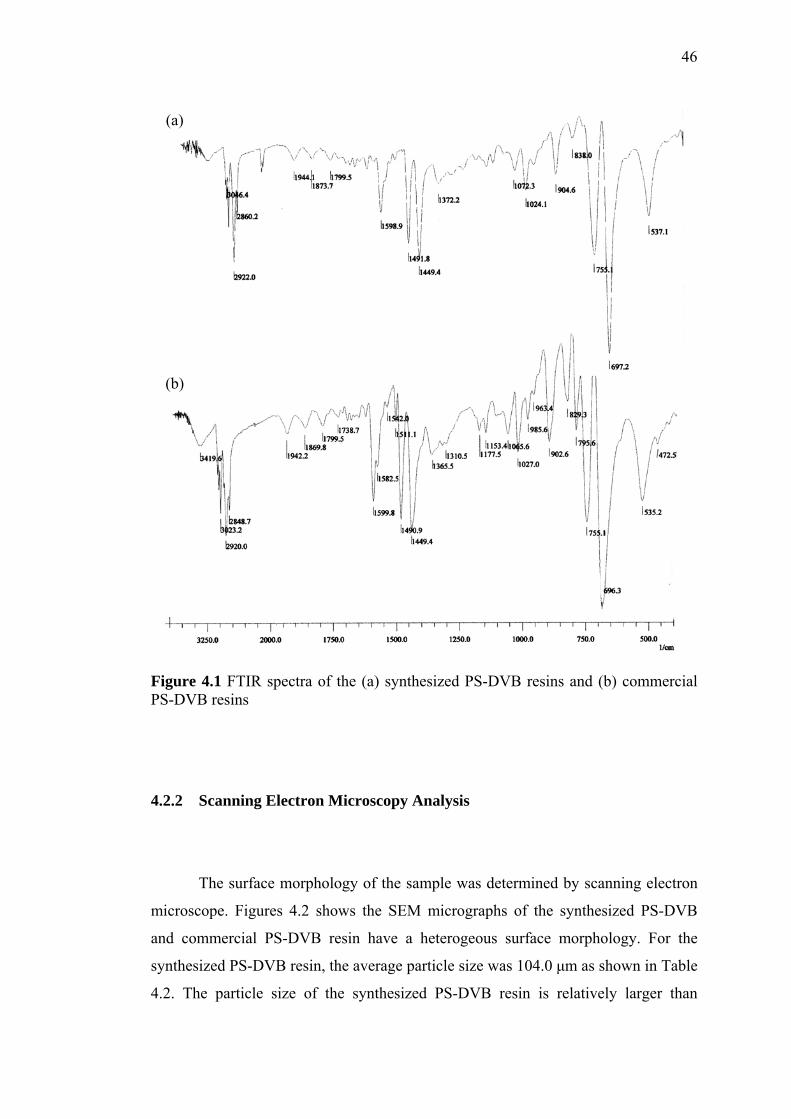
46
(a)
(b) Figure 4.1 FTIR spectra of the (a) synthesized PS-DVB resins and (b) commercial PS-DVB resins
4.2.2 Scanning Electron Microscopy Analysis
The surface morphology of the sample was determined by scanning electron
microscope. Figures 4.2 shows the SEM micrographs of the synthesized PS-DVB
and commercial PS-DVB resin have a heterogeous surface morphology. For the
synthesized PS-DVB resin, the average particle size was 104.0 μm as shown in Table
4.2. The particle size of the synthesized PS-DVB resin is relatively larger than
47
commercial PS-DVB resin. The micrograph (Figure 4.2a) showed that the
synthesized PS-DVB resin exhibits non-uniform size and cores with a wide range of
particle size from 84.0-162.2 μm. The micrograph of the synthesized PS-DVB resin
particles (Figure 4.2b) shows that the surface morphology is smoother and good
surface homogeneity. This is probably due to the influence of the controlled
polymerization parameters such as the initiator concentration, the stabilizer
concentration, the polarity of the polymerization medium, the technique of
polymerization used (Tuncel et al., 1993), and the fraction of cross-linking monomer
(Maria et al., 2003a).
From the micrograph (Figure 4.2c), the commercial PS-DVB resin consists of
sphere beads. The particle size was distributed in a narrow range of 39.1-52.8 μm.
There are various factors that influence the particle size of the product; stirring speed
is the most important factor that provides a relatively convenient means of particle
size control for most practical purposes. The particle size can be controlled by the
adjustment of the stirring speed. These limits depend on the size and the
configuration of the polymerization reactor (including its stirring arrangement). For
the laboratory preparation involving a total volume of about 500 mL, the stirring
speed can be varied in the range of 200 to 1000 rpm. The stirring speed of 900 rpm
was chosen in this study.
Table 4.2: Average particle size of synthesized and commercial PS-DVB resins
Resin Particle size range, μm Average Particle size, μm Synthesized PS-DVB 84.0-162.2 104.0 Commercial PS-DVB 39.1-52.8 44.9
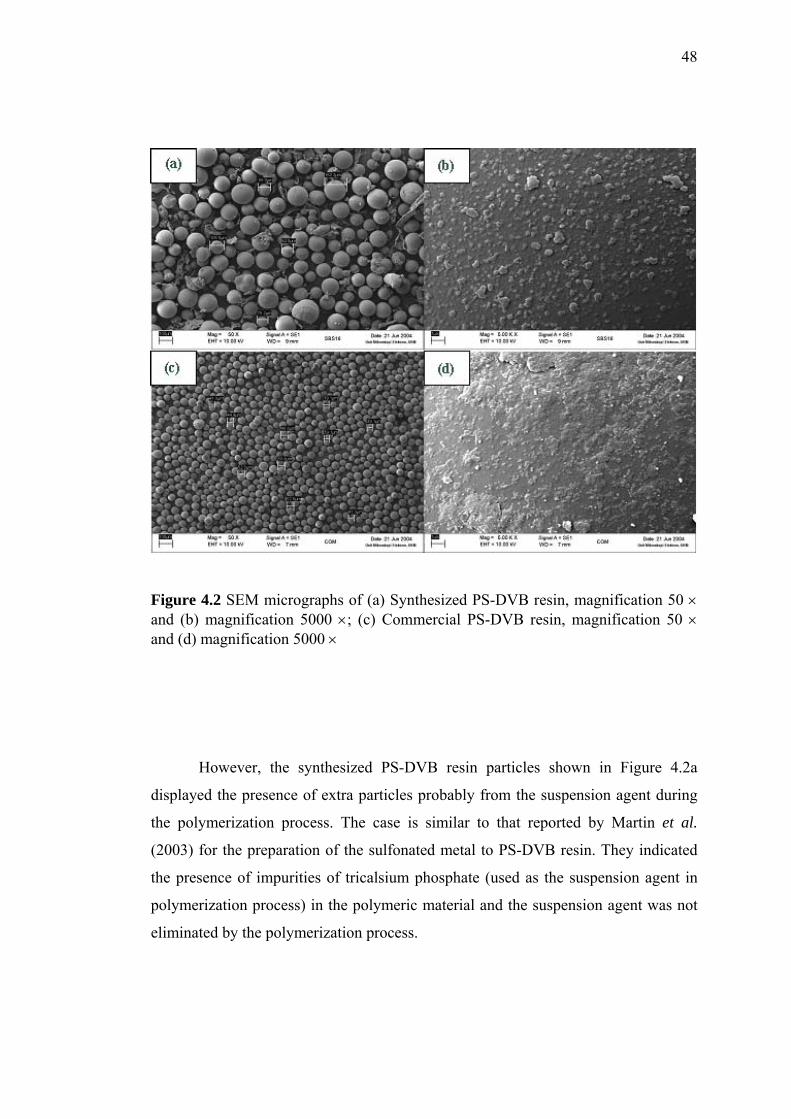
48
Figure 4.2 SEM micrographs of (a) Synthesized PS-DVB resin, magnification 50 × and (b) magnification 5000 ×; (c) Commercial PS-DVB resin, magnification 50 × and (d) magnification 5000 ×
However, the synthesized PS-DVB resin particles shown in Figure 4.2a
displayed the presence of extra particles probably from the suspension agent during
the polymerization process. The case is similar to that reported by Martin et al.
(2003) for the preparation of the sulfonated metal to PS-DVB resin. They indicated
the presence of impurities of tricalsium phosphate (used as the suspension agent in
polymerization process) in the polymeric material and the suspension agent was not
eliminated by the polymerization process.
49
4.2.3 Thermogravimetry Analysis
Thermogravimetry is a technique whereby a sample is continuously weighed
as it heated at a constant and preferably linear rate. The resulting weight change
versus temperature curve provides information concerning of the thermal stability
and composition of the original sample, the composition and thermal stability of any
intermediate compounds and the composition of the residue. In this analysis, five
stages of temperature range were observed to study the thermal stability of PS-DVB
resin. The temperature range followed from the temperature stage in thermogram
(Appendix A). Temperature range less than 135.5°C and range of 135.5-326.6°C are
related to low temperature range, while temperature range of 326.6-517.6°C is
referred to the intermediate temperature range and temperature range of 517.6-
708.6°C and temperature range of 708.6-899.7°C are referred to high temperature
stage.
The thermogram for synthesized and commercial PS-DVB resins at various
temperature ranges are listed in Table 4.3. At temperature range less than 135.5°C,
the resins show weight loss percentages of 1.8% (synthesized) and 1.7%
(commercial). Meanwhile, at temperature range of 135.5-326.6°C, the resins show
weight loss percentages of 16.8% (synthesized) and 19.1% (commercial). These
results reflect that the loss in weight observed over temperature range less than
135.5°C is due to the removal of the loosely bound water from the resin while the
loss in weight at temperature range of 135.5-326.6°C corresponds to the removal of
more strongly bounded water derived from hydroxyl groups and the decomposition
of low-volatility groups.
Table 4.3 also indicates that the maximum weight loss for both samples
occurs at temperature range of 326.6-517.6°C, 73.5% for synthesized PS-DVB and
56.6% for commercial resin. The decomposition for both PS-DVB resin is completed
after the temperature reaches 900°C. It occurs because all of the PS-DVB resins were
more unstable during the analysis when the temperature reaches to 708.6°C. The
weight loss occurred at the temperature range less than 135.5°C and range of 135.5-
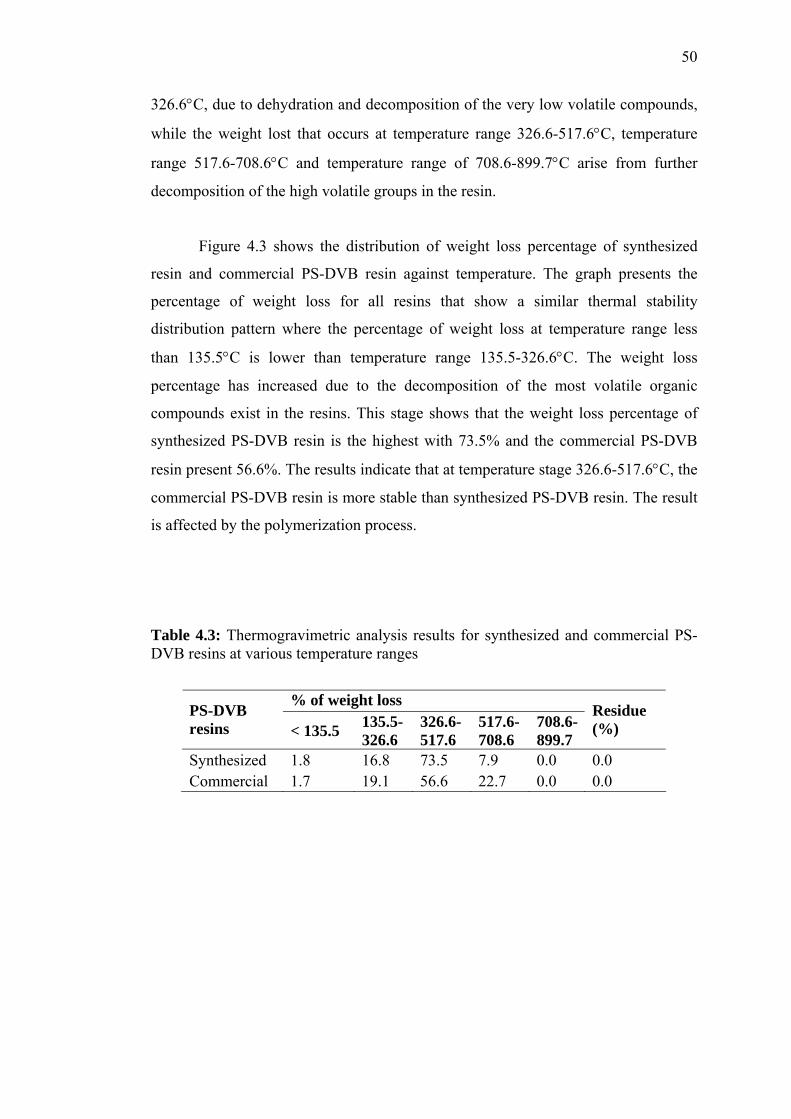
50
326.6°C, due to dehydration and decomposition of the very low volatile compounds,
while the weight lost that occurs at temperature range 326.6-517.6°C, temperature
range 517.6-708.6°C and temperature range of 708.6-899.7°C arise from further
decomposition of the high volatile groups in the resin.
Figure 4.3 shows the distribution of weight loss percentage of synthesized
resin and commercial PS-DVB resin against temperature. The graph presents the
percentage of weight loss for all resins that show a similar thermal stability
distribution pattern where the percentage of weight loss at temperature range less
than 135.5°C is lower than temperature range 135.5-326.6°C. The weight loss
percentage has increased due to the decomposition of the most volatile organic
compounds exist in the resins. This stage shows that the weight loss percentage of
synthesized PS-DVB resin is the highest with 73.5% and the commercial PS-DVB
resin present 56.6%. The results indicate that at temperature stage 326.6-517.6°C, the
commercial PS-DVB resin is more stable than synthesized PS-DVB resin. The result
is affected by the polymerization process.
Table 4.3: Thermogravimetric analysis results for synthesized and commercial PS-DVB resins at various temperature ranges
% of weight loss PS-DVB resins < 135.5 135.5-
326.6 326.6-517.6
517.6-708.6
708.6-899.7
Residue (%)
Synthesized 1.8 16.8 73.5 7.9 0.0 0.0 Commercial 1.7 19.1 56.6 22.7 0.0 0.0
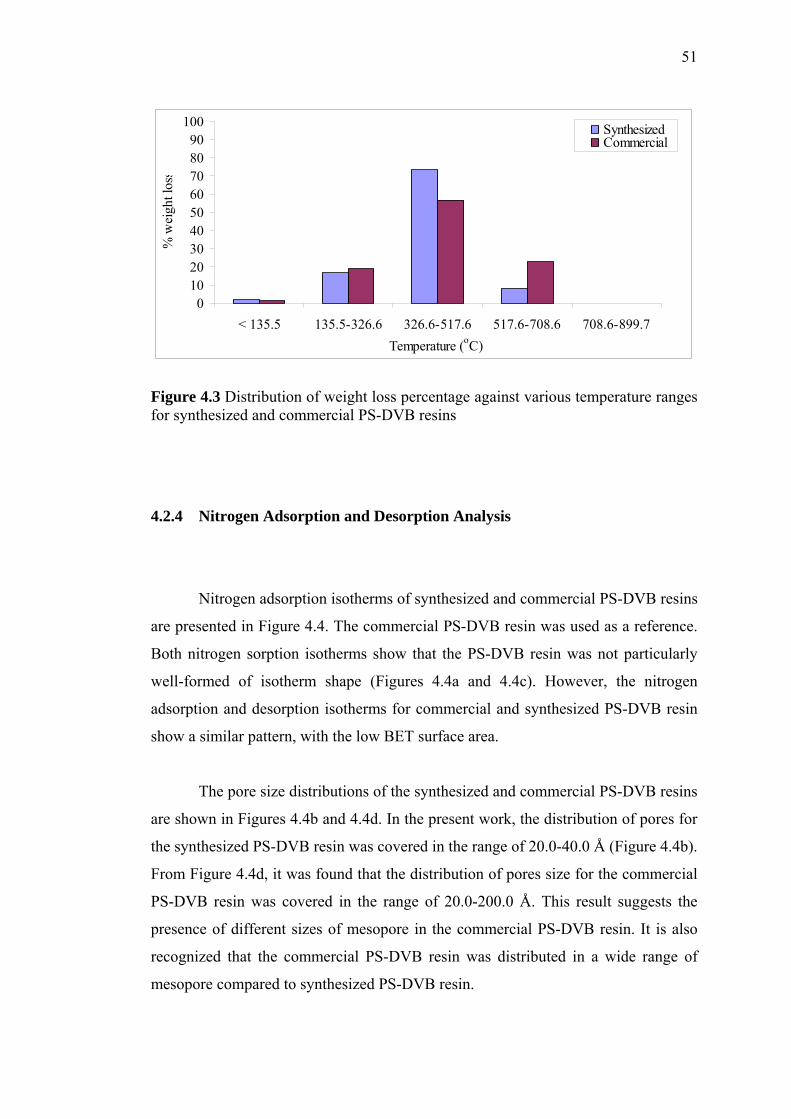
51
0102030405060708090
100
< 135.5 135.5-326.6 326.6-517.6 517.6-708.6 708.6-899.7Temperature (oC)
% w
eigh
t los
s
SynthesizedCommercial
Figure 4.3 Distribution of weight loss percentage against various temperature ranges for synthesized and commercial PS-DVB resins
4.2.4 Nitrogen Adsorption and Desorption Analysis
Nitrogen adsorption isotherms of synthesized and commercial PS-DVB resins
are presented in Figure 4.4. The commercial PS-DVB resin was used as a reference.
Both nitrogen sorption isotherms show that the PS-DVB resin was not particularly
well-formed of isotherm shape (Figures 4.4a and 4.4c). However, the nitrogen
adsorption and desorption isotherms for commercial and synthesized PS-DVB resin
show a similar pattern, with the low BET surface area.
The pore size distributions of the synthesized and commercial PS-DVB resins
are shown in Figures 4.4b and 4.4d. In the present work, the distribution of pores for
the synthesized PS-DVB resin was covered in the range of 20.0-40.0 Å (Figure 4.4b).
From Figure 4.4d, it was found that the distribution of pores size for the commercial
PS-DVB resin was covered in the range of 20.0-200.0 Å. This result suggests the
presence of different sizes of mesopore in the commercial PS-DVB resin. It is also
recognized that the commercial PS-DVB resin was distributed in a wide range of
mesopore compared to synthesized PS-DVB resin.
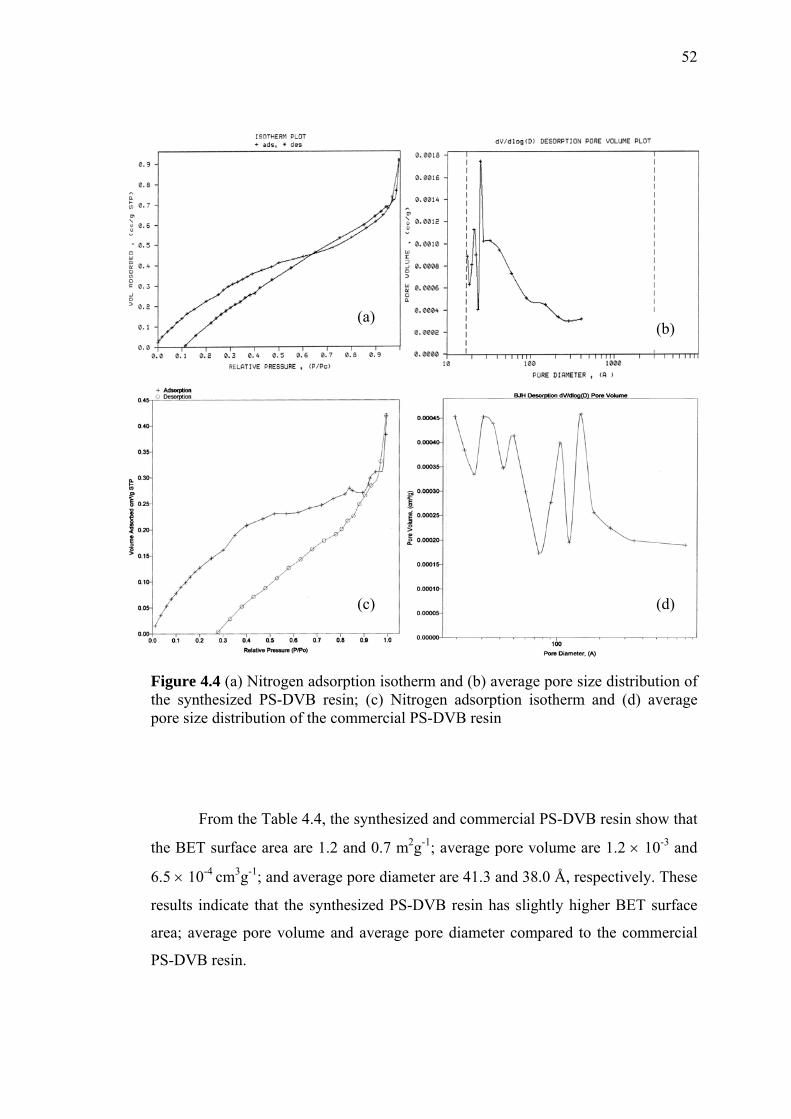
52
(a) (b)
(c) (d)
Figure 4.4 (a) Nitrogen adsorption isotherm and (b) average pore size distribution of the synthesized PS-DVB resin; (c) Nitrogen adsorption isotherm and (d) average pore size distribution of the commercial PS-DVB resin
From the Table 4.4, the synthesized and commercial PS-DVB resin show that
the BET surface area are 1.2 and 0.7 m2g-1; average pore volume are 1.2 × 10⁻³ and
6.5 × 10⁻⁴ cm3g-1; and average pore diameter are 41.3 and 38.0 Å, respectively. These
results indicate that the synthesized PS-DVB resin has slightly higher BET surface
area; average pore volume and average pore diameter compared to the commercial
PS-DVB resin.
53
Table 4.4: Pore and surface characteristic of synthesized PS-DVB resin and commercial PS-DVB resin
PS-DVB Resins
BET surface area (m2g-1)
Total pore volume (cm3g-1)
Average pore width (Å)
Type of pore
Synthesized 1.2 1.2 × 10⁻³ 41.3 Meso Commercial 0.7 6.5 × 10⁻⁴ 38.0 Meso
4.2.4.1 Effect of Reaction Time
It was found that PS-DVB 5h, PS-DVB 15h and PS-DVB 20h exhibits 3.7,
1.5 and 1.2 m2g-1 for BET surface area, respectively. The result (Table 4.5) suggests
that the BET surface area increases with the decrease time of polymerization. The
reaction time shows a significant effect to the BET surface area and physical
characteristics. It can be observed that when reaction time was set at 5h, the pore
width of PS-DVB was approximately 38.7 Å. Highest average pore width value and
pore volume were obtained when the reaction time was fixed at 15 h with a value of
137.7 Å. However, a significant decrease of pore width was noted when the reaction
time was increased to 20 h.
Table 4.5: Effect of reaction period on nitrogen adsorption analysis data for synthesized PS-DVB. Reaction time (h)
BET surface area m2/g
Total pore volume cm3/g
Average pore width (Å)
Physical characteristics
5 3.7 3.5 × 10⁻³ 38.7 White, harder bead.
15 1.5 5.1 × 10⁻³ 137.7
20 1.2 1.2 × 10⁻³ 41.3
Small, white, powder, easy to grind.
54
4.2.4.2 Effect of Stabilizer
Table 4.6 shows the poly(vinyl alcohol) has a BET surface area of 1.2 m2g-1
and total pore volume of 1.2 × 10⁻³ cm3g-1 and polyvinyl pyrrolidone has a BET
surface area of 0.7 m2g-1 and average pore volume of 1.0 × 10⁻³ cm3g-1. The results
show that polyvinyl alcohol was a better stabilizer than polyvinyl pyrolidone. The
particles obtained from poly(vinyl alcohol) polymerization has a smaller size and the
material was easy to grind, unlike the material obtained from polymerization that
used polyvinyl pyyrolidone. The beads particle size was controlled using a sieve
shaker (200-400 mesh portion). It was probably because poly(vinyl alcohol) is
incorporated into the surface of the polystyrene beads and thus giving better
protection against growing process (Gautheir et al., 2004). The particle size
distribution of the PS-DVB resin prepared with poly(vinyl alcohol) as a suspension
stabilizer can vary widely by changing the relative amounts of the monomer and
aqueous phase. When using poly(vinyl alcohol) in the polymerization of the PS-DVB
resin the value of BET surface area, average pore diameter and total pore volume is
higher compared to polyvinyl pyrolidone.
Table 4.6: Nitrogen adsorption analysis data for synthesized PS-DVB resin using different stabilizers
Stabilizer BET surface area m2g-1
Total pore volume cm3g-1
Average pore width (Å)
Physical characteristics
Poly(vinyl alcohol) 1.2 1.2 × 10⁻³ 41.3
Small, white, powder, easy to grind.
Poly(vinyl pyrolidone) 0.7 1.0 × 10⁻³ 60.3
Bigger, white, difficult to grind.
55
4.2.4.3 Effect of Polymerization Method
Table 4.7 shows a significant difference in the data of nitrogen adsorption for
the synthesized PS-DVB resin. The surfactant polymerization technique showed that
the pore volume and average pore diameter of this sample was lower compared to the
seeding polymerization technique. The result obtained suggests that the surfactant
polymerization technique was a better method than the seeding polymerization
technique.
Table 4.7: Nitrogen adsorption analysis data for synthesizing PS-DVB resin by different techniques
Technique BET surface area m2g-1
Total pore volume cm3g-1
Average pore diameter (Å)
Physical characteristics
Seeding 2.0 3.5 × 10⁻³ 68.6
Surfactant 1.2 1.2 × 10⁻³ 41.3
Small, white, powder, easy to grind.
4.3 Preparation of p-2-zirconyl-2-methylethyl-PS-DVB Chloride
Modification PS-DVB adsorbent was carried out via Friedel Crafts acylation
reaction with acetyl chloride using Lewis acid catalyst (product 2A) followed by
Grignard reaction of the product with methyl magnesium chloride (product 2B) and
reaction with zirconium(IV) oxide chloride octahydrate (product 2C). The polymer
adsorbent of product 2A (p-ethanoyl-PS-DVB) was prepared using Friedel Crafts
acylation reaction with acetyl chloride in the presence of aluminium chloride
anhydrous (AlCl3) as Lewis acid catalyst. The ketone functional group CH3-CO-(PS-
DVB) showed an intense carbonyl absorption band at 1678.9 cm-1 in the FTIR
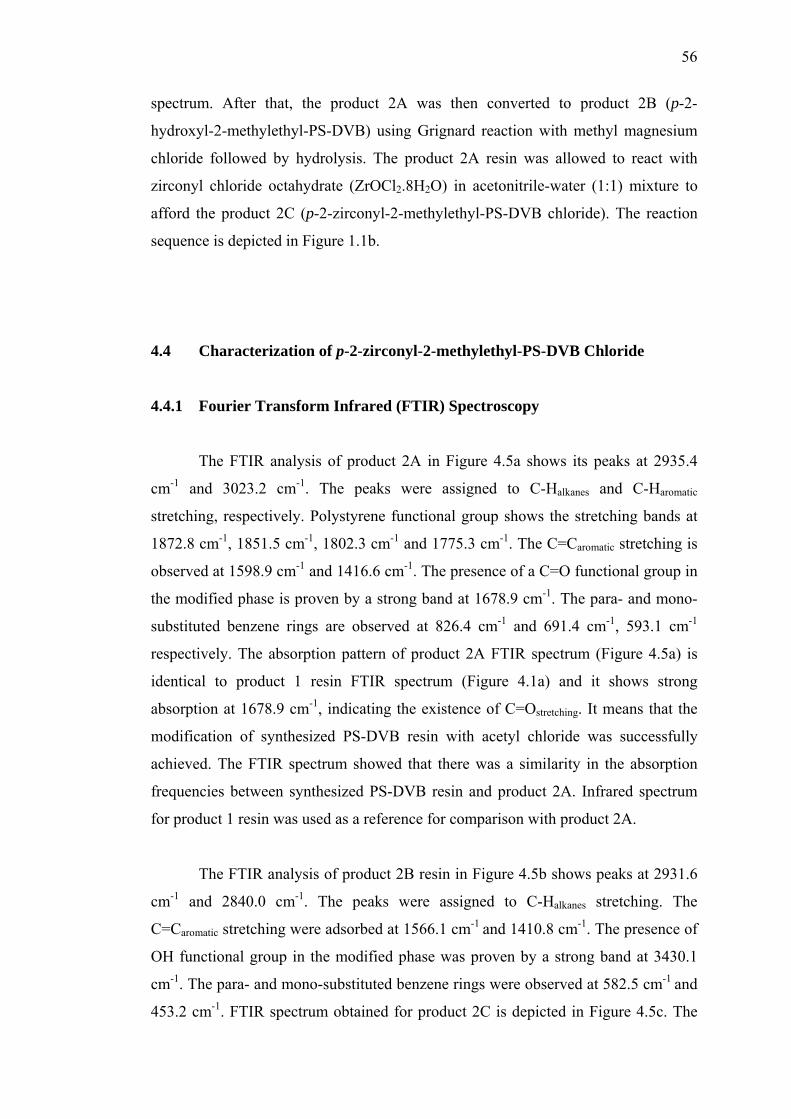
56
spectrum. After that, the product 2A was then converted to product 2B (p-2-
hydroxyl-2-methylethyl-PS-DVB) using Grignard reaction with methyl magnesium
chloride followed by hydrolysis. The product 2A resin was allowed to react with
zirconyl chloride octahydrate (ZrOCl2.8H2O) in acetonitrile-water (1:1) mixture to
afford the product 2C (p-2-zirconyl-2-methylethyl-PS-DVB chloride). The reaction
sequence is depicted in Figure 1.1b.
4.4 Characterization of p-2-zirconyl-2-methylethyl-PS-DVB Chloride
4.4.1 Fourier Transform Infrared (FTIR) Spectroscopy
The FTIR analysis of product 2A in Figure 4.5a shows its peaks at 2935.4
cm-1 and 3023.2 cm-1. The peaks were assigned to C-Halkanes and C-Haromatic
stretching, respectively. Polystyrene functional group shows the stretching bands at
1872.8 cm-1, 1851.5 cm-1, 1802.3 cm-1 and 1775.3 cm-1. The C=Caromatic stretching is
observed at 1598.9 cm-1 and 1416.6 cm-1. The presence of a C=O functional group in
the modified phase is proven by a strong band at 1678.9 cm-1. The para- and mono-
substituted benzene rings are observed at 826.4 cm-1 and 691.4 cm-1, 593.1 cm-1
respectively. The absorption pattern of product 2A FTIR spectrum (Figure 4.5a) is
identical to product 1 resin FTIR spectrum (Figure 4.1a) and it shows strong
absorption at 1678.9 cm-1, indicating the existence of C=Ostretching. It means that the
modification of synthesized PS-DVB resin with acetyl chloride was successfully
achieved. The FTIR spectrum showed that there was a similarity in the absorption
frequencies between synthesized PS-DVB resin and product 2A. Infrared spectrum
for product 1 resin was used as a reference for comparison with product 2A.
The FTIR analysis of product 2B resin in Figure 4.5b shows peaks at 2931.6
cm-1 and 2840.0 cm-1. The peaks were assigned to C-Halkanes stretching. The
C=Caromatic stretching were adsorbed at 1566.1 cm-1 and 1410.8 cm-1. The presence of
OH functional group in the modified phase was proven by a strong band at 3430.1
cm-1. The para- and mono-substituted benzene rings were observed at 582.5 cm-1 and
453.2 cm-1. FTIR spectrum obtained for product 2C is depicted in Figure 4.5c. The
57
result showed that the sample gave similar adsorption bands with product 2B except
for the spectrum of product 2C which is exhibits an extra broad band. It may be due
to the stretching vibration of the –OH group present in the sample. Table 4.8
summarizes the FTIR absorption data incorporating functional groups from the FTIR
spectra of PS-DVB-modified resin.
(a)
(b)
(c)
Figure 4.5 FTIR spectra of the (a) product 2A, (b) product 2B, and (c) product 2C
58
Table 4.8: Absorbance signals for the functional groups of modification PS-DVB using acetyl chloride
Resin Product 2A Product 2B Product 2C Functional
Groups Wave number, cm−1
OH - 3430.1 (h) 3421.5 (h) =C-Haromatic 3023.2 - - -CHsaturated 2935.4, 2862.2 2931.6, 2860.0 - C=O 1678.9 - - C=Caromatic 1598.9, 1416.6 1605.6, 1410.8 1564.2, 1417.6
4.4.2 Scanning Electron Microscopy Analysis
From the SEM micrograph, it was found that the particle of PS-DVB-
modified resin scattered on the surface of the tape in a small size which is resembles
spherical beads as shown in Figure 4.6. Figure 4.6a shows the surface morphology of
the product 2A particle. The surface morphology of the particles showed that they
are relatively irregular, mixture of the particle shapes and not fully spherical beads
form. A spherical morphology was also observed, although in this case some debris
appeared are mixed with the particles. The surface of these particles is rougher
compared to the surface of the product 1 resin particles (Figure 4.2b) as observed in
Figure 4.6b. These results seem to suggest that the changing of the surface
morphology was due to the introduction of product 1 resin particles at an elevated
temperature during the Friedel Crafts acylation. In addition, the use of excessive
acetyl chloride agent was expected to contribute to the irregularity of beads shape.
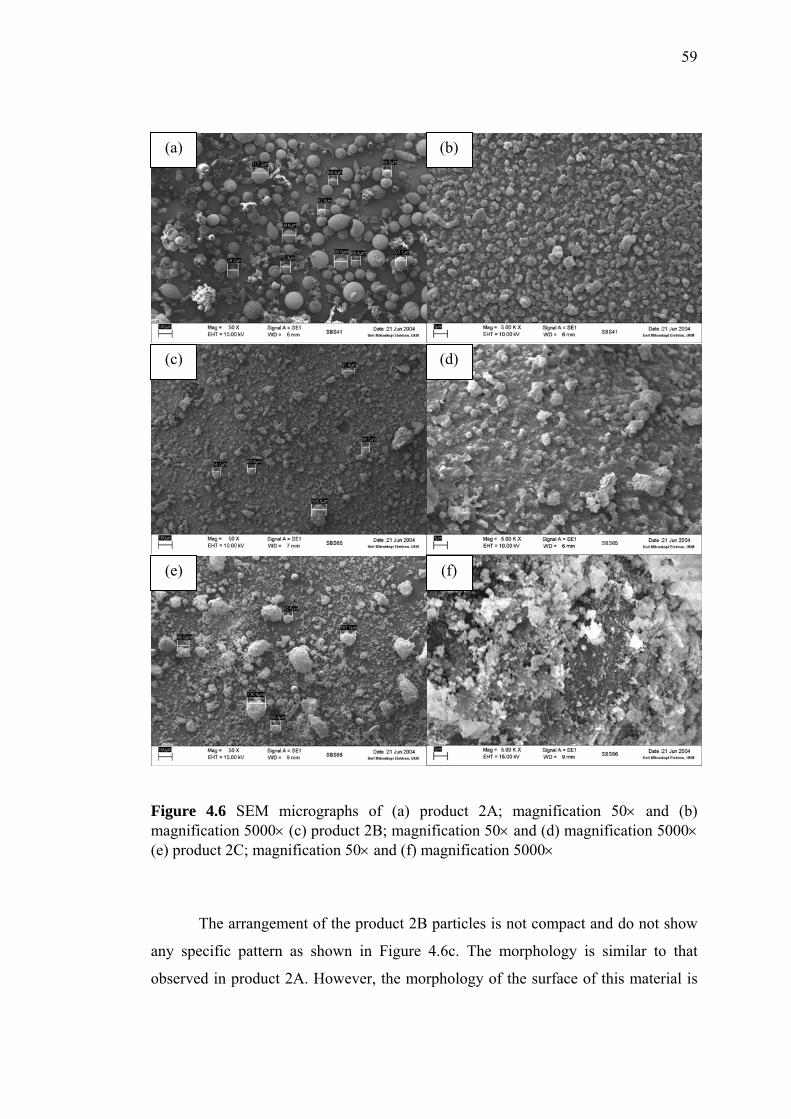
59
(a) (b)
(c) (d)
(e) (f)
Figure 4.6 SEM micrographs of (a) product 2A; magnification 50× and (b) magnification 5000× (c) product 2B; magnification 50× and (d) magnification 5000× (e) product 2C; magnification 50× and (f) magnification 5000×
The arrangement of the product 2B particles is not compact and do not show
any specific pattern as shown in Figure 4.6c. The morphology is similar to that
observed in product 2A. However, the morphology of the surface of this material is
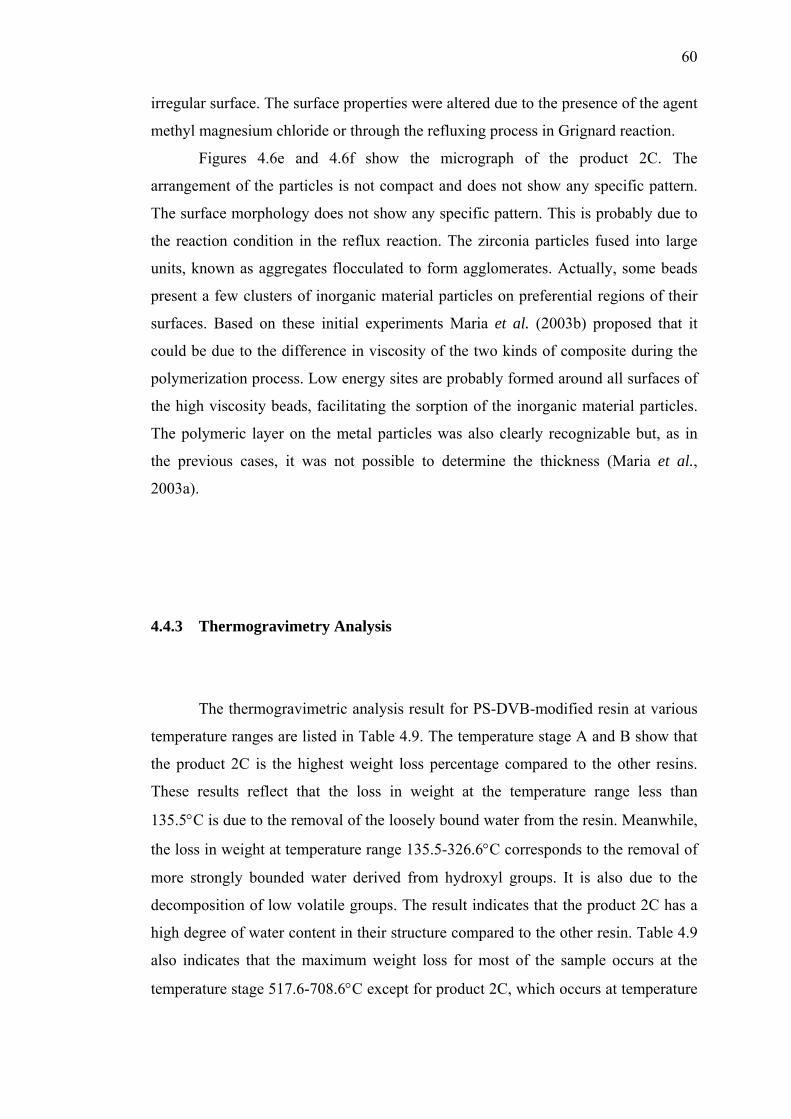
60
irregular surface. The surface properties were altered due to the presence of the agent
methyl magnesium chloride or through the refluxing process in Grignard reaction.
Figures 4.6e and 4.6f show the micrograph of the product 2C. The
arrangement of the particles is not compact and does not show any specific pattern.
The surface morphology does not show any specific pattern. This is probably due to
the reaction condition in the reflux reaction. The zirconia particles fused into large
units, known as aggregates flocculated to form agglomerates. Actually, some beads
present a few clusters of inorganic material particles on preferential regions of their
surfaces. Based on these initial experiments Maria et al. (2003b) proposed that it
could be due to the difference in viscosity of the two kinds of composite during the
polymerization process. Low energy sites are probably formed around all surfaces of
the high viscosity beads, facilitating the sorption of the inorganic material particles.
The polymeric layer on the metal particles was also clearly recognizable but, as in
the previous cases, it was not possible to determine the thickness (Maria et al.,
2003a).
4.4.3 Thermogravimetry Analysis
The thermogravimetric analysis result for PS-DVB-modified resin at various
temperature ranges are listed in Table 4.9. The temperature stage A and B show that
the product 2C is the highest weight loss percentage compared to the other resins.
These results reflect that the loss in weight at the temperature range less than
135.5°C is due to the removal of the loosely bound water from the resin. Meanwhile,
the loss in weight at temperature range 135.5-326.6°C corresponds to the removal of
more strongly bounded water derived from hydroxyl groups. It is also due to the
decomposition of low volatile groups. The result indicates that the product 2C has a
high degree of water content in their structure compared to the other resin. Table 4.9
also indicates that the maximum weight loss for most of the sample occurs at the
temperature stage 517.6-708.6°C except for product 2C, which occurs at temperature
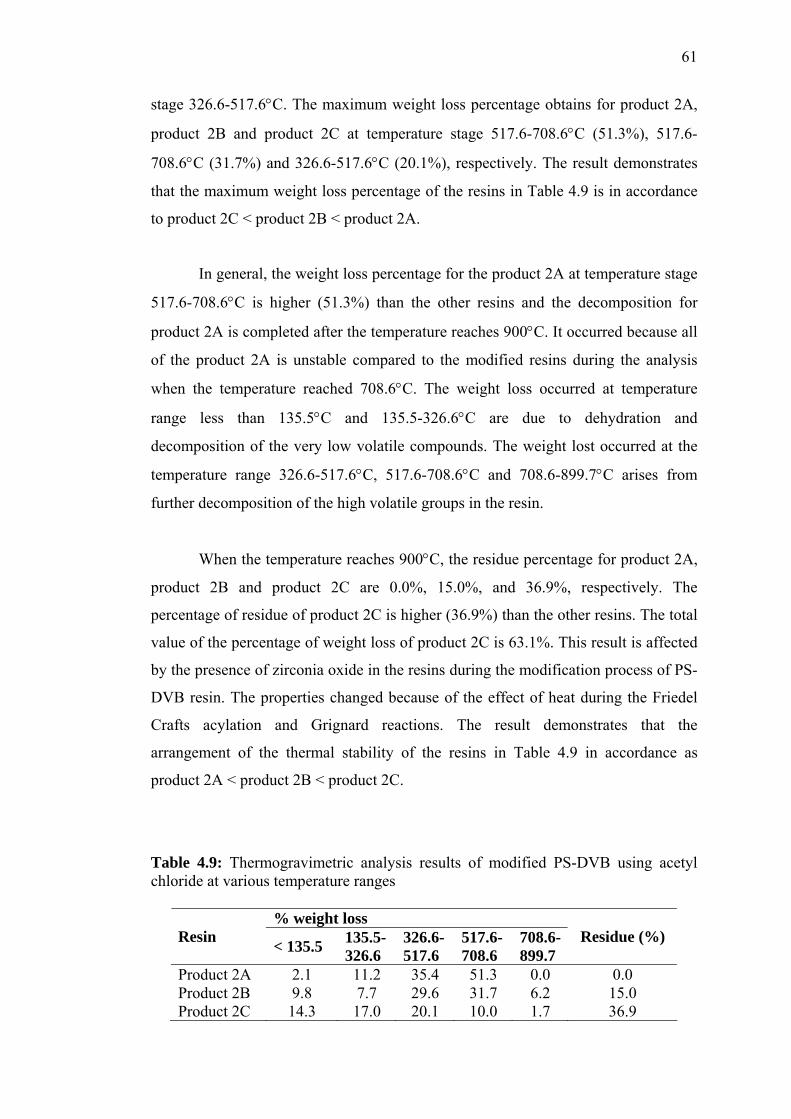
61
stage 326.6-517.6°C. The maximum weight loss percentage obtains for product 2A,
product 2B and product 2C at temperature stage 517.6-708.6°C (51.3%), 517.6-
708.6°C (31.7%) and 326.6-517.6°C (20.1%), respectively. The result demonstrates
that the maximum weight loss percentage of the resins in Table 4.9 is in accordance
to product 2C < product 2B < product 2A.
In general, the weight loss percentage for the product 2A at temperature stage
517.6-708.6°C is higher (51.3%) than the other resins and the decomposition for
product 2A is completed after the temperature reaches 900°C. It occurred because all
of the product 2A is unstable compared to the modified resins during the analysis
when the temperature reached 708.6°C. The weight loss occurred at temperature
range less than 135.5°C and 135.5-326.6°C are due to dehydration and
decomposition of the very low volatile compounds. The weight lost occurred at the
temperature range 326.6-517.6°C, 517.6-708.6°C and 708.6-899.7°C arises from
further decomposition of the high volatile groups in the resin.
When the temperature reaches 900°C, the residue percentage for product 2A,
product 2B and product 2C are 0.0%, 15.0%, and 36.9%, respectively. The
percentage of residue of product 2C is higher (36.9%) than the other resins. The total
value of the percentage of weight loss of product 2C is 63.1%. This result is affected
by the presence of zirconia oxide in the resins during the modification process of PS-
DVB resin. The properties changed because of the effect of heat during the Friedel
Crafts acylation and Grignard reactions. The result demonstrates that the
arrangement of the thermal stability of the resins in Table 4.9 in accordance as
product 2A < product 2B < product 2C.
Table 4.9: Thermogravimetric analysis results of modified PS-DVB using acetyl chloride at various temperature ranges
% weight loss Resin < 135.5 135.5-
326.6 326.6-517.6
517.6-708.6
708.6-899.7
Residue (%)
Product 2A 2.1 11.2 35.4 51.3 0.0 0.0 Product 2B 9.8 7.7 29.6 31.7 6.2 15.0 Product 2C 14.3 17.0 20.1 10.0 1.7 36.9
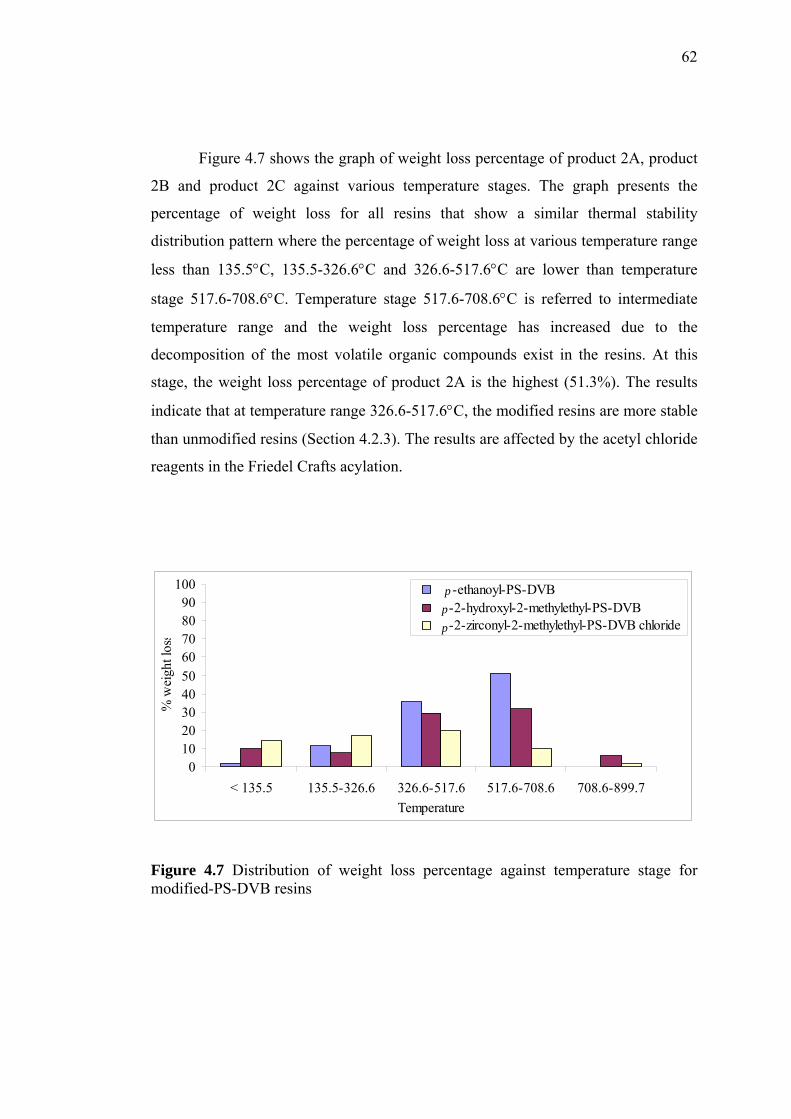
62
Figure 4.7 shows the graph of weight loss percentage of product 2A, product
2B and product 2C against various temperature stages. The graph presents the
percentage of weight loss for all resins that show a similar thermal stability
distribution pattern where the percentage of weight loss at various temperature range
less than 135.5°C, 135.5-326.6°C and 326.6-517.6°C are lower than temperature
stage 517.6-708.6°C. Temperature stage 517.6-708.6°C is referred to intermediate
temperature range and the weight loss percentage has increased due to the
decomposition of the most volatile organic compounds exist in the resins. At this
stage, the weight loss percentage of product 2A is the highest (51.3%). The results
indicate that at temperature range 326.6-517.6°C, the modified resins are more stable
than unmodified resins (Section 4.2.3). The results are affected by the acetyl chloride
reagents in the Friedel Crafts acylation.
010203040506070
Figure 4.7 Distribution of weight loss percentage against temperature stage for modified-PS-DVB resins
8090
100
< 135.5 135.5-326.6 326.6-517.6 517.6-708.6 708.6-899.7Temperature
-ethanoyl-PS-DVB -2-hydroxyl-2-methylethyl-PS-DVB
% w
eigh
t los
s
-2-zirconyl-2-methylethyl-PS-DVB chloride
p
p p
63
4.4.4 Nitrogen Adsorption and Desorption Analysis
The nitrogen adsorption isotherm for product 2A is shown in Figure 4.8a. The
nitrogen adsorption data of the product 1 resin was used as a reference to compare
the types of pore, surface area and pore volume with the product 2A. As mentioned
before in Figure 4.4a, the synthesized PS-DVB resin is not well formed. Based on the
result, the synthesized PS-DVB resin contains a mixture of a narrow and wide
mesopore. Figure 4.8a shows the nitrogen isotherm obtained from product 2A is not
well formed. Therefore, the type of pores in the product 2A was a mixture of
mesopore and macropore. This result suggests that the product 2A did not affect
much on the surface properties of the studied phase.
The pore size distribution of the product 2A is shown in Figure 4.8b. It was
found that the distribution of pore size for the product 2A was covered in the range
of 20-700 Å. This result suggests the presence of different sizes of mesopore and
macropore in the product 2A. In the present work, the distribution of pores for the
synthesized PS-DVB resin was covered in the range of 20-40 Å (Figure 4.8d). The
distribution of pores size for synthesized PS-DVB resin changed probably due to the
effect of the Friedel Crafts acylation reaction.
All of the obtained data from nitrogen adsorption for modified-PS-DVB resin
are summarized in Table 4.10. The data show that the product 2A has BET surface
area of 5.8 m2g-1 and average pore volume of 9.8 × 10⁻³ cm3 g-1. It was found that
product 2A exhibits the higher BET surface area and average pore volume compared
to the synthesized PS-DVB resin (Table 4.10). This result suggests that the product
2A increases the BET surface area and average pore volume of native PS-DVB. This
can be proven with the significance change in the BET surface area and average pore
volume of the synthesized PS-DVB resin after modification with acetyl chloride
during the Friedel Crafts acylation reaction.
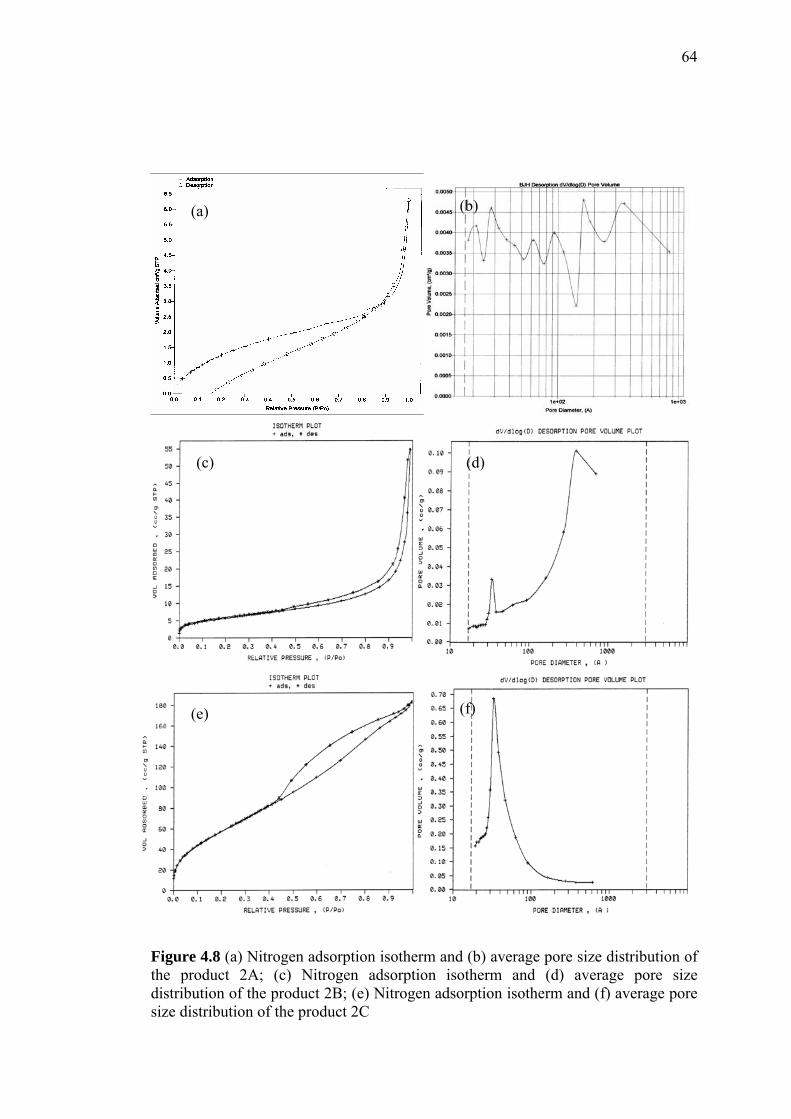
64
(a) (b)
(c) (d)
(e) (f)
Figure 4.8 (a) Nitrogen adsorption isotherm and (b) average pore size distribution of the product 2A; (c) Nitrogen adsorption isotherm and (d) average pore size distribution of the product 2B; (e) Nitrogen adsorption isotherm and (f) average pore size distribution of the product 2C
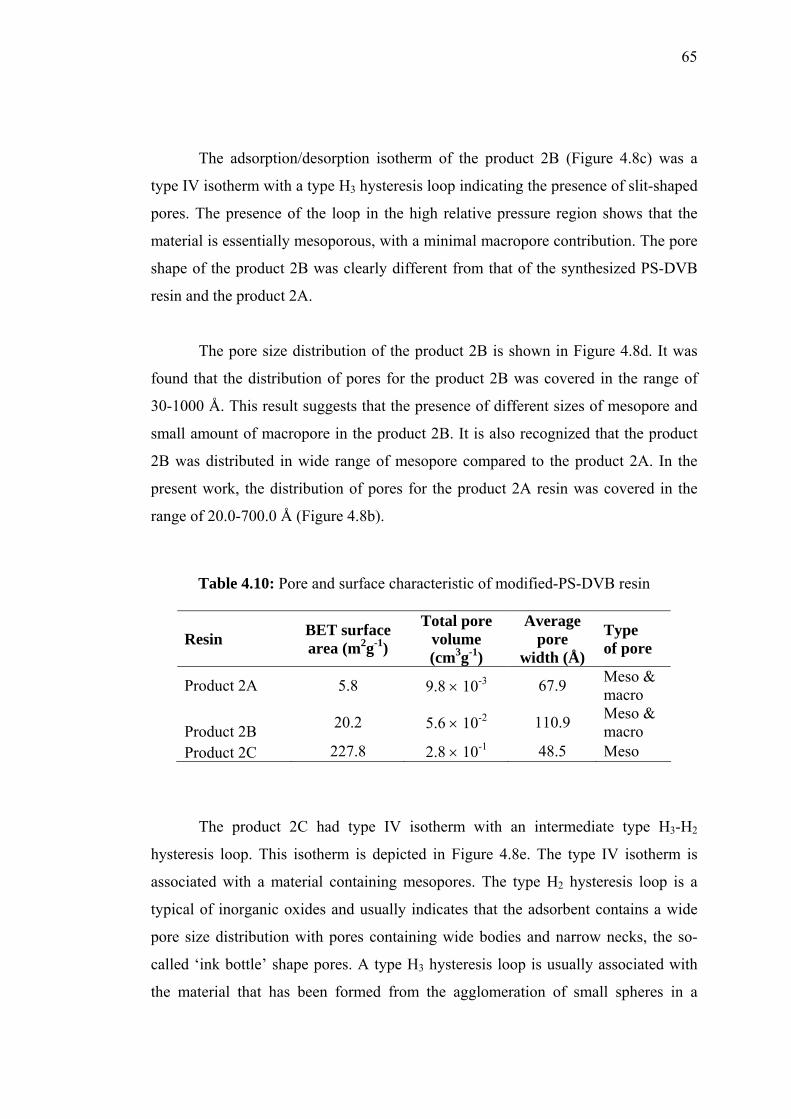
65
The adsorption/desorption isotherm of the product 2B (Figure 4.8c) was a
type IV isotherm with a type H3 hysteresis loop indicating the presence of slit-shaped
pores. The presence of the loop in the high relative pressure region shows that the
material is essentially mesoporous, with a minimal macropore contribution. The pore
shape of the product 2B was clearly different from that of the synthesized PS-DVB
resin and the product 2A.
The pore size distribution of the product 2B is shown in Figure 4.8d. It was
found that the distribution of pores for the product 2B was covered in the range of
30-1000 Å. This result suggests that the presence of different sizes of mesopore and
small amount of macropore in the product 2B. It is also recognized that the product
2B was distributed in wide range of mesopore compared to the product 2A. In the
present work, the distribution of pores for the product 2A resin was covered in the
range of 20.0-700.0 Å (Figure 4.8b).
Table 4.10: Pore and surface characteristic of modified-PS-DVB resin
Resin BET surface area (m2g-1)
Total pore volume (cm3g-1)
Average pore
width (Å)
Type of pore
Product 2A 5.8 9.8 × 10⁻³ 67.9 Meso & macro
Product 2B 20.2 5.6 × 10⁻² 110.9 Meso & macro
Product 2C 227.8 2.8 × 10⁻¹ 48.5 Meso
The product 2C had type IV isotherm with an intermediate type H3-H2
hysteresis loop. This isotherm is depicted in Figure 4.8e. The type IV isotherm is
associated with a material containing mesopores. The type H2 hysteresis loop is a
typical of inorganic oxides and usually indicates that the adsorbent contains a wide
pore size distribution with pores containing wide bodies and narrow necks, the so-
called ‘ink bottle’ shape pores. A type H3 hysteresis loop is usually associated with
the material that has been formed from the agglomeration of small spheres in a
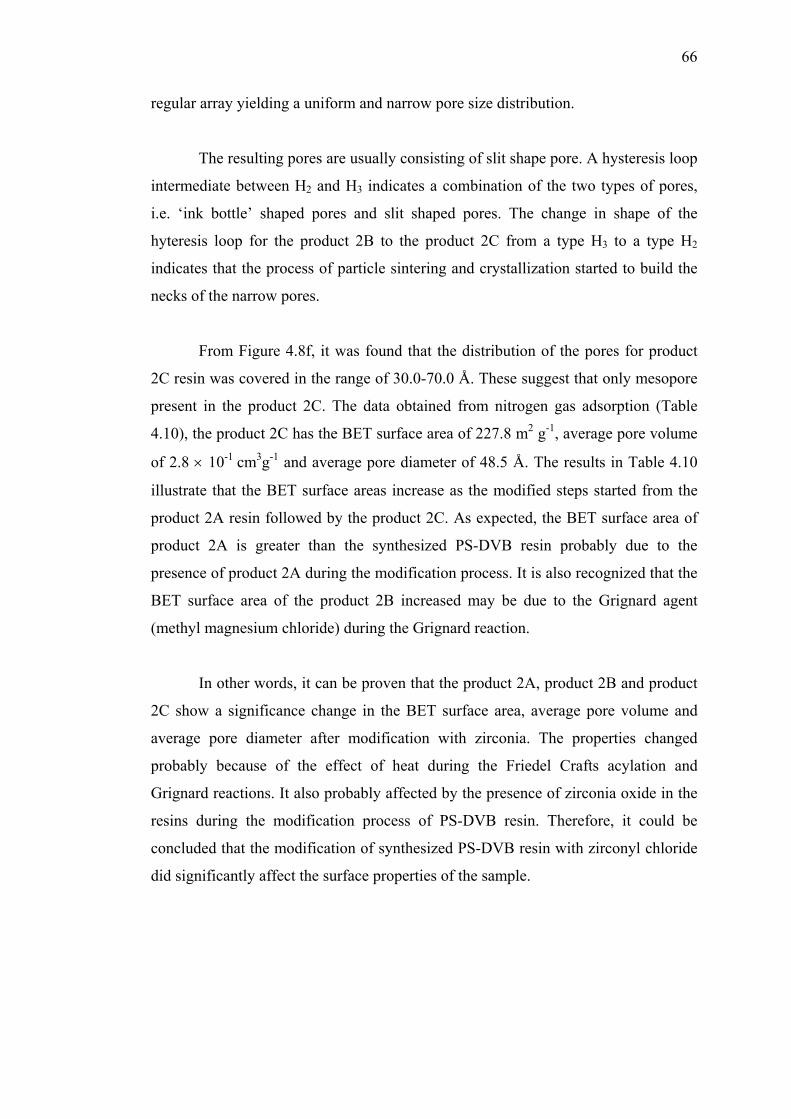
66
regular array yielding a uniform and narrow pore size distribution.
The resulting pores are usually consisting of slit shape pore. A hysteresis loop
intermediate between H2 and H3 indicates a combination of the two types of pores,
i.e. ‘ink bottle’ shaped pores and slit shaped pores. The change in shape of the
hyteresis loop for the product 2B to the product 2C from a type H3 to a type H2
indicates that the process of particle sintering and crystallization started to build the
necks of the narrow pores.
From Figure 4.8f, it was found that the distribution of the pores for product
2C resin was covered in the range of 30.0-70.0 Å. These suggest that only mesopore
present in the product 2C. The data obtained from nitrogen gas adsorption (Table
4.10), the product 2C has the BET surface area of 227.8 m2 g-1, average pore volume
of 2.8 × 10⁻¹ cm3g-1 and average pore diameter of 48.5 Å. The results in Table 4.10
illustrate that the BET surface areas increase as the modified steps started from the
product 2A resin followed by the product 2C. As expected, the BET surface area of
product 2A is greater than the synthesized PS-DVB resin probably due to the
presence of product 2A during the modification process. It is also recognized that the
BET surface area of the product 2B increased may be due to the Grignard agent
(methyl magnesium chloride) during the Grignard reaction.
In other words, it can be proven that the product 2A, product 2B and product
2C show a significance change in the BET surface area, average pore volume and
average pore diameter after modification with zirconia. The properties changed
probably because of the effect of heat during the Friedel Crafts acylation and
Grignard reactions. It also probably affected by the presence of zirconia oxide in the
resins during the modification process of PS-DVB resin. Therefore, it could be
concluded that the modification of synthesized PS-DVB resin with zirconyl chloride
did significantly affect the surface properties of the sample.
67
4.5 Preparation of p-2-zirconyl-2-methylpropyl-PS-DVB chloride
The polymer adsorbent of p-2-zirconyl-2-methylpropyl-PS-DVB chloride
resin was prepared using three steps polymer analogous reaction. It was coded as
product 3C. At first, a ketone group CH3-COCH2- was introduced into the
synthesized PS-DVB using Friedel Crafts acylation reaction with chloroacetone with
the presence of AlCl3 as Lewis acid catalyst. The ketone functional resin showed an
intense carbonyl stretching at 1711.7 cm-1 in the FTIR spectrum. It produced p-2-
propanoyl-PS-DVB and coded as product 3A. p-2-propanoyl-PS-DVB was then
converted to product 3B (p-2-hydroxyl-2-methylpropyl-PS-DVB) using Grignard
reaction with methyl magnesium chloride, followed by hydrolysis. The p-2-
hydroxyl-2-methylpropyl-PS-DVB was allowed to react with zirconyl chloride
octahydrate (ZrOCl2.8H2O) in acetonitrile-water (1:1) mixture to afford the polymer
p-2-zirconyl-2-methylpropyl-PS-DVB chloride. The reaction sequence is depicted in
Figure 1.1c.
4.6 Characterization of p-2-zirconyl-2-methylpropyl-PS-DVB chloride
4.6.1 Fourier Transform Infrared (FTIR) Spectroscopy
FTIR analysis of product 3A in Figure 4.9a shows its peaks at 3000.2 cm-1
and 3024.2 cm-1 which are assigned to C-Halkanes and C-Haromatic stretching,
respectively. Polystyrene functional group shows its stretching absorbance at 1942.2
cm-1, 1872.8 cm-1, 1799.5 cm-1 and 1775.3 cm-1. The C=Caromatic stretching were
absorbed at 1599.8 cm-1 and 1490.9 cm-1. The presence of a C=O functional group in
the modified phase is proven by a strong band at 1711.7 cm-1 on spectrum. The para-
and mono-substituted benzene rings were observed at 750.3 cm-1 and 696.3 cm-1,
536.2 cm-1 respectively.
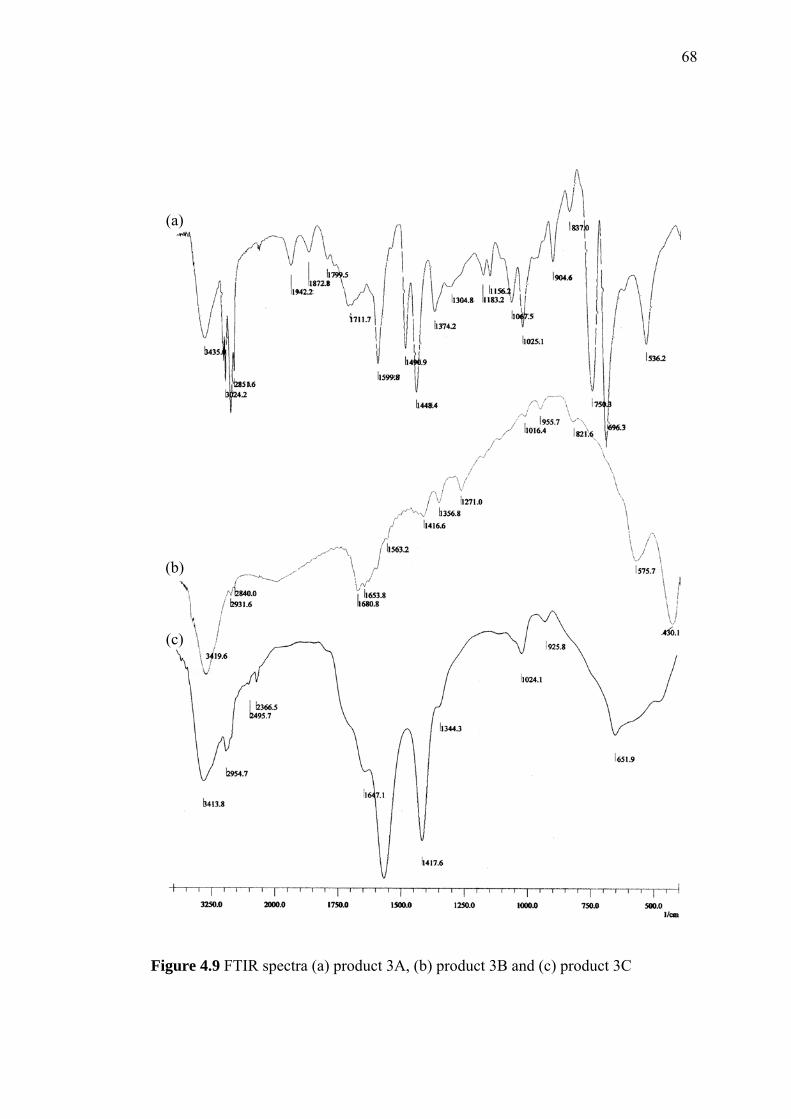
68
(a)
(b)
(c)
Figure 4.9 FTIR spectra (a) product 3A, (b) product 3B and (c) product 3C
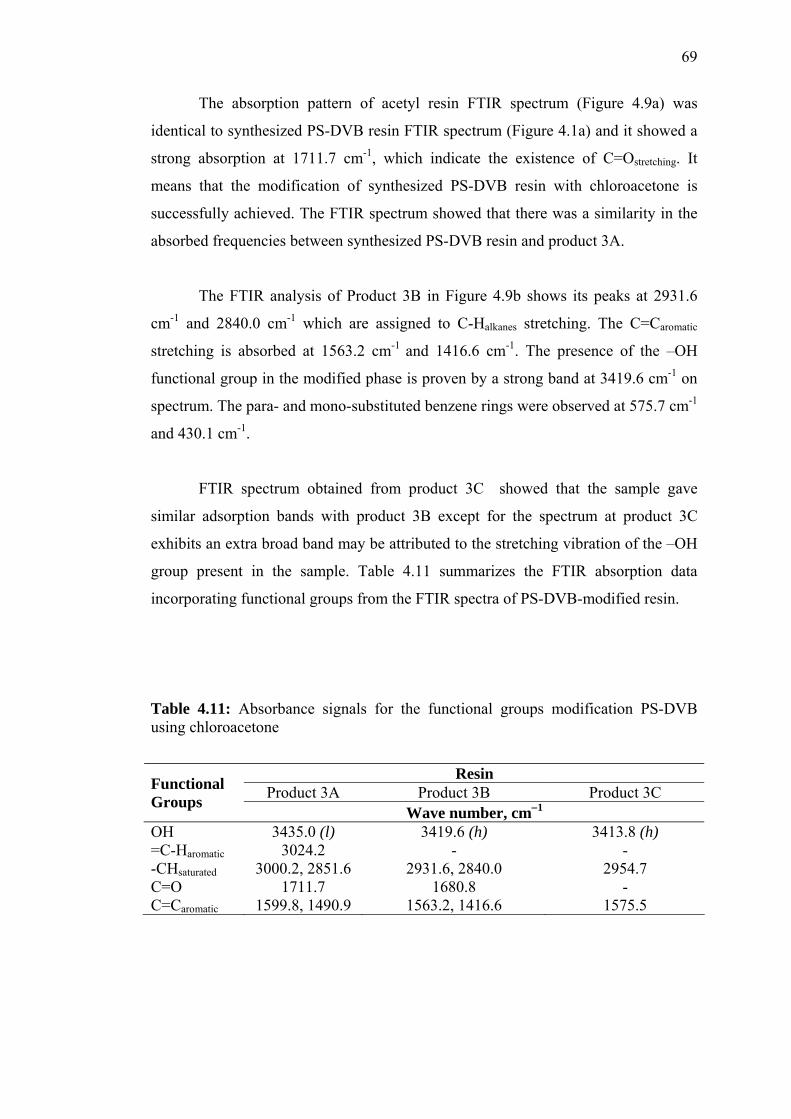
69
The absorption pattern of acetyl resin FTIR spectrum (Figure 4.9a) was
identical to synthesized PS-DVB resin FTIR spectrum (Figure 4.1a) and it showed a
strong absorption at 1711.7 cm-1, which indicate the existence of C=Ostretching. It
means that the modification of synthesized PS-DVB resin with chloroacetone is
successfully achieved. The FTIR spectrum showed that there was a similarity in the
absorbed frequencies between synthesized PS-DVB resin and product 3A.
The FTIR analysis of Product 3B in Figure 4.9b shows its peaks at 2931.6
cm-1 and 2840.0 cm-1 which are assigned to C-Halkanes stretching. The C=Caromatic
stretching is absorbed at 1563.2 cm-1 and 1416.6 cm-1. The presence of the –OH
functional group in the modified phase is proven by a strong band at 3419.6 cm-1 on
spectrum. The para- and mono-substituted benzene rings were observed at 575.7 cm-1
and 430.1 cm-1.
FTIR spectrum obtained from product 3C showed that the sample gave
similar adsorption bands with product 3B except for the spectrum at product 3C
exhibits an extra broad band may be attributed to the stretching vibration of the –OH
group present in the sample. Table 4.11 summarizes the FTIR absorption data
incorporating functional groups from the FTIR spectra of PS-DVB-modified resin.
Table 4.11: Absorbance signals for the functional groups modification PS-DVB using chloroacetone
Resin Product 3A Product 3B Product 3C Functional
Groups Wave number, cm−1
OH 3435.0 (l) 3419.6 (h) 3413.8 (h) =C-Haromatic 3024.2 - - -CHsaturated 3000.2, 2851.6 2931.6, 2840.0 2954.7 C=O 1711.7 1680.8 - C=Caromatic 1599.8, 1490.9 1563.2, 1416.6 1575.5
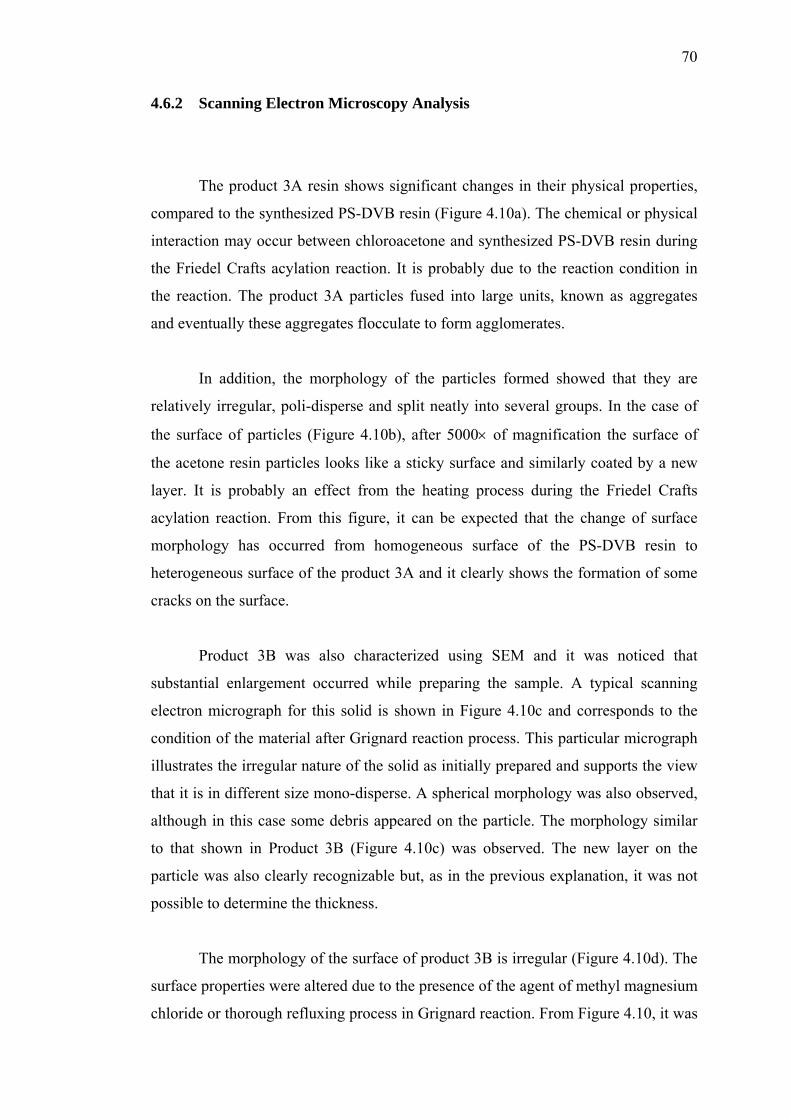
70
4.6.2 Scanning Electron Microscopy Analysis
The product 3A resin shows significant changes in their physical properties,
compared to the synthesized PS-DVB resin (Figure 4.10a). The chemical or physical
interaction may occur between chloroacetone and synthesized PS-DVB resin during
the Friedel Crafts acylation reaction. It is probably due to the reaction condition in
the reaction. The product 3A particles fused into large units, known as aggregates
and eventually these aggregates flocculate to form agglomerates.
In addition, the morphology of the particles formed showed that they are
relatively irregular, poli-disperse and split neatly into several groups. In the case of
the surface of particles (Figure 4.10b), after 5000× of magnification the surface of
the acetone resin particles looks like a sticky surface and similarly coated by a new
layer. It is probably an effect from the heating process during the Friedel Crafts
acylation reaction. From this figure, it can be expected that the change of surface
morphology has occurred from homogeneous surface of the PS-DVB resin to
heterogeneous surface of the product 3A and it clearly shows the formation of some
cracks on the surface.
Product 3B was also characterized using SEM and it was noticed that
substantial enlargement occurred while preparing the sample. A typical scanning
electron micrograph for this solid is shown in Figure 4.10c and corresponds to the
condition of the material after Grignard reaction process. This particular micrograph
illustrates the irregular nature of the solid as initially prepared and supports the view
that it is in different size mono-disperse. A spherical morphology was also observed,
although in this case some debris appeared on the particle. The morphology similar
to that shown in Product 3B (Figure 4.10c) was observed. The new layer on the
particle was also clearly recognizable but, as in the previous explanation, it was not
possible to determine the thickness.
The morphology of the surface of product 3B is irregular (Figure 4.10d). The
surface properties were altered due to the presence of the agent of methyl magnesium
chloride or thorough refluxing process in Grignard reaction. From Figure 4.10, it was
71
found that the particle size for product 3A, product 3B and product 3C were about
85.2, 94.2 and 109.8 μm, respectively. This result reflects that the particle size of the
modified-PS-DVB resin is dramatically increased by the modification process steps
of the synthesized PS-DVB resin.
In the micrograph of product 3C particles (Figure 4.10e), morphology similar
to that shown in product 3C (Figure 4.6e). These observations indirectly imply that a
reflux process change the morphology of Product 3B to Product 3C, which alter the
mechanical properties. The arrangement of the particle is random and does not show
any specific pattern. The morphology of the particles formed showed that they are
irregular. However, the morphology of the surface of Product 3C does not show any
specific pattern (Figure 4.10f). Thus, it is suggested that the mixing process
interrupted the relatively ordered arrangement of multiplets, resulting in scattering
centers of various scattering intensities at varying distances. This formation is
supportive for the morphological changes upon blending in the present work
(Coutinho et al., 2004).
Based on these initial experiments we propose that it could be due to the
difference in viscosity of the two kinds of composite during the polymerization
process. Low energy sites are probably formed around all the surface of the high
viscosity beads and facilitate the sorption of the iron particles. On the other hand,
only few sites of low energy could be observed on the surface of the low viscosity
ones. In this case, the particles seemingly prefer to form in clusters arrangement
instead of nucleating (Coutinho et al., 2004; Maria et al., 2003a and 2003b; Huang
and Tang, 2004).
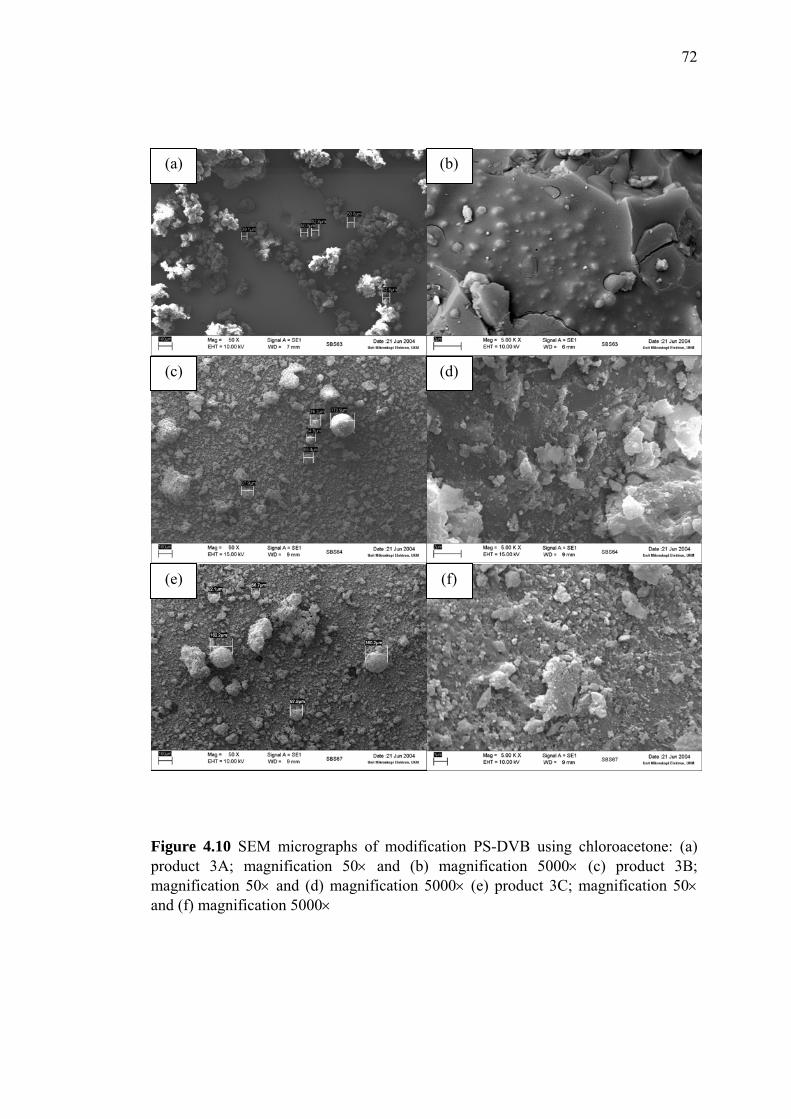
72
(a) (b)
(c) (d)
(e) (f)
Figure 4.10 SEM micrographs of modification PS-DVB using chloroacetone: (a) product 3A; magnification 50× and (b) magnification 5000× (c) product 3B; magnification 50× and (d) magnification 5000× (e) product 3C; magnification 50× and (f) magnification 5000×
73
4.6.3 Thermogravimetry Analysis
he thermogravimetric analysis result for modified-PS-DVB resin at various
temperature ranges are listed in Table 4.12. Temperature range less than 135.5°C and
temperature range 135.5-326.6°C show that the Product 3B (19.0%) and Product 3A
(24.8%) are the highest weight loss percentage compared to the other resins,
respectively. These results reflect that the loss in weight observed at the temperature
range less than 135.5°C is probably due to the removal of the loosely bound water
from the resin while the loss in weight at temperature range 135.5-326.6°C
corresponds to the removal of more strongly bounded water derived from hydroxyl
groups and may also due to the decomposition of low volatile groups. The result
indicates that the both resin may have a high degree of water contained in their
structure compared to the other resins.
Table 4.12 also indicates that the maximum weight loss for most of the
sample occurred at temperature range 326.6-517.6°C except for Product 3A, which
occurs at temperature range of 517.6-708.6°C. The maximum weight loss percentage
for Product 3A, Product 3B, and Product 3C are observed at temperature range of
517.6-708.6°C (32.98%), temperature range 326.6-517.6°C (22.5%), and
temperature range 326.6-517.6°C (23.1%), respectively. Meanwhile, the weight lost
occurred at temperature range 326.6-517.6°C, 517.6-708.6°C and 708.6-899.7°C
arises from further decomposition of the high volatile groups in the resin. The result
demonstrates that the maximum weight loss percentage of the resins in Table 4.12 in
accordance as Product 3A < Product 3B < Product 3C.
The residue percentage for Product 3A, Product 3B and Product 3C when the
temperature reaches 900°C are 7.4%, 25.1%, and 57.7%, respectively. The
percentage of residue of Product 3C is higher (57.7%) than the other resins. The total
value of the percentage of weight loss of Product 3C is 42.4%. This result is probably
affected by the presence of zirconia oxide in the resin during the modification
process of PS-DVB resin. The properties changed probably because of the effect of
heat during the Friedel Crafts acylation and Grignard reactions. The result
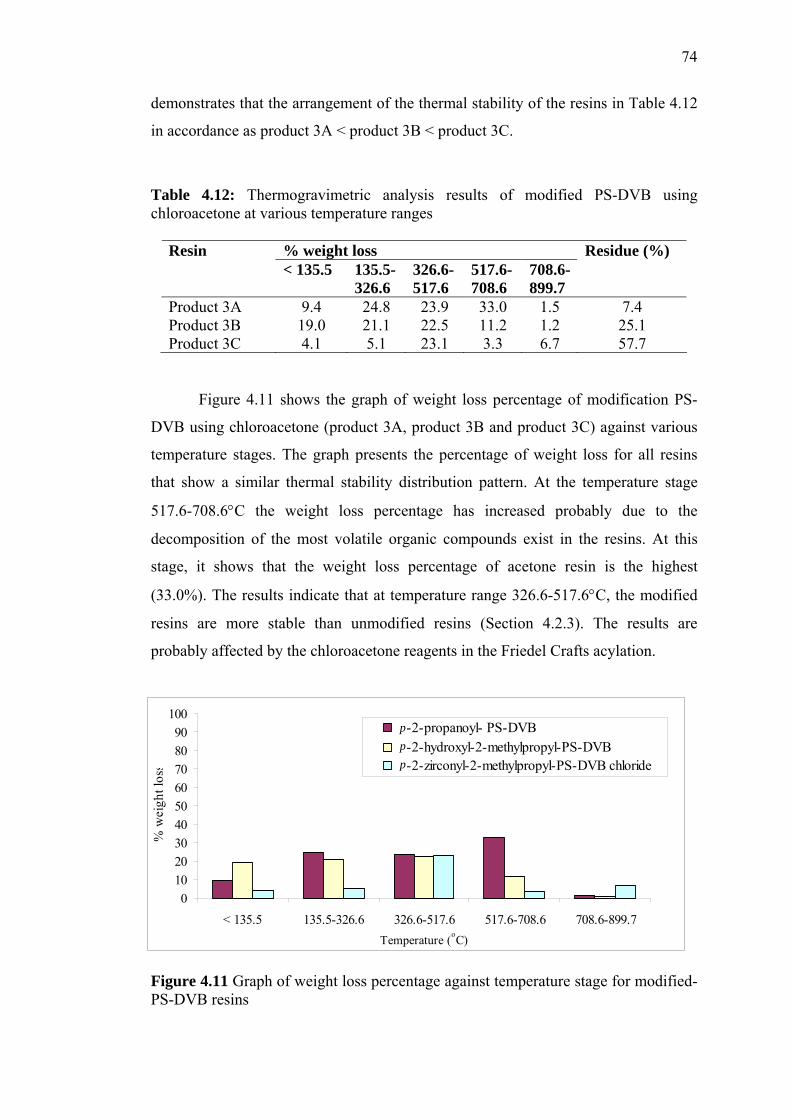
74
demonstrates that the arrangement of the thermal stability of the resins in Table 4.12
in accordance as product 3A < product 3B < product 3C.
Table 4.12: Thermogravimetric analysis results of modified PS-DVB using chloroacetone at various temperature ranges
% weight loss Resin < 135.5 135.5-
326.6 326.6-517.6
517.6-708.6
708.6-899.7
Residue (%)
Product 3A 9.4 24.8 23.9 33.0 1.5 7.4 Product 3B 19.0 21.1 22.5 11.2 1.2 25.1 Product 3C 4.1 5.1 23.1 3.3 6.7 57.7
Figure 4.11 shows the graph of weight loss percentage of modification PS-
DVB using chloroacetone (product 3A, product 3B and product 3C) against various
temperature stages. The graph presents the percentage of weight loss for all resins
that show a similar thermal stability distribution pattern. At the temperature stage
517.6-708.6°C the weight loss percentage has increased probably due to the
decomposition of the most volatile organic compounds exist in the resins. At this
stage, it shows that the weight loss percentage of acetone resin is the highest
(33.0%). The results indicate that at temperature range 326.6-517.6°C, the modified
resins are more stable than unmodified resins (Section 4.2.3). The results are
probably affected by the chloroacetone reagents in the Friedel Crafts acylation.
0102030405060708090
100
< 135.5 135.5-326.6 326.6-517.6 517.6-708.6 708.6-899.7Temperature (oC)
% w
eigh
t los
s
-2-propanoyl- PS-DVB -2-hydroxyl-2-methylpropyl-PS-DVB -2-zirconyl-2-methylpropyl-PS-DVB chloride
p
p
p
Figure 4.11 Graph of weight loss percentage against temperature stage for modified-PS-DVB resins
75
4.6.4 Nitrogen Adsorption and Desorption Analysis
The nitrogen adsorption isotherm for product 3A is shown in Figure 4.12a.
The nitrogen adsorption and desorption isotherms for product 3A and synthesized
PS-DVB resin (Figure 4.4a) have a similar pattern, with low BET surface area.
Figure 4.12a shows the nitrogen isotherm obtained from acetone resin was not well
formed. Therefore, the type of pores in the acetone resin was a mixture of mesopore
and macropore (Figure 4.12b). This result suggested that the acetone resin did not
affect much on the surface properties of the studied phase.
The pore size distribution of the product 3A is shown in Figure 4.12b. It was
found that the distribution of pore size for the product 3A resin was covered in the
range of 20.0-700.0 Å. This result suggests the presence of different sizes of
mesopore and macropore in the product 3A. In the present work, the distribution of
pores size for the synthesized PS-DVB resin was covered in the range of 20.0-40.0 Å
(Figure 4.12d). From the results, it can be mentioned that the distribution of pores
size for synthesized PS-DVB resin was changed probably due to the effect of the
Friedel Crafts acylation reaction or the presence of chloroacetone reagent. The
adsorption/desorption isotherm of the product 3B (Figure 4.12c) was a type IV
isotherm with a type H3 hysteresis loop indicating the presence of slit-shaped pores.
The presence of the loop in the high relative pressure region shows that the material
is essentially mesoporous, with a minimal macropore contribution. Regarding the
result, the pore shape of the product 3B was clearly different from the synthesized
PS-DVB resin and the product 3C. The pore size distribution of the product 3B is
shown in Figure 4.12d. It was found that the distribution of pores size for the product
3B was covered in the range of 300-1000 Å. This result suggests the presence a
mixture of mesopore and minimal macropore consists in the product 3B. It is also
recognized that the product 3B was distributed in the wide range of mesopore
compared to the acetone resin. In the present work, the distribution of pores size for
the acetone resin was covered in the range of 20.0-700.0 Å (Figure 4.12b).
The nitrogen isotherm of the product 3C was a type IV isotherm with a type
H3 hysteresis loop indicating the presence of slit-shaped pores. The type IV isotherm
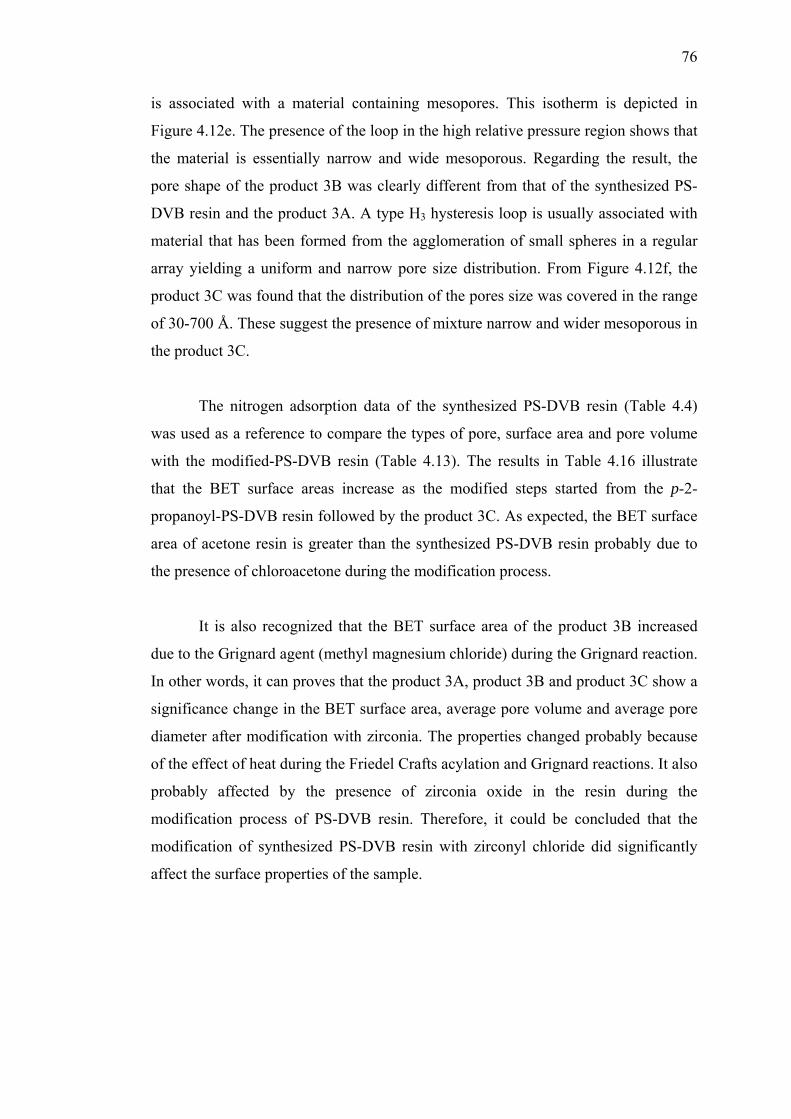
76
is associated with a material containing mesopores. This isotherm is depicted in
Figure 4.12e. The presence of the loop in the high relative pressure region shows that
the material is essentially narrow and wide mesoporous. Regarding the result, the
pore shape of the product 3B was clearly different from that of the synthesized PS-
DVB resin and the product 3A. A type H3 hysteresis loop is usually associated with
material that has been formed from the agglomeration of small spheres in a regular
array yielding a uniform and narrow pore size distribution. From Figure 4.12f, the
product 3C was found that the distribution of the pores size was covered in the range
of 30-700 Å. These suggest the presence of mixture narrow and wider mesoporous in
the product 3C.
The nitrogen adsorption data of the synthesized PS-DVB resin (Table 4.4)
was used as a reference to compare the types of pore, surface area and pore volume
with the modified-PS-DVB resin (Table 4.13). The results in Table 4.16 illustrate
that the BET surface areas increase as the modified steps started from the p-2-
propanoyl-PS-DVB resin followed by the product 3C. As expected, the BET surface
area of acetone resin is greater than the synthesized PS-DVB resin probably due to
the presence of chloroacetone during the modification process.
It is also recognized that the BET surface area of the product 3B increased
due to the Grignard agent (methyl magnesium chloride) during the Grignard reaction.
In other words, it can proves that the product 3A, product 3B and product 3C show a
significance change in the BET surface area, average pore volume and average pore
diameter after modification with zirconia. The properties changed probably because
of the effect of heat during the Friedel Crafts acylation and Grignard reactions. It also
probably affected by the presence of zirconia oxide in the resin during the
modification process of PS-DVB resin. Therefore, it could be concluded that the
modification of synthesized PS-DVB resin with zirconyl chloride did significantly
affect the surface properties of the sample.
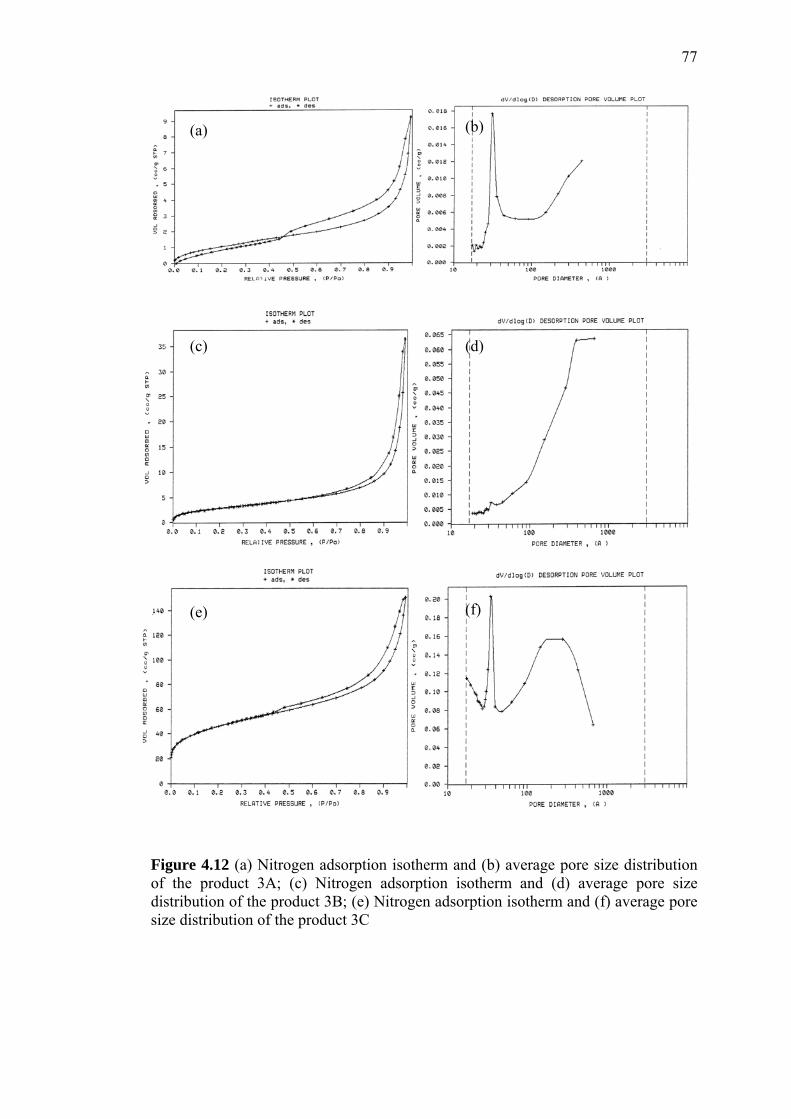
77
(a) (b)
(c) (d)
(e) (f)
Figure 4.12 (a) Nitrogen adsorption isotherm and (b) average pore size distribution of the product 3A; (c) Nitrogen adsorption isotherm and (d) average pore size distribution of the product 3B; (e) Nitrogen adsorption isotherm and (f) average pore size distribution of the product 3C
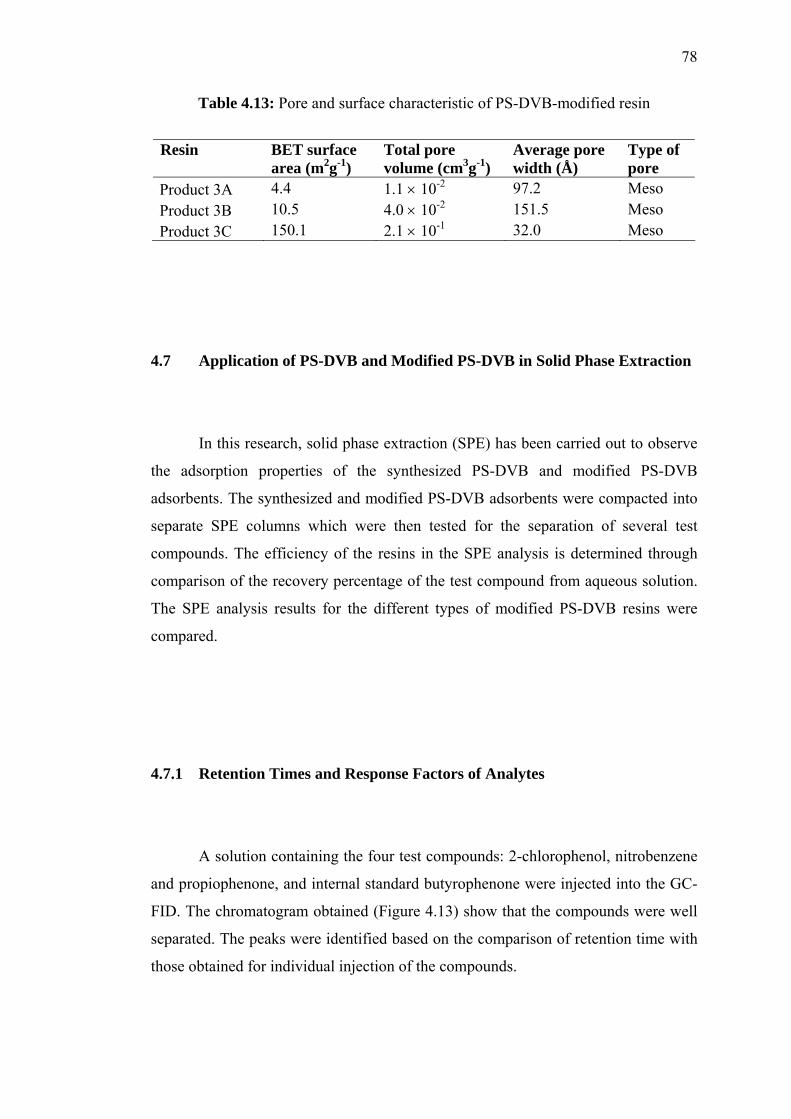
78
Table 4.13: Pore and surface characteristic of PS-DVB-modified resin
Resin BET surface area (m2g-1)
Total pore volume (cm3g-1)
Average pore width (Å)
Type of pore
Product 3A 4.4 1.1 × 10⁻² 97.2 Meso Product 3B 10.5 4.0 × 10⁻² 151.5 Meso Product 3C 150.1 2.1 × 10⁻¹ 32.0 Meso
4.7 Application of PS-DVB and Modified PS-DVB in Solid Phase Extraction
In this research, solid phase extraction (SPE) has been carried out to observe
the adsorption properties of the synthesized PS-DVB and modified PS-DVB
adsorbents. The synthesized and modified PS-DVB adsorbents were compacted into
separate SPE columns which were then tested for the separation of several test
compounds. The efficiency of the resins in the SPE analysis is determined through
comparison of the recovery percentage of the test compound from aqueous solution.
The SPE analysis results for the different types of modified PS-DVB resins were
compared.
4.7.1 Retention Times and Response Factors of Analytes
A solution containing the four test compounds: 2-chlorophenol, nitrobenzene
and propiophenone, and internal standard butyrophenone were injected into the GC-
FID. The chromatogram obtained (Figure 4.13) show that the compounds were well
separated. The peaks were identified based on the comparison of retention time with
those obtained for individual injection of the compounds.
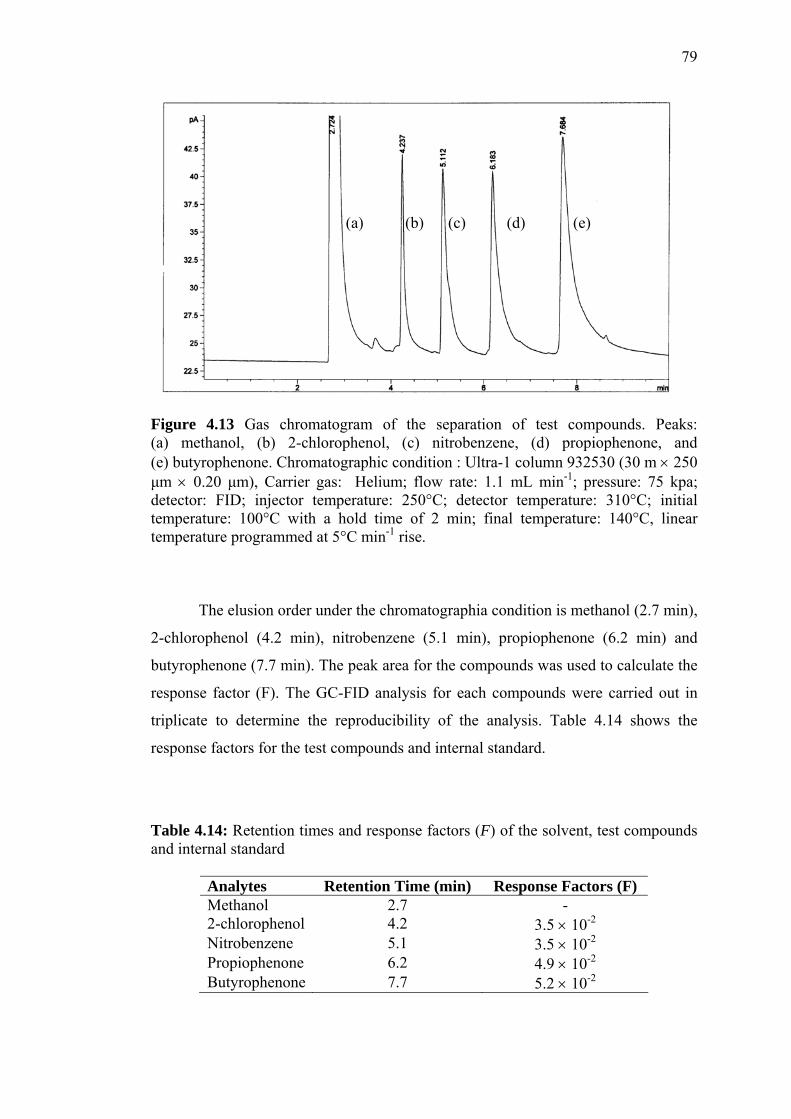
79
(a) (b) (c) (d) (e)
Figure 4.13 Gas chromatogram of the separation of test compounds. Peaks: (a) methanol, (b) 2-chlorophenol, (c) nitrobenzene, (d) propiophenone, and (e) butyrophenone. Chromatographic condition : Ultra-1 column 932530 (30 m × 250 μm × 0.20 μm), Carrier gas: Helium; flow rate: 1.1 mL min-1; pressure: 75 kpa; detector: FID; injector temperature: 250°C; detector temperature: 310°C; initial temperature: 100°C with a hold time of 2 min; final temperature: 140°C, linear temperature programmed at 5°C min-1 rise.
The elusion order under the chromatographia condition is methanol (2.7 min),
2-chlorophenol (4.2 min), nitrobenzene (5.1 min), propiophenone (6.2 min) and
butyrophenone (7.7 min). The peak area for the compounds was used to calculate the
response factor (F). The GC-FID analysis for each compounds were carried out in
triplicate to determine the reproducibility of the analysis. Table 4.14 shows the
response factors for the test compounds and internal standard.
Table 4.14: Retention times and response factors (F) of the solvent, test compounds and internal standard
Analytes Retention Time (min) Response Factors (F) Methanol 2.7 - 2-chlorophenol 4.2 3.5 × 10⁻²
Nitrobenzene 5.1 3.5 × 10⁻²
Propiophenone 6.2 4.9 × 10⁻²
Butyrophenone 7.7 5.2 × 10⁻²
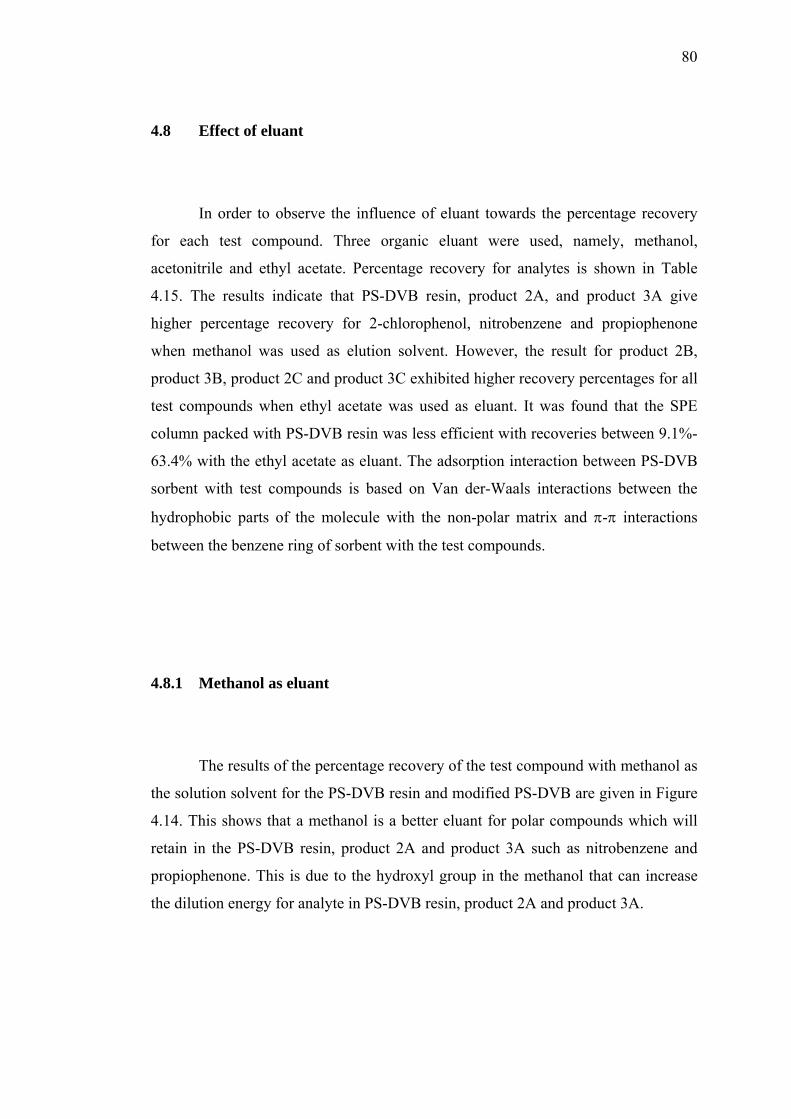
80
4.8 Effect of eluant
In order to observe the influence of eluant towards the percentage recovery
for each test compound. Three organic eluant were used, namely, methanol,
acetonitrile and ethyl acetate. Percentage recovery for analytes is shown in Table
4.15. The results indicate that PS-DVB resin, product 2A, and product 3A give
higher percentage recovery for 2-chlorophenol, nitrobenzene and propiophenone
when methanol was used as elution solvent. However, the result for product 2B,
product 3B, product 2C and product 3C exhibited higher recovery percentages for all
test compounds when ethyl acetate was used as eluant. It was found that the SPE
column packed with PS-DVB resin was less efficient with recoveries between 9.1%-
63.4% with the ethyl acetate as eluant. The adsorption interaction between PS-DVB
sorbent with test compounds is based on Van der-Waals interactions between the
hydrophobic parts of the molecule with the non-polar matrix and π-π interactions
between the benzene ring of sorbent with the test compounds.
4.8.1 Methanol as eluant
The results of the percentage recovery of the test compound with methanol as
the solution solvent for the PS-DVB resin and modified PS-DVB are given in Figure
4.14. This shows that a methanol is a better eluant for polar compounds which will
retain in the PS-DVB resin, product 2A and product 3A such as nitrobenzene and
propiophenone. This is due to the hydroxyl group in the methanol that can increase
the dilution energy for analyte in PS-DVB resin, product 2A and product 3A.
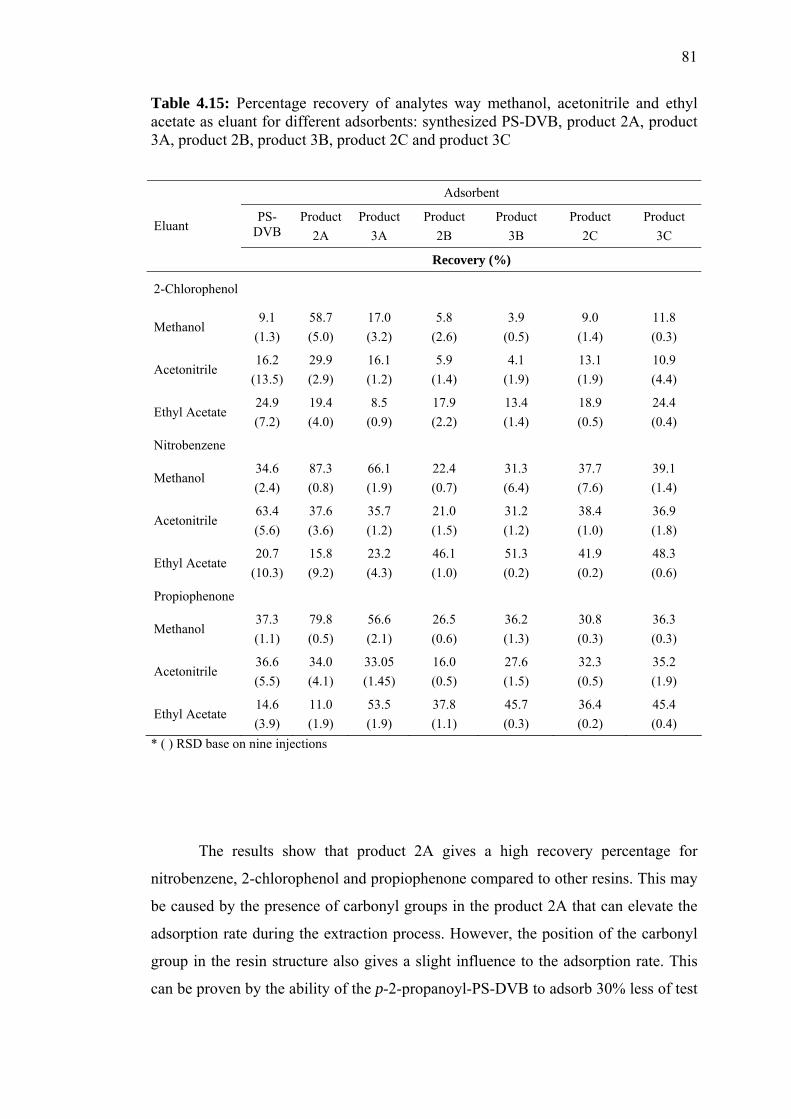
81
Table 4.15: Percentage recovery of analytes way methanol, acetonitrile and ethyl acetate as eluant for different adsorbents: synthesized PS-DVB, product 2A, product 3A, product 2B, product 3B, product 2C and product 3C
Adsorbent
PS-DVB
Product 2A
Product 3A
Product 2B
Product 3B
Product 2C
Product 3C
Eluant
Recovery (%)
2-Chlorophenol
Methanol 9.1
(1.3) 58.7 (5.0)
17.0 (3.2)
5.8 (2.6)
3.9 (0.5)
9.0 (1.4)
11.8 (0.3)
Acetonitrile 16.2
(13.5) 29.9 (2.9)
16.1 (1.2)
5.9 (1.4)
4.1 (1.9)
13.1 (1.9)
10.9 (4.4)
Ethyl Acetate 24.9 (7.2)
19.4 (4.0)
8.5 (0.9)
17.9 (2.2)
13.4 (1.4)
18.9 (0.5)
24.4 (0.4)
Nitrobenzene
Methanol 34.6 (2.4)
87.3 (0.8)
66.1 (1.9)
22.4 (0.7)
31.3 (6.4)
37.7 (7.6)
39.1 (1.4)
Acetonitrile 63.4 (5.6)
37.6 (3.6)
35.7 (1.2)
21.0 (1.5)
31.2 (1.2)
38.4 (1.0)
36.9 (1.8)
Ethyl Acetate 20.7
(10.3) 15.8 (9.2)
23.2 (4.3)
46.1 (1.0)
51.3 (0.2)
41.9 (0.2)
48.3 (0.6)
Propiophenone
Methanol 37.3 (1.1)
79.8 (0.5)
56.6 (2.1)
26.5 (0.6)
36.2 (1.3)
30.8 (0.3)
36.3 (0.3)
Acetonitrile 36.6 (5.5)
34.0 (4.1)
33.05 (1.45)
16.0 (0.5)
27.6 (1.5)
32.3 (0.5)
35.2 (1.9)
Ethyl Acetate 14.6 (3.9)
11.0 (1.9)
53.5 (1.9)
37.8 (1.1)
45.7 (0.3)
36.4 (0.2)
45.4 (0.4)
* ( ) RSD base on nine injections
The results show that product 2A gives a high recovery percentage for
nitrobenzene, 2-chlorophenol and propiophenone compared to other resins. This may
be caused by the presence of carbonyl groups in the product 2A that can elevate the
adsorption rate during the extraction process. However, the position of the carbonyl
group in the resin structure also gives a slight influence to the adsorption rate. This
can be proven by the ability of the p-2-propanoyl-PS-DVB to adsorb 30% less of test
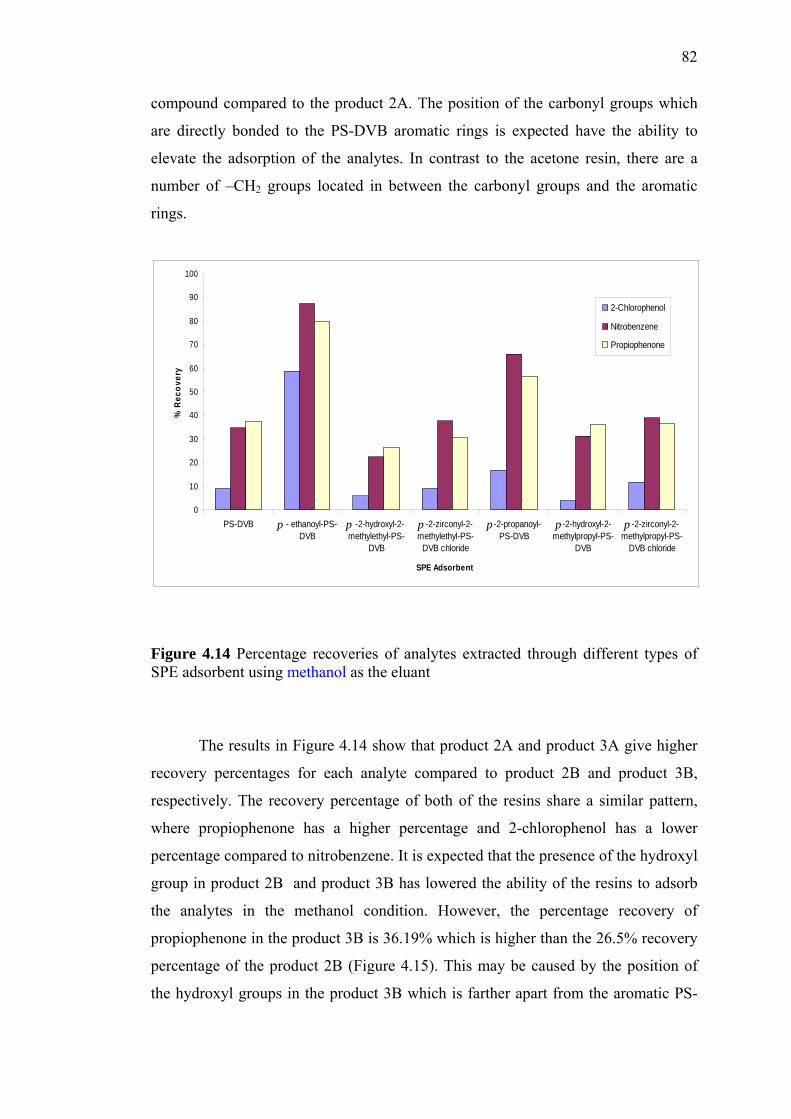
82
compound compared to the product 2A. The position of the carbonyl groups which
are directly bonded to the PS-DVB aromatic rings is expected have the ability to
elevate the adsorption of the analytes. In contrast to the acetone resin, there are a
number of –CH2 groups located in between the carbonyl groups and the aromatic
rings.
0
10
20
30
40
50
60
70
80
90
100
PS-DVB - ethanoyl-PS-DVB
-2-hydroxyl-2-methylethyl-PS-
DVB
-2-zirconyl-2-methylethyl-PS-
DVB chloride
-2-propanoyl-PS-DVB
-2-hydroxyl-2-methylpropyl-PS-
DVB
-2-zirconyl-2-methylpropyl-PS-
DVB chloride
SPE Adsorbent
% R
ecov
ery
2-Chlorophenol
Nitrobenzene
Propiophenone
p p p p p p
Figure 4.14 Percentage recoveries of analytes extracted through different types of SPE adsorbent using methanol as the eluant
The results in Figure 4.14 show that product 2A and product 3A give higher
recovery percentages for each analyte compared to product 2B and product 3B,
respectively. The recovery percentage of both of the resins share a similar pattern,
where propiophenone has a higher percentage and 2-chlorophenol has a lower
percentage compared to nitrobenzene. It is expected that the presence of the hydroxyl
group in product 2B and product 3B has lowered the ability of the resins to adsorb
the analytes in the methanol condition. However, the percentage recovery of
propiophenone in the product 3B is 36.19% which is higher than the 26.5% recovery
percentage of the product 2B (Figure 4.15). This may be caused by the position of
the hydroxyl groups in the product 3B which is farther apart from the aromatic PS-
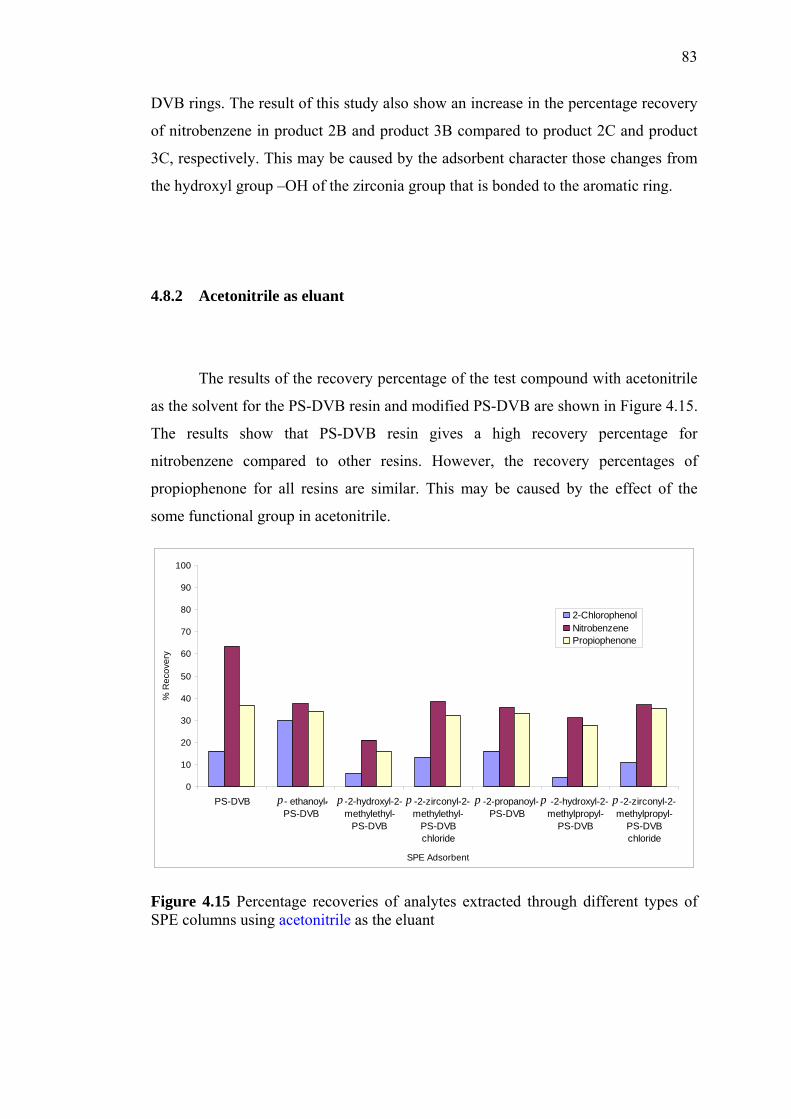
83
DVB rings. The result of this study also show an increase in the percentage recovery
of nitrobenzene in product 2B and product 3B compared to product 2C and product
3C, respectively. This may be caused by the adsorbent character those changes from
the hydroxyl group –OH of the zirconia group that is bonded to the aromatic ring.
4.8.2 Acetonitrile as eluant
The results of the recovery percentage of the test compound with acetonitrile
as the solvent for the PS-DVB resin and modified PS-DVB are shown in Figure 4.15.
The results show that PS-DVB resin gives a high recovery percentage for
nitrobenzene compared to other resins. However, the recovery percentages of
propiophenone for all resins are similar. This may be caused by the effect of the
some functional group in acetonitrile.
0
10
20
30
40
50
60
70
80
90
100
PS-DVB - ethanoyl-PS-DVB
-2-hydroxyl-2-methylethyl-
PS-DVB
-2-zirconyl-2-methylethyl-
PS-DVBchloride
-2-propanoyl-PS-DVB
-2-hydroxyl-2-methylpropyl-
PS-DVB
-2-zirconyl-2-methylpropyl-
PS-DVBchloride
SPE Adsorbent
% R
ecov
ery
2-ChlorophenolNitrobenzenePropiophenone
p . p p p p p
Figure 4.15 Percentage recoveries of analytes extracted through different types of SPE columns using acetonitrile as the eluant
84
4.8.3 Ethyl acetate as eluant
Figure 4.16 shows the percentage recovery of the test compounds with ethyl
acetate as the eluant for the PS-DVB resin and modified PS-DVB. The result shows
an increase in the recovery percentage of nitrobenzene and propiophenone in
modified PS-DVB compared to unmodified PS-DVB resin. It is expected due to the
presence of some functional group in both resin and test compounds.
0
10
20
30
40
50
60
70
80
90
100
PS-DVB - ethanoyl-PS-DVB
-2-hydroxyl-2-methylethyl-
PS-DVB
-2-zirconyl-2-methylethyl-
PS-DVBchloride
-2-propanoyl- PS-
DVB
-2-hydroxyl-2-
methylpropyl-PS-DVB
-2-zirconyl-2-methylpropyl-
PS-DVBchloride
SPE Adsorbent
% R
ecov
ery
2-Chlorophenol
Nitrobenzene
Propiophenone
p . p p p p p
Figure 4.16 Percentage recoveries of analytes extracted through different types of SPE columns using ethyl acetate as the eluant
CHAPTER 5
CONCLUSIONS AND SUGGESTIONS FOR FURTHER STUDY
5.1 Conclusions
In this research, PS-DVB adsorbents have been successfully synthesized and
subsequently modified. The effects of reaction time, stabilizer and polymerization
method were investigated to determine suitable set of conditions to obtain PS-DVB
resins with excellent physical properties. The optimum reaction time for
polymerization was for 20.0 h at 70.0°C. The results showed that synthesized PS-
DVB using poly(vinyl alcohol) as the stabilizer has the BET surface area of 1.2 m2/g
and total pore volume of 1.2 × 10⁻³ cm3/g and it is a better stabilizer than poly(vinyl
pyrrolidone). The surfactant polymerization technique showed that the pore diameter
(68.6 Å) of this sample is lower compared to the seeding polymerization technique.
Six different modified PS-DVB adsorbents namely, p-ethanoyl-PS-DVB, p-2-
hydroxyl-2-methylethyl-PS-DVB, p-2-zirconyl-2-methylethyl-PS-DVB chloride, p-
2-propanoyl-PS-DVB, p-2-hydroxyl-2-methylpropyl-PS-DVB, and p-2-zirconyl-2-
methylpropyl-PS-DVB chloride have been completely characterized by using FTIR,
SEM, TGA and Nitrogen adsorption.
86
This is evidence from the FTIR spectrum of synthesized PS-DVB resin that
has similar adsorption pattern compared to the FTIR spectrum of commercial PS-
DVB resin. For p-ethanoyl-PS-DVB and p-2-propanoyl-PS-DVB the presence of a
C=O functional group in the modified phase was proven by strong band at 1678.9
cm-1 and 1711.1 cm-1, respectively. This indicated the respective incorporation of the
acetyl chloride and chloroacetone to the PS-DVB resin respectively.
In addition, the similarities between the spectra of p-ethanoyl-PS-DVB and p-
2-propanoyl-PS-DVB indicate that the basic structural units of synthesized PS-DVB
resin are preserved in the polymers. The FTIR analysis of p-2-hydroxyl-2-
methylethyl-PS-DVB and p-2-hydroxyl-2-methylpropyl-PS-DVB show strong
absorbent bands at 3430.1 cm-1 and 3419.6 cm-1, respectively, which are assigned to
the presence of -OH functional group in the modified phase. The scanning electron
microscopy characterization, the micrograph showed that the synthesized PS-DVB
resin exhibits somewhat uniform size and distributed in the wide range of particle
size which is covered from 84.0-162.2 μm.
In thermogravimetry analysis, the result represents the percentage weight loss
for synthesized and commercial PS-DVB resins that show similar thermal stability
distribution patterns where the percentage of weight loss at temperature stage less
than 135.5°C and 135.5-326.6°C are lower than temperature stage of 326.6-517.6°C.
The percentage weight loss has increased probably due to the decomposition of the
most volatile organic compounds exist in the resins. This stage shows that the
percentage weight loss of synthesized PS-DVB resin is slightly higher (73.5%)
compared to the commercial PS-DVB resin (56.6%).
The result indicate that the synthesized PS-DVB resin have slightly higher
BET surface area; average pore volume and average pore diameter compared than
the commercial PS-DVB resin. In general, the modified PS-DVB resins were
mesoporous. Therefore, it could be concluded that the modification of synthesized
PS-DVB resin with zirconyl chloride did significantly affect the surface properties of
the sample.
87
The GC-FID chromatogram shows that the earliest retention time of 2.7 min
was referred to methanol, followed by 2-chlorophenol, nitrobenzene, propiophenone
and lastly, butyrophenone, with the retention time at 4.2 min, 5.1 min, 6.2 min and
7.7 min, respectively. The GC-FID analysis was repeated three times for each sample
to determine the average of peak area reproducibility of the analysis. The results
show the peak areas and response factors for 2-chlorophenol, nitrobenzene,
propiophenone and butyrophenone are 3.5 × 10⁻², 3.5 × 10⁻², 4.9 × 10⁻²and 5.2 × 10⁻²,
respectively.
Three types of organic elution solvent are used which are methanol,
acetonitrile and ethyl acetate in order to observe the influence of elution towards the
recovery percentage for each test compound. It was also found that methanol is a
good eluting solvent to elute polar analytes retained in p-ethanoyl-PS-DVB sorbent.
It is because methanol consists –OH groups, which can increase the solubility of
analytes during the elution step, therefore giving higher recoveries compare to
extraction using other adsorbents.
The result shows that p-ethanoyl-PS-DVB gives a high recovery percentage
for nitrobenzene, 2-chlorophenol and propiophenone compared to other resins. This
may be caused by the presence of carbonyl groups in the acetyl resin and that can
elevate the adsorption rate during the extraction process. However, the position of
the carbonyl group in the resin structure also gives a slight influence to the
adsorption rate. This can be proven by the ability of the p-2-propanoyl-PS-DVB to
adsorb 30% less of test compound compared to the p-ethanoyl-PS-DVB. The
position of the carbonyl groups which are directly bonded to the PS-DVB aromatic
rings is expected to have the ability to elevate the adsorption of the analytes.
88
5.2 Suggestions for Further Study
SPE with chemically modified sorbents has been carried out in the off-line
and on-line modes by León-González and Pérez-Arribas (2000). In this research,
SPE was carried out in the off-line mode. So, further studies could be conducted to
carry out SPE with modified and unmodified PS-DVB sorbents in the on-line mode.
On-line procedures use an extraction sorbent in a pre-column. The methods, which
combine SPE with HPLC, are the most frequently used, mainly to determine polar
compounds in water. In the on-line procedures, there is no sample manipulation
between preconcentration and analysis, so loss and contamination risks are avoided,
and detection limits and reproducibility values may be better.
In this work, the performances of the modified and unmodified PS-DVB
sorbents in home made SPE column were determined and compared. Further studies
could be conducted for the analysis of breakthrough curves to determine the
efficiency of these adsorbents. As described previously, the breakthrough volume or
retention volume for a particular analyte is a good indication of the extraction ability
of the adsorbents (Dumont and Fritz, 1995). It corresponds to the aqueous sample
volume that can be percolated though the SPE column without any loss of the
analyte. It also means that the whole amount of analyte percolated is trapped by the
sorbent.
89
REFERENCES
Aiken, B., Hsu, W. P. and Matijevie, E. (1990). Preparation and properties of
uniform mixed and coated colloidal particles. J. Mater. Sci. 25: 1886-1894.
Allcock, H. R., Lampe, F. W. and Mark, J. E. (2003). Contemporary Polymer
Chemistry. 3rd Edition. Pearson Prentice Hall: New Jersy. 61-72.
Bacquet, M., Salunkhe, M., and Caze, C. (1992). Influence of chlorosulfonation on
textural chemical parameters of styrene-divinylbenzene porous copolymers.
Reactive Polym. 16: 61-69.
Baiulescu, G. E. and Ilie, V. A. (1975). Stationary Phases in Gas Chromatography.
Hungary: Pergamon Press. 113-116, 295.
Blumenthal, B. H. (1958). The chemical behavior of zirconium. Van Norstad: New
York. 36-41.
Buchmeiser M. R. (2001). New synthetic ways for the preparation of high-
performance liquid chromatography supports. J. Chromatogr. A. 918: 233-236.
Camel, V. (2003). Solid phase extraction of trace elements. Review. Spectrochimica
Acta Part B. 58: 1177-1233.
Chambers, T. K. and Fritz, J. S. (1998). Effect of polystyrene-divinyl benzene resin
sulfonation on solute retention in high-performance liquid chromatography. J.
Chromatogr. A. 797: 139-147.
90
Clark, R. H. J. (1975). The Chemistry of Titanium, Zirconium & Hafnium. Great
Britain: Pergamon Press, 419-420.
Conder, J. R. and Young, C. L. (1979). Physicochemical Measurement by Gas
Chromatography. 1st ed. Great Britain: John Willey & Sons Ltd. 6. 79-93.
Coutinho, F. M. B., Souza, R. R. and Gomes, A. S. (2004). Synthesis,
characterization and evaluation of sulfonic resins as catalysts. Eur. Polym. J. 40:
1525-1532.
Dumont, P. J. and Fritz, J. S. (1995). Effect of Resin Sulfonation on the Retention of
Polar Organic Compounds in Solid-Phase Extraction. J. Chromatogr. A. 691:
123-131.
Durst, H. D. and Gokel, G. W. (1980). Experimental Organic Chemistry. McGraw-
Hill Book Company: New York. 50-59.
Dyson, R. W. (1987). Specialty Polymers. Blackie & Son, London. 21-23.
Edward, D. I. (1970). Chromatography: Principles and Techniques. London:
Butterworth & Co. (Pubishers) Ltd. 1-2.
Ensing, K., Berggren, C. and Majors, R. E. (2002). Selective sorbents for SPE based
on molecularly imprinted polymers. LC-GC Europe. Sample preparation
perspectives. 2-8.
Fontanals, N., Galià M., Marce R. M. and Borrull F. (2004). Solid-phase extraction
of polar compounds with a hydrophilic copolymeric sorbent. J. Chromatogr. A.
1030: 63-68.
Fritz, J. S., Dumont, P. J. And Schmidt, L. W. (1995). Methods and materials for
solid-phase extraction. J. Chromatogr. A. 691: 133-140.
91
Gauthier, M. A., Luo, J., Calvet, D., Ni, C., Zhu, X. X., Garon, M. and Buschmann,
M. D. (2004). Degree of crosslinking and mechanical properties of crosslinked
poly(vinyl alcohol) beads for use in solid-phase organic synthesis. Polym. 45:
8201-8210.
Glajeh, J. J., Kirkland, J. J. and Kohler, J. (1987). Effect of column degradation on
the RP high performance liquid chromatographic separation of peptides and
proteins. J. Chromatogr. 384: 81.
Green, C. E. and Abraham, M. H. (2000). Investigation into the effects of
temperature and stirring rate on the solid-phase extraction of diuron from water
using a C18 extraction disk. J. Chromatogr. A. 885: 41-49.
Gregg, S. J. and Sing, K. S. W. (1982). Adsorption, surface area and porosity. 2nd ed.
London: Academic Press. 1 – 39.
Gurdeep, R. C. (1974). Adsorption and phase rule. 2nd ed. Subhash Bazar: Goel
Publishing House. 1 – 14, 43 – 49.
Hennion, M. (1999). Solid phase extraction: method development, sorbents and
coupling with liquid chromatography. Review. J. Chromatogr. A. 856: 3-54.
Hennion, M. (2000). Graphitized carbons for solid-phase extraction. Review. J.
Chromatogr. A. 885: 73-95.
Hosoya, K., Kishii, Y., Kimata, K., Araki, T., Tanaka, N., Svec, F. and Fréchet, J. M.
J. (1995). Uniform-size hydrophobic polymer-based separation media selectively
modified with a hydrophilic external polymeric layer. J. Chromatogr. A. 690: 21-
28.
Howdle, S. M., Jerábek, Leocorbo, V., Marr, P.C. and Sherrington, D.C. (2000).
Reversibly collapsible macroporous poly(styrene-divinyl benzene) resins.
Polymer Communication. 41: 7273-7277.
92
Hu, Y. L., Feng, Y. Q., Wan, J. D. and Da, S. L. (2001). Native and Stearic Acid
Modified Ceria-Zirconia Supports in Normal and Reversed-Phase HPLC.
Talanta. 54: 79-88.
Huang, Z. and Tang, F. (2004). Preparation, structure, and magnetic properties of
polystyrene coated by Fe3O4 nanoparticles. J. Colloid Interface Science. 275:
142-147.
Huck, C. W. and Bonn, G. K. (2000). Recent developments in polymer-based
sorbents for solid-phase extraction. Review. J. Chromatogr. A. 885: 51-72.
Hussain, A. (1984). Thermal and surface studies of the decomposition of the various
zirconium compounds. PhD Thesis. 64, 49-57.
Klingenberg, A. and Seubert, A. (2002). Sulfoacylated poly(styrene-divinyl benzene)
copolymers as resins for cation chromatography: comparison with sulfonated,
dynamically coated and silica gel cation exchangers. J. Chromatogr. A. 946: 91-
97.
Knox, J. H., Unger, K. K. and Mueller, H. (1983). Prospects for Carbon as Packing
Material in High Performance Liquid Chromatography. J. Liq Chromatogr. 6
(Suppl.) 1: 1-36.
Legido-Quigley, C. and Smith, N. W. (2004a). Study of short polystyrene monolith-
fritted micro-liquid chromatography columns for analysis of neutral and basic
compounds. J. Chromatogr. A. 1042: 61-68.
Legido-Quigley, C., Marlin, N. and Smith, N. W. (2004b). Comparison of styrene-
divinylbenzene-based monoliths and Vydac nano-liquid chromatography
columns for protein analysis. J. Chromatogr. A. 1030: 195-200.
León-González, M. E. and Pérez-Arribas, L. V. (2000). Chemically modified
polymeric sorbents for sample preconcentration. J. Chromatogr. A. 902: 3-16.
93
Li, J., Litwinson, L. M. and Cantwell, F. F., (1996). Intra-particle sorption rate and
liquid chromatographic bandbroadening in porous polymer packings II. Slow
sorption rate on a microparticle packing. J. Chromatogr. A. 726: 25-36.
Li, J., Reeder, D. H., McCormick, A. V. and Carr, P. W. (1997). Factors influencing
polybutadiene deposition within porous chromatographic zirconia. J. Chromatog.
A. 791: 45-52.
Liska, I. (2000). Fifty years of SPE in water analysis-historical development and
overview. Review. J. Chromatogr. A. 885: 3-16.
Liu, Y. and Pietrzyk, D. J. (2001). Capillary-electrochromatographic separations with
copolymeric reversed-stationary phase and ion-exchanger-packed columns. J.
Chromatogr. A. 920: 367-375.
Mahdavian, A. R. and Khoee, S. (2002). A facile and efficient method for
preparation of chiral supported poly(styrene-divinyl benzene) copolymers.
Reactive & Func. Polym. 50: 217-223.
Malik, M. A., Ahmed, M. and Ikram, M. (2004). A new method to estimate pore
volume of porous styrene-divinyl benzene copolymers. Polym. Testing. 23: 835-
838.
Marce, R. M. and Borrull, F. (2000). Solid-phase extraction of polycyclic aromatic
compounds. Review. J. Chromatogr. A. 885: 273-290.
Maria, L. C. S., Aguiar, M. R. M. P., Guimaraes, P. I. C., Amorim, M. C. V., Costa,
M. A. S., Almeida, R. S. M., Aguiar, A. P. and Oliveira, A. J. B. (2003a).
Synthesis of crosslinked resin based on methacylamide, styrene and divinyl
benzene obtained from polymerization in aqueous suspension. Eur. Polym. J. 39:
291-296.
94
Maria, L. C. S., Leite, M. C. A. M., Costa, M. A.S., Ribeiro, J. M. S., Senna, L. F.
and Silva, M. R. (2003b). Preparation of composite materials containing iron in a
cross-linked resin host based on styrene and divinyl benzene. Eur. Polym. J. 39:
843-846.
Martin, C., Ramirez, L. and Cuellar, J. (2003). Stainless steel microbeads coated with
sulfonated polystyrene-co-divinyl benzene. Surface & Coatings Technology, 165:
58-64.
Masqué, N., Galiá, M., Marcé, R. M. and Borrull, F. (1998). New chemically
modified polymeric resin for solid-phase extraction of pesticides and phenolic
compounds from water. J. Chromatogr. A. 803: 147-155.
Matyjaszewski, K. and Davis, T. P. (1998). Handbook of Radical Polymerization.
Wiley-Interscience. John Wiley & Sons, Inc. USA. 1-3, 302: 854-855.
McNeff, C., Zigan, L., Johnson, K., Carr, P. W., Wang, A. and Weber-Main, A. M.
(2000). Analytical advantages of highly stable stationary phases for reversed-
phase LC, LC-GC, Vol 18: 5, 514-529.
Melo, L. F. C., Collins, C. H. and Jardim, I. C. S. F. (2004). New materials for solid-
phase extraction and multiclass high-performance liquid chromatographic
analysis of pesticides in grapes. J. Chromatogr. A. 1032: 51-58.
Nash, D. C. and Chase, H. A. (1998). Comparison of diffusion and diffusion-
convection matrices for use in ion-exchange separations of proteins. J.
Chromatogr. A. 807: 185-207.
Nawrocki, J. Rigney, M. P., McCromick, A. and Carr, P. W. (1993). Chemistry of
zirconia and its use in chromatography. J. Chromatogr. A. 657: 229-282.
Nilsson, U. J. (2000). Solid-phase extraction for combinatorial libraries. Review. J.
Chromatogr. A. 885: 305-319.
95
Ohta, K., Ohashi, M., Jin, J. Y., Takeuchi, T., Fujimoto, C., Choi, S. H., Ryoo, J. J.
and Lee, K. P. (2004). Retention behavior of C1-C6 aliphatic monoamines on
anion-exchange and polymethacrylate resins with heptylamine as eluent. J.
Chromatogr. A. 1039: 179-186.
Olah, G. A. (1973). Friedel-Crafts Chemistry. John Wiley & Sons: New York-
London-Sydney-Toronto. 1-30, 91-95.
Pico, Y., Font, G., Molto, J. C. and Manes, J. (2000). Solid-phase extraction of
quaternary ammonium herbicides. Review. J. Chromatogr. A. 885: 251-271.
Rigney, M. P., Funkenbush, E. F. and Carr, P. W. (1990). Physical and chemical
characterization of microporous zirconia. J. Chromatogr. A. 499: 291-304.
Rigney, M. P., Weber, T. P. and Carr, P. W. (1989). Preparation and Evaluation of a
Polymer Coated Zirconia RP-Chromatographic Support. J. Chromatogr. 484:
273.
Rodriguez, I., Llompart, M. P. and Cela, R., (2000). Solid-phase extraction of
phenols.Review. J. Chromatogr. A. 885: 291-304.
Sabik, H., Jeannot, R. and Rondeau, B. (2000). Multiresidue methods using solid-
phase extraction techniques for monitoring priority pesticides, including triazines
and degradation products, in ground and surface waters. Review. J. Chromatogr.
A. 885: 217-236.
Safarikova, M. and Safarik, I. (2002). Magnetic SPE of target analytes from large
volumes of urine. Eur cells and materials. Vol. 3, Suppl. 2: 192-195.
Sandler, S. R. and Karo, W. (1974). Polymer Syntheses. Volume 1. Academic Press:
New York and London. 3-17, 9-10.
Schmidt, L., Sun, J. J. and Fritz, S. (1993). Solid-phase extraction of phenols using
membranes loaded with modified polymeric resins. J. Chromatogr. 641: 57-61.
96
Settle, F. A. (1997). Handbook of Intrumental Techniques for Analytical Chemistry.
Prentice Hall PTR: Upper Saddle River, New Jersey. 35-40.
Shalliker, R. A., Douglas, G. K., Comino, P. R. and Kavanagh, P. E. (1997).
Examination of various pore size zirconias for potential chromatographic
applications. Powder Technology. 91: 17-23.
Sun, J. J. and Fritz, J. S. (1990). Chemically modified polymeric resins for high-
performance liquid chromatography. J. Chromatogr. 522: 95-105.
Sun, J. J. and Fritz, J. S. (1992). Chemically modified resins for solid-phase
extraction. J. Chromatogr. 590: 197-202.
Tuncel, A., Kahraman, R. and Piskin, E. (1993). Monosize polystyrene microbeads
by dispersion polymerization. J. Applied Polymer Science. 50: 303-319.
Vendula, R. R. and Spencer, H. G. (1991). Adsorption of polyacrylic acid on titania
anatase and zirconia colloids. Colloids Surf. 58: 99-111.
Vogelsang, U. B., Deege, A., Figge, H., Kohler, J. and Schomburg, G. (1984).
Analytical Advantages of Highly Stable Stationary Phases for Reversed-Phase
LC. Chromatographia. 19: 170.
Weber, T. P. and Carr, P. W. (1990). Comparison of Isomer Separation on Carbon-
Clad Microporous Zirconia and on Conventional Reversed-Phase High-
Performance Liquid Chromatography Supports. Anal Chem. 62: 2620-2625.
Wehrli, A., Hildenbrand, J. C., Keller, H. P., Frei, R. W. and Stampeli, R. (1978).
Influence of organic bases on the stability and separation properties of reversed
phase chemically bonded silica. J. Chromatogr. 149: 199.
Yang, Y. B., Harrison, K. and Kindsvater, J., (1996). Characterization of a novel
stationary phase derived from a hydrophilic polystyrene-based resin or protein. J.
Chromatogr. A. 723: 1-10.

97
Yu, J. C., Jiang, Z. T., Liu, H. Y., Yu, J. and Zhang, L. (2003). β-Cyclodextrin
epichlorohydrin copolymer as a solid-phase extraction adsorbent for aromatic
compounds in water samples. Analytica Chimica Acta. 477: 93-101.
99
LIST OF PUBLICATIONS
Parts of the work have been presented in the following scientific meetings and/or papers: 1. Norsyariza Abd Aziz, Ahmedy Abu Naim, M. Marsin Sanagi, Wan Aini Wan
Ibrahim, Asiah Hussain, “Synthesis and Characterization of Nano Size Poly(Styrene-
Divinyl Benzene) using Dispersion Copolymerization”, Paper persented at Simposium
Kimia Analisis Malaysia Ke-18 (SKAM-18) 12-14 September 2005, Hyatt Regency
Hotel, Johor Bahru, Johor.
2. Mohd Marsin Sanagi*, Sri Hilma Siregar, Ahmedy Abu Naim, Asiah Hussain and
Shiv Prasad a/l Sandera Bahador, “Solid Phase Extraction of Organophosphorous
Pesticides using Poly(styrene-divinylbenzene)-based Adsorbents” Paper presented at
the Annual Fundamental Science Seminar 2005 (AFSS 2005), 4-5 July 2005, Institut
Ibnu Sina, Universiti Teknologi Malaysia, 81310 Skudai, Johor, Malaysia.
3. Mohd Marsin Sanagi, Mohd Sani Sarjadi, Ahmedy Abu Naim and Asiah Hussain,
“Preparation and Characterization of Acetyl-modified Polystyrene-divinyl benzene)
Adsorbents for Solid Phase Extraction”, Paper presented at the Annual Fundamental
Science Seminar 2005 (AFSS 2005), 4-5 July 2005, Institut Ibnu Sina, Universiti
Teknologi Malaysia, 81310 Skudai, Johor, Malaysia.
4. Mohd Marsin Sanagi*, Mohd Sani Sarjadi, Ahmedy Abu Naim and Asiah Hussain,
“Preparation and Characterization of 2-Zirconyl-2-Methylethane-Poly(Styrene-
Divinyl Benzene) Chloride Adsorbents”, Paper presented at the Annual Fundamental
Science Seminar 2005 (AFSS 2005), 4-5 July 2005, Institut Ibnu Sina, Universiti
Teknologi Malaysia, 81310 Skudai, Johor, Malaysia.
5. Sri Hilma Siregar, Mohd Marsin Sanagi, Ahmedy Abu Naim, Asiah Hussain, and
Tham Ee Mun, “Stearoyl Chloride-modification of poly(styrene-divinylbenzene)
adsorbent for Solid Phase Extraction”, Paper presented at the 17th Malaysian
Symposium on Analytical Chemistry, 24-26 August 2004, Swiss-Garden Resort,
Pantai Balok, Kuantan, Pahang.
100
6. Mohd Sani Sarjadi, Mohd Marsin Sanagi, Ahmedy Abu Naim and Asiah Hussain,
“Preparation and characterization of acetyl-modified poly(styrene-divinylbenzene) as
adsorbent for solid phase extraction”, Paper presented at the 17th Malaysian
Symposium on Analytical Chemistry, 24-26 August 2004, Swiss-Garden Resort,
Pantai Balok, Kuantan, Pahang. (Submitted for publication in Malaysian Journal of
Analytical Sciences)
7. Mohd Marsin Sanagi, Ahmedy Abu Naim, Asiah Hussain, Sri Hilma Siregar and
Mohd Sani Sarjadi, “Development of Poly(Vinyl alcohol)-modified Poly(styrene-
divinylbenzene) Adsorbents”, Paper presented at the Annual Fundamental Science
Seminar, Puteri Pan Pacific Hotel, Johor Bahru, 20-21 May 2003.
8. Mohd Marsin Sanagi, Ahmedy Abu Naim, Asiah Hussain, Sri Hilma Siregar and
Mohd Sani Sarjadi, “ Synthesis of Poly(styrene-divinylbenzene) Adsorbents: Effects
of Type of Stirrer, Time of reaction, Surfactants and Stabilizers”, Paper presented at
the Annual Fundamental Science Seminar, Puteri Pan Pacific Hotel, Johor Bahru, 20-
21 May 2003.


![MEMBRANES FOR FLUE GAS TREATMENT DISSERTATION · Poly styrene PS 970 388 [3, 6] Sulfonated poly ether sulfone ... Sulfonated poly ether ether ketone (S-PEEK) can be obtained by sulfonation](https://img.pdfslide.us/doc/110x75/6121e88d85512935481dfaa9/membranes-for-flue-gas-treatment-dissertation-poly-styrene-ps-970-388-3-6-sulfonated.jpg)