Embed Size (px)
Citation preview

lable at ScienceDirect
Environmental Modelling & Software 63 (2015) 61e72
Contents lists avai
Environmental Modelling & Software
journal homepage: www.elsevier .com/locate/envsoft
Development and application of a geospatial wildfire exposureand risk calculation tool
Matthew P. Thompson a, *, Jessica R. Haas a, Julie W. Gilbertson-Day a, Joe H. Scott b,Paul Langowski c, 1, Elise Bowne c, David E. Calkin a
a Rocky Mountain Research Station, US Forest Service, MT, USAb Pyrologix, LLC, Missoula, MT, USAc Rocky Mountain Region, US Forest Service, CO, USA
a r t i c l e i n f o
Article history:Received 10 June 2014Received in revised form15 September 2014Accepted 22 September 2014Available online 10 October 2014
Keywords:Decision supportExposure analysisEffects analysisGISRisk assessmentWildfire
* Corresponding author.E-mail address: [email protected] (M.P. Th
1 Retired.
http://dx.doi.org/10.1016/j.envsoft.2014.09.0181364-8152/Published by Elsevier Ltd.
a b s t r a c t
Applying wildfire risk assessment models can inform investments in loss mitigation and landscaperestoration, and can be used to monitor spatiotemporal trends in risk. Assessing wildfire risk entails theintegration of fire modeling outputs, maps of highly valued resources and assets (HVRAs), character-ization of fire effects, and articulation of relative importance across HVRAs. Quantifying and geo-processing wildfire risk can be a complex and time-intensive task, often requiring expertise in geo-spatial analysis. Researchers and land managers alike would benefit from a standardized and streamlinedability to estimate wildfire risk. In this paper we present the development and application of a geospatialwildfire risk calculation tool, FireNVC. We describe the major components of the tool and how they alignwith a geospatial wildfire risk assessment framework, detail a recent application of the tool to informfederal wildfire management and planning, and offer suggestions for future improvements and uses ofthe tool.
Published by Elsevier Ltd.
1. Introduction
Wildfires, though under many circumstances desirable from anecological perspective, can threaten human lives and property,degrade air and water quality, and damage natural and culturalresources. Prospectively assessing wildfire risk can help landmanagers better understand where fires are more likely to occurand with what impacts to highly valued resources and assets(HVRAs). Fundamentally assessing wildfire risk is built uponmodeling the likelihood and intensity of wildfire interactions withHVRAs, as well as the magnitude of potential HVRA response to fire,which can be positive or negative (Finney, 2005; Miller and Ager,2013; Scott et al., 2013). This information is useful for informinginvestments in loss mitigation and landscape restoration, inparticular for pre-fire decisions relating to reduction of hazardousfuels and location-allocation of suppression resources. Assessmentresults can also be used to monitor trends in risk across space andtime.
ompson).
Assessing wildfire risk in a quantitative, spatial framework isessential for landscape planning (Thompson and Calkin, 2011). Aquantitative framework for wildfire risk is consistent with actuarialprinciples and standard economic notions of risk, and further en-ables cost-effectiveness analysis as a basis for evaluating riskmitigation options. A spatial framework recognizes that wildfire is aspatial process with significant spatial variation in environmentalfactors driving wildfire likelihood and intensity, as well as resourceand asset vulnerability.
Quantitative, spatial wildfire risk assessment frameworks areincreasingly being applied, with growing sophistication, to informwildfire management in the U.S. and elsewhere (Fiorucci et al.,2008; Bar Massada et al., 2009, Atkinson et al., 2010; Chuviecoet al., 2010; Thompson et al., 2011; Rom�an et al., 2012). Applica-tions vary, although many share the premise of coupling spatialinformation on fire likelihood with resource or asset vulnerability,and integrate multiple disciplinary perspectives including fire andfuels modeling, fire ecology, and resource economics. In particularthe use of advanced spatial burn probability modeling techniquesis gaining popularity (Carmel et al., 2009; Scott et al., 2012a;Parisien et al., 2013). The basic framework for exposure and riskassessment is flexible and scalable, applicable at national

M.P. Thompson et al. / Environmental Modelling & Software 63 (2015) 61e7262
(Thompson et al., 2011), regional (Ager et al., 2013), landscape(Thompson et al., 2013a), and project-level (Ager et al., 2010)planning scales.
In recent years the application of risk analysis and use of risk-based decision support tools has greatly expanded for federalwildfire management in the United States (Miller and Ager, 2013).A particularly salient example is the Wildland Fire DecisionSupport System, which provides functionality for burn probabil-ity modeling and exposure analysis to support risk-informedincident decision making (Calkin et al., 2011a). There is greatopportunity to expand efforts beyond the incident decisionsupport realm to provide risk-based information for hazardousfuels and preparedness decisions. Along those lines, in recentyears the list of “early adopters” has continued to grow, with risk-based assessments performed on federally managed landsthroughout the western United States including the Beaverhead-Deerlodge National Forest, the Black Hills National Forest, theBridger-Teton National Forest, the Deschutes National Forest, theInyo National Forest, the Lewis and Clark National Forest, thePike-San Isabel National Forest and the Cimarron and ComancheNational Grasslands, the Sequoia National Forest, the Sierra Na-tional Forest, the Stanislaus National Forest, and the Grand TetonNational Park.
In performing these geospatial risk assessments a number ofsignificant process limitations became apparent. One key lessonlearned from our experience is the need for a standardized andstreamlined geospatial risk calculation tool. A potential bottleneckof calculating integrated risk scores is the large number of geo-processing steps required, in particular the intersections of firemodeling outputs with HVRA maps and calculations of HVRA re-sponses to fire. In practice these steps are repeated many timesdependent on the total number of HVRAs, and are therefore quitetime intensive and introduce the potential for human error. Thecomputational time required for a landscape-level assessment us-ing standard GIS software packages can take days to complete,making it difficult to use assessment results in a real-time work-shop setting, or to quickly regenerate results if changes arewarranted.
In order to address the limitations associated with the process,we developed a software toolbox, FireNVC, designed to performrisk calculations in a computationally efficient timeframe suitablefor rapid analysis. We created FireNVC to provide a flexible researchtool capable of landscape-scale exposure and risk assessment, andultimately to provide decision support for landmanagers seeking tomitigate wildfire risk. Here we discuss the development of theFireNVC toolbox as well as the subsequent improvements incomputational efficiency. As a demonstration of the tool's utility wedetail a recent application of FireNVC for the U.S. Forest Service'sRocky Mountain Region.
In the subsequent sections we first describe in more detail theframework for wildfire risk assessment, as well as a geospatialmodeling process to implement the framework. We then describethe development of the FireNVC tool itself, and next illustrate itsapplication for the Rocky Mountain Region. Lastly we discussstrengths and limitations of both the framework and tool, and offerrecommended directions for future work.
2. A wildfire risk assessment framework
A generalized framework for wildfire risk assessment entailsfour primary stages: problem formulation, exposure analysis, ef-fects analysis, and risk characterization (Fairbrother and Turnley,2005; Thompson and Calkin, 2011). In practice the processrequired to implement this framework entails multiple steps, and isbased on an integrated, interdisciplinary perspective (Scott et al.,
2013). In the sub-sections that follow we briefly review the wild-fire risk assessment framework and process, informed by our ex-periences performing this process multiple times at varyingplanning scales.
2.1. Problem formulation
It is critical to begin by articulating the objectives of theassessment, the spatiotemporal scope of analysis, and the assess-ment endpoints. Assessment objectives relate to how assessmentresults are to be used and will fit into broader structured decisionprocesses for wildfire management, ranging from project-level fueltreatment planning to strategic prioritization and budgeting. Acritical step is the identification, characterization, and mapping ofHVRAs that are likely to be impacted by fire and that are salient towildfire management goals.
2.2. Exposure analysis
Exposure analysis explores the degree towhich HVRAs are likelyto interact with wildfire, and entails the coupling of fire modelingoutputs with HVRA maps. Intersecting fire modeling outputs withrasterized HVRA maps allows for a fine-scale quantification of thelikelihood of any given HVRA pixel burning, and further providescritical information in terms of the intensity with which fire willburn at that location. Pixel-based exposure can thus be quantifiedin terms of multiple metrics including expected HVRA area burned,expected HVRA area burned by flame length category, mean burnprobability, mean fireline intensity, and conditional flame length(Salis et al., 2012).
2.3. Effects analysis
Effects analysis explores the potential consequences of varyinglevels of HVRA exposure, as a function of fire behavior e typicallyflame length e as well as other environmental characteristics thatcould influence HVRA susceptibility. There are at least two keyreasons for contemplating fire effects. First, because wildfire canresult in both negative and positive consequences, effects analysiscan lead to the identification of areas on the landscape whereresource protection or ecological restoration objectives are mostappropriate. Second, fire effects are not necessarily directly pro-portional to probability and intensity, and thus areas of highestexpected loss (or benefit) may not coincide with the areas ofhighest exposure; see Thompson et al. (2013a) for an illustration ofthis point.
In the framework described here, fire effects are quantified interms of net value change (NVC), thereby explicitly recognizing thepotential for both beneficial and detrimental effects. HVRA-specifictabular “response functions” determine NVC as a function of flamelength, where NVC is expressed in relative terms as percentage lossor gain (e.g., complete loss ¼ �100%). The response functionapproach provides a flexible, yet consistent, platform for evaluatingpotential fire effects across HVRAs. Multivariate response functiondefinitions can be readily incorporated, for instance differentiatinglikely post-fire watershed response according to erosion potential.Geospatial calculations combining burn probabilities with responsefunctions result in an HVRA-specific estimate of expected NVC, orE(NVC).
2.4. Risk characterization
Characterizing wildfire risk is the process of synthesizing resultsof the prior analyses to provide information useful for decisionmaking. Identifying the risk attitude of the decisionmaker and how

M.P. Thompson et al. / Environmental Modelling & Software 63 (2015) 61e72 63
to balance non-commensurate risks to various HVRAs are two keyquestions. With respect to the former, a risk neutral approach istypically taken as the approach that can best maximize socialwelfare. In terms of the latter, an ideal assessment could monetizeall HVRAs and their corresponding value changes from fire; how-ever the applicability of such an approach across all possible HVRAsin all possible locations is limited, especially when considering therange of environmental goods and services stemming from eco-systems. Instead, fire managers articulate relative importanceweights based upon existing wildfire management priorities andother relevant policies.
Using these HVRA-specific relative importance weights leads toa weighted E(NVC), or E(wNVC) score. This approach provides foran integrated, composite measure of risk useful for comparing risksand analyzing tradeoffs with a common metric. Further, impor-tance weights can be apportioned according to the relative arealextent of each HVRA. This serves to distribute importance weightsacross HVRAs with a large mapped area and to concentrateimportance for geographically rare HVRAs, and can help alleviatediscrepancies in different HVRA spatial mapping techniques. Rela-tive importance weights as articulated by fire managers relate tolandscape priorities, although actual risk calculations apportionweights on a per-pixel basis (see x3.1).
2.5. Risk modeling considerations
Model-based evaluations of wildfire risk necessitate a numberof considerations to ensure results are credible and effective forsupporting decisions. Most importantly, the context must be clearlyframed so that the aim and scope of the modeling effort align withthat of the decision process (Marcot et al., 2012; Bennett et al.,2013). As described earlier, landscape planning and prioritizationefforts require information that is spatial and quantitative, somodel efforts must be designed to meet these requirements.Ensuring sufficiency of input data is important as well, in particularthat HVRA datasets are complete over the extent of the study areaand mapped using similar methods. Further, when introducing anew modeling tool, as we do here, it is imperative to demonstratethat the model has advantages over the prior art (see x3) and canprovide utility for environmental assessment (see x4) (Alexandrovet al., 2011).
Comprehensive, integratedwildfire risk assessment requires thesimultaneous consideration of three primary sources of uncer-tainty: (a) the inherent variability surrounding the occurrence,extent, and intensity of wildfires; (b) knowledge gaps regardingpotential fire-induced benefits and losses to HVRAs; and (c) deci-sion uncertainty regarding how to balance fire-related impactsacross market and non-market HVRAs (Thompson and Calkin,2011). Better understanding the type and magnitude of thesesources of uncertainty allows for an improved ability to systemat-ically address uncertainties in the assessment process, and toidentify best practice modeling procedures (Robson, 2014). Theprimary modeling and analytical steps we have used to implementthis framework are stochastic wildfire simulation, expert judgmentelicitation, and multi-criteria decision analysis. Respectively thesecomponents provide flame length probability distributions, expert-defined characterization of fire effects via tabular response func-tions, and articulation of relative importance across HVRAs withweights that range from 0 to 100 (see x3.1). Selection of thesespecific modeling approaches reflects best practice efforts thatspecifically target the type of information being generated alongwith corresponding uncertainties (Ananda and Herath, 2009;Kuhnert et al., 2010; Thompson and Calkin, 2011; Krueger et al.,2012).
3. FireNVC: a wildfire exposure and risk calculation tool
3.1. FireNVC risk calculations
This section describes the specific model formulation for thepixel-based calculations of wildfire risk within FireNVC, based uponthe framework introduced in the previous sections. Objectives fordevelopment of FireNVC include generating a flexible, streamlinedtool that can perform quantitative, geospatial risk calculationsacross large landscapes. Additionally, FireNVC can be used throughtime to monitor spatiotemporal trends in HVRA exposure and risk.Relative to earlier assessment processes and wildfire decisionsupport tools used by federal landmanagement agencies, FireNVC'sintegration of effects analysis with exposure analysis is a keyimprovement, enabling explicit quantification of the potentialconsequences of wildfire. Relative to earlier work implementingthis risk framework, the computational efficiencies and relativeease of use afforded by FireNVC greatly expand opportunities forapplication across potential users and planning contexts.
The actual generation of fire modeling outputs, geospatialmapping of HVRAs, definition of response functions, and articula-tion of relative importance weights are all processes external to thetool. Of course, it is only when these components are integratedthat actual risks can be quantified, mapped, and evaluated. FireNVCtakes in these inputs, geo-processes them, and produces tabularand geospatial exposure and risk outputs. The location of HVRAswith respect to wildfire activity, their susceptibility to wildfire, andtheir relative importance and extent are key factors drivingassessment results.
Prior to presenting the risk equations we introduce key modelnomenclature. Let:
i2I Elements in the set I of HVRAsj2J Elements in the set J of flame length categoriesk2K Elements in the set K of landscape pixelsBPjk Burn probability of flame length j on landscape pixel kRFijk Response function for HVRA i at flame length j on landscapepixel kRIi Relative importance weight for HVRA iREi Relative areal extent of HVRA iEðNVCiÞ Expected net value change for HVRA iEðwNVCÞ Weighted expected net value change integrating allHVRAs
EðNVCiÞ ¼X
j
X
k
BPjkRFijk (1)
EðwNVCÞ ¼X
i
EðNVCÞiRIi=REi (2)
Equation (1) provides the formula for calculating E(NVC), theindividual HVRA risk score, as a function of flame length burnprobabilities and HVRA-specific response functions, summarizedover all pixels in the assessment landscape. Equation (2) providesthe formula for calculating E(wNVC), the importance-weightedexpected net value change across all HVRAs on the assessmentlandscape. In the next section we review the development ofFireNVC to perform wildfire exposure and risk calculations in ageospatial environment.
3.2. FireNVC tool development & overview
FireNVC is a software tool which researchers and analysts withgeographic information system (GIS) expertise can use to quantify

M.P. Thompson et al. / Environmental Modelling & Software 63 (2015) 61e7264
wildfire risk to HVRAs using the framework outlined above. Weimplemented FireNVC within the ESRI ArcGIS Toolbox module, aGIS commonly used by land management agencies that will likelybe familiar to many end users. Seamlessly integrating FireNVC intothe ArcGIS environment minimizes the effort and time needed torun the tool.
We developed FireNVC using all open source software, specif-ically through the Python programming environment (PythonSoftware Foundation). Python is an object oriented programminglanguage which has been integrated into ArcGIS, and comes stan-dard with ArcGIS. In particular we relied heavily on Python's sci-entific computing packages, numpy and scipy, which rapidlyperform high level matrix and linear algebra computations. Theresulting Python scripts are easily integrated into ArcGIS throughthe ArcToolbox window. This GUI produces a familiar platform toprovide all necessary inputs to the FireNVC tool.
Fig. 1 displays the primary data inputs, scripted processes,stored data, and outputs of FireNVC. User inputs include firemodeling outputs, HVRA maps, HVRA response functions andrelative importance weights, and optional summary masks (dis-cussed below). The main functionality of the tool is based aroundthree modules (scripted processes) that: (1) import pixel-basedburn probability raster data layers, (2) import HVRA geospatiallayers, and (3) perform the NVC calculations (see x3.1).
The first two modules are preprocessing steps which are usedfor increased numerical efficiency in module three. Specifically,raster data are stored as numpy arrays, providing for efficiencygains through the use of linear algebra calculations to derive riskscores. The current version of FireNVC is coded to accept text filesoutput from the FSim (Finney et al., 2011) or FlamMap v5 (Finney,2006) fire modeling systems (see x4 for an example), as well asgeneric burn probabilities with or without conditional flame
Fig. 1. Workflow diagram for the FireNVC tool with the primary i
length raster data. In the second module, user generated HVRAraster datasets are similarly read into numpy arrays, and if needbe, are projected, resampled and clipped to match the spatialreference, spatial extent, and resolution of the fire modeling in-puts. The third module performs the fire effects (net value change)calculations for all HVRAs. The tool outputs cumulative risk asraster data and summary tables containing risk scores and ex-pected area burned by flame length class (i.e., exposure metrics).The option to output individual HVRA risk scores as well as cu-mulative risk scores across all HVRAs is provided. Further, theoption to summarize exposure and risk calculations according to auser-defined mask, or zone, allows users to geographically delin-eate and quantify risks, for instance, by watershed, forest, orownership boundaries, or within areas identified as suitable formitigation activities.
The implementation environment and computational effi-ciencies afforded by the FireNVC tool readily allow for real-time useand experimentation. The exposure and risk calculations occurwithin an acceptable time frame, typically minutes in our experi-ence, although this will vary with computer specifications, land-scape size, the quantity of HVRAs, and the number of responsefunction variants. Two strengths of FireNVC are, therefore, greatlyenhanced opportunities for both sensitivity and scenario analysis.With respect to the former, users can adjust the response functionsor relative importance values, and then rapidly re-run the tool tosee impacts to final risk results. With respect to the latter, users caninput different burn probability raster data to examine alternativefuel treatment strategies or other fire management scenarios. Userscan also import alternative HVRA raster data, to expand or limit theamount of HVRAs included in the assessment. Further, importingalternative HVRA raster data could be used to examine how riskschange with future land use changes, such as expansion of
nputs, scripted processes, stored data, and outputs displayed.

M.P. Thompson et al. / Environmental Modelling & Software 63 (2015) 61e72 65
residential development or construction of new energy or tele-communication infrastructure.
4. Application of FireNVC
4.1. Risk assessment and mitigation planning in the RockyMountain Region
Here we review a recent application of FireNVC for wildfireexposure and risk analysis on National Forest System lands in theU.S. Forest Service's Rocky Mountain Region. The Rocky MountainRegion includes National Forest and Grasslands (NFG) in Colorado,Kansas, Nebraska, South Dakota, and Wyoming (Fig. 2). Our casestudy stems from a collaborative effort with the Region inwhichwesummarized pixel-based wildfire exposure and risk assessmentresults at the NFG level. Notably, the Region used these results toinform budgetary allocation decisions relating to hazardous fuelsand suppression preparedness investments, on the scale of tens ofmillions of dollars.
Burn probabilities are highest in the northern and northeasternportions of the Region, which in part is influenced by a greaterproportion of grass and shrub fuel typeswith higher rates of spread,and which could also reflect geographic variation in suppressionresponse capacity for initial attack operations to prevent escapedlarge wildfires (Fig. 3). These burn probability outputs weregenerated at 270 m � 270 m pixel resolution, for all the FirePlanning Units spanning the Rocky Mountain Region (Karen Short,Research Ecologist, personal communication). Specifically we usedoutputs from the FSim fire modeling system (Finney et al., 2011),which simulates thousands of artificial fire seasons based on his-torical fire weather to account for the range of fire weather and fuel
Fig. 2. National forests and grasslands in the forest Service's Rocky Mountain Region (CO
moisture conditions driving wildfire occurrence and behavior. FSimdoes not model every single ignition, instead focusing on only thoserare fires that grow large and account for the vast majority of areaburned. Internally FSim combines models for fire occurrence,growth and behavior, and containment, typically for tens of thou-sands of large wildfires, over landscapes that can reach millions ofhectares. Calibration efforts focus on historical fire size and annualarea burned distributions, and analyses demonstrate a high degreeof agreement betweenmodeled and historical results (Mark Finney,Research Forester, personal communication). For additional vali-dation we presented maps of modeled large fire burn probabilityand historical large fire occurrence to regional experts, and similarspatial patterns in areas of high/low likelihood helped solidifyconfidence in the risk modeling process. Readers interested inadditional details on FSim model structure, calibration, and appli-cation are referred to (Scott et al., 2012a, 2012b; Thompson et al.,2013a, Thompson et al. 2013b).
Table 1 enumerates the HVRAs, sub-HVRAs, and relativeimportance scores identified by regional leadership, along with thetabular response functions as defined by the regional resourcespecialists. The Region ultimately identified a set of three HVRAs tobe included in the assessment (listed in order of importance): watersupply, the wildlandeurban interface (WUI), and infrastructure. Insome cases, HVRA information is broken down to capture differ-ences in relative importance (e.g., population density within thewildlandeurban interface), whereas others are broken down tocapture differences in both relative importance and responsefunctions (e.g., infrastructure).
Resource specialists identified two landscape variables influ-encing HVRA susceptibility to be included in response functiondefinitions: erosion potential category and bark beetle impacts. The
¼ Colorado; KS ¼ Kansas; NE ¼ Nebraska; SD ¼ South Dakota; WY ¼ Wyoming).
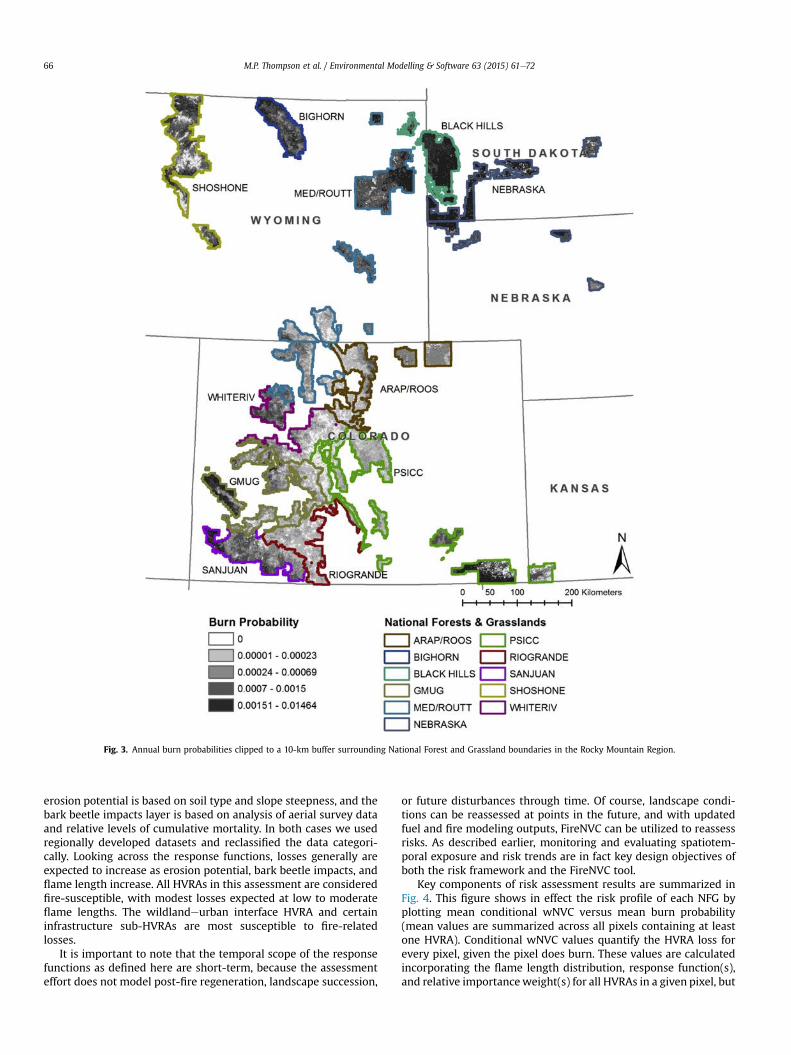
Fig. 3. Annual burn probabilities clipped to a 10-km buffer surrounding National Forest and Grassland boundaries in the Rocky Mountain Region.
M.P. Thompson et al. / Environmental Modelling & Software 63 (2015) 61e7266
erosion potential is based on soil type and slope steepness, and thebark beetle impacts layer is based on analysis of aerial survey dataand relative levels of cumulative mortality. In both cases we usedregionally developed datasets and reclassified the data categori-cally. Looking across the response functions, losses generally areexpected to increase as erosion potential, bark beetle impacts, andflame length increase. All HVRAs in this assessment are consideredfire-susceptible, with modest losses expected at low to moderateflame lengths. The wildlandeurban interface HVRA and certaininfrastructure sub-HVRAs are most susceptible to fire-relatedlosses.
It is important to note that the temporal scope of the responsefunctions as defined here are short-term, because the assessmenteffort does not model post-fire regeneration, landscape succession,
or future disturbances through time. Of course, landscape condi-tions can be reassessed at points in the future, and with updatedfuel and fire modeling outputs, FireNVC can be utilized to reassessrisks. As described earlier, monitoring and evaluating spatiotem-poral exposure and risk trends are in fact key design objectives ofboth the risk framework and the FireNVC tool.
Key components of risk assessment results are summarized inFig. 4. This figure shows in effect the risk profile of each NFG byplotting mean conditional wNVC versus mean burn probability(mean values are summarized across all pixels containing at leastone HVRA). Conditional wNVC values quantify the HVRA loss forevery pixel, given the pixel does burn. These values are calculatedincorporating the flame length distribution, response function(s),and relative importanceweight(s) for all HVRAs in a given pixel, but

Table 1Listing of HVRAs and sub-HVRAs, including HVRA Relative Importance (RI) weights, variables included in response functions, and tabular response function definitions. Notethat in some cases HVRA are broken down for the purposes of assigning different RI weights, for defining difference response functions, or both.
HVRA RI Sub-HVRA Sub-RI Variable 1 Variable 2 Variable 3
Erosion class Bark beetleimpacts
Flame length Category (ft)
0e2 2e4 4e6 6e8 8e12 12þWater Supply 100 Importance to drinking water High: 100
Moderate: 75none e low None e low 0 0 �10 �20 �30 �30
Mod 0 0 �10 �20 �30 �30High 0 �10 �20 �25 �30 �30
mod None e low 0 �10 �20 �30 �40 �50Mod 0 �10 �30 �40 �50 �60High �10 �20 �40 �60 �70 �80
high None e low 0 �20 �40 �60 �80 �80Mod �10 �30 �70 �80 �90 �90High �20 �40 �80 �90 �100 �100
WUI 80 Population density High: 100Moderate: 80Low: 60
e None e low �10 �20 �40 �80 �100 �100Mod �20 �40 �80 �100 �100 �100High �20 �40 �80 �100 �100 �100
Infrastructure 60 Transmission lines 100 e None e low 0 0 0 �30 �40 �50Mod 0 0 �30 �40 �50 �50High 0 0 �30 �40 �50 �50
Communication facilities 70 e None e low 0 0 0 �30 �40 �50Mod 0 0 �30 �40 �50 �50High 0 0 �30 �40 �50 �50
Ski areas 50 e None e low 0 �10 �10 �20 �50 �70Mod �10 �20 �30 �40 �60 �70High �20 �30 �40 �50 �70 �80
Campgrounds, trailheads, etc. 25 e None e low 0 �10 �10 �20 �50 �70Mod �10 �10 �10 �10 �10 �10High �10 �10 �10 �10 �10 �10
Rec. residences/admin. sites 25 e None e low �10 �20 �40 �80 �100 �100Mod �20 �40 �80 �100 �100 �100High �20 �40 �80 �100 �100 �100
M.P. Thompson et al. / Environmental Modelling & Software 63 (2015) 61e72 67
are exclusive of burn probability. The product of mean conditionalwNVC and mean burn probability yields the expected overall NFG-level weighted risk score, or E(wNVC) (see Fig. 5).
Fig. 4 also includes isolines of equal expected loss (E(wNVC))that can provide a reference for comparing how NFGs of similarexpected loss vary in terms of their underlying risk factors. Clearly,for some NFGs wildfire risk is driven more by burn probability,whereas for other NFGs the high potential for loss drives results.This differentiation can be critical not only for understanding thenature of wildfire risk, but additionally for identifying cost-effectivemitigation options. Fig. 5 further displays the E(wNVC) rasteroutput by FireNVC, illustrating spatial variation in expected lossesboth within and across NFGs in the Region. Similar to the differ-entiation of probability and consequences in Fig. 3, this spatialdifferentiation of areas of high and low risk can be very informativefor mitigation planning.
The efficiency of FireNVC greatly facilitated exploration andsensitivity analysis, particularly in three key areas. First, we wereable to incorporate a burn probability adjustment factor to accountfor the ease of suppressing grassland fires relative to timber fueltypes, consistent with how the Forest Service currently assesseswildfire potential for national-scale hazardous fuels prioritization(Jim Menakis, Fire Ecologist, personal communication). Second,regional leadership explored various relative importance scores forwater supply and WUI, as well as identifying which highly valuedwatersheds across the Region were to be included in the HVRA.Third, the Region was able to incorporate additional HVRA layers(wildlife habitat and timber resources) and we summarized NFGrisk scores inclusive and exclusive of these HVRAs (ultimately theseHVRAs were excluded from the final prioritization model).
The Rocky Mountain Region used risk assessment results as akey component informing their budgetary allocation decisionsacross NFGs. The Region tiered NFG risk scores and integrated theseresults along with additional information on total fire load and fire
management complexity indices in order to determine final allo-cations. These allocation decisions then led to investment levels forhazardous fuels and suppression preparedness in fiscal years 2013and 2014, with continued use of risk assessment results planned incoming fiscal years.
4.2. Sensitivity analysis of NFG risk rankings
To explore and evaluate the performance of FireNVC as a pri-oritization tool, we analyzed the sensitivity of NFG risk rankingsto changes in model inputs (see Equations (1) and (2)). Althoughregional leadership did explore various weighting schemes in theinitial prioritization efforts, here our aim is to much more sys-tematically explore the sensitivity of FireNVC results. To do so wevaried response functions and relative importance weights, inorder to explore changes in mean conditional weighted net valuechange (wNVC), and further varied mean burn probability, in or-der to explore changes in E(wNVC). For response functions weexplored 4 scenarios where each HVRA's conditional responsewas changed by ± 25% and 50%, in addition to the baseline sce-nario. For relative importance weights we explored three alter-native policies in addition to the baseline of 100/80/60 for WaterSupply/WUI/Infrastructure: 100/60/20 (a larger gradation acrossexisting priorities), 80/100/60 (Water Supply and WUI swap pri-orities), and 60/100/20 (Water Supply and WUI swap priorities,with a larger gradation across new priorities). For simplicity thissensitivity analysis did not consider variation in sub-HVRAweighting schemes. Collectively these changes led to 500 alter-native NFG rankings for mean conditional wNVC. For each ofthese 500 ranking scenarios, we further explored changes in firelikelihood, where each NFG's mean burn probability was changedby ± 25% and 50%, in addition to the baseline scenario. Thereforewe analyzed a total of 2500 alternative NFG rankings forE(wNVC).

Fig. 4. Scatterplot diagram of mean conditional weighted net value change (wNVC) scores (y-axis) and mean burn probability (x-axis), for all National Forests and Grasslands in theRocky Mountain Region. The three lines in black represent contours of equal expected net value change.
M.P. Thompson et al. / Environmental Modelling & Software 63 (2015) 61e7268
To quantify the sensitivity of NFG risk rankings we kept track ofthe number of times each of the eleven NFGs was assigned to eachrank. Table 2 summarizes these results by identifying the highest,lowest, and most common rank (mode) for each NFG (which can bethe same), along with the proportion of total scenarios analyzedwhere the NFG was assigned to these respective ranks. Consistentwith Fig. 4, there is significant variation in the potential for loss thatdrives conditional wNVC rankings. Similarly, significant variation inthe probability of experiencing large wildfire drives E(wNVC)rankings. Results indicate that risk rankings are quite robust, withan average difference of only 2.73 between the highest/lowestconditional wNVC rankings, and an average difference of only 3.55between the highest/lowest E(wNVC) rankings. The larger differ-ence between E(wNVC) rankings is expected due to the addedvariability from a wider range of mean burn probabilities. Even incases where a given NFG exhibits a wider range of possible ranks,often the relative proportion of scenarios corresponding to a high/low ranking is quite low. Across NFGs the average proportion of themost common rank was 65% and 58% for the mean conditionalwNVC and E(wNVC) rankings, respectively, with ranges of 35e93%and 30e100%. These results indicate that for NFG risk rankings todramatically shift would require major changes in response func-tion definitions, a major reordering of priorities, and/or significantand widespread changes in modeled burn probabilities, none ofwhich is likely.
5. Discussion
5.1. Implications & applications
FireNVC proved to be a useful and computationally efficient toolfor a real-world application of wildfire exposure and risk assess-ment and mitigation planning on National Forest System lands inthe Rocky Mountain Region. The collaborative assessment processwas iterative in nature, and reemphasized needs to clearly identify
how assessment results are to be used, to invest in upfront geo-spatial data management, and to carefully evaluate and critique firemodeling outputs. Satisfaction with the process and the FireNVCtool has led to subsequent downscaling within the Region for as-sessments at smaller planning scales, including the Black HillsNational Forest and the Upper Monument Creek CollaborativeLandscape Restoration Initiative on the Pike-San Isabel NationalForest. This downscaling enables use of refined HVRA and firemodeling data, and increased local stakeholder involvement,illustrating the flexibility and utility of the decision support toolacross planning scales.
At present FireNVC is primarily a research tool, although wehave shared the tool with a select set of National Forest Systempartners. While the time and resources necessary to providecomprehensive documentation and user support are still beingweighed, a clear future direction for FireNVC includes additionalresearch-management partnerships with the objectives ofadvancing wildfire risk science and the application of that science.We anticipate that FireNVC could have broad application to assesswildfire risk on fire-prone landscapes across a variety of geographicareas and ownerships. We have shared the fundamentals of thisprocess and the key lessons learned with other Forest Service Re-gions, as well as broader audiences, with the aim of expanding theuser base and facilitating adoption of a consistent risk assessmentframework.
There are a number of potential benefits to be realized fromexpanded use of FireNVC. First and foremost, the tool is premisedon application a structured and systematic process for assessingrisk in a quantitative and spatial manner. Adoption of risk-baseddecision support tools is consistent with broader recommenda-tions for wildfire management, particularly in the context of federalland management in the United States (Calkin et al., 2011b, 2011c).A risk assessment perspective can lead to an improved character-ization of the potential socioeconomic and ecological impacts offire, through the spatial overlays of fire modeling outputs with

Fig. 5. Weighted risk score (E(wNVC)) raster output by FireNVC, mapped on National Forest and Grasslands in the Rocky Mountain Region. Areas mapped in white contain noHVRAs, and thus by definition present no risk to HVRAs.
M.P. Thompson et al. / Environmental Modelling & Software 63 (2015) 61e72 69
HVRAs, as well as the structured incorporation of disciplinaryexpertise and local knowledge into fire effects analysis. The delin-eation of response functions and relative importance weightsprovides for a transparent integration of science-based and value-based information into a broader decision support process(Marcot et al., 2012; Thompson et al., 2013c). The FireNVC tool ispremised on a flexible and scalable framework that can be appliedat various planning scales and that can readily incorporate addi-tional information to modify wildfire potential, to characterize fireeffects, or to differentiate fire management priorities.
FireNVC's ability to rapidly generate risk calculations in a geo-spatial context will provide researchers and land managers withan accessible and familiar context with which to evaluate firemanagement threats and opportunities. Tabular outputs andsummarization according to user-defined spatial layers can
highlight areas of relatively high or low risk mitigation potential.The ability to perform both sensitivity and scenario analysis affor-ded by the tool greatly enhances opportunities for model evalua-tion as well as comparison of fire management alternatives andtradeoff analysis. The menu of exposure and risk modeling ap-proaches provides users with flexibility to tailor the assessment totheir specific context.
5.2. Extensions
A number of extensions to FireNVC are foreseeable and/orongoing. Four opportunities in particular merit discussion. First,exposure analysis functionality within FireNVC could be expandedto include simulated fire perimeter polygons in addition to aggre-gated pixel-based probability outputs. Overlaying individual fire

Table 2Sensitivity analysis results comparing variation in NFG risk rankings, identifying thehigh/mode/low ranks along with their respective proportion of all scenariosanalyzed.
NFG ID Mean Conditional wNVC Rankings E(wNVC) Rankings
High Mode Low High Mode Low
ARAP/ROOS 2 2 3 8 10 1082% 82% 18% 7% 66% 66%
BIGHORN 8 10 11 8 9 101% 55% 10% 24% 41% 29%
BLACK HILLS 3 8 8 1 1 22% 39% 39% 98% 98% 2%
GMUG 5 7 8 6 7 83% 73% 9% 4% 68% 28%
MED/ROUTT 3 4 5 2 3 51% 72% 27% 21% 46% 8%
NEBRASKA 7 9 10 2 2 102% 48% 35% 43% 43% 2%
PSICC 1 1 2 3 4 793% 93% 7% 29% 46% 1%
RIOGRANDE 10 11 11 11 11 1110% 90% 90% 100% 100% 100%
SANJUAN 3 5 7 2 2 84% 54% 1% 35% 35% 3%
SHOSHONE 6 8 9 3 8 1033% 35% 18% 2% 30% 3%
WHITERIV 1 3 5 3 6 77% 76% 2% 5% 63% 11%
M.P. Thompson et al. / Environmental Modelling & Software 63 (2015) 61e7270
perimeters with HVRAmaps can yield useful information regardingthe annual probability that a wildfire will reach any portion of anHVRA, as well as the expected annual HVRA area burned. Evenmore informative is the characterization of the conditional distri-bution of HVRA area burned, providing an estimate of howmuch ofthe HVRA could burn in any given fire season or any given fireevent. This information can help differentiate across HVRA poly-gons with equal expected area burned, where a given HVRAmay bemore likely to experience fire but the fires may tend to burn lessHVRA area when they do occur. Conditional distributions of HVRAarea burned can be especially useful where the cumulative areaburned is an important predictor of fire effects, for instancewatershed response.
As an illustrative example, Fig. 6 displays polygon-based expo-sure analysis results for eight highly valued watersheds (labeled A-H) within the Pike-San Isabel National Forest in the Rocky Moun-tain Region. Because the watersheds vary in size, the bottom x-axisis displayed in terms of percentage of watershed burned, which isthe metric we use here for comparative purposes. Exposure levelsvary considerably across the watersheds assessed, which are pre-sented in order of decreasing exposure levels. Variation in wildfiresize and location, fuel structure and continuity, and other factorsdriving wildfire occurrence and spread all influence watershedexposure, but generating these polygon-based exposure resultsallows for a concise summary of areas where concern over post-firewatershed response and additional analysis may be warranted.Details on the fire simulation modeling for this example are avail-able in Thompson et al. (2013d), which additionally providesfurther examples of polygon-based exposure for wildlife habitatand human communities. Integrating this polygon-based approachinto FireNVC could allow for streamlined, complementary ap-proaches to HVRA exposure analysis.
A second, related, extension could modify FireNVC's fire effectsfunctionality to account for alternative spatiotemporal character-izations of response functions. One promising avenue is the char-acterization of fire effects on a per fire basis to account fordistributions of HVRA area burned. FireNVC could be coupled withother models such as post-fire debris flow models (Cannon et al.,
2010; Friedel, 2011) in an attempt to better capture fire effects.Longer-term models integrating vegetative succession and distur-bance (Millington et al., 2009) as well as shifting climatic influenceson fire likelihood (Carvalho et al., 2011) could also be integrated.FireNVC could also be modified to include suppression cost modelsin order to estimate likely fire management costs and to comparecosts and risks in a comprehensive cost effectiveness framework(Thompson et al., 2013e).
Third, FireNVC could be integrated with broader landscapeassessment and fuel treatment planning decision support systems(e.g., Ager et al., 2011; Vaillant et al., 2013). The consolidation ofFireNVC's multivariate response function and relative importancefunctionality with fire behavior modeling and fuel treatment plan-ning couldprovideapowerful tool for landandfiremanagers seekingto explore how alternative strategies could best mitigate wildfirerisk. Additionally, because FireNVC's functionality is built on opensource software, future applications could operate FireNVC withinan open source GIS and thereby broaden the potential user base.
Fourth, FireNVC could be used not only tomonitor exposure andrisk trends, as described earlier, but also to measure improvementsfrom risk mitigation investments. By maintaining consistency inresponse functions and relative importanceweights, changes in riskcan directly tie to changes in landscape condition (e.g., from fueltreatments) or the frequency/intensity ofwildfire (e.g., from ignitionprevention programs or altered suppression strategies). Pairing riskassessment with counterfactual fire simulation could explore dif-ferences in risk across landscapes had certain mitigation strategiesnot been implemented (e.g., Cochrane et al., 2012). Use of FireNVCwould allow for performance measurement on the basis of riskrather than simpler measures like area treated or area burned. Ofcourse, isolating the influence of riskmitigation investments againstthe backdrop of vegetation dynamics, expanding human develop-ment, and a changing climate would not be without challenges.
5.3. Limitations
There are a number of potential limitations to the assessmentframework and its implementation within FireNVC. Broadlyspeaking these include potential errors and uncertainties associ-ated with fire modeling inputs and outputs, HVRA response func-tions, and HVRA relative importance weights. With respect to firemodeling, research efforts could focus on establishing a firmertheoretical basis for fire spreadmodeling and developing a strongerempirical basis for evaluating model performance (Sullivan, 2009;Cruz and Alexander, 2010; Finney et al., 2012). In the case of theRocky Mountain Region assessment, for example, there was anexpectation of refined burn probability results from simulating fireat a finer spatial resolution to better capture variation in fuel con-ditions and fire weather patterns, and further from use of anupdated and more comprehensive fire history database (Short,2013) for calibration purposes.
Predicting fire effects is subject to multiple sources of uncer-tainty, including limited or inadequate empirical observations, andgaps in fire effects science (Hyde et al., 2012), highlighting a needfor continued empirical research into post-fire impacts (Riley et al.,2013). A lack of HVRA-specific predictive models also limits theability of fire managers to assess the potential consequences ofwildfire, especially where non-market HVRAs are concerned(Reinhardt and Dickinson, 2010; Venn and Calkin, 2011). Validationof risk modeling results can therefore be difficult, particularly asmultiple HVRAs are integrated and model complexity increases,and asmetrics tomeasure impacts are not immediately evident (i.e.,observed wildfire impacts may not be readily monetized or trans-lated into NVC scores). Continued data collection on wildfire im-pacts and the integration of fire ecology with resource economics

Fig. 6. Conditional distributions of watershed area burned (absolute area and as a percentage of watershed area) for highly valued watersheds (labeled A through H) located in thePike-San Isabel National Forest.
M.P. Thompson et al. / Environmental Modelling & Software 63 (2015) 61e72 71
are recommended, and the need for reliance on expert judgment tovalidate risk modeling results will likely remain for some time.
Nevertheless, effects analysis remains a critical component ofquantitative risk assessment and wildfire management. With thatsaid, the response function approach itself may be not appropriatein all circumstances, in particular for single HVRA assessmentswhere other modeling approaches exist and can readily be inte-grated, such as post-fire erosion and impacts to water quality,although additional assumptions and inferences will likely benecessary to translate fire intensity outputs into burn severitymetrics typically ingested by such models (Robichaud and Ashmun,2013). Lastly, fire managers may have difficulty quantitativelyarticulating fire management priorities across HVRAs, although aswe demonstrated approaches such multi-criteria decision analysiscan help manage this source of uncertainty (Ananda and Herath,2009; Thompson and Calkin, 2011).
While important, these aforementioned issues are largelyexternal to the design and implementation of FireNVC itself,
however. The tool is largely model-independent and amenable to anumber of alternative characterizations of burn probabilities andresponse functions. The spatiotemporal scales of fire modelingoutputs, fire effects analysis, and geospatial data layers across theassessment landscape must be consistent. Computational issuesmay arise for particularly large or complex analyses. Withincreasing spatial resolution, landscape size, number of HVRAs, andnumber of HVRA covariates, computational burdens will increase.
6. Conclusion
In summary, we reviewed the supporting framework and thedevelopment of FireNVC, a geospatial wildfire risk calculation tool.Our illustrative example application was not merely a proof ofconcept, but rather an instance of real-world decision support forbudgetary decision processes on National Forest System lands inthe RockyMountain Region of the United States. A great strength ofthis process was the implementation of a systematic and well-

M.P. Thompson et al. / Environmental Modelling & Software 63 (2015) 61e7272
tested assessment framework, for which FireNVC enabled stream-lined calculations and provided geospatial and tabular risk sum-marizations. FireNVC is a flexible platform to integrate key pieces ofinformation and to assess risks to multiple HVRAs. Future uses ofthe tool and refinements to the tool both will ideally support risk-informed and science-based decision making in the context of landand natural resource management.
Acknowledgments
The Rocky Mountain Research Station and the National FireDecision Support Center supported this research. Thanks to JimMenakis for his efforts supporting this process.
References
Ager, A.A., Buonopane, M., Reger, A., Finney, M.A., 2013. Wildfire exposure analysison the national forests in the Pacific Northwest, USA. Risk Anal. 33 (6),1000e1020.
Ager, A.A., Vaillant, N.M., Finney, M.A., 2010. A comparison of landscape fueltreatment strategies to mitigate wildland fire risk in the urban interface andpreserve old forest structure. For. Ecol. Manag. 259, 1556e1570.
Ager, A.A., Vaillant, N.M., Finney, M.A., 2011. Integrating fire behavior models andgeospatial analysis for wildland fire risk assessment and fuel managementplanning. J. Combust. 2011, 19.
Alexandrov, G.A., Ames, D., Bellocchi, G., Bruen, M., Crout, N., Erechtchoukova, M.,Hildebrandt, A., Hoffman, F., Jackish, C., Khaiter, P., Mannina, G., Matsunaga, T.,Purucker, S.T., Rivington, M., Samaniego, L., 2011. Technical assessment andevaluation of environmental models and software: letter to the Editor. Environ.Model. Softw. 26, 328e336.
Ananda, J., Herath, G., 2009. A critical review of multi-criteria decision makingmethods with special reference to forest management and planning. Ecol. Econ.68, 2535e2548.
Atkinson, D., Chladil, M., Janssen, V., Lucieer, A., 2010. Implementation of quanti-tative bushfire risk analysis in a GIS environment. Int. J. Wildland Fire 19,649e658.
Bar Massada, A., Radeloff, V.C., Stewart, S.I., Hawbaker, T.J., 2009. Wildfire risk in thewildland-urban interface: a simulation study in northwestern Wisconsin. For.Ecol. Manag. 258, 1990e1999.
Bennett, N.D., Croke, B.F.W., Guariso, G., Guillaume, J.H.A., Hamilton, S.H.,Jakeman, A.J., Marsili-Libelli, S., Newham, L.T.H., Norton, J.P., Perrin, C.,Pierce, S.A., Robson, B., Seppelt, R., Voinov, A.A., Fath, B.D., Andreassian, V., 2013.Characterising performance of environmental models. Environ. Model. Softw.40, 1e20.
Calkin, D.E., Thompson, M.P., Finney, M.A., Hyde, K.D., 2011a. A real-time riskassessment tool supporting wildland fire decisionmaking. J. For. 109, 274e280.
Calkin, D., Ager, A., Thompson, M., Finney, M., Lee, D., Quigley, T., McHugh, C.,Riley, K.L., 2011b. A Comparative Risk Assessment Framework for Wildland FireManagement: the 2010 Cohesive Strategy Science Report. Gen. Tech. Rep.RMRS-GTR-262. U.S. Department of Agriculture, Forest Service, Rocky MountainResearch Station, Fort Collins, CO, 63 pp.
Calkin, D., Thompson, M.P., Ager, A.A., Finney, M., 2011c. Progress towards andbarriers to implementation of a risk framework for US federal wildland firepolicy and decision making. For. Policy Econ. 13, 378e389.
Cannon, S.H., Gartner, J.E., Rupert, M.G., Michael, J.A., Rea, A.H., Parrett, C., 2010.Predicting the probability and volume of postwildfire debris flows in theintermountain western United States. Geol. Soc. Am. Bull. 122, 127e144.
Carmel, Y., Paz, S., Jahashan, F., Shoshany, M., 2009. Assessing fire risk using MonteCarlo simulations of fire spread. For. Ecol. Manag. 257, 370e377.
Carvalho, A., Carvalho, A., Martins, H., Marques, C., Rocha, A., Borrego, C., Viegas, D.,Miranda, A., 2011. Fire weather risk assessment under climate change using adynamical downscaling approach. Environ. Model. Softw. 26, 1123e1133.
Chuvieco, E., Aguado, I., Yebra, M., Nieto, H., Salas, J., Martín, M.P., Vilar, L.,Martínez, J., Martín, S., Ibarra, P., 2010. Development of a framework for fire riskassessment using remote sensing and geographic information system tech-nologies. Ecol. Model. 221, 46e58.
Cochrane, M.A., Moran, C.J., Wimberly, M.C., Baer, A.D., Finney, M.A.,Beckendorf, K.L., Eidenshink, J., Zhu, Z., 2012. Estimation of wildfire size and riskchanges due to fuels treatments. Int. J. Wildland Fire 21, 357e367.
Cruz, M.G., Alexander, M.E., 2010. Assessing crown fire potential in coniferous for-ests of western North America: a critique of current approaches and recentsimulation studies. Int. J. Wildland Fire 19, 377e398.
Fairbrother, A., Turnley, J.G., 2005. Predicting risks of uncharacteristic wildfires:application of the risk assessment process. For. Ecol. Manag. 211, 28e35.
Finney, M.A., 2005. The challenge of quantitative risk analysis for wildland fire. For.Ecol. Manag. 211, 97e108.
Finney, M.A., 2006. FlamMap 3.0. USDA Forest Service, Rocky Mountain ResearchStation, Fire Sciences Laboratory, Missoula, MT., U.S. Department of Agriculture,Forest Service, Rocky Mountain Research Station, Portland, OR.
Finney, M.A., Cohen, J.D., McAllister, S.S., Jolly, W.M., 2012. On the need for a theoryof wildland fire spread. Int. J. Wildland Fire 22, 25e36.
Finney, M.A., McHugh, C.W., Grenfell, I.C., Riley, K.L., Short, K.C., 2011. A simulationof probabilistic wildfire risk components for the continental United States.Stoch. Environ. Res. Risk Assess. 25, 973e1000.
Fiorucci, P., Gaetani, F.,Minciardi, R., 2008.Development andapplicationof a system fordynamic wildfire risk assessment in Italy. Environ. Model. Softw. 23, 690e702.
Friedel, M.J., 2011. A data-driven approach for modeling post-fire debris-flow vol-umes and their uncertainty. Environ. Model. Softw. 26, 1583e1598.
Hyde, K., Dickinson, M.B., Bohrer, G., Calkin, D., Evers, L., Gilbertson-Day, J.,Nicolet, T., Ryan, K., Tague, C., 2012. Research and development supporting risk-based wildfire effects prediction for fuels and fire management: status andneeds. Int. J. Wildland Fire 22, 37e50.
Krueger, T., Page, T., Hubacek, K., Smith, L., Hiscock, K., 2012. The role of expertopinion in environmental modelling. Environ. Model. Softw. 36, 4e18.
Kuhnert, P.M., Martin, T.G., Griffiths, S.P., 2010. A guide to eliciting and using expertknowledge in Bayesian ecological models. Ecol. Lett. 13 (7), 900e914.
Marcot, B.G., Thompson, M.P., Runge, M.C., Thompson, F.R., McNulty, S., Cleaves, D.,Tomosy, M., Fisher, L.A., Bliss, A., 2012. Recent advances in applying decisionscience to managing national forests. For. Ecol. Manag. 285, 123e132.
Miller, C., Ager, A.A., 2013. A review of recent advances in risk analysis for wildfiremanagement. Int. J. Wildland Fire 22, 1e14.
Millington, J.D., Wainwright, J., Perry, G.L., Romero-Calcerrada, R., Malamud, B.D.,2009. Modelling Mediterranean landscape succession-disturbance dynamics: alandscape fire-succession model. Environ. Model. Softw. 24, 1196e1208.
Parisien, M.-A., Walker, G.R., Little, J.M., Simpson, B.N., Wang, X., Perrakis, D.D., 2013.Considerations for modeling burn probability across landscapes with steepenvironmental gradients: an example from the Columbia Mountains, Canada.Nat. Hazards 66, 439e462.
Reinhardt, E., Dickinson, M., 2010. First-order fire effects models for land man-agement: overview and issues. Fire Ecol. 6, 131e142.
Riley, K.L., Bendick, R., Hyde, K.D., Gabet, E.J., 2013. Frequencyemagnitude distri-bution of debris flows compiled from global data, and comparison with post-fire debris flows in the western US. Geomorphology 191, 118e128.
Robichaud, P.R., Ashmun, L.E., 2013. Tools to aid post-wildfire assessment anderosion-mitigation treatment decisions. Int. J. Wildland Fire 22, 95e105.
Robson, Barbara J., 2014. State of the art in modelling of phosphorus in aquaticsystems: review, criticisms and commentary. Environ. Model. Softw. 61,339e359. http://dx.doi.org/10.1016/j.envsoft.2014.01.012.
Rom�an, M.V., Azqueta, D., Rodrígues, M., 2013. Methodological approach to assessthe socio-economic vulnerability to wildfires in Spain. For. Ecol. Manag. 294,158e165.
Salis, M., Ager, A.A., Arca, B., Finney, M.A., Bacciu, V., Duce, P., Spano, D., 2012.Assessing exposure of human and ecological values to wildfire in Sardinia, Italy.Int. J. Wildland Fire 22, 549e565.
Scott, J., Helmbrecht, D., Thompson, M.P., Calkin, D.E., Marcille, K., 2012a. Probabi-listic assessment of wildfire hazard and municipal watershed exposure. Nat.Hazards 64, 707e728.
Scott, J., Helmbrecht, D., Parks, S., Miller, C., 2012b. Quantifying the threat ofunsuppressed wildfires reaching the adjacent wildland-urban interface on theBridger-Teton National Forest, Wyoming, USA. Fire Ecol. 8, 125e142.
Scott, J.H., Thompson, M.P., Calkin, D.E., 2013. AWildfire Risk Assessment Frameworkfor Land and Resource Management. Gen. Tech. Rep. RMRS-GTR-315. U.S. Depart-ment of Agriculture, Forest Service, Rocky Mountain Research Station, 83 pp.
Sullivan, A.L., 2009. Wildland surface fire spread modelling, 1990e2007. 3: simu-lation and mathematical analogue models. Int. J. Wildland Fire 18, 387e403.
Thompson, M.P., Calkin, D.E., 2011. Uncertainty and risk in wildland fire manage-ment: a review. J. Environ. Manag. 92, 1895e1909.
Thompson, M.P., Calkin, D.E., Finney, M.A., Ager, A.A., Gilbertson-Day, J.W., 2011.Integrated national-scale assessment of wildfire risk to human and ecologicalvalues. Stoch. Environ. Res. Risk Assess. 25, 761e780.
Thompson, M.P., Scott, J., Helmbrecht, D., Calkin, D.E., 2013a. Integrated wildfire riskassessment: framework development and application on the Lewis and ClarkNational Forest in Montana, USA. Integr. Environ. Assess. Manag. 9, 329e342.
Thompson, M.P., Scott, J., Kaiden, J.D., Gilbertson-Day, J.W., 2013b. A polygon-basedmodeling approach to assess exposure of resources and assets to wildfire. Nat.Hazards 67, 627e644.
Thompson, M.P., Marcot, B.G., Thompson, F.R., McNulty, S., Fisher, L.A., Runge, M.C.,Cleaves, D., Tomosy, M., 2013c. The Science of Decisionmaking: Applications forSustainable Forest and Grassland Management in the National Forest System.U.S. Department of Agriculture, Forest Service. 54 p, Washington, DC. Gen. Tech.Rep. WO-GTR-88.
Thompson, M.P., Scott, J., Langowski, P.G., Gilbertson-Day, J.W., Haas, J.R.,Bowne, E.M., 2013d. Assessing watershed-wildfire risks on National ForestSystem lands in the Rocky Mountain Region of the United States. Water 5,945e971.
Thompson, M.P., Vaillant, N.M., Haas, J.R., Gebert, K.M., Stockmann, K.D., 2013e.Quantifying the potential impacts of fuel treatments on wildfire suppressioncosts. J. For. 111, 49e58.
Vaillant, N.M., Ager, A.A., Anderson, J., 2013. ArcFuels10 System Overview. Gen.Tech. Rep. PNW-GTR-875. U.S. Department of Agriculture, Forest Service, PacificNorthwest Research Station, Portland, OR, 65 pp.
Venn, T.J., Calkin, D.E., 2011. Accommodating non-market values in evaluation ofwildfire management in the United States: challenges and opportunities. Int. J.Wildland Fire 20, 327e339.