Embed Size (px)
Citation preview

Engineering Structures 52 (2013) 284–294
Contents lists available at SciVerse ScienceDirect
Engineering Structures
journal homepage: www.elsevier .com/locate /engstruct
Development and analytical verification of an inelastic reinforcedconcrete joint model
0141-0296/$ - see front matter � 2013 Elsevier Ltd. All rights reserved.http://dx.doi.org/10.1016/j.engstruct.2013.02.032
⇑ Corresponding author. Tel.: +90 312 210 5477.E-mail addresses: [email protected] (M. Unal), [email protected] (B. Burak).
Mehmet Unal a, Burcu Burak b,⇑a Civil Engineering Department, Pennsylvania State University, University Park, PA, United Statesb Civil Engineering Department, Middle East Technical University, K2-311 Ankara, Turkey
a r t i c l e i n f o a b s t r a c t
Article history:Received 21 February 2012Revised 20 February 2013Accepted 23 February 2013Available online 9 April 2013
Keywords:Beam-to-column connectionsSeismic loadingJoint modelJoint shearJoint distortion
Previous experimental research indicated that beam-to-column connections of reinforced concrete (RC)moment resisting frame structures experience considerable deformations under earthquake loading andthese deformations have a major contribution to the story drift of the building. In current analysis anddesign applications, however, the connection regions are generally modeled as rigid zones and the inelas-tic behavior of the joint is not considered. This assumption gives rise to an underestimation of the storydrifts and hence to an improper assessment of the seismic performance of the structure. In order toimplement the effect of shear distortions observed in these regions into the seismic design and analysisof buildings, a model that represents their inelastic behavior needs to be developed. In this study, a para-metric model that predicts the joint shear strength versus strain relationship is developed by investigat-ing several previous experimental studies on RC beam-to-column connection subassemblies subjected tocyclic loading and establishing an extensive database. Based on this experimental database, parametersthat significantly influence the joint behavior are determined by employing statistical correlation methodand these key parameters are assembled to form a joint model. This model is then verified by comparingthe results obtained from the dynamic earthquake analysis carried out by using Perform 3D with theexperimental ones. Based on the verification results, it is observed that the analysis including the devel-oped joint model improves the prediction of the seismic behavior.
� 2013 Elsevier Ltd. All rights reserved.
1. Introduction
For more than 40 years, many experimental studies have beencarried out focusing on the behavior of beam-to-column connec-tions under cyclic loading. Several of these studies indicated thatjoint deformations have a significant contribution on the story drift[1–6]. Therefore, the seismic behavior of beam-to-column connec-tions significantly influences the earthquake response of reinforcedconcrete frame structures. If these regions are not properly de-signed and detailed, they may fail prematurely under strong earth-quake ground motions.
In the design of reinforced concrete moment resisting framestructures, the ‘‘strong column–weak beam’’ philosophy is rec-ommended to ensure the formation of beam plastic hingingrather than column hinging at large displacement levels. Beam-to-column connections, therefore, are expected to be in the elas-tic range. However, experimental studies indicated that they un-dergo large inelastic shear deformations even when the strongcolumn–weak beam design philosophy is followed. It was alsoobserved that the inelastic behavior of connections subjected
to cyclic loading significantly affects the overall behavior of thespecimen and should not be neglected. However, in current anal-ysis and design applications, the connection regions are gener-ally modeled as rigid zones or regions with reduced stiffnessbased on the stiffness of adjoining members and the inelasticbehavior of this region is not accurately taken into account. Thisassumption leads to underestimation of the story drifts andoverestimation of beam end rotations and hence to improperassessment of the seismic performance of the whole structureand structural members. Therefore, a model needs to be devel-oped to properly represent the inelastic seismic behavior ofbeam-to-column connections.
In order to define the inelastic behavior of these regions, thefactors influencing the seismic behavior of beam-to-column con-nections should be determined. Many researchers agree that thekey parameters affecting the connection performance are col-umn-to-beam moment strength ratio, confinement provided bythe lateral reinforcement and beams framing into the connectionregion, anchorage of the beam longitudinal reinforcement andshear stress level in the joint. In addition, material properties, sec-tion dimensions, eccentricity between the centerlines of beam andcolumn, axial load acting on the column and presence of widebeams or slab also affect the connection behavior.

Nomenclature
Ao cross-sectional area of the transverse reinforcementAg gross area of column sectionbb beam widthbc column widthbc,core width of the column corebj effective joint widthd0 0 depth of the beam between top and bottom reinforce-
mente eccentricity between beam and column centerlinesf 0c concrete compressive strengthfy yield strength of reinforcing barsG shear modulusH height of the specimenhb beam depthhc column depthhc,core depth of the column corel span length of the beamleff effective length of the lateral reinforcement in the load-
ing direction, which is taken as the summation of thelengths of stirrup legs placed parallel to the loadingdirection
Lp plastic hinge lengthMn nominal moment strengthN column axial loadn number of layers of transverse reinforcement in the
effective confined areas center-to-center spacing of stirrupsVj joint shear forcevj joint shear stressc joint shear distortionqcore volumetric confinement reinforcement ratio deter-
mined considering the core volume of the connectionregion
qgross volumetric confinement reinforcement ratio deter-mined considering the gross volume of the connectionregion
qonelayer volumetric confinement reinforcement ratio deter-mined considering the effective volume that containsone layer of joint transverse reinforcement
h beam rotation, radDj the contribution of joint shear distortion to the total
story drift
M. Unal, B. Burak / Engineering Structures 52 (2013) 284–294 285
Based on experimental results, numerous analytical studieshave been conducted to investigate the effect of different param-eters on the seismic behavior of the connection region and pre-dict the load–deformation relationships. Consequently, analyticalmodels representing the joint shear stress versus strain responsehave been proposed. Parra-Montesinos and Wight [7] proposedan analytical model for estimating shear strength versus strain re-sponse of reinforced concrete beam-to-column connections.Experimental results of cyclic connection tests were utilized todevelop a factor for defining principle tensile and compressivestress versus shear distortion response. The development of thismodel was based on the state of plane strains in the joint. Thisanalytical model also included a coefficient that takes into ac-count the effect of eccentricity.
Lowes and Altoontash [8] developed a joint model that providesa representation of the nonlinear mechanism of the joint behaviorby developing constitutive relationships of material, geometric anddesign parameters and implementing a four-node 12 degree-of-freedom element. Mitra and Lowes [9] improved this model bychanging the element definition. A numerical simulation of theparameters in conjunction with finite element analysis to predictthe joint shear strength was utilized in this study. A compres-sion-strut model was used to simulate the joint core and bond–slipresponse was also considered in addition to nonlinear joint core re-sponse to simulate the joint stiffness. An extensive experimentaldatabase of beam-to-column subassemblies was used in order toevaluate the accuracy of the model.
Shin and LaFave [10], Kim and LaFave [11] investigated the ef-fects of some key parameters such as concrete compressivestrength, joint reinforcement and axial load effect using the datafrom 26 beam-to-column connection tests. Afterwards, an analyti-cal model was proposed to estimate the hysteretic joint shearstress versus strain behavior by employing modified compressionfield theory. Burak [1] also used experimental results and devel-oped a joint model that takes into account the joint shear strainand predicts the joint shear behavior. The model presents an opti-mized equation including concrete compressive strength, geome-try and eccentricity parameters. A five story building wasanalyzed by using both rigid connections and the developed joint
model. It was concluded that if the joint model was not includedin the analysis the roof drifts could be underestimated up to 25%.Canbolat [2] developed a parametric joint model that takes into ac-count the material properties, geometric properties and confine-ment provided by the joint hoop reinforcement. The model wasused in the dynamic time history analysis of a five-story RC build-ing. The results showed that the roof drifts increased up to 25%when the analytical joint model was utilized.
More recently, Kim and LaFave [12] used statistical methods toevaluate the effect of key parameters such as concrete compressivestrength, panel geometry, confinement due to joint reinforcement,column axial compression, and bond characteristics of the longitu-dinal reinforcement on the joint behavior. It was concluded thatjoint shear capacity mostly depends on concrete compressivestrength, however, joint panel geometry has only a slight effecton the seismic performance. After having determined the mostinfluential parameters on joint shear stress–strain behavior, anequation representing joint shear strength was developed by usingBayesian parameter estimation approach.
In this paper, a database of specimens is presented and theoutputs of experimental and analytical studies on beam-to-col-umn connections are synthesized to develop a joint model. Theshear strength prediction equation developed by the authors,the details of which are explained in a prior article [13], is usedas the ultimate shear strength of beam-to-column connectionsin this model. The shear distortion value corresponding to theultimate strength and two other key points are defined and abackbone curve for the joint model is developed, then the subas-semblies in the database are analyzed utilizing the developedmodel. When the joint model is included in the analysis, not onlythe prediction of the lateral load versus story drift response of thestructure, but also the inelastic behavior of members such as theconnection region and the beams are improved significantly. Themain objective of this study is to develop a joint model that canbe incorporated into a commercial software program that can beof practical use to the engineering practice. Therefore, the enve-lope curves are obtained and conservative values for the lateralload, story drift, beam end rotation, joint shear stress and distor-tion are estimated.
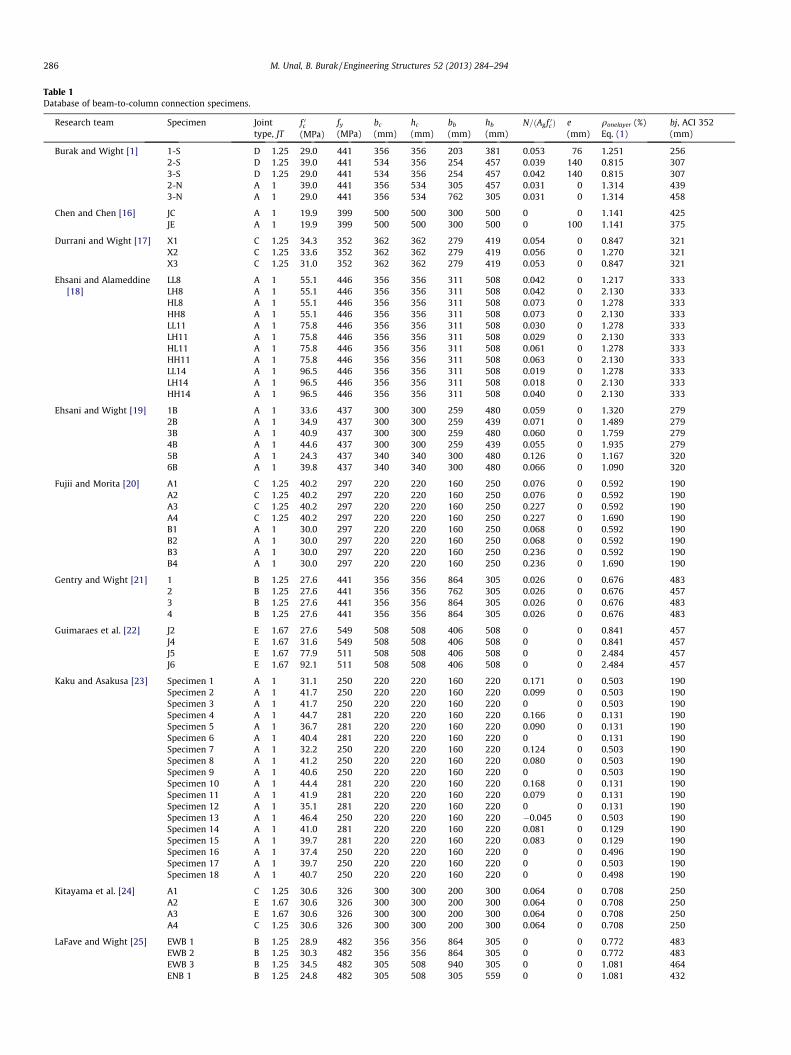
Table 1Database of beam-to-column connection specimens.
Research team Specimen Jointtype, JT
f 0c(MPa)
fy
(MPa)bc
(mm)hc
(mm)bb
(mm)hb
(mm)N=ðAgf 0cÞ e
(mm)qonelayer (%)Eq. (1)
bj, ACI 352(mm)
Burak and Wight [1] 1-S D 1.25 29.0 441 356 356 203 381 0.053 76 1.251 2562-S D 1.25 39.0 441 534 356 254 457 0.039 140 0.815 3073-S D 1.25 29.0 441 534 356 254 457 0.042 140 0.815 3072-N A 1 39.0 441 356 534 305 457 0.031 0 1.314 4393-N A 1 29.0 441 356 534 762 305 0.031 0 1.314 458
Chen and Chen [16] JC A 1 19.9 399 500 500 300 500 0 0 1.141 425JE A 1 19.9 399 500 500 300 500 0 100 1.141 375
Durrani and Wight [17] X1 C 1.25 34.3 352 362 362 279 419 0.054 0 0.847 321X2 C 1.25 33.6 352 362 362 279 419 0.056 0 1.270 321X3 C 1.25 31.0 352 362 362 279 419 0.053 0 0.847 321
Ehsani and Alameddine[18]
LL8 A 1 55.1 446 356 356 311 508 0.042 0 1.217 333LH8 A 1 55.1 446 356 356 311 508 0.042 0 2.130 333HL8 A 1 55.1 446 356 356 311 508 0.073 0 1.278 333HH8 A 1 55.1 446 356 356 311 508 0.073 0 2.130 333LL11 A 1 75.8 446 356 356 311 508 0.030 0 1.278 333LH11 A 1 75.8 446 356 356 311 508 0.029 0 2.130 333HL11 A 1 75.8 446 356 356 311 508 0.061 0 1.278 333HH11 A 1 75.8 446 356 356 311 508 0.063 0 2.130 333LL14 A 1 96.5 446 356 356 311 508 0.019 0 1.278 333LH14 A 1 96.5 446 356 356 311 508 0.018 0 2.130 333HH14 A 1 96.5 446 356 356 311 508 0.040 0 2.130 333
Ehsani and Wight [19] 1B A 1 33.6 437 300 300 259 480 0.059 0 1.320 2792B A 1 34.9 437 300 300 259 439 0.071 0 1.489 2793B A 1 40.9 437 300 300 259 480 0.060 0 1.759 2794B A 1 44.6 437 300 300 259 439 0.055 0 1.935 2795B A 1 24.3 437 340 340 300 480 0.126 0 1.167 3206B A 1 39.8 437 340 340 300 480 0.066 0 1.090 320
Fujii and Morita [20] A1 C 1.25 40.2 297 220 220 160 250 0.076 0 0.592 190A2 C 1.25 40.2 297 220 220 160 250 0.076 0 0.592 190A3 C 1.25 40.2 297 220 220 160 250 0.227 0 0.592 190A4 C 1.25 40.2 297 220 220 160 250 0.227 0 1.690 190B1 A 1 30.0 297 220 220 160 250 0.068 0 0.592 190B2 A 1 30.0 297 220 220 160 250 0.068 0 0.592 190B3 A 1 30.0 297 220 220 160 250 0.236 0 0.592 190B4 A 1 30.0 297 220 220 160 250 0.236 0 1.690 190
Gentry and Wight [21] 1 B 1.25 27.6 441 356 356 864 305 0.026 0 0.676 4832 B 1.25 27.6 441 356 356 762 305 0.026 0 0.676 4573 B 1.25 27.6 441 356 356 864 305 0.026 0 0.676 4834 B 1.25 27.6 441 356 356 864 305 0.026 0 0.676 483
Guimaraes et al. [22] J2 E 1.67 27.6 549 508 508 406 508 0 0 0.841 457J4 E 1.67 31.6 549 508 508 406 508 0 0 0.841 457J5 E 1.67 77.9 511 508 508 406 508 0 0 2.484 457J6 E 1.67 92.1 511 508 508 406 508 0 0 2.484 457
Kaku and Asakusa [23] Specimen 1 A 1 31.1 250 220 220 160 220 0.171 0 0.503 190Specimen 2 A 1 41.7 250 220 220 160 220 0.099 0 0.503 190Specimen 3 A 1 41.7 250 220 220 160 220 0 0 0.503 190Specimen 4 A 1 44.7 281 220 220 160 220 0.166 0 0.131 190Specimen 5 A 1 36.7 281 220 220 160 220 0.090 0 0.131 190Specimen 6 A 1 40.4 281 220 220 160 220 0 0 0.131 190Specimen 7 A 1 32.2 250 220 220 160 220 0.124 0 0.503 190Specimen 8 A 1 41.2 250 220 220 160 220 0.080 0 0.503 190Specimen 9 A 1 40.6 250 220 220 160 220 0 0 0.503 190Specimen 10 A 1 44.4 281 220 220 160 220 0.168 0 0.131 190Specimen 11 A 1 41.9 281 220 220 160 220 0.079 0 0.131 190Specimen 12 A 1 35.1 281 220 220 160 220 0 0 0.131 190Specimen 13 A 1 46.4 250 220 220 160 220 �0.045 0 0.503 190Specimen 14 A 1 41.0 281 220 220 160 220 0.081 0 0.129 190Specimen 15 A 1 39.7 281 220 220 160 220 0.083 0 0.129 190Specimen 16 A 1 37.4 250 220 220 160 220 0 0 0.496 190Specimen 17 A 1 39.7 250 220 220 160 220 0 0 0.503 190Specimen 18 A 1 40.7 250 220 220 160 220 0 0 0.498 190
Kitayama et al. [24] A1 C 1.25 30.6 326 300 300 200 300 0.064 0 0.708 250A2 E 1.67 30.6 326 300 300 200 300 0.064 0 0.708 250A3 E 1.67 30.6 326 300 300 200 300 0.064 0 0.708 250A4 C 1.25 30.6 326 300 300 200 300 0.064 0 0.708 250
LaFave and Wight [25] EWB 1 B 1.25 28.9 482 356 356 864 305 0 0 0.772 483EWB 2 B 1.25 30.3 482 356 356 864 305 0 0 0.772 483EWB 3 B 1.25 34.5 482 305 508 940 305 0 0 1.081 464ENB 1 B 1.25 24.8 482 305 508 305 559 0 0 1.081 432
286 M. Unal, B. Burak / Engineering Structures 52 (2013) 284–294

Table 1 (continued)
Research team Specimen Jointtype, JT
f 0c(MPa)
fy
(MPa)bc
(mm)hc
(mm)bb
(mm)hb
(mm)N=ðAgf 0cÞ e
(mm)qonelayer (%)Eq. (1)
bj, ACI 352(mm)
Lee and Ko [26] S0 A 1 32.6 471 400 600 300 450 0.089 0 0.423 350S50 A 1 34.2 471 400 600 300 450 0.085 50 0.423 350W0 A 1 28.9 471 600 400 300 450 0.101 0 1.134 450W75 A 1 30.4 471 600 400 300 450 0.096 75 1.134 450W150 A 1 29.1 471 600 400 300 450 0.100 150 1.134 450
Shiohara [27] J-7 C 1.25 79.2 857 300 300 240 300 0.117 0 0.689 270J-10 C 1.25 39.2 598 300 300 240 300 0.236 0 0.689 270
Quintero-Febres andWight [28]
IWB1 E 1.67 27.6 503 356 356 889 305 0 0 1.097 489IWB2 E 1.67 27.6 503 356 356 660 305 0 0 1.097 432IWB3 E 1.67 27.6 503 330 508 838 305 0 0 0.908 457
Raffaelle and Wight [29] 1 C 1.25 28.6 441 356 356 254 381 0.025 51 0.772 3072 C 1.25 26.8 441 356 356 178 381 0.026 89 0.772 2313 C 1.25 37.7 441 356 356 191 381 0.019 83 0.772 2444 C 1.25 19.3 441 356 356 191 559 0.036 83 0.772 244
Shin and LaFave [30,31] SL 1 D 1.25 29.9 468 457 330 279 406 0 89 0.615 329SL 2 D 1.25 36.1 468 457 330 178 406 0 140 0.615 227SL 3 D 1.25 47.4 551 457 330 279 406 0 0 0.615 362SL 4 D 1.25 31.1 579 279 368 279 406 0 0 1.099 279
Teng and Zhou [32] S1 C 1.25 33.0 440 400 300 200 400 0.111 0 0.885 275S2 C 1.25 34.0 440 400 300 200 400 0.108 50 0.885 275S3 C 1.25 35.0 440 400 300 200 400 0.105 100 0.885 245S5 C 1.25 39.0 440 400 200 200 400 0.110 50 1.287 250S6 C 1.25 38.0 440 400 200 200 400 0.113 100 1.287 230
Fig. 1. Critical points of the proposed model for the joint shear stress–straindiagram of specimen SL2 – Shin and LaFave [31].
M. Unal, B. Burak / Engineering Structures 52 (2013) 284–294 287
2. Analytical joint model definition
In order to predict the joint shear strength versus strain behav-ior, past experimental data on the cyclic testing of beam-to-col-umn connection subassemblies, which provide both joint shearstrength and strain measurements are utilized. The parameterswhich are believed to be influential on the seismic behavior ofjoints are collected in a database given in Table 1. By using statis-tical correlation methods, the most effective parameters are deter-mined whereas the ones that have a slight effect on the shearbehavior are neglected (Table 2). Consequently, an equation to pre-dict the maximum joint shear strength of reinforced concretebeam-to-column connections subjected to earthquake loading isgenerated [13]. Final parameters in the equation are defined interms of ratios and powers of some of the key individual parame-
Table 2Correlation of key parameters with maximum experimental joint shear strength.
Vj;max f 0c fy qcore qgross qonelayer
Exterior joints 0.6693 0.0790 0.4512 0.3101 0.5356Interior joints 0.6929 0.0850 0.3608 0.3546 0.5604
where, CorrelationðX;YÞ ¼Pðx��xÞ�ðy��yÞffiffiffiffiffiffiffiffiffiffiffiffiffiffiffiffiffiffiffiffiffiffiffiffiffiffiffiffiffiffiffiffiPðx��xÞ2 �
Pðy��yÞ2
p .
ters to accurately represent their effect on the capacity and obtainthe minimum average error and the highest correlation with theexperimental values. While carrying out these steps, the guidelinesgiven in ACI Committee 318 Building Code Requirements for Struc-tural Concrete [14], and ACI-ASCE Committee 352 Recommenda-tions for Design of Beam–Column Connections in MonolithicReinforced Concrete Structures [15] are followed. After developingequations for the maximum joint shear strength and the corre-sponding strain value (vj,u,cu), two more critical points in the jointshear strength versus strain curve are determined by using statis-tical data. These points are selected as the onset of cracking (vj,cr, -ccr) and the end of cracked-elastic stage (vj,i,ci) (Fig. 1).
The critical points are defined as parametric equations aimingto give the best correlation with the experimental values. Theresulting equations to define the strength and strain values ofthe critical points are given below, which resulted in an average er-ror of �4.2% and a correlation of 88% with the experimental data:
v j;uðMPaÞ ¼ JT � ðfc � fyÞ1=6 � qjoint � EE � CI � NE �WB � SI
v j;crðMPaÞ ¼ 0:4 � v j;u
v j;iðMPaÞ ¼ 0:9 � v j;u
ci ¼ ðv j;u
GÞ0:7 � 1
JT� hc
bj
ccr ¼ 0:15 � ci
cu ¼ 2:5 � ci
ð1Þ
The parameters used in this analytical study are explained in anearlier article by the authors [13], but are also briefly explainedhere.
bc hc bb hb N e
�0.1393 �0.3189 �0.2319 0.2963 0.3292 �0.24710.0996 0.1996 �0.1032 0.0353 0.1564 �0.3349

288 M. Unal, B. Burak / Engineering Structures 52 (2013) 284–294
JT is a parameter that takes into account the effect of the con-finement provided by the surrounding beams as defined in Fig. 2.This parameter is based on the ACI-ASCE Committee 352 [15] jointclassification for Type 2 connections and the arrangement of beamsin the test setup.
The joint shear resistance is based on (fc�fy)1/6, which gives sim-ilar results to the
ffiffiffiffif 0c
papproach of ACI-ASCE Committee 352 Rec-
ommendations [15] for regular strength concrete and jointtransverse reinforcement, but more improved results for connec-tion regions with lower yield strength transverse reinforcement.
G is the elastic shear modulus defined by the followingequation:
G ¼ E2ð1þ mÞ ð2Þ
qjoint is a parameter that depends on the volumetric joint transversereinforcement ratio for one layer of confinement reinforcement:
Wide Beam Effect ðWBÞ ¼ 1� hbbb� bj
bb; when wide beams are present in the loading direction
1; when wide beams are not present in the loading directionð7Þ
qjoint ð%Þ ¼ 1:0 if qonelayer < 1:0
qjoint ð%Þ ¼ ðqonelayerÞ0:5 if qonelayer P 1:0
and qonelayer ¼Ao � leff
hc;core � bc;core�s
ð3Þ
EE shows the reduction in joint strength due to the presence ofeccentricity:
Eccentricity Effect ðEEÞ ¼
ffiffiffiffiffiffiffiffiffiffiffiffiffiffiffiffiffiffi1
1þ e=bc
sð4Þ
CI is the column index based on column aspect ratio that is usedto account for the reduction of effective joint area in rectangularcolumns:
Column Index ðCIÞ ¼
ffiffiffiffibchc
qwhen bc
hc< 1:0
1:0 when bchc
P 1:0ð5Þ
NE defines the confinement effect due to axial load:
Axial Load Effect ðNEÞ ¼ 1þ NAg � fc
ð6Þ
WB gives the reduction in strength when wide beams are pres-ent in the loading direction:
SI defines the confinement of the connection region due to thepresence of a floor system. In order to take the presence of slab into
A B C
Fig. 2. Joint types and joint type index (JT
account the effective beam width defined in ACI Committee 318Building Code Requirements [14] and the reinforcement placedin the flange are considered. The nominal moment strength forthe flanged section is calculated and divided to that of the rectan-gular beam section having same depth and web width:
Slab Index ðSIÞ ¼MnðFlanged SectionÞ
MnðRectangular SectionÞ ; when slab is present
1; when slab is not presentð8Þ
3. Analytical verification of the joint model
After the parametric joint model that predicts the experimentalbehavior is generated and calibrated, the specimens are analyzedusing Perform 3D v4.0 [33] which is a commercially available non-linear dynamic analysis program. Beams, columns and connectionregions are modeled individually and cyclic loading that was ap-
plied in the experiment is imposed to the specimen models by cre-ating a ground acceleration record. Finally, the analytical resultsand the experimental results are compared for the verification ofthe joint model.
The model for interior connection regions consists of two col-umns, two beams and a joint panel zone element; whereas forthe exterior connections, two columns, one beam and a joint panelzone element are used (Fig. 3). Majority of the selected experi-ments had a test set-up similar to the one shown in Fig. 3a, wherethe lateral load was applied to the top of the column. However, forsome experiments on exterior connections, the beams werealigned vertically as in Fig. 3b and the load was applied at the beamend. The details of each individual subassembly model are givenbelow:
3.1. Beam element
The beam element is defined as a frame compound componentincluding three basic components which are rigid end zone at thebeam end, semi-rigid moment connection hinge next to the rigidend zone and a uniform elastic cross-section. For the elastic sec-tion, cracked stiffness, that is taken as 35% of the gross stiffness[14], is considered (Fig. 4a) and the rigid end zone length is se-lected as half of the column width.
D E
) values for computations in SI units.

Fig. 5. Beam moment versus plastic hinge rotation relationship.
Fig. 6. Moment through connection versus shear strain relationship.
(a) (b)
Fig. 4. Details of the subassembly components.
Fig. 3. Specimen models.
M. Unal, B. Burak / Engineering Structures 52 (2013) 284–294 289
Semi-rigid moment connection hinges are the main compo-nents that represent the inelastic activity in the beams. In orderto get the inelastic moment–rotation relationship, first the mo-ment–curvature behavior of the beams is obtained by Response2000 [34]. Afterwards, the rotation values are obtained by multi-plying the curvature values by the plastic hinge length that is takenas the half of the effective beam depth (Lp = 0.5d). As a result, themoment–rotation relationship shown in Fig. 5 is used in definingsemi-rigid moment connection hinges. A 20% strength decreasewas assumed to occur at higher rotation values based on the exper-imental results.
3.2. Column element
Similar to the beam element, the column element was mod-eled as a frame compound component consisting of a rigid end
zone at the end of the column, an inelastic P-M-M hinge andan elastic column cross-section at the free end. The cracked iner-tia of the column elastic segment is taken as the 70% of thegross inertia [14]. The column compound element is also illus-trated in Fig. 4a. The rigid end zone length is taken as half ofthe beam depth.
Zero-length P-M-M hinges are employed, which are rigid-plastic hinges that remain elastic up to a moderate load level.Because, the inelastic activity in the columns is not as signifi-cant as the one in the beams and they remain mostly in theelastic range due to strong column–weak beam design approach.For defining these hinges, moment versus axial load yield (inter-action) surfaces are plotted and utilized in defining thecomponent.

Fig. 7. Lateral load versus story drift responses – specimens of Burak and Wight [1].
(a) (b)
Fig. 8. Joint shear stress versus joint shear distortion responses – specimens of Burak and Wight [1].
290 M. Unal, B. Burak / Engineering Structures 52 (2013) 284–294
3.3. Joint element
In order to represent the inelastic activity in the joint region,connection panel zone element in Perform 3D is utilized
(Fig. 4b). This element has only one node that is taken at the inter-section of beam and column axes. The rigid end zones of beam andcolumn elements are connected to rigid links of the panel zone(Fig. 4a). A rotational spring attached to the panel zone has a non-

Fig. 9. Beam moment versus beam plastic hinge rotation responses – specimens of Burak and Wight [1].
Fig. 10. Story shear versus story drift responses – specimens of Raffaelle and Wight [29].
M. Unal, B. Burak / Engineering Structures 52 (2013) 284–294 291
linear moment–rotation relationship that enables the definition ofthe inelastic behavior.
As described before, the inelastic behavior of the joint is definedby parametric equations. Using these equations, inelastic jointshear strength versus shear strain relationships are generated for
connection regions. However, since the connection element re-quires the joint moment versus shear strain relationship of theconnection region in Perform 3D, shear stress values are convertedto moment values by multiplying them by the effective joint width(bj) and the column depth (hc) to obtain the joint shear force and

Fig. 11. Joint shear versus joint deformation responses – specimen 2 of Raffaelle and Wight [29].
Fig. 12. Beam moment versus rotation response – specimen 2-S of Burak and Wight[1].
292 M. Unal, B. Burak / Engineering Structures 52 (2013) 284–294
the depth of the beam between the top and the bottom reinforce-ment layers (d0 0) to obtain the moment through connection (Eq.(9)).
Mj ¼ v j � bj � hc � d00 ð9Þ
The above-mentioned procedure was carried out for all criticalshear strain points discussed earlier and eventually joint momentversus shear strain relationship was obtained. The test results indi-cated a connection strength decrease of about 20% at high shearstrain levels, therefore, 20% reduction of the ultimate moment isconsidered. The resulting moment through connection versusshear strain relationship is illustrated in Fig. 6.
4. Results of analytical verification
The proposed joint model is verified analytically by using Per-form 3D. As it is stated earlier, the subassemblies that were testedunder quasi-static loading are modeled and ground accelerationrecords that exactly simulates the displacement histories appliedto the subassemblies during the tests are imposed to the speci-mens, because of the limitation of Perform 3D in defining cyclicloading. The analytical results are presented below and comparedwith the experimental results in order to test the validity and accu-racy of the model.
4.1. Specimens of Burak and Wight [1]
Specimen 2-S, 3-S, 2-N and 3-N of this experimental study,which have the same displacement history applied during theexperiment, are analyzed under dynamic earthquake loading. Thematerial strengths and geometric properties of these specimensare presented in Table 1. The main variables considered in thisexperimental study are eccentricity, beam width to column widthratio, column aspect ratio and the presence of slab. Both experi-mentally and analytically obtained lateral load versus story driftresponses are shown in Fig. 7. As it can be observed from this fig-ure, analytical lateral load response represents the experimentalone realistically, except for pinching, which cannot be modeledusing Perform 3D. As a result of this limitation of the software,wider loops are observed in the hysteresis curves. Nevertheless,this does not affect the main objective of this study which is toestimate the envelope behavior of the connection region and themaximum values for lateral load, story drift, joint shear stressand distortion. Specimens 2-S and 3-S have good predictions ofmaximum story shear, therefore, even the cyclic degradation inhigher drift levels closely matched with the experimental ones.Specimen 2-N and 3-N also have an acceptable accuracy, however,the prediction in the negative loading direction is not adequate forSpecimen 3-N. This may be due to the wide beam of this specimen,which was intentionally designed not to comply with the ACI-ASCECommittee 352 Recommendations [15] in terms of the memberdepth required to provide adequate confinement to the connectionregion.
The comparison of the analytical and experimental response ofjoint shear strength versus distortion is presented in Fig. 8. Themaximum joint shear strengths of the analytical models are signif-icantly close to the experimental values. After the maximum shearstrength has been reached, the analytical behavior diverged fromthe experimental behavior, especially for specimens such as 3-S,which does not have adequate confinement provided by theadjoining members [3].
Finally, the beam end moment versus plastic hinge rotationcurves are compared in Fig. 9. As for the load–deformation re-sponse, the analytical model has good correlation with the exper-imental results in terms of beam plastic hinge response.Therefore, a realistic assessment of the beam behavior in termsof moment capacity, maximum inelastic rotations and their contri-bution to the total story drift can be performed by using these ana-lytical results.

Table 3Displacements due to joint shear distortions and their contribution to total story drift at 2% drift level.
Specimen Displacement due to joint shear distortion (mm) Total displacement (mm) Contribution of joint shear distortion (%)
Burak and Wight [1] 2-S 20.84 51.80 40.243-S 14.07 51.80 27.172-N 6.12 51.80 11.823-N 21.83 51.80 42.13
Kaku and Asakusa [23] Specimen 1 3.94 30.80 12.80Specimen 2 2.93 30.80 9.52Specimen 3 5.70 30.80 18.52Specimen 6 6.29 30.80 20.42Specimen 9 6.10 30.80 19.81Specimen 12 6.43 30.80 20.88
Raffaelle and Wight [29] 1 7.49 44.72 16.752 8.62 44.72 19.283 6.46 44.72 14.444 6.56 44.72 14.66
Shin and LaFave [30,31] SL1 22.95 58.94 38.94SL3 6.58 58.94 11.16
LaFave and Wight [25] EWB1 2.65 44.72 5.92EWB2 2.48 44.72 5.55EWB3 5.45 44.72 12.18ENB1 1.48 44.72 3.31
Average 11.40 44.80 23.24
M. Unal, B. Burak / Engineering Structures 52 (2013) 284–294 293
4.2. Specimens of Raffaelle and Wight [29]
The main variable of the experimental study by Raffaelle andWight [29] is the eccentricity between beam and column center-lines. Besides eccentricity, member dimensions and the reinforce-ment detailing of beams varies in different specimens. Althoughthe column dimensions are the same in all specimens, the effectivejoint width differs due to changes in eccentricity and the beamdepth. The story shear versus story drift curves for the four eccen-tric specimens of Rafaelle and Wight are given in Fig. 10. The enve-lopes of the analytical results match the experimental ones withsignificant accuracy, therefore the analytical joint model is verifiedone more time for the eccentric interior connections. It is observedthat as the eccentricity increases, the ultimate story shear force de-creases. Moreover, Specimen 4 attains the highest strength since ithas the deepest beam and thus the highest flexural strength. Up to3% story drift, the ductility characteristics of all four specimens aresimilar. After that point, the beam width and the eccentricity influ-enced the energy dissipation capacity. For instance the beam widthof Specimen 2 is smaller; therefore it has smoother stiffness degra-dation as captured by the model.
The joint shear versus joint deformation behavior comparisonfor Specimen 2 is presented in Fig. 11. In this figure, the joint shearstress versus strain relationship of the connection panel elementwas compared with the experimental joint response measuredboth at the flush (outer) and offset (inner) joint faces. In order tomake a comparison, the average of both figures should be consid-ered since the panel zone element in the analytical model gives anaverage response. It is observed that the maximum joint shearcapacity is predicted successfully by the analytical model. Besides,the maximum joint strain values also closely match with the aver-age shear deformation response obtained in the experiments. Itshould also be noted that with the presence of a slab the differencein the joint shear distortions will not be this significant on twoopposite faces of the specimen as in the case of Canbolat [3] andShin and LaFave [30].
4.3. Comparison of the joint model with rigid connections
In order to examine the effect of including the joint model in thenonlinear analysis of RC beam-to-column connection subassem-
blies, all specimens are also modeled by assuming the connectionregions as rigid zones. In other words, the specimens are analyzedonce again by removing the joint model. Fig. 12 shows the momentversus rotation response for the beams of Specimen 2-S by Burakand Wight [1]. When the story drift values are kept the same, thebeam rotations are significantly overestimated with the use of rigidconnections, which could lead to improper seismic assessment ofthese members.
The influence of joint shear distortion on total story drift is com-puted at 2% drift level, using analytical shear strains in Eq. (10) [1]and is presented in Table 3. It can be observed from this table thatthe average contribution of the joint shear distortion to the totalstory drift is 18%. This clearly indicates the need for consideringa joint model in nonlinear analysis.
Dj ¼ H � c � 1� hb
H� hc
l
� �ð10Þ
5. Summary and conclusions
The main objective of this study is to develop an analytical jointmodel to predict the inelastic behavior of reinforced concretebeam-to-column connections subjected to earthquake loading thatcan be incorporated into commercial software programs. For thispurpose, first, an experimental database of reinforced concreteconnection subassemblies is generated which includes materialproperties, geometric characteristics and the test results undercyclic loading [13]. Then, a set of equations are developed to esti-mate the critical joint strength and strain values which give mini-mum average error and the highest correlation with theexperimental values. While carrying out these steps, the guidelinesgiven in ACI Committee 318, Building Code Requirements forStructural Concrete [14], and ACI-ASCE Committee 352 Recom-mendations for Design of Beam–Column Connections in Mono-lithic Reinforced Concrete Structures [15] are followed. Theconnection subassemblies are modeled and the cyclic loading his-tories followed in the experiments are applied analytically usingPerform 3D [33]. Finally, the analytical results obtained by consid-ering the joint model and rigid connections are compared with theexperimental ones. Based on the results of the analytical study, thefollowing conclusions can be drawn:

294 M. Unal, B. Burak / Engineering Structures 52 (2013) 284–294
1. The envelope of the nonlinear hysteretic behavior of the jointcan be predicted by considering three critical points at whichsignificant slope changes are observed. A simple and conserva-tive trilinear joint model is developed, which represents thisnonlinear behavior, to be used in inelastic analysis and designapplications. The nonlinear analysis is performed using com-mercially available software, so that this joint model can alsobe utilized in practical engineering applications. By slightlyincreasing the computational time, more conservative esti-mates of drift can be obtained, as well as the inelastic responsesof the connection regions.
2. The proposed joint model is integrated to the subassemblymodel as a panel zone element. Beams are modeled by consid-ering their moment versus rotation relationships, and for col-umns, in addition to moment versus rotation curves, theinteraction diagrams are obtained. The joint model is verifiedby comparing the experimental results with the analyticalresponse in terms of overall lateral load–story drift relationship,joint element response, and beam plastic hinge response. It isobserved that, in general, the seismic behavior of beam-to-col-umn connection subassemblies is reasonably predicted not onlyfor the overall lateral load–story drift response, but also for theelement responses.
3. The significance of concrete compressive strength, axial loadand volumetric joint transverse reinforcement ratio on the jointshear response is also verified by this analytical study.
4. When analytical results considering the joint model and rigidconnections are compared, it is concluded that assuming a rigidconnection region in modeling results in underestimation of thestory drifts and overestimation of the beam plastic hinge rota-tions, which leads to improper assessment of the seismic per-formance of the overall structure and the structural members.
5. The contribution of joint shear distortions to the total story driftare computed and it is observed that in average 18% of the storydrift is due to joint shear deformations.
References
[1] Burak B. Seismic behavior of eccentric reinforced concrete beam–column–slabconnections. PhD thesis, University of Michigan, Ann Arbor; 2005.
[2] Canbolat BB. Structural applications of a reinforced concrete beam–column–slab connection model for earthquake loading. In: The 14th world conferenceon earthquake engineering, Beijing, China; October 12–17, 2008.
[3] Canbolat BB, Wight JK. Experimental investigation on seismic behavior ofeccentric reinforced concrete beam–column–slab connections. ACI Struct J2008:154–62 [Title no. 105-S16].
[4] Ghobarah A, Biddah A. Dynamic analysis of reinforced concrete framesincluding joint shear deformation. Eng Struct 1999;21(11):971–87.
[5] Dhakal RP, Pan T, Irawan P, Tsai K, Chen C. Experimental study on the dynamicresponse of gravity-designed reinforced concrete connections. Eng Struct2005;27(1):75–87.
[6] Lee J, Kim J, Oh G. Strength deterioration of reinforced concrete beam–columnjoints subjected to cyclic loading. Eng Struct 2009;31(9):2070–85.
[7] Parra-Montesinos GJ, Wight JK. Prediction of shear strength and sheardistortion in R/C beam–column joints SP197-10; 2002.
[8] Lowes NL, Altoontash A. Modeling of reinforced-concrete beam–column jointssubjected to cyclic loading. J Struct Eng 2003;129(12):1686–97.
[9] Mitra N, Lowes NL. Evaluation, calibration, and verification of areinforced concrete beam–column joint model. J Struct Eng 2007;133(1):105–20.
[10] Shin M, LaFave JM. Modeling of cyclic joint shear deformation contributions inRC beam–column connections to overall frame behavior. Struct Eng Mech2004;18(5):645–69.
[11] Kim J, LaFave JM. Key influence parameters for the joint shear behaviour ofreinforced concrete (RC) beam–column connections. Eng Struct2007;29(10):2523–39.
[12] Kim J, LaFave JM. Probabilistic joint shear strength models for design ofRC beam–column connections. ACI Struct J 2008:770–80 [Title no. 105-S71].
[13] Unal M, Burak B. Joint shear strength prediction for reinforced concrete beam-to-column connections. Struct Eng Mech 2012;41(3).
[14] ACI Committee 318, 2011. Building code requirements for structuralconcrete, ACI 318-11. American Concrete Institute, Farmington Hills,Michigan; 2011.
[15] ACI-ASCE Committee 352, 2002. Recommendations for design of beam–column connections in monolithic reinforced concrete structures. ACI 352R-02. American Concrete Institute, Farmington Hills, Michigan; 2002.
[16] Chen CC, Chen G. Cyclic behavior of reinforced concrete eccentric beam–column corner joints connecting spread-ended beams. Technical paper.. ACIStruct J 1999:443–50 [Title no. 96-S50].
[17] Durrani AJ, Wight JK. Behavior of interior beam-to-column connections underearthquake-type loading. ACI Struct J 1985:343–9 [Title 82-30].
[18] Ehsani MR, Alameddine F. Design recommendations for type 2 high-strengthreinforced concrete connections. Technical paper. ACI Struct J 1991:277–90[Title no. 88-S30].
[19] Ehsani MR, Wight JK. Exterior reinforced concrete beam-to-columnconnections subjected to earthquake-type loading. Technical paper. ACIStruct J 1985:492–9 [Title no. 82-43].
[20] Fujii S, Morita S. Comparison between interior and exterior RC beam–columnjoint behavior. Design of beam–column joints for seismic resistance – ACI1991. p. 145–65.
[21] Gentry TR, Wight JK. Wide beam–column connections under earthquake-typeloading. Earthq Spectra 1994;10(4):675–702.
[22] Guimaraes GN, Kreger ME, Jirsa JO. Evaluation of joint-shear provisions forinterior beam–column–slab connections using high-strength materials.Technical paper. ACI Struct J 1992:89–98 [Title no. 89-S10].
[23] Kaku T, Asakusa H. Ductility estimation of exterior beam-columnsubassemblages in reinforced concrete frames. Design of beam-columnjoints for seismic resistance. ACI SP-123; 1991. p. 167–85.
[24] Kitayama K, Otani S, Aoyama H. Development of design criteria for RCinterior beam–column joints. ACI SP-123 design of beam–column jointsfor seismic resistance. American Concrete Institute, Michigan; 1991. p. 97–123.
[25] LaFave JM, Wight JK. Reinforced concrete exterior wide beam–column–slabconnections subjected to lateral earthquake loading. ACI Struct J 1999:577–86[Title no. 96-S64].
[26] Lee HJ, Ko J. Eccentric reinforced concrete beam–column connectionssubjected to cyclic loading in principal directions. ACI Struct J 2007:459–67[Title no. 104-S44].
[27] Shiohara H. New model for shear failure of RC interior beam–columnconnections. J Struct Eng 2001;127(2):152–60.
[28] Quintero-Febres CG, Wight JK. Experimental study of reinforced concreteinterior wide beam–column connections subjected to lateral loading. ACIStruct J 2001:572–81 [Title no. 98-S55].
[29] Raffaelle SG, Wight JK. Reinforced concrete eccentric beam–columnconnections subjected to earthquake-type loading. ACI Struct J 1995:45–55[Title no. 92-S6].
[30] Shin M, LaFave JM. Seismic performance of reinforced concrete eccentricbeam–column connections with floor slabs. ACI Struct J 2004:403–12 [Title no.101-S41].
[31] Shin M. Performance of reinforced concrete edge beam–column–slabconnections subjected to earthquake loading. PhD thesis, University ofIllinois at Urbana – Champaign, Urbana – Illinois; 2004.
[32] Teng S, Zhou H. Eccentric reinforced concrete beam–column joints subjectedto cyclic loading. ACI Struct J 2008:139–48 [Title no. 100-S15].
[33] Computers and Structures Inc. (CSI). User manual for PERFORM-3D v4.0,Berkeley, California, USA; August 2006.
[34] Bentz EC. Version 1.1, user manual, response 2000; 2001.