Embed Size (px)
Citation preview
DEVELOPMENT AND ANALYSIS OF ULTRASONIC ASSISTED FRICTION STIR WELDING PROCESS
by
Kwanghyun Park
A dissertation submitted in partial fulfillment of the requirements for the degree of
Doctor of Philosophy (Mechanical Engineering)
in The University of Michigan 2009
Doctoral Committee:
Professor Jun Ni, Chair Professor James R. Barber Professor Jyotirmoy Mazumder Professor Jwo Pan Professor Nickolas Vlahopoulos

reserved rights All
ParkKwanghyun
2009

ii
To Jinhee
iii
ACKNOWLEDGEMENTS
I would like to acknowledge Professor Jun Ni, my graduate advisor and committee
chairman, for initiating my research at S. M. Wu Manufacturing Research Center.
Without his continuous support and guidance, this work would not have been possible.
I would also like to extend my sincere gratitude to Professor James Barber, Professor
Jyoti Mazumder, Professor Jwo Pan, and Professor Nickolas Vlahopoulos for serving on
my doctoral committee. I appreciate the technical assistance received from Xianli Qiao
and Steve Erskine on handling machines. I would like to express gratitude to Britt Diver
in Weber ultrasonics USA for lending ultrasonic system.
I would also like to thank friends in Wu Manufacturing Research Center for the help
and interaction, and my friends Dr. Ho Choi, Dr. Bong-suk Kim, Dr. Gap-Yong Kim, Jae-
Wook Oh, and Seungchul Lee for the wonderful moments we have shared.
I am grateful to my parents and parents-in-laws for their care of me throughout the
years. Last but not least I would like to thank my lovely wife, Jinhee Han and my
adorable children, Shinyoung and Yoonyoung for supporting me and encouraging me to
pursue this degree.
iv
TABLE OF CONTENTS
DEDICATION…………………………………………………………………………....ii
ACKNOWLEDGEMENTS ............................................................................................ iii
LIST OF FIGURES ......................................................................................................... vi
LIST OF TABLES ............................................................................................................ xi
ABSTRACT ..................................................................................................................... xii
CHAPTER 1 - INTRODUCTION ................................................................................... 1
1.1 BACKGROUND AND MOTIVATION .............................................................................. 1 1.2 RESEARCH OBJECTIVES ............................................................................................ 3 1.3 DISSERTATION ORGANIZATION ................................................................................. 5
CHAPTER 2 - LITERATURE REVIEW ON FRICTION STIR WELDING AND ULTRASONIC ASSISTED PROCESSING ................................................................... 6
2.1 GENERAL OVERVIEW OF FRICTION STIR WELDING .................................................. 6 2.2 ULTRASONIC ASSISTED PROCESSING ...................................................................... 13
2.2.1 Ultrasonic assisted forming .................................................................. 14 2.2.2 Ultrasonic Machining ........................................................................... 18 2.2.3 Ultrasonic welding ................................................................................ 22
CHAPTER 3 - PRELIMINARY EVALUATION FOR ULTRASONIC ASSISTED FRICTION STIR WELDING ....................................................................................... 25
3.1 OVERVIEW OF FRICTION STIR WELDING EXPERIMENTAL SET-UP AND ITS OPERATION 25 3.2 EXPERIMENTAL INVESTIGATIONS OF THE ULTRASONIC ASSISTED FRICTION STIR
WELDING PROCESS ....................................................................................................... 28 3.2.1 Force measurement during friction stir welding ................................... 28 3.2.2 Mechanical testing of friction stir welded material .............................. 32
3.2.2.1 Tensile test ................................................................................... 33 3.2.2.2 Microhardness test ...................................................................... 35 3.2.2.3 Defect analysis ............................................................................ 37
3.3 FE MODELING OF THE ULTRASONIC ASSISTED FRICTION STIR WELDING ................ 39 3.3.1 FE model of the friction stir welding process ....................................... 39 3.3.2 Heat generation due to ultrasonic vibration .......................................... 42 3.3.3 Result and discussion ............................................................................ 43
3.4 CONCLUSIONS ........................................................................................................ 47
v
CHAPTER 4 - THERMO-MECHANICAL FE MODEL OF ULTRASONIC ASSISTED FRICTION STIR WELDING ................................................................... 49
4.1 INTRODUCTION....................................................................................................... 49 4.2 FEM MODELING .................................................................................................... 52
4.2.1 Thermal models .................................................................................... 52 4.2.2 FE model description ............................................................................ 53
4.2.2.1 FE mesh and geometry ................................................................ 54 4.2.2.2 Material model and interface properties ..................................... 55 4.2.2.3 Boundary conditions ................................................................... 57
4.3 EXPERIMENTAL SETUP AND DESIGN ........................................................................ 58 4.4 VALIDATION OF FEM MODELING OF FSW IN TERMS OF THE WELDING FORCE ........ 59 4.5 EFFECT OF ULTRASONIC ASSISTANCE ON FSW OF LOW MELTING TEMPERATURE
MATERIALS ................................................................................................................... 62 4.6 EFFECT OF ULTRASONIC ASSISTANCE ON FSW OF HIGH MELTING TEMPERATURE
MATERIALS ................................................................................................................... 64 4.7 CONCLUSIONS ........................................................................................................ 68
CHAPTER 5 - EXPERIMENTAL INVESTIGATIONS OF THE ULTRASONIC ASSISTED FRICTION STIR WELDING PROCESS ................................................ 69
5.1 INTRODUCTION....................................................................................................... 69 5.2 DESIGN CONCEPT OF THE ULTRASONIC ASSISTED FSW PROCESS ............................ 70 5.3 ULTRASONIC HORN DESIGN AND FABRICATION ....................................................... 72
5.3.1 Horn design procedure .......................................................................... 73 5.3.2 Design and fabrication of 40kHz ultrasonic horn ................................. 75
5.3.2.1 Horn type selection ..................................................................... 75 5.3.2.2 Tuning process ............................................................................ 78 5.3.2.3 Actual measurement of resonant frequency and amplitude ........ 80
5.3.3 Design and fabrication of 20 kHz ultrasonic horn ................................ 82 5.4 UAFSW OF 6061-T651 ALUMINUM ALLOY ............................................................ 85
5.4.1 Experimental setup ............................................................................... 85 5.4.2 Results with 40 kHz ultrasonic system ................................................. 88 5.4.3 Results with 20 kHz ultrasonic system ................................................. 94
5.5 ULTRASONIC ASSISTED FSW OF HIGH MELTING TEMPERATURE MATERIALS ............ 96 5.6 CONCLUSIONS ...................................................................................................... 101
CHAPTER 6 - CONCLUSIONS AND FUTURE WORK ........................................ 102
6.1 CONCLUSIONS ...................................................................................................... 102
6.2 RECOMMENDATIONS FOR FUTURE WORK ............................................................. 104
BIBLIOGRAPHY……………………………………………………………………..106
vi
LIST OF FIGURES
Figure 2-1 : Schematic drawing of the friction stir welding (Thomas et al. 1991) ............. 6
Figure 2-2 : Schematic drawing of the FSW tool (Mishra and Ma 2005) .......................... 7
Figure 2-3 : (a) Worl tool (b) MX triflute tool (Thomas et al. 2003) .................................. 8
Figure 2-4 : (a) Schematic diagram of microstructural zones in friction stir welds in aluminum (b) micrograph showing various micro-structural zones (Threadgill 1999) ............................................................................................ 9
Figure 2-5 : Peak temperature distribution adjacent to a friction stir weld in 7075AL (Mahoney et al. 1998) ................................................................................... 10
Figure 2-6 : Dependence of travel speed on alloy type and thickness .............................. 13
Figure 2-7 : The reduction in forming force based on superposition mechanism (a) Force reduction by impulses of ultrasonic in the drawing (Pohlman and Lehfeldt 1966) (b) Standing longitudinal wave induced in the sample (Winsper and Sansome 1969) ....................................................................... 15
Figure 2-8 : Material softening with ultrasound (Langenecker 1966) (a) Stress reduction of aluminum in a tensile test during ultrasound irradiation (b) Temperature profile of standard tensile samples after the beginning of ultrasonic irradiation ..................................................................................... 16
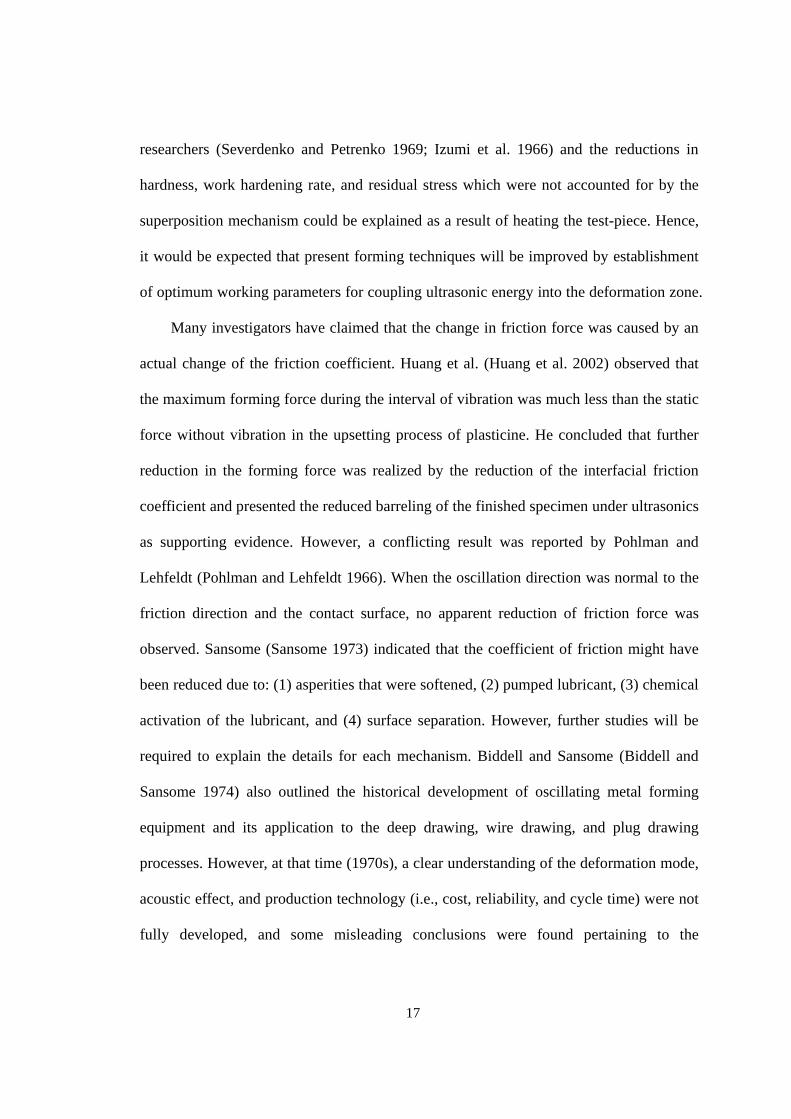
Figure 2-9 : Burrs produced after drilling: 3.18mm drill 6000 RPM, 1.90mm/s federate (Chang and Bone 2005) .................................................................. 18
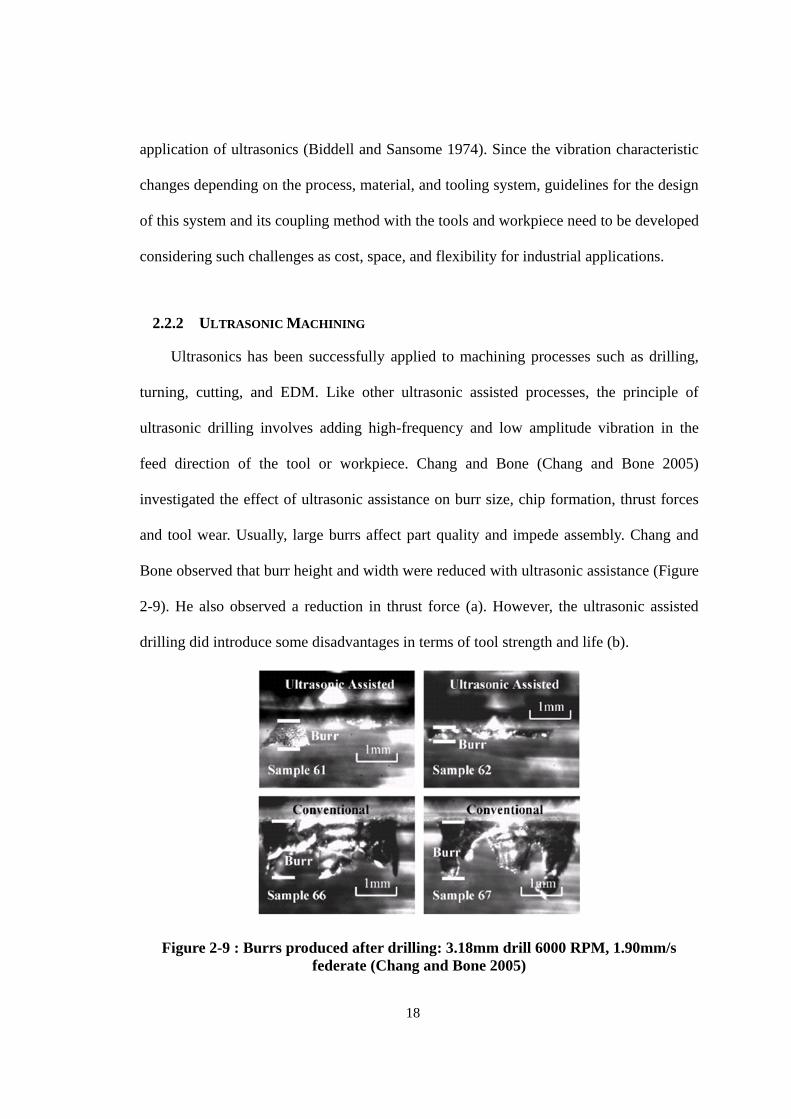
Figure 2-10 : (a) Average thrust force (b) flank wear progression at the outer edge of the cutting tips of four drills (Chang and Bone 2005) .................................. 19
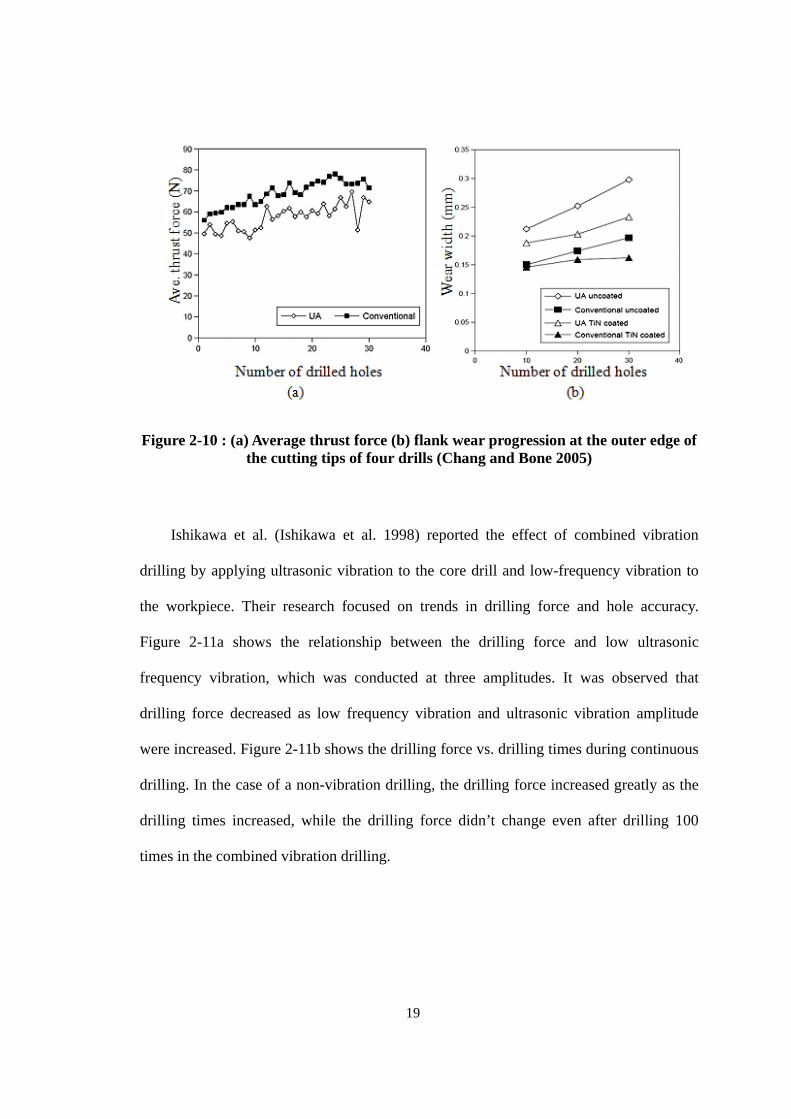
Figure 2-11 : (a) Relationship between the drilling force and low ultrasonic frequency vibration (b) Drilling force vs. drilling time continuous drilling (Ishikawa et al. 1998) ....................................................................... 20
Figure 2-12 : (a) Simulated contact lengths; approaching (I) penetration (II) unloading (III) withdrawal (IV) (Mitrofanov et al. 2003) (b) Temperature evolution for the cutting tip (Mitrofanov et al. 2004) .............. 21
vii
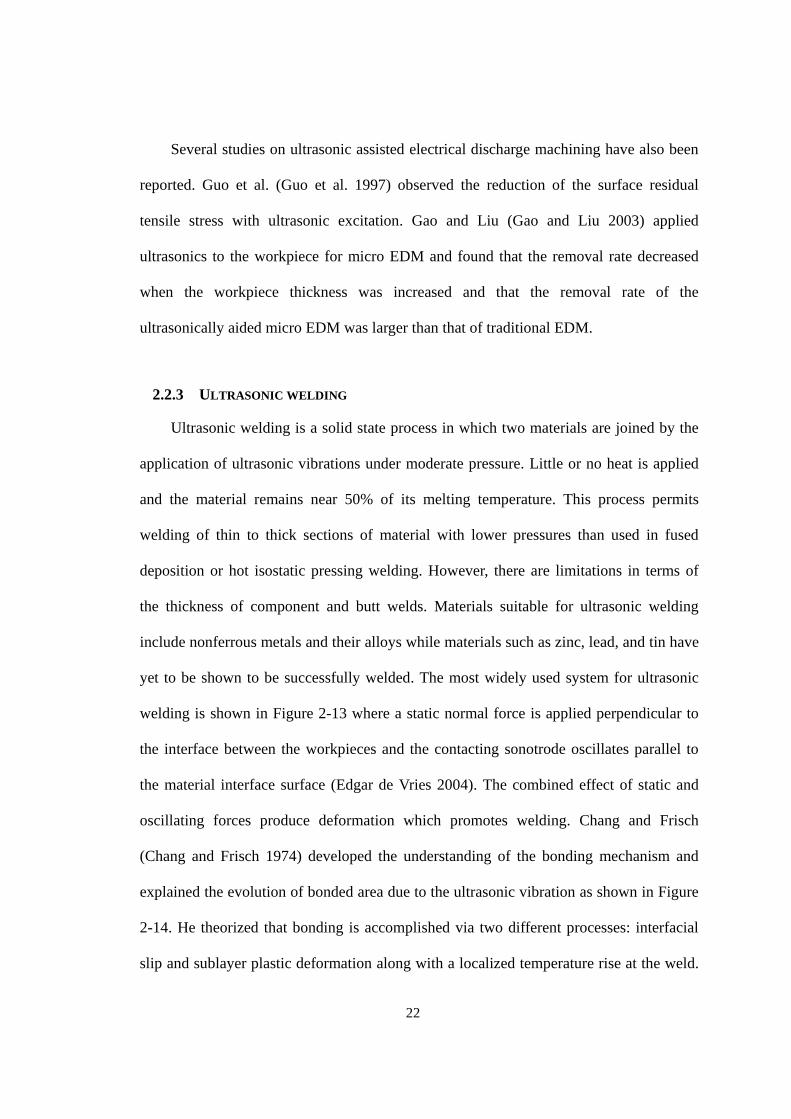
Figure 2-13 : Principle of ultrasonic welding set up for spot welding (Edgar de Vries 2004) ............................................................................................................. 23
Figure 2-14 : Evolution of bonded area due to ultrasonic vibration (Chang and Bone 1974) ............................................................................................................. 23
Figure 3-1 : FSW equipment by the use of Moriseiki CNC machining center ................. 25
Figure 3-2 : Schematic of fixture ...................................................................................... 26
Figure 3-3 : Friction stir welding tool (a) tool clamped in a collar (b) tool size(mm) ...... 28
Figure 3-4 : Axial force (z-direction) and traverse force (x-direction) with respect to time at 1500 rpm rotational speed and 1 in/min translational speed ............. 30
Figure 3-5 : Plot of the axial force vs. translational speed (a) at constant rotation speed (1500rpm) (b) at constant rotation speed (1800rpm) .......................... 31
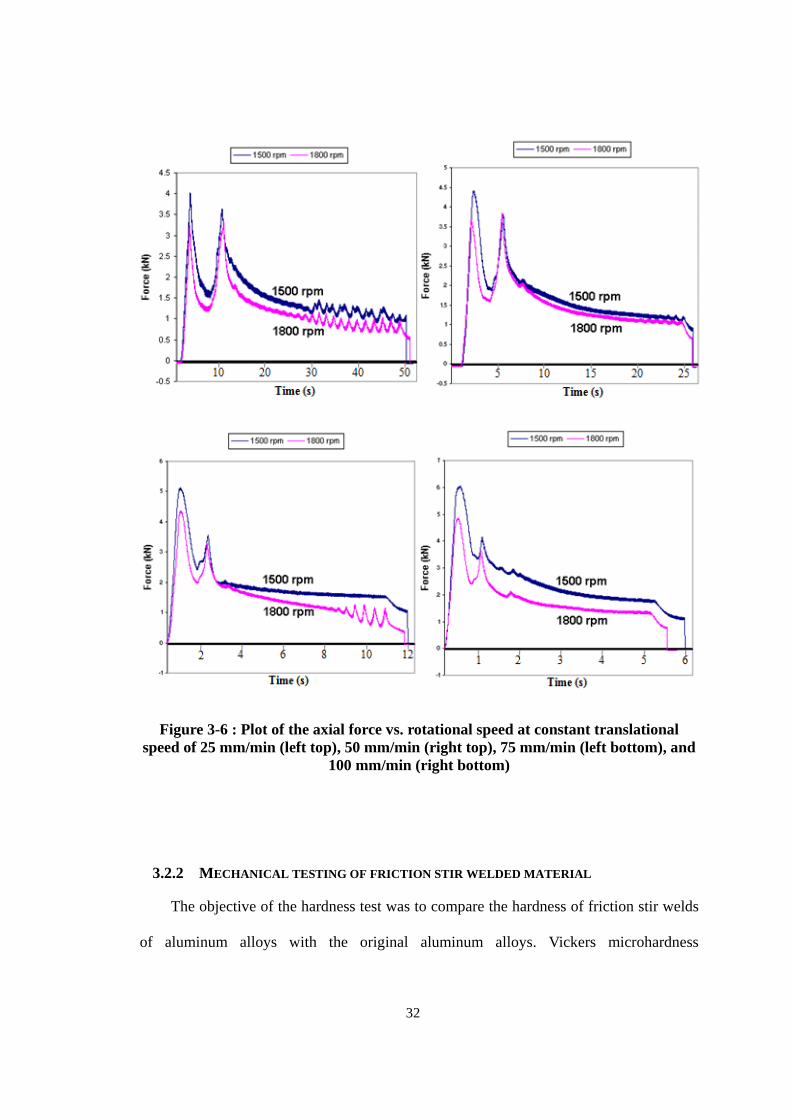
Figure 3-6 : Plot of the axial force vs. rotational speed at constant translational speed of 25 mm/min (left top), 50 mm/min (right top), 75 mm/min (left bottom), and 100 mm/min (right bottom) ..................................................... 32
Figure 3-7 : Schematic of a tensile test specimen ............................................................. 33
Figure 3-8 : (a) Changes in tensile strength and (b) tensile elongation of friction stir welded Aluminum 6061-T651 as a function of rotational and translational speed ......................................................................................... 34
Figure 3-9 : Top view of the failed tensile specimens showing a failure location ............ 35
Figure 3-10 : Vickers hardness and matching cross-section view of the weld at 1800 rpm rotational speed and 75 mm/min translational speed ............................ 36
Figure 3-11 : Surface appearances of the welds (a) weld which has excessive weld flash (b) good weld (c) groove type defect ................................................... 37
Figure 3-12 : Void defect from the cross sectional view ................................................... 38
Figure 3-13 : Schematic diagram of the FSW system considered in the model ............... 40
Figure 3-14 : Temperature-dependant stress-strain curve of 6061-T6 aluminum alloy [Chen and Kovacevic 2003].......................................................................... 40
Figure 3-15 : Overview of ultrasonic assisted FSW process ............................................ 42
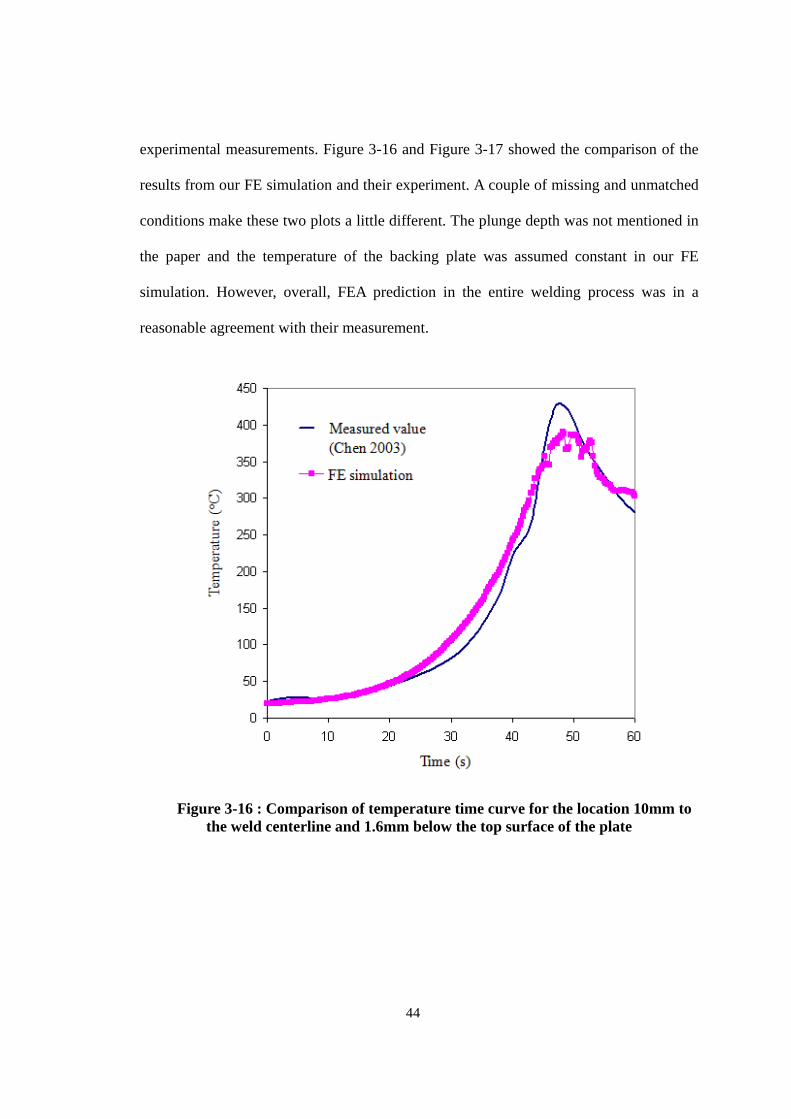
Figure 3-16 : Comparison of temperature time curve for the location 10mm to the weld centerline and 1.6mm below the top surface of the plate ..................... 44
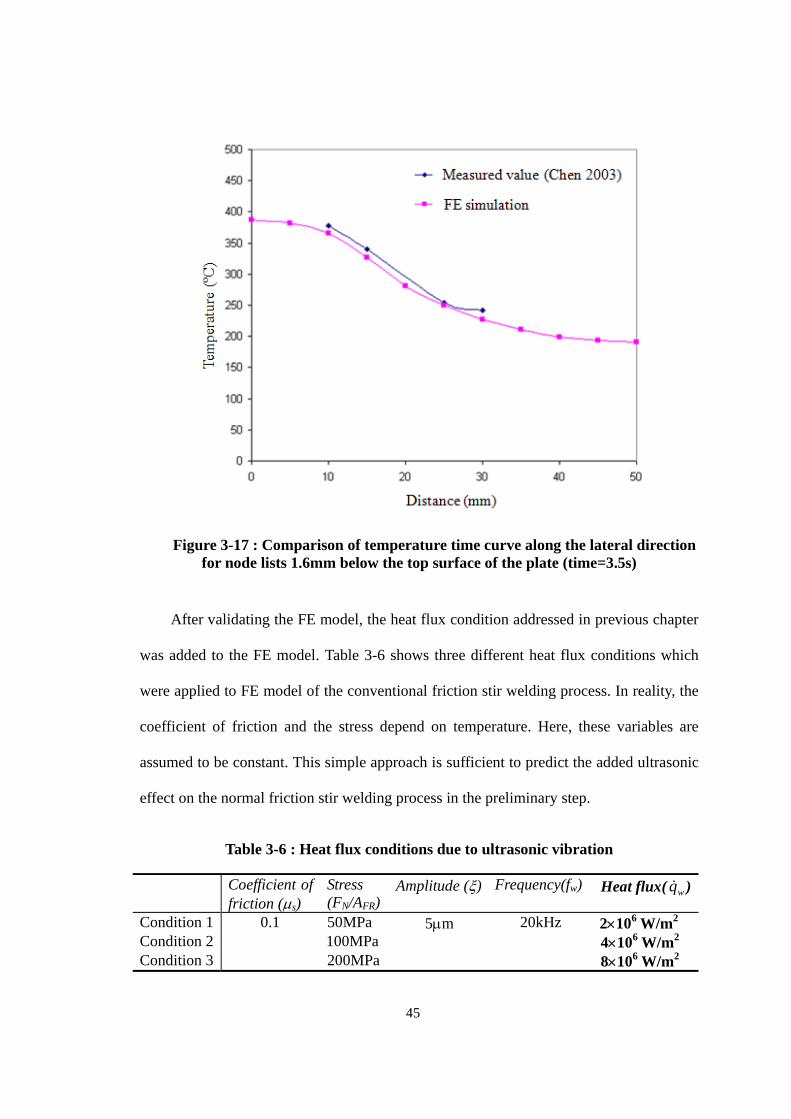
Figure 3-17 : Comparison of temperature time curve along the lateral direction for
viii
node lists 1.6mm below the top surface of the plate (time=3.5s) ................. 45
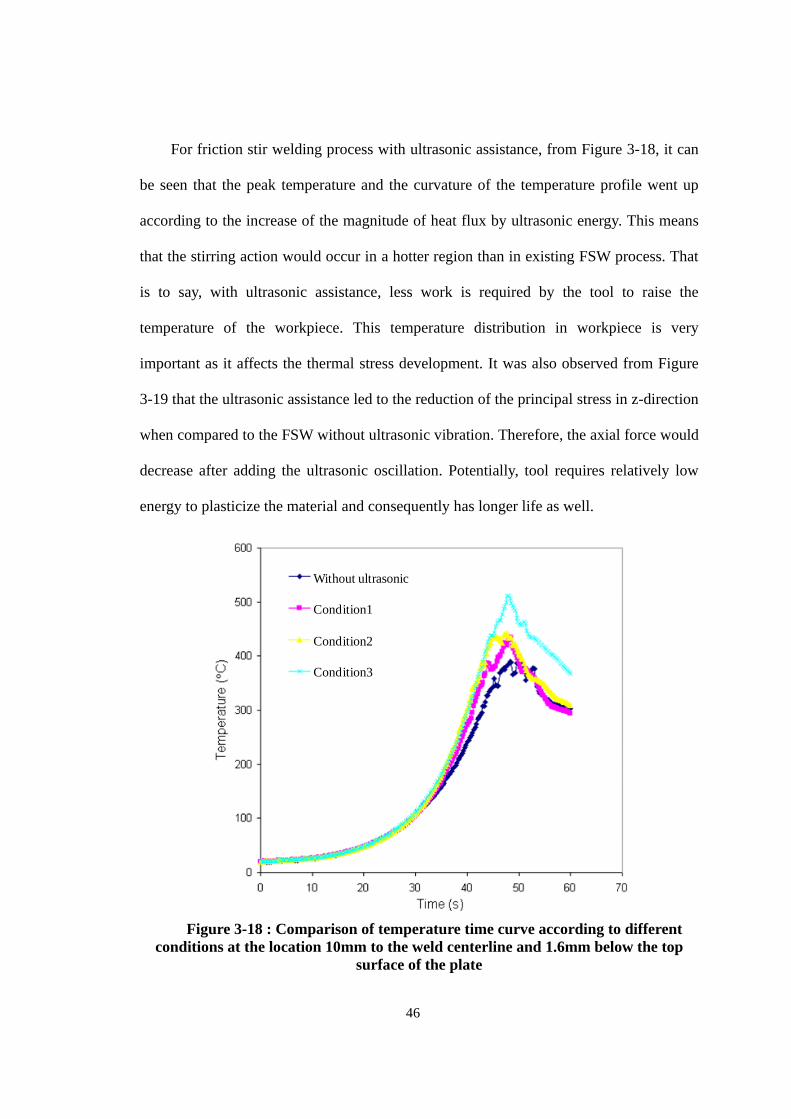
Figure 3-18 : Comparison of temperature time curve according to different conditions at the location 10mm to the weld centerline and 1.6mm below the top surface of the plate ................................................................. 46
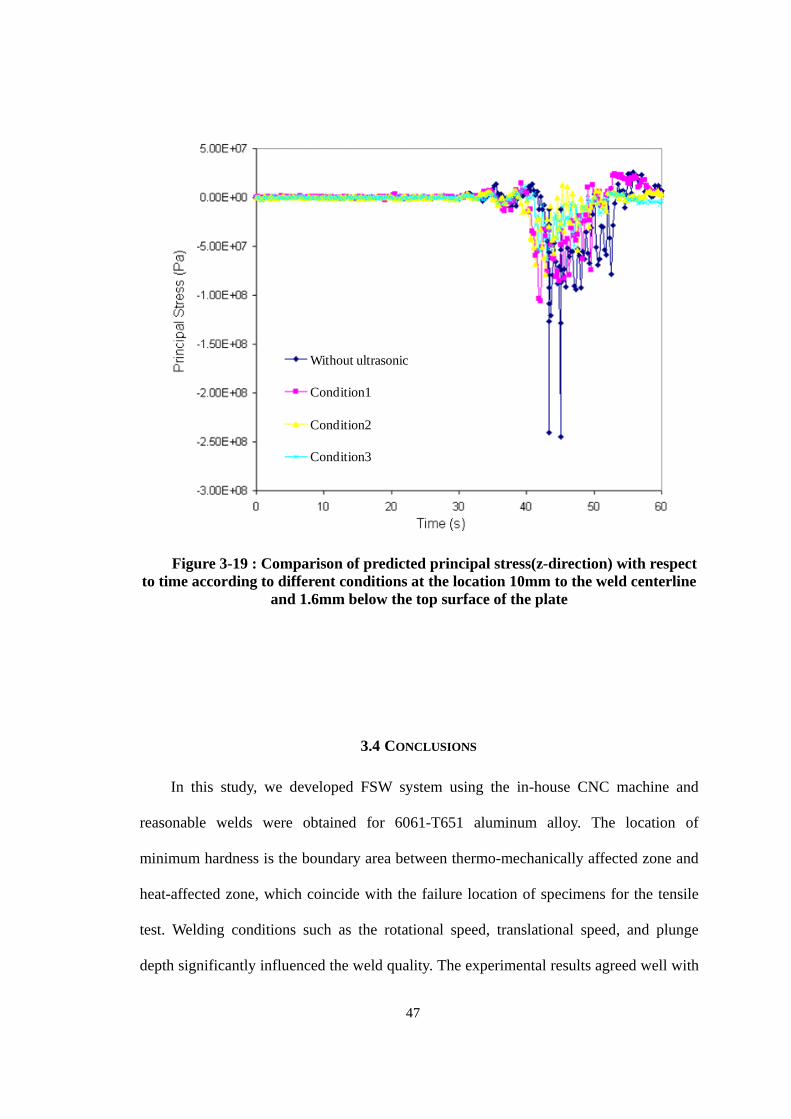
Figure 3-19 : Comparison of predicted principal stress(z-direction) with respect to time according to different conditions at the location 10mm to the weld centerline and 1.6mm below the top surface of the plate ............................. 47
Figure 4-1 : Friction stir welding process (Mahoney et al. 1998) .................................... 50
Figure 4-2 : Finite element meshes for workpieces, FSW tool, and backing place .......... 55
Figure 4-3 : The effect of the friction coefficients with 0.2, 0.3, and 0.4 on the plunge forces ................................................................................................. 56
Figure 4-4 : Axial and traverse force profiles during the plunging and welding phases ............................................................................................................ 58
Figure 4-5 : Comparison of forces-time curves between experiment and simulation results ............................................................................................................ 59
Figure 4-6 : Temperature distribution during three steps of the tool travel ...................... 60
Figure 4-7 : Comparison of the experiment vs. simulated plunge force in FSW for 1500 and 1800 rpm speed, and 1 and 2 in/min translational speed .............. 61
Figure 4-8 : Variations of the plunge forces with the tool motion of 1500 rpm rotational speed and 25 mm/min feed rate by imposing ultrasonic vibrations for two amplitudes ....................................................................... 62
Figure 4-9 : Temperature profiles of welding region with and without ultrasonic effect ............................................................................................................. 63
Figure 4-10 : Axial force comparison in FSW (1018 steel, Rotational speed of 650rpm; translational speed of 50 mm/min) ................................................. 66
Figure 4-11 : Axial force comparison with ultrasonic assistance (1018 steel, Rotational speed of 650rpm; translational speed of 50 mm/min) ................. 66
Figure 4-12 : Axial force comparison with ultrasonic assistance (304 stainless steel, Rotational speed of 1000rpm; translational speed of 50 mm/min) ............... 67
Figure 5-1 : Concept configuration of UaFSW ................................................................. 71
Figure 5-2 : Ultrasonic generator by Webber ultrasonics ................................................. 71
Figure 5-3 : Ultrasonic transducer .................................................................................... 72
ix
Figure 5-4 : Assembly configuration of ultrasonic horn used in this study ...................... 74
Figure 5-5 : Criterion of horn dimension. ......................................................................... 74
Figure 5-6 : Different types of horn design: (a) Taper type with rectangular section, (b) Stepped type with rectangular section, and (c) Stepped type with circular section .............................................................................................. 75
Figure 5-7 : Amplitude of horn tip displacement with respect to frequency. Left and right plots describe the amplitude acquired from left and right tip of bearings, respectively .................................................................................... 77
Figure 5-8 : Change in resonant frequency of longitudinal vibration mode after cutting laterally (y-direction) ........................................................................ 79
Figure 5-9 : Change in resonant frequency of longitudinal vibration mode after cutting longitudinally (z-direction) ............................................................... 79
Figure 5-10 : Estimated modal frequencies for 40 kHz horn ............................................ 80
Figure 5-11 : Actual measurement of (a) impedance and (b) phase using HP4192A ....... 81
Figure 5-12 : 40 kHz ultrasonic horn amplitude measured by laser vibrometer .............. 82
Figure 5-13 : Result of modal and harmonic analysis of the stepped type with rectangular section ........................................................................................ 83
Figure 5-14 : Result of modal and harmonic analysis of the stepped type with circular section .............................................................................................. 83
Figure 5-15 : Change in resonant frequency of longitudinal vibration mode after shortening and the final prototype ................................................................ 84
Figure 5-16 : 20 kHz ultrasonic horn amplitude measured by laser vibrometer .............. 85
Figure 5-17 : (a) Schematic drawing of the assembly including a holder and (b) Fabricated horn and fixture ........................................................................... 86
Figure 5-18 : Experimental set-up for UaFSW using Mori Seiki CNC machine ............. 87
Figure 5-19 : Axial forces with respect to time ................................................................. 90
Figure 5-20 : Stress strain curve of welded parts .............................................................. 91
Figure 5-21 : Macroscopic views of weld zone at (a) 1500 rpm, 25mm/min, and without ultrasonics; (b) 1500 rpm, 25mm/min, and with ultrasonics; (c) 1500 rpm, 50mm/min, and without ultrasonics; (d) 1500 rpm, 50mm/min, and with ultrasonics; (e) 1800 rpm, 25mm/min, and without ultrasonics; (f) 1800 rpm, 25mm/min, and with ultrasonics ......................... 92
x
Figure 5-22 : Vickers hardness profiles in weld zone along centerline at different conditions ...................................................................................................... 94
Figure 5-23 : Axial forces with respect to time (Rotational speed of 1500rpm; translational speed of 25 mm/min) ............................................................... 95
Figure 5-24 : Stress strain curve of welded parts (Rotational speed of 1500rpm; translational speed of 25 mm/min) ............................................................... 95
Figure 5-25 : Experimental setup for UaFSW using horizontal CNC machine................ 96
Figure 5-26 : The view of tool used: (a) made of A2 tool steel (b) made of tungsten carbide (10% cobalt) ..................................................................................... 97
Figure 5-27 : Top view of friction stir welded 1018 steel; Upper joint is with ultrasonic and lower one is without ultrasonic ............................................. 98
Figure 5-28 : Effect of ultrasonic vibration on axial forces (Rotational speed of 650 rpm; translational speed of 50 mm/min) ....................................................... 99
Figure 5-29 : Effect of ultrasonic vibration on temperature profiles (Rotational speed of 650 rpm; translational speed of 50 mm/min) ............................................ 99
Figure 5-30 : Axial forces with respect to time (Rotational speed of 650 rpm; translational speed of 25 mm/min) ............................................................. 100
xi
LIST OF TABLES
Table 2-1 : Overview of friction stir welding process .......................................................11
Table 3-1 : Nominal compositions of aluminum alloy 6061-T651 ................................... 26
Table 3-2 : Mechanical properties of aluminum alloy 6061-T651 ................................... 27
Table 3-3 : Guideline for tempering A2 Tool Steel ........................................................... 27
Table 3-4 : Geometry and process variables used for FEA............................................... 41
Table 3-5 : Material properties of A2 tool steel and 6061-T651 aluminum alloy (Alcan 1970; Chen and Kovacevic 2003) ..................................................... 41
Table 3-6 : Heat flux conditions due to ultrasonic vibration............................................. 45
Table 4-1 : Material properties and Johnson-Cook parameters for 1018 steel and 304 stainless steel used in the numerical analysis (Mori et al. 2007; Vural et al, 2003) ........................................................................................................ 65
Table 4-2 : Temperature dependent friction coefficient of steel (Awang et al. 2005) ....... 65
Table 5-1 : Specifications of the 40 kHz ultrasonic generator .......................................... 72
Table 5-2 : Processing parameters .................................................................................... 87
xii
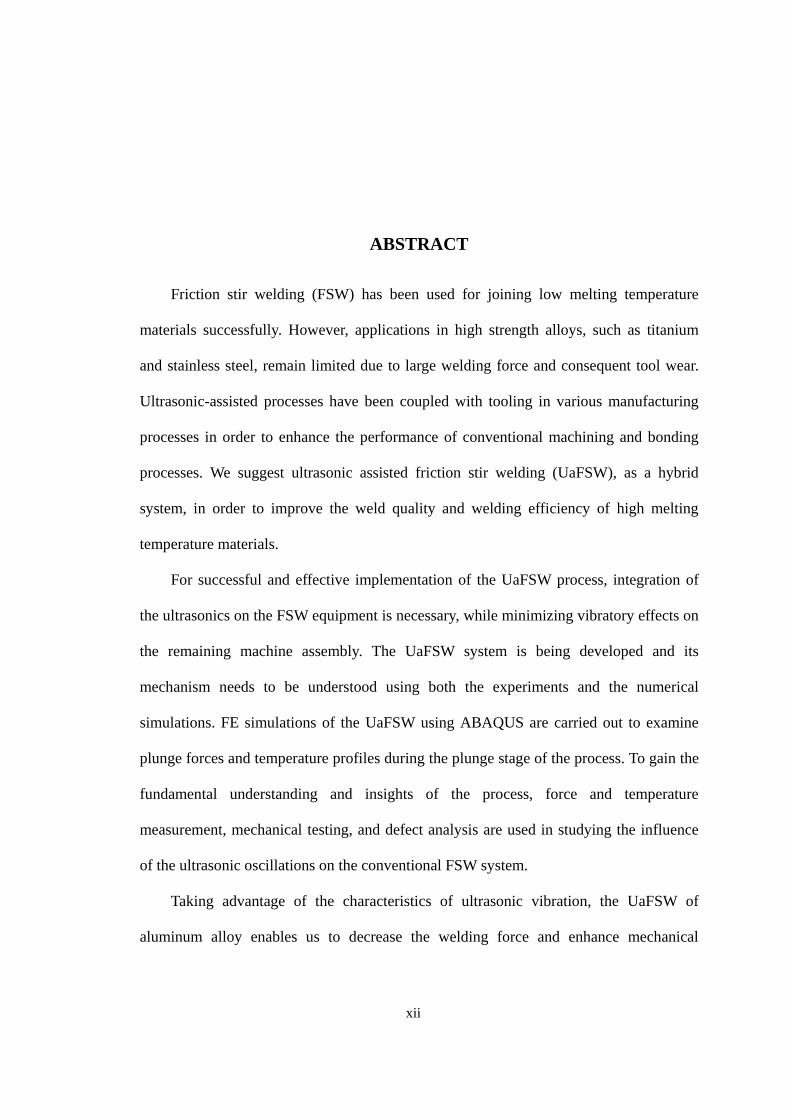
ABSTRACT
Friction stir welding (FSW) has been used for joining low melting temperature
materials successfully. However, applications in high strength alloys, such as titanium
and stainless steel, remain limited due to large welding force and consequent tool wear.
Ultrasonic-assisted processes have been coupled with tooling in various manufacturing
processes in order to enhance the performance of conventional machining and bonding
processes. We suggest ultrasonic assisted friction stir welding (UaFSW), as a hybrid
system, in order to improve the weld quality and welding efficiency of high melting
temperature materials.
For successful and effective implementation of the UaFSW process, integration of
the ultrasonics on the FSW equipment is necessary, while minimizing vibratory effects on
the remaining machine assembly. The UaFSW system is being developed and its
mechanism needs to be understood using both the experiments and the numerical
simulations. FE simulations of the UaFSW using ABAQUS are carried out to examine
plunge forces and temperature profiles during the plunge stage of the process. To gain the
fundamental understanding and insights of the process, force and temperature
measurement, mechanical testing, and defect analysis are used in studying the influence
of the ultrasonic oscillations on the conventional FSW system.
Taking advantage of the characteristics of ultrasonic vibration, the UaFSW of
aluminum alloy enables us to decrease the welding force and enhance mechanical
xiii
properties of welded part in terms of elongation and yield strength. It was shown that
ultrasonic integration on FSW tool helps to decrease the chance of formation of welding
defect. It could be also observed from the experimental results that ultrasonic vibration
helps to decrease the welding forces for welding of high melting temperature material.
Force reduction of 6% during the peak region and 12.5% during the welding one was
observed. For FE analysis of UaFSW, it was predicted that the plunge forces were
reduced by using the ultrasonic vibrations. In addition, it was shown that the plunge
forces could be decreased by increasing the amplitude of vibrations.
1
CHAPTER 1 - INTRODUCTION
1.1 BACKGROUND AND MOTIVATION
A variety of joining processes for metal parts have been employed in various fields
of the manufacturing industry. Depending on the types or combinations of energy, metal
welding processes may be divided into two major groups: (1) fusion welding and (2)
solid-state welding. Fusion welding processes use intense localized heat source to melt
the base metal. Solid-state welding is completed under pressure alone or a combination of
heat and pressure. If heat is used, the temperature in the solid-state welding process is
below the melting temperature.
Friction Stir Welding (FSW) falls in the category of solid state welding which was
invented by The Welding Institute (TWI) in 1991 for joining low melting temperature
alloys like aluminum, magnesium and copper (Thomas et al. 1991). The basic principle
of FSW involves plunging a spinning tool that has a specially designed pin and shoulder
into the workpieces that are intended for welding. Since melting of materials is avoided,
FSW avoids problems such as distortion and metallurgical reactions which typically
appear in conventional fusion welding processes. It is reported that the strength of the
FSW weld is 30% to 50% greater than those produced by arc welding and resistance spot
welding while maintaining the fatigue life comparable to riveted panels (Mendez and
Eagar 2001). However, applications with high temperature materials like steel and
titanium remain limited. Compared with joining of low temperature materials, FSW of
steel requires large plunging and stirring forces, which dictate the use of large FSW
2
equipment. More importantly, the life of a spin tool is significantly reduced in the FSW of
high temperature materials. Frequent replacement of worn-out tools leads to high
production cost, which results in additional cost due to reduced production rate. Moreover,
the use of the damaged tool brings about another problem in terms of welding quality.
Several variations of FSW are being developed to address these problems. One is to
use an induction coil in front of the rotating tool (Reitz 2002; Tweedy et al. 2005). But it
is difficult to focus the induction coil on a specific location, and coil heats all conductive
materials including the tool. Others are using fusion welding apparatus such as laser and
plasma torch (Kohn et al. 2002; Able and Pfefferkorn 2005). These technologies, however,
are still under investigations and are inefficient in terms of energy consumption.
Since the 1950s, the application of ultrasonic energy to the plastic deformation of
metals has been widely investigated. Claims have been made that ultrasonic oscillations
in the tooling reduce static deformation forces, increase processing speeds, and improve
the quality of the product (Sansome 1973). These effects have been demonstrated in
various manufacturing processes such as machining, drilling, welding, etc (Kremer 1981;
Tsujino et al. 2002; Neugebauer and Stoll 2004). Ultrasonic machining and drilling
processes have been successfully demonstrated in machining tough-to-cut alloys such as
titanium (Singh and Khamba 2006).
In this research, we are introducing a new hybrid technology which integrates
ultrasonics to FSW. By integrating the ultrasonics to the FSW process, many benefits are
expected in terms of welding quality, welding force, and tool life.
3
1.2 RESEARCH OBJECTIVES
This research aims to develop a novel ultrasonic-assisted friction stir welding
(UaFSW) technique which may improve the welding process and enhance the welded
part quality. Since the proposed ultrasonic assisted FSW process is a new solid-state
welding process, guidelines for the design and control of the process need to be
developed using theoretical and numerical models. In pursuit of fundamental
understanding of the ultrasonic assisted FSW process and addressing the underlying
scientific and technical challenges systematically, the following key objectives have been
identified: (1) Development of the ultrasonic assisted FSW system. (2) Investigation of
the influence of ultrasonic energy on FSW process. (3) Numerical and experimental
studies of the ultrasonic assisted FSW process, and (4) Application of ultrasonic assisted
FSW in high temperature materials. Specific objectives can be summarized as follows:
1) Development of FSW system and preliminary evaluation of UaFSW process:
FSW system will be established using an in-house CNC drilling machine. Several
welding parameters such as rotational speed, feed rate, and plunge depth will be
measured and analyzed as a function of welding conditions. The FE models of
UaFSW will be developed by using additional heat flux equation. Through the
comparison with experimental results in the literature, the effectiveness of the FE
model will be validated.
2) Thermo-mechanical model of UaFSW process: UaFSW is a hybrid welding
technique, where high frequency vibration is superimposed on the movement of a
rotating tool. The UaFSW system is being developed and its mechanism needs to
4
be understood using both the experiments and the numerical simulations. FE
models of FSW process with ultrasonic assistance will be developed using
available material and friction data in the literature. FE simulations of FSW and
UaFSW using ABAQUS/Explicit will be carried out to examine plunge forces and
temperature profiles during the plunge phase of FSW and UaFSW, respectively.
Once the accuracy of the FSW model is validated by experiments, further FEA
will be performed to gain a comprehensive understanding and to expand
guidelines for the UaFSW process.
3) Development of the ultrasonic assisted FSW system: Ultrasonic energy can be
transmitted into the welding region in a variety of ways. A good design will
consider whether ultrasonic energy should be added to the shoulder, pin,
workpiece, or backing table directly. The optimal means of transmitting the
ultrasonic energy into the welding region while minimizing the vibration leakage
into the rest of the machine must be determined for various geometrical and
material configurations. To gain the fundamental understanding and insights of
the process, it is essential to measure temperature, and welding force generated
during the process. In this study, thrust force measurement, mechanical testing,
and defect analysis will be used in studying the influence of the ultrasonic
oscillations on the conventional FSW system. One of the most critical issues in
FSW of steels is the life of FSW tool. Forces generated during FSW process are
known to be one of important factors in causing the tool breakage. Therefore, the
force and temperature investigations will be carried out for the UaFSW of high
temperature materials.
5
1.3 DISSERTATION ORGANIZATION
Chapter 2 presents the literature review on the friction stir welding and ultrasonic
assisted processes. Chapter 3 presents experimental results of the FSW of 6061 aluminum
alloy and preliminary results on the validation of FE model on the enhancement of FSW
by means of ultrasonics. Chapter 4 concentrates on FE model of UaFSW process carried
out to investigate the mechanism of the process. In Chapter 5, experimental investigations
of the UaFSW process are addressed. In the final chapter, the accomplished work is
summarized and the proposed future work is presented.
6
CHAPTER 2 - LITERATURE REVIEW ON FRICTION STIR WELDING AND ULTRASONIC ASSISTED PROCESSING
2.1 GENERAL OVERVIEW OF FRICTION STIR WELDING
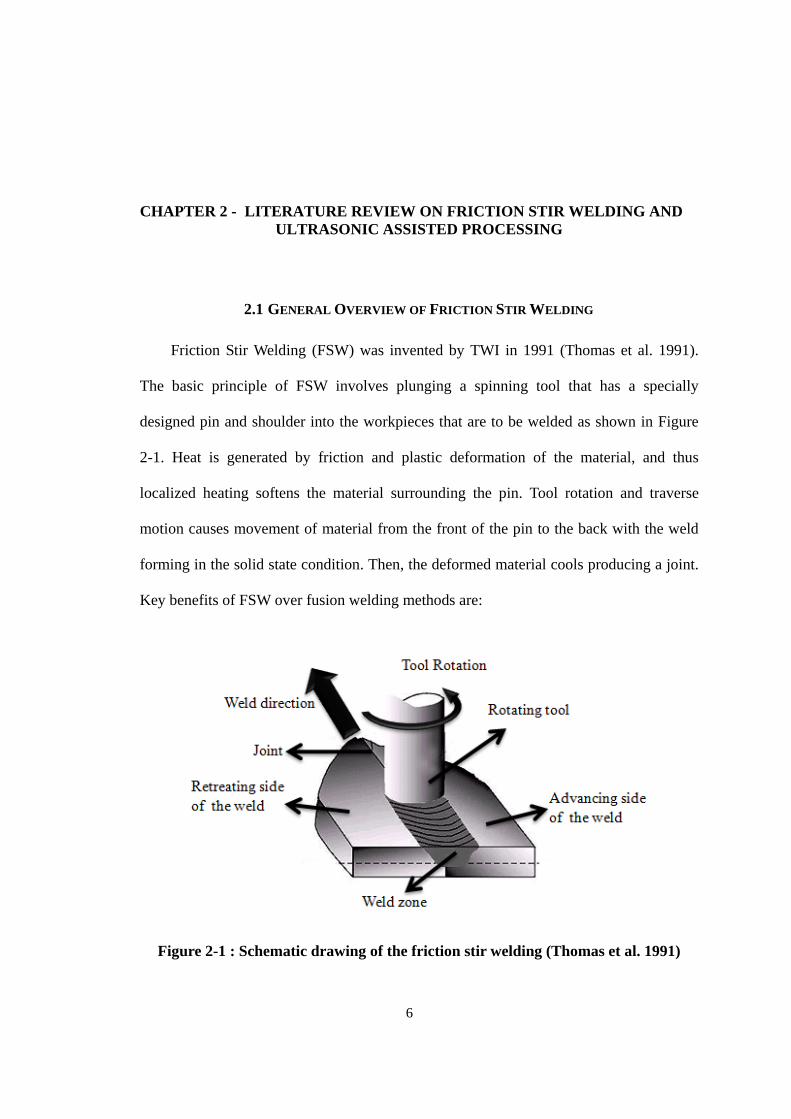
Friction Stir Welding (FSW) was invented by TWI in 1991 (Thomas et al. 1991).
The basic principle of FSW involves plunging a spinning tool that has a specially
designed pin and shoulder into the workpieces that are to be welded as shown in Figure
2-1. Heat is generated by friction and plastic deformation of the material, and thus
localized heating softens the material surrounding the pin. Tool rotation and traverse
motion causes movement of material from the front of the pin to the back with the weld
forming in the solid state condition. Then, the deformed material cools producing a joint.
Key benefits of FSW over fusion welding methods are:
Figure 2-1 : Schematic drawing of the friction stir welding (Thomas et al. 1991)
7
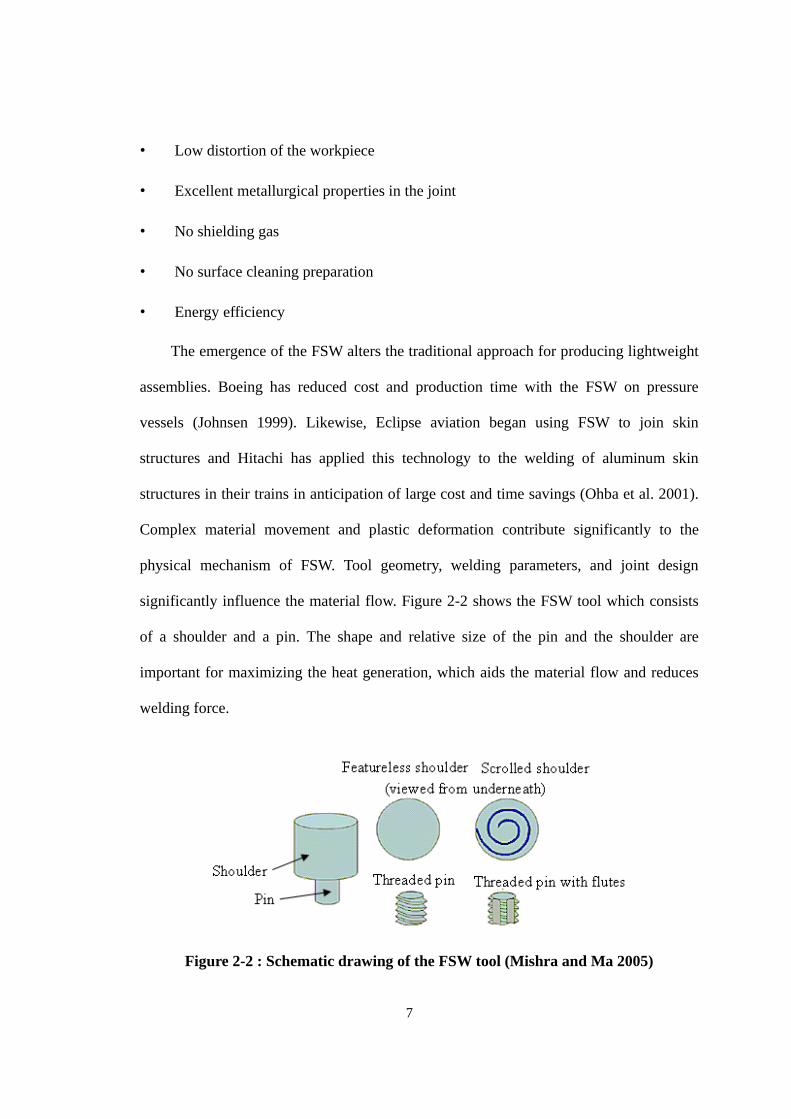
• Low distortion of the workpiece
• Excellent metallurgical properties in the joint
• No shielding gas
• No surface cleaning preparation
• Energy efficiency
The emergence of the FSW alters the traditional approach for producing lightweight
assemblies. Boeing has reduced cost and production time with the FSW on pressure
vessels (Johnsen 1999). Likewise, Eclipse aviation began using FSW to join skin
structures and Hitachi has applied this technology to the welding of aluminum skin
structures in their trains in anticipation of large cost and time savings (Ohba et al. 2001).
Complex material movement and plastic deformation contribute significantly to the
physical mechanism of FSW. Tool geometry, welding parameters, and joint design
significantly influence the material flow. Figure 2-2 shows the FSW tool which consists
of a shoulder and a pin. The shape and relative size of the pin and the shoulder are
important for maximizing the heat generation, which aids the material flow and reduces
welding force.
Figure 2-2 : Schematic drawing of the FSW tool (Mishra and Ma 2005)
8
Three flutes
Left hand helix onOuter diameter lands
(a) (b)
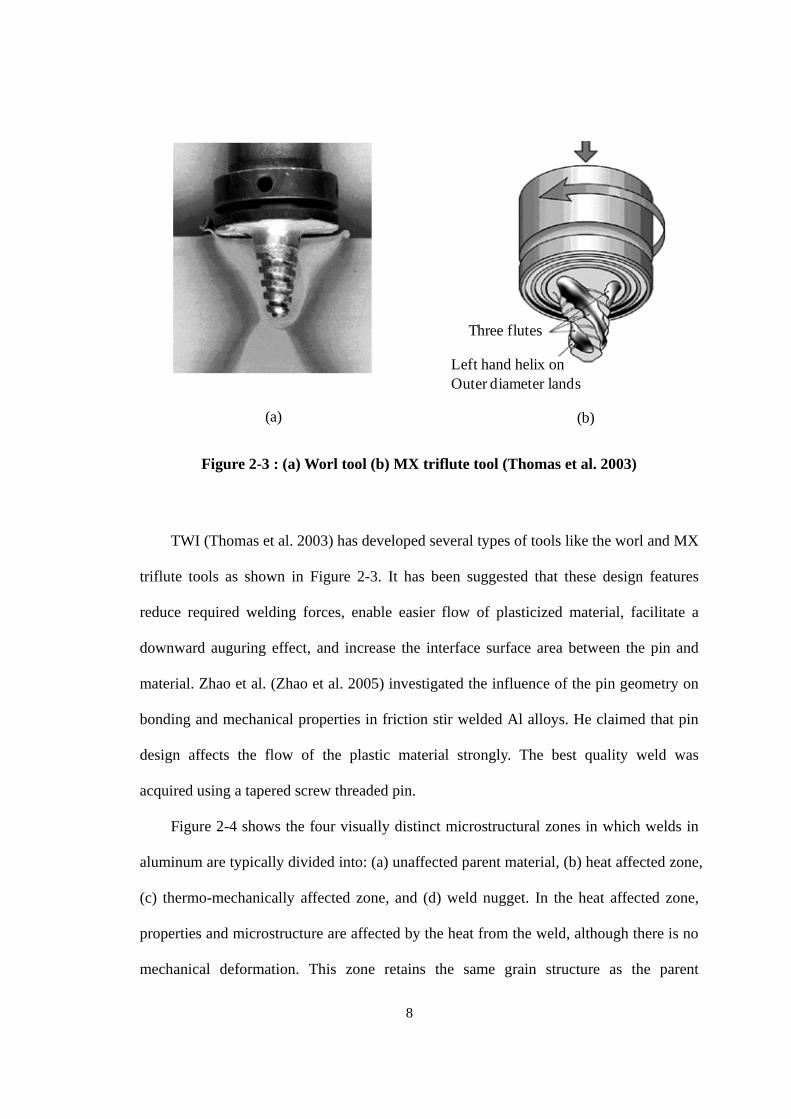
Figure 2-3 : (a) Worl tool (b) MX triflute tool (Thomas et al. 2003)
TWI (Thomas et al. 2003) has developed several types of tools like the worl and MX
triflute tools as shown in Figure 2-3. It has been suggested that these design features
reduce required welding forces, enable easier flow of plasticized material, facilitate a
downward auguring effect, and increase the interface surface area between the pin and
material. Zhao et al. (Zhao et al. 2005) investigated the influence of the pin geometry on
bonding and mechanical properties in friction stir welded Al alloys. He claimed that pin
design affects the flow of the plastic material strongly. The best quality weld was
acquired using a tapered screw threaded pin.
Figure 2-4 shows the four visually distinct microstructural zones in which welds in
aluminum are typically divided into: (a) unaffected parent material, (b) heat affected zone,
(c) thermo-mechanically affected zone, and (d) weld nugget. In the heat affected zone,
properties and microstructure are affected by the heat from the weld, although there is no
mechanical deformation. This zone retains the same grain structure as the parent
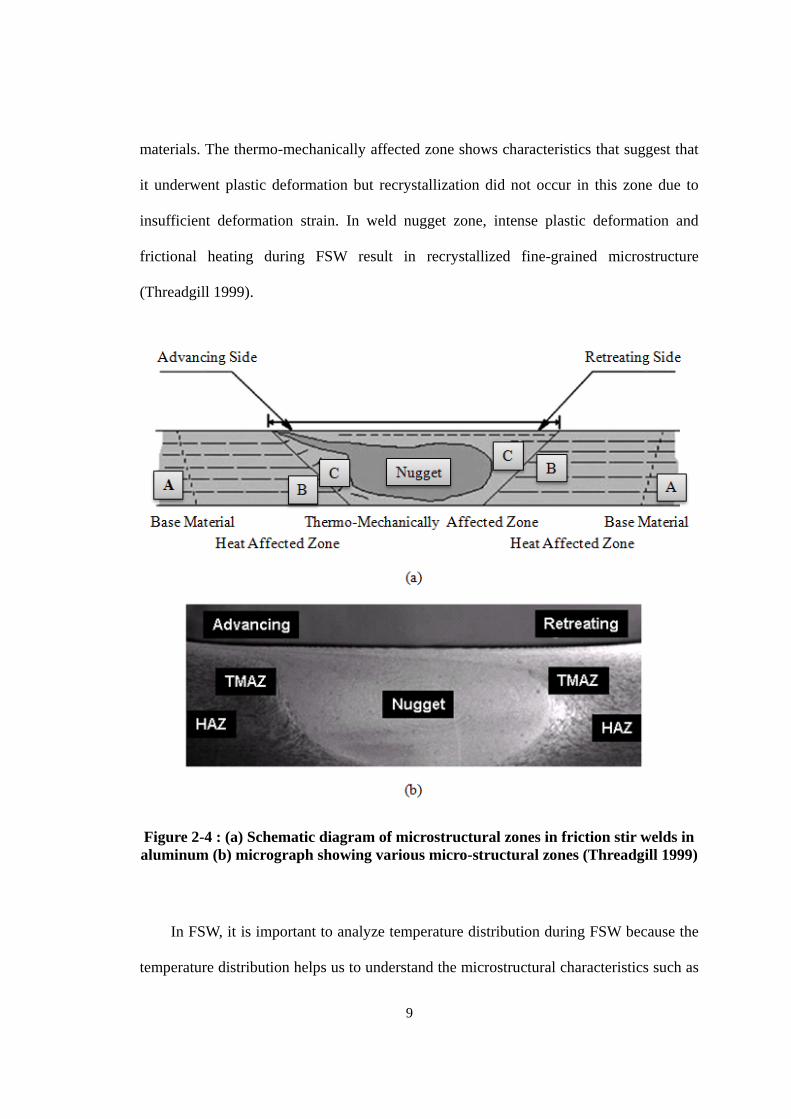
9
materials. The thermo-mechanically affected zone shows characteristics that suggest that
it underwent plastic deformation but recrystallization did not occur in this zone due to
insufficient deformation strain. In weld nugget zone, intense plastic deformation and
frictional heating during FSW result in recrystallized fine-grained microstructure
(Threadgill 1999).
Figure 2-4 : (a) Schematic diagram of microstructural zones in friction stir welds in aluminum (b) micrograph showing various micro-structural zones (Threadgill 1999)
In FSW, it is important to analyze temperature distribution during FSW because the
temperature distribution helps us to understand the microstructural characteristics such as
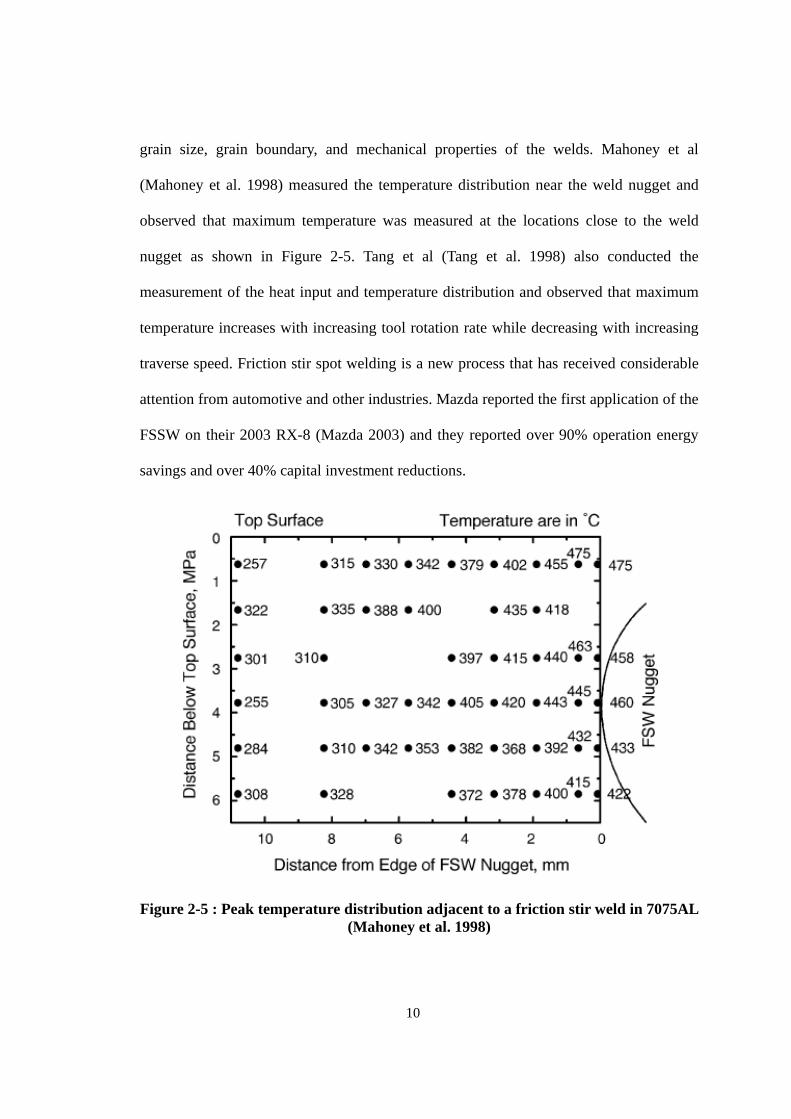
10
grain size, grain boundary, and mechanical properties of the welds. Mahoney et al
(Mahoney et al. 1998) measured the temperature distribution near the weld nugget and
observed that maximum temperature was measured at the locations close to the weld
nugget as shown in Figure 2-5. Tang et al (Tang et al. 1998) also conducted the
measurement of the heat input and temperature distribution and observed that maximum
temperature increases with increasing tool rotation rate while decreasing with increasing
traverse speed. Friction stir spot welding is a new process that has received considerable
attention from automotive and other industries. Mazda reported the first application of the
FSSW on their 2003 RX-8 (Mazda 2003) and they reported over 90% operation energy
savings and over 40% capital investment reductions.
Figure 2-5 : Peak temperature distribution adjacent to a friction stir weld in 7075AL (Mahoney et al. 1998)
11
Due to the fact that material flow characteristics during FSW affects weld quality so
extensively, a complete understanding of material flow around the rotating tool is crucial
to the optimization of FSW parameters and tool design. So far, most tool designs have
been carried out with intuitive concepts. It is important that tool wear is more objectively
and scientifically understood in order to optimize the tool material and geometry. For
microstructural stability, processing parameters such as the tool rotation rate and traverse
speed must be investigated thoroughly (Mishra and Ma 2005). An overview of the
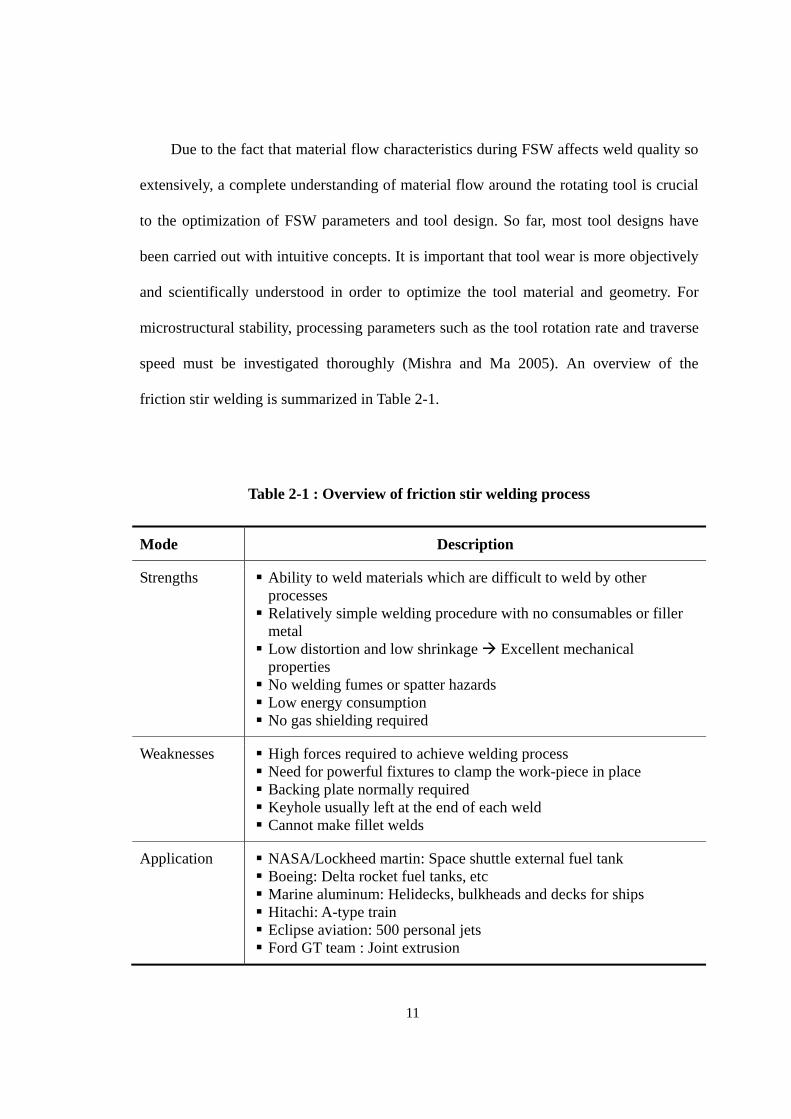
friction stir welding is summarized in Table 2-1.
Table 2-1 : Overview of friction stir welding process
Mode Description
Strengths Ability to weld materials which are difficult to weld by other processes Relatively simple welding procedure with no consumables or filler
metal Low distortion and low shrinkage Excellent mechanical
properties No welding fumes or spatter hazards Low energy consumption No gas shielding required
Weaknesses High forces required to achieve welding process Need for powerful fixtures to clamp the work-piece in place Backing plate normally required Keyhole usually left at the end of each weld Cannot make fillet welds
Application NASA/Lockheed martin: Space shuttle external fuel tank Boeing: Delta rocket fuel tanks, etc Marine aluminum: Helidecks, bulkheads and decks for ships Hitachi: A-type train Eclipse aviation: 500 personal jets Ford GT team : Joint extrusion
12
Material (Thickness)
1xxx,2xxx,5xxx,6xxx,7xxx,8xxx series aluminum alloy o 6-25mm has been generally reported o 6082-T6 up to 50mm (single pass), 75mm (two passes) o 5xxx, 6xxx 1mm or slightly less
Steel(mild steel, austenitic, martensitic and duplex SS) o 3.2-6.4mm thick steel plates (single pass) o 6.4mm thick 304L steel and steel plates of >6.4mm (two passes)
Copper and its alloys (2-50mm) Lead and its alloy (3mm) Zinc (0.88mm) Magnesium alloys/Titanium and its alloy/ Nickel alloys/ Metal
matrix composites
Joint geometry Butt welds (dissimilar thickness, non-linear, circumferential) Lap welds Circumferential lap welds Corner joints T joints Pipe to flange welds
Welding force (Power Input)
6082-T6 aluminum alloy (6.3mm thick) o Rotational speed: 710-1000rpm, Traverse speed: 40-224mm/min o Downward force: 5.5-10kN Torque 10-14Nm
6082/7075 aluminum alloy (25mm thick) o Downward force: 46-54kN (6082), 54-56kN (7075)
6061-T651 aluminum alloy (6.4mm thick) o Rotational speed: 1000-2500 rpm, Traverse speed: 204-816 mm/min o Downward force: 3-7 kN o Spindle power: 1.3-1.9 kW
2024-T351 aluminum alloy (6.4mm thick) o Power: 3.3kW (Fast weld), 2.9kW (Medium weld), 2.1kW (Slow
weld)
2524-T351 aluminum alloy (6.4mm thick) o Power: 2.3kW (Fast weld), 2.1kW (Medium weld), 1.6kW (Slow
weld)
Mild steel (6-12mm thick) o Maximum z-axis load: 89Kn, Machine horsepower: 15kW
6000 series aluminum alloy(12.5mm) Power: 3kW
13
Welding speed Welding speed depends on the tool geometry, the material, and other process parameters. Figure 2-6 shows a general result of travel speed according to alloy type and thickness
Figure 2-6 : Dependence of travel speed on alloy type and thickness
Tool life 6000 series aluminum alloy up to 1000m 6061aluminum alloy no measurable tool wear 6061 AA + Al203 MMC 0.64%/cm wear rate(1000rpm),
0.42(1500rpm), 0.56(2000rpm) It has been reported that tools were replaced after they were used to
produce 1.5-2.0m of weld of steel PCBN tool 10m in HSLA-65, 30m in 304 Stainless steel, 80m in
A36 steel Tool replacement usually occurs in response to severe tool wear, and
pin and shoulder fracture.
2.2 ULTRASONIC ASSISTED PROCESSING
It was noted here that the ultrasonic energy influenced the performance of
conventional manufacturing processes such as the forming, machining, and welding.
14
2.2.1 ULTRASONIC ASSISTED FORMING
Reports indicate that applying ultrasonic energy to a tool and/or workpiece in
various metal-forming processes affects those processes in such a way that process forces
can be reduced, processing speeds can be increased, and product quality is improved.
These benefits have been attributed to superposition and local heating which occur when
oscillatory energy is applied during the plastic deformation of metals. In most studies,
superposition has been considered to be the major mechanism responsible for the
reduction in forming force. The static force reduction during forming was found to be
equal to the periodic force amplitude induced in the workpiece. Pohlman and Lehfeldt
(Pohlman and Lehfeldt 1966) performed simple drawing experiments on pure
polycrystalline copper with superimposed ultrasonic oscillation (Figure 2-7a). When the
sample was subjected to impulses of ultrasound along the axial direction, the drawing
force dropped immediately and remained low for the duration of the impulses. The
amount of force reduction agreed with the value of the acoustic stress amplitude in the
sample, which could be calculated from the displacement amplitude of the sample.
Winsper (Winsper 1969; Winsper and Sansome 1969) reported that the optimum die-to-
drum distance, d, during the wire drawing of mild metal should be obtained based on the
following formula to achieve the maximum load reduction. The distance, a+n/2, was
found to be optimum value, where a is the constant determined empirically based on the
acoustic impedance of the die/transducer assembly, and is the longitudinal wavelength
in the wire (Figure 2-7b). The reduction in force could be also attributed to the
superposition mechanism. However, Sansome (Sansome 1973) found that the peak of the
oscillatory force exceeded the conventional process force in most cases even though the
15
mean force could be reduced when the ultrasonic vibration is applied. Hence, he
concluded that if the superposition occurs alone in oscillatory metal working, it only has
limited advantages for the industrial applications.
Figure 2-7 : The reduction in forming force based on superposition mechanism (a) Force reduction by impulses of ultrasonic in the drawing (Pohlman and Lehfeldt
1966) (b) Standing longitudinal wave induced in the sample (Winsper and Sansome 1969)
In the late 1960’s and early ‘70’s, Langenecker (Langenecker 1965; Langenecker
1966; Langenecker and Jones 1970) conducted tensile, wire drawing, and tube bending
experiments of various metals (Al, Cu, SAE 1019 Steel, etc), and found that the reduction
of process force was much larger than the acoustic stress in the sample when high
intensity ultrasound was applied (Figure 2-8a). By using infrared radiometry, he
discovered a notable temperature gradient that was built up in the sample within a few
seconds (Figure 2-8b).
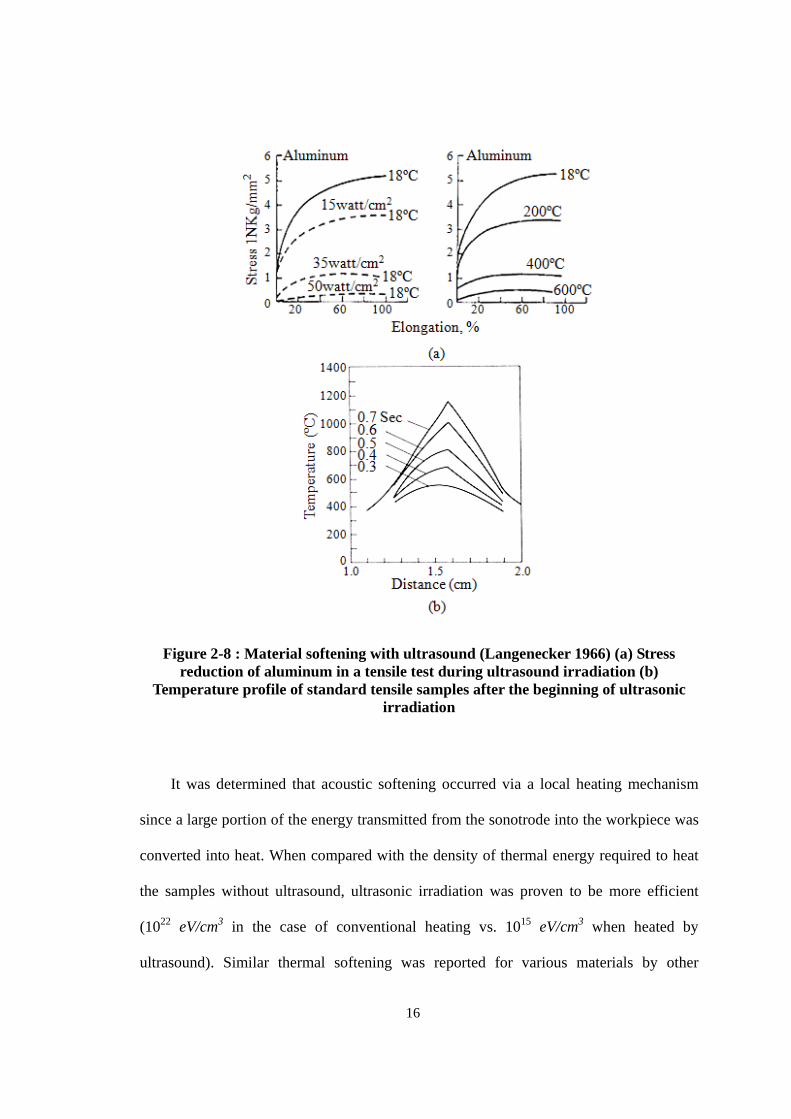
16
Figure 2-8 : Material softening with ultrasound (Langenecker 1966) (a) Stress reduction of aluminum in a tensile test during ultrasound irradiation (b)
Temperature profile of standard tensile samples after the beginning of ultrasonic irradiation
It was determined that acoustic softening occurred via a local heating mechanism
since a large portion of the energy transmitted from the sonotrode into the workpiece was
converted into heat. When compared with the density of thermal energy required to heat
the samples without ultrasound, ultrasonic irradiation was proven to be more efficient
(1022 eV/cm3 in the case of conventional heating vs. 1015 eV/cm3 when heated by
ultrasound). Similar thermal softening was reported for various materials by other
17
researchers (Severdenko and Petrenko 1969; Izumi et al. 1966) and the reductions in
hardness, work hardening rate, and residual stress which were not accounted for by the
superposition mechanism could be explained as a result of heating the test-piece. Hence,
it would be expected that present forming techniques will be improved by establishment
of optimum working parameters for coupling ultrasonic energy into the deformation zone.
Many investigators have claimed that the change in friction force was caused by an
actual change of the friction coefficient. Huang et al. (Huang et al. 2002) observed that
the maximum forming force during the interval of vibration was much less than the static
force without vibration in the upsetting process of plasticine. He concluded that further
reduction in the forming force was realized by the reduction of the interfacial friction
coefficient and presented the reduced barreling of the finished specimen under ultrasonics
as supporting evidence. However, a conflicting result was reported by Pohlman and
Lehfeldt (Pohlman and Lehfeldt 1966). When the oscillation direction was normal to the
friction direction and the contact surface, no apparent reduction of friction force was
observed. Sansome (Sansome 1973) indicated that the coefficient of friction might have
been reduced due to: (1) asperities that were softened, (2) pumped lubricant, (3) chemical
activation of the lubricant, and (4) surface separation. However, further studies will be
required to explain the details for each mechanism. Biddell and Sansome (Biddell and
Sansome 1974) also outlined the historical development of oscillating metal forming
equipment and its application to the deep drawing, wire drawing, and plug drawing
processes. However, at that time (1970s), a clear understanding of the deformation mode,
acoustic effect, and production technology (i.e., cost, reliability, and cycle time) were not
fully developed, and some misleading conclusions were found pertaining to the
18
application of ultrasonics (Biddell and Sansome 1974). Since the vibration characteristic
changes depending on the process, material, and tooling system, guidelines for the design
of this system and its coupling method with the tools and workpiece need to be developed
considering such challenges as cost, space, and flexibility for industrial applications.
2.2.2 ULTRASONIC MACHINING
Ultrasonics has been successfully applied to machining processes such as drilling,
turning, cutting, and EDM. Like other ultrasonic assisted processes, the principle of
ultrasonic drilling involves adding high-frequency and low amplitude vibration in the
feed direction of the tool or workpiece. Chang and Bone (Chang and Bone 2005)
investigated the effect of ultrasonic assistance on burr size, chip formation, thrust forces
and tool wear. Usually, large burrs affect part quality and impede assembly. Chang and
Bone observed that burr height and width were reduced with ultrasonic assistance (Figure
2-9). He also observed a reduction in thrust force (a). However, the ultrasonic assisted
drilling did introduce some disadvantages in terms of tool strength and life (b).
Figure 2-9 : Burrs produced after drilling: 3.18mm drill 6000 RPM, 1.90mm/s federate (Chang and Bone 2005)
19
Figure 2-10 : (a) Average thrust force (b) flank wear progression at the outer edge of the cutting tips of four drills (Chang and Bone 2005)
Ishikawa et al. (Ishikawa et al. 1998) reported the effect of combined vibration
drilling by applying ultrasonic vibration to the core drill and low-frequency vibration to
the workpiece. Their research focused on trends in drilling force and hole accuracy.
Figure 2-11a shows the relationship between the drilling force and low ultrasonic
frequency vibration, which was conducted at three amplitudes. It was observed that
drilling force decreased as low frequency vibration and ultrasonic vibration amplitude
were increased. Figure 2-11b shows the drilling force vs. drilling times during continuous
drilling. In the case of a non-vibration drilling, the drilling force increased greatly as the
drilling times increased, while the drilling force didn’t change even after drilling 100
times in the combined vibration drilling.
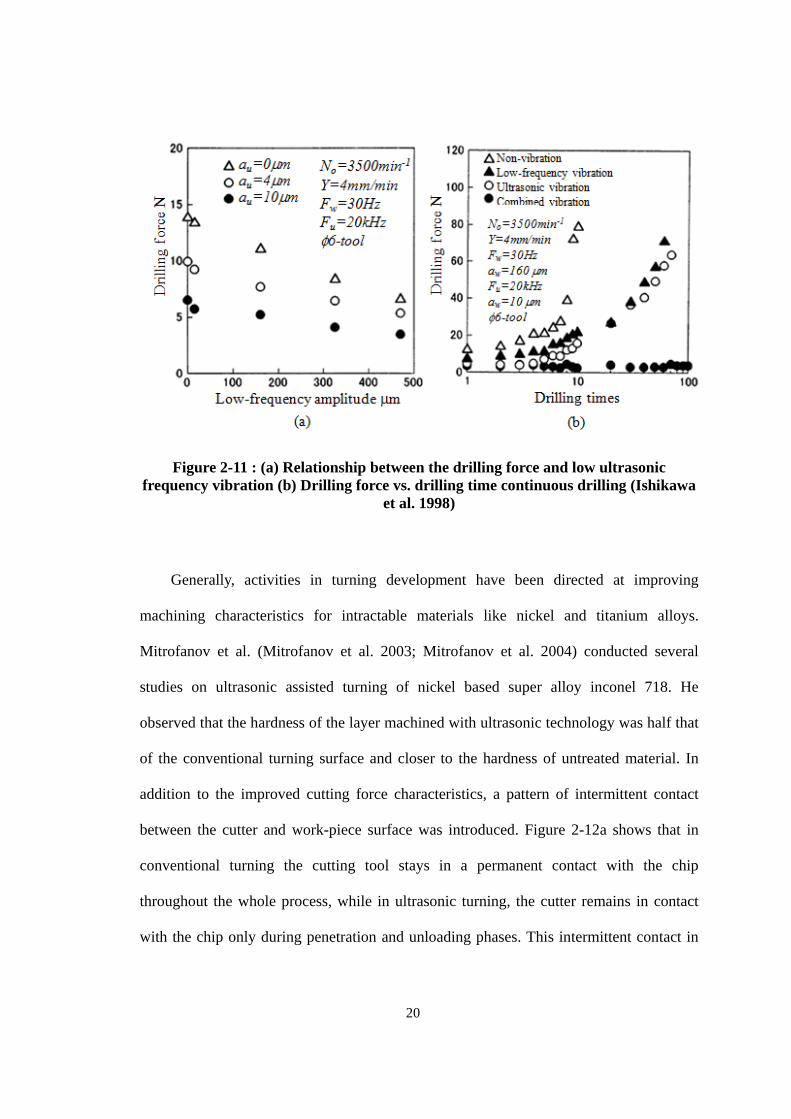
20
Figure 2-11 : (a) Relationship between the drilling force and low ultrasonic frequency vibration (b) Drilling force vs. drilling time continuous drilling (Ishikawa
et al. 1998)
Generally, activities in turning development have been directed at improving
machining characteristics for intractable materials like nickel and titanium alloys.
Mitrofanov et al. (Mitrofanov et al. 2003; Mitrofanov et al. 2004) conducted several
studies on ultrasonic assisted turning of nickel based super alloy inconel 718. He
observed that the hardness of the layer machined with ultrasonic technology was half that
of the conventional turning surface and closer to the hardness of untreated material. In
addition to the improved cutting force characteristics, a pattern of intermittent contact
between the cutter and work-piece surface was introduced. Figure 2-12a shows that in
conventional turning the cutting tool stays in a permanent contact with the chip
throughout the whole process, while in ultrasonic turning, the cutter remains in contact
with the chip only during penetration and unloading phases. This intermittent contact in
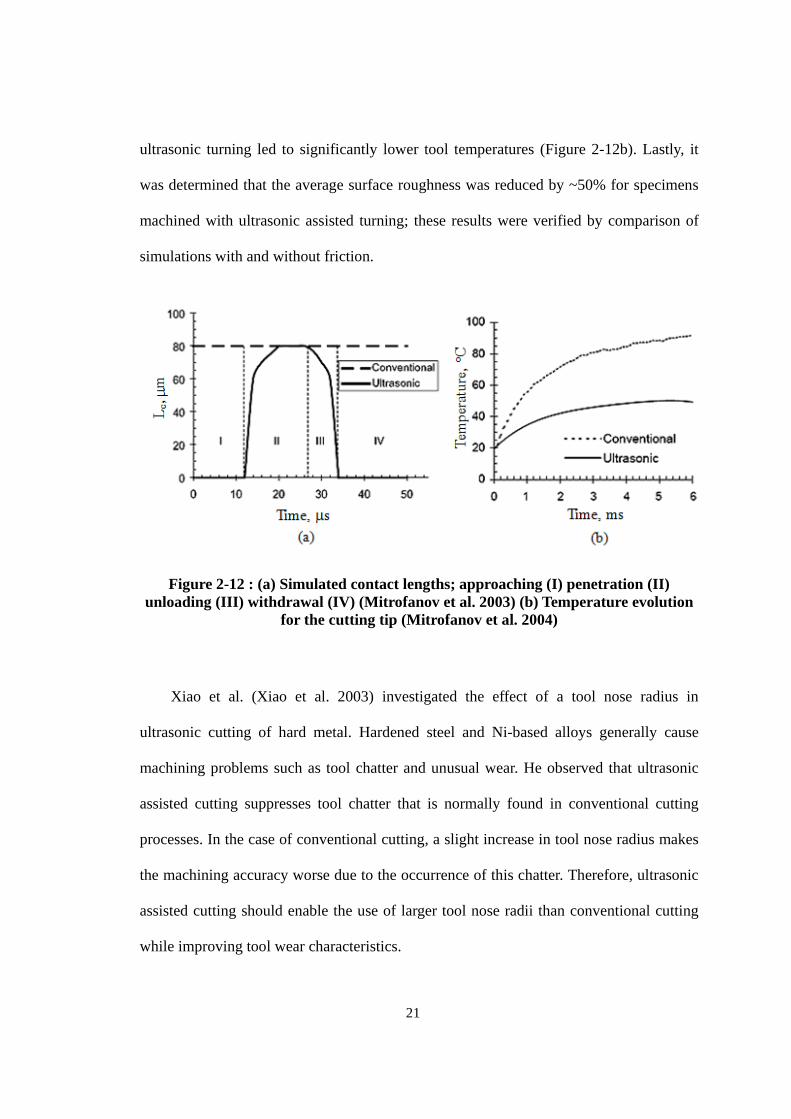
21
ultrasonic turning led to significantly lower tool temperatures (Figure 2-12b). Lastly, it
was determined that the average surface roughness was reduced by ~50% for specimens
machined with ultrasonic assisted turning; these results were verified by comparison of
simulations with and without friction.
Figure 2-12 : (a) Simulated contact lengths; approaching (I) penetration (II) unloading (III) withdrawal (IV) (Mitrofanov et al. 2003) (b) Temperature evolution
for the cutting tip (Mitrofanov et al. 2004)
Xiao et al. (Xiao et al. 2003) investigated the effect of a tool nose radius in
ultrasonic cutting of hard metal. Hardened steel and Ni-based alloys generally cause
machining problems such as tool chatter and unusual wear. He observed that ultrasonic
assisted cutting suppresses tool chatter that is normally found in conventional cutting
processes. In the case of conventional cutting, a slight increase in tool nose radius makes
the machining accuracy worse due to the occurrence of this chatter. Therefore, ultrasonic
assisted cutting should enable the use of larger tool nose radii than conventional cutting
while improving tool wear characteristics.
22
Several studies on ultrasonic assisted electrical discharge machining have also been
reported. Guo et al. (Guo et al. 1997) observed the reduction of the surface residual
tensile stress with ultrasonic excitation. Gao and Liu (Gao and Liu 2003) applied
ultrasonics to the workpiece for micro EDM and found that the removal rate decreased
when the workpiece thickness was increased and that the removal rate of the
ultrasonically aided micro EDM was larger than that of traditional EDM.
2.2.3 ULTRASONIC WELDING
Ultrasonic welding is a solid state process in which two materials are joined by the
application of ultrasonic vibrations under moderate pressure. Little or no heat is applied
and the material remains near 50% of its melting temperature. This process permits
welding of thin to thick sections of material with lower pressures than used in fused
deposition or hot isostatic pressing welding. However, there are limitations in terms of
the thickness of component and butt welds. Materials suitable for ultrasonic welding
include nonferrous metals and their alloys while materials such as zinc, lead, and tin have
yet to be shown to be successfully welded. The most widely used system for ultrasonic
welding is shown in Figure 2-13 where a static normal force is applied perpendicular to
the interface between the workpieces and the contacting sonotrode oscillates parallel to
the material interface surface (Edgar de Vries 2004). The combined effect of static and
oscillating forces produce deformation which promotes welding. Chang and Frisch
(Chang and Frisch 1974) developed the understanding of the bonding mechanism and
explained the evolution of bonded area due to the ultrasonic vibration as shown in Figure
2-14. He theorized that bonding is accomplished via two different processes: interfacial
slip and sublayer plastic deformation along with a localized temperature rise at the weld.
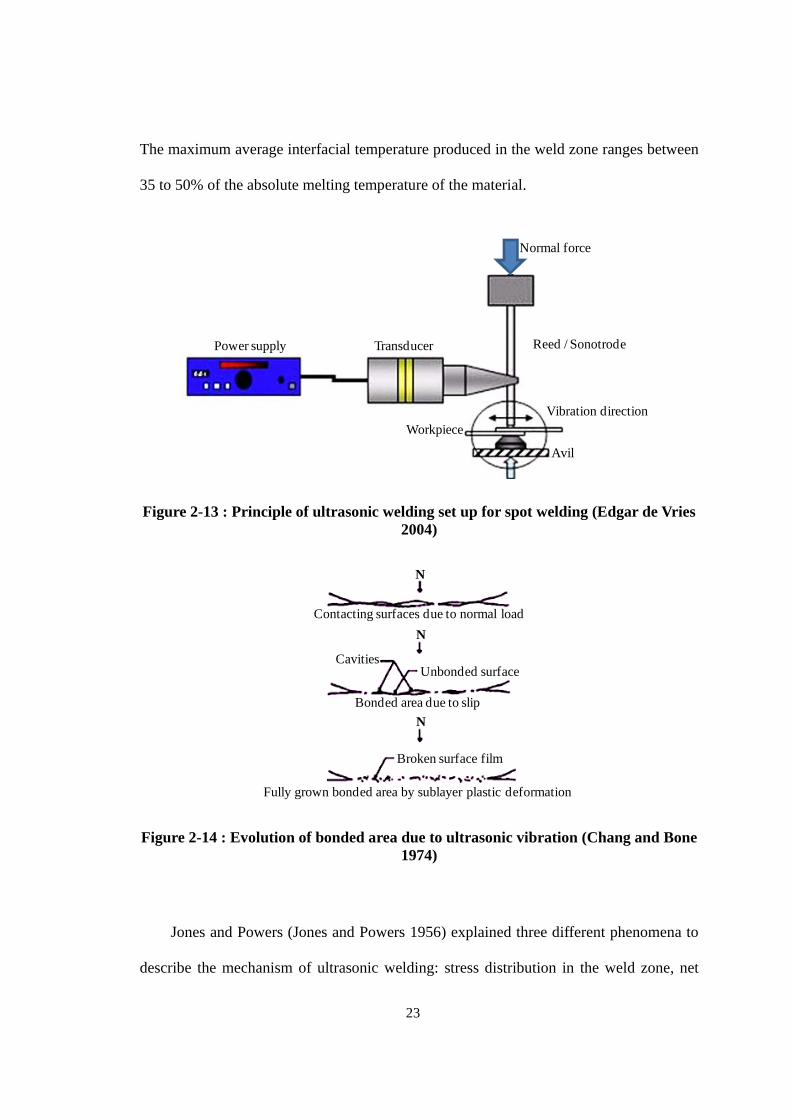
23
The maximum average interfacial temperature produced in the weld zone ranges between
35 to 50% of the absolute melting temperature of the material.
Normal force
Reed / Sonotrode
Vibration direction
Avil
Workpiece
TransducerPower supply
Figure 2-13 : Principle of ultrasonic welding set up for spot welding (Edgar de Vries 2004)
Contacting surfaces due to normal load
Bonded area due to slip
Fully grown bonded area by sublayer plastic deformation
N
N
N
CavitiesUnbonded surface
Broken surface film
Figure 2-14 : Evolution of bonded area due to ultrasonic vibration (Chang and Bone 1974)
Jones and Powers (Jones and Powers 1956) explained three different phenomena to
describe the mechanism of ultrasonic welding: stress distribution in the weld zone, net
24
energy delivered to the weld zone and the localized temperature rise developed within the
weld zone. They found external deformation was on the order of 0-5% of the total
thickness of the sheets being welded while internal deformations amounted to as high as
80%. It has also been theorized that the oscillatory energy generated at the weld interface
causes internal stresses which in turn produces additional elastic and plastic deformation
in the weld zone.
Tsujino et al. (Tsujino 1995; Tsujino et al. 1996) conducted research on ultrasonic
welding in order to propose effective ultrasonic welding parameters based on the size of
the workpieces. For welding of thick and large metal specimens, an ultrasonic butt
welding system was developed. A conventional ultrasonic lapped spot welding method
allows welding up to 2 or 3mm thick plate specimens. Aluminum plates of 6mm
thickness have been joined end to end by shifting the welding tip driving position to run
along the specimen width. For welding of medium to large metal specimens, a welding
method of using two vibration systems was proposed. This involved the use of an upper
vibration system with welding tips located at its center as well as a mirrored lower
vibration system. Welding specimens were then inserted between the upper and lower
welding tips under static clamping force. For medium size metal welding specimens, it
was claimed that the weld strengths obtained by using a welding tip of circular locus
were larger than those joined by a conventional welding system where the welding tip
vibration was linear. Lastly, an ultrasonic wire bonding system is effective for welding
small metal specimens.
25
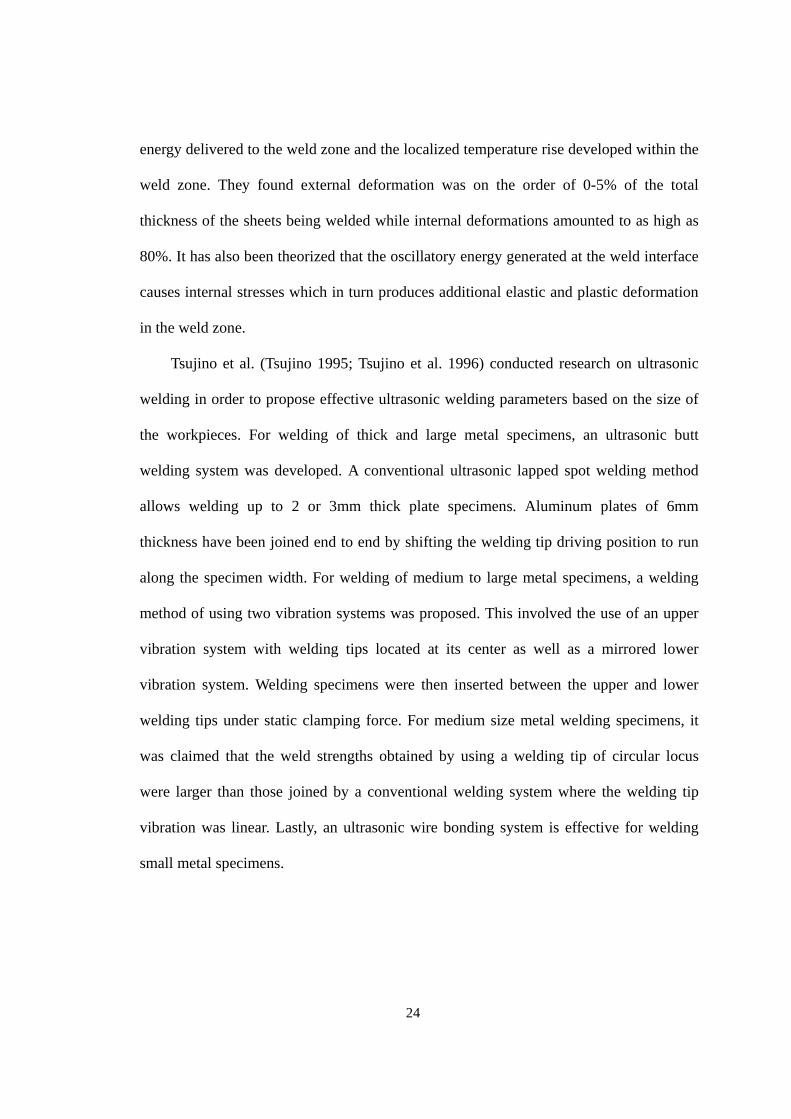
CHAPTER 3 - PRELIMINARY EVALUATION FOR ULTRASONIC ASSISTED FRICTION STIR WELDING
3.1 OVERVIEW OF FRICTION STIR WELDING EXPERIMENTAL SET-UP AND ITS OPERATION
Since the first friction stir welds were carried out at TWI (The Welding Institute) in
1991, a conventional milling machine has been demonstrated capable of performing FSW.
Our experiments were similarly established using Moriseiki CNC machining center (TV-
30) as shown in Figure 3-1.
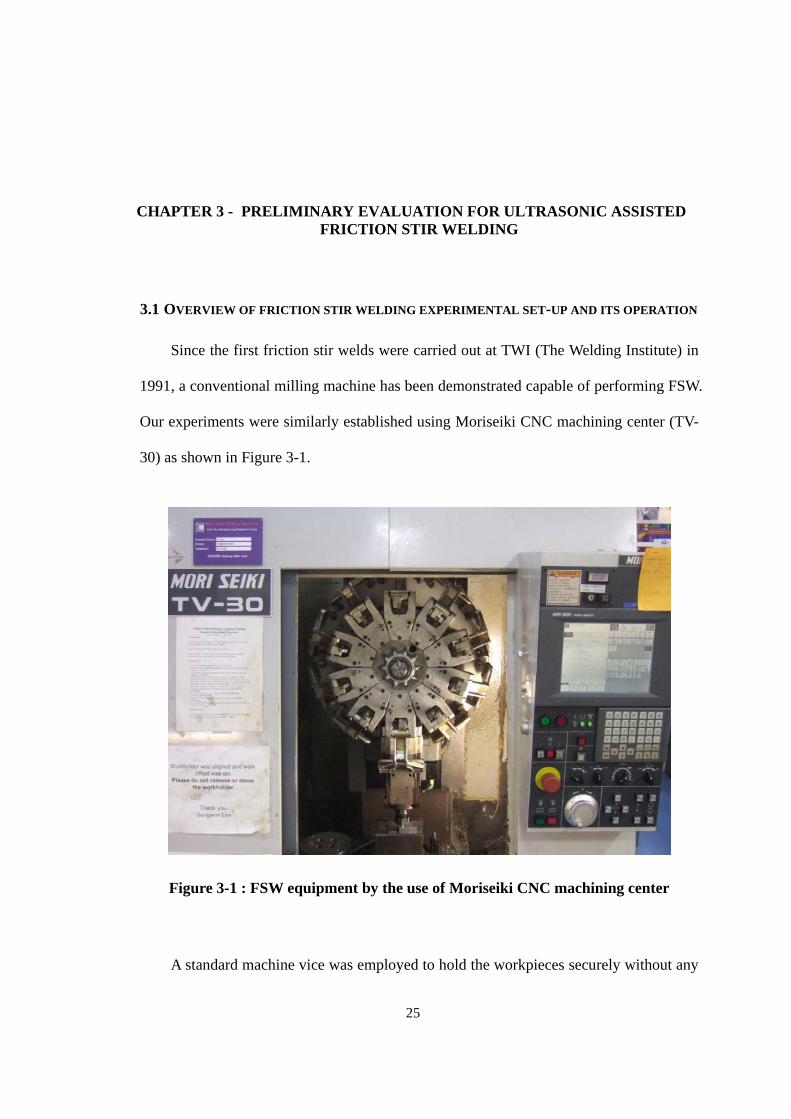
Figure 3-1 : FSW equipment by the use of Moriseiki CNC machining center
A standard machine vice was employed to hold the workpieces securely without any
26
lateral movement during welding process. A steel block was used as a backing plate and
to prevent trembling of the machine as shown in Figure 3-2.
Figure 3-2 : Schematic of fixture
Aluminum alloy 6061-T6511, which has good weldability for FSW, was used. A
3.175mm thickness aluminum alloy sheet was cut to 50mm 70mm rectangle plates and
milled with square mating edges, whose chemical composition and mechanical properties
were listed in Table 3-1 and Table 3-2.
Table 3-1 : Nominal compositions of aluminum alloy 6061-T651
Comp Al Cr Cu Fe Mg Mn Si Ti Zn
Wt. % 98 0.04- 0.35
0.15- 0.4
Max 0.7
0.8- 1.2
Max 0.15
0.4- 0.8
Max 0.15
Max 0.25
27
Table 3-2 : Mechanical properties of aluminum alloy 6061-T651
Tensile strength (MPa) Yield strength (MPa) Elongation (%)
228-283 193-262 10-11.62
Table 3-3 : Guideline for tempering A2 Tool Steel
Tempering Data
Tempering Temperature
Typical Rockwell Hardness
Tempering Temperature
Typical Rockwell Hardness
As Quenched 63.5C-65C 500 ºF 59C-59.5C
300 ºF 62.5C-64C 600 ºF 58C
400 ºF 61C-62C 700 ºF 56C-57C
For the tool, air-hardened A2 tool steel was used. Figure 3-3a shows the FSW tool
used for the butt joint welds. Many papers have reported various tool designs which can
influence the welding quality and addressed that care must be taken in determining
geometrical variables such as the shoulder diameter, pin diameter, pin length, and pin
shape. The tool consists of a typical non-threaded tapered pin shape and flat diameter.
Dimensions of the tool were selected based on Arbegast’s work (Arbegast and Patnaik
2005). Figure 3-3b shows the dimension of the tool used for this experiment. It has been
reported in FSW that the height of the tool pin used for rotating shoulder tool is known to
be around 90-95% of the material thickness (Arbegast and Patnaik 2005). Heat treatment
was applied to the tool to achieve high hardness and better wear resistance. According to
the guideline provided by the supplier of the tool steel (McMaster-Carr), the tool
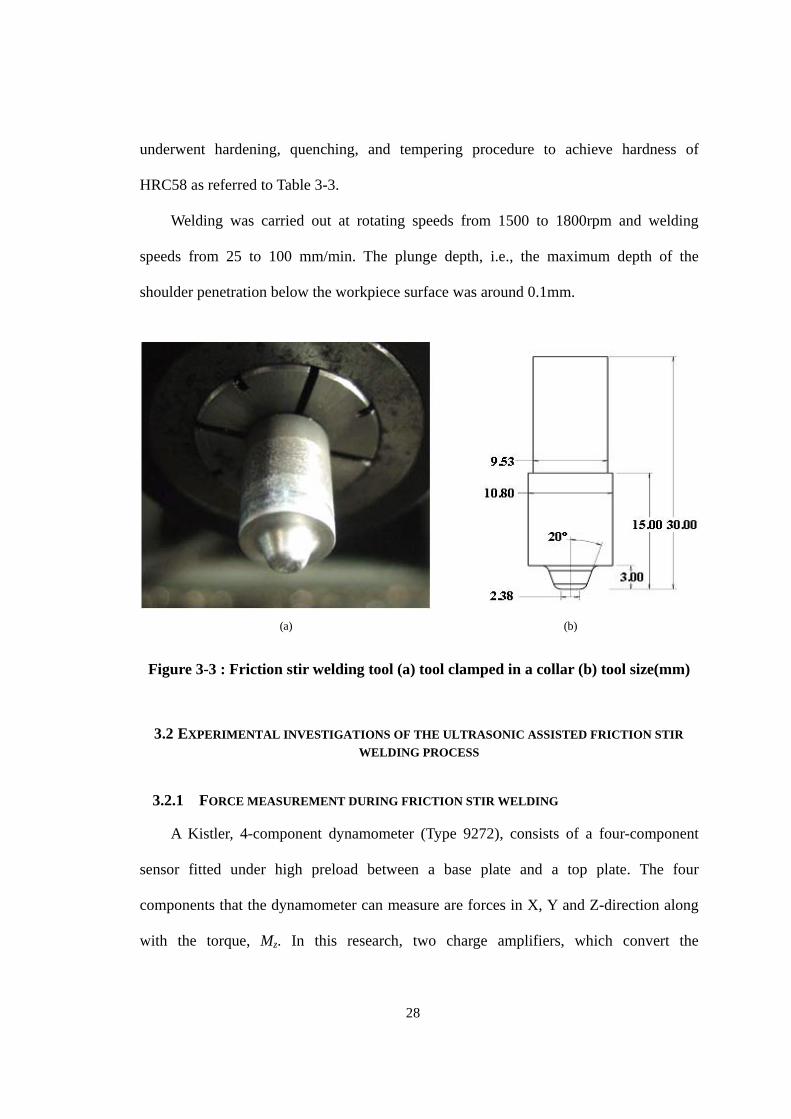
28
underwent hardening, quenching, and tempering procedure to achieve hardness of
HRC58 as referred to Table 3-3.
Welding was carried out at rotating speeds from 1500 to 1800rpm and welding
speeds from 25 to 100 mm/min. The plunge depth, i.e., the maximum depth of the
shoulder penetration below the workpiece surface was around 0.1mm.
(a) (b)
Figure 3-3 : Friction stir welding tool (a) tool clamped in a collar (b) tool size(mm)
3.2 EXPERIMENTAL INVESTIGATIONS OF THE ULTRASONIC ASSISTED FRICTION STIR
WELDING PROCESS
3.2.1 FORCE MEASUREMENT DURING FRICTION STIR WELDING
A Kistler, 4-component dynamometer (Type 9272), consists of a four-component
sensor fitted under high preload between a base plate and a top plate. The four
components that the dynamometer can measure are forces in X, Y and Z-direction along
with the torque, Mz. In this research, two charge amplifiers, which convert the
29
dynamometer charge signals into output voltages proportional to the forces and moment
obtained, were employed. The dynamometer was mounted with screws on the bed of the
machine with help of a supporting block. The workpiece holder (vice) was clamped to the
dynamometer. The operating temperature range of the dynamometer is from 0°C to 70°C.
But the heat generated during welding must be much more than the operating temperature
of the dynamometer. In order to reduce the heat conducted from the workpiece vice to the
dynamometer, a steel plate was placed between the workpiece vice and dynamometer as
shown in Figure 3-2.
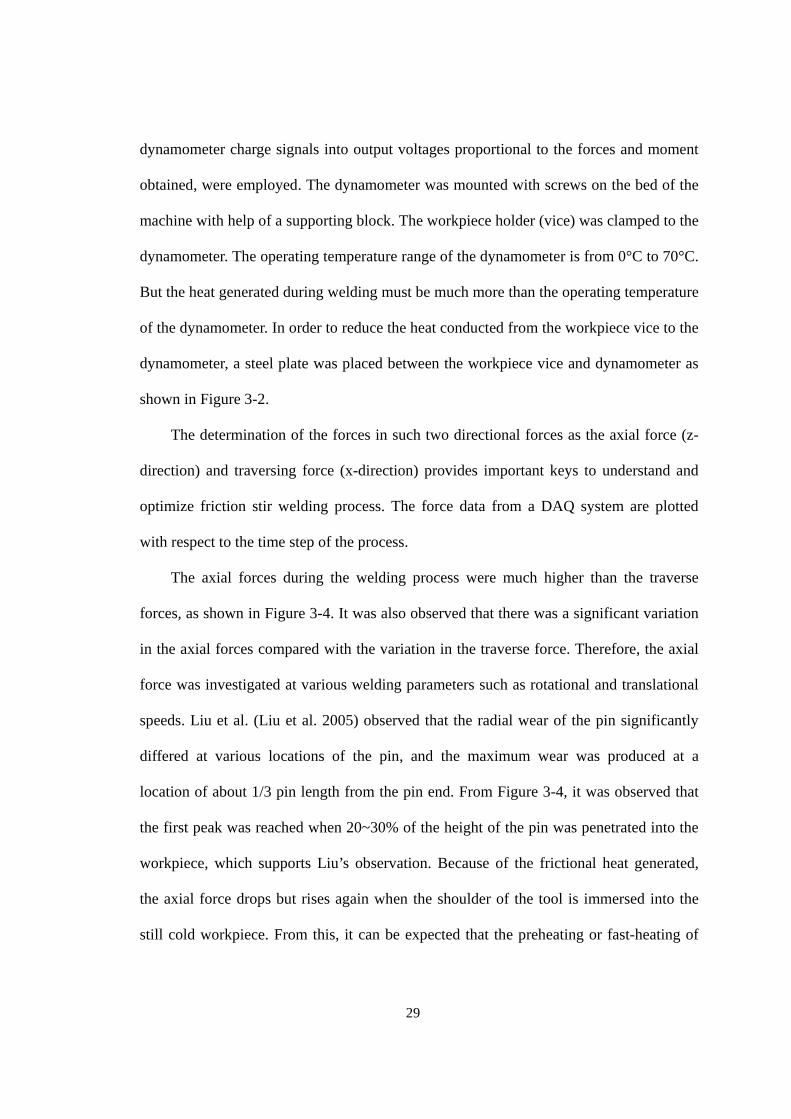
The determination of the forces in such two directional forces as the axial force (z-
direction) and traversing force (x-direction) provides important keys to understand and
optimize friction stir welding process. The force data from a DAQ system are plotted
with respect to the time step of the process.
The axial forces during the welding process were much higher than the traverse
forces, as shown in Figure 3-4. It was also observed that there was a significant variation
in the axial forces compared with the variation in the traverse force. Therefore, the axial
force was investigated at various welding parameters such as rotational and translational
speeds. Liu et al. (Liu et al. 2005) observed that the radial wear of the pin significantly
differed at various locations of the pin, and the maximum wear was produced at a
location of about 1/3 pin length from the pin end. From Figure 3-4, it was observed that
the first peak was reached when 20~30% of the height of the pin was penetrated into the
workpiece, which supports Liu’s observation. Because of the frictional heat generated,
the axial force drops but rises again when the shoulder of the tool is immersed into the
still cold workpiece. From this, it can be expected that the preheating or fast-heating of
30
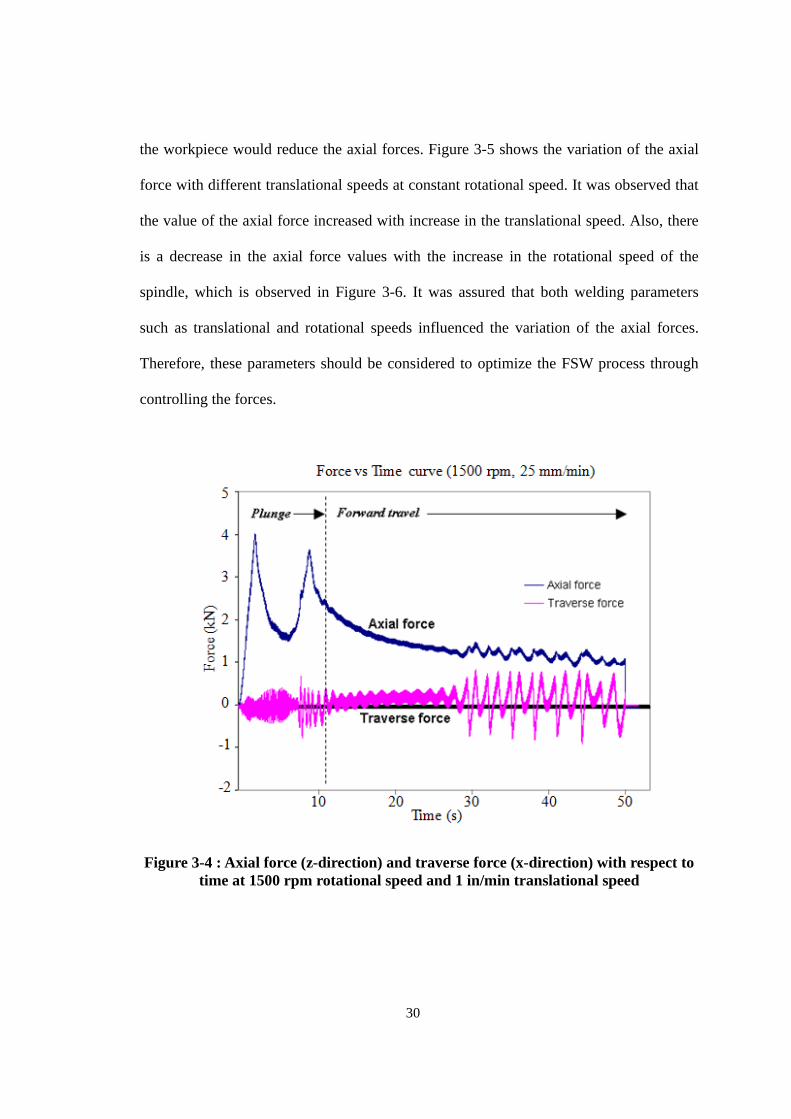
the workpiece would reduce the axial forces. Figure 3-5 shows the variation of the axial
force with different translational speeds at constant rotational speed. It was observed that
the value of the axial force increased with increase in the translational speed. Also, there
is a decrease in the axial force values with the increase in the rotational speed of the
spindle, which is observed in Figure 3-6. It was assured that both welding parameters
such as translational and rotational speeds influenced the variation of the axial forces.
Therefore, these parameters should be considered to optimize the FSW process through
controlling the forces.
Figure 3-4 : Axial force (z-direction) and traverse force (x-direction) with respect to time at 1500 rpm rotational speed and 1 in/min translational speed
31
(a)
(b)
Figure 3-5 : Plot of the axial force vs. translational speed (a) at constant rotation speed (1500rpm) (b) at constant rotation speed (1800rpm)
32
Figure 3-6 : Plot of the axial force vs. rotational speed at constant translational speed of 25 mm/min (left top), 50 mm/min (right top), 75 mm/min (left bottom), and
100 mm/min (right bottom)
3.2.2 MECHANICAL TESTING OF FRICTION STIR WELDED MATERIAL
The objective of the hardness test was to compare the hardness of friction stir welds
of aluminum alloys with the original aluminum alloys. Vickers microhardness
33
measurements were performed at 100gf load for 15s along the centerline of the cross-
section of the welds.
The objective of tensile testing was to determine the tensile yield strength and
percentage of yield elongation of friction stir welds of aluminum alloys. The results were
compared with the properties of original aluminum alloys. The tensile tests were
performed on Instron universal testing machine. The cross-weld specimens from the
welds were prepared by using EDM machine with reference to ASM guideline (Kuhn and
Medlin 2000). Tensile specimens were prepared with the tensile direction, perpendicular
to the welding direction, so that the weld zone is located in the middle of the specimen.
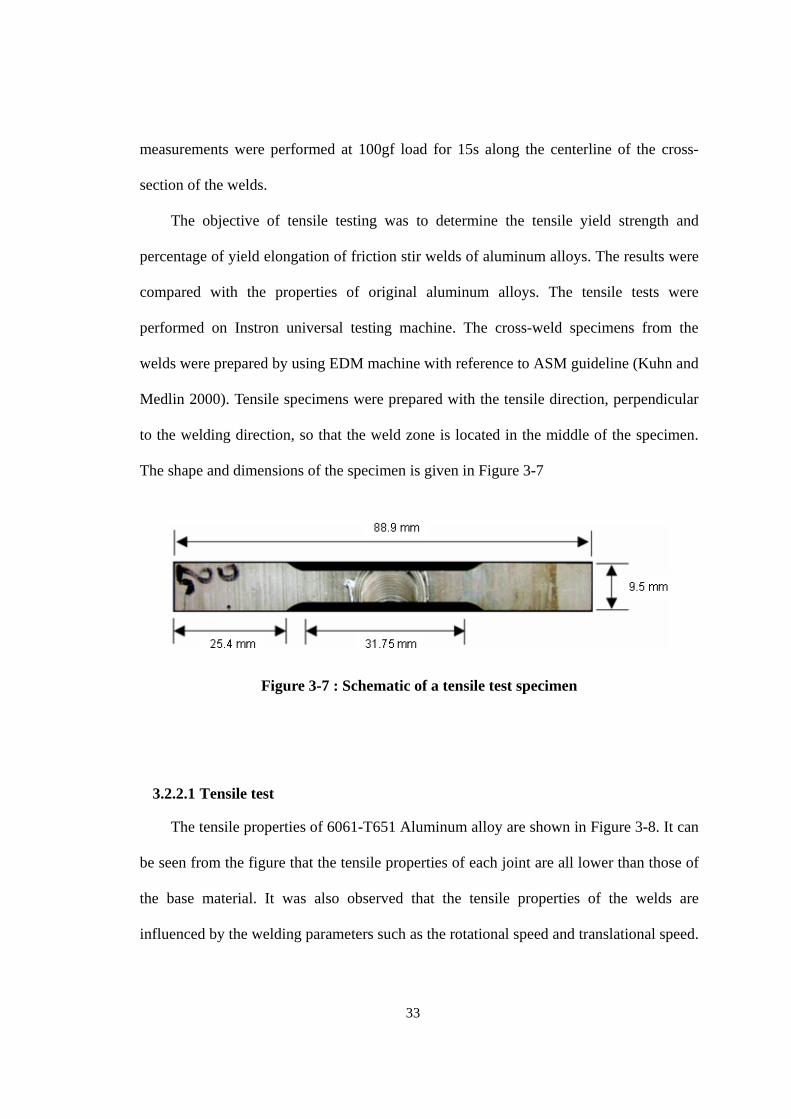
The shape and dimensions of the specimen is given in Figure 3-7
Figure 3-7 : Schematic of a tensile test specimen
3.2.2.1 Tensile test
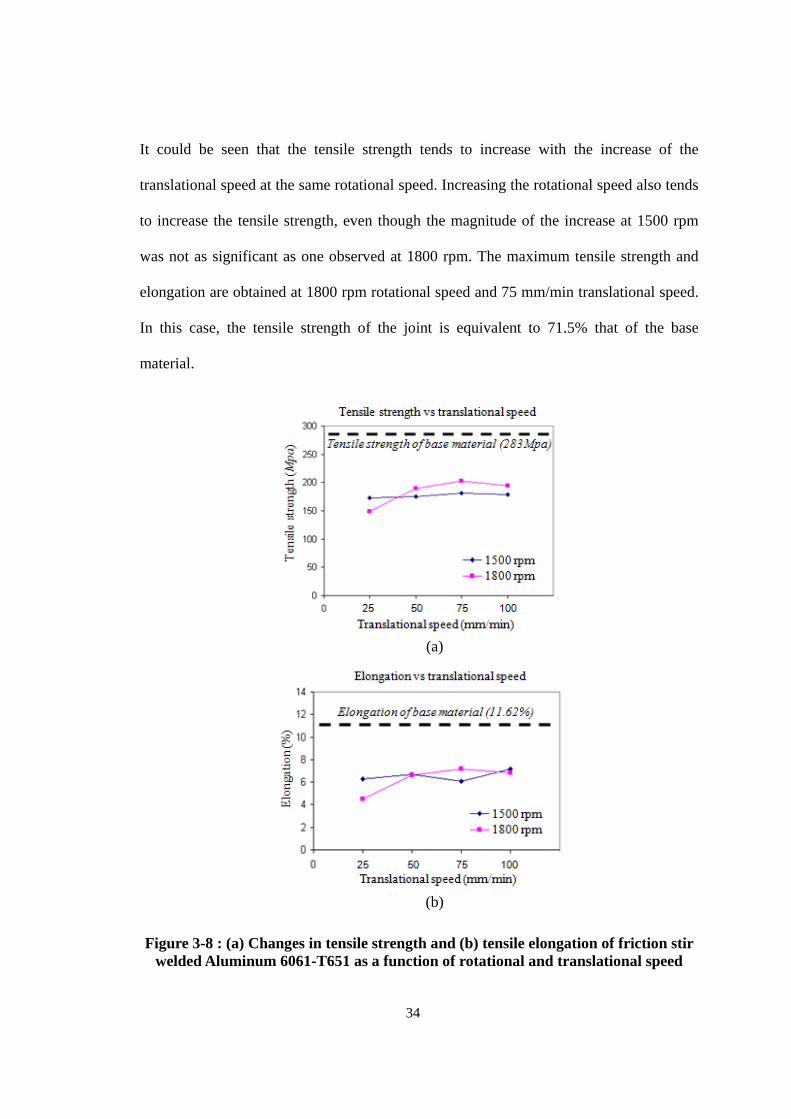
The tensile properties of 6061-T651 Aluminum alloy are shown in Figure 3-8. It can
be seen from the figure that the tensile properties of each joint are all lower than those of
the base material. It was also observed that the tensile properties of the welds are
influenced by the welding parameters such as the rotational speed and translational speed.
34
It could be seen that the tensile strength tends to increase with the increase of the
translational speed at the same rotational speed. Increasing the rotational speed also tends
to increase the tensile strength, even though the magnitude of the increase at 1500 rpm
was not as significant as one observed at 1800 rpm. The maximum tensile strength and
elongation are obtained at 1800 rpm rotational speed and 75 mm/min translational speed.
In this case, the tensile strength of the joint is equivalent to 71.5% that of the base
material.
(a)
(b)
Figure 3-8 : (a) Changes in tensile strength and (b) tensile elongation of friction stir welded Aluminum 6061-T651 as a function of rotational and translational speed
35
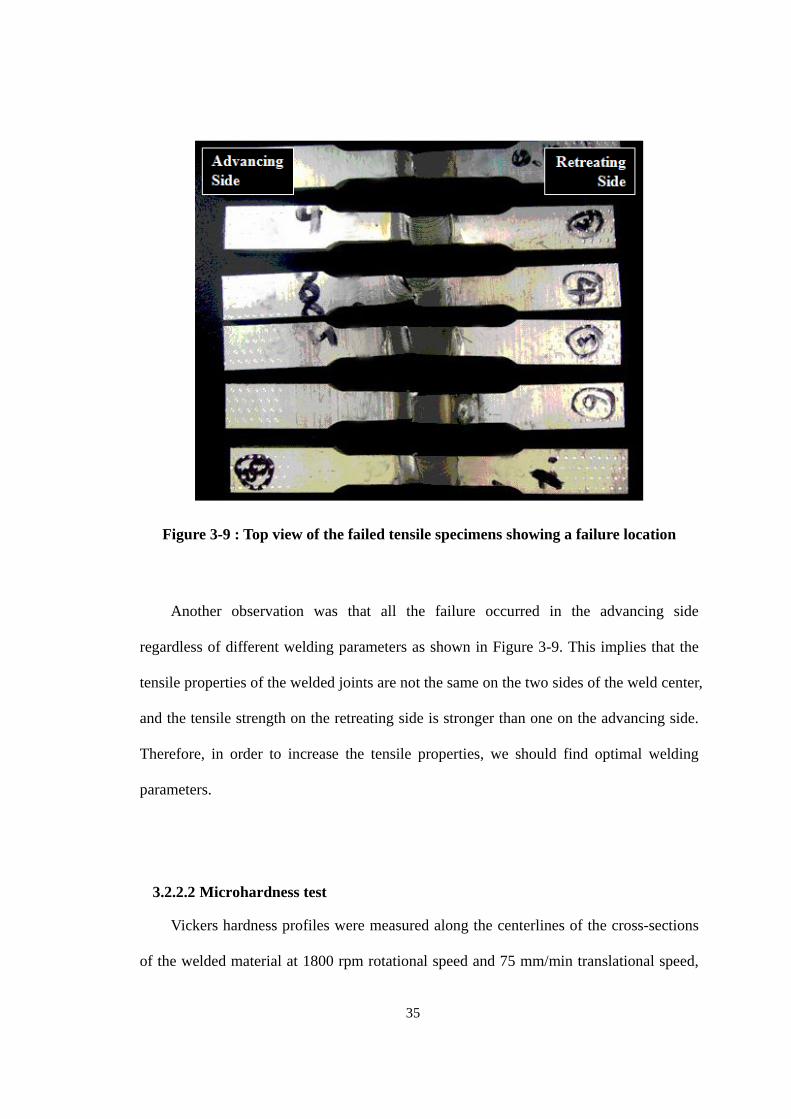
Figure 3-9 : Top view of the failed tensile specimens showing a failure location
Another observation was that all the failure occurred in the advancing side
regardless of different welding parameters as shown in Figure 3-9. This implies that the
tensile properties of the welded joints are not the same on the two sides of the weld center,
and the tensile strength on the retreating side is stronger than one on the advancing side.
Therefore, in order to increase the tensile properties, we should find optimal welding
parameters.
3.2.2.2 Microhardness test
Vickers hardness profiles were measured along the centerlines of the cross-sections
of the welded material at 1800 rpm rotational speed and 75 mm/min translational speed,
36
which had the highest value of the tensile properties. Figure 3-10 shows the Vicker’s
hardness values at various locations and matching cross-section view of the specimen. It
was observed that the hardness value decreased from the base material to heat-affected
zone (HAZ), and that the boundary area between thermo-mechanically affected zone
(TMAZ) and HAZ appeared to have the lowest hardness value. But, the hardness values
of the nugget zone were higher than those of TMAZ and HAZ. It was also observed that
the location of minimum hardness coincide with the failure location during the tensile test.
According to Sato et al. and Zeng et al. (Sato et al. 1999; Zeng et al. 2006), the hardness
profiles were affected by precipitate distribution and the grain size in the weld.
Figure 3-10 : Vickers hardness and matching cross-section view of the weld at 1800 rpm rotational speed and 75 mm/min translational speed
37
3.2.2.3 Defect analysis
From the experiments, a few defects have been detected with the changes of various
welding conditions such as the rotational speed, translational speed, and plunge depth.
From the visual examination, it was observed that the welding quality was basically
affected by the plunge depth. When the plunge depth was deeper than optimized value
(0.1mm), big weld flash was formed on the retreating side due to the excessive extrusion
of the plastic material near the pin. On the contrary, when it was insufficient, groove type
defect was generated on the advancing side. Figure 3-11 shows the good weld and two
typical defects on the welded region.
ExcessiveWeld flash
Groove-typedefect
(a) (b) (c)
Figure 3-11 : Surface appearances of the welds (a) weld which has excessive weld flash (b) good weld (c) groove type defect
Even though the good-looking surface was obtained in the weld, cross-sectional
views of the weld show void defect of 0.5mm in almost all the specimens. Figure 3-12
38
shows the void defect captured by a low magnification microscopy. It was speculated that
plastically deformed material around tool pin was not sufficiently filled on the region.
The geometry and size of the tool pin, rotational speed, and translational speed must
influence the defect. This may be an important reason that the ductility of the welded
joint decreases.
Figure 3-12 : Void defect from the cross sectional view
39
3.3 FE MODELING OF THE ULTRASONIC ASSISTED FRICTION STIR WELDING
Since the invention of FSW in 1991, analytical as well as numerical models were
developed in order to gain better understanding of the mechanisms of the process. As the
first step to develop the numerical model of FSW process, the thermo-mechanical FE
model was utilized to predict temperature distribution of the workpiece and the results
were validated with experimental results (Chen and Kovacevic 2003).
3.3.1 FE MODEL OF THE FRICTION STIR WELDING PROCESS
A FE simulation model was developed for a butt weld, which joins two workpieces
as shown in Figure 3-13. The FE model was performed using ABAQUS software, which
enables an explicit solution of the dynamic, coupled thermo-mechanical analysis. Since
the tool (A2 tool steel) was harder than the workpiece material (6061-T651 aluminum
alloy), the tool was assumed rigid solid, and the workpiece was considered a ductile
material having temperature-dependent properties based on reference (Alcan 1970; Chen
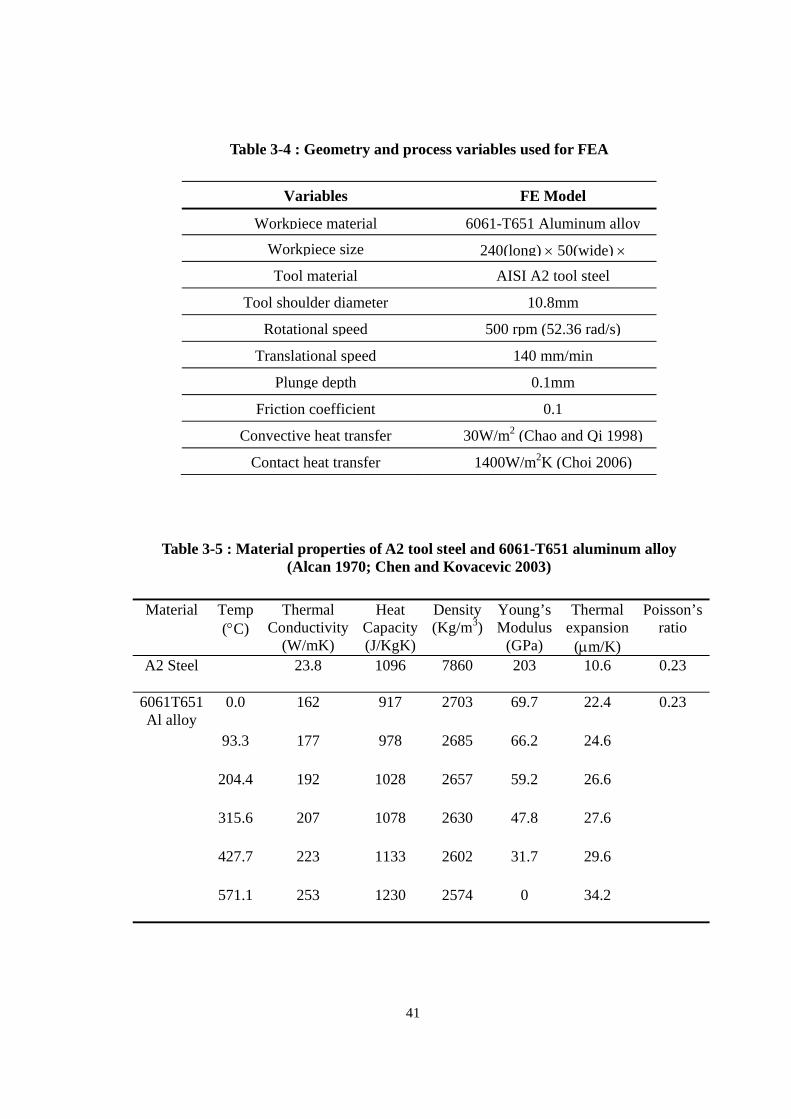
and Kovacevic 2003). Table 3-4, Table 3-5 and Figure 3-14 show the process conditions
and the material properties. At this time, we assumed that the friction between the
workpiece and the tool shoulder was the major heat generation source. Moreover, due to
large strain and deformation, Arbitrary Lagrangian-Eulerian (ALE) adaptive mesh
technique was used to avoid excessively distorted elements.
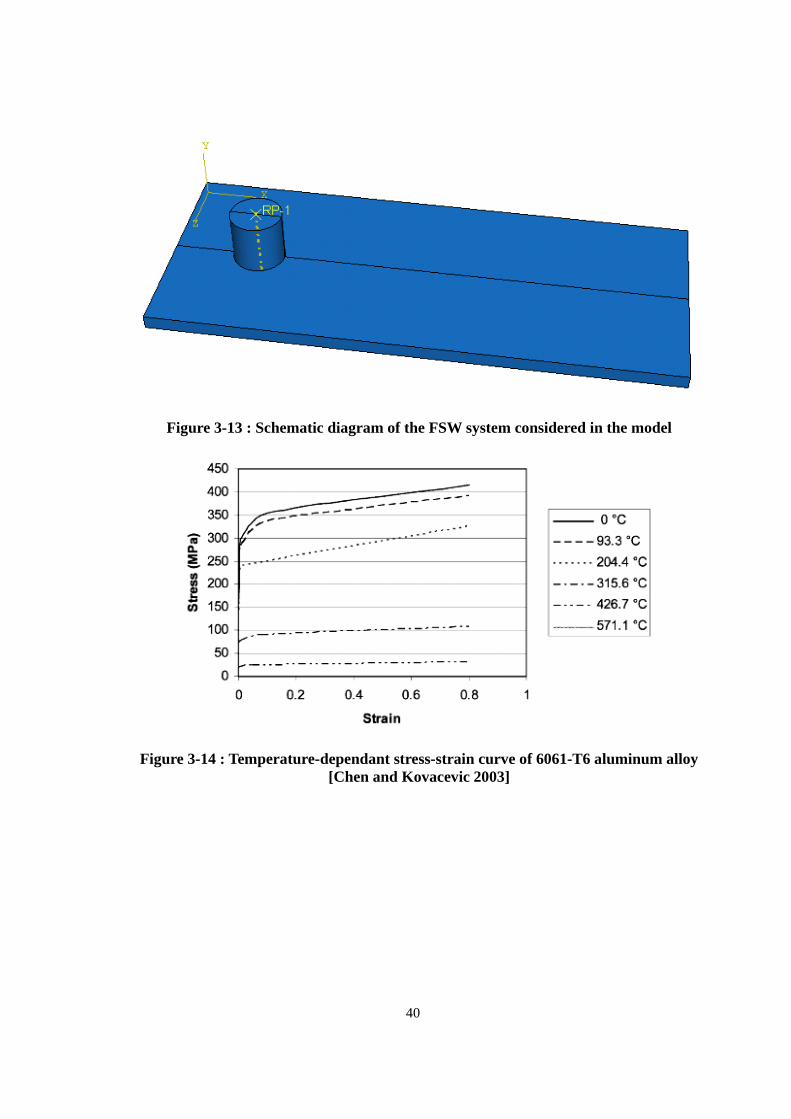
40
Figure 3-13 : Schematic diagram of the FSW system considered in the model
Figure 3-14 : Temperature-dependant stress-strain curve of 6061-T6 aluminum alloy [Chen and Kovacevic 2003]
41
Table 3-4 : Geometry and process variables used for FEA
Variables FE Model
Workpiece material 6061-T651 Aluminum alloy
Workpiece size 240(long) 50(wide)
Tool material AISI A2 tool steel
Tool shoulder diameter 10.8mm
Rotational speed 500 rpm (52.36 rad/s)
Translational speed 140 mm/min
Plunge depth 0.1mm
Friction coefficient 0.1
Convective heat transfer 30W/m2 (Chao and Qi 1998)
Contact heat transfer 1400W/m2K (Choi 2006)
Table 3-5 : Material properties of A2 tool steel and 6061-T651 aluminum alloy (Alcan 1970; Chen and Kovacevic 2003)
Material Temp (C)
Thermal Conductivity
(W/mK)
Heat Capacity (J/KgK)
Density (Kg/m3)
Young’s Modulus
(GPa)
Thermal expansion
(m/K)
Poisson’s ratio
A2 Steel 23.8 1096 7860 203 10.6 0.23
6061T651 Al alloy
0.0 162 917 2703 69.7 22.4 0.23
93.3 177 978 2685 66.2 24.6
204.4 192 1028 2657 59.2 26.6
315.6 207 1078 2630 47.8 27.6
427.7 223 1133 2602 31.7 29.6
571.1 253 1230 2574 0 34.2
42
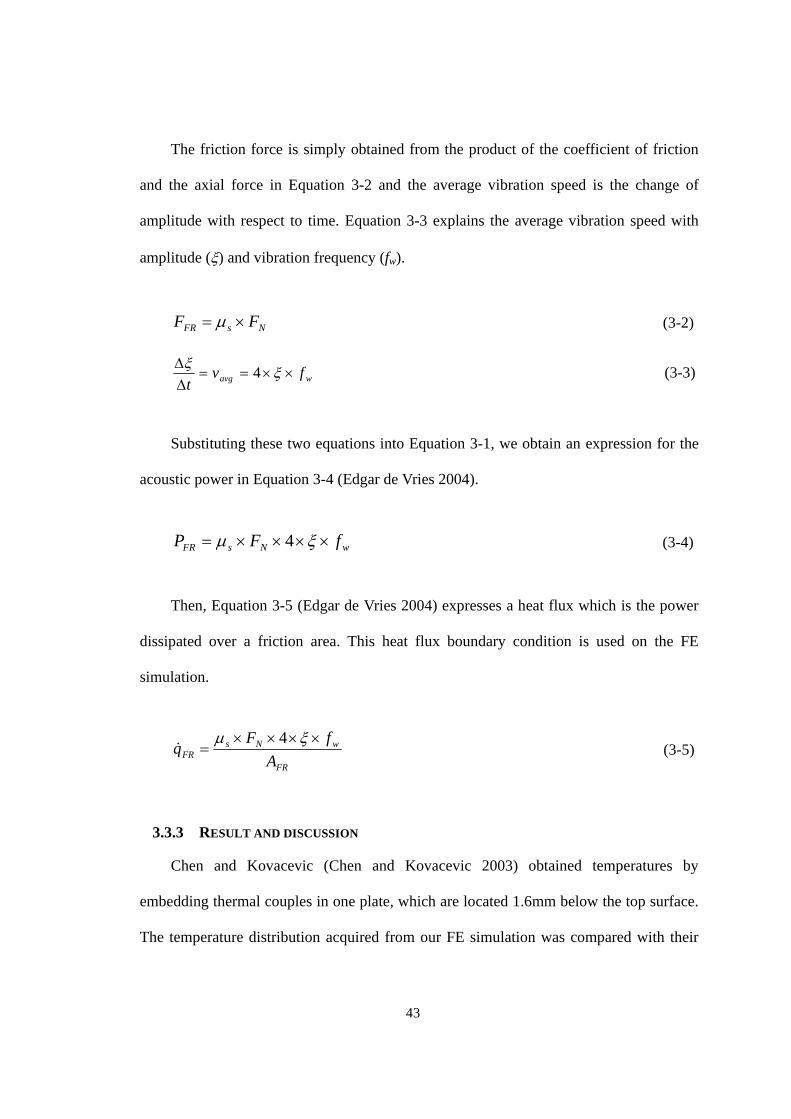
3.3.2 HEAT GENERATION DUE TO ULTRASONIC VIBRATION
Applying horizontal ultrasonic vibration on the workpiece using a vibration table
will generate heat due to the friction between the tool shoulder and the workpiece. This
heat is superimposed on the heat from the existing friction stir welding process. This heat
generation will affect the temperature distribution of the workpiece during the welding
process, which has critical impact on the material properties.
Edgar de Vries (Edgar de Vries 2004) developed an equation for the heat generated
by the friction from the ultrasonic welding process. This heat generation equation was
used for adding the ultrasonic effect on the FE simulation of our welding process. Figure
3-15 shows the overview of our ultrasonic assisted FSW process.
Figure 3-15 : Overview of ultrasonic assisted FSW process
The acoustic power (PFR) is calculated with the product of friction force (FFR) and
the average vibration speed (vavg) in Equation 3-1.
avgFRFR vFP (3-1)
43
The friction force is simply obtained from the product of the coefficient of friction
and the axial force in Equation 3-2 and the average vibration speed is the change of
amplitude with respect to time. Equation 3-3 explains the average vibration speed with
amplitude () and vibration frequency (fw).
NsFR FF (3-2)
wavg fvt
4 (3-3)
Substituting these two equations into Equation 3-1, we obtain an expression for the
acoustic power in Equation 3-4 (Edgar de Vries 2004).
wNsFR fFP 4 (3-4)
Then, Equation 3-5 (Edgar de Vries 2004) expresses a heat flux which is the power
dissipated over a friction area. This heat flux boundary condition is used on the FE
simulation.
FR
wNsFR A
fFq
4 (3-5)
3.3.3 RESULT AND DISCUSSION
Chen and Kovacevic (Chen and Kovacevic 2003) obtained temperatures by
embedding thermal couples in one plate, which are located 1.6mm below the top surface.
The temperature distribution acquired from our FE simulation was compared with their
44
experimental measurements. Figure 3-16 and Figure 3-17 showed the comparison of the
results from our FE simulation and their experiment. A couple of missing and unmatched
conditions make these two plots a little different. The plunge depth was not mentioned in
the paper and the temperature of the backing plate was assumed constant in our FE
simulation. However, overall, FEA prediction in the entire welding process was in a
reasonable agreement with their measurement.
Figure 3-16 : Comparison of temperature time curve for the location 10mm to the weld centerline and 1.6mm below the top surface of the plate
45
Figure 3-17 : Comparison of temperature time curve along the lateral direction for node lists 1.6mm below the top surface of the plate (time=3.5s)
After validating the FE model, the heat flux condition addressed in previous chapter
was added to the FE model. Table 3-6 shows three different heat flux conditions which
were applied to FE model of the conventional friction stir welding process. In reality, the
coefficient of friction and the stress depend on temperature. Here, these variables are
assumed to be constant. This simple approach is sufficient to predict the added ultrasonic
effect on the normal friction stir welding process in the preliminary step.
Table 3-6 : Heat flux conditions due to ultrasonic vibration
Coefficient of friction (s)
Stress (FN/AFR)
Amplitude () Frequency(fw) Heat flux( wq )
Condition 1 0.1 50MPa 5m 20kHz 2106 W/m2 Condition 2 100MPa 4106 W/m2 Condition 3 200MPa 8106 W/m2
46
For friction stir welding process with ultrasonic assistance, from Figure 3-18, it can
be seen that the peak temperature and the curvature of the temperature profile went up
according to the increase of the magnitude of heat flux by ultrasonic energy. This means
that the stirring action would occur in a hotter region than in existing FSW process. That
is to say, with ultrasonic assistance, less work is required by the tool to raise the
temperature of the workpiece. This temperature distribution in workpiece is very
important as it affects the thermal stress development. It was also observed from Figure
3-19 that the ultrasonic assistance led to the reduction of the principal stress in z-direction
when compared to the FSW without ultrasonic vibration. Therefore, the axial force would
decrease after adding the ultrasonic oscillation. Potentially, tool requires relatively low
energy to plasticize the material and consequently has longer life as well.
Without ultrasonic
Condition1
Condition2
Condition3
Figure 3-18 : Comparison of temperature time curve according to different conditions at the location 10mm to the weld centerline and 1.6mm below the top
surface of the plate
47
Without ultrasonic
Condition1
Condition2
Condition3
Figure 3-19 : Comparison of predicted principal stress(z-direction) with respect to time according to different conditions at the location 10mm to the weld centerline
and 1.6mm below the top surface of the plate
3.4 CONCLUSIONS
In this study, we developed FSW system using the in-house CNC machine and
reasonable welds were obtained for 6061-T651 aluminum alloy. The location of
minimum hardness is the boundary area between thermo-mechanically affected zone and
heat-affected zone, which coincide with the failure location of specimens for the tensile
test. Welding conditions such as the rotational speed, translational speed, and plunge
depth significantly influenced the weld quality. The experimental results agreed well with
48
the data published in papers. Furthermore, to verify the ultrasonic effect on FSW process,
FE model was performed using ABAQUS. The model was validated and employed to
analyze the temperature and flow stress from the cases with and without ultrasound. From
the FE simulation with ultrasonics, it was expected that ultrasonic assistance may
increase the temperature of the weld region, and consequently decrease the stress of the
region as compared with FSW without ultrasonics. This would ultimately lead to the
prolongation of the tool life.
49
CHAPTER 4 - THERMO-MECHANICAL FE MODEL OF ULTRASONIC ASSISTED FRICTION STIR WELDING
Ultrasonic assisted friction stir welding (UaFSW) is a hybrid welding technique,
where high frequency vibration is superimposed on the movement of a rotating tool. The
benefit of using ultrasonic vibration in the FSW process refers to the reduction in the
welding force and to the better welding quality. The UaFSW system is being developed
and its mechanism needs to be understood using both the experiments and the numerical
simulations. In this study, FE simulations of FSW and UaFSW using ABAQUS/Explicit
were carried out to examine plunge forces during the plunge phase of FSW and UaFSW,
respectively. The simulations of the conventional FSW process were validated. Then,
simulation of UaFSW process was performed by imposing sinusoidal horizontal
ultrasonic vibrations on the tool.
4.1 INTRODUCTION
Friction stir welding has two different stages including a plunge and a linear welding
phase as shown in Figure 4-1. In the plunge stage, a FSW tool penetrates the workpieces
to be welded. In the linear welding phase, the tool moves along the joint line. The whole
process adds frictional heat with intense plastic deformation to generate joints and the
plunge stage of FSW process is crucial since most of the thermomechanical conditions
are initiated and the highest temperature and forces are required in this stage during the
whole process. The characteristic of this phase makes it difficult in observing the details
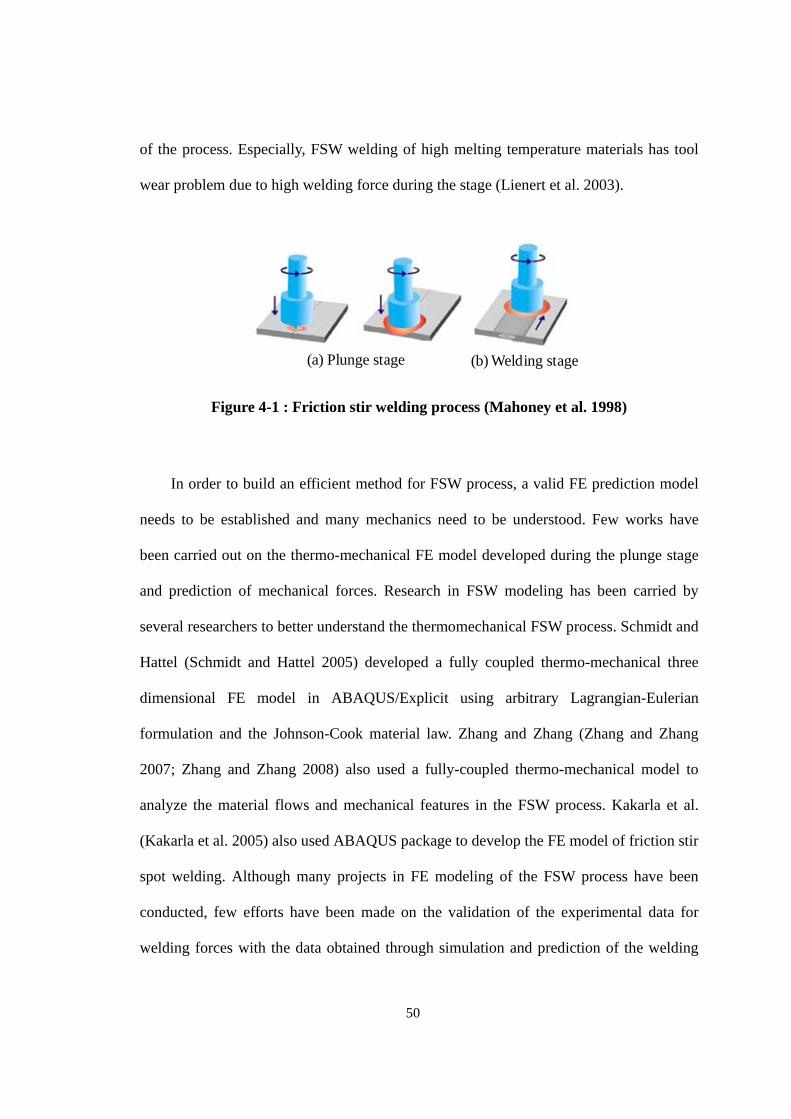
50
of the process. Especially, FSW welding of high melting temperature materials has tool
wear problem due to high welding force during the stage (Lienert et al. 2003).
(a) Plunge stage (b) Welding stage
Figure 4-1 : Friction stir welding process (Mahoney et al. 1998)
In order to build an efficient method for FSW process, a valid FE prediction model
needs to be established and many mechanics need to be understood. Few works have
been carried out on the thermo-mechanical FE model developed during the plunge stage
and prediction of mechanical forces. Research in FSW modeling has been carried by
several researchers to better understand the thermomechanical FSW process. Schmidt and
Hattel (Schmidt and Hattel 2005) developed a fully coupled thermo-mechanical three
dimensional FE model in ABAQUS/Explicit using arbitrary Lagrangian-Eulerian
formulation and the Johnson-Cook material law. Zhang and Zhang (Zhang and Zhang
2007; Zhang and Zhang 2008) also used a fully-coupled thermo-mechanical model to
analyze the material flows and mechanical features in the FSW process. Kakarla et al.
(Kakarla et al. 2005) also used ABAQUS package to develop the FE model of friction stir
spot welding. Although many projects in FE modeling of the FSW process have been
conducted, few efforts have been made on the validation of the experimental data for
welding forces with the data obtained through simulation and prediction of the welding
51
forces.
Research in FE modeling of various manufacturing processes using the ultrasonic
vibration techniques has been carried out. Mousavi et al. (Mousavi et al. 2007) performed
FE analysis by using the explicit analysis procedure in order to study the perceptive of
the mechanism of ultrasonic vibration extrusion. Ahmed et al. (Ahmed et al. 2007)
developed transient and coupled thermo-mechanical simulations of elasto-plastic
materials under conditions of ultrasonically assisted turning to study the effect of cutting
parameters and friction on ultrasonic assistance. Amini et al. (Amini et al. 2008) studied
turning of Inconel 738 with a tool vibrating at ultrasonic frequency by using MCS-Marc
and ANSYS software. Rosochowska and Rosochowski (Rosochowska and Rosochowski
2007) created FE model of ultrasonic back extrusion using ABAQUS/Explicit to examine
mechanisms responsible for the reduction in the mean forming force.
In this research, a three-dimensional solid mechanical model of FSW has been
developed using the finite element analysis (FEA) ABAQUS/Explicit. The model is
developed based on the actual experimental welding procedure in order to obtain the
numerical steady-state solution, such as force and temperature profile of the welding. We
investigated the thermo-mechanical processes in the material during the plunge phase
using numerical simulation and experiments. The plunge forces during the plunge phase
are considered because plunge forces in the plunge phase are higher than the plunge
forces in welding phase or traverse forces. The effects of vibration properties and
frictional conditions on the forces were investigated using the FE method.
52
4.2 FEM MODELING
4.2.1 THERMAL MODELS
In general, heat generation comes from two sources; frictional heating at the tool-
workpiece interface and plastic energy dissipation due to shear deformation in the nugget
zone. It has been suggested that frictional heating at the tool-workpiece interface is the
main heat source while the other account for only 1-2% of the total heat generation. The
governing equation for heat transfer process during the plunge phase of FSW process can
be written as
x y z p
T T Tc k k k q
t x x y y z z
(4-1)
where is the density c is the specific heat, k is heat conductivity, T is the
temperature, t is the time, pq is heat generation coming from plastic energy dissipation
due to shear deformation, and x, y, and z are spatial coordinate. The density, specific heat,
heat conductivity are temperature dependant parameters, which is used in this simulation
to acquire accurate results.
The rate of heat generation due to plastic energy dissipation, pq is computed from
plpq (4-2)
Where, is the heat fraction, is the shear stress, and pl is the rate of plastic
strain. For inelastic heat fraction, , because plasticity was assumed to heat workpieces
mostly, the heat fraction of 0.9 was used in this study. (Awang et al. 2006)
Heat generation also comes from frictional heating between tool and workpieces.
53
(Frigaard et al. 2001) If all the shearing work at the interface is converted into frictional
heat, the average heat generation per unit area becomes
0
zM
fq dM (4-3)
where fq is the frictional heat generation, is the angular velocity, and M is the
interfacial moment.
The moment required to rotate a circular tool relative to the workpiece surface under
the plunging action is derived by
2
0 02
zM RM dM P r dr (4-4)
where µ is the coefficient of friction, R is the surface radius, and P is the traction.
The angular velocity can be expressed in terms of the rotational speed N. By
substituting equation 4-4 and 2 N into equation 4-3, we derive
2 2 3
0
4(2 )2 Pr
3
R
fq N dr PNR (4-5)
From equation 4-5, it is sure that the frictional heat generation depends on the
rotational speed and the radius of the tool shoulder.
4.2.2 FE MODEL DESCRIPTION
One of the primary difficulties in modeling the plunge phase is the excessive mesh
distortion of the FE model leading to divergence problem. The current FE model utilizes
54
the ABAQUS/EXPLICIT finite element code and is based on Arbitrary Lagrangian-
Eulerian (ALE) adaptive mesh technique that automatically regenerates the mesh once
the elements are severely distorted due to large deformation. Adaptive meshing technique
in ABAQUS/Explicit creates a new mesh and remaps the solution parameters from the
existing mesh to the newly created mesh. In this study, the adaptive meshing was carried
out for every three increments of the tool and five mesh sweeps per adaptive mesh
increment was performed to improve the aspect ratio of distorted elements. Mass scaling
technique that modifies the densities of the materials in the model and improves the
computational efficiency was also used. In this study, mass scaling was carried out every
10 increments with stable time increments below a value of 51.0 10 .
4.2.2.1 FE mesh and geometry
A FE simulation model was performed for a butt weld, which joins two workpieces
as shown in Figure 4-2. It consists of a tool, a backing plate, and 3.175mm thickness
workpieces. The tool is made of A2 tool steel and consists of the shoulder and the non-
threaded tapered pin. Dimensions of the tool were selected based on Table 5-2. Since the
tool (A2 tool steel) and the backing plate were harder than the workpiece material (6061-
T651 aluminum alloy), they were assumed rigid surfaces. The workpieces have been
meshed using a biased mesh seed for better results around the moving tool. They have
been modeled using element type C3D8RT, which is an 8-node thermally coupled brick
having reduced integration and combined hourglass control whose stiffness-viscous
weight factor is 0.5.
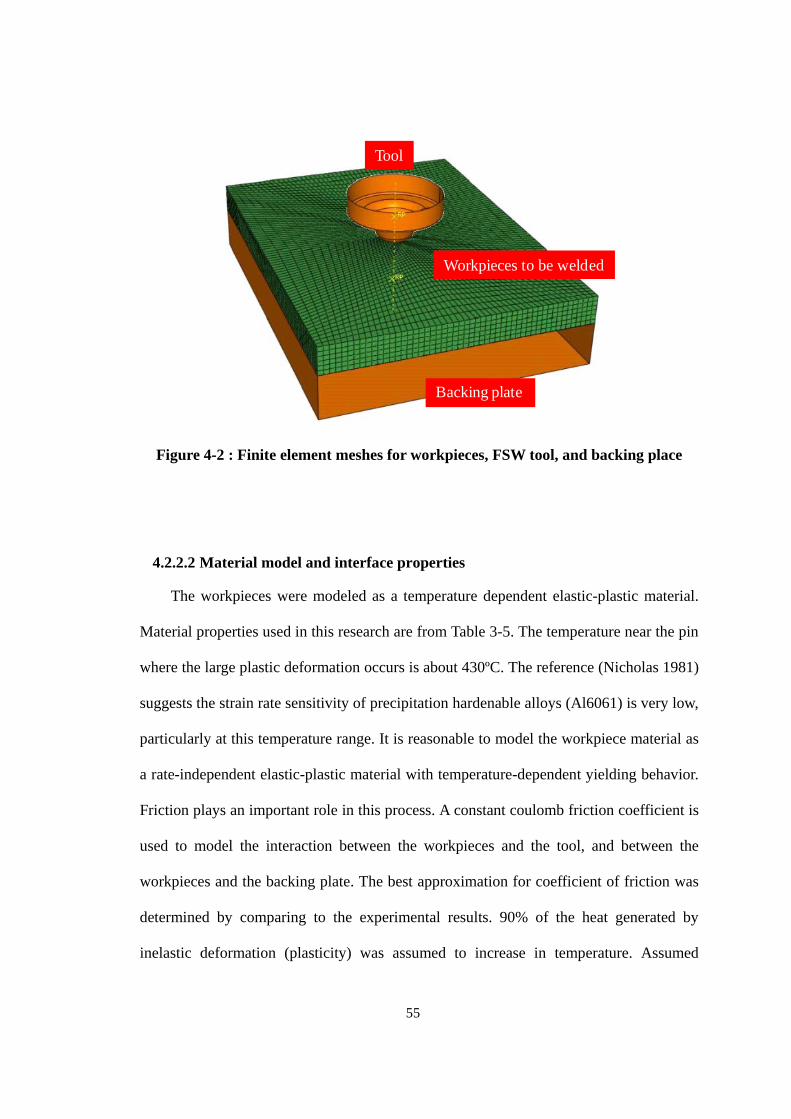
55
Tool
Workpieces to be welded
Backing plate
Figure 4-2 : Finite element meshes for workpieces, FSW tool, and backing place
4.2.2.2 Material model and interface properties
The workpieces were modeled as a temperature dependent elastic-plastic material.
Material properties used in this research are from Table 3-5. The temperature near the pin
where the large plastic deformation occurs is about 430ºC. The reference (Nicholas 1981)
suggests the strain rate sensitivity of precipitation hardenable alloys (Al6061) is very low,
particularly at this temperature range. It is reasonable to model the workpiece material as
a rate-independent elastic-plastic material with temperature-dependent yielding behavior.
Friction plays an important role in this process. A constant coulomb friction coefficient is
used to model the interaction between the workpieces and the tool, and between the
workpieces and the backing plate. The best approximation for coefficient of friction was
determined by comparing to the experimental results. 90% of the heat generated by
inelastic deformation (plasticity) was assumed to increase in temperature. Assumed
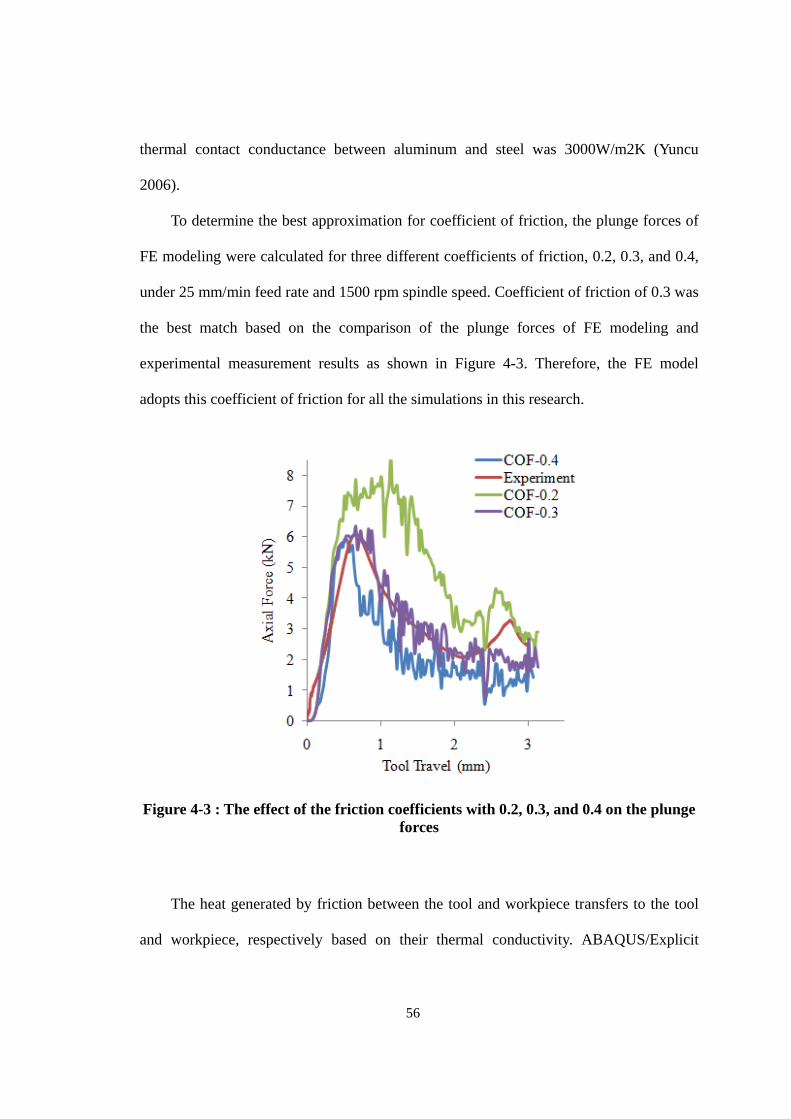
56
thermal contact conductance between aluminum and steel was 3000W/m2K (Yuncu
2006).
To determine the best approximation for coefficient of friction, the plunge forces of
FE modeling were calculated for three different coefficients of friction, 0.2, 0.3, and 0.4,
under 25 mm/min feed rate and 1500 rpm spindle speed. Coefficient of friction of 0.3 was
the best match based on the comparison of the plunge forces of FE modeling and
experimental measurement results as shown in Figure 4-3. Therefore, the FE model
adopts this coefficient of friction for all the simulations in this research.
Figure 4-3 : The effect of the friction coefficients with 0.2, 0.3, and 0.4 on the plunge forces
The heat generated by friction between the tool and workpiece transfers to the tool
and workpiece, respectively based on their thermal conductivity. ABAQUS/Explicit
57
requires the heat fraction of converted heat distributed to the workpiece and the value of
0.87 was set to the ratio of heat partition into the workpiece. (Miller 2006)
4.2.2.3 Boundary conditions
In the FE model, the same translational and rotational speeds used in experiments
were employed. The top surface of the workpiece was under free convection with
convection coefficient of 30 W/m2C from Awang (Awang et al. 2005) and ambient air
temperature of 22C. The backing plate and two sides of workpieces were fixed in all
degree of freedom. Simulation of the ultrasonic assisted friction stir welding was
performed by imposing horizontal ultrasonic vibrations on the tip of the FSW tool.
Namely, the tool was subjected to ultrasonic oscillations of 20 kHz and amplitude by
imposing a boundary constraint to the tip of the tool in the form of a sinusoidal
displacement. The ultrasonic vibration in the model was applied in the direction of tool
travel. The amplitude a is defined as a Fourier series;
0 0 01
cos ( ) sin ( )N
n nn
a A A n t t B n t t
(4-6)
where, 0t , N, , A0, An, and Bn, n=1,2…N, are user-defined constants.
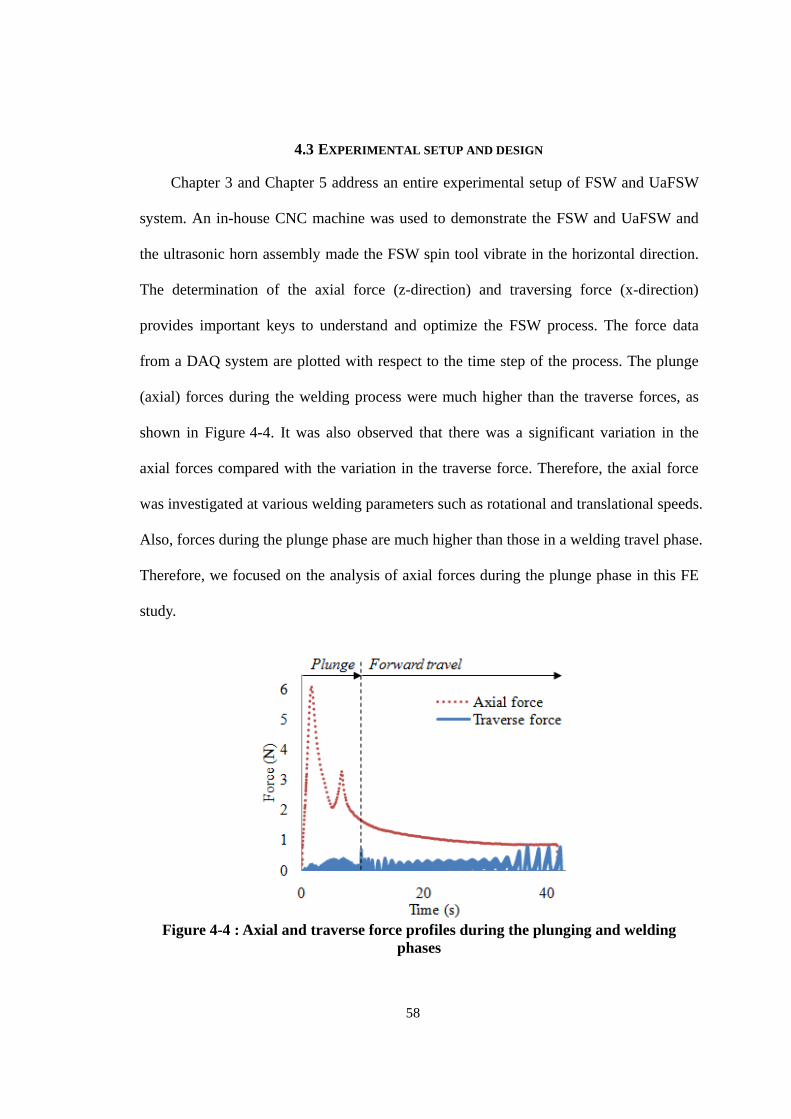
58
4.3 EXPERIMENTAL SETUP AND DESIGN
Chapter 3 and Chapter 5 address an entire experimental setup of FSW and UaFSW
system. An in-house CNC machine was used to demonstrate the FSW and UaFSW and
the ultrasonic horn assembly made the FSW spin tool vibrate in the horizontal direction.
The determination of the axial force (z-direction) and traversing force (x-direction)
provides important keys to understand and optimize the FSW process. The force data
from a DAQ system are plotted with respect to the time step of the process. The plunge
(axial) forces during the welding process were much higher than the traverse forces, as
shown in Figure 4-4. It was also observed that there was a significant variation in the
axial forces compared with the variation in the traverse force. Therefore, the axial force
was investigated at various welding parameters such as rotational and translational speeds.
Also, forces during the plunge phase are much higher than those in a welding travel phase.
Therefore, we focused on the analysis of axial forces during the plunge phase in this FE
study.
Figure 4-4 : Axial and traverse force profiles during the plunging and welding
phases
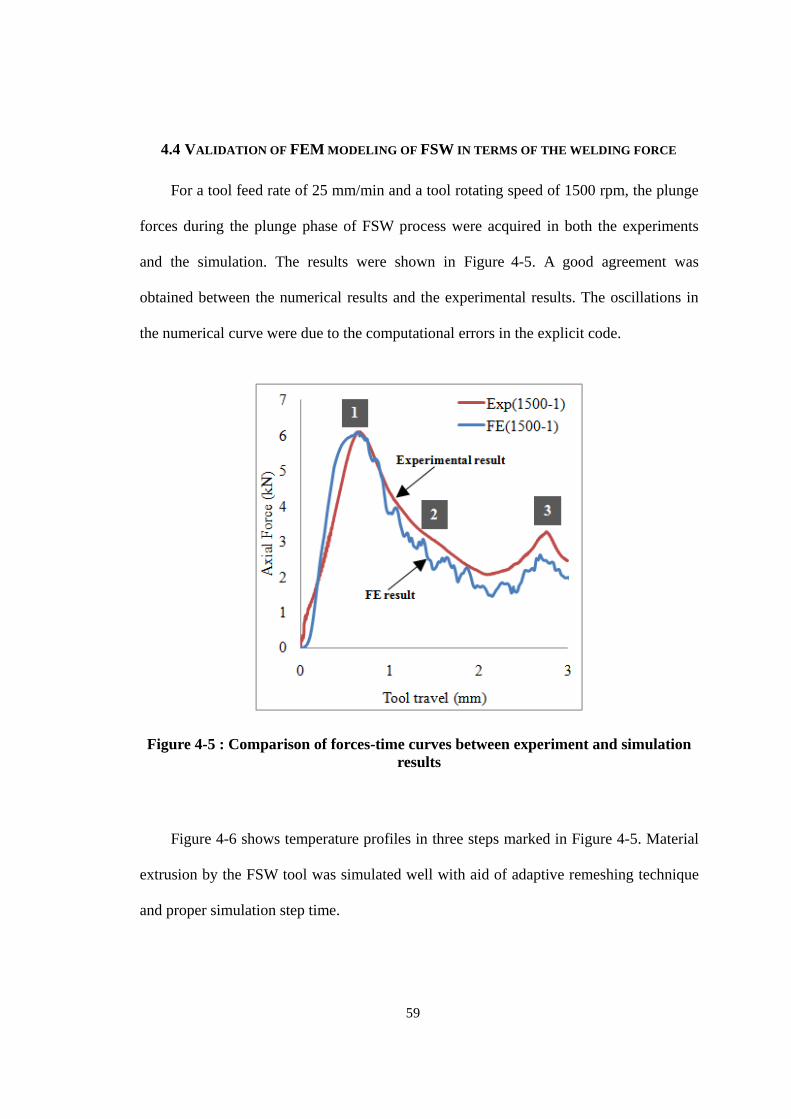
59
4.4 VALIDATION OF FEM MODELING OF FSW IN TERMS OF THE WELDING FORCE
For a tool feed rate of 25 mm/min and a tool rotating speed of 1500 rpm, the plunge
forces during the plunge phase of FSW process were acquired in both the experiments
and the simulation. The results were shown in Figure 4-5. A good agreement was
obtained between the numerical results and the experimental results. The oscillations in
the numerical curve were due to the computational errors in the explicit code.
Figure 4-5 : Comparison of forces-time curves between experiment and simulation results
Figure 4-6 shows temperature profiles in three steps marked in Figure 4-5. Material
extrusion by the FSW tool was simulated well with aid of adaptive remeshing technique
and proper simulation step time.
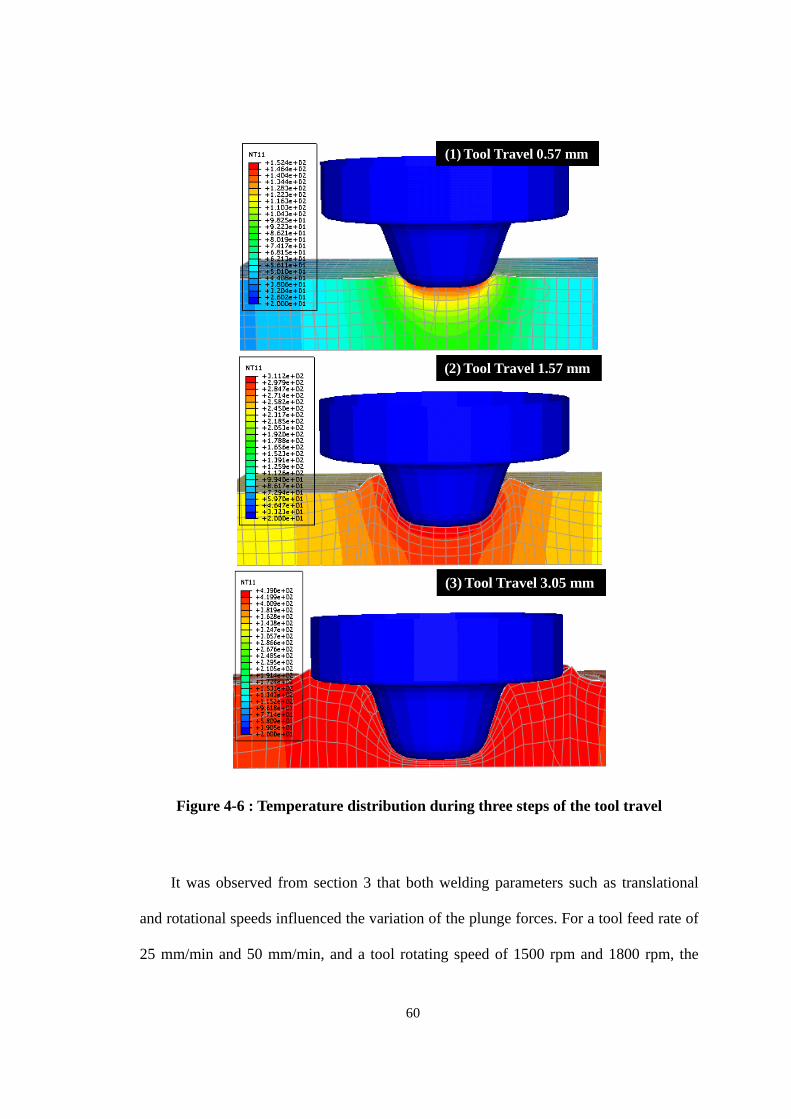
60
(1) Tool Travel 0.57 mm
(2) Tool Travel 1.57 mm
(3) Tool Travel 3.05 mm
Figure 4-6 : Temperature distribution during three steps of the tool travel
It was observed from section 3 that both welding parameters such as translational
and rotational speeds influenced the variation of the plunge forces. For a tool feed rate of
25 mm/min and 50 mm/min, and a tool rotating speed of 1500 rpm and 1800 rpm, the
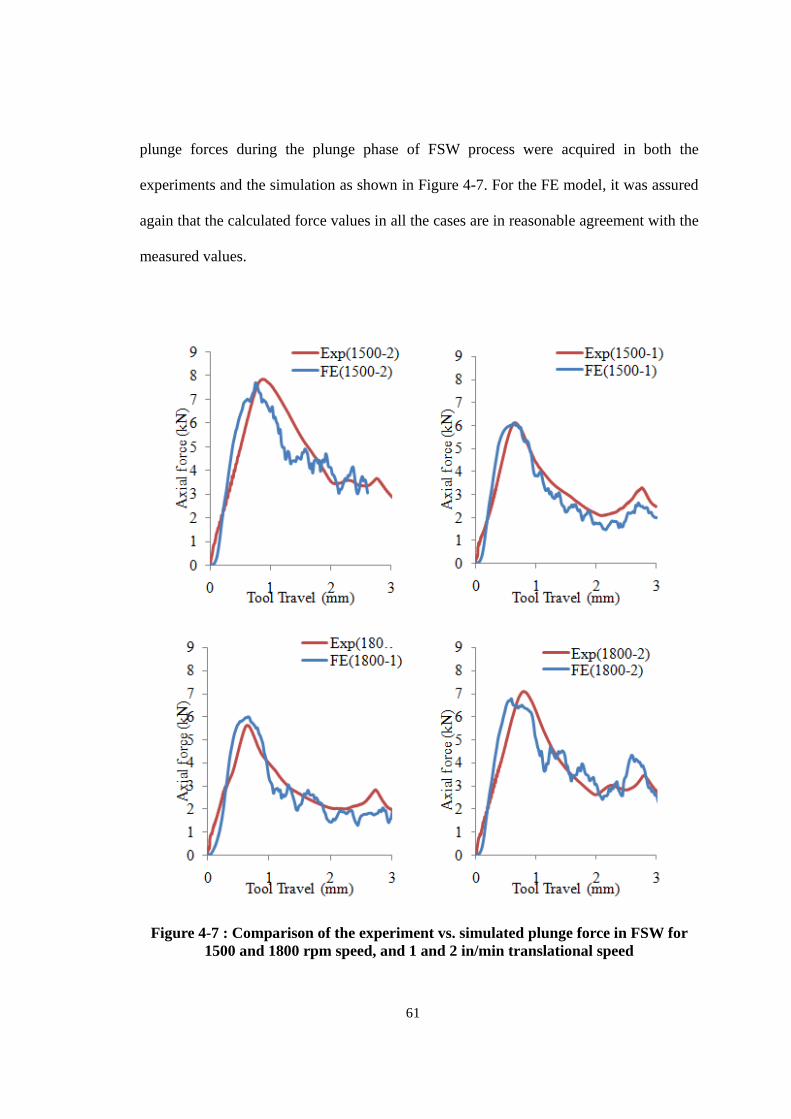
61
plunge forces during the plunge phase of FSW process were acquired in both the
experiments and the simulation as shown in Figure 4-7. For the FE model, it was assured
again that the calculated force values in all the cases are in reasonable agreement with the
measured values.
Figure 4-7 : Comparison of the experiment vs. simulated plunge force in FSW for 1500 and 1800 rpm speed, and 1 and 2 in/min translational speed
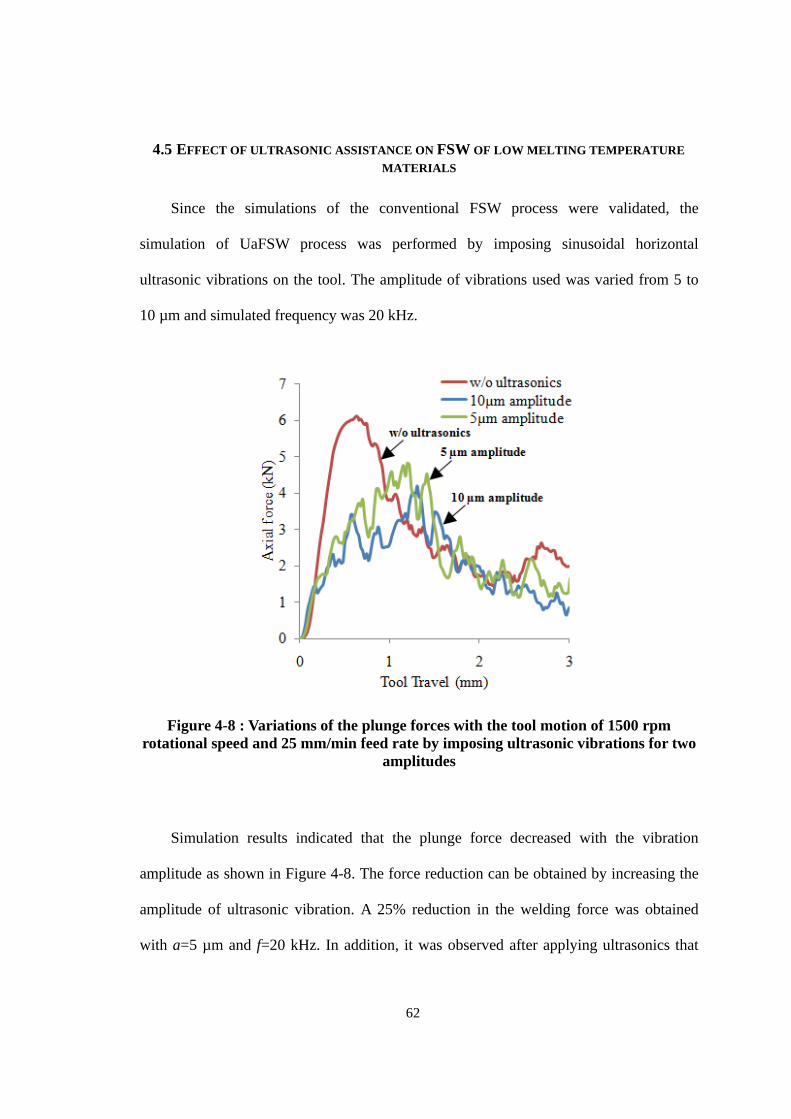
62
4.5 EFFECT OF ULTRASONIC ASSISTANCE ON FSW OF LOW MELTING TEMPERATURE
MATERIALS
Since the simulations of the conventional FSW process were validated, the
simulation of UaFSW process was performed by imposing sinusoidal horizontal
ultrasonic vibrations on the tool. The amplitude of vibrations used was varied from 5 to
10 µm and simulated frequency was 20 kHz.
Figure 4-8 : Variations of the plunge forces with the tool motion of 1500 rpm rotational speed and 25 mm/min feed rate by imposing ultrasonic vibrations for two
amplitudes
Simulation results indicated that the plunge force decreased with the vibration
amplitude as shown in Figure 4-8. The force reduction can be obtained by increasing the
amplitude of ultrasonic vibration. A 25% reduction in the welding force was obtained
with a=5 µm and f=20 kHz. In addition, it was observed after applying ultrasonics that
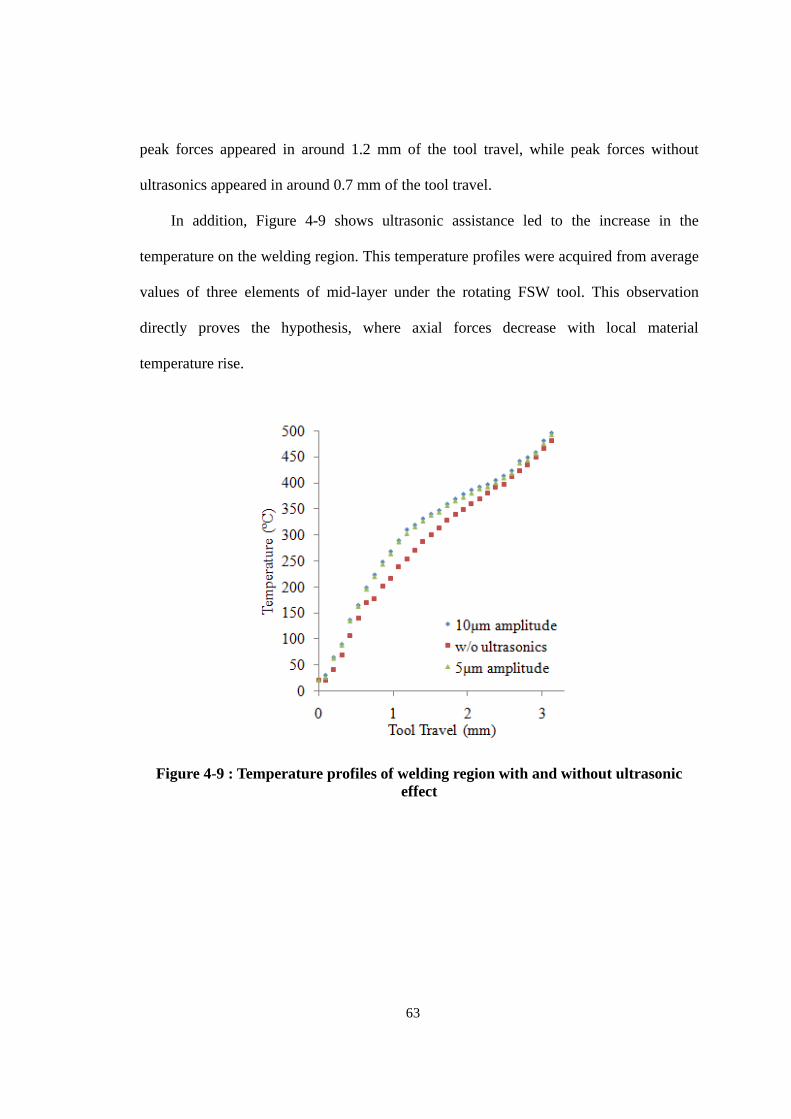
63
peak forces appeared in around 1.2 mm of the tool travel, while peak forces without
ultrasonics appeared in around 0.7 mm of the tool travel.
In addition, Figure 4-9 shows ultrasonic assistance led to the increase in the
temperature on the welding region. This temperature profiles were acquired from average
values of three elements of mid-layer under the rotating FSW tool. This observation
directly proves the hypothesis, where axial forces decrease with local material
temperature rise.
Figure 4-9 : Temperature profiles of welding region with and without ultrasonic effect
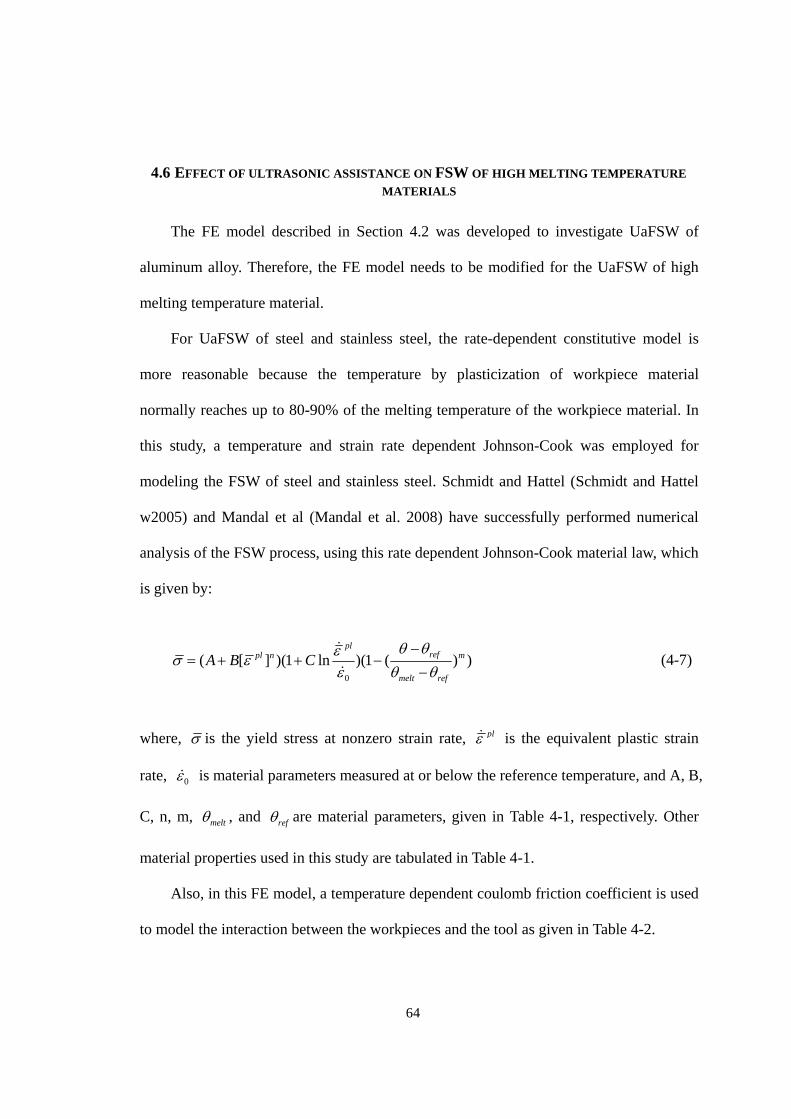
64
4.6 EFFECT OF ULTRASONIC ASSISTANCE ON FSW OF HIGH MELTING TEMPERATURE
MATERIALS
The FE model described in Section 4.2 was developed to investigate UaFSW of
aluminum alloy. Therefore, the FE model needs to be modified for the UaFSW of high
melting temperature material.
For UaFSW of steel and stainless steel, the rate-dependent constitutive model is
more reasonable because the temperature by plasticization of workpiece material
normally reaches up to 80-90% of the melting temperature of the workpiece material. In
this study, a temperature and strain rate dependent Johnson-Cook was employed for
modeling the FSW of steel and stainless steel. Schmidt and Hattel (Schmidt and Hattel
w2005) and Mandal et al (Mandal et al. 2008) have successfully performed numerical
analysis of the FSW process, using this rate dependent Johnson-Cook material law, which
is given by:
0
( [ ] )(1 ln )(1 ( ) )pl
refpl n m
melt ref
A B C
(4-7)
where, is the yield stress at nonzero strain rate, pl is the equivalent plastic strain
rate, 0 is material parameters measured at or below the reference temperature, and A, B,
C, n, m, melt , and ref are material parameters, given in Table 4-1, respectively. Other
material properties used in this study are tabulated in Table 4-1.
Also, in this FE model, a temperature dependent coulomb friction coefficient is used
to model the interaction between the workpieces and the tool as given in Table 4-2.
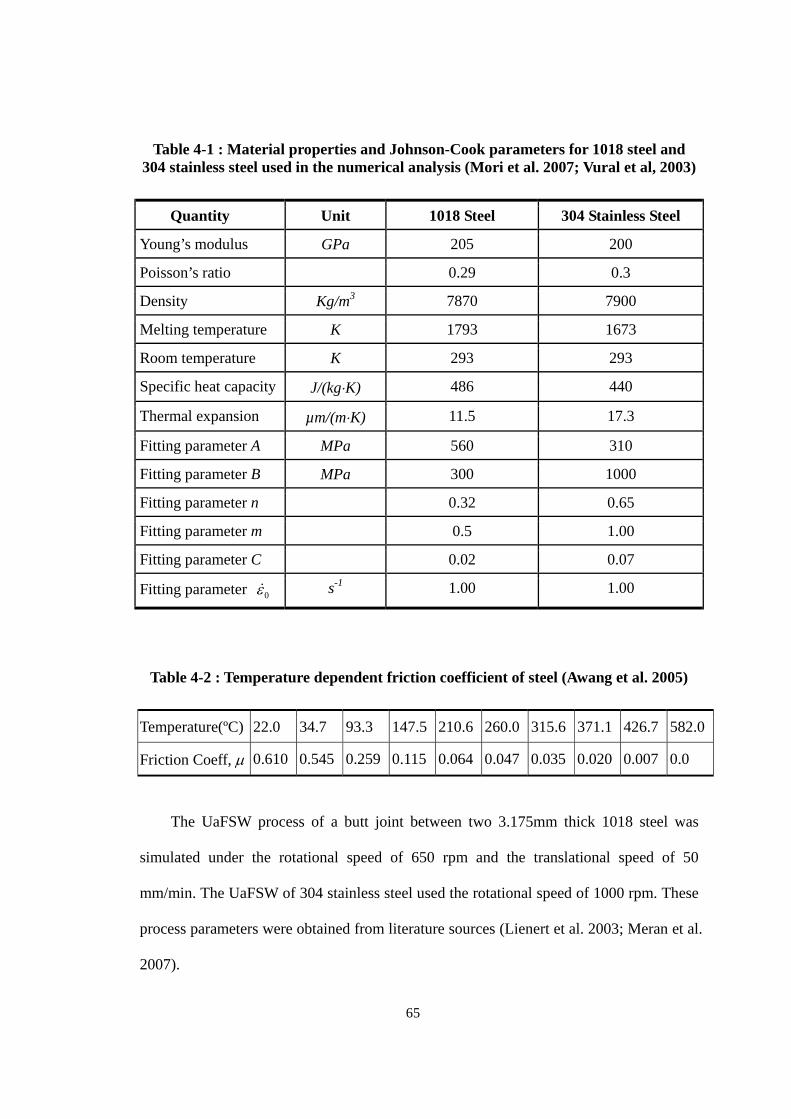
65
Table 4-1 : Material properties and Johnson-Cook parameters for 1018 steel and 304 stainless steel used in the numerical analysis (Mori et al. 2007; Vural et al, 2003)
Quantity Unit 1018 Steel 304 Stainless Steel
Young’s modulus GPa 205 200
Poisson’s ratio 0.29 0.3
Density Kg/m3 7870 7900
Melting temperature K 1793 1673
Room temperature K 293 293
Specific heat capacity J/(kgK) 486 440
Thermal expansion µm/(mK) 11.5 17.3
Fitting parameter A MPa 560 310
Fitting parameter B MPa 300 1000
Fitting parameter n 0.32 0.65
Fitting parameter m 0.5 1.00
Fitting parameter C 0.02 0.07
Fitting parameter 0 s-1 1.00 1.00
Table 4-2 : Temperature dependent friction coefficient of steel (Awang et al. 2005)
Temperature(ºC) 22.0 34.7 93.3 147.5 210.6 260.0 315.6 371.1 426.7 582.0
Friction Coeff, 0.610 0.545 0.259 0.115 0.064 0.047 0.035 0.020 0.007 0.0
The UaFSW process of a butt joint between two 3.175mm thick 1018 steel was
simulated under the rotational speed of 650 rpm and the translational speed of 50
mm/min. The UaFSW of 304 stainless steel used the rotational speed of 1000 rpm. These
process parameters were obtained from literature sources (Lienert et al. 2003; Meran et al.
2007).
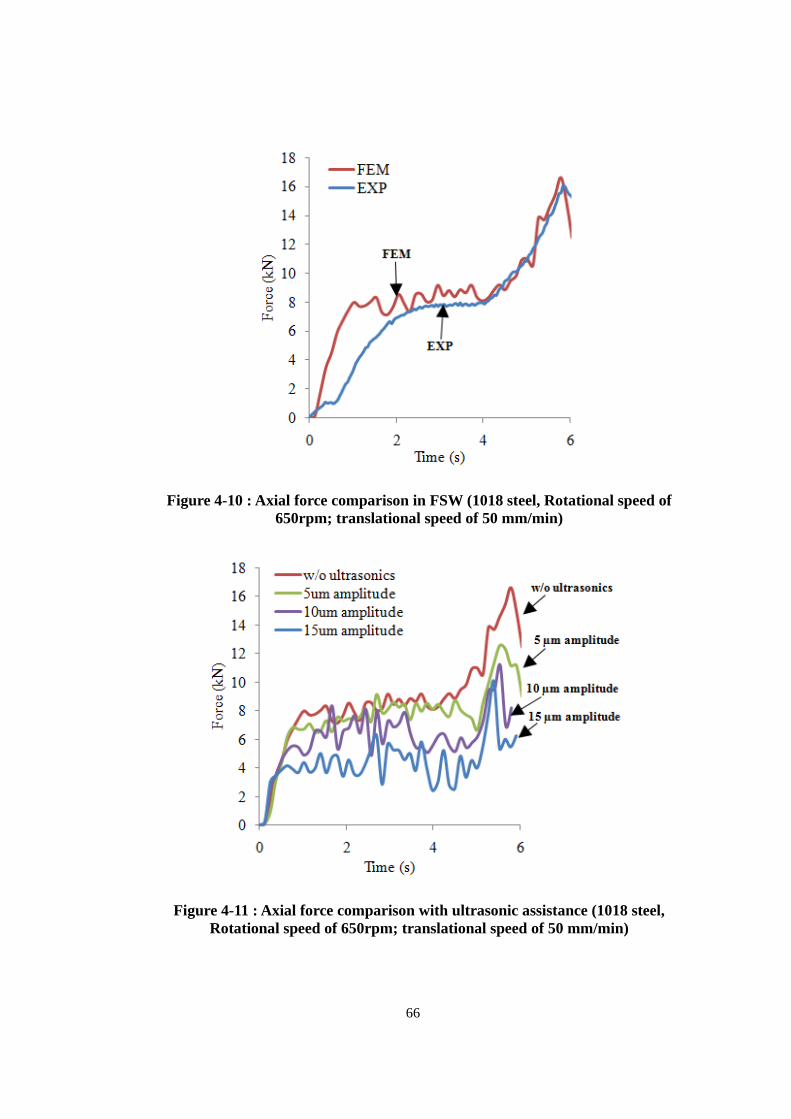
66
Figure 4-10 : Axial force comparison in FSW (1018 steel, Rotational speed of 650rpm; translational speed of 50 mm/min)
Figure 4-11 : Axial force comparison with ultrasonic assistance (1018 steel, Rotational speed of 650rpm; translational speed of 50 mm/min)
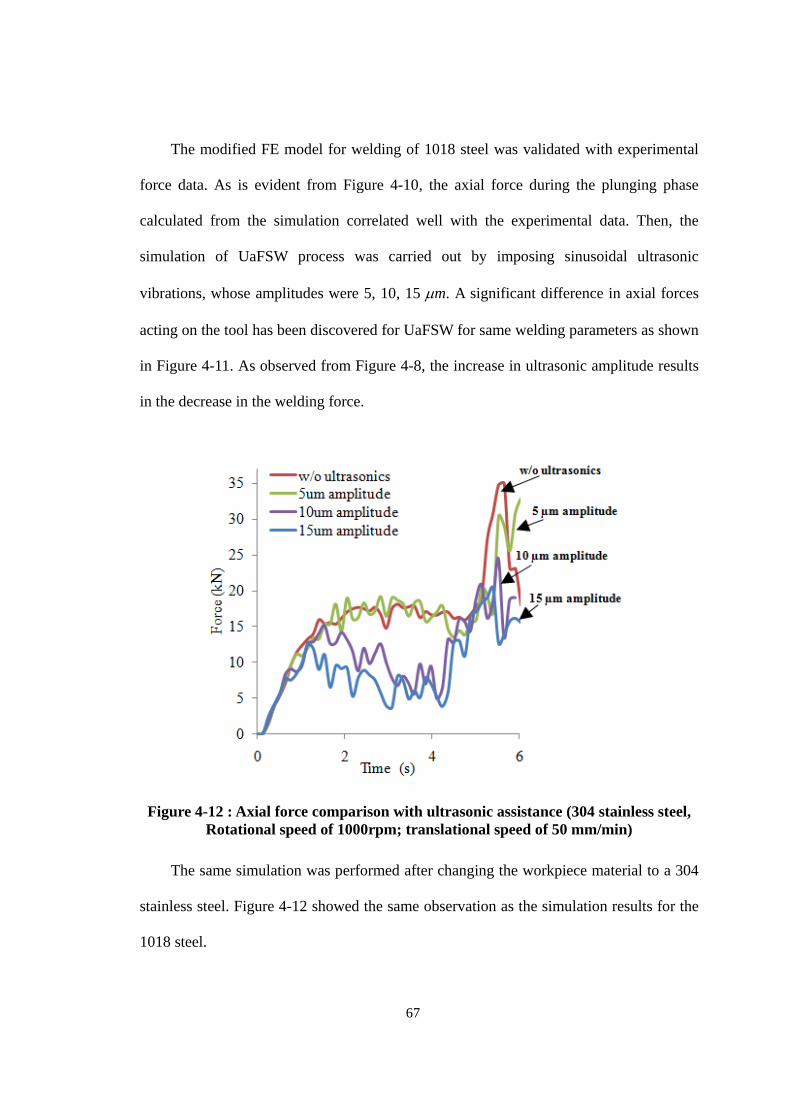
67
The modified FE model for welding of 1018 steel was validated with experimental
force data. As is evident from Figure 4-10, the axial force during the plunging phase
calculated from the simulation correlated well with the experimental data. Then, the
simulation of UaFSW process was carried out by imposing sinusoidal ultrasonic
vibrations, whose amplitudes were 5, 10, 15 m. A significant difference in axial forces
acting on the tool has been discovered for UaFSW for same welding parameters as shown
in Figure 4-11. As observed from Figure 4-8, the increase in ultrasonic amplitude results
in the decrease in the welding force.
Figure 4-12 : Axial force comparison with ultrasonic assistance (304 stainless steel, Rotational speed of 1000rpm; translational speed of 50 mm/min)
The same simulation was performed after changing the workpiece material to a 304
stainless steel. Figure 4-12 showed the same observation as the simulation results for the
1018 steel.
68
4.7 CONCLUSIONS
The FE analysis was used to simulate axial forces during the plunge phase of FSW
and UaFSW, respectively. For FE analysis of FSW of aluminum alloy, coefficient of
friction was selected based on the comparison of the plunge forces of FE modeling and
experimental measurement results. The plunge forces acquired in both the experiments
and the simulation showed a good agreement. Furthermore, the modified UaFSW FE
model was developed using temperature and rate dependent Johnson-Cook model and
temperature dependent friction coefficient for welding of 1018 steel and a 304 stainless
steel. For FE analysis of UaFSW, it was observed that the plunge forces were reduced by
using the ultrasonic vibrations. In addition, it was shown that the plunge forces could be
decreased by increasing the amplitude of vibrations.
69
CHAPTER 5 - EXPERIMENTAL INVESTIGATIONS OF THE ULTRASONIC ASSISTED FRICTION STIR WELDING PROCESS
5.1 INTRODUCTION
The purpose of this chapter is to design and build an ultrasonic system able to
integrate the ultrasonic oscillations to the FSW system. By integrating the ultrasonic to
the FSW process, many benefits are expected in terms of welding quality, welding force,
and tool life. Integration of ultrasonic vibration into conventional drilling and welding
processes have been achieved in such a way that ultrasonic vibration is applied to the tool
which is directly connected to ultrasonic transducer or horn. To overcome these
disadvantages, we are introducing a method where the ultrasonic vibration is applied to a
side of a rotating tool so that the welding tool can vibrate in a horizontal manner. It is
much simpler and more effective than traditional way.
For designing the ultrasonic system, the natural frequency of the ultrasonic horn was
considered to be as close as possible to the working frequency of the generator. The
performance of the ultrasonic system is related to the amplitude of the oscillations. In this
study, a laser vibrometer was applied to measure the amplitude of the ultrasonic horn.
Thrust force measurement, mechanical testing, and defect analysis were used in studying
the influence of the ultrasonic oscillations on the conventional FSW process.
70
5.2 DESIGN CONCEPT OF THE ULTRASONIC ASSISTED FSW PROCESS
Ultrasonic system needs to be integrated into conventional FSW system to
effectively transmit the vibrational energy to the workpiece. Ultrasonic energy can be
transmitted into the welding region through various routes such as through the tool,
workpiece, or a bottom support. In this study, the ultrasonic energy was applied to the
rotating tool. However, compared with the commonly used method in which ultrasonic
system is bolted to the tool, ultrasonic is applied to the side of the rotating tool with an
aid of bearings as shown in Figure 5-1. This configuration simplifies the integration
procedure since the ultrasonic transmitter can be independently designed and fabricated
without changing any part of the existing FSW machine.
The ultrasonic system for this hybrid welding process consists of three components,
which are ultrasonic generator, ultrasonic transducer, and ultrasonic horn. Ultrasonic
generator, as shown in Figure 5-2, generates sinusoidal wave in specific frequency from
the supplied power source. The high frequency signal forces the transducers to vibrate at
the imposed frequency. Typical power supplies have maximum outputs ranging from a
few hundred watts to several kilowatts. The ultrasonic generator by Weber Ultrasonics
was used in this study. Ultrasonic transducer, as shown in Figure 5-3, converts the
electrical wave to mechanical vibration which is small and must be amplified using an
acoustic horn. For ultrasonic assisted friction stir welding system, the most appropriate is
with longitudinal oscillations. In this study, the generator and transducer operates at a
frequency of 20 kHz and 40 kHz with a variable bandwidth of 1 kHz and 4 kHz
respectively. Specifications of the 40 kHz ultrasonic generator are shown in Table 5-1.
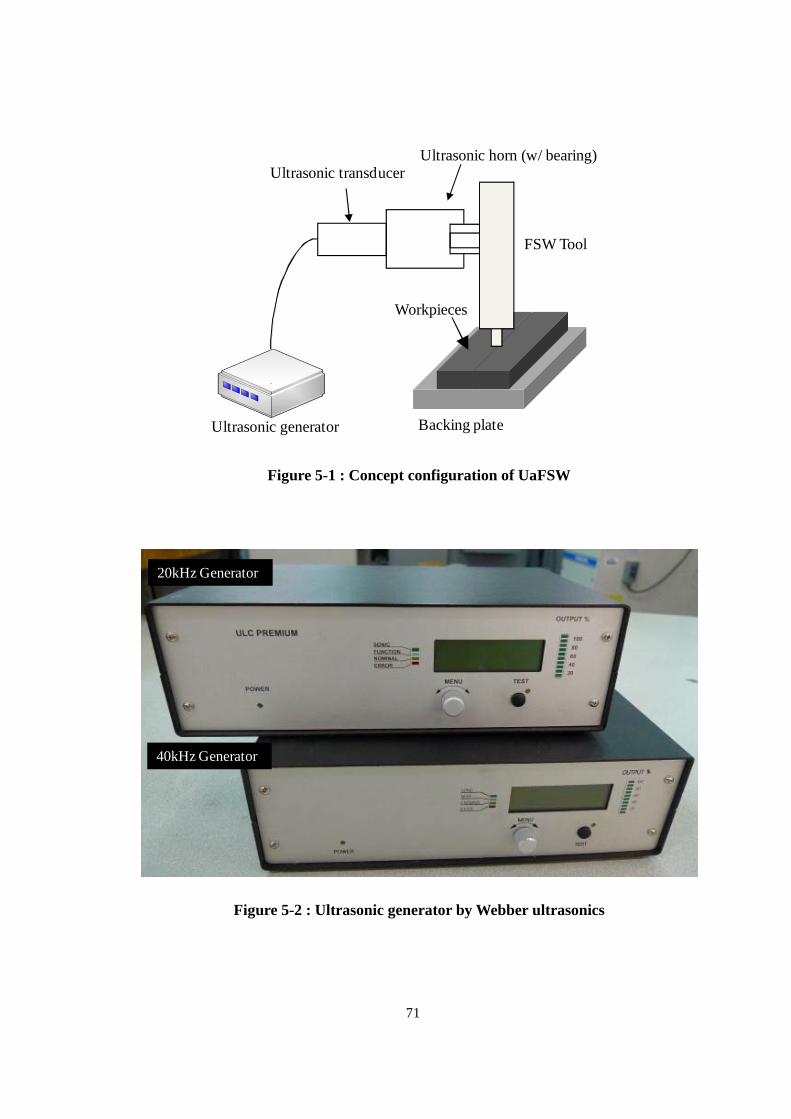
71
Ultrasonic horn (w/ bearing)Ultrasonic transducer
Backing plate
Workpieces
Ultrasonic generator
FSW Tool
Figure 5-1 : Concept configuration of UaFSW
20kHz Generator
40kHz Generator
Figure 5-2 : Ultrasonic generator by Webber ultrasonics
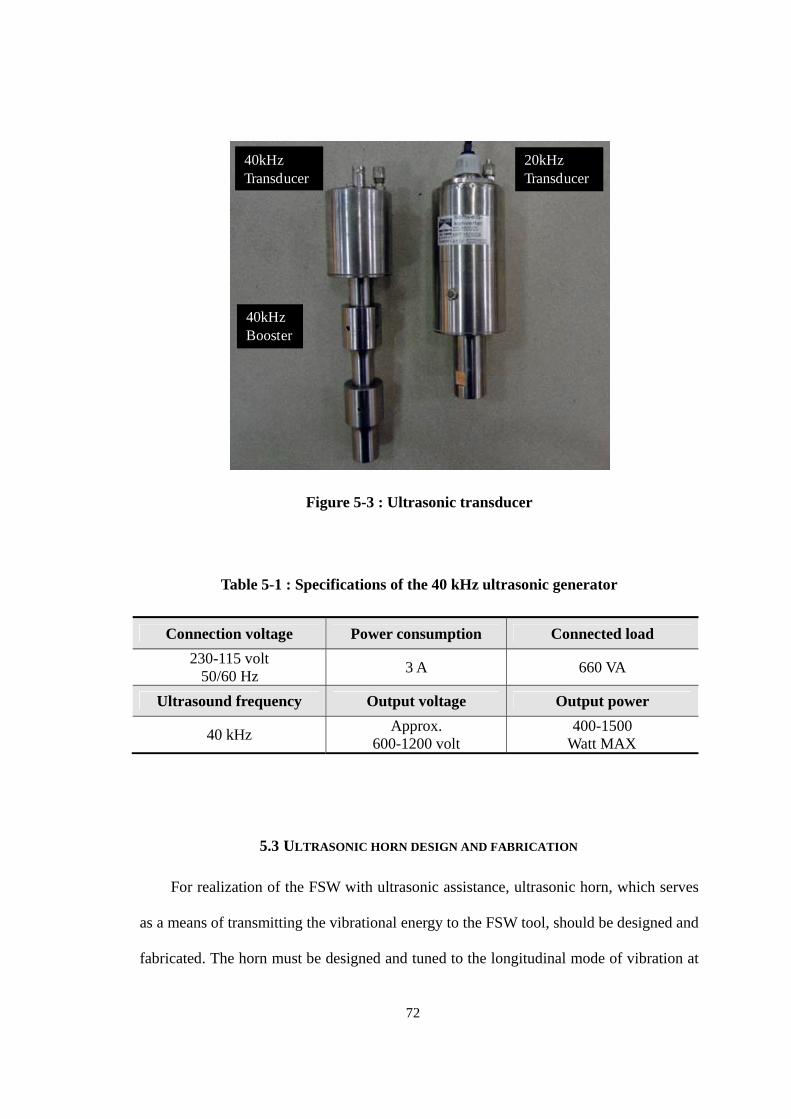
72
20kHz Transducer
40kHz Transducer
40kHz Booster
Figure 5-3 : Ultrasonic transducer
Table 5-1 : Specifications of the 40 kHz ultrasonic generator
Connection voltage Power consumption Connected load
230-115 volt 50/60 Hz
3 A 660 VA
Ultrasound frequency Output voltage Output power
40 kHz Approx.
600-1200 volt 400-1500
Watt MAX
5.3 ULTRASONIC HORN DESIGN AND FABRICATION
For realization of the FSW with ultrasonic assistance, ultrasonic horn, which serves
as a means of transmitting the vibrational energy to the FSW tool, should be designed and
fabricated. The horn must be designed and tuned to the longitudinal mode of vibration at
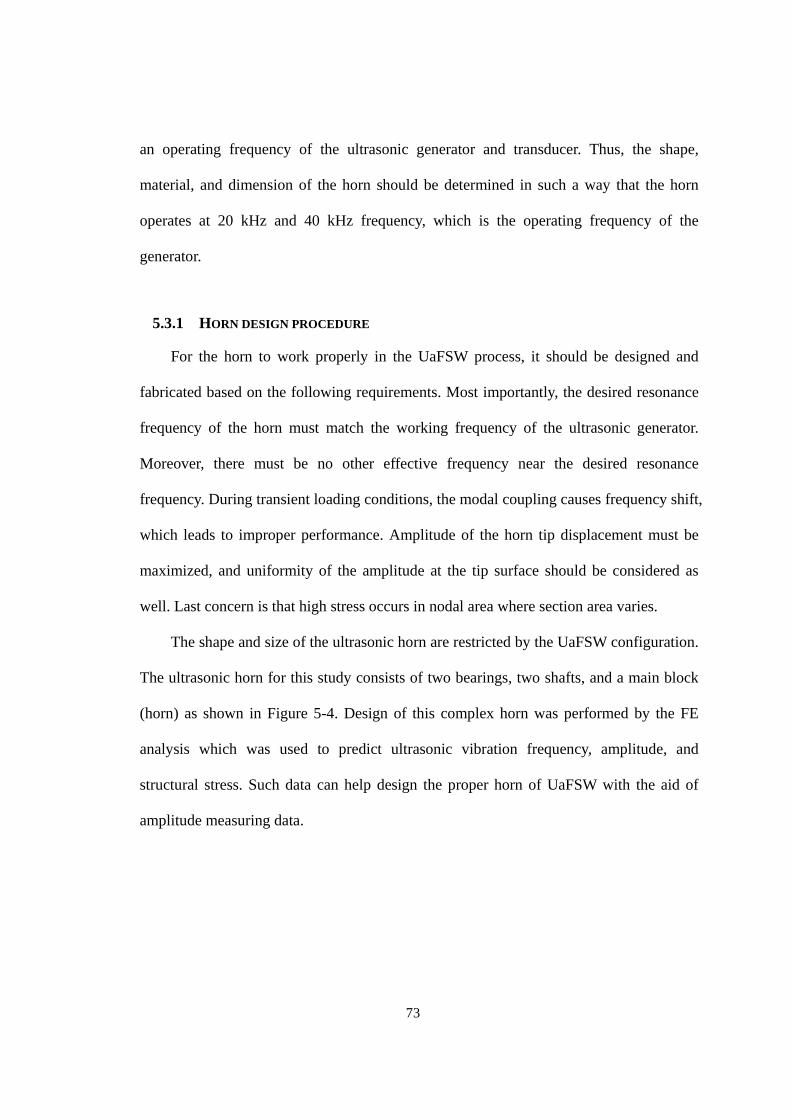
73
an operating frequency of the ultrasonic generator and transducer. Thus, the shape,
material, and dimension of the horn should be determined in such a way that the horn
operates at 20 kHz and 40 kHz frequency, which is the operating frequency of the
generator.
5.3.1 HORN DESIGN PROCEDURE
For the horn to work properly in the UaFSW process, it should be designed and
fabricated based on the following requirements. Most importantly, the desired resonance
frequency of the horn must match the working frequency of the ultrasonic generator.
Moreover, there must be no other effective frequency near the desired resonance
frequency. During transient loading conditions, the modal coupling causes frequency shift,
which leads to improper performance. Amplitude of the horn tip displacement must be
maximized, and uniformity of the amplitude at the tip surface should be considered as
well. Last concern is that high stress occurs in nodal area where section area varies.
The shape and size of the ultrasonic horn are restricted by the UaFSW configuration.
The ultrasonic horn for this study consists of two bearings, two shafts, and a main block
(horn) as shown in Figure 5-4. Design of this complex horn was performed by the FE
analysis which was used to predict ultrasonic vibration frequency, amplitude, and
structural stress. Such data can help design the proper horn of UaFSW with the aid of
amplitude measuring data.
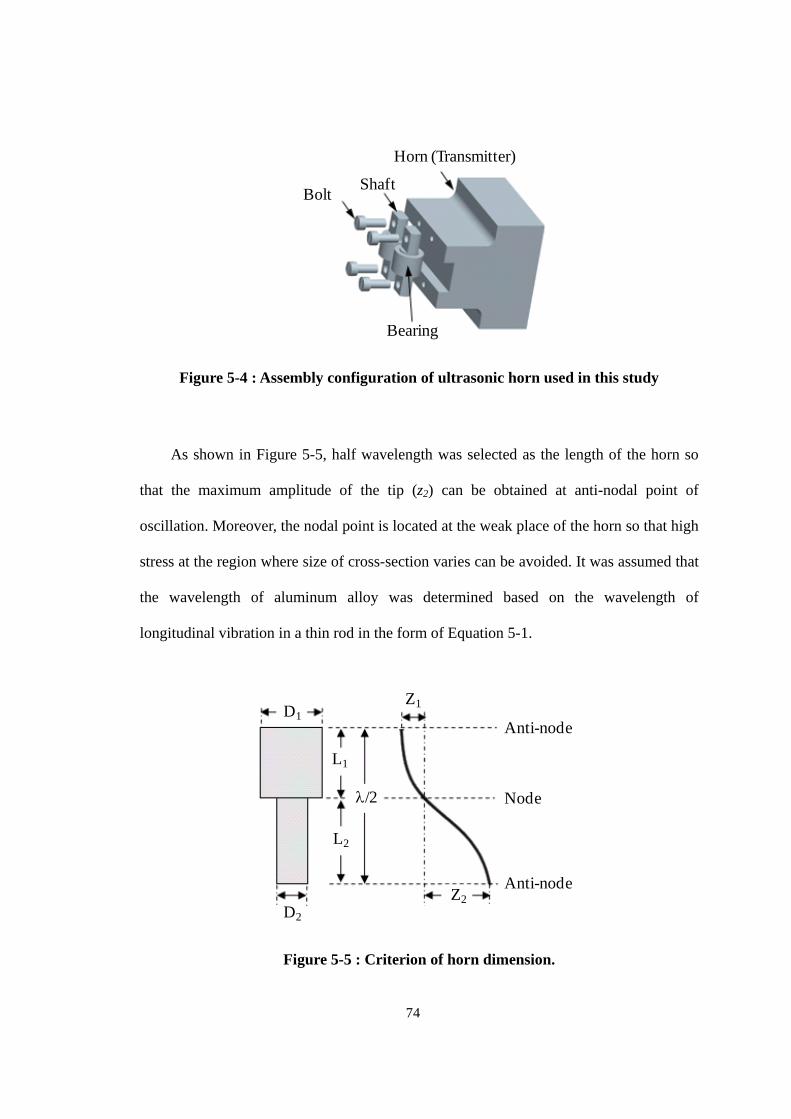
74
Bearing
ShaftBolt
Horn (Transmitter)
Figure 5-4 : Assembly configuration of ultrasonic horn used in this study
As shown in Figure 5-5, half wavelength was selected as the length of the horn so
that the maximum amplitude of the tip (z2) can be obtained at anti-nodal point of
oscillation. Moreover, the nodal point is located at the weak place of the horn so that high
stress at the region where size of cross-section varies can be avoided. It was assumed that
the wavelength of aluminum alloy was determined based on the wavelength of
longitudinal vibration in a thin rod in the form of Equation 5-1.
D1
L1
L2
D2
/2
Z1
Z2
Anti-node
Node
Anti-node
Figure 5-5 : Criterion of horn dimension.
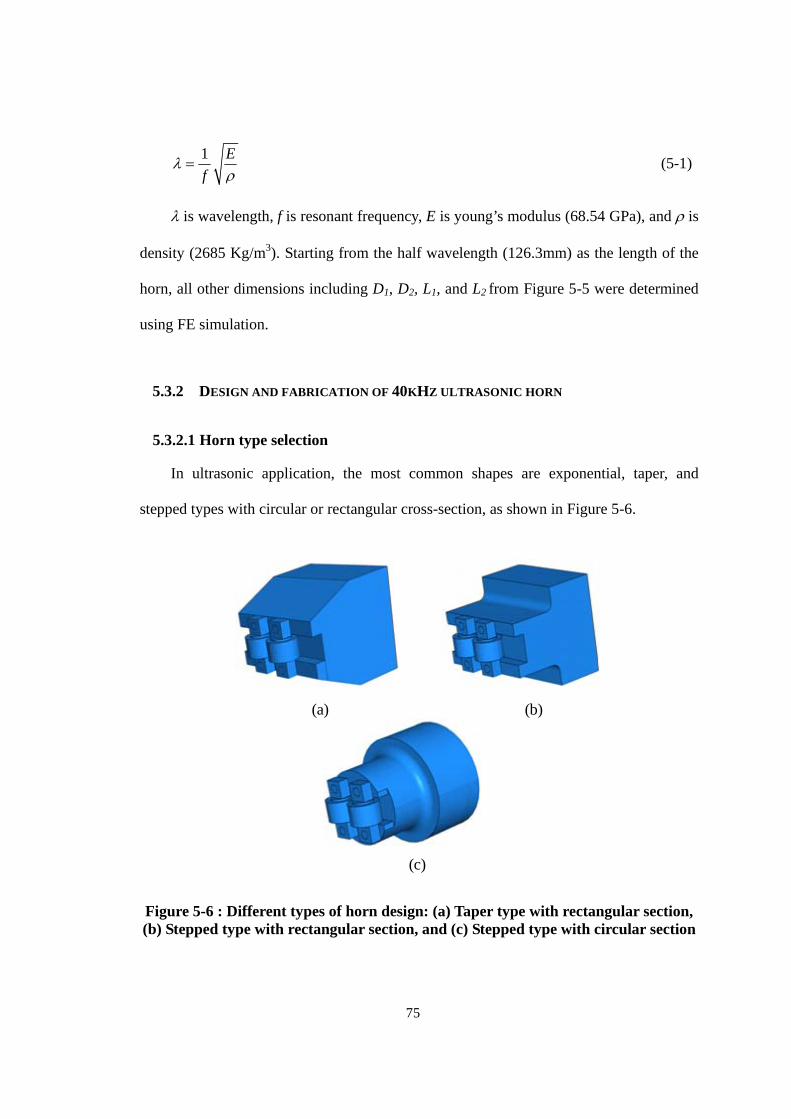
75
1 E
f
(5-1)
is wavelength, f is resonant frequency, E is young’s modulus (68.54 GPa), and is
density (2685 Kg/m3). Starting from the half wavelength (126.3mm) as the length of the
horn, all other dimensions including D1, D2, L1, and L2 from Figure 5-5 were determined
using FE simulation.
5.3.2 DESIGN AND FABRICATION OF 40KHZ ULTRASONIC HORN
5.3.2.1 Horn type selection
In ultrasonic application, the most common shapes are exponential, taper, and
stepped types with circular or rectangular cross-section, as shown in Figure 5-6.
(a) (b)
(c)
Figure 5-6 : Different types of horn design: (a) Taper type with rectangular section, (b) Stepped type with rectangular section, and (c) Stepped type with circular section
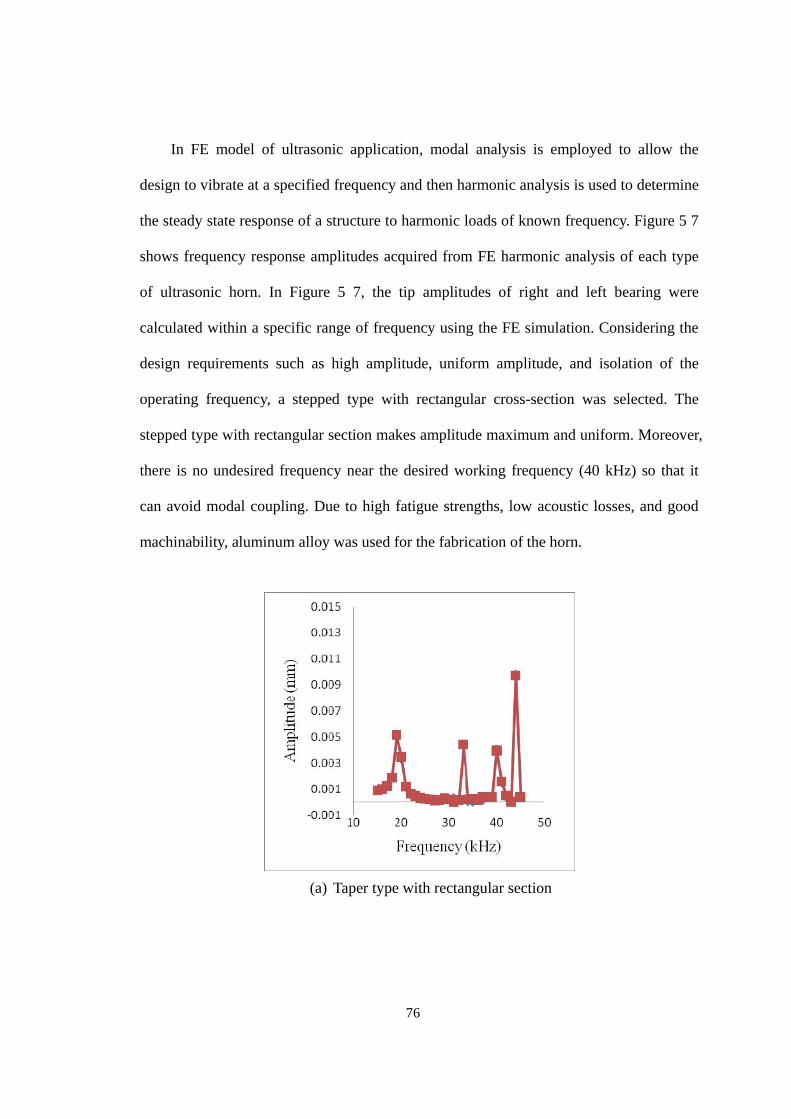
76
In FE model of ultrasonic application, modal analysis is employed to allow the
design to vibrate at a specified frequency and then harmonic analysis is used to determine
the steady state response of a structure to harmonic loads of known frequency. Figure 5 7
shows frequency response amplitudes acquired from FE harmonic analysis of each type
of ultrasonic horn. In Figure 5 7, the tip amplitudes of right and left bearing were
calculated within a specific range of frequency using the FE simulation. Considering the
design requirements such as high amplitude, uniform amplitude, and isolation of the
operating frequency, a stepped type with rectangular cross-section was selected. The
stepped type with rectangular section makes amplitude maximum and uniform. Moreover,
there is no undesired frequency near the desired working frequency (40 kHz) so that it
can avoid modal coupling. Due to high fatigue strengths, low acoustic losses, and good
machinability, aluminum alloy was used for the fabrication of the horn.
(a) Taper type with rectangular section
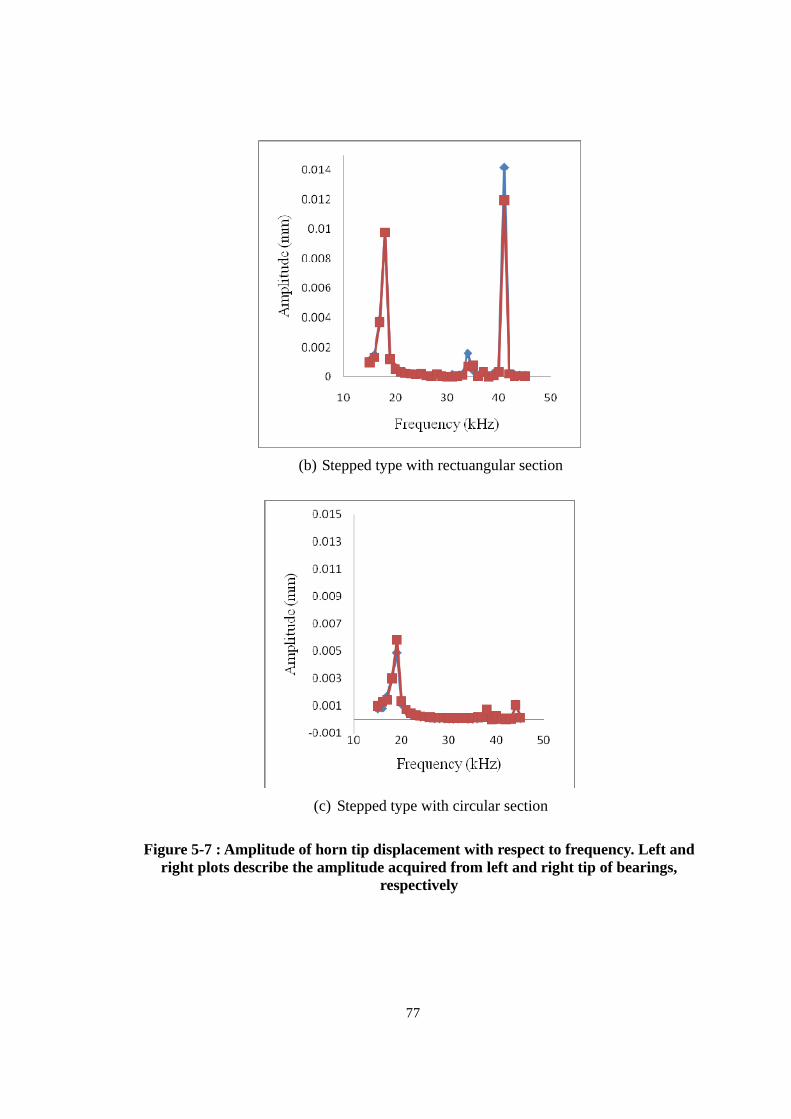
77
(b) Stepped type with rectuangular section
(c) Stepped type with circular section
Figure 5-7 : Amplitude of horn tip displacement with respect to frequency. Left and right plots describe the amplitude acquired from left and right tip of bearings,
respectively
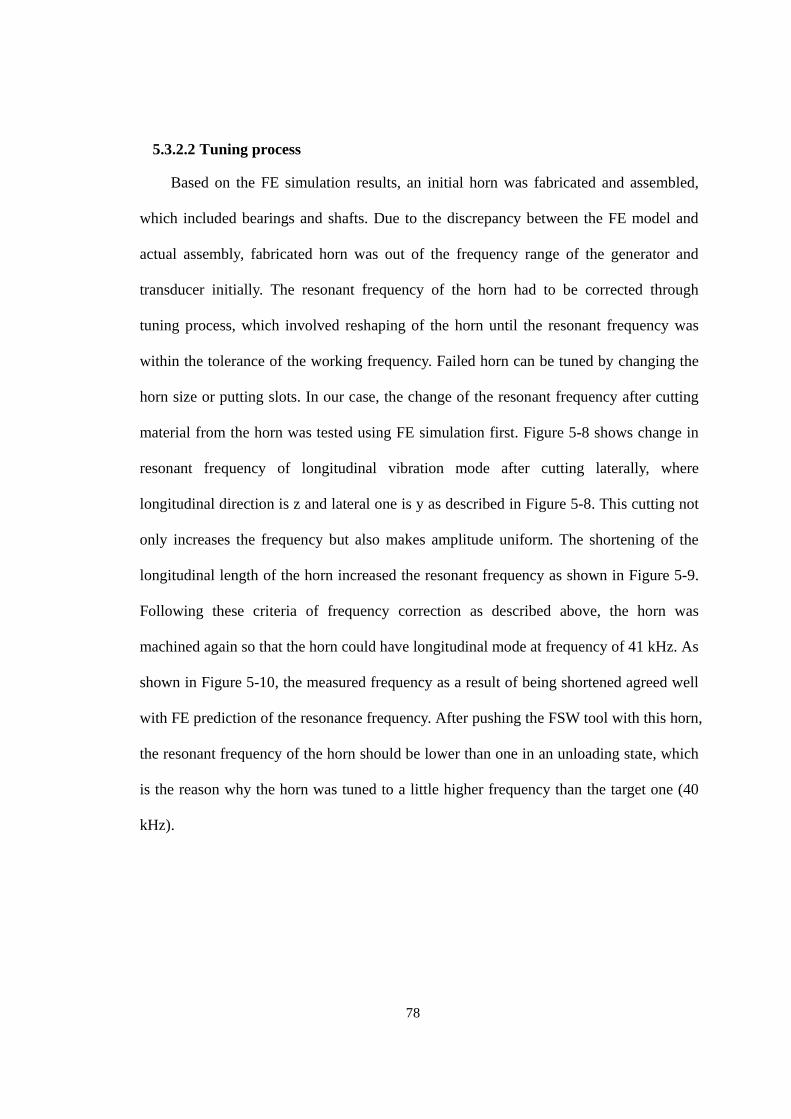
78
5.3.2.2 Tuning process
Based on the FE simulation results, an initial horn was fabricated and assembled,
which included bearings and shafts. Due to the discrepancy between the FE model and
actual assembly, fabricated horn was out of the frequency range of the generator and
transducer initially. The resonant frequency of the horn had to be corrected through
tuning process, which involved reshaping of the horn until the resonant frequency was
within the tolerance of the working frequency. Failed horn can be tuned by changing the
horn size or putting slots. In our case, the change of the resonant frequency after cutting
material from the horn was tested using FE simulation first. Figure 5-8 shows change in
resonant frequency of longitudinal vibration mode after cutting laterally, where
longitudinal direction is z and lateral one is y as described in Figure 5-8. This cutting not
only increases the frequency but also makes amplitude uniform. The shortening of the
longitudinal length of the horn increased the resonant frequency as shown in Figure 5-9.
Following these criteria of frequency correction as described above, the horn was
machined again so that the horn could have longitudinal mode at frequency of 41 kHz. As
shown in Figure 5-10, the measured frequency as a result of being shortened agreed well
with FE prediction of the resonance frequency. After pushing the FSW tool with this horn,
the resonant frequency of the horn should be lower than one in an unloading state, which
is the reason why the horn was tuned to a little higher frequency than the target one (40
kHz).
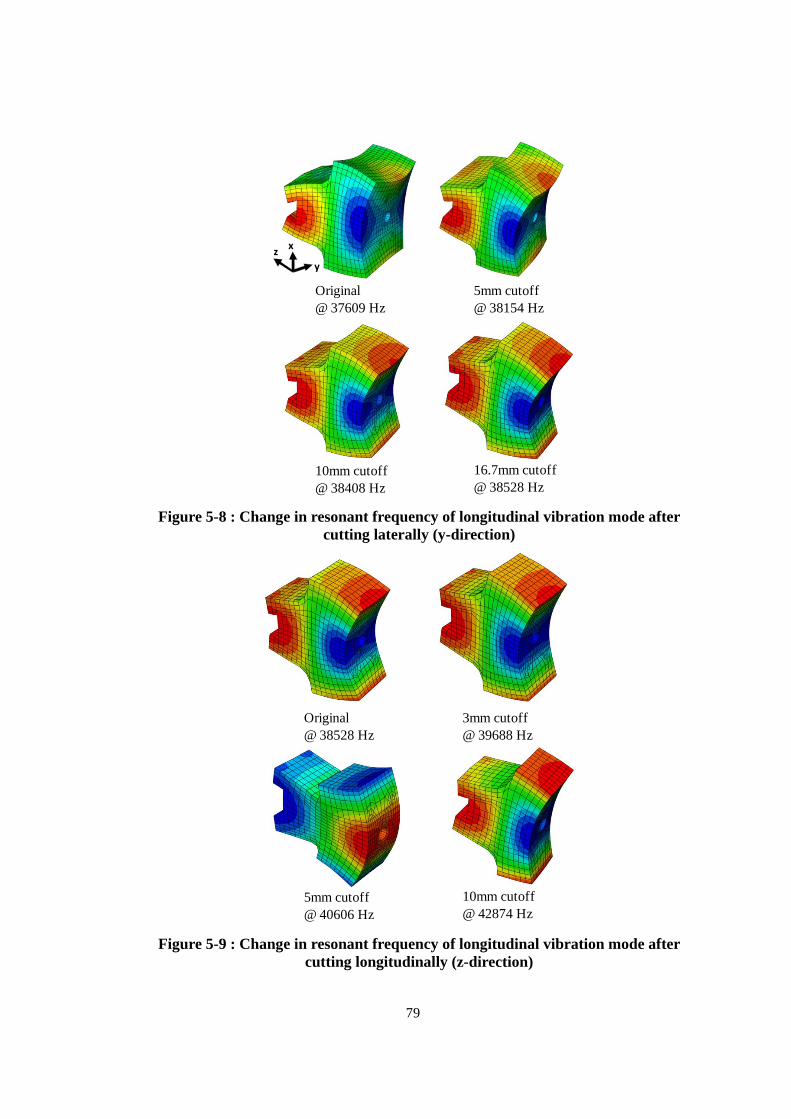
79
xz
y
Original @ 37609 Hz
10mm cutoff@ 38408 Hz
5mm cutoff@ 38154 Hz
16.7mm cutoff@ 38528 Hz
Figure 5-8 : Change in resonant frequency of longitudinal vibration mode after cutting laterally (y-direction)
Original @ 38528 Hz
5mm cutoff@ 40606 Hz
3mm cutoff@ 39688 Hz
10mm cutoff@ 42874 Hz
Figure 5-9 : Change in resonant frequency of longitudinal vibration mode after cutting longitudinally (z-direction)
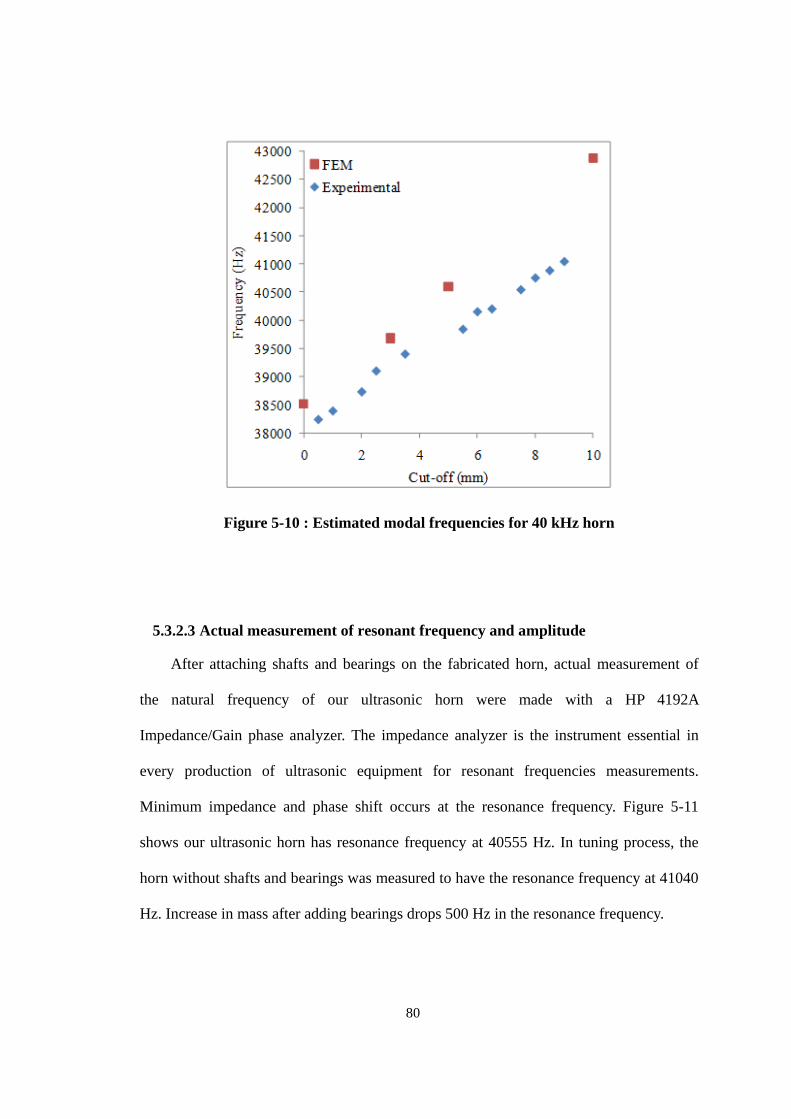
80
Figure 5-10 : Estimated modal frequencies for 40 kHz horn
5.3.2.3 Actual measurement of resonant frequency and amplitude
After attaching shafts and bearings on the fabricated horn, actual measurement of
the natural frequency of our ultrasonic horn were made with a HP 4192A
Impedance/Gain phase analyzer. The impedance analyzer is the instrument essential in
every production of ultrasonic equipment for resonant frequencies measurements.
Minimum impedance and phase shift occurs at the resonance frequency. Figure 5-11
shows our ultrasonic horn has resonance frequency at 40555 Hz. In tuning process, the
horn without shafts and bearings was measured to have the resonance frequency at 41040
Hz. Increase in mass after adding bearings drops 500 Hz in the resonance frequency.
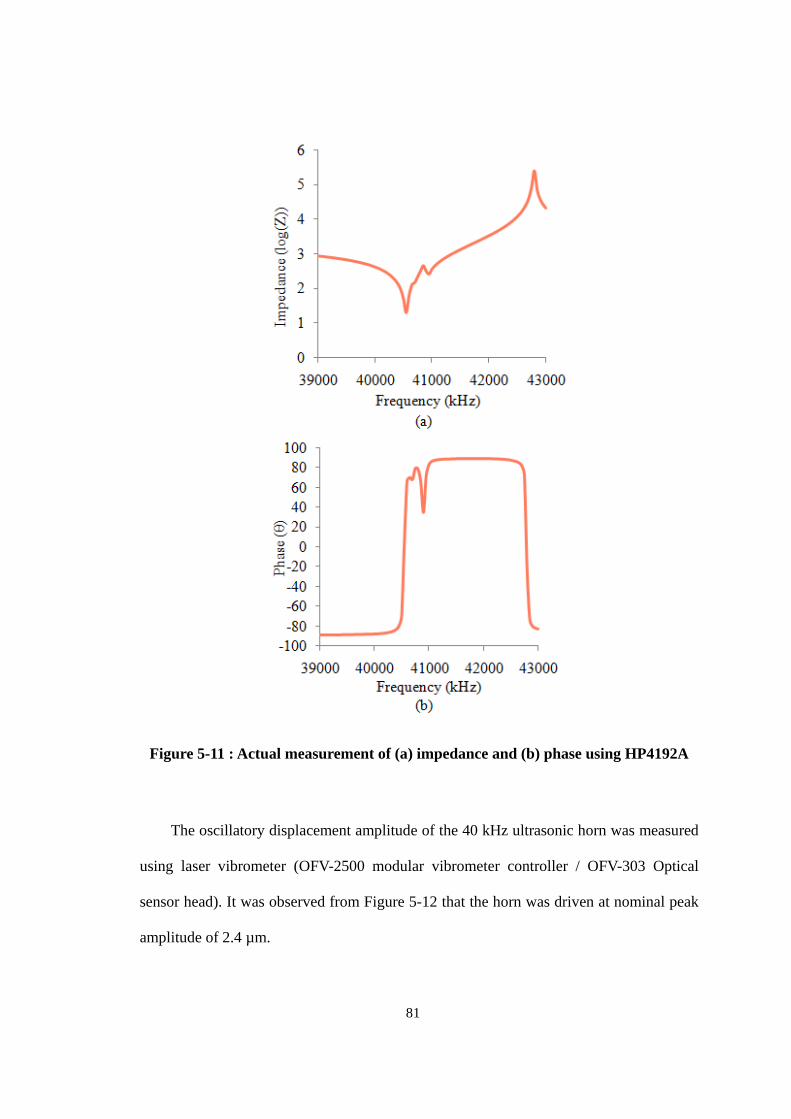
81
Figure 5-11 : Actual measurement of (a) impedance and (b) phase using HP4192A
The oscillatory displacement amplitude of the 40 kHz ultrasonic horn was measured
using laser vibrometer (OFV-2500 modular vibrometer controller / OFV-303 Optical
sensor head). It was observed from Figure 5-12 that the horn was driven at nominal peak
amplitude of 2.4 µm.
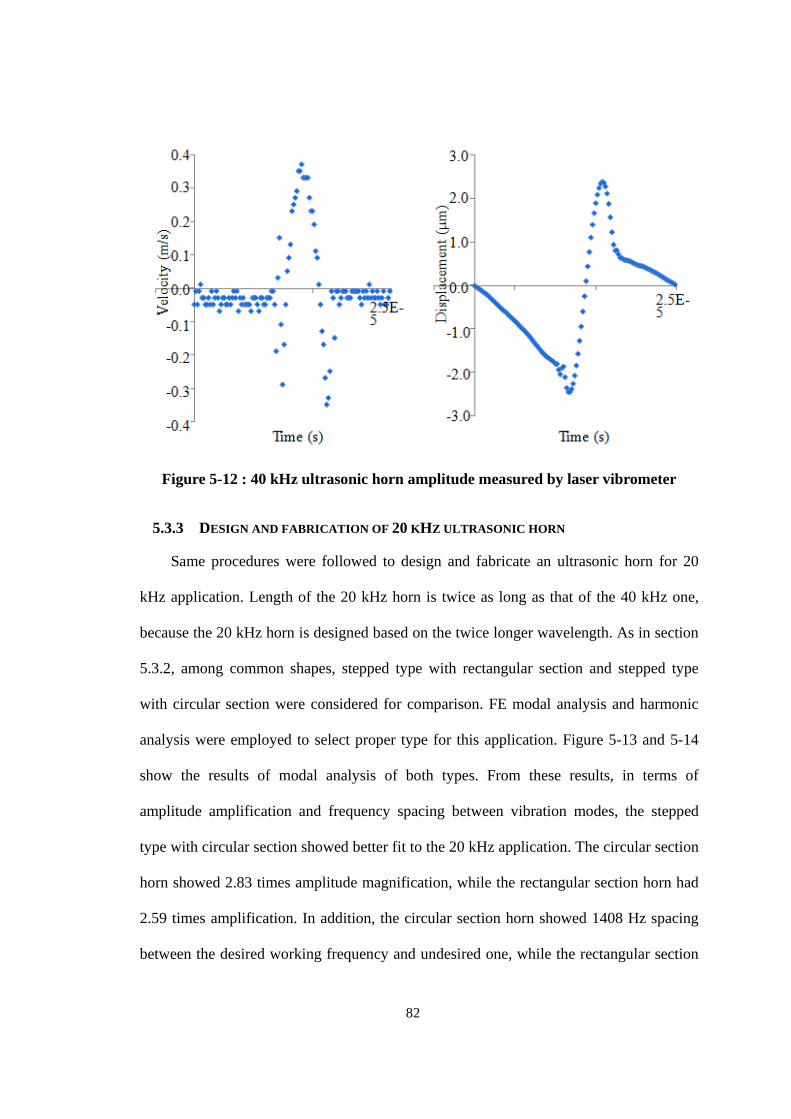
82
Figure 5-12 : 40 kHz ultrasonic horn amplitude measured by laser vibrometer
5.3.3 DESIGN AND FABRICATION OF 20 KHZ ULTRASONIC HORN
Same procedures were followed to design and fabricate an ultrasonic horn for 20
kHz application. Length of the 20 kHz horn is twice as long as that of the 40 kHz one,
because the 20 kHz horn is designed based on the twice longer wavelength. As in section
5.3.2, among common shapes, stepped type with rectangular section and stepped type
with circular section were considered for comparison. FE modal analysis and harmonic
analysis were employed to select proper type for this application. Figure 5-13 and 5-14
show the results of modal analysis of both types. From these results, in terms of
amplitude amplification and frequency spacing between vibration modes, the stepped
type with circular section showed better fit to the 20 kHz application. The circular section
horn showed 2.83 times amplitude magnification, while the rectangular section horn had
2.59 times amplification. In addition, the circular section horn showed 1408 Hz spacing
between the desired working frequency and undesired one, while the rectangular section
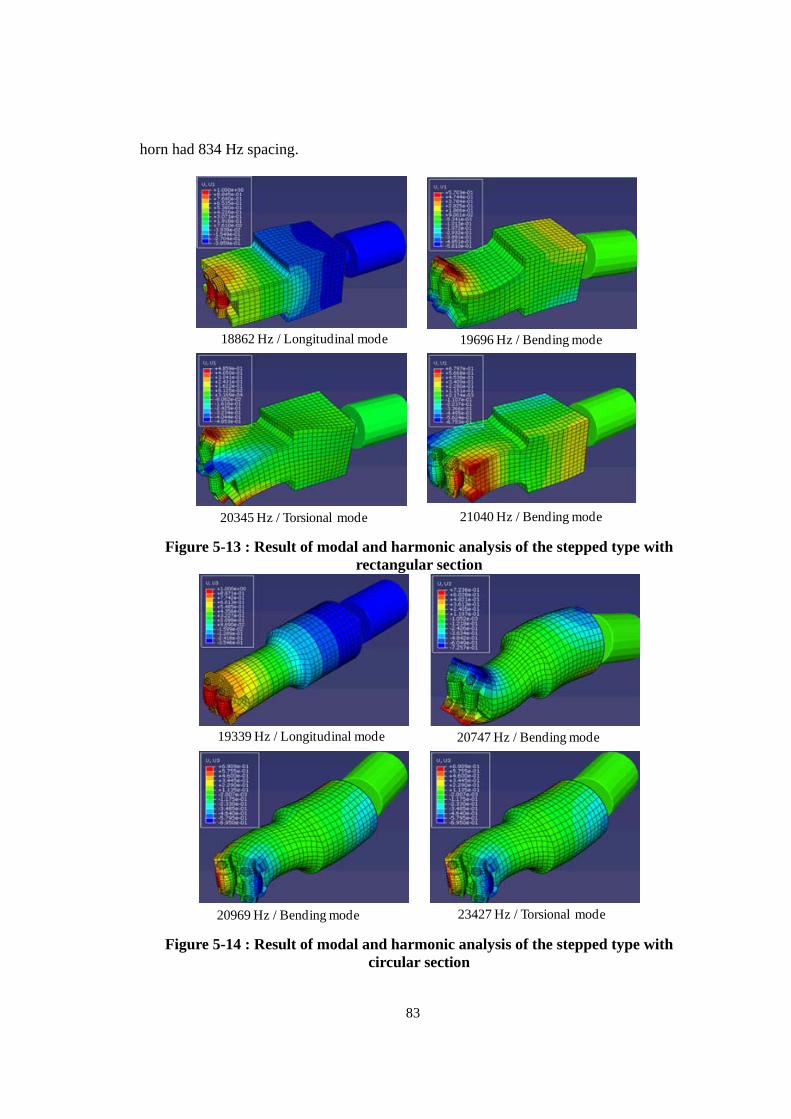
83
horn had 834 Hz spacing.
18862 Hz / Longitudinal mode 19696 Hz / Bending mode
20345 Hz / Torsional mode 21040 Hz / Bending mode
Figure 5-13 : Result of modal and harmonic analysis of the stepped type with rectangular section
19339 Hz / Longitudinal mode 20747 Hz / Bending mode
20969 Hz / Bending mode 23427 Hz / Torsional mode
Figure 5-14 : Result of modal and harmonic analysis of the stepped type with circular section
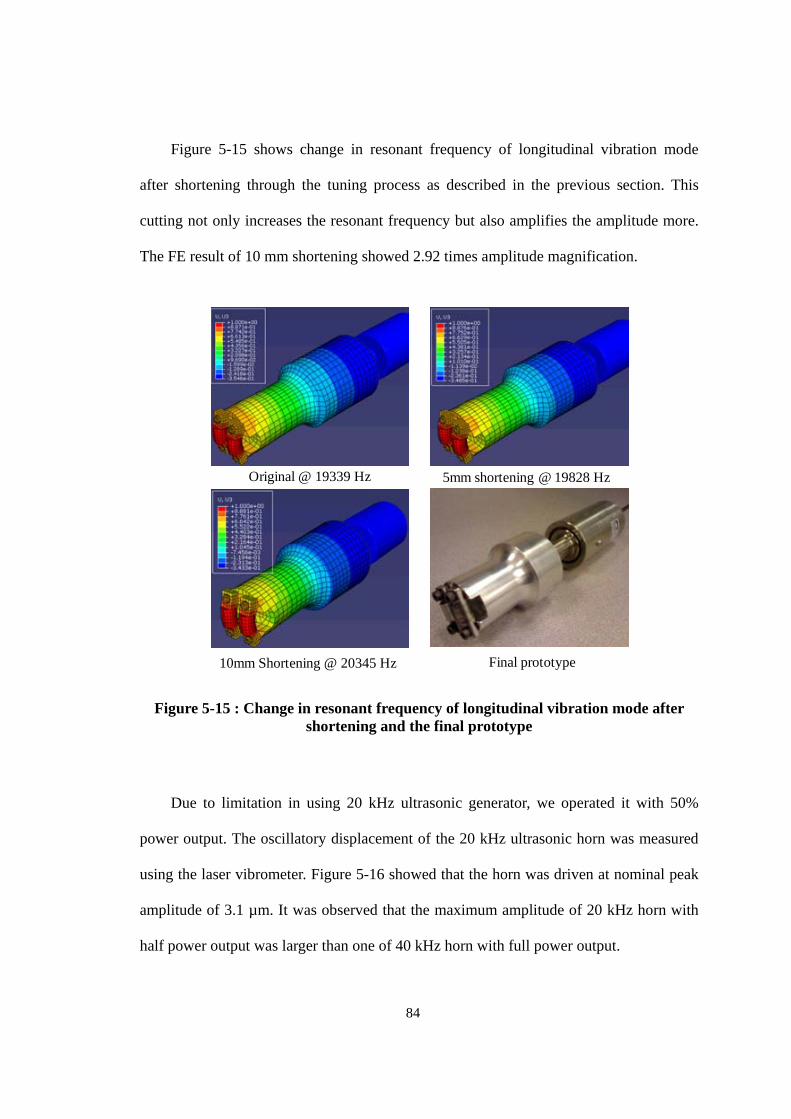
84
Figure 5-15 shows change in resonant frequency of longitudinal vibration mode
after shortening through the tuning process as described in the previous section. This
cutting not only increases the resonant frequency but also amplifies the amplitude more.
The FE result of 10 mm shortening showed 2.92 times amplitude magnification.
Original @ 19339 Hz 5mm shortening @ 19828 Hz
10mm Shortening @ 20345 Hz Final prototype
Figure 5-15 : Change in resonant frequency of longitudinal vibration mode after shortening and the final prototype
Due to limitation in using 20 kHz ultrasonic generator, we operated it with 50%
power output. The oscillatory displacement of the 20 kHz ultrasonic horn was measured
using the laser vibrometer. Figure 5-16 showed that the horn was driven at nominal peak
amplitude of 3.1 µm. It was observed that the maximum amplitude of 20 kHz horn with
half power output was larger than one of 40 kHz horn with full power output.
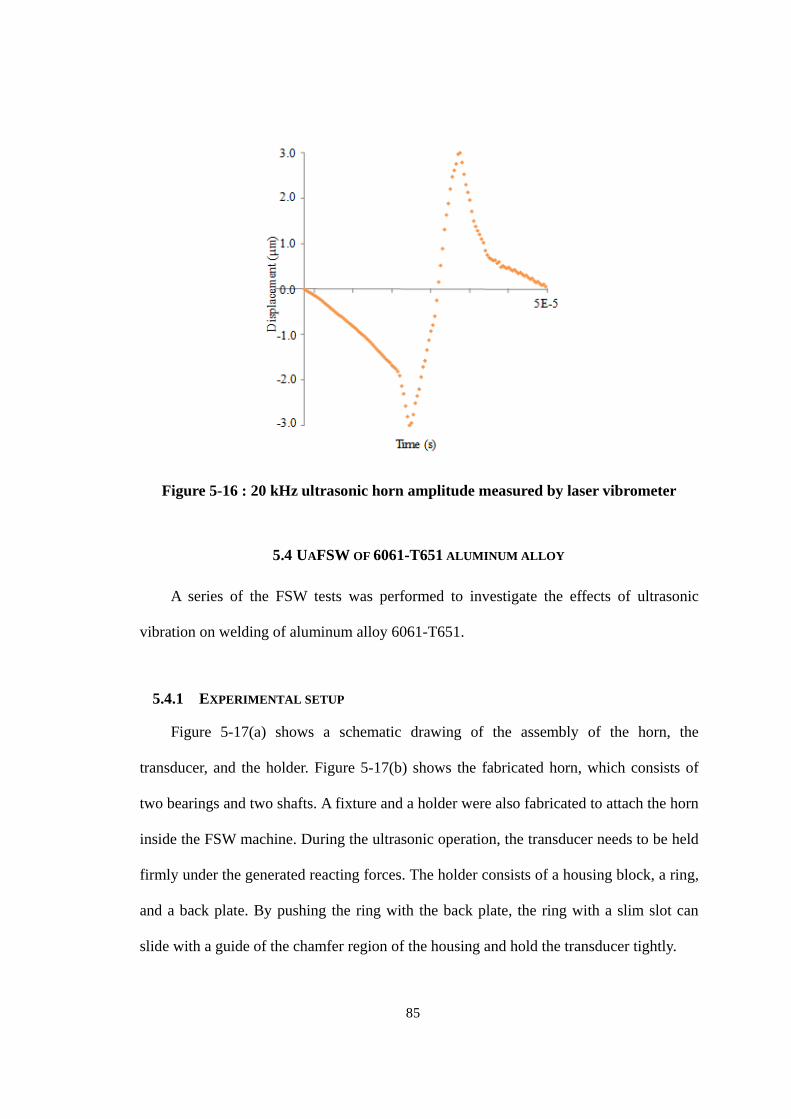
85
Figure 5-16 : 20 kHz ultrasonic horn amplitude measured by laser vibrometer
5.4 UAFSW OF 6061-T651 ALUMINUM ALLOY
A series of the FSW tests was performed to investigate the effects of ultrasonic
vibration on welding of aluminum alloy 6061-T651.
5.4.1 EXPERIMENTAL SETUP
Figure 5-17(a) shows a schematic drawing of the assembly of the horn, the
transducer, and the holder. Figure 5-17(b) shows the fabricated horn, which consists of
two bearings and two shafts. A fixture and a holder were also fabricated to attach the horn
inside the FSW machine. During the ultrasonic operation, the transducer needs to be held
firmly under the generated reacting forces. The holder consists of a housing block, a ring,
and a back plate. By pushing the ring with the back plate, the ring with a slim slot can
slide with a guide of the chamfer region of the housing and hold the transducer tightly.
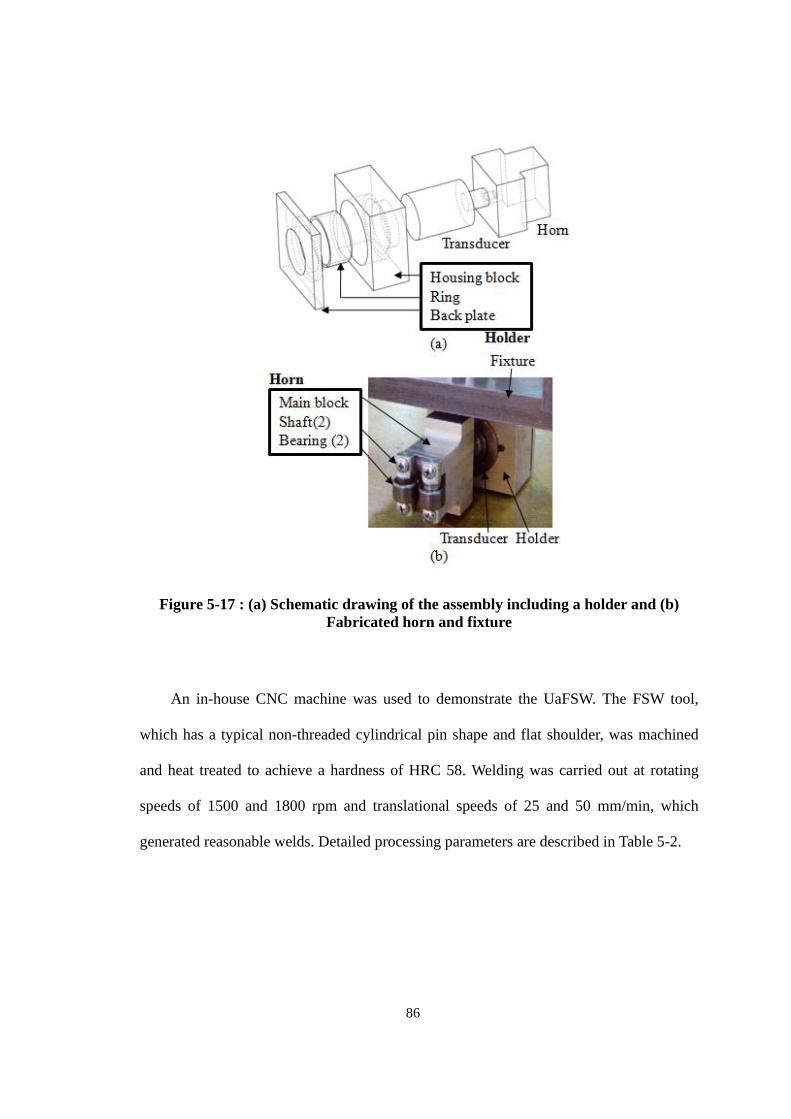
86
Figure 5-17 : (a) Schematic drawing of the assembly including a holder and (b) Fabricated horn and fixture
An in-house CNC machine was used to demonstrate the UaFSW. The FSW tool,
which has a typical non-threaded cylindrical pin shape and flat shoulder, was machined
and heat treated to achieve a hardness of HRC 58. Welding was carried out at rotating
speeds of 1500 and 1800 rpm and translational speeds of 25 and 50 mm/min, which
generated reasonable welds. Detailed processing parameters are described in Table 5-2.
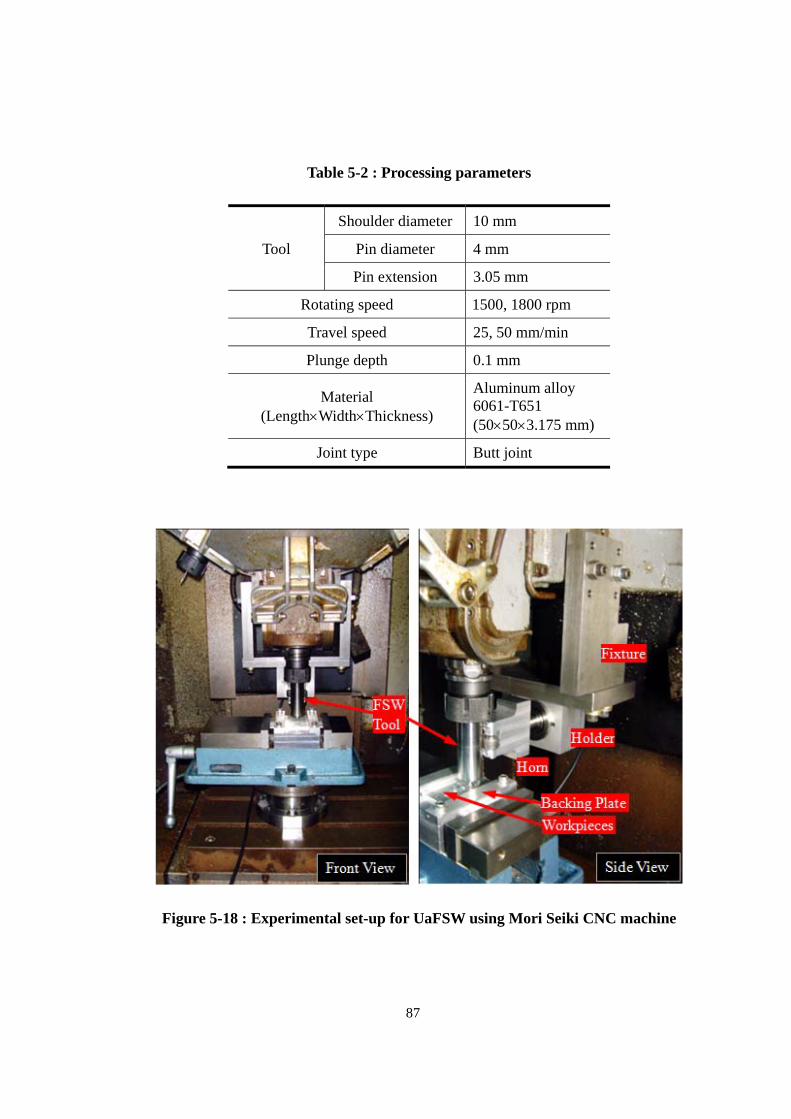
87
Table 5-2 : Processing parameters
Tool
Shoulder diameter 10 mm
Pin diameter 4 mm
Pin extension 3.05 mm
Rotating speed 1500, 1800 rpm
Travel speed 25, 50 mm/min
Plunge depth 0.1 mm
Material (LengthWidthThickness)
Aluminum alloy 6061-T651 (50503.175 mm)
Joint type Butt joint
Figure 5-18 : Experimental set-up for UaFSW using Mori Seiki CNC machine
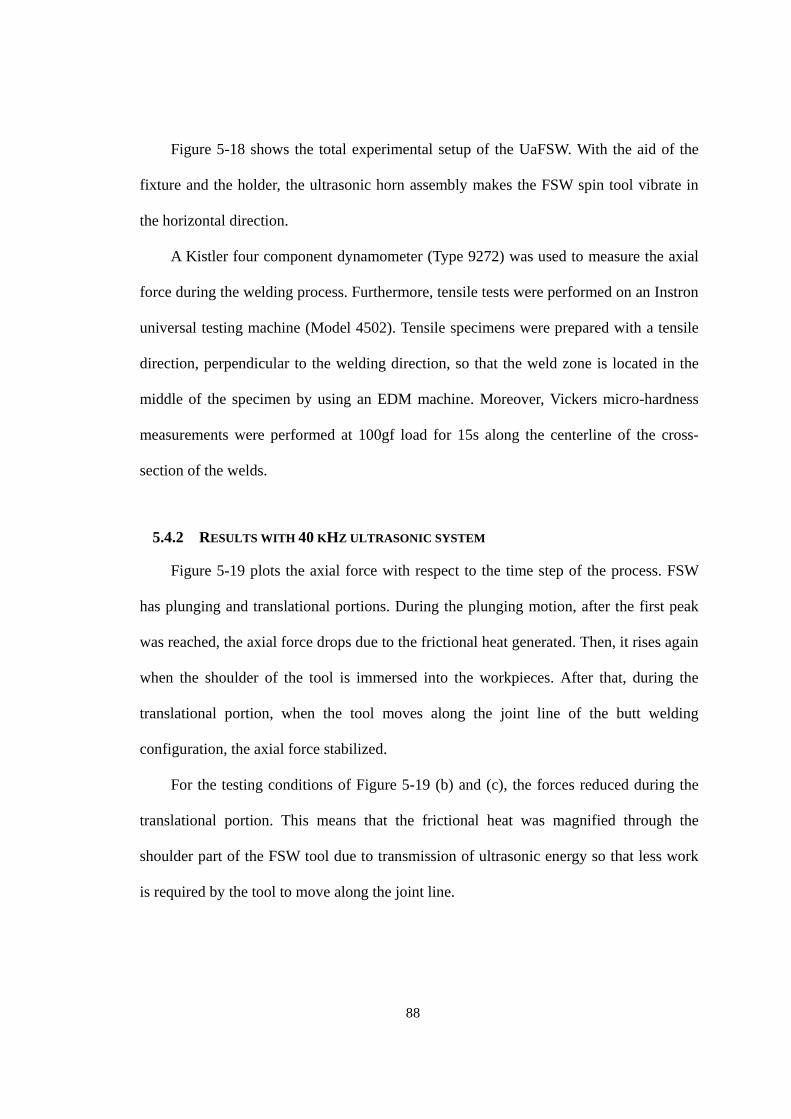
88
Figure 5-18 shows the total experimental setup of the UaFSW. With the aid of the
fixture and the holder, the ultrasonic horn assembly makes the FSW spin tool vibrate in
the horizontal direction.
A Kistler four component dynamometer (Type 9272) was used to measure the axial
force during the welding process. Furthermore, tensile tests were performed on an Instron
universal testing machine (Model 4502). Tensile specimens were prepared with a tensile
direction, perpendicular to the welding direction, so that the weld zone is located in the
middle of the specimen by using an EDM machine. Moreover, Vickers micro-hardness
measurements were performed at 100gf load for 15s along the centerline of the cross-
section of the welds.
5.4.2 RESULTS WITH 40 KHZ ULTRASONIC SYSTEM
Figure 5-19 plots the axial force with respect to the time step of the process. FSW
has plunging and translational portions. During the plunging motion, after the first peak
was reached, the axial force drops due to the frictional heat generated. Then, it rises again
when the shoulder of the tool is immersed into the workpieces. After that, during the
translational portion, when the tool moves along the joint line of the butt welding
configuration, the axial force stabilized.
For the testing conditions of Figure 5-19 (b) and (c), the forces reduced during the
translational portion. This means that the frictional heat was magnified through the
shoulder part of the FSW tool due to transmission of ultrasonic energy so that less work
is required by the tool to move along the joint line.

89
(a) Rotational speed (1500 rpm), Translational speed (25 mm/min)
(b) Rotational speed (1500 rpm), Translational speed (50 mm/min)
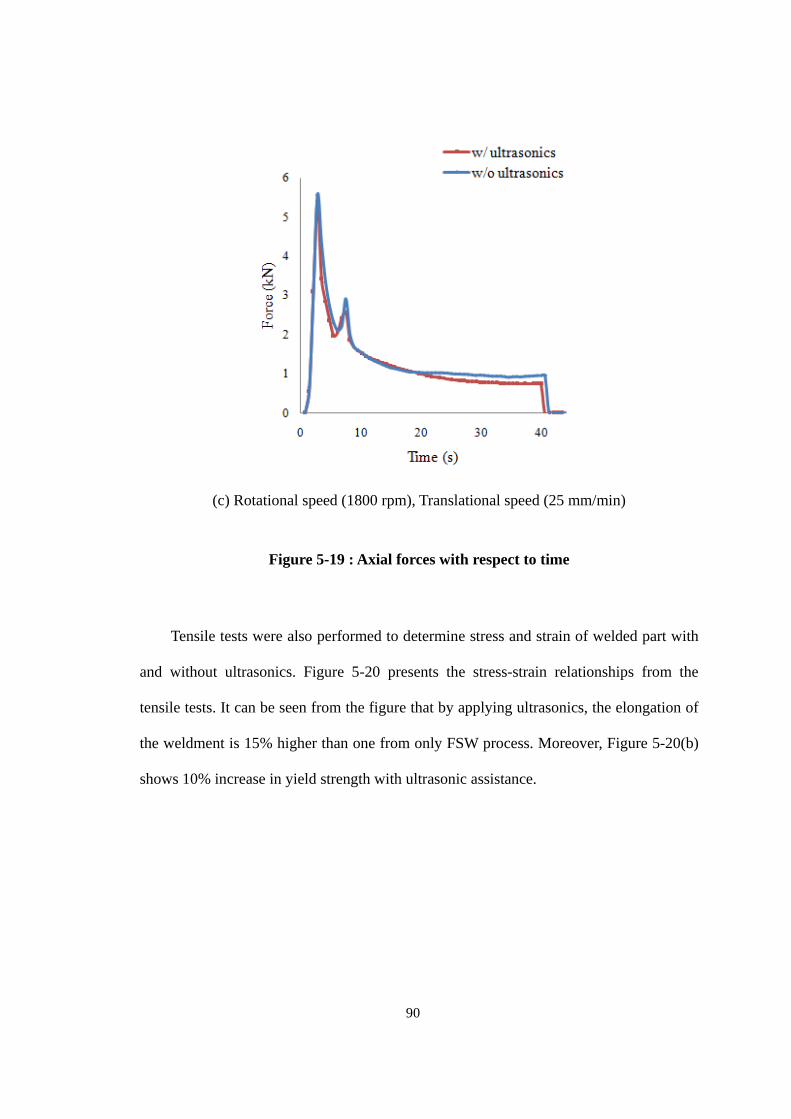
90
(c) Rotational speed (1800 rpm), Translational speed (25 mm/min)
Figure 5-19 : Axial forces with respect to time
Tensile tests were also performed to determine stress and strain of welded part with
and without ultrasonics. Figure 5-20 presents the stress-strain relationships from the
tensile tests. It can be seen from the figure that by applying ultrasonics, the elongation of
the weldment is 15% higher than one from only FSW process. Moreover, Figure 5-20(b)
shows 10% increase in yield strength with ultrasonic assistance.
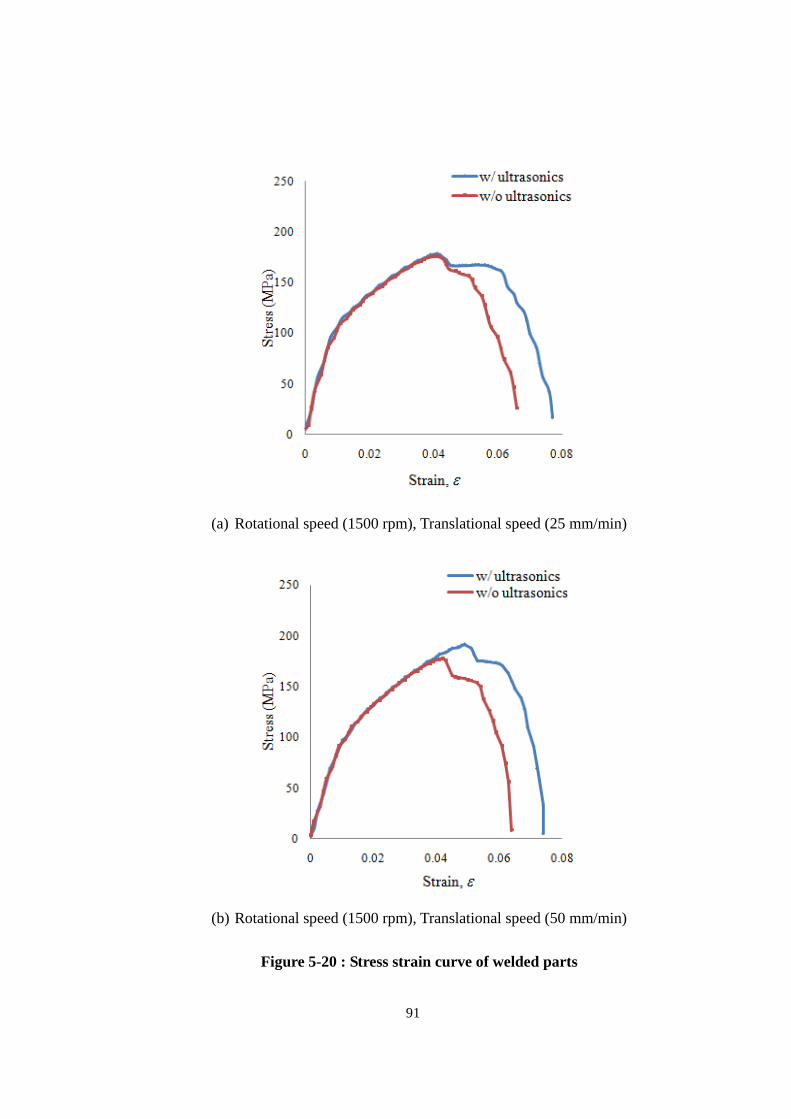
91
(a) Rotational speed (1500 rpm), Translational speed (25 mm/min)
(b) Rotational speed (1500 rpm), Translational speed (50 mm/min)
Figure 5-20 : Stress strain curve of welded parts
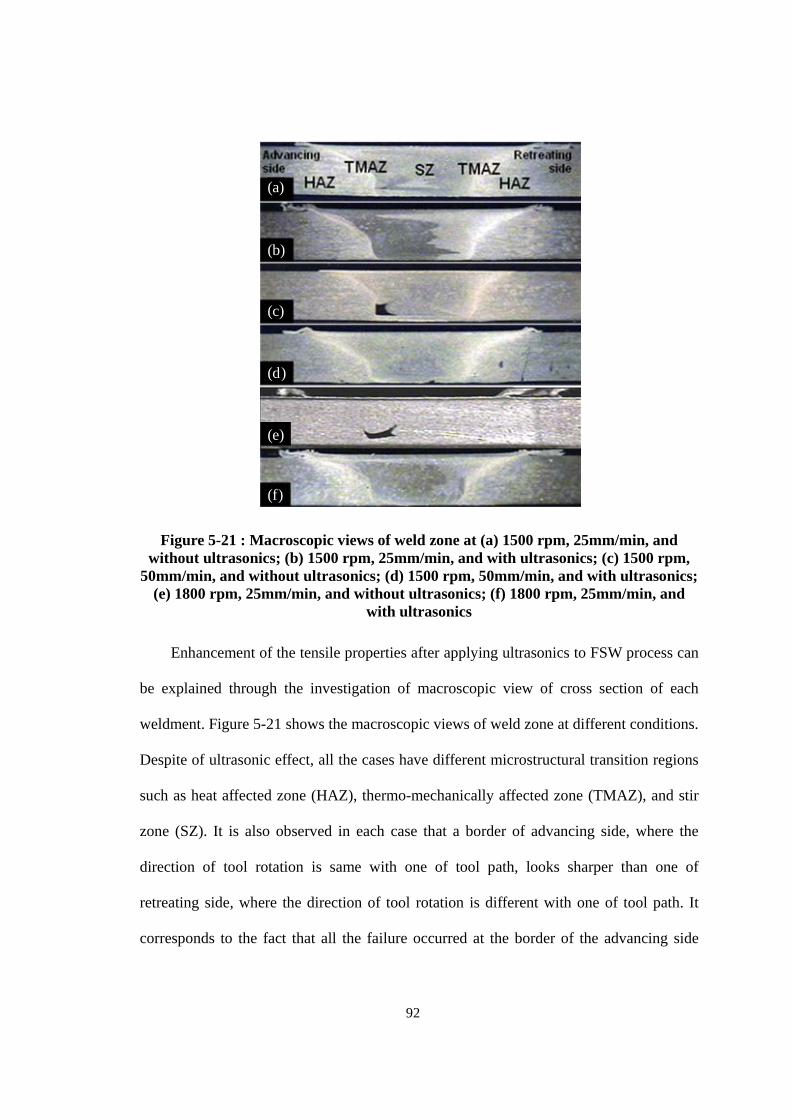
92
(a)
(b)
(c)
(d)
(e)
(f)
Figure 5-21 : Macroscopic views of weld zone at (a) 1500 rpm, 25mm/min, and without ultrasonics; (b) 1500 rpm, 25mm/min, and with ultrasonics; (c) 1500 rpm,
50mm/min, and without ultrasonics; (d) 1500 rpm, 50mm/min, and with ultrasonics; (e) 1800 rpm, 25mm/min, and without ultrasonics; (f) 1800 rpm, 25mm/min, and
with ultrasonics
Enhancement of the tensile properties after applying ultrasonics to FSW process can
be explained through the investigation of macroscopic view of cross section of each
weldment. Figure 5-21 shows the macroscopic views of weld zone at different conditions.
Despite of ultrasonic effect, all the cases have different microstructural transition regions
such as heat affected zone (HAZ), thermo-mechanically affected zone (TMAZ), and stir
zone (SZ). It is also observed in each case that a border of advancing side, where the
direction of tool rotation is same with one of tool path, looks sharper than one of
retreating side, where the direction of tool rotation is different with one of tool path. It
corresponds to the fact that all the failure occurred at the border of the advancing side
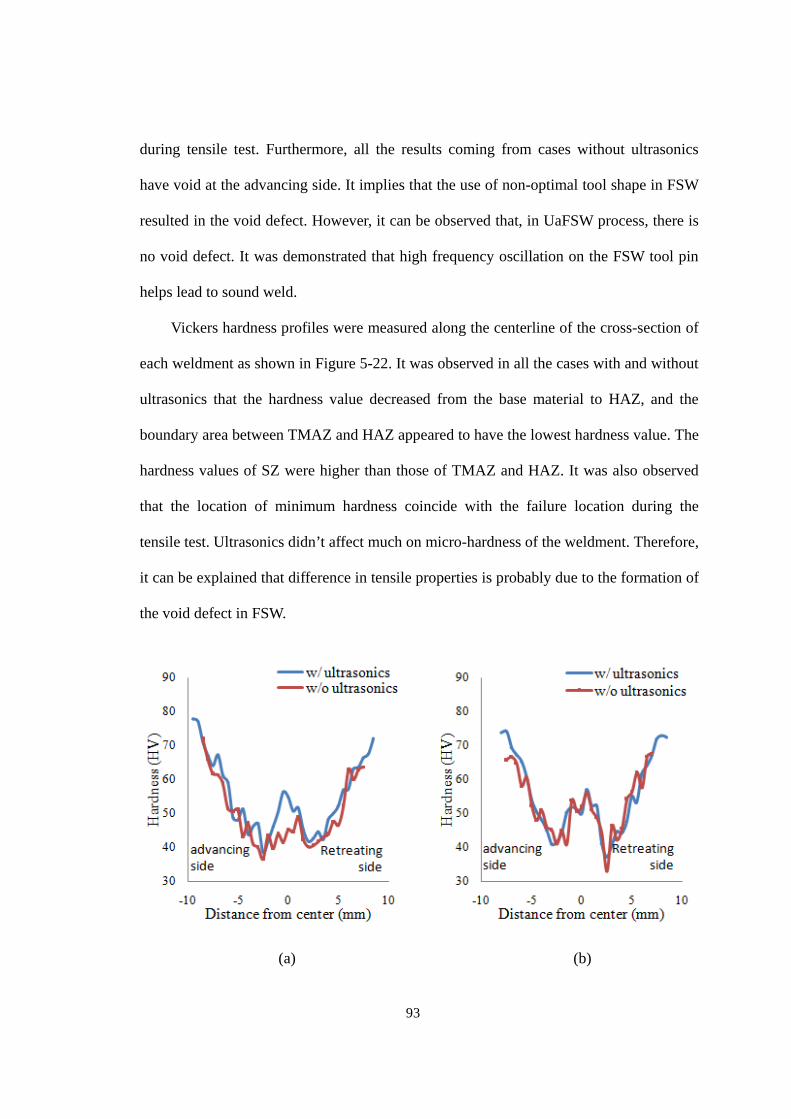
93
during tensile test. Furthermore, all the results coming from cases without ultrasonics
have void at the advancing side. It implies that the use of non-optimal tool shape in FSW
resulted in the void defect. However, it can be observed that, in UaFSW process, there is
no void defect. It was demonstrated that high frequency oscillation on the FSW tool pin
helps lead to sound weld.
Vickers hardness profiles were measured along the centerline of the cross-section of
each weldment as shown in Figure 5-22. It was observed in all the cases with and without
ultrasonics that the hardness value decreased from the base material to HAZ, and the
boundary area between TMAZ and HAZ appeared to have the lowest hardness value. The
hardness values of SZ were higher than those of TMAZ and HAZ. It was also observed
that the location of minimum hardness coincide with the failure location during the
tensile test. Ultrasonics didn’t affect much on micro-hardness of the weldment. Therefore,
it can be explained that difference in tensile properties is probably due to the formation of
the void defect in FSW.
(a) (b)
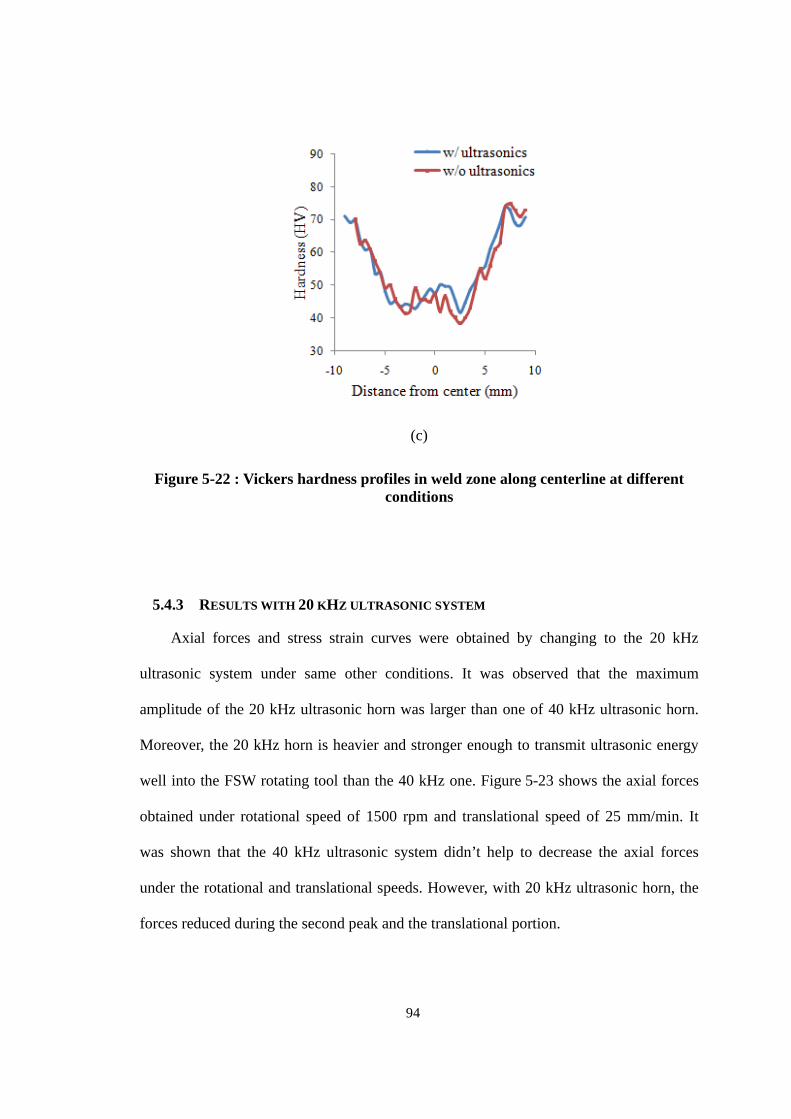
94
(c)
Figure 5-22 : Vickers hardness profiles in weld zone along centerline at different conditions
5.4.3 RESULTS WITH 20 KHZ ULTRASONIC SYSTEM
Axial forces and stress strain curves were obtained by changing to the 20 kHz
ultrasonic system under same other conditions. It was observed that the maximum
amplitude of the 20 kHz ultrasonic horn was larger than one of 40 kHz ultrasonic horn.
Moreover, the 20 kHz horn is heavier and stronger enough to transmit ultrasonic energy
well into the FSW rotating tool than the 40 kHz one. Figure 5-23 shows the axial forces
obtained under rotational speed of 1500 rpm and translational speed of 25 mm/min. It
was shown that the 40 kHz ultrasonic system didn’t help to decrease the axial forces
under the rotational and translational speeds. However, with 20 kHz ultrasonic horn, the
forces reduced during the second peak and the translational portion.
95
Figure 5-23 : Axial forces with respect to time (Rotational speed of 1500rpm; translational speed of 25 mm/min)
Figure 5-24 : Stress strain curve of welded parts (Rotational speed of 1500rpm; translational speed of 25 mm/min)
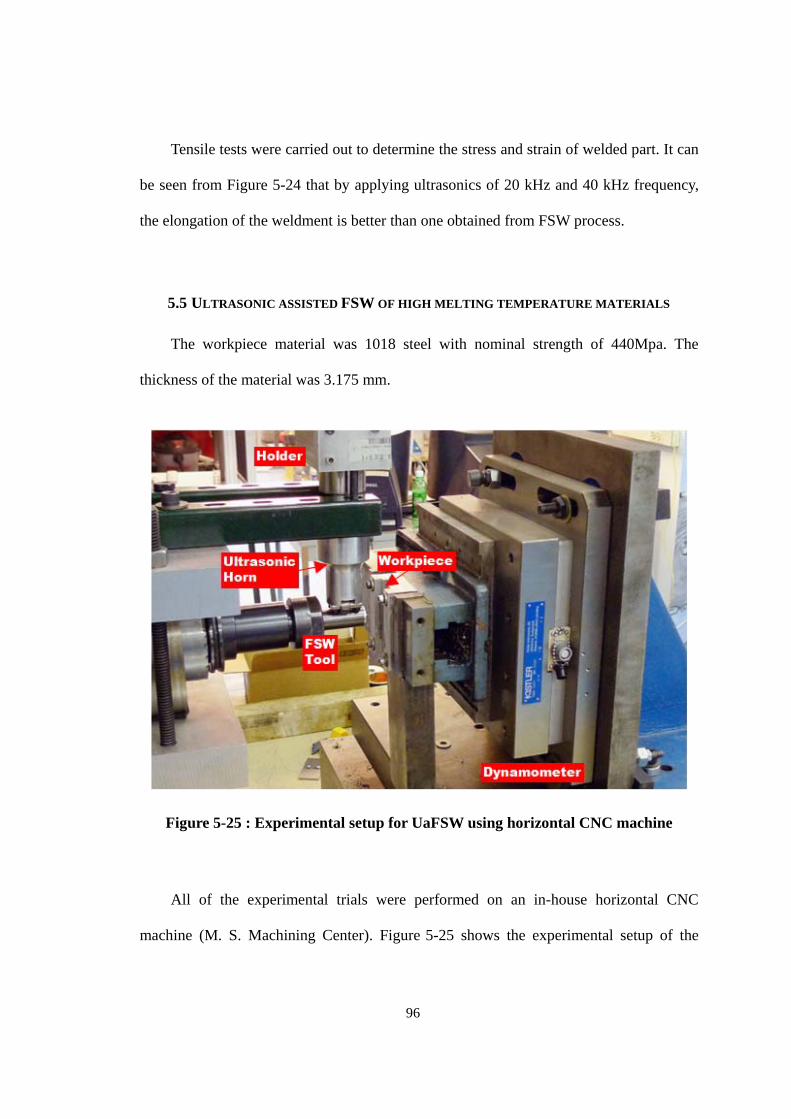
96
Tensile tests were carried out to determine the stress and strain of welded part. It can
be seen from Figure 5-24 that by applying ultrasonics of 20 kHz and 40 kHz frequency,
the elongation of the weldment is better than one obtained from FSW process.
5.5 ULTRASONIC ASSISTED FSW OF HIGH MELTING TEMPERATURE MATERIALS
The workpiece material was 1018 steel with nominal strength of 440Mpa. The
thickness of the material was 3.175 mm.
Figure 5-25 : Experimental setup for UaFSW using horizontal CNC machine
All of the experimental trials were performed on an in-house horizontal CNC
machine (M. S. Machining Center). Figure 5-25 shows the experimental setup of the
97
UaFSW. With the aid of the fixture and the holder, the ultrasonic horn assembly makes
the FSW spin tool vibrate in the joint direction.
(a) (b)
Figure 5-26 : The view of tool used: (a) made of A2 tool steel (b) made of tungsten carbide (10% cobalt)
The shoulder diameter of the tool was 10 mm, and the taper typed pin was changed
conically 2.4 and 3.0 mm in diameter. The length of the pin was machined to be 3 mm. At
the initial experimental trials, the tool made of heat treated A2 tool steel with HV 653
hardness was used. However, the pin melted down after a few trials due to high friction
between the tool and steel workpiece as shown in Figure 5-26 (a). Then the FSW tool was
made of tungsten carbide with HV 1650 hardness. The tungsten carbide tool can
withstand high temperatures of 1200 ºC. Figure 5-26 shows the tool steel FSW tool and
98
the tungsten carbide FSW tool. Welding was carried out at rotating speeds of 650 rpm and
translational speeds of 25 and 50 mm/min, which generated reasonable welds. And a
Kistler four component dynamometer (Type 9255) was used to measure the axial force
during the welding process. The temperature was measured using a type E thermocouple
(Omega 5TC-TT-E-36-72) on the top surface of the workpiece. The thermocouples were
placed on both sides of 7 mm away from the joint line of two workpieces as a butt
welding configuration and fixed on the surface using epoxy adhesive (Omega OB-101
resin and catalyst). Figure 5-27 is a top view of weldment after welding using FSW and
UaFSW process. Upper joint was produced with UaFSW process, which used a 20 kHz
ultrasonic system, the translational speed of 50 mm/min, and the rotational speed of 650
rpm. Two thermocouples were placed on both sides of the joint line. Lower one was
produced with conventional FSW process under same parameters.
Figure 5-27 : Top view of friction stir welded 1018 steel; Upper joint is with ultrasonic and lower one is without ultrasonic
99
Figure 5-28 : Effect of ultrasonic vibration on axial forces (Rotational speed of 650 rpm; translational speed of 50 mm/min)
Figure 5-29 : Effect of ultrasonic vibration on temperature profiles (Rotational speed of 650 rpm; translational speed of 50 mm/min)
100
Figure 5-28 shows the effect of ultrasonic vibration on the axial forces. Measured
axial forces in UaFSW are lower than those in the conventional FSW. It can be seen that
the axial forces become smaller during both the peak portion and the translational one.
We could obtain 6% reduction in the welding peak and around 12.5% reduction in the
translational region. Figure 5-29 shows the effect of ultrasonic vibration on the
temperature profiles. It can be verified for the welding of 1018 steel that the ultrasonic
assistance led to the increase in temperature on the whole welding region.
Other welding trial was carried out with the translational speed of 25 mm/min as
shown in Figure 5-30. This is similar to the preceding analysis. 6% reduction in the
welding peak and around 20% reduction in the welding region were observed.
Figure 5-30 : Axial forces with respect to time (Rotational speed of 650 rpm; translational speed of 25 mm/min)
101
5.6 CONCLUSIONS
We proposed a development of ultrasonic assisted friction stir welding process. For
integrating the ultrasonic system in the conventional FSW process, the design of stepped
horn made of aluminum proved to be successful. The FE analysis was helpful to the
design and tuning process of the horn structure.
Taking advantage of the characteristics of ultrasonic vibration, the UaFSW of
aluminum alloys enables us to decrease the welding force and enhance mechanical
properties of welded part in terms of elongation and yield strength. It was shown that
ultrasonic integration on FSW tool helps to decrease the chance of formation of welding
defect. Moreover, potential benefits of UaFSW process for steel workpiece include the
reduction in axial forces and the increase in temperature profiles.
102
CHAPTER 6 - CONCLUSIONS AND FUTURE WORK
6.1 CONCLUSIONS
This research is focused on the development of the ultrasonic assisted friction stir
welding (UaFSW) process. The feasibility of the proposed hybrid FSW process has been
investigated through the experimental tests and numerical simulation.
For integrating the ultrasonic system in the conventional FSW process, the design of
stepped horn made of aluminum proved to be successful. The FE analysis was helpful to
the design and tuning process of the horn structure. We obtained a resonance frequency of
the ultrasonic horn as close as possible to the working frequency of the ultrasonic
generators. Greater amplitude and firm coupling between the horn and the FSW tool were
required for successful welding.
A numerical FE model to determine the influence of the ultrasonic oscillations on
the FSW process was developed. The FE analysis was used to simulate plunge forces
during the plunge phase of FSW and UaFSW, respectively. For FE analysis of FSW of
aluminum alloy, the coefficient of friction was selected based on the comparison of the
plunge forces of FE modeling and experimental measurement results. The plunge forces
acquired in both the experiments and the simulation showed a good agreement. The FE
model of UaFSW of high melting temperature material was developed using temperature
and rate dependent Johnson-Cook model and temperature dependent friction coefficient.
For FE analysis of UaFSW, it was observed that the plunge forces were reduced by using
103
the ultrasonic vibrations. In addition, it was shown that the plunge forces could be
decreased by increasing the amplitude of vibrations.
An in-house CNC machine was used to demonstrate the UaFSW. Taking advantage
of the characteristics of ultrasonic vibration, the UaFSW enables us to decrease the
welding force and enhance mechanical properties of welded part in terms of elongation
and yield strength. It was shown that ultrasonic integration on FSW tool helps to decrease
the chance of formation of welding defect.
6.2 CONTRIBUTIONS
The major contributions of the dissertation are summarized as follows:
1. A FEM design procedure was developed for the design of a horn for friction stir
welding (FSW) process. It was observed that the welding performance of an
ultrasonic assisted friction stir welding (UaFSW) depends on the ability of the
design of the acoustic horn.
2. Development and investigations on the UaFSW process showed a promising FSW
technique for enhancement of welding quality and reduction in welding forces.
Ultrasonic assistance had proven to be beneficial to avoid weld defect and to
enhance the mechanical properties for UaFSW of aluminum alloys. The ultrasonic
assistance on FSW of high melting temperature material helped to reduce welding
forces.
3. A FE model constructed using ABAQUS software was proven feasible by
104
comparing with experimentally measured forces and temperature during plunge
stage of the UaFSW process. The FE model supported the finding that the UaFSW
could provide better weldability of high melting temperature materials than the
conventional FSW. The FE model provides engineers and scientists a convenient
tool to enhance the basic understanding of the FSW or friction stir spot welding
(FSSW) processes.
6.3 RECOMMENDATIONS FOR FUTURE WORK
To further advance the understanding of ultrasonic assisted friction stir welding
(UaFSW) process few tasks that are worth pursuing in the future have been identified as
follows:
1. For further enhancement of the UaFSW process, a better methodology for
integrating the ultrasonic tooling system needs to be established. It may be
necessary to find a method to measure energy dissipation between the ultrasonic
horn and the FSW tool. Optimization of the ultrasonic horn also needs to obtain
maximum benefit of the UaFSW process
2. The FE modeling should be further developed and extended to improve the
modeling results. In reality, the workpiece of aluminum alloy is prone to stick to
the tool so that it results in the complicated friction characteristics. A partial
sliding or sticking methods should be added on the FE model.
105
3. To better demonstrate the feasibility of FSW of high melting temperature
materials, several tool materials need to be tested by characterizing the process,
microstructure, and mechanical properties of friction stir welds on high melting
temperature materials. It may be necessary to measure tool wear. A better tool
geometry can also help to achieve good results of the UaFSW process.
4. Microstructural analysis should be conducted. Based on the guidelines from this
research work, it may be necessary to conduct the microstructural investigation to
understand how the ultrasonic assistance influences on the friction stir welds.
106
BIBLIOGRAPHY
Able, N. and Pfefferkorn, F. (2005). “Laser-assisted friction stir lap welding of aluminum.” Proceedings of the ASME Summer Heat Transfer Conference, 425-429
Ahmed, N., Mitrofanov, A. V., Babitsky, V. I., and Silberschmidt, V. V. (2007). "3D finite element analysis of ultrasonically assisted turning." Computational materials science 39(1): 149-54.
Alcan (1970). Handbook of aluminum, Alcan aluminum corporation.
Amini, S., Soleimanimehr, H., Nategh, M. J., Abudollah, A., and Sadeghi, M. H. (2008). "FEM analysis of ultrasonic-vibration-assisted turning and the vibratory tool." Journal of materials processing technology 201(1): 43-7.
Arbegast, W. J. and Patnaik, A. K. (2005). “Process parameter development and fixturing issues for friction stir welding of aluminum beam assemblies.” Proceedings of the 2005 SAE AeroTech Conference, Dallas, TX.
Awang, M., Mucino, V. H., Feng, Z., and David, S. A. (2005). "Thermo-mechanical modeling of friction stir spot welding(FSSW) process: Use of an explicit adaptive meshing scheme." SAE 2005 World Congress.
Biddell, D. C. and Sansome, D. H. (1974). "The development of oscillatory metal drawing equipment an engineering's view." Ultrasonics: 195-205.
Chang, S. S. F. and Bone, G. M. (2005). "Burr size reduction in drilling by ultrasonic assistance." Robotics and computer-integrated manufacturing 21(4): 442-50.
Chang, U. I. and Frisch, J. (1974). "On optimization of some parameters in ultrasonic metal welding." Welding Journal 53(1): 24-35.
Chao, Y. J. and Qi, X. (1998). "Thermal and thermo-mechanical modeling of friction stir welding of aluminum alloy 6061-T6." Journal of materials processing & manufacturing science 7(2): 215-233.
Chen, C. M. and Kovacevic, R. (2003). "Finite element modeling of friction stir welding - Thermal and thermomechanical analysis." International journal of machine tools & manufacture 43(13): 1319-1326.
Choi, H. (2006). A study on warm hydro forming of lightweight sheet material: Process
107
optimization. Mechanical engineering. Ann Arbor, University of Michigan. PhD.
Edgar de Vries, D. I. (2004). “Mechanics and mechanisms of ultrasonic metal welding.” The Ohio State University. PhD.
Frigaard, O., Grong, O., and Midling, O. T. (2001) “A process model for friction stir welding of age hardening aluminum alloys.” Metallurgical and Material Transactions A: Physical Metallurgy and Materials Science, 32(5): 1189-1200
Gao, C. and Liu, Z. (2003). "A study of ultrasonically aided micro-electrical-discharge machining by the application of workpiece vibration." Journal of materials processing technology 139(1-3): 226-228.
Guo, Z. N., Lee, T. C., Yue, T. M., and Lau, W. S. (1997). "Study of ultrasonic-aided wire electrical discharge machining." Journal of materials processing technology 63(1): 823-828.
Huang, Z., Lucas, M., and Adams, M. J. (2002). "Influence of ultrasonics on upsetting of a model paste." Ultrasonics 40(1): 43-8.
Ishikawa, K.-I., Suwabe, H., Nishide, T., and Uneda, M. (1998). "Study on combined vibration drilling by ultrasonic and low-frequency vibrations for hard and brittle materials." Precision engineering 22(4): 196-205.
Izumi, O., Oyama, K., and Suzuki, Y. (1966). "Effect of superimposed ultrasonic vibrations on the compressive deformation of metals." Transaction of Japan Institute of Metal 7: 162-167.
Johnsen, M. R. (1999). "Friction stir welding takes off at Boeing." Welding Journal 78(2): 35-39.
Jones, J. B. and Powers Jr., J. J. (1956). "Ultrasonic welding." Engineers' digest 17(10): 436-438.
Kakarla, S. S. T., Muci-Kuchler, K. H., Arbegast, W. J., and Allen, C. D. (2005). "Three-dimensional finite element model of the friction stir spot welding process", Friction Stir Welding and Processing III. Proceedings of a Symposia Sponsored by the Shaping and Forming Committee of the Materials Processing and Manufacturing Division of TMS.
Kohn, G, Greenberg, Y., Makover, I., and Munitz, A. (2002). "Laser-assisted friction stir welding." Welding Journal 81(2): 46-48.
Kremer, D. (1981). "The state of the art of ultrasonic machining." CIRP annals ...
108
manufacturing technology 30(1): 107-10.
Kuhn, H. and Medlin, D. (2000) “ASM Handbook: Volume 8:Mechanical testing and evaluation” ASM International, 10th edition
Langenecker, B. (1965). “Metal deformation in macrosonic fields.” Society of Automotive Engineers – Papers, p17
Langenecker, B. (1966). "Effects of ultrasound on deformation characteristics of metals." IEEE transactions on sonics and ultrasonics 13(1): 1-8.
Langenecker, B. and Jones, V. O. (1970). “Macrosonic wire drawing and tube bending.” Proceedings of 1st International Symposium High Power Ultrasonics.
Lienert, T. J., Stellwag Jr, W. L., Grimmett, B. B., and Warke, R. W. (2003). "Friction stir welding studies on mild steel." Welding Journal 82(1): 1-9.
Liu, H. J., Feng, C., Fujii, H., and Nogi, H. (2005) “Wear characteristics of a WC-Co tool in friction stir welding of AC4A+30 vol%SiCp composite.” International journal of machine tools and manufacture 45, pp1635-1639
Mahoney, M. W, Rhodes, C. G., Flintoff, J. G., Bingel, W. H., and Spurling, R. A. (1998). "Properties of friction-stir-welded 7075 T651 aluminum." Metallurgical and Materials Transactions; A; Physical Metallurgy and Materials Science 29(7): 1955-64.
Mandal, S., Rice, J., and Elmustafa, A. A. (2008) "Experimental and numerical investigation of the plunge stage in friction stir welding.” Journal of Materials Processing Technology 203, pp411-419
Mazda (2003). "Mazda develops world's first aluminum joining technology using friction heat." from http://www.mazda.com/publicity/release/200302/0227e.html.
McMaster-Carr “Guidelines for heat treating tool steel.” Document 8864KAC
Mendez, P. F. and Eagar, T. W. (2001). "Welding processes for aeronautics." Advanced materials & processes 159(5): 39-43.
Meran, C., Kovan, V., and Alptekin, A. (2007) “Friction stir welding of AISI 304 austenitic stainless steel” Materialwissenschaft und Werkstofftechnik, 38(10): 829-835.
Miller, S. F. (2006). Friction drilling. Mechanical engineering. Ann Arbor, University of Michigan. PhD.
109
Mishra, R. S. and Ma, Z. Y. (2005). "Friction stir welding and processing." Materials Science & Engineering. R, Reports 50(1): 78-78.
Mitrofanov, A. V., Babitsky, V. I., Silberschmidt, V. V. (2003). "Finite element simulations of ultrasonically assisted turning." Computational materials science 28(3): 645-53.
Mitrofanov, A. V., Babitsky, V. I., Silberschmidt, V. V. (2004). "Finite element analysis of ultrasonically assisted turning of Inconel 718." Integration, The VLSI Journal, 38(1): 233-9.
Mori, L. F., Lee, S., Xue, Z. Y., Vaziri, A., Queheillalt, D. T., Dharmasena, K. P., Wadley, H. N. G., Hutchinson, J. W., and Espinosa, H. D. (2007) “Deformation and fracture modes of sandwich structures subjected to underwater impulsive loads” Journal of Mechanics of Mataerials and Structures, 2(10), pp1981-2006
Mousavi, S. A. A. A., Feizi, H., and Madoliat, R. (2007). "Investigations on the effects of ultrasonic vibrations in the extrusion process." Journal of materials processing technology 187-188: 657-661.
Neugebauer, R. and Stoll, A. (2004). "Ultrasonic application in drilling." Journal of materials processing technology 149(1): 633-9.
Nicholas, T. (1981). "Tensile testing of materials at high rates of strain." Experimental mechanics 21(5): 177-85.
Ohba, H., Ueda, C., and Agatsuma, K. (2001). "Innovative vehicle - The "A-train"." Hitachi technology 50(4): 130-133.
Pohlman, R. and Lehfeldt, E. (1966). "Influence of ultrasonic vibration on metallic friction." Ultrasonics 4: 178-185.
Reitz, V. (2002). "Causing a stir in welding." Welding Design & Fabrication 75(4): 46-49.
Rosochowska, M. and Rosochowski, A. (2007). "FE simulation of ultrasonic back extrusion." AIP conference proceedings 907(1): 564-9.
Sansome, D. H. (1973). "Recent developments in oscillatory metal working." Engineering 213(4): 243-247.
Sato, Y. S., Kokawa, H., Enomoto, M, and Jogan, S. (1999). "Microstructural evolution of 6063 aluminum during friction-stir welding." Metallurgical and Materials Transactions; A; Physical Metallurgy and Materials Science 30(9): 2429-2437.
110
Schmidt, H. and Hattel, J. (2005). "A local model for the thermomechanical conditions in friction stir welding." Modelling and Simulation in Materials Science and Engineering 13(1): 77-93.
Severdenko, V. P. and Petrenko, V. V. (1969). "The temperature conditions during open die upsetting of steel in an ultrasonic field." Izv. Akad. Nauk. B.S.S.R..
Singh, R. and Khamba, J. S. (2006). "Ultrasonic machining of titanium and its alloys: A review." Journal of materials processing technology 173(2): 125-35.
Tang, W., Guo, X., and McClure, J. C. (1998). "Heat input and temperature distribution in friction stir welding." Journal of materials processing & manufacturing science 7(2): 163-172.
Thomas, W. M., Johnson, K. I., and Wiesner, C. S., (2003). "Friction stir welding-recent developments in tool and process technologies." Advanced engineering materials 5(7): 485-490.
Thomas, W. M., Nicholas, E. D., Needham, J. C., Murch, G., Temple-Smith, P., and Dowes, C. J. (1991). “Friction stir butt welding.”
Threadgill, P. L. (1999). “Friction stir welding-State of the Art.” TWI Report 678
Tsujino, J. (1995). “Recent developments of ultrasonic welding.” IEEE Ultrasonics Symposium. Proceedings. An International Symposium.
Tsujino, J., Ueoka, T., Hasegawa, K., Fujita, Y, Shiraki, T., Okada, T., and Tamura, T. (1996). "New methods of ultrasonic welding of metal and plastic materials." Ultrasonics 34(2): 177-85.
Tsujino, J., Hidai, K., Hasegawa, A., Kanai, R., Matsuura, H., Matsushima, K., and Ueoka, T. (2002). "Ultrasonic butt welding of aluminum, aluminum alloy and stainless steel plate specimens." Ultrasonics 40(1): 371-374.
Tweedy, B. M., Arbegast, W., and Allen, C. (2005). “Friction stir welding of ferrous alloys using induction preheating.” Friction Stir Welding and Processing III. 97-104
Vural, M., Ravichandran, G., and Rittel, D. (2003) “Large strain mechanical behavior of 1018 cold-rolled steel over a wide range of strain rates”, Metallurgical and Materials Transactions A, 34(12), pp2873-2885
Winsper, C. E. (1969). Study of the mechanics of wire drawing with a superimposed ultrasonic stress. Proc 10th MTDR Conf, Advan in Mach Tool Des and Res: 553-65.
111
Winsper, C. E. and Sansome, D. H. (1969). "Fundamentals of ultrasonic wire drawing." Journal of the Institute of Metals 97: 274-280.
Xiao, M., Sato, K., Karube, S., and Soutome, T. (2003). "The effect of tool nose radius in ultrasonic vibration cutting of hard metal." International journal of machine tools & manufacture 43(13): 1375-82.
Yuncu, H. (2006). "Thermal contact conductance of nominally flat surfaces." Heat and mass transfer 43(1): 1-5.
Zeng, W. M., Wu, H. L., and Zhang, J. (2006). "Effect of tool wear on microstructure, mechanical properties and acoustic emission of friction stir welded 6061 Al alloy." Acta Metallurgica Sinica 19(1): 9-19.
Zhang, Z. and Zhang, H. W. (2007). "Material behaviors and mechanical features in friction stir welding process." International journal of advanced manufacturing technology 35(1): 86-100.
Zhang, Z. and Zhang, H. W. (2008). "A fully coupled thermo-mechanical model of friction stir welding." International journal of advanced manufacturing technology 37(3): 279-293.
Zhao, Y.-H., Lin, S.-B., Wu, L., and Qu, F.-X. (2005). "The influence of pin geometry on bonding and mechanical properties in friction stir weld 2014 Al alloy." Materials letters 59(23): 2948-52.