Embed Size (px)
Citation preview

Development and Analysis of Automotive Car
Door Crop by using FEA Method
Yashas S Undergraduate Student,
Department of Mechanical Engineering, Visvesvaraya Technical University,
East West Institute of Technology, Anjana Nagar, Bengaluru, Karnataka 560-091
Abstract:- Door Assembly module is pre-assembly of various
components which can be directly mounted onto the door
inner panel. These door modules, when directly shipped to the
OEM's (original equipment manufacturer), to save assembly
time and cost in mass manufacturing. So in this project work
carried out with help of FEM by using Hyper mesh as per the
quality criteria by using Nastran as a solver for test loads.
Using Finite element method to determine the natural
frequency of door trim with respect to considering the mass of
other structure, now for this project work we are considering
the LH side door. In the door assemblies having some major
parts are there in that Door inner trim part is the major one,
it will be supporting the door from inner and outer side also
including electrical assembly parts like sensors and motor for
windshield.
Generally the initial mass of Door assembly in automotive
car will be 10.2 kg, which need to be improved to reach the
natural frequency of the door trim, by adding stiffeners to
reach the target mass of 12.8 kg and reached the desired
natural frequency of door trim. once determining the natural
frequency door trim purpose is to check which material will
used for manufacturing of the door trim , for the
consideration purpose material will be used for door trim is
steel, plastic, Aluminum based on their young's modulus.
Key words: Car Door, FEM, Hyper mesh.
I. INTRODUCTION
Door modules are preassemblies of various components
on a carrier plate which can be directly mounted onto the
door inner panel. Those door modules, when directly
shipped to the OEM’s, save assembly time and cost in mass
manufacturing. Long fiber which is reinforced
thermoplastic polypropylene (PP-LFT) with glass filled
fiber material is used for various automotive applications as
it has improved structural and material properties over
conventional materials like steel. Door modules are made
up
of PP-LFT material is manufactured using injection and
moulding method.
As the engineering profession has developed further,
analytical techniques were introduced to improve the
design procedures. As the components became more and
more complex, the more difficult it was to apply analytical
techniques to predict fatigue life. Instead, the numerical
approaches have been developed, which make it possible to
effectively analyse complex structures and obtain solutions
faster. These numerical approaches use both the data
obtained from multiple experimental testing together with
the analytical correlations developed.
For the effective usage of these numerical approaches,
knowledge of Finite Element Analysis (FEA) is required.
In a same progressive manner as fatigue, FEA is now an
integral part of structural design. FEA allows the design
analysts and engineers to create virtual models and perform
simulations in the preliminary design stage. As such, a
considerable amount of cost and time are been saved. FEA
is being done by using Hyper mesh for pre-processing,
Nastran as solver and Hyper view for post- processing.
1.1 Modal analysis
Modal analysis is a field of measuring and analysing
the dynamic response of structures or fluids without
excitation. It is a study of the dynamic properties of the
structures under a vibrational excitation.
In the Structural engineering, modal analysis uses
overall mass and stiffness of a structure to find the various
periods at which it will naturally resonate.
1.1.1 Types of analysis:
1. Linear static analysis.
2. Non-linear static analysis.
3. Dynamic analysis.
4. Buckling analysis.
5. Thermal analysis.
6. Fatigue analysis.
7. Optimization.
8. CFD analysis.
9. Crash analysis.
10. NVH analysis.
Linear static analysis:
Linear means a straight line. In real life, a material after
crossing the yield point materials follows a non-linear
curve but software always follows the same straight line.
The Components brake into two separate pieces after
crossing the ultimate stress but software based analysis
never show failure in this fashion. It shows the single
unbroken part with the red colour zone at the location of
failure. The linear solver assumes that all material behaves
in linear elastic manner.
1.2 Terms of vibration:
Natural frequency: It is the frequency at which a system
or body tends to oscillate in the absence of external driving
force or damping force.
Free vibrations of an elastic body are called natural
vibrations and occur at frequency called as natural
frequency.
It is given by mathematical equation, Fn = 1/T
Hertz.
International Journal of Engineering Research & Technology (IJERT)
ISSN: 2278-0181http://www.ijert.org
IJERTV9IS100073(This work is licensed under a Creative Commons Attribution 4.0 International License.)
Published by :
www.ijert.org
Vol. 9 Issue 10, October-2020
159

Where,
T is Time period in seconds.
Frequency: It is the rate at which something occurs over a
particular period of time i.e. the number of cycles per unit
time.
Amplitude: While the body is said to be in or under the
influence of vibration, the maximum displacement of a
vibrating body from the mean position is known as
vibration. It is denoted by ‘A’.
Resonance: It is a phenomenon in which vibrating system
or external force drives another system to oscillate with
greater amplitude at a specific preferential frequency.
Frequencies at which the response amplitude is a
relative maximum are known as the system’s resonance
frequency. At a resonant frequency, small periodic driving
forces have the ability to produce large amount of
amplitude oscillations, due to the storage of vibrational
energy.
Degrees of freedom: A minimum number of independent
coordinates required to determine completely the positions
of all parts of a system at any instant of time defines the
number of degrees of freedom of the system.
Systems with finite numbers of degree of freedom are
known as discrete systems, and those systems with infinite
number of degrees of freedom are known as continuous
systems. Any structure in space will possess six degrees of
freedom as shown in the figure below.
Fig. 1.1: Degrees of freedom.
1.3 Concepts of vibration:
Any motion that repeats itself after a fixed interval of
time is known as vibration. A swinging pendulum and a
motion of plucked string are typical examples of vibration.
A vibratory system, generally includes a means of
storing for potential energy (spring or elastic), a means of
storing for kinetic energy (mass or inertia), and a means by
which energy is gradually lost (damper).
Classification of vibration:
1. Free and forced vibration.
2. Damped and un-damped vibration.
3. Linear and non-linear vibration.
4. Deterministic and random vibration.
Free vibration:
If a system, after an initial displacement or disturbance,
is left to vibrate on its own, that vibration possessed by the
body is known as free vibration. No external force acts on
the system.
Forced vibration:
If a system is subjected to external force i.e., external
load then the vibration possessed by the body is known as
forced vibration. If the frequency of external force
coincides with any of the natural frequencies of the system,
there occurs a condition known as resonance. And the
system undergoes dangerously large oscillations. While the
frequency of vibrations caused meet the natural frequency
of the system or instrument, then it causes vigorous damage
to the continuum of the system.
1.4 FEM (Finite element method):
The Finite element method is the numerical method of
solving engineering problems. It is also referred to as FEA
(Finite element analysis).
General procedure of FEM: Discretization: Since the
model or structure is an infinite structure for which the
problem cannot be solved. Therefore the infinite structure
is converted into finite structure by discretizing a part of
structure assuming that structure is divided into equal parts.
Selection of displacement models or nodes: Nodal
displacements are determined. Displacement within the
structure is computed. Some values are approximated in
order to achieve least error. And model should satisfy few
basic requirements to minimize errors.
Derivation of element matrix: Nodes are subjected to
equivalent loads. Material and geometrical properties of the
structure material is specified. Forces at the nodes refer to
nodal displacement which relates to stiffness of the
structure. By this stiffness matrix is derived, which is
denoted by “K”. Stiffness matrix refers to the matrix that
represents the system of linear equations that must be
solved in order to ascertain an approximate solution to the
differential equation.
Derivation of overall matrix: While there has to be
displacement at the node it has to be same for all the
adjacent elements. So by this combined element matrix can
be determined.
Solution for unknown displacements: While the specified
boundary conditions are applied as of equation given below
the unknown displacement values can be determined.
[K]{Q} = [F]
Where, K is stiffness matrix.
Q is nodal displacement. F is force matrix.
Areas where FEM can be applied:
1. Structure analysis: Cantilever, Simply supported beam.
2. Solid mechanics: a gear, an automotive train.
3. Dynamics: shear tower, earthquake.
4. Thermal analysis: heat radiation of finned surface,
thermal stress brake.
5. Electrical analysis: piezo actuator, electrical signal
propagation.
International Journal of Engineering Research & Technology (IJERT)
ISSN: 2278-0181http://www.ijert.org
IJERTV9IS100073(This work is licensed under a Creative Commons Attribution 4.0 International License.)
Published by :
www.ijert.org
Vol. 9 Issue 10, October-2020
160

Fig. 1.2 Procedure of FEM.
1.5 Software based FEA:
For any software there are 3 steps
1.5.1 Pre-Processing
• CAD data
• Meshing
• Boundary condition
Create the model first using the modeling software that
we want to do test or to build prototype. Then import the
CAD data & discretize the whole model into smaller, using
finite elements (i.e. meshing the CAD model using smaller
elements). Then applying boundary conditions (i.e.
constraints & loads to be applied to the model) to know the
required solution. After completion of pre- processing (i.e.,
a,b,c), software internally forms mathematical equation of
the form [F]=[K]*[δ].
1.5.2 Processing
Processing means solving the given problem (i.e.
internally software carries out matrix formation, inversions,
multiplications) & gives solution for unknowns (i.e.
Displacements, Strains & Stress for static analysis).
1.5.3 Post Processing
Post processing is visualization of results, verification,
conclusion & thinking about what step could be taken to
improve the design. The results can be viewed in various
formats: graph, value, animation etc.
Fig. 1.3 Steps followed for FEA.
1.6 Introduction to software used:
• Pre Processor as HYPERMESH
• Processor as NASTRAN
• Post processor as HYPERVIEW
1.6.1 Hyper mesh
Hyper Mesh is a high-performance finite element pre-
processor to prepare even the largest models, starting from
import of cad geometry to exporting analysis run for
various disciplines. If element size data of meshing is not
specified by the customer convergence study is conducted
to determine element size. Care should to be taken to
decide the type of element to be used like 1D, 2D or 3D
elements. Special considerations has to be taken while
deciding the elements at welded regions, solder joints etc.,
with a focus on engineering productivity, Hyper Mesh is
the user- preferred environment for:
• Solid Geometry Modelling.
• Shell Meshing Model.
• Morphing Detailed Model.
• Setup Surface Geometry.
• Modelling Automatic Mid-Surface.
• Generation Batch meshing.
1.6.2 Nastran
Nastran is acronym formed from NASA Structure
Analysis; Nastran is a finite element analysis (FEA)
program that was developed by NASA in the late 1960s by
Stephen Burns of the University of Rochester. Generally
used Nastran versions are MSC (MacNeal-schwendler)
Nastran or CSC (Computer Sciences Corporation) Nastran
NX Nastran. Nowadays, Nastran is widely used in the
fields of aerospace, automotive and maritime industries.
Nastran is written primarily in FORTAN and contains over
million lines of code. These modules are controlled by an
internal language called the Direct Matrix Abstraction
Program (DMAP).
Few most common solution sequence codes are
• 101-Linear static
• 103-Modal or Dynamic
• 105-Buckling106-Non-Linear Static
• 107-Direct Complex Eigenvalue
• 108-Direct Frequency Response
• 109- Direct Transient Response
Pre - Process
Process
Post - Process
International Journal of Engineering Research & Technology (IJERT)
ISSN: 2278-0181http://www.ijert.org
IJERTV9IS100073(This work is licensed under a Creative Commons Attribution 4.0 International License.)
Published by :
www.ijert.org
Vol. 9 Issue 10, October-2020
161

• 110-Modal Complex Eigen value
• 111-Modal Frequency Response
• 112-Modal Transient Response
• 129-Nonlinear Transient
• 144-Static Aero elastic analysis
• 145-Flutter/Aero servo elastic Analysis
• 146-Dynamic Aero elastic Analysis
• 153-Non-linear Static coupled with Heat
transfer
• 159- Non-linear transient coupled with Heat
transfer
• 187-DDAM
• 200-Design Optimization and sensitivity
analysis
• 600-Non-linear static and dynamic(implicit)
• 601-Implicit Non-linear
• 700-Explicit Non-linear
1.6.3 Hyper view
It is actually a post processor which is used to view the
results visually and graphically. Various types of results are
viewable in hyper view like stress plots, displacement
plots, various modes of vibrations, etc. From these we can
draw conclusions on the components analyzed whether it is
safe and can be used for the intended applications.
1.7 Material Properties:
Density:
A material density is defined as its respected mass per
unit volume. It is, essentially, the measurement of how
tightly matter is crammed together. Take the mass (m) and
divide by a volume (v): ρ = m / v
The SI unit of the density is kilogram per cubic meter
(kg/m3). It is also frequently represented in CGS unit of
grams per cubic centimeter (g/cm3).
Fig 1.4: Density
Poisson’s ratio:
Poisson's ratio is defined as a negative of the ratio of a
lateral strain to the axial strain for a uniaxial stress state.
If the tensile load is applied to a material, then the material
will elongate on the axis of the load. Conversely, if a load
is compressive, the axial dimension will decrease. If
volume is constant, the corresponding lateral contraction or
expansion must occur. This lateral change will bear a fixed
relationship to an axial strain. The relationship, or a ratio,
of lateral to the axial strain is called Poisson's ratio.
1.8 Theories of failure:
a) Maximum principal stress theory.
b) Maximum shear stress or stress difference theory.
c) Strain energy theory.
d) Shear strain energy theory.
e) Maximum principal strain theory.
1.8.1 By Default all the post processors gives von-
Mises stress plot. What is von-Mises stress and the
maximum principle stress?
The stress – strain diagram is plotted from an uniaxial
tensile test. These curve is helpful in designing dimensions
of component via if tensile force is known, based on yield
stress 1 can is easily determined safe area of C/S
(A=F/stress yield), but component is subjected to a
multiracial loading (normal and shear together) nature of
stress- strain curve will not be the same (graph will be
different), it indicates for different combinations of loading
(Fx, Fy, Fz, Mx, My, Mz) different graphs should be
referred to. Therefore it is not just particle to conduct so
many tests. Then how components can be designed when it
is subjected to multi-axial loading using available test data
for uniaxial loading? It is achieved via theories of failure,
which gives us equivalent max. Normal or max. Shear
stress energy of the component subjected to multi-axial
loading. It is then equated with respective value at yield
point (uniaxial tensile test).
Fig 1.8: Stress-Strain Diagram
Max principle stress: Max. Value of the normal stress, the
plane on which max. Principal stress acts, shear stress
value is zero.
1.8.2 Why von-Mises stress is recommended for a
ductile and principal stress for brittle material?
Fig 1.9: von-Mises for brittle and ductile material.
Brittle:
Failure of a cast iron rod subjected to uniaxial load is
along a plane perpendicular to the axis of loading. Clearly
failure is due to normal stress. Out of different theories of
International Journal of Engineering Research & Technology (IJERT)
ISSN: 2278-0181http://www.ijert.org
IJERTV9IS100073(This work is licensed under a Creative Commons Attribution 4.0 International License.)
Published by :
www.ijert.org
Vol. 9 Issue 10, October-2020
162

failure max. Principal stress theory is one which is based
on normal stresses. Hence for brittle material components
max. Principal stress is used.
Ductile:
Mild steel fails at the plane inclined 45degree to axis of
loading normal stresses cannot act on this plane and the
only other possible is shear stress. Out of different theories
of failure its max. shear stress and a von-Mises stress
which are based on shear stress. Von-Mises stress gives a
better correlation with experimental results and hence
preferred for ductile materials.
Max. Shear stress is sometimes preferred over von-
Mises stress for designing rotating components such as
turbine blade and compressor components.
1.8.3 What is absolute principal stress and signed
von-Mises stress?
Absolute principal stress: This term is so commonly used
in fatigue analysis. Fatigue calculations are based on an
amplitude and mean stress. It has been observed that if the
calculations are just based on only the maximum principal
stress or only minimum principal stress then stress range is
less and leads to higher fatigue life. Remedy is to find max.
value out of a two at the point over given period of time
and then find the stress range or amplitude and mean stress
based on this data (say max. principal stresses at a node at
time 1 sec. is +250 N/mm2 and min. principal is around-
400 N/mm2 then the absolute principal stress is equal to -
400 N/mm2, collect the data over a period of 10 sec and
then find stress range based on max. and min. absolute
stress values out of the 10).
Signed von-Mises stress: von-Mises and max. Shear stress
values are always positive. If those values are used for
fatigue calculations then stress range would be reduced to
half resulting in higher fatigue life. Remedy is to find out
the sign of absolute principal stress at the point at a given
time instance and assign it to corresponding value of von-
Mises or max. Shear stress. Say absolute max.
Principal stress is -300 N/mm2 at 2 seconds and
corresponding von-Mises stress at time 2 sec is 315 N/mm2
then signed von-Mises stress would be -315 N/mm2.
II. LITERATURE SURVEY
2.1. H. M. A. Hussein and Ahmad Gemeal :
Conducted analysis on automotive car doors since they
not only determine the general guidelines of car style, but
also are vital for passenger's safety by protecting humans
from side crashes. Predetermined values from the previous
works conducted on a similar existing SUV vehicle were
used as targets to be achieved by Finite Element Analysis
(FEA) of car doors. The modal analysis of the rear and the
front doors reveal that the lateral stiffness and vertical
displacement analysis the reinforcement must be brought to
1.2 mm at the inner panel. The stress analysis of the rear
door suggests addition of a terminal flange in its area. And
the stiffness of a door can be increased by percentage of
St.42 or by other steels of high strength without increasing
weight.
2.2. O.M. Terciu, I. Curtu :
He has done research on FEA of an automotive door
trim panel made of lignocelluloses composites in order to
determine the stresses and displacements in case of a door
slam simulation. On his research a new lignocelluloses
composites made of polymers reinforced with woven
fabrics of natural fibers and wood particles was created.
The mechanical properties of these material were
determined experimentally and used as input data in FEM
simulations. The finite element method result emphasized
that new material improves component stiffness compare
with classical materials used. The modeling part of the
complex geometry requires specialized software to achieve
the required model. Since the composite material has high
of fixing areas to the metal structure there is equivalent
stress distribution and the displacement of the
lignocellulose material is 43% smaller than the other
polypropylene panel when compared by Finite Element
Method. Since smaller displacement results it is due to high
rigidity and low weight of the material this decreases the
overall weight by 1.81kg to 1.49kg.
2.3. S. Vinay Seeba, S. Srikari :
He had studied The design and analysis methodology
design adopt plastic door module plate to replace existing
steel door module plate, this door modules where directly
shipped to the OEM’s, which saves assembly time and cost
in mass manufacturing. The application of long fibers
reinforced thermoplastic has improved structural and
material properties over conventional materials like steel.
The final design of plastic door module is 33% lesser in
weight with improved structure, when compared to steel.
The same can be adopted to replace semi- structural
automotive parts currently made from steel.
2.4. M. Raghuveer, Ganti Satya Parkash :
He had conducted finite element analysis based on
implementation or replacing the presently used material
steel with composite materials like Aluminum, Carbon
Epoxy, S-glass epoxy, E-Glass epoxy,etc. such that the
weight of the door can be reduced and impact analysis was
conducted on door for different loads by varying the
materials. Therefore results show the improvement in the
strength of the door as the stresses of the solid work is far
less than the material yield stress which indicates us the
design is safe. Since the strength is increased by decreasing
the weight the manufacturing cost of the car door is
increased by using composite material by replacing steel.
By above results it can be decided that FEA is a good tool
to reduce the time consuming theoretical work.
2.5. Tan Wei, Wang Yan, Li Lingyang :
He had studied the Design of The Vehicle Door
Structure Based on Finite Element Method. The
performance of the door assembly is very significant for
the vehicle design. In the present paper, the FEM is used in
the development processes of the door assembly. The
modal characteristic, stiffness, strength, and anti-extrusion
of a newly developed passenger vehicle door assembly
were calculated and evaluated by several finite element
International Journal of Engineering Research & Technology (IJERT)
ISSN: 2278-0181http://www.ijert.org
IJERTV9IS100073(This work is licensed under a Creative Commons Attribution 4.0 International License.)
Published by :
www.ijert.org
Vol. 9 Issue 10, October-2020
163

analysis software’s. The structural problems were
discovered by finite element analysis and had been
modified and finally achieved the expected door structure
performance target of this new vehicle, and its issue in
focus is to predict performance of the door assembly by
powerful finite element analysis software, and optimize the
structure to meet the design targets and it is observed that
this method have been used to forecast the performance of
vehicle door efficiently when it was designed.
III. SUMMARIZATION
1. Rear Modal analysis of the rear and the front doors
reveals that they is in target. Front doors lower opening
must be split into two; Rear door stress analysis suggest the
need to extend the latch reinforce or adding the terminal
flange in this area. Anti-intrusion bar and mirror
reinforcement increases stiffness in a hinged area for both
front and rear doors rather than for rear door only, from the
strength point of view: there is still wide opportunity to
increase the stiffness of doors by increasing the percentage
of St. 42 are already used and/or other steels of high
strength without increasing weight.
2. Modeling parts with a complex geometry involves the
usage of specialized software to achieve a virtual model;
From the equivalent stress distribution of an analyzed
component can be seen that these areas have high levels on
fixing the areas to a metal structure; The displacements of
lignocellulose materials door trim the panel obtained by
FEM are smaller by 43% than that of the polypropylene
panel; Small values of displacements resulting for
lignocelluloses composite component are due to high
rigidity and also low weight material layer given its lower
thickness of the panel, these are gradually decreasing from
1.81kg to 1.49kg.
3. This study helped in designing the plastic door module
plate for the car body application using 30% glass fiber PP-
LFT (STAMAX®) material, topology and the shape
optimization techniques. A final design of the plastic door
module is 33% lesser in weight with improved structural
properties compared to the existing steel door module
plate. The design and the analysis methodology adopted
here to design plastic door module plate to replace existing
steel door module plate can be adopted to design and the
analysis plastic parts which replaces the semi structural
automotive parts currently made from steel.
4. Result shows an improvement in the strength of the door
as the maximum limit of the stresses. The value of the von-
misses stresses that comes out from the solid works is far
less than that of material yield stress so our design is safe.
The strength of a car door is also increased (weight
Reduction) from change of material from steel to Eglass
epoxy and sglass epoxy. The cost of the car doors are
increased sufficiently by using the composite materials for
the car door manufacturing but this decreases the risk from
the collisions.
5. There is no physical test in the development of the
process of this new vehicle door products, just using the
FEM to the discovery of the design problems and will be
able to make the target recommendations for an
improvement are very effective, quick guide engineer to
improve the product quality. This method can reduce the
parts of prototype producing and the number of physical
tests to shorten the development cycle and reduce the
development investment.
6. Modal analysis of the front doors reveals that they are in
target. Modal analysis result is obtained for 10 different
modes, in that first 5 modes are local modes and the
remaining is global modes. The modal frequencies are
obtained that is >20 Hz which well away from the engine
excitation of 16Hz. This result is for an ideal condition of
engine. (Engine at 1000 rpm and load at ideal), Harmonic
analysis is performed with and without the stiffener for
automotive car door. In a harmonic analysis displacement
were obtained for both conditions. With stiffener
displacement were less and a safe design.
IV. OBJECTIVES
• Finite element analysis is very good tool to reduce the
time consuming theoretical work.
• It is recommended that the structural analysis
optimization has to made for doors.
• Hyper mesh software is used for modal and linear
static analysis.
• The natural frequencies of the door trim should be
found, and it is suggested that the free natural
frequencies are not as same as forced frequencies so it
doesn't reach the resonance state.
• Stiffeners are added to the door trim so that the
required natural frequencies are obtained.
• Then three materials are selected and have been
analyzed with respect to their displacement and stress
with applied loads.
• And the suitable materials are selected for
manufacturing process of the car door trim.
V. METHODOLOGY
5.1 Meshing parameters considered for Door trim
Analysis:
Fig. 5.1: FE modeling of door trim.
Elements are used for the meshing of door trim is
having size of 5mm and remaining quality parameters is
explained in the table number 2, Each critical capture
International Journal of Engineering Research & Technology (IJERT)
ISSN: 2278-0181http://www.ijert.org
IJERTV9IS100073(This work is licensed under a Creative Commons Attribution 4.0 International License.)
Published by :
www.ijert.org
Vol. 9 Issue 10, October-2020
164
properly to represent the CAD, elements which are used for
meshing in both quad and tria element. These 2d shell
elements have only translation DOF there is no rotational
DOF, for only solid elements, elements information will be
provided below.
5.2 Quality parameters considered while meshing of
doortrim:
• Warpage: In shell & hexahedron elements only
applicable to determine the warpage. In shell element
also if third node is out of plane by a certain angle,
error due to warpage can occur, in hexahedron element
it will be deviated from the plane from 3 node plane to
4 node plane.
• Maximum Angle: Between the two edges of the
obtuse angle in quad element should be more than the
limit, which will be not accepted for the software.
• Minimum Angle: Between two edges in quadrilateral
obtuse angle is less than limit.
• Aspect Ratio: The ratio of maximum length to
minimum length should be less than limit.
• Jacobian: The differential matrix which obtained from
the formulation of any stiffness called the Jacobian.
Quality parameters
Warpage in degree 30
Aspect ratio 5
Skew in degree 60
Min. Length 1
Max. Length 8
Jacobian 0.6
Min. Quad Angle 40
Max. Quad Angle 140
Table 5.1: Quality parameters used for meshing of Door trim.
5.3 1D & 2D element information used in Door trim
modeling
Fig. 5.2: Representation of rigid element.
1) Rigid body element (2D element):
Properties of rigid elements:
a) Rigid element in 1d element, which used to represent the
bolt connection and connecting with different components.
b) Rigid element will have 6 degrees of freedom, which
can release as per the requirement.
c) Six degree will be derived into 3 translations and 3
rotation.
d) Property of rigid element is to constrain the region of
element at that region will not get any displacement or
stress.
e) Rigid element will add the stiffness to original structure,
while not in RBE3.
f) RBE2 element distributes the force and moment equally
among all the connected nodes Irrespective of position of
force or moment application.
g) RBE3 element is a constraint equation to distribute force
and moment as per the distance.
Types of rigid elements:
a) RBE2.
b) RBE3.
c) Bar.
d) Beam.
e) Rod.
f) Spring.
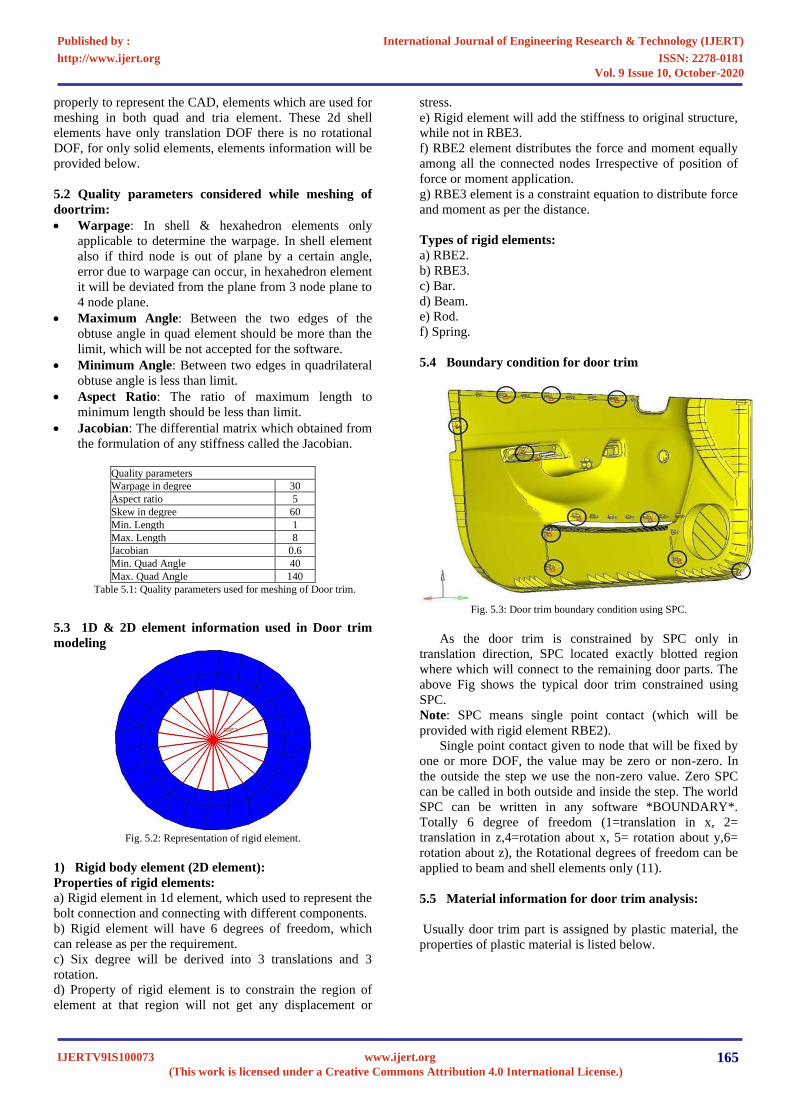
5.4 Boundary condition for door trim
Fig. 5.3: Door trim boundary condition using SPC.
As the door trim is constrained by SPC only in
translation direction, SPC located exactly blotted region
where which will connect to the remaining door parts. The
above Fig shows the typical door trim constrained using
SPC.
Note: SPC means single point contact (which will be
provided with rigid element RBE2).
Single point contact given to node that will be fixed by
one or more DOF, the value may be zero or non-zero. In
the outside the step we use the non-zero value. Zero SPC
can be called in both outside and inside the step. The world
SPC can be written in any software *BOUNDARY*.
Totally 6 degree of freedom (1=translation in x, 2=
translation in z,4=rotation about x, 5= rotation about y,6=
rotation about z), the Rotational degrees of freedom can be
applied to beam and shell elements only (11).
5.5 Material information for door trim analysis:
Usually door trim part is assigned by plastic material, the
properties of plastic material is listed below.
International Journal of Engineering Research & Technology (IJERT)
ISSN: 2278-0181http://www.ijert.org
IJERTV9IS100073(This work is licensed under a Creative Commons Attribution 4.0 International License.)
Published by :
www.ijert.org
Vol. 9 Issue 10, October-2020
165

Table 5.2: Plastic material information (standard table from client)
5.6 Static Analysis:
The linear static analysis is applied to analyze
displacements, strains or stress of structures. This analysis
is valid for linear static mechanical problems without any
non-liner (geometrically nonlinear, contact, material
nonlinear).
Static nonlinear problems can be solved by the nonlinear
analysis whereas transient problems are solved by methods.
The static linear analysis formulates structural
equilibrium on the initial configuration without
consideration of deformations. Hence, it is only valid for
problems showing small displacements.
5.7 Linear material properties:
Solving of linear problem in all material will behave in
a linear elastic manner. Some materials shows non-linear
elastic parametric behavior, yield should be above this kind
of problem, they still result require non-linear codes & non-
linear structural behavior for solution. If a system is to be
loaded beyond its yield point, non-linear analysis would
also be required. This shows in the figure below for a
material comparison behavior. In this step, the constraints,
geometry, loads & mechanical properties are applied to
develop matrix equations for all elements, which are
combined to generate a
global matrix equation of the structure. Forms of the
individual equations, as well as the structural equation is
always,
{F} = [K] [U],
Where,
{F} = External force matrix.
[K] = Global stiffness matrix.
[U] = Displacement matrix.
Fig 5.4: Linear, Non-linear, Elastic Material properties.
VI. RESULTS AND DISCUSSIONS
6.1 Model performance of door trim:
Modal analysis is a basic analysis to check the natural
frequency of the system, as per the basic analysis door trim
having a natural frequency 25Hz, has the model not
meeting the modal performance so that we have increased
the mass of the door trim, initially door trim model
performance was 21.21Hz, so that until reaching natural
frequency of door not able to perform the linear static
analysis. Increasing the mass of the door trim and by
increasing the density and also provide the extra stiffness
increase the mass of the door trim, once the mass increase
modal performance also increases and thereby attain the
desired natural frequency (25Hz).
Modal analysis means, the goal is to find the natural
frequencies, mode shapes, Eigen vectors under the free
vibration. For the door trim initially undergo the modal
analysis in the 1st iteration of modal analysis not reaching
the target value of 25Hz, so by increasing the mass of door
trim on 2nd iteration then it reaches the natural frequency
of 25Hz.
Sl. no. Mass in
Kg
Natural
frequency in Hz
Iteration 1 10.2 21.63
Iteration 2 12.72 26.3 Table 6.1: Natural Frequency of door trim at different iteration.
[NOTE: Target natural frequency of door trim is 25Hz.]
Fig. 6.1: Iteration 1 having mass of 10.2 kg no stiffener is added.
In the figure 6.1, it is seen that door trim has mass of 10.2
kg and modal analysis for the iteration 1 is done.
Material Material properties
Plastic
E MPa Poisson’s Ratio ρ Kg/mm3
1500 0.3 7.80E-9
International Journal of Engineering Research & Technology (IJERT)
ISSN: 2278-0181http://www.ijert.org
IJERTV9IS100073(This work is licensed under a Creative Commons Attribution 4.0 International License.)
Published by :
www.ijert.org
Vol. 9 Issue 10, October-2020
166

Fig. 6.2: Initial model performance of door trim at 21.3 Hz.
In the figure 6.2, the modal performance result of door trim
is obtained as 21.3 Hz.
The desired natural frequency is not obtained from the
iteration 1, so in order to achieve the desired natural
frequency the mass of the door trim is increased by
addition of stiffeners.
Fig. 6.3: Iteration 2 having mass of 12.72 kg stiffener is added.
Now the increased mass door trim achieves the desired
natural frequency as shown in fig. 6.4, and also as the mass
is increased by addition of stiffeners, thereby increases the
stiffness of the door trim.
Fig. 6.4: Initial model performance of door trim at 26.21 Hz.
6.2 Static analysis of door trim.
Load applied: 100 N
Result: Displacement & Stress plot.
1) Displacement Plot:
[NOTE: Target Stiffness is 15±0.5 N/mm].
• For Steel:
Fig. 6.5: Displacement Plot results for Steel Loading Points Load (N) Displacement
(mm)
Stiffness (N/mm)
For Steel:
1 100 0.12 833.33
2 100 0.17 588.23
Table 6.2: Displacement results for static loading of Steel.
From the static loading the stiffness and displacement
values are obtained as shown in fig. 4.5, in which stiffness
in both cases is beyond the required 15±0.5 N/mm
stiffness. So Steel is not suitable.
• For Aluminium:
International Journal of Engineering Research & Technology (IJERT)
ISSN: 2278-0181http://www.ijert.org
IJERTV9IS100073(This work is licensed under a Creative Commons Attribution 4.0 International License.)
Published by :
www.ijert.org
Vol. 9 Issue 10, October-2020
167

Fig. 6.6: Displacement Plot results for Aluminium.
Loading
Points
Load (N) Displaceme
nt (mm)
Stiffness
(N/mm)
For
Aluminum:
1 100 0.36 277.78
2 100 0.13 769.23
Table 6.3: Displacement results for static loading of Aluminum.
From the static loading the stiffness and displacement
values are obtained as shown in fig. 6.7, in which stiffness
in both cases is beyond the required 15±0.5 N/mm
stiffness. So Aluminum is not suitable.
• For Plastic:
Fig. 6.8: Displacement Plot results for Plastic.
Loading
Points
Load
(N)
Displacement (mm) Stiffness
(N/mm)
For Plastic:
1 100 14.95 6.68
2 100 6.46 15.47
Table 6.4: Displacement results for static loading of Plastic.
From the static loading the stiffness and displacement
values are obtained as shown in fig. 6.8, the stiffness in
both cases is within the required 15±0.5 N/mm stiffness. So
Plastic is suitable.
2) Stress Plot:
• For Steel:
Fig. 6.9: Stress Plot results for Steel.
Loading Point Load (N) Stress Mpa
For Steel:
1 100 69.32
2 100 28.31
Table 6.5: Stress results for static loading of Steel.
From Static Loading the stress obtained are 69.32 &
28.31 Mpa, at the loading points 1and 2 respectively for
steel, shown in the table 6.5.
• For Aluminum:
International Journal of Engineering Research & Technology (IJERT)
ISSN: 2278-0181http://www.ijert.org
IJERTV9IS100073(This work is licensed under a Creative Commons Attribution 4.0 International License.)
Published by :
www.ijert.org
Vol. 9 Issue 10, October-2020
168

Fig. 6.10: Stress Plot results for Aluminum.
Loading Point Load (N) Stress Mpa
For Aluminum:
1 100 69.32
2 100 28.31
Table 6.6: Stress results for static loading of Aluminum.
From Static Loading the stress obtained are 69.32 &
28.31 Mpa, at the loading points 1and 2 respectively for
Aluminum, shown in the table 6.6.
• For Plastic:
Fig. 6.11: Stress Plot results for Plastic
Loading Point Load (N) Stress Mpa
For Plastic:
1 100 15.745
2 100 28.240
Table 6.7: Stress results for static loading of Plastic.
From Static Loading the stress obtained are 19.03 &
13.38 Mpa, at the loading points 1and 2 respectively for
plastic, shown in the table 6.7 and plastic is suitable.
VII. CONCLUSION
Modal analysis is based on finite element method to
determine the life of door trim, under the loading of 100 N.
Simulation results is validated with experimental results.
Static analysis was conducted for determining stiffness of
door trim, in which results for displacement and stress is
obtained.
1. The desired natural frequency of door trim weighing
10.2 Kg is more than 25 Hz, which is not obtained by the
door trim. So the weight of door trim is increased to 12.72
kg (by adding stiffeners) by which natural frequency of
26.21 Hz is produced.
2. By having three materials as choice namely Steel,
Aluminum, Plastic in order to manufacture door trim it is
necessary to determine the best material in terms of
requirement and usage.
3. Based on displacement and stress plot it is determined
that plastic is the suitable material for the manufacture of
door trim.
VIII. FUTURE SCOPE
1. By the results it is observed that plastic is the better
material for the manufacture of automotive door trim, so in
order to get better performance of the model the material
properties of the plastic are to be enhanced.
2. The further research on door trim samples should be
examined and the surface treatment results should be prior
in order to determine the life of the component.
IX. REFERENCES
[1] H. M. A. Hussein and Ahmad Gemeal, Numerical study of
Automotive doors Vol.12, August 2012, No.04 [2] O.M. Terciu, I. Curtu et al., FEM Modelling of an automotive door
trim panel made of lignocelulozic composites in case of door slam
simulation COMAT 2012, October 2012. [3] S. VinaySeeba, S. Srikari et al., Design and analysis of a plastic door
module for car body application : Vol.9, Issue 1, April 2010.
[4] M. Raghuveer, GantiSathyaPrakash, Design and Impact Analysis of
a Car Door Vol. 4, Iss. 9, September 2014, pp. 1-8.
[5] MSC. Nastran [Computer software]:"Introduction to NASTRAN
user guide" Los ANgeles (CA, USA), Vol 111,MacNelSchwendler Corporation, 2011.
[6] Peterson, R.E "stress Comcentration Factors" New york: john Wiley
& Sons, Vol 1 2009. [7] Kown, Y. W. and Bang H:" The Finite Element Method Using
MATLAB" Vol 111, 2010.
[8] Su, Henkin "Automotive CAE Durability Analysis Using Random Vibration Approach" Proceedings of MSC2nd Worldwide
Automotive Conference, Dearborn, MI, Oct.2010.
[9] "Door Trim Key Life Bench Durability Test", Visteon Internal Test Procedure, TO-WP-0018B, April 28, 1999.
[10] “Practical Finite Element Analysis byNitin S” Goshala, Vol 1 2008
Edition.
International Journal of Engineering Research & Technology (IJERT)
ISSN: 2278-0181http://www.ijert.org
IJERTV9IS100073(This work is licensed under a Creative Commons Attribution 4.0 International License.)
Published by :
www.ijert.org
Vol. 9 Issue 10, October-2020
169