Embed Size (px)
Citation preview
Rose-Hulman Institute of TechnologyRose-Hulman Scholar
Graduate Theses - Chemical Engineering Chemical Engineering
Spring 5-2019
Development and Analysis of a Methanol-to-Gasoline Reaction Setup for use in anUndergraduate SettingRyan Michael Beere
Follow this and additional works at: https://scholar.rose-hulman.edu/dept_chemical_engineering
This Thesis is brought to you for free and open access by the Chemical Engineering at Rose-Hulman Scholar. It has been accepted for inclusion inGraduate Theses - Chemical Engineering by an authorized administrator of Rose-Hulman Scholar. For more information, please contact [email protected].
Recommended CitationBeere, Ryan Michael, "Development and Analysis of a Methanol-to-Gasoline Reaction Setup for use in an Undergraduate Setting"(2019). Graduate Theses - Chemical Engineering. 1.https://scholar.rose-hulman.edu/dept_chemical_engineering/1
i
Development and Analysis of a Methanol-to-Gasoline Reaction Setup for use in an
Undergraduate Setting
A Thesis
Submitted to the Faculty
Of
Rose-Hulman Institute of Technology
By
Ryan Michael Beere
In Partial Fulfillment of the Requirements for the Degree
Of
Master of Science in Chemical Engineering
May 2019
© Ryan Michael Beere
ii
iii
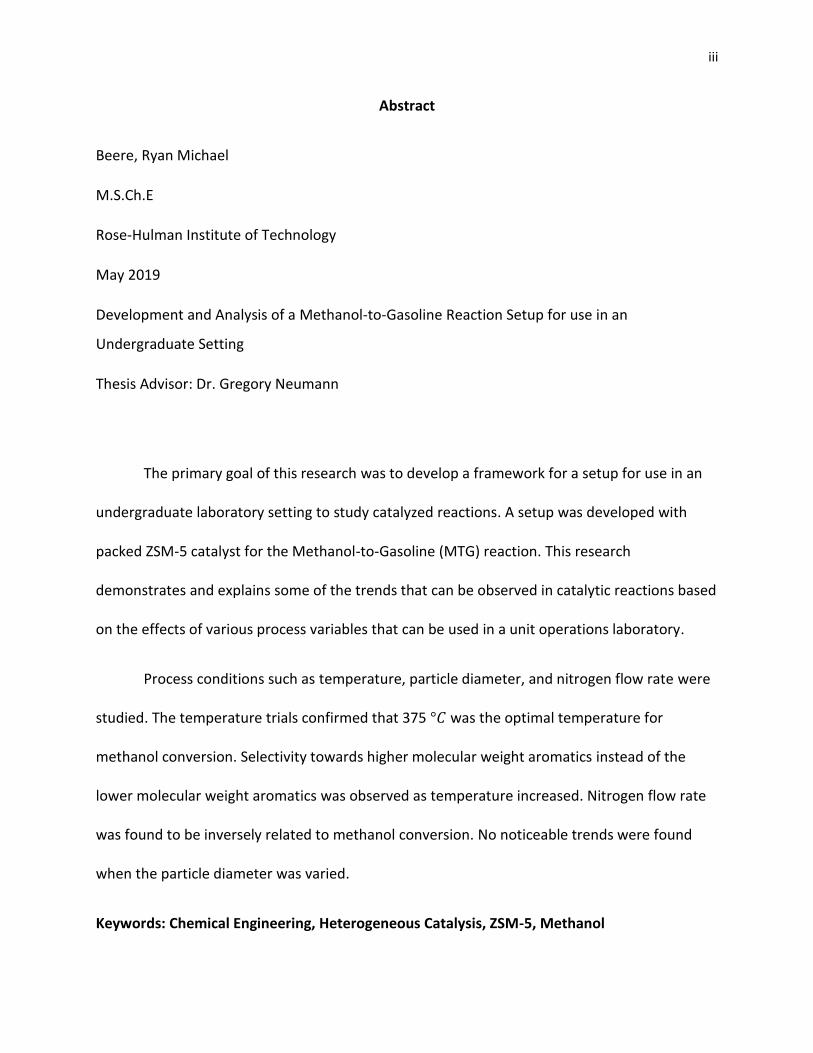
Abstract
Beere, Ryan Michael
M.S.Ch.E
Rose-Hulman Institute of Technology
May 2019
Development and Analysis of a Methanol-to-Gasoline Reaction Setup for use in an
Undergraduate Setting
Thesis Advisor: Dr. Gregory Neumann
The primary goal of this research was to develop a framework for a setup for use in an
undergraduate laboratory setting to study catalyzed reactions. A setup was developed with
packed ZSM-5 catalyst for the Methanol-to-Gasoline (MTG) reaction. This research
demonstrates and explains some of the trends that can be observed in catalytic reactions based
on the effects of various process variables that can be used in a unit operations laboratory.
Process conditions such as temperature, particle diameter, and nitrogen flow rate were
studied. The temperature trials confirmed that 375 °𝐶 was the optimal temperature for
methanol conversion. Selectivity towards higher molecular weight aromatics instead of the
lower molecular weight aromatics was observed as temperature increased. Nitrogen flow rate
was found to be inversely related to methanol conversion. No noticeable trends were found
when the particle diameter was varied.
Keywords: Chemical Engineering, Heterogeneous Catalysis, ZSM-5, Methanol

iv
Dedication
I’d like to dedicate this thesis to my parents who have both gone a long way in
supporting me and helping me to get through school. Without them, I could not have made it
this far.
v
Acknowledgements
I’d like to thank my advisor, Dr. Gregory Neumann, for his help and guidance in this project.
I’d like to thank all of my friends for helping me stay sane through everything and being there
when I needed them.
I would also like to thank Mr. Frank Cunning and Mr. Lou Johnson for all of their help in using
the equipment in the Rose-Hulman Chemical Engineering and Chemistry Departments.
vi
Table of Contents
List of Figures . . . . . . . . . . . . . . . . . . . . . . . . . . . . . . . . . . . . . . . . . . . . . . . . . . . . . . . . . . . . . . .vii
List of Tables . . . . . . . . . . . . . . . . . . . . . . . . . . . . . . . . . . . . . . . . . . . . . . . . . . . . . . . . . . . . . . . .ix
1. Introduction. . . . . . . . . . . . . . . . . . . . . . . . . . . . . . . . . . . . . . . . . . . . . . . . . . . . . . . . . . . . . 1
1.1 Liquid Fuels . . . . . . . . . . . . . . . . . . . . . . . . . . . . . . . . . . . . . . . . . . . . . . . . . . . . . . . 2
1.2 Catalysts. . . . . . . . . . . . . . . . . . . . . . . . . . . . . . . . . . . . . . . . . . . . . . . . . . . . . . . . . . 6
1.3 MTG Mechanism . . . . . . . . . . . . . . . . . . . . . . . . . . . . . . . . . . . . . . . . . . . . . . . . . . 11
2. Theory. . . . . . . . . . . . . . . . . . . . . . . . . . . . . . . . . . . . . . . . . . . . . . . . . . . . . . . . . . . . . . . . . 13
3. Experimental Setup and Procedures . . . . . . . . . . . . . . . . . . . . . . . . . . . . . . . . . . . . . . . . 20
4. Results and Discussion . . . . . . . . . . . . . . . . . . . . . . . . . . . . . . . . . . . . . . . . . . . . . . . . . . . 24
4.1 Calibration Curves. . . . . . . . . . . . . . . . . . . . . . . . . . . . . . . . . . . . . . . . . . . . . . . . . 24
4.2 Temperature . . . . . . . . . . . . . . . . . . . . . . . . . . . . . . . . . . . . . . . . . . . . . . . . . . . . . 29
4.3 Nitrogen Flow Rate . . . . . . . . . . . . . . . . . . . . . . . . . . . . . . . . . . . . . . . . . . . . . . . . 31
4.4 Particle Size . . . . . . . . . . . . . . . . . . . . . . . . . . . . . . . . . . . . . . . . . . . . . . . . . . . . . . 33
5. Educational Use . . . . . . . . . . . . . . . . . . . . . . . . . . . . . . . . . . . . . . . . . . . . . . . . . . . . . . . . .38
6. Conclusion . . . . . . . . . . . . . . . . . . . . . . . . . . . . . . . . . . . . . . . . . . . . . . . . . . . . . . . . . . . . . 41
7. References . . . . . . . . . . . . . . . . . . . . . . . . . . . . . . . . . . . . . . . . . . . . . . . . . . . . . . . . . . . . . 44
8. Appendix . . . . . . . . . . . . . . . . . . . . . . . . . . . . . . . . . . . . . . . . . . . . . . . . . . . . . . . . . . . . . . 47
vii
List of Figures
Figure 1-1. Conversion paths of carbon sources to liquid fuel. . . . . . . . . . . . . . . . . . . . . . . . . . . . 2
Figure 1-2. MTG process flow diagram from ExxonMobil . . . . . . . . . . . . . . . . . . . . . . . . . . . . . . . 6
Figure 1-3. Activation energy with and without a catalyst . . . . . . . . . . . . . . . . . . . . . . . . . . . . . . 7
Figure 1-4. Diagram of ZSM-5 layer showing the rings 10-membered rings. . . . . . . . . . . . . . . . .9
Figure 1-5. (a). 12-atom building block (b). Chain formed from building blocks . . . . . . . . . . . . .10
Figure 2-1. Velocity effects on reaction rate. Diffusion limited and reaction limited regimes . 16
Figure 2-2. Diffusion limited and reaction limited regimes for internal diffusion. . . . . . . . . . . .18
Figure 3-1. Temperature control method used for data analysis on the GC/MS . . . . . . . . . . . 22
Figure 3-2. General schematic of final process setup. . . . . . . . . . . . . . . . . . . . . . . . . . . . . . . . . . 23
Figure 3-3. Picture of final process setup . . . . . . . . . . . . . . . . . . . . . . . . . . . . . . . . . . . . . . . . . . . 23
Figure 4-1. Example chromatogram for data analysis. . . . . . . . . . . . . . . . . . . . . . . . . . . . . . . . . .24
Figure 4-2. Calibration curve for o-xylene. . . . . . . . . . . . . . . . . . . . . . . . . . . . . . . . . . . . . . . . . . . 25
Figure 4-3. Rate values for larger reactor setup . . . . . . . . . . . . . . . . . . . . . . . . . . . . . . . . . . . . . . 26
Figure 4-4. Aromatics summed peak areas vs. temperature. . . . . . . . . . . . . . . . . . . . . . . . . . . . 29
Figure 4-5. Peak area fractions vs. temperature for aromatics. . . . . . . . . . . . . . . . . . . . . . . . . . 31
Figure 4-6. Aromatics summed peak areas vs. nitrogen flow rate . . . . . . . . . . . . . . . . . . . . . . . .32
viii
Figure 4-7. Peak area fractions vs. nitrogen flow rate for aromatics. . . . . . . . . . . . . . . . . . . . . . 33
Figure 4-8. Aromatics summed peak areas vs. particle size . . . . . . . . . . . . . . . . . . . . . . . . . . . . 34
Figure 4-9. Comparison of ethanol trial to trial without ethanol addition. . . . . . . . . . . . . . . . . .36
Figure 8-1. Calibration curve for p-xylene. . . . . . . . . . . . . . . . . . . . . . . . . . . . . . . . . . . . . . . . . . . 47
Figure 8-2. Calibration curve for 𝑪𝟗 aromatics. . . . . . . . . . . . . . . . . . . . . . . . . . . . . . . . . . . . . . . 47
Figure 8-3. Calibration curve for 𝑪𝟏𝟎 aromatics . . . . . . . . . . . . . . . . . . . . . . . . . . . . . . . . . . . . . . 48
Figure 8-4. Calibration curve for 𝑪𝟏𝟏 aromatics. . . . . . . . . . . . . . . . . . . . . . . . . . . . . . . . . . . . . . 48
Figure 8-5. Calibration curve for 𝑪𝟏𝟐 aromatics. . . . . . . . . . . . . . . . . . . . . . . . . . . . . . . . . . . . . . 49
ix
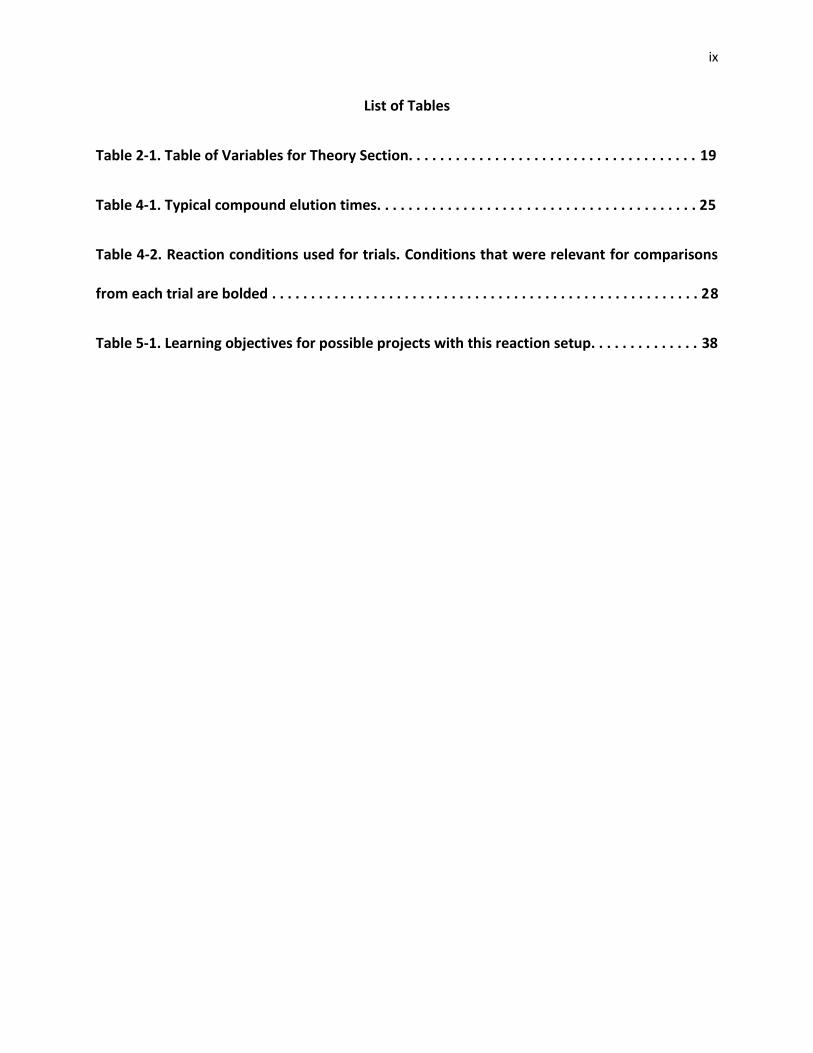
List of Tables
Table 2-1. Table of Variables for Theory Section. . . . . . . . . . . . . . . . . . . . . . . . . . . . . . . . . . . . . 19
Table 4-1. Typical compound elution times. . . . . . . . . . . . . . . . . . . . . . . . . . . . . . . . . . . . . . . . . 25
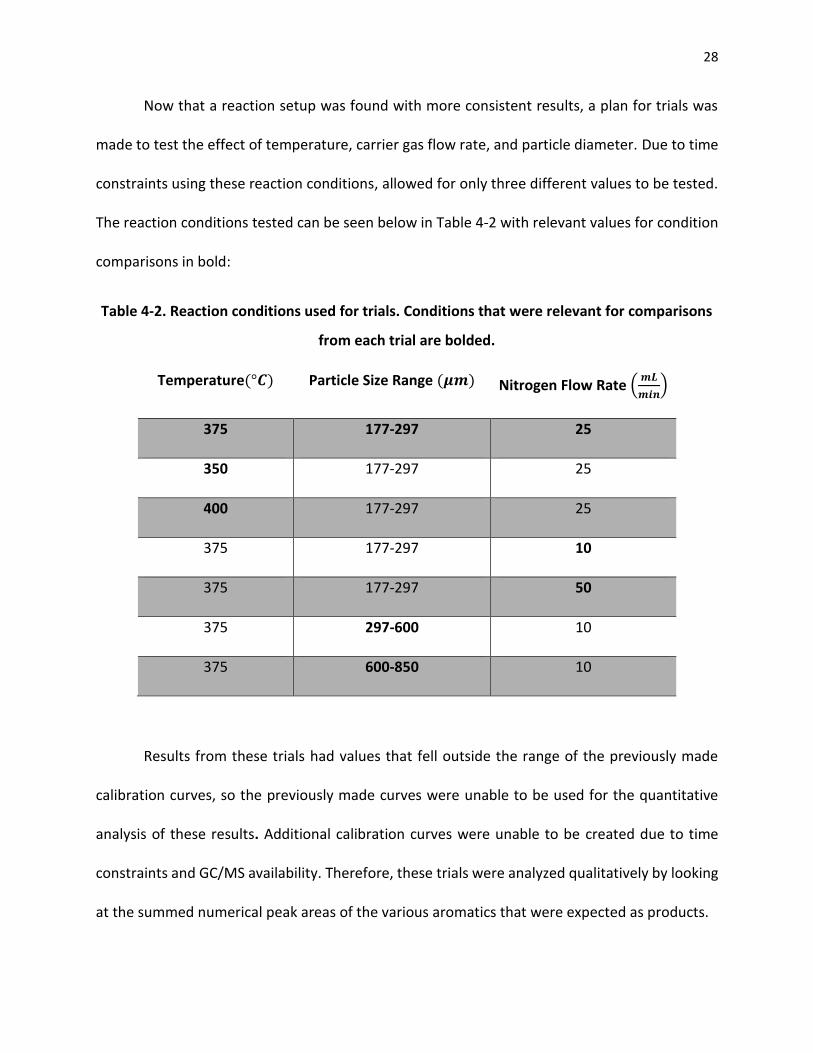
Table 4-2. Reaction conditions used for trials. Conditions that were relevant for comparisons
from each trial are bolded . . . . . . . . . . . . . . . . . . . . . . . . . . . . . . . . . . . . . . . . . . . . . . . . . . . . . . . 28
Table 5-1. Learning objectives for possible projects with this reaction setup. . . . . . . . . . . . . . 38
1
1. Introduction
World energy needs are constantly increasing, especially in developing areas. Energy
needs are closely tied to economic increases such that if GDP doubles energy consumption
increases by about 30% [1]. This is especially relevant in developing countries that need energy
due to the energy costs associated with residential and industrial development. The energy needs
of these areas have a large impact on the increasing needs of energy sources, such as liquid fuel.
Due to this, liquid fuels will continue to be needed in increasing amounts in the foreseeable
future [1]. Through the instruction of undergraduate engineering students, the relevancy of
learning can be reinforced by current events. Giving context to specific tasks can aid students in
the retention of the knowledge gained in the project.
A relevant liquid fuels reaction for the instructional purposes is the methanol to gasoline
(MTG) reaction which can be used to teach students about an industrial process in this area. This
allows students to follow the entire process from raw feed to consumer product which is rare in
small scale unit operations experiments. Through use of this reaction, instruction can include
some of the fundamental chemical engineering principles that are used in multiple industrial
applications such as kinetics, mass transfer, and reusability. Catalytic reactors are common within
the chemical industry and by way of this project, students will gain experience troubleshooting,
analyzing, and controlling relatively simple reaction with multiple instructive objectives. The
incorporation of products students use in their daily lives adds an element of motivation and
empowerment. In addition to the importance of the production of liquid fuels, the reactor setup
yields a wide variety of theoretical or empirical models that are encountered in chemical
engineering courses and can be used with this experiment. The ability to tie together theoretical
2
concepts learned in the curriculum with a physical experiment has the potential to show how
they work with an industrial application.
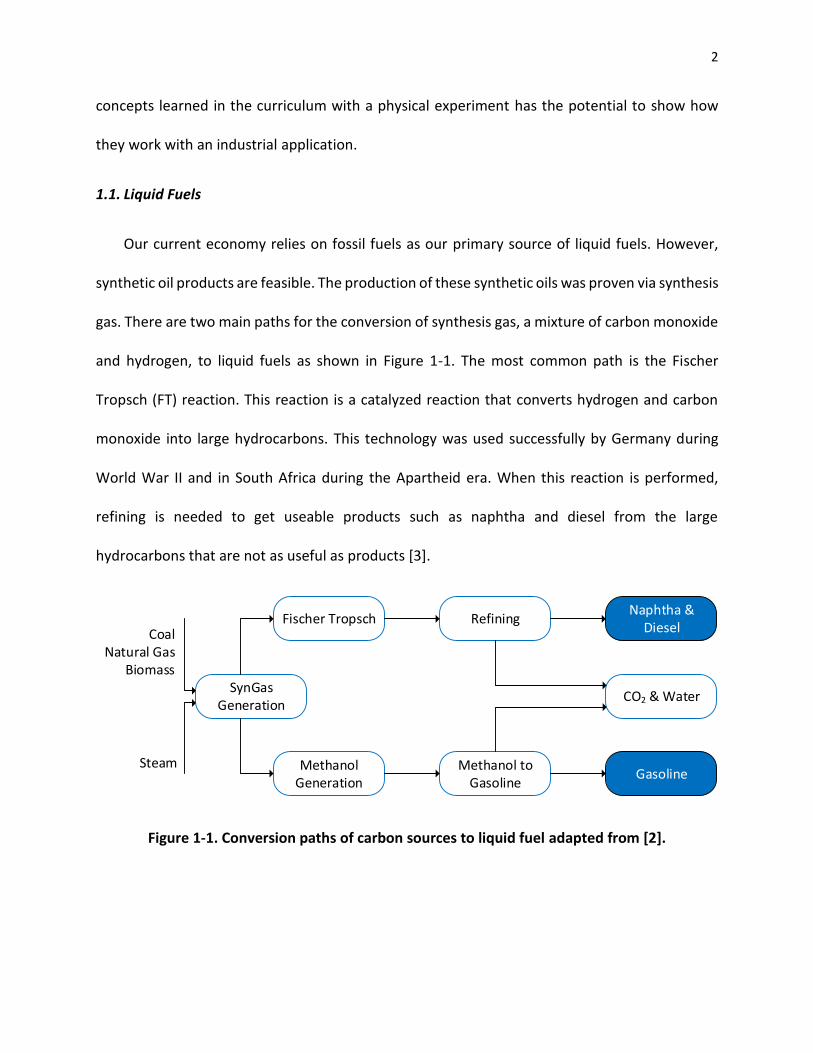
1.1. Liquid Fuels
Our current economy relies on fossil fuels as our primary source of liquid fuels. However,
synthetic oil products are feasible. The production of these synthetic oils was proven via synthesis
gas. There are two main paths for the conversion of synthesis gas, a mixture of carbon monoxide
and hydrogen, to liquid fuels as shown in Figure 1-1. The most common path is the Fischer
Tropsch (FT) reaction. This reaction is a catalyzed reaction that converts hydrogen and carbon
monoxide into large hydrocarbons. This technology was used successfully by Germany during
World War II and in South Africa during the Apartheid era. When this reaction is performed,
refining is needed to get useable products such as naphtha and diesel from the large
hydrocarbons that are not as useful as products [3].
Figure 1-1. Conversion paths of carbon sources to liquid fuel adapted from [2].
Fischer Tropsch Refining
SynGas Generation
Methanol Generation
Methanol to Gasoline
Naphtha & Diesel
Gasoline
CO2 & Water
CoalNatural Gas
Biomass
Steam
3
Refining is a process which accepts crude oil as the feed and, through a series of
separators and reactors, yields consumer products such as gasoline, diesel, heating oil, jet fuel,
chemical feedstocks, waxes, lubricating oils, and asphalt. Refining is accomplished in three basic
steps: separation, conversion, and treatment [4]. The separation step takes the crude oil and
processes it in distillation units where products are separated into components called fractions
by their boiling points. Heavy fractions, the gas oils, come out at the bottom and light fractions,
like gasoline, come out at the top. Liquids such as kerosene come out in the middle. In the second
step, conversion, some of the heavier fractions are converted into lighter more valuable products
such as gasoline. The most common way to do this is by catalytic cracking. This process uses heat,
pressure, and catalysts to crack large hydrocarbon molecules into smaller ones. In the final
treatment step, some of the streams are combined from different units to create gasoline with
proper octane levels and to meet other requirements such as vapor pressure and emission
standards [4].
The Fischer-Tropsch synthesis route has been demonstrated as a viable way to utilize
synthesis gas; however, due to the high energy consumption of the process and complex product
mixtures; it has been suggested this cannot be the technology of the future [5]. An alternative
method that has received considerable attention is the “Methanol Economy” [5]. In this analysis,
the authors describe the ability to convert abundant natural gas sources directly to methanol
which can take the place of traditional fuels such as gasoline, diesel, and natural gas. Although
the suggestion that methanol can be used as an energy storage medium, it will be difficult to
convert preexisting infrastructure over to solely a methanol economy. Therefore, the direct
4
conversion method to produce gasoline known as the methanol to gasoline process will be the
focus of this thesis.
Like the Fischer-Tropsch synthesis, the MTG reaction is also catalyzed, but converts
methanol to gasoline-range hydrocarbons, primarily in the 𝐶6 − 𝐶10 range. This process does not
require a refining process like the Fischer Tropsch process because the products that are formed
can already be used as gasoline [2]. The MTG process is a simple process which only requires
methanol as feedstock and a conventional fixed bed reactor making it easily scalable as well as
an excellent tool for instruction. There are many well-researched processes to generate
methanol that make this method an attractive option for gasoline production from a variety of
feedstock such as syngas, biomass, and water [7].
There are many sources of methanol that can be used for the MTG reaction. One of the
most common ways to produce methanol is through the conversion of syngas to methanol as
highlighted above. A traditional method for syngas production is from the steam reforming of
methane, but other avenues including from incomplete combustion of coal have been used.
Syngas is composed of carbon monoxide and hydrogen and can then be converted in a gas-phase
reaction at high pressure in a fixed bed reactor directly to methanol [8]. Biomass can also be used
to produce methanol. A process known as partial oxidation can convert the biomass into syngas
which can be converted directly to methanol in a gas-phase reaction within a fixed-bed reactor
as highlighted above. Electrical energy can also be used to convert water into hydrogen and
oxygen [7]. The hydrogen can then be reacted with carbon dioxide to form methanol. There are
a variety of methods for producing methanol suggesting that methanol can be an extremely
abundant resource for use in the MTG reaction.
5
Recently, focus on methanol production has been on the development of catalysts that
have a better yield of methanol. It has been found that copper-based catalysts are generally the
best and most popular for methanol synthesis due to its higher activity. Zinc and aluminum-based
catalysts have also been used for methanol synthesis [9].
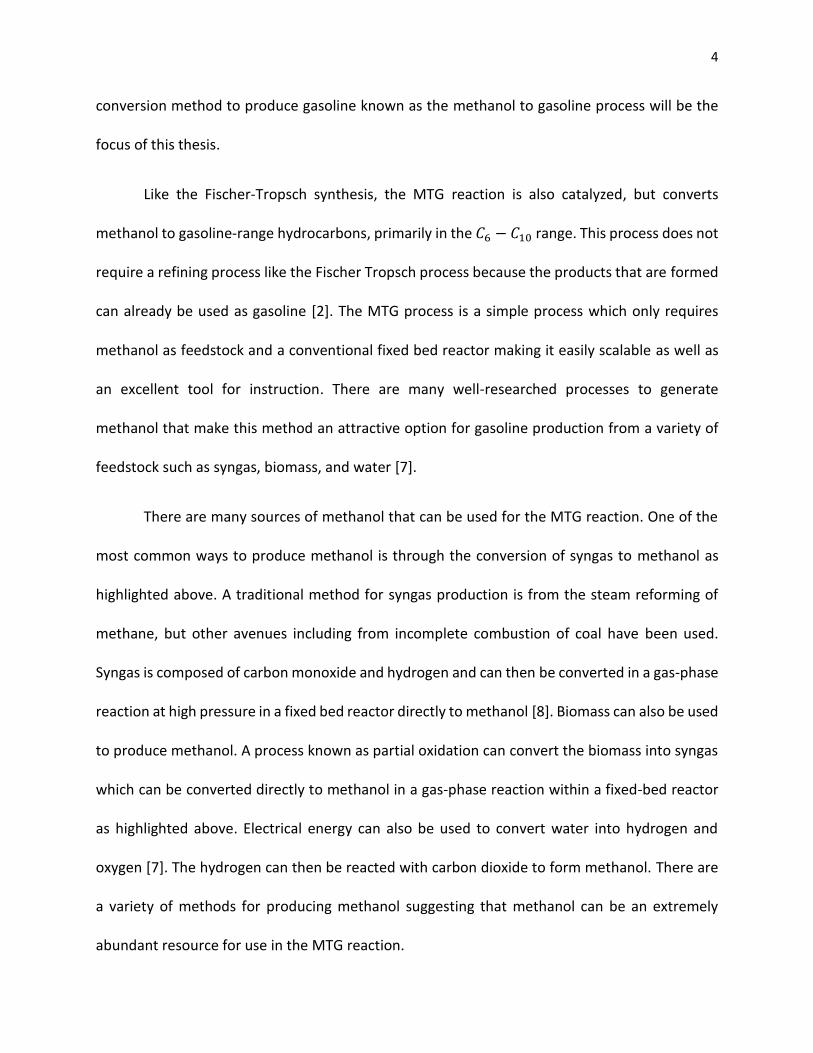
Illustrated in Figure 1-2 is a simple example of an MTG process by ExxonMobil. In this
example, methanol undergoes dehydration to form an equilibrium of dimethyl ether, methanol,
and water. This mix is then sent to the reactors where the MTG reaction converts the mix to
hydrocarbons in the gasoline range. This illustration contains three fixed bed reactors in parallel
that can be cycled out when the catalyst becomes deactivated. Post reactors, the water is
removed, and the gasoline is sent to recovery. This fixed bed process design is scalable up to
15,000 barrels of gasoline per day [2].
There are a variety of alternative fuel and energy sources with varying degrees of viability.
While they all have their merits and uses, they are not yet close to being able to replace the needs
for gasoline fully. These include some very high-level examples. Electric cars are becoming more
popular but still are very cost prohibitive even though they have begun to be commercialized.
Hydrogen fuel cell vehicles have been studied but still have many issues. One of the more
significant issues is that hydrogen has a low energy content per volume compared to gasoline
[10]. This means that hydrogen storage is a major issue in the commercialization of these types
of vehicles. Some vehicles use Flex Fuel which is gasoline mixed with up to 85% ethanol. This still
requires gasoline but is more renewable [11]. Despite the importance of investigating and
studying alternative sources of energy, these alternative fuels are a long way away from
6
completely replacing gasoline. Therefore, studying the route of direct gasoline synthesis from
methanol is relevant and appropriate for use in an undergraduate laboratory setting.
Figure 1-2. MTG process flow diagram from ExxonMobil [2].
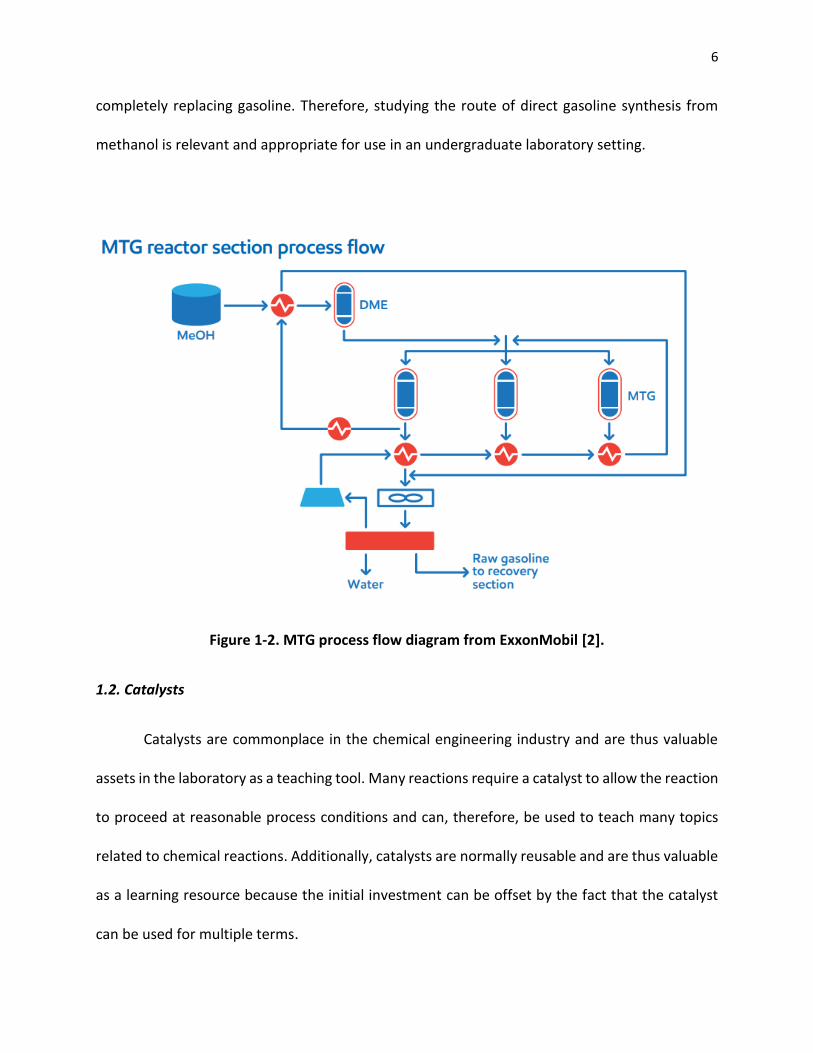
1.2. Catalysts
Catalysts are commonplace in the chemical engineering industry and are thus valuable
assets in the laboratory as a teaching tool. Many reactions require a catalyst to allow the reaction
to proceed at reasonable process conditions and can, therefore, be used to teach many topics
related to chemical reactions. Additionally, catalysts are normally reusable and are thus valuable
as a learning resource because the initial investment can be offset by the fact that the catalyst
can be used for multiple terms.
7
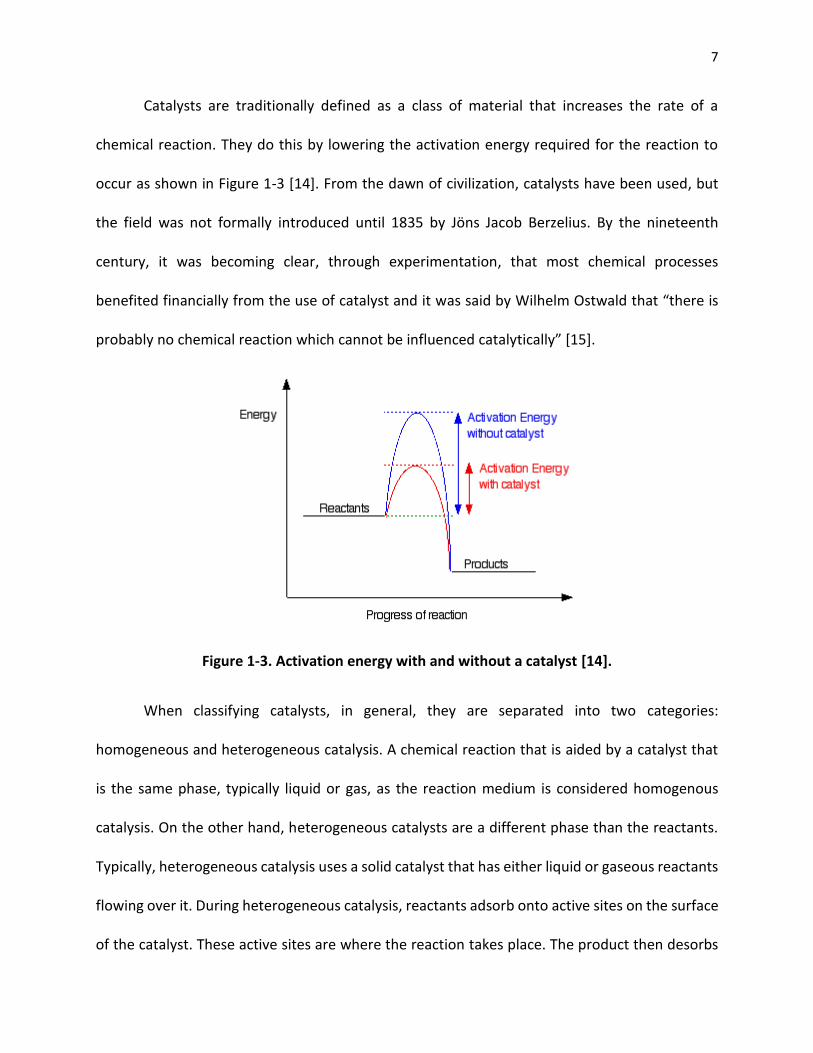
Catalysts are traditionally defined as a class of material that increases the rate of a
chemical reaction. They do this by lowering the activation energy required for the reaction to
occur as shown in Figure 1-3 [14]. From the dawn of civilization, catalysts have been used, but
the field was not formally introduced until 1835 by Jöns Jacob Berzelius. By the nineteenth
century, it was becoming clear, through experimentation, that most chemical processes
benefited financially from the use of catalyst and it was said by Wilhelm Ostwald that “there is
probably no chemical reaction which cannot be influenced catalytically” [15].
Figure 1-3. Activation energy with and without a catalyst [14].
When classifying catalysts, in general, they are separated into two categories:
homogeneous and heterogeneous catalysis. A chemical reaction that is aided by a catalyst that
is the same phase, typically liquid or gas, as the reaction medium is considered homogenous
catalysis. On the other hand, heterogeneous catalysts are a different phase than the reactants.
Typically, heterogeneous catalysis uses a solid catalyst that has either liquid or gaseous reactants
flowing over it. During heterogeneous catalysis, reactants adsorb onto active sites on the surface
of the catalyst. These active sites are where the reaction takes place. The product then desorbs
8
from the catalyst [16]. For the reaction studied in this paper, we use Zeolite Socony Mobil-5 (ZSM-
5) as a heterogeneous catalyst. An advantage of using a heterogeneous catalyst is that it can be
recovered and separated from the reactants/products without expensive separation techniques.
An additional benefit is that if the catalyst becomes deactivated, it can be easily removed and
regenerated for repeated use.
The most common reactor setup for heterogeneous catalysis is a fixed bed reactor. A fixed
bed reactor contains the packed catalyst in a tube or pipe and is normally used with gas phase
reactants that flow over the catalyst. Catalytic fixed bed reactors are used in many different
industrial processes for various types of reactions [17]. In large scale processes, multiple fixed
bed reactors can be used in parallel. This allows the deactivated catalyst to be changed out as
the reactor is taken offline.
The first observation of hydrocarbon formation from methanol is credited to Mattox in
1962. Olefins in the 𝐶2 − 𝐶5 range were formed during methanol dehydration over NaX zeolite
[18]. Similar results were found by others over a variety of catalysts. In 1974, Pearson was able
to obtain larger yields of hydrocarbons including some aromatics with methanol dehydration
over 𝑃2𝑂5 at higher temperatures [18]. In 1976, Mobil discovered a shape-selective catalyst that
allowed for conversion of methanol to gasoline with ZSM-5 [18].
The catalyst used in the MTG reaction is a ZSM-5 catalyst which has the repeating formula
of |𝑁𝑎𝑛+(𝐻2𝑂)16|[𝐴𝑙𝑛𝑆𝑖96−𝑛𝑂192] where n is less than 27 [19]. ZSM-5 is an acidic catalyst and
thus can be continuously used in acid catalyzed reactions and is primarily utilized by the
petroleum industry for cracking large hydrocarbons. ZSM-5 is an aluminosilicate material giving
9
it highly acidic properties. Aluminum ions (𝐴𝑙3+) replace silicon ions (𝑆𝑖4+) in the lattice
framework resulting in a proton (𝐻+) being needed to keep the material charge neutral. As a
result, the Brønsted acidity of the catalyst is directly proportional to aluminum content [20].
In addition to the properties ZSM-5 has as an aluminosilicate material, it also has
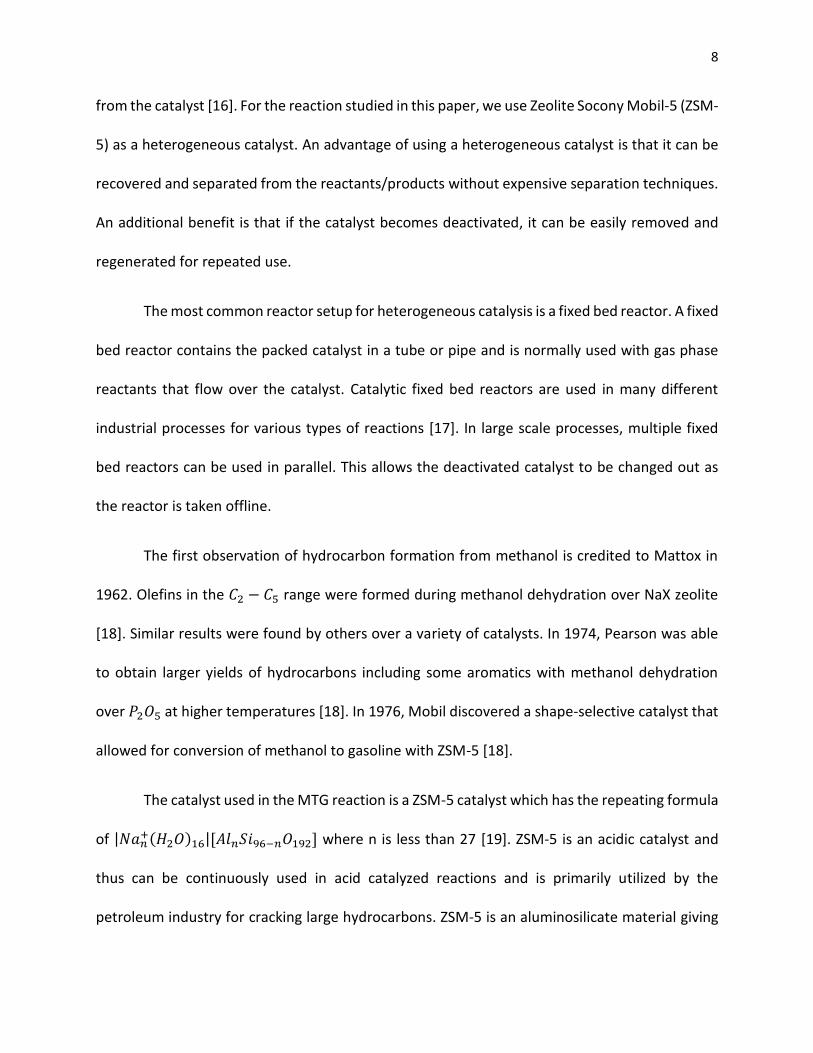
properties related to its physical structure. ZSM-5 is a zeolite that is defined by 10-membered
rings as shown in Figure 1-4, and the channel size of these rings dictates the size of compounds
that can traverse through the catalyst. The channel dimensions of the catalyst are approximately
5.4 X 5.6 Å, which limits larger compounds sterically. However, compounds in the gasoline range
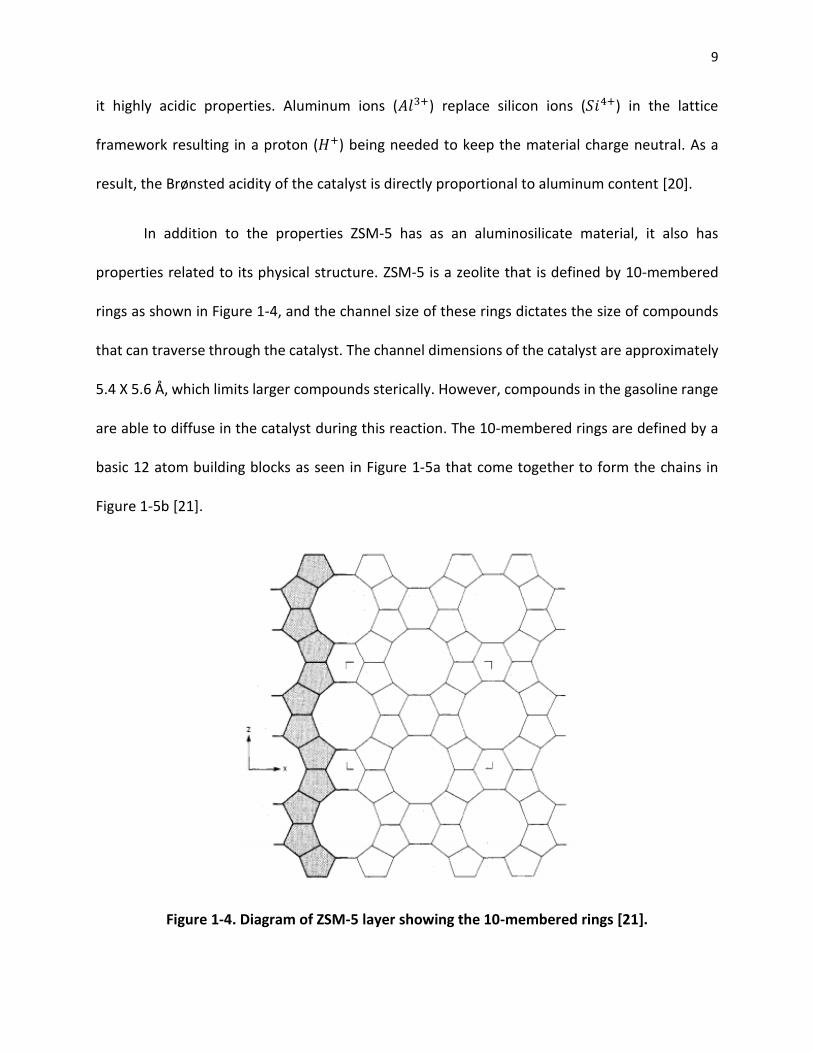
are able to diffuse in the catalyst during this reaction. The 10-membered rings are defined by a
basic 12 atom building blocks as seen in Figure 1-5a that come together to form the chains in
Figure 1-5b [21].
Figure 1-4. Diagram of ZSM-5 layer showing the 10-membered rings [21].
10
Figure 1-5. (a). 12-atom building block (b). Chain formed from building blocks [21].
In addition to speeding up the rate of reaction at a given temperature, catalysts can also
sometimes take on a secondary role. They can help to control the slate of products in certain
reactions. In the MTG reaction, ZSM-5 does this because the channel size and shape limit certain
larger compounds, 𝐶11 aromatics and larger, from moving through the catalyst [21].
The primary goal of this research is to develop a framework for a setup that could be used
with this reaction to study catalyzed reactions in an undergraduate laboratory setting. Because
the Unit Operations Laboratory at Rose-Hulman Institute of Technology does not currently have
a catalytic reactor available for undergraduate experimentation, there is a unique opportunity to
introduce this project. There is a strong need to instruct students with industrially relevant
equipment and projects. The introduction of heterogeneous catalysis will give students an
opportunity to experimental with fundamental concepts such as kinetics, heat transfer, mass
transfer all which learning how catalysts behave during operation. This will prepare them for
experiences outside of academia.
11
1.3. MTG Mechanism
The MTG reaction is initiated by the formation of a “hydrocarbon pool” in the catalyst.
The “hydrocarbon pool” consists of compounds that form inside the catalyst channels such as
cyclic carbenium ions. These compounds undergo methylation and olefin elimination and act as
reaction centers to form the desired products. Without this “hydrocarbon pool,” the MTG
reaction will not occur. It is believed that impurities in the methanol feed, the carrier gas, and
incomplete combustion on the catalyst leave enough organics in order to form the pool. The
required formation of these pools means that there is an observed kinetic induction period
during which the reaction proceeds very slowly or not all [22].
In addition to a “hydrocarbon pool,” methanol also has to undergo a dehydration reaction
to form an equilibrium of methanol, dimethyl ether, and water. The methanol and dimethyl ether
react with the reaction centers of the pool to form light olefins, like ethylene and propylene.
Paraffins, aromatics, and heavier olefins are then formed. These reaction steps result in a product
slate ranging from ethylene to polymethylbenzenes. As the reaction progresses and bigger
compounds form, their mobility through the catalyst channels decreases with increasing
diameter. Once the compounds get to the size of pentamethylbenzene, they start to become
incapable of moving through the catalyst. This leads to deactivation and coking on the catalyst as
the molecules fill up the active sites [23].
The pore size of the catalyst also plays a role in the shape selectivity of certain compounds
of similar or equal molecular weights. For instance, para-xylene and ortho-xylene are both the
exact same molecular weight, but the structure of p-xylene allows it to traverse through the
12
catalyst channels easier than o-xylene. Looking down the axis of the methyl groups on p-xylene
shows that it has a smaller effective diameter when traversing through the channel than o-
xylene. This type of shape selectivity occurs for all aromatics in the 𝐶8 − 𝐶10 range [21].
Catalyzed reactions are a significant part of many chemical engineering industries, such
as the petroleum, pharmaceutical, and specialty chemical industries. Another goal in this
research is to show and explain some of the trends that can be observed in catalytic reactions
based on the effects of various process variables. Additionally, after the initial setup has been
developed, possible improvements that could be made if more resources were available should
be recommended.
13
2. Theory
In a fixed catalyst bed, there are multiple terms that need to be defined and calculated in
order to fully define and analyze the reaction. In a packed bed reactor, the reactions occur on the
surface of the catalyst. Therefore, instead of normalizing on the reactor volume, the catalyst mass
is used for the reaction rate. This is shown in Equation 1 where 𝑊 is catalyst weight [24].
−𝑟𝐴′ =
𝑚𝑜𝑙 𝑜𝑓 𝐴′ ′𝑟𝑒𝑎𝑐𝑡𝑒𝑑
𝑡𝑖𝑚𝑒 ∗ 𝑊 (1)
Conducting a mole balance over the differential catalyst bed yields Equation 2 [24].
𝑑𝐹𝐴
𝑑𝑊= 𝑟𝐴
′ (2)
Substituting the definitions of fractional conversion into Equation 2, yields Equation 3 [24].
𝐹𝐴0 (𝑑𝑋
𝑑𝑊) = −𝑟𝐴
′ (3)
One important term when analyzing a fixed catalyst bed is weighted hourly space velocity
(WHSV), defined as the weight of feed flowing through the reactor per unit weight of the catalyst
per hour. In a fixed bed, the weight of the catalyst in the reactor is a constant (coking does not
affect catalyst weight as it is not part of the catalyst); therefore, the only variable that changes
and affects WHSV is the flow rate of feed. In this study, both methanol and nitrogen are flowing
into the reactor. Methanol is the feed, and nitrogen is simply a carrier gas, so the nitrogen flow
rate has no impact on WHSV. WHSV can be defined using Equation 4 [24]:
𝑊𝐻𝑆𝑉 =𝐹𝐴
𝑊 (4)
14
In a fixed bed, flow across the bed creates a pressure drop, which is extremely relevant
when conducting the analysis of the experiments. For an ideal gas, the concentration of a species
is defined in Equation 5 where Θ𝑖 =𝐹𝑖0
𝐹𝐴0 [24].
𝐶𝑖 = 𝐶𝐴0 (Θ𝑖 + 𝑣𝑖𝑋
1 + 𝑦𝐴0𝛿𝑋)
𝑃
𝑃0
𝑇0
𝑇 (5)
For gas phase reactions Equation 5 yields Equation 6 [24].
𝐶𝐴 =𝐶𝐴0(1 − 𝑋)
1 + 𝑦𝐴0𝛿𝑋
𝑃
𝑃0
𝑇0
𝑇 (6)
An example rate law is shown in Equation 7 [24].
−𝑟𝐴′ = 𝑘𝐶𝐴
𝑛 (7)
The rate law can then be written as Equation 8 when Equation 6 is substituted into Equation 7
[24].
−𝑟𝐴′ = 𝑘 (
𝐶𝐴0(1 − 𝑋)
1 + 𝑦𝐴0𝛿𝑋
𝑃
𝑃0
𝑇0
𝑇)
𝑛
(8)
From Equation 8, one can see that the larger the pressure drop across a bed, the smaller the
reaction rate will be as this reduces 𝑃
𝑃0 [24].
In order to model the pressure drop across a bed, the Ergun equation as shown in
Equation 9 can be used [24]:
Δ𝑃
𝐿=
150 ∗ 𝜇 ∗ (1 − 𝜖)2 ∗ 𝑣0
𝜖3𝑑𝑝2
+1.75 ∗ (1 − 𝜖) ∗ 𝜌 ∗ 𝑣0
2
𝜖3 ∗ 𝑑𝑝 (9)
15
where Δ𝑃 is the pressure drop across the bed, L is the length of the bed, 𝜇 is the viscosity of the
fluid, 𝜖 is the void space in the bed, 𝑣0 is the superficial fluid velocity, 𝑑𝑝 is the particle diameter,
and 𝜌 is the density of the fluid. Equation 3 shows a few important things that are relevant to our
experiment. As particle size increases, the pressure drop across the bed decreases. Additionally,
as fluid velocity increases, the pressure drop across the bed increases. These two statements are
important in determining the conditions with which we were able to run experiments [24].
In order for a reaction to happen, diffusion of the reactant from the bulk to the surface
must occur. This rate of diffusion is defined in Equations 10 and 11 [24]. In these equations, 𝑘𝑐 is
the mass transfer coefficient. It is a function of particle diameter and fluid velocity [24].
𝑟𝑎𝑡𝑒 = 𝑘𝑐(𝐶𝐴𝑏 − 𝐶𝐴𝑠) (10)
𝑘𝐶 =𝐷𝐴𝐵
𝑏𝑜𝑢𝑛𝑑𝑎𝑟𝑦 𝑙𝑎𝑦𝑒𝑟 𝑡ℎ𝑖𝑐𝑘𝑛𝑒𝑠𝑠 (11)
The boundary layer thickness is defined as the distance between the solid and the point
where the concentration of reactant is 99% of the bulk [24]. At low velocities, the boundary layer
is thicker, and it takes longer for 𝐴 to get to the surface. At high velocities, the boundary layer
becomes very thin and offers little resistance to mass transfer. Particle size has the reverse effect
[24]. As fluid velocity increases or particle size decreases, 𝑘𝑐 increases until it reaches a plateau
where 𝐶𝐴𝑏 ≈ 𝐶𝐴𝑠.As a result of this, the velocity of the fluid influences the rate of the reaction.
Depending on the velocity at which the fluid flows, the reaction rate can end up in one of two
regimes, diffusion-limited and reaction-limited. The diffusion limited regime occurs when the
flow rate is slow enough that reaction happens faster than the external diffusion of the reactant
into the catalyst [24]. Therefore, the reaction entering the catalyst is the step that limits the
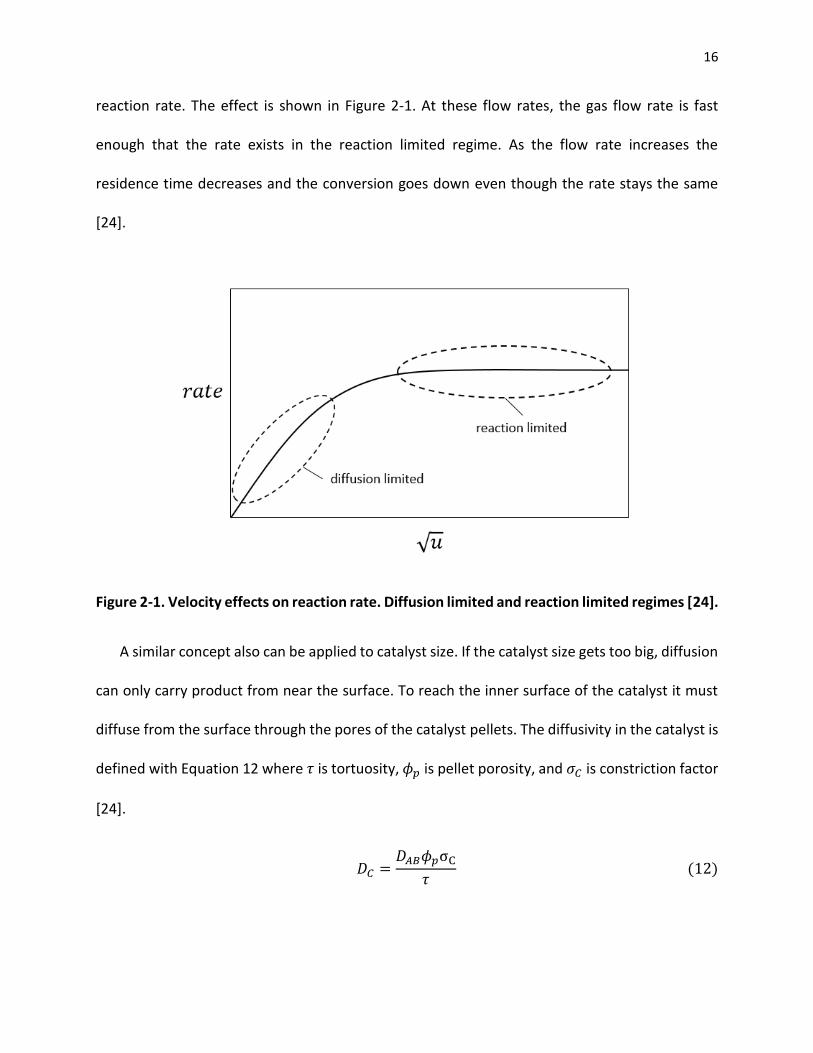
16
reaction rate. The effect is shown in Figure 2-1. At these flow rates, the gas flow rate is fast
enough that the rate exists in the reaction limited regime. As the flow rate increases the
residence time decreases and the conversion goes down even though the rate stays the same
[24].
Figure 2-1. Velocity effects on reaction rate. Diffusion limited and reaction limited regimes [24].
A similar concept also can be applied to catalyst size. If the catalyst size gets too big, diffusion
can only carry product from near the surface. To reach the inner surface of the catalyst it must
diffuse from the surface through the pores of the catalyst pellets. The diffusivity in the catalyst is
defined with Equation 12 where 𝜏 is tortuosity, 𝜙𝑝 is pellet porosity, and 𝜎𝐶 is constriction factor
[24].
𝐷𝐶 =𝐷𝐴𝐵𝜙𝑝σC
𝜏 (12)
17
With the introduction of some dimensionless variables in Equations 13 and 14, we can develop
the Thiele modulus. For these equations, it is assumed that 𝐶𝐴𝑠 is the concentration of 𝐴 at the
surface of the catalyst and that the catalyst is spherical with radius, 𝑅 [24].
Ψ =𝐶𝐴
𝐶𝐴𝑠 (13)
𝜆 =𝑟
𝑅 (14)
Applying boundary conditions and using the molar differential equation we get Equation 15. The
boundary conditions used are 𝐶𝐴 = 𝐶𝐴𝑠 at 𝑟 = 𝑅, and 𝐶𝐴 is finite at 𝑟 = 0 [24].
𝑊𝐴𝑧 = −𝐷𝐶
𝑑𝐶𝐴
𝑑𝑟 (15)
Using chain rule and differentiating equations 13 and 14, we can get Equation 16 [24].
𝑑𝐶𝐴
𝑑𝑟=
𝑑Ψ
𝑑𝜆
𝐶𝐴𝑠
𝑅 (16)
Differentiating and substituting, we can finally get to Equation 17 [24].
𝑑2Ψ
𝑑𝜆2+
2
𝜆 (
𝑑Ψ
𝑑𝜆) − Φ𝑛
2Ψ2 = 0 (17)
Where
𝚽𝑛2 =
𝑘𝑛𝑅2𝐶𝐴𝑠𝑛−1
𝐷𝐶 (18)
The Thiele modulus in Equation 17 and 18 is equal to Φ𝑛 and is equal to the surface reaction rate
over the diffusion rate. As the Thiele modulus gets bigger, the reaction rate goes down due to
18
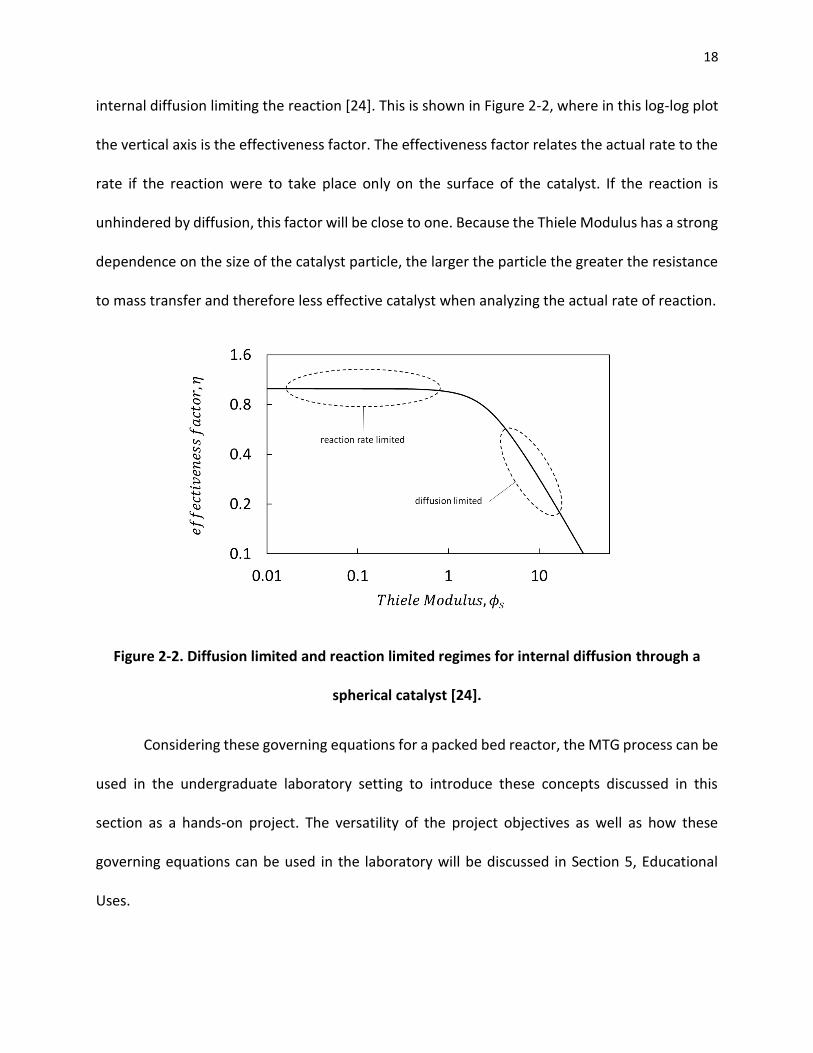
internal diffusion limiting the reaction [24]. This is shown in Figure 2-2, where in this log-log plot
the vertical axis is the effectiveness factor. The effectiveness factor relates the actual rate to the
rate if the reaction were to take place only on the surface of the catalyst. If the reaction is
unhindered by diffusion, this factor will be close to one. Because the Thiele Modulus has a strong
dependence on the size of the catalyst particle, the larger the particle the greater the resistance
to mass transfer and therefore less effective catalyst when analyzing the actual rate of reaction.
Figure 2-2. Diffusion limited and reaction limited regimes for internal diffusion through a
spherical catalyst [24].
Considering these governing equations for a packed bed reactor, the MTG process can be
used in the undergraduate laboratory setting to introduce these concepts discussed in this
section as a hands-on project. The versatility of the project objectives as well as how these
governing equations can be used in the laboratory will be discussed in Section 5, Educational
Uses.
19
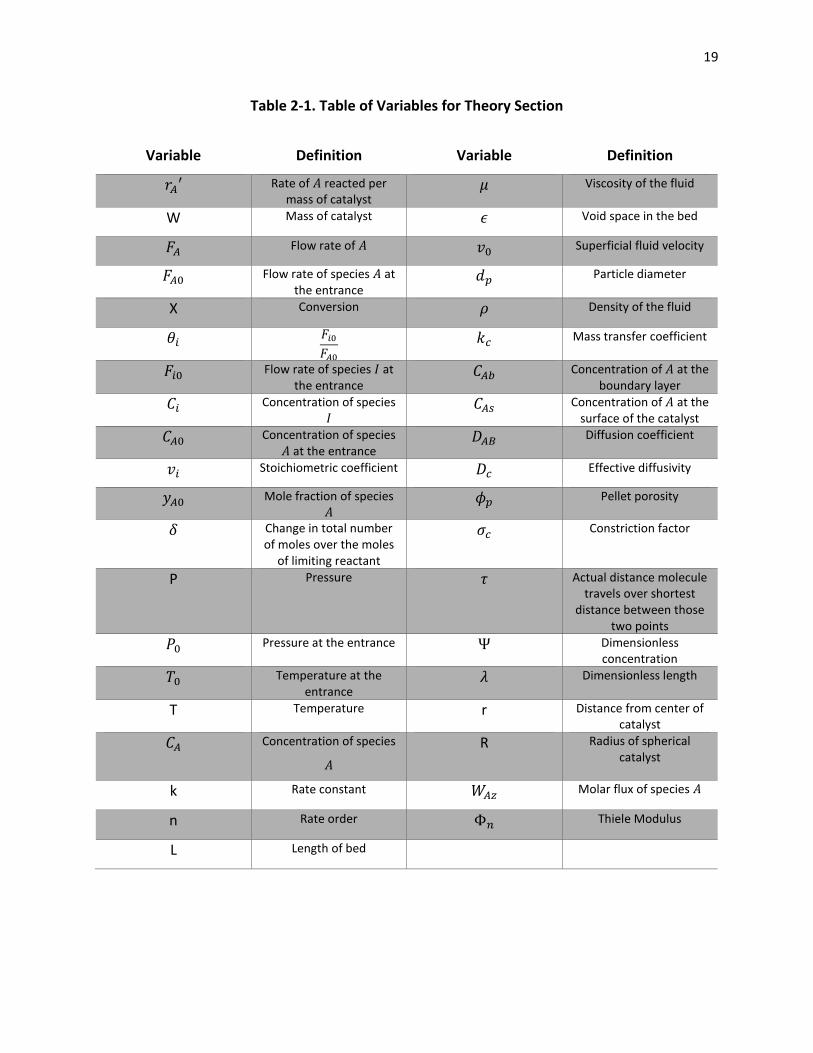
Table 2-1. Table of Variables for Theory Section
Variable Definition Variable Definition
𝑟𝐴′ Rate of 𝐴 reacted per mass of catalyst
𝜇 Viscosity of the fluid
W Mass of catalyst 𝜖 Void space in the bed
𝐹𝐴 Flow rate of 𝐴 𝑣0 Superficial fluid velocity
𝐹𝐴0 Flow rate of species 𝐴 at the entrance
𝑑𝑝 Particle diameter
X Conversion 𝜌 Density of the fluid
𝜃𝑖 𝐹𝑖0
𝐹𝐴0
𝑘𝑐 Mass transfer coefficient
𝐹𝑖0 Flow rate of species 𝐼 at the entrance
𝐶𝐴𝑏 Concentration of 𝐴 at the boundary layer
𝐶𝑖 Concentration of species 𝐼
𝐶𝐴𝑠 Concentration of 𝐴 at the surface of the catalyst
𝐶𝐴0 Concentration of species 𝐴 at the entrance
𝐷𝐴𝐵 Diffusion coefficient
𝑣𝑖 Stoichiometric coefficient 𝐷𝑐 Effective diffusivity
𝑦𝐴0 Mole fraction of species 𝐴
𝜙𝑝 Pellet porosity
𝛿 Change in total number of moles over the moles
of limiting reactant
𝜎𝑐 Constriction factor
P Pressure 𝜏 Actual distance molecule travels over shortest
distance between those two points
𝑃0 Pressure at the entrance Ψ Dimensionless concentration
𝑇0 Temperature at the entrance
𝜆 Dimensionless length
T Temperature r Distance from center of catalyst
𝐶𝐴 Concentration of species
𝐴
R Radius of spherical catalyst
k Rate constant 𝑊𝐴𝑧 Molar flux of species 𝐴
n Rate order Φ𝑛 Thiele Modulus
L Length of bed
20
3. Materials, Experimental Setup, and Procedures
A similar experimental setup and procedure were followed for all MTG reaction trials
and was adjusted as needed throughout the course of the experiment. Nitrogen gas was used
as the carrier gas for the reaction and a compressed 𝑁2 tank fed 𝑁2 gas through a gas
flowmeter in order to control the carrier gas flow rate. As trials progressed, it was determined
that the minimum flow rate achievable by this flowmeter (approximately 0.3-0.4 L/min
minimum) was higher than what was needed in the trials. A rotameter was then added to the
setup in order to allow for lower 𝑁2 gas flow rates (approximately 10 mL/min minimum) in the
trials.
Methanol was the only reactant fed to the reactor in this setup. Originally, methanol
was fed to the reactor using a water bath to heat the methanol and send the vapors through
the reactor. This method of feeding methanol to the reactor was quickly dropped in favor of
using a syringe pump to feed liquid methanol. This switch allowed the amount of methanol fed
to the reactor to be more easily and accurately controlled.
The methanol and the 𝑁2 carrier gas met at a “tee” before being fed to the reactor.
Early on, a 1-inch diameter tube was used for the reactor. This was packed with catalyst
surrounding a temperature probe. The methanol contacted the catalyst inside the tubing and
was kept at the temperature inside a furnace. A temperature probe was used to monitor and
control this temperature. A switch was made to a smaller 0.25-inch diameter tube in order to
potentially see better results. The smaller tube meant the temperature probe had to rest
outside the tubing. This may have been less accurate as a result.
21
In the original setup with the larger tubing, the catalyst was packed in the reactor as full
uncrushed, pelletized particles with a 2 mm diameter and 2-10 mm of length. When the switch
was made to the smaller tubing, the catalyst was crushed to smaller sizes between 177 and 850
𝜇𝑚, allowing particle size to be varied from trial to trial. In all trials with the smaller tubing,
catalyst mass charged in the reactor was kept constant at 2.00 grams.
Pelletized ZSM-5 catalyst with a 𝑆𝑖𝑂2/𝐴𝑙2𝑂3 ratio of 38 was crushed using a mortar and
pestle, then sieved to the appropriate size using trays from the Rose-Hulman Chemical
Engineering Laboratories. After 2.00 grams of the appropriate catalyst was sieved and weighed,
it was funneled into the reactor tubing and held in place with quartz wool on either side of the
catalyst. With smaller reactor tubing, packing the catalyst was difficult. Best results were found
when the catalyst was slowly funneled into the tubing after quartz wool had been placed on
one side. Quartz wool on either side was placed by curling it into a cylindrical shape and
twisting it into the tubing.
After the gases left the reactor, they were fed into a flask that was submerged in an ice
bath in order to condense the remaining methanol as well as any liquid products. This liquid
was then analyzed using the GC/MS in the Rose-Hulman Chemistry Department. A Shimadzu
GC-2010 Gas Chromatograph connected to a Shimadzu GCMS-QP2010S Gas Chromatograph
Mass Spectrometer was used. The column was an Elite-5MS PerkinElmer column with a 1,4-
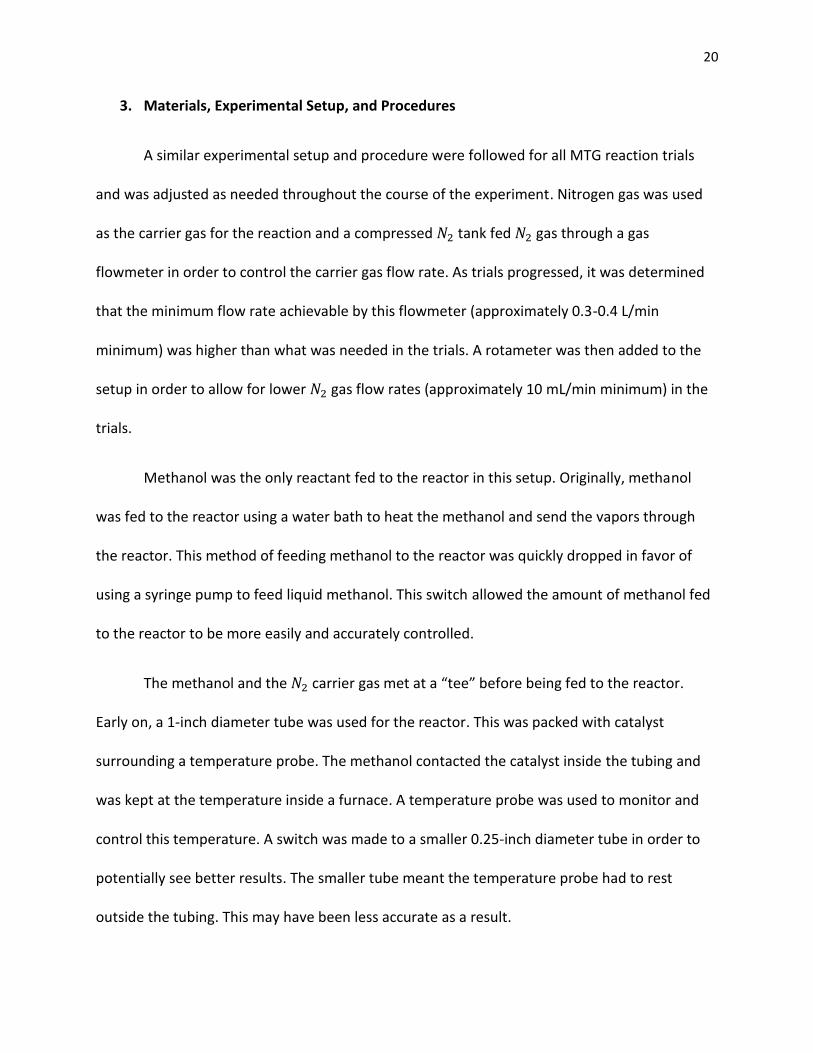
bis(dimethylsiloxy)phenylene dimethyl polysiloxane phase. The GC/MS temperature method
that was used started at a temperature of 55 °𝐶, then was held for 5 minutes. It then ramped to
260 °𝐶 at a rate of 15 °𝐶
𝑚𝑖𝑛𝑢𝑡𝑒, and then was held at 260 °𝐶 for 6 minutes, as seen in Figure 3-1.
22
Figure 3-1. Temperature control method used for data analysis on the GC/MS.
Any non-condensed gases that were still carried by the 𝑁2 carrier gas, were vented to
the hood above the reactor and unfortunately unable to be analyzed with the available
resources. Future students could analyze these gases by condensing them with dry ice or by
direct analysis of the gases with an analytical system integrated directly into the setup.
During reaction trials, 99% assay methanol was always pumped at 0.05 𝑚𝐿
𝑚𝑖𝑛𝑢𝑡𝑒 for 100
minutes at the beginning of each trial. After this, the flask was changed out so that the sample
collected at the end for analysis would contain liquid that was collected entirely while the
reaction was at steady state. Testing determined that 100 minutes was more than sufficient
time for the reaction to reach steady state. A full schematic and picture of the setup is shown in
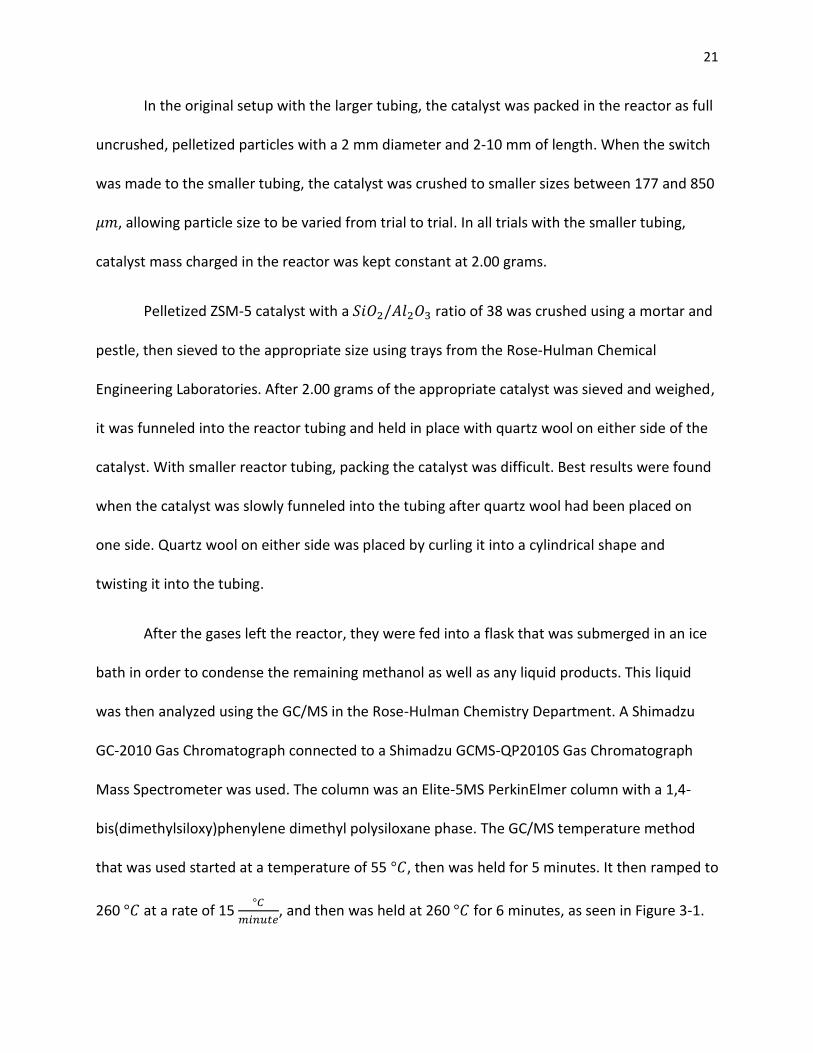
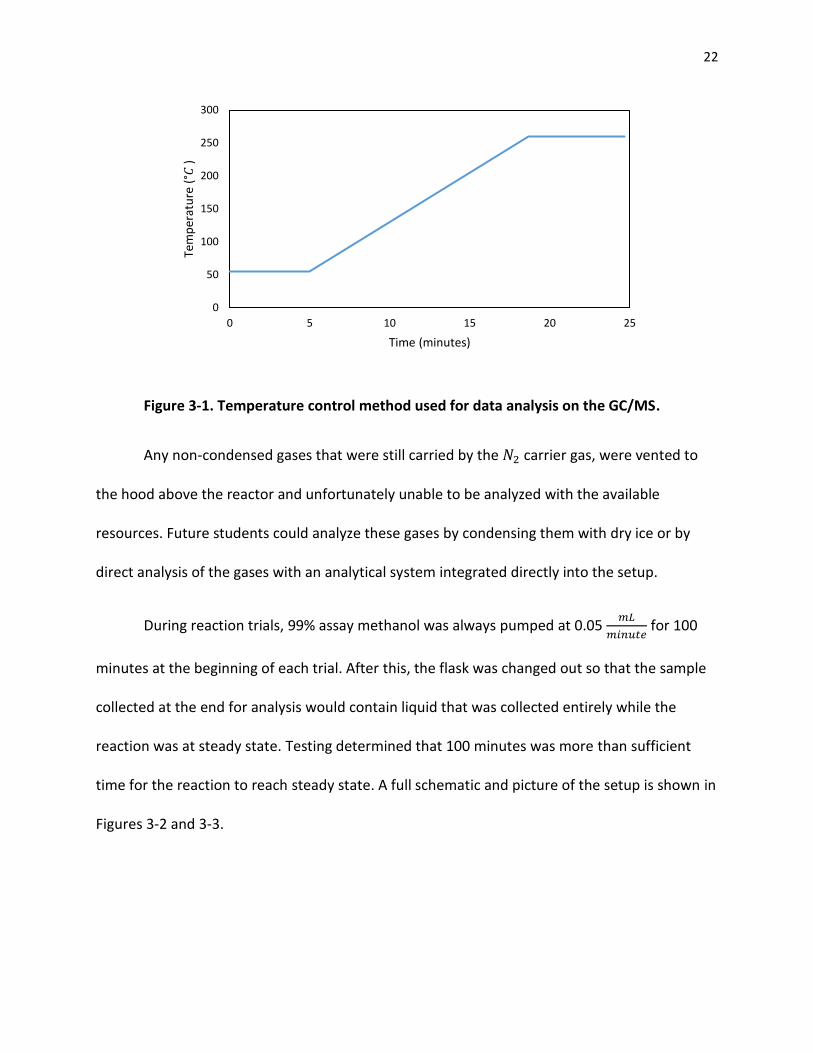
Figures 3-2 and 3-3.
0
50
100
150
200
250
300
0 5 10 15 20 25
Tem
per
atu
re (
°𝐶)
Time (minutes)
23
Reactor
Nitrogen
Syringe Pump-Methanol
FurnaceIce Bath-Product
Collection
Vent to HoodRotameter
Figure 3-2. General schematic of the final process setup.
Figure 3-3. Picture of final process setup.
24
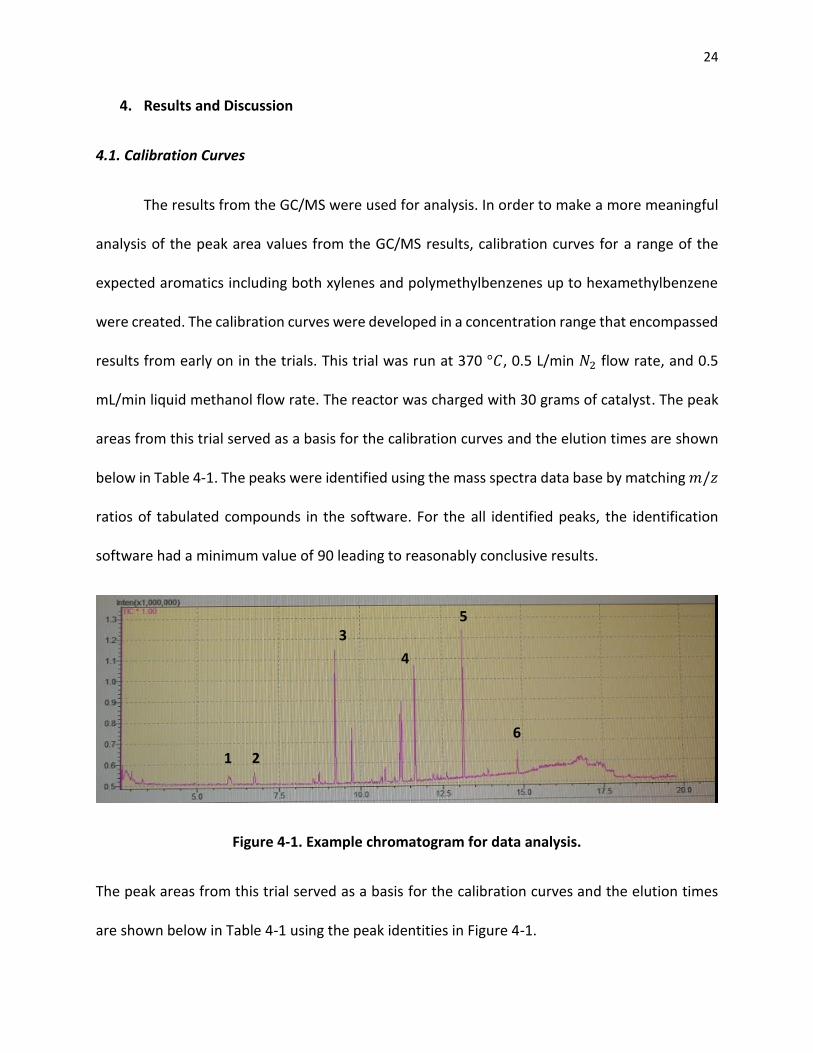
4. Results and Discussion
4.1. Calibration Curves
The results from the GC/MS were used for analysis. In order to make a more meaningful
analysis of the peak area values from the GC/MS results, calibration curves for a range of the
expected aromatics including both xylenes and polymethylbenzenes up to hexamethylbenzene
were created. The calibration curves were developed in a concentration range that encompassed
results from early on in the trials. This trial was run at 370 °𝐶, 0.5 L/min 𝑁2 flow rate, and 0.5
mL/min liquid methanol flow rate. The reactor was charged with 30 grams of catalyst. The peak
areas from this trial served as a basis for the calibration curves and the elution times are shown
below in Table 4-1. The peaks were identified using the mass spectra data base by matching 𝑚/𝑧
ratios of tabulated compounds in the software. For the all identified peaks, the identification
software had a minimum value of 90 leading to reasonably conclusive results.
Figure 4-1. Example chromatogram for data analysis.
The peak areas from this trial served as a basis for the calibration curves and the elution times
are shown below in Table 4-1 using the peak identities in Figure 4-1.
1 2
3
4
5
6
25
Table 4-1. Typical compound elution times.
Peak # Compound Peak Elution Time (min)
1 o-xylene 6
2 p-xylene 7
3 C9 aromatics 8.5-9.5
4 C10 aromatics 11-12
5 C11 aromatics 13
6 C12 aromatics 15
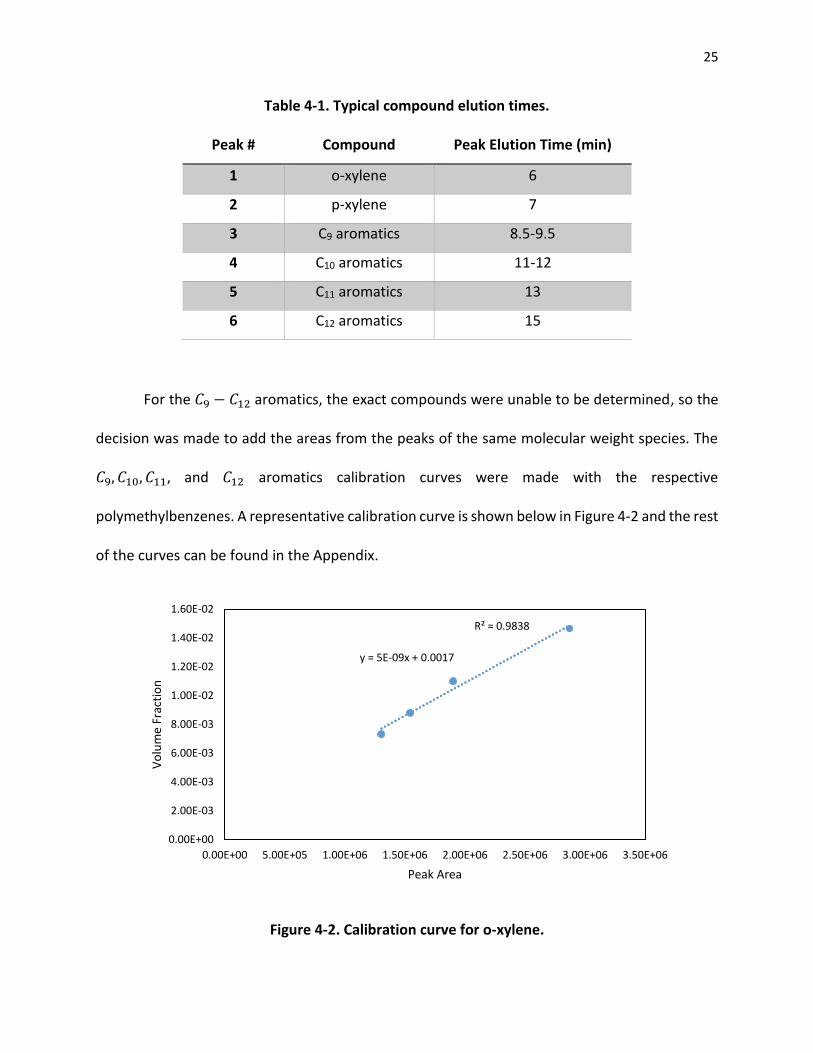
For the 𝐶9 − 𝐶12 aromatics, the exact compounds were unable to be determined, so the
decision was made to add the areas from the peaks of the same molecular weight species. The
𝐶9, 𝐶10, 𝐶11, and 𝐶12 aromatics calibration curves were made with the respective
polymethylbenzenes. A representative calibration curve is shown below in Figure 4-2 and the rest
of the curves can be found in the Appendix.
Figure 4-2. Calibration curve for o-xylene.
R² = 0.9838
y = 5E-09x + 0.0017
0.00E+00
2.00E-03
4.00E-03
6.00E-03
8.00E-03
1.00E-02
1.20E-02
1.40E-02
1.60E-02
0.00E+00 5.00E+05 1.00E+06 1.50E+06 2.00E+06 2.50E+06 3.00E+06 3.50E+06
Vo
lum
e Fr
acti
on
Peak Area
26
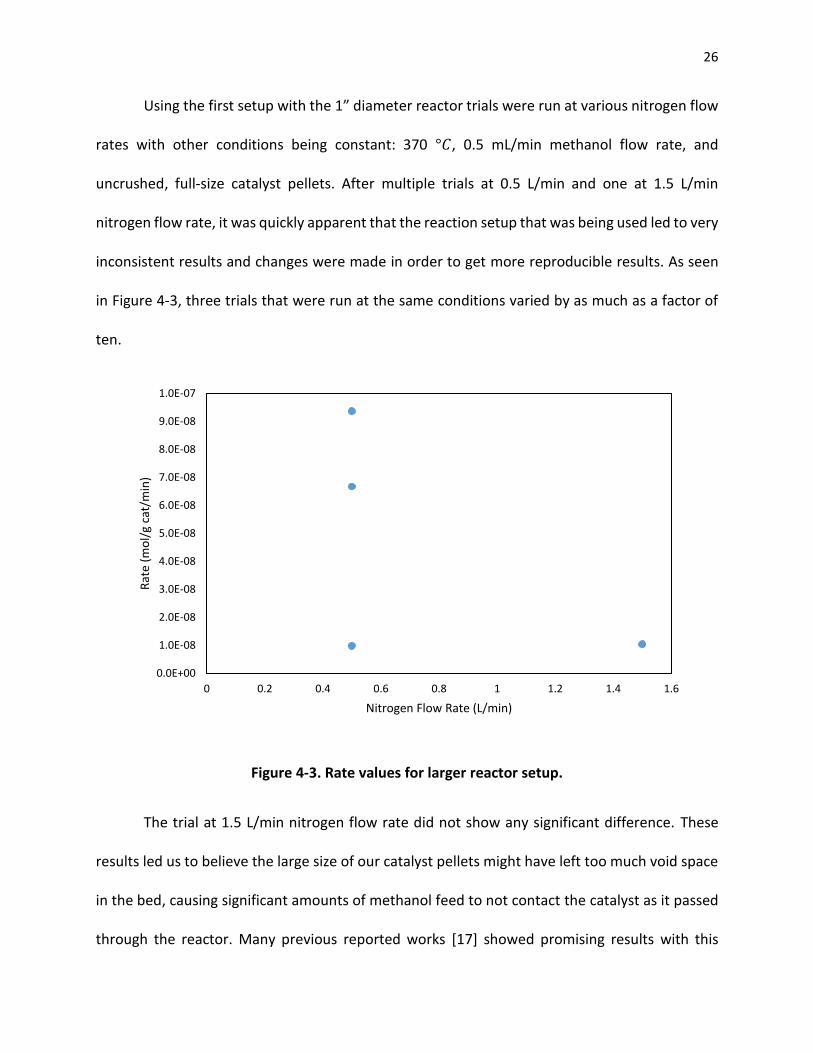
Using the first setup with the 1” diameter reactor trials were run at various nitrogen flow
rates with other conditions being constant: 370 °𝐶, 0.5 mL/min methanol flow rate, and
uncrushed, full-size catalyst pellets. After multiple trials at 0.5 L/min and one at 1.5 L/min
nitrogen flow rate, it was quickly apparent that the reaction setup that was being used led to very
inconsistent results and changes were made in order to get more reproducible results. As seen
in Figure 4-3, three trials that were run at the same conditions varied by as much as a factor of
ten.
Figure 4-3. Rate values for larger reactor setup.
The trial at 1.5 L/min nitrogen flow rate did not show any significant difference. These
results led us to believe the large size of our catalyst pellets might have left too much void space
in the bed, causing significant amounts of methanol feed to not contact the catalyst as it passed
through the reactor. Many previous reported works [17] showed promising results with this
0.0E+00
1.0E-08
2.0E-08
3.0E-08
4.0E-08
5.0E-08
6.0E-08
7.0E-08
8.0E-08
9.0E-08
1.0E-07
0 0.2 0.4 0.6 0.8 1 1.2 1.4 1.6
Rat
e (m
ol/
g ca
t/m
in)
Nitrogen Flow Rate (L/min)
27
reaction using a smaller reactor tube and crushed catalyst; they also had lower nitrogen and
methanol flow rates. These findings caused us to change the reactor setup to the smaller
diameter reactor tubing.
The smaller reactor tubing meant that lower flow rates were required for similar reaction
conditions to be met. Unfortunately, the flow meter that was being used could only regulate
nitrogen flow rates as low as about 40 mL/min. In order to produce lower flow rates, a rotameter
was installed, which allowed for nitrogen flow rates as low as about 10 mL/min. Particle trays
were also used to sieve crushed catalyst particles to desired particle diameter ranges for use in
the trials. Three particle size diameter ranges were chosen to vary particle size for the trials to
study the effect of particle size. The chosen particle size was based on the literature source [17],
where a particle size of 150-300 𝜇𝑚 was used. Our particle size range was chosen as 177-297
𝜇𝑚 as these are the closest sieve sizes that could be quickly obtained from the Rose-Hulman
Chemical Engineering Laboratory. Ideally, we would test particle size ranges on either side of the
range above; however, if a particle size smaller than this range was chosen, pressure in the
system became too high for the setup used. The setup was not able to handle high backpressure,
and it led to tubing popping off or leakage through various joints.
The reason for the increase in the pressure becomes apparent when looking at equation
9 from Section 2, the Ergun equation. The two terms in the equation have 𝑑𝑝, particle diameter,
in the denominator and one of those terms is particle diameter squared. This means that as the
particle diameter in a fixed bed decreases, the pressure drop per unit length increases
significantly. In order to run tests with smaller catalyst size, the setup would have to be modified
to better handle larger amounts of backpressure.
28
Now that a reaction setup was found with more consistent results, a plan for trials was
made to test the effect of temperature, carrier gas flow rate, and particle diameter. Due to time
constraints using these reaction conditions, allowed for only three different values to be tested.
The reaction conditions tested can be seen below in Table 4-2 with relevant values for condition
comparisons in bold:
Table 4-2. Reaction conditions used for trials. Conditions that were relevant for comparisons
from each trial are bolded.
Temperature(°𝑪) Particle Size Range (𝝁𝒎) Nitrogen Flow Rate (𝒎𝑳
𝒎𝒊𝒏)
375 177-297 25
350 177-297 25
400 177-297 25
375 177-297 10
375 177-297 50
375 297-600 10
375 600-850 10
Results from these trials had values that fell outside the range of the previously made
calibration curves, so the previously made curves were unable to be used for the quantitative
analysis of these results. Additional calibration curves were unable to be created due to time
constraints and GC/MS availability. Therefore, these trials were analyzed qualitatively by looking
at the summed numerical peak areas of the various aromatics that were expected as products.
29
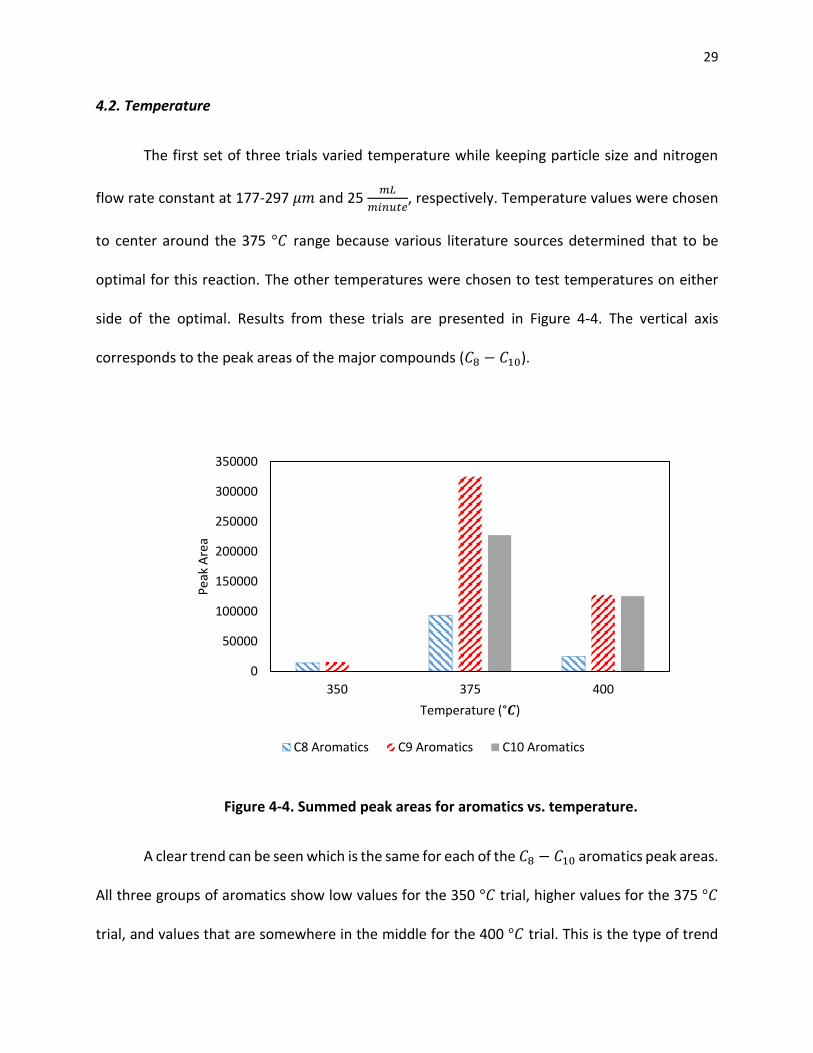
4.2. Temperature
The first set of three trials varied temperature while keeping particle size and nitrogen
flow rate constant at 177-297 𝜇𝑚 and 25 𝑚𝐿
𝑚𝑖𝑛𝑢𝑡𝑒, respectively. Temperature values were chosen
to center around the 375 °𝐶 range because various literature sources determined that to be
optimal for this reaction. The other temperatures were chosen to test temperatures on either
side of the optimal. Results from these trials are presented in Figure 4-4. The vertical axis
corresponds to the peak areas of the major compounds (𝐶8 − 𝐶10).
Figure 4-4. Summed peak areas for aromatics vs. temperature.
A clear trend can be seen which is the same for each of the 𝐶8 − 𝐶10 aromatics peak areas.
All three groups of aromatics show low values for the 350 °𝐶 trial, higher values for the 375 °𝐶
trial, and values that are somewhere in the middle for the 400 °𝐶 trial. This is the type of trend
0
50000
100000
150000
200000
250000
300000
350000
350 375 400
Pea
k A
rea
Temperature (°𝑪)
C8 Aromatics C9 Aromatics C10 Aromatics
30
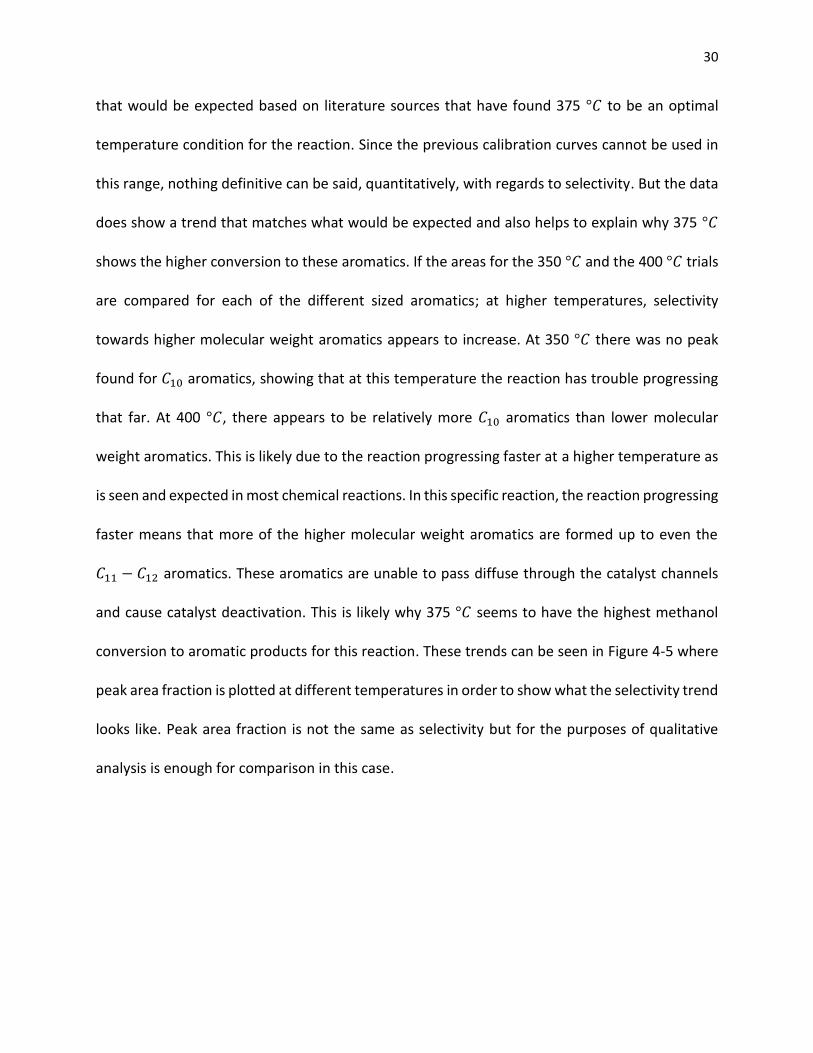
that would be expected based on literature sources that have found 375 °𝐶 to be an optimal
temperature condition for the reaction. Since the previous calibration curves cannot be used in
this range, nothing definitive can be said, quantitatively, with regards to selectivity. But the data
does show a trend that matches what would be expected and also helps to explain why 375 °𝐶
shows the higher conversion to these aromatics. If the areas for the 350 °𝐶 and the 400 °𝐶 trials
are compared for each of the different sized aromatics; at higher temperatures, selectivity
towards higher molecular weight aromatics appears to increase. At 350 °𝐶 there was no peak
found for 𝐶10 aromatics, showing that at this temperature the reaction has trouble progressing
that far. At 400 °𝐶, there appears to be relatively more 𝐶10 aromatics than lower molecular
weight aromatics. This is likely due to the reaction progressing faster at a higher temperature as
is seen and expected in most chemical reactions. In this specific reaction, the reaction progressing
faster means that more of the higher molecular weight aromatics are formed up to even the
𝐶11 − 𝐶12 aromatics. These aromatics are unable to pass diffuse through the catalyst channels
and cause catalyst deactivation. This is likely why 375 °𝐶 seems to have the highest methanol
conversion to aromatic products for this reaction. These trends can be seen in Figure 4-5 where
peak area fraction is plotted at different temperatures in order to show what the selectivity trend
looks like. Peak area fraction is not the same as selectivity but for the purposes of qualitative
analysis is enough for comparison in this case.
31
Figure 4-5. Peak area fractions for aromatics vs. temperature.
4.3. Nitrogen Flow Rate
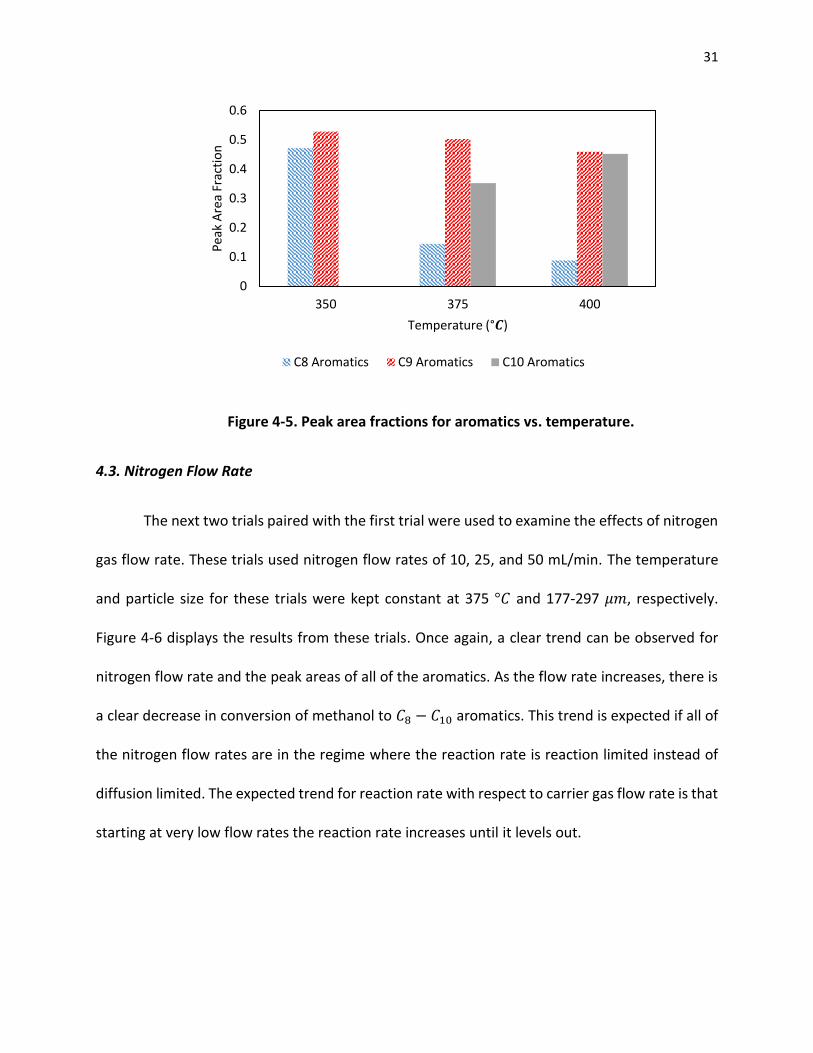
The next two trials paired with the first trial were used to examine the effects of nitrogen
gas flow rate. These trials used nitrogen flow rates of 10, 25, and 50 mL/min. The temperature
and particle size for these trials were kept constant at 375 °𝐶 and 177-297 𝜇𝑚, respectively.
Figure 4-6 displays the results from these trials. Once again, a clear trend can be observed for
nitrogen flow rate and the peak areas of all of the aromatics. As the flow rate increases, there is
a clear decrease in conversion of methanol to 𝐶8 − 𝐶10 aromatics. This trend is expected if all of
the nitrogen flow rates are in the regime where the reaction rate is reaction limited instead of
diffusion limited. The expected trend for reaction rate with respect to carrier gas flow rate is that
starting at very low flow rates the reaction rate increases until it levels out.
0
0.1
0.2
0.3
0.4
0.5
0.6
350 375 400
Pea
k A
rea
Frac
tio
n
Temperature (°𝑪)
C8 Aromatics C9 Aromatics C10 Aromatics
32
Figure 4-6. Aromatics summed peak areas vs. nitrogen flow rate.
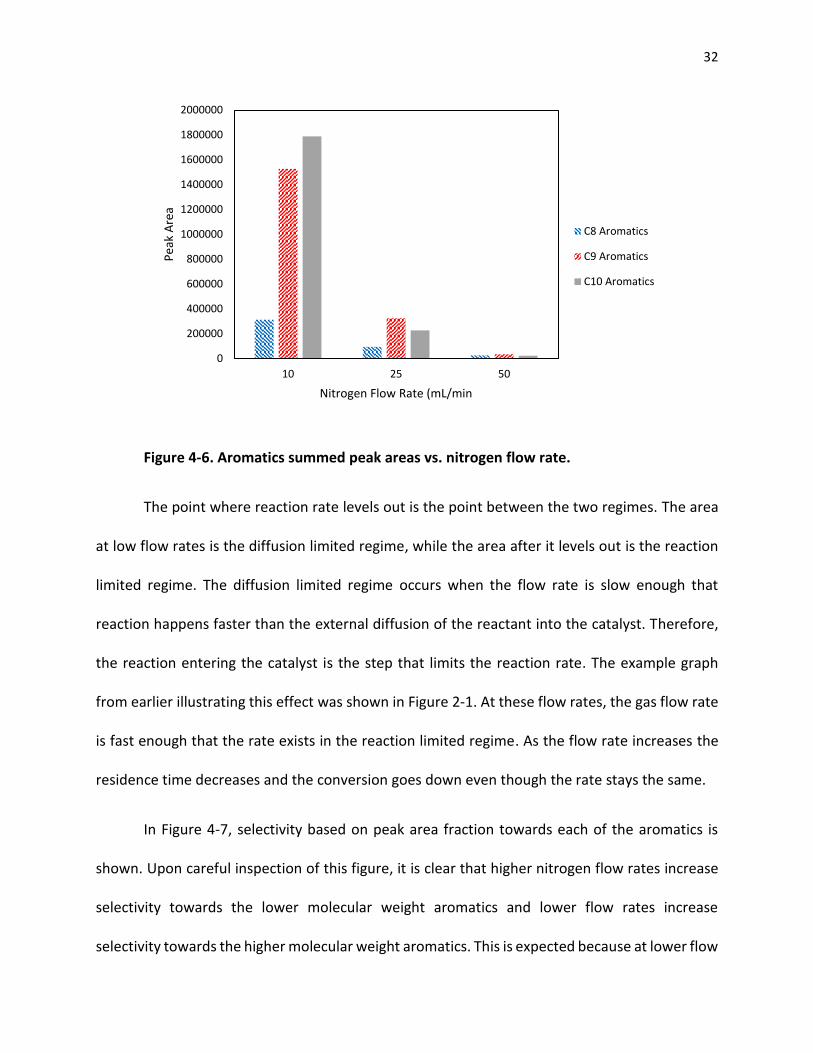
The point where reaction rate levels out is the point between the two regimes. The area
at low flow rates is the diffusion limited regime, while the area after it levels out is the reaction
limited regime. The diffusion limited regime occurs when the flow rate is slow enough that
reaction happens faster than the external diffusion of the reactant into the catalyst. Therefore,
the reaction entering the catalyst is the step that limits the reaction rate. The example graph
from earlier illustrating this effect was shown in Figure 2-1. At these flow rates, the gas flow rate
is fast enough that the rate exists in the reaction limited regime. As the flow rate increases the
residence time decreases and the conversion goes down even though the rate stays the same.
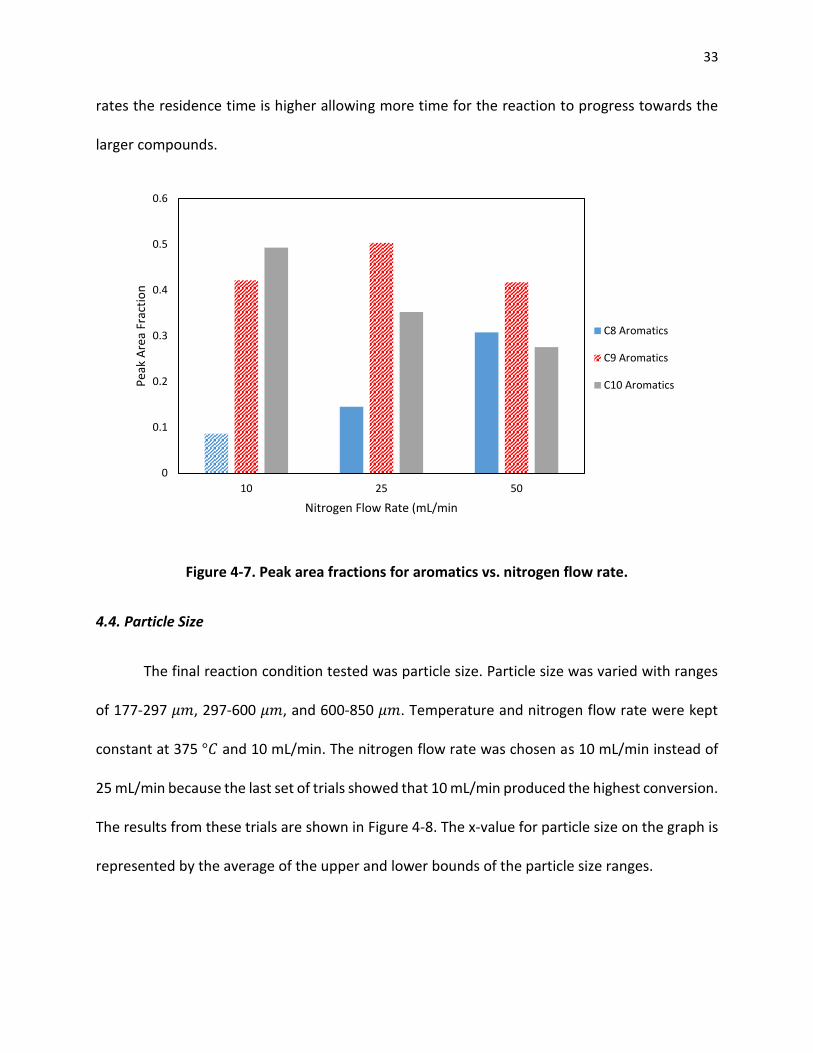
In Figure 4-7, selectivity based on peak area fraction towards each of the aromatics is
shown. Upon careful inspection of this figure, it is clear that higher nitrogen flow rates increase
selectivity towards the lower molecular weight aromatics and lower flow rates increase
selectivity towards the higher molecular weight aromatics. This is expected because at lower flow
0
200000
400000
600000
800000
1000000
1200000
1400000
1600000
1800000
2000000
10 25 50
Pea
k A
rea
Nitrogen Flow Rate (mL/min
C8 Aromatics
C9 Aromatics
C10 Aromatics
33
rates the residence time is higher allowing more time for the reaction to progress towards the
larger compounds.
Figure 4-7. Peak area fractions for aromatics vs. nitrogen flow rate.
4.4. Particle Size
The final reaction condition tested was particle size. Particle size was varied with ranges
of 177-297 𝜇𝑚, 297-600 𝜇𝑚, and 600-850 𝜇𝑚. Temperature and nitrogen flow rate were kept
constant at 375 °𝐶 and 10 mL/min. The nitrogen flow rate was chosen as 10 mL/min instead of
25 mL/min because the last set of trials showed that 10 mL/min produced the highest conversion.
The results from these trials are shown in Figure 4-8. The x-value for particle size on the graph is
represented by the average of the upper and lower bounds of the particle size ranges.
0
0.1
0.2
0.3
0.4
0.5
0.6
10 25 50
Pea
k A
rea
Frac
tio
n
Nitrogen Flow Rate (mL/min
C8 Aromatics
C9 Aromatics
C10 Aromatics
34
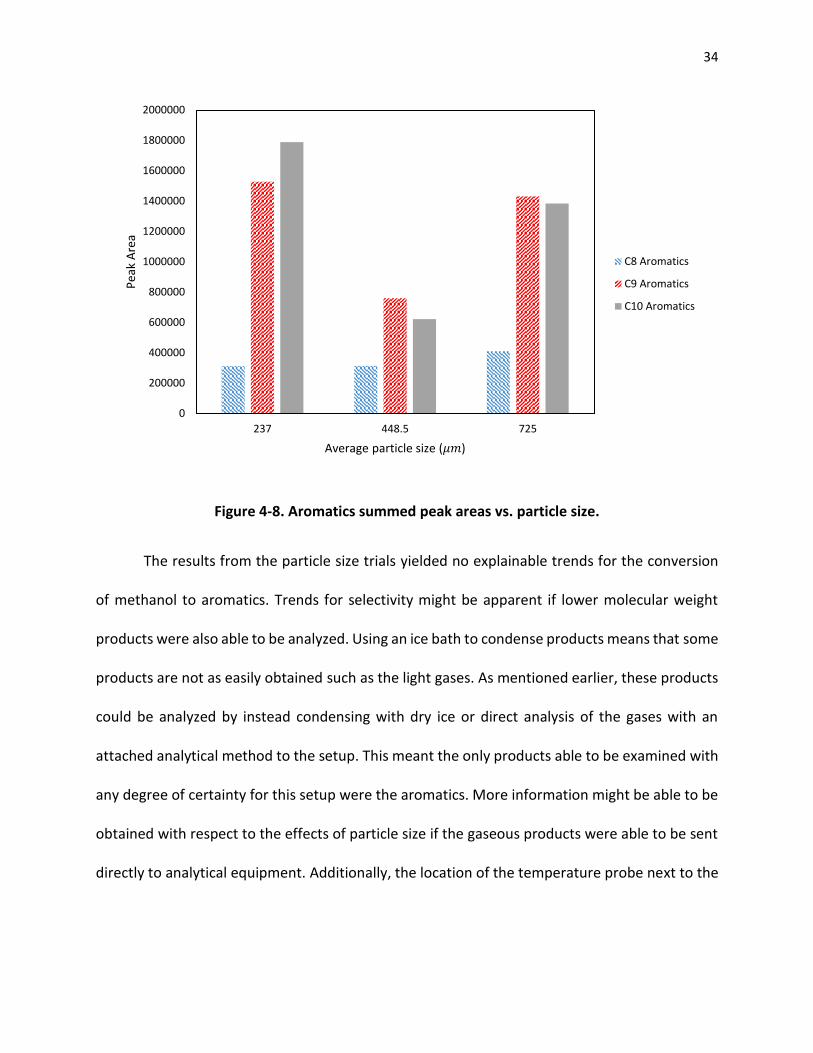
Figure 4-8. Aromatics summed peak areas vs. particle size.
The results from the particle size trials yielded no explainable trends for the conversion
of methanol to aromatics. Trends for selectivity might be apparent if lower molecular weight
products were also able to be analyzed. Using an ice bath to condense products means that some
products are not as easily obtained such as the light gases. As mentioned earlier, these products
could be analyzed by instead condensing with dry ice or direct analysis of the gases with an
attached analytical method to the setup. This meant the only products able to be examined with
any degree of certainty for this setup were the aromatics. More information might be able to be
obtained with respect to the effects of particle size if the gaseous products were able to be sent
directly to analytical equipment. Additionally, the location of the temperature probe next to the
0
200000
400000
600000
800000
1000000
1200000
1400000
1600000
1800000
2000000
237 448.5 725
Pea
k A
rea
Average particle size (𝜇𝑚)
C8 Aromatics
C9 Aromatics
C10 Aromatics
35
reactor tubing instead of inside it may have had a negative effect on the consistency of the
results, leading to possible trends getting lost.
The carbon pool mechanism relies on organic impurities in order to start the formation of
the “hydrocarbon pool.” The methanol used for the reaction had a purity of greater than 99.9%
assay. Conversions that were obtained were significantly lower than those of various literature
sources, so an additional trial was run with 1% by volume ethanol added to our methanol feed
as an impurity to make sure that lack of impurities was not affecting the early progression of the
reaction. This trial was run at the following conditions: 10 mL/min nitrogen flow rate, 375 °𝐶, and
177-297 𝜇𝑚 particle diameter. The summed peak areas under these conditions did not have a
noticeable trend. Peak area of the 𝐶8 aromatics increased by approximately 50%, peak area of
the 𝐶9 aromatics decreased by approximately 10%, and peak area of the 𝐶10 aromatics decreased
by approximately 58%. While the peak areas for each aromatic did change from the previous trial
of the same conditions, the overall conversion of methanol to aromatics stayed consistent. This
means that the lower conversions of our trials compared to literature trials was not due to a lack
of impurities to start the “hydrocarbon pool”. A plot of this data compared to the trial without
ethanol is shown in Figure 4-9.
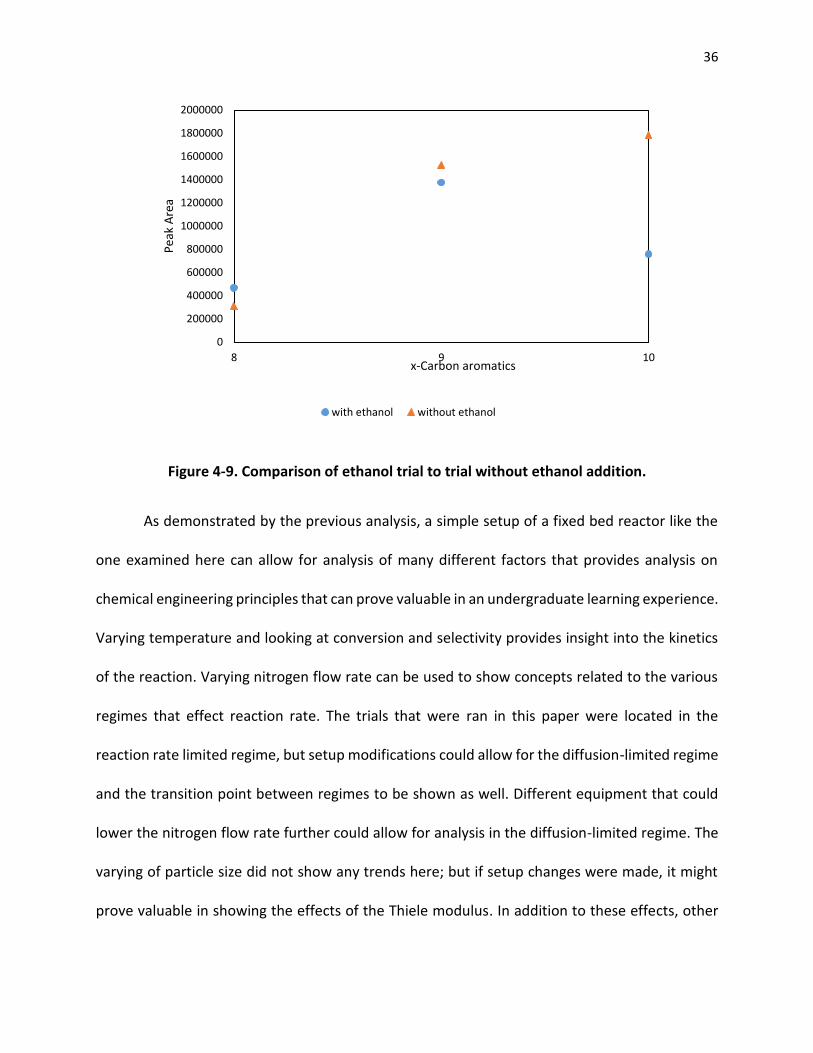
36
Figure 4-9. Comparison of ethanol trial to trial without ethanol addition.
As demonstrated by the previous analysis, a simple setup of a fixed bed reactor like the
one examined here can allow for analysis of many different factors that provides analysis on
chemical engineering principles that can prove valuable in an undergraduate learning experience.
Varying temperature and looking at conversion and selectivity provides insight into the kinetics
of the reaction. Varying nitrogen flow rate can be used to show concepts related to the various
regimes that effect reaction rate. The trials that were ran in this paper were located in the
reaction rate limited regime, but setup modifications could allow for the diffusion-limited regime
and the transition point between regimes to be shown as well. Different equipment that could
lower the nitrogen flow rate further could allow for analysis in the diffusion-limited regime. The
varying of particle size did not show any trends here; but if setup changes were made, it might
prove valuable in showing the effects of the Thiele modulus. In addition to these effects, other
0
200000
400000
600000
800000
1000000
1200000
1400000
1600000
1800000
2000000
8 9 10
Pea
k A
rea
x-Carbon aromatics
with ethanol without ethanol
37
studies can be done to provide information on the reusability of the catalyst after the used
catalyst has been regenerated. This could be done by comparing the conversion and selectivity
found with a fresh catalyst to those of catalyst that has been regenerated. These studies could
also be repeated with the addition of metals to the catalyst like zinc or copper to see the effects
on conversion, selectivity, and catalyst deactivation.
38
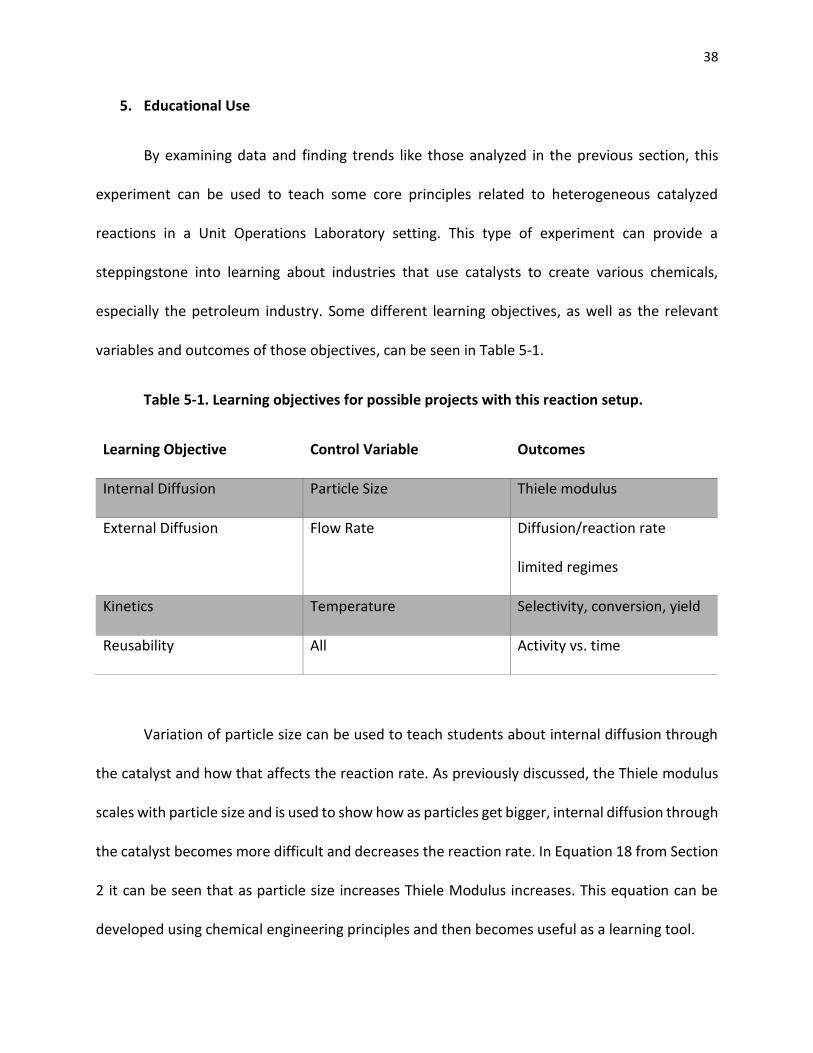
5. Educational Use
By examining data and finding trends like those analyzed in the previous section, this
experiment can be used to teach some core principles related to heterogeneous catalyzed
reactions in a Unit Operations Laboratory setting. This type of experiment can provide a
steppingstone into learning about industries that use catalysts to create various chemicals,
especially the petroleum industry. Some different learning objectives, as well as the relevant
variables and outcomes of those objectives, can be seen in Table 5-1.
Table 5-1. Learning objectives for possible projects with this reaction setup.
Learning Objective Control Variable Outcomes
Internal Diffusion Particle Size Thiele modulus
External Diffusion Flow Rate Diffusion/reaction rate
limited regimes
Kinetics Temperature Selectivity, conversion, yield
Reusability All Activity vs. time
Variation of particle size can be used to teach students about internal diffusion through
the catalyst and how that affects the reaction rate. As previously discussed, the Thiele modulus
scales with particle size and is used to show how as particles get bigger, internal diffusion through
the catalyst becomes more difficult and decreases the reaction rate. In Equation 18 from Section
2 it can be seen that as particle size increases Thiele Modulus increases. This equation can be
developed using chemical engineering principles and then becomes useful as a learning tool.
39
Varying flow rate and plotting results can be used to examine the effects of external
diffusion on the reaction rate. At low flow rates, the reaction over the catalyst is limited by
external diffusion due to the rate that reactants can enter the catalyst sites. As flow rate
increases, rate increases until it’s no longer limited by diffusion into the catalyst and instead is
limited by reaction rate. This point represents the separation of the two regimes and can be
clearly seen in experiments where the flow rate is varied. This core concept is represented in
Equation 11 from Section 2 where the mass transfer coefficient is inversely proportional to the
boundary layer thickness. From core principles learned in fluids classes it is known that as fluid
velocity increases, the boundary layer decreases and diffusion into the catalyst is no longer
limiting.
The kinetics of catalytic reaction can be examined by varying the temperature of reaction
trials. This allows for students to investigate outcomes such as selectivity, conversion, and yield
for the reactions. In the context of this reaction, it was able to be seen where the optimal
temperature was with respect to conversion. The core concepts of kinetics are represented in
Equation 8 from Section 2, where the rate is shown in relation to temperature among other
variables. Also, within Equation 8 is the effects of pressure on the reaction. As was shown with
the Ergun equation in Equation 9. These two equations show that a large pressure drop across
the reactor, as was seen in this study, decreases the reaction rate.
A possible learning objective that was not analyzed in this research is catalyst reusability.
This can be tested alongside any of the other learning objectives by rerunning experiments with
regenerated catalyst and examining catalyst activity and if the rate stays the same with continued
uses. This is extremely relevant for how it would work on an industrial scale in which it isn’t

40
feasible to use fresh catalyst whenever it is used up. Instead, it is much more practical to use a
regenerated catalyst and is therefore important to understand how or if regenerating it has any
effects.
41
6. Conclusion
Unit operations in chemical engineering laboratories are used in many universities to teach
many core chemical engineering principles. Some core principles that might be taught in unit
operations labs include fluid mechanics, thermodynamics, and heat and mass transfer. In
addition to experiments that teach these core principles, it is also useful to have experiments
that might be considered more specialized. Specialized experiments still use fundamental
principles from chemical engineering courses, but they also sometimes use concepts that are not
seen as often or at all in a general chemical engineering curriculum. An experiment like the MTG
reaction in a fixed bed reactor would provide a useful educational framework for teaching the
concepts behind heterogeneous catalyzed reactions.
A variety of setup configurations were tested in the earlier trials of this reaction.
Inconsistent results on the early trials led to the switch from a 1-inch diameter reactor to a 0.25-
inch reactor, as well as the switch to crushed catalyst instead of pelletized catalyst. The smaller
reactor led to the use of a rotameter for nitrogen flow rate control instead of the original
flowmeter due to the lower minimum flow rate (10 mL/min vs. 0.5 L/min). A temperature probe
and a controller were used to control the temperature of the reactor. A syringe pump was used
to feed the liquid methanol into the reactor, and an ice bath was used to condense products in a
vial at the reactor outlet before being vented to the hood. This experimental setup brought the
best combination of consistency and methanol conversion but was not without its own problems.
There are a few improvements that should be made for this setup but were unable to be
attempted due to factors such as time or cost. A smaller temperature probe that could either fit
42
into the reactor or be implemented immediately at the exit of the reactor instead of next to the
tubing would likely yield more consistent results across the board due to more accurate
temperature control. The analysis would benefit from analytical equipment tied directly into the
setup such that all products could be analyzed in real time. This would give information on how
the reaction progresses over and give information on the product slate that had too low of boiling
points to condense from the ice bath. The furnace that was used for heating was designed for
the bigger tubing, so a furnace that better matched the size of the reactor tubing would likely
give more consistency to the temperature control. Finally, a flowmeter or rotameter that went
to lower flow rates could be beneficial if reactor size was kept similar. The best results obtained
were at the lowest flow rates and, unfortunately, the readability of the rotameter in that low of
a range was not very good either. Being able to run in a lower range would likely yield better and
more accurate results due to larger conversion and better readability on flow rate.
Qualitative analysis showed some of the expected trends from the reaction conditions
that were varied: temperature, nitrogen gas flow rate, and particle diameter. Various literature
sources from trials with this reaction showed that the best conversion values to be at
temperatures of about 370-375 °𝐶. This was confirmed in the temperature trials in which the
highest peak values were obtained for the 𝐶8 − 𝐶10 aromatics at 375 °𝐶. The higher temperature
also showed selectivity to the higher molecular weight aromatics. This means the reaction likely
progressed faster at the higher temperature, which led to quicker catalyst deactivation. Varying
the nitrogen flow rate showed the same trend for all of the aromatics. The highest methanol
conversion occurred at the lowest flow rate. This means that higher flow rates lowered the
residence time and with it the methanol conversion even though the rate stayed the same as it

43
occurred in the reaction rate limited regime. No trends were noticed when particle the size was
varied.
44
7. References
[1] BP Energy Outlook 2017 Edition. 2017, www.bp.com/content/dam/bp/pdf/energy-
economics/energy-outlook-2017/bp-energy-outlook-2017.pdf.
[2] “Methanol to Gasoline Synthesis | ExxonMobil Chemical.” Where We Operate | ExxonMobil
Chemical , 8 Nov. 2017, www.exxonmobilchemical.com/en/products-and-services/technology-
licensing-and-services/methanol-to-gasoline-synthesis.
[3] “Ftsynthesis.” What Are the Primary Sources of CO2?, 20 June 2013,
www.netl.doe.gov/research/coal/energy-systems/gasification/gasifipedia/ftsynthesis.
[4] “Refining Crude Oil.” Refining Crude Oil - Energy Explained, Your Guide To Understanding
Energy - Energy Information Administration,
www.eia.gov/energyexplained/index.php?page=oil_refining.
[5] Olah, George A. “Beyond Oil and Gas: The Methanol Economy.” Angewandte Chemie
International Edition, John Wiley & Sons, Ltd, 31 Mar. 2005,
onlinelibrary.wiley.com/doi/abs/10.1002/anie.200462121.
[6] “Gasoline - Energy Explained, Your Guide To Understanding Energy - Energy Information
Administration.” EIA, www.eia.gov/energyexplained/index.php?page=gasoline_home.
[7] IAGS, and Institute for the Analysis of Global Security. “Sources of Methanol.” IAGS,
www.iags.org/methanolsources.htm.
[8] “Syngas Conversion to Methanol.” National Energy Technology Laboratory,
www.netl.doe.gov/research/coal/energy-systems/gasification/gasifipedia/methanol.
45
[9] Ali, Khozema Ahmed. “Recent Development in Catalytic Technologies for Methanol Synthesis
from Renewable Sources: A Critical Review.” Renewable and Sustainable Energy Reviews, Science
Direct, 22 Jan. 2015, www.sciencedirect.com/science/article/pii/S1364032115000209.
[10] “Hydrogen Storage.” Energy.gov, www.energy.gov/eere/fuelcells/hydrogen-storage.
[11] “Alternative Fuels and Advanced Vehicles.” Alternative Fuels Data Center: Fuel Prices,
www.afdc.energy.gov/fuels/.
[12] Wang, Peter. “Catalysts in 21st Century Energy.” Stanford,
large.stanford.edu/courses/2016/ph240/wang2/.
[13] Hakan Olcay, Ayyagari V. Subrahmanyam, Rong Xing, Jason Lajoie, James A. Dumesic and
George W. Huber (2013) Production of renewable petroleum refinery diesel and jet fuel
feedstocks from hemicellulose sugar streams. Energy Environ. Sci. 6, 205-216
doi: 10.1039/C2EE23316A
[14] Libretexts. “The Effect of a Catalyst on Rate of Reaction.” Chemistry LibreTexts, National
Science Foundation, 2 June 2017,
chem.libretexts.org/Textbook_Maps/Inorganic_Chemistry/Supplemental_Modules_(Inorganic_
Chemistry)/Catalysis/The_Effect_of_a_Catalyst_on_Rate_of_Reaction
[15] Lindström, Bård, and Lars J. Pettersson. “A Brief History of Catalysis.” SpringerLink, Kluwer
Academic Publishers-Plenum Publishers, link.springer.com/article/10.1023/A:1025001809516.
[16] “Types of Catalysis.” Types of Catalysis, Chemguide,
www.chemguide.co.uk/physical/catalysis/introduction.html.
46
[17] Andrigo, P. “Fixed Bed Reactors.” ScienceDirect, Catalysis Today, 1999,
doi.org/10.1016/S0920-5861(99)00076-0.
[18] Chang, Clarence. “Process Studies on the Conversion of Methanol to Gasoline.” ACS
Publications, July 1978, pubs.acs.org/doi/abs/10.1021/i260067a008
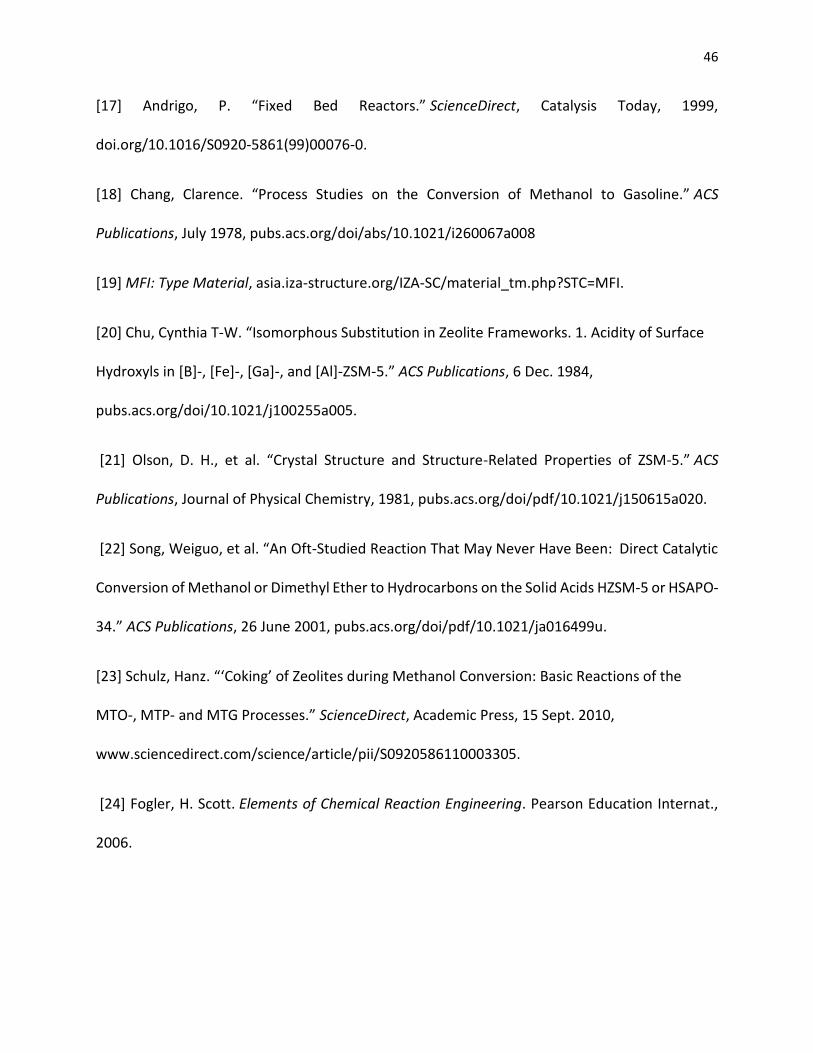
[19] MFI: Type Material, asia.iza-structure.org/IZA-SC/material_tm.php?STC=MFI.
[20] Chu, Cynthia T-W. “Isomorphous Substitution in Zeolite Frameworks. 1. Acidity of Surface
Hydroxyls in [B]-, [Fe]-, [Ga]-, and [Al]-ZSM-5.” ACS Publications, 6 Dec. 1984,
pubs.acs.org/doi/10.1021/j100255a005.
[21] Olson, D. H., et al. “Crystal Structure and Structure-Related Properties of ZSM-5.” ACS
Publications, Journal of Physical Chemistry, 1981, pubs.acs.org/doi/pdf/10.1021/j150615a020.
[22] Song, Weiguo, et al. “An Oft-Studied Reaction That May Never Have Been: Direct Catalytic
Conversion of Methanol or Dimethyl Ether to Hydrocarbons on the Solid Acids HZSM-5 or HSAPO-
34.” ACS Publications, 26 June 2001, pubs.acs.org/doi/pdf/10.1021/ja016499u.
[23] Schulz, Hanz. “‘Coking’ of Zeolites during Methanol Conversion: Basic Reactions of the
MTO-, MTP- and MTG Processes.” ScienceDirect, Academic Press, 15 Sept. 2010,
www.sciencedirect.com/science/article/pii/S0920586110003305.
[24] Fogler, H. Scott. Elements of Chemical Reaction Engineering. Pearson Education Internat.,
2006.
47
8. Appendix
Figure 8-1. Calibration curve for p-xylene.
Figure 8-2. Calibration curve for 𝑪𝟗 aromatics.
R² = 0.999
y = 5E-09x + 0.0006
0.00E+00
2.00E-03
4.00E-03
6.00E-03
8.00E-03
1.00E-02
1.20E-02
1.40E-02
1.60E-02
0.00E+00 5.00E+05 1.00E+06 1.50E+06 2.00E+06 2.50E+06 3.00E+06
Vo
lum
e Fr
acti
on
Peak Area
R² = 0.9981
y = 5E-09x + 0.0018
0.00E+00
5.00E-03
1.00E-02
1.50E-02
2.00E-02
2.50E-02
3.00E-02
3.50E-02
4.00E-02
4.50E-02
5.00E-02
0.00E+00 2.00E+06 4.00E+06 6.00E+06 8.00E+06 1.00E+07 1.20E+07
Vo
lum
e Fr
acti
on
Peak Area

48
Figure 8-3. Calibration curve for 𝑪𝟏𝟎 aromatics.
Figure 8-4. Calibration curve for 𝑪𝟏𝟏 aromatics.
R² = 0.9973
y = 6E-09x - 0.0034
0
0.01
0.02
0.03
0.04
0.05
0.06
0.00E+00 2.00E+06 4.00E+06 6.00E+06 8.00E+06 1.00E+07
mg/
mL
Peak Area
R² = 0.9587
y = 5E-09x + 0.0124
0
0.01
0.02
0.03
0.04
0.05
0.06
0.00E+00 2.00E+06 4.00E+06 6.00E+06 8.00E+06 1.00E+07
mg/
mL
Peak Area
49
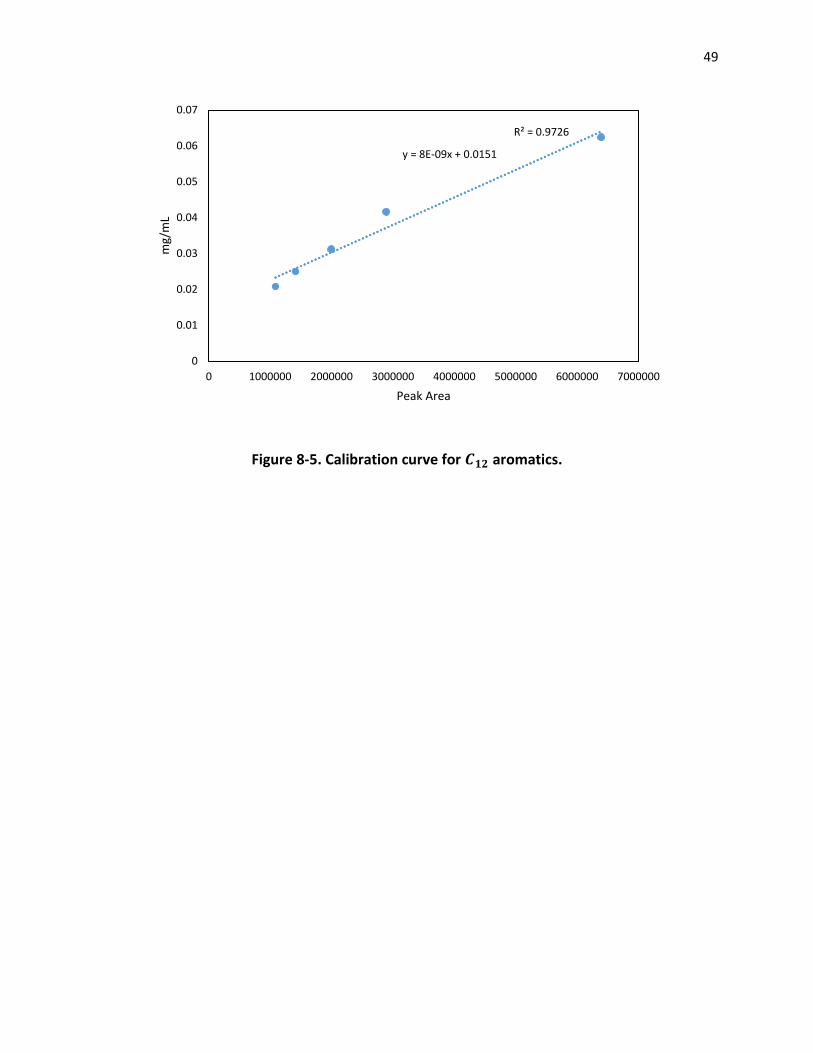
Figure 8-5. Calibration curve for 𝑪𝟏𝟐 aromatics.
R² = 0.9726
y = 8E-09x + 0.0151
0
0.01
0.02
0.03
0.04
0.05
0.06
0.07
0 1000000 2000000 3000000 4000000 5000000 6000000 7000000
mg/
mL
Peak Area