Embed Size (px)
Citation preview
Developing Wind Energy in Indiana:
A Case Study of Benton County
Ian Van LieuApril 25th, 2008
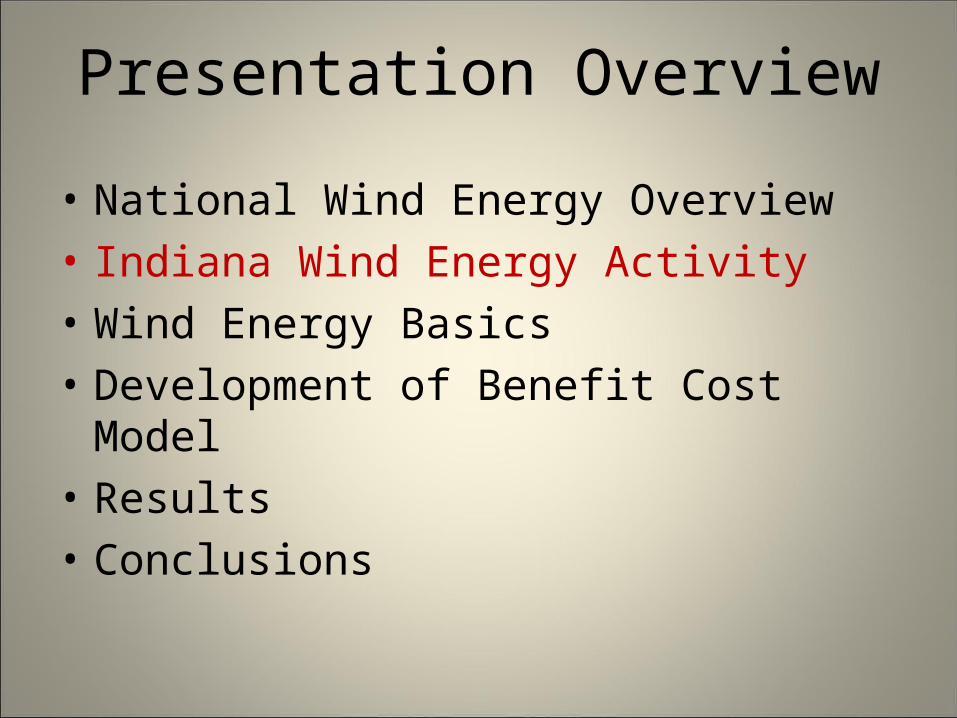
Presentation Overview
• National Wind Energy Overview• Indiana Wind Energy Activity• Wind Energy Basics• Development of Benefit Cost Model• Results• Conclusions

National Wind Energy
• Wind Energy is currently the fast growing technology in electricity generation
• Current installed capacity is 16,819 MW• Capacity under construction 3,627 MW
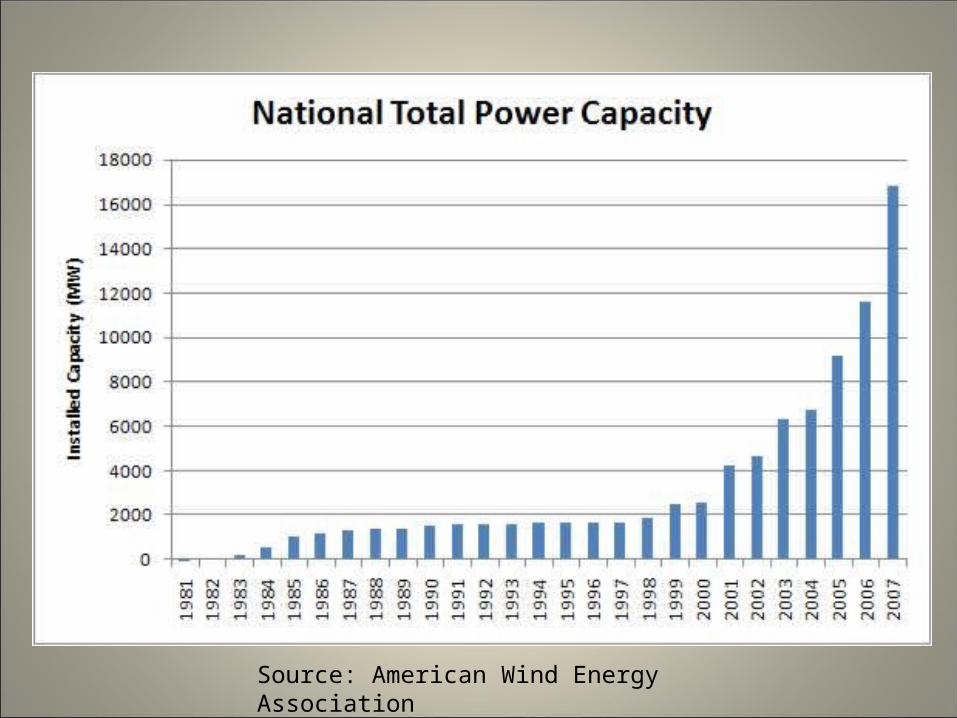
Source: American Wind Energy Association

Installed Capacity
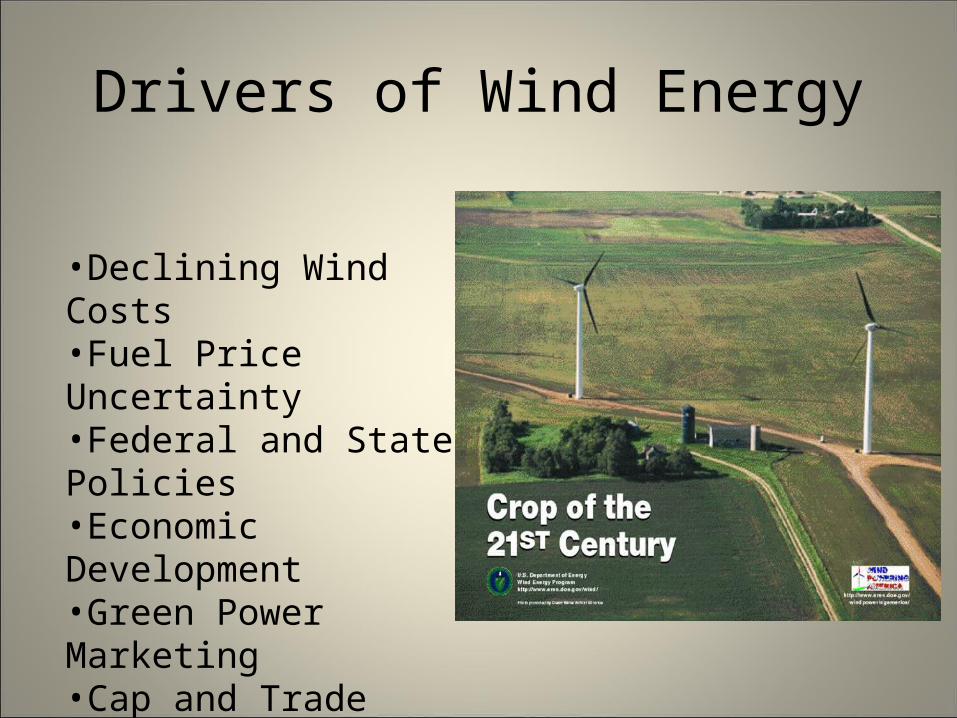
Drivers of Wind Energy
•Declining Wind Costs•Fuel Price Uncertainty•Federal and State Policies •Economic Development•Green Power Marketing•Cap and Trade Program
Presentation Overview
• National Wind Energy Overview• Indiana Wind Energy Activity• Wind Energy Basics• Development of Benefit Cost Model• Results• Conclusions

Benton County Projects
• Indiana Winds Project– 130 MW facility by Earl Park
• Fowler Ridge Project– 750 MW in 2 phases

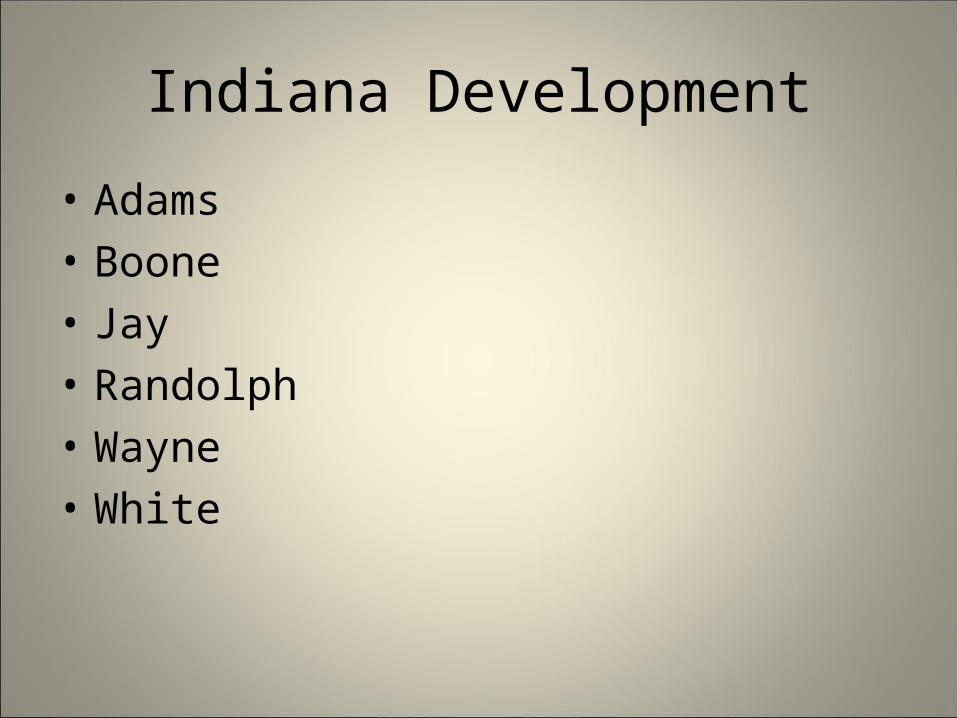
Indiana Development
• Adams• Boone• Jay• Randolph• Wayne • White

Presentation Overview
• National Wind Energy Overview• Indiana Wind Energy Activity• Wind Energy Basics• Development of Benefit Cost Model• Results• Conclusions

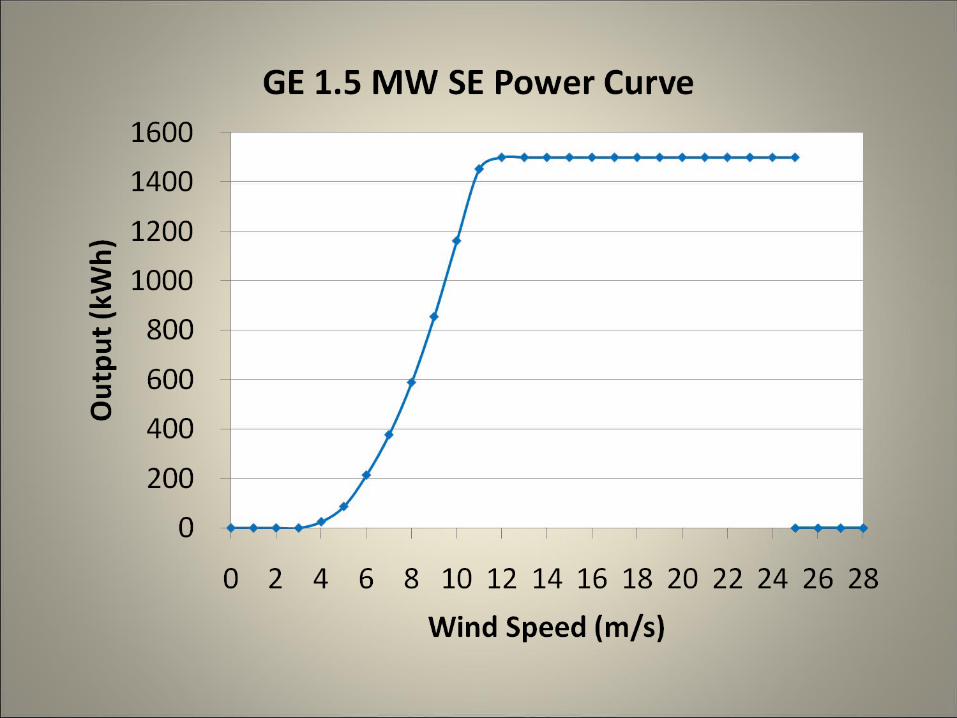
Wind Speed
• Wind speeds increase with height above the ground• It is not only about wind speeds
– Wind Power is the amount of energy produced by the wind
• Wind Power=(Wind Speed)3
• Wind Speeds are often best described using a Weibull Distribution

Wind Speed Distribution

Wind Turbine Power Equation
• ρ: The density of the air measure in kg/m3
• A : The area swept by the turbine
• CP: Turbine power coefficient
• VWind : The wind speed in meters per second
Turbine Power = 35.0 WindPVAC
Wind
TurbineP P
PC

Presentation Overview
• National Wind Energy Overview• Indiana Wind Energy Activity• Wind Energy Basics• Development of Benefit Cost Model• Results• Conclusions

Benefit Cost Model AssumptionsFactor Baseline Value
Project Life 25 Years
Nominal Interest Rate 7.00%
Inflation Rate 2.5%
Project Debt Percentage 60%
Loan Repayment Period 10 Years
Price Per kW Installed $1127.00
Number of Wind Turbines 67

Project Cost
Factor Baseline Value
Total Project Cost $113,263,500.00
Project Equity $45,305,400.00
Debt Payments $9,675,704.57
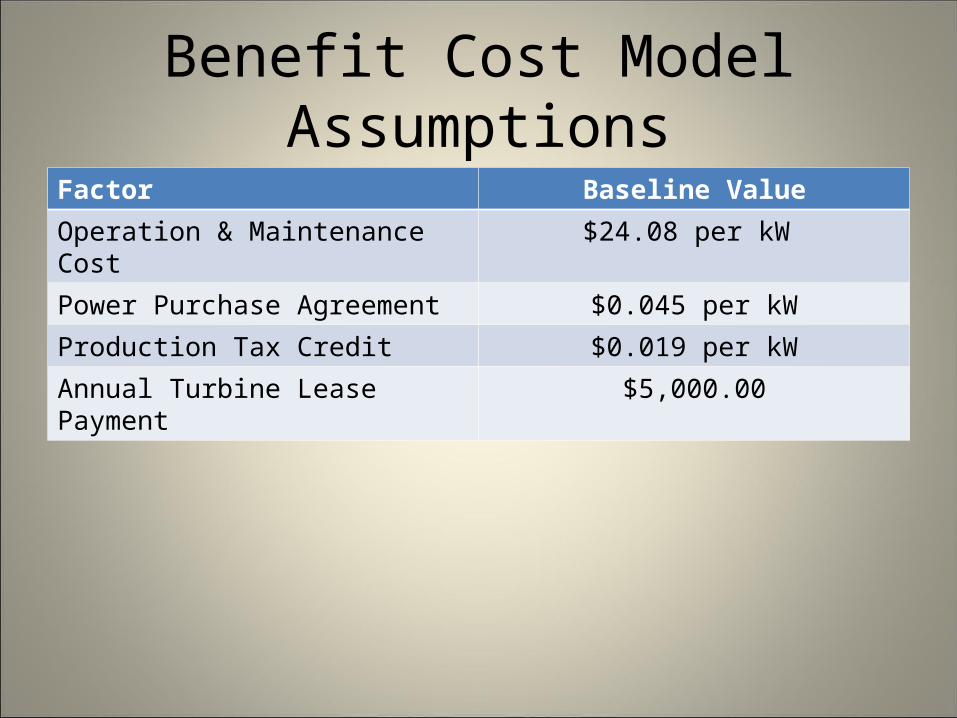
Benefit Cost Model AssumptionsFactor Baseline Value
Operation & Maintenance Cost $24.08 per kW
Power Purchase Agreement $0.045 per kW
Production Tax Credit $0.019 per kW
Annual Turbine Lease Payment $5,000.00

Property Tax AbatementYear Abatement Factor
1100%
290%
380%
470%
560%
650%
740%
830%
920%
1010%

County Property Tax RevenueYear Property Taxes
1 -$7,434
2 $142,424
3 $177,226
4 $258,431
5 $344,574
6 $430,718
7 $516,862
8 $603,005
9 $689,149
10 $775,293
11 through 25 $861,436

Depreciation SchedulesMACRS 15 Year Schedule
Year 1 0.2 0.1
Year 2 0.32 0.1
Year 3 0.19 0.1
Year4 0.1152 0.1
Year 5 0.1152 0.05
Year 6 0.0576 0.05
Year 7 through 16 0 0.05
Presentation Overview
• National Wind Energy Overview• Indiana Wind Energy Activity• Wind Energy Basics• Development of Benefit Cost Model• Results• Conclusions

Baseline Scenarios Net Present Value Without Tax Abatement With Tax Abatement
Minimum $20,250,880 $23,208,780
Mean $25,366, 640 $28,256,650
Maximum $30,309,370 $18,849,450
Standard Deviation $1,383,383 $1, 383,383
Coefficient of Variation 5.49% 4.91%
P(NPV≤0) 0.00% 0.00%
Return on Equity 14.63% 15.78%
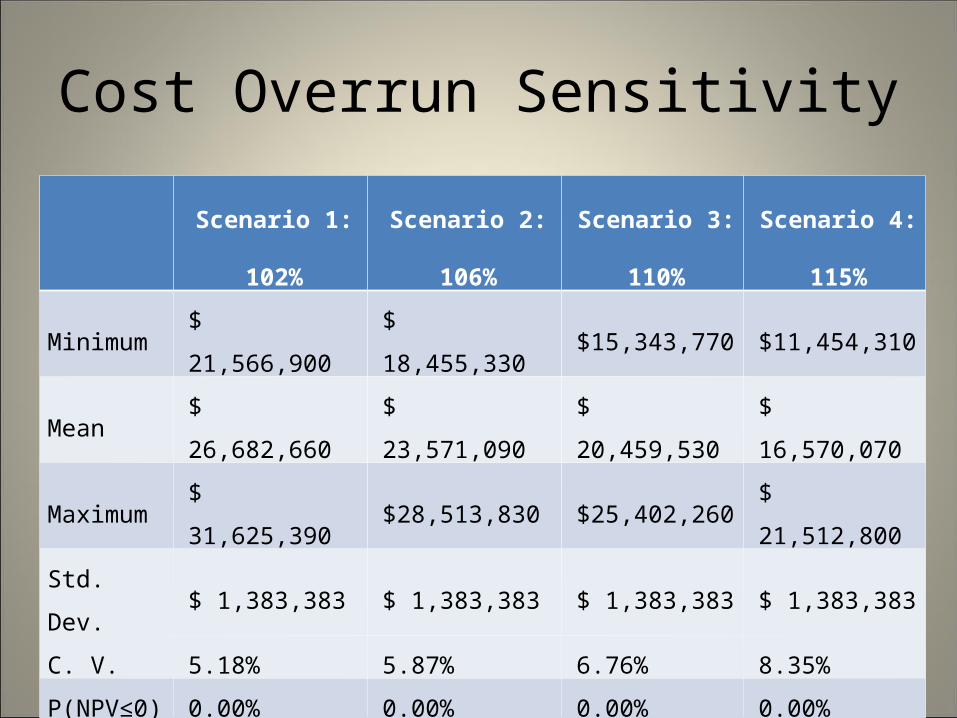
Cost Overrun Sensitivity
Scenario 1:
102%
Scenario 2:
106%
Scenario 3:
110%
Scenario 4:
115%
Minimum $ 21,566,900 $ 18,455,330 $15,343,770 $11,454,310
Mean $ 26,682,660 $ 23,571,090 $ 20,459,530 $ 16,570,070
Maximum $ 31,625,390 $28,513,830 $25,402,260 $ 21,512,800
Std. Dev. $ 1,383,383 $ 1,383,383 $ 1,383,383 $ 1,383,383
C. V. 5.18% 5.87% 6.76% 8.35%
P(NPV≤0) 0.00% 0.00% 0.00% 0.00%
IRR 15.13% 13.92% 12.79% 11.48%
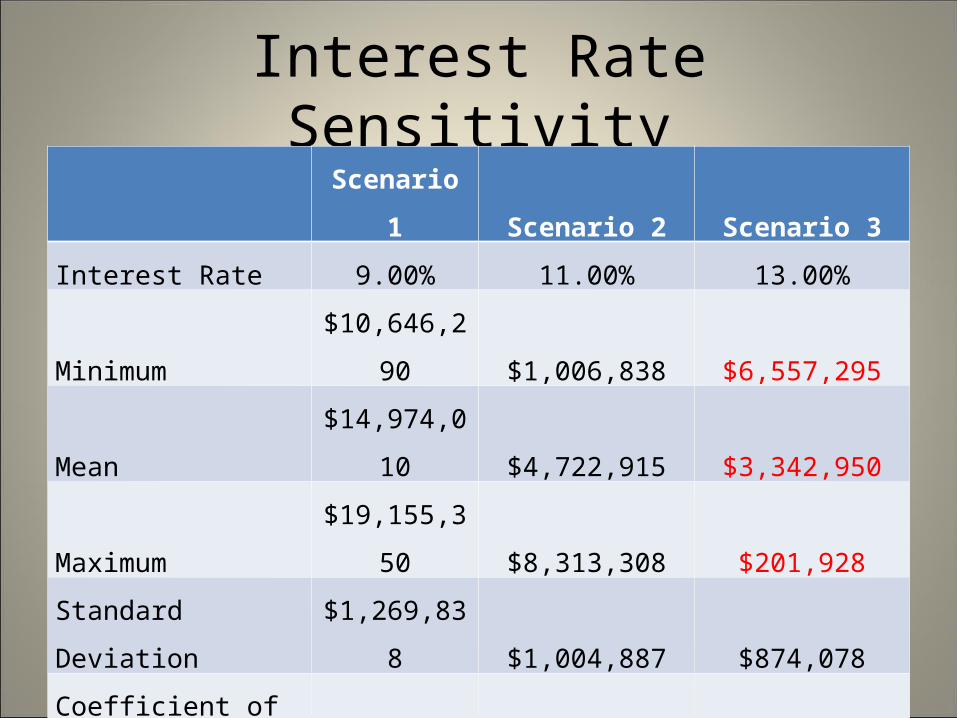
Interest Rate SensitivityScenario 1 Scenario 2 Scenario 3
Interest Rate 9.00% 11.00% 13.00%
Minimum $10,646,290 $1,006,838 $6,557,295
Mean $14,974,010 $4,722,915 $3,342,950
Maximum $19,155,350 $8,313,308 $201,928
Standard Deviation $1,269,838 $1,004,887 $874,078
Coefficient of
Variation 7.82% 21.28% -
P(NPV≤0) 0.00% 0.00% 100.00%
Return on Equity 15.07% 12.20% 11.48%
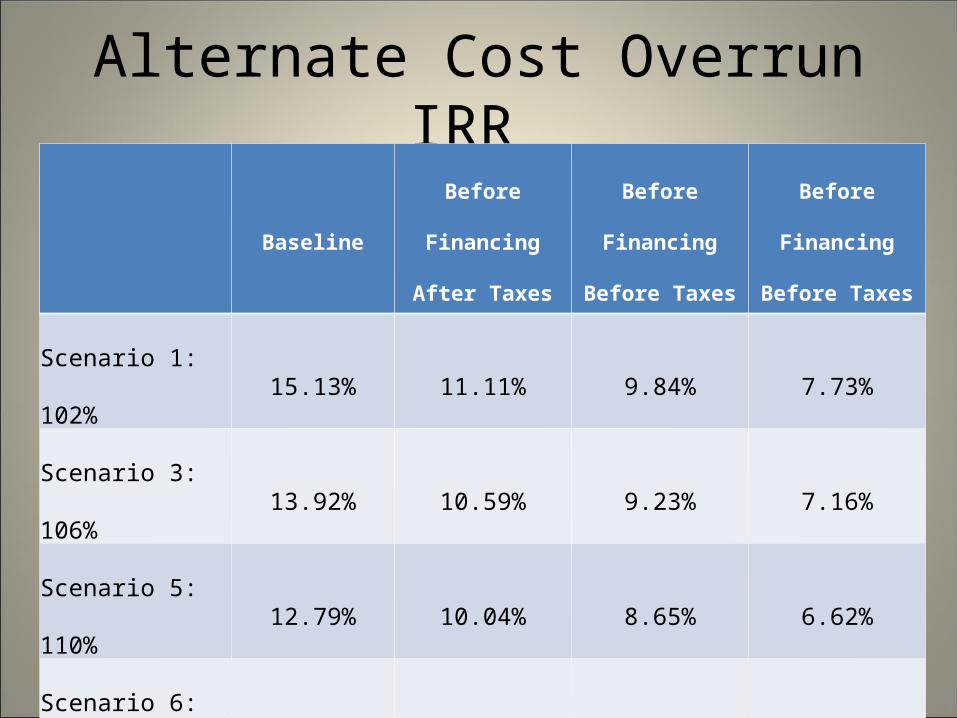
Alternate Cost Overrun IRR
BaselineBefore Financing
After Taxes
Before Financing
Before Taxes
Before Financing
Before Taxes
Scenario 1: 102% 15.13% 11.11% 9.84% 7.73%
Scenario 3: 106% 13.92% 10.59% 9.23% 7.16%
Scenario 5: 110% 12.79% 10.04% 8.65% 6.62%
Scenario 6: 115% 11.48% 9.40% 7.98% 6.00%
Presentation Overview
• National Wind Energy Overview• Indiana Wind Energy Activity• Wind Energy Basics• Development of Benefit Cost Model• Results• Conclusions
Conclusions
• Wind farms in Benton county will be able to operate profitably under many of the scenarios studied.
• The results of the model are dependent on the wind speed estimates and the initial values of the model assumptions.
• The project is sensitive to both the debt interest rate and total project cost.
Conclusions
• A 10 percent increase in total cost still allows the project to operate with a positive average net present value.
• A 10 percent decrease in the wind speeds will decrease the quantity of electricity generated by 33 percent and also decrease the production tax credit by that amount.

Questions