Embed Size (px)
Citation preview

Developing viability criteria for threatened Puget Sound steelhead
Jeff Hard and Jim Myers (for the PSSTRT)Conservation Biology Division
NMFS Northwest Fisheries Science CenterSeattle, WA 98112
West Coast Steelhead Management MeetingRedmond, OR
9-11 March 2010
interim^

Outline
• Status of the Puget Sound steelhead DPS
• Recent changes• Technical Recovery Team
(TRT) objectives• The TRT’s approach to
identifying viability criteria• Identifying DIPs & MPGs• Assessing viability of
DIPs, MPGs, and the DPS• Run type diversity; residency
and anadromy• Outlook

Puget Sound steelhead
status reviews• Originally reviewed in 1996;
ESA listing not warranted• 2nd status review in response
to September 2004 petition completed June 2007
• DPS listed as threatened under ESA
• Several populations continue steep declines despite harvest restrictions
• Low productivity; poor FW/marine habitat conditions; use of non-local/ derived hatchery stocks; depressed LH diversity

Outline
• Status of the Puget Sound steelhead DPS
• Recent changes• Technical Recovery Team
(TRT) objectives• The TRT’s approach to
identifying viability criteria• Identifying DIPs & MPGs• Assessing viability of
DIPs, MPGs, and the DPS• Run type diversity; residency
and anadromy• Outlook

East Puget Sound steelheadTolt SSH
P(ex
tincti
on)
Years
Abun
danc
e
QET = 50
Green WSH
QET = 50

General RoE patterns for Puget Sound steelhead
• Some but not all northern PS populations are at relatively low risk of extinction
• Populations in central and southern PS (except Green WSH) are generally smaller and most are declining
• Hood Canal and SJF populations are small and at high risk, although some have been relatively stable
• Status of many South Sound/Kitsap Peninsula independents and most SSH populations unclear
• Of concern: Most central and SPS populations, many Hood Canal, all SJF populations

Outline
• Status of the Puget Sound steelhead DPS
• Recent changes• Technical Recovery Team
(TRT) objectives• The TRT’s approach to
identifying viability criteria• Identifying DIPs & MPGs• Assessing viability of
DIPs, MPGs, and the DPS• Run type diversity; residency
and anadromy• Outlook

Technical Recovery Team (TRT)• When a population(s) under NOAA/USFWS jurisdiction is
petitioned for listing under ESA, a Biological Review Team (BRT) of federal scientists determines its risk of extinction—the basis for a listing decision
• Viable Salmonid Populations (VSP; McElhany et al. 2000) criteria:- Abundance, productivity, spatial structure, diversity
• A TRT develops biological recovery (“viability”) criteria to guide recovery planning for listed unit
• A TRT has two primary charges:- Identify demographically independent populations (DIPs)
and major population groups (MPGs) within the ESU/DPS- Develop viability criteria for these units and the ESU/DPS

Outline
• Status of the Puget Sound steelhead DPS
• Recent changes• Technical Recovery Team
(TRT) objectives• The TRT’s approach to
identifying viability criteria• Identifying DIPs & MPGs• Assessing viability of
DIPs, MPGs, and the DPS• Run type diversity; residency
and anadromy• Outlook

Demographically Independent Populations & Major Population Groups
• DIPs < MPGs < DPS• Data are usually limiting, and TRTs have had to rely
on indirect measures to identify DIPs and MPGs• TRTs have typically used simple decision rules to
evaluate these factors– e.g., spawning populations separated by some amount– e.g., elevation/gradient/hydrograph differs substantially
between areas• Assessment of historical populations a key element
of identifying DIPs and MPGs

DIP checklist• Tier 1
– Historical presence– Historical abundance– Demographic independence
• Tier 2 (proxies)– Recent abundance
• Intrinsic potential or other habitat based estimate of potential productivity– Basin size/drainage area– Geographic isolation– Genetic distance– Barriers
• physical• seasonal
– Ecological separation– Temporal isolation
• Tier 3 (species surrogates)• Genetic distance• Geographic isolation

0.1
Dosewallips
Duckabush77
Elwha wild05
Dungeness all87
15
DuckSmlt08
Hamma smlt
HammaSmlt0850
23
Skamania Hat
Minter Mx45
7
Nisqually all
Puyallup
WhiteR all62
GreenR wild06
Cedar all90
58
33
Samish all
Nooksac
Nook2100
59
Stillagua smlt
Skag Mansr100
29
15
5
7
Snow all
BigBeef all
BeefSmlt08100
Dewat all
DewatSmlt08100
Tahuya all
TahuyaSmlt08100
91
90
39
Skokom all
SkokSmlt08100
21
Neighbor-joining treeC-S-E distances13 μsat loci
Includes 2008 and 2009 collections
East Hood Canal
West Hood Canal
Strait of Juan de Fuca
South/Central Sound
North Sound

Historical WDF steelhead catch data

Dendrogram of Gower SI of habitat characteristics
Ba
ker
No
rth
Fo
rk S
kyko
mis
h
Mid
dle
Fo
rk N
oo
ksa
ck
Ca
sca
de
So
uth
Fo
rk S
kyko
mis
h Elw
ha
Ha
mm
a H
am
ma
Ca
nyo
n
Fin
ne
y De
er
Sko
kom
ish
Sn
oq
ua
lmie
So
uth
Fo
rk N
oo
ksa
ck
To
lt
So
uth
Fo
rk S
tilla
gu
am
ish
Stil
lag
ua
mis
h
Do
sew
alli
ps
Du
cka
bu
sh D
un
ge
ne
ss
Sa
uk
Ca
rbo
n
Wh
ite
Gre
en
Ma
inst
em
_N
ort
h F
ork
No
oks
ack
Nis
qu
ally
Sn
oh
om
ish
_S
kyko
mis
h
Ca
se_
Ca
rr
Ea
st K
itsa
p
De
wa
tto
Un
ion
Ta
hu
ya
To
tten
Inle
t
Ha
mm
ers
ley
Eld
Da
kota
Sa
mis
h
La
ke W
ash
ing
ton
Pilc
hu
ck
Pu
yallu
p
De
sch
ute
s
Dis
cove
ry B
ay
Se
qu
im B
ay
Mo
rse
Ma
inst
em
_S
kag
it_T
rib
s.
0.0
0.1
0.2
0.3
0.4
0.5
Dendrogram of agnes(x = daisy(dat[, varNames1], metric = "gower"))
Agglomerative Coefficient = 0.81daisy(dat[, varNames1], metric = "gower")
He
igh
t
High precip, snow pack(and SSH)
Wider, more
spawn-able area
SJFRain dominated,
generally smaller

How can we combine these data in a way that helps to identify DIPs?
Recent demographic independence
(PD)
Ecophenotypic differences
(EP)
Ecological distinctiveness
(ED)
Biological distinctiveness (BD)
Population independence
(IP)
Population dynamics
(PD.1)
W
W
Migration rates(PD.2)
Habitat characteristics
(EP.2)
Life history traits(EP.1)
W
Genetic distinctiveness
(GD)
Geographic isolation
(GI)
W
W
Stream gradient,
etc. (EP.2.A...)
W
Run timing,
etc. (EP.1.A...)
W
Tag recoverie
s, etc. (PD.2.A...)
W
Adult number,
etc. (PD.1.A...)
W
Geographic
distance, etc.
(GI.1.A...)
W
Genetic distance,
etc. (GD.1.A...
)
W
(from a concept by K. Currens, NWIFC)

Why a Decision Support System (DSS) framework?
• “Fuzzy logic” system systematically incorporates degree of uncertainty into decision making
• Almost any relevant criterion can be considered• Employs truth membership functions to evaluate the
degree to which propositions are true• Uses logical operators (e.g., “AND”, “UNION”,
“MEDIAN”, “AVERAGE”) and weighting factors to combine criteria
• Provides a transparent, systematic, and repeatable framework to reach decisions supported by the available data

A truth membership function
Fals
e
U
ncer
tain
T
rue
“Population will persist= FALSE”
“Population will persist= TRUE”
Trut
h va
lue
for p
ropo
sitio
n
1-P(extinction)
“I am completely uncertain whether the population will persist”

Some DSS DIP model inputs• Historic populations identified from WDF
steelhead catch statistics (1946-1970) and habitat-based intrinsic potential estimates• Minimum historic size (e.g., > 500 natural spawners/gen)• Minimum suitable habitat (e.g., > 20K m2 IP habitat)
• Recent demographic data estimated from spawner escapements and selected age structure data (1970s-present)
• Geographic distances, hydrographic data, and habitat features estimated from GIS data layers
• Genetic distances based on pairwise FST values from 13 microsatellite loci

Matrix of potential PS steelhead DIPs(Central/South Puget Sound WSH)
Lk Washington WSH Green WSH MS Puyallup WSH Nisqually WSH East Kitsap WSH
Lk Washington WSH -0.48642 0.132319 0.490463 0.301333
Green WSH -0.48642 0.164813 0.168309 0.056166
MS Puyallup WSH 0.132319 0.164813 -0.178016 -0.002167
Nisqually WSH 0.490463 0.168309 -0.178016 0.1435
East Kitsap WSH 0.301333 0.056166 -0.002167 0.1435DRAFT

Outline
• Status of the Puget Sound steelhead DPS
• Recent changes• Technical Recovery Team
(TRT) objectives• The TRT’s approach to
identifying viability criteria• Identifying DIPs & MPGs• Assessing viability of
DIPs, MPGs, and the DPS• Run type diversity; residency
and anadromy• Outlook

ESU viability:All MPGs must be viable
MPG viability
1 viable population from each major genetic and life-history
group.
2-4 viable populations
Phenotypic and genotypic variation at population level
Distribution of spawning
aggregations
Suggested population size
range
Historical Abundance SimSam Habitat-based
PVA (EDT)
CatastropheESU: Overall risk with distribution of pops and life histories in each MPG
Pop: % of affected by given catastrophe
Puget Sound Chinook salmon
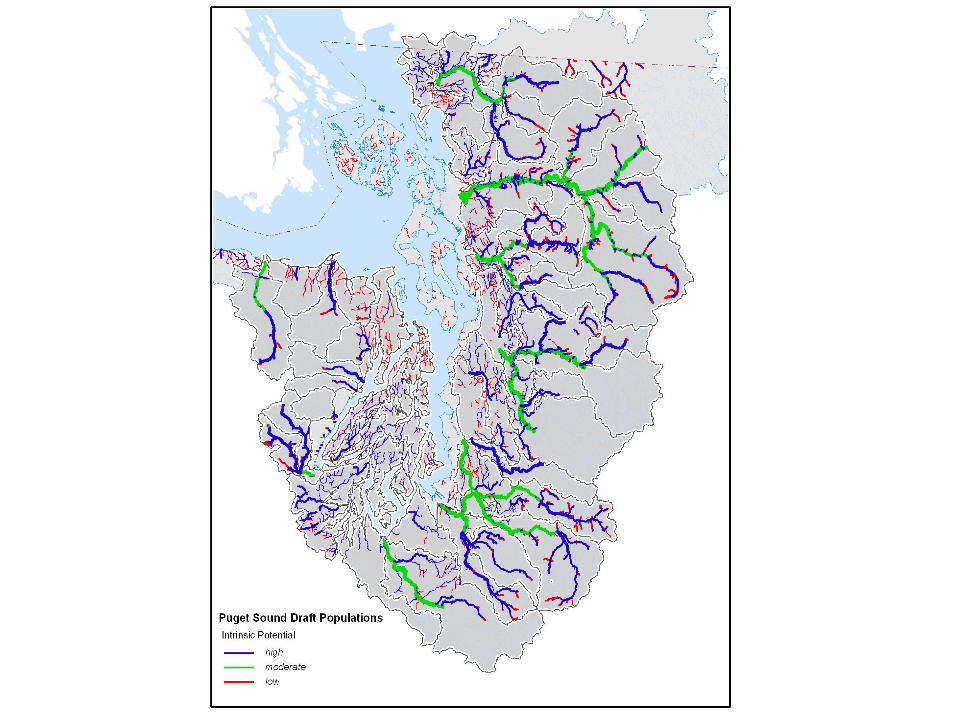
DSS viability criteria:
• population• stratum/MPG• entire ESU/DPS
AND
ES
ES-2
AND
ED-3ED-1
U
ED-1a ED-1b ED-1c ED-1d
ED-2
SF
32
PF1
. . .
AND
PF
PP*PD
AND
*See Persistence Criteria
PD-3 PD-4
UU
32
W-Sp1
. . . 32
W-Ju1
. . .
PD-1 PD-2
W-Sp W-Ju
AND
PS
M
SD
32
PS1
. . .
SS
AND
CB
SSA
. . .
AND
ES-1
U
ED-2a ED-2b
ES
U C
riter
ia
Str
atum
Crit
eria
Pop
ulat
ion
Crit
eria
Wat
ersh
ed
Crit
eria
Legend
Final outputs of the DSS
EP
The collection of results for lower-level criteriaiiiii
W-Ju i
Criteria evaluated from lower- level criteria
PP
Logical operatorsAND
Data is loaded into the DSS and evaluated with a truth membership function
PP-2
PP
Adult dist’n
Hatchery influence
Abundance
Juvenile dist’n
PS PF
PD
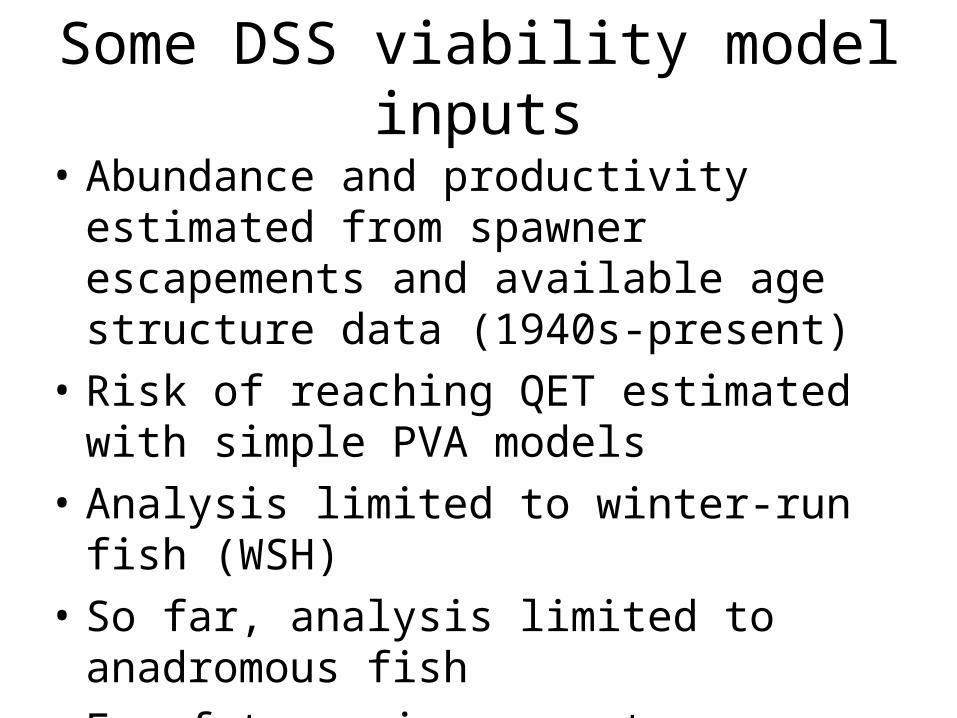
Some DSS viability model inputs
• Abundance and productivity estimated from spawner escapements and available age structure data (1940s-present)
• Risk of reaching QET estimated with simple PVA models
• Analysis limited to winter-run fish (WSH)• So far, analysis limited to anadromous fish• For future: incorporate iteroparity and relative
abundance of resident fish as VSP factors

DSS applied to PS steelhead viability: MPG and DPS levels
MPG MP MD MF MS DS DP
Strait of Georgia 0 -0.268 1 -0.036
Whidbey Basin 0.93 -0.029 1 0.221
Central/South Puget Sound 0 -0.302 0.689 -0.075 -0.805 0.093
Hood Canal 0 -0.340 -0.173 -0.312
Strait of Juan de Fuca 0 -0.316 -0.876 -0.861
…………..MPG level………….. …..DPS level…..
Persistence
Diversity
Functionality
Sustainabilit
y
Sustainabilit
y
Persistence
DRAFT

Outline
• Status of the Puget Sound steelhead DPS
• Recent changes• Technical Recovery Team
(TRT) objectives• The TRT’s approach to
identifying viability criteria• Identifying DIPs & MPGs• Assessing viability of
DIPs, MPGs, and the DPS• Run type diversity; residency
and anadromy• Outlook

VSP: DiversitySummer-run life history
• Historically at least 12 wild SSH populations existed in DPS
• In 2002 SaSI, 16 SSH populations were identified as extant• Most of “unknown” status; only 2 considered
“healthy” (Tolt, SF Skykomish [non-native])• 7 are monitored: Canyon Cr., Skagit,
Snohomish, Tolt, Stillaguamish, Green, Elwha• Estimates of escapement available for only Tolt
River SSH in northern Puget Sound

Smolts produced by resident spawners may be critical in supporting steelhead productivity
during periods of low marine survival
VSP: Diversityresidency & anadromy
Marine survival

Outline
• Status of the Puget Sound steelhead DPS
• Recent changes• Technical Recovery Team
(TRT) objectives• The TRT’s approach to
identifying viability criteria• Identifying DIPs & MPGs• Assessing viability of
DIPs, MPGs, and the DPS• Run type diversity; residency
and anadromy• Outlook

Outlook• TRT to identify draft viability criteria for Puget Sound
steelhead in 2010• NOAA status review update due in 2010• Recovery planning is underway• Additional analyses planned:
• Genetic samples• Finer-scale intrinsic potential estimates• Archived abundance and life history data• Puget Sound Chinook salmon gap analysis

FIN
Extra slides after this point
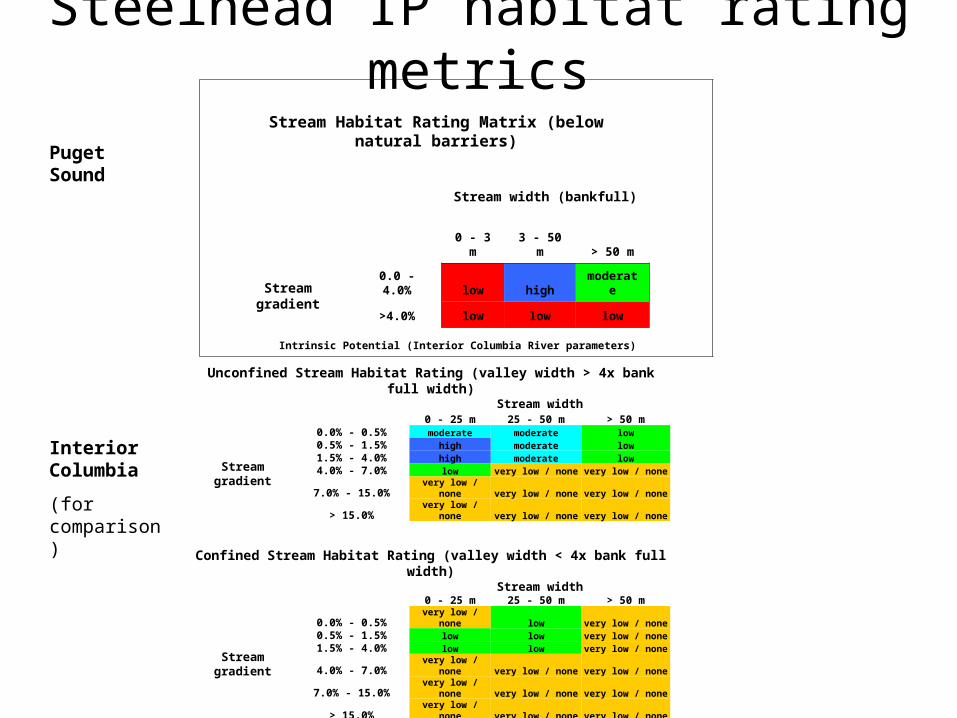
Steelhead IP habitat rating metrics
Intrinsic Potential (Interior Columbia River parameters)
Unconfined Stream Habitat Rating (valley width > 4x bank full width)Stream width
0 - 25 m 25 - 50 m > 50 m
Stream gradient
0.0% - 0.5% moderate moderate low0.5% - 1.5% high moderate low1.5% - 4.0% high moderate low4.0% - 7.0% low very low / none very low / none7.0% - 15.0% very low / none very low / none very low / none
> 15.0% very low / none very low / none very low / none
Confined Stream Habitat Rating (valley width < 4x bank full width)Stream width
0 - 25 m 25 - 50 m > 50 m
Stream gradient
0.0% - 0.5% very low / none low very low / none0.5% - 1.5% low low very low / none1.5% - 4.0% low low very low / none4.0% - 7.0% very low / none very low / none very low / none7.0% - 15.0% very low / none very low / none very low / none
> 15.0% very low / none very low / none very low / none
Weighted Habitat Areahigh = 1.0 x Bank full areamoderate = 0.5 x Bank full arealow = 0.25 x Bank full areavery low / none = 0.0 x Bank full area
Stream Habitat Rating Matrix (below natural barriers)
Stream width (bankfull)
0 - 3 m 3 - 50 m > 50 m
Stream gradient
0.0 - 4.0% low high moderate
>4.0% low low low
Puget Sound
Interior Columbia
(for comparison)
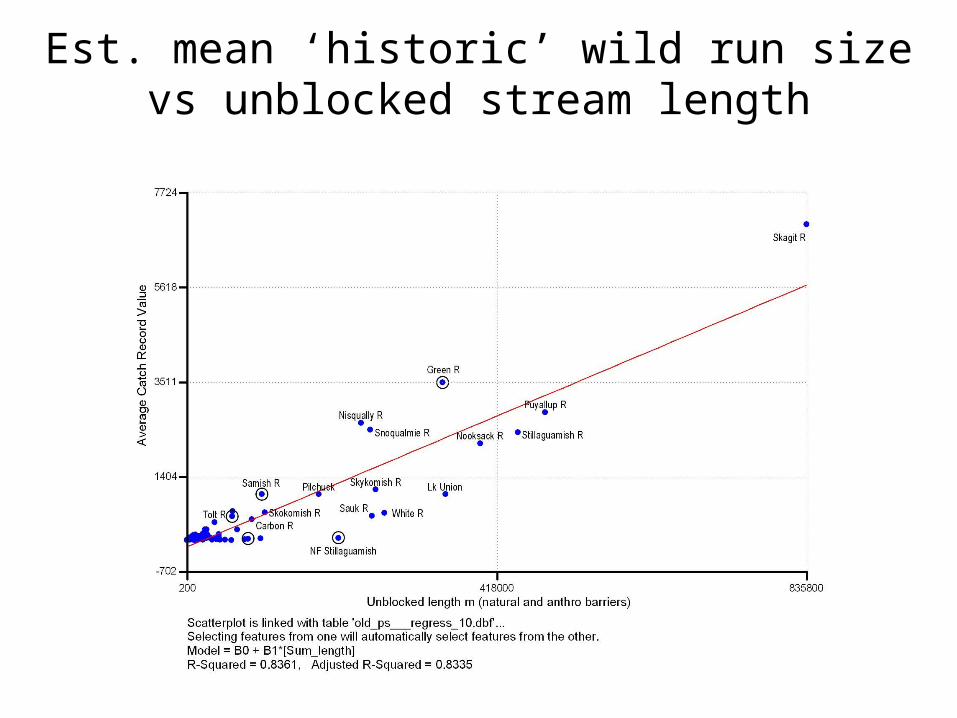
Est. mean ‘historic’ wild run size vs unblocked stream length

Spawner capacity estimates
Assuming:7.17 parr/100 m2
0.0265 spnrs/parr(Gibbons et al. 1985)
WinterSummer
Run type
Baker
Rive
r
Bound
ary W
ater
s
Canyo
n Cre
ek
Casca
de R
iver
Deer C
reek
Dunge
ness
Rive
r
East K
itsap
Elwha
Rive
r
Green
Rive
r
Lake
Was
hingt
on
MS S
kagit
Rive
r
Mor
se C
reek
NF Sky
kom
ish R
iver
Nisqua
lly R
iver
Nooks
ack R
iver
Pilchu
ck R
iver
Puyall
up R
iver
SF Noo
ksac
k Rive
r
Samish
Rive
r
Sauk R
iver
Sequim
Inde
pend
ents
Skoko
mish
Rive
r
Snoho
mish
Rive
r
Snoqu
almie
River
South
Sou
nd
Stillag
uam
ish R
iver
Tolt R
iver
Upper
Cas
cade
Rive
r
Wes
t Hoo
d Can
al
Wes
t Kits
ap
Whit
e Rive
r
Population
0
10,000
20,000
30,000
40,000
50,000
60,000
70,000
Po
ten
tial s
pa
wn
ers