Embed Size (px)
Citation preview
T E C H N I C A L R E P O R T 0 5 0
Developing Sitka Spruce Populations for Resistance to the White Pine WeevilSummary of Research and Breeding Program
2009
Ministry of Forests and RangeForest Science Program
050
Ministry of Forests and RangeForest Science Program
Developing Sitka Spruce Populations for Resistance to the White Pine WeevilSummary of Research and Breeding Program
John N. King and René I. Alfaro

The use of trade, firm, or corporation names in this publication is for the information and convenience of the reader. Such use does not constitute an official endorsement or approval by the Government of British Columbia of any product or service to the exclusion of any others that may also be suitable. Contents of this report are presented for discussion purposes only. Funding assistance does not imply endorsement of any statements or information contained herein by the Government of British Columbia. Uniform Resource Locators (urls), addresses, and contact information contained in this document are current at the time of printing unless otherwise noted.
© 2009 Province of British Columbia When using information from this or any Forest Science Program report,
please cite fully and correctly.
Library and Archives Canada Cataloguing in Publication DataKing, John N. (John Norman), 1947-Developing Sitka spruce populations for resistance to the white pine weevil : summary of research and breeding program / John N. King, René I. Alfaro.
(Technical report ; 050) Includes bibliographical references. isbn 978-0-7726-6120-3
1. Sitka spruce--Diseases and pests--Control--British Columbia. 2. Sitka spruce--Disease and pest resistance--British Columbia. 3. Sitka spruce—Breeding
--British Columbia. 4. Sitka spruce--Propagation--British Columbia. 5. White pine weevil--Control--British Columbia. 6. Forest management--British Columbia. 7. Forest ecology--British Columbia. I. Alfaro, René I. II. British Columbia. Forest Science Program III. Title. IV. Series: Technical report (British Columbia. Forest Science Program) ; 050
sb945.w62k56 2009 634.9'7526768 c2009-909968-3
Citation King, J.N. and R.I. Alfaro. 2009. Developing Sitka spruce populations for resistance to the white pine weevil: summary of research and breeding program. B.C. Min. For. Range, For. Sci. Prog., Victoria, B.C. Tech. Rep. 050. www.for.gov.bc.ca/hfd/pubs/Docs/Tr/Tr050.htm
Prepared byJohn N. King René I. AlfaroB.C. Ministry of Forests and Range Natural Resources CanadaResearch Branch Pacific Forestry CentrePo Box 9519, Stn Prov Govt 506-W-Burnside Rd.Victoria, BC v8w 9c2 Victoria, BC v8z 1m5
Copies of this report may be obtained, depending on supply, from:Crown Publications, Queen's Printers2nd Floor, 563 Superior StreetVictoria, BC V8w 9v7Toll free 1-800-663-6105www.crownpub.bc.ca
For more information on Forest Science Program publications, visit www.for.gov.bc.ca/scripts/hfd/pubs/hfdcatalog/index.asp
iii
AbstrAct
This publication reports on the results of over two decades of research in the Sitka Spruce Breeding Program. The objective of the Sitka spruce (Picea sitchensis [Bong.] Carr.) breeding program is to develop, propagate, and de-ploy genotypes with robust resistance to the white pine weevil (Pissodes strobi Peck). The program is based on research that has been conducted on the extent and nature of genetic resistance in Sitka spruce populations in British Columbia. This research has international stature and provides a successful model for incorporating the results of research on natural genetic resistance to insect pests into applied breeding programs and proactive forest manage-ment.
ExEcutivE summAry
The Sitka spruce breeding program has been an ongoing cooperative effort between the Research Branch of the B.C. Forest Service, the Pacific Forestry Centre, and B.C. universities. By building on prior knowledge and develop-ing new research installations, our goal is to enable managers to restore the Sitka spruce component of the regenerated forests of coastal British Co-lumbia. The revival of this fast-growing and valuable species will benefit the forest industry, forest-dependent communities, and the provincial economy. It will also support the restoration of an important component of our coastal forest ecosystems. To date, research activities have included studies of individual trees, fami-lies, and source populations that express weevil resistance; the development of methods to screen for resistance; and efforts to identify the physiological and genetic controls of these resistance mechanisms. From the late 1970s to the present, close to 100,000 trees have been established in nearly 100 ex-perimental plots (eps) (Appendix 1). Detailed studies of insect outbreaks and population dynamics have been conducted in these plots, the results of which may provide useful guidelines beyond just the spruce/weevil system. An evaluation of hazard rating and seed transfer has also been part of this pro-gram. When final results are available, they will be incorporated into existing best practices guidelines for forest management in Sitka spruce habitat. This report details the historic development and ongoing activities of the Sitka spruce breeding program.
Key results of the program include the following:1. development of a methodology for rapid screening of weevil resistance
using artificial infestations (Alfaro et al. 2008);2. development of methods to quantify resistance based on statistically
testable data (King et al. 2004); 3. screening of many populations, families, and individuals to identify
those with durable resistance (this report);
iv
4. propagation of the best individuals and families into seed orchards that are now producing seeds with a high degree of resistance (this report);
5. indications that the basis for the resistance is very likely a complex interaction of genotype and environment, manifested by more than one resistance mechanism. Factors in this resistance include density of scle-reid cells and resin canals. In some genotypes, a very strong resistance was observed (Alfaro et al. 2002); and
6. indications that resistance is stable, viable over a wide area, and appears durable over the phase of susceptibility to attack. New guidelines for deploying resistant Sitka spruce were proposed as a means of encourag-ing foresters to use Sitka spruce more often and in higher proportions on suitable sites in the Coast Forest Region (following Heppner and Turner 2006).
AcknowlEdgEmEnts
This report represents over two decades of research, mainly by the B.C. Min-istry of Forests and Range (mfr), Research Branch, initially spearheaded by Cheng Ying; and the Canadian Forest Service (cfs). Key support was pro-vided by Simon Fraser University, particularly John Borden and his associ-ates and students, and co-operators in the British Columbia forest industry, especially John Barker and Annette van Niejenhuis of Western Forest Prod-ucts Ltd. our field staff deserve the lion’s share of thanks. From the B.C. Ministry of Forests and Range: Charlie Cartwright, Doug Ashbee, and David Pons-ford. From the Canadian Forest Service: Lara van Akker and George Brown. Without the dedication of these people none of these results could have been achieved. our thanks to the following reviewers: Barry Jaquish (mfr), Don Heppner (mfr), Peter ott (mfr), Jodie Krakowski (mfr), Gaëtan Daoust (cfs), and Robert Lavallée (cfs). We would like to acknowledge Moraia Grau and Jodie Krakowski for all their help in editing this report and the managers at mfr (Alvin Yanchuk in particular) and the cfs for their continued support for this program. We would also like to thank the Forest Genetics Council for funding the prepress work of this publication.

v
contEnts
Abstract . . . . . . . . . . . . . . . . . . . . . . . . . . . . . . . . . . . . . . . . . . . . . . . . . . . . . . . . . . . . . . . . . . . . . . . . . . . . . . . iii
Executive Summary . . . . . . . . . . . . . . . . . . . . . . . . . . . . . . . . . . . . . . . . . . . . . . . . . . . . . . . . . . . . . . . . . iii
Acknowledgements . . . . . . . . . . . . . . . . . . . . . . . . . . . . . . . . . . . . . . . . . . . . . . . . . . . . . . . . . . . . . . . . . . iv
1 Introduction and Background . . . . . . . . . . . . . . . . . . . . . . . . . . . . . . . . . . . . . . . . . . . . . . 1
2 Description of Weevil Resistance Programs . . . . . . . . . . . . . . . . . . . . . . . . . . . . . . . 5 2.1 Provenance Program . . . . . . . . . . . . . . . . . . . . . . . . . . . . . . . . . . . . . . . . . . . . . . . . . . . . . . . . . 5 2.1.1 iufro series . . . . . . . . . . . . . . . . . . . . . . . . . . . . . . . . . . . . . . . . . . . . . . . . . . . . . . . . . . . . . 5 2.1.2 Summary of provenance program results . . . . . . . . . . . . . . . . . . . . . . . . . 6 2.2 Weevil Resistance Screening Programs . . . . . . . . . . . . . . . . . . . . . . . . . . . . . . . . . . . 8 2.2.1 Selection . . . . . . . . . . . . . . . . . . . . . . . . . . . . . . . . . . . . . . . . . . . . . . . . . . . . . . . . . . . . . . . . 8 2.2.2 Screening with weevil enhancement . . . . . . . . . . . . . . . . . . . . . . . . . . . . . . . 8
3 Results of Screening . . . . . . . . . . . . . . . . . . . . . . . . . . . . . . . . . . . . . . . . . . . . . . . . . . . . . . . . . 10 3.1 Clonal Trials . . . . . . . . . . . . . . . . . . . . . . . . . . . . . . . . . . . . . . . . . . . . . . . . . . . . . . . . . . . . . . . . . . 10 3.1.1 Fair Harbour grafted clonal program . . . . . . . . . . . . . . . . . . . . . . . . . . . . . . 10 3.1.2 Sayward and other clonal trials . . . . . . . . . . . . . . . . . . . . . . . . . . . . . . . . . . . . . 12 3.2 Weevil Screening Family Trials . . . . . . . . . . . . . . . . . . . . . . . . . . . . . . . . . . . . . . . . . . . . 13 3.2.1 Jordan River series . . . . . . . . . . . . . . . . . . . . . . . . . . . . . . . . . . . . . . . . . . . . . . . . . . . . 13 3.2.2 Port Renfrew, Camp 4 series op trials . . . . . . . . . . . . . . . . . . . . . . . . . . . . . 16 3.2.3 Coombs series . . . . . . . . . . . . . . . . . . . . . . . . . . . . . . . . . . . . . . . . . . . . . . . . . . . . . . . . . 17 3.3 Summary of Screening: Distribution of Resistance . . . . . . . . . . . . . . . . . . . . 17 3.4 Summary of Screening: Ranking Families and Resistance Values . . . . . . . . . . . . . . . . . . . . . . . . . . . . . . . . . . . . . . . . . . . . . . . . . . . . . . . . . . . . 20 3.5 Breeding and Establishment of F1 Trials . . . . . . . . . . . . . . . . . . . . . . . . . . . . . . . . . . 22
4 Mechanisms of Resistance . . . . . . . . . . . . . . . . . . . . . . . . . . . . . . . . . . . . . . . . . . . . . . . . . 22 4.1 Resistance Mechanisms to Weevil Attack in Spruce Populations . . . . . . . . . . . . . . . . . . . . . . . . . . . . . . . . . . . . . . . . . . . . . . . . . . . . . . . . . . 23 4.1.1 Feeding, egg laying, failed and successful attack incidence . . . . . . . . . . . . . . . . . . . . . . . . . . . . . . . . . . . . . . . . . . . . . . . . . . . . . . . 23 4.1.2 Repellence or hindrance defences against insects . . . . . . . . . . . . . . . 23 4.1.3 Toxic defences: the 898 story . . . . . . . . . . . . . . . . . . . . . . . . . . . . . . . . . . . . . . . . 24 4.1.4 Phenology, population dynamics, and biological defences . . . . . . . . . . . . . . . . . . . . . . . . . . . . . . . . . . . . . . . . . . . . . . . . . . . . 25 4.2 Characterizing Resistance Mechanisms of Known Resistant Populations . . . . . . . . . . . . . . . . . . . . . . . . . . . . . . . . . . . . . . . . . . . . . . . . . . . . . . . 25 4.3 Understanding the Genetic Basis of the Expressed Phenotypic Resistance . . . . . . . . . . . . . . . . . . . . . . . . . . . . . . . . . . . . . . . . . . . . . . . . . . . . . . 26

vi
5 Deployment . . . . . . . . . . . . . . . . . . . . . . . . . . . . . . . . . . . . . . . . . . . . . . . . . . . . . . . . . . . . . . . . . . . 27 5.1 Delivery Program . . . . . . . . . . . . . . . . . . . . . . . . . . . . . . . . . . . . . . . . . . . . . . . . . . . . . . . . . . . . 27 5.1.1 Seed orchards and the b+ seedlot program . . . . . . . . . . . . . . . . . . . . . . . 27 5.1.2 Cuttings and somatic embling programs . . . . . . . . . . . . . . . . . . . . . . . . . . 29 5.2 Demonstration and Silvicultural Trials . . . . . . . . . . . . . . . . . . . . . . . . . . . . . . . . . . 29 5.2.1 Silvicultural trials . . . . . . . . . . . . . . . . . . . . . . . . . . . . . . . . . . . . . . . . . . . . . . . . . . . . . 29 5.2.2 Hazard evaluation trials . . . . . . . . . . . . . . . . . . . . . . . . . . . . . . . . . . . . . . . . . . . . . 29
6 Other Spruce Programs . . . . . . . . . . . . . . . . . . . . . . . . . . . . . . . . . . . . . . . . . . . . . . . . . . . . 30 6.1 Interior Spruce Program . . . . . . . . . . . . . . . . . . . . . . . . . . . . . . . . . . . . . . . . . . . . . . . . . . . 30 6.2 Nass/Skeena Transition Program . . . . . . . . . . . . . . . . . . . . . . . . . . . . . . . . . . . . . . . . . 30 6.3 Queen Charlotte Islands Program . . . . . . . . . . . . . . . . . . . . . . . . . . . . . . . . . . . . . . . . 31
7 Summary and Conclusion . . . . . . . . . . . . . . . . . . . . . . . . . . . . . . . . . . . . . . . . . . . . . . . . . . 32
8 References . . . . . . . . . . . . . . . . . . . . . . . . . . . . . . . . . . . . . . . . . . . . . . . . . . . . . . . . . . . . . . . . . . . . . 33
Glossary of Terms used in this publication . . . . . . . . . . . . . . . . . . . . . . . . . . . . . . . . . . . . . . 39
appendices
1 Trial Sites . . . . . . . . . . . . . . . . . . . . . . . . . . . . . . . . . . . . . . . . . . . . . . . . . . . . . . . . . . . . . . . . . . . . . . . . . . . 42 1a Provenance Trials . . . . . . . . . . . . . . . . . . . . . . . . . . . . . . . . . . . . . . . . . . . . . . . . . . . . . . . . . . . . 43 1b Clonal Trials—Weevil Screening . . . . . . . . . . . . . . . . . . . . . . . . . . . . . . . . . . . . . . . . . . 43 1c op Progeny Trials—Weevil Screening . . . . . . . . . . . . . . . . . . . . . . . . . . . . . . . . . . . . 43 1d op Progeny Trials—qci and others . . . . . . . . . . . . . . . . . . . . . . . . . . . . . . . . . . . . . . 44 1e F1 Trial Series . . . . . . . . . . . . . . . . . . . . . . . . . . . . . . . . . . . . . . . . . . . . . . . . . . . . . . . . . . . . . . . . 45 1f Demonstration, Silvicultural Interaction, and Hazard Evaluation Trials . . . . . . . . . . . . . . . . . . . . . . . . . . . . . . . . . . . . . . . . . . . . . . . . . . . . . . . . . . . . . 45 1g Sitka Spruce Hybrid Trials . . . . . . . . . . . . . . . . . . . . . . . . . . . . . . . . . . . . . . . . . . . . . . . . . 46
2 Sources of Parent Trees in Screening Trials . . . . . . . . . . . . . . . . . . . . . . . . . . . . . . . . . . . 47 2a Source of Parent Trees: ep 702.06—Clonal Series . . . . . . . . . . . . . . . . . . . . . . 47 2b Source of Parent Trees: ep 702.08.01—Jordan River Series 1992 . . . . . 53 2c Source of Parent Trees: ep 702.08.02—Port Renfrew Series 1994 . . . . 55 2d Source of Parent Trees: ep 702.08.03—Camp 4 Series 1995 . . . . . . . . . . . 56 2e Source of Parent Trees: ep 702.08.04—Coombs Series 1999 . . . . . . . . . . 58
3 Population Resistance Values from Provenance Trials . . . . . . . . . . . . . . . . . . . . . 61
vii
tables1 Geographic locations, years of observation, and weevil attack levels in the Sitka spruce provenance trials . . . . . . . . . . . . . . . . . . . . . . . . . . . . 62 Twenty-year mean heights and mean annual attack of Sitka spruce from eight regions at five provenance trials . . . . . . . . . . . . . . . . . . . . 73 Geographic locations, year of augmentation, numbers of years of observation, and weevil attack levels in the clonal series and open-pollinated series trials . . . . . . . . . . . . . . . . . . . . . . . . . . . . . . . . . . . . . . . . 104 Provenance source levels for mean annual attack and evidence of eggs at two sites in the Jordan River series trial . . . . . . . . . . . . . . . 155 Mean annual attack and standard errors for different regions in the open-pollinated trials . . . . . . . . . . . . . . . . . . . . . . . . . . . . . . . . . . . . . . . . . . . 186 Sample of screened families and selected clones showing mean annual attack and standard error for series, provenances, registration number for tested parent trees, and resistance value . . . . . . . . . . . . . . . . . . . . . . . . . . . . . . . . . . . . . . . . . . . . . . . . . . . . . . . . . . . . . . 21
figures1 Severe attack and plantation failure at the Green Timbers plantation in Surrey, B.C. . . . . . . . . . . . . . . . . . . . . . . . . . . . . . . . . . . . . . . . . . . . . . . . . . . . . . . . . . . 12 Severe and repeated attack leads to prominent bushy growth habit . . . . . . . 23 Sitka spruce weevil hazard zones showing the early defined provenances for resistance: hybrid zone, Big Qualicum, and Haney . . . . . . . . . . . . . . . . . . . . . . . . . . . . . . . . . . . . . . . . . . . . . . . . . . . . . . . . . . . . . . . . . . . . . . . . . . . 44 Linear trend of 20-year height growth and latitude of seed origin at Rennell Sound provenance test site . . . . . . . . . . . . . . . . . . . . . . . . . . . . . . . . . . 85 Weevil augmentation: two or three weevils are placed in live crown in late summer or fall . . . . . . . . . . . . . . . . . . . . . . . . . . . . . . . . . . . . . . . . . . . . . . . . . . . . . 96 Fair Harbour results: differences between resistant, hybrid, and susceptible clones . . . . . . . . . . . . . . . . . . . . . . . . . . . . . . . . . . . . . . . . . . . . . . . . . . . . . . . . . . . 117 Mean annual attack rate of the East Vancouver Island resistant source compared to typical susceptible sources across sites reported by increasing hazard scale . . . . . . . . . . . . . . . . . . . . . . . . . . . . . . . . . . . . . . . . . . . 138 Weevil population dynamics at six of the screening sites since weevil release . . . . . . . . . . . . . . . . . . . . . . . . . . . . . . . . . . . . . . . . . . . . . . . . . . . . . . . . . . . . . . . 149 Resistant provenances by mean annual attack level, and zones of high and low natural resistance . . . . . . . . . . . . . . . . . . . . . . . . . . . . . . . . . . . . . . . . . . . . . 1910 Rings of traumatic resin canals . . . . . . . . . . . . . . . . . . . . . . . . . . . . . . . . . . . . . . . . . . . . . . . . . 2411 High sclereid density and low sclereid density clones . . . . . . . . . . . . . . . . . . . . . . 2612 Big Qualicum origin spruce showing excellent growth and no weevil damage at a high hazard site . . . . . . . . . . . . . . . . . . . . . . . . . . . . . . . . . . . . . . . 28
1
1 introduction And bAckground
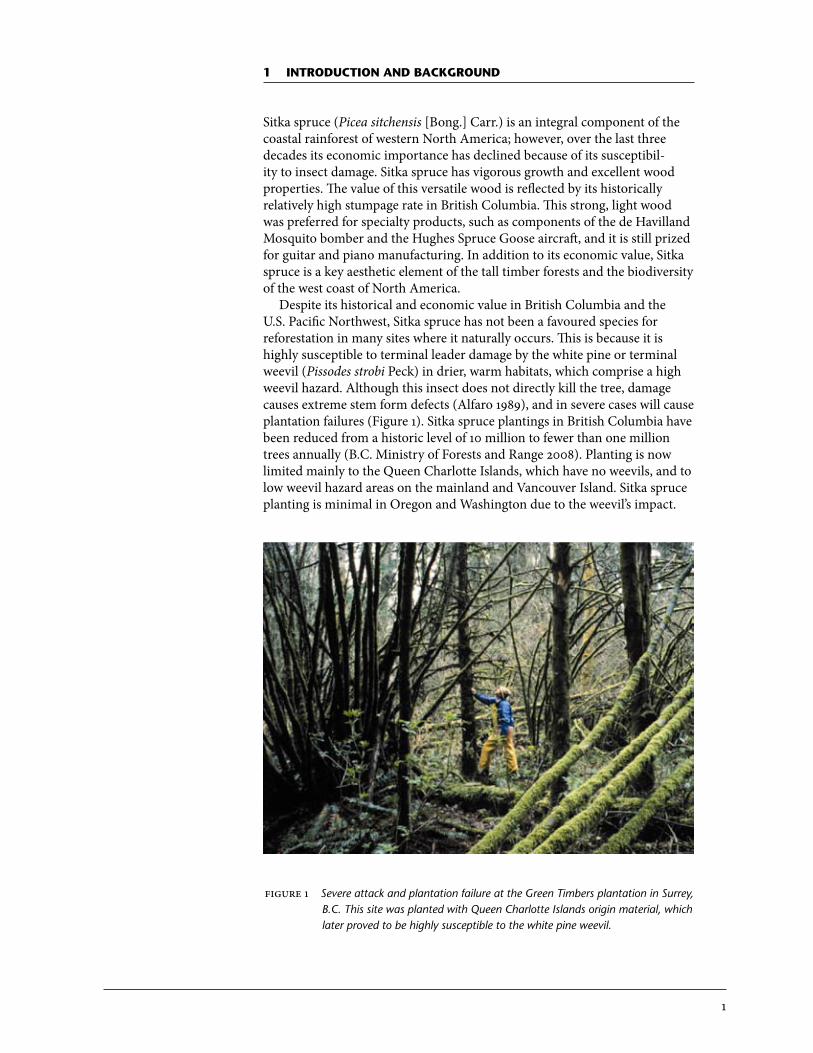
Sitka spruce (Picea sitchensis [Bong.] Carr.) is an integral component of the coastal rainforest of western North America; however, over the last three decades its economic importance has declined because of its susceptibil-ity to insect damage. Sitka spruce has vigorous growth and excellent wood properties. The value of this versatile wood is reflected by its historically relatively high stumpage rate in British Columbia. This strong, light wood was preferred for specialty products, such as components of the de Havilland Mosquito bomber and the Hughes Spruce Goose aircraft, and it is still prized for guitar and piano manufacturing. In addition to its economic value, Sitka spruce is a key aesthetic element of the tall timber forests and the biodiversity of the west coast of North America. Despite its historical and economic value in British Columbia and the U.S. Pacific Northwest, Sitka spruce has not been a favoured species for reforestation in many sites where it naturally occurs. This is because it is highly susceptible to terminal leader damage by the white pine or terminal weevil (Pissodes strobi Peck) in drier, warm habitats, which comprise a high weevil hazard. Although this insect does not directly kill the tree, damage causes extreme stem form defects (Alfaro 1989), and in severe cases will cause plantation failures (Figure 1). Sitka spruce plantings in British Columbia have been reduced from a historic level of 10 million to fewer than one million trees annually (B.C. Ministry of Forests and Range 2008). Planting is now limited mainly to the Queen Charlotte Islands, which have no weevils, and to low weevil hazard areas on the mainland and Vancouver Island. Sitka spruce planting is minimal in oregon and Washington due to the weevil’s impact.
figure 1 Severe attack and plantation failure at the Green Timbers plantation in Surrey, B.C. This site was planted with Queen Charlotte Islands origin material, which later proved to be highly susceptible to the white pine weevil.
2
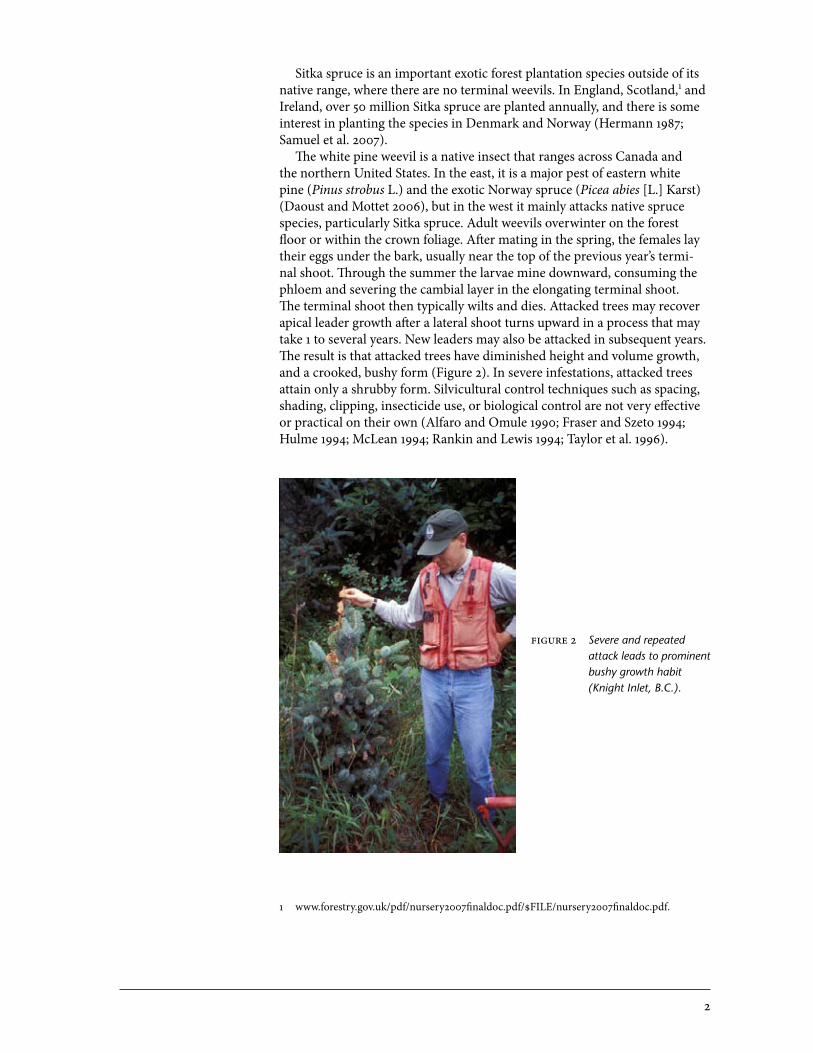
Sitka spruce is an important exotic forest plantation species outside of its native range, where there are no terminal weevils. In England, Scotland,1 and Ireland, over 50 million Sitka spruce are planted annually, and there is some interest in planting the species in Denmark and Norway (Hermann 1987; Samuel et al. 2007). The white pine weevil is a native insect that ranges across Canada and the northern United States. In the east, it is a major pest of eastern white pine (Pinus strobus L.) and the exotic Norway spruce (Picea abies [L.] Karst) (Daoust and Mottet 2006), but in the west it mainly attacks native spruce species, particularly Sitka spruce. Adult weevils overwinter on the forest floor or within the crown foliage. After mating in the spring, the females lay their eggs under the bark, usually near the top of the previous year’s termi-nal shoot. Through the summer the larvae mine downward, consuming the phloem and severing the cambial layer in the elongating terminal shoot. The terminal shoot then typically wilts and dies. Attacked trees may recover apical leader growth after a lateral shoot turns upward in a process that may take 1 to several years. New leaders may also be attacked in subsequent years. The result is that attacked trees have diminished height and volume growth, and a crooked, bushy form (Figure 2). In severe infestations, attacked trees attain only a shrubby form. Silvicultural control techniques such as spacing, shading, clipping, insecticide use, or biological control are not very effective or practical on their own (Alfaro and omule 1990; Fraser and Szeto 1994; Hulme 1994; McLean 1994; Rankin and Lewis 1994; Taylor et al. 1996).
figure 2 Severe and repeated attack leads to prominent bushy growth habit (Knight Inlet, B.C.).
1 www.forestry.gov.uk/pdf/nursery2007finaldoc.pdf/$FILE/nursery2007finaldoc.pdf.
3
The discovery of genetic resistance to the white pine weevil likely offers the best chance of restoring Sitka spruce within the coastal forest manage-ment system. Sitka spruce genotypes that were clearly resistant to weevil damage were first noted in British Columbia in the early 1940s at the Green Timbers plantation in Surrey (Figure 1), where five trees escaped an extreme attack that destroyed a 10-ha Sitka spruce plantation (Alfaro 1982, 1995; Alfa-ro and Wegwitz 1994). Populations and individuals differ in their susceptibil-ity to weevil attack. Mitchell et al. (1990) noticed that natural hybrids of Sitka and white spruce (Picea glauca [Moench] Voss) showed markedly less attack than pure Sitka spruce, although hybrid growth rates varied greatly. F1 hy-brids, the offspring of controlled crosses between one Sitka and one white spruce parent, have been tested by the British Forest Commission.2 Although early growth was sometimes promising, long-term performance could not match that of pure Sitka spruce. Lutz spruce (the name often used for the natural hybrid) was grown commercially for a limited time in Washington and oregon, but its poor overall growth performance made it an unattractive option.3
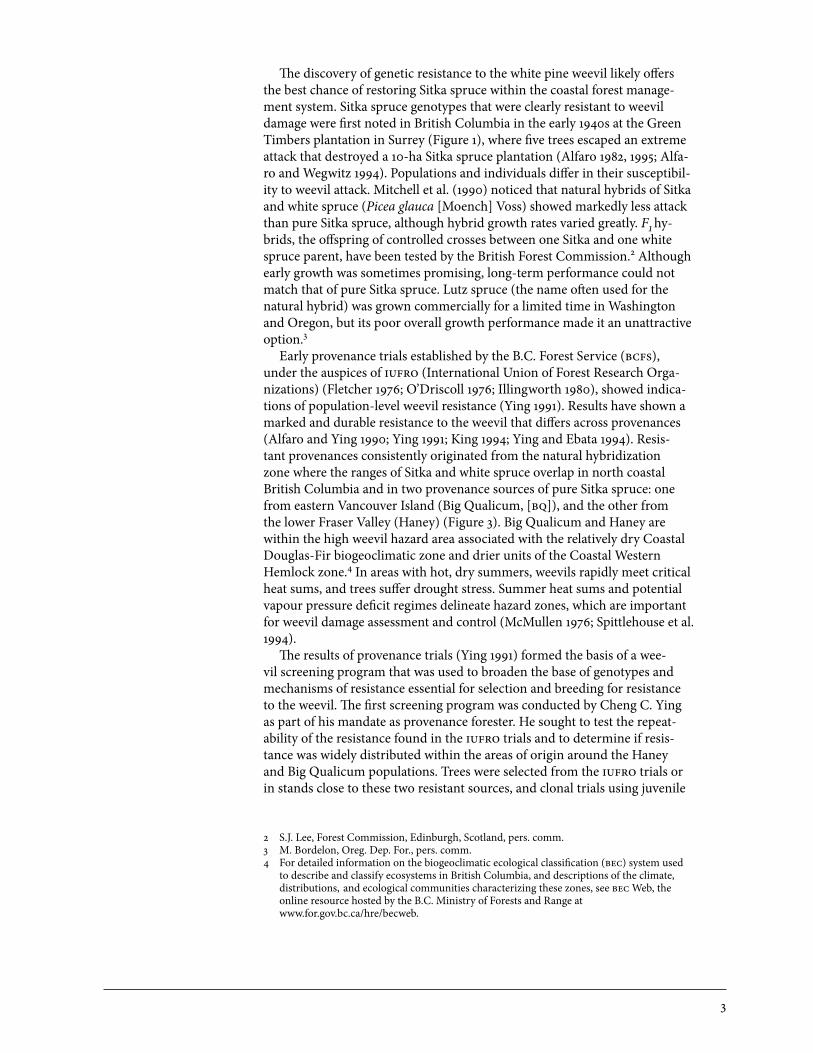
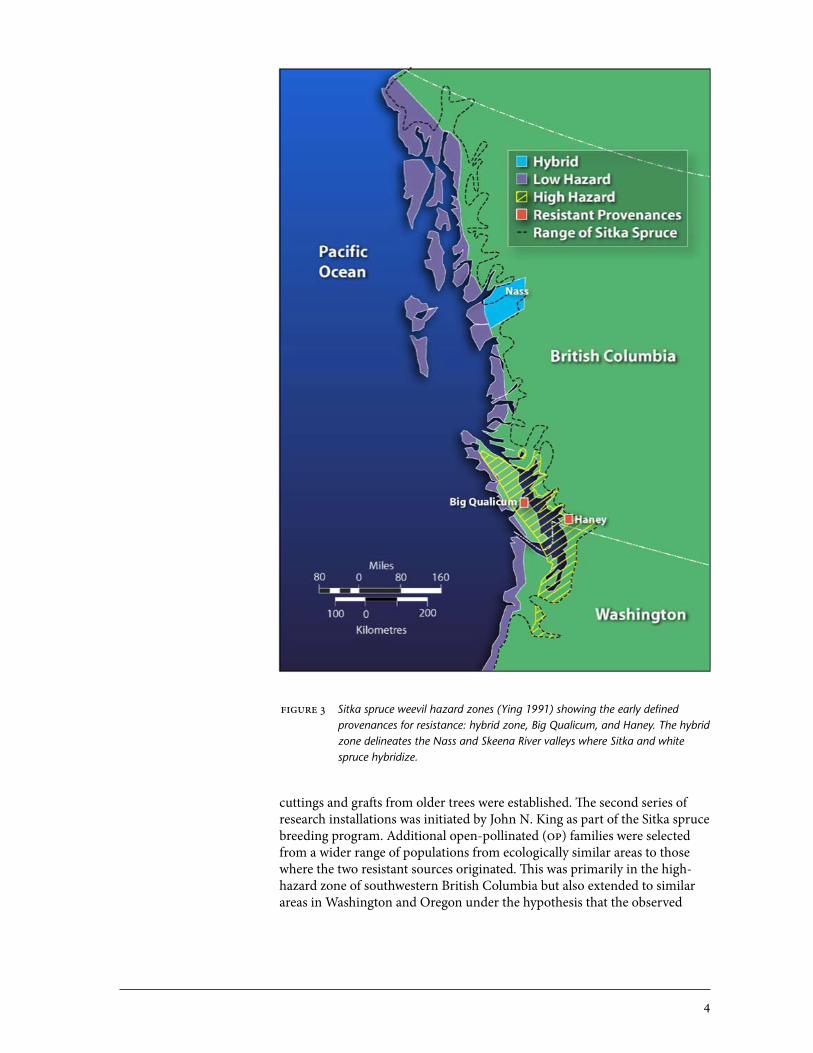
Early provenance trials established by the B.C. Forest Service (bcfs), under the auspices of iufro (International Union of Forest Research orga-nizations) (Fletcher 1976; o’Driscoll 1976; Illingworth 1980), showed indica-tions of population-level weevil resistance (Ying 1991). Results have shown a marked and durable resistance to the weevil that differs across provenances (Alfaro and Ying 1990; Ying 1991; King 1994; Ying and Ebata 1994). Resis-tant provenances consistently originated from the natural hybridization zone where the ranges of Sitka and white spruce overlap in north coastal British Columbia and in two provenance sources of pure Sitka spruce: one from eastern Vancouver Island (Big Qualicum, [bq]), and the other from the lower Fraser Valley (Haney) (Figure 3). Big Qualicum and Haney are within the high weevil hazard area associated with the relatively dry Coastal Douglas-Fir biogeoclimatic zone and drier units of the Coastal Western Hemlock zone.4 In areas with hot, dry summers, weevils rapidly meet critical heat sums, and trees suffer drought stress. Summer heat sums and potential vapour pressure deficit regimes delineate hazard zones, which are important for weevil damage assessment and control (McMullen 1976; Spittlehouse et al. 1994). The results of provenance trials (Ying 1991) formed the basis of a wee-vil screening program that was used to broaden the base of genotypes and mechanisms of resistance essential for selection and breeding for resistance to the weevil. The first screening program was conducted by Cheng C. Ying as part of his mandate as provenance forester. He sought to test the repeat-ability of the resistance found in the iufro trials and to determine if resis-tance was widely distributed within the areas of origin around the Haney and Big Qualicum populations. Trees were selected from the iufro trials or in stands close to these two resistant sources, and clonal trials using juvenile
2 S.J. Lee, Forest Commission, Edinburgh, Scotland, pers. comm.3 M. Bordelon, oreg. Dep. For., pers. comm.4 For detailed information on the biogeoclimatic ecological classification (bec) system used to describe and classify ecosystems in British Columbia, and descriptions of the climate, distributions, and ecological communities characterizing these zones, see bec Web, the online resource hosted by the B.C. Ministry of Forests and Range at www.for.gov.bc.ca/hre/becweb.
4
cuttings and grafts from older trees were established. The second series of research installations was initiated by John N. King as part of the Sitka spruce breeding program. Additional open-pollinated (op) families were selected from a wider range of populations from ecologically similar areas to those where the two resistant sources originated. This was primarily in the high-hazard zone of southwestern British Columbia but also extended to similar areas in Washington and oregon under the hypothesis that the observed
figure 3 Sitka spruce weevil hazard zones (Ying 1991) showing the early defined provenances for resistance: hybrid zone, Big Qualicum, and Haney. The hybrid zone delineates the Nass and Skeena River valleys where Sitka and white spruce hybridize.
5
phenotypic resistance would be widely distributed within this zone due to natural selection pressure from high weevil attack levels (King 1994). Most of these clonal and op family trials have now been screened for weevil resis-tance. Artificial weevil infestations of experimental trials have allowed all of the selected populations to be screened very quickly; due to relatively uni-form weevil pressure across a test site, resistance screening can be completed approximately 5 years after establishment (Alfaro et al. 2001, 2008; King and Alfaro 2001). This report synthesizes the achievements to date of research on Sitka spruce breeding for terminal weevil resistance in British Columbia. It in-cludes a review of weevil resistance information for provenance trials that are now 30 years old and which have endured many years of intensive and repeated attack and assessment. Screening results from the clonal and op family trials are also reported. A Sitka spruce breeding program was estab-lished based on these results, and an F1 population has been established as an experimental population to study the mechanisms of resistance in detail and determine their inheritance. The breeding program, current knowledge of weevil resistance mechanisms, and a resistance rating system for Sitka spruce are described in this report. In addition, breeding and assessment programs for Sitka spruce growth and adaptability on the Queen Charlotte Islands (qci) and in the Nass/Skeena hybrid zone are discussed. This report also shows how in-depth monitoring of weevil infestations provides insights into host responses and defences, and can provide insights into other insect epidemics, including that of the mountain pine beetle. Finally, this report provides deployment guidelines for new resistant material that is now avail-able from provincial seed orchards.
2 dEscriPtion oF wEEvil rEsistAncE ProgrAms
British Columbia has a long history of provenance testing for commercial forestry species. The infrastructure dedicated to testing Sitka spruce, founded upon the iufro collection made by Alan Fletcher of the U.K. Forestry Com-mission, is second only to the large-scale province-wide testing of lodgepole pine (Pinus contorta var. latifolia Dougl. ex Loud.) (Illingworth 1978).
2.1.1 iufro series (ep 702.03, 702.04, 702.05) The iufro Sitka spruce provenance experiments (ep 702.04 and 702.05) are described in detail by Fletcher (1976), o’Driscoll (1976), and Ying (1991, 1997) (Appendix 1a). To summarize: 14 provenances were tested across eight sites with 10 provenances planted at each site. The tested provenances cover the species’ main coastal range from southeast Alaska to southern oregon and inland to the Sitka–white spruce hybridization zone around the Nass and Skeena Rivers of north coastal British Columbia. These trials were planted in a randomized complete block design with nine replications of nine-tree plots spaced at 3 × 3 m. Ying (1997) analyzed 20-year heights and Xu et al. (2000) analyzed 20-year volume and weevil attack in relation to ecological characteristics at the sites of planting and origin. Table 1 shows weevil attack levels at several of the eight iufro sites (rang-ing from 49°48' n to 55°04' n), that sustained the heaviest attack. Also shown
2.1 Provenance Program
6
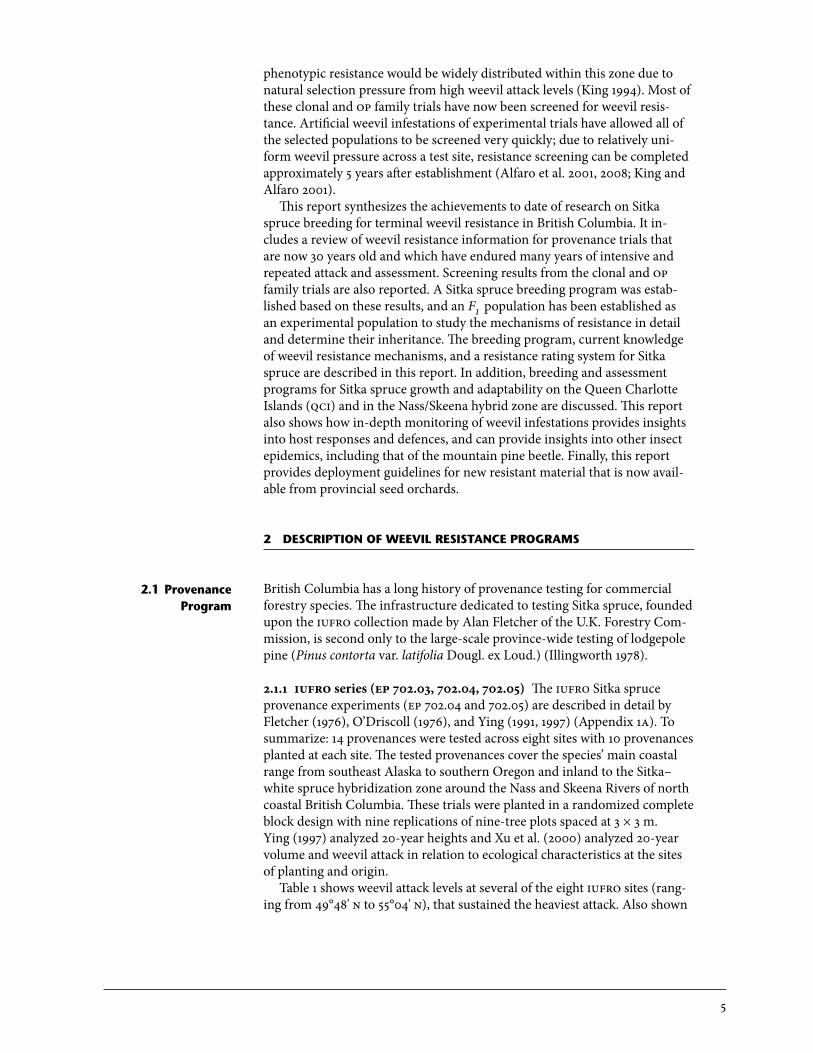
is a weevil-free site at Rennell Sound, qci, which was used to quantify potential height loss caused by weevil attack. Although not part of the iufro trials, a provenance trial at Sayward (Bigtree Creek, ep 702.03) on Vancouver Island is also included in Table 1. Surplus material from the iufro collec-tions, including additional provenances and op families, was planted at this site (Alfaro and Ying 1990; Ying 1991). Even though this site had design shortcomings (such as no replication of plots), the weevil attack results have been very informative. The results in Table 1 are based on data gathered from these provenance trials after 20 years, which follow up to 12 years of heavy and repeated weevil attack.
able 1 Geographic locations, years of observation, and weevil attack levels in the Sitka spruce provenance trials
Latitude Longitude Elevation Years of Cumulative Mean annualTrial (°n) (°w) (m) attack data attack (%) attack (%)
Nassa 55°04' 129°26' 15 12 93 37Kitimata 54°12' 128°33' 100 12 99 48Rennell Sounda 53°23' 132°28' 50 0 0 0Head Baya 49°48' 126°28' 15 10 91 33Sayward Bigtree Creek 50°13' 125°45' 75 9 95 40
a iufro trials (Ying 1997).
Mean annual attack (maa) refers to the percentage of trees attacked an-nually by weevil, and is used as an index of both weevil attack levels and susceptibility to attack. maa represents a successful leader kill, scored as 1 or 0 over several years during the peak years of attack, which in the case of the iufro trials, continued up to 12 years. An maa value of 0% is the minimum; often 50% or more is the maximum since an attacked tree typically needs an extra year for a dominant lateral shoot to take over as the leader. Heavy and repeated attacks of 50% or more usually do not allow the trees to recover, and usually result in a permanent bushy form, overtopping, and ultimately death. maa ranged from 0% at Rennell Sound, qci to 48% on the mainland at Kitimat (Table 1). maa for the entire trial is reported in Table 1 and by prov-enance or other entry (e.g., op family or clone) in subsequent tables.
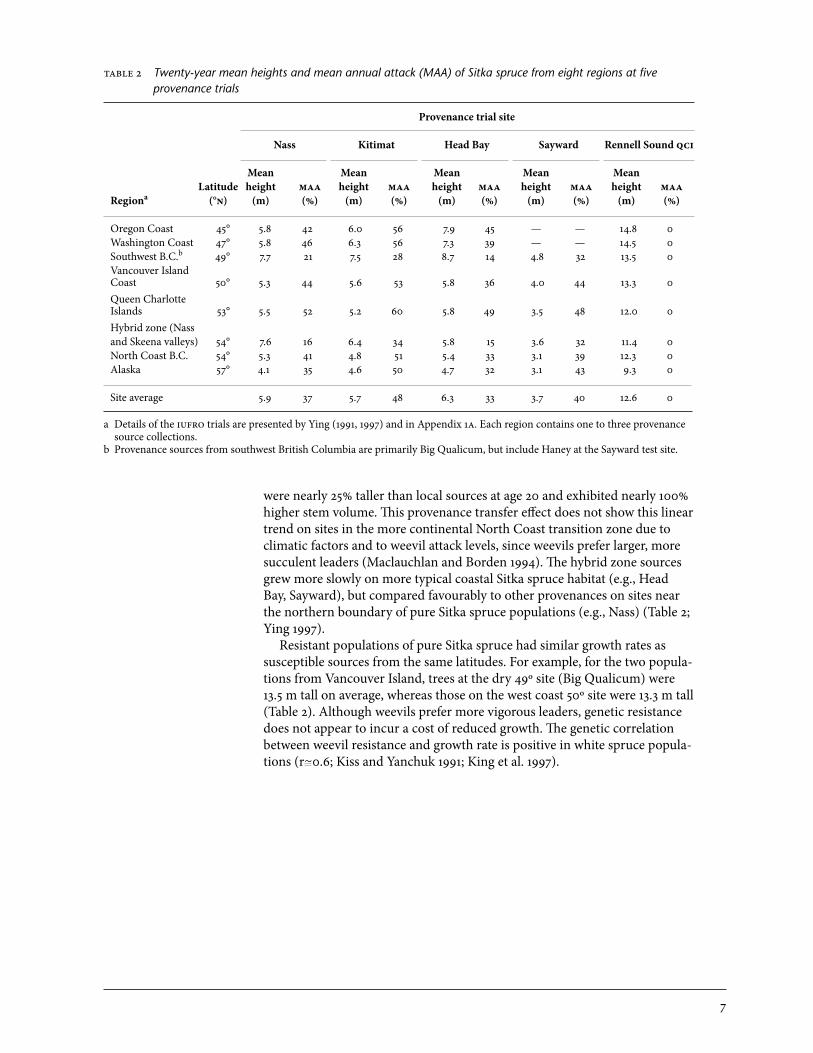
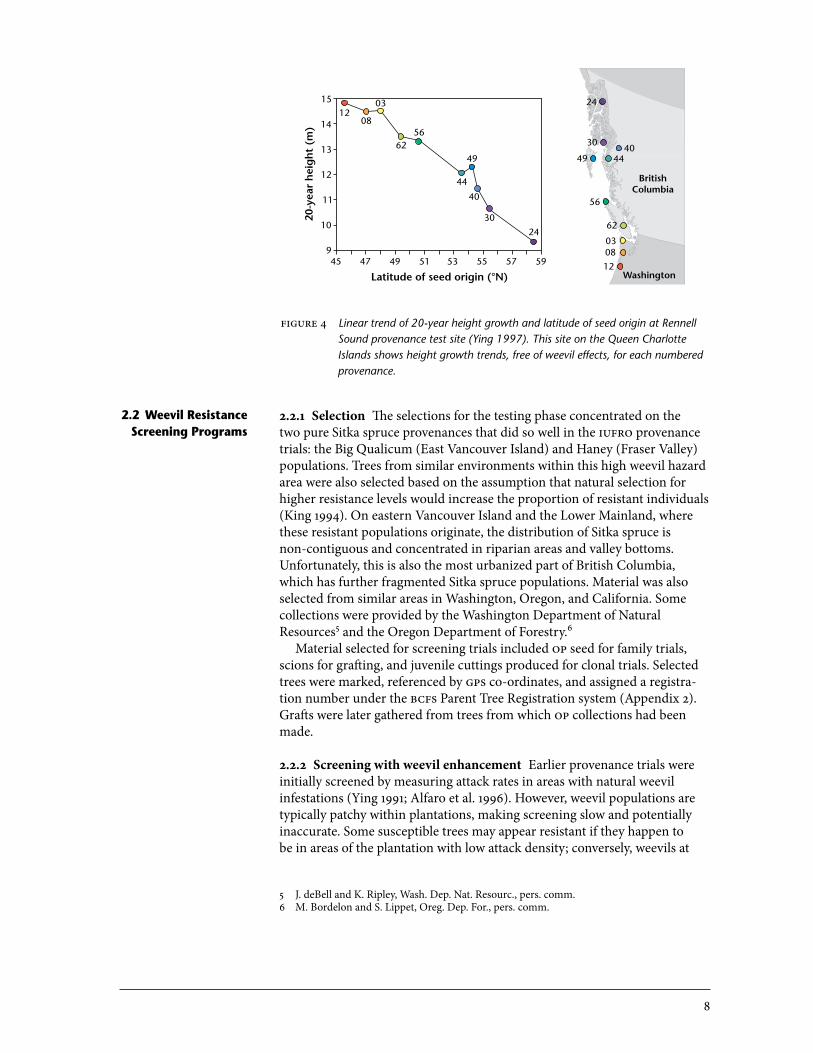
2.1.2 Summary of provenance program results The provenance trials show strong population source effects for resistance to weevil attack (Table 2). The worst overall provenances were the qci sources, followed closely by coastal sources (from oregon to north coastal British Columbia), with mean annual attack rates around 50%. Populations from the Sitka–white spruce hybridization zone and from the high-hazard dry ecological zones of southwestern British Columbia had weevil attack rates that were about half those of typical coastal wet-zone sources (Table 2, Figure 3). Strong provenance effects were also apparent for height growth. The significant north–south latitudinal effect on height reported by Ying (1997) was evident at the qci Rennell Sound site (Table 2, Figure 4), which suffered no weevil attack. Southern sources from oregon (moved north 7º latitude)
7
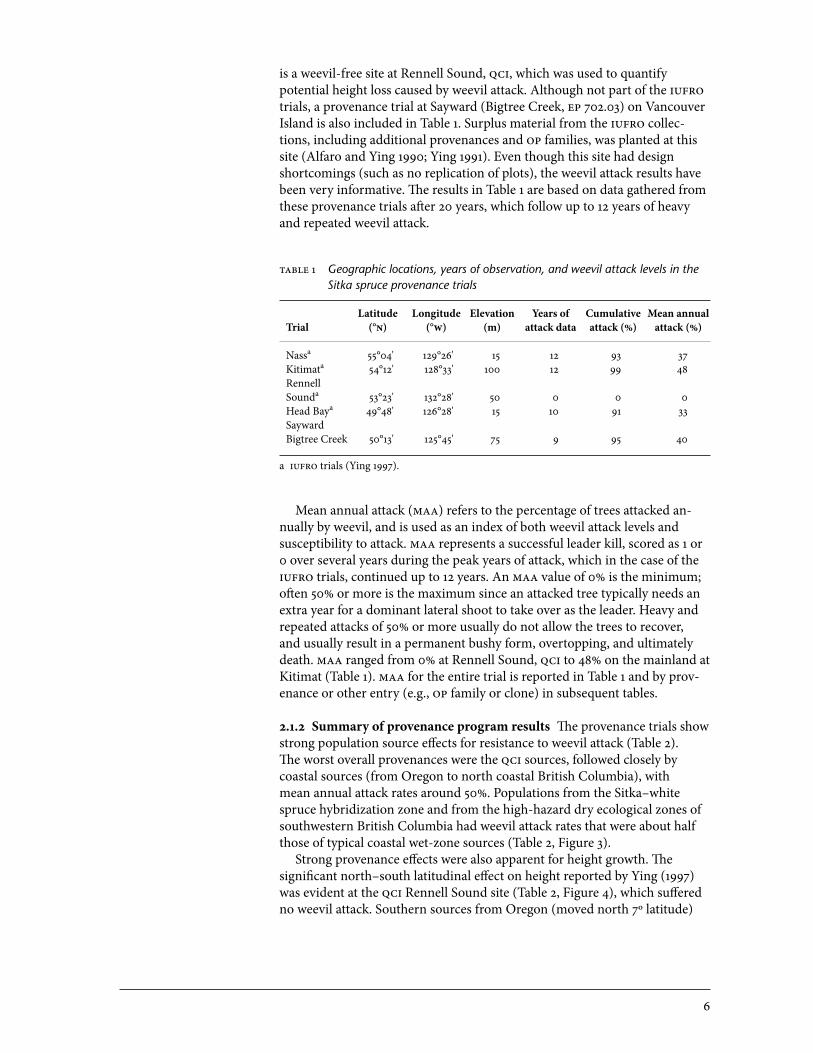
able 2 Twenty-year mean heights and mean annual attack (MAA) of Sitka spruce from eight regions at five provenance trials
Provenance trial site
Nass Kitimat Head Bay Sayward Rennell Sound qci
Mean Mean Mean Mean Mean Latitude height maa height maa height maa height maa height maaRegiona (°n) (m) (%) (m) (%) (m) (%) (m) (%) (m) (%)
oregon Coast 45° 5.8 42 6.0 56 7.9 45 — — 14.8 0Washington Coast 47° 5.8 46 6.3 56 7.3 39 — — 14.5 0Southwest B.C.b 49° 7.7 21 7.5 28 8.7 14 4.8 32 13.5 0Vancouver Island Coast 50° 5.3 44 5.6 53 5.8 36 4.0 44 13.3 0Queen Charlotte Islands 53° 5.5 52 5.2 60 5.8 49 3.5 48 12.0 0Hybrid zone (Nass and Skeena valleys) 54° 7.6 16 6.4 34 5.8 15 3.6 32 11.4 0North Coast B.C. 54° 5.3 41 4.8 51 5.4 33 3.1 39 12.3 0Alaska 57° 4.1 35 4.6 50 4.7 32 3.1 43 9.3 0
Site average 5.9 37 5.7 48 6.3 33 3.7 40 12.6 0
a Details of the iufro trials are presented by Ying (1991, 1997) and in Appendix 1a. Each region contains one to three provenance source collections.
b Provenance sources from southwest British Columbia are primarily Big Qualicum, but include Haney at the Sayward test site.
were nearly 25% taller than local sources at age 20 and exhibited nearly 100% higher stem volume. This provenance transfer effect does not show this linear trend on sites in the more continental North Coast transition zone due to climatic factors and to weevil attack levels, since weevils prefer larger, more succulent leaders (Maclauchlan and Borden 1994). The hybrid zone sources grew more slowly on more typical coastal Sitka spruce habitat (e.g., Head Bay, Sayward), but compared favourably to other provenances on sites near the northern boundary of pure Sitka spruce populations (e.g., Nass) (Table 2; Ying 1997). Resistant populations of pure Sitka spruce had similar growth rates as susceptible sources from the same latitudes. For example, for the two popula-tions from Vancouver Island, trees at the dry 49º site (Big Qualicum) were 13.5 m tall on average, whereas those on the west coast 50º site were 13.3 m tall (Table 2). Although weevils prefer more vigorous leaders, genetic resistance does not appear to incur a cost of reduced growth. The genetic correlation between weevil resistance and growth rate is positive in white spruce popula-tions (r~0.6; Kiss and Yanchuk 1991; King et al. 1997).
8
20-y
ear
hei
gh
t (m
)
Latitude of seed origin (°N)
9
10
11
12
13
14
15
45 47 49 51 53 55 57 59
12
12
08
08
03
03
62
62
56
56
44
4449 49
40
40
30
30
24
24
Washington
BritishColumbia
2.2.1 Selection The selections for the testing phase concentrated on the two pure Sitka spruce provenances that did so well in the iufro provenance trials: the Big Qualicum (East Vancouver Island) and Haney (Fraser Valley) populations. Trees from similar environments within this high weevil hazard area were also selected based on the assumption that natural selection for higher resistance levels would increase the proportion of resistant individuals (King 1994). on eastern Vancouver Island and the Lower Mainland, where these resistant populations originate, the distribution of Sitka spruce is non-contiguous and concentrated in riparian areas and valley bottoms. Unfortunately, this is also the most urbanized part of British Columbia, which has further fragmented Sitka spruce populations. Material was also selected from similar areas in Washington, oregon, and California. Some collections were provided by the Washington Department of Natural Resources5 and the oregon Department of Forestry.6 Material selected for screening trials included op seed for family trials, scions for grafting, and juvenile cuttings produced for clonal trials. Selected trees were marked, referenced by gps co-ordinates, and assigned a registra-tion number under the bcfs Parent Tree Registration system (Appendix 2). Grafts were later gathered from trees from which op collections had been made.
2.2.2 Screening with weevil enhancement Earlier provenance trials were initially screened by measuring attack rates in areas with natural weevil infestations (Ying 1991; Alfaro et al. 1996). However, weevil populations are typically patchy within plantations, making screening slow and potentially inaccurate. Some susceptible trees may appear resistant if they happen to be in areas of the plantation with low attack density; conversely, weevils at
figure 4 Linear trend of 20-year height growth and latitude of seed origin at Rennell Sound provenance test site (Ying 1997). This site on the Queen Charlotte Islands shows height growth trends, free of weevil effects, for each numbered provenance.
2.2 weevil resistance screening Programs
5 J. deBell and K. Ripley, Wash. Dep. Nat. Resourc., pers. comm.6 M. Bordelon and S. Lippet, oreg. Dep. For., pers. comm.
9
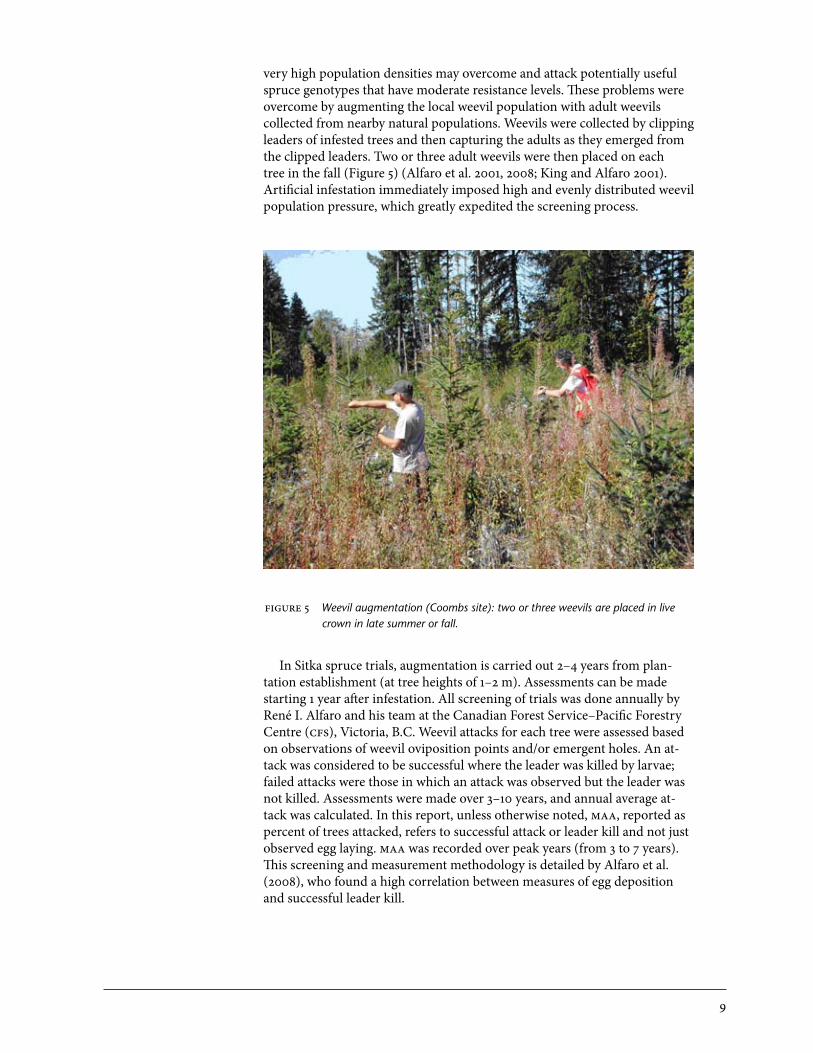
very high population densities may overcome and attack potentially useful spruce genotypes that have moderate resistance levels. These problems were overcome by augmenting the local weevil population with adult weevils collected from nearby natural populations. Weevils were collected by clipping leaders of infested trees and then capturing the adults as they emerged from the clipped leaders. Two or three adult weevils were then placed on each tree in the fall (Figure 5) (Alfaro et al. 2001, 2008; King and Alfaro 2001). Artificial infestation immediately imposed high and evenly distributed weevil population pressure, which greatly expedited the screening process.
In Sitka spruce trials, augmentation is carried out 2–4 years from plan-tation establishment (at tree heights of 1–2 m). Assessments can be made starting 1 year after infestation. All screening of trials was done annually by René I. Alfaro and his team at the Canadian Forest Service–Pacific Forestry Centre (cfs), Victoria, B.C. Weevil attacks for each tree were assessed based on observations of weevil oviposition points and/or emergent holes. An at-tack was considered to be successful where the leader was killed by larvae; failed attacks were those in which an attack was observed but the leader was not killed. Assessments were made over 3–10 years, and annual average at-tack was calculated. In this report, unless otherwise noted, maa, reported as percent of trees attacked, refers to successful attack or leader kill and not just observed egg laying. maa was recorded over peak years (from 3 to 7 years). This screening and measurement methodology is detailed by Alfaro et al. (2008), who found a high correlation between measures of egg deposition and successful leader kill.
figure 5 Weevil augmentation (Coombs site): two or three weevils are placed in live crown in late summer or fall.
10
Screening was completed on all the first-generation lines (clones and op families), and comprised over 400 entries (Appendix 2) across 20 test sites (Appendix 1), although not all of these sites were augmented.
3 rEsults oF scrEEning
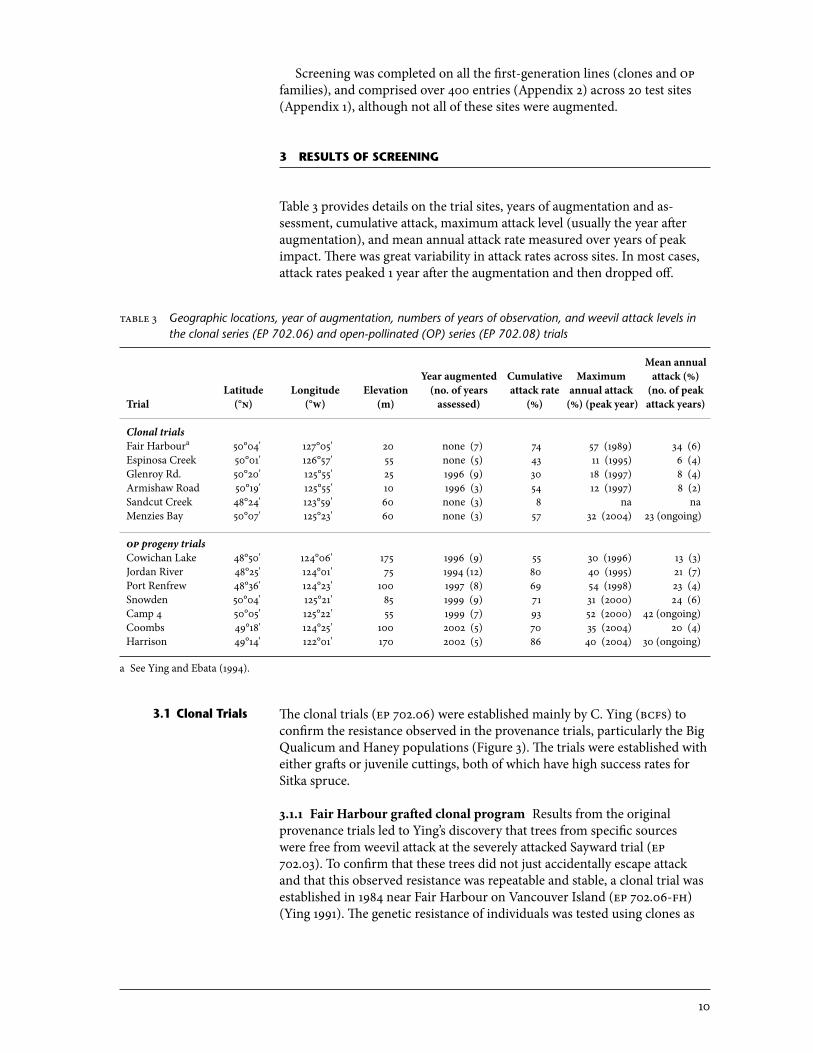
Table 3 provides details on the trial sites, years of augmentation and as-sessment, cumulative attack, maximum attack level (usually the year after augmentation), and mean annual attack rate measured over years of peak impact. There was great variability in attack rates across sites. In most cases, attack rates peaked 1 year after the augmentation and then dropped off.
able 3 Geographic locations, year of augmentation, numbers of years of observation, and weevil attack levels in the clonal series (EP 702.06) and open-pollinated (OP) series (EP 702.08) trials
Mean annual Year augmented Cumulative Maximum attack (%) Latitude Longitude Elevation (no. of years attack rate annual attack (no. of peak Trial (°n) (°w) (m) assessed) (%) (%) (peak year) attack years)
Clonal trials Fair Harboura 50°04' 127°05' 20 none (7) 74 57 (1989) 34 (6)Espinosa Creek 50°01' 126°57' 55 none (5) 43 11 (1995) 6 (4)Glenroy Rd. 50°20' 125°55' 25 1996 (9) 30 18 (1997) 8 (4)Armishaw Road 50°19' 125°55' 10 1996 (3) 54 12 (1997) 8 (2)Sandcut Creek 48°24' 123°59' 60 none (3) 8 na naMenzies Bay 50°07' 125°23' 60 none (3) 57 32 (2004) 23 (ongoing)
op progeny trials Cowichan Lake 48°50' 124°06' 175 1996 (9) 55 30 (1996) 13 (3)Jordan River 48°25' 124°01' 75 1994 (12) 80 40 (1995) 21 (7)Port Renfrew 48°36' 124°23' 100 1997 (8) 69 54 (1998) 23 (4)Snowden 50°04' 125°21' 85 1999 (9) 71 31 (2000) 24 (6)Camp 4 50°05' 125°22' 55 1999 (7) 93 52 (2000) 42 (ongoing)Coombs 49°18' 124°25' 100 2002 (5) 70 35 (2004) 20 (4)Harrison 49°14' 122°01' 170 2002 (5) 86 40 (2004) 30 (ongoing)
a See Ying and Ebata (1994).
The clonal trials (ep 702.06) were established mainly by C. Ying (bcfs) to confirm the resistance observed in the provenance trials, particularly the Big Qualicum and Haney populations (Figure 3). The trials were established with either grafts or juvenile cuttings, both of which have high success rates for Sitka spruce.
3.1.1 Fair Harbour grafted clonal program Results from the original provenance trials led to Ying’s discovery that trees from specific sources were free from weevil attack at the severely attacked Sayward trial (ep 702.03). To confirm that these trees did not just accidentally escape attack and that this observed resistance was repeatable and stable, a clonal trial was established in 1984 near Fair Harbour on Vancouver Island (ep 702.06-fh) (Ying 1991). The genetic resistance of individuals was tested using clones as
3.1 clonal trials
11
Num
ber
of
ann
ual w
eevi
l att
acks
Population
0.00
0.10
0.20
0.30
0.40
0.50
0.60
Resistant Hybrid QCI(Green Timbers)
Susceptible
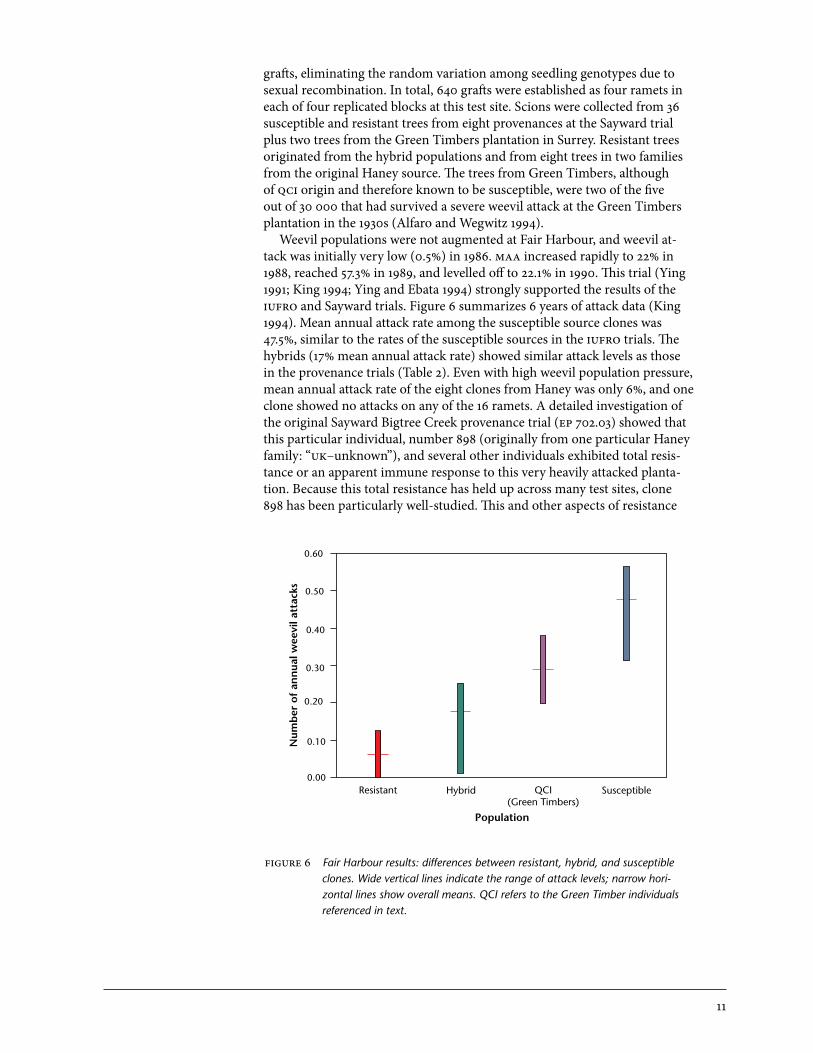
grafts, eliminating the random variation among seedling genotypes due to sexual recombination. In total, 640 grafts were established as four ramets in each of four replicated blocks at this test site. Scions were collected from 36 susceptible and resistant trees from eight provenances at the Sayward trial plus two trees from the Green Timbers plantation in Surrey. Resistant trees originated from the hybrid populations and from eight trees in two families from the original Haney source. The trees from Green Timbers, although of qci origin and therefore known to be susceptible, were two of the five out of 30 000 that had survived a severe weevil attack at the Green Timbers plantation in the 1930s (Alfaro and Wegwitz 1994). Weevil populations were not augmented at Fair Harbour, and weevil at-tack was initially very low (0.5%) in 1986. maa increased rapidly to 22% in 1988, reached 57.3% in 1989, and levelled off to 22.1% in 1990. This trial (Ying 1991; King 1994; Ying and Ebata 1994) strongly supported the results of the iufro and Sayward trials. Figure 6 summarizes 6 years of attack data (King 1994). Mean annual attack rate among the susceptible source clones was 47.5%, similar to the rates of the susceptible sources in the iufro trials. The hybrids (17% mean annual attack rate) showed similar attack levels as those in the provenance trials (Table 2). Even with high weevil population pressure, mean annual attack rate of the eight clones from Haney was only 6%, and one clone showed no attacks on any of the 16 ramets. A detailed investigation of the original Sayward Bigtree Creek provenance trial (ep 702.03) showed that this particular individual, number 898 (originally from one particular Haney family: “uk–unknown”), and several other individuals exhibited total resis-tance or an apparent immune response to this very heavily attacked planta-tion. Because this total resistance has held up across many test sites, clone 898 has been particularly well-studied. This and other aspects of resistance
figure 6 Fair Harbour results: differences between resistant, hybrid, and susceptible clones. Wide vertical lines indicate the range of attack levels; narrow hori-zontal lines show overall means. QCI refers to the Green Timber individuals referenced in text.

12
have been widely studied at the Fair Harbour site by cfs and Simon Fraser University entomologists (summarized in Section 4). Attack rates in the resistant hybrid and Haney populations were so low relative to the susceptible source clones that the distributions were non-over-lapping. Even susceptible clones with the fewest attacks had very high attack rates (Figure 6). Although the grafts from Green Timbers were expected to have high resistance levels, the mean attack rate of 29% was still much lower than any of the susceptible source clones, and was lower than any expected qci source material. This indicates that even in the highly susceptible qci population (where Pissodes strobi is absent), there is a low frequency of re-sistance. Since there are no weevils on qci, when that provenance is exposed to attack, it resembles an exotic pest introduction where the local population has had no opportunity to evolve resistance, which results in very high attack rates and negligible resistance.
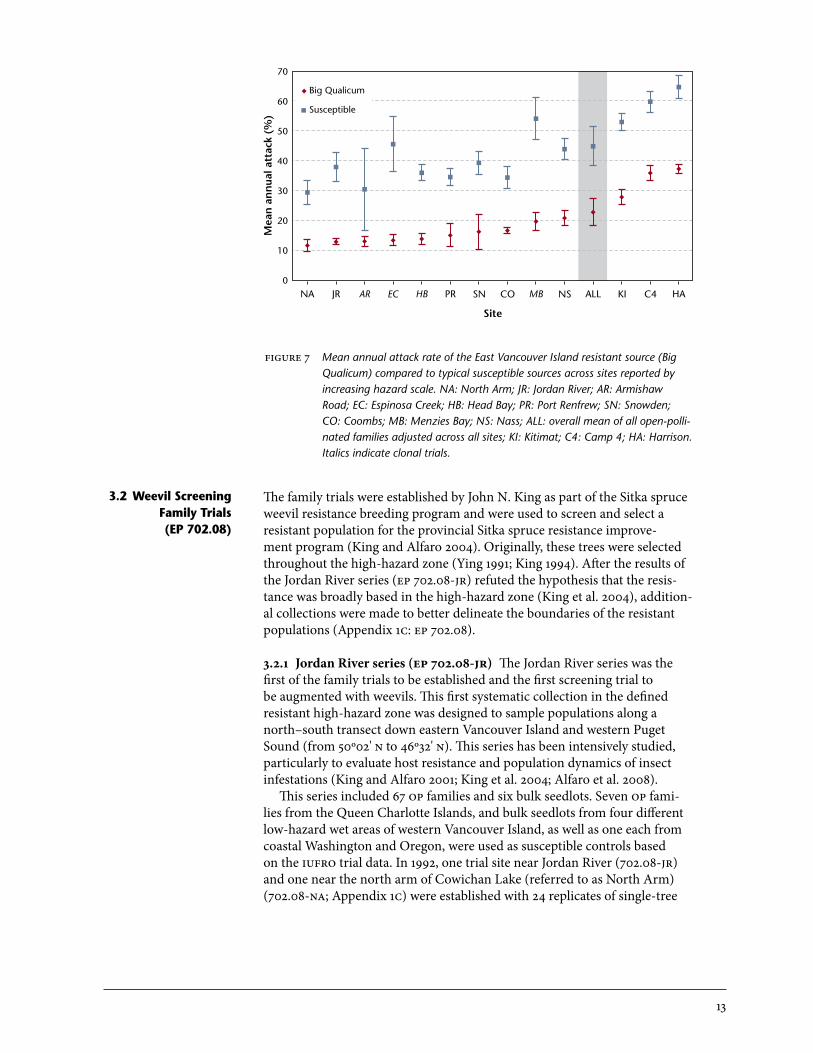
3.1.2 Sayward and other clonal trials (ep 702.06) Three clonal trials were established in 1991 and 1992 using juvenile cuttings or grafts. one site was installed in 1991 near Zeballos (Espinosa Creek, ep 702.06.2-ec), and two sites were planted at Sayward in 1992 (Glenroy Road, ep 702.06.3-gr and Armishaw Road, ep 702.06.4-ar; Appendix 1b). These trials included a more intensively sampled selection of trees from within the following provenance sources: (1) Haney (University of British Columbia Malcolm Knapp Research Forest and adjacent sites in Maple Ridge, especially Kanaka Creek), (2) Big Qualicum River on eastern Vancouver Island, and (3) selections from these two sources from the Nass and Kitimat iufro and Bigtree Creek trial sites. Also included were trees from natural populations around the Squamish area on the mainland south coast. Some known susceptible individuals, mainly from the iufro trials, were also added. The design was similar to Fair Harbour’s, with four replicates of four-tree-row plots. The Glenroy and Armishaw Road sites were augmented with weevils in September 1996 in half of the replicates. Espinosa Creek was left untreated to allow a natural weevil population to build up for comparison purposes. other clonal trials were established in 1997 at Menzies Bay and Sandcut Creek near Jordan River (southwest Vancouver Island). The test material for these trials was surplus grafts and juvenile cuttings from other clonal tri-als. The plot design was incomplete due to material availability. These two trials were not augmented, but natural weevil attacks were substantial at the Menzies Bay site and have been included in this analysis. Sandcut Creek, with only 8% cumulative attack by the last assessment, was excluded from the analysis. More detailed results are presented below (Section 3.2) for the op tri-als, which included more extensive sampling. Random samples were taken within the resistant and susceptible regions rather than re-testing selected trees from the provenance trials that had been emphasized in the clonal tri-als. Comparisons of resistant (Big Qualicum) and susceptible regions (west-ern Vancouver Island and qci) for the clonal (ep 702.06), op (ep 702.08), and iufro trials are presented in Figure 7. Resistant populations sustained approximately half the attack levels of susceptible populations over a wide variety of sites and test material. The overall mean annual attack rate for the combined op trials analysis (all: Figure 7) was 23% for resistant material and 45% for susceptible sources.
13
The family trials were established by John N. King as part of the Sitka spruce weevil resistance breeding program and were used to screen and select a resistant population for the provincial Sitka spruce resistance improve-ment program (King and Alfaro 2004). originally, these trees were selected throughout the high-hazard zone (Ying 1991; King 1994). After the results of the Jordan River series (ep 702.08-jr) refuted the hypothesis that the resis-tance was broadly based in the high-hazard zone (King et al. 2004), addition-al collections were made to better delineate the boundaries of the resistant populations (Appendix 1c: ep 702.08).
3.2.1 Jordan River series (ep 702.08-jr) The Jordan River series was the first of the family trials to be established and the first screening trial to be augmented with weevils. This first systematic collection in the defined resistant high-hazard zone was designed to sample populations along a north–south transect down eastern Vancouver Island and western Puget Sound (from 50º02' n to 46º32' n). This series has been intensively studied, particularly to evaluate host resistance and population dynamics of insect infestations (King and Alfaro 2001; King et al. 2004; Alfaro et al. 2008). This series included 67 op families and six bulk seedlots. Seven op fami-lies from the Queen Charlotte Islands, and bulk seedlots from four different low-hazard wet areas of western Vancouver Island, as well as one each from coastal Washington and oregon, were used as susceptible controls based on the iufro trial data. In 1992, one trial site near Jordan River (702.08-jr) and one near the north arm of Cowichan Lake (referred to as North Arm) (702.08-na; Appendix 1c) were established with 24 replicates of single-tree
figure 7 Mean annual attack rate of the East Vancouver Island resistant source (Big Qualicum) compared to typical susceptible sources across sites reported by increasing hazard scale. NA: North Arm; JR: Jordan River; AR: Armishaw Road; EC: Espinosa Creek; HB: Head Bay; PR: Port Renfrew; SN: Snowden; CO: Coombs; MB: Menzies Bay; NS: Nass; ALL: overall mean of all open-polli-nated families adjusted across all sites; KI: Kitimat; C4: Camp 4; HA: Harrison. Italics indicate clonal trials.
3.2 weevil screening Family trials (EP 702.08)
Mea
n a
nn
ual a
ttac
k (%
)
Site
0
10
20
30
40
Big Qualicum
Susceptible
50
60
70
NA JR AR EC HB PR SN CO MB NS ALL KI C4 HA
14
100
90
80
70
60
50
40
30
20
10
0100
90
80
70
60
50
40
30
20
10
0100
90
80
70
60
50
40
30
20
10
0
Pro
po
rtio
n o
f p
op
ulat
ion
(%
)
Years since augmentation
0 1 2 3 4 5 6 7 8 9 10 11 12 0 1 2 3 4 5 6 7 8 9 10 11 12
JR
SNC4
AR EC
PR
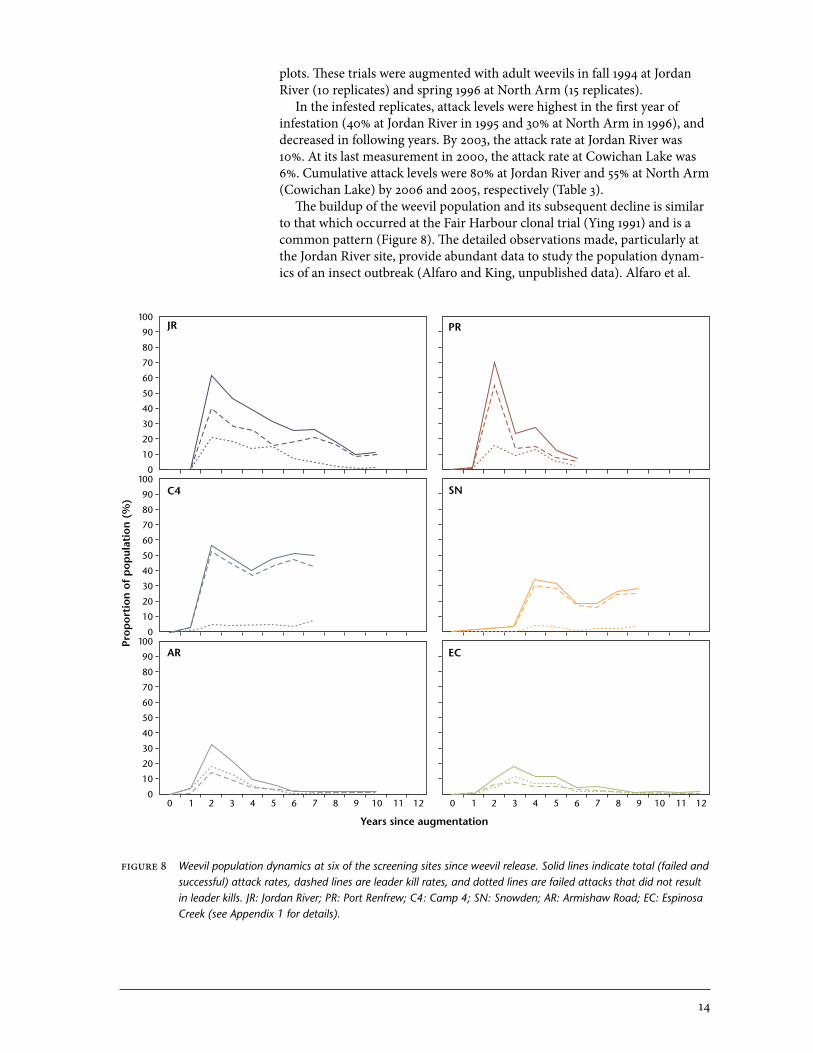
plots. These trials were augmented with adult weevils in fall 1994 at Jordan River (10 replicates) and spring 1996 at North Arm (15 replicates). In the infested replicates, attack levels were highest in the first year of infestation (40% at Jordan River in 1995 and 30% at North Arm in 1996), and decreased in following years. By 2003, the attack rate at Jordan River was 10%. At its last measurement in 2000, the attack rate at Cowichan Lake was 6%. Cumulative attack levels were 80% at Jordan River and 55% at North Arm (Cowichan Lake) by 2006 and 2005, respectively (Table 3). The buildup of the weevil population and its subsequent decline is similar to that which occurred at the Fair Harbour clonal trial (Ying 1991) and is a common pattern (Figure 8). The detailed observations made, particularly at the Jordan River site, provide abundant data to study the population dynam-ics of an insect outbreak (Alfaro and King, unpublished data). Alfaro et al.
figure 8 Weevil population dynamics at six of the screening sites since weevil release. Solid lines indicate total (failed and successful) attack rates, dashed lines are leader kill rates, and dotted lines are failed attacks that did not result in leader kills. JR: Jordan River; PR: Port Renfrew; C4: Camp 4; SN: Snowden; AR: Armishaw Road; EC: Espinosa Creek (see Appendix 1 for details).
15
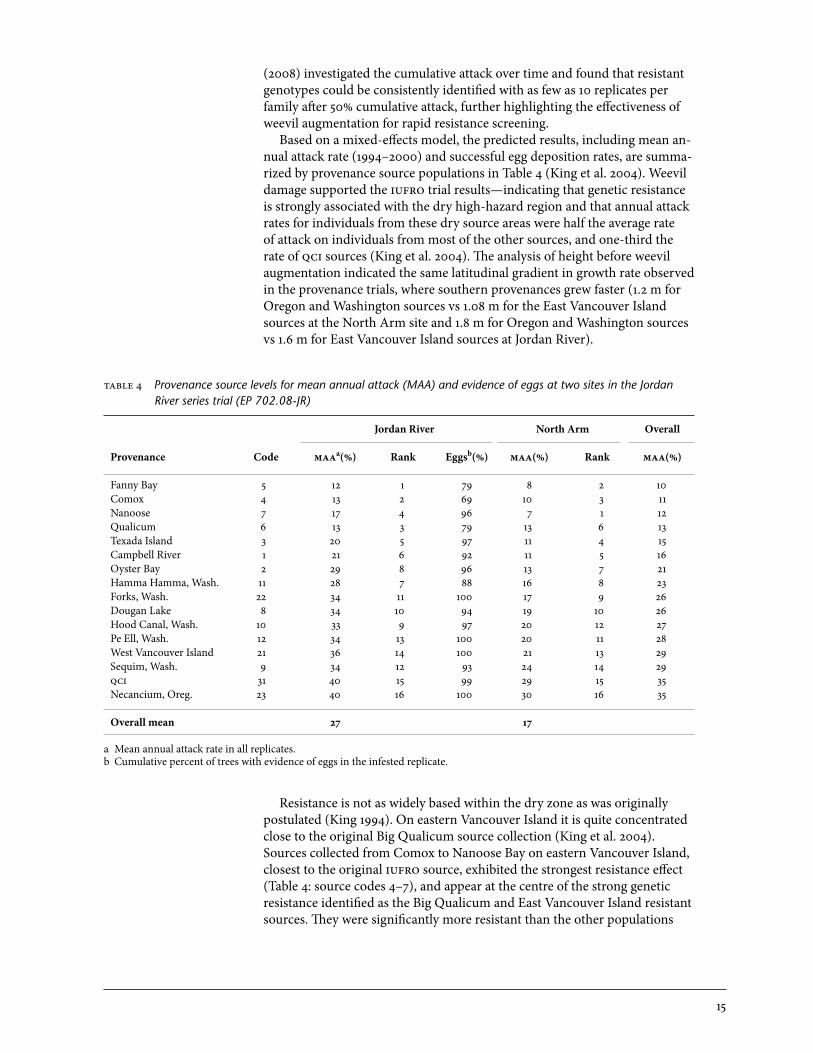
(2008) investigated the cumulative attack over time and found that resistant genotypes could be consistently identified with as few as 10 replicates per family after 50% cumulative attack, further highlighting the effectiveness of weevil augmentation for rapid resistance screening. Based on a mixed-effects model, the predicted results, including mean an-nual attack rate (1994–2000) and successful egg deposition rates, are summa-rized by provenance source populations in Table 4 (King et al. 2004). Weevil damage supported the iufro trial results—indicating that genetic resistance is strongly associated with the dry high-hazard region and that annual attack rates for individuals from these dry source areas were half the average rate of attack on individuals from most of the other sources, and one-third the rate of qci sources (King et al. 2004). The analysis of height before weevil augmentation indicated the same latitudinal gradient in growth rate observed in the provenance trials, where southern provenances grew faster (1.2 m for oregon and Washington sources vs 1.08 m for the East Vancouver Island sources at the North Arm site and 1.8 m for oregon and Washington sources vs 1.6 m for East Vancouver Island sources at Jordan River).
Resistance is not as widely based within the dry zone as was originally postulated (King 1994). on eastern Vancouver Island it is quite concentrated close to the original Big Qualicum source collection (King et al. 2004). Sources collected from Comox to Nanoose Bay on eastern Vancouver Island, closest to the original iufro source, exhibited the strongest resistance effect (Table 4: source codes 4–7), and appear at the centre of the strong genetic resistance identified as the Big Qualicum and East Vancouver Island resistant sources. They were significantly more resistant than the other populations
able 4 Provenance source levels for mean annual attack (MAA) and evidence of eggs at two sites in the Jordan River series trial (EP 702.08-JR)
Jordan River North Arm Overall
Provenance Code maaa(%) Rank Eggsb(%) maa(%) Rank maa(%)
Fanny Bay 5 12 1 79 8 2 10Comox 4 13 2 69 10 3 11Nanoose 7 17 4 96 7 1 12Qualicum 6 13 3 79 13 6 13Texada Island 3 20 5 97 11 4 15Campbell River 1 21 6 92 11 5 16oyster Bay 2 29 8 96 13 7 21Hamma Hamma, Wash. 11 28 7 88 16 8 23Forks, Wash. 22 34 11 100 17 9 26Dougan Lake 8 34 10 94 19 10 26Hood Canal, Wash. 10 33 9 97 20 12 27Pe Ell, Wash. 12 34 13 100 20 11 28West Vancouver Island 21 36 14 100 21 13 29Sequim, Wash. 9 34 12 93 24 14 29qci 31 40 15 99 29 15 35Necancium, oreg. 23 40 16 100 30 16 35
Overall mean 27 17
a Mean annual attack rate in all replicates.b Cumulative percent of trees with evidence of eggs in the infested replicate.
16
in this high-hazard zone. Most southern source families in this high-hazard zone (especially those in Washington) did not prove significantly more resis-tant than qci sources, although some populations directly north of these Big Qualicum sources (Table 4: source codes 1–3) did show an intermediate level of resistance, but were still significantly more susceptible than Big Qualicum parents (King et al. 2004).
3.2.2 Port Renfrew, Camp 4 series op trials (ep 702.08-pr, 702.08-c4) The Port Renfrew series was collected in 1991 and 1992 from a variety of sources, mainly from areas in the drier biogeoclimatic variants. Collection areas included the Sunshine Coast, Vancouver Island, and Whidbey Island and eastern Puget Sound in Washington. Some California collections were also included. originally, California trees were collected because there is no historical evidence of weevil attack in California; however, that area is outside the range of Pissodes strobi (Langor and Sperling 1995), and none of the Cali-fornia trees could survive our winters. Five screening sites were established: Port Renfrew, Snowden seed orchard near Campbell River, Deena on the Queen Charlotte Islands, and two sites in the United States. Results from the Port Renfrew series provide good support for those of the Jordan River series (King et al. 2004) where, at least on Vancouver Island, the resistance was not broadly based in the high-hazard zone but rather appeared to be concentrated very near the original Big Qualicum source. Families from Hilliers, near Coombs in the middle of this zone, and from Miracle Beach were by far the most resistant. As in the Jordan River series, families from ecologically similar sites in Washington (Puget Sound, Whidbey Island, Tula-lip, and Seattle) performed poorly. Provenance sources from East Vancouver Island but north of Campbell River (Amor de Cosmos and Salmon River near Sayward) also showed poor resistance performance. Sunshine Coast–or-igin trees performed well but not as well as the highly resistant East Vancou-ver Island sources. Sunshine Coast–origin trees had mean annual attack rates similar to those of nearby populations, such as Texada Island (tested in the Jordan River series) (Table 4). Additional trials were included to complement the Port Renfrew trial. They were located at Camp 4 in the Snowden Demonstration Forest, Camp-bell River. The families for the Camp 4 series trials were gathered in 1995, mostly using helicopter collections made in the Fraser Valley in 1994 (63 op families). They were used to capitalize on the resistance associated with the iufro Haney provenance, assuming there was a broad resistance distribution in the area. Another 27 parent trees from the Washington Cascades and the oregon coast were included. It was hypothesized that the steep ecological cline from the coast to the interior could have resulted in the Cascade spruce populations developing some weevil resistance as a result of natural selection in these high-hazard environments. Five previously tested Queen Charlotte Islands op families plus four previously tested western Vancouver Island seedlots were obtained from the bcfs Tree Seed Centre and were included as susceptible controls. Progeny were planted near Campbell River (Camp 4), Sayward (Derby), and Port Alice (Victoria Lake) (Appendix a1). The trials used the same design as previous test series. Excess stock was deployed in a weevil-free trial near Sandspit (Spectacular Gorge, qci). The Camp 4 site was augmented with weevils in the fall of 1999 and soon reached the highest infes-tation rates ever observed in progeny trials. Unlike other sites, such as Jordan
17
River (Table 3), cumulative attack at the Camp 4 site had reached 93% by 2005 after only 4 years, with no observed collapse of the weevil population. In this heavily infested site, the best ranked families were from the Fraser Valley, except for the Coombs and Big Qualicum bulk collections used in most trials as a comparison standard. The distribution of the parents of these families ranged from 122º16' w (Hatzic Slough) to 123°06' w (Tsawwassen). The original Haney parents of the iufro series originated from 122°36' (Uni-versity of British Columbia Malcolm Knapp Research Forest). As in the other op series, the U.S. parents showed very little resistance, although a few trees from higher elevations in the Cascades (Issaquah and White River) were in the top quartile.
3.2.3 Coombs series (ep 702.08-co) The Coombs series was designed to test the two resistant populations from the iufro trials (Big Qualicum and Haney) against each other and in complementary environments to provide information on their relative resistance. Trees from 128 selected families were planted at three sites: Coombs on Vancouver Island, Harrison Mills in the Fraser Valley, and Waterfall Creek in the Queen Charlotte Islands (Appendix 1a). The Coombs and Harrison sites were also chosen because they were easy to access, which facilitated their further use in detailed investigations of putative resistance mechanisms. Selection efforts concentrated on collecting open-pollinated seed in areas around Haney (22 parent trees) and Qualicum (55 parent trees). Eleven susceptible genotypes, six from the Queen Charlotte Islands and five from western Vancouver Island, were deployed as standard susceptible controls. Four Qualicum and three Haney families previously identified as resistant were included as standards. U.S. agencies also provided material: the oregon Department of Forestry supplied 20 parent tree selections from the Jewel area west of Portland, and the Washington Department of Natural Resources procured 13 selections from western Washington State. As with the Camp 4 site, the Harrison site was heavily attacked. It had 86% cumulative attack after only 3 years of infestation (Table 3). Similar to the Ar-mishaw Road clonal site (Section 3.1.2), there were no significant differences overall between the Haney and Big Qualicum sources, even in the severely at-tacked Harrison site. Good families were from sources that included Coombs and Qualicum, as well as Aldergrove and Burnaby Lake in the Fraser Valley. U.S. families were ranked 70th and below. Except for the few trees mentioned in the Camp 4 analysis (Section 3.2.2), no regional effect for resistance has been found in any U.S. population.
The provenance trials (Table 2; Ying 1997) indicated geographic regions of resistance: the hybrid area of northwest British Columbia and two prov-enance sources within the high-hazard region of southwest British Columbia (Haney and Big Qualicum). King et al. (2004) found that the resistance from the high-hazard region in southwest British Columbia, particularly on East Vancouver Island, is not as widely based (Table 4) as had been originally hypothesized (King 1994). Screening results extended resistant source regions beyond those identified in the provenance analysis (Table 2) to include areas where susceptible populations were found in the high-hazard zone and adjacent areas, particularly those just north of the originally identified Big Qualicum region (i.e., Campbell River and Texada Island; King et al. 2004).
3.3 summary of screening:
distribution of resistance
18
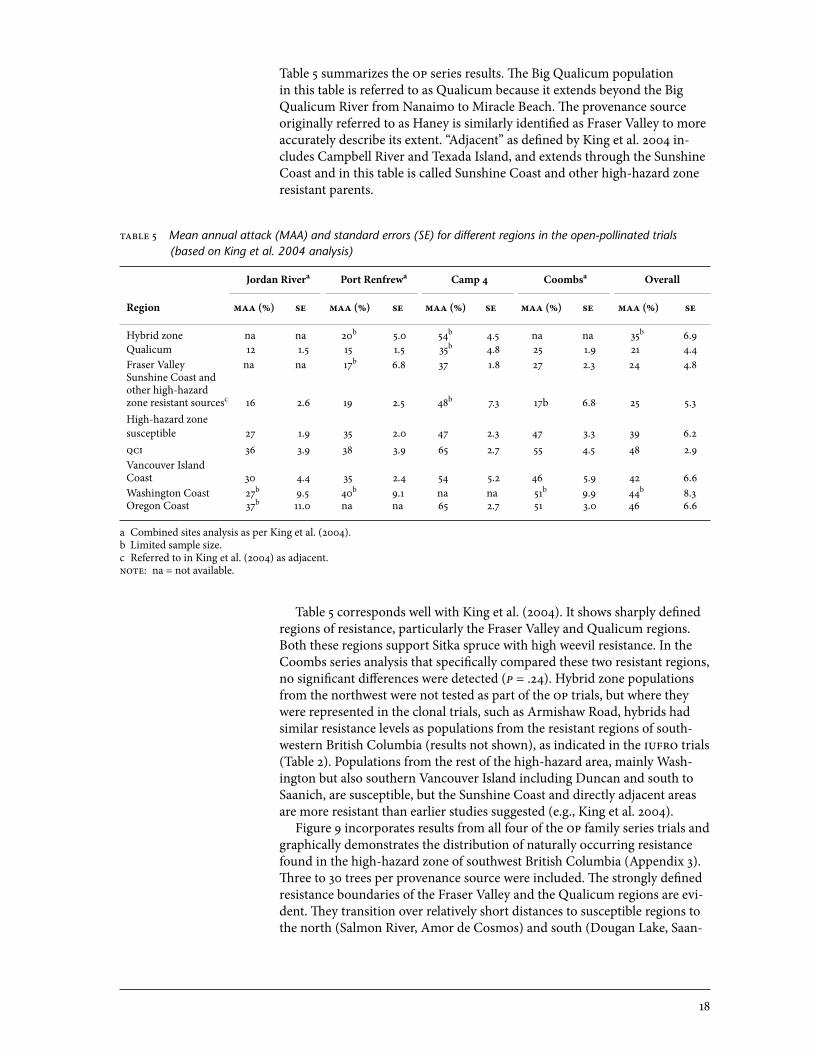
Table 5 summarizes the op series results. The Big Qualicum population in this table is referred to as Qualicum because it extends beyond the Big Qualicum River from Nanaimo to Miracle Beach. The provenance source originally referred to as Haney is similarly identified as Fraser Valley to more accurately describe its extent. “Adjacent” as defined by King et al. 2004 in-cludes Campbell River and Texada Island, and extends through the Sunshine Coast and in this table is called Sunshine Coast and other high-hazard zone resistant parents.
able 5 Mean annual attack (MAA) and standard errors (SE) for different regions in the open-pollinated trials (based on King et al. 2004 analysis)
Jordan Rivera Port Renfrewa Camp 4 Coombsa Overall
Region maa (%) se maa (%) se maa (%) se maa (%) se maa (%) se
Hybrid zone na na 20b 5.0 54b 4.5 na na 35b 6.9Qualicum 12 1.5 15 1.5 35b 4.8 25 1.9 21 4.4Fraser Valley na na 17b 6.8 37 1.8 27 2.3 24 4.8Sunshine Coast andother high-hazardzone resistant sourcesc 16 2.6 19 2.5 48b 7.3 17b 6.8 25 5.3High-hazard zone susceptible 27 1.9 35 2.0 47 2.3 47 3.3 39 6.2qci 36 3.9 38 3.9 65 2.7 55 4.5 48 2.9Vancouver Island Coast 30 4.4 35 2.4 54 5.2 46 5.9 42 6.6Washington Coast 27b 9.5 40b 9.1 na na 51b 9.9 44b 8.3oregon Coast 37b 11.0 na na 65 2.7 51 3.0 46 6.6
a Combined sites analysis as per King et al. (2004).b Limited sample size.c Referred to in King et al. (2004) as adjacent. noe: na = not available.
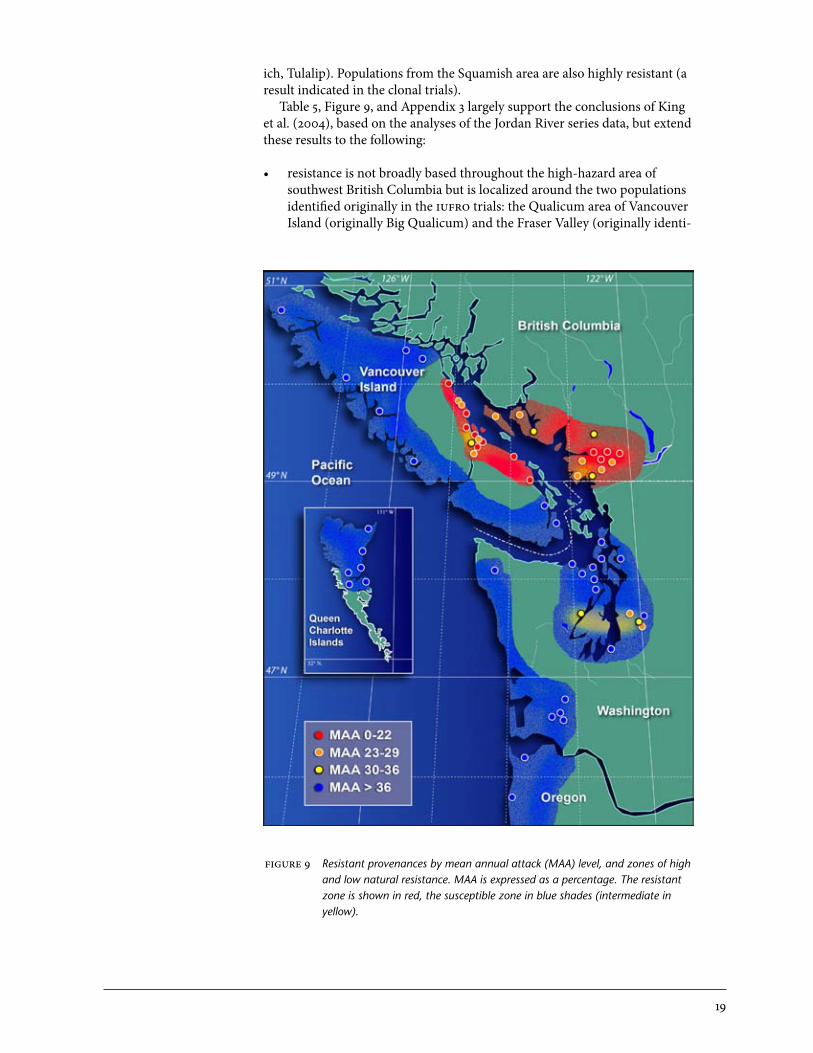
Table 5 corresponds well with King et al. (2004). It shows sharply defined regions of resistance, particularly the Fraser Valley and Qualicum regions. Both these regions support Sitka spruce with high weevil resistance. In the Coombs series analysis that specifically compared these two resistant regions, no significant differences were detected (p = .24). Hybrid zone populations from the northwest were not tested as part of the op trials, but where they were represented in the clonal trials, such as Armishaw Road, hybrids had similar resistance levels as populations from the resistant regions of south-western British Columbia (results not shown), as indicated in the iufro trials (Table 2). Populations from the rest of the high-hazard area, mainly Wash-ington but also southern Vancouver Island including Duncan and south to Saanich, are susceptible, but the Sunshine Coast and directly adjacent areas are more resistant than earlier studies suggested (e.g., King et al. 2004). Figure 9 incorporates results from all four of the op family series trials and graphically demonstrates the distribution of naturally occurring resistance found in the high-hazard zone of southwest British Columbia (Appendix 3). Three to 30 trees per provenance source were included. The strongly defined resistance boundaries of the Fraser Valley and the Qualicum regions are evi-dent. They transition over relatively short distances to susceptible regions to the north (Salmon River, Amor de Cosmos) and south (Dougan Lake, Saan-
19
ich, Tulalip). Populations from the Squamish area are also highly resistant (a result indicated in the clonal trials). Table 5, Figure 9, and Appendix 3 largely support the conclusions of King et al. (2004), based on the analyses of the Jordan River series data, but extend these results to the following:
• resistanceisnotbroadlybasedthroughoutthehigh-hazardareaofsouthwest British Columbia but is localized around the two populations identified originally in the iufro trials: the Qualicum area of Vancouver Island (originally Big Qualicum) and the Fraser Valley (originally identi-
figure 9 Resistant provenances by mean annual attack (MAA) level, and zones of high and low natural resistance. MAA is expressed as a percentage. The resistant zone is shown in red, the susceptible zone in blue shades (intermediate in yellow).

20
fied as the Haney area near University of British Columbia Malcolm Knapp Research Forest);
• theclonaltrialsidentifiedtheSquamishareaasaresistantregionwithinthe high-hazard area of southwestern British Columbia, and the op series extended the resistance into the Sunshine Coast and Texada Island;
• nootherresistantregionshavebeenidentifiedwithinthishigh-hazardarea (including none in the United States), although west of Seattle (close to the Cascades), a few populations with moderate resistance have been found;
• theclonaltrialsconfirmtheearlierprovenanceresultsindicatingthatthe hybrid zone of northwestern British Columbia is a similar resistant region;
• onaverage,parenttreesfromtheseresistantregionshaveapproximatelyone-half the weevil attack level of susceptible sources over a wide variety of site hazards;
• outsideoftheseresistantregions,populationsourcesfromhigh-hazardareas are no more weevil resistant than other coastal sources, except the Queen Charlotte Islands and some fast-growing oregon sources, which show even more susceptibility than expected; and
• thereissignificantvariabilityinresistancebetweenindividualswithinregions.
Although the strong provenance effect shown in both the regional analysis (Table 5) and provenance analysis (Figure 9) has been the dominant story in the resistance of Sitka spruce to the white pine weevil, there is significant variability of families within these regions (King et al. 2004). Selections from the screening programs have been used to establish seed orchards that are now delivering resistant seed using this observed variability. To differentiate these parents based on the screening analysis, we have developed a resistance value score. A system using genetic worth is currently used in British Columbia to evaluate the potential gain of seedlots from domestic seed orchards, estimat-ed for a given trait at harvest age. Values are derived from the breeding values of selected parents, adjusted for factors such as parental fecundity and pollen contamination (Stoehr et al. 2004). Breeding values reflect the percentage increase (or decrease) of a tree relative to the overall population mean for a trait, where a wild population of trees has a breeding value of zero. Genetic worth values are based on conventional breeding values for traits of interest, such as volume or wood density, and genetic covariances are adjusted based on pedigree data. To standardize a similar measure for weevil resistance, mean annual attack data are adjusted using a mixed effects model (King et al. 2004). The rationale for concentrating on adjusting the value for the major effect (i.e., the site hazard variability shown in Tables 3 and Figure 7) was as follows: (1) nearly all the individuals in the weevil resistance screening are first-generation selections and can therefore be considered unrelated; (2) the mean annual attack data do not fit an underlying normal distribution, which most traditional breeding value adjustments rely on (e.g., White and Hodge 1989); and (3) there is often the assumption of a multigenic model for quanti-tative traits, but currently, little is known about the underlying genetic mod-els of resistance (see Section 4). After future analysis of the F1 data provides a better understanding of the genetics of resistance, the resistance score may be adjusted to correspond more with the genetic worth system.
3.4 summary of screening: ranking
Families and resistance values
21
At this time, however, the resistance value is the mean annual attack rate, adjusted for the site hazard (Figure 7) using a mixed linear effects model (King et al. 2004). Percent mean annual attack presented in this way equates to the weevil attack susceptibility expected in a plantation established with genotypes of similar resistance value. For example, a stand established with a Big Qualicum bulk seedlot on a medium-hazard site is expected to have 23% of trees attacked in any year (Figure 7: all sites). Another major advantage of using mean annual attack as a basis of the resistance value score is that this number is also used as a base input to the bcfs growth and yield models for stand productivity and timber supply modelling (ipsy and swa
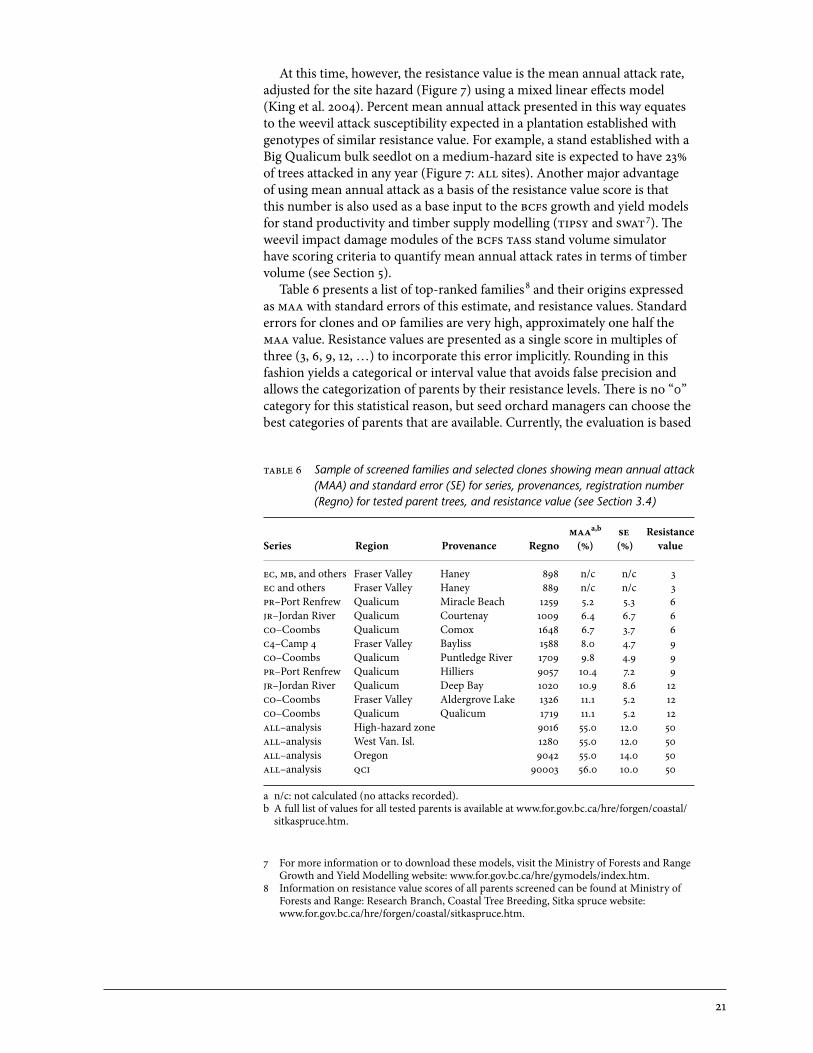
7). The weevil impact damage modules of the bcfs ass stand volume simulator have scoring criteria to quantify mean annual attack rates in terms of timber volume (see Section 5). Table 6 presents a list of top-ranked families
8 and their origins expressed as maa with standard errors of this estimate, and resistance values. Standard errors for clones and op families are very high, approximately one half the maa value. Resistance values are presented as a single score in multiples of three (3, 6, 9, 12, …) to incorporate this error implicitly. Rounding in this fashion yields a categorical or interval value that avoids false precision and allows the categorization of parents by their resistance levels. There is no “0” category for this statistical reason, but seed orchard managers can choose the best categories of parents that are available. Currently, the evaluation is based
able 6 Sample of screened families and selected clones showing mean annual attack (MAA) and standard error (SE) for series, provenances, registration number (Regno) for tested parent trees, and resistance value (see Section 3.4)
maaa,b se ResistanceSeries Region Provenance Regno (%) (%) value
ec, mb, and others Fraser Valley Haney 898 n/c n/c 3ec and others Fraser Valley Haney 889 n/c n/c 3pr–Port Renfrew Qualicum Miracle Beach 1259 5.2 5.3 6jr–Jordan River Qualicum Courtenay 1009 6.4 6.7 6co–Coombs Qualicum Comox 1648 6.7 3.7 6c4–Camp 4 Fraser Valley Bayliss 1588 8.0 4.7 9co–Coombs Qualicum Puntledge River 1709 9.8 4.9 9pr–Port Renfrew Qualicum Hilliers 9057 10.4 7.2 9jr–Jordan River Qualicum Deep Bay 1020 10.9 8.6 12co–Coombs Fraser Valley Aldergrove Lake 1326 11.1 5.2 12co–Coombs Qualicum Qualicum 1719 11.1 5.2 12all–analysis High-hazard zone 9016 55.0 12.0 50all–analysis West Van. Isl. 1280 55.0 12.0 50all–analysis oregon 9042 55.0 14.0 50all–analysis qci 90003 56.0 10.0 50
a n/c: not calculated (no attacks recorded).b A full list of values for all tested parents is available at www.for.gov.bc.ca/hre/forgen/coastal/
sitkaspruce.htm.
7 For more information or to download these models, visit the Ministry of Forests and Range Growth and Yield Modelling website: www.for.gov.bc.ca/hre/gymodels/index.htm.
8 Information on resistance value scores of all parents screened can be found at Ministry of Forests and Range: Research Branch, Coastal Tree Breeding, Sitka spruce website: www.for.gov.bc.ca/hre/forgen/coastal/sitkaspruce.htm.
22
on the phenotypic expression of resistance in the screening trials and does not express the underlying genetics (see Section 4). To fit a scale comparable to genetic worth (linear increasing scale), the bcfs seed inventory system spar (Seed Planning and Registry Application) uses the inverted resistance value score, so that 0 is the lowest genetic worth associated with the observed maximum attack rate (50%) and 100 is the highest genetic worth and most resistant (0% mean annual attack) from the formula gwr = 100 – (2 × %rv) where rv is the resistance value. gwr (Genetic Worth Resistance) values for all screened parents (clones and families) are available on the spar website9.
Based on the results from the screening trials, individuals were selected to become parents in the breeding population. Some of these have also been established in seed orchards (see Section 5). Initially, 60 parents were selected based on their phenotypic expression of resistance from weevil screening. Controlled crossing in a partial diallel design was completed, and three series of F1 trials were established to generate a total of 300 full-sib families (Appendix 1d). Because no information on differences in putative mechanisms was available (see Section 4), resistant parents were identified by their population of origin (Big Qualicum and Haney), and diallel mat-ing groups were constructed within these populations. Pair crosses between population groups and with susceptible parents were also made (see King and Alfaro 2004 for details). This approach was used to test the hypothesis that these populations might have different resistance characteristics. Since then, resources have been focussed on characterizing both populations and individuals for known mechanisms based on their phenotypic expression. Based on these results, there are plans to establish a second-phase breeding population to help us better understand the inheritance of these mechanisms and their roles in observed phenotypic resistance. The first of the F1 trials at Jordan River Main (ep 702.10-jm1) underwent its first assessment in fall 2008, 1 year after weevil enhancement. This culminates a full evaluation of weevil resistance only 5 years from seed.
4 mEcHAnisms oF rEsistAncE
Artificial weevil infestation is cheap, effective, and quick (Alfaro et al. 2008); however, it provides only a phenotypic measure of resistance with limited information on the mechanisms and factors influencing resistant genotypes. The knowledge gained in nearly 30 years of research into this resistance has been used as a textbook case of host resistance to stem-invading insects. Three general types of resistance are defined by Alfaro et al. (2002): (1) toxicity, (2) repellence or hindrance (and avoidance); and (3) phenology and synchronicity. Toxic effects can be antibiotic effects that harm the insect, or antixonetic effects that deter colonization by harming the insect’s reproduc-tive abilities. Both antibiotic and antixonetic effects, in turn, can be caused by straight toxic effects or by nutritional deprivation. Repellence hinders the insect’s ability to attack the tree for both feeding and reproductive purposes,
3.5 breeding and Establishment of
F1 trials
9 For more information and use of the spar system see www.for.gov.bc.ca/HTI/spar/
23
and can extend to pitching out of eggs and larvae. Phenology and synchron-icity may delay the insect’s feeding and reproductive cycles, and in doing so, help parasitizing insects and diseases that attack the pest. Resistance mechanisms can also be classified as constitutive or inducible defences according to their permanence in time (Alfaro et al. 2002). Consti-tutive defences are permanent structural or chemical defence systems that occur regardless of the presence of the attacker. Examples include trichomes, thorns, latex, resin canals, sclereid cells, and an array of defence chemicals, including resin component chemicals. Inducible defences are activated in re-sponse to attack. Examples include the mobilization of defensive chemicals to the site of wounding, and the production of traumatic resin canals in conifers in response to insect and fungal attack. Plant defences and their effects on in-sects are dynamic and interactive. The interaction of the host, its phenology, the insect pest, and associated parasites and predators can be quite complex (Panda and Khush 1995; Alfaro et al. 2002).
4.1.1 Feeding, egg laying, failed and successful attack incidence When Pissodes strobi feeds on spruce, it really does no harm to the tree. It is only after fairly massive egg laying that the tree suffers. In a study of spruce populations from the British Columbia interior (primarily white spruce), leaders were successfully killed if 140 eggs or more were laid (Alfaro et al. 1996). The number of eggs laid could correspond with the success of weevil attack; values higher than approximately 140 eggs may be a threshold for leader kill. There is a significant and strong correlation between our phenotypic as-sessment of leader damage and successful egg deposition. Three of the four highly resistant sources (Fanny Bay, Comox, and Qualicum) showed signifi-cantly fewer trees with egg deposition than most other sources in the Jordan River series (Table 4). Thirty-four of the 67 op families tested had successful egg depositions on 100% of the trees. In the best four families selected from this trial, only 50% of the trees had any eggs at all, and those that did had significantly fewer eggs than trees from other families (Table 4). Much research on feeding, egg-laying, and weevil top-kill has been con-ducted on the 898 clone since this highly resistant individual was first noticed at the Sayward (Bigtree Creek) trial (Alfaro and Ying 1990). This research has been well replicated in many trials, including Fair Harbour (King 1994), Espinosa Creek, and Sandcut Creek, and in trials conducted by the Pacific Forestry Centre in Victoria, Western Forest Products Ltd. Saanichton For-estry Centre, and the B.C. Forest Service Cowichan Lake Research Station. Detailed feeding and oviposition observations of uncaged weevils and wee-vils caged onto spruce leaders have been made (L. VanAkker and R. Alfaro, unpublished data). Caged weevils fed on clone 898 but usually lower down in the crown than typical; uncaged weevils usually moved to a different clone. Very little or no oviposition, and even fewer successful emergent holes were observed on the hundreds of ramets studied, even where weevils were caged. Reports on hindrance and toxicity of clone 898 are reported below.
4.1.2 Repellence or hindrance defences against insects Several hindrance mechanisms have been noted, the main one being resin canal formation. This includes increases in natural levels of constitutive resin canals in the bark (Tomlin and Borden 1994; Alfaro et al. 1997) and the formation of rings of traumatic resin canals induced by weevil feeding and oviposition punctures
4.1 resistance mechanisms to
weevil Attack in spruce Populations
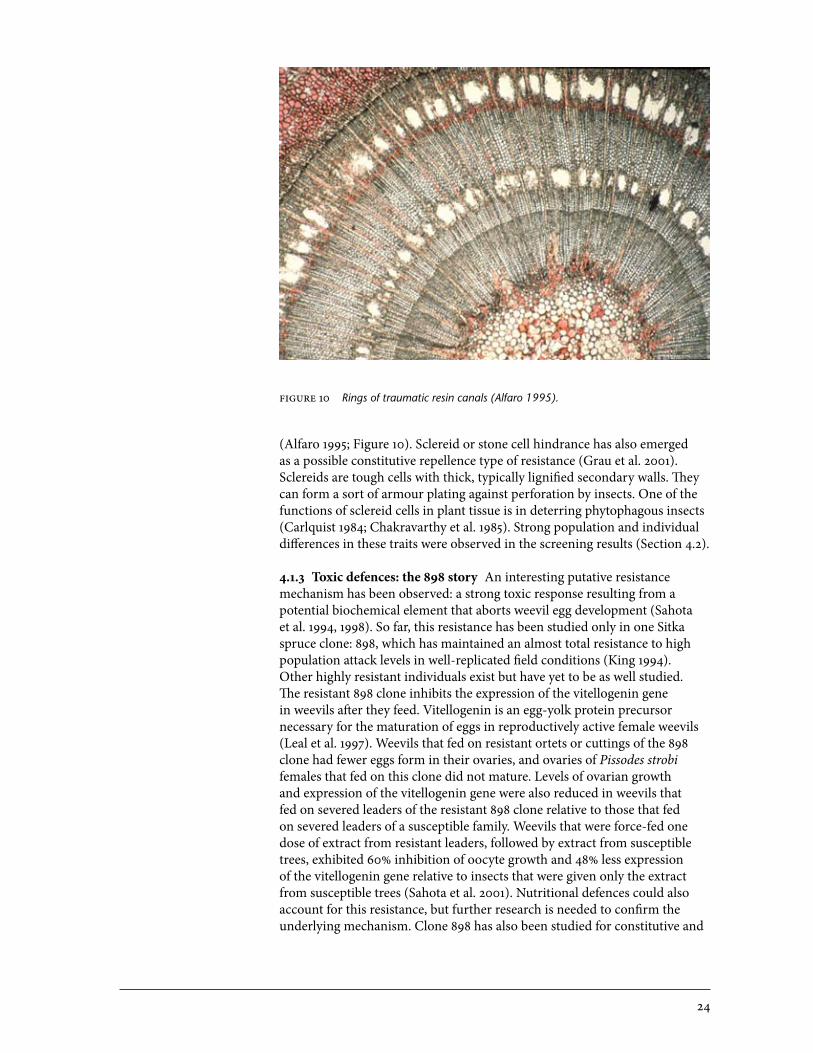
24
(Alfaro 1995; Figure 10). Sclereid or stone cell hindrance has also emerged as a possible constitutive repellence type of resistance (Grau et al. 2001). Sclereids are tough cells with thick, typically lignified secondary walls. They can form a sort of armour plating against perforation by insects. one of the functions of sclereid cells in plant tissue is in deterring phytophagous insects (Carlquist 1984; Chakravarthy et al. 1985). Strong population and individual differences in these traits were observed in the screening results (Section 4.2).
4.1.3 Toxic defences: the 898 story An interesting putative resistance mechanism has been observed: a strong toxic response resulting from a potential biochemical element that aborts weevil egg development (Sahota et al. 1994, 1998). So far, this resistance has been studied only in one Sitka spruce clone: 898, which has maintained an almost total resistance to high population attack levels in well-replicated field conditions (King 1994). other highly resistant individuals exist but have yet to be as well studied. The resistant 898 clone inhibits the expression of the vitellogenin gene in weevils after they feed. Vitellogenin is an egg-yolk protein precursor necessary for the maturation of eggs in reproductively active female weevils (Leal et al. 1997). Weevils that fed on resistant ortets or cuttings of the 898 clone had fewer eggs form in their ovaries, and ovaries of Pissodes strobi females that fed on this clone did not mature. Levels of ovarian growth and expression of the vitellogenin gene were also reduced in weevils that fed on severed leaders of the resistant 898 clone relative to those that fed on severed leaders of a susceptible family. Weevils that were force-fed one dose of extract from resistant leaders, followed by extract from susceptible trees, exhibited 60% inhibition of oocyte growth and 48% less expression of the vitellogenin gene relative to insects that were given only the extract from susceptible trees (Sahota et al. 2001). Nutritional defences could also account for this resistance, but further research is needed to confirm the underlying mechanism. Clone 898 has also been studied for constitutive and
figure 10 Rings of traumatic resin canals (Alfaro 1995).
25
induced hindrance traits. Although it does well in these rankings (Alfaro 1996; McKay-Byun et al. 2006; L. VanAkker and R. Alfaro, unpublished data), results for this individual are within the range of statistical norms.
4.1.4 Phenology, population dynamics, and biological defences The role of phenology in resistance has also been investigated (Alfaro et al. 2000, 2002). Phenology includes the synchronization of the growth and life cycles of the tree with those of the weevil and the weevil’s predator and parasite populations. It has been noted that in Sitka spruce, trees that flush earlier may have less weevil damage (Hulme 1995). This interaction may be a strong part of the population dynamics illus-trated in Figure 7, which shows weevil attack dynamics on six test sites, all of which were augmented except for Espinosa Creek. The most common trend was a marked increase over the background weevil attack level immediately after augmentation, followed by a decline as the corresponding predator populations built up (R. Alfaro, unpublished data). Sometimes an abrupt col-lapse (e.g., Armishaw Road) was observed rather than a decline (e.g., Jordan River), and in some cases, weevil populations declined only marginally (e.g., Camp 4). other sites that suffered repeated high attacks were Harrison and Menzies Bay (Table 3), and provenance trials at Kitimat and Sayward Bigtree Creek (Table 1). Research into the population dynamics of insect outbreaks has been a valuable adjunct to the screening work (R. Alfaro and J. King, unpublished data).
Specific resistance mechanisms used by resistant populations and individu-als were characterized to test how accurately they can be used to predict or describe the phenotypic resistance observed in the attack data. Studies of white spruce populations indicate that traumatic resin canals are strongly as-sociated with resistance (Alfaro 1995; Alfaro et al. 1996, 2004). However, this resistance mechanism appears to be less strongly expressed in Sitka spruce than in white spruce, and may account for the far higher weevil susceptibil-ity in Sitka than white spruce (Humble et al. 1994). In the hybrid zone in northwestern British Columbia (the Nass and Skeena River valleys), the most significant predictive variables for traumatic resin canal levels in spruce trees were distance from salt water and degree of white spruce genotypes in the hybrid (o’Neill et al. 2002). King et al. (in prep.) studied the resistance of cloned individuals from the resistant populations of southwest British Columbia. The objective was to determine if these populations had the same type of resistant mechanisms by specifically testing for repellency of constitutive and traumatic resin canals and sclereid cells. The authors also evaluated how these hindrance traits could best predict phenotypic resistance scores based on mean annual at-tack. The Fraser Valley population had nearly four times the sclereid density of susceptible populations. Although the Big Qualicum population had the same high resistance, it was expressed primarily through increased constitu-tive resin canals. Sclereid cell density had the highest predictive power for resistance score (Figure 11). Contrary to observations by o’Neill et al. (2002), traumatic resin canals were not significantly correlated with mean annual attack rate, and did not show significant population differences. Further research is planned for the next phase of the breeding plan, and will include using clonal embling lines.
4.2 characterizing resistance
mechanisms of known resistant
Populations
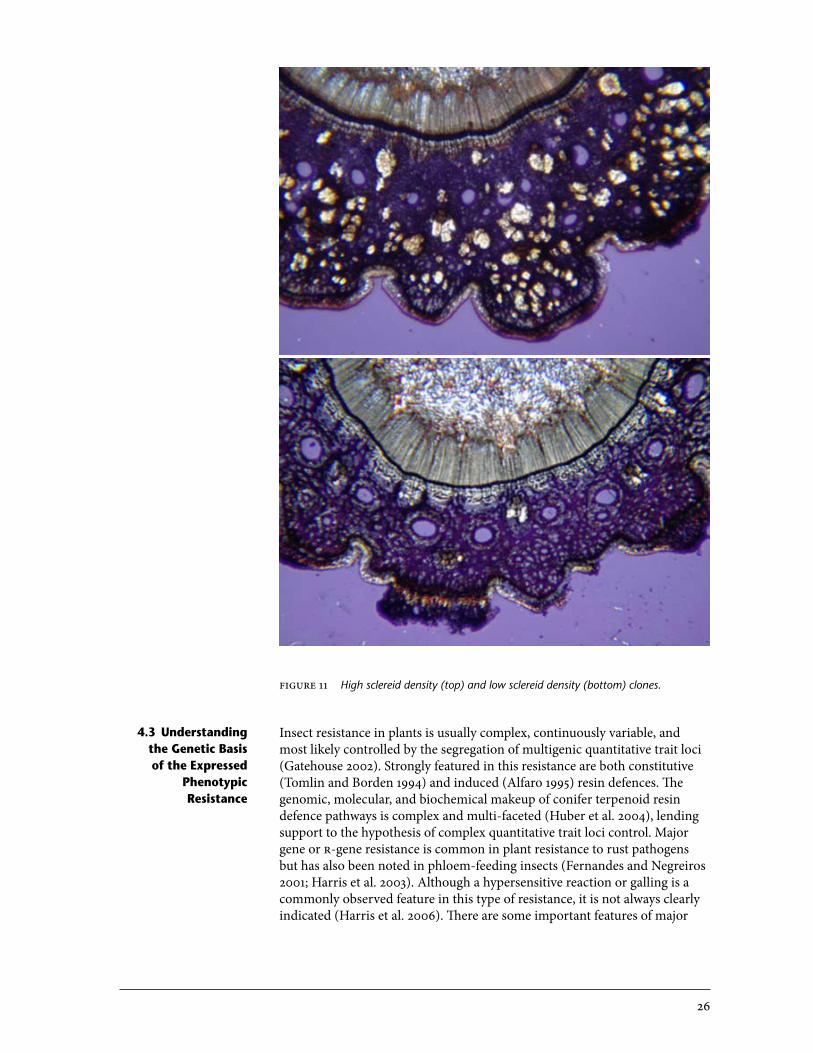
26
Insect resistance in plants is usually complex, continuously variable, and most likely controlled by the segregation of multigenic quantitative trait loci (Gatehouse 2002). Strongly featured in this resistance are both constitutive (Tomlin and Borden 1994) and induced (Alfaro 1995) resin defences. The genomic, molecular, and biochemical makeup of conifer terpenoid resin defence pathways is complex and multi-faceted (Huber et al. 2004), lending support to the hypothesis of complex quantitative trait loci control. Major gene or r-gene resistance is common in plant resistance to rust pathogens but has also been noted in phloem-feeding insects (Fernandes and Negreiros 2001; Harris et al. 2003). Although a hypersensitive reaction or galling is a commonly observed feature in this type of resistance, it is not always clearly indicated (Harris et al. 2006). There are some important features of major
figure 11 High sclereid density (top) and low sclereid density (bottom) clones.
4.3 understanding the genetic basis of the Expressed
Phenotypic resistance

27
gene resistance in Sitka spruce to the white pine weevil, particularly the discrete geographic distribution of resistance (Figure 9) but this in itself does not prove the case. Family and within-family variability is being analyzed using new phenotypic weevil data from the F1 trials to test the hypothesis of major gene segregation. Confirmation will require the use of more extended pedigrees for segregation analysis and/or molecular genetic techniques based on linked molecular markers. The work of the spruce genome project10 at the University of British Columbia will be instrumental in this understanding.
5 dEPloymEnt
For successful deployment of Sitka spruce, two components must be consid-ered: the delivery program, consisting of seed orchards, vegetative cuttings, and associated works; and silvicultural guidelines for the deployment of spruce based on hazard evaluations and risk assessments. Deployment guidelines will be updated to include seed transfer and results of the Sitka spruce improvement program for weevil resistance. Trials have shown that moving seed 5º, 6º, or even 7º north of its source, in similar climatic conditions (e.g., maritime or submaritime climatic regimes with similar numbers of frost-free days, mean annual and minimum temperatures, etc.), does not compromise survival and growth (Figure 12). The extremely restrictive transfer guidelines for the Coast-Interior transition will also be examined, but given the steep environmental clines and the adaptational clines exhibited in Sitka-hybrid spruce, transfer in this area will likely remain limited and will rely more heavily on local seed sources with desirable pheno-types (e.g., b+ seedlots).
5.1.1 Seed orchards and the b+ seedlot program The greatest effect observed so far in the Sitka spruce weevil resistance breeding program is the significant and overwhelming provenance effect for resistance (King et al. 2004; Table 5). Planting trees from resistant regions has produced seedlings that have, on average, less than half the effective attack rate of those from more susceptible sources (King et al. 2004; Figure 7, Table 5). Therefore, a low-cost deployment option, which is recommended as a priority ahead of orchard seed and is particularly valuable for low-hazard or mixture plantings on medium-hazard sites, is simply to use b+ or superior provenance seedlots, such as Big Qualicum bulk. b+ seedlots have been widely used since the early 1990s, supplanting the use of the old orchard seed that was derived mainly from susceptible regions. Seed orchards (sos) have traditionally been used to provide seed for commercially important species in British Columbia and species that are the focus of tree improvement programs. This policy was established based on the provincial plus-tree program. Many orchards were established in the 1970s. The Sitka spruce program included four seed orchards for coastal British Columbia: Western Vancouver Island Hovey Road so 133, Northern Vancouver
5.1 delivery Program
10 For details of the ubc genomics project see: treenomix.ca/Home/ResearchAreas/FunctionalGenomicsofConiferDefense.aspx.
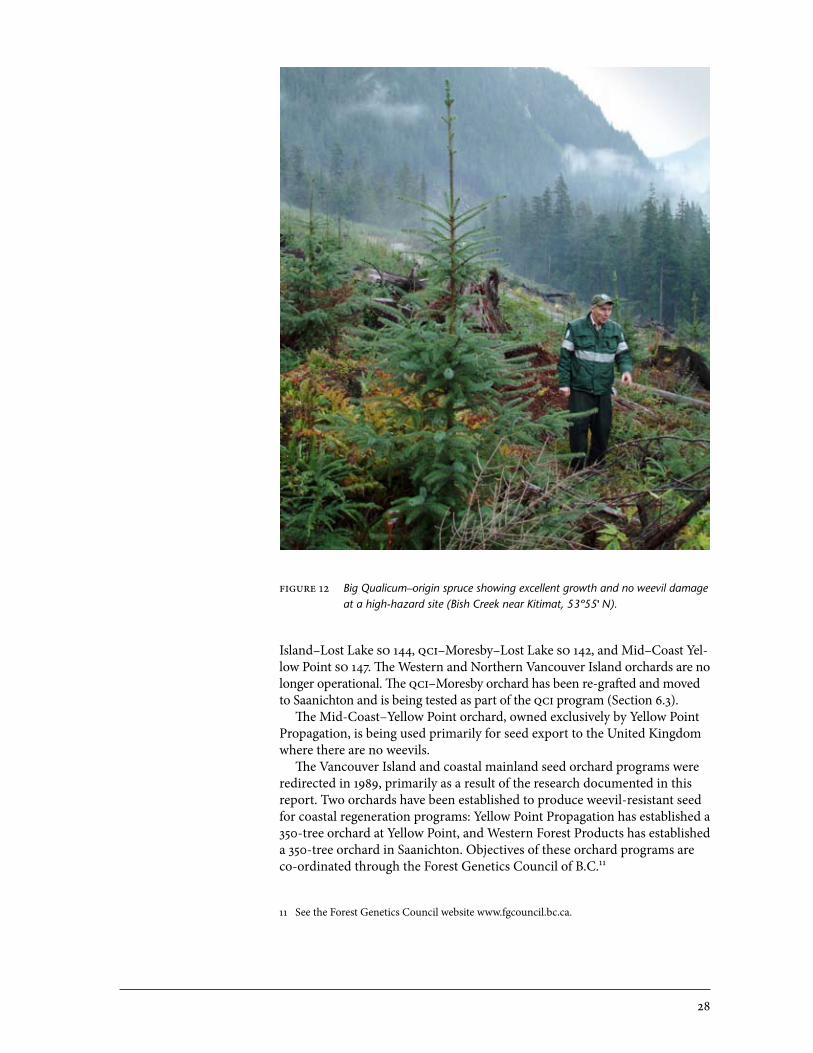
28
Island–Lost Lake so 144, qci–Moresby–Lost Lake so 142, and Mid –Coast Yel-low Point so 147. The Western and Northern Vancouver Island orchards are no longer operational. The qci–Moresby orchard has been re-grafted and moved to Saanichton and is being tested as part of the qci program (Section 6.3). The Mid-Coast–Yellow Point orchard, owned exclusively by Yellow Point Propagation, is being used primarily for seed export to the United Kingdom where there are no weevils. The Vancouver Island and coastal mainland seed orchard programs were redirected in 1989, primarily as a result of the research documented in this report. Two orchards have been established to produce weevil-resistant seed for coastal regeneration programs: Yellow Point Propagation has established a 350-tree orchard at Yellow Point, and Western Forest Products has established a 350-tree orchard in Saanichton. objectives of these orchard programs are co-ordinated through the Forest Genetics Council of B.C.11
figure 12 Big Qualicum–origin spruce showing excellent growth and no weevil damage at a high-hazard site (Bish Creek near Kitimat, 53º55' N).
11 See the Forest Genetics Council website www.fgcouncil.bc.ca.
29
5.1.2 Cuttings and somatic embling programs Bulking-up valuable material through vegetative propagation by using nursery stool beds and setting cuttings is often used in forest plantation regeneration and is widely used for Sitka spruce in the United Kingdom (Samuel et al. 2007). A fairly large program was initiated in British Columbia in the mid 1990s to produce several hundred thousand cuttings of Sitka spruce for the coastal British Columbia reforestation efforts. This initiative took advantage of the F1 breeding program by using surplus seed produced. The program was terminated when the first phase of the breeding was finished and seed orchards became operational. Clonal lines of emblings are part of the weevil resistance program for interior spruce; more than 1000 such lines were created and established in various field trials. A small program involving 100 Sitka spruce lines was established, none of which were kept in cold storage. It is expected, however, that a directed research effort using emblings with a range of phenotypic re-sistance mechanisms will be established (J. King, unpublished data). Plans for the second-phase F1 breeding program include creating small diallel breed-ing units using clonal lines. This will provide important statistical replication of genotypes and will aid our understanding of the nature and inheritance of resistance mechanisms.
5.2.1 Silvicultural trials Various demonstration trials have been set up to highlight genetic resistance (Appendix 1f). Probably the most marked of these are the block plots of susceptible and highly resistant grafts at the Hisnit site, which were established by the Canadian Forest Service Pacific Forestry Centre (Appendix 1f: ep 702.11-hs). Little or no attack was noted on highly resistant grafts (including clone 898), but massive, ongoing, and repeated attack levels of 50% or more occurred in the susceptible blocks. The resistant blocks are free-growing trees, but the susceptible blocks were reduced to shrubs. Silvicultural control techniques such as shading, clipping, insecticide use, spacing, and mixture planting have largely fallen out of favour; therefore, re-sistant seed is now seen as the best silvicultural option. Ecological approaches to limit the impacts of the weevil on coastal spruce plantations are discussed by Alfaro et al. (1994), who proposed the use of integrated pest management systems that would favour the weevil’s natural pests. outside of genetic resis-tance, the best approach may be to use biological control. The investigation of weevil collapse and population dynamics (Figure 8) suggests that some of this work (Alfaro et al. 1985; Hulme 1994) may be worth revisiting. Trials using various techniques, such as spacing and mixed species plantings, have been established (Appendix 1f: ep 702.00.01), but results have not shown effective weevil control. Deploying genetically resistant material in conjunc-tion with site hazard evaluation is seen as a more cost-effective and robust approach over the long term.
5.2.2 Hazard evaluation trials Current deployment guidelines for Sitka spruce are extremely conservative, reflecting the species’ historic susceptibility to the weevil. However, the Sitka spruce tree improvement program, as detailed here, has yielded robust material that has demonstrated durable resistance to the weevil, and good growth in height and volume.
5.2 demonstration and silvicultural
trials

30
The other major influence on weevil attack, aside from genetic resistance, is the environment. Figure 7 clearly shows the impact of increasing environ-mental pressure on the bulk Big Qualicum seedlot. Trying to define the fac-tors that influence this environmental pressure is an important precursor for establishing deployment guidelines. A series of hazard evaluation trials has been established (Appendix 1f: ep 702.00.02). Initial measurements will be undertaken in 2008–2009. Site-specific empirical climate data are available from establishment in 1999 through to 2008. Additional refinement of exist-ing weevil hazard mapping based on climate station data will also be initiated in 2008–2009. This will involve using a climate modelling approach and inte-grating a spatial gis database with growing-season degree-day accumulation to indicate conditions associated with varying degrees of suitability for weevil development. Thresholds for weevil development in Sitka and interior spruce have already been established and can be interpolated in the transition zone. Results from established trials and plantations that are using susceptible and resistant seedlots will be used to refine the model. This includes developing recommendations for fine-scale spatial variation, such as aspect or microsite.
6 otHEr sPrucE ProgrAms
Weevil resistance is an important component of the interior spruce breed-ing program, but far more emphasis is placed on growth and yield than in the Sitka spruce program. As found by o’Neill et al. (2002) and Alfaro et al. (1997), resin canal hindrance, particularly traumatic resin canal formation, is a much stronger and more effective resistance agent in white spruce than Sitka spruce. Although provenance variation is not as apparent, there is con-siderable genetic resistance in interior spruce populations (King et al. 1997; Alfaro et al. 2004), and an active selection program for weevil resistance is under way.
12 Prominent in these selections are eastern North American trees that display strong and durable genetic resistance to the weevil, and which have very good height growth. Some unique genotypes, such as clone pg29, have been identified as having some of the total resistance characteristics as Sitka spruce clone 898.
The Coast Mountains of British Columbia provide a natural barrier between coastal Sitka spruce and interior spruce (including white and Engelmann spruce and their hybrids). However, in some areas with submaritime cli-mates, and where rivers, such as the Nass and Skeena Rivers, open up east–west valleys through the mountain ranges, these species naturally hybridize. These hybrid zones, besides having tremendous genetic diversity due to the introgression of the two gene pools, are also areas of extreme environmental variability since they are at the transition between coastal and interior cli-mates. In the hybrid zones, the major adaptive selection pressures on spruce seedlings include (1) weevil hazard: having a high proportion of interior spruce genes reduces weevil susceptibility by 50%, (2) frost tolerance: interior spruce has much higher frost hardiness, and (3) growth rate: having a high
6.1 interior spruce Program
6.2 nass/skeena transition Program
12 B. Jaquish, pers. comm. see: www.for.gov.bc.ca/hre/forgen/interior/spruce.htm.
31
proportion of Sitka spruce genes leads to significantly faster growth. All three of these selection pressures strongly influence the health and adaptability of spruce trees but in differing directions depending on the genetic makeup of the hybrid. Frost and weevil tolerance are superior in interior spruce, while growth rate—which influences adaptability in a seedling’s ability to overcome brush hazard, browsing, and weevil attack recovery—is higher in Sitka spruce genotypes. The trade-offs between Sitka and interior spruce traits in hybrid trees make it difficult to prescribe seedlots for the transition area. Seed trans-fer in this zone is very limited—only ± 0.5º of latitude compared to 3º for most other species. This restriction has been a challenge for resource manag-ers trying to use spruce in this area. In 2000, a series of trials was established using single-tree collections made throughout the hybrid area of northwest British Columbia and other spruce transition areas, and including some known F1 and other pedigreed crosses. These trials will be assessed for growth, survival, and weevil attack in 2008–2009. Information from this assessment will be used to establish guidelines for Sitka and hybrid spruce seed transfer. It will also enhance our understanding of the importance of the genetic origin of seedlots and the effects of environmental pressures on growth, stress tolerance, and weevil attack levels. Collaborative nursery and molecular genetics projects with the University of British Columbia Centre for Forest Conservation Genetics13 have provided important information that will support the field trial assess-ments and improve our understanding of the complex genetic and environ-mental diversity of spruce in this region.
The main region where Sitka spruce has remained commercially important in British Columbia is the Queen Charlotte Islands, where the terminal weevil is not present. Annual planting of Sitka spruce in the Haida Gwaii Forest District from 1996 to 2000 averaged 800 000 seedlings, with a high of 1.1 mil-lion in 1998. However, current plantings throughout British Columbia now number only about 500 000. Genetic research on Sitka spruce in the Queen Charlotte Islands has included a series of non-iufro and iufro provenance trials (Appendix 1a: ep 702.02 and ep 702.05, Rennell Sound). These trials have had excellent growth rates, with oregon sources attaining double the volume of local sources at 20 years (Figure 4). This increased growth potential does not appear to incur any costs in terms of damage (such as forking due to frost kill) or lower wood density. In fact, the wood density profiles of these oregon trees appear better than local sources as the extended late-season growth also produces a much higher percentage of denser latewood (J. King, unpublished data). Many of the U.K. Forestry Commission selections and breeding program parents in northern Britain are of qci origin. Seventy-five of these families were selected on the basis of growth rate, stem form, and, more recently, wood density, and have been established and tested alongside 90 families of the original South Moresby seed orchard (Appendix 1d; Appendix 2e). Volume gains at rotation are predicted with confidence to be 15–20% over the average (Samuels et al. 2007). The bcfs has also established trials with weevil-resistant families on the Queen Charlotte Islands (Appendix 1d). This
6.3 Queen charlotte islands Program
13 ubc Centre for Forest Conservation Genetics. See: genetics.forestry.ubc.ca/cfcg.
32
provides an opportunity to analyze these families for their inherent growth potential in the absence of weevils, which cannot be done on the mainland, and to evaluate how these families will perform if planted on the Queen Charlotte Islands. If the weevil migrates there, information is already avail-able on how weevil-resistant material can be used and deployed to protect the valuable Sitka spruce resource in that area.
7 summAry And conclusion
This report presents the history and results of several decades of research on the genetic resistance of Sitka spruce to the white pine weevil. The discovery of this resistance has supplanted many of the older and less effective silvi-culture controls, and now is seen as the key to successfully re-introducing this valuable component of our coastal rainforests. This research has, for the most part, been published, is internationally recognized, and has been used as a textbook example of how an active tree breeding program can be used against an insect pest. Most of this work has been accomplished through the establishment, careful maintenance, and record keeping of well-replicated, long-term experimental plots. This effort has involved effective and skilled teams from the British Columbia Forest Service and the Canadian Forest Ser-vice, and collaboration with the forest industry and universities. Although an ongoing breeding program is planned through the establishment of F1 trial series, it is unlikely to require the same intensive effort since the fundamental structure and populations capturing key resistance have been secured. Much of the effort in the future will likely be devoted to understanding the nature of this genetic resistance and better defining environmental hazards in order to adjust deployment guidelines. The results of this program are detailed and significant enough across the range of Sitka spruce in British Columbia that current recommendations are to deploy resistant provenances of Sitka spruce on suitable sites in the Coast Forest Region (Heppner and Turner 2006), including in-species admixtures where most of the block will be reforested to spruce. This will help increase diversity and bring back a historic species to the forests of British Columbia.
33
8 rEFErEncEs
Alfaro, R.I. 1982. Fifty-year-old Sitka spruce plantations with a history of intense weevil attack. J. Entomol. Soc. B.C. 79:62–65.
_________. 1989. Probability of damage to Sitka spruce by the Sitka spruce weevil, Pissodes strobi. J. Entomol. Soc. B.C. 87:22–25.
_________. 1995. An induced defence reaction in white spruce to attack by white pine weevil. Can. J. For. Res. 25:1725–1730.
_________. 1996. Role of genetic resistance in managing ecosystems suscep-tible to white pine weevil. For. Chron. 72:374–380.
Alfaro, R.I., J.H. Borden, R.G. Fraser, and A.D. Yanchuk. 1994. The white pine weevil in British Columbia: basis for an integrated pest manage-ment system. For. Chron. 71:66–73.
Alfaro, R.I., J.H. Borden, J.N. King, E.S. Tomlin, R.L. McIntosh, and J. Bohl-mann. 2002. Mechanisms of resistance in conifers against shoot infesting insects: the case of the white pine weevil Pissodes strobi (Peck) (Co-leoptera: Curculionidae). In: Mechanisms and deployment of resistance in trees to insects. M.R. Wagner, K.M. Clancy, F. Lieutier, and T.D. Paine (editors). Klubbert Publ., Dordrecht, Netherlands, pp. 101–126.
Alfaro, R.I., F. He, G.K. Kiss, J. King, and A.D. Yanchuk. 1996. Resistance of white spruce to white pine weevil: development of a resistance index. For. Ecol. Manag. 81:51–62.
Alfaro, R.I., F. He, E. Tomlin, and G. Kiss. 1997. Resistance of white spruce to the white pine weevil related to resin canal density. Can. J. Bot. 75:568–573.
Alfaro, R.I., M.A. Hulme, and J.W.E. Harris. 1985. Insects associated with the Sitka spruce weevil, Pissodes strobi (Peck) (Coleoptera: Curculionidae) on Sitka spruce, Picea sitchensis, in British Columbia, Canada. Ento-mophaga 30:415–418.
Alfaro R.I, J.N. King, R.G. Brown, and S.M. Buddingh. 2008. Screening of Sitka spruce genotypes for resistance to the white pine weevil using arti-ficial infestations. For. Ecol. Manag. 255:1749–1758.
Alfaro, R.I., J.N. King, Y.A. El-Kassaby, R.G. Brown, and K.G. Lewis. 2001. Use of artificial infestations in the selection of Sitka spruce genotypes for resistance to the white pine weevil in British Columbia, Canada. In: Proc. Protection of world forests from insect pests: advances in research. R.I. Alfaro, K. Day, S. Salom, K.S.S. Nair, H. Evans, A. Liebhold, F. Lieutier, M. Wagner, K. Futai, and K. Suzuki (editors.). xxi iufro World Con-gress, Kuala Lumpur, Malaysia. iufro, Vienna, Austria, pp. 13–18.

34
Alfaro, R.I., K.G. Lewis, J.N. King, Y.A. El-Kassaby, G. Brown, and L.D. Smith. 2000. Budburst phenology of Sitka spruce and its relationship to white pine weevil attack. For. Ecol. Manag. 127:19–29.
Alfaro, R.I. and S.A.Y. omule. 1990. The effects of spacing on Sitka spruce weevil damage to Sitka spruce. Can. J. For. Res. 20:179–184.
Alfaro R.I., L. vanAkker, B. Jaquish, and J.N. King. 2004. Weevil resistance of progeny derived from putatively resistant and susceptible interior spruce parents. For. Ecol. Manag. 202:369–377.
Alfaro, R.I. and E. Wegwitz. 1994. The spruce weevil in the Green Timbers plantation. In: The white pine weevil: biology, damage and management. R.I. Alfaro, G. Kiss, and G. Fraser (editors). Can. For. Serv. and B.C. Min. For., Richmond, B.C. frda Rep. 226, pp. 222–225. www.for.gov.bc.ca/hfd/pubs/Docs/Frr/Frr226.htm
Alfaro, R.I. and C.C. Ying. 1990. Levels of Sitka spruce weevil, Pissodes strobi (Peck) damage among Sitka spruce provenances and families near Say-ward, British Columbia (Canada). Can. Entomol. J. 122:607–616.
British Columbia Ministry of Forests and Range. 2008. 2007/08 annual ser-vice plan report. B.C. Min. For. Range, Victoria, B.C.
Carlquist, S. 1984. Wood and stem anatomy of Lardizabalaceae, with com-ments on vining habitat, ecology and systematics. Bot. J. Linn. Soc. 88:257–277.
Chakravarthy, A.K., A.S. Sidhu, and J. Singh. 1985. Effect of plant phenology and related factors on insect pest infestations in Arboreum and Hirsutum cotton varieties. Insect Sci. Appl. 6:521–532.
Daoust, G. and M.-J. Mottet. 2006. Impact of the white pine weevil (Pissodes strobi Peck) on Norway spruce plantations (Picea abies [L.] Karst.) Part 1: Productivity and lumber quality. For. Chron. 82:745–756.
Fernandes, G.W. and D. Negreiros. 2001. The occurrence and effectiveness of hypersensitive reaction against galling herbivores across host taxa. Ecol. Entomol. 26: 46–55.
Fletcher, A.M. 1976. Seed collection in north-west America with particu-lar reference to a Sitka spruce seed collection for provenance studies. In: iufro Sitka spruce, Picea sitchensis (Bong.) Carr., international ten provenance experiment: nursery stage results. Forestry Commission, Edinburgh, Scotland, Bull. No. 17, pp. 2–20.
Fraser, R.G. and S. Szeto. 1994. Insecticides applied with Ezject will protect young Sitka spruce from white pine weevil attack. In: The white pine weevil: biology, damage and management. R.I. Alfaro, G. Kiss, and G. Fraser (editors). Can. For. Serv. and B.C. Min. For., Richmond, B.C. frda Rep. 226, pp. 229–247.
35
Gatehouse, J.A. 2002. Plant resistance towards insect herbivores: a dynamic interaction. New Phytol. 156:145–169.
Grau, M., R.I. Alfaro, and G. Brown. 2001. Bark traits related to resistance to the white pine weevil in selected Sitka spruce families. Can. For. Serv. and B.C. Min. For., Pacific Forestry Centre, Victoria, B.C. Unpubl. file rep.
Harris, M.o., T.P. Freeman, o. Rohrfritsch, K.G. Anderson, S.A. Payne, and J.A. Moore. 2006. Virulent Hessian fly (Diptera: Cecidomyiidae) larvae induce a nutritive tissue during compatible interactions with wheat. Ann. Entomol. Soc. Am. 99:305–316.
Harris, M.o., J.J. Stuart, M. Mohan, S. Nair, R.J. Lamb, and o. Rohrfritsch. 2003. Grasses and gall midges: plant defenses and insect adaptation. Annu. Rev. Entomol. 48:549–577.
Heppner, D. and J. Turner. 2006. British Columbia’s coastal forests: spruce weevil and western spruce budworm forest health stand establishment decision aids. B.C. J. Ecosystems Manag. 7(3):45–49.
Hermann, R.K. 1987. North American tree species in Europe: transplanted species offer good growth potential on suitable sites. J. For. 85:27–32.
Huber, D.P.W., S. Ralph, and J. Bohlmann. 2004. Genomic hardwiring and phenotypic plasticity of terpenoid-based defenses in conifers. J. Chemi-cal Ecol. 30:2399–2418.
Hulme, M.A. 1994. The potential of Allodorus crassigaster for the biological control of Pissodes strobi. In: The white pine weevil: biology, damage and management. R.I. Alfaro, G. Kiss, and G. Fraser (editors). Can. For. Serv. and B.C. Min. For., Richmond, B.C. frda Rep. 226, pp. 294–300. www.for.gov.bc.ca/hfd/pubs/Docs/Frr/Frr226.htm
__________. 1995. Resistance by translocated Sitka spruce to damage by Pissodes strobi (Coleoptera: Curculionidae) related to tree phenology. J. Econ. Entomol. 88:1525–1530.
Humble, L.M., N. Humphreys, and G.A. Van Sickle. 1994. Distribution and hosts of white pine weevil (Pissodes strobi.) in Canada. In: The white pine weevil: biology, damage and management. R.I. Alfaro, G. Kiss, and R.G. Fraser (editors). Can. For. Serv. and B.C. Min. For., Richmond, B.C. frda Rep. 226, pp. 68–75. www.for.gov.bc.ca/hfd/pubs/Docs/Frr/Frr226.htm
Illingworth, K. 1978. Study of lodgepole pine genotype-environment interac-tion in B.C. In: Douglas-fir provenances, lodgepole pine provenances, Sitka spruce provenances and Abies provenances: Proc. iufro Joint Meet. Work. Parties, Vancouver, B.C., pp. 151–158.
36
___________. 1980. Field experiments and performance of species: Sitka spruce. In: Proc. iufro Joint Meet. Work. Parties, 1978, Vancouver, B.C., B.C. Min. For., Info. Serv. Br., Victoria, B.C. 2:310–326.
King, J.N. 1994. Delivering durable resistant Sitka spruce for plantations. In: The white pine weevil: biology, damage and management. R.I. Alfaro, G. Kiss, and G. Fraser (editors). Can. For. Serv. and B.C. Min. For., Rich-mond, B.C. frda Rep. 226., pp. 134–149. www.for.gov.bc.ca/hfd/pubs/Docs/Frr/Frr226.htm
King, J.N. and R.I. Alfaro. 2001. Screening of Sitka spruce genotypes for resis-tance to the white pine weevil in British Columbia. In: Genetic response of forest systems to changing environmental conditions. G. Müller-Stark and R. Schubert (editors). Kluwer Academic Publ., Dordrecht, Nether-lands, pp. 11–20.
___________. 2004. Breeding for resistance to a shoot weevil of Sitka spruce in British Columbia, Canada. In: Plantation forest biotechnology for the 21st century. C. Walter and M. Carson (editors). Research Signpost Publ., Kerala, India, pp.119–128.
King, J.N., R.I. Alfaro, and C. Cartwright. 2004. Genetic resistance of Sitka spruce (Picea sitchensis) populations to the white pine weevil (Pissodes strobi): distribution of resistance. Forestry 77:269–278.
King, J.N., A.D. Yanchuk, G.K. Kiss, and R.I. Alfaro. 1997. Genetic and phenotypic relationships between weevil resistance and height growth in spruce populations of British Columbia. Can. J. For. Res. 275:732–739.
Kiss, G.K. and A.D. Yanchuk. 1991. Preliminary evaluation of genetic varia-tion of weevil resistance in interior spruce in British Columbia. Can. J. For. Res. 21:230–234.
Langor, D.W. and F.A.H. Sperling. 1995. Mitochondrial variation and iden-tification of bark weevils in the Pissodes strobi species group in western Canada (Coleoptera: Curculionidae). Can. Entomol. 127:895–911.
Leal I., E.E. White, T.S. Sahota, and J.F. Manville. 1997. Differential gene ex-pression of the vitellogenin gene in the spruce terminal weevil feeding on resistant versus susceptible trees. Insect Biochem. Mol. Biol. 27:569–575.
Maclauchlan, L.E. and J.H. Borden. 1994. Spatial attack dynamics and impact of Pissodes terminalis in three biogeoclimatic zones of southern B.C. In: The white pine weevil: biology, damage and management. R.I. Alfaro, G. Kiss, and G. Fraser (editors). Can. For. Serv. and B.C. Min. For., Rich-mond, B.C. frda Rep. 226, pp. 76–90. www.for.gov.bc.ca/hfd/pubs/Docs/Frr/Frr226.htm
37
McKay-Byun, A., K.-A. Godard, M. Toudefallah, D.M. Martin, R.I. Alfaro, J.N. King, J. Bohlmann, and A.L. Plant. 2006. Wound-induced ter-pene synthase gene expression in Sitka spruce that exhibit resistance or susceptibility to attack by the white pine weevil. Plant Physiol. 104:1009–1021.
McLean, A. 1994. Silvicultural control of the white pine weevil at the UBC Malcolm Knapp Research Forest. In: The white pine weevil: biology, damage and management. R.I. Alfaro, G. Kiss, and G. Fraser (editors). Can. For. Serv. and B.C. Min. For., Richmond, B.C. frda Rep. 226, pp. 248–253. www.for.gov.bc.ca/hfd/pubs/Docs/Frr/Frr226.htm
McMullen, L.H. 1976. Spruce weevil damage, ecological basis and hazard rat-ing for Vancouver Island. Can. For. Serv. and B.C. Min. For., Pacific For. Cent., Victoria, B.C. Inf. Rep. bc–x–141.
Mitchell, R.G., K.H. Wright, and N.E. Johnson. 1990. Damage by the Sitka spruce weevil (Pissodes strobi) and growth patterns for 10 spruce species and hybrids over 26 years in the Pacific Northwest. usda For. Serv., Pac. N.W. Res. Stn., Portland, oreg. Res. Pap. pnw–rp–434.
o’Driscoll, J. 1976. International ten provenance experiment: working plan. In: iufro Sitka spruce, Picea sitchensis (Bong.) Carr., international ten provenance experiment: nursery stage results. Dep. Lands, For. and Wildl. Serv., Dublin, Ireland, pp. 140–163.
o’Neill, G.A., S.N. Aitken, J.N. King, and R.I. Alfaro. 2002. Geographic varia-tion in resin canal defences in seedlings from the Sitka × white spruce introgression zone. Can. J. For. Res. 32:390–400.
Panda, N. and G.S. Khush. 1995. Host plant resistance to insects. cab Inter-national, oxon, U.K.
Rankin, L. and K.G. Lewis, 1994. Effectiveness of leader clipping for control of the white pine weevil, Pissodes strobi, in the Cariboo Forest Region of British Columbia. In: The white pine weevil: biology, damage and man-agement. R.I. Alfaro, G. Kiss, and G. Fraser (editors). Can. For. Serv. and B.C. Min. For., Richmond, B.C. frda Rep. 226, pp. 262–269. www.for.gov.bc.ca/hfd/pubs/Docs/Frr/Frr226.htm
Sahota, T.S., J.F. Manville, J. Hollmann, I. Leal, A. Ibaraki, and E.E. White. 2001. Resistance against Pissodes strobi (Coleoptera: Curculionidae) in severed leaders and in water-soluble bark extract of Picea sitchensis (Pinaceae): evidence for a post-ingestive mode of action. Can. Entomol. 133:1–9.
Sahota, T.S., J.F. Manville, F.G. Peet, E.E. White, A.Ibaraki, and J.R. Nault. 1998. Resistance against white pine weevil: effects on weevil reproduc-tion and host finding. Can. Entomol. 130:337–347.
38
Sahota, T.S., J.F. Manville, and E.E. White. 1994. Interaction between Sitka spruce weevil and its host Picea sitchensis (Bong) Carr.: a new mecha-nism for resistance. Can. Entomol. 126:1067–1074.
Samuel, C.J.A., A.M. Fletcher, and R. Lines. 2007. Choice of Sitka spruce seed origins for use in British forests. For. Comm. Bull. 127. For. Comm., Edinburgh, Scotland.
Spittlehouse, D.L., B.G. Sieben, and S.P. Taylor. 1994. Spruce weevil hazard mapping based on climate and ground survey data. In: The white pine weevil: biology, damage and management. R.I. Alfaro, G. Kiss, and G. Fraser (editors). Can. For. Serv. and B.C. Min. For., Richmond, B.C. frda Rep. 226, pp. 23–32. www.for.gov.bc.ca/hfd/pubs/Docs/Frr/Frr226.htm
Stoehr, M., J. Webber, and J. Woods. 2004. Protocol for rating seed orchard seedlots in British Columbia: quantifying genetic gain and diversity. Forestry 77:297–303.
Taylor, S.P., R.I. Alfaro, C. DeLong, and L. Rankin. 1996. The effects of over-story shading on white pine weevil damage to white spruce and its effect on spruce growth rates. Can. J. For. Res. 26:306–312.
Tomlin, E. and J.H. Borden. 1994. Relationship between leader morphology and resistance or susceptibility of Sitka spruce to the white pine weevil. Can. J. For. Res. 24:810–816.
White, T.L. and G.R. Hodge. 1989. Predicting breeding values with applica-tions in forest tree improvement. Kluwer Academic Publishers. Dor-drecht, Netherlands.
Xu, P., C.C. Ying, and Y.A. El-Kassaby. 2000. Multivariate approaches for de-termining the underlying major ecological factors characterizing growth of 43 Sitka spruce populations. Silvae Genet. 49:257–263.
Ying, C.C. 1991. Genetic resistance to the white pine weevil in Sitka spruce. B.C. Min. For., Victoria, B.C. Res. Note 196.
________. 1997. Effects of site, provenance and site interaction in Sitka spruce in coastal British Columbia. For. Genet. 4:99–112.
Ying, C.C. and T. Ebata. 1994. Provenance variation in weevil attack in Sitka spruce. In: The white pine weevil: biology, damage and management. R.I. Alfaro, G. Kiss, and G. Fraser (editors). Can. For. Serv. and B.C. Min. For., Richmond, B.C. frda Rep. 226, pp. 98–109. www.for.gov.bc.ca/hfd/pubs/Docs/Frr/Frr226.htm
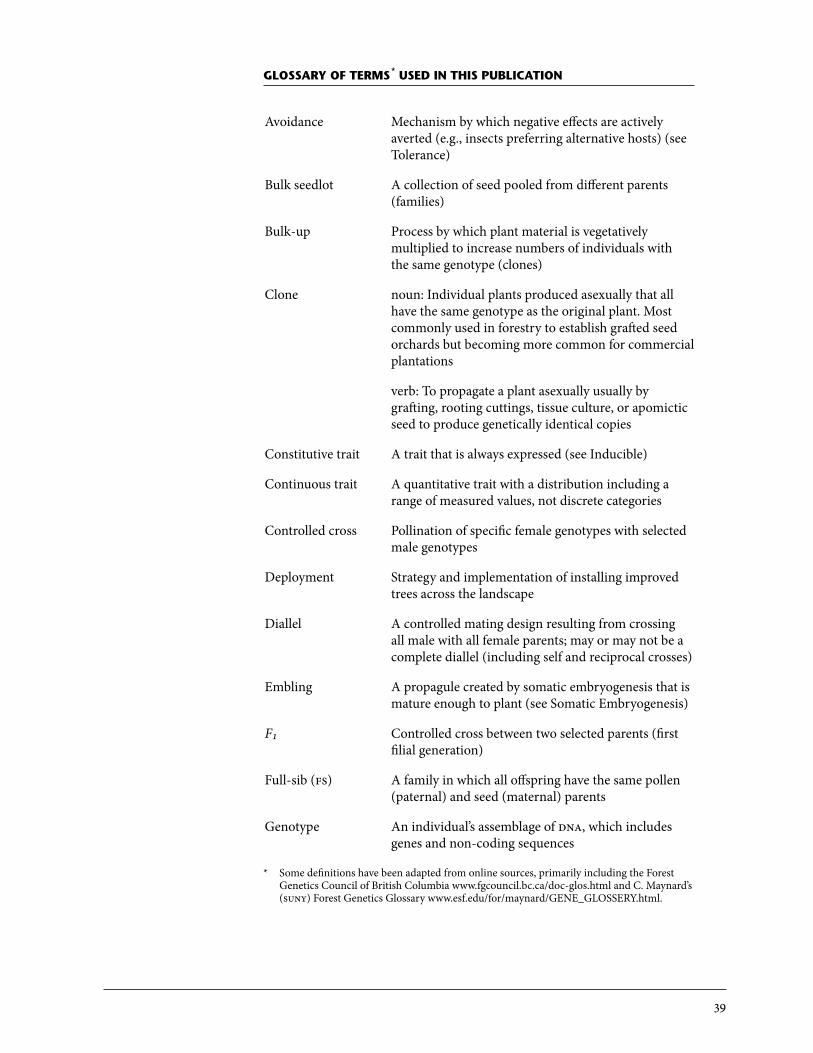
39
glossAry oF tErms * usEd in tHis PublicAtion
Avoidance Mechanism by which negative effects are actively averted (e.g., insects preferring alternative hosts) (see Tolerance)
Bulk seedlot A collection of seed pooled from different parents (families)
Bulk-up Process by which plant material is vegetatively multiplied to increase numbers of individuals with the same genotype (clones)
Clone noun: Individual plants produced asexually that all have the same genotype as the original plant. Most commonly used in forestry to establish grafted seed orchards but becoming more common for commercial plantations
verb: To propagate a plant asexually usually by grafting, rooting cuttings, tissue culture, or apomictic seed to produce genetically identical copies
Constitutive trait A trait that is always expressed (see Inducible)
Continuous trait A quantitative trait with a distribution including a range of measured values, not discrete categories
Controlled cross Pollination of specific female genotypes with selected male genotypes
Deployment Strategy and implementation of installing improved trees across the landscape
Diallel A controlled mating design resulting from crossing all male with all female parents; may or may not be a complete diallel (including self and reciprocal crosses)
Embling A propagule created by somatic embryogenesis that is mature enough to plant (see Somatic Embryogenesis)
F1 Controlled cross between two selected parents (first filial generation)
Full-sib (fs) A family in which all offspring have the same pollen (paternal) and seed (maternal) parents
Genotype An individual’s assemblage of dna, which includes genes and non-coding sequences
* Some definitions have been adapted from online sources, primarily including the Forest Genetics Council of British Columbia www.fgcouncil.bc.ca/doc-glos.html and C. Maynard’s (suny) Forest Genetics Glossary www.esf.edu/for/maynard/GENE_GLoSSERY.html.
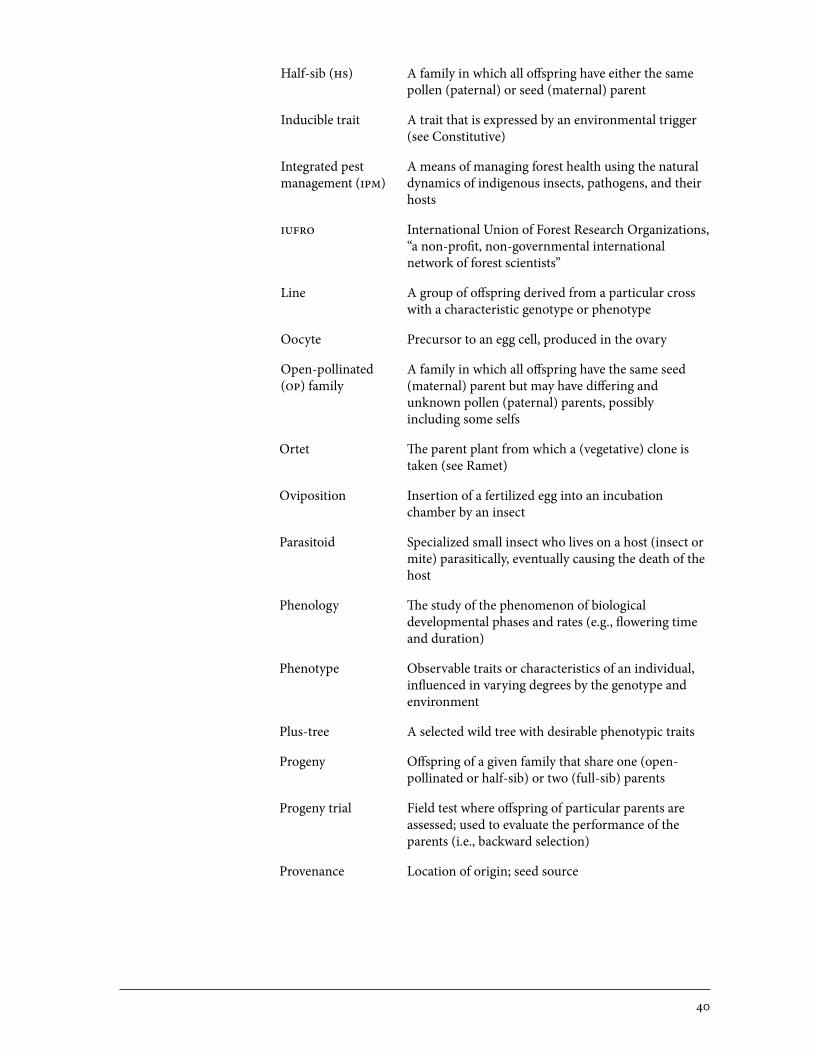
40
Half-sib (hs) A family in which all offspring have either the same pollen (paternal) or seed (maternal) parent
Inducible trait A trait that is expressed by an environmental trigger (see Constitutive)
Integrated pest A means of managing forest health using the natural management (ipm) dynamics of indigenous insects, pathogens, and their
hosts
iufro International Union of Forest Research organizations, “a non-profit, non-governmental international network of forest scientists”
Line A group of offspring derived from a particular cross with a characteristic genotype or phenotype
oocyte Precursor to an egg cell, produced in the ovary
open-pollinated A family in which all offspring have the same seed (op) family (maternal) parent but may have differing and
unknown pollen (paternal) parents, possibly including some selfs
ortet The parent plant from which a (vegetative) clone is taken (see Ramet)
oviposition Insertion of a fertilized egg into an incubation chamber by an insect
Parasitoid Specialized small insect who lives on a host (insect or mite) parasitically, eventually causing the death of the host
Phenology The study of the phenomenon of biological developmental phases and rates (e.g., flowering time and duration)
Phenotype observable traits or characteristics of an individual, influenced in varying degrees by the genotype and environment
Plus-tree A selected wild tree with desirable phenotypic traits
Progeny offspring of a given family that share one (open-pollinated or half-sib) or two (full-sib) parents
Progeny trial Field test where offspring of particular parents are assessed; used to evaluate the performance of the parents (i.e., backward selection)
Provenance Location of origin; seed source
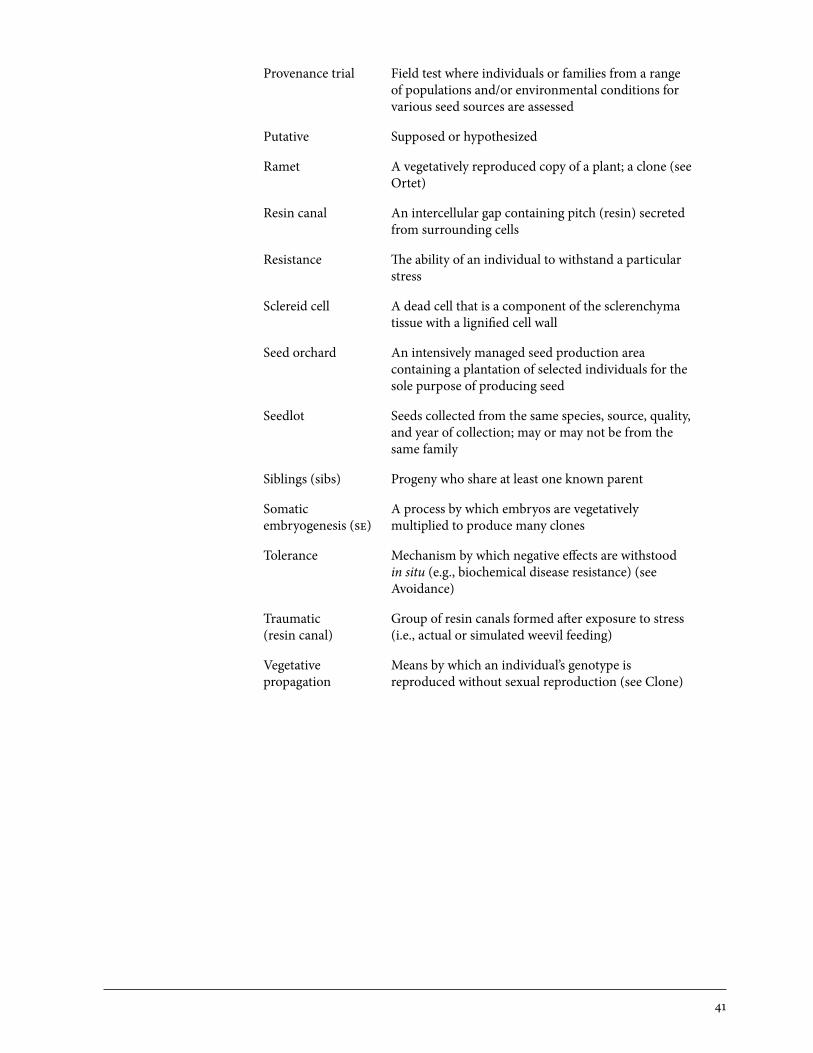
41
Provenance trial Field test where individuals or families from a range of populations and/or environmental conditions for various seed sources are assessed
Putative Supposed or hypothesized
Ramet A vegetatively reproduced copy of a plant; a clone (see ortet)
Resin canal An intercellular gap containing pitch (resin) secreted from surrounding cells
Resistance The ability of an individual to withstand a particular stress
Sclereid cell A dead cell that is a component of the sclerenchyma tissue with a lignified cell wall
Seed orchard An intensively managed seed production area containing a plantation of selected individuals for the sole purpose of producing seed
Seedlot Seeds collected from the same species, source, quality, and year of collection; may or may not be from the same family
Siblings (sibs) Progeny who share at least one known parent
Somatic A process by which embryos are vegetatively embryogenesis (se) multiplied to produce many clones
Tolerance Mechanism by which negative effects are withstood in situ (e.g., biochemical disease resistance) (see Avoidance)
Traumatic Group of resin canals formed after exposure to stress (resin canal) (i.e., actual or simulated weevil feeding)
Vegetative Means by which an individual’s genotype is propagation reproduced without sexual reproduction (see Clone)
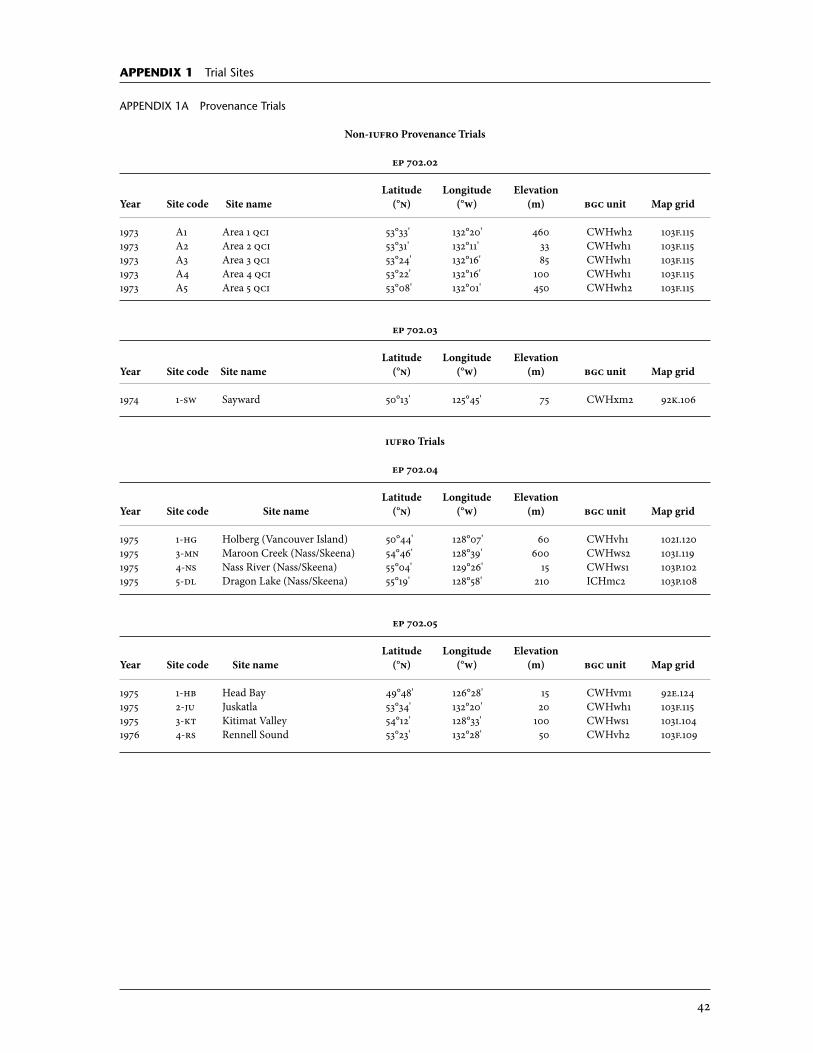
42
APPEndix 1 Trial Sites
APPENDIX 1A Provenance Trials
Non-iufro Provenance Trials
ep 702.02
Latitude Longitude Elevation Year Site code Site name (°n) (°w) (m) bgc unit Map grid
1973 A1 Area 1 qci 53°33' 132°20' 460 CWHwh2 103f.1151973 A2 Area 2 qci 53°31' 132°11' 33 CWHwh1 103f.1151973 A3 Area 3 qci 53°24' 132°16' 85 CWHwh1 103f.1151973 A4 Area 4 qci 53°22' 132°16' 100 CWHwh1 103f.1151973 A5 Area 5 qci 53°08' 132°01' 450 CWHwh2 103f.115
ep 702.03
Latitude Longitude Elevation Year Site code Site name (°n) (°w) (m) bgc unit Map grid
1974 1-sw Sayward 50°13' 125°45' 75 CWHxm2 92k.106
iufro Trials
ep 702.04
Latitude Longitude Elevation Year Site code Site name (°n) (°w) (m) bgc unit Map grid
1975 1-hg Holberg (Vancouver Island) 50°44' 128°07' 60 CWHvh1 102i.1201975 3-mn Maroon Creek (Nass/Skeena) 54°46' 128°39' 600 CWHws2 103i.1191975 4-ns Nass River (Nass/Skeena) 55°04' 129°26' 15 CWHws1 103p.1021975 5-dl Dragon Lake (Nass/Skeena) 55°19' 128°58' 210 ICHmc2 103p.108
ep 702.05
Latitude Longitude Elevation Year Site code Site name (°n) (°w) (m) bgc unit Map grid
1975 1-hb Head Bay 49°48' 126°28' 15 CWHvm1 92e.1241975 2-ju Juskatla 53°34' 132°20' 20 CWHwh1 103f.1151975 3-k Kitimat Valley 54°12' 128°33' 100 CWHws1 103i.1041976 4-rs Rennell Sound 53°23' 132°28' 50 CWHvh2 103f.109
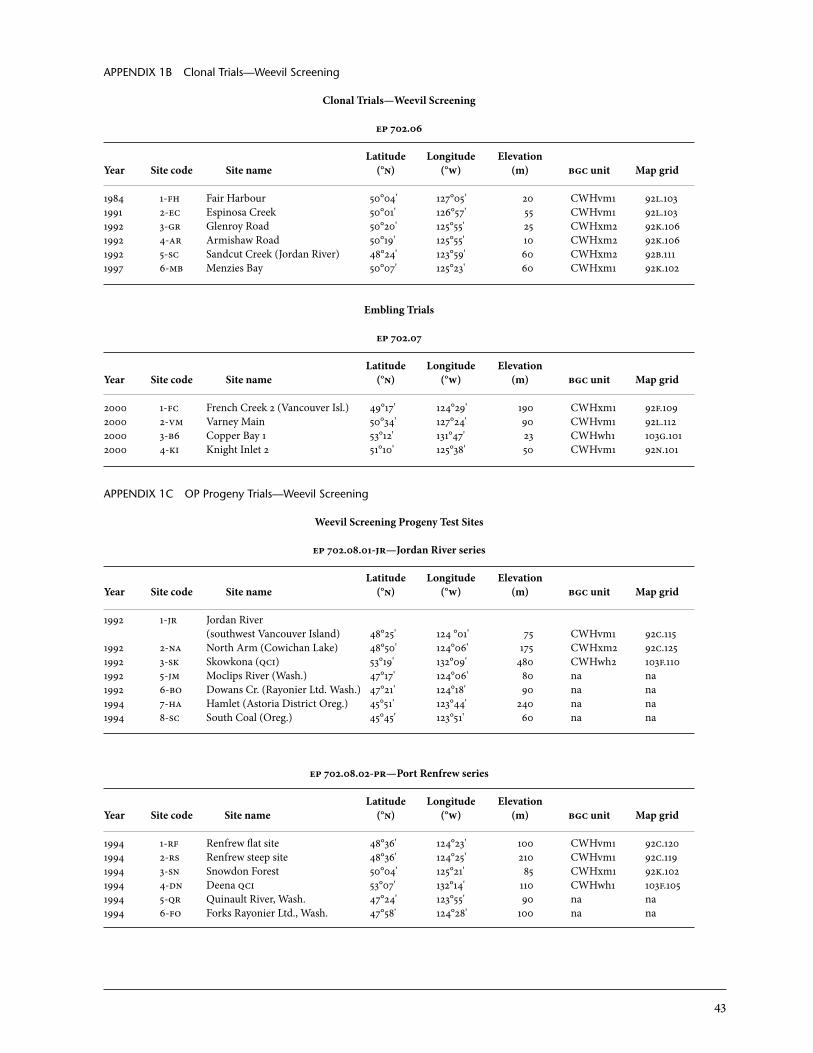
43
APPENDIX 1B Clonal Trials—Weevil Screening
Clonal Trials—Weevil Screening
ep 702.06
Latitude Longitude Elevation Year Site code Site name (°n) (°w) (m) bgc unit Map grid
1984 1-fh Fair Harbour 50°04' 127°05' 20 CWHvm1 92l.1031991 2-ec Espinosa Creek 50°01' 126°57' 55 CWHvm1 92l.1031992 3-gr Glenroy Road 50°20' 125°55' 25 CWHxm2 92k.1061992 4-ar Armishaw Road 50°19' 125°55' 10 CWHxm2 92k.1061992 5-sc Sandcut Creek (Jordan River) 48°24' 123°59' 60 CWHxm2 92b.1111997 6-mb Menzies Bay 50°07' 125°23' 60 CWHxm1 92k.102
Embling Trials
ep 702.07
Latitude Longitude Elevation Year Site code Site name (°n) (°w) (m) bgc unit Map grid
2000 1-fc French Creek 2 (Vancouver Isl.) 49°17' 124°29' 190 CWHxm1 92f.1092000 2-vm Varney Main 50°34' 127°24' 90 CWHvm1 92l.1122000 3-b6 Copper Bay 1 53°12' 131°47' 23 CWHwh1 103g.1012000 4-ki Knight Inlet 2 51°10' 125°38' 50 CWHvm1 92n.101
APPENDIX 1C OP Progeny Trials—Weevil Screening
Weevil Screening Progeny Test Sites
ep 702.08.01-jr—Jordan River series
Latitude Longitude Elevation Year Site code Site name (°n) (°w) (m) bgc unit Map grid
1992 1-jr Jordan River (southwest Vancouver Island) 48°25' 124 °01' 75 CWHvm1 92c.1151992 2-na North Arm (Cowichan Lake) 48°50' 124°06' 175 CWHxm2 92c.1251992 3-sk Skowkona (qci) 53°19' 132°09' 480 CWHwh2 103f.1101992 5-jm Moclips River (Wash.) 47°17' 124°06' 80 na na1992 6-bo Dowans Cr. (Rayonier Ltd. Wash.) 47°21' 124°18' 90 na na1994 7-ha Hamlet (Astoria District oreg.) 45°51' 123°44' 240 na na1994 8-sc South Coal (oreg.) 45°45' 123°51' 60 na na
ep 702.08.02-pr—Port Renfrew series
Latitude Longitude Elevation Year Site code Site name (°n) (°w) (m) bgc unit Map grid
1994 1-rf Renfrew flat site 48°36' 124°23' 100 CWHvm1 92c.1201994 2-rs Renfrew steep site 48°36' 124°25' 210 CWHvm1 92c.1191994 3-sn Snowdon Forest 50°04' 125°21' 85 CWHxm1 92k.1021994 4-dn Deena qci 53°07' 132°14' 110 CWHwh1 103f.1051994 5-qr Quinault River, Wash. 47°24' 123°55' 90 na na1994 6-fo Forks Rayonier Ltd., Wash. 47°58' 124°28' 100 na na
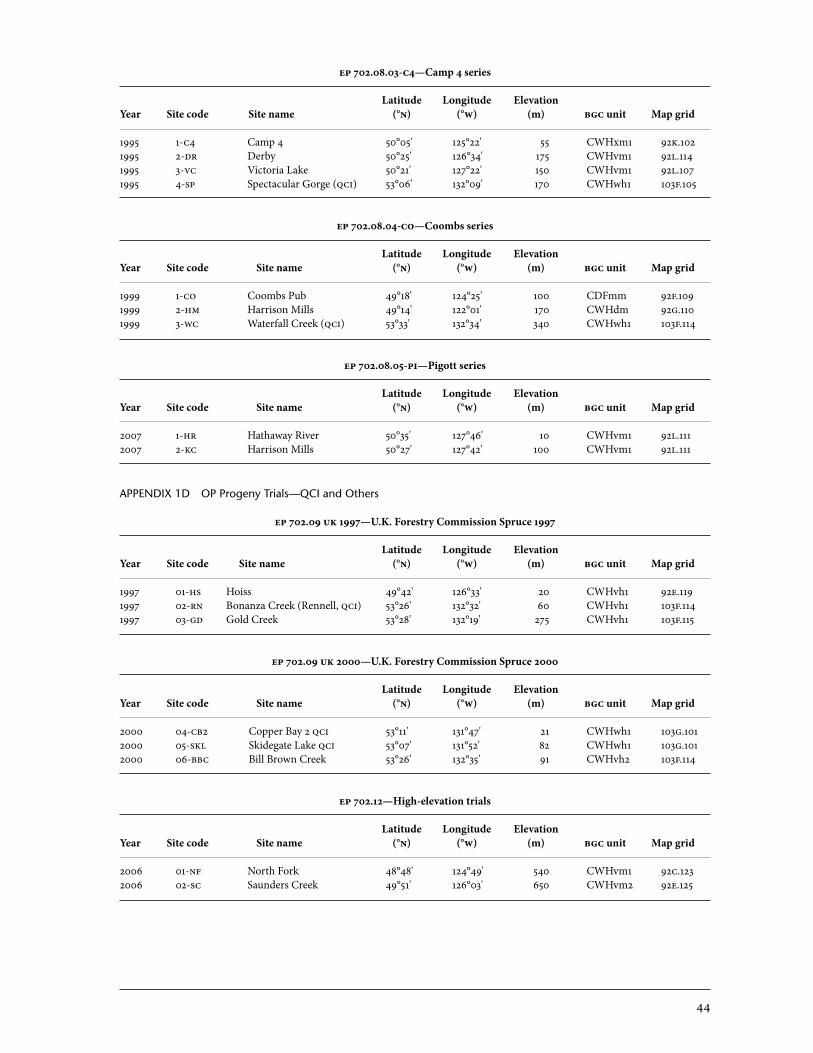
44
ep 702.08.03-c4—Camp 4 series
Latitude Longitude Elevation Year Site code Site name (°n) (°w) (m) bgc unit Map grid
1995 1-c4 Camp 4 50°05' 125°22' 55 CWHxm1 92k.1021995 2-dr Derby 50°25' 126°34' 175 CWHvm1 92l.1141995 3-vc Victoria Lake 50°21' 127°22' 150 CWHvm1 92l.1071995 4-sp Spectacular Gorge (qci) 53°06' 132°09' 170 CWHwh1 103f.105
ep 702.08.04-co—Coombs series
Latitude Longitude Elevation Year Site code Site name (°n) (°w) (m) bgc unit Map grid
1999 1-co Coombs Pub 49°18' 124°25' 100 CDFmm 92f.1091999 2-hm Harrison Mills 49°14' 122°01' 170 CWHdm 92g.1101999 3-wc Waterfall Creek (qci) 53°33' 132°34' 340 CWHwh1 103f.114
ep 702.08.05-pi—Pigott series
Latitude Longitude Elevation Year Site code Site name (°n) (°w) (m) bgc unit Map grid
2007 1-hr Hathaway River 50°35' 127°46' 10 CWHvm1 92l.1112007 2-kc Harrison Mills 50°27' 127°42' 100 CWHvm1 92l.111
APPENDIX 1D OP Progeny Trials—QCI and Others
ep 702.09 uk 1997—U.K. Forestry Commission Spruce 1997
Latitude Longitude Elevation Year Site code Site name (°n) (°w) (m) bgc unit Map grid
1997 01-hs Hoiss 49°42' 126°33' 20 CWHvh1 92e.1191997 02-rn Bonanza Creek (Rennell, qci) 53°26' 132°32' 60 CWHvh1 103f.1141997 03-gd Gold Creek 53°28' 132°19' 275 CWHvh1 103f.115
ep 702.09 uk 2000—U.K. Forestry Commission Spruce 2000
Latitude Longitude Elevation Year Site code Site name (°n) (°w) (m) bgc unit Map grid
2000 04-cb2 Copper Bay 2 qci 53°11' 131°47' 21 CWHwh1 103g.1012000 05-skl Skidegate Lake qci 53°07' 131°52' 82 CWHwh1 103g.1012000 06-bbc Bill Brown Creek 53°26' 132°35' 91 CWHvh2 103f.114
ep 702.12—High-elevation trials
Latitude Longitude Elevation Year Site code Site name (°n) (°w) (m) bgc unit Map grid
2006 01-nf North Fork 48°48' 124°49' 540 CWHvm1 92c.1232006 02-sc Saunders Creek 49°51' 126°03' 650 CWHvm2 92e.125
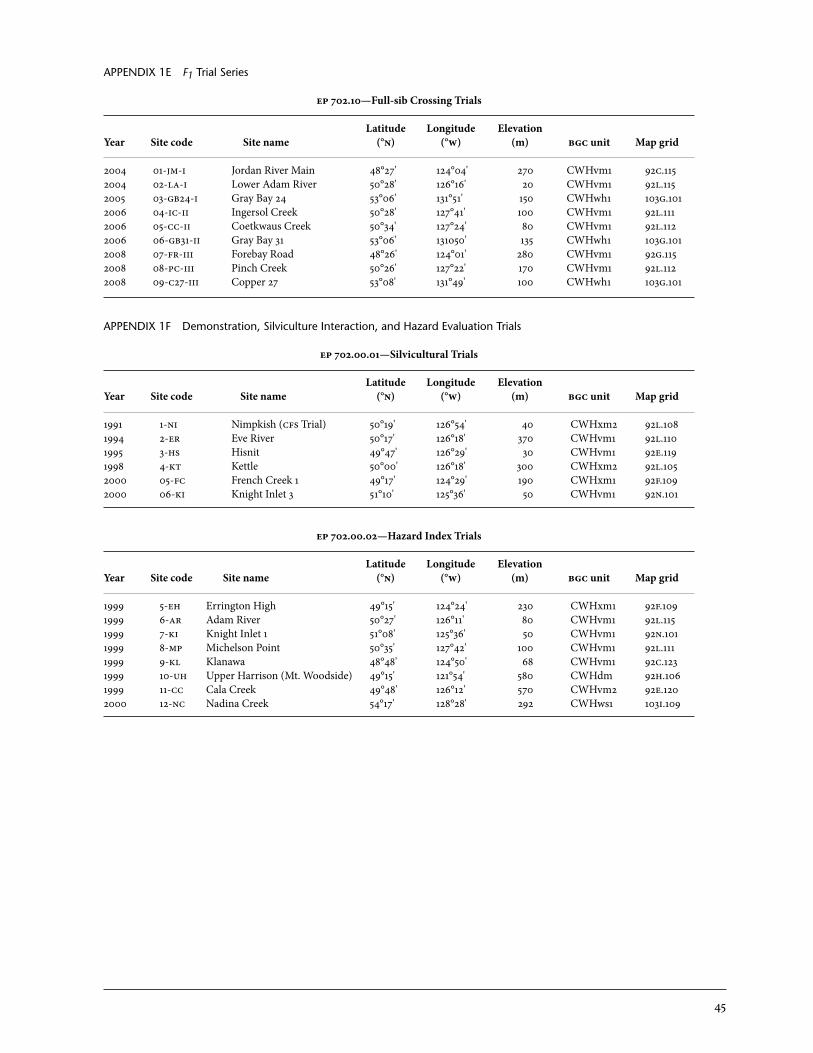
45
APPENDIX 1E F1 Trial Series
ep 702.10—Full-sib Crossing Trials
Latitude Longitude Elevation Year Site code Site name (°n) (°w) (m) bgc unit Map grid
2004 01-jm-i Jordan River Main 48°27' 124°04' 270 CWHvm1 92c.1152004 02-la-i Lower Adam River 50°28' 126°16' 20 CWHvm1 92l.1152005 03-gb24-i Gray Bay 24 53°06' 131°51' 150 CWHwh1 103g.1012006 04-ic-ii Ingersol Creek 50°28' 127°41' 100 CWHvm1 92l.1112006 05-cc-ii Coetkwaus Creek 50°34' 127°24' 80 CWHvm1 92l.1122006 06-gb31-ii Gray Bay 31 53°06' 131o50' 135 CWHwh1 103g.1012008 07-fr-iii Forebay Road 48°26' 124°01' 280 CWHvm1 92g.1152008 08-pc-iii Pinch Creek 50°26' 127°22' 170 CWHvm1 92l.1122008 09-c27-iii Copper 27 53°08' 131°49' 100 CWHwh1 103g.101
APPENDIX 1F Demonstration, Silviculture Interaction, and Hazard Evaluation Trials
ep 702.00.01—Silvicultural Trials
Latitude Longitude Elevation Year Site code Site name (°n) (°w) (m) bgc unit Map grid
1991 1-ni Nimpkish (cfs Trial) 50°19' 126°54' 40 CWHxm2 92l.1081994 2-er Eve River 50°17' 126°18' 370 CWHvm1 92l.1101995 3-hs Hisnit 49°47' 126°29' 30 CWHvm1 92e.1191998 4-k Kettle 50°00' 126°18' 300 CWHxm2 92l.1052000 05-fc French Creek 1 49°17' 124°29' 190 CWHxm1 92f.1092000 06-ki Knight Inlet 3 51°10' 125°36' 50 CWHvm1 92n.101
ep 702.00.02—Hazard Index Trials
Latitude Longitude Elevation Year Site code Site name (°n) (°w) (m) bgc unit Map grid
1999 5-eh Errington High 49°15' 124°24' 230 CWHxm1 92f.1091999 6-ar Adam River 50°27' 126°11' 80 CWHvm1 92l.1151999 7-ki Knight Inlet 1 51°08' 125°36' 50 CWHvm1 92n.1011999 8-mp Michelson Point 50°35' 127°42' 100 CWHvm1 92l.1111999 9-kl Klanawa 48°48' 124°50' 68 CWHvm1 92c.1231999 10-uh Upper Harrison (Mt. Woodside) 49°15' 121°54' 580 CWHdm 92h.1061999 11-cc Cala Creek 49°48' 126°12' 570 CWHvm2 92e.1202000 12-nc Nadina Creek 54°17' 128°28' 292 CWHws1 103i.109
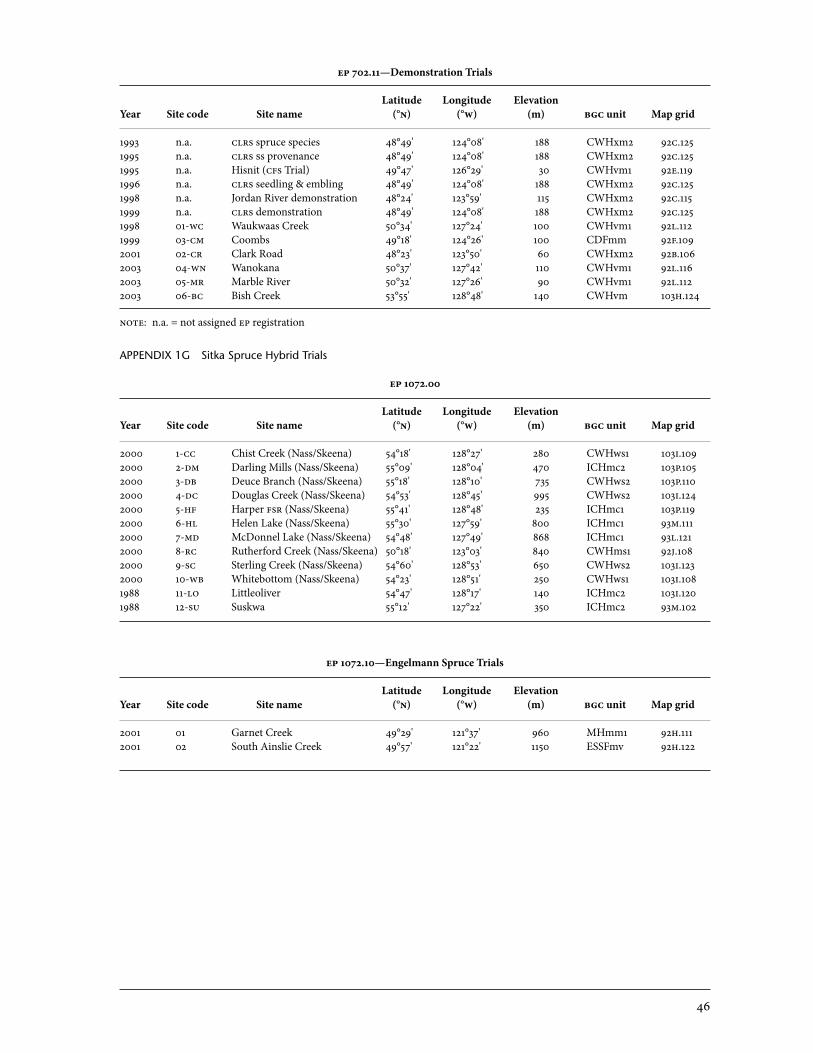
46
ep 702.11—Demonstration Trials
Latitude Longitude Elevation Year Site code Site name (°n) (°w) (m) bgc unit Map grid
1993 n.a. clrs spruce species 48°49' 124°08' 188 CWHxm2 92c.1251995 n.a. clrs ss provenance 48°49' 124°08' 188 CWHxm2 92c.1251995 n.a. Hisnit (cfs Trial) 49°47' 126°29' 30 CWHvm1 92e.1191996 n.a. clrs seedling & embling 48°49' 124°08' 188 CWHxm2 92c.1251998 n.a. Jordan River demonstration 48°24' 123°59' 115 CWHxm2 92c.1151999 n.a. clrs demonstration 48°49' 124°08' 188 CWHxm2 92c.1251998 01-wc Waukwaas Creek 50°34' 127°24' 100 CWHvm1 92l.1121999 03-cm Coombs 49°18' 124°26' 100 CDFmm 92f.1092001 02-cr Clark Road 48°23' 123°50' 60 CWHxm2 92b.1062003 04-wn Wanokana 50°37' 127°42' 110 CWHvm1 92l.1162003 05-mr Marble River 50°32' 127°26' 90 CWHvm1 92l.1122003 06-bc Bish Creek 53°55' 128°48' 140 CWHvm 103h.124
noe: n.a. = not assigned ep registration APPENDIX 1G Sitka Spruce Hybrid Trials
ep 1072.00
Latitude Longitude Elevation Year Site code Site name (°n) (°w) (m) bgc unit Map grid
2000 1-cc Chist Creek (Nass/Skeena) 54°18' 128°27' 280 CWHws1 103i.1092000 2-dm Darling Mills (Nass/Skeena) 55°09' 128°04' 470 ICHmc2 103p.1052000 3-db Deuce Branch (Nass/Skeena) 55°18' 128°10' 735 CWHws2 103p.1102000 4-dc Douglas Creek (Nass/Skeena) 54°53' 128°45' 995 CWHws2 103i.1242000 5-hf Harper fsr (Nass/Skeena) 55°41' 128°48' 235 ICHmc1 103p.1192000 6-hl Helen Lake (Nass/Skeena) 55°30' 127°59' 800 ICHmc1 93m.1112000 7-md McDonnel Lake (Nass/Skeena) 54°48' 127°49' 868 ICHmc1 93l.1212000 8-rc Rutherford Creek (Nass/Skeena) 50°18' 123°03' 840 CWHms1 92j.1082000 9-sc Sterling Creek (Nass/Skeena) 54°60' 128°53' 650 CWHws2 103i.1232000 10-wb Whitebottom (Nass/Skeena) 54°23' 128°51' 250 CWHws1 103i.1081988 11-lo Littleoliver 54°47' 128°17' 140 ICHmc2 103i.1201988 12-su Suskwa 55°12' 127°22' 350 ICHmc2 93m.102
ep 1072.10—Engelmann Spruce Trials
Latitude Longitude Elevation Year Site code Site name (°n) (°w) (m) bgc unit Map grid
2001 01 Garnet Creek 49°29' 121°37' 960 MHmm1 92h.1112001 02 South Ainslie Creek 49°57' 121°22' 1150 ESSFmv 92h.122
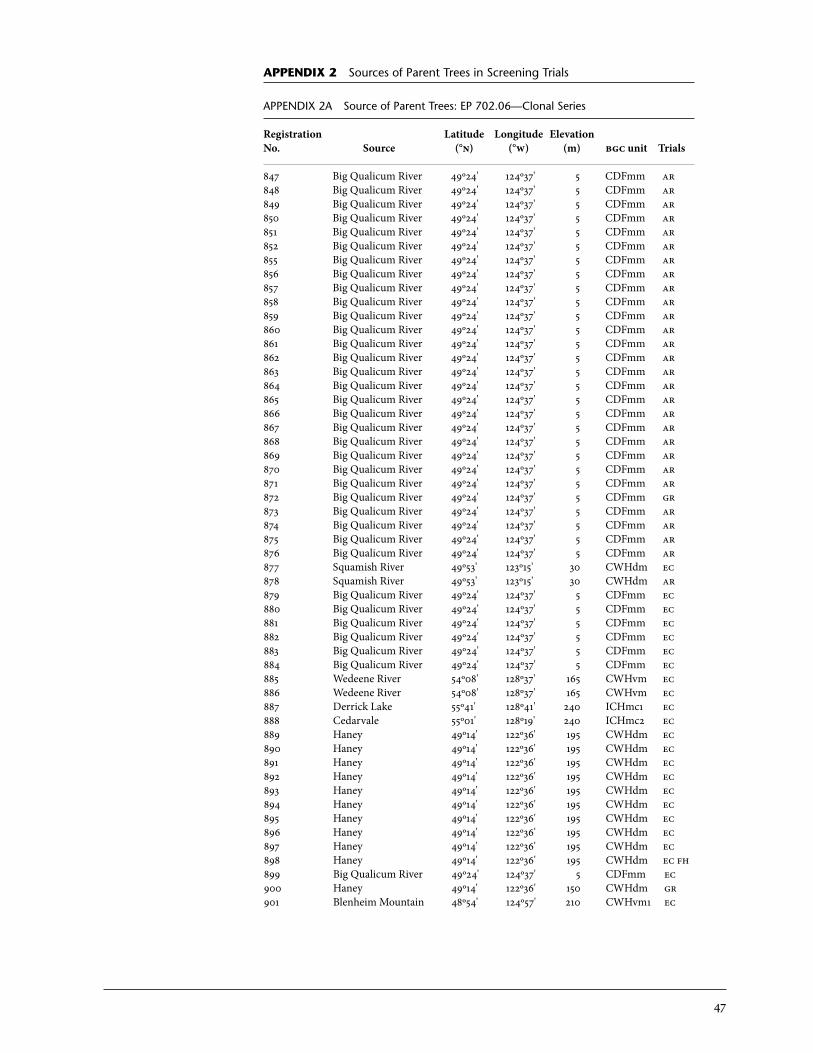
47
APPEndix 2 Sources of Parent Trees in Screening Trials
APPENDIX 2A Source of Parent Trees: EP 702.06—Clonal Series
Registration Latitude Longitude Elevation No. Source (°n) (°w) (m) bgc unit Trials 847 Big Qualicum River 49º24' 124º37' 5 CDFmm ar848 Big Qualicum River 49º24' 124º37' 5 CDFmm ar849 Big Qualicum River 49º24' 124º37' 5 CDFmm ar850 Big Qualicum River 49º24' 124º37' 5 CDFmm ar851 Big Qualicum River 49º24' 124º37' 5 CDFmm ar852 Big Qualicum River 49º24' 124º37' 5 CDFmm ar855 Big Qualicum River 49º24' 124º37' 5 CDFmm ar856 Big Qualicum River 49º24' 124º37' 5 CDFmm ar857 Big Qualicum River 49º24' 124º37' 5 CDFmm ar858 Big Qualicum River 49º24' 124º37' 5 CDFmm ar859 Big Qualicum River 49º24' 124º37' 5 CDFmm ar860 Big Qualicum River 49º24' 124º37' 5 CDFmm ar861 Big Qualicum River 49º24' 124º37' 5 CDFmm ar862 Big Qualicum River 49º24' 124º37' 5 CDFmm ar863 Big Qualicum River 49º24' 124º37' 5 CDFmm ar864 Big Qualicum River 49º24' 124º37' 5 CDFmm ar865 Big Qualicum River 49º24' 124º37' 5 CDFmm ar866 Big Qualicum River 49º24' 124º37' 5 CDFmm ar867 Big Qualicum River 49º24' 124º37' 5 CDFmm ar868 Big Qualicum River 49º24' 124º37' 5 CDFmm ar869 Big Qualicum River 49º24' 124º37' 5 CDFmm ar870 Big Qualicum River 49º24' 124º37' 5 CDFmm ar871 Big Qualicum River 49º24' 124º37' 5 CDFmm ar872 Big Qualicum River 49º24' 124º37' 5 CDFmm gr873 Big Qualicum River 49º24' 124º37' 5 CDFmm ar874 Big Qualicum River 49º24' 124º37' 5 CDFmm ar875 Big Qualicum River 49º24' 124º37' 5 CDFmm ar876 Big Qualicum River 49º24' 124º37' 5 CDFmm ar877 Squamish River 49º53' 123º15' 30 CWHdm ec878 Squamish River 49º53' 123º15' 30 CWHdm ar879 Big Qualicum River 49º24' 124º37' 5 CDFmm ec880 Big Qualicum River 49º24' 124º37' 5 CDFmm ec881 Big Qualicum River 49º24' 124º37' 5 CDFmm ec882 Big Qualicum River 49º24' 124º37' 5 CDFmm ec883 Big Qualicum River 49º24' 124º37' 5 CDFmm ec884 Big Qualicum River 49º24' 124º37' 5 CDFmm ec885 Wedeene River 54º08' 128º37' 165 CWHvm ec886 Wedeene River 54º08' 128º37' 165 CWHvm ec887 Derrick Lake 55º41' 128º41' 240 ICHmc1 ec888 Cedarvale 55º01' 128º19' 240 ICHmc2 ec889 Haney 49º14' 122º36' 195 CWHdm ec890 Haney 49º14' 122º36' 195 CWHdm ec891 Haney 49º14' 122º36' 195 CWHdm ec892 Haney 49º14' 122º36' 195 CWHdm ec893 Haney 49º14' 122º36' 195 CWHdm ec894 Haney 49º14' 122º36' 195 CWHdm ec895 Haney 49º14' 122º36' 195 CWHdm ec896 Haney 49º14' 122º36' 195 CWHdm ec897 Haney 49º14' 122º36' 195 CWHdm ec898 Haney 49º14' 122º36' 195 CWHdm ec fh899 Big Qualicum River 49º24' 124º37' 5 CDFmm ec900 Haney 49º14' 122º36' 150 CWHdm gr901 Blenheim Mountain 48º54' 124º57' 210 CWHvm1 ec
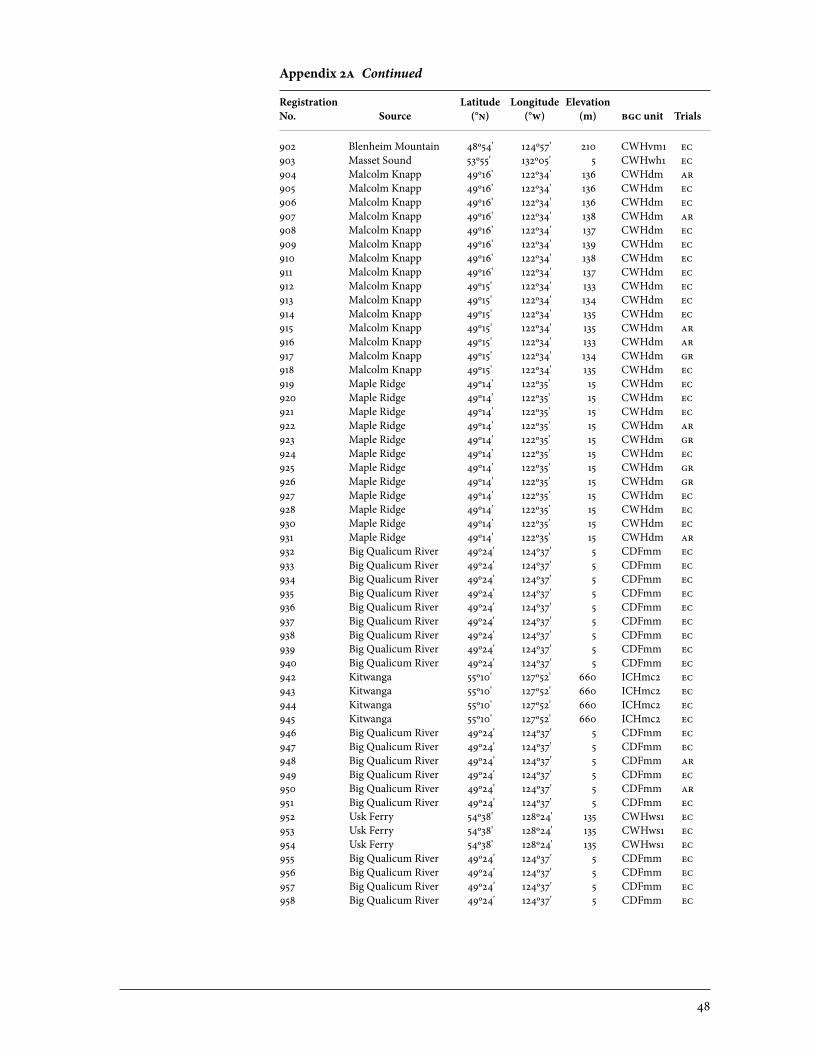
48
902 Blenheim Mountain 48º54' 124º57' 210 CWHvm1 ec903 Masset Sound 53º55' 132º05' 5 CWHwh1 ec904 Malcolm Knapp 49º16' 122º34' 136 CWHdm ar905 Malcolm Knapp 49º16' 122º34' 136 CWHdm ec906 Malcolm Knapp 49º16' 122º34' 136 CWHdm ec907 Malcolm Knapp 49º16' 122º34' 138 CWHdm ar908 Malcolm Knapp 49º16' 122º34' 137 CWHdm ec909 Malcolm Knapp 49º16' 122º34' 139 CWHdm ec910 Malcolm Knapp 49º16' 122º34' 138 CWHdm ec911 Malcolm Knapp 49º16' 122º34' 137 CWHdm ec912 Malcolm Knapp 49º15' 122º34' 133 CWHdm ec913 Malcolm Knapp 49º15' 122º34' 134 CWHdm ec914 Malcolm Knapp 49º15' 122º34' 135 CWHdm ec915 Malcolm Knapp 49º15' 122º34' 135 CWHdm ar916 Malcolm Knapp 49º15' 122º34' 133 CWHdm ar917 Malcolm Knapp 49º15' 122º34' 134 CWHdm gr918 Malcolm Knapp 49º15' 122º34' 135 CWHdm ec919 Maple Ridge 49º14' 122º35' 15 CWHdm ec920 Maple Ridge 49º14' 122º35' 15 CWHdm ec921 Maple Ridge 49º14' 122º35' 15 CWHdm ec922 Maple Ridge 49º14' 122º35' 15 CWHdm ar923 Maple Ridge 49º14' 122º35' 15 CWHdm gr924 Maple Ridge 49º14' 122º35' 15 CWHdm ec925 Maple Ridge 49º14' 122º35' 15 CWHdm gr926 Maple Ridge 49º14' 122º35' 15 CWHdm gr927 Maple Ridge 49º14' 122º35' 15 CWHdm ec928 Maple Ridge 49º14' 122º35' 15 CWHdm ec930 Maple Ridge 49º14' 122º35' 15 CWHdm ec931 Maple Ridge 49º14' 122º35' 15 CWHdm ar932 Big Qualicum River 49º24' 124º37' 5 CDFmm ec933 Big Qualicum River 49º24' 124º37' 5 CDFmm ec934 Big Qualicum River 49º24' 124º37' 5 CDFmm ec935 Big Qualicum River 49º24' 124º37' 5 CDFmm ec936 Big Qualicum River 49º24' 124º37' 5 CDFmm ec937 Big Qualicum River 49º24' 124º37' 5 CDFmm ec938 Big Qualicum River 49º24' 124º37' 5 CDFmm ec939 Big Qualicum River 49º24' 124º37' 5 CDFmm ec940 Big Qualicum River 49º24' 124º37' 5 CDFmm ec942 Kitwanga 55º10' 127º52' 660 ICHmc2 ec943 Kitwanga 55º10' 127º52' 660 ICHmc2 ec944 Kitwanga 55º10' 127º52' 660 ICHmc2 ec945 Kitwanga 55º10' 127º52' 660 ICHmc2 ec946 Big Qualicum River 49º24' 124º37' 5 CDFmm ec947 Big Qualicum River 49º24' 124º37' 5 CDFmm ec948 Big Qualicum River 49º24' 124º37' 5 CDFmm ar949 Big Qualicum River 49º24' 124º37' 5 CDFmm ec950 Big Qualicum River 49º24' 124º37' 5 CDFmm ar951 Big Qualicum River 49º24' 124º37' 5 CDFmm ec952 Usk Ferry 54º38' 128º24' 135 CWHws1 ec953 Usk Ferry 54º38' 128º24' 135 CWHws1 ec954 Usk Ferry 54º38' 128º24' 135 CWHws1 ec955 Big Qualicum River 49º24' 124º37' 5 CDFmm ec956 Big Qualicum River 49º24' 124º37' 5 CDFmm ec957 Big Qualicum River 49º24' 124º37' 5 CDFmm ec958 Big Qualicum River 49º24' 124º37' 5 CDFmm ec
Appendix 2a Continued
Registration Latitude Longitude Elevation No. Source (°n) (°w) (m) bgc unit Trials
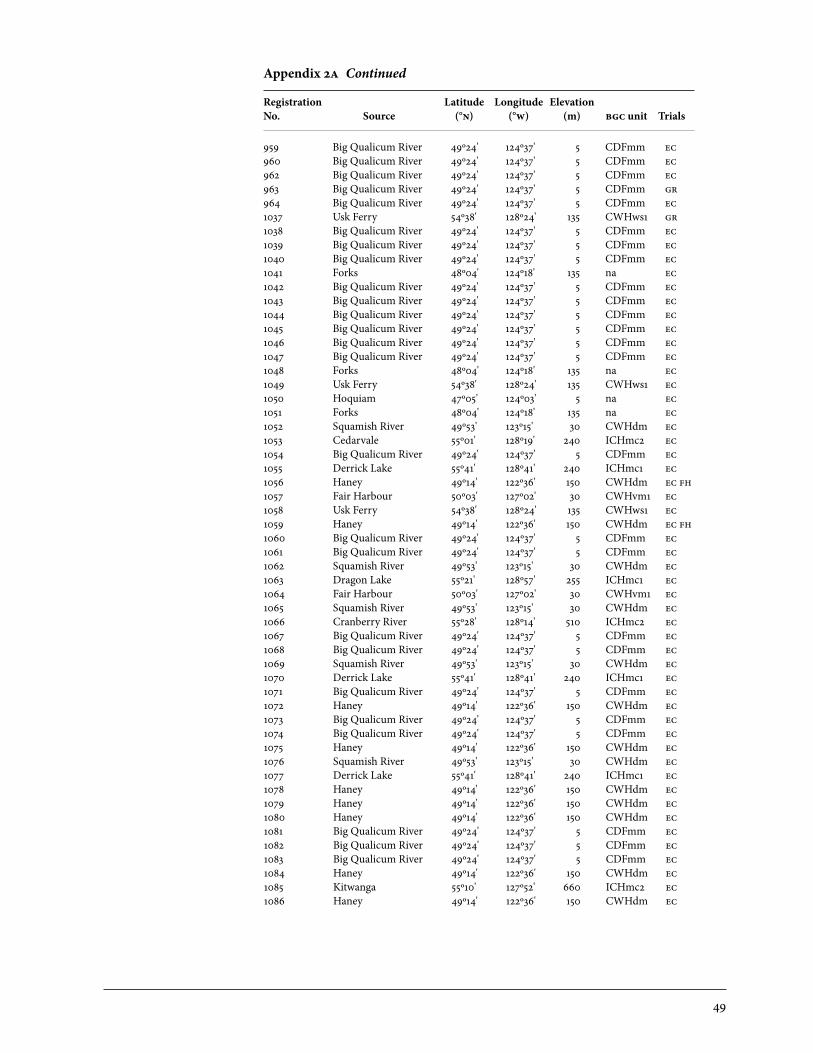
49
959 Big Qualicum River 49º24' 124º37' 5 CDFmm ec960 Big Qualicum River 49º24' 124º37' 5 CDFmm ec962 Big Qualicum River 49º24' 124º37' 5 CDFmm ec963 Big Qualicum River 49º24' 124º37' 5 CDFmm gr964 Big Qualicum River 49º24' 124º37' 5 CDFmm ec1037 Usk Ferry 54º38' 128º24' 135 CWHws1 gr1038 Big Qualicum River 49º24' 124º37' 5 CDFmm ec1039 Big Qualicum River 49º24' 124º37' 5 CDFmm ec1040 Big Qualicum River 49º24' 124º37' 5 CDFmm ec1041 Forks 48º04' 124º18' 135 na ec1042 Big Qualicum River 49º24' 124º37' 5 CDFmm ec1043 Big Qualicum River 49º24' 124º37' 5 CDFmm ec1044 Big Qualicum River 49º24' 124º37' 5 CDFmm ec1045 Big Qualicum River 49º24' 124º37' 5 CDFmm ec1046 Big Qualicum River 49º24' 124º37' 5 CDFmm ec1047 Big Qualicum River 49º24' 124º37' 5 CDFmm ec1048 Forks 48º04' 124º18' 135 na ec1049 Usk Ferry 54º38' 128º24' 135 CWHws1 ec1050 Hoquiam 47º05' 124º03' 5 na ec1051 Forks 48º04' 124º18' 135 na ec1052 Squamish River 49º53' 123º15' 30 CWHdm ec1053 Cedarvale 55º01' 128º19' 240 ICHmc2 ec1054 Big Qualicum River 49º24' 124º37' 5 CDFmm ec1055 Derrick Lake 55º41' 128º41' 240 ICHmc1 ec1056 Haney 49º14' 122º36' 150 CWHdm ec fh1057 Fair Harbour 50º03' 127º02' 30 CWHvm1 ec1058 Usk Ferry 54º38' 128º24' 135 CWHws1 ec1059 Haney 49º14' 122º36' 150 CWHdm ec fh1060 Big Qualicum River 49º24' 124º37' 5 CDFmm ec1061 Big Qualicum River 49º24' 124º37' 5 CDFmm ec1062 Squamish River 49º53' 123º15' 30 CWHdm ec1063 Dragon Lake 55º21' 128º57' 255 ICHmc1 ec1064 Fair Harbour 50º03' 127º02' 30 CWHvm1 ec1065 Squamish River 49º53' 123º15' 30 CWHdm ec1066 Cranberry River 55º28' 128º14' 510 ICHmc2 ec1067 Big Qualicum River 49º24' 124º37' 5 CDFmm ec1068 Big Qualicum River 49º24' 124º37' 5 CDFmm ec1069 Squamish River 49º53' 123º15' 30 CWHdm ec1070 Derrick Lake 55º41' 128º41' 240 ICHmc1 ec1071 Big Qualicum River 49º24' 124º37' 5 CDFmm ec1072 Haney 49º14' 122º36' 150 CWHdm ec1073 Big Qualicum River 49º24' 124º37' 5 CDFmm ec1074 Big Qualicum River 49º24' 124º37' 5 CDFmm ec1075 Haney 49º14' 122º36' 150 CWHdm ec1076 Squamish River 49º53' 123º15' 30 CWHdm ec1077 Derrick Lake 55º41' 128º41' 240 ICHmc1 ec1078 Haney 49º14' 122º36' 150 CWHdm ec1079 Haney 49º14' 122º36' 150 CWHdm ec1080 Haney 49º14' 122º36' 150 CWHdm ec1081 Big Qualicum River 49º24' 124º37' 5 CDFmm ec1082 Big Qualicum River 49º24' 124º37' 5 CDFmm ec1083 Big Qualicum River 49º24' 124º37' 5 CDFmm ec1084 Haney 49º14' 122º36' 150 CWHdm ec1085 Kitwanga 55º10' 127º52' 660 ICHmc2 ec1086 Haney 49º14' 122º36' 150 CWHdm ec
Appendix 2a Continued
Registration Latitude Longitude Elevation No. Source (°n) (°w) (m) bgc unit Trials

50
1087 Squamish River 49º53' 123º15' 30 CWHdm ec1088 Usk Ferry 54º38' 128º24' 135 CWHws1 ec1089 Haney 49º14' 122º36' 150 CWHdm ec1090 Haney 49º14' 122º36' 150 CWHdm ec1091 Squamish River 49º53' 123º15' 30 CWHdm gr1092 Haney 49º14' 122º36' 150 CWHdm ec1093 Haney 49º14' 122º36' 150 CWHdm ec1094 Wedeene River 54º08' 128º37' 165 CWHvm gr1095 Haney 49º14' 122º36' 150 CWHdm ec1096 Big Qualicum River 49º24' 124º37' 5 CDFmm ec1097 Big Qualicum River 49º24' 124º37' 5 CDFmm ec1098 Big Qualicum River 49º24' 124º37' 5 CDFmm ec1099 Big Qualicum River 49º24' 124º37' 5 CDFmm ec1100 Big Qualicum River 49º24' 124º37' 5 CDFmm ec1101 Big Qualicum River 49º24' 124º37' 5 CDFmm ec1102 Upper Squamish Valley 49º53' 125º15' 22 CWHxm1 gr1103 Upper Squamish Valley 49º53' 125º15' 22 CWHxm1 gr1104 Upper Squamish Valley 49º53' 125º15' 22 CWHxm1 gr1105 Upper Squamish Valley 49º53' 125º15' 22 CWHxm1 gr1106 Upper Squamish Valley 49º53' 125º15' 22 CWHxm1 ar1107 Upper Squamish Valley 49º53' 125º15' 22 CWHxm1 gr1108 Upper Squamish Valley 49º53' 125º15' 22 CWHxm1 gr1109 Upper Squamish Valley 49º53' 125º15' 22 CWHxm1 gr1110 Upper Squamish Valley 49º53' 125º15' 22 CWHxm1 gr1111 Upper Squamish Valley 49º53' 125º15' 22 CWHxm1 gr1112 Upper Squamish Valley 49º53' 125º15' 22 CWHxm1 gr1113 Upper Squamish Valley 49º53' 125º15' 22 CWHxm1 gr1114 Upper Squamish Valley 49º53' 125º15' 22 CWHxm1 gr1115 Upper Squamish Valley 49º53' 125º15' 22 CWHxm1 gr1116 Upper Squamish Valley 49º53' 125º15' 22 CWHxm1 ar1117 Upper Squamish Valley 49º53' 125º15' 22 CWHxm1 gr1118 Upper Squamish Valley 49º53' 125º15' 22 CWHxm1 gr1119 Upper Squamish Valley 49º53' 125º15' 22 CWHxm1 gr1120 Upper Squamish Valley 49º53' 125º15' 22 CWHxm1 gr1121 Upper Squamish Valley 49º53' 125º15' 22 CWHxm1 gr1122 Upper Squamish Valley 49º53' 125º15' 22 CWHxm1 gr1123 Upper Squamish Valley 49º53' 125º15' 22 CWHxm1 gr1124 Upper Squamish Valley 49º53' 125º15' 22 CWHxm1 gr1125 Upper Squamish Valley 49º53' 125º15' 22 CWHxm1 gr1126 Upper Squamish Valley 49º53' 125º15' 22 CWHxm1 gr1127 Upper Squamish Valley 49º53' 125º15' 22 CWHxm1 gr1128 Upper Squamish Valley 49º53' 125º15' 22 CWHxm1 gr1129 Upper Squamish Valley 49º53' 125º15' 22 CWHxm1 gr1130 Upper Squamish Valley 49º53' 125º15' 22 CWHxm1 gr1131 Upper Squamish Valley 49º53' 125º15' 22 CWHxm1 gr1132 Upper Squamish Valley 49º53' 125º15' 22 CWHxm1 gr1133 Upper Squamish Valley 49º53' 125º15' 22 CWHxm1 gr1134 Upper Squamish Valley 49º53' 125º15' 22 CWHxm1 ec1135 Upper Squamish Valley 49º53' 125º15' 22 CWHxm1 gr1136 Upper Squamish Valley 49º53' 125º15' 22 CWHxm1 gr1137 Upper Squamish Valley 49º53' 125º15' 22 CWHxm1 gr1138 Upper Squamish Valley 49º53' 125º15' 22 CWHxm1 gr1139 Kanaka Creek 49º12' 122º33' 12 CWHxm1 ar1140 Kanaka Creek 49º12' 122º33' 12 CWHxm1 ar1141 Kanaka Creek 49º12' 122º33' 12 CWHxm1 na1142 Kanaka Creek 49º12' 122º33' 12 CWHxm1 gr
Appendix 2a Continued
Registration Latitude Longitude Elevation No. Source (°n) (°w) (m) bgc unit Trials
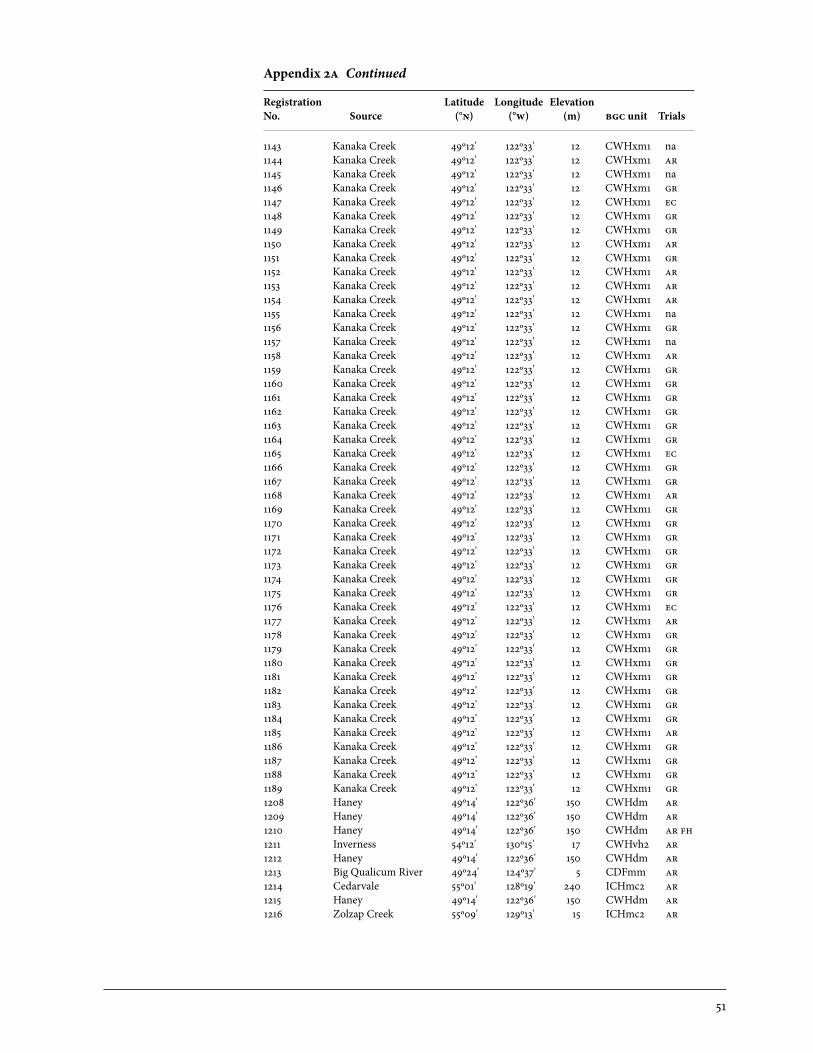
51
1143 Kanaka Creek 49º12' 122º33' 12 CWHxm1 na1144 Kanaka Creek 49º12' 122º33' 12 CWHxm1 ar1145 Kanaka Creek 49º12' 122º33' 12 CWHxm1 na1146 Kanaka Creek 49º12' 122º33' 12 CWHxm1 gr1147 Kanaka Creek 49º12' 122º33' 12 CWHxm1 ec1148 Kanaka Creek 49º12' 122º33' 12 CWHxm1 gr1149 Kanaka Creek 49º12' 122º33' 12 CWHxm1 gr1150 Kanaka Creek 49º12' 122º33' 12 CWHxm1 ar1151 Kanaka Creek 49º12' 122º33' 12 CWHxm1 gr1152 Kanaka Creek 49º12' 122º33' 12 CWHxm1 ar1153 Kanaka Creek 49º12' 122º33' 12 CWHxm1 ar1154 Kanaka Creek 49º12' 122º33' 12 CWHxm1 ar1155 Kanaka Creek 49º12' 122º33' 12 CWHxm1 na1156 Kanaka Creek 49º12' 122º33' 12 CWHxm1 gr1157 Kanaka Creek 49º12' 122º33' 12 CWHxm1 na1158 Kanaka Creek 49º12' 122º33' 12 CWHxm1 ar1159 Kanaka Creek 49º12' 122º33' 12 CWHxm1 gr1160 Kanaka Creek 49º12' 122º33' 12 CWHxm1 gr1161 Kanaka Creek 49º12' 122º33' 12 CWHxm1 gr1162 Kanaka Creek 49º12' 122º33' 12 CWHxm1 gr1163 Kanaka Creek 49º12' 122º33' 12 CWHxm1 gr1164 Kanaka Creek 49º12' 122º33' 12 CWHxm1 gr1165 Kanaka Creek 49º12' 122º33' 12 CWHxm1 ec1166 Kanaka Creek 49º12' 122º33' 12 CWHxm1 gr1167 Kanaka Creek 49º12' 122º33' 12 CWHxm1 gr1168 Kanaka Creek 49º12' 122º33' 12 CWHxm1 ar1169 Kanaka Creek 49º12' 122º33' 12 CWHxm1 gr1170 Kanaka Creek 49º12' 122º33' 12 CWHxm1 gr1171 Kanaka Creek 49º12' 122º33' 12 CWHxm1 gr1172 Kanaka Creek 49º12' 122º33' 12 CWHxm1 gr1173 Kanaka Creek 49º12' 122º33' 12 CWHxm1 gr1174 Kanaka Creek 49º12' 122º33' 12 CWHxm1 gr1175 Kanaka Creek 49º12' 122º33' 12 CWHxm1 gr1176 Kanaka Creek 49º12' 122º33' 12 CWHxm1 ec1177 Kanaka Creek 49º12' 122º33' 12 CWHxm1 ar1178 Kanaka Creek 49º12' 122º33' 12 CWHxm1 gr1179 Kanaka Creek 49º12' 122º33' 12 CWHxm1 gr1180 Kanaka Creek 49º12' 122º33' 12 CWHxm1 gr1181 Kanaka Creek 49º12' 122º33' 12 CWHxm1 gr1182 Kanaka Creek 49º12' 122º33' 12 CWHxm1 gr1183 Kanaka Creek 49º12' 122º33' 12 CWHxm1 gr1184 Kanaka Creek 49º12' 122º33' 12 CWHxm1 gr1185 Kanaka Creek 49º12' 122º33' 12 CWHxm1 ar1186 Kanaka Creek 49º12' 122º33' 12 CWHxm1 gr1187 Kanaka Creek 49º12' 122º33' 12 CWHxm1 gr1188 Kanaka Creek 49º12' 122º33' 12 CWHxm1 gr1189 Kanaka Creek 49º12' 122º33' 12 CWHxm1 gr1208 Haney 49º14' 122º36' 150 CWHdm ar1209 Haney 49º14' 122º36' 150 CWHdm ar1210 Haney 49º14' 122º36' 150 CWHdm ar fh1211 Inverness 54º12' 130º15' 17 CWHvh2 ar1212 Haney 49º14' 122º36' 150 CWHdm ar1213 Big Qualicum River 49º24' 124º37' 5 CDFmm ar1214 Cedarvale 55º01' 128º19' 240 ICHmc2 ar1215 Haney 49º14' 122º36' 150 CWHdm ar1216 Zolzap Creek 55º09' 129º13' 15 ICHmc2 ar
Appendix 2a Continued
Registration Latitude Longitude Elevation No. Source (°n) (°w) (m) bgc unit Trials
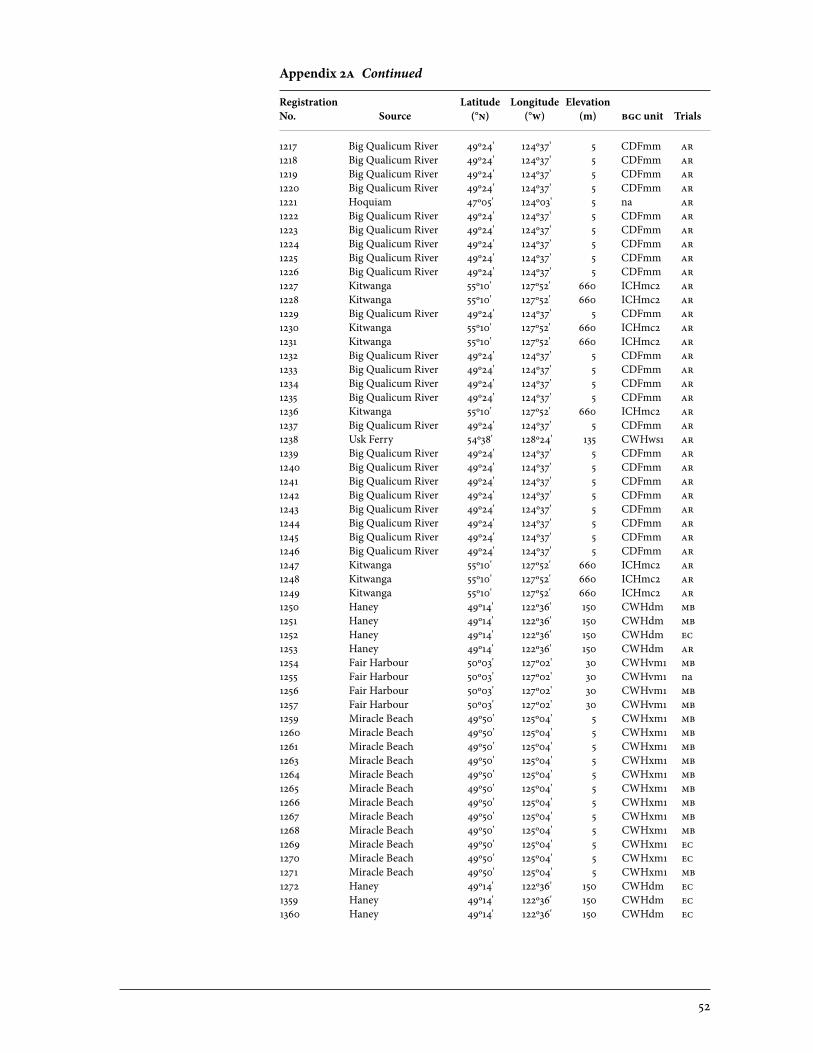
52
1217 Big Qualicum River 49º24' 124º37' 5 CDFmm ar1218 Big Qualicum River 49º24' 124º37' 5 CDFmm ar1219 Big Qualicum River 49º24' 124º37' 5 CDFmm ar1220 Big Qualicum River 49º24' 124º37' 5 CDFmm ar1221 Hoquiam 47º05' 124º03' 5 na ar1222 Big Qualicum River 49º24' 124º37' 5 CDFmm ar1223 Big Qualicum River 49º24' 124º37' 5 CDFmm ar1224 Big Qualicum River 49º24' 124º37' 5 CDFmm ar1225 Big Qualicum River 49º24' 124º37' 5 CDFmm ar1226 Big Qualicum River 49º24' 124º37' 5 CDFmm ar1227 Kitwanga 55º10' 127º52' 660 ICHmc2 ar1228 Kitwanga 55º10' 127º52' 660 ICHmc2 ar1229 Big Qualicum River 49º24' 124º37' 5 CDFmm ar1230 Kitwanga 55º10' 127º52' 660 ICHmc2 ar1231 Kitwanga 55º10' 127º52' 660 ICHmc2 ar1232 Big Qualicum River 49º24' 124º37' 5 CDFmm ar1233 Big Qualicum River 49º24' 124º37' 5 CDFmm ar1234 Big Qualicum River 49º24' 124º37' 5 CDFmm ar1235 Big Qualicum River 49º24' 124º37' 5 CDFmm ar1236 Kitwanga 55º10' 127º52' 660 ICHmc2 ar1237 Big Qualicum River 49º24' 124º37' 5 CDFmm ar1238 Usk Ferry 54º38' 128º24' 135 CWHws1 ar1239 Big Qualicum River 49º24' 124º37' 5 CDFmm ar1240 Big Qualicum River 49º24' 124º37' 5 CDFmm ar1241 Big Qualicum River 49º24' 124º37' 5 CDFmm ar1242 Big Qualicum River 49º24' 124º37' 5 CDFmm ar1243 Big Qualicum River 49º24' 124º37' 5 CDFmm ar1244 Big Qualicum River 49º24' 124º37' 5 CDFmm ar1245 Big Qualicum River 49º24' 124º37' 5 CDFmm ar1246 Big Qualicum River 49º24' 124º37' 5 CDFmm ar1247 Kitwanga 55º10' 127º52' 660 ICHmc2 ar1248 Kitwanga 55º10' 127º52' 660 ICHmc2 ar1249 Kitwanga 55º10' 127º52' 660 ICHmc2 ar1250 Haney 49º14' 122º36' 150 CWHdm mb1251 Haney 49º14' 122º36' 150 CWHdm mb1252 Haney 49º14' 122º36' 150 CWHdm ec1253 Haney 49º14' 122º36' 150 CWHdm ar1254 Fair Harbour 50º03' 127º02' 30 CWHvm1 mb1255 Fair Harbour 50º03' 127º02' 30 CWHvm1 na1256 Fair Harbour 50º03' 127º02' 30 CWHvm1 mb1257 Fair Harbour 50º03' 127º02' 30 CWHvm1 mb1259 Miracle Beach 49º50' 125º04' 5 CWHxm1 mb1260 Miracle Beach 49º50' 125º04' 5 CWHxm1 mb1261 Miracle Beach 49º50' 125º04' 5 CWHxm1 mb1263 Miracle Beach 49º50' 125º04' 5 CWHxm1 mb1264 Miracle Beach 49º50' 125º04' 5 CWHxm1 mb1265 Miracle Beach 49º50' 125º04' 5 CWHxm1 mb1266 Miracle Beach 49º50' 125º04' 5 CWHxm1 mb1267 Miracle Beach 49º50' 125º04' 5 CWHxm1 mb1268 Miracle Beach 49º50' 125º04' 5 CWHxm1 mb1269 Miracle Beach 49º50' 125º04' 5 CWHxm1 ec1270 Miracle Beach 49º50' 125º04' 5 CWHxm1 ec1271 Miracle Beach 49º50' 125º04' 5 CWHxm1 mb1272 Haney 49º14' 122º36' 150 CWHdm ec1359 Haney 49º14' 122º36' 150 CWHdm ec1360 Haney 49º14' 122º36' 150 CWHdm ec
Appendix 2a Continued
Registration Latitude Longitude Elevation No. Source (°n) (°w) (m) bgc unit Trials
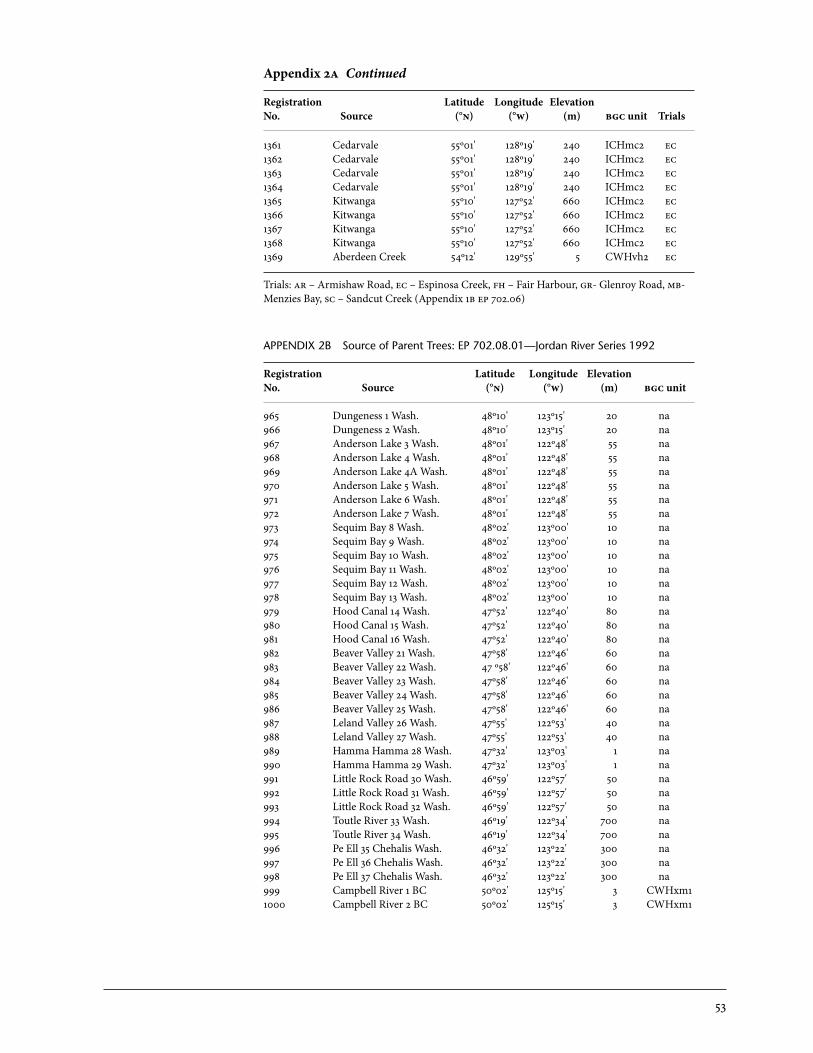
53
1361 Cedarvale 55º01' 128º19' 240 ICHmc2 ec1362 Cedarvale 55º01' 128º19' 240 ICHmc2 ec1363 Cedarvale 55º01' 128º19' 240 ICHmc2 ec1364 Cedarvale 55º01' 128º19' 240 ICHmc2 ec1365 Kitwanga 55º10' 127º52' 660 ICHmc2 ec1366 Kitwanga 55º10' 127º52' 660 ICHmc2 ec1367 Kitwanga 55º10' 127º52' 660 ICHmc2 ec1368 Kitwanga 55º10' 127º52' 660 ICHmc2 ec1369 Aberdeen Creek 54º12' 129º55' 5 CWHvh2 ec
Trials: ar – Armishaw Road, ec – Espinosa Creek, fh – Fair Harbour, gr- Glenroy Road, mb- Menzies Bay, sc – Sandcut Creek (Appendix 1b ep 702.06)
APPENDIX 2B Source of Parent Trees: EP 702.08.01—Jordan River Series 1992
Registration Latitude Longitude Elevation No. Source (°n) (°w) (m) bgc unit
965 Dungeness 1 Wash. 48º10' 123º15' 20 na966 Dungeness 2 Wash. 48º10' 123º15' 20 na967 Anderson Lake 3 Wash. 48º01' 122º48' 55 na968 Anderson Lake 4 Wash. 48º01' 122º48' 55 na969 Anderson Lake 4A Wash. 48º01' 122º48' 55 na970 Anderson Lake 5 Wash. 48º01' 122º48' 55 na971 Anderson Lake 6 Wash. 48º01' 122º48' 55 na972 Anderson Lake 7 Wash. 48º01' 122º48' 55 na973 Sequim Bay 8 Wash. 48º02' 123º00' 10 na974 Sequim Bay 9 Wash. 48º02' 123º00' 10 na975 Sequim Bay 10 Wash. 48º02' 123º00' 10 na976 Sequim Bay 11 Wash. 48º02' 123º00' 10 na977 Sequim Bay 12 Wash. 48º02' 123º00' 10 na978 Sequim Bay 13 Wash. 48º02' 123º00' 10 na979 Hood Canal 14 Wash. 47º52' 122º40' 80 na980 Hood Canal 15 Wash. 47º52' 122º40' 80 na981 Hood Canal 16 Wash. 47º52' 122º40' 80 na982 Beaver Valley 21 Wash. 47º58' 122º46' 60 na983 Beaver Valley 22 Wash. 47 º58' 122º46' 60 na984 Beaver Valley 23 Wash. 47º58' 122º46' 60 na985 Beaver Valley 24 Wash. 47º58' 122º46' 60 na986 Beaver Valley 25 Wash. 47º58' 122º46' 60 na987 Leland Valley 26 Wash. 47º55' 122º53' 40 na988 Leland Valley 27 Wash. 47º55' 122º53' 40 na989 Hamma Hamma 28 Wash. 47º32' 123º03' 1 na990 Hamma Hamma 29 Wash. 47º32' 123º03' 1 na991 Little Rock Road 30 Wash. 46º59' 122º57' 50 na992 Little Rock Road 31 Wash. 46º59' 122º57' 50 na993 Little Rock Road 32 Wash. 46º59' 122º57' 50 na994 Toutle River 33 Wash. 46º19' 122º34' 700 na995 Toutle River 34 Wash. 46º19' 122º34' 700 na996 Pe Ell 35 Chehalis Wash. 46º32' 123º22' 300 na997 Pe Ell 36 Chehalis Wash. 46º32' 123º22' 300 na998 Pe Ell 37 Chehalis Wash. 46º32' 123º22' 300 na999 Campbell River 1 BC 50º02' 125º15' 3 CWHxm11000 Campbell River 2 BC 50º02' 125º15' 3 CWHxm1
Appendix 2a Continued
Registration Latitude Longitude Elevation No. Source (°n) (°w) (m) bgc unit Trials
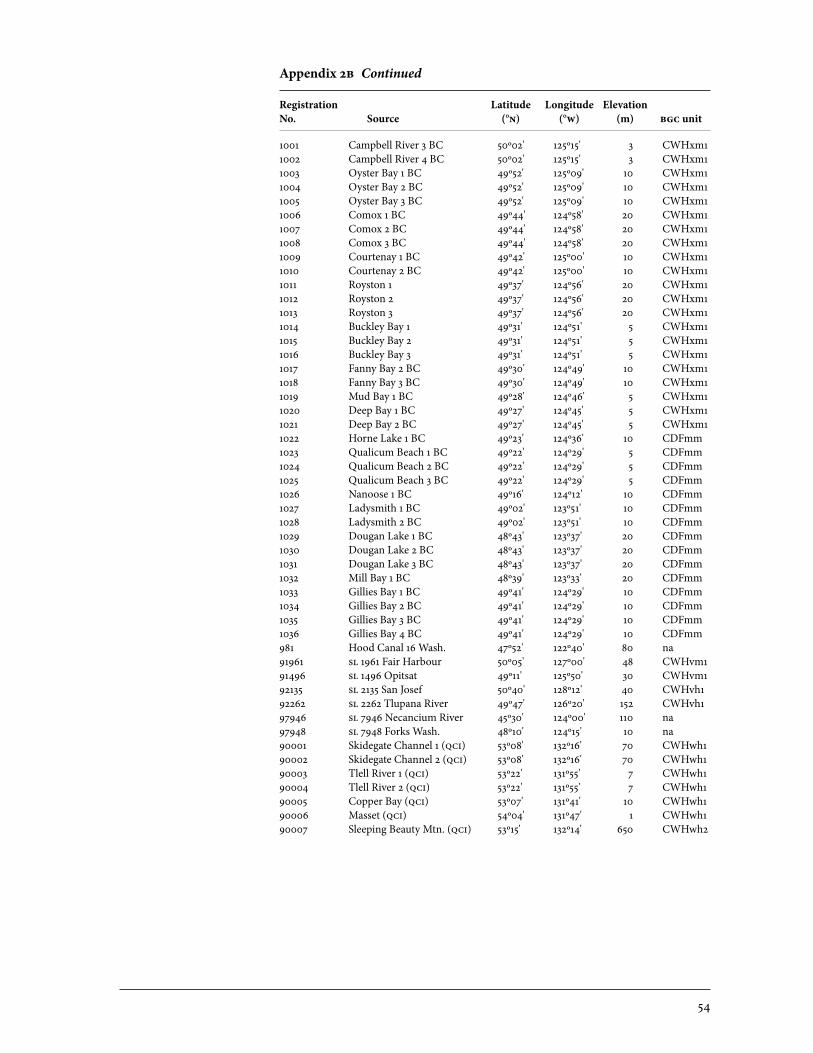
54
1001 Campbell River 3 BC 50º02' 125º15' 3 CWHxm11002 Campbell River 4 BC 50º02' 125º15' 3 CWHxm11003 oyster Bay 1 BC 49º52' 125º09' 10 CWHxm11004 oyster Bay 2 BC 49º52' 125º09' 10 CWHxm11005 oyster Bay 3 BC 49º52' 125º09' 10 CWHxm11006 Comox 1 BC 49º44' 124º58' 20 CWHxm11007 Comox 2 BC 49º44' 124º58' 20 CWHxm11008 Comox 3 BC 49º44' 124º58' 20 CWHxm11009 Courtenay 1 BC 49º42' 125º00' 10 CWHxm11010 Courtenay 2 BC 49º42' 125º00' 10 CWHxm11011 Royston 1 49º37' 124º56' 20 CWHxm11012 Royston 2 49º37' 124º56' 20 CWHxm11013 Royston 3 49º37' 124º56' 20 CWHxm11014 Buckley Bay 1 49º31' 124º51' 5 CWHxm11015 Buckley Bay 2 49º31' 124º51' 5 CWHxm11016 Buckley Bay 3 49º31' 124º51' 5 CWHxm11017 Fanny Bay 2 BC 49º30' 124º49' 10 CWHxm11018 Fanny Bay 3 BC 49º30' 124º49' 10 CWHxm11019 Mud Bay 1 BC 49º28' 124º46' 5 CWHxm11020 Deep Bay 1 BC 49º27' 124º45' 5 CWHxm11021 Deep Bay 2 BC 49º27' 124º45' 5 CWHxm11022 Horne Lake 1 BC 49º23' 124º36' 10 CDFmm1023 Qualicum Beach 1 BC 49º22' 124º29' 5 CDFmm1024 Qualicum Beach 2 BC 49º22' 124º29' 5 CDFmm1025 Qualicum Beach 3 BC 49º22' 124º29' 5 CDFmm1026 Nanoose 1 BC 49º16' 124º12' 10 CDFmm1027 Ladysmith 1 BC 49º02' 123º51' 10 CDFmm1028 Ladysmith 2 BC 49º02' 123º51' 10 CDFmm1029 Dougan Lake 1 BC 48º43' 123º37' 20 CDFmm1030 Dougan Lake 2 BC 48º43' 123º37' 20 CDFmm1031 Dougan Lake 3 BC 48º43' 123º37' 20 CDFmm1032 Mill Bay 1 BC 48º39' 123º33' 20 CDFmm1033 Gillies Bay 1 BC 49º41' 124º29' 10 CDFmm1034 Gillies Bay 2 BC 49º41' 124º29' 10 CDFmm1035 Gillies Bay 3 BC 49º41' 124º29' 10 CDFmm1036 Gillies Bay 4 BC 49º41' 124º29' 10 CDFmm981 Hood Canal 16 Wash. 47º52' 122º40' 80 na91961 sl 1961 Fair Harbour 50º05' 127º00' 48 CWHvm191496 sl 1496 opitsat 49º11' 125º50' 30 CWHvm192135 sl 2135 San Josef 50º40' 128º12' 40 CWHvh192262 sl 2262 Tlupana River 49º47' 126º20' 152 CWHvh197946 sl 7946 Necancium River 45º30' 124º00' 110 na97948 sl 7948 Forks Wash. 48º10' 124º15' 10 na90001 Skidegate Channel 1 (qci) 53º08' 132º16' 70 CWHwh190002 Skidegate Channel 2 (qci) 53º08' 132º16' 70 CWHwh190003 Tlell River 1 (qci) 53º22' 131º55' 7 CWHwh190004 Tlell River 2 (qci) 53º22' 131º55' 7 CWHwh190005 Copper Bay (qci) 53º07' 131º41' 10 CWHwh190006 Masset (qci) 54º04' 131º47' 1 CWHwh190007 Sleeping Beauty Mtn. (qci) 53º15' 132º14' 650 CWHwh2
Appendix 2b Continued
Registration Latitude Longitude Elevation No. Source (°n) (°w) (m) bgc unit
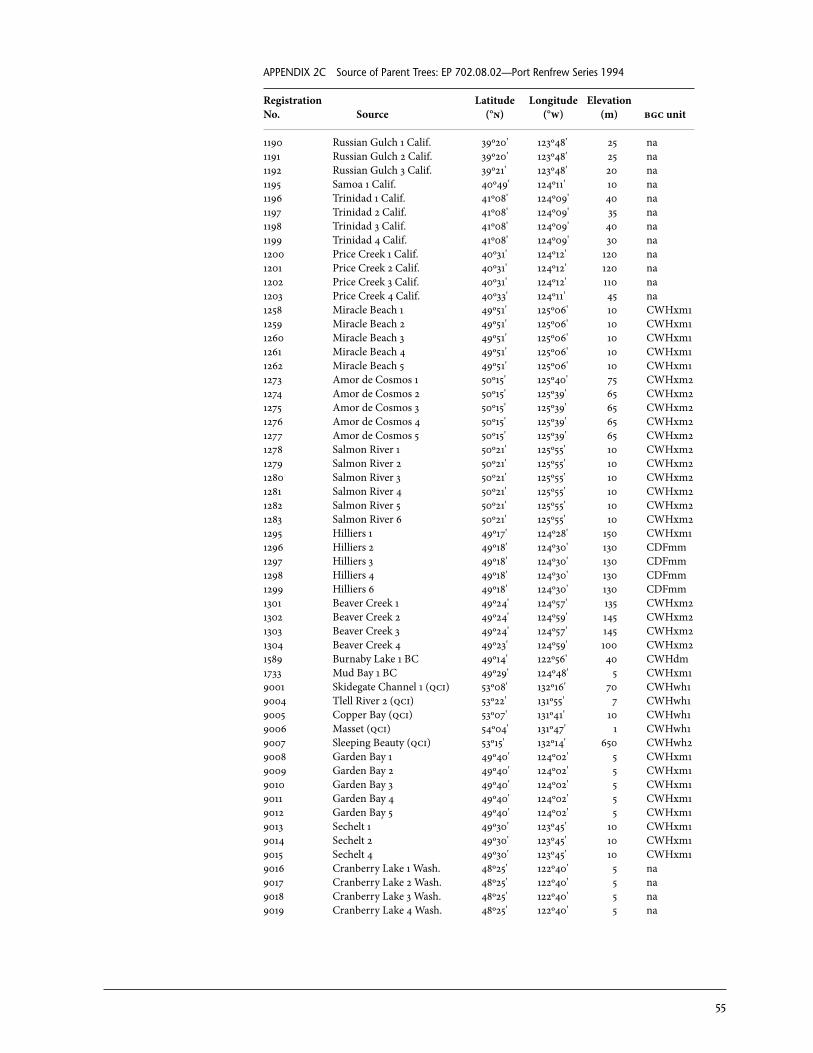
55
APPENDIX 2C Source of Parent Trees: EP 702.08.02—Port Renfrew Series 1994
Registration Latitude Longitude Elevation No. Source (°n) (°w) (m) bgc unit
1190 Russian Gulch 1 Calif. 39º20' 123º48' 25 na1191 Russian Gulch 2 Calif. 39º20' 123º48' 25 na1192 Russian Gulch 3 Calif. 39º21' 123º48' 20 na1195 Samoa 1 Calif. 40º49' 124º11' 10 na1196 Trinidad 1 Calif. 41º08' 124º09' 40 na1197 Trinidad 2 Calif. 41º08' 124º09' 35 na1198 Trinidad 3 Calif. 41º08' 124º09' 40 na1199 Trinidad 4 Calif. 41º08' 124º09' 30 na1200 Price Creek 1 Calif. 40º31' 124º12' 120 na1201 Price Creek 2 Calif. 40º31' 124º12' 120 na1202 Price Creek 3 Calif. 40º31' 124º12' 110 na1203 Price Creek 4 Calif. 40º33' 124º11' 45 na1258 Miracle Beach 1 49º51' 125º06' 10 CWHxm11259 Miracle Beach 2 49º51' 125º06' 10 CWHxm11260 Miracle Beach 3 49º51' 125º06' 10 CWHxm11261 Miracle Beach 4 49º51' 125º06' 10 CWHxm11262 Miracle Beach 5 49º51' 125º06' 10 CWHxm11273 Amor de Cosmos 1 50º15' 125º40' 75 CWHxm21274 Amor de Cosmos 2 50º15' 125º39' 65 CWHxm21275 Amor de Cosmos 3 50º15' 125º39' 65 CWHxm21276 Amor de Cosmos 4 50º15' 125º39' 65 CWHxm21277 Amor de Cosmos 5 50º15' 125º39' 65 CWHxm21278 Salmon River 1 50º21' 125º55' 10 CWHxm21279 Salmon River 2 50º21' 125º55' 10 CWHxm21280 Salmon River 3 50º21' 125º55' 10 CWHxm21281 Salmon River 4 50º21' 125º55' 10 CWHxm21282 Salmon River 5 50º21' 125º55' 10 CWHxm21283 Salmon River 6 50º21' 125º55' 10 CWHxm21295 Hilliers 1 49º17' 124º28' 150 CWHxm11296 Hilliers 2 49º18' 124º30' 130 CDFmm1297 Hilliers 3 49º18' 124º30' 130 CDFmm1298 Hilliers 4 49º18' 124º30' 130 CDFmm1299 Hilliers 6 49º18' 124º30' 130 CDFmm1301 Beaver Creek 1 49º24' 124º57' 135 CWHxm21302 Beaver Creek 2 49º24' 124º59' 145 CWHxm21303 Beaver Creek 3 49º24' 124º57' 145 CWHxm21304 Beaver Creek 4 49º23' 124º59' 100 CWHxm21589 Burnaby Lake 1 BC 49º14' 122º56' 40 CWHdm1733 Mud Bay 1 BC 49º29' 124º48' 5 CWHxm19001 Skidegate Channel 1 (qci) 53º08' 132º16' 70 CWHwh19004 Tlell River 2 (qci) 53º22' 131º55' 7 CWHwh19005 Copper Bay (qci) 53º07' 131º41' 10 CWHwh19006 Masset (qci) 54º04' 131º47' 1 CWHwh19007 Sleeping Beauty (qci) 53º15' 132º14' 650 CWHwh29008 Garden Bay 1 49º40' 124º02' 5 CWHxm19009 Garden Bay 2 49º40' 124º02' 5 CWHxm19010 Garden Bay 3 49º40' 124º02' 5 CWHxm19011 Garden Bay 4 49º40' 124º02' 5 CWHxm19012 Garden Bay 5 49º40' 124º02' 5 CWHxm19013 Sechelt 1 49º30' 123º45' 10 CWHxm19014 Sechelt 2 49º30' 123º45' 10 CWHxm19015 Sechelt 4 49º30' 123º45' 10 CWHxm19016 Cranberry Lake 1 Wash. 48º25' 122º40' 5 na9017 Cranberry Lake 2 Wash. 48º25' 122º40' 5 na9018 Cranberry Lake 3 Wash. 48º25' 122º40' 5 na9019 Cranberry Lake 4 Wash. 48º25' 122º40' 5 na
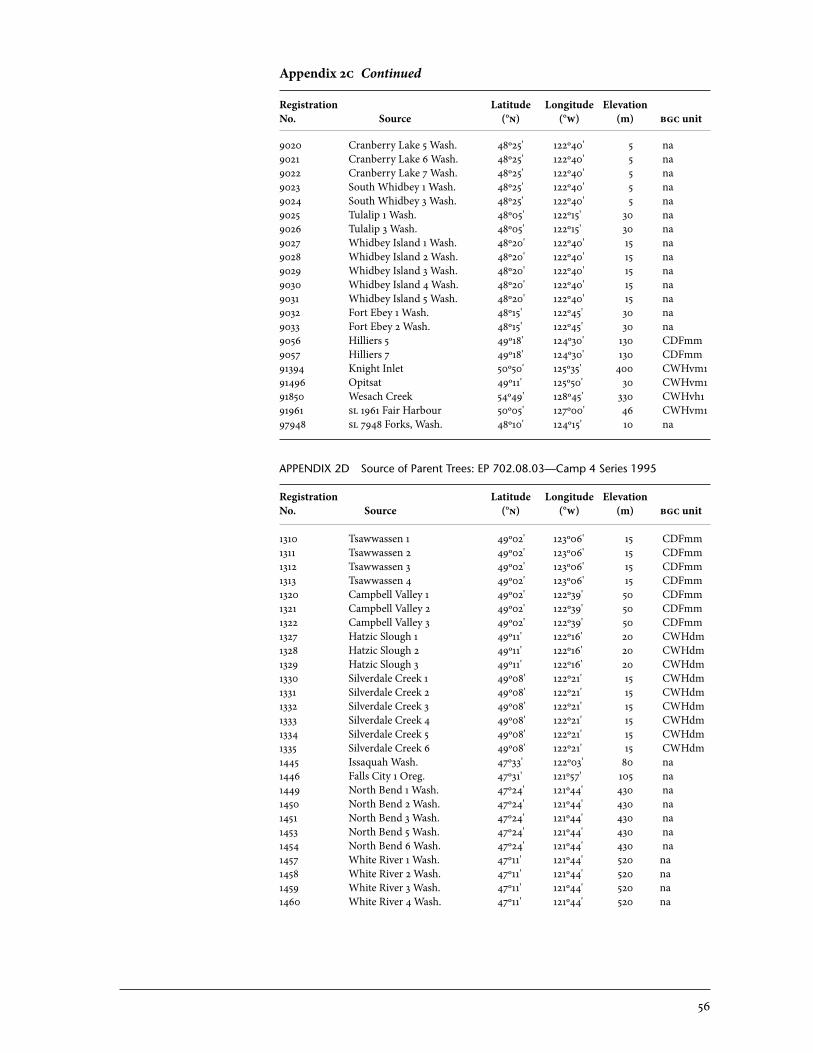
56
9020 Cranberry Lake 5 Wash. 48º25' 122º40' 5 na9021 Cranberry Lake 6 Wash. 48º25' 122º40' 5 na9022 Cranberry Lake 7 Wash. 48º25' 122º40' 5 na9023 South Whidbey 1 Wash. 48º25' 122º40' 5 na9024 South Whidbey 3 Wash. 48º25' 122º40' 5 na9025 Tulalip 1 Wash. 48º05' 122º15' 30 na9026 Tulalip 3 Wash. 48º05' 122º15' 30 na9027 Whidbey Island 1 Wash. 48º20' 122º40' 15 na9028 Whidbey Island 2 Wash. 48º20' 122º40' 15 na9029 Whidbey Island 3 Wash. 48º20' 122º40' 15 na9030 Whidbey Island 4 Wash. 48º20' 122º40' 15 na9031 Whidbey Island 5 Wash. 48º20' 122º40' 15 na9032 Fort Ebey 1 Wash. 48º15' 122º45' 30 na9033 Fort Ebey 2 Wash. 48º15' 122º45' 30 na9056 Hilliers 5 49º18' 124º30' 130 CDFmm9057 Hilliers 7 49º18' 124º30' 130 CDFmm91394 Knight Inlet 50º50' 125º35' 400 CWHvm191496 opitsat 49º11' 125º50' 30 CWHvm191850 Wesach Creek 54º49' 128º45' 330 CWHvh191961 sl 1961 Fair Harbour 50º05' 127º00' 46 CWHvm197948 sl 7948 Forks, Wash. 48º10' 124º15' 10 na
APPENDIX 2D Source of Parent Trees: EP 702.08.03—Camp 4 Series 1995
Registration Latitude Longitude Elevation No. Source (°n) (°w) (m) bgc unit
1310 Tsawwassen 1 49º02' 123º06' 15 CDFmm1311 Tsawwassen 2 49º02' 123º06' 15 CDFmm1312 Tsawwassen 3 49º02' 123º06' 15 CDFmm1313 Tsawwassen 4 49º02' 123º06' 15 CDFmm1320 Campbell Valley 1 49º02' 122º39' 50 CDFmm1321 Campbell Valley 2 49º02' 122º39' 50 CDFmm1322 Campbell Valley 3 49º02' 122º39' 50 CDFmm1327 Hatzic Slough 1 49º11' 122º16' 20 CWHdm1328 Hatzic Slough 2 49º11' 122º16' 20 CWHdm1329 Hatzic Slough 3 49º11' 122º16' 20 CWHdm1330 Silverdale Creek 1 49º08' 122º21' 15 CWHdm1331 Silverdale Creek 2 49º08' 122º21' 15 CWHdm1332 Silverdale Creek 3 49º08' 122º21' 15 CWHdm1333 Silverdale Creek 4 49º08' 122º21' 15 CWHdm1334 Silverdale Creek 5 49º08' 122º21' 15 CWHdm1335 Silverdale Creek 6 49º08' 122º21' 15 CWHdm1445 Issaquah Wash. 47º33' 122º03' 80 na1446 Falls City 1 oreg. 47º31' 121º57' 105 na1449 North Bend 1 Wash. 47º24' 121º44' 430 na1450 North Bend 2 Wash. 47º24' 121º44' 430 na1451 North Bend 3 Wash. 47º24' 121º44' 430 na1453 North Bend 5 Wash. 47º24' 121º44' 430 na1454 North Bend 6 Wash. 47º24' 121º44' 430 na1457 White River 1 Wash. 47º11' 121º44' 520 na1458 White River 2 Wash. 47º11' 121º44' 520 na1459 White River 3 Wash. 47º11' 121º44' 520 na1460 White River 4 Wash. 47º11' 121º44' 520 na
Appendix 2c Continued
Registration Latitude Longitude Elevation No. Source (°n) (°w) (m) bgc unit
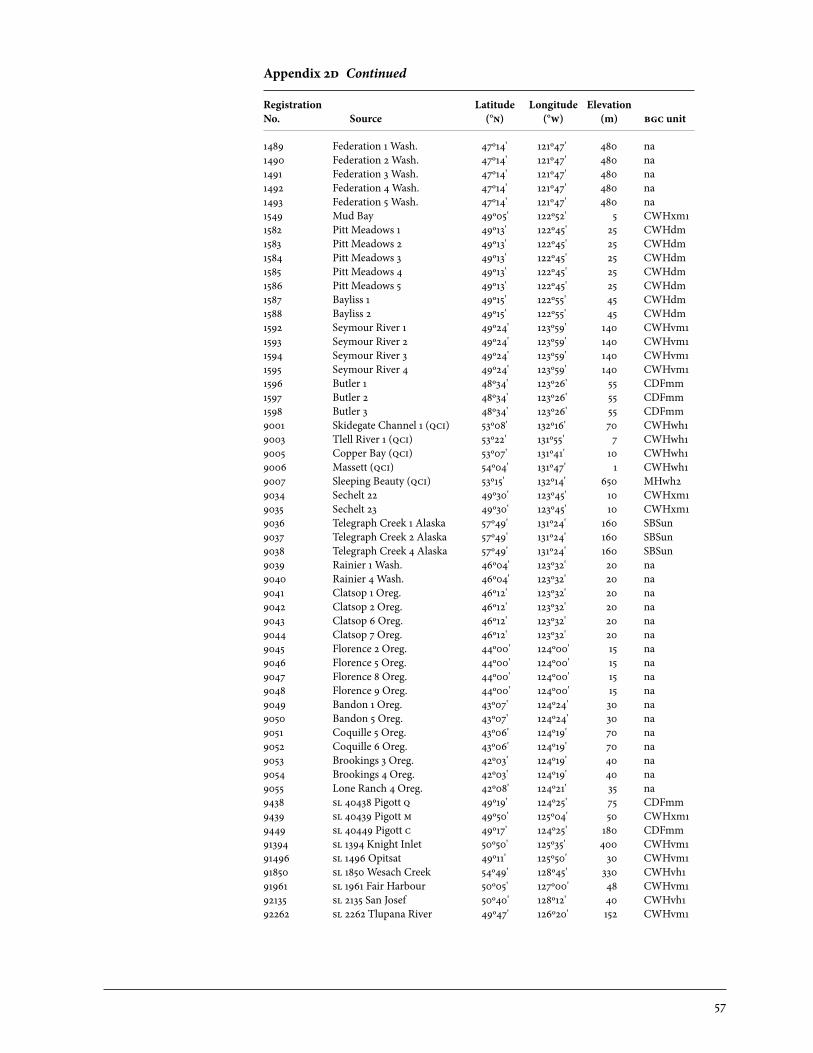
57
1489 Federation 1 Wash. 47º14' 121º47' 480 na1490 Federation 2 Wash. 47º14' 121º47' 480 na1491 Federation 3 Wash. 47º14' 121º47' 480 na1492 Federation 4 Wash. 47º14' 121º47' 480 na1493 Federation 5 Wash. 47º14' 121º47' 480 na1549 Mud Bay 49º05' 122º52' 5 CWHxm11582 Pitt Meadows 1 49º13' 122º45' 25 CWHdm1583 Pitt Meadows 2 49º13' 122º45' 25 CWHdm1584 Pitt Meadows 3 49º13' 122º45' 25 CWHdm1585 Pitt Meadows 4 49º13' 122º45' 25 CWHdm1586 Pitt Meadows 5 49º13' 122º45' 25 CWHdm1587 Bayliss 1 49º15' 122º55' 45 CWHdm1588 Bayliss 2 49º15' 122º55' 45 CWHdm1592 Seymour River 1 49º24' 123º59' 140 CWHvm11593 Seymour River 2 49º24' 123º59' 140 CWHvm11594 Seymour River 3 49º24' 123º59' 140 CWHvm11595 Seymour River 4 49º24' 123º59' 140 CWHvm11596 Butler 1 48º34' 123º26' 55 CDFmm1597 Butler 2 48º34' 123º26' 55 CDFmm1598 Butler 3 48º34' 123º26' 55 CDFmm9001 Skidegate Channel 1 (qci) 53º08' 132º16' 70 CWHwh19003 Tlell River 1 (qci) 53º22' 131º55' 7 CWHwh19005 Copper Bay (qci) 53º07' 131º41' 10 CWHwh19006 Massett (qci) 54º04' 131º47' 1 CWHwh19007 Sleeping Beauty (qci) 53º15' 132º14' 650 MHwh29034 Sechelt 22 49º30' 123º45' 10 CWHxm19035 Sechelt 23 49º30' 123º45' 10 CWHxm19036 Telegraph Creek 1 Alaska 57º49' 131º24' 160 SBSun9037 Telegraph Creek 2 Alaska 57º49' 131º24' 160 SBSun9038 Telegraph Creek 4 Alaska 57º49' 131º24' 160 SBSun9039 Rainier 1 Wash. 46º04' 123º32' 20 na9040 Rainier 4 Wash. 46º04' 123º32' 20 na9041 Clatsop 1 oreg. 46º12' 123º32' 20 na9042 Clatsop 2 oreg. 46º12' 123º32' 20 na9043 Clatsop 6 oreg. 46º12' 123º32' 20 na9044 Clatsop 7 oreg. 46º12' 123º32' 20 na9045 Florence 2 oreg. 44º00' 124º00' 15 na9046 Florence 5 oreg. 44º00' 124º00' 15 na9047 Florence 8 oreg. 44º00' 124º00' 15 na9048 Florence 9 oreg. 44º00' 124º00' 15 na9049 Bandon 1 oreg. 43º07' 124º24' 30 na9050 Bandon 5 oreg. 43º07' 124º24' 30 na9051 Coquille 5 oreg. 43º06' 124º19' 70 na9052 Coquille 6 oreg. 43º06' 124º19' 70 na9053 Brookings 3 oreg. 42º03' 124º19' 40 na9054 Brookings 4 oreg. 42º03' 124º19' 40 na9055 Lone Ranch 4 oreg. 42º08' 124º21' 35 na9438 sl 40438 Pigott q 49º19' 124º25' 75 CDFmm9439 sl 40439 Pigott m 49º50' 125º04' 50 CWHxm19449 sl 40449 Pigott c 49º17' 124º25' 180 CDFmm91394 sl 1394 Knight Inlet 50º50' 125º35' 400 CWHvm191496 sl 1496 opitsat 49º11' 125º50' 30 CWHvm191850 sl 1850 Wesach Creek 54º49' 128º45' 330 CWHvh191961 sl 1961 Fair Harbour 50º05' 127º00' 48 CWHvm192135 sl 2135 San Josef 50º40' 128º12' 40 CWHvh192262 sl 2262 Tlupana River 49º47' 126º20' 152 CWHvm1
Appendix 2d Continued
Registration Latitude Longitude Elevation No. Source (°n) (°w) (m) bgc unit
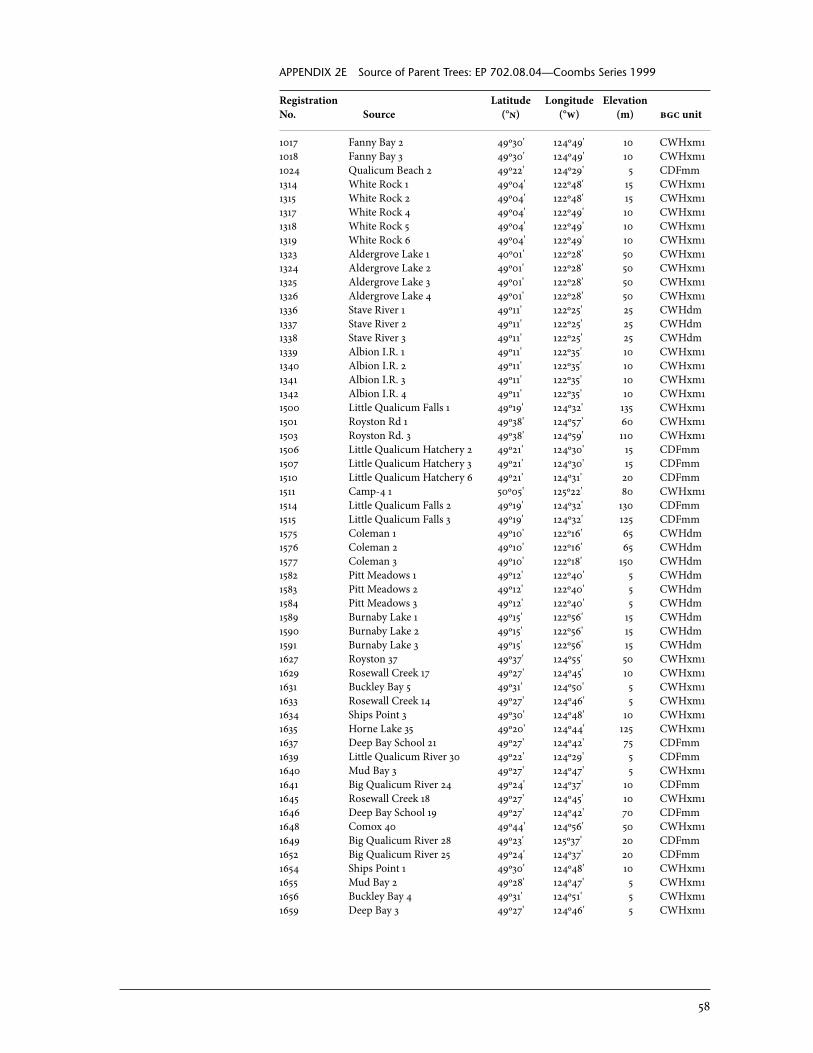
58
APPENDIX 2E Source of Parent Trees: EP 702.08.04—Coombs Series 1999
Registration Latitude Longitude Elevation No. Source (°n) (°w) (m) bgc unit
1017 Fanny Bay 2 49º30' 124º49' 10 CWHxm11018 Fanny Bay 3 49º30' 124º49' 10 CWHxm11024 Qualicum Beach 2 49º22' 124º29' 5 CDFmm1314 White Rock 1 49º04' 122º48' 15 CWHxm11315 White Rock 2 49º04' 122º48' 15 CWHxm11317 White Rock 4 49º04' 122º49' 10 CWHxm11318 White Rock 5 49º04' 122º49' 10 CWHxm11319 White Rock 6 49º04' 122º49' 10 CWHxm11323 Aldergrove Lake 1 40º01' 122º28' 50 CWHxm11324 Aldergrove Lake 2 49º01' 122º28' 50 CWHxm11325 Aldergrove Lake 3 49º01' 122º28' 50 CWHxm11326 Aldergrove Lake 4 49º01' 122º28' 50 CWHxm11336 Stave River 1 49º11' 122º25' 25 CWHdm1337 Stave River 2 49º11' 122º25' 25 CWHdm1338 Stave River 3 49º11' 122º25' 25 CWHdm1339 Albion I.R. 1 49º11' 122º35' 10 CWHxm11340 Albion I.R. 2 49º11' 122º35' 10 CWHxm11341 Albion I.R. 3 49º11' 122º35' 10 CWHxm11342 Albion I.R. 4 49º11' 122º35' 10 CWHxm11500 Little Qualicum Falls 1 49º19' 124º32' 135 CWHxm11501 Royston Rd 1 49º38' 124º57' 60 CWHxm11503 Royston Rd. 3 49º38' 124º59' 110 CWHxm11506 Little Qualicum Hatchery 2 49º21' 124º30' 15 CDFmm1507 Little Qualicum Hatchery 3 49º21' 124º30' 15 CDFmm1510 Little Qualicum Hatchery 6 49º21' 124º31' 20 CDFmm1511 Camp-4 1 50º05' 125º22' 80 CWHxm11514 Little Qualicum Falls 2 49º19' 124º32' 130 CDFmm1515 Little Qualicum Falls 3 49º19' 124º32' 125 CDFmm1575 Coleman 1 49º10' 122º16' 65 CWHdm1576 Coleman 2 49º10' 122º16' 65 CWHdm1577 Coleman 3 49º10' 122º18' 150 CWHdm1582 Pitt Meadows 1 49º12' 122º40' 5 CWHdm1583 Pitt Meadows 2 49º12' 122º40' 5 CWHdm1584 Pitt Meadows 3 49º12' 122º40' 5 CWHdm1589 Burnaby Lake 1 49º15' 122º56' 15 CWHdm1590 Burnaby Lake 2 49º15' 122º56' 15 CWHdm1591 Burnaby Lake 3 49º15' 122º56' 15 CWHdm1627 Royston 37 49º37' 124º55' 50 CWHxm11629 Rosewall Creek 17 49º27' 124º45' 10 CWHxm11631 Buckley Bay 5 49º31' 124º50' 5 CWHxm11633 Rosewall Creek 14 49º27' 124º46' 5 CWHxm11634 Ships Point 3 49º30' 124º48' 10 CWHxm11635 Horne Lake 35 49º20' 124º44' 125 CWHxm11637 Deep Bay School 21 49º27' 124º42' 75 CDFmm1639 Little Qualicum River 30 49º22' 124º29' 5 CDFmm1640 Mud Bay 3 49º27' 124º47' 5 CWHxm11641 Big Qualicum River 24 49º24' 124º37' 10 CDFmm1645 Rosewall Creek 18 49º27' 124º45' 10 CWHxm11646 Deep Bay School 19 49º27' 124º42' 70 CDFmm1648 Comox 40 49º44' 124º56' 50 CWHxm11649 Big Qualicum River 28 49º23' 125º37' 20 CDFmm1652 Big Qualicum River 25 49º24' 124º37' 20 CDFmm1654 Ships Point 1 49º30' 124º48' 10 CWHxm11655 Mud Bay 2 49º28' 124º47' 5 CWHxm11656 Buckley Bay 4 49º31' 124º51' 5 CWHxm11659 Deep Bay 3 49º27' 124º46' 5 CWHxm1
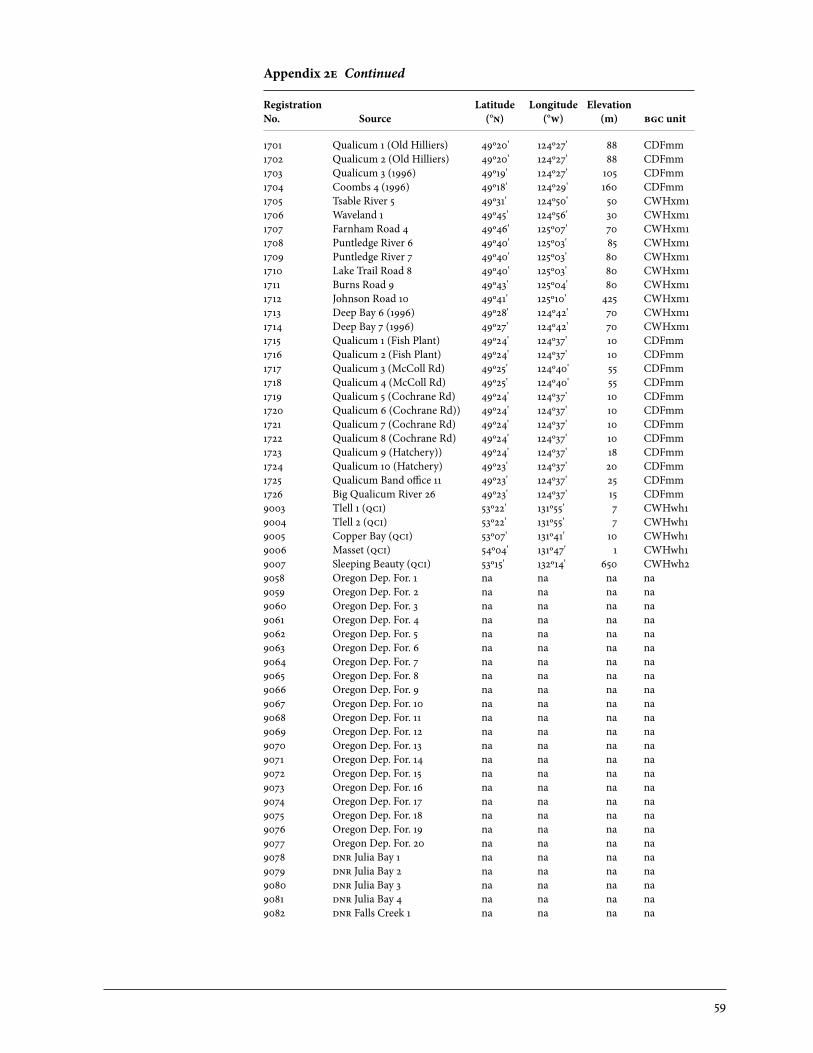
59
1701 Qualicum 1 (Old Hilliers) 49º20' 124º27' 88 CDFmm1702 Qualicum 2 (Old Hilliers) 49º20' 124º27' 88 CDFmm1703 Qualicum 3 (1996) 49º19' 124º27' 105 CDFmm1704 Coombs 4 (1996) 49º18' 124º29' 160 CDFmm1705 Tsable River 5 49º31' 124º50' 50 CWHxm11706 Waveland 1 49º45' 124º56' 30 CWHxm11707 Farnham Road 4 49º46' 125º07' 70 CWHxm11708 Puntledge River 6 49º40' 125º03' 85 CWHxm11709 Puntledge River 7 49º40' 125º03' 80 CWHxm11710 Lake Trail Road 8 49º40' 125º03' 80 CWHxm11711 Burns Road 9 49º43' 125º04' 80 CWHxm11712 Johnson Road 10 49º41' 125º10' 425 CWHxm11713 Deep Bay 6 (1996) 49º28' 124º42' 70 CWHxm11714 Deep Bay 7 (1996) 49º27' 124º42' 70 CWHxm11715 Qualicum 1 (Fish Plant) 49º24' 124º37' 10 CDFmm1716 Qualicum 2 (Fish Plant) 49º24' 124º37' 10 CDFmm1717 Qualicum 3 (McColl Rd) 49º25' 124º40' 55 CDFmm1718 Qualicum 4 (McColl Rd) 49º25' 124º40' 55 CDFmm1719 Qualicum 5 (Cochrane Rd) 49º24' 124º37' 10 CDFmm1720 Qualicum 6 (Cochrane Rd)) 49º24' 124º37' 10 CDFmm1721 Qualicum 7 (Cochrane Rd) 49º24' 124º37' 10 CDFmm1722 Qualicum 8 (Cochrane Rd) 49º24' 124º37' 10 CDFmm1723 Qualicum 9 (Hatchery)) 49º24' 124º37' 18 CDFmm1724 Qualicum 10 (Hatchery) 49º23' 124º37' 20 CDFmm1725 Qualicum Band office 11 49º23' 124º37' 25 CDFmm1726 Big Qualicum River 26 49º23' 124º37' 15 CDFmm9003 Tlell 1 (qci) 53º22' 131º55' 7 CWHwh19004 Tlell 2 (qci) 53º22' 131º55' 7 CWHwh19005 Copper Bay (qci) 53º07' 131º41' 10 CWHwh19006 Masset (qci) 54º04' 131º47' 1 CWHwh19007 Sleeping Beauty (qci) 53º15' 132º14' 650 CWHwh29058 Oregon Dep. For. 1 na na na na9059 Oregon Dep. For. 2 na na na na9060 Oregon Dep. For. 3 na na na na9061 Oregon Dep. For. 4 na na na na9062 Oregon Dep. For. 5 na na na na9063 Oregon Dep. For. 6 na na na na9064 Oregon Dep. For. 7 na na na na9065 Oregon Dep. For. 8 na na na na9066 Oregon Dep. For. 9 na na na na9067 Oregon Dep. For. 10 na na na na9068 Oregon Dep. For. 11 na na na na9069 Oregon Dep. For. 12 na na na na9070 Oregon Dep. For. 13 na na na na9071 Oregon Dep. For. 14 na na na na9072 Oregon Dep. For. 15 na na na na9073 Oregon Dep. For. 16 na na na na9074 Oregon Dep. For. 17 na na na na9075 Oregon Dep. For. 18 na na na na9076 Oregon Dep. For. 19 na na na na9077 Oregon Dep. For. 20 na na na na9078 dnr Julia Bay 1 na na na na9079 dnr Julia Bay 2 na na na na9080 dnr Julia Bay 3 na na na na9081 dnr Julia Bay 4 na na na na9082 dnr Falls Creek 1 na na na na
Appendix 2e Continued
Registration Latitude Longitude Elevation No. Source (°n) (°w) (m) bgc unit
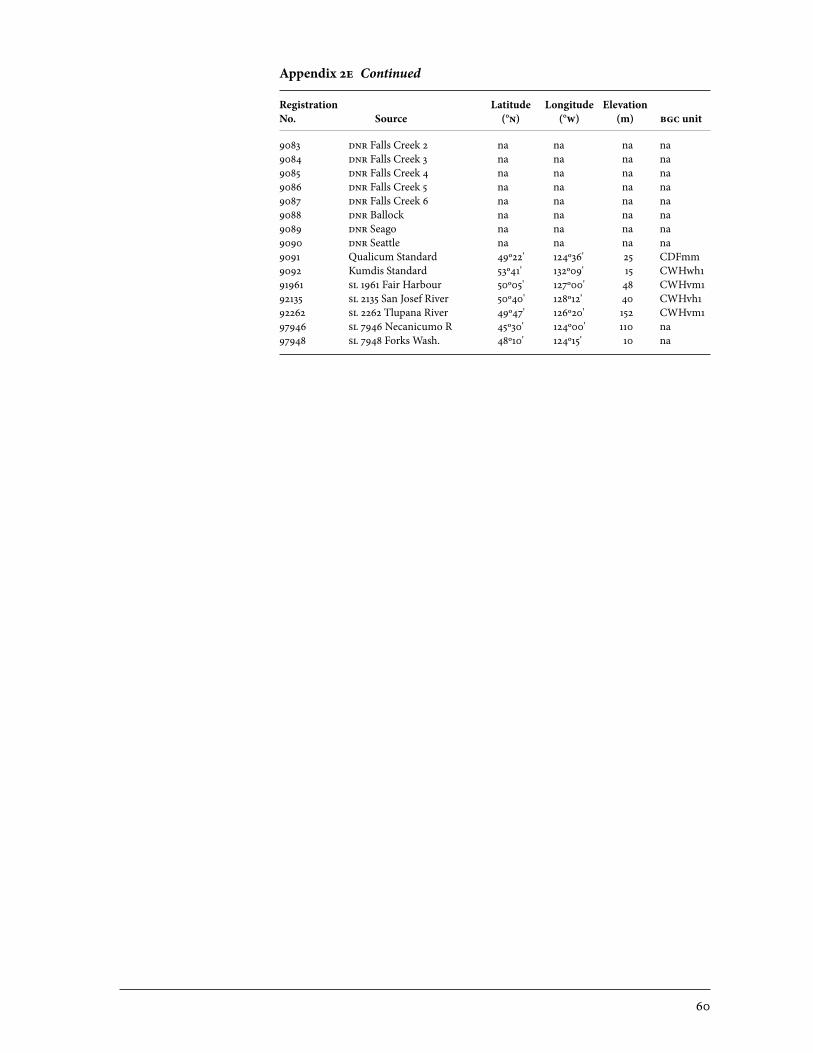
60
9083 dnr Falls Creek 2 na na na na9084 dnr Falls Creek 3 na na na na9085 dnr Falls Creek 4 na na na na9086 dnr Falls Creek 5 na na na na9087 dnr Falls Creek 6 na na na na9088 dnr Ballock na na na na9089 dnr Seago na na na na9090 dnr Seattle na na na na9091 Qualicum Standard 49º22' 124º36' 25 CDFmm9092 Kumdis Standard 53º41' 132º09' 15 CWHwh191961 sl 1961 Fair Harbour 50º05' 127º00' 48 CWHvm192135 sl 2135 San Josef River 50º40' 128º12' 40 CWHvh192262 sl 2262 Tlupana River 49º47' 126º20' 152 CWHvm197946 sl 7946 Necanicumo R 45º30' 124º00' 110 na97948 sl 7948 Forks Wash. 48º10' 124º15' 10 na
Appendix 2e Continued
Registration Latitude Longitude Elevation No. Source (°n) (°w) (m) bgc unit
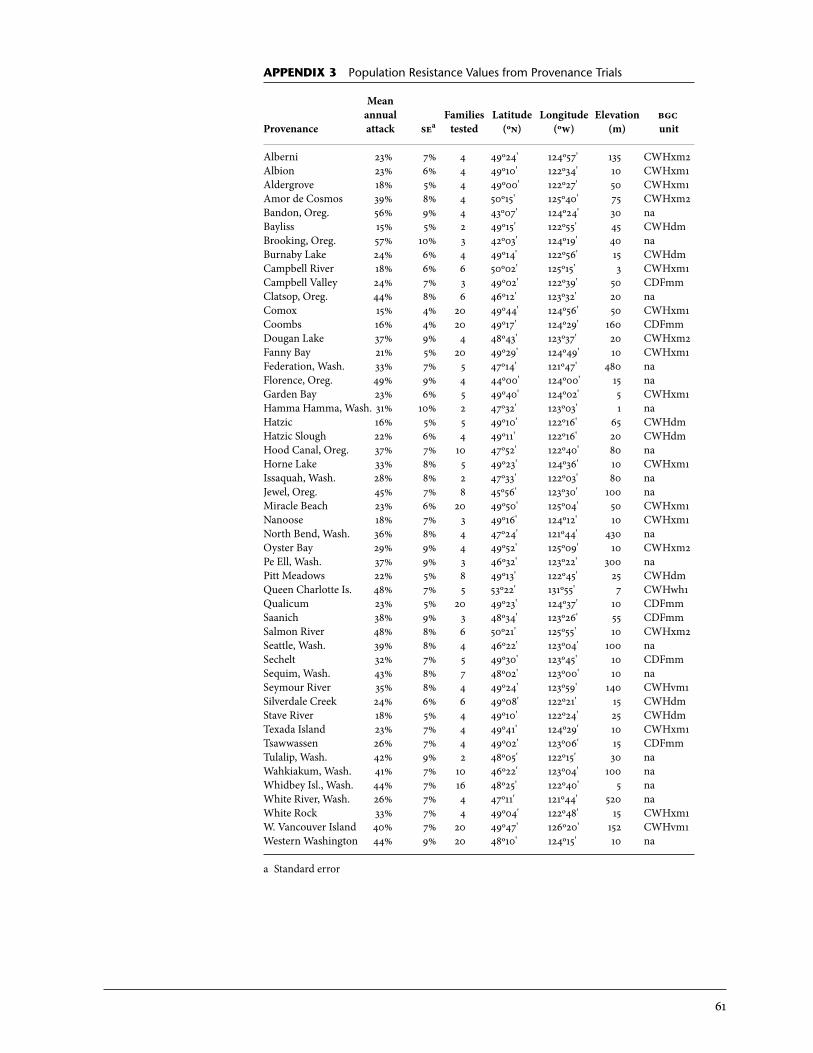
61
APPEndix 3 Population Resistance Values from Provenance Trials
Mean annual Families Latitude Longitude Elevation bgcProvenance attack sea tested (ºn) (ºw) (m) unit
Alberni 23% 7% 4 49º24' 124º57' 135 CWHxm2Albion 23% 6% 4 49º10' 122º34' 10 CWHxm1Aldergrove 18% 5% 4 49º00' 122º27' 50 CWHxm1Amor de Cosmos 39% 8% 4 50º15' 125º40' 75 CWHxm2Bandon, oreg. 56% 9% 4 43º07' 124º24' 30 naBayliss 15% 5% 2 49º15' 122º55' 45 CWHdmBrooking, oreg. 57% 10% 3 42º03' 124º19' 40 naBurnaby Lake 24% 6% 4 49º14' 122º56' 15 CWHdmCampbell River 18% 6% 6 50º02' 125º15' 3 CWHxm1Campbell Valley 24% 7% 3 49º02' 122º39' 50 CDFmmClatsop, oreg. 44% 8% 6 46º12' 123º32' 20 naComox 15% 4% 20 49º44' 124º56' 50 CWHxm1Coombs 16% 4% 20 49º17' 124º29' 160 CDFmmDougan Lake 37% 9% 4 48º43' 123º37' 20 CWHxm2Fanny Bay 21% 5% 20 49º29' 124º49' 10 CWHxm1Federation, Wash. 33% 7% 5 47º14' 121º47' 480 naFlorence, oreg. 49% 9% 4 44º00' 124º00' 15 naGarden Bay 23% 6% 5 49º40' 124º02' 5 CWHxm1Hamma Hamma, Wash. 31% 10% 2 47º32' 123º03' 1 naHatzic 16% 5% 5 49º10' 122º16' 65 CWHdmHatzic Slough 22% 6% 4 49º11' 122º16' 20 CWHdmHood Canal, oreg. 37% 7% 10 47º52' 122º40' 80 naHorne Lake 33% 8% 5 49º23' 124º36' 10 CWHxm1Issaquah, Wash. 28% 8% 2 47º33' 122º03' 80 naJewel, oreg. 45% 7% 8 45º56' 123º30' 100 naMiracle Beach 23% 6% 20 49º50' 125º04' 50 CWHxm1Nanoose 18% 7% 3 49º16' 124º12' 10 CWHxm1North Bend, Wash. 36% 8% 4 47º24' 121º44' 430 naoyster Bay 29% 9% 4 49º52' 125º09' 10 CWHxm2Pe Ell, Wash. 37% 9% 3 46º32' 123º22' 300 naPitt Meadows 22% 5% 8 49º13' 122º45' 25 CWHdmQueen Charlotte Is. 48% 7% 5 53º22' 131º55' 7 CWHwh1Qualicum 23% 5% 20 49º23' 124º37' 10 CDFmmSaanich 38% 9% 3 48º34' 123º26' 55 CDFmmSalmon River 48% 8% 6 50º21' 125º55' 10 CWHxm2Seattle, Wash. 39% 8% 4 46º22' 123º04' 100 naSechelt 32% 7% 5 49º30' 123º45' 10 CDFmmSequim, Wash. 43% 8% 7 48º02' 123º00' 10 naSeymour River 35% 8% 4 49º24' 123º59' 140 CWHvm1Silverdale Creek 24% 6% 6 49º08' 122º21' 15 CWHdmStave River 18% 5% 4 49º10' 122º24' 25 CWHdmTexada Island 23% 7% 4 49º41' 124º29' 10 CWHxm1Tsawwassen 26% 7% 4 49º02' 123º06' 15 CDFmmTulalip, Wash. 42% 9% 2 48º05' 122º15' 30 naWahkiakum, Wash. 41% 7% 10 46º22' 123º04' 100 naWhidbey Isl., Wash. 44% 7% 16 48º25' 122º40' 5 naWhite River, Wash. 26% 7% 4 47º11' 121º44' 520 naWhite Rock 33% 7% 4 49º04' 122º48' 15 CWHxm1W. Vancouver Island 40% 7% 20 49º47' 126º20' 152 CWHvm1Western Washington 44% 9% 20 48º10' 124º15' 10 na
a Standard error