Embed Size (px)
Citation preview
Louisiana State UniversityLSU Digital Commons
LSU Master's Theses Graduate School
2003
Developing risk assessment maps for Schistosomahaematobium in Kenya based on climate grids andremotely sensed dataKelsey Lee McNallyLouisiana State University and Agricultural and Mechanical College, [email protected]
Follow this and additional works at: https://digitalcommons.lsu.edu/gradschool_theses
Part of the Veterinary Pathology and Pathobiology Commons
This Thesis is brought to you for free and open access by the Graduate School at LSU Digital Commons. It has been accepted for inclusion in LSUMaster's Theses by an authorized graduate school editor of LSU Digital Commons. For more information, please contact [email protected].
Recommended CitationMcNally, Kelsey Lee, "Developing risk assessment maps for Schistosoma haematobium in Kenya based on climate grids and remotelysensed data" (2003). LSU Master's Theses. 1851.https://digitalcommons.lsu.edu/gradschool_theses/1851
DEVELOPING RISK ASSESSMENT MAPS FOR SCHISTOSOMA HAEMATOBIUM BASED ON CLIMATE GRIDS AND REMOTELY SENSED DATA
A thesis
Submitted to the Graduate Faculty of the Louisiana State University and School of Veterinary Medicine
in partial fulfillment of the requirements for the degree of
Master of Science in
The Interdepartmental Program in Veterinary Medical Science
In the Department of Pathobiological Science
by Kelsey McNally
B.A. University of Memphis, 2001 December 2003
ii
Acknowledgements
I would like to thank Dr. Jack Malone for working with me as my major
professor. He has been instrumental in providing me with any data and telling me I was
doing something wrong before it was too late. Next I would like to thank Dr. James
Miller and Dr. Oscar Huh for being on my committee. Thank you to Jennifer McCarroll
and DeWitt Braud for technical assistance and problem solving throughout my project.
Thank you to Pat Smith and Seklau Wiles for their encouragement me to explore my
natural potential. Thank you to Emanuele Brianti and Prixia del Mar Nieto for making me
laugh and relax when I was stressed out and everything seemed to be going wrong. Thank
you to Michael Kearny who was a great help with the statistics. Finally I want to thank
my mother Molly McNally and my sister Lacey McNally for everything they have done
for me and always willing to do whatever I asked of them.
iii
Table of Contents
Acknowledgements………………………………………………………………………..ii
List of Tables...………….………………………………………………….………...…..iv
List of Figures……………………………………………….………………..………… ..v
Abstract..………………………………………………………………………..………..vii
Introduction………………………………………………………………..………………1
Methods and Materials…………………………………………………….……………..10
Results…………………………………………………………………….…..………….17
Discussion…………………………………………………………………...…………...30
Conclusion and Significance…………………………………………….……………….37
References………………………………………………………………………………..38
Vita………………………………………………………………………….……………42
iv
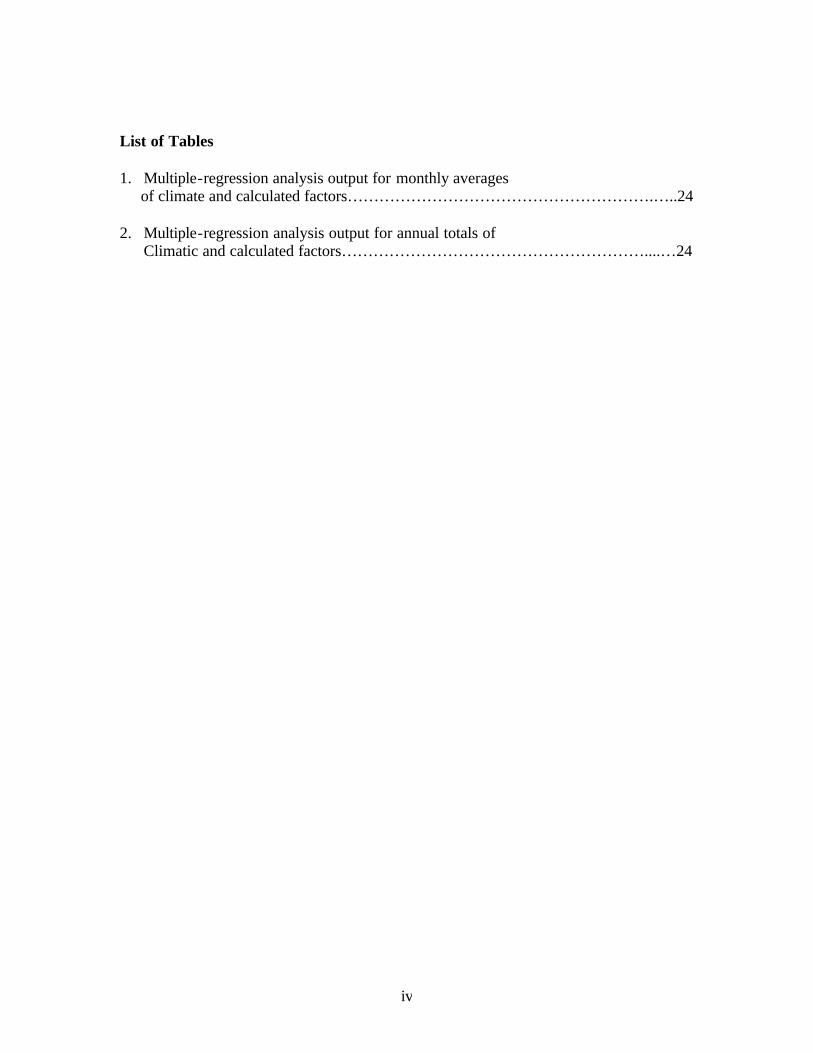
List of Tables
1. Multiple-regression analysis output for monthly averages of climate and calculated factors………………………………………………….…..24 2. Multiple-regression analysis output for annual totals of
Climatic and calculated factors…………………………………………………....…24
v
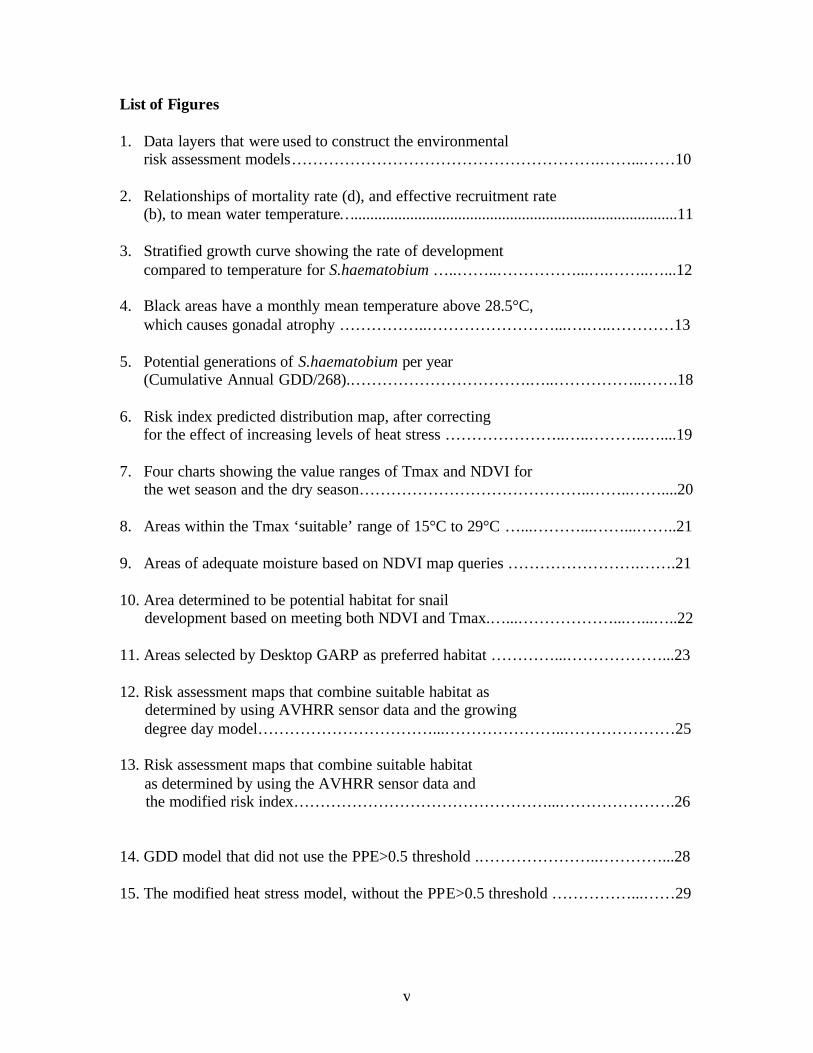
List of Figures
1. Data layers that were used to construct the environmental risk assessment models………………………………………………….……...……10
2. Relationships of mortality rate (d), and effective recruitment rate (b), to mean water temperature….................................................................................11 3. Stratified growth curve showing the rate of development compared to temperature for S.haematobium …..……..……………...….……..…...12 4. Black areas have a monthly mean temperature above 28.5°C, which causes gonadal atrophy ……………..……………………...….…..…………13 5. Potential generations of S.haematobium per year (Cumulative Annual GDD/268).…………………………….…..……………..…….18 6. Risk index predicted distribution map, after correcting for the effect of increasing levels of heat stress …………………..…..………..…....19 7. Four charts showing the value ranges of Tmax and NDVI for the wet season and the dry season……………………………………..……..……....20
8. Areas within the Tmax ‘suitable’ range of 15°C to 29°C …...………...……...……..21 9. Areas of adequate moisture based on NDVI map queries …………………….…….21 10. Area determined to be potential habitat for snail development based on meeting both NDVI and Tmax.…...………………...…...…..22 11. Areas selected by Desktop GARP as preferred habitat …………...………………...23 12. Risk assessment maps that combine suitable habitat as determined by using AVHRR sensor data and the growing degree day model……………………………...…………………..…………………25 13. Risk assessment maps that combine suitable habitat as determined by using the AVHRR sensor data and the modified risk index…………………………………………...………………….26 14. GDD model that did not use the PPE>0.5 threshold .…………………..…………...28 15. The modified heat stress model, without the PPE>0.5 threshold ……………...……29
vi
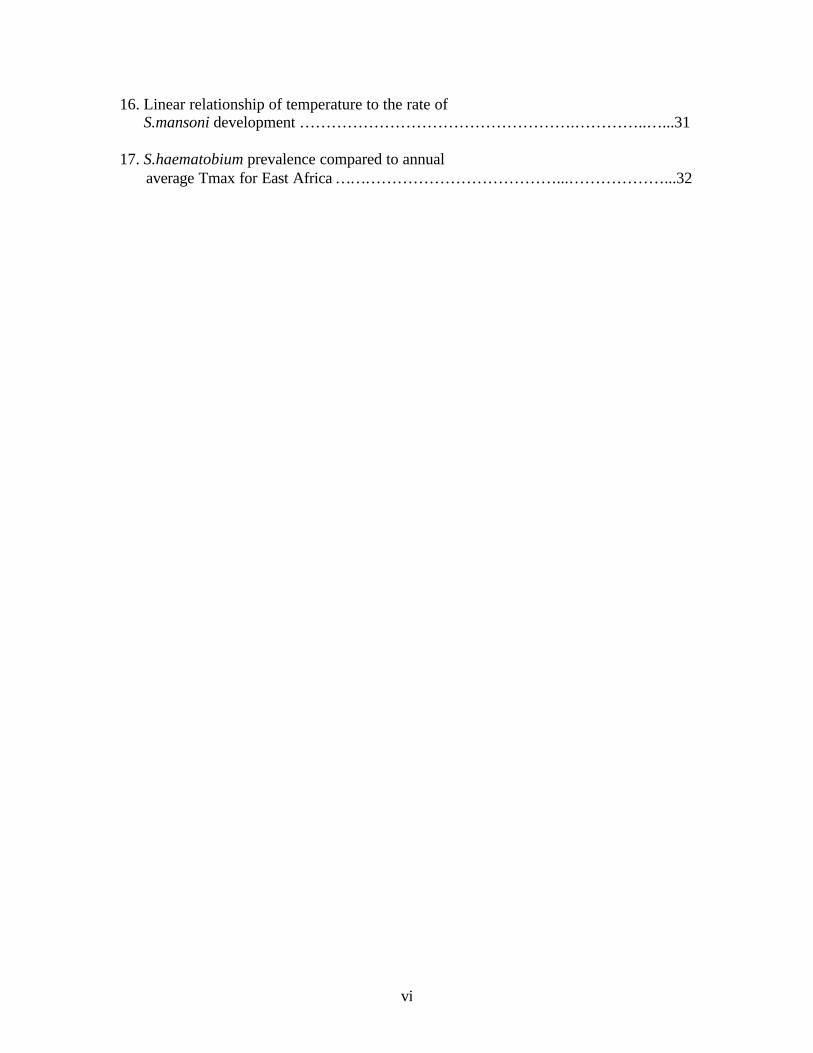
16. Linear relationship of temperature to the rate of S.mansoni development …………………………………………….…………..…...31 17. S.haematobium prevalence compared to annual average Tmax for East Africa ……………………………………...………………...32
vii
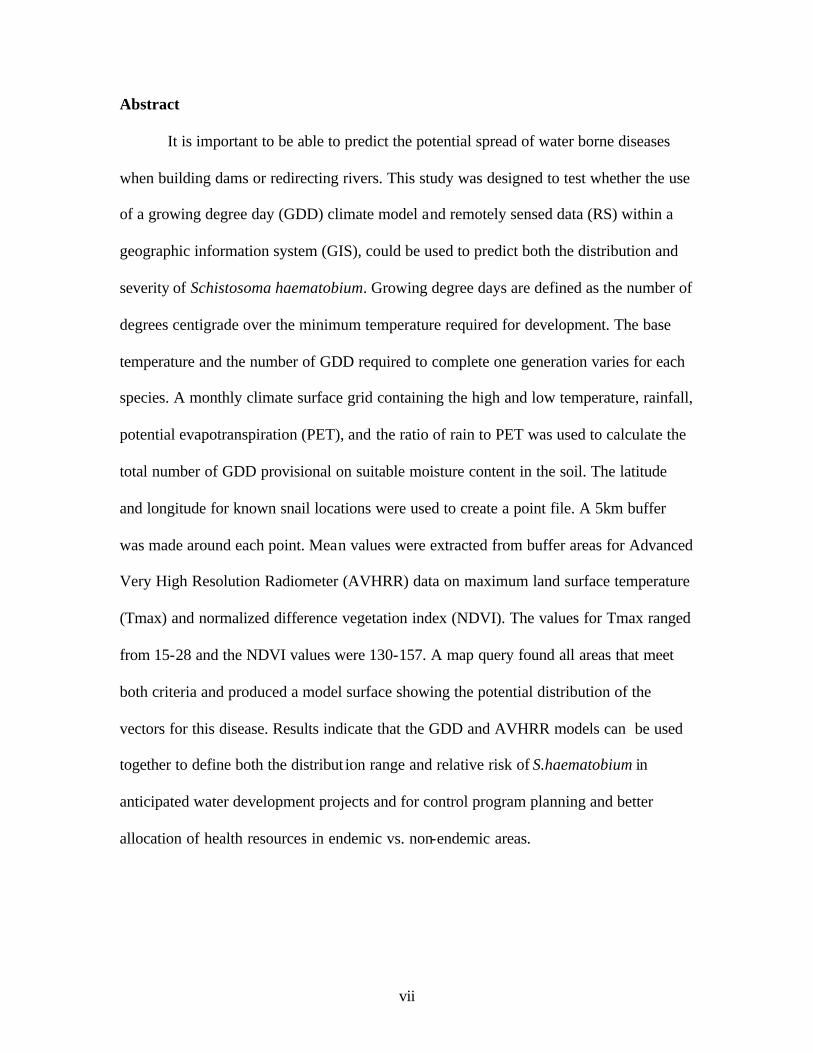
Abstract
It is important to be able to predict the potential spread of water borne diseases
when building dams or redirecting rivers. This study was designed to test whether the use
of a growing degree day (GDD) climate model and remotely sensed data (RS) within a
geographic information system (GIS), could be used to predict both the distribution and
severity of Schistosoma haematobium. Growing degree days are defined as the number of
degrees centigrade over the minimum temperature required for development. The base
temperature and the number of GDD required to complete one generation varies for each
species. A monthly climate surface grid containing the high and low temperature, rainfall,
potential evapotranspiration (PET), and the ratio of rain to PET was used to calculate the
total number of GDD provisional on suitable moisture content in the soil. The latitude
and longitude for known snail locations were used to create a point file. A 5km buffer
was made around each point. Mean values were extracted from buffer areas for Advanced
Very High Resolution Radiometer (AVHRR) data on maximum land surface temperature
(Tmax) and normalized difference vegetation index (NDVI). The values for Tmax ranged
from 15-28 and the NDVI values were 130-157. A map query found all areas that meet
both criteria and produced a model surface showing the potential distribution of the
vectors for this disease. Results indicate that the GDD and AVHRR models can be used
together to define both the distribut ion range and relative risk of S.haematobium in
anticipated water development projects and for control program planning and better
allocation of health resources in endemic vs. non-endemic areas.
1
Introduction
Schistosomiasis is one of the World Health Organization’s (WHO) great
neglected diseases. It is the second most prevalent tropical disease, with 200 million
people infected and 500 million at risk (Lengeler et al., 2002). The great majority (80-
85%) of schistosomiasis is found in sub-Saharan Africa (Bergquist, 2002). It is important
to create some method of separating areas of high risk from areas of low risk for control
programs. Schistosomiasis is spread by water contact of human hosts in freshwater
habitats of snails suitable for propagation and transmission of the parasite.
Schistosoma haematobium has an indirect life cycle that requires aquatic snail
intermediate hosts of several Bulinus spp. Suitable snail hosts are penetrated by miracidia
that hatch in fresh water aquatic environments from eggs shed in the urine of infected
humans. The miracidia have 8-12 hours to infect a suitable Bulinus spp. snail host. In the
snail, the miracidium then develops into sporocysts and then to cercariae. The sporocyst
can produce up to 600 daughter sporocysts. The daughter sporocysts migrate to the
digestive gland of the snail host to begin producing the cercariae stage. The snail can
shed approximately 100’s of cercariae/day up to 18 days
(http://martin.parasitology.mcgill.ca/jimspage/biol/schisto.htm). Temperature effects the
amount of time needed to complete this portion of the life cycle. Cooler temperatures
decrease the rate of development while warmer temperatures up to the optimum
temperature 22°C. Pflüger (1981) describes this portion of the schistosome life cycle as
being the most restrictive with respect to temperature. The free swimming cercariae
released from snail hosts infect the human host by penetrating the skin. The cercariae
shed their bifurcated tail, and the resulting schistosomula are carried through the blood
2
stream to the lungs for approximately 8 days. The schistosomula are then transported to
the liver where they mature to adults and begin pairing as adult. The paired adults begin
producing eggs that pass into adjacent tissues, while many eggs penetrate through the
mucosa of bladder. The eggs of S. haematobium are shed in the urine (Ross, 2002). Eggs
contaminate fresh water due to the lack of a proper sewerage system or defecating close
to a water body. The eggs, once in water, then hatch because of the osmotic pressure
releasing the miracidia to the water to infect more snail hosts.
Advances in technology have allowed geographical information systems (GIS)
and remote sensing (RS) to be used in the epidemiology of disease to create risk
assessment maps. John Snow first used GIS in 1854, in a public health application of an
outbreak of cholera in London (Loslier, 1995). Because of the lack of spatial data sources
and the limited capability of computer software, GIS has not been used at it full potential,
until recently. Technological advances in computers, software, and data availability have
led to development of a number of GIS medical applications that allow evaluation of both
spatial and temporal relationships of the environment and disease agents. In the last
decade, GIS has been used to create risk models for a number of environmentally
sensitive diseases including malaria, onchocerciasis, rift valley fever, fascioliasis, and
African trypanosomiasis (Brooker, et al. 2001, Malone et al., 1995, 2003). Environmental
factors such as climate, satellite sensor data, elevation, land use, soil type, and other map
data are overlaid on a base map of standard geographic projection and scale. A series of
points can then be added and used to extract data for all layers of environmental data and
interactively analyzed by GIS query and statistical methods. These points can be cities,
3
weather stations, or locations where health data was collected in previous or current field
research.
Remote sensing data from earth observing satellites or aircraft can be used to
gather ‘surrogate’ information on climate, vegetation, soil moisture, and other
environmental features. Remote sensing has not been widely used in public health, until
recently due to the coarse resolution of early sensors and the cost of obtaining satellite
images. Environmental satellites have been launched into space for 40 years, but were
originally limited to use for the military and weather observations (Huh and Malone,
2001). Among the advantages of using RS are that data can be provided on areas that are
not assessable, it offers the possibility of global coverage, and data can be collected,
processed, and used in near real time. Weather stations can only provide data for small
areas, and therefore it can require hundreds or thousands of climate stations to effectively
cover a given country in the same detail as satellite imagery.
Currently, the Advanced Very High Resolution Radiometer (AVHRR) sensor is
one of the most widely used remote sensing systems used in parasitological and
epidemiological studies. This system uses 5 bands with bands 1 and 2 being in the visible
portion of the energy spectrum, bands 4 and 5 being thermal infrared data, and band 3
being mid-range infrared data, all with a pixel resolution of 1.1km2 (Huh and Malone,
2001). The first AVHRR sensor satellite was launched in 1978, providing a long-term
archive of satellite data that can be used to map the distribution and abundance of
diseases and vectors and to document the spread of a given disease. A limitation of using
AVHRR is the 1.1km2 resolution and the fact that snails and the parasites they carry often
live in water bodies and streams smaller than 1.1km2.
4
The effects of environmental factors on the development of the intermediate hosts
of schistosomiasis were described by Malek in 1958. A suitable range was defined for
each factor and the limiting effect it has on the snail. It is reported that Bulinus globosus
and Bulinus physopsis can survive 12 months of drought in the laboratory and 45 days in
its natural habitat (Malek, 1958).
Many studies have been done to evaluate and predict the effects of irrigation
projects on snails and schistosomes with mixed success. For example in 1976, the United
States Agency for International Development (USAID) did an assessment on the risk of
schistosomiasis before a water development scheme began in the Senegal River Basin
and predicted the river basin was at low risk for the development of this disease. Two
dams were built, one in 1985 and a second in 1989, which changed the environment in
the Senegal River Basin and led to one of the worst outbreaks of schistosomiasis ever
recorded (Southgate, 1997). This was likely to occur, since data cannot be recorded for
every location or every point in time (Kitron, 2000) and thus field assessments were
incomplete. This event and earlier experience with other water development projects that
ultimately led to increased risk of schistosomiasis, notably the Aswan Dam in Egypt and
the Akosombo Dam in Ghana (Hunter et al., 1982), indicate the need for more accurate
risk assessment methods.
The construction of the Aswan Dam altered the environment, creating
unfavorable conditions for Bulinus sp. and favorable conditions for Biomphalaria spp.
Under pre-dam conditions of a single seasonal irrigation period that were more suitable
for the development of Bulinus sp., the prevalence in the Nile Delta of S. haematobium
was 74% in 1935 and the prevalence of S.mansoni was 3.2% (Abdel-Wahab, 1979). In
5
1979, when the human population was retested, the prevalence relationship had reversed;
S. haematobium prevalence was 2.2% and S.mansoni prevalence was 73%.
Irrigation and water development is thus known to be highly influential in the
spread and increased relative severity of schistosomiasis. Sturrock (1965) monitored nine
irrigations schemes in Tanzania to determine the effect of these water developments on
the establishment of snail populations. Each scheme used different methods of water
control and maintenance leading to the establishment of different assemblage of snail
species in each scheme. In 1977, established irrigation schemes in Ethiopia were
surveyed to measure the prevalence of schistosomiasis, the effects of water temperature,
and elevation on the snail population. The results of this study showed that Biomphalaria
pfeifferi were found in large numbers, while only a few snails from the Bulinus spp were
found in the canals (Kloos and Lemma, 1977). It was reported that resettlement was
another method of introducing infected people to uninfected areas. In many cases the
schistosomes died and did not create new endemic areas (Kloos, 1990).
The ecology of S.mansoni and S. haematobium was mapped for Ethiopia by Kloos
(1988) to show the relationships between prevalence and environmental factors, both
natural and man-made. An elevational limit of 800m-2200m above sea level was
established as suitable elevation for S.mansoni due to hot water temperatures below 800m
and cold water temperature above 2200m (Kloos et al., 1988). S. haematobium was found
below 800m because the Bulinus spp. in Ethiopia favor warm water temperatures.
S.mansoni prevalence declines when the elevation is above 2000m (Kloos et al., 1988). In
addition to describing the elevational requirements for the intermediate hosts, Kloos also
identified the specific species capable of transmission for various region in Ethiopia.
6
The effects of temperature on prevalence and development of schistosomes have
been studied in the laboratory by a number of authors. Anderson et al. (1979) found that
the rate of development increased with temperature as a linear relationship. The suitable
temperature range for larval development in the laboratory was between 15°C to 35°C,
with an optimum temperature for intramolluscan development of 25°C. The study also
determined that infection considerably reduced the life span of the snail. Woolhouse et al.
(1990) describes the fecundity rate as being dependent on temperature by modeling a bell
curve relationship with the optimum temperature peak at 20.6°C.
The thermal development requirements of S. haematobium and S.mansoni have
been reported in detailed studies by Pflüger (1981). A minimum temperature and
maximum temperature for development of the parasite was established as well as the
number of GDD required to complete one life cycle in the snail host for both S.mansoni
and S. haematobium. The rate of development, as influenced by temperature, was shown
to have a linear relationship starting with the minimum temperature (15.3°C for S.
haematobium) to an optimum temperature (22°C for S. haematobium). Again, it was
stated that there is an inverse relationship of development and temperature above the
optimum temperature. Parasitic development within the snail has the most restricted
range of temperatures throughout the life cycle (Pflüger, 1981). The effects of
temperature on Bulinus globosus in field studies in the Kenya coastal areas were reported
by O’Keeffe, (1985); snail populations were limited when temperatures rise above
28.5°C, an effect that was attributed to gonadal atrophy. The optimum temperature for
population growth was shown to be 25°C. Rainfall and water temperature were reported
7
to be the most important variables for controlling the population of B.globosus
(O’Keeffe, 1985).
The use of GIS and RS for the prediction of schistosomiasis was first attempted in
the Philippines and the Caribbean by Cross et al. (1984). Data collected by weather
stations, topographic information, Landsat data, and disease was combined to create a
model. This model had 93.2% correct classification of known endemic areas in the
Philippines. The model was not accurate when classifying the environment for
schistosomiasis in the Caribbean (Cross et al., 1984).
GIS and remote sensing (RS) were later used to evaluate risk of schistosomiasis in
the Nile River delta of Egypt (Malone, 1994) for use in control program management for
schistosomiasis. A regional scale model was created for the Nile Delta on the potential
distribution and abundance of S.mansoni by Malone et al. (2001) who used AVHRR to
create diurnal temperature difference maps which indicated thermal-hydrological regimes
that favored the snail host and transmission of the parasite. Bulinus spp. was suggested to
be more tolerate of drought and high temperatures than Biomphalaria spp, the snail host
for S.mansoni (Malone, 1994, 1995).
The habitats for Bulinus globosus and Biomphalaria pfeifferi were described in
Zimbabwe using Tmax and NDVI from the AVHRR sensor. The seasonal distribution
was monitored using RS to determine which months had the most influence on
transmission. The optimum range of NDVI was 128-160 for identifying areas of high
prevalence (= 5%) (Mukaratirwa, 1999).
Risk assessment maps were created in 2001 for S. haematobium in Tanzania by
use of RS and logistic regression, regions were identified as being risk (Brooker, 2001).
8
Remote sensing was used to define ecologic zones and then produce risk assessment
maps for each zone. These models were then validated by using a questionnaire to
determine prevalence in a given area (Brooker, 2002). A risk assessment model has been
developed for S.mansoni, in Bahia, Brazil, using GIS. The latter model evaluated several
agro-climate and environmental factors to find areas that met the life cycle requirements
of S.mansoni (Bavia, 1999).
Geospatial studies on other diseases suggest new approaches for the use of GIS
for better decision making toward schistosomiasis control. The spatial distribution of
filariasis in the Nile Delta has been described using RS to identify environmental
requirements for this disease. Normalized difference vegetation index (NDVI) combined
with temperature were used to determine suitable mosquito habitat areas
(Crombie, 1999, Thompson et al.,1996). These studies used AVHRR and the Landsat
sensor systems, respectively, to measure soil moisture parameters that determine potential
breeding habitat.
For malaria, an environmental risk assessment model was recently used for
prediction of malaria risk for Eritrea in 2002. A growing degree day model was used to
determine the potential severity of malaria which was divided into a highland pattern and
a coastal transmission pattern based on temperature and water balance parameters using a
5km2 climate grid (Malone et al., 2003). A similar approach was successfully used to
determine the potential severity of S.mansoni in Kenya (Malone and Corbett, 2002). The
influences of resettlement were described for Malaria, yellow fever, onchocerciasis , and
trypanosomiasis in Ethiopia. An upper limit for elevation was defined as 2000m for many
tropical diseases in Ethiopia (Kloos, 1990).
9
The impetus for the current study on S. haematobium in Kenya arose from results
of earlier work described above and the availability of GIS-compatible resource datasets
from two sources: 1) A ‘minimum medical GIS database’ for the IGAD/Nile region of
East Africa, including Kenya (Malone et al., 2001a,b), and 2) a database from a very
complete recent survey of the freshwater snails of southern Kenya (Loker et al., 1993).
The Global Network on Schistosomiasis Information Systems and Control of
Snail-Borne Disease (www.GnosisGIS.org) has fostered use of satellite climatology in
predictive models for schistosomiasis and fascioliasis. One of the purposes of this
network is to create and maintain a “Minimum Medical Database” (MMDb), a
compilation of environmental and parasitological data needed to develop risk assessment
models for a variety of diseases and parasites. The MMDb includes AVHRR data, on
NDVI and land surface temperature (Tmax), along with other data components such as a
Food and Agriculture Organization (FAO) soil database, topography, and snail
distribution for East Africa (Bergquist, NR, 2002).
Loker et al. (1993) performed a systematic survey in southern Kenya to map the
locations of fresh water snails and determine the preferred habitat. Snails were collected
and identified over a three year time period in natural and man-made water bodies.
Elevation and habitat type were recorded as well as the number of each species found.
The latitude and longitude were recorded so that these points could be used in a
geographic information system (GIS). The MMDb database, supplemented with
geospatial data from other sources, and the Loker survey database were used in the
current study to initiate development of a risk assessment model for Kenya using GIS/RS
methodologies.
10
Methods and Materials
Two approaches were taken to develop separate GIS model components which
were later combined to produce the final model: (1) a climate-growing degree day model
and (2) a remote sensing model using earth observing satellites. The databases included
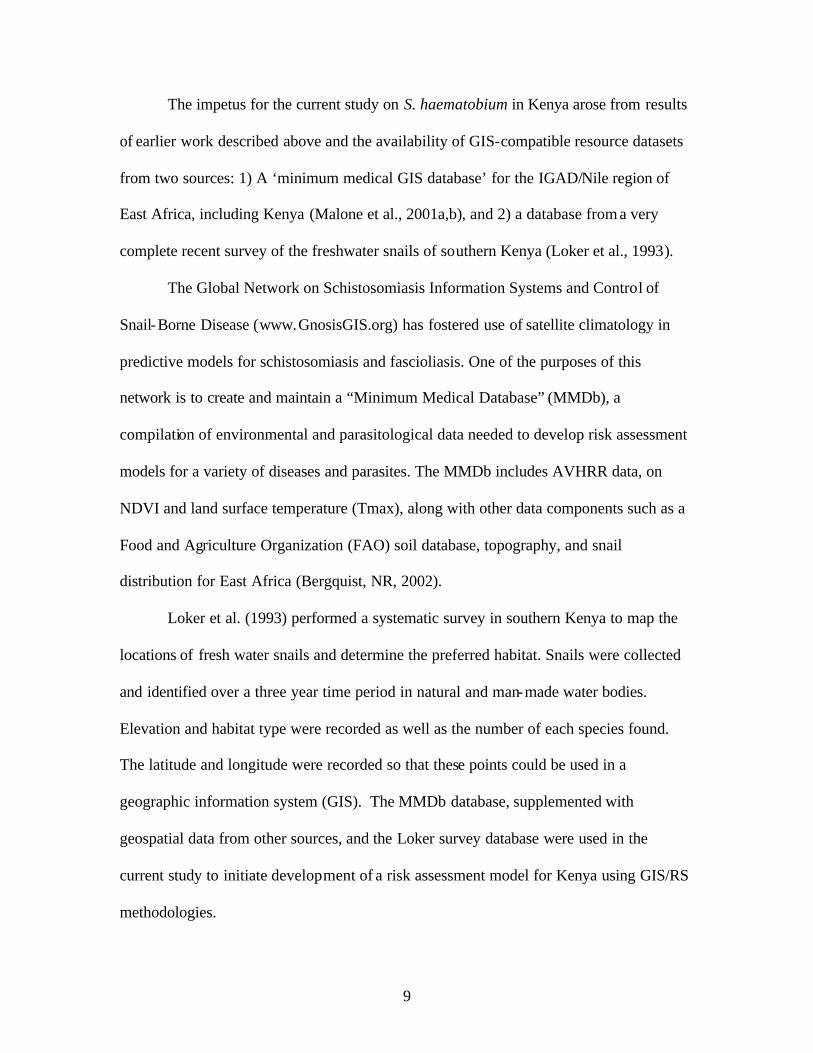
in the GIS constructed for use in these stud ies is shown on Fig.1.
Fig.1. Data layers that were used to construct the environmental risk assessment models for S. haematobium. Growing Degree Day Model
A growing degree day (GDD) model was developed using a MMDb climate
surface 5km2 grid that had originally been obtained from the Almanac Characterization
Tool 3.0 (ACT 3.0) (Corbett et al., 2001), a comprehensive database on climate,
demography, topography, infrastructure, hydrology, and other environmental parameters
for East Africa.
11
Growing degree days were calculated as the number of degrees above 15.3°C, the
minimum temperature required for development of S. haematobium (Pflüger, 1981) times
the number of days per months ((mean temperature-15.3)*days of the month). Growing
degree days were accumulated only under conditions in which a soil moisture water
balance was above a threshold considered to be needed to allow the snail and the parasite
to survive in a given environment. A precipitation:potential evapotranspiration ratio
(PPE) greater than 0.5 was set as the criteria to indicate the presence of an adequate
amount of surface water or soil moisture based on the water balance in the top 25cm of
soil water holding capacity. A total of 298 GDD is required to complete one S.
haematobium development cycle in the snail host. GDD/298 represents the number of
potential generations per year that could occur for each grid cell.
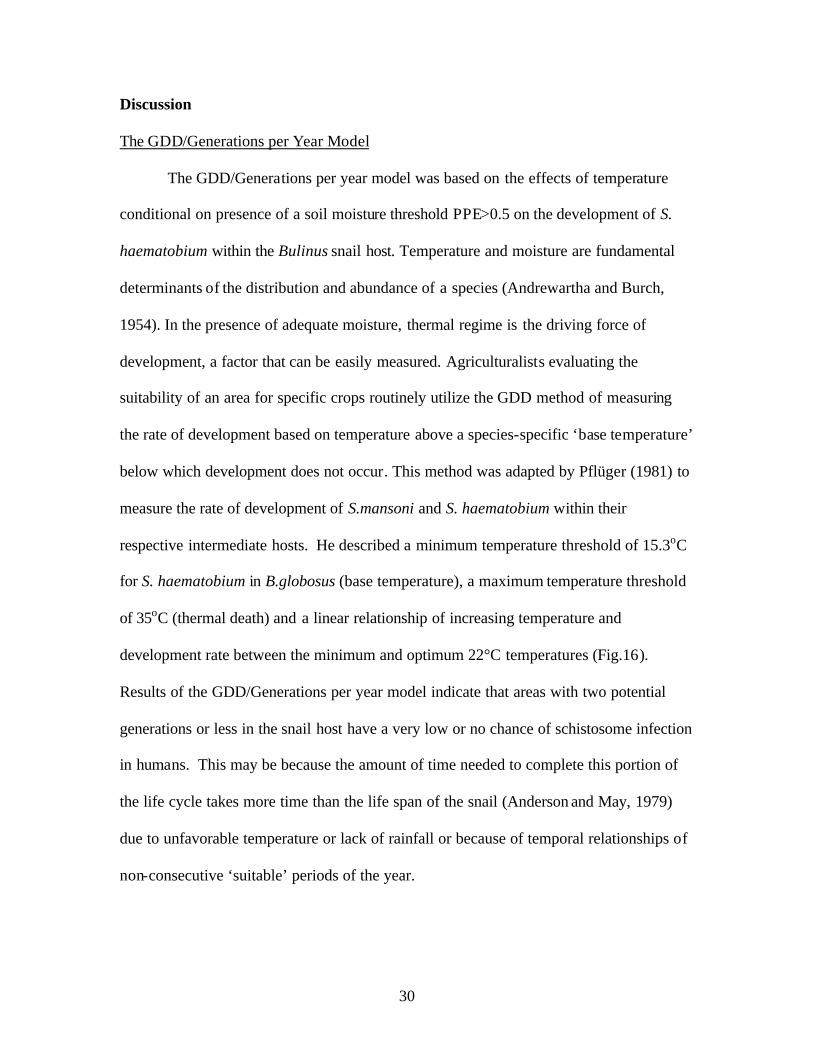
Modified Risk Index Model
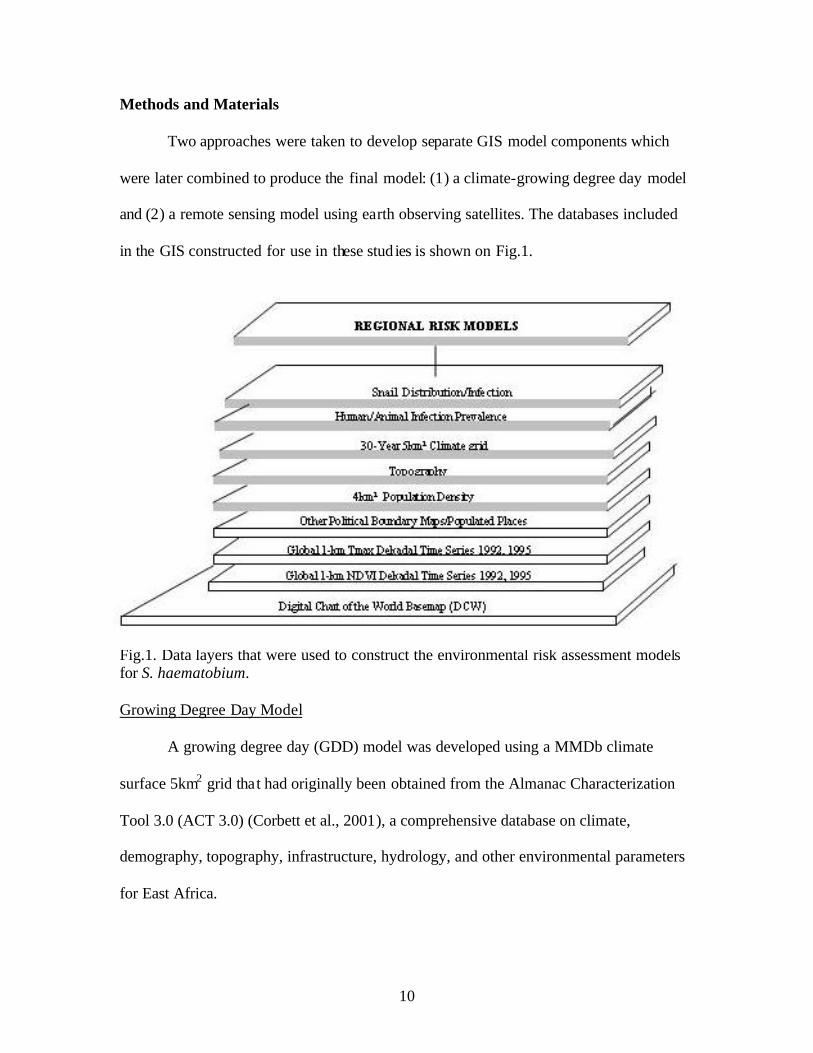
It is known that development rates of the free-living stages of many parasites
increase with temperature until the optimum temperature is reached, then decrease at
temperatures that exceed the optimum due to heat stress (Fig.2), although this factor has
been difficult to measure in the field (Andrewartha and Burch, 1954, Woolhouse, 1990).
Fig. 2. Relationships of mortality rate (d), and effective recruitment rate (b), to mean water temperature for B.globosus based on a mathematical model (Woolhouse, 1990).
12
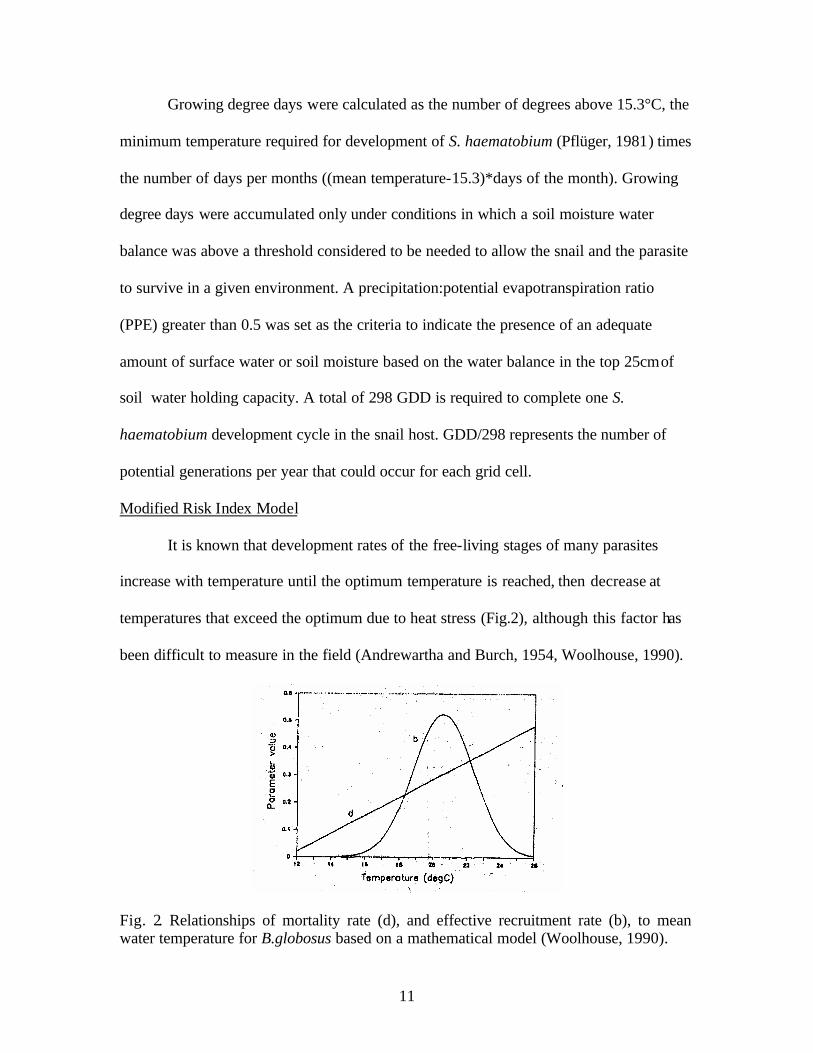
The effect of heat stress was estimated by stratifying the growth curve into 7 classes
assuming the population development-survival balance will lead to population growth at
a given rate on either side of the optimum temperature (Fig.3). The water balance
threshold of PPE>0.5 was used to indicate areas with adequate moisture for life cycle
progression in each month. Monthly values were then summed to yield a cumulative risk
index value.
Fig.3. Stratified growth curve showing the rate of development compared to temperature for S. haematobium. Masking Unsuitable Areas
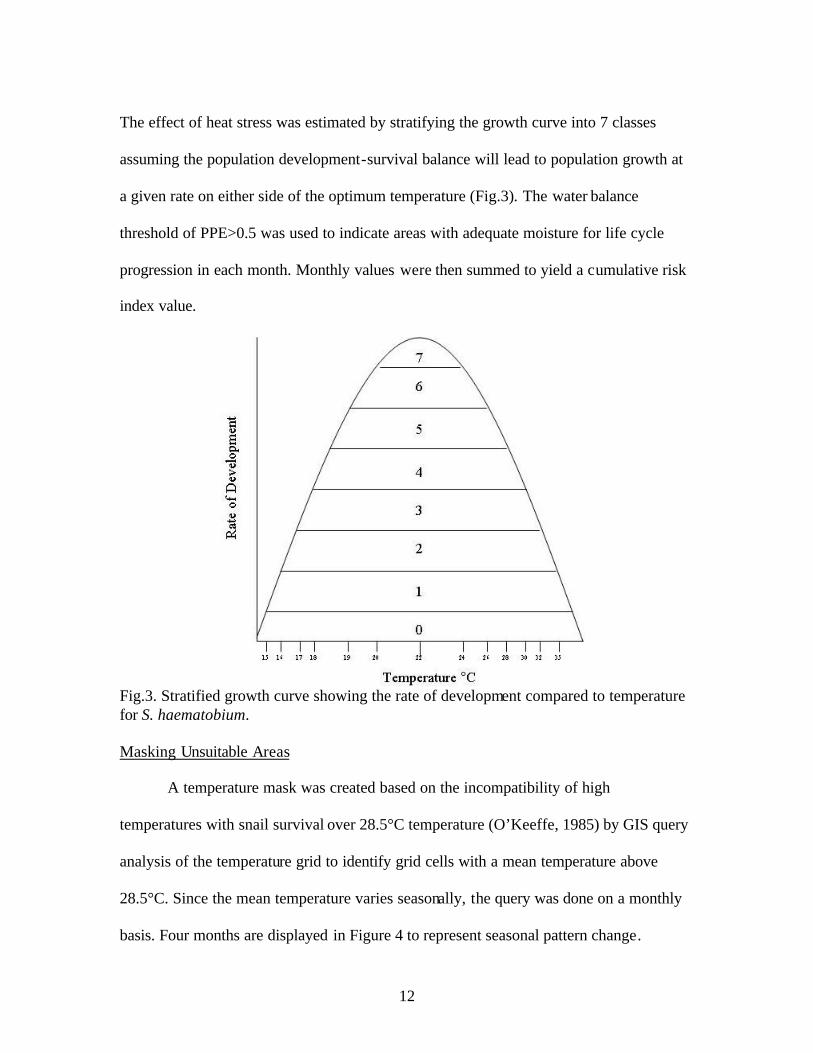
A temperature mask was created based on the incompatibility of high
temperatures with snail survival over 28.5°C temperature (O’Keeffe, 1985) by GIS query
analysis of the temperature grid to identify grid cells with a mean temperature above
28.5°C. Since the mean temperature varies seasonally, the query was done on a monthly
basis. Four months are displayed in Figure 4 to represent seasonal pattern change.
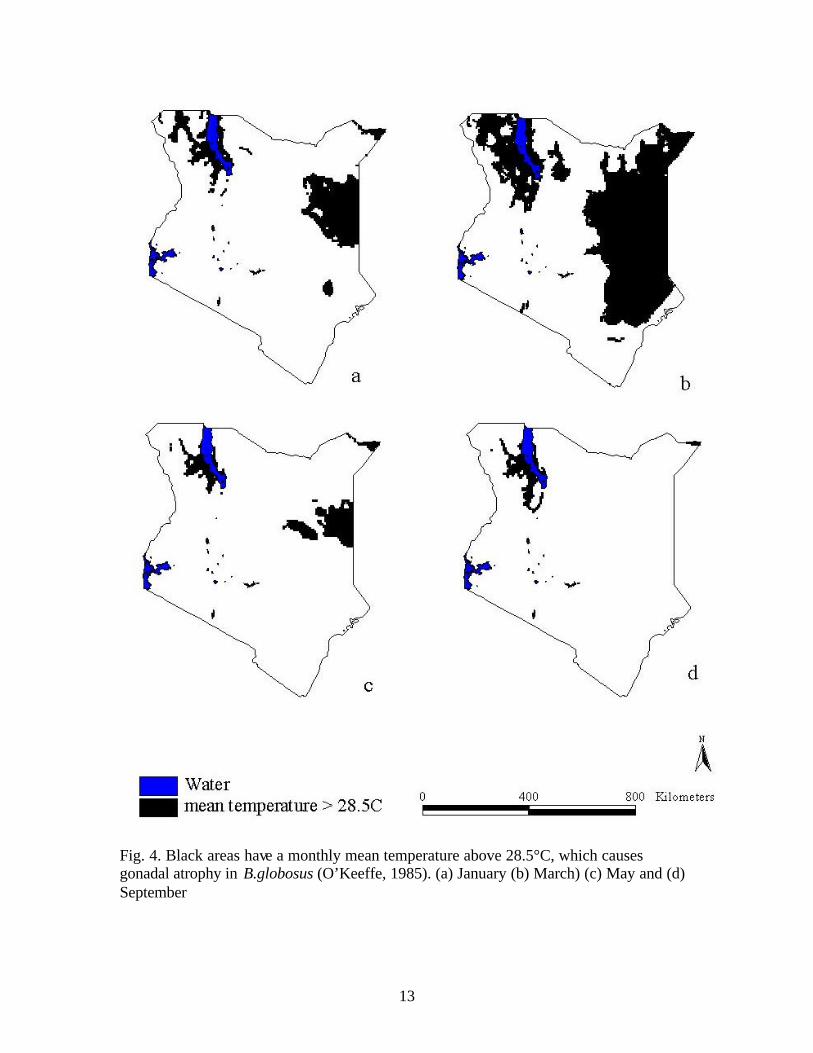
13
Fig. 4. Black areas have a monthly mean temperature above 28.5°C, which causes gonadal atrophy in B.globosus (O’Keeffe, 1985). (a) January (b) March) (c) May and (d) September
14
AVHRR Remote Sensing Models
Advanced Very High Resolution Radiometer (AVHRR) data was obtained
(Malone et al., 2001) for 1992-1993 and 1995-1996 via the Internet from the United
States Geological Survey (USGS) global 1km2 website
(http://edcdaac.usgs.gov/1KM/1kmhomepage.html) for daytime land surface temperature
(Tmax) and Normalized Difference Vegetation Index (NDVI). NDVI is an index that
ranges from -1 to 1, that was rescaled for use by the global 1km2 website to yield NDVI
values of 0-200. The primary purpose of NDVI is to measure vegetation health, however,
NDVI can also be used to estimate soil moisture based on vegetation health (Crombie,
1999, Huh and Malone, 2001). NDVI based on data from the AVHRR sensor is
calculated by using channels 1 and 2 ((channel 2- channel1)/(channel 2+ channel 1))
(Huh and Malone, 2001).
The AVHRR data was downloaded at dekadal intervals (every10 days) that had
already been processed by the USGS to eliminate cloud cover using an algorithm that
records the highest pixel value for each pixel during the 10-day period. All satellite
images were calibrated and georeferenced to a geographic decimal degree latitude and
longitude coordinate system using ERDAS imagine 8.6 image processing software. The
dekadal data were then combined to create monthly composite maps by averaging the
images together:
((Image1+Image2+Image3)/3)=monthly composite
Monthly data were averaged together to create wet season (Oct-March), and dry season
(April-Sept) composite maps, and an annual composite map. Composite images were
incorporated into an ArcView 3.3 GIS project and converted to a grid file for further
15
analysis using a grid cell size of 1.1km2, the same spatial resolution as the original
AVHRR data.
Buffer zones with a 5km diameter were created in ArcView 3.3 GIS centered on
all survey points for B.globosus. A separate set of buffers was centered on survey points
containing B.physopsis. These buffers were used to extract mean values for both Tmax
and NDVI. Since each pixel in the AVHRR image represents 1.1km2, ArcView 3.3 GIS
calculated the mean value for both NDVI and Tmax for the entire buffer area. Based on
the mean value range, a map query was then done to select grid cells of the composite
maps cons istent with the range of known infected sites. The intent was to show areas
where B.globosus and B.physopsis can occur based on the value range of Tmax and
NDVI at known endemic sites.
Ecological Niche Modeling
Using the Genetic Algorithm for Rule-Set Prediction (GARP), an ecological niche
for S haematobium was predicted based on environmental factors, including high
temperature, low temperature, rainfall, evapotranspiration, topography, and AVHRR
data. The snail survey dataset of Loker et al. (1993) was used as the positive point
location records for this program. GARP uses 50% of the point locations for training and
the remaining 50% as a test dataset, using either 1000 iterations or until an operator
specified convergence level is reached in the rule-selection process. The predictive value
is based on 1250 points taken from test data and 1250 points randomly selected from
within the study area. Logistic regression is performed after each iteration to determine if
the rule should be incorporated into the model (Peterson, 2002, 2003). An ArcView grid
16
is created based on the final model used by GARP. This grid can then be input into a GIS
and compared to existing models.
17
Results
GDD and Modified Risk Index
The range of potential generations per year throughout Kenya was -8 to +10 when
a water balance of PPE>0.5 was considered to be a limiting factor (Fig. 5). The area
surrounding Lake Victoria and along the southern coast had 6-10 generations per year.
The eastern border, the area around Lake Turkana, and the highlands had values less than
2 generations per year. For the remainder of the country 2-6 potential generations of S.
haematobium were predicted developing in the snail hosts per year.
For the modified risk index model that accounted for the effect of heat stress, risk
index value ranges of 0-15 (very low), 16-30 (low), 31-46 (moderate), 47-61 (high), and
62-77 (very high) (Fig.6) were predicted, conditional on water balance values of
PPE>0.5. The area surrounding Lake Victoria is the only region with both high and very
high risk by this model. The southern part of Kenya along the coast, and regions in the
highlands were predicted to have moderate risk. The remainder of the southern region of
Kenya had low risk while the northern regions had very low risk.
AVHRR Remote Sensing Model
The mean values for Tmax within the 5km buffers centered on sna il survey data
points ranged from 6.5-28.5°C for the wet season, and 7.5-29° C for the dry season based
on 1992/1995 AVHRR composite seasonal maps (Fig.7). The range used for the map
queries was 15?C-29?C. The lower limit of this temperature range was chosen because of
the life cycle demands of the schistosome. The upper limit was used based on the fact
that no snails were found at higher temperatures and also because of reported gonadal
atrophy above 28.5?C (O’Keeffe, 1985).
18
Fig.5. Potential generations of S. haematobium per year (Cumulative Annual GDD/268) that can occur based on monthly mean temperature of > 15.3oC, conditional on a water balance ratio (Rain/Potential Evapotranspiration) of >0.5.
19
Fig.6. Risk index predicted distribution map, after correcting for the effect of increasing levels of heat stress (>optimum temperature) on the model output of the GDD-based generations per year model for S. haematobium, conditional on water balance values of PPE>0.5.
20
Fig.7. Four charts showing the value ranges of Tmax and NDVI for the wet season and the dry season (a) Tmax values for known Bulinus spp. locations during the wet season (b) Tmax values for known Bulinus spp. locations during the dry season (c) NDVI values for known Bulinus spp. locations during the wet season (d) NDVI values for known Bulinus spp. locations during the dry season. All Bulinus spp. locations were based on surveys performed by Loker et al. (1993). The map queries indicated almost the entire country fell within the suitable thermal range
15°C-29°C (Fig. 8). The NDVI mean values extracted from for the 5km buffers were 35-
160 for the wet season, and 56-157 for the dry season based on the 1992/1995 composite
seasonal map data (Fig. 7). Values of NDVI used for final map queries were 125-160 for
the wet season, and 130-157 for the dry season (Fig.9). Buffer query areas with low
mean NDVI values (<100) were eliminated from consideration if part of the buffer zone
being averaged included a water body of nil NDVI value. Large water bodies register as
0 for NDVI due to the fact that there is little or no vegetation in the middle of a body of
water. Another map query, using boolian logic, shows areas that met both criteria (NDVI
and Tmax), thus being suitable habitat for a snail population to survive (Fig. 10).
21
Fig.8. Areas within the Tmax ‘suitable’ range of 15°C to 29°C for (a) wet season and (b) dry season as determined by dekadal AVHRR satellite sensor data.
Fig.9. Areas of adequate moisture based on NDVI map queries (a) wet season with a range of 125-160 (b) dry season with a range of 130-157.
22
Fig.10. Area determined to be potential habitat for snail development based on meeting both NDVI and Tmax suitable range criteria for the (a) wet season and (b) dry season Ecological Niche Modeling Two seasonal ecological niche models for the distribution of S haematobium were
derived based on temperature, rainfall, topography and remotely sensed data from the
AVHRR sensor (Fig.11). Convergence at a threshold of 0.05 was reached after 20
iterations for the wet season, and 25 iterations for the dry season. Once convergence was
reached, Desktop GARP performs a Chi square analysis for a “best fit” ecological model
for each season. The p values from the Chi square analysis for each model were 9.13e -18
for the wet season, and 3.95e-15 for the dry season.
23
Fig.11. Areas selected by Desktop GARP as preferred habitat based on climatic factors, topography, and the locations of snails (Loker et al, 1992) for the (a) wet season and (b) dry season.
Statistical Analysis
Multiple-regression analysis was done to determine which environmental and
calculated factors had the highest impact on the distribution and abundance of the Bulinus
spp. population. This was done for both a monthly average (Table 1) and annual totals
(Table 2) of these factors. In both cases, the growing degree day model (WETGDD,
p=0.0029, 0.0032) and the modified heat stress model (WETRANK, p=0.0011, 0.0014),
as measured by the PPE>0.5 threshold, were the most significant factors.
24
Table 1. Multiple-regression analysis output for monthly averages of climatic and calculated factors.
Maximum R-Square Improvement: Step 18
Variable LT Entered: R-Square = 0.2915 and C(p) = 11.0000
Analysis of Variance
Source DF Squares Square F Value Pr > F
Model 10 28933 2893.25065 3.29 0.0013
Error 80 70315 878.93295
Corrected Total 90 99247
Parameter Standard
Variable Estimate Error Type II F value Pr>FIntercept -26.96707 57.50568 193.28656 0.22 0.6406Elevation 0.01888 0.04634 145.85476 0.17 0.6848GDD w/o PPE>0.5 -0.66079 0.41591 2218.6384 2.52 0.1161Low tmeperatre -0.71718 6.20303 11.74915 0.01 0.9082PET -2.15153 1.03628 3788.7754 4.31 0.0411PPE -211.911 162.17738 1500.6589 1.71 0.1951PRE 1.01432 1.5097 396.75599 0.45 0.5036Heat stress w/o PPE>0.5 -4.65159 9.30496 219.64861 0.25 0.6185GDD w/ PPE>0.5 0.63705 0.20967 8113.5196 9.23 0.0032Heat stress w/ PPE>0.5 -19.72045 5.83661 1.0034 11.42 0.0011High tmeperature 19.32259 7.70205 5531.8949 6.29 0.0141
Table 2. Multiple-regression analysis output for annual totals of climatic and calculated factors
Maximum R-Square Improvement: Step 12
Variable LT Entered: R-Square = 0.2744 and C(p) = 11.0000
Analysis of Variance
Source DF Squares Square F Value Pr > F
Model 10 27238 2723.82600 3.03 0.0027
Error 80 72009 900.11104
Corrected Total 90 99247
Parameter Standard
Variable Estimate Error Type II F value Pr>FIntercept -127.8079 181.90179 444.36276 0.49 0.4843Elevation 0.0379 0.0551 425.9589 0.47 0.4935GDD w/o PPE>0.5 -0.05874 0.03602 2393.398 2.66 0.1069Low tmeperatre 0.17846 0.66247 65.31983 0.07 0.7883PET -0.16213 0.09338 2713.172 3.01 0.0864PPE -14.93816 15.5069 835.29665 0.93 0.3383PRE 0.05938 0.14271 155.86371 0.17 0.6784Heat stress w/o PPE>0.5 -0.42079 0.78435 259.05802 0.29 0.5931GDD w/ PPE>0.5 0.05693 0.01849 8529.987 9.48 0.0029Heat stress w/ PPE>0.5 -1.68399 0.50826 9881.1785 10.98 0.0014High tmeperature 1.67212 0.65947 5786.9 6.43 0.0132
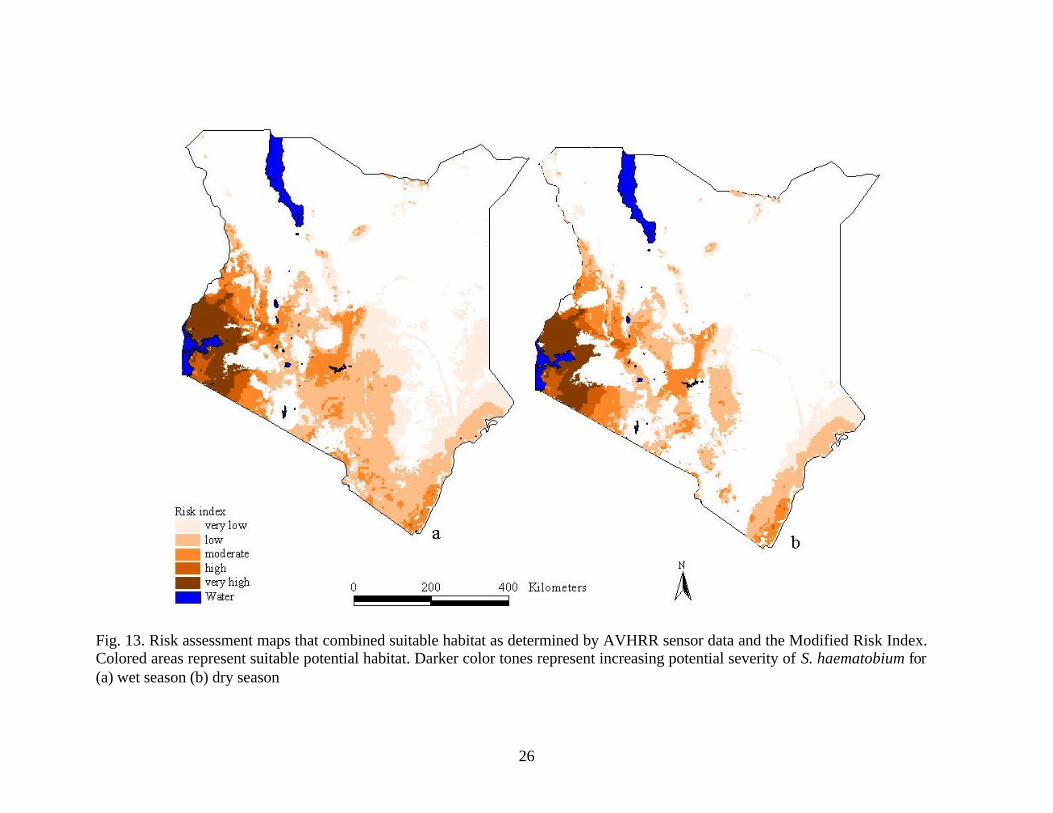
Use of GDD/Generations per Year and AVHRR Remote Sensing Models in Combination In the current study it was assumed that if the host was present in an area the
parasite could potentially also be found in the same area. The potential snail distribution,
as determined by the AVHRR results, was used as a mask to remove unsuitable areas
within the growing degree day model (Fig.12) and the modified heat stress model
(Fig.13) for both seasons. The purpose of using the potential snail habitat based on
AVHRR data as a mask over the GDD model and the modified heat stress model was to
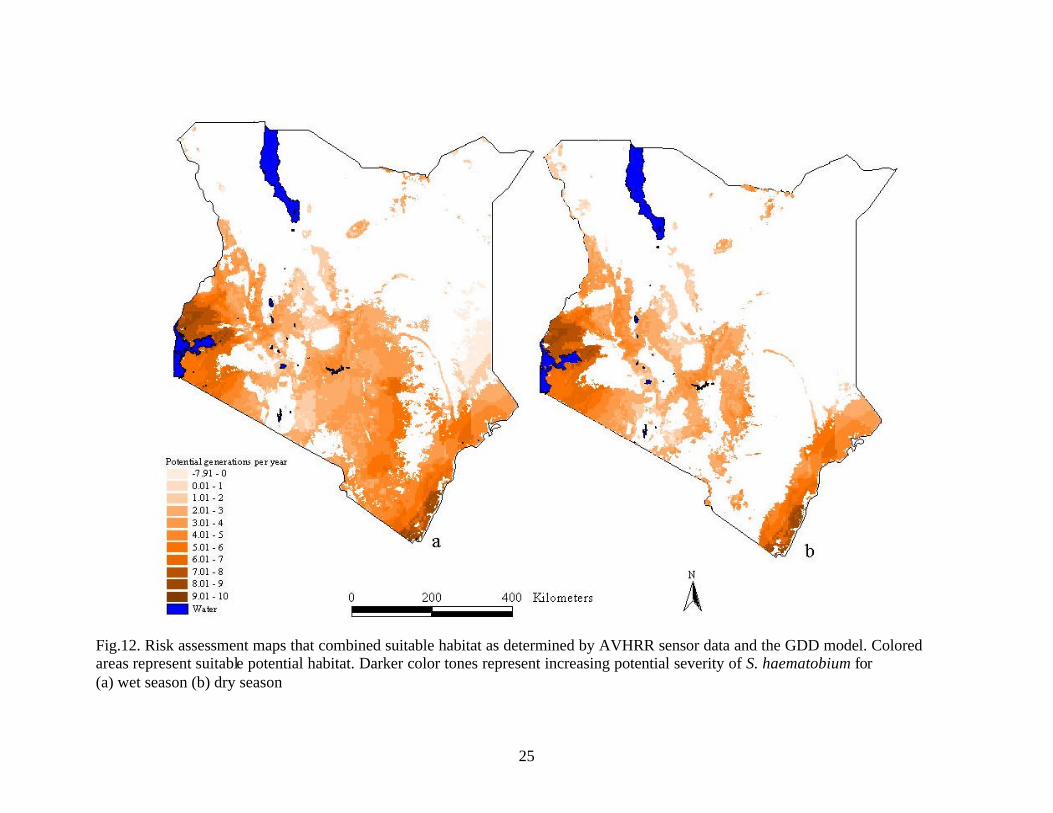
25
Fig.12. Risk assessment maps that combined suitable habitat as determined by AVHRR sensor data and the GDD model. Colored areas represent suitable potential habitat. Darker color tones represent increasing potential severity of S. haematobium for (a) wet season (b) dry season
26
Fig. 13. Risk assessment maps that combined suitable habitat as determined by AVHRR sensor data and the Modified Risk Index. Colored areas represent suitable potential habitat. Darker color tones represent increasing potential severity of S. haematobium for (a) wet season (b) dry season
27
show the potential snail habitat and the potential severity of the disease on one map. By
dividing results into seasons, the two distributions can be studied to aid in the
development or modification of control programs. The distribution, as determined based
on AVHRR data, represents the areas that are susceptible during a given time period. The
combination of AVHRR determined distribution zone, the mask of; unsuitable; areas, and
the modified heat stress model yielded the most accurate model for S. haematobium.
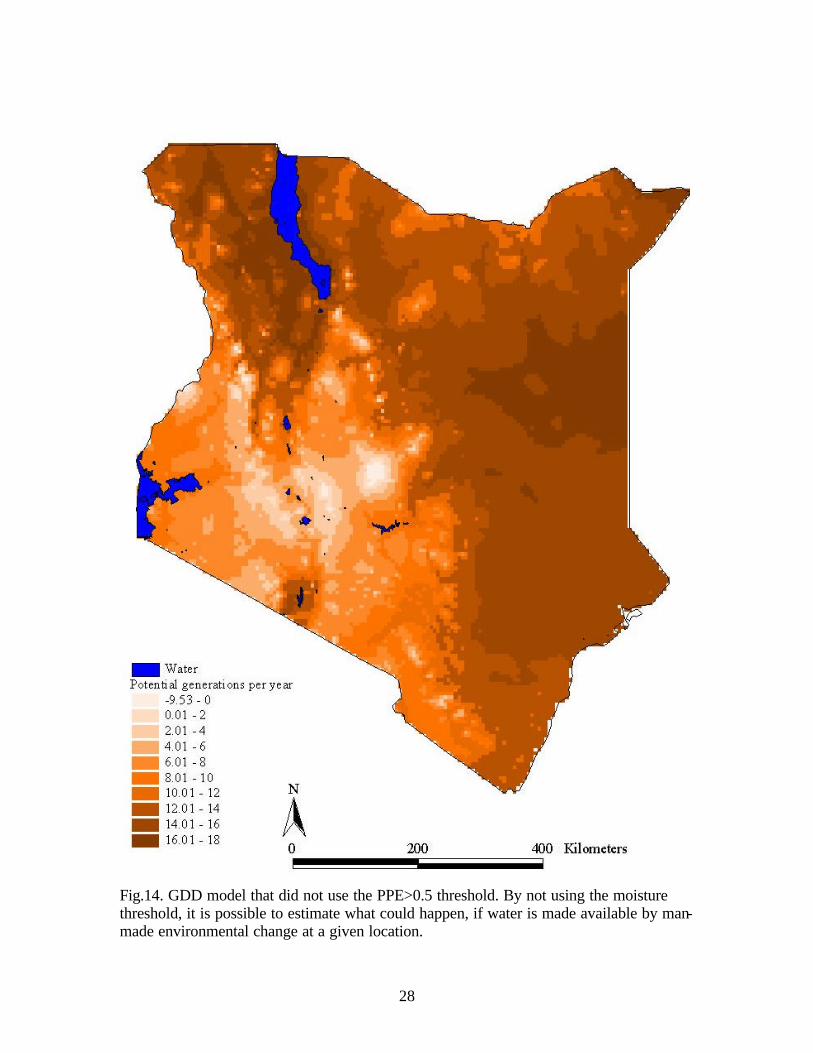
GDD Model for Water Development Schemes
When the water balance was not considered to be a limiting factor, the number of
potential generations per year ranged from -10 to +18 (Fig.14). The area surrounding
Lake Turkana and along the eastern border had the highest number of potential
generations starting with 13 and increasing to 18. These regions do not have enough
rainfall to sustain a snail population unless water was available through irrigation or other
water development projects. The highlands had less than 2 generations which does not
support intramolluscan development in the snail host. The area surrounding the highlands
along with the Lake Victoria Basin had 5 to 9 potential generations of S. haematobium
while the coast had 9 to 13 potential generations per year.
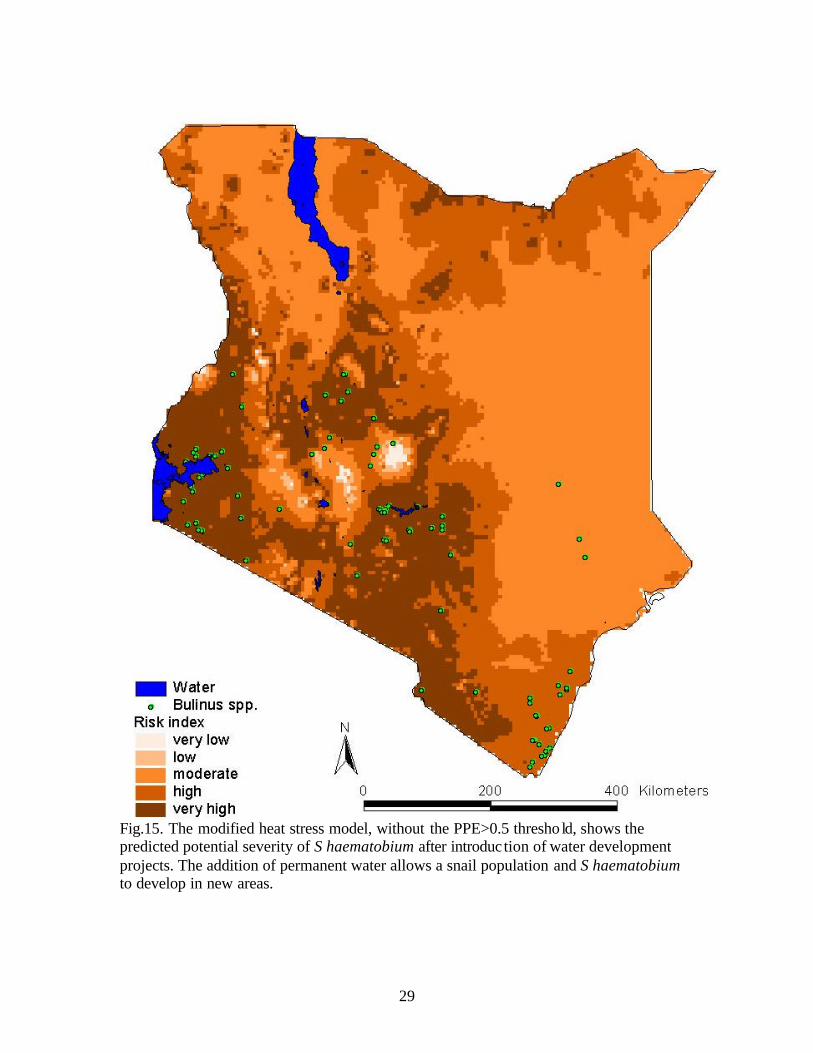
Modified Risk Index Model for Water Development Schemes
The modified risk index, when corrected for the effects of heat stress on the
development of the schistosome, had a risk index range of 0-84 with 0-28 (very low), 29-
45 (low), 46-54 (moderate), 55-67 (high), and 68-84 (very high) categories (Fig.15). The
areas of very high risk surround the Lake Victoria Basin and the highlands. Moderate and
low risk was found around Lake Turkana.
28
Fig.14. GDD model that did not use the PPE>0.5 threshold. By not using the moisture threshold, it is possible to estimate what could happen, if water is made available by man-made environmental change at a given location.
29
Fig.15. The modified heat stress model, without the PPE>0.5 thresho ld, shows the predicted potential severity of S haematobium after introduction of water development projects. The addition of permanent water allows a snail population and S haematobium to develop in new areas.
30
Discussion
The GDD/Generations per Year Model
The GDD/Generations per year model was based on the effects of temperature
conditional on presence of a soil moisture threshold PPE>0.5 on the development of S.
haematobium within the Bulinus snail host. Temperature and moisture are fundamental
determinants of the distribution and abundance of a species (Andrewartha and Burch,
1954). In the presence of adequate moisture, thermal regime is the driving force of
development, a factor that can be easily measured. Agriculturalists evaluating the
suitability of an area for specific crops routinely utilize the GDD method of measuring
the rate of development based on temperature above a species-specific ‘base temperature’
below which development does not occur. This method was adapted by Pflüger (1981) to
measure the rate of development of S.mansoni and S. haematobium within their
respective intermediate hosts. He described a minimum temperature threshold of 15.3oC
for S. haematobium in B.globosus (base temperature), a maximum temperature threshold
of 35oC (thermal death) and a linear relationship of increasing temperature and
development rate between the minimum and optimum 22°C temperatures (Fig.16).
Results of the GDD/Generations per year model indicate that areas with two potential
generations or less in the snail host have a very low or no chance of schistosome infection
in humans. This may be because the amount of time needed to complete this portion of
the life cycle takes more time than the life span of the snail (Anderson and May, 1979)
due to unfavorable temperature or lack of rainfall or because of temporal relationships of
non-consecutive ‘suitable’ periods of the year.
31
Fig.16. Linear relationship of temperature to the rate of S.mansoni development under conditions ranging from the minimum temperature required for development to the optimum temperature of 22°C (Pflüger, 1981). Modified Heat Stress Model
The effect of heat stress on diminishing life cycle suitability at higher temperature
regimes, a factor not considered in the initial GGD/Generations per year model, was
accounted for in a modified model in two ways: 1) reduced development at temperatures
over the optimum for S haematobium and 2) the sterilizing effect on Bulinus globosus
snail hosts at temperatures above 28.5oC.
Pflüger (1981) reported a suitable temperature range for S haematobium of
15.3°C to 33°C, with a optimum temperature of development of 22°C and described a
hyperbolic relationship between temperature and the length of the prepatent period in the
snail, ie. increasing or diminishing development suitability are observed below or above
the optimum temperature range (Fig.17). To account for this relationship, a stratified
growth curve was developed for the current studies to assign a numerical index value for
population. This is supported by field survey prevalence data as compared to 1992/1995
AVHRR annual composite Tmax values extracted from 5 km buffers centered on
S. haematobium prevalence survey sites by plotting prevalence values from the WHO
32
Fig.17. S. haematobium prevalence compared to annual average Tmax from AVHRR annual composite (1992/1995) maps for East Africa
atlas (Doumenge et al.,1987) against annual average Tmax over the entire East Africa
region (Fig.17).
The temperature ‘mask’ was developed within the GIS to show both areas and
times when monthly mean temperature was >28.5°C for at least 2 weeks during the
development period of snail host reproductive capacity. It was assumed that in areas
covered by the mask, the snails will either be aestivating or rendered reproductively
incompetent by temperature/moisture regime, with resultant ‘nul’ transmission potential.
AVHRR Remote Sensing Model
Tmax and NDVI are two factors that can be measured by using AVHRR satellite
sensor data to provide surrogate climate parameters that represent thermal-moisture
regimes important to the life cycle of snail host-parasite systems. Temperature alone can
be a limiting factor for potential snail habitat and no snails were found in areas with
temperatures >28.5°C based on the Tmax queries for either season (Fig.7). However this
is not the case for most of Kenya. The majority of Kenya fell within a suitable
temperature range for both the wet season and the dry season as determined by AVHRR
33
query analysis within ArcView 3.3; Tmax queries in fact resulted in an over prediction of
suitability in zones considered free of schistosomiasis (Doumenge et al., 1987) (Fig.8).
The use of NDVI as a surrogate of moisture regime, appeared to be a more
accurate limiting factor for snail distribution in Kenya based on GIS query analysis.
Suitable NDVI values were found in the highlands and along the coast during the dry
season (130-157) and throughout the south and the highlands during the wet season (125-
160). There was a difference between the pattern of the wet season and the dry season
queries, a reflection of the lack of rainfall during the dry season and the abundance of
rainfall during the wet season associated with both the position of the intertropical
convergence zone (Wu, 2003) and seasonal patterns of temperature. NDVI alone was not
a sufficiently accurate predictor and, like Tmax, over-predicted the endemic area.
In areas selected as suitable for the Bulinus-S. haematobium system using a
combination of Tmax and NDVI satellite sensor data, a query based on prediction of the
area where the suitability range of both NDVI and Tmax were met resulted in a modeled
distribution zone that included 90% of known suitable Bulinus habitat points for the wet
season and dry season (Fig.10). However, the resulting model based on AVHRR derived
Tmax and NDVI parameters did not differentiate relative risk within the query-predicted
area.
Ecological Niche Modeling
Until recently, most models dealing with the locations of snails and other
organisms had assumed a spatially uniform distribution within a selected study area
(Anderson and May,1979). Ecological niche modeling is a method used for finding
suitable host habitat that does not assume that the host has a uniform distribution.
34
Desktop GARP analyzes environmental factors in GIS grid format to create a preferred
habitat model. These factors may or may not have an impact on the geographical
distribution of a species (Peterson, 2002). Desktop GARP was used in the current study
to find suitable habitats for Bulinus spp. based on the 5km2 climate grid, and a 5km2
topographic grid taken from the ACT3.0 (Corbett 2002). This created an output of two
distributions which describe the wet season and a dry season distribution for Kenya (Fig.
11).
Use of AVHRR ‘climate surrogate’ data is another means of find suitable host
habitat. This method only uses a combination of Tmax and NDVI for model
development. A statistical program such as SAS or S-Plus must be used to provide
statistical validity to this method. Remotely sensed data is easier to collect than climate
data or other data used in the GARP program.
Water Management and Snail Control
Regional environmental factors used in this study accounted for less than one
third (29% or 27%) of the variation of disease risk using multiple-regression analysis
(Table 1, Table 2). Humans are able to adapt to a wide range of environments by building
shelters or adding water to arid areas. When water is introduced to arid areas, the
environments change and water is no longer a limiting factor. The major difference
between the GDD model and the modified heat stress model is best illustrated by looking
at the two models created for water developments. The GDD model still shows the Lake
Victoria Basin as being high risk. The region around Lake Turkana, and the eastern
border have become the areas with the highest risk, having 18 potent ial generations per
year (Fig.14). The modified heat stress model maintains that the Lake Victoria Basin is
35
still the highest risk; the very high risk class has expanded as compared to the model that
considers PPE>0.5 (Fig.6) but the overall pattern is the same (Fig.15).
The utility of this modified heat stress model for water development is
hypothetical and must wait for validation studies based on field experience. Water
management can reduce transmission in areas of flooding by directing the excess water to
more arid regions which causes a rapid spread of new habitat and snails (Kloos, 1985).
Use of dams to create a constant water level in channels has a great impact on the spread
of the snail host and increase of prevalence (Southgate, 2000, Sturrock, 1965). Man-made
habitats often provide ideal conditions for the introduction of parasitic diseases in
otherwise unfavorable regions (Hunter,1982). However, snails are able to move vertically
in water bodies seeking optimum temperatures (Marti, 1985). This movement allows
snails to survive at extreme temperatures in same locations depending on thermal flux
dynamics in irrigation water bodies.
Originally a highland model and a lowland model were going to be developed in
these studies based on the distribution of Bulinus globosus (highland) and Bulinus
physopsis (lowland) separated by Loker et al (1992). After performing the AVHRR
queries, it was discovered that there was no difference for Tmax and very little difference
for NDVI requirements for these two species. There was also little difference in
elevation between these two species. These two snails are now referred to as a single
group because of the similarities between these two Bulinus species. Classification of
Bulinus and other snail species is often controversial due to subspecies and varying
strains of the same snail (Kristensen, personal communication). Consideration of both
species combined led to the risk assessment maps produced by this project.
36
Limitations of This Study
A limitation of using 5km2 climate grid data is that there can be a tremendous
amount of variation of both climate and topography possible at regional scales. In
highland regions, for example, it is possible to have a difference in elevation of several
hundred meters within a 5km2 area and this difference in elevation affects temperature.
For each increase of 620 meters in elevation, the temperature decreases 2.1°C (Hardwick,
et al., 1996). Because of this, it is possible in some instances for the GDD/Generations
per year model to predict that it is not likely or impossible for S. haematobium to develop
in some grid cells even though the World Health Organization (WHO) has recorded that
the disease was there in earlier surveys.
The use of remotely sensed data may be of limited use for disease prediction
when dealing with water development projects. The AVHRR queries for Tmax showed
that most of Kenya is suitable for snail habitat and queries for NDVI showed a very
limited region that is suitable. The 5km2 climate grid and the AVHRR sensor are best
used on a regional or national scale. To accurately identify high risk zones found within
coarse (5km2) climate grids, higher resolution sensors such as Landsat TM or SPOT must
be used to create a city or village scale risk maps in future work.
37
Conclusions and Significance
The current work has resulted in the construction of two GIS risk assessment
models for S. haematobium in Kenya that we propose will be useful in predicting
potential risk of disease for control program management in Kenya:
1. GDD-Heat Stress Index: This risk assessment method utilizes a GDD-heat
stress model, conditional on soil moisture (PPE>0.5), to predict relative risk within the
potential seasonal distribution zones defined by AVHRR satellite sensor data (NDVI and
Tmax). The model was based on Bulinus spp. snail survey records and known
development requirements for S. haematobium within the current endemic area in Kenya.
2. GDD-Heat Stress Index for Water Developments: The GDD-Heat Stress Index
was modified to predict hypothetical risk of establishment of S. haematobium in future
water development schemes, assuming natural rainfall is no longer limiting. The model is
the same as the S. haematobium suitability model without consideration of the soil
moisture (PPE>0.5) limit or AVHRR potential distribution zones.
The GIS models incorporate innovative use of GDD-water budget concepts that
are used in crop production models, and apply a unique heat stress modifier methodology
to produce digital maps of the suitability of the environment for the Bulinus-S.
haematobium system in Kenya. Using the power of new GIS/RS tools, data from
excellent classical epidemiologic studies can now be systematically placed in an
environmental context and used to spatially define the ecological requirements of vector-
parasite systems and associated disease risk. Results can potentially be used to develop
future in real-time spatial decision support models for health care program management.
38
References
Abdel-Wahab, M., El-Sahly, A., Zakaria, S., Strickland, G., El-Kady, N., Ahmed, L.; 1979. Changing pattern of schistosomiasis in Egypt 1935-1979. The Lancet. 242-244.
Anderson, R., May, R.; 1979. Prevalence of schistosome infections within molluscan
populations:observed patterns and theoretical predictions. Parasitology. 79, 63-94. Andrewartha, H., Birch, L.; 1954. The distribution and abundance of animals. The
University of Chicago press, Chicago, Il, pp.160-169. Bavia, M., Hale, L., Malone, JB., Bruad, D., Shane, S.; 1999. Geographic Information
Systems and the Environmenal Risk of Schistosomiasis in Bahia, Brazil. The American Society of Tropical Medicine and Hygine. 60, 566-572.
Bergquist, NR. ; 2002. Schistosomiasis: from risk assessment to control. Trends in
Parasitology. 18, 309-314. Brooker, S., Rowlands, M., Haller, l., Savioli, L., Bundy, D.A.P.; 2000. Towards an atlas
of human helminth infection in sub-Saharan Africa: the use of Geographical Information Systems(GIS). Parasitology Today. 16, 303-307.
Brooker, S., Hay, S., Issae, W., Hall, A., Kihamia, C., Lwambo, N., Wint, W., Roger, D.,
Bundy, D.; 2001. Predicting the distribution of urinary schistosomiasis in Tanzania using satellite sensor data. Tropical Medicine and Internationa l Health. 6, 998-1007.
Brooker, S.; 2002. Schistosomes, snails and satellites. Acta Tropica. 82, 207-214. Corbett, JD., et al.; 2001. Almanac Characterization Tool v 3.0. A resource base for
characterizing the agricultural, natural and human environments of select African countries. Texas Agriculture Experiment Station, Texas A&M University, Blackland Research Center Report No. 01-08.
Crombie, MK., Gillies, RR., Arvidson, RE., Brookmeyer,P., Weil, GJ., Sultan,M., Harb,
M.; 1999. An application of remotely derived climatological fields for risk assessment of vector-borne disease: A spatial study of filariasis prevalence in the Nile Delta, Egypt. Photogrammetric Engineering & Remote Sensing. 65, 1401-1409.
Cross, E., Perrine, R.; 1984. Predicting areas endemic for schistosomiasis using weather
variables and a Landsat data base. Military Medicine. 149, 542-544.
39
Doumenge, J., Mott, K., Cheung, C., Villenave, D., Chapuis, O., Perrin, M., REaud-Thomas, G.; 1987. Atlas of the global distribution of schistosomiasis. Presses Univeritaires de Bordeaux. Talence Cedex, France.
Hardwick, S., Holtgrieve, D.; 1996. Geography for Educators. Prentice-Hall. Upper
Saddle River, NJ. pp. 92. http://edcdaac.usgs.gov/1KM/1kmhomepage.html 2002. http://martin.parasitology.mcgill.ca/jimspage/biol/schisto.htm November 2003. Huh, OK, Malone, JB.; 2001. New tools:potential medical applications of data from new
and old environmental satellites. Acta Tropica. 79:35-47. Hunter, J., Rey, L., Scott, D.; 1982. Man-made lakes and man-made diseases. Society of
Medicine.16, 1127-1145. Kitron, U. 2000. Risk maps: transmission and burden of vector-borne diseases. Parasitology Today. 16, 324-325. Kloos, H., Lemma, A.; 1977. Schistosomiasis in irrigation schemes in the Awash Valley,
Ethiopia. American Journal of Tropical Medicine and Hygiene. 26, 899-908. Kloos, H.; 1985. Water resources development and schistosomiasis ecology in the Awash
Valley, Ethiopia. Society of Science Medicine. 20, 609-625. Kloos, H., Lo, C., Birrie, H., Ayele, T., Tedla, S., Tsegay, F.; 1988. Schistosomiasis in
Ethiopia. Social Science and Medicine. 26, 803-827. Kloos, H.;1990. Health aspects of resettlement in Ethiopia. Social Science and Medicine.
30,643-656. Lengeler, C., Utzinger, J., Tanner.; 2002. Questionares for rapid screening of
schistosomiasis in sub-Saharan Africa. Bulletin of the World Health Organization. 80,235-242.
Loker, E., Hofkin, B. , Mkoji, G., Mungai, B., Kihara, J., Koech, D. ; 1993. Distribution
of freshwater snails in southern Kenya with implications for biological control of Schistosomiasis and other snail-mediated parasites. Journal of Medical & Applied Malacol. 5, 1-20.
Loslier, L 1995, Geographical Information Systems (GIS) From a Health Perspective.
http://www.idrc.ca/books/focus/766/loslier1.html Malek, A. ; 1958 Factors conditioning the habitat of Bilharziasis intermediate hosts of the
family planorbidae. Bulletin of the World Health Organization. 18, 785-818.
40
Malone, J., Huh, O., Fehler, D., Wilson, P., Wilensky, D., Holmes, R., Elmagdoub,
A.;1994. Temperature data from satellite imagery and the distribution of schistosomiasis in Egypt. American Journal of Tropical Medicine. 50; 714-722.
Malone, JB.; 1995.The geographic understanding of snail borne disease in endemic areas using satellite surveillance. Mern Inst Oswaldo Cruz. 90(2):205-209.
Malone,JB., Abdel-Rahman,MS., Bahy, M.M.El, Huh, Ok., Shafik, M., Bavia, M.; 1997. Geographic Information Systems and the distribution if Schistosoma mansoni in the Nile Delta. Parasitology Today. 13, 112-119.
Malone, JB., Bergquist, NR., Huh, OK., Bavia, ME., Bernardi, M., Bahy, M.M.El, Fuentes, MV., Kristensen, TK., McCarroll, JC., Yilma, JM., Zhou, XN.; 2001. A global network for the control of snail-borne disease using satellite surveillance and geographic information systems. Acta Tropica. 79, 7-12.
Malone, JB, McCarroll, JC, Kristensen, TK, Yilma, JM, Erko, B, El-Bahy, MM, Corbett, JD.; 2001. Minimum Medical Database Spatial Decision Support System
for the Inter Governmental Authority on Development –Nile Basin Region (IGAD/Nile). Manual and CDrom, 49.
Malone, JB, Corbett, JD.; 2002. Spatial decision Support Systems and Control of
schistosomiasis in Africa. Final Report USAID/EGAT/AFS/GISD. January 2003. Malone, JB.. Poggi, E., Igualada, F., Sintasath D., Ghebremeskel, T., Corbett, J.,
McCarroll, J., Chinnici, P., Shililiu, J., McNally, K., Downer, R., Perich, M., Ford, R.; 2003. Malaria environmental risk assessment in Eritrea. Proceedings IGARRS, Toulouse.
Marti, H., Tanner, M., Degremont, A., Freyvogel, T.; 1985. Studies on the ecology of
Bulinus globosus, the intermediate host of Schistosoma haematobium in the Ifakara area, Tanzania. Acta Tropica. 42, 171-187.
Mukaratirwa, S., Malone, J., McCarroll, J., Dristensen, T.; 1999. Satellite surveillance,
geographic information systems and the seasonal suitability of environment for the development of the snail-parasite system of urinary and intestinal schistosomiasis in Zimbabwe. Proceedings “Workshop on medical and veterinary malacology in Africa”, Zimbabwe, 265-271.
O’Keeffe, JH. 1985. Population biology of the freshwater snail Bulinus globosus on the
Kenya coast .1. Population fluctuations in relation to climate. Journal of Applied Ecology. 22, 73-84.
41
Peterson, A., Sanchez-Cordero, V., Beard, C. Ramsey, J.; 2002. Eclogical niche modeling and potential reservoirs for Chagas Disease in Mexico. Emerging Infectious Diseases. 8, 662-667.
Peterson, A, Vieglais, D, Andreasen, J.; 2003. Migratory birds modeled as critical
transport agents for West Nile Virus in North America. Vector-Borne and Zoonotic Diseases. 3, 27-37.
Pflüger, W.; 1981. Experimental epidemiology of Schistosomiasis. Parasitenkunde. 66,
221-229. Ross, A., Bartley, P., Sleigh, A., Olds, G., Li, Y., Williams, G., McManus, D.; 2002.
Current concepts- Schistosomiasis. New England Journal of Medicine. 346, 1212-1220.
Southgate, VR.; 1997. Schistosomiasis in the Senegal River Basin: before and after the
construction of the dams at Diama, Senegal and Manantali, Mali and future prospects. Journal of Helminthology. 71, 125-132.
Southgate, VR., Tchuente, L., Sene, M., Clercq, D., Theron, A., Jourdame, J., Webster,
B., Rollinson, D., Gryseels, B., Vercruysse, J.; 2001. Studies on the biology of schistosomiasis with emphasis on the Sengal River Basin. Mern Inst Oswaldo Cruz. 96, 75-78.
Sturrock, R.; 1965. The development of irrigation and its influence on the transmission of
bilharziasis in Tanganyika. Bulletin of the World Health Organization. 32, 225-236. Thompson D.L., Malone, JB., Harb, M., Faris, R., Huh, OK., Buck, AA., Cline, BL.;
1996. Bancroftian filariasis dis tribution in the Southern Nile Delta: Correlation with diurnal temperature difference maps from satellite imagery. Emerging Infectious Diseases 2, 234-235.
Woolhouse, M., Chandiwana, S.; 1990. Temporal patterns in the epidemiology of
schistosome infections of snails: a model for field data. Parasitology. 100, 247-253.
Woolhouse, M., Chandiwana, S.; 1990. Population dynamics model for Bulinus globosus,
intermediate host for Schistosoma haematobium, in river habitats. Acta Tropica. 47, 151-160.
Wu, X., Liang, X., Zhang, G.; 2003. Seasonal migration of ITCZ precipitation across the
equator: Why can’t GCMs simulate it?. Geophysical Research Letters. 30, 15.
42
Vita Kelsey McNally was born in 1980 in Memphis, Tennessee, to a loving mother
Molly McNally and sister Lacey McNally. He was active in the Boy Scouts and achieved
the rank of Eagle Scout in December of 1995. In 1998 he graduated from Houston High
School in Germantown, Tennessee, and began college that summer. He attended the
University of Memphis where he played tuba in the “Mighty Sound of the South”
marching band for 2 years. During the summer of 2000, Kelsey taught English as a
second language in the Czech Republic and in China that fall. He returned to school in
2001. In the fall of 2001, Kelsey graduated cum luade from the University of Memphis in
the fall of 2001 with a Bachelor of Arts degree. While working on a degree in geography,
he participated in a study on the erosion effect of channalized streams compared to
nonchannalized streams. He then enrolled at the Louisiana State University School of
Veterinary Medicine in the spring of 2002 to pursue a Master of Science degree focusing
on environmental parasitology. Since his enrollment he as worked on several projects
dealing with different diseases in East Africa and Latin America.