Embed Size (px)
Citation preview

Developing Proposed Layout … (Johan Oscar Ong; Cornellia) 151
DEVELOPING PROPOSED LAYOUT FOR INCREASING LINE EFFICIENCY ON BODYSHOP
Johan Oscar Ong; Cornellia
Faculty of Technology, Industrial Engineering Department, President University Jl. Ki Hajar Dewantara, Kota Jababeka,Cikarang, Bekasi - Indonesia 17550
ABSTRACT
Recently, an imbalance workstation in assembly line is one of the critical problems faced by many companies. Many researches have proposed various designs of assembly line balancing to solve this problem. This research compared straight line balancing and u-shaped line balancing which both had the same target to minimize the workstations. The result showed that u-shaped line balancing provided a better solution than the straight line balancing did in number of workstation. Straight line balancing utilized rank positional weight (RPW) whereas u-shaped line balancing utilized Critical Task Method (CTM). Significantly, u-shaped line balancing was more efficient than straight line balancing. Keywords: assembly line balancing, straight line balancing, u-shaped line balancing, rank positional weight (RPW), critical task method (CTM)
ABSTRAK
Workstation yang tidak seimbang dalam jalur perakitan adalah salah satu masalah penting yang dihadapi oleh banyak perusahaan. Banyak penelitian telah mengusulkan berbagai desain penyeimbangan jalur perakitan untuk memecahkan masalah ini. Penelitian ini membandingkan penyeimbangan jalur lurus dan penyeimbangan jalur berbentuk U yang keduanya memiliki target yang sama yaitu meminimalkan workstation. Hasil penelitian menunjukkan bahwa penyeimbangan jalur berbentuk U memberikan solusi yang lebih baik daripada penyeimbangan jalur lurus dalam jumlah workstation. Penyeimbangan jalur lurus menggunakan utilized rank positional weight (RPW) sedangkan penyeimbangan jalur berbentuk U menggunakan critical task method (CTM). Secara signifikan, penyeimbangan jalur berbentuk U lebih efisien daripada penyeimbangan jalur lurus. Kata kunci: perakitan balancing, lurus line balancing, u-berbentuk line balancing, rank positional weight (RPW), Critical Task Method (CTM)

152 INASEA, Vol. 14 No.2, Oktober 2013: 151-176
INTRODUCTION
Automotive company is developing rapidly. It leads the BodyShop business be a promising business because the automotive company could not stand itself without the activities of BodyShop Business. There are three kinds of BodyShop’s activities: light repair, medium repair, and heavy repair. The standard time for light damage (one to three panels) is one to three days. For medium damage (four to six panels) is 3 to 5 days and for the heavy damage (≥ seven panels) is 5 days to 2 weeks. In fact, the actual repair time for light damage is 4.44 business days (more than 3 business days) and for medium damage is 7.02 business days (more than 5 business days). Thus, the line efficiency of BodyShop is low.
The line of BodyShop is not balance, it makes many vehicles got stuck when entering the
stalls. There are two types of assembly line balancing that matches for the condition of BodyShop; straight line balancing and u-shaped line balancing. Straight line balancing is a balance production line where stations are arranged consecutively in a line by grouping tasks into stations while moving forward through a precedence diagram using Rank Positional Weight. On the other hand, u-shaped line balancing is a balance production line arranged by assigning tasks into stations while moving forward, backward, or simultaneously in both directions through the precedence diagram by using Critical Task Method.
This research compares straight line balancing and u-shaped line balancing. The objective is to
minimize the workstations, and then to find which line balancing is better to be implemented at BodyShop Business.
METHOD
Designing Assembly Line Balancing Standard Time (Time Study)
There are three kind of test to prove the observation’s data is valid. First is normality test. If confidence interval construction is about unknown population mean μ
based upon the calculation of a point estimate and level of confidence, hypothesis testing allows an experimenter to assess the plausibility and credibility of a specific statement (Hayter, 2000). H0 : The data is normally distributed HA : The data is not normally distributed
Walpole, et al. (2002) puts the rules of p-value to take the statistical inference data:
If p-value ≤ α, reject the null hypothesis. If p-value > α, fail to reject the null hypothesis.
Second is uniformity test. There are several steps to determine the uniformity of a set of data:
Calculate average observed time (x) for each operation.
(1)
Calculate the standard deviation (s) of each operation.
∑
Developing Proposed Layout … (Johan Oscar Ong; Cornellia) 153
(2)
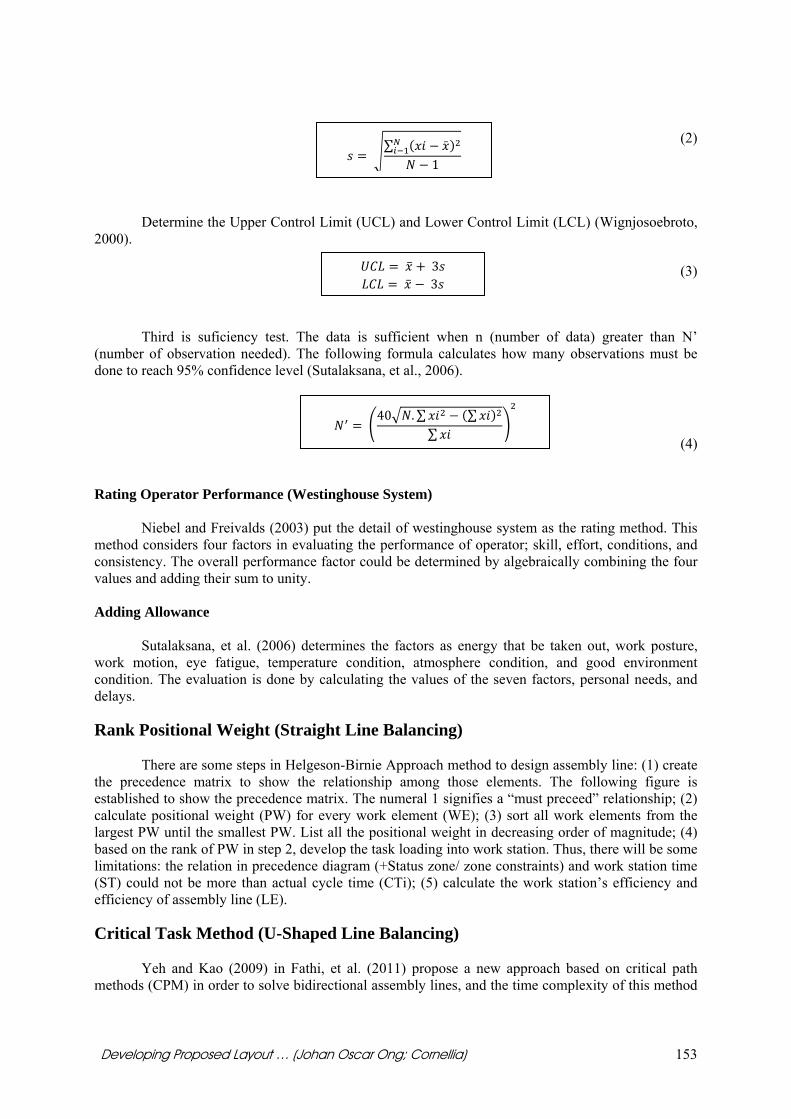
Determine the Upper Control Limit (UCL) and Lower Control Limit (LCL) (Wignjosoebroto,
2000).
(3)
Third is suficiency test. The data is sufficient when n (number of data) greater than N’
(number of observation needed). The following formula calculates how many observations must be done to reach 95% confidence level (Sutalaksana, et al., 2006).
(4)
Rating Operator Performance (Westinghouse System) Niebel and Freivalds (2003) put the detail of westinghouse system as the rating method. This
method considers four factors in evaluating the performance of operator; skill, effort, conditions, and consistency. The overall performance factor could be determined by algebraically combining the four values and adding their sum to unity. Adding Allowance
Sutalaksana, et al. (2006) determines the factors as energy that be taken out, work posture, work motion, eye fatigue, temperature condition, atmosphere condition, and good environment condition. The evaluation is done by calculating the values of the seven factors, personal needs, and delays. Rank Positional Weight (Straight Line Balancing)
There are some steps in Helgeson-Birnie Approach method to design assembly line: (1) create
the precedence matrix to show the relationship among those elements. The following figure is established to show the precedence matrix. The numeral 1 signifies a “must preceed” relationship; (2) calculate positional weight (PW) for every work element (WE); (3) sort all work elements from the largest PW until the smallest PW. List all the positional weight in decreasing order of magnitude; (4) based on the rank of PW in step 2, develop the task loading into work station. Thus, there will be some limitations: the relation in precedence diagram (+Status zone/ zone constraints) and work station time (ST) could not be more than actual cycle time (CTi); (5) calculate the work station’s efficiency and efficiency of assembly line (LE).
Critical Task Method (U-Shaped Line Balancing)
Yeh and Kao (2009) in Fathi, et al. (2011) propose a new approach based on critical path
methods (CPM) in order to solve bidirectional assembly lines, and the time complexity of this method
40 . ∑ ∑∑
∑1
3 3

154 INASEA, Vol. 14 No.2, Oktober 2013: 151-176
is only O(mn2), meaning that this method can be solved within a polynomial-time. Because of the advantage of less time complexity, the effective heuristic method is presented which is based on combining the proposed approach by Yeh and Kao (2009) and the well-known rank positional weight technique (RPW) introduced by Helgeson and Birnie (1961) to solve U-shape assembly line problems in the area of type-1.
There are several steps to do the Critical Task Method CTM. First is calculating minimum
feasible number of workstation S and the minimum feasible cycle time MCT and the adjusted value of CT* = (MCT + CT) / 2
Second is creating a new workstation. Then, calculate the weight for each task in two stages,
one time from the forward direction and another time from the backwards direction. And then, identify activities permitted for assigning and creating a candidate list.
The third step is assigning activities with high weight on the candidate list. Iif there are two or
more activities with the same weight, one can be selected to be assigned at random. This order in each stage is continued by finding the new weight for each task using the critical path. When solving U-shape line, the tasks' weight should be updated in forward direction if the assigned task is from the end of network. Otherwise, the tasks' weight in the backward direction should be recalculated until all the activities are assigned to the workstations.
The fourth step is calculating the remaining time for the current station and updating the
candidate list based on the new calculated weights and constraints. If the station has enough time for any feasible unassigned task, back to step 3, otherwise go to step 5. The fifth step is repeat assigning process until no tasks are left. If there are unassigned tasks, back to step 2. Activity Relationship Chart
Activity Relationship Chart (ARC) can be defined as the maping of activity relation that
describe the closeness degree of every facility. Mulyati and Rachmi (2011) set the main goal of ARC is to identify the relationship closeness of each group’s activity in terms of factory organization. There are six symbols of ARC’s closeness degree (Table 1).
Table 1 Table closeness degree
Code Closeness Degree
A Absolutely necessary E Especially important I Important O Ordinary closeness OK X Undesirable U Unimportant
The dimensionless block diagram is the first attempt and the result of the ARC. This layout
will be the basis for the master layout and plot plan. The following table is the position requirements of placing the relationship codes (Table 2).
Table 2 Position in dimensionless block diagram
Code Position
A in the top left-hand corner E top right corner I bottom left corner

Developing Proposed Layout … (Johan Oscar Ong; Cornellia) 155
O bottom right corner U relationship omitted X in the center under the department number
Bonferroni Approach In Harrell et al. (2012), the statistical methods for making the comparison of system are called
hypotheses tests. One of the methods that could be used is Bonferroni Approach. When there are three to about five alternative system designs to compare with respect to some performance measure, the Bonferroni approach is the method to solve it. Given K alternative system designs to compare, the null hypothesis H0 and alternative hypothesis H1 become :
H0: µ = µ = µ = . . . . = µ μ for K alternative systems H1: µ ≠ µ for at least one pair i ≠ i’ where i and i’ are between 1 and K and i < i’.
The number of pairwise comparisons for K candidate designs is computed by K(K – 1) / 2.
Model Verification and Model Validation
There is a way to do the model verification; using trace and debugging facilities. Comparing
with the actual system is one of the techniques that could be used to validate the model. Using the paired-t test for comparing the model with the actual system. In paired-t test, it is necessary for testing the hypotheses;
H0: µ µ = 0 H1: µ µ ≠ 0
Thus, the paired-t confidence interval for an α level of significance is P(x – hw ≤ µ ≤ x + hw) = 1 – α
Mathematics
There are three parameters in designing the assemly line balancing. First is the efficiency of
assembly line (ratio between total workstation time and multification of cycle time and number of workstations).
LE = ∑ x 100% (K) (CT) (5)
LE = efficiency of assembly line STi = workstation time i K = number of workstations CT = cycle time Second is the smoothness index (index that shows the relative smoothness of the assembly line).
SI = ∑ 2 (6)
SI = smoothness index STmax = maximum workstation time STi = workstation time i Third is the balance delay (the rate of delay).
BD =(K) (STmax) – ∑ x 100% (K) (STmax) (7)
BD = balance delay K = number of workstation
156
STmax =ti =
Actual A
facts abowas rougstudy (re
No
1 2 3 4 5 6
7
8
T
LE = (K) = = 46,
T
= maximum = work elem
l Condition
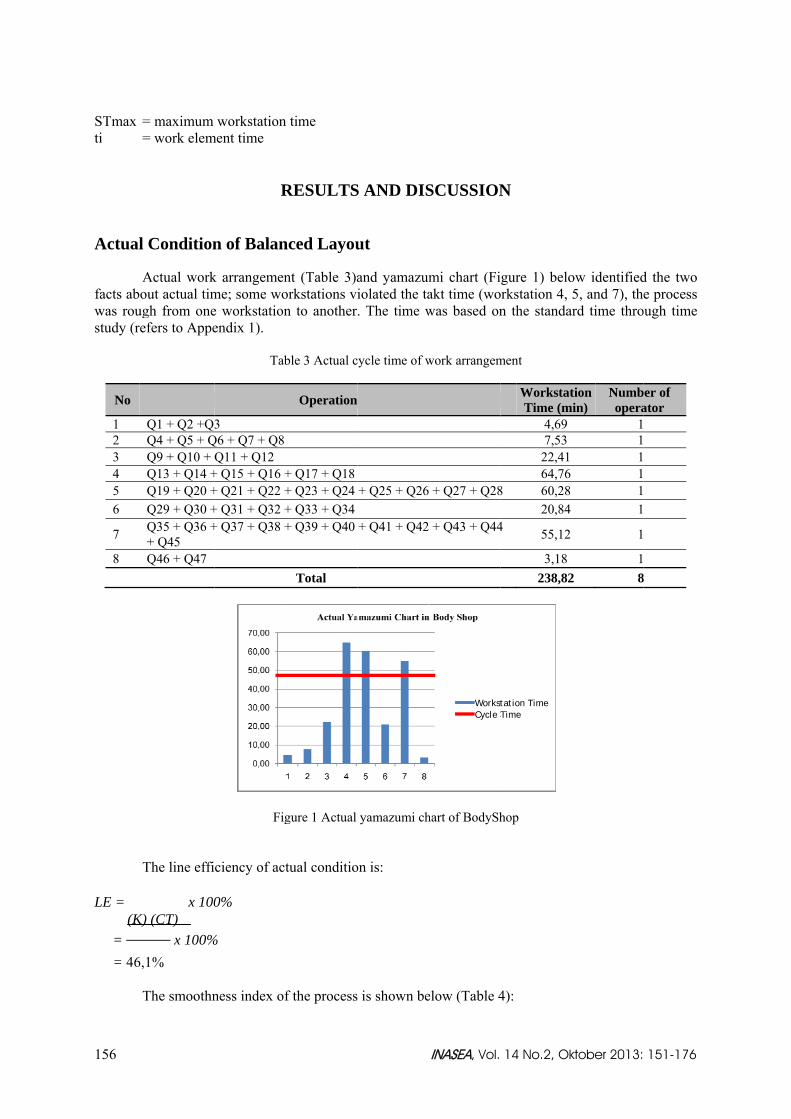
Actual workout actual timgh from oneefers to Appe
Q1 + Q2 +Q3Q4 + Q5 + QQ9 + Q10 + Q13 + Q14 +Q19 + Q20 +Q29 + Q30 +Q35 + Q36 ++ Q45 Q46 + Q47
The line effi
x 100) (CT)
x 100%,1%
The smoothn
workstationment time
R
n of Balan
k arrangemenme; some woe workstationendix 1).
Tab
3 Q6 + Q7 + Q8
Q11 + Q12 + Q15 + Q16 ++ Q21 + Q22 ++ Q31 + Q32 ++ Q37 + Q38 +
Fig
ciency of act
0%
%
ness index of
n time
RESULTS
nced Layou
nt (Table 3)aorkstations vin to another
ble 3 Actual c
Operation
+ Q17 + Q18+ Q23 + Q24 + Q33 + Q34+ Q39 + Q40
Total
gure 1 Actual
tual conditio
f the process
S AND DIS
ut
and yamazumiolated the ta. The time w
cycle time of w
+ Q25 + Q26
+ Q41 + Q42
yamazumi ch
on is:
is shown be
INASEA, Vol.
SCUSSION
mi chart (Fiakt time (wowas based on
work arrangem
+ Q27 + Q28
+ Q43 + Q44
hart of BodySh
elow (Table 4
WorkstCycle T
14 No.2, Ok
N
gure 1) beloorkstation 4, n the standa
ment
WorkstatTime (m
4,69 7,53 22,41 64,76
8 60,28 20,84
4 55,12
3,18 238,82
hop
4):
tation Time Time
ktober 2013:
ow identified5, and 7), thrd time thro
tion min)
Numbopera
111111
1
12 8
151-176
d the two e process
ough time
ber of ator
8

Developing Proposed Layout … (Johan Oscar Ong; Cornellia) 157
Table 4 Smoothness Index of Bodyshop
Operator STi (STmax-STi)2
1 4,69 3608,79 2 7,53 3274,80 3 22,41 1793,21 4 64,76 0,00 5 60,28 20,06 6 20,84 1928,91 7 55,12 92,89 8 3,18 3792,13
Total 14510,79 Smoothness Index 120,46
Due to bottleneck and idle time occured in the BodyShop line, delays came up. The value of
delay was: BD =(K) (STmax) – ∑ x 100% (K) (STmax) = , ,
, 100%
= 53,9% Simulation
The picture below showed the layout of location constructed (Figure 2).
Figure 2 Display of location for current line
Table 5 showed the process and routing of the current line’s simulation.
Table 5 Process of current line
Process Routing Entity Location Operation Output Destination Rule Move Logic
Car Enter Car Operator_1 FIRST 1 MOVE FOR 4 MIN

158 INASEA, Vol. 14 No.2, Oktober 2013: 151-176
Car Operator_1 WAIT N(4.69,5) MIN Car Operator_2 FIRST 1 MOVE FOR 4 MIN
Car Operator_2 WAIT N(7.53,5) MIN Car Operator_3 FIRST 1 MOVE FOR 4 MIN
Car Operator_3 WAIT N(22.41,5) MIN Car Operator_4 FIRST 1 MOVE FOR 4 MIN
Car Operator_4 WAIT N(64.76,5) MIN Car Operator_5 FIRST 1 MOVE FOR 4 MIN
Car Operator_5 WAIT N(60.28,5) MIN Car Operator_6 FIRST 1 MOVE FOR 4 MIN
Car Operator_6 WAIT N(20.84,5) MIN Car Operator_7 FIRST 1 MOVE FOR 4 MIN
Car Operator_7 WAIT N(55.12,5) MIN Car Operator_8 FIRST 1 MOVE FOR 4 MIN
Car Operator_8 WAIT N(3.18,5) MIN INC Finished_Repair Car EXIT FIRST 1 MOVE FOR 4
MIN The trace below shows that the entity or sequence of events follow the behavior that would
occur in the actual system (model verification) (Figure 3).
Figure 3 Trace listing of current line Model validation is tested by using paired-t (comparing with actual system of BodyShop).
Below is the calculation of paired-t confidence intervals. Comparing μ(A-C): α 0.05 The approximate 95% confidence interval:
hw = , .
√
hw = . .√
0.43 – 0.56 ≤ μ(A – C) ≤ 0.43 + 0.56 hw = 0.56 unit per hour -0.12 ≤ μ(A – C) ≤ 0.99 Given that the confidence interval about μ(A – C) includes zero, it is concluded that there was no
significant difference in the mean throughput produced by Actual System (μA) and Current Line in

Developing Proposed Layout … (Johan Oscar Ong; Cornellia) 159
ProModel (μC). Thus, the model of current line in ProModel is right (validation and verification). There were 7.48 finished repair vehicles that are found in the finished stall. This is the output of current line in the simulation.
Layout of Proposed Straight Line Rank Positional Weight
Below is the example of calculating positional weight for Q1 based on precedence diagram
(refers to Appendix 2). Since Q1 precedes all operations except Q22, Q26, Q32, and Q45, the operational weight of Q1 is:
∑1, 2, 3, 4, 5, 6, 7, 8, 9, 10, 11, 12, 13, 14, 15, 16, 17,
18, 19, 20, 21, 23, 24, 25, 27, 28, 29, 30, 31, 33, 34,35, 36, 37, 38, 39, 40, 41, 42, 43, 44, 46, 47
=0,92+1,34+2,44+1,50+1,84+2,76+1,09+0,36+2,01+7,74+3,23+9,44+5,19+0,84+44,38+1,52+11,72+1,12+4,74+2,58+0,63+0,50+1,40+2,63+10,09+34,85+1,92+3,87+3,64+4,93+2,65+3,01+6,94+2,41+7,95+3,68+2,04+13,31+1,93+5,60+2,79+1,77+1,41 = 226.66
Calculation table and the application of RPW are attached in Appendix 3. Then the data is
used as the basis in determining the work arrangement between operators. Work Arrangement
The table below is the work arrangement of straight line balancing based on RPW (Table 6),
generating Yamazumi Chart on Figure 4.
Table 6 Proposed work arrangement of straight line (RPW)
Workstation Operation Workstation Time (min)
Number of
operator
1 Q1 + Q2 + Q3 + Q4 + Q5 + Q6 + Q7 + Q8 + Q9 + Q10 + Q11 + Q12 + Q13 39,52 1
2 Q14 + Q15 + Q16 46,74 1
3 Q17 + Q18 + Q19 + Q20 + Q21 + Q22 + Q23 + Q24 + Q25 26,2 1
4 Q26 + Q27 + Q28 46,92 1
5 Q29 + Q30 + Q31 + Q32 + Q33 + Q34 + Q35 + Q36 + Q37 + Q38 + Q39 44,84 1
6 Q40 + Q41 + Q42 + Q43 + Q44 + Q45 + Q46 + Q47 34,32 1 TOTAL 238,54 6
Figure 4 Yamazumi Chart of proposed straight line
160 INASEA, Vol. 14 No.2, Oktober 2013: 151-176
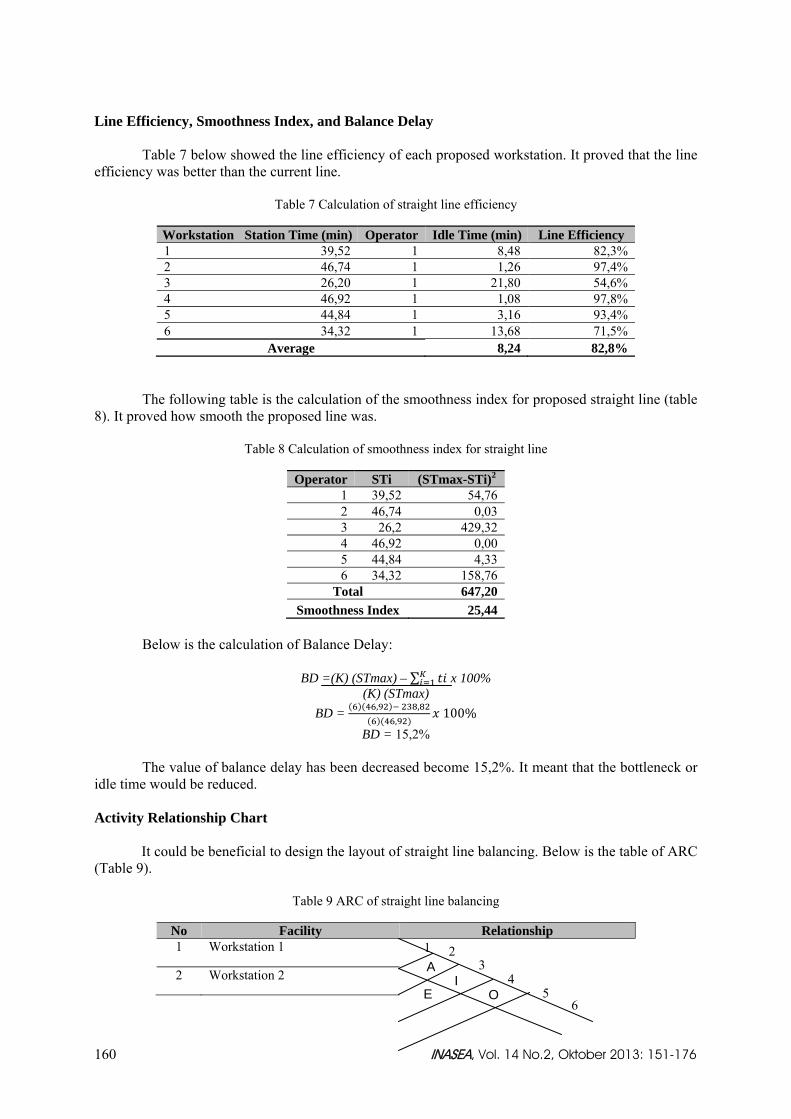
Line Efficiency, Smoothness Index, and Balance Delay Table 7 below showed the line efficiency of each proposed workstation. It proved that the line
efficiency was better than the current line.
Table 7 Calculation of straight line efficiency
Workstation Station Time (min) Operator Idle Time (min) Line Efficiency 1 39,52 1 8,48 82,3% 2 46,74 1 1,26 97,4% 3 26,20 1 21,80 54,6% 4 46,92 1 1,08 97,8% 5 44,84 1 3,16 93,4% 6 34,32 1 13,68 71,5%
Average 8,24 82,8%
The following table is the calculation of the smoothness index for proposed straight line (table 8). It proved how smooth the proposed line was.
Table 8 Calculation of smoothness index for straight line
Operator STi (STmax-STi)2
1 39,52 54,76 2 46,74 0,03 3 26,2 429,32 4 46,92 0,00 5 44,84 4,33 6 34,32 158,76
Total 647,20 Smoothness Index 25,44
Below is the calculation of Balance Delay:
BD =(K) (STmax) – ∑ x 100% (K) (STmax)
BD = , ,,
100% BD = 15,2%
The value of balance delay has been decreased become 15,2%. It meant that the bottleneck or
idle time would be reduced. Activity Relationship Chart
It could be beneficial to design the layout of straight line balancing. Below is the table of ARC
(Table 9).
Table 9 ARC of straight line balancing
No Facility Relationship 1 Workstation 1
2 Workstation 2
6 5
43
21
E OI
A

Developing Proposed Layout … (Johan Oscar Ong; Cornellia) 161
3 Workstation 3
4 Workstation 4
5 Workstation 5
6 Workstation 6
Below is the dimensionless block diagram (layout) for straight line balancing (Figure 5).
Figure 5 Dimensionless block diagram of straight line balancing
Simulation There were three model system designs of proposed straight line; system 1 with 15 operators
(station 1= 2opt, station 2= 3opt, station 3= 2opt, station 4= 3opt, station 5= 3opt, station 6= 2opt), system 2 with 16 operators (station 1= 2opt, station 2= 3opt, station 3= 2opt, station 4= 3opt, station 5= 3opt, station 6= 3opt), and system 3 with 15 operators (station 1= 3opt, station 2= 3opt, station 3= 2opt, station 4= 3opt, station 5= 3opt, station 6= 2opt). Using the benferroni approach to compare these systems. Below was the calculation of paired-t confidence intervals. Comparing μ(1-2): α1 0.02 The approximate 98% confidence interval:
hw = , .
√
hw = . .√
-0.48 – 0.38 ≤ μ(1 – 2) ≤ -0.48 + 0.38 hw = 0.38 unit per hour -0.86 ≤ μ(1 – 2) ≤ -0.10
Comparing μ(1-3): α2 0.02 The approximate 98% confidence interval:
hw = , .
√
hw = . .√
-0.91 – 0.59 ≤ μ(1 – 3) ≤ -0.91 + 0.59 hw = 0.59 unit per hour -1.50 ≤ μ(1 – 3) ≤ -0.32
Comparing μ(2-3): α1 0.02 The approximate 98% confidence interval:
hw = , .
√
65
43
21
O
EX
XO
AX
OO
X O

162 INASEA, Vol. 14 No.2, Oktober 2013: 151-176
hw = . .√
-0.43 – 0.44 ≤ μ(2 – 3) ≤ -0.43 + 0.44 hw = 0.44 unit per hour -0.88 ≤ μ(2 – 3) ≤ 0.01 Based on the results, system 1 is the least favorable with respect to the mean throughtput while
System 2 and System 3 are the most favorable with respect to mean throughput. Thus, the recommendation is implementing the System 3 in place of the System 2 because System 3 was the boss’s idea.
The picture below shows the layout of location which has been constructed.
Figure 6 Display of locations for system 3 proposed straight line
The following table is the process and routing of the proposed straight line.
Table 10 Process of proposed straight line
Process Routing Entity Location Operation Output Destination Rule Move Logic
Car Enter Car Operator_1 FIRST 1
MOVE FOR 5 MIN
Car Operator_1 WAIT 39.52 MIN Car Operator_2 FIRST
1 MOVE FOR 5 MIN
Car Operator_2 WAIT 46.74 MIN Car Operator_3 FIRST
1 MOVE FOR 5 MIN
Car Operator_3 WAIT 26.2 MIN Car Operator_4 FIRST
1 MOVE FOR 5 MIN
Car Operator_4 WAIT 46.92 MIN Car Operator_5 FIRST
1 MOVE FOR 5 MIN
Car Operator_5 WAIT 44.84 MIN Car Operator_6 FIRST
1 MOVE FOR 5 MIN
Car Operator_6
WAIT 34.32 MIN INC Finished_Repair
Car EXIT FIRST 1
MOVE FOR 5 MIN
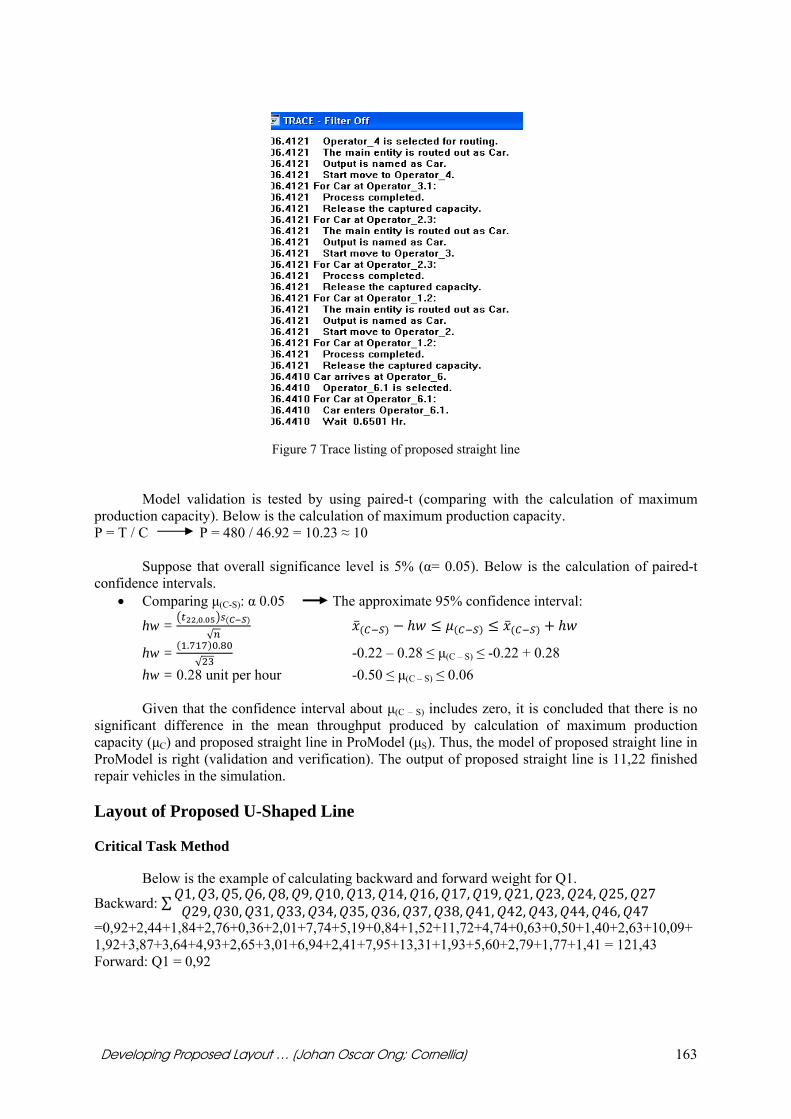
The trace below shows that the entity or sequence of events follow the behavior of system
(model verification).
Developing Proposed Layout … (Johan Oscar Ong; Cornellia) 163
Figure 7 Trace listing of proposed straight line Model validation is tested by using paired-t (comparing with the calculation of maximum
production capacity). Below is the calculation of maximum production capacity. P = T / C P = 480 / 46.92 = 10.23 ≈ 10
Suppose that overall significance level is 5% (α= 0.05). Below is the calculation of paired-t
confidence intervals. • Comparing μ(C-S): α 0.05 The approximate 95% confidence interval:
hw = , .
√
hw = . .√
-0.22 – 0.28 ≤ μ(C – S) ≤ -0.22 + 0.28 hw = 0.28 unit per hour -0.50 ≤ μ(C – S) ≤ 0.06 Given that the confidence interval about μ(C – S) includes zero, it is concluded that there is no
significant difference in the mean throughput produced by calculation of maximum production capacity (μC) and proposed straight line in ProModel (μS). Thus, the model of proposed straight line in ProModel is right (validation and verification). The output of proposed straight line is 11,22 finished repair vehicles in the simulation. Layout of Proposed U-Shaped Line Critical Task Method
Below is the example of calculating backward and forward weight for Q1.
Backward: ∑ 1, 3, 5, 6, 8, 9, 10, 13, 14, 16, 17, 19, 21, 23, 24, 25, 2729, 30, 31, 33, 34, 35, 36, 37, 38, 41, 42, 43, 44, 46, 47
=0,92+2,44+1,84+2,76+0,36+2,01+7,74+5,19+0,84+1,52+11,72+4,74+0,63+0,50+1,40+2,63+10,09+1,92+3,87+3,64+4,93+2,65+3,01+6,94+2,41+7,95+13,31+1,93+5,60+2,79+1,77+1,41 = 121,43 Forward: Q1 = 0,92
164 INASEA, Vol. 14 No.2, Oktober 2013: 151-176
Calculation table and the application of CTM are attached in Appendix 4. Then the data is used as the basis in determining the work arrangement between operators. Work Arrangement
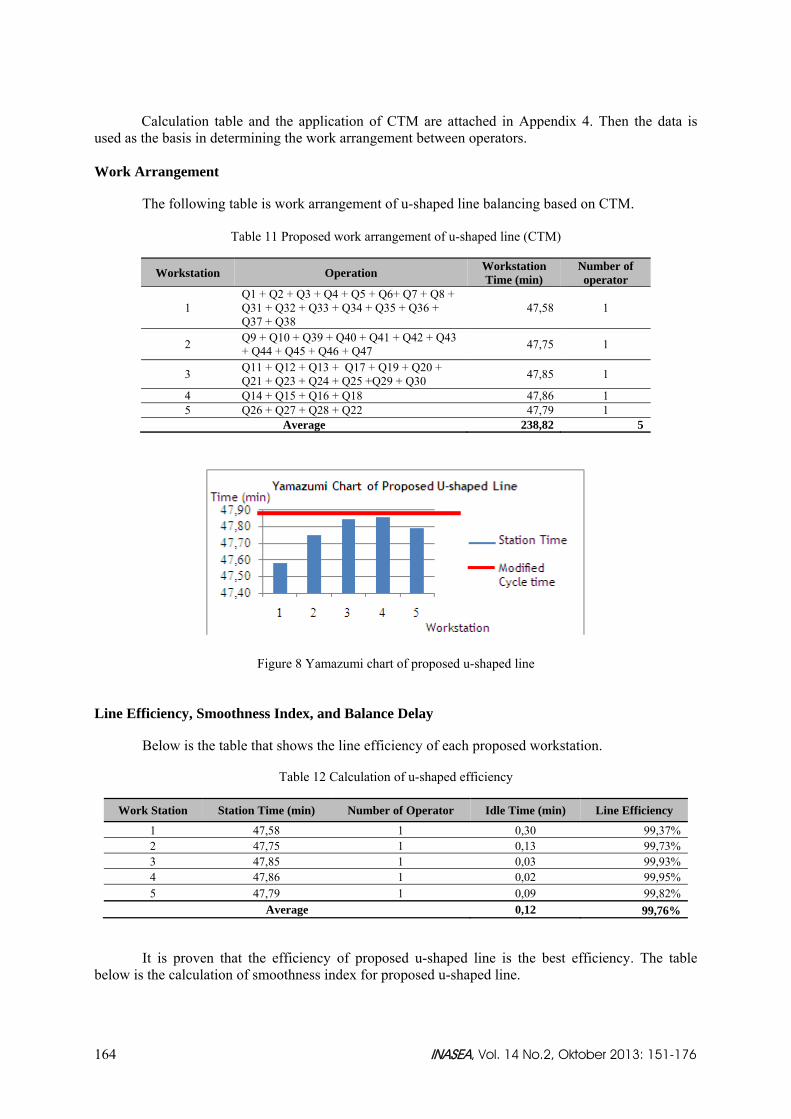
The following table is work arrangement of u-shaped line balancing based on CTM.
Table 11 Proposed work arrangement of u-shaped line (CTM)
Workstation Operation Workstation Time (min)
Number of operator
1 Q1 + Q2 + Q3 + Q4 + Q5 + Q6+ Q7 + Q8 + Q31 + Q32 + Q33 + Q34 + Q35 + Q36 + Q37 + Q38
47,58 1
2 Q9 + Q10 + Q39 + Q40 + Q41 + Q42 + Q43 + Q44 + Q45 + Q46 + Q47 47,75 1
3 Q11 + Q12 + Q13 + Q17 + Q19 + Q20 + Q21 + Q23 + Q24 + Q25 +Q29 + Q30 47,85 1
4 Q14 + Q15 + Q16 + Q18 47,86 1 5 Q26 + Q27 + Q28 + Q22 47,79 1
Average 238,82 5
Figure 8 Yamazumi chart of proposed u-shaped line Line Efficiency, Smoothness Index, and Balance Delay
Below is the table that shows the line efficiency of each proposed workstation.
Table 12 Calculation of u-shaped efficiency
Work Station Station Time (min) Number of Operator Idle Time (min) Line Efficiency
1 47,58 1 0,30 99,37% 2 47,75 1 0,13 99,73% 3 47,85 1 0,03 99,93% 4 47,86 1 0,02 99,95% 5 47,79 1 0,09 99,82%
Average 0,12 99,76%
It is proven that the efficiency of proposed u-shaped line is the best efficiency. The table below is the calculation of smoothness index for proposed u-shaped line.

Developing Proposed Layout … (Johan Oscar Ong; Cornellia) 165
Table 13 Calculation of smoothness index for u-shaped line
Work Station STi (STmax-STi)2
1 47,58 0,077 2 47,75 0,012 3 47,85 0,000 4 47,86 0,000 5 47,79 0,004
Total 0,093 Smoothness Index 0,305
Below is the calculation of Balance Delay of proposed u-shaped line.
BD =(K) (STmax) – ∑ x 100% (K) (STmax)
BD = , ,,
100% BD = 0,2%
The value of balance delay is very small. Thus, there is no bottleneck on BodyShop.
Activity Relationship Chart
Below is the table of ARC for u-shaped line balancing.
Table 14 ARC of u-shaped line balancing
No Facility Relationship
1 Workstation 1
2 Workstation 2
3 Workstation 3
4 Workstation 4
5 Workstation 5
Dimensionless block diagram is the layout of proposed u-shaped line balancing.
Figure 9 Dimensionless block diagram of straight line balancing
54
32
1
54
32
1
IA
A OI
EO
OI
E

166 INASEA, Vol. 14 No.2, Oktober 2013: 151-176
Simulation There are three model system designs of proposed u-shaped line: system 1 with 15 operators
(station 1= 3opt, station 2= 3opt, station 3= 3opt, station 4= 3opt, station 5= 3opt), system 2 with 14 operators (station 1= 2opt, station 2= 3opt, station 3= 3opt, station 4= 3opt, station 5= 3opt), and system 3 with 16 operators (station 1= 3opt, station 2= 3opt, station 3= 3opt, station 4= 4opt, station 5= 3opt). We used Bonferroni approach to compare these systems. Below were the calculations of paired-t confidence intervals.
Comparing μ(1-2): α1 0.02 The approximate 98% confidence interval:
hw = , .
√
hw = . ,√
1.13 – 0.57 ≤ μ(1 – 2) ≤ 1.13 + 0.57 hw = 0.57 unit per hour 0.56 ≤ μ(1 – 2) ≤ 1.70
Comparing μ(1-3): α2 0.02 The approximate 98% confidence interval:
hw = , .
√
hw = . ,√
-0.48 – 0.61 ≤ μ(1 – 3) ≤ -0.48 + 0.61 hw = 0.61 unit per hour -1.09 ≤ μ(1 – 3) ≤ 0.13
Comparing μ(2-3): α1 0.02 The approximate 98% confidence interval:
hw = , .
√
hw = . ,√
-1.61 – 0.47 ≤ μ(2 – 3) ≤ -1.61 + 0.47 hw = 0.47 unit per hour -2.08 ≤ μ(2 – 3) ≤ -1.14 Based on the results, the System 1 was the least favorable with respect to the mean
throughtput while System 2 and System 3 were the most favorable with respect to mean throughput. Thus, the recommendation was implementing the System 3 in place of the System 2 because System 3 was the boss’s idea. The picture below showed the proposed layout of location using U-shape line (Figure 10).
Figure 10 Display of location for system 3 proposed u-shaped line. The following table was the process and routing of the proposed u-shaped line (Table 15).
Table 15 Process of proposed u-shaped line
Process Routing
Entity Location Operation Output Destination Rule Move Logic Car Enter Car Operator_1 FIRST 1 MOVE FOR 5 MIN

Developing Proposed Layout … (Johan Oscar Ong; Cornellia) 167
Car Operator_1 WAIT N(12.22, 5) MIN Car Operator_2 FIRST 1 MOVE FOR 5 MIN
Car Operator_2 WAIT N(9.75, 5) MIN Car Operator3a_rework FIRST 1 MOVE FOR 5 MIN
Car Operator3a_rework
WAIT N(17.85, 5) MIN Car Operator_4 FIRST 1 MOVE FOR 5 MIN
Car Operator_4 WAIT N(47.86, 5) MIN Car Operator_3 FIRST 1 MOVE FOR 5 MIN
Car Operator_3 WAIT N(24.2, 5) MIN Car Operator_5 FIRST 1 MOVE FOR 5 MIN
Car Operator_5 WAIT N(47.79, 5) MIN Car Operator3b_rework FIRST 2 MOVE FOR 5 MIN
Car Operator3b_rework
WAIT N(5.79, 5) MIN Car Operator1_rework FIRST 3 MOVE FOR 5 MIN
Car Operator1_rework WAIT N(35.36, 5) MIN Car Operator2_rework FIRST 4 MOVE FOR 5 MIN
Car Operator2_rework WAIT N(38, 5) MIN INC Finished_Repair
Car EXIT FIRST 1 MOVE FOR 5 MIN
The trace (Figure 11) below showed that the entity or sequence of events follow the behavior
of system (model verification).
Figure 11 Trace listing of proposed u-shaped line Model validation is tested by using paired-t (comparing with the calculation of maximum
production capacity). Below is the calculation of maximum production capacity. P = T / C P = 480 / 46.92 = 10.23 ≈ 10
Supposed that overall significance level was 5% (α= 0.05). Below was the calculation of
paired-t confidence intervals.
168 INASEA, Vol. 14 No.2, Oktober 2013: 151-176
Comparing μ(C-U): α 0.05 The approximate 95% confidence interval:
hw = , .
√
hw = . .√
-0.22 – 0.24 ≤ μ(C – U) ≤ -0.22 + 0.24 hw = 0.24 unit per hour -0.46 ≤ μ(C – U) ≤ 0.02 Given that the confidence interval about μ(C – U) included zero, we concluded that there was no
significant difference in the mean throughput produced by calculation of maximum production capacity (μC) and we proposed u-shaped line in ProModel (μU). Thus, the proposed model of u-shaped line in ProModel was appropriate (validation and verification). There were 11,83 finished repair vehicles found in the finished stall. They were the outputs of proposed u-shaped line in the simulation.
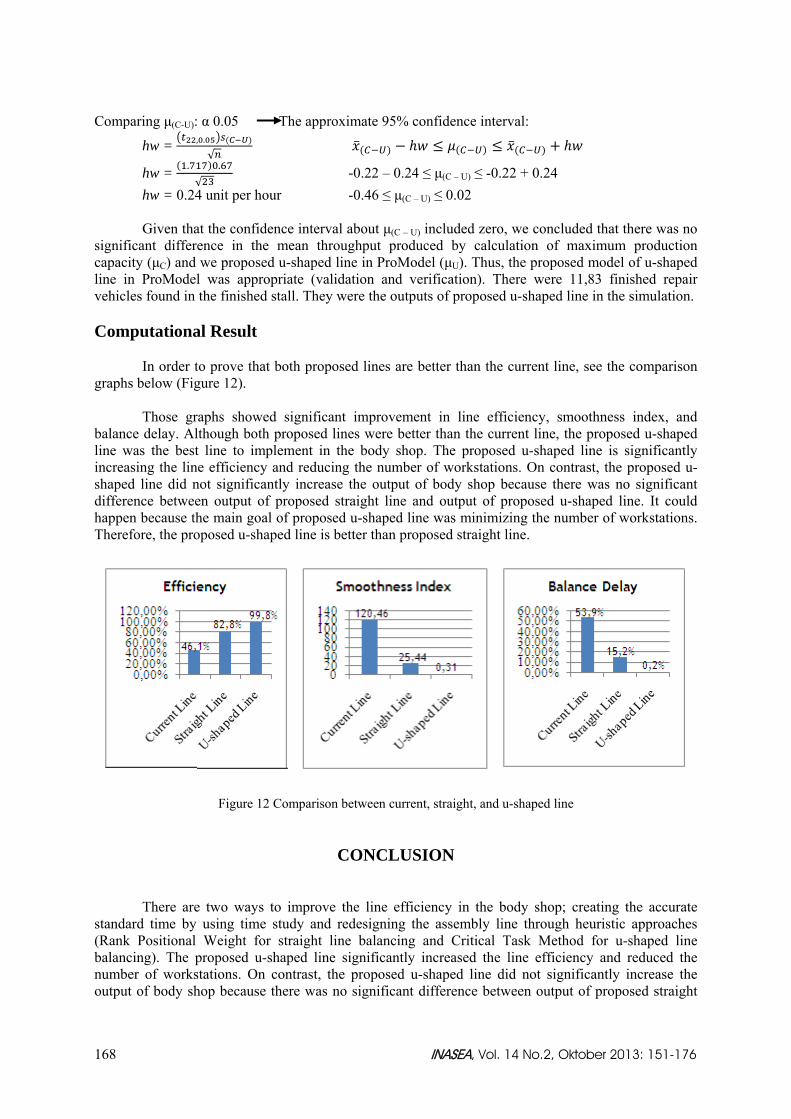
Computational Result
In order to prove that both proposed lines are better than the current line, see the comparison
graphs below (Figure 12). Those graphs showed significant improvement in line efficiency, smoothness index, and
balance delay. Although both proposed lines were better than the current line, the proposed u-shaped line was the best line to implement in the body shop. The proposed u-shaped line is significantly increasing the line efficiency and reducing the number of workstations. On contrast, the proposed u-shaped line did not significantly increase the output of body shop because there was no significant difference between output of proposed straight line and output of proposed u-shaped line. It could happen because the main goal of proposed u-shaped line was minimizing the number of workstations. Therefore, the proposed u-shaped line is better than proposed straight line.
Figure 12 Comparison between current, straight, and u-shaped line
CONCLUSION
There are two ways to improve the line efficiency in the body shop; creating the accurate standard time by using time study and redesigning the assembly line through heuristic approaches (Rank Positional Weight for straight line balancing and Critical Task Method for u-shaped line balancing). The proposed u-shaped line significantly increased the line efficiency and reduced the number of workstations. On contrast, the proposed u-shaped line did not significantly increase the output of body shop because there was no significant difference between output of proposed straight
Developing Proposed Layout … (Johan Oscar Ong; Cornellia) 169
line and output of proposed u-shaped line. It could happen because the main goal of proposed u-shaped line was minimizing the number of workstations. Therefore, the proposed u-shaped line is better than proposed straight line.
REFERENCES Fathi, M., Alvarez, M. J. & Rodriguez, V. (2011). A new heuristics approach to solving u-shape
assembly line balancing problem type-1. World Academy of Science, Engineering and Technology, 59.
Harrell, C., Ghosh, Biman K. & Bowden, Royce O. (2012). Simulation using Promodel 3rd edition.
New York: McGraw-Hill. Hayter, A. (2000). Probability and Statistics for Engineers and Scientists (3rd ed.). Boston: Thomson
Learning. Mulyati, Erna & Rachmi, Ricca. (2011). Redesain Layout untuk Meningkatkan Efisiensi Ruangan
Gudang Tertutup: Studi Kasus PT Kaltim Industrial Estate. Skirpsi tidak diterbitkan. Politeknik Pos Indonesia, Bandung.
Niebel, B.W. & Freivalds, A. (2003). Niebel’s Methods, Standards, and Work Design (12th ed.). New
York: McGraw-Hill. Sutalaksana, Iftikar Z., Anggawisastra, R. And Tjakraatmadja, J.H. (2006). Teknik Perancangan
Sistem Kerja. Bandung: ITB. Walpole, R.E., Myers, R.H., Myers, S.L. & Ye, K. (2002). Probability and Statistic for Engineers and
Scientists (7th ed.). New Jersey: Prentice Hall. Wignjosoebroto, S. (2000). Ergonomi, Studi Gerak dan Waktu. Surabaya: Guna Widya. Yeh, D. H. & Kao, H. H. (2009). A New Bidirectional Heuristic for the Assembly Line Balancing
Problem. Comput Indu Eng, 57 (4), 1156-1160.

170 INASEA, Vol. 14 No.2, Oktober 2013: 151-176
APPENDIX
Appendix 1: Standard Time after Time Study

Developing Proposed Layout … (Johan Oscar Ong; Cornellia) 171
Appendix 2: Precedence Diagram

172 INASEA, Vol. 14 No.2, Oktober 2013: 151-176
Appendix 3: Rank Positional Weight
Opera
tionStd
Time
Q1Q2
Q3Q4
Q5Q6
Q7Q8
Q9Q1
0Q1
1Q1
2Q1
3Q1
4Q1
5Q1
6Q1
7Q1
8Q1
9Q2
0Q2
1Q2
2Q2
3Q2
4Q2
5Q2
6Q2
7Q2
8Q2
9Q3
0Q3
1Q3
2Q3
3Q3
4Q3
5Q3
6Q3
7Q3
8Q3
9Q4
0Q4
1Q4
2Q4
3Q4
4Q4
5Q4
6Q4
7Q1
0,92
1Q2
1,34
11
Q32,4
41
1Q4
1,50
11
1Q5
1,84
11
1Q6
2,76
11
11
Q71,0
91
11
11
Q80,3
61
11
11
Q92,0
11
11
11
11
Q10
7,74
11
11
11
11
Q11
3,23
11
11
11
11
1Q1
29,4
41
11
11
11
11
1Q1
35,1
91
11
11
11
11
Q14
0,84
11
11
11
11
11
Q15
44,38
11
11
11
11
11
1Q1
61,5
21
11
11
11
11
11
Q17
11,72
11
11
11
11
11
11
Q18
1,12
11
11
11
11
11
11
1Q1
94,7
41
11
11
11
11
11
11
Q20
2,58
11
11
11
11
11
11
11
Q21
0,63
11
11
11
11
11
11
11
Q22
0,88
1Q2
30,5
01
11
11
11
11
11
11
11
1Q2
41,4
01
11
11
11
11
11
11
11
11
Q25
2,63
11
11
11
11
11
11
11
11
11
1Q2
61,9
81
Q27
10,09
11
11
11
11
11
11
11
11
11
11
Q28
34,85
11
11
11
11
11
11
11
11
11
11
1Q2
91,9
21
11
11
11
11
11
11
11
11
11
11
Q30
3,87
11
11
11
11
11
11
11
11
11
11
11
Q31
3,64
11
11
11
11
11
11
11
11
11
11
11
1Q3
23,8
41
Q33
4,93
11
11
11
11
11
11
11
11
11
11
11
11
1Q3
42,6
51
11
11
11
11
11
11
11
11
11
11
11
11
1Q3
53,0
11
11
11
11
11
11
11
11
11
11
11
11
11
11
Q36
6,94
11
11
11
11
11
11
11
11
11
11
11
11
11
11
Q37
2,41
11
11
11
11
11
11
11
11
11
11
11
11
11
11
1Q3
87,9
51
11
11
11
11
11
11
11
11
11
11
11
11
11
11
1Q3
93,6
81
11
11
11
11
11
11
11
11
11
11
11
11
11
11
11
Q40
2,04
11
11
11
11
11
11
11
11
11
11
11
11
11
11
11
1Q4
113,
311
11
11
11
11
11
11
11
11
11
11
11
11
11
11
11
Q42
1,93
11
11
11
11
11
11
11
11
11
11
11
11
11
11
11
11
Q43
5,60
11
11
11
11
11
11
11
11
11
11
11
11
11
11
11
11
1Q4
42,7
91
11
11
11
11
11
11
11
11
11
11
11
11
11
11
11
11
11
Q45
5,47
1Q4
61,7
71
11
11
11
11
11
11
11
11
11
11
11
11
11
11
11
11
11
1Q4
71,4
11
11
11
11
11
11
11
11
11
11
11
11
11
11
11
11
11
11
11
226,66
1,34
224,41
1,50
220,47
218,63
215,52
214,79
214,43
212,42
12,66
9,44
192,02
186,83
44,38
141,61
140,09
1,12
127,26
2,58
119,94
120,18
119,30
118,80
117,40
119,37
114,77
34,85
69,83
67,91
64,04
64,24
60,40
55,48
52,83
49,82
42,88
40,47
3,68
2,04
26,81
13,50
11,57
5,97
11,45
3,18
1,41
Weigh
t
Developing Proposed Layout … (Johan Oscar Ong; Cornellia) 173
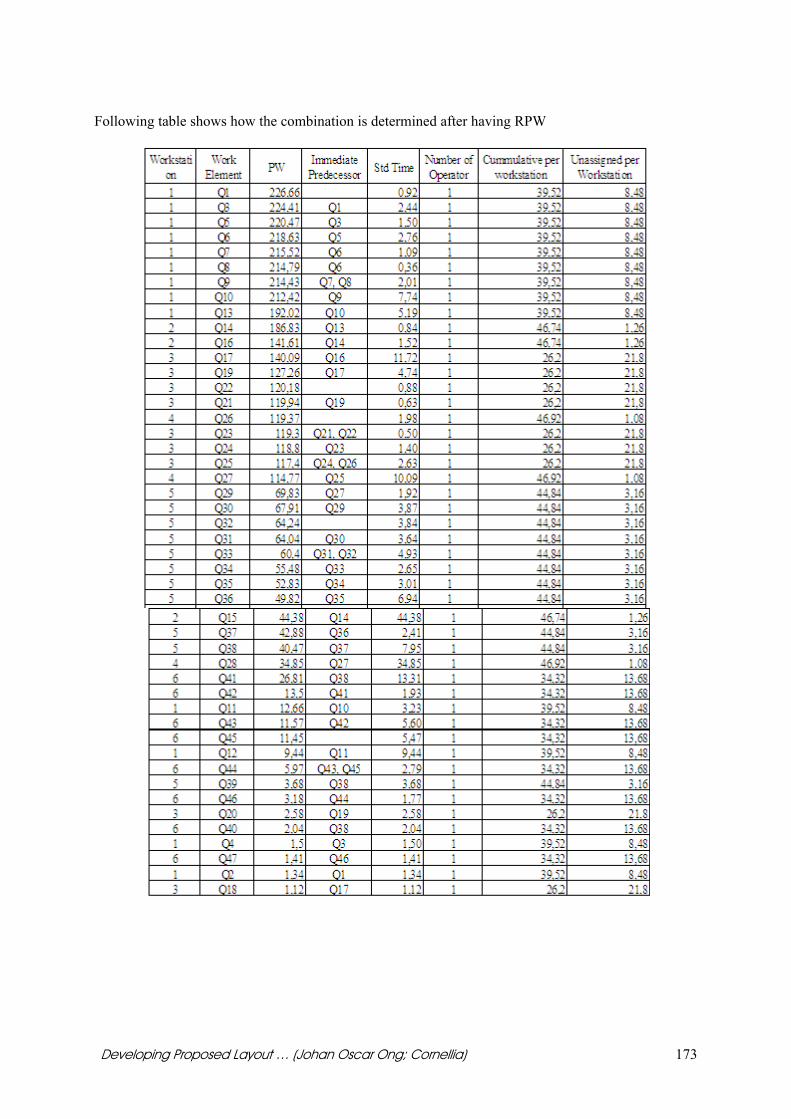
Following table shows how the combination is determined after having RPW
174 INASEA, Vol. 14 No.2, Oktober 2013: 151-176
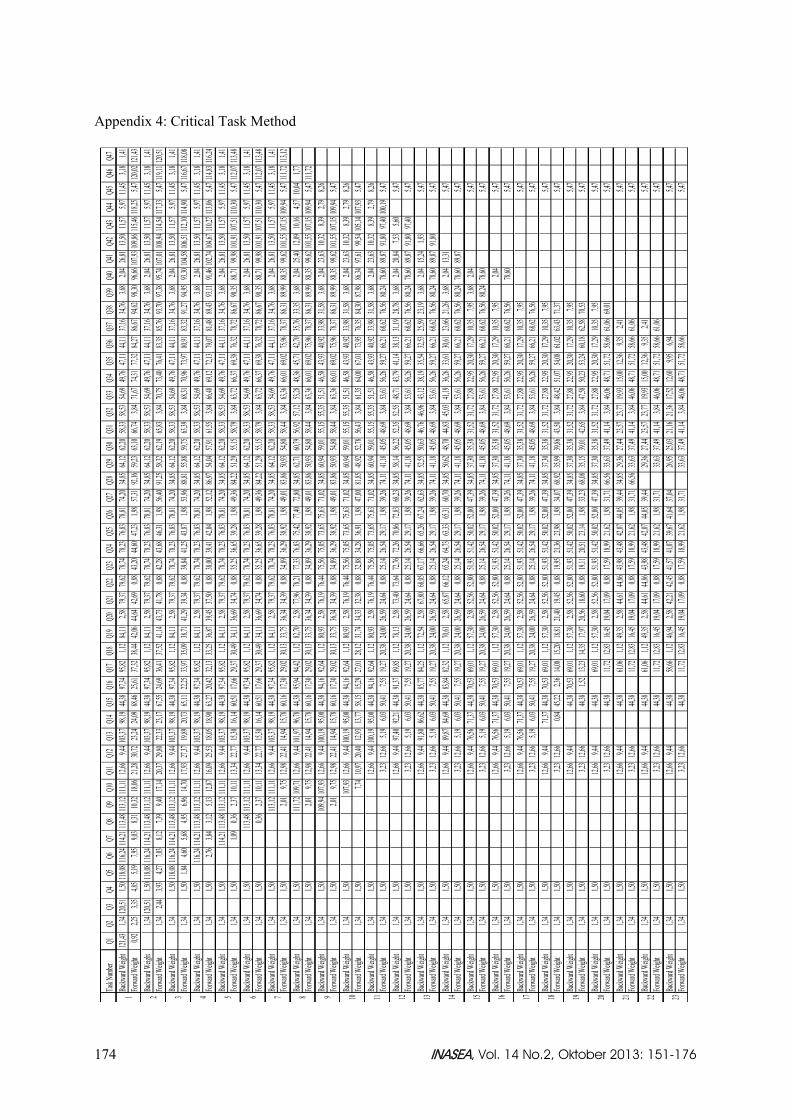
Appendix 4: Critical Task Method Tas
k Num
berQ1
Q2Q3
Q4Q5
Q6Q7
Q8Q9
Q10
Q11
Q12
Q13
Q14
Q15
Q16
Q17
Q18
Q19
Q20
Q21
Q22
Q23
Q24
Q25
Q26
Q27
Q28
Q29
Q30
Q31
Q32
Q33
Q34
Q35
Q36
Q37
Q38
Q39
Q40
Q41
Q42
Q43
Q44
Q45
Q46
Q47
Backw
ard W
eight
121,43
1,341
20,51
1,501
18,08
116,24
114,21
113,48
113,12
111,11
12,66
9,441
03,37
98,19
44,38
97,34
95,82
1,12
84,11
2,58
79,37
79,62
78,74
78,23
76,83
78,81
74,20
34,85
64,12
62,20
58,33
58,53
54,69
49,76
47,11
44,11
37,16
34,76
3,68
2,04
26,81
13,50
11,57
5,97
11,45
3,18
1,41
Forwa
rd Weig
ht0,9
22,2
53,3
54,8
55,1
97,9
59,0
38,3
110,
3218,
0621,
2830,
7223,
2424,
0968,
4625,
6137,
3238,
4442,
0644,
6442,
690,8
843,
2044,
6047,
231,9
857,
3192,
1659,
2363,
1066,
743,8
471,
6774,
3177,
3284,
2786,
6794,
6298,
3096,
66107
,93109
,86115
,46118
,255,4
7120,
02121
,43Bac
kward
Weig
ht1,3
4120,
511,5
0118,
08116
,24114
,21113
,48113
,12111
,1112,
669,4
4103,
3798,
1944,
3897,
3495,
821,1
284,
112,5
879,
3779,
6278,
7478,
2376,
8378,
8174,
2034,
8564,
1262,
2058,
3358,
5354,
6949,
7647,
1144,
1137,
1634,
763,6
82,0
426,
8113,
5011,
575,9
711,
453,1
81,4
1For
ward W
eight
1,34
2,44
3,93
4,27
7,03
8,12
7,39
9,40
17,14
20,37
29,80
22,33
23,17
67,55
24,69
36,41
37,52
41,14
43,73
41,78
0,88
42,28
43,68
46,31
1,98
56,40
91,25
58,32
62,19
65,83
3,84
70,75
73,40
76,41
83,35
85,76
93,70
97,38
95,74
107,01
108,94
114,54
117,33
5,471
19,11
120,51
Backw
ard W
eight
1,34
1,501
18,08
116,24
114,21
113,48
113,12
111,11
12,66
9,441
03,37
98,19
44,38
97,34
95,82
1,12
84,11
2,58
79,37
79,62
78,74
78,23
76,83
78,81
74,20
34,85
64,12
62,20
58,33
58,53
54,69
49,76
47,11
44,11
37,16
34,76
3,68
2,04
26,81
13,50
11,57
5,97
11,45
3,18
1,41
Forwa
rd Weig
ht1,3
41,5
01,8
44,6
05,6
84,9
56,9
614,
7017,
9327,
3719,
8920,
7365,
1122,
2533,
9735,
0938,
7141,
2939,
340,8
839,
8441,
2543,
871,9
853,
9688,
8155,
8859,
7563,
393,8
468,
3170,
9673,
9780,
9183,
3291,
2794,
9593,
30104
,58106
,51112
,10114
,905,4
7116,
67118
,08Bac
kward
Weig
ht1,3
41,5
0116
,24114
,21113
,48113
,12111
,1112,
669,4
4103,
3798,
1944,
3897,
3495,
821,1
284,
112,5
879,
3779,
6278,
7478,
2376,
8378,
8174,
2034,
8564,
1262,
2058,
3358,
5354,
6949,
7647,
1144,
1137,
1634,
763,6
82,0
426,
8113,
5011,
575,9
711,
453,1
81,4
1For
ward W
eight
1,34
1,50
2,76
3,84
3,12
5,13
12,87
16,09
25,53
18,05
18,90
63,27
20,42
32,13
33,25
36,87
39,45
37,50
0,88
38,00
39,41
42,04
1,98
52,12
86,97
54,04
57,91
61,55
3,84
66,48
69,12
72,13
79,07
81,48
89,43
93,11
91,46
102,74
104,67
110,27
113,06
5,471
14,83
116,24
Backw
ard W
eight
1,34
1,50
114,21
113,48
113,12
111,11
12,66
9,441
03,37
98,19
44,38
97,34
95,82
1,12
84,11
2,58
79,37
79,62
78,74
78,23
76,83
78,81
74,20
34,85
64,12
62,20
58,33
58,53
54,69
49,76
47,11
44,11
37,16
34,76
3,68
2,04
26,81
13,50
11,57
5,97
11,45
3,18
1,41
Forwa
rd Weig
ht1,3
41,5
01,0
90,3
62,3
710,
1113,
3422,
7715,
3016,
1460,
5117,
6629,
3730,
4934,
1136,
6934,
740,8
835,
2536,
6539,
281,9
849,
3684,
2251,
2955,
1558,
793,8
463,
7266,
3769,
3876,
3278,
7286,
6790,
3588,
7199,
98101
,91107
,51110
,305,4
7112,
07113
,48Bac
kward
Weig
ht1,3
41,5
0113
,48113
,12111
,1112,
669,4
4103,
3798,
1944,
3897,
3495,
821,1
284,
112,5
879,
3779,
6278,
7478,
2376,
8378,
8174,
2034,
8564,
1262,
2058,
3358,
5354,
6949,
7647,
1144,
1137,
1634,
763,6
82,0
426,
8113,
5011,
575,9
711,
453,1
81,4
1For
ward W
eight
1,34
1,50
0,36
2,37
10,11
13,34
22,77
15,30
16,14
60,51
17,66
29,37
30,49
34,11
36,69
34,74
0,88
35,25
36,65
39,28
1,98
49,36
84,22
51,29
55,15
58,79
3,84
63,72
66,37
69,38
76,32
78,72
86,67
90,35
88,71
99,98
101,91
107,51
110,30
5,471
12,07
113,48
Backw
ard W
eight
1,34
1,50
113,12
111,11
12,66
9,441
03,37
98,19
44,38
97,34
95,82
1,12
84,11
2,58
79,37
79,62
78,74
78,23
76,83
78,81
74,20
34,85
64,12
62,20
58,33
58,53
54,69
49,76
47,11
44,11
37,16
34,76
3,68
2,04
26,81
13,50
11,57
5,97
11,45
3,18
1,41
Forwa
rd Weig
ht1,3
41,5
02,0
19,7
512,
9822,
4114,
9415,
7860,
1617,
3029,
0230,
1333,
7536,
3434,
390,8
834,
8936,
2938,
921,9
849,
0183,
8650,
9354,
8058,
443,8
463,
3666,
0169,
0275,
9678,
3786,
3189,
9988,
3599,
62101
,55107
,15109
,945,4
7111,
72113
,12Bac
kward
Weig
ht1,3
41,5
0111
,72109
,7112,
669,4
4101,
9796,
7844,
3895,
9494,
421,1
282,
702,5
877,
9678,
2177,
3376,
8375,
4277,
4072,
8034,
8562,
7160,
7956,
9257,
1253,
2848,
3645,
7142,
7035,
7633,
353,6
82,0
425,
4012,
0910,
164,5
710,
041,7
7For
ward W
eight
1,34
1,50
2,01
9,75
12,98
22,41
14,94
15,78
60,16
17,30
29,02
30,13
33,75
36,34
34,39
0,88
34,89
36,29
38,92
1,98
49,01
83,86
50,93
54,80
58,44
3,84
63,36
66,01
69,02
75,96
78,37
86,31
89,99
88,35
99,62
101,55
107,15
109,94
5,471
11,72
Backw
ard W
eight
1,34
1,50
109,94
107,93
12,66
9,441
00,19
95,00
44,38
94,16
92,64
1,12
80,93
2,58
76,19
76,44
75,56
75,05
73,65
75,63
71,02
34,85
60,94
59,01
55,15
55,35
51,51
46,58
43,93
40,92
33,98
31,58
3,68
2,04
23,63
10,32
8,39
2,79
8,26
Forwa
rd Weig
ht1,3
41,5
02,0
19,7
512,
9822,
4114,
9415,
7860,
1617,
3029,
0230,
1333,
7536,
3434,
390,8
834,
8936,
2938,
921,9
849,
0183,
8650,
9354,
8058,
443,8
463,
3666,
0169,
0275,
9678,
3786,
3189,
9988,
3599,
62101
,55107
,15109
,945,4
7Bac
kward
Weig
ht1,3
41,5
0107
,9312,
669,4
4100,
1995,
0044,
3894,
1692,
641,1
280,
932,5
876,
1976,
4475,
5675,
0573,
6575,
6371,
0234,
8560,
9459,
0155,
1555,
3551,
5146,
5843,
9340,
9233,
9831,
583,6
82,0
423,
6310,
328,3
92,7
98,2
6For
ward W
eight
1,34
1,50
7,74
10,97
20,40
12,93
13,77
58,15
15,29
27,01
28,12
31,74
34,33
32,38
0,88
32,88
34,28
36,91
1,98
47,00
81,85
48,92
52,78
56,43
3,84
61,35
64,00
67,01
73,95
76,35
84,30
87,98
86,34
97,61
99,54
105,14
107,93
5,47
Backw
ard W
eight
1,34
1,50
12,66
9,441
00,19
95,00
44,38
94,16
92,64
1,12
80,93
2,58
76,19
76,44
75,56
75,05
73,65
75,63
71,02
34,85
60,94
59,01
55,15
55,35
51,51
46,58
43,93
40,92
33,98
31,58
3,68
2,04
23,63
10,32
8,39
2,79
8,26
Forwa
rd Weig
ht1,3
41,5
03,2
312,
665,1
96,0
350,
417,5
519,
2720,
3824,
0026,
5924,
640,8
825,
1426,
5429,
171,9
839,
2674,
1141,
1845,
0548,
693,8
453,
6156,
2659,
2766,
2168,
6276,
5680,
2478,
6089,
8791,
8097,
40100
,195,4
7Bac
kward
Weig
ht1,3
41,5
012,
669,4
497,
4092,
2144,
3891,
3789,
851,1
278,
132,5
873,
4073,
6472,
7672,
2670,
8672,
8368,
2334,
8558,
1456,
2252,
3552,
5548,
7143,
7941,
1438,
1331,
1928,
783,6
82,0
420,
847,5
35,6
05,4
7For
ward W
eight
1,34
1,50
3,23
12,66
5,19
6,03
50,41
7,55
19,27
20,38
24,00
26,59
24,64
0,88
25,14
26,54
29,17
1,98
39,26
74,11
41,18
45,05
48,69
3,84
53,61
56,26
59,27
66,21
68,62
76,56
80,24
78,60
89,87
91,80
97,40
5,47
Backw
ard W
eight
1,34
1,50
12,66
9,44
91,80
86,62
44,38
85,77
84,25
1,12
72,54
2,58
67,80
68,05
67,17
66,66
65,26
67,24
62,63
34,85
52,55
50,63
46,76
46,96
43,12
38,19
35,54
32,53
25,59
23,19
3,68
2,04
15,24
1,93
5,47
Forwa
rd Weig
ht1,3
41,5
03,2
312,
665,1
96,0
350,
417,5
519,
2720,
3824,
0026,
5924,
640,8
825,
1426,
5429,
171,9
839,
2674,
1141,
1845,
0548,
693,8
453,
6156,
2659,
2766,
2168,
6276,
5680,
2478,
6089,
8791,
805,4
7Bac
kward
Weig
ht1,3
41,5
012,
669,4
489,
8784,
6944,
3883,
8482,
321,1
270,
612,5
865,
8766,
1265,
2464,
7363,
3365,
3160,
7034,
8550,
6248,
7044,
8345,
0341,
1936,
2633,
6130,
6123,
6621,
263,6
82,0
413,
315,4
7For
ward W
eight
1,34
1,50
3,23
12,66
5,19
6,03
50,41
7,55
19,27
20,38
24,00
26,59
24,64
0,88
25,14
26,54
29,17
1,98
39,26
74,11
41,18
45,05
48,69
3,84
53,61
56,26
59,27
66,21
68,62
76,56
80,24
78,60
89,87
5,47
Backw
ard W
eight
1,34
1,50
12,66
9,44
76,56
71,37
44,38
70,53
69,01
1,12
57,30
2,58
52,56
52,80
51,93
51,42
50,02
52,00
47,39
34,85
37,30
35,38
31,52
31,72
27,88
22,95
20,30
17,29
10,35
7,95
3,68
2,04
5,47
Forwa
rd Weig
ht1,3
41,5
03,2
312,
665,1
96,0
350,
417,5
519,
2720,
3824,
0026,
5924,
640,8
825,
1426,
5429,
171,9
839,
2674,
1141,
1845,
0548,
693,8
453,
6156,
2659,
2766,
2168,
6276,
5680,
2478,
605,4
7Bac
kward
Weig
ht1,3
41,5
012,
669,4
476,
5671,
3744,
3870,
5369,
011,1
257,
302,5
852,
5652,
8051,
9351,
4250,
0252,
0047,
3934,
8537,
3035,
3831,
5231,
7227,
8822,
9520,
3017,
2910,
357,9
52,0
45,4
7For
ward W
eight
1,34
1,50
3,23
12,66
5,19
6,03
50,41
7,55
19,27
20,38
24,00
26,59
24,64
0,88
25,14
26,54
29,17
1,98
39,26
74,11
41,18
45,05
48,69
3,84
53,61
56,26
59,27
66,21
68,62
76,56
78,60
5,47
Backw
ard W
eight
1,34
1,50
12,66
9,44
76,56
71,37
44,38
70,53
69,01
1,12
57,30
2,58
52,56
52,80
51,93
51,42
50,02
52,00
47,39
34,85
37,30
35,38
31,52
31,72
27,88
22,95
20,30
17,29
10,35
7,95
5,47
Forwa
rd Weig
ht1,3
41,5
03,2
312,
665,1
96,0
350,
417,5
519,
2720,
3824,
0026,
5924,
640,8
825,
1426,
5429,
171,9
839,
2674,
1141,
1845,
0548,
693,8
453,
6156,
2659,
2766,
2168,
6276,
565,4
7Bac
kward
Weig
ht1,3
41,5
012,
669,4
471,
3744,
3870,
5369,
011,1
257,
302,5
852,
5652,
8051,
9351,
4250,
0252,
0047,
3934,
8537,
3035,
3831,
5231,
7227,
8822,
9520,
3017,
2910,
357,9
55,4
7For
ward W
eight
1,34
1,50
3,23
12,66
0,84
45,22
2,36
14,08
15,20
18,81
21,40
19,45
0,88
19,95
21,36
23,98
1,98
34,07
68,92
35,99
39,86
43,50
3,84
48,42
51,07
54,08
61,02
63,43
71,37
5,47
Backw
ard W
eight
1,34
1,50
12,66
9,44
44,38
70,53
69,01
1,12
57,30
2,58
52,56
52,80
51,93
51,42
50,02
52,00
47,39
34,85
37,30
35,38
31,52
31,72
27,88
22,95
20,30
17,29
10,35
7,95
5,47
Forwa
rd Weig
ht1,3
41,5
03,2
312,
6644,
381,5
213,
2314,
3517,
9720,
5618,
600,8
819,
1120,
5123,
141,9
833,
2368,
0835,
1539,
0142,
653,8
447,
5850,
2353,
2460,
1862,
5870,
535,4
7Bac
kward
Weig
ht1,3
41,5
012,
669,4
444,
3869,
011,1
257,
302,5
852,
5652,
8051,
9351,
4250,
0252,
0047,
3934,
8537,
3035,
3831,
5231,
7227,
8822,
9520,
3017,
2910,
357,9
55,4
7For
ward W
eight
1,34
1,50
3,23
12,66
44,38
11,72
12,83
16,45
19,04
17,09
0,88
17,59
18,99
21,62
1,98
31,71
66,56
33,63
37,49
41,14
3,84
46,06
48,71
51,72
58,66
61,06
69,01
5,47
Backw
ard W
eight
1,34
1,50
12,66
9,44
44,38
61,06
1,12
49,35
2,58
44,61
44,86
43,98
43,48
42,07
44,05
39,44
34,85
29,36
27,44
23,57
23,77
19,93
15,00
12,36
9,35
2,41
5,47
Forwa
rd Weig
ht1,3
41,5
03,2
312,
6644,
3811,
7212,
8316,
4519,
0417,
090,8
817,
5918,
9921,
621,9
831,
7166,
5633,
6337,
4941,
143,8
446,
0648,
7151,
7258,
6661,
065,4
7Bac
kward
Weig
ht1,3
41,5
012,
669,4
444,
3861,
061,1
249,
352,5
844,
6144,
8643,
9843,
4842,
0744,
0539,
4429,
3627,
4423,
5723,
7719,
9315,
0012,
369,3
52,4
15,4
7For
ward W
eight
1,34
1,50
3,23
12,66
44,38
11,72
12,83
16,45
19,04
17,09
0,88
17,59
18,99
21,62
1,98
31,71
33,63
37,49
41,14
3,84
46,06
48,71
51,72
58,66
61,06
5,47
Backw
ard W
eight
1,34
1,50
12,66
9,44
44,38
58,66
1,12
46,94
2,58
42,21
42,45
41,57
41,07
39,67
41,64
37,04
26,95
25,03
21,16
21,36
17,52
12,60
9,95
6,94
5,47
Forwa
rd Weig
ht1,3
41,5
03,2
312,
6644,
3811,
7212,
8316,
4519,
0417,
090,8
817,
5918,
9921,
621,9
831,
7133,
6337,
4941,
143,8
446,
0648,
7151,
7258,
665,4
7
541 2 3 11109876 171615141312 232221201918

Developing Proposed Layout … (Johan Oscar Ong; Cornellia) 175
Task N
umber
Q1Q2
Q3Q4
Q5Q6
Q7Q8
Q9Q1
0Q1
1Q1
2Q1
3Q1
4Q1
5Q1
6Q1
7Q1
8Q1
9Q2
0Q2
1Q2
2Q2
3Q2
4Q2
5Q2
6Q2
7Q2
8Q2
9Q3
0Q3
1Q3
2Q3
3Q3
4Q3
5Q3
6Q3
7Q3
8Q3
9Q4
0Q4
1Q4
2Q4
3Q4
4Q4
5Q4
6Q4
7Ba
ckward
Weig
ht1,3
41,5
012,
669,4
444,
3851,
721,1
240,
002,5
835,
2735,
5134,
6334,
1332,
7334,
7030,
1020,
0118,
0914,
2214,
4210,
585,6
63,0
15,4
7For
ward W
eight
1,34
1,50
3,23
12,66
44,38
11,72
12,83
16,45
19,04
17,09
0,88
17,59
18,99
21,62
1,98
31,71
33,63
37,49
41,14
3,84
46,06
48,71
51,72
5,47
Backw
ard W
eight
1,34
1,50
12,66
9,44
44,38
48,71
1,12
36,99
2,58
32,26
32,50
31,62
31,12
29,72
31,69
27,09
17,00
15,08
11,21
11,41
7,57
2,65
5,47
Forwa
rd Weig
ht1,3
41,5
03,2
312,
6644,
3811,
7212,
8316,
4519,
0417,
090,8
817,
5918,
9921,
621,9
831,
7133,
6337,
4941,
143,8
446,
0648,
715,4
7Ba
ckward
Weig
ht1,3
41,5
012,
669,4
444,
3846,
061,1
234,
342,5
829,
6129,
8528,
9828,
4727,
0729,
0424,
4414,
3512,
438,5
78,7
74,9
35,4
7For
ward W
eight
1,34
1,50
3,23
12,66
44,38
11,72
12,83
16,45
19,04
17,09
0,88
17,59
18,99
21,62
1,98
31,71
33,63
37,49
41,14
3,84
46,06
5,47
Backw
ard W
eight
1,34
1,50
12,66
9,44
44,38
41,14
1,12
29,42
2,58
24,68
24,93
24,05
23,55
22,14
24,12
19,52
9,43
7,51
3,64
3,84
5,47
Forwa
rd Weig
ht1,3
41,5
03,2
312,
6644,
3811,
7212,
8316,
4519,
0417,
090,8
817,
5918,
9921,
621,9
831,
7133,
6337,
4941,
143,8
45,4
7Ba
ckward
Weig
ht1,3
41,5
012,
669,4
441,
141,1
229,
422,5
824,
6824,
9324,
0523,
5522,
1424,
1219,
529,4
37,5
13,6
43,8
45,4
7For
ward W
eight
1,34
1,50
3,23
12,66
11,72
12,83
16,45
19,04
17,09
0,88
17,59
18,99
21,62
1,98
31,71
33,63
37,49
41,14
3,84
5,47
Backw
ard W
eight
1,34
1,50
12,66
9,44
37,49
1,12
25,78
2,58
21,04
21,29
20,41
19,91
18,50
20,48
15,87
5,79
3,87
3,84
5,47
Forwa
rd Weig
ht1,3
41,5
03,2
312,
6611,
7212,
8316,
4519,
0417,
090,8
817,
5918,
9921,
621,9
831,
7133,
6337,
493,8
45,4
7Ba
ckward
Weig
ht1,3
41,5
012,
669,4
41,1
225,
782,5
821,
0421,
2920,
4119,
9118,
5020,
4815,
875,7
93,8
73,8
45,4
7For
ward W
eight
1,34
1,50
3,23
12,66
1,12
4,74
7,32
5,37
0,88
5,87
7,28
9,90
1,98
19,99
21,91
25,78
3,84
5,47
Backw
ard W
eight
1,34
1,50
12,66
9,44
1,12
21,91
2,58
17,18
17,42
16,54
16,04
14,63
16,61
12,01
1,92
3,84
5,47
Forwa
rd Weig
ht1,3
41,5
03,2
312,
661,1
24,7
47,3
25,3
70,8
85,8
77,2
89,9
01,9
819,
9921,
913,8
45,4
7Ba
ckward
Weig
ht1,3
41,5
012,
669,4
41,1
219,
992,5
815,
2515,
5014,
6214,
1212,
7114,
6910,
093,8
45,4
7For
ward W
eight
1,34
1,50
3,23
12,66
1,12
4,74
7,32
5,37
0,88
5,87
7,28
9,90
1,98
19,99
3,84
5,47
Backw
ard W
eight
1,34
1,50
12,66
9,44
1,12
2,58
15,25
15,50
14,62
14,12
12,71
14,69
10,09
3,84
5,47
Forwa
rd Weig
ht1,3
41,5
03,2
312,
661,1
22,5
80,6
30,8
81,1
42,5
45,1
71,9
815,
253,8
45,4
7Ba
ckward
Weig
ht1,3
41,5
012,
669,4
41,1
22,5
815,
2514,
6214,
1212,
7114,
6910,
093,8
45,4
7For
ward W
eight
1,34
1,50
3,23
12,66
1,12
2,58
0,63
1,14
2,54
5,17
1,98
15,25
3,84
5,47
Backw
ard W
eight
1,34
1,50
12,66
9,44
1,12
2,58
14,62
14,12
12,71
14,69
10,09
3,84
5,47
Forwa
rd Weig
ht1,3
41,5
03,2
312,
661,1
22,5
80,5
01,9
14,5
41,9
814,
623,8
45,4
7Ba
ckward
Weig
ht1,3
41,5
012,
669,4
41,1
22,5
814,
6214,
1212,
7110,
093,8
45,4
7For
ward W
eight
1,34
1,50
3,23
12,66
1,12
2,58
0,50
1,91
4,54
14,62
3,84
5,47
Backw
ard W
eight
1,34
1,50
12,66
9,44
1,12
2,58
4,54
4,03
2,63
3,84
5,47
Forwa
rd Weig
ht1,3
41,5
03,2
312,
661,1
22,5
80,5
01,9
14,5
43,8
45,4
7Ba
ckward
Weig
ht1,3
41,5
09,4
41,1
22,5
84,5
44,0
32,6
33,8
45,4
7For
ward W
eight
1,34
1,50
9,44
1,12
2,58
0,50
1,91
4,54
3,84
5,47
Backw
ard W
eight
1,34
1,50
1,12
2,58
4,54
4,03
2,63
3,84
5,47
Forwa
rd Weig
ht1,3
41,5
01,1
22,5
80,5
01,9
14,5
43,8
45,4
7Ba
ckward
Weig
ht1,3
41,5
01,1
22,5
84,5
44,0
32,6
33,8
4For
ward W
eight
1,34
1,50
1,12
2,58
0,50
1,91
4,54
3,84
Backw
ard W
eight
1,34
1,50
1,12
2,58
4,03
2,63
3,84
Forwa
rd Weig
ht1,3
41,5
01,1
22,5
81,4
04,0
33,8
4Ba
ckward
Weig
ht1,3
41,5
01,1
22,5
82,6
33,8
4For
ward W
eight
1,34
1,50
1,12
2,58
2,63
3,84
Backw
ard W
eight
1,34
1,50
1,12
2,58
2,63
Forwa
rd Weig
ht1,3
41,5
01,1
22,5
82,6
3Ba
ckward
Weig
ht1,3
41,5
01,1
22,5
8For
ward W
eight
1,34
1,50
1,12
2,58
Backw
ard W
eight
1,34
1,50
1,12
Forwa
rd Weig
ht1,3
41,5
01,1
2Ba
ckward
Weig
ht1,3
41,1
2For
ward W
eight
1,34
1,12
Backw
ard W
eight
1,12
Forwa
rd Weig
ht1,1
2
28 2927262524 353433323130 414039383736 474645444342

176 INASEA, Vol. 14 No.2, Oktober 2013: 151-176
Iteration Candidate List Assigned Task Task Time Station No.
1 Q1,Q47 Q1 0,92 12 Q3,Q47 Q3 2,44 13 Q5,Q47 Q5 1,84 14 Q6,Q47 Q6 2,76 15 Q7 Q7 1,09 16 Q8,Q47 Q8 0,36 17 Q9,Q47 Q47 1,41 28 Q9,Q46 Q46 1,77 29 Q9,Q44 Q9 2,01 2
10 Q10,Q44 Q10 7,74 211 Q13,Q44 Q44 2,79 212 Q13,Q43 Q43 5,60 213 Q13,Q42 Q42 1,93 214 Q13,Q41 Q41 13,31 215 Q39 Q39 3,68 216 Q40 Q40 2,04 217 Q13,Q38 Q13 5,19 318 Q14,Q38 Q14 0,84 419 Q16,Q38 Q16 1,52 420 Q17,Q38 Q38 7,95 121 Q28 Q28 34,85 522 Q17,Q37 Q37 2,41 123 Q17,Q36 Q36 6,94 124 Q17,Q35 Q35 3,01 125 Q17,Q34 Q34 2,65 126 Q17,Q33 Q33 4,93 127 Q15 Q15 44,38 428 Q17,Q31 Q31 3,64 129 Q17,Q30 Q17 11,72 330 Q19,Q30 Q30 3,87 331 Q19,Q29 Q29 1,92 332 Q19,Q27 Q19 4,74 333 Q22 Q22 0,88 534 Q21,Q27 Q21 0,63 335 Q26 Q26 1,98 536 Q23,Q27 Q27 10,09 537 Q11,Q12 Q11 3,23 338 Q12 Q12 9,44 339 Q45 Q45 5,47 240 Q23,Q25 Q23 0,50 341 Q24,Q25 Q24 1,40 342 Q32 Q32 3,84 143 Q25 Q25 2,63 344 Q20 Q20 2,58 345 Q4 Q4 1,50 146 Q2 Q2 1,34 147 Q18 Q18 1,12 4