Embed Size (px)
Citation preview
1
UCL SCHOOL OF PHARMACY
BRUNSWICK SQUARE
Developing oral formulations
for protein and peptide drugs
Alice Parry
A thesis submitted in partial fulfilment of the requirements for
the degree of Doctor of Philosophy
UCL SCHOOL OF PHARMACY
29-39 Brunswick Square
London
WC1N 1AX
2
Plagiarism Statement
This thesis describes research conducted in the School of Pharmacy, University
College London between 2008 and 2012 under the supervision of Dr. Simon
Gaisford, Dr Satyanarayana Somavarapu and Professor Abdul Basit. I certify
that the research described is original and that any parts of the work that have
been conducted by collaboration are clearly indicated. I also certify that I have
written all the text herein and have clearly indicated by suitable citation any part
of this dissertation that has already appeared in publication.
_____________________ ___________________
Signature Date
3
Abstract
The vast majority of protein/peptide drugs are not available orally. Their oral
delivery is hindered by intestinal instability and limited permeability. The aim of
this project was to gain an understanding of the stability of a large protein,
lactase, a small protein, insulin, and a newly discovered peptide throughout the
intestinal tract. This was used for the rational design of their oral formulations.
Lactase was completely denatured at gastric pH within 10 minutes but was
stable with intestinal enzymes. Encapsulation in enteric Eudragit L100
microparticles using a method previously used to encapsulate low molecular
weight drugs produced small particles with a high yield and encapsulation
efficiency, >90%. They restricted lactase release in acid but did not protect it
from denaturation. Porosity and particle morphology investigations using an
SEM with a new type of detector revealed surface structures which disappeared
upon dispersal in acid and an inner porous structure which may allow acid entry
and lactase denaturation. Co-encapsulation of an antacid preserved almost
10% of lactase activity in acid, superior to existing oral lactase supplements.
Insulin was not hydrolysed at gastric pH but was immediately and completely
digested by gastrointestinal enzymes. To protect it from pepsin insulin was
encapsulated in Eudragit L100 microparticles. The particles produced were
<100µm with a yield and encapsulation efficiency of >70%. After incubation
with pepsin they protected 80% of encapsulated insulin.
A small peptide, peptide 1 was gradually degraded in the intestinal fluids. To
provide protection and increase its permeability peptide 1 was encapsulated in
PLGA nanoparticles but 15% of the encapsulated peptide was immediately
released in vitro. Encapsulation of the nanoparticles in Eudragit L100
microparticles successfully prevented any burst release in acid. This should
minimise gastric digestion of peptide 1 and concentrate nanoparticle release in
the small intestine providing a higher probability of permeation.

4
Acknowledgements
Firstly I would like to thank my supervisors Dr Simon Gaisford, Dr Soma and
Professor Abdul Basit for their support and advice during my PhD, the BBSRC
and Kuecept for funding this project and Valirx for supplying peptide 1. The
Department of Pharmaceutics has provided a great deal of support during this
project especially Isabel, Martin, Catherine Baumber, John Frost, Owen and
Sunny whose HPLC expertise saved me on many occasions. Also thanks to
Alison, Chris, Rob and Adrian in stores and everyone in the library.
This project has relied heavily on microscopy and couldn’t have been
completed without the knowledge and help of Dave Gathercole, David
McCarthy and Helmut Gnagi at Diatome. Special thanks to David for his help in
investigating my holey particles, being such a great listener and always
cheering me up. I’m very grateful to Dr Richard Harbottle at Imperial College,
London for his help with the cells and Dhani and Marie for their expertise.
I would like to thank everyone I have worked with and learned from in various
labs around the school and all those who have provided gossip, laughter, tea
and biscuits in the fourth floor study room: Abeer, Alastair, Alex, Amelia,
Annabelle, Ashkan, Asma, Claire, Enrico, Felipe, Flo, Fouad, Francisco, Funmi,
Gary, Gulay, Hamid, Hazrina, Honey, Jawal, Jay, Jie, Jip, Ketan, Luis, Mansa,
Margarida, Maria, Mariarosa, Mohamed, Mustafa, Naba, Rin, Sara, Sarit, Sejal,
Shin, Tan, Veronika, Vipul, Yacoub and Zenneh. I am particularly grateful to
Mohamed for imparting his vast microparticle knowledge, Hamid for always
helping, Vipul, Shin and Jie for help with the stability studies and Felipe and
Veronika for help with tablet coating. Thanks also to my lunchtime and PGS
partner Row who I set the world to rights with daily.
My family, especially Mum, Dad and Will, have given me so much love and
support, without them I would not have completed this project. Thanks also to
my friends, particularly Catherine who listened so patiently, I’m also grateful to
Simon for not allowing me to be homeless. Finally, thanks Stephen for putting
up with me!
5
Table of contents
Chapter 1: Introduction...................................................................................26
1.1 Protein and peptide drugs.......................................................................27
1.2 Orally delivered protein and peptide drugs.............................................29
1.3 Advantages of oral delivery.....................................................................33
1.4 Oral and intestinal bioavailabilities of protein and peptide drugs............33
1.5 Barriers to oral protein/peptide drug delivery- instability.........................36
1.5.1 Gastric instability..........................................................................37
1.5.2 Small intestinal instability.............................................................41
1.5.3 Large intestinal instability.............................................................47
1.5.4 Systemic instability.......................................................................48
1.6 Barriers to oral protein/peptide drug delivery-permeability......................49
1.7 Oral protein/peptide drug delivery strategies..........................................51
1.8 Overcoming the gastric barrier................................................................52
1.9 Overcoming intestinal instability..............................................................56
1.9.1 Enzyme protection........................................................................56
1.9.2 Colonic delivery............................................................................58
1.10 Overcoming the permeation barrier........................................................59
1.10.1 Mucoadhesion............................................................................59
1.10.2 Permeation enhancers...............................................................61
1.10.3 Lipidisation.................................................................................65
1.10.4 Targeting ligands........................................................................65
1.11 Multiparticulates and emulsions..............................................................66
1.11.1 Polymeric particles.....................................................................69
6
1.11.2 Lipid particles.............................................................................70
1.11.3 Micelles......................................................................................70
1.11.4 Liposomes..................................................................................70
1.11.5 Microemulsions..........................................................................71
1.11.6 Multiparticulates- potential for oral delivery................................72
1.12 Commercial oral delivery strategies........................................................72
1.12.1 Discontinued/inactive oral delivery strategies............................72
1.12.2 Current oral delivery strategies in clinical trials..........................73
1.13 Oral protein/peptide drug delivery success and future perspective........76
1.14 Aims of project........................................................................................77
Chapter 2: Investigation of the intestinal stability of lactase and
development of its oral formulations.............................................................78
2.1 Introduction.............................................................................................79
2.1.1 Lactase structure and function.....................................................79
2.1.2 Lactose intolerance......................................................................80
2.1.3 Lactose pre-hydrolysis.................................................................81
2.1.4 Orally delivered lactase ...............................................................82
2.1.4.1 Oral lactase stability................................................82
2.1.4.2 Alternative lactase origin.........................................82
2.1.4.3 Oral lactase supplements.......................................82
2.1.5 Existing oral enzyme delivery strategies…………………………..84
2.1.6 Lactase microparticles..................................................................85
2.1.7 Enteric microparticles...................................................................86
2.2 Aims........................................................................................................88
7
2.3 Materials..................................................................................................88
2.4 Methods..................................................................................................91
2.4.1 Lactase activity-ONPG assay.......................................................91
2.4.2 Intestinal stability..........................................................................91
2.4.2.1 Human faecal slurry................................................92
2.4.3 Lactase supplements...................................................................94
2.4.4 Self emulsifying dosage form with soy bean oil............................95
2.4.5 Enteric coated lactase tablets......................................................96
2.4.5.1 Active lactase content of tablets.............................97
2.4.5.2 In vitro release from enteric lactase tablets............97
2.4.6 Preparation of enteric lactase microparticles...............................98
2.4.6.1 Particle size and yield………………………………..99
2.4.6.2 Particle morphology................................................99
2.4.6.3 Encapsulation efficiency and active lactase
loading……………………………………………………………….100
2.4.6.4 Differential scanning calorimetry (DSC)...............100
2.4.6.5 Enteric protection- in vitro release of active
lactase........................................................................................100
2.4.7 Spray drying lactase...................................................................101
2.4.8 Fluorescent labeling and visualization of lactase………………..102
2.4.9 Active lactase burst released from microparticles below pH 6...103
2.4.10 Encapsulation of pH sensitive marker......................................103
2.4.11 Cryosectioning microparticles..................................................104
2.4.12 Surface area analysis...............................................................104
8
2.4.13 Enteric microparticles with antacids.........................................106
2.4.14 Self emulsifying dosage forms with soy bean oil and lactase
microparticles........................................................................................107
2.5 Results and Discussion.........................................................................108
2.5.1 Intestinal stability........................................................................108
2.5.1.1 Gastric fluids.........................................................108
2.5.1.2 Small intestinal fluids............................................109
2.5.1.3 Colonic fluids........................................................111
2.5.1.4 Overall intestinal stability......................................112
2.5.2 Lactase supplements.................................................................114
2.5.3 Self emulsifying dosage forms with soy bean oil........................116
2.5.4 Enteric lactase tablets................................................................118
2.5.4.1 In vitro release......................................................119
2.5.5 Eudragit L100 microparticles......................................................120
2.5.6 Spray drying lactase...................................................................127
2.5.7 Eudragit L100 microparticles with spray dried lactase...............129
2.5.7.1 In vitro release………………………………………132
2.5.8 Exploration of Eudragit L100 microparticle porosity…………….134
2.5.9 Surface morphological investigation……………………………...134
2.5.10 Interior morphological investigation..........................................137
2.5.11 Eudragit L100 microparticle surface area………………………141
2.5.12 Eudragit L100 microparticles with antacids..............................142
2.5.12.1 In vitro release......................................................147
2.5.13 Eudragit L100 microparticles and soy bean oil.........................148
9
2.5.14 Overall assessment of oral lactase delivery strategies............149
2.6 Conclusion............................................................................................150
Chapter 3: Investigation of the intestinal stability of insulin and
development of is oral formulations............................................................153
3.1 Introduction...........................................................................................154
3.1.1 Insulin structure and function.....................................................154
3.1.2 Current administration of insulin…………………………………..156
3.1.3 Oral insulin…………………………………………………………..157
3.1.4 Barriers to oral delivery..............................................................157
3.1.5 Oral insulin delivery strategies...................................................158
3.1.6 Commercial oral insulin delivery.................................................159
3.1.7 Enteric multiparticulates.............................................................164
3.1.7.1 In vitro testing.......................................................164
3.1.7.2 In vivo testing........................................................166
3.1.7.3 Methods of production..........................................168
3.2 Aims………………………………………………………………………….170
3.3 Materials................................................................................................170
3.4 Methods................................................................................................171
3.4.1 Insulin intestinal stability.............................................................171
3.4.2 HPLC method.............................................................................172
3.4.3 Eudragit L100 microparticle preparation....................................172
3.4.4 Encapsulation efficiency and insulin loading.............................173
3.4.5 In vitro insulin release.................................................................173
3.4.6 Stability testing of insulin with citric acid.....................................174
10
3.4.7 Eudragit L100 microparticles with citric acid..............................174
3.5 Results..................................................................................................175
3.5.1 Insulin intestinal stability.............................................................175
3.5.2 Eudragit L100 microparticles......................................................177
3.5.2.1 In vitro insulin release...........................................180
3.5.3 Eudragit L100 microparticles with citric acid..............................186
3.6 Conclusion............................................................................................189
Chapter 4: Investigation of the intestinal stability of Peptide 1 and
development of is oral formulations............................................................191
4.1 Introduction...........................................................................................192
4.1.1 Peptide 1, function and structure................................................192
4.1.2 Chemotherapeutic peptides.......................................................193
4.1.3 Barriers to oral delivery of peptides for cancer treatment...........195
4.1.4 Oral delivery strategies investigated for peptide
chemotherapeutics................................................................................196
4.1.5 PLGA nanoparticles for oral delivery of proteins/peptides.........197
4.1.5.1 PLGA particles- stability and permeability
enhancement..............................................................................198
4.1.5.2 Formation of PLGA particles.................................199
4.1.5.3 Overcoming drug burst release from PLGA
particles......................................................................................200
4.2 Aims......................................................................................................201
4.3 Materials................................................................................................201
4.4 Methods................................................................................................202
4.4.1 Peptide 1 intestinal stability........................................................202
11
4.4.1.1 Statistics...............................................................204
4.4.2 HPLC method.............................................................................204
4.4.3 Formation of PLGA nanoparticles………………………………...204
4.4.3.1 In vitro peptide 1 release......................................207
4.4.4 Chitosan coated PLGA nanoparticles........................................207
4.4.5 Peptide 1 efficacy.......................................................................208
4.4.6 Enteric microparticles.................................................................208
4.4.6.1 Loading and encapsulation efficiency...................210
4.4.6.2 In vitro release......................................................211
4.4.7 Statistics.....................................................................................211
4.5 Results and Discussion.........................................................................211
4.5.1 Peptide 1 intestinal stability.......................................................211
4.5.1.1 Gastric fluids.........................................................211
4.5.1.2 Small intestinal fluids............................................213
4.5.1.3 Colonic fluids........................................................216
4.5.1.4 Overall intestinal stability......................................218
4.5.2 PLGA nanoparticles...................................................................219
4.5.2.1 Method development............................................219
4.5.2.2 Solvent evaporation duration................................221
4.5.2.3 In vitro release......................................................225
4.5.2.4 External aqueous phase PVA concentration........226
4.5.2.5 In vitro release......................................................230
4.5.2.6 Inner aqueous phase peptide 1 concentration......231
12
4.5.3 Chitosan coated PLGA nanoparticles........................................232
4.5.3.1 In vitro release......................................................234
4.5.4 Peptide 1 efficacy.......................................................................235
4.5.5 Enteric microencapsulation........................................................236
4.5.5.1 Microparticle size, span, yield and morphology....237
4.5.5.2 Peptide 1 loading and encapsulation efficiency....239
4.5.5.3 In vitro release......................................................240
4.6 Conclusion............................................................................................244
Chapter 5: Final conclusions and future work............................................246
5.1 Conclusion............................................................................................247
5.2 Future work...........................................................................................251
References......................................................................................................252
13
List of figures
Chapter 1
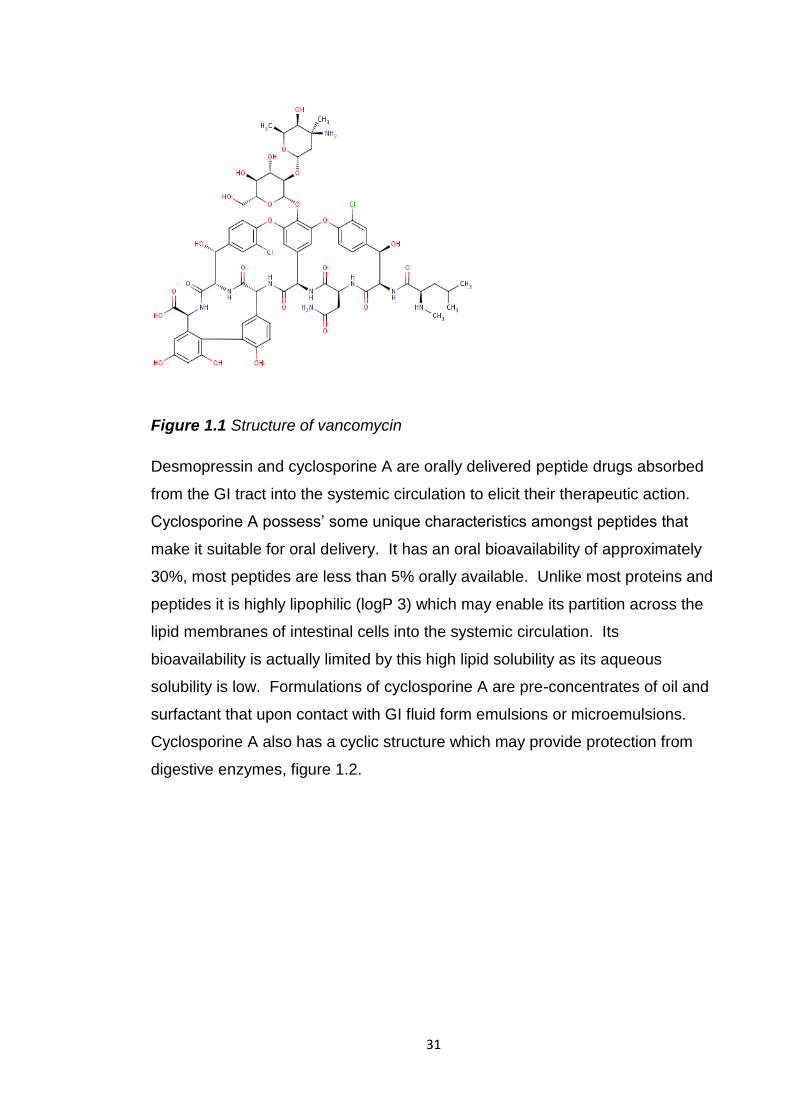
Figure 1.1 Structure of vancomycin..................................................................31
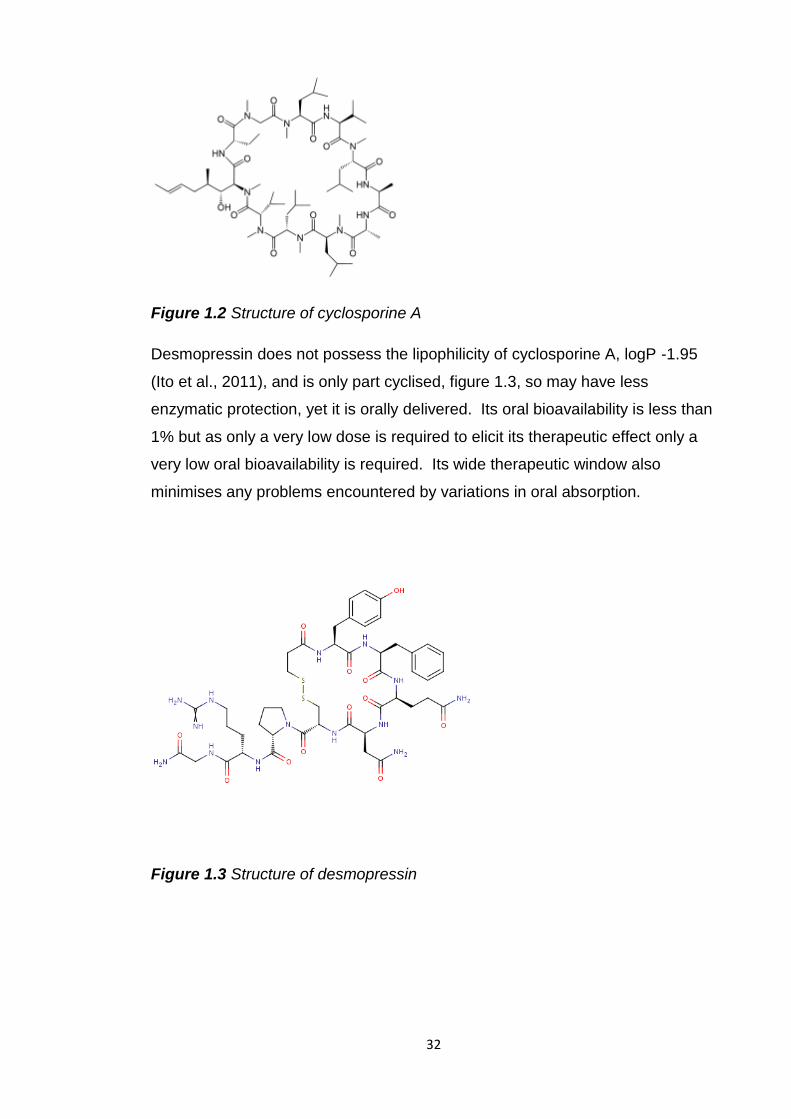
Figure 1.2 Structure of cyclosporine A..............................................................32
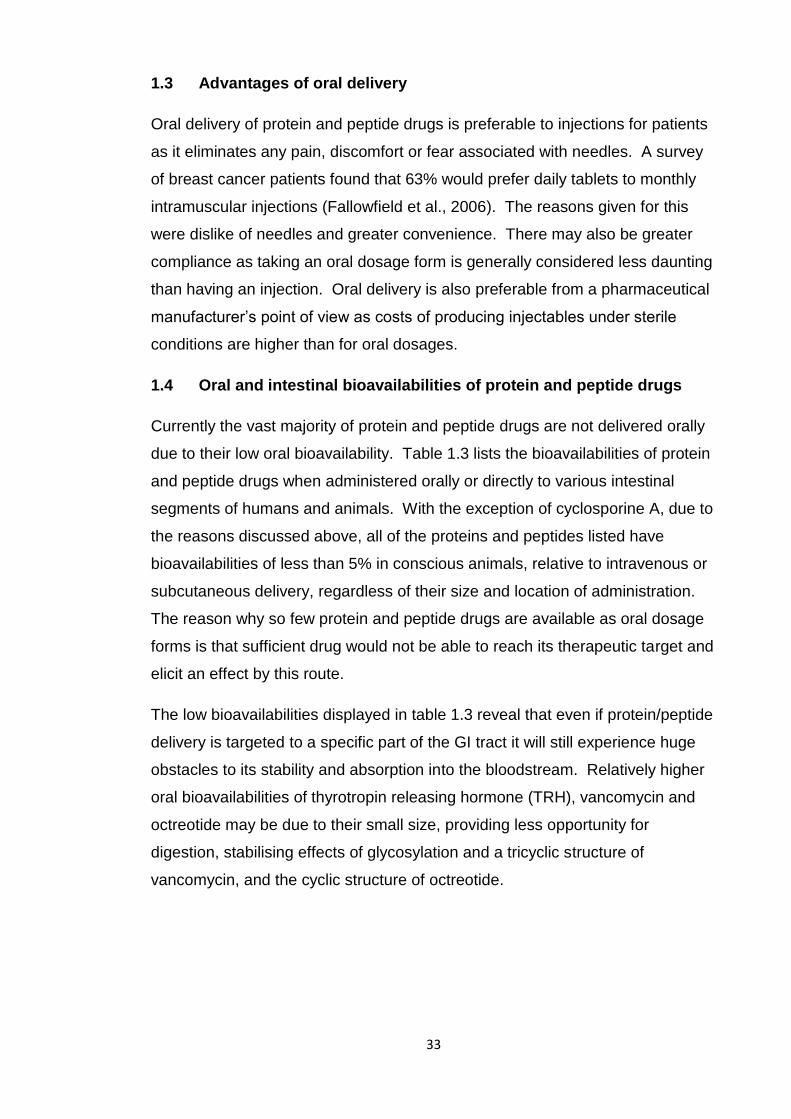
Figure 1.3 Structure of desmopressin...............................................................32
Figure 1.4 The stability and permeability barriers to oral protein and peptide
drug delivery, adapted from www.encognitive.com...........................................37
Figure 1.5 Strategies to overcome the stability and permeability barriers to oral
protein and peptide drug delivery, adapted from www.encognitive.com............52
Chapter 2
Figure 2.1 Computer simulation image based on X-ray diffraction of E.coli β-
galactosidase (Juers et al., 2000)......................................................................80
Figure 2.2 Active lactase recovered after incubation in simulated, porcine and
human intestinal fluids.....................................................................................113
Figure 2.3 Map of the stability of lactase throughout the gastrointestinal tract
from studies in simulated and porcine intestinal fluids.....................................113
Figure 2.4 Residual active lactase released from supplements after incubation
in 0.1N HCl prior to pH rise to pH 6.8..............................................................114
Figure 2.5 Light microscope image of soy bean oil, lactase and soy lecithin
formulation upon dispersion in pH 6.8 phosphate buffer.................................117
Figure 2.6 Active lactase release from uncoated and enteric coated tablets in
0.1N HCl for 2 hours and pH 6.8 phosphate buffer for 45 minutes..................120
Figure 2.7 Frequency curve of lactase microparticle size (image from Malvern
Mastersizer).....................................................................................................123
Figure 2.8 (a) and (b) SEM images of blank Eudragit L100 microparticles,
sputter coated, in a high vacuum and visualized with a 5kV beam……………124
14
Figure 2.9 (a) and (b) SEM images of microparticles encapsulating lactase,
sputter coated, in a high vacuum and visualized with a 5kV beam……………124
Figure 2.10 DSC thermograph of blank Eudragit L100 microparticles............125
Figure 2.11 DSC thermograph of lactase........................................................125
Figure 2.12 DSC thermograph of lactase loaded Eudragit L100
microparticles...................................................................................................126
Figure 2.13 Active lactase release from Eudragit L100 microparticles after
2 hours in 0.1N HCl and 45 minutes at pH 6.8…………………………………..127
Figure 2.14 SEM image of lactase powder.....................................................127
Figure 2.15 (a) and (b) SEM images of spray dried lactase…………………..128
Figure 2.16 (a) and (b) SEM images after spray dried lactase has been added
to ethanol.........................................................................................................129
Figure 2.17 Frequency curve of microparticle size with spray dried lactase
(image from Malvern Mastersizer)...................................................................130
Figure 2.18 (a) and (b) SEM images of Eudragit L100 microparticles with spray
dried lactase, sputter coated and imaged in a high vacuum with a 5kV
beam................................................................................................................131
Figure 2.19 CFLM image of encapsulated, spray dried FITC labelled lactase in
Eudragit L100 microparticles………………………………………………………131
Figure 2.20 Active lactase release from Eudragit L100 microparticles with non-
spray dried and spray dried lactase in pH 4.5 buffer for 2 hours and 45 minutes
in pH 6.8 phosphate buffer...............................................................................133
Figure 2.21 Emission from lysosensor yellow/blue dextran marker in Eudragit
L100 microparticles in dry conditions, pH 6.8 phosphate buffer and
0.1N HCl……………………………………………………………………………..134
Figure 2.22 (a) and (b) SEM images of microparticles with non-spray dried
lactase, they were not coated and visualised in a low vacuum with a 1kV
beam................................................................................................................135
15
Figure 2.23 (a) and (b) SEM images of microparticles with spray dried lactase,
they were not coated and visualised in a low vacuum with a 5 and 1kV
beam................................................................................................................135
Figure 2.24 (a), (b), (c) and (d) SEM images of blank Eudragit L100
microparticles generated using an SEM with a new back scatter detector
allowing the use of a 500 volt beam………………………………………………136
Figure 2.25 (a) and (b) SEM images of blank Eudragit L100 microparticles after
acid incubation generated using an SEM with a new back scatter detector
enabling the use of a 500 volt beam……………………………………………...137
Figure 2.26 Cryosections of blank Eudragit L100 microparticles on sample
block………………………………………………………………………………….138
Figure 2.27 TEM image of sectioned blank Eudragit L100 microparticles
mounted on a C flat grid with 2μm holes…………………………………………138
Figure 2.28 (a), (b) and (c) TEM images of cryosections of (a) blank Eudragit
L100 microparticles, (b) non-spray dried lactase loaded microparticles and
(c) spray dried lactase loaded microparticles……………………………………139
Figure 2.29 (a) and (b) SEM images of cryosectioned blank Eudragit L100
microparticles………………………………………………………………………..140
Figure 2.30 Frequency curve of the size of lactase microparticles with
encapsulated magnesium hydroxide (image from Malvern Mastersizer..........143
Figure 2.31 Frequency curve of the size of lactase microparticles with
encapsulated sodium bicarbonate (image from Malvern Mastersizer)............145
Figure 2.32 (a) and (b) SEM images of blank Eudragit L100 microparticles with
encapsulated magnesium hydroxide...............................................................145
Figure 2.33 (a) and (b) SEM images of Eudragit L100 microparticles with
encapsulated lactase and magnesium hydroxide............................................146
Figure 2.34 (a) and (b) SEM images of blank Eudragit L100 microparticles with
encapsulated sodium bicarbonate...................................................................146
16
Figure 2.35 (a) and (b) SEM images of Eudragit L100 microparticles with
encapsulated lactase and sodium bicarbonate................................................147
Figure 2.36 Active lactase release from existing and developed oral lactase
formulations after dissolution in acid and pH 6.8 phosphate buffer.................149
Chapter 3
Figure 3.1 Insulin sequence and structure………………………………………155
Figure 3.2 Computer simulation image based on X-ray diffraction of insulin
(Timofeev et al., 2010).....................................................................................155
Figure 3.3 Insulin recovery following incubation in simulated gastric and
intestinal fluids with and without enzymes, porcine small intestinal and colonic
fluids and human faecal fluids..........................................................................177
Figure 3.4 (a) & (b) SEM images of Eudragit L100 microparticles with
encapsulated insulin........................................................................................180
Figure 3.5 Insulin release from Eudragit L100 microparticles after incubation for
2 hours in SGF without pepsin followed by a pH rise to pH 6.8.......................182
Figure 3.6 Insulin release from Eudragit L100 microparticles after incubation in
either SGF with or without pepsin, or porcine gastric fluid for 2 hours and
45 minutes in pH 6.8 phosphate buffer............................................................182
Figure 3.7 HPLC chromatograms of (a) insulin (b) insulin released from
Eudragit L100 microparticles after incubation in SGF with pepsin then pH 6.8
phosphate buffer (c) insulin released from Eudragit L100 microparticles after
incubation in pig gastric fluid, then pH 6.8 phosphate buffer...........................184
Figure 3.8 (a) and (b) SEM images of insulin Eudragit L100 microparticles with
100mg of co-encapsulated citric acid...............................................................187
Figure 3.9 (a) and (b) SEM images of insulin Eudragit L100 microparticles with
30mg of co-encapsulated citric acid.................................................................188
17
Chapter 4
Figure 4.1 Double emulsion solvent evaporation method used to produce PLGA
nanoparticles encapsulating peptide 1.............................................................205
Figure 4.2 Peptide bonds of peptide 1 susceptible to chymotrypsin, trypsin and
elastase cleavage............................................................................................215
Figure 4.3 Peptide 1 recovered after incubation in simulated, porcine and
human intestinal fluids.....................................................................................218
Figure 4.4 SEM images of blank PLGA nanoparticles prepared after (a) 2 hours
solvent evaporation, (b) 4 hours solvent evaporation......................................223
Figure 4.5 SEM images of 10mg peptide 1 loaded PLGA nanoparticles
prepared after: (a) 2 hours solvent evaporation, (b) 4 hours solvent
evaporation......................................................................................................224
Figure 4.6 SEM images of 20mg peptide 1 loaded PLGA nanoparticles after:
(a) 2 hours solvent evaporation (b) 4 hours solvent evaporation.....................224
Figure 4.7 Cumulative release of peptide 1 from PLGA nanoparticles prepared
after 2 or 4 hours solvent evaporation.............................................................225
Figure 4.8 SEM images of blank PLGA nanoparticles prepared in (a) 1.25%
PVA and (b) 2.5% PVA....................................................................................229
Figure 4.9 SEM images of 10mg peptide 1 loaded PLGA nanoparticles
prepared in (a) 1.25% PVA and (b) 2.5% PVA................................................229
Figure 4.10 SEM images of 20mg peptide 1 loaded PLGA nanoparticles
prepared in (a) 1.25% PVA and (b) 2.5% PVA................................................230
Figure 4.11 Cumulative peptide 1 release from PLGA nanoparticles prepared in
an outer aqueous phase of 1.25% or 2.5% PVA.............................................230
Figure 4.12 SEM images of chitosan coated PLGA nanoparticles (a) blank
(b) 10mg peptide 1 loaded...............................................................................234
18
Figure 4.13 SEM images of Eudragit L100 microparticles (a) blank, with
encapsulated (b) peptide 1 (c) blank PLGA nanoparticles (d) peptide 1 PLGA
nanoparticles....................................................................................................238
Figure 4.14 SEM images of split Eudragit L100 microparticles (a) & (b) with
encapsulated peptide 1 PLGA nanoparticles, (c) with encapsulated
peptide 1..........................................................................................................239
Figure 4.15 Peptide 1 release from PLGA nanoparticles initially loaded with
10mg peptide 1 in 0.1N HCl for 2 hours followed by pH rise to pH 6.8............241
Figure 4.16 Peptide 1 release from Eudragit L100 microparticles in 0.1N HCl for
2 hours and 45 minutes in pH 6.8 phosphate buffer........................................241
Figure 4.17 Peptide 1 release from PLGA nanoparticles encapsulated in
Eudragit L100 microparticles in 0.1N HCl for 2 hours and 45 minutes in pH 6.8
phosphate buffer..............................................................................................242
Figure 4.18 Peptide 1 release from Eudragit L100 microparticles and from
PLGA nanoparticles encapsulated within Eudragit L100 microparticles after 2
hours in 0.1N HCl and 45 minutes in pH 6.8 phosphate buffer .......................243
19
List of tables
Chapter 1
Table 1.1 Examples of protein and peptide drugs in the BNF, their size and
indications..........................................................................................................28
Table 1.2 Orally delivered protein and peptide drugs in the BNF......................30
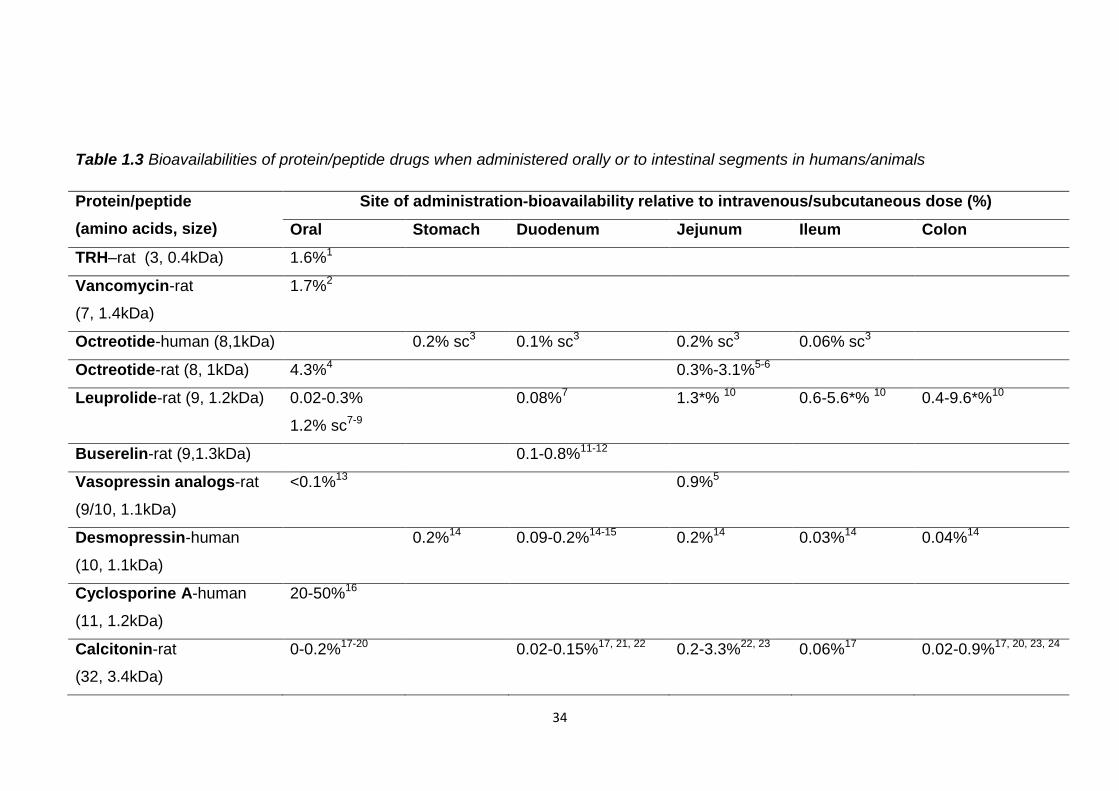
Table 1.3 Bioavailabilities of protein/peptide drugs when administered orally or
to intestinal segments in humans/animals.........................................................34
Table 1.4 Protein/peptide recovery after incubation in simulated gastric fluid
(SGF), human/animal gastric fluid and mucosa.................................................39
Table 1.5 Protein/peptide recovery and half lives (HL) after incubation in
simulated intestinal media (SIF) with pancreatin and enzyme solutions............42
Table 1.6 Stability of disulphide bridge containing peptides with glutathione....44
Table 1.7 Protein/peptide recovery and half lives (HL) after incubation in
human/animal small intestinal fluid and mucosa................................................45
Table 1.8 Protein/peptide recovery and half lives (HL) after incubation in
human/animal large intestinal, faecal fluid and mucosa....................................48
Table 1.9 Oral protein/peptide drug delivery strategies to increase stability in
gastric conditions...............................................................................................53
Table 1.10 Oral protein/peptide drug delivery strategies to overcome intestinal
enzymatic degradation………………………………………………………………57
Table 1.11 Oral protein/peptide drug delivery strategies to increase
mucoadhesion and intestinal residence duration...............................................60
Table 1.12 Oral protein/peptide drug delivery strategies to increase intestinal
permeation.........................................................................................................63
Table 1.13 Oral protein/peptide multiparticulate delivery strategies..................67
Table 1.14 Currently active oral protein/peptide drug delivery programs in
clinical trials........................................................................................................74
20
Chapter 2
Table 2.1 Active lactase release from supplements following 2 hours incubation
in simulated gastric fluid (SGF) with and without pepsin...................................83
Table 2.2 Pancreatin products available and their enteric excipients................84
Table 2.3 The ingredients, lactase content and dosage instructions for lactase
supplements tested............................................................................................90
Table 2.4 Composition of basal medium (Hughes et al., 2008).........................93
Table 2.5 Active lactase recovery after incubation in SGF and porcine gastric
fluids.................................................................................................................109
Table 2.6 Active lactase recovery after incubation in SIF and porcine small
intestinal fluids.................................................................................................110
Table 2.7 Active lactase recovery after incubation in porcine colonic and human
faecal fluids......................................................................................................111
Table 2.8 Active lactase units detected per supplement after incubation in pH
6.8 phosphate buffer for 2 hours or in 0.1N HCl for 2 hours and 45 minutes in
pH 6.8 phosphate buffer..................................................................................115
Table 2.9 Encapsulation efficiency and loading of active lactase in soy bean oil
and active lactase release after dissolution in 0.1N HCl followed by pH rise to
6.8....................................................................................................................118
Table 2.10 Active lactase loading and loading efficiency in uncoated and
Eudragit L100 coated lactase tablets...............................................................119
Table 2.11 In vitro active lactase release from uncoated and enteric coated
tablets after 2 hours in 0.1N HCl and 45 minutes in pH 6.8 phosphate
buffer................................................................................................................120
Table 2.12 Size, span, yield, encapsulation efficiency and lactase loading of
blank and lactase loaded Eudragit L100 microparticles………………………..123
Table 2.13 Size, span, yield, encapsulation efficiency and spray dried lactase
loading of Eudragit L100 microparticles…………………………………………130
21
Table 2.14 Active lactase release from Eudragit L100 microparticles with non-
spray dried and spray dried lactase in either 0.1N HCl or pH 4.5 buffer for 2
hours and 45 minutes in pH 6.8 phosphate buffer………………………………133
Table 2.15 Surface areas of blank, non-spray dried lactase and spray dried
lactase Eudragit L100 microparticles……………………………………………..142
Table 2.16 Size, span, yield, encapsulation efficiency and lactase loading of
blank and lactase loaded Eudragit L100 microparticles with encapsulated
magnesium hydroxide or sodium bicarbonate.................................................144
Table 2.17 Active lactase release after 2 hours in 0.1N HCl and 45 minutes in
pH 6.8 phosphate buffer from Eudragit L100 microparticles with magnesium
hydroxide or sodium bicarbonate and the pH of 0.1N HCl after 2 hours with
microparticles...................................................................................................147
Table 2.18 Encapsulation efficiency and loading of active lactase in a soy bean
oil formulation of lactase microparticles, active lactase release after dissolution
in 0.1N HCl and pH 6.8 phosphate buffer........................................................149
Chapter 3
Table 3.1 Delivery strategies tested in vitro and in vivo for the oral delivery of
insulin...............................................................................................................160
Table 3.2 Commercial insulin strategies past and present and their clinical
testing status....................................................................................................161
Table 3.3 Insulin release from enteric micro/nanoparticulates, in vitro, in acid
and at small intestinal pH, and its protection from pepsin................................165
Table 3.4 In vivo glucose reduction and pharmacological availability, relative to
subcutaneous (sc) insulin, of orally administered insulin loaded enteric
micro/nanoparticles in rats/rabbits...................................................................167
Table 3.5 Insulin recovery in SGF, without pepsin, and SIF, without
pancreatin........................................................................................................176
Table 3.6 Size, span, insulin loading, encapsulation efficiency and yield of
Eudragit L100 microparticles with encapsulated insulin..................................179
22
Table 3.7 Intact insulin release from Eudragit L100 microparticles after 2 hours
in SGF with and without pepsin and porcine gastric fluid followed by pH rise to
pH 6.8..............................................................................................................181
Table 3.8 Yields of blank and insulin loaded Eudragit L100 microparticles with
either 100mg or 30mg of citric acid..................................................................187
Chapter 4
Table 4.1 Molecular weight (MW) of GnRH agonists, GnRH pharmaceutical
products available and their sustained release component.............................194
Table 4.2 Peptide 1 recovery after incubation in SGF and porcine gastric
fluids.................................................................................................................212
Table 4.3 Degradation rate constants (k) and half lives of peptide 1 in SGF and
porcine gastric fluids........................................................................................213
Table 4.4 Peptide 1 recovery after incubation in SIF and porcine small intestinal
fluid..................................................................................................................214
Table 4.5 Degradation rate constants (k) and half lives of peptide 1 in simulated
and porcine small intestinal fluids....................................................................215
Table 4.6 Peptide 1 recovery in porcine colonic and human faecal fluids.......216
Table 4.7 Degradation rate constants (k) and half lives of peptide 1 in porcine
colonic and human faecal fluids calculated by regression of a first order
reaction............................................................................................................217
Table 4.8 Size, polydispersity, yield, zeta potential, encapsulation efficiency and
peptide 1 loading of blank and peptide 1 loaded PLGA nanoparticles prepared
with a solvent evaporation duration of 2 or 4 hours.........................................222
Table 4.9 Size, polydispersity, yield, zeta potential, encapsulation efficiency and
peptide 1 loading of blank and peptide 1 loaded PLGA nanoparticles prepared
in a 1.25% or 2.5% PVA outer aqueous phase................................................227
Table 4.10 Size, polydispersity, yield and charge of blank and peptide 1 loaded
PLGA nanoparticles with a chitosan coating....................................................233
23
Table 4.11 Peptide 1 loading and encapsulation efficiency in PLGA
nanoparticles with a chitosan coating..............................................................233
Table 4.12 Peptide 1 release from chitosan coated PLGA nanoparticles in
PBS..................................................................................................................234
Table 4.13 Absorbance values from PrestoBlueTM and crystal violet cell viability
assays performed on MDA-MB-231, breast cancer cells, alone and with
peptide 1 formulations......................................................................................235
Table 4.14 Size, span and yield of blank, peptide 1, peptide 1 PLGA
nanoparticles and blank nanoparticles loaded Eudragit L100 microparticles..237
Table 4.15 Peptide 1 loading and encapsulation efficiency in Eudragit L100
microparticles...................................................................................................240
24
List of abbreviations
AR Androgen receptor
BNF British National Formulary
BSA Bovine serum albumin
CFLM Confocal laser microscopy
DCM Dichloromethane
DI Deionised
EDTA Ethylenediaminetetraacetic acid
ER Estradiol receptor
GCSF Granulocyte colony stimulating factor
GI Gastrointestinal
GLP-1 Glucagon like peptide 1
GnRH Gonadotrophin releasing hormone
HCl Hydrochloric acid
HPLC High performance liquid chromatography
HPMCP hydroxypropylmethylcellulose phthalate
K Degradation rate constant
KDa Kilodalton
LHRH Luteinising hormone releasing hormone
LogP Partition coefficient
NaOH Sodium hydroxide
NDA New drug application
ONP o-nitrophenol
ONPG o-nitrophenyl-β-D-galactopyranoside
25
o/o Oil in oil emulsion
PA Pharmacological availability
PBS Phosphate buffered saline
PEG Polyethylene glycol
PLA Poly (lactic acid)
PLGA Poly (lactic-co-glycolic) acid
PVA Polyvinyl alcohol
SC Subcutaneous
SD Standard deviation
SDS Sodium dodecyl sulphate
SEDDS Self emulsifying drug delivery systems
SGF Simulated gastric fluid
SIF Simulated intestinal fluid
Src Proto-oncogene tyrosine-protein kinase
T max Time of maximum plasma concentration
TRH Thyrotropin releasing hormone
w/o/w Water in oil in water double emulsion
ZOT Zonula occludens toxin

26
Chapter 1
Introduction
27
1.1 Protein and peptide drugs
Protein and peptides are biological molecules consisting of amino acids.
Typically peptides consist of 50 amino acids or less and proteins have more
than 50 amino acids. The primary structure of proteins is the linear sequence of
amino acids, held together by peptide bonds, and any disulphide bonds
between them. Secondary structures are regular local substructures of either
alpha helix or beta sheets held together by hydrogen bonds. Tertiary structure
is the three dimensional structure of the folded protein and is held together by
hydrogen bonds, hydrophobic interactions, ionic interactions, van der Waals
forces and disulphide bonds. The three dimensional structure of a multisubunit
protein, held together by non-covalent interactions and disulphide bonds, is
defined as quaternary structure. Proteins and peptides are used as
pharmaceuticals due to their specific and vital therapeutic activities.
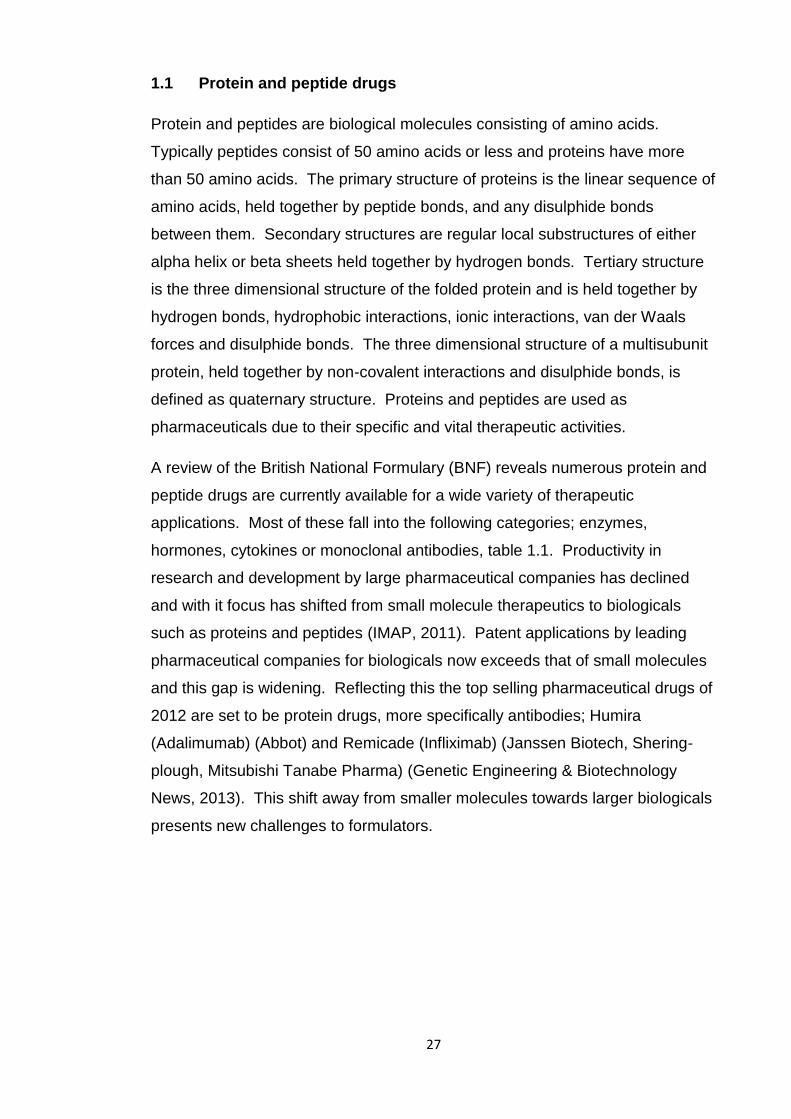
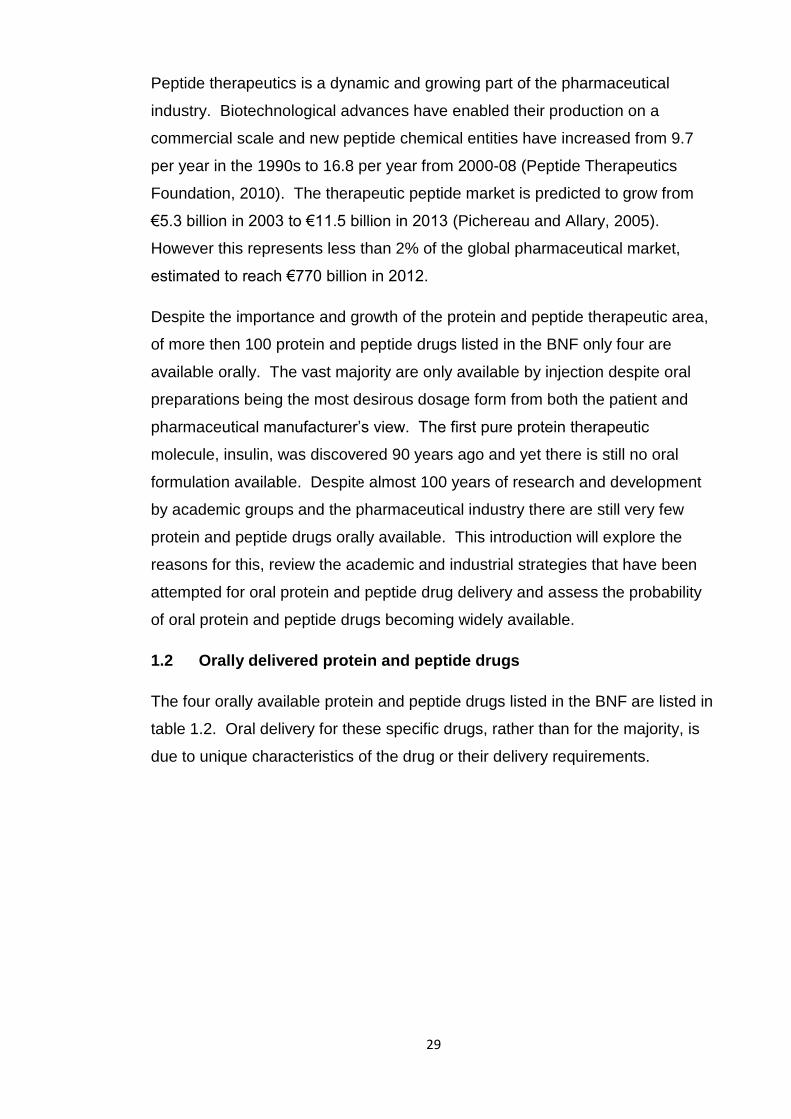
A review of the British National Formulary (BNF) reveals numerous protein and
peptide drugs are currently available for a wide variety of therapeutic
applications. Most of these fall into the following categories; enzymes,
hormones, cytokines or monoclonal antibodies, table 1.1. Productivity in
research and development by large pharmaceutical companies has declined
and with it focus has shifted from small molecule therapeutics to biologicals
such as proteins and peptides (IMAP, 2011). Patent applications by leading
pharmaceutical companies for biologicals now exceeds that of small molecules
and this gap is widening. Reflecting this the top selling pharmaceutical drugs of
2012 are set to be protein drugs, more specifically antibodies; Humira
(Adalimumab) (Abbot) and Remicade (Infliximab) (Janssen Biotech, Shering-
plough, Mitsubishi Tanabe Pharma) (Genetic Engineering & Biotechnology
News, 2013). This shift away from smaller molecules towards larger biologicals
presents new challenges to formulators.
28
Table 1.1 Examples of protein and peptide drugs in the BNF, their size and indications
Protein/peptide drugs Size (kDa) Amino
acids
Indications
Enzymes (eg lysosomal enzymes,
pancreatic enzymes)
29-320 260-2928 Cardiac disorders, lysosomal storage disorders, leukaemia
treatment, digestion aids
Hormones: (eg gonadotrophins,
vasopressin analogs, oxytocin analogs,
calcitonin, insulin)
0.4-37 3-244 Infertility treatment, hormonal cancer treatment, antidiuretic,
osteoporosis, blood glucose maintenance, growth
stimulation/inhibition, endometriosis
Cytokines: (interleukins, interferons) 15-19 132-165 Tumour shrinkage, rheumatoid arthritis, hepatitis B/C, multiple
sclerosis, lymphomas
Growth factors (eg palifermin) 16-25 109-140 Ulcer treatment, oral mucositis
Antibiotics (eg vancomycin) 1-2 9-10 Cancer, bacterial infections, tuberculosis
Vaccines (antigens, toxins) 12-150 Immunisation
Monoclonal antibodies (eg infliximab,
abciximab)
48-150 Coronary disease, Crohn’s disease, psoriasis, rheumatoid
arthritis, leukaemia, organ rejection, cancer treatment, irritable
bowel disease, multiple sclerosis
Immunoglobulins (eg hepatitis B
immunoglobulin)
150 Rheumatoid arthritis, psoriasis, prophylaxis against infection
Miscellaneous: cyclosporine A 1.2 11 Organ transplant, ulcerative colitis, rheumatoid arthritis, psoriasis
29
Peptide therapeutics is a dynamic and growing part of the pharmaceutical
industry. Biotechnological advances have enabled their production on a
commercial scale and new peptide chemical entities have increased from 9.7
per year in the 1990s to 16.8 per year from 2000-08 (Peptide Therapeutics
Foundation, 2010). The therapeutic peptide market is predicted to grow from
€5.3 billion in 2003 to €11.5 billion in 2013 (Pichereau and Allary, 2005).
However this represents less than 2% of the global pharmaceutical market,
estimated to reach €770 billion in 2012.
Despite the importance and growth of the protein and peptide therapeutic area,
of more then 100 protein and peptide drugs listed in the BNF only four are
available orally. The vast majority are only available by injection despite oral
preparations being the most desirous dosage form from both the patient and
pharmaceutical manufacturer’s view. The first pure protein therapeutic
molecule, insulin, was discovered 90 years ago and yet there is still no oral
formulation available. Despite almost 100 years of research and development
by academic groups and the pharmaceutical industry there are still very few
protein and peptide drugs orally available. This introduction will explore the
reasons for this, review the academic and industrial strategies that have been
attempted for oral protein and peptide drug delivery and assess the probability
of oral protein and peptide drugs becoming widely available.
1.2 Orally delivered protein and peptide drugs
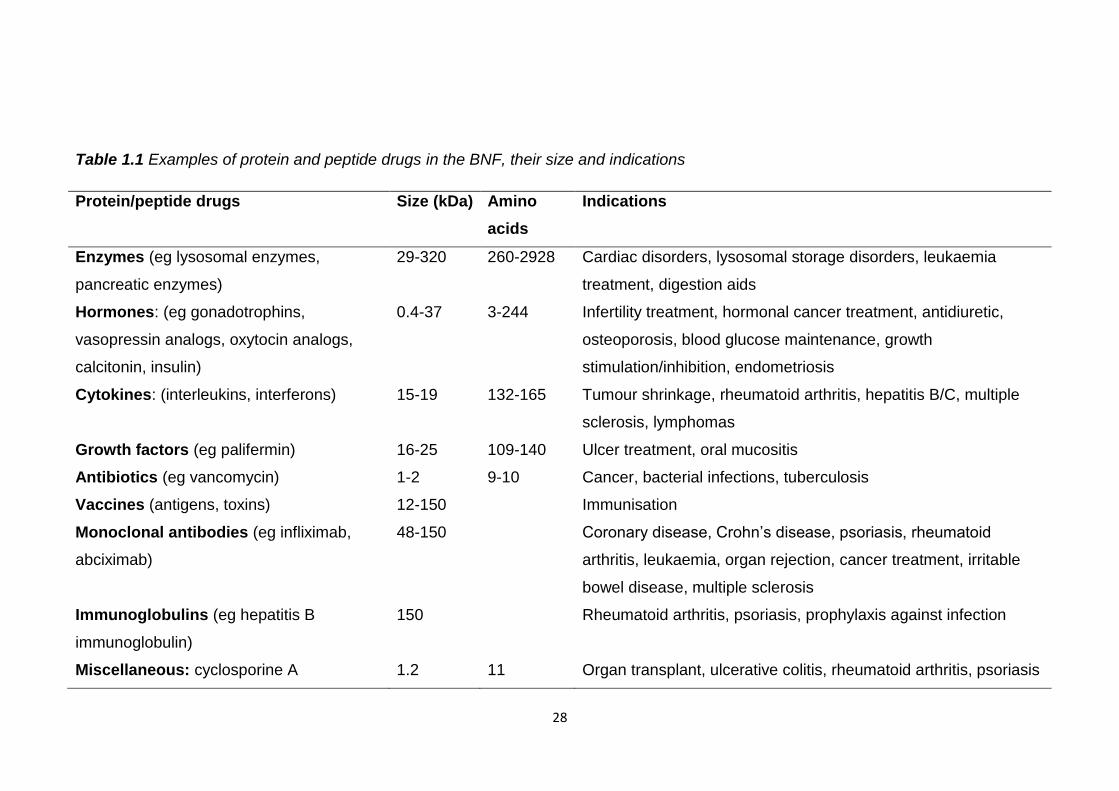
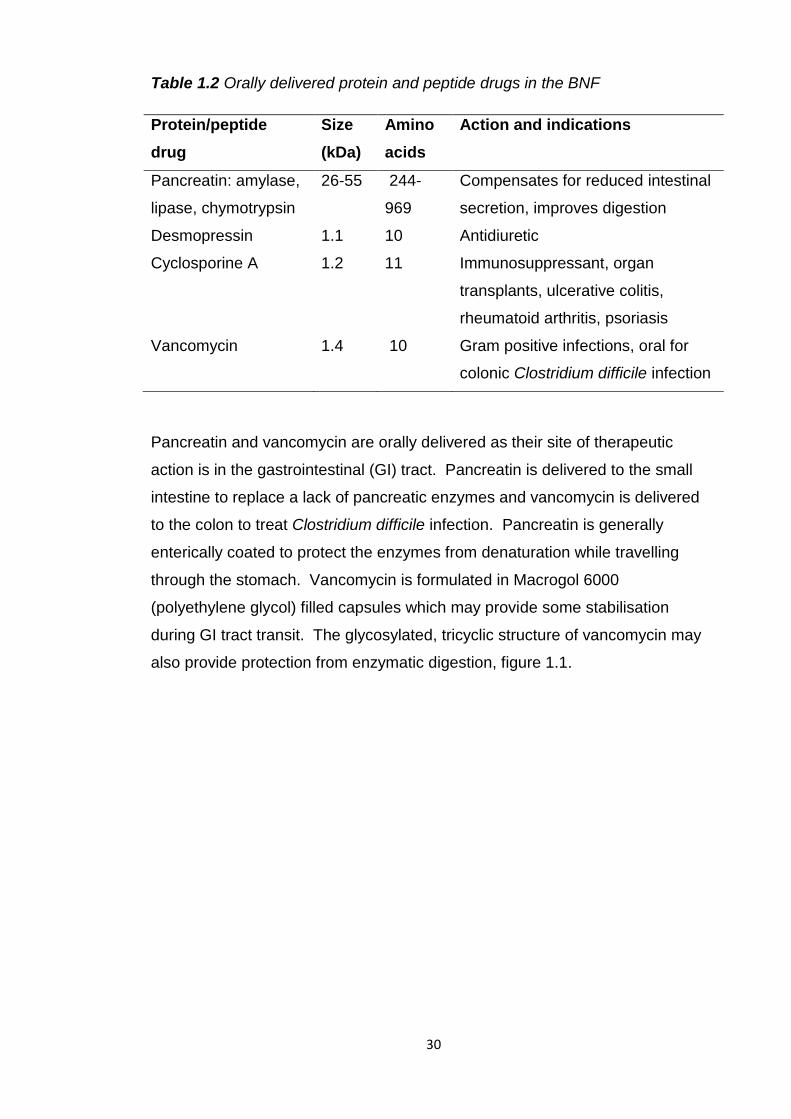
The four orally available protein and peptide drugs listed in the BNF are listed in
table 1.2. Oral delivery for these specific drugs, rather than for the majority, is
due to unique characteristics of the drug or their delivery requirements.
30
Table 1.2 Orally delivered protein and peptide drugs in the BNF
Protein/peptide
drug
Size
(kDa)
Amino
acids
Action and indications
Pancreatin: amylase,
lipase, chymotrypsin
26-55 244-
969
Compensates for reduced intestinal
secretion, improves digestion
Desmopressin 1.1 10 Antidiuretic
Cyclosporine A 1.2 11 Immunosuppressant, organ
transplants, ulcerative colitis,
rheumatoid arthritis, psoriasis
Vancomycin 1.4 10 Gram positive infections, oral for
colonic Clostridium difficile infection
Pancreatin and vancomycin are orally delivered as their site of therapeutic
action is in the gastrointestinal (GI) tract. Pancreatin is delivered to the small
intestine to replace a lack of pancreatic enzymes and vancomycin is delivered
to the colon to treat Clostridium difficile infection. Pancreatin is generally
enterically coated to protect the enzymes from denaturation while travelling
through the stomach. Vancomycin is formulated in Macrogol 6000
(polyethylene glycol) filled capsules which may provide some stabilisation
during GI tract transit. The glycosylated, tricyclic structure of vancomycin may
also provide protection from enzymatic digestion, figure 1.1.
31
Figure 1.1 Structure of vancomycin
Desmopressin and cyclosporine A are orally delivered peptide drugs absorbed
from the GI tract into the systemic circulation to elicit their therapeutic action.
Cyclosporine A possess’ some unique characteristics amongst peptides that
make it suitable for oral delivery. It has an oral bioavailability of approximately
30%, most peptides are less than 5% orally available. Unlike most proteins and
peptides it is highly lipophilic (logP 3) which may enable its partition across the
lipid membranes of intestinal cells into the systemic circulation. Its
bioavailability is actually limited by this high lipid solubility as its aqueous
solubility is low. Formulations of cyclosporine A are pre-concentrates of oil and
surfactant that upon contact with GI fluid form emulsions or microemulsions.
Cyclosporine A also has a cyclic structure which may provide protection from
digestive enzymes, figure 1.2.
32
Figure 1.2 Structure of cyclosporine A
Desmopressin does not possess the lipophilicity of cyclosporine A, logP -1.95
(Ito et al., 2011), and is only part cyclised, figure 1.3, so may have less
enzymatic protection, yet it is orally delivered. Its oral bioavailability is less than
1% but as only a very low dose is required to elicit its therapeutic effect only a
very low oral bioavailability is required. Its wide therapeutic window also
minimises any problems encountered by variations in oral absorption.
Figure 1.3 Structure of desmopressin
33
1.3 Advantages of oral delivery
Oral delivery of protein and peptide drugs is preferable to injections for patients
as it eliminates any pain, discomfort or fear associated with needles. A survey
of breast cancer patients found that 63% would prefer daily tablets to monthly
intramuscular injections (Fallowfield et al., 2006). The reasons given for this
were dislike of needles and greater convenience. There may also be greater
compliance as taking an oral dosage form is generally considered less daunting
than having an injection. Oral delivery is also preferable from a pharmaceutical
manufacturer’s point of view as costs of producing injectables under sterile
conditions are higher than for oral dosages.
1.4 Oral and intestinal bioavailabilities of protein and peptide drugs
Currently the vast majority of protein and peptide drugs are not delivered orally
due to their low oral bioavailability. Table 1.3 lists the bioavailabilities of protein
and peptide drugs when administered orally or directly to various intestinal
segments of humans and animals. With the exception of cyclosporine A, due to
the reasons discussed above, all of the proteins and peptides listed have
bioavailabilities of less than 5% in conscious animals, relative to intravenous or
subcutaneous delivery, regardless of their size and location of administration.
The reason why so few protein and peptide drugs are available as oral dosage
forms is that sufficient drug would not be able to reach its therapeutic target and
elicit an effect by this route.
The low bioavailabilities displayed in table 1.3 reveal that even if protein/peptide
delivery is targeted to a specific part of the GI tract it will still experience huge
obstacles to its stability and absorption into the bloodstream. Relatively higher
oral bioavailabilities of thyrotropin releasing hormone (TRH), vancomycin and
octreotide may be due to their small size, providing less opportunity for
digestion, stabilising effects of glycosylation and a tricyclic structure of
vancomycin, and the cyclic structure of octreotide.
34
Table 1.3 Bioavailabilities of protein/peptide drugs when administered orally or to intestinal segments in humans/animals
Protein/peptide
(amino acids, size)
Site of administration-bioavailability relative to intravenous/subcutaneous dose (%)
Oral Stomach Duodenum Jejunum Ileum Colon
TRH–rat (3, 0.4kDa) 1.6%1
Vancomycin-rat
(7, 1.4kDa)
1.7%2
Octreotide-human (8,1kDa) 0.2% sc3 0.1% sc3 0.2% sc3 0.06% sc3
Octreotide-rat (8, 1kDa) 4.3%4 0.3%-3.1%5-6
Leuprolide-rat (9, 1.2kDa) 0.02-0.3%
1.2% sc7-9
0.08%7 1.3*% 10 0.6-5.6*% 10 0.4-9.6*%10
Buserelin-rat (9,1.3kDa) 0.1-0.8%11-12
Vasopressin analogs-rat
(9/10, 1.1kDa)
<0.1%13 0.9%5
Desmopressin-human
(10, 1.1kDa)
0.2%14 0.09-0.2%14-15 0.2%14 0.03%14 0.04%14
Cyclosporine A-human
(11, 1.2kDa)
20-50%16
Calcitonin-rat
(32, 3.4kDa)
0-0.2%17-20 0.02-0.15%17, 21, 22 0.2-3.3%22, 23 0.06%17 0.02-0.9%17, 20, 23, 24
35
Calcitonin-human 0.22%25
Calcitonin-dog 0.04%26 0.06%26 0.02%26
Exenatide-rat (39, 4.2kDa) 0%27 0.005%28
Insulin-rat (51, 5.8kDa) 0.7%, <1%19, 29
Parathyroid hormone-
rat/monkey (84, 9.4kDa)
0%30, 31 0%30
Erythropoietin-rat
(106, 18kDa)
0.6%32
Interferon α-rat/rabbit
(165, 19kDa)
0%33 <1% 33
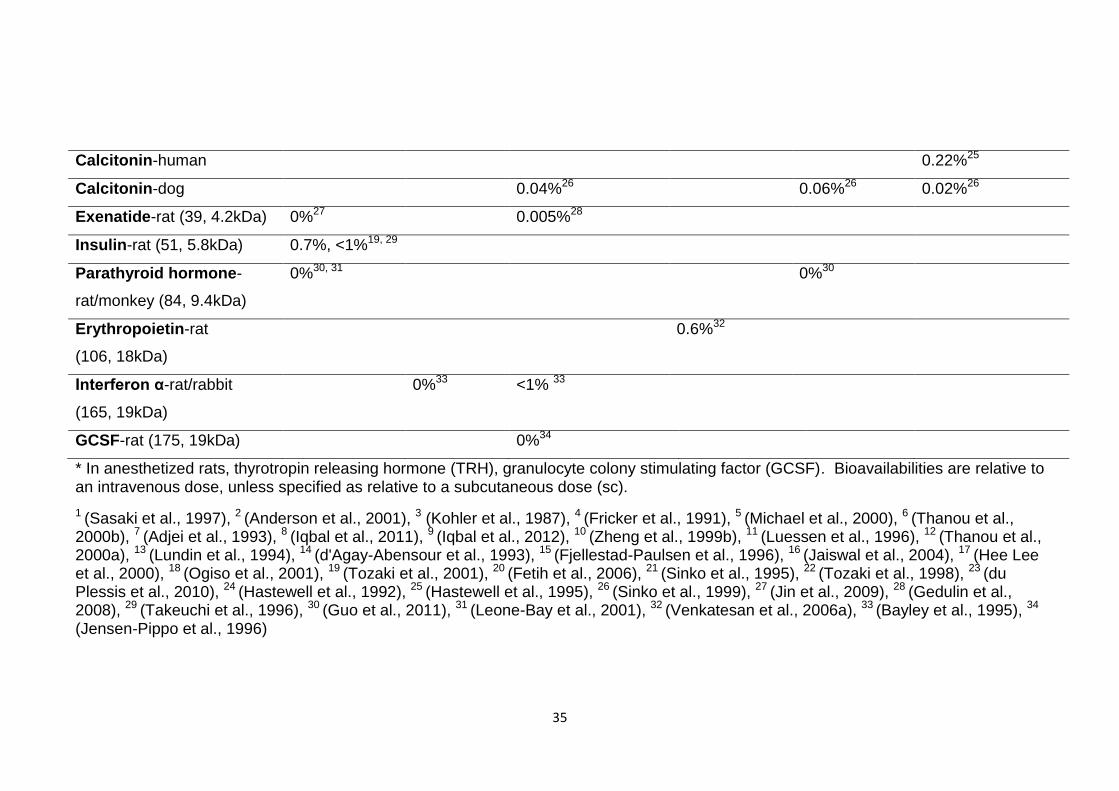
GCSF-rat (175, 19kDa) 0%34
* In anesthetized rats, thyrotropin releasing hormone (TRH), granulocyte colony stimulating factor (GCSF). Bioavailabilities are relative to an intravenous dose, unless specified as relative to a subcutaneous dose (sc).
1 (Sasaki et al., 1997), 2 (Anderson et al., 2001), 3 (Kohler et al., 1987), 4 (Fricker et al., 1991), 5 (Michael et al., 2000), 6 (Thanou et al., 2000b), 7 (Adjei et al., 1993), 8 (Iqbal et al., 2011), 9 (Iqbal et al., 2012), 10 (Zheng et al., 1999b), 11 (Luessen et al., 1996), 12 (Thanou et al., 2000a), 13 (Lundin et al., 1994), 14 (d'Agay-Abensour et al., 1993), 15 (Fjellestad-Paulsen et al., 1996), 16 (Jaiswal et al., 2004), 17 (Hee Lee et al., 2000), 18 (Ogiso et al., 2001), 19 (Tozaki et al., 2001), 20 (Fetih et al., 2006), 21 (Sinko et al., 1995), 22 (Tozaki et al., 1998), 23 (du Plessis et al., 2010), 24 (Hastewell et al., 1992), 25 (Hastewell et al., 1995), 26 (Sinko et al., 1999), 27 (Jin et al., 2009), 28 (Gedulin et al., 2008), 29 (Takeuchi et al., 1996), 30 (Guo et al., 2011), 31 (Leone-Bay et al., 2001), 32 (Venkatesan et al., 2006a), 33 (Bayley et al., 1995), 34
(Jensen-Pippo et al., 1996)
36
Of the intestinal segments the jejunum appears to be the most favourable for
successful absorption. Possibly the enzyme concentration is lower here than in
other segments, there is greater surface area for absorption or it is more
permeable to protein and peptide drugs. Despite the lack of secretion of
intestinal enzymes in the colon bioavailabilities of drugs administered here were
less than 1% in conscious animals. This suggests they are vulnerable to
microbial mediated fermentation and enzymes. The smaller surface area for
absorption and the tighter intercellular channels, compared to the small
intestine, may also have restricted bioavailability.
All the proteins and peptides listed in table 1.3 are hormones, with the exception
of interferon α, cyclosporine A and vancomycin, and therefore not completely
representative of all therapeutic protein and peptide drugs. Research may have
focused on these due to their relatively small size and they may be easier to
obtain than some of the larger and more expensive proteins such as
monoclonal antibodies. Most of the studies have not been conducted in
humans so they may not represent what would happen upon oral administration
to humans. However, the results show that generally, regardless of size,
structure, site of administration and subject, protein and peptide drugs have
very low oral bioavailabilities, <5%, and therefore cannot be administered in
standard oral tablet or capsule formulations.
1.5 Barriers to oral protein/peptide drug delivery- instability
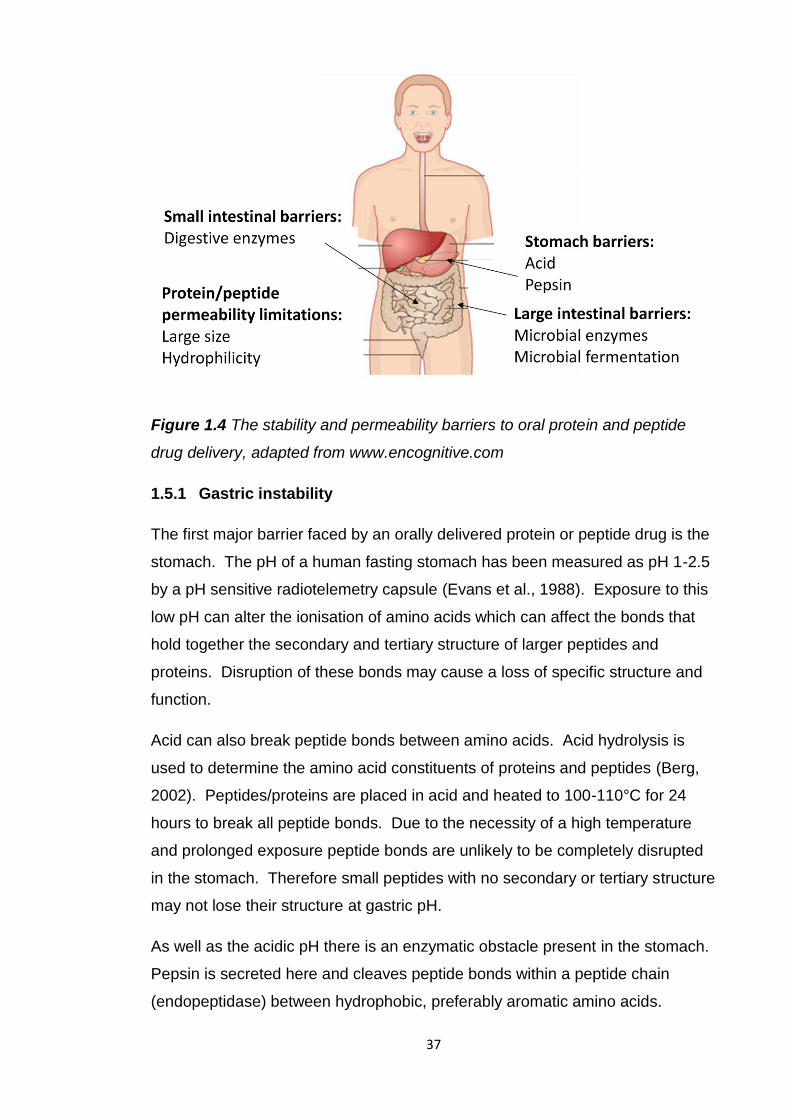
The major barriers to oral protein/peptide drug delivery are illustrated in figure
1.4. The GI tract is designed to digest proteins and peptides and thus it plays a
major role in the bioavailability of orally delivered protein and peptide drugs.
Protein and peptide digestion is initiated by acid and pepsin in the stomach and
continued throughout the small intestine by a multitude of proteases and
peptidases in its lumen and along the intestinal wall. Should any proteins or
peptides enter the large intestine intact they may be digested or fermented by
its large population of bacteria. These processes necessary for protein
digestion work antagonistically to the oral delivery of intact protein/peptide
drugs.
37
Figure 1.4 The stability and permeability barriers to oral protein and peptide
drug delivery, adapted from www.encognitive.com
1.5.1 Gastric instability
The first major barrier faced by an orally delivered protein or peptide drug is the
stomach. The pH of a human fasting stomach has been measured as pH 1-2.5
by a pH sensitive radiotelemetry capsule (Evans et al., 1988). Exposure to this
low pH can alter the ionisation of amino acids which can affect the bonds that
hold together the secondary and tertiary structure of larger peptides and
proteins. Disruption of these bonds may cause a loss of specific structure and
function.
Acid can also break peptide bonds between amino acids. Acid hydrolysis is
used to determine the amino acid constituents of proteins and peptides (Berg,
2002). Peptides/proteins are placed in acid and heated to 100-110°C for 24
hours to break all peptide bonds. Due to the necessity of a high temperature
and prolonged exposure peptide bonds are unlikely to be completely disrupted
in the stomach. Therefore small peptides with no secondary or tertiary structure
may not lose their structure at gastric pH.
As well as the acidic pH there is an enzymatic obstacle present in the stomach.
Pepsin is secreted here and cleaves peptide bonds within a peptide chain
(endopeptidase) between hydrophobic, preferably aromatic amino acids.
38
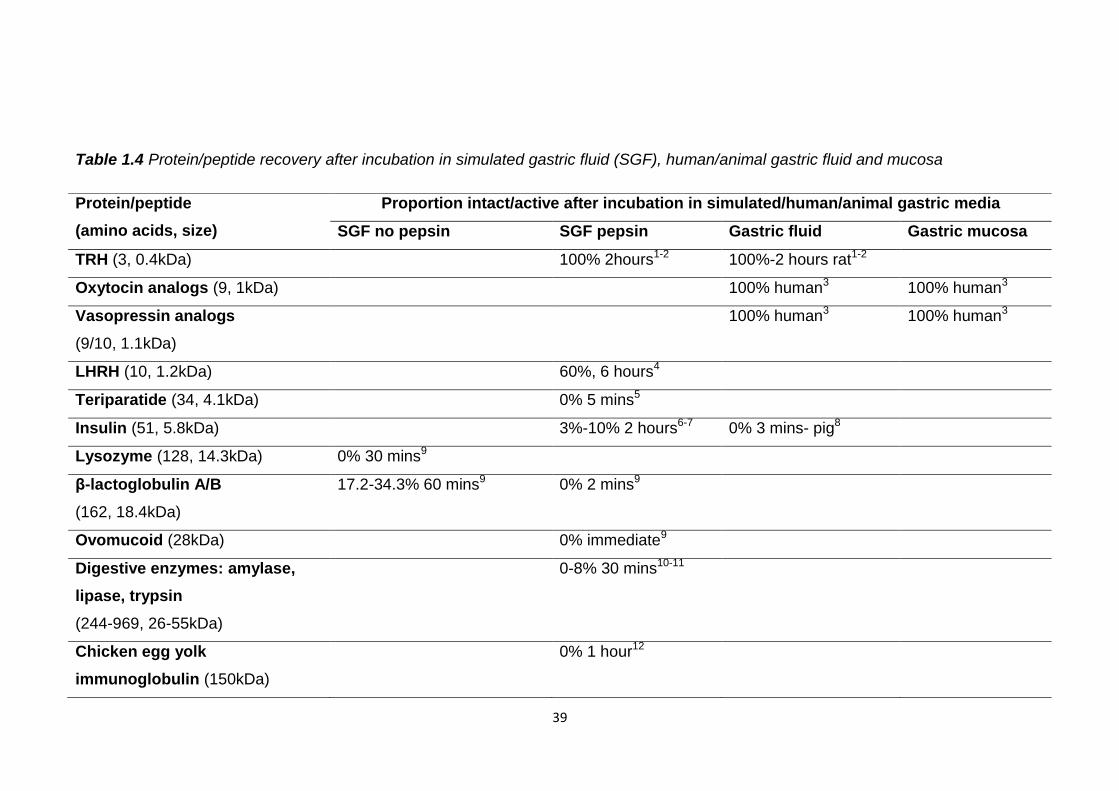
Table 1.4 indicates that the gastric stability of peptides and proteins is at least
partly dependent on their size. The smaller peptides, vasopressin, oxytocin and
TRH analogues appear to be completely stable in simulated, human and animal
gastric fluids and mucosa. This may be due to their lack of higher structure
which could be disrupted by the low pH. They also appear to be stable in the
presence of pepsin which may mean they lack specific pepsin cleavage motifs
or are partially protected by disulphide bridges as in oxytocin and vasopressin.
The larger peptides and proteins such as the digestive enzymes, insulin and
teriparatide appear to be susceptible to gastric denaturation of their secondary
and tertiary structures.
These results suggest for successful oral delivery gastric protection is
necessary for larger peptides and proteins and those containing pepsin
cleavage sites. However, protection in the stomach is not needed for all
proteins and peptides. Assessment of gastric stability is beneficial to not only
discover where protection is needed for orally administered protein/peptide
drugs but also to assess where protection is not required as this will reduce
manufacturing costs and make oral delivery more achievable.
39
Table 1.4 Protein/peptide recovery after incubation in simulated gastric fluid (SGF), human/animal gastric fluid and mucosa
Protein/peptide
(amino acids, size)
Proportion intact/active after incubation in simulated/human/animal gastric media
SGF no pepsin SGF pepsin Gastric fluid Gastric mucosa
TRH (3, 0.4kDa) 100% 2hours1-2 100%-2 hours rat1-2
Oxytocin analogs (9, 1kDa) 100% human3 100% human3
Vasopressin analogs
(9/10, 1.1kDa)
100% human3 100% human3
LHRH (10, 1.2kDa) 60%, 6 hours4
Teriparatide (34, 4.1kDa) 0% 5 mins5
Insulin (51, 5.8kDa) 3%-10% 2 hours6-7 0% 3 mins- pig8
Lysozyme (128, 14.3kDa) 0% 30 mins9
β-lactoglobulin A/B
(162, 18.4kDa)
17.2-34.3% 60 mins9 0% 2 mins9
Ovomucoid (28kDa) 0% immediate9
Digestive enzymes: amylase,
lipase, trypsin
(244-969, 26-55kDa)
0-8% 30 mins10-11
Chicken egg yolk
immunoglobulin (150kDa)
0% 1 hour12
40
Luteinising hormone releasing hormone (LHRH)
1 (Sasaki et al., 1997), 2 (Khomane et al., 2011), 3 (Fjellestad-Paulsen et al., 1995), 4 (Kafka et al., 2011), 5 (Werle et al., 2006), 6 (Han et al., 2012), 7(Jain et al., 2012), 8 (Werle et al., 2008), 9 (Zheng et al., 2010), 10 (Scocca et al., 2007), 11 (Massicotte et al., 2008), 12 (Li et al., 2009)
41
1.5.2 Small intestinal instability
The small intestine is the major site of protein and peptide digestion and
represents a barrier to oral protein and peptide drug delivery. The pH of the
gastrointestinal tract rises to pH 6.6 in the proximal small intestine and rises to
pH 7.5 in the terminal ileum (Evans et al., 1988). The small intestine contains
luminally secreted proteases and membrane bound peptidases which can
digest protein and peptide drugs. They may also be subject to degradation by
thiol-disulfide exchange reactions if they contain cysteine residues
The major enzymes secreted into the small intestine are the endopeptidases
trypsin, chymotrypsin and elastase and the exopeptidases aminopeptidase and
carboxypeptidase. These cleave within or from the ends of peptide chains
according to their cleavage specificities. Identification of a cleavage motif within
a peptide chain may not definitely indicate digestion by a specific enzyme.
Cleavage is not just dependent on the presence of a vulnerable peptide bond
but the size and position of other amino acids in the peptide sequence.
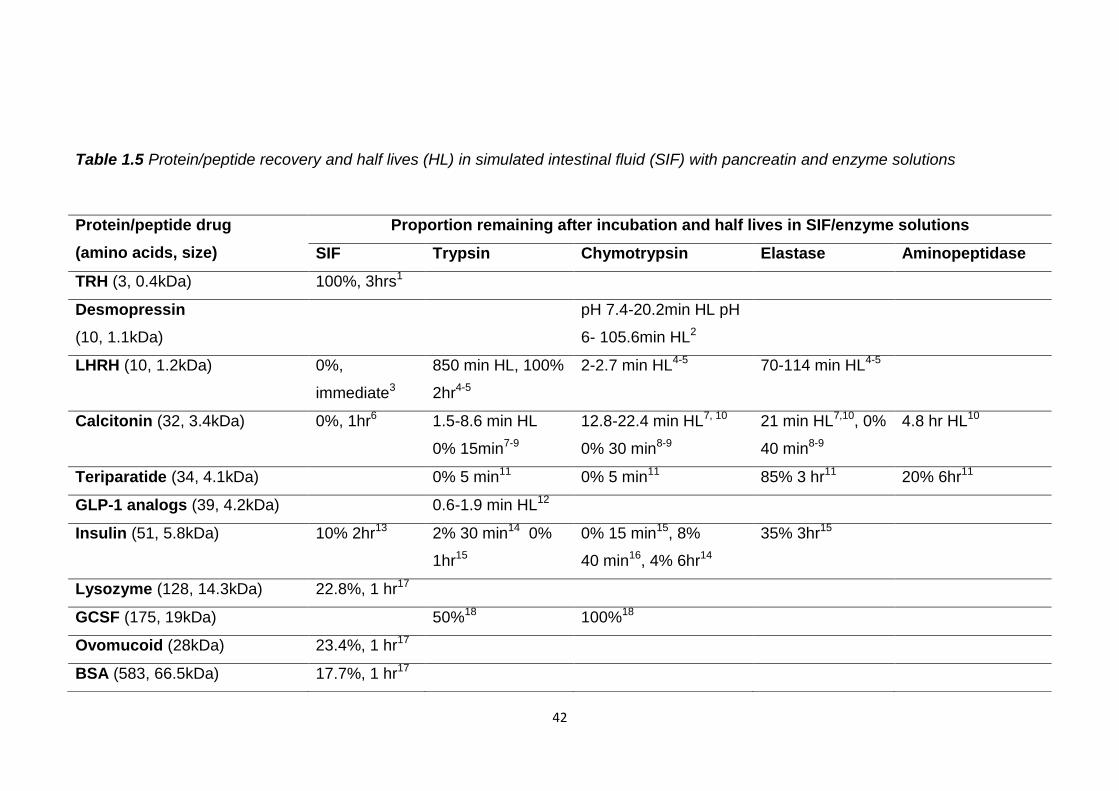
Investigations of protein and peptide stability in simulated intestinal fluid and
enzyme solutions are summarised in table 1.5. With the exception of TRH there
is a general trend that proteins are more stable than peptides in these
conditions. This may be because proteins do not have as easily accessible
cleavable peptide bonds as their peptide chains are involved in complex
secondary and tertiary structures. However, if orally delivered these structures
may be unfolded in the stomach and so would be more vulnerable to enzymatic
digestion.
Trypsin and chymotrypsin appear to be the most degradative towards peptides
and proteins and so for successful oral delivery these enzymes should be
specifically inhibited. A reduction of pH to pH 6 reduced the degradation of
desmopressin by chymotrypsin so this may be used to inhibit intestinal enzymes
(Fredholt et al., 1999).
42
Table 1.5 Protein/peptide recovery and half lives (HL) in simulated intestinal fluid (SIF) with pancreatin and enzyme solutions
Protein/peptide drug
(amino acids, size)
Proportion remaining after incubation and half lives in SIF/enzyme solutions
SIF Trypsin Chymotrypsin Elastase Aminopeptidase
TRH (3, 0.4kDa) 100%, 3hrs1
Desmopressin
(10, 1.1kDa)
pH 7.4-20.2min HL pH
6- 105.6min HL2
LHRH (10, 1.2kDa) 0%,
immediate3
850 min HL, 100%
2hr4-5
2-2.7 min HL4-5 70-114 min HL4-5
Calcitonin (32, 3.4kDa) 0%, 1hr6 1.5-8.6 min HL
0% 15min7-9
12.8-22.4 min HL7, 10
0% 30 min8-9
21 min HL7,10, 0%
40 min8-9
4.8 hr HL10
Teriparatide (34, 4.1kDa) 0% 5 min11 0% 5 min11 85% 3 hr11 20% 6hr11
GLP-1 analogs (39, 4.2kDa) 0.6-1.9 min HL12
Insulin (51, 5.8kDa) 10% 2hr13 2% 30 min14 0%
1hr15
0% 15 min15, 8%
40 min16, 4% 6hr14
35% 3hr15
Lysozyme (128, 14.3kDa) 22.8%, 1 hr17
GCSF (175, 19kDa) 50%18 100%18
Ovomucoid (28kDa) 23.4%, 1 hr17
BSA (583, 66.5kDa) 17.7%, 1 hr17
43
Glucagon like peptide 1 (GLP-1), bovine serum albumin (BSA)
1 (Khomane et al., 2011), 2 (Fredholt et al., 1999), 3 (Kafka et al., 2011), 4 (Wen et al., 2002c), 5 (Walker et al., 2001), 6 (Lee et al., 2010), 7 (Lu et al., 1999), 8 (Ryan et al., 2011), 9 (Shah and Khan, 2004), 10 (Youn et al., 2006), 11 (Werle et al., 2006), 12 (Jin et al., 2009), 13 (Jain et al., 2012), 14 (Agarwal et al., 2001), 15 (Werle et al., 2008), 16 (Schilling and Mitra, 1991), 17 (Zheng et al., 2010), 18 (Jensen-Pippo et al., 1996)
44
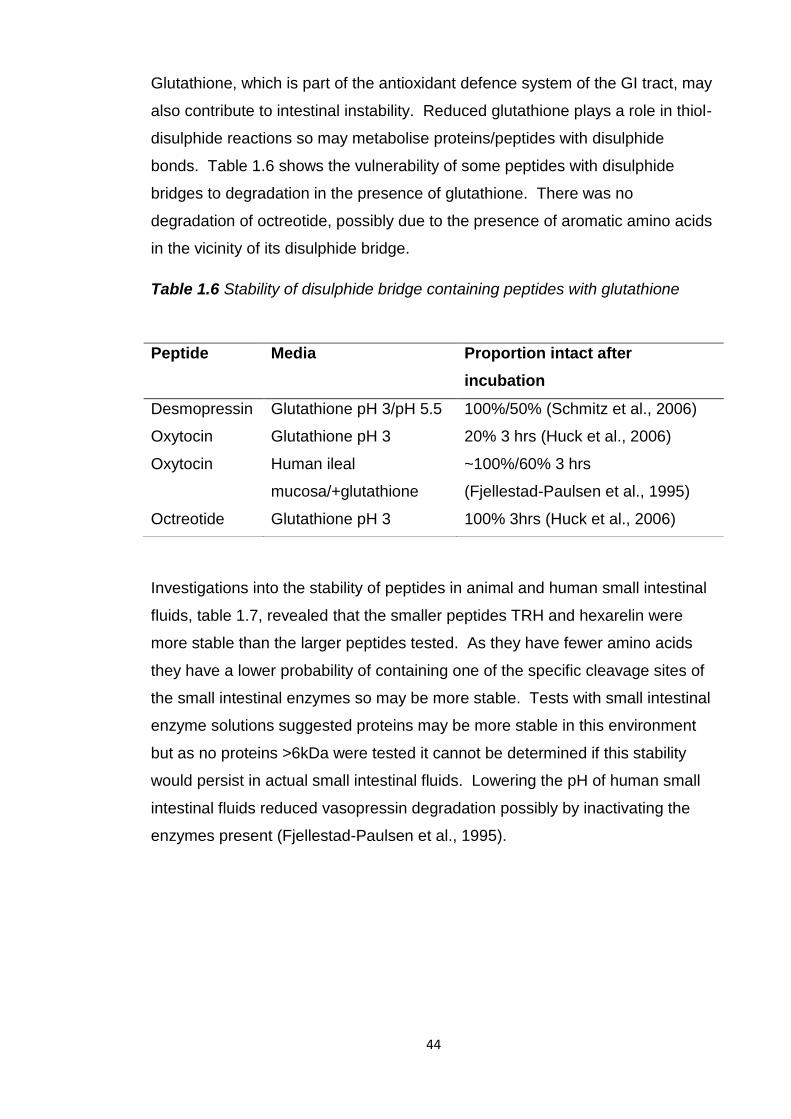
Glutathione, which is part of the antioxidant defence system of the GI tract, may
also contribute to intestinal instability. Reduced glutathione plays a role in thiol-
disulphide reactions so may metabolise proteins/peptides with disulphide
bonds. Table 1.6 shows the vulnerability of some peptides with disulphide
bridges to degradation in the presence of glutathione. There was no
degradation of octreotide, possibly due to the presence of aromatic amino acids
in the vicinity of its disulphide bridge.
Table 1.6 Stability of disulphide bridge containing peptides with glutathione
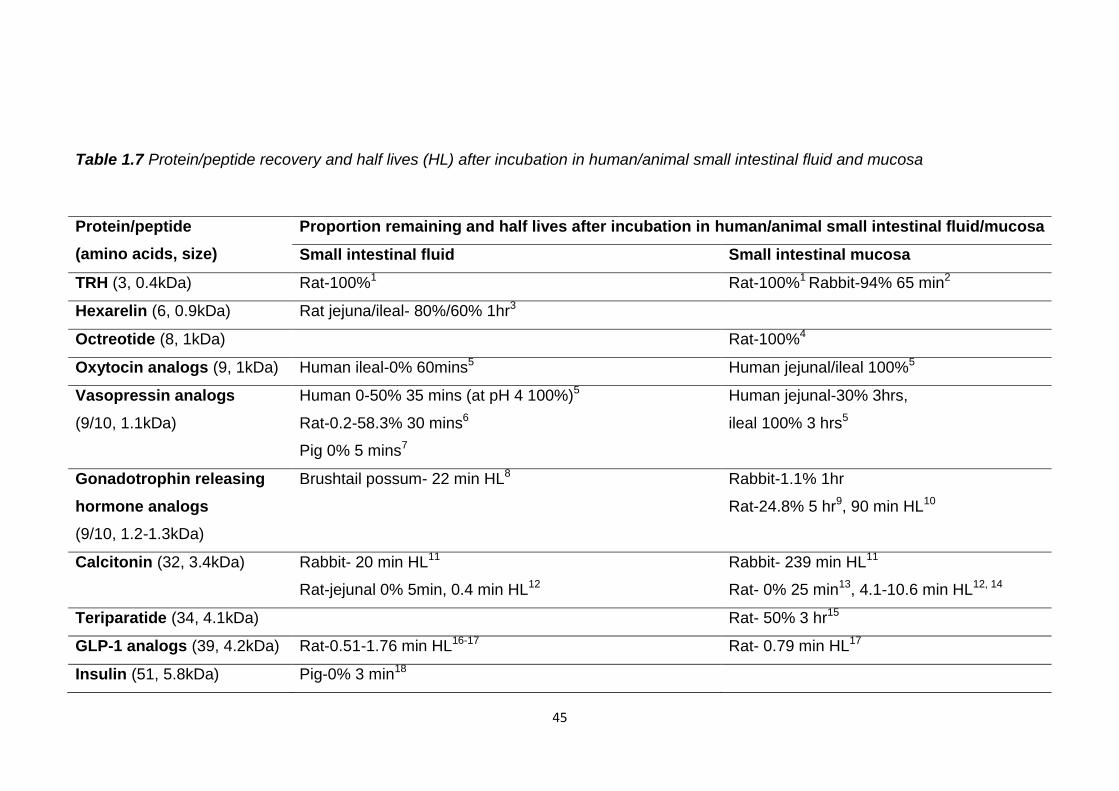
Investigations into the stability of peptides in animal and human small intestinal
fluids, table 1.7, revealed that the smaller peptides TRH and hexarelin were
more stable than the larger peptides tested. As they have fewer amino acids
they have a lower probability of containing one of the specific cleavage sites of
the small intestinal enzymes so may be more stable. Tests with small intestinal
enzyme solutions suggested proteins may be more stable in this environment
but as no proteins >6kDa were tested it cannot be determined if this stability
would persist in actual small intestinal fluids. Lowering the pH of human small
intestinal fluids reduced vasopressin degradation possibly by inactivating the
enzymes present (Fjellestad-Paulsen et al., 1995).
Peptide Media Proportion intact after
incubation
Desmopressin Glutathione pH 3/pH 5.5 100%/50% (Schmitz et al., 2006)
Oxytocin Glutathione pH 3 20% 3 hrs (Huck et al., 2006)
Oxytocin Human ileal
mucosa/+glutathione
~100%/60% 3 hrs
(Fjellestad-Paulsen et al., 1995)
Octreotide Glutathione pH 3 100% 3hrs (Huck et al., 2006)
45
Table 1.7 Protein/peptide recovery and half lives (HL) after incubation in human/animal small intestinal fluid and mucosa
Protein/peptide
(amino acids, size)
Proportion remaining and half lives after incubation in human/animal small intestinal fluid/mucosa
Small intestinal fluid Small intestinal mucosa
TRH (3, 0.4kDa) Rat-100%1 Rat-100%1 Rabbit-94% 65 min2
Hexarelin (6, 0.9kDa) Rat jejuna/ileal- 80%/60% 1hr3
Octreotide (8, 1kDa) Rat-100%4
Oxytocin analogs (9, 1kDa) Human ileal-0% 60mins5 Human jejunal/ileal 100%5
Vasopressin analogs
(9/10, 1.1kDa)
Human 0-50% 35 mins (at pH 4 100%)5
Rat-0.2-58.3% 30 mins6
Pig 0% 5 mins7
Human jejunal-30% 3hrs,
ileal 100% 3 hrs5
Gonadotrophin releasing
hormone analogs
(9/10, 1.2-1.3kDa)
Brushtail possum- 22 min HL8 Rabbit-1.1% 1hr
Rat-24.8% 5 hr9, 90 min HL10
Calcitonin (32, 3.4kDa) Rabbit- 20 min HL11
Rat-jejunal 0% 5min, 0.4 min HL12
Rabbit- 239 min HL11
Rat- 0% 25 min13, 4.1-10.6 min HL12, 14
Teriparatide (34, 4.1kDa) Rat- 50% 3 hr15
GLP-1 analogs (39, 4.2kDa) Rat-0.51-1.76 min HL16-17 Rat- 0.79 min HL17
Insulin (51, 5.8kDa) Pig-0% 3 min18
46
1 (Sasaki et al., 1997), 2 (Thwaites et al., 1993), 3 (Fagerholm et al., 1998), 4 (Fricker et al., 1991), 5 (Fjellestad-Paulsen et al., 1995), 6 (Lundin et al., 1994), 7 (Lundin et al., 1989), 8 (Wen et al., 2002c), 9 (Guo et al., 2004), 10 (Zheng et al., 1999a), 11 (Lu et al., 1999), 12 (Ogiso et al., 2001), 13 (Tozaki et al., 1998), 14 (Youn et al., 2006), 15 (Werle et al., 2006), 16 (Jin et al., 2009), 17 (Youn et al., 2008), 18 (Werle et al., 2008)
47
Degradation of peptides was generally reduced in the intestinal mucosal
homogenates (Fjellestad-Paulsen et al., 1995) and proteolytic activity was found
to be reduced here compared to the lumen (Wen et al., 2002c). There may be
fewer enzymes here capable of digesting larger peptide chains as usually when
they arrive at the mucosal membranes they have been digested to tri and
dipeptides. Protein and peptide drugs could be targeted to the intestinal
mucosa for release as here they will encounter less digestion.
Different regions of the intestinal tract have been found to have differing
proteolytic activities. The luminal and mucosal extracts from the jejunum of the
rat and brushtail possum were found to have greater proteolytic activity than
those from the ileum (Wen et al., 2002c, Tozaki et al., 1998). LHRH was most
degraded in brushtail possum luminal and mucosal extracts from the jejunum
than the ileum or duodenum (Wen et al., 2002a, Wen et al., 2002b). Despite
this, bioavailability of protein and peptide drugs tended to be greater when
administered to the jejunum than from the duodenum or ileum, table 1.3.
Possibly the opportunity for absorption into the systemic circulation is far greater
from the jejunum than the other intestinal segments and so overcomes the
greater proteolytic activity.
1.5.3 Large intestinal instability
Proteolytic activity in the large intestinal fluids and mucosa has been found to
be lower than in the small intestine of brushtail possums (Wen et al., 2002c)
and rats (Tozaki et al., 1998). LHRH degradation was least in the colonic
contents of a brushtail possum intestine (Wen et al., 2002a, Wen et al., 2002b).
Glatiramer acetate degradation was also lower in rat colonic mucosa compared
to the other intestinal segments (Haupt et al., 2002). Desmopressin
degradation was lowest in the colonic contents from a rat compared to extracts
from small intestinal segments, however vasopressin was degraded mainly in
the colonic contents (Ungell et al., 1992). This reduced proteolytic activity may
make the large intestine a more attractive target for oral protein and peptide
drug delivery than the small intestine.
Table 1.8 shows that despite reduced proteolytic activity in the large intestine
protein/peptide degradation still occurs and would need to be minimised for oral
delivery strategies targeted here.
48
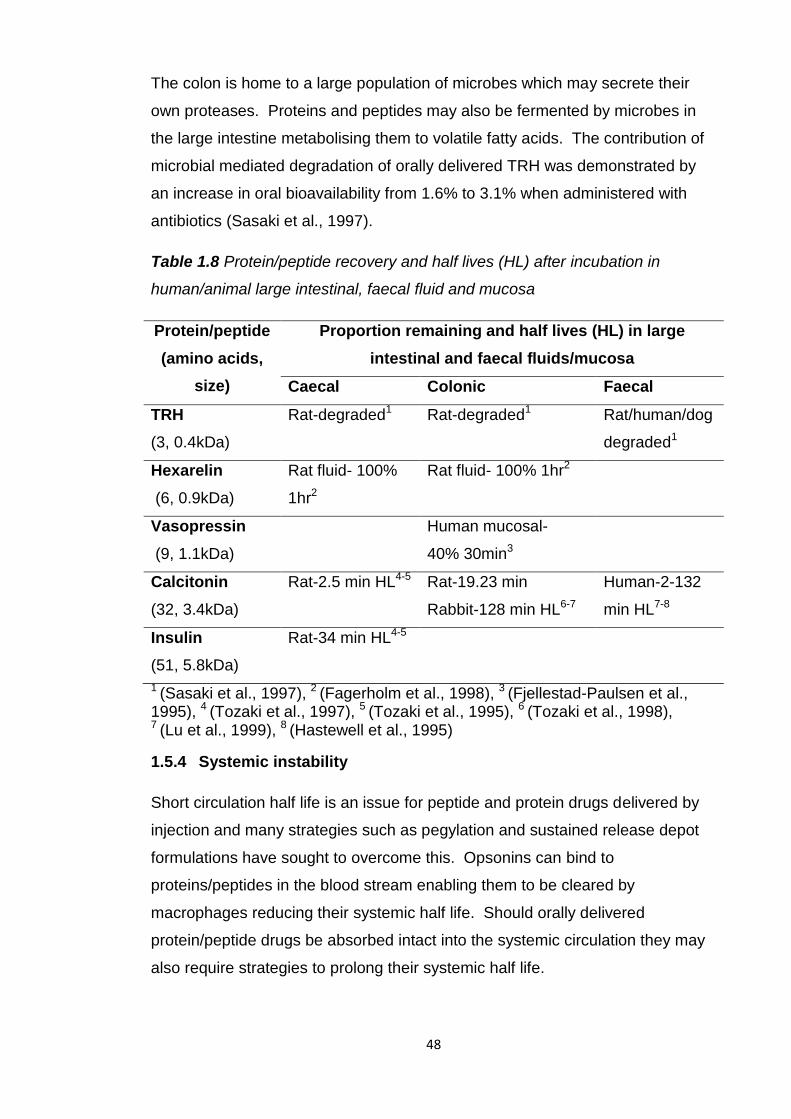
The colon is home to a large population of microbes which may secrete their
own proteases. Proteins and peptides may also be fermented by microbes in
the large intestine metabolising them to volatile fatty acids. The contribution of
microbial mediated degradation of orally delivered TRH was demonstrated by
an increase in oral bioavailability from 1.6% to 3.1% when administered with
antibiotics (Sasaki et al., 1997).
Table 1.8 Protein/peptide recovery and half lives (HL) after incubation in
human/animal large intestinal, faecal fluid and mucosa
Protein/peptide
(amino acids,
size)
Proportion remaining and half lives (HL) in large
intestinal and faecal fluids/mucosa
Caecal Colonic Faecal
TRH
(3, 0.4kDa)
Rat-degraded1 Rat-degraded1 Rat/human/dog
degraded1
Hexarelin
(6, 0.9kDa)
Rat fluid- 100%
1hr2
Rat fluid- 100% 1hr2
Vasopressin
(9, 1.1kDa)
Human mucosal-
40% 30min3
Calcitonin
(32, 3.4kDa)
Rat-2.5 min HL4-5 Rat-19.23 min
Rabbit-128 min HL6-7
Human-2-132
min HL7-8
Insulin
(51, 5.8kDa)
Rat-34 min HL4-5
1 (Sasaki et al., 1997), 2 (Fagerholm et al., 1998), 3 (Fjellestad-Paulsen et al., 1995), 4 (Tozaki et al., 1997), 5 (Tozaki et al., 1995), 6 (Tozaki et al., 1998), 7 (Lu et al., 1999), 8 (Hastewell et al., 1995)
1.5.4 Systemic instability
Short circulation half life is an issue for peptide and protein drugs delivered by
injection and many strategies such as pegylation and sustained release depot
formulations have sought to overcome this. Opsonins can bind to
proteins/peptides in the blood stream enabling them to be cleared by
macrophages reducing their systemic half life. Should orally delivered
protein/peptide drugs be absorbed intact into the systemic circulation they may
also require strategies to prolong their systemic half life.
49
1.6 Barriers to oral protein/peptide drug delivery-permeability
The very low oral bioavailabilities of protein and peptide drugs are not just the
result of their instability but also poor permeability. The routes for
protein/peptide drug absorption from the intestinal lumen into the systemic
circulation are between cells, paracellular, through cells, transcellular, by
endocytosis/pinocytosis or by carrier mediated transport. The relatively small
peptide TRH appeared to be absorbed by carrier mediated transport
(Yokohama et al., 1984). However carrier mediated transport for larger
peptides and proteins is likely to be limited as peptide carriers in the intestinal
membrane are present for the uptake of di/tri peptides produced by digestion.
The relatively large size of protein and peptide drugs hampers their absorption
as it has been shown to be size dependent and decreases rapidly when
molecular weight is greater than 700Da (Humphrey and Ringrose, 1986,
McMartin et al., 1987, Donovan et al., 1990). The paracellular route is
particularly limited by the tight junctions between cells and restricted to
molecules less than 200Da (Humphrey and Ringrose, 1986, McMartin et al.,
1987, Donovan et al., 1990). As even the smaller peptides are larger than
700Da their intestinal absorption is likely to be very limited.
The majority of protein and peptide drugs are hydrophilic and therefore not
compatible with passive transcellular absorption across the lipid bilayer
membranes of intestinal cells. The lipophilic nature of cyclosporine A is thought
to account for its higher oral bioavailability as it can be absorbed by the
transcellular pathway. However a study found no correlation between the
lipophilicity of peptides and their uptake across the Caco-2 in vitro intestinal cell
model (Conradi et al., 1991). Instead they found a correlation between the
number of hydrogen bonds a peptide could make with water and its
permeability. The more H-bonds it could form the less permeable it was,
possibly due to the greater amount of energy required to break these bonds
before absorption.
The paracellular route may be more compatible for absorption of hydrophilic
protein and peptide drugs. However paracellular spaces contribute less than
1% of the total mucosal surface area and their small diameter, less than 10Å,
(Jung et al., 2000) limits the passage of these large molecules.
50
Human colon carcinoma (Caco-2) cells are used to mimic the intestinal
absorptive epithelium for studying transepithelial drug transport. Caco-2 cell
uptake studies revealed more than 90% of TRH remained on the donor side
and salmon calcitonin uptake was negligible (Yoo and Park, 2004). The low
uptake of even the very small peptide TRH shows the inherent lack of
permeability of intact peptide and protein drugs.
Most absorption takes place in the small intestine due to its large absorptive
surface area and leakier paracellular channels than those in the large intestine.
Vasopressin absorption in a rat was found to be greater from the small intestine
than the large intestine or stomach (Ritschel, 1991). Absorption of calcitonin in
rats and dogs (Tozaki et al., 1998, Hee Lee et al., 2000, Sinko et al., 1999) and
desmopressin in humans (d'Agay-Abensour et al., 1993) was greater from the
small intestine than the colon.
Table 1.3 indicated bioavailabilities were greater after administration to the
jejunum, however the results were gathered from many different studies which
may have used different parameters possibly making comparisons inaccurate.
Studies conducted to compare the absorption of various protein and peptide
drugs from small intestinal segments in rats, beagle dogs and rabbits found that
calcitonin (Tozaki et al., 1998, Hee Lee et al., 2000, Sinko et al., 1999), insulin
(Han et al., 2012), oxytocin, carbetocin (Lundin et al., 1991), desmopressin,
vasopressin (Pantzar et al., 1995, Lundin et al., 1991) and leuprolide (Zheng et
al., 1999b) were all more absorbed from the distal than proximal small intestine.
This may be due to lower proteolytic activity of the ileum than the jejunum. The
M cells of gut associated lymphoid tissue are known to sample macromolecules
from the ileum and represent a potential portal for oral protein/peptide
absorption. Increased absorption from this segment may be due to these cells.
In human studies, however, desmopressin (d'Agay-Abensour et al., 1993) and
octreotide (Kohler et al., 1987) absorption was greater from the proximal small
intestine than the ileum. This disparity with animal absorption studies could be
due to their higher percentage of M cells in Peyer’s patches, 10-50%, in
rodents, and 46% in rabbits (Gebert et al., 2004) compared to humans, 5%.
Absorption of leuprolide from small intestinal and colonic segments was greater
in anesthetized rats than conscious rats (Zheng et al., 1999b), table 1.3.
51
This may have been due to reduced GI motility and enzyme secretion. The
absorption of desmopressin was increased by pretreatment with loperamide,
which decreased intestinal motility, in human volunteers (Callreus et al., 1999).
This increased desmopressin residence time and therefore its absorption. It
may also have inhibited pancreatic secretions increasing its bioavailability by
reducing its enzymatic digestion. An increased intestinal residence time may be
used to increase the oral bioavailability of protein and peptide drugs.
1.7 Oral protein/peptide drug delivery strategies
To overcome the stability and permeability barriers to oral protein and peptide
delivery many different strategies have been attempted, illustrated in figure 1.5
and described below. The main challenge for the oral delivery system is to
increase oral bioavailability from less than 5% to at least 30-50% (Shaji and
Patole, 2008). In addition to this the formulation preparation process must not
denature fragile protein/peptide drugs.
The vast majority of oral delivery research has been conducted with calcitonin
and insulin, possibly due to the frequency of their administration and clinical
importance. Some research has also focused on improving the oral delivery of
cyclosporine A, desmopressin and pancreatin. There has also been research
conducted with the peptide hormones leuprolide, oxytocin and octreotide
possibly due to their smaller size making them more compatible for oral
delivery. There has been very little investigation into the oral delivery of larger
proteins. This could be because of the inherent difficulties of maintaining their
complex structure during GI transit and the greater difficulty of absorption of
such large molecules into the bloodstream. Recently the oral delivery of GLP-1
and its analogues exenatide and liraglutide has been explored possibly due to
their importance in the treatment of type 2 diabetes (Rekha and Sharma, 2013).
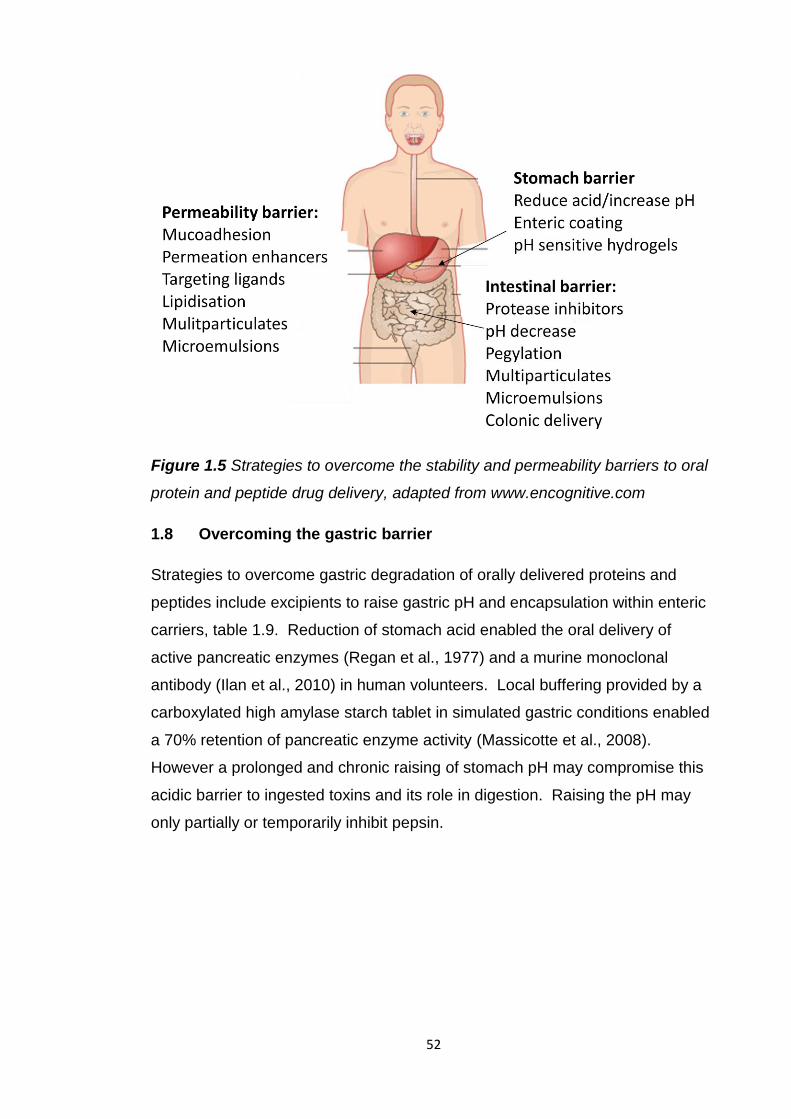
52
Figure 1.5 Strategies to overcome the stability and permeability barriers to oral
protein and peptide drug delivery, adapted from www.encognitive.com
1.8 Overcoming the gastric barrier
Strategies to overcome gastric degradation of orally delivered proteins and
peptides include excipients to raise gastric pH and encapsulation within enteric
carriers, table 1.9. Reduction of stomach acid enabled the oral delivery of
active pancreatic enzymes (Regan et al., 1977) and a murine monoclonal
antibody (Ilan et al., 2010) in human volunteers. Local buffering provided by a
carboxylated high amylase starch tablet in simulated gastric conditions enabled
a 70% retention of pancreatic enzyme activity (Massicotte et al., 2008).
However a prolonged and chronic raising of stomach pH may compromise this
acidic barrier to ingested toxins and its role in digestion. Raising the pH may
only partially or temporarily inhibit pepsin.
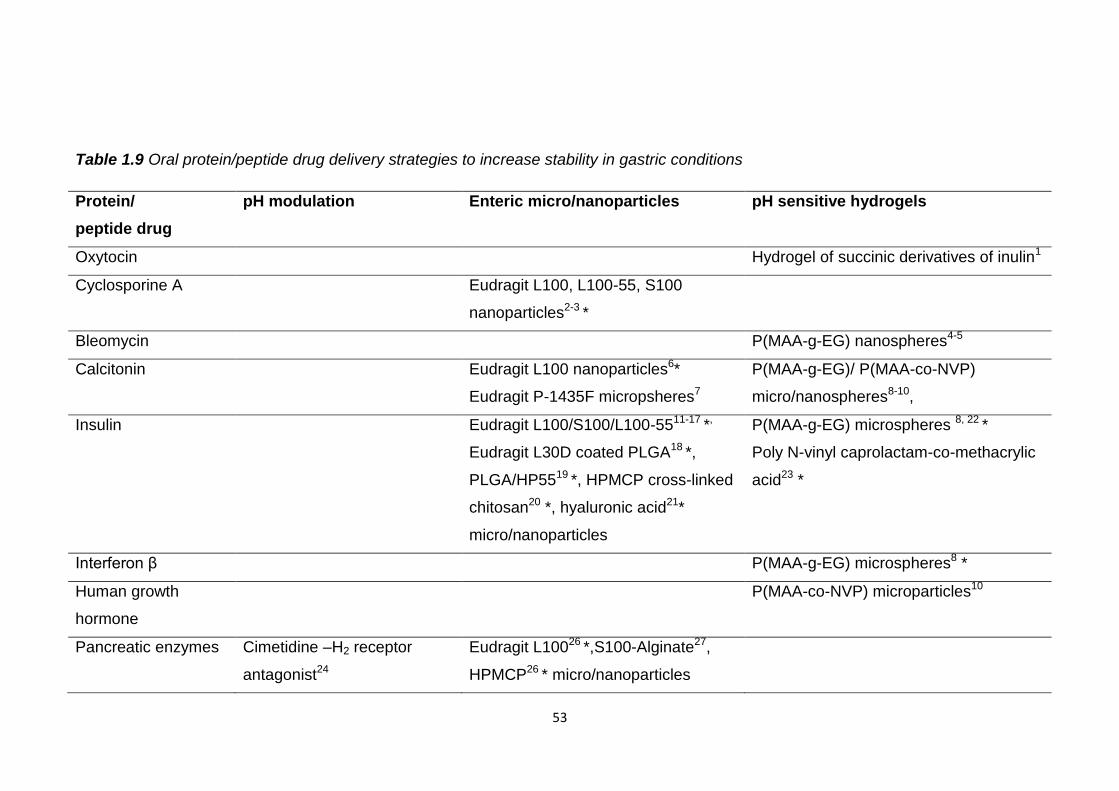
53
Table 1.9 Oral protein/peptide drug delivery strategies to increase stability in gastric conditions
Protein/
peptide drug
pH modulation Enteric micro/nanoparticles pH sensitive hydrogels
Oxytocin Hydrogel of succinic derivatives of inulin1
Cyclosporine A Eudragit L100, L100-55, S100
nanoparticles2-3 *
Bleomycin P(MAA-g-EG) nanospheres4-5
Calcitonin Eudragit L100 nanoparticles6*
Eudragit P-1435F micropsheres7
P(MAA-g-EG)/ P(MAA-co-NVP)
micro/nanospheres8-10,
Insulin Eudragit L100/S100/L100-5511-17 *,
Eudragit L30D coated PLGA18 *,
PLGA/HP5519 *, HPMCP cross-linked
chitosan20 *, hyaluronic acid21*
micro/nanoparticles
P(MAA-g-EG) microspheres 8, 22 *
Poly N-vinyl caprolactam-co-methacrylic
acid23 *
Interferon β P(MAA-g-EG) microspheres8 *
Human growth
hormone
P(MAA-co-NVP) microparticles10
Pancreatic enzymes Cimetidine –H2 receptor
antagonist24
Eudragit L10026 *,S100-Alginate27,
HPMCP26 * micro/nanoparticles
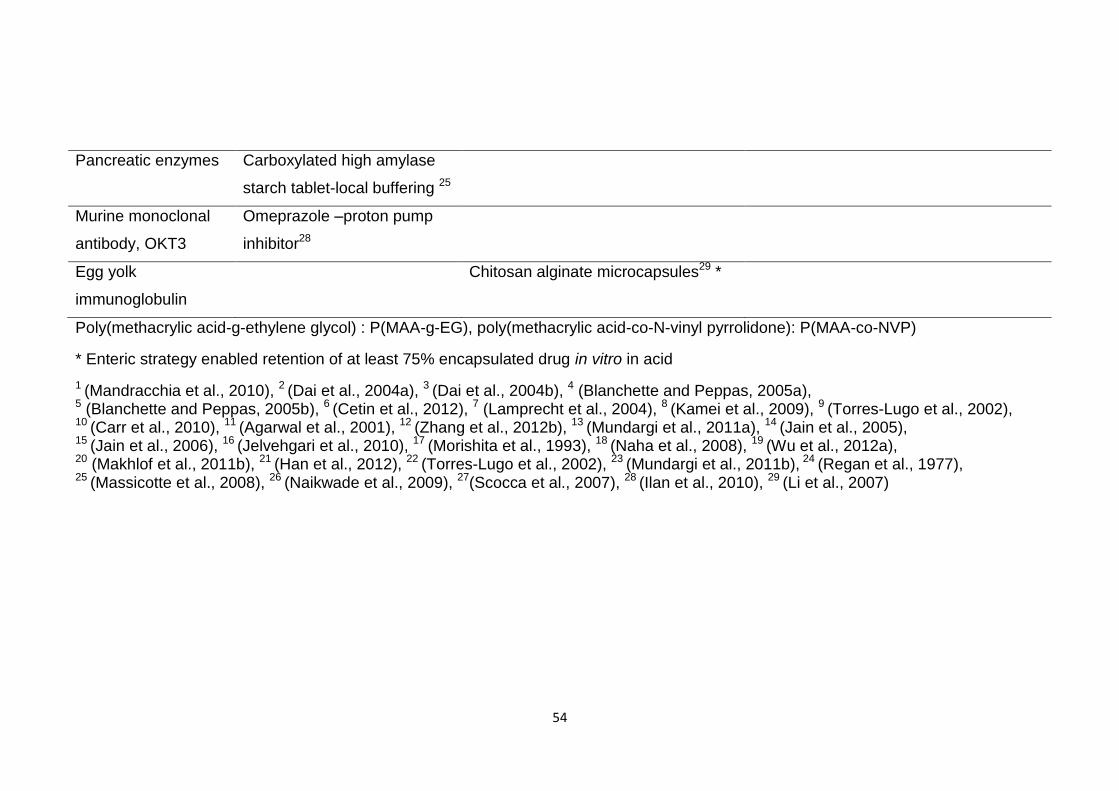
54
Pancreatic enzymes Carboxylated high amylase
starch tablet-local buffering 25
Murine monoclonal
antibody, OKT3
Omeprazole –proton pump
inhibitor28
Egg yolk
immunoglobulin
Chitosan alginate microcapsules29 *
Poly(methacrylic acid-g-ethylene glycol) : P(MAA-g-EG), poly(methacrylic acid-co-N-vinyl pyrrolidone): P(MAA-co-NVP)
* Enteric strategy enabled retention of at least 75% encapsulated drug in vitro in acid
1 (Mandracchia et al., 2010), 2 (Dai et al., 2004a), 3 (Dai et al., 2004b), 4 (Blanchette and Peppas, 2005a), 5 (Blanchette and Peppas, 2005b), 6 (Cetin et al., 2012), 7 (Lamprecht et al., 2004), 8 (Kamei et al., 2009), 9 (Torres-Lugo et al., 2002), 10 (Carr et al., 2010), 11 (Agarwal et al., 2001), 12 (Zhang et al., 2012b), 13 (Mundargi et al., 2011a), 14 (Jain et al., 2005), 15 (Jain et al., 2006), 16 (Jelvehgari et al., 2010), 17 (Morishita et al., 1993), 18 (Naha et al., 2008), 19 (Wu et al., 2012a), 20 (Makhlof et al., 2011b), 21 (Han et al., 2012), 22 (Torres-Lugo et al., 2002), 23 (Mundargi et al., 2011b), 24 (Regan et al., 1977), 25 (Massicotte et al., 2008), 26 (Naikwade et al., 2009), 27(Scocca et al., 2007), 28 (Ilan et al., 2010), 29 (Li et al., 2007)
55
Enteric formulations can prevent the release of orally delivered protein and
peptide drugs in the stomach protecting them from acid and/or pepsin
degradation, and can target their release to favourable regions of the intestinal
tract for their absorption. Pancreatin is currently available as enteric coated
tablets, granules and microspheres to prevent its gastric denaturation. Enteric
micro and nanoparticles offer advantages over enteric tablets or capsules in
terms of a faster drug release at small intestinal pH (Naikwade et al., 2009) and
better in vivo control of symptoms (Littlewood et al., 1988).
Enteric micro/nanoparticles and most of the pH sensitive hydrogels, which swell
in response to pH, were able to restrict the release of encapsulated
protein/peptide drugs in vitro in acid, table 1.9, however some of the hydrogel
particles prematurely released their loaded drug. Almost 40% of calcitonin and
bleomycin were released from P(MAA-g-EG) hydrogels at pH 1.2 possibly due
to their small size (Kamei et al., 2009, Blanchette and Peppas, 2005a,
Blanchette and Peppas, 2005b).
While enteric particles prevented release of a high proportion of encapsulated
protein/peptide drug in acid the proportion retaining activity after pepsin
incubation was much lower, 26-60% (Scocca et al., 2007, Li et al., 2009,
Makhlof et al., 2011b, Han et al., 2012). This disparity suggests they may not
be able to prevent premature drug release, degradation of drugs exposed at the
particle surface and/or influx of acid and pepsin which can degrade the
encapsulated protein/peptide.
Encapsulation of pancreatin (Naikwade et al., 2009), calcitonin (Cetin et al.,
2012) and insulin (Mundargi et al., 2011a, Jain et al., 2005, Naha et al., 2008,
Han et al., 2012) in enteric particles increased their oral efficacy up to four times
that of a drug solution in rabbits and rats. Pharmacological availabilities of
insulin encapsulated in enteric micro/nanoparticulates, ranged from 0.8 to
11.4% relative to subcutaneous insulin (Zhang et al., 2012b, Morishita et al.,
1993, Wu et al., 2012a, Makhlof et al., 2011b). An insulin solution produced
negligible availability. Encapsulation of cyclosporine A in enteric nanoparticles
increased its oral bioavailability in rats by 32.5% compared to the currently
available microemulsion formulation Neoral (Novartis) (Dai et al., 2004a, Dai et
al., 2004b).
56
Loading in pH sensitive hydrogels increased absorption of calcitonin and
interferon β from rat ileum (Kamei et al., 2009). Insulin loaded hydrogels
decreased blood glucose levels by 50% when orally administered to rats
(Mundargi et al., 2011b).
Oral bioavailabilities of protein and peptide drugs, except cyclosporine A, solely
encapsulated in enteric polymers were less than 5% (Han et al., 2012, Cetin et
al., 2012, Lamprecht et al., 2004, Morishita et al., 1993). The vulnerability of the
released protein/peptide to enzymatic degradation in the small intestine and
poor permeability may restrict its bioavailability. Combining a pH sensitive
polymer with a sustained release polymer, PLGA, increased insulin oral
bioavailability to 11.4% (Wu et al., 2012a). Enteric polymers may need to be
combined with other, sustained release polymers, enzyme inhibitors and
permeation enhancers to form a successful oral delivery strategy.
1.9 Overcoming intestinal instability
1.9.1 Enzyme protection
To inhibit the enzymatic degradation of orally delivered protein and peptide
drugs specific enzyme inhibitors and organic acids to lower the pH of the
intestine, inactivating enzymes, have been used. These strategies inhibited
degradation in vitro in enzyme solutions and in human, rat and brushtail possum
intestinal fluids and mucosa, table 1.10. However, they may disrupt the normal
digestion of proteins making them unsuitable for prolonged use. The
attachment of polyethylene glycol (PEG) has also been used to stabilise
proteins/peptides by shielding them from enzymes. Pegylation has been used
to lengthen the circulatory half life and bioavailability of interferons (Pegasys,
PegIntron) and GCSF (Neulasta) reducing the frequency of their injection.
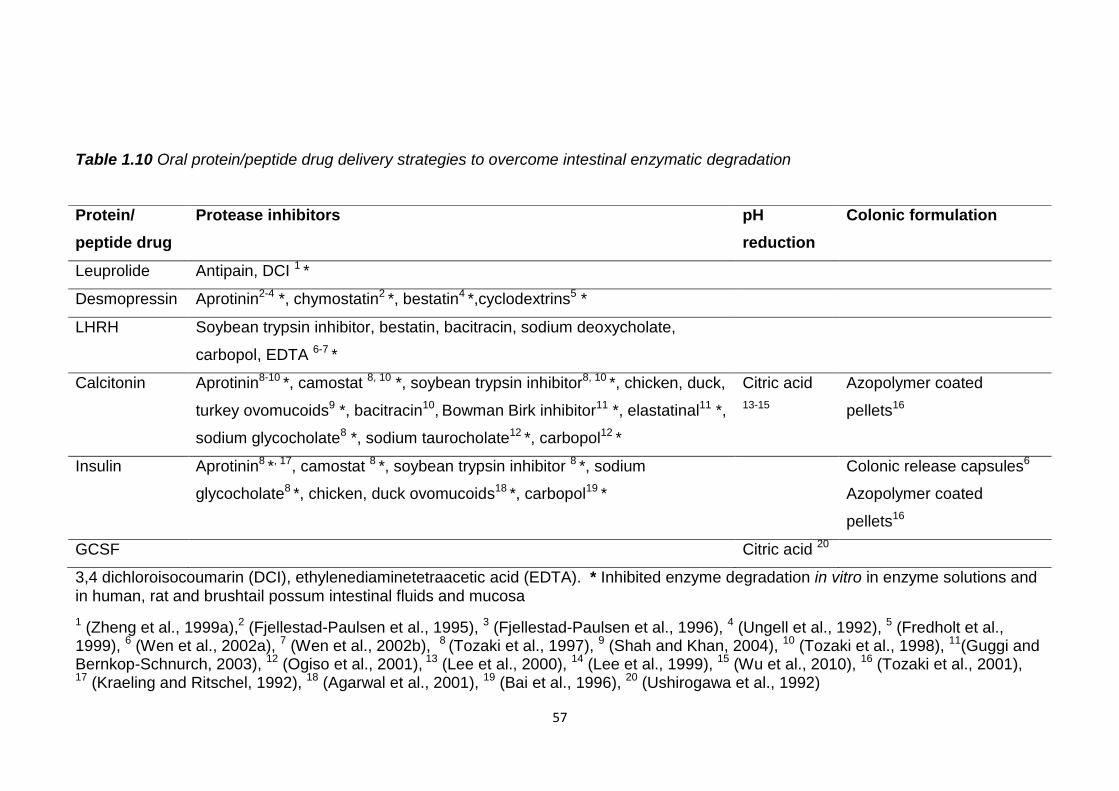
57
Table 1.10 Oral protein/peptide drug delivery strategies to overcome intestinal enzymatic degradation
3,4 dichloroisocoumarin (DCI), ethylenediaminetetraacetic acid (EDTA). * Inhibited enzyme degradation in vitro in enzyme solutions and
in human, rat and brushtail possum intestinal fluids and mucosa
1 (Zheng et al., 1999a),2 (Fjellestad-Paulsen et al., 1995), 3 (Fjellestad-Paulsen et al., 1996), 4 (Ungell et al., 1992), 5 (Fredholt et al., 1999), 6 (Wen et al., 2002a), 7 (Wen et al., 2002b), 8 (Tozaki et al., 1997), 9 (Shah and Khan, 2004), 10 (Tozaki et al., 1998), 11(Guggi and Bernkop-Schnurch, 2003), 12 (Ogiso et al., 2001), 13 (Lee et al., 2000), 14 (Lee et al., 1999), 15 (Wu et al., 2010), 16 (Tozaki et al., 2001), 17 (Kraeling and Ritschel, 1992), 18 (Agarwal et al., 2001), 19 (Bai et al., 1996), 20 (Ushirogawa et al., 1992)
Protein/
peptide drug
Protease inhibitors pH
reduction
Colonic formulation
Leuprolide Antipain, DCI 1 *
Desmopressin Aprotinin2-4 *, chymostatin2 *, bestatin4 *,cyclodextrins5 *
LHRH Soybean trypsin inhibitor, bestatin, bacitracin, sodium deoxycholate,
carbopol, EDTA 6-7 *
Calcitonin Aprotinin8-10 *, camostat 8, 10 *, soybean trypsin inhibitor8, 10 *, chicken, duck,
turkey ovomucoids9 *, bacitracin10, Bowman Birk inhibitor11 *, elastatinal11 *,
sodium glycocholate8 *, sodium taurocholate12 *, carbopol12 *
Citric acid
13-15
Azopolymer coated
pellets16
Insulin Aprotinin8 *, 17, camostat 8 *, soybean trypsin inhibitor 8 *, sodium
glycocholate8 *, chicken, duck ovomucoids18 *, carbopol19 *
Colonic release capsules6
Azopolymer coated
pellets16
GCSF Citric acid 20
58
In vivo the trypsin/chymotrypsin inhibitor aprotinin increased the bioavailability
of desmopressin from 0.09 to 0.46%, when administered intraduodenally in
human volunteers (Fjellestad-Paulsen et al., 1996), and of insulin from 5.02% to
6.15% when administered orally to dogs in a colonic formulation (Kraeling and
Ritschel, 1992). Aprotinin attached to liposomes with calcitonin (Werle and
Takeuchi, 2009) and insulin (Morishita et al., 1993) increased oral hypocalcemic
activity 11 fold, compared to plain liposomes, and oral insulin bioavailability in
rats from 1.3% to 3.6%.
Citric acid increased GCSF activity five fold when administered intraduodenally
to rats, compared to a solution, (Ushirogawa et al., 1992). It also increased the
oral bioavailability of salmon calcitonin in dogs, when loaded in enteric
capsules, from 0.02% to 0.86% (Lee et al., 2000, Lee et al., 1999), and
produced an oral calcitonin bioavailability of 1.8% in rats (Wu et al., 2010).
Pegylation increased GCSF bioavailability following intraduodenal
administration to rats from undetectable to 1.8%, relative to intravenous GCSF
(Jensen-Pippo et al., 1996). When pegylated calcitonin was administered
intestinally in rats its activity was 5.8 fold greater than unmodified calcitonin
(Youn et al., 2006) but when orally administered it was not as active as
unmodified calcitonin (Cheng and Lim, 2009). Possibly PEG was detached
from the drug before it reached the small intestine and may require additional GI
protection.
Oral protein/peptide drug bioavailability of pegylated drugs or those formulated
with protease inhibitors or citric acid alone was not more than 5%, relative to the
intravenously administered drugs. These strategies alone may not be enough
to enable oral protein and peptide drug delivery, however combined with other
strategies they can increase oral bioavailabilities.
1.9.2 Colonic delivery
As the colon has been shown to be less proteolytically active than the small
intestine (Tozaki et al., 1998, Wen et al., 2002c) some oral protein and peptide
drug delivery strategies have been targeted there, table 1.10. However drugs
released here will be vulnerable to microbial mediated degradation and any
permeation enhancement could result in the uptake of potentially toxic material.
59
pH sensitive colonic release capsules loaded with an insulin microemulsion
increased its oral pharmacological availability in dogs from 2.1%, for the
microemulsion, to 5% from the capsules (Kraeling and Ritschel, 1992). Colon
targeted azopolymer coated pellets loaded with eel calcitonin and insulin
increased their oral pharmacological availabilities in rats from 0.16 to 1.04% and
0.67 to 3.38% respectively (Tozaki et al., 2001). The azo bonds of the polymer
can be reduced by colonic microbiota triggering drug release. The increased
bioavailability is still only 5% of that of an intravenous dose and therefore to
reach desired oral bioavailability levels additional excipients may be required.
1.10 Overcoming the permeation barrier
1.10.1 Mucoadhesion
Mucoadhesive polymers such as chitosan, polyacrylic acids (carbopol,
carbomer, carbophil) and thiomers have been used in oral protein and peptide
drug formulations and increased in vitro mucoadhesion to cells and intestinal
segments, table 1.11. Lectin attachment can increase binding to cells in the
small intestine and therefore uptake of protein and peptide drugs. The lectin
wheat germ agglutinin, WGA, has been most frequently used and can bind to
intestinal cell surface receptors, table 1.11. Mucoadhesion can increase
intestinal residence time and concentration gradient between the delivery
system and intestinal membrane, increasing the absorption of the associated
drug.
Chitosan is a natural, mucoadhesive polymer with a positive charge that allows
it to interact with negatively charged intestinal mucosa. Chitosan coating of
liposomes loaded with insulin increased its oral pharmacological availability five
fold, compared to a solution, and produced a pharmacological availability of 5%
relative to a subcutaneous dose (Takeuchi et al., 1996). Chitosan coated
liposomes increased the oral efficacy of calcitonin in rats up to six times that of
uncoated liposomes (Takeuchi, 1999). A dispersion of buserelin with chitosan
increased its bioavailability from 0.1 to 5.1% when administered intraduodenally
to rats (Luessen et al., 1996).
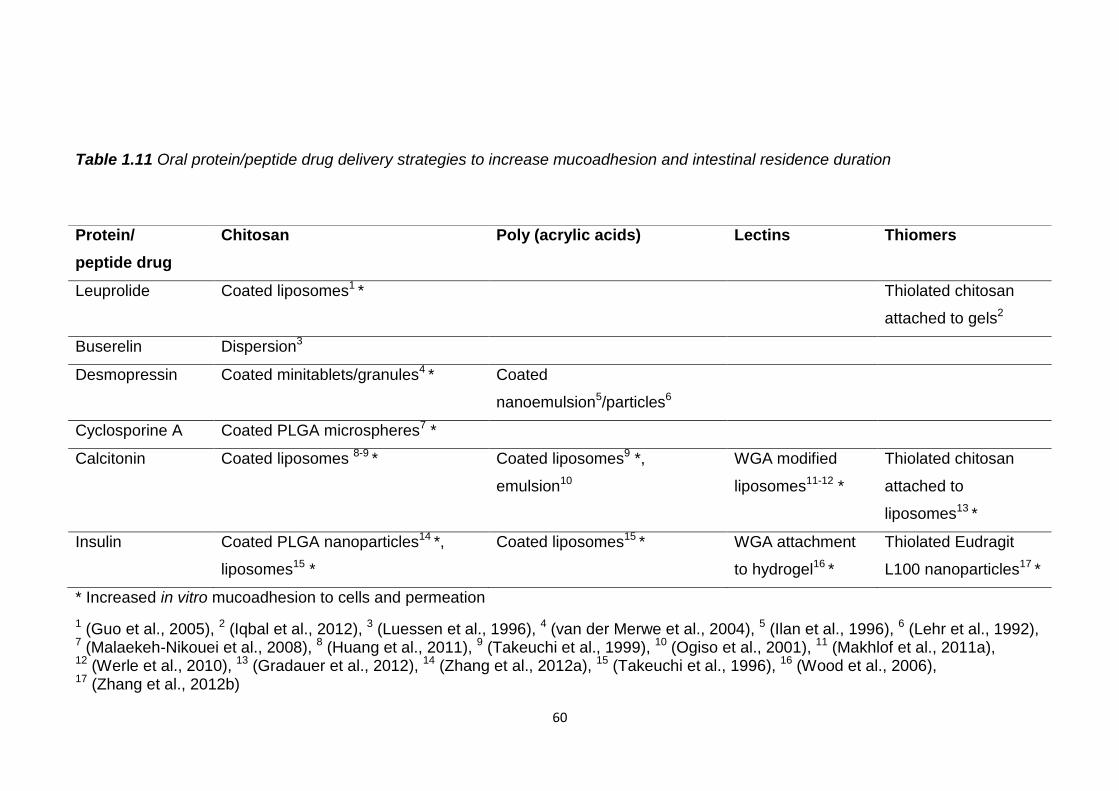
60
Table 1.11 Oral protein/peptide drug delivery strategies to increase mucoadhesion and intestinal residence duration
* Increased in vitro mucoadhesion to cells and permeation
1 (Guo et al., 2005), 2 (Iqbal et al., 2012), 3 (Luessen et al., 1996), 4 (van der Merwe et al., 2004), 5 (Ilan et al., 1996), 6 (Lehr et al., 1992), 7 (Malaekeh-Nikouei et al., 2008), 8 (Huang et al., 2011), 9 (Takeuchi et al., 1999), 10 (Ogiso et al., 2001), 11 (Makhlof et al., 2011a), 12 (Werle et al., 2010), 13 (Gradauer et al., 2012), 14 (Zhang et al., 2012a), 15 (Takeuchi et al., 1996), 16 (Wood et al., 2006), 17 (Zhang et al., 2012b)
Protein/
peptide drug
Chitosan Poly (acrylic acids) Lectins Thiomers
Leuprolide Coated liposomes1 * Thiolated chitosan
attached to gels2
Buserelin Dispersion3
Desmopressin Coated minitablets/granules4 * Coated
nanoemulsion5/particles6
Cyclosporine A Coated PLGA microspheres7 *
Calcitonin Coated liposomes 8-9 * Coated liposomes9 *,
emulsion10
WGA modified
liposomes11-12 *
Thiolated chitosan
attached to
liposomes13 *
Insulin Coated PLGA nanoparticles14 *,
liposomes15 *
Coated liposomes15 * WGA attachment
to hydrogel16 *
Thiolated Eudragit
L100 nanoparticles17 *
61
Carbopol coated liposomes and emulsions increased the oral efficacy of
calcitonin in rats 2.4 fold compared to uncoated liposomes (Takeuchi, 1999)
and increased its oral bioavailability from 0.3 to 0.4% (Ogiso et al., 2001).
Insulin loaded thiolated Eudragit L100 nanoparticles had an oral bioavailability
of 7.3% in rats and a 2.8 fold greater efficacy compared to unmodified
nanoparticles (Zhang et al., 2012b). Thiolated chitosan attachment to leuprolide
loaded gels increased its oral bioavailability in rats from 1.2 to 4.5% (Iqbal et al.,
2012). Attachment of WGA to carbopol coated liposomes increased oral
calcitonin efficacy in rats six fold compared to those with no WGA (Werle et al.,
2010).
Gastrointestinal mucoadhesive patches (GI MAPs) produced oral and intestinal
availabilities of GCSF (Eiamtrakarn et al., 2002), interferon α (Ito et al., 2005),
erythropoietin (Venkatesan et al., 2006a, Venkatesan et al., 2006b) and
surfactant coated insulin (Toorisaka et al., 2012) of 2-23%, relative to an
intravenous dose, in rats and dogs. In addition to a mucoadhesive layer, eg
chitosan or polyacrylic acid, the patches had an enteric layer, citric acid to
inhibit enzymes and permeation enhancers to aid absorption.
Mucoadhesion alone increased oral protein/peptide drug bioavailability to about
5% but with pH protection, protease inhibition and permeation enhancement, in
the form of GI MAPs, oral bioavailability increased up to 23% (Eiamtrakarn et
al., 2002). The use of mucoadhesive polymers to enhance oral delivery is
limited however by the natural mucus turnover which is in the range of 12-24
hours in the human intestine (Shaji and Patole, 2008).
1.10.2 Permeation enhancers
To overcome the limited permeability of protein and peptide drugs excipients
that disrupt the membranes of intestinal cells or widen the paracellular channels
between them have been used, but they may cause the uptake of potentially
toxic substances, limiting their prolonged use.
62
Chitosan (Luessen et al., 1997, Kotze et al., 1997a, Prego et al., 2005, Kotze et
al., 1997b, Lin et al., 2007, Nguyen et al., 2011), polyacrylic acids (Kotze et al.,
1997a), spermine (Makhlof et al., 2011c), sodium salts of medium chain fatty
acids (Lindmark et al., 1995), acylcarnitines (LeCluyse et al., 1991) and bile
salts (Michael et al., 2000) were able to reduce the transepithelial resistance
(TEER) of Caco-2 cells and open paracellular channels. In formulations with
protein and peptide drugs they increased their in vitro cell absorption, table
1.12.
Chitosan increased intraduodenal bioavailability of buserelin from 0.8% to 13%,
(Thanou et al., 2000a), and octreotide intrajejunal bioavailability in rats from
3.1% to 15.9% (Thanou et al., 2000b). Exenatide encapsulation in γ-PGA
nanoparticles shelled with chitosan increased its oral bioavailability in rats from
undetectable to 14% (Nguyen et al., 2011). Spermine nanoparticles loaded with
calcitonin were 15.2 fold more active than the free drug when orally
administered to rats (Makhlof et al., 2011c) and acylcarnitine increased the oral
bioavailability of salmon calcitonin in dogs from <0.5% to 1.3% (Sinko et al.,
1999).
Bile salts increased desmopressin intrajejunal uptake in rats (Michael et al.,
2000), and octreotide intrajejunal availability from 0.26 to 20.2% (Fricker et al.,
1996). Bile salts formulated with insulin loaded liposomes (Niu et al., 2012) and
PLGA nanoparticles (Sun et al., 2011a) produced an oral bioavailability of 11-
12% in rats. Bile salts also increased the oral bioavailability of salmon
calcitonin in dogs from less than 0.5% to 1.1% (Sinko et al., 1999) and
produced an oral octreotide bioavailability in humans of 1.26% (Fricker et al.,
1996).
Surfactants such as sodium dodecyl sulphate (SDS) can disrupt the cell
membrane making it more permeable to protein and peptide drugs. SDS
decreased the TEER of Caco-2 cells (Anderberg and Artursson, 1993).
However exposure to SDS for two hours irreversibly altered the villi morphology,
caused apical membrane wounds and structural separation of the tight
junctions. Prolonged exposure of intestinal cells to surfactants like SDS could
cause intestinal cell damage and unwanted absorption of harmful molecules.
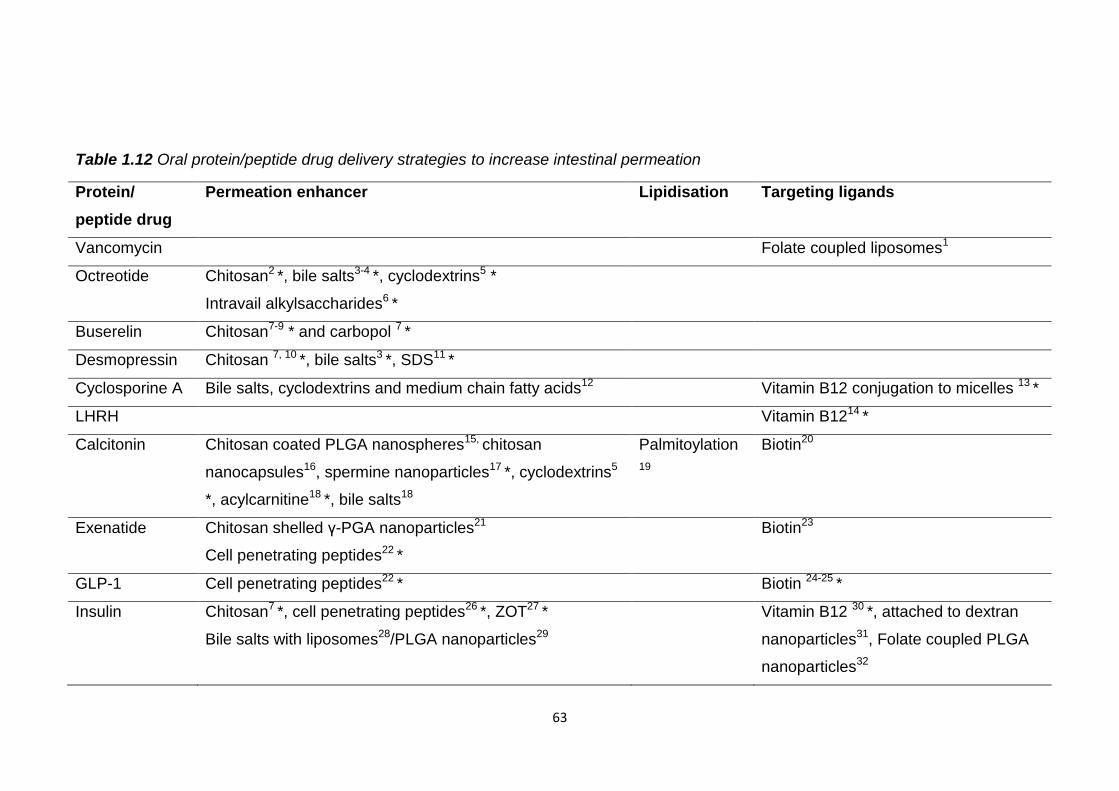
63
Table 1.12 Oral protein/peptide drug delivery strategies to increase intestinal permeation
Protein/
peptide drug
Permeation enhancer Lipidisation Targeting ligands
Vancomycin Folate coupled liposomes1
Octreotide Chitosan2 *, bile salts3-4 *, cyclodextrins5 *
Intravail alkylsaccharides6 *
Buserelin Chitosan7-9 * and carbopol 7 *
Desmopressin Chitosan 7, 10 *, bile salts3 *, SDS11 *
Cyclosporine A Bile salts, cyclodextrins and medium chain fatty acids12 Vitamin B12 conjugation to micelles 13 *
LHRH Vitamin B1214 *
Calcitonin Chitosan coated PLGA nanospheres15, chitosan
nanocapsules16, spermine nanoparticles17 *, cyclodextrins5
*, acylcarnitine18 *, bile salts18
Palmitoylation
19
Biotin20
Exenatide Chitosan shelled γ-PGA nanoparticles21
Cell penetrating peptides22 *
Biotin23
GLP-1 Cell penetrating peptides22 * Biotin 24-25 *
Insulin Chitosan7 *, cell penetrating peptides26 *, ZOT27 *
Bile salts with liposomes28/PLGA nanoparticles29
Vitamin B12 30 *, attached to dextran
nanoparticles31, Folate coupled PLGA
nanoparticles32
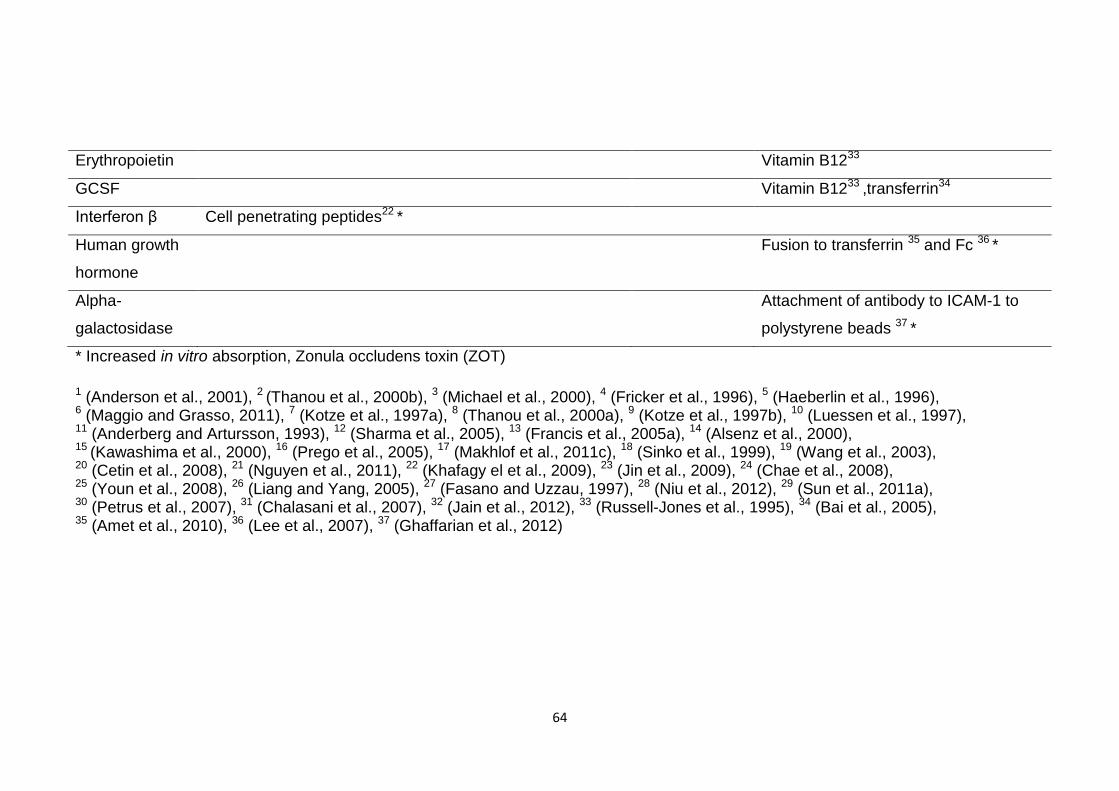
64
Erythropoietin Vitamin B1233
GCSF Vitamin B1233 ,transferrin34
Interferon β Cell penetrating peptides22 *
Human growth
hormone
Fusion to transferrin 35 and Fc 36 *
Alpha-
galactosidase
Attachment of antibody to ICAM-1 to
polystyrene beads 37 *
* Increased in vitro absorption, Zonula occludens toxin (ZOT)
1 (Anderson et al., 2001), 2 (Thanou et al., 2000b), 3 (Michael et al., 2000), 4 (Fricker et al., 1996), 5 (Haeberlin et al., 1996), 6 (Maggio and Grasso, 2011), 7 (Kotze et al., 1997a), 8 (Thanou et al., 2000a), 9 (Kotze et al., 1997b), 10 (Luessen et al., 1997), 11 (Anderberg and Artursson, 1993), 12 (Sharma et al., 2005), 13 (Francis et al., 2005a), 14 (Alsenz et al., 2000), 15 (Kawashima et al., 2000), 16 (Prego et al., 2005), 17 (Makhlof et al., 2011c), 18 (Sinko et al., 1999), 19 (Wang et al., 2003), 20 (Cetin et al., 2008), 21 (Nguyen et al., 2011), 22 (Khafagy el et al., 2009), 23 (Jin et al., 2009), 24 (Chae et al., 2008), 25 (Youn et al., 2008), 26 (Liang and Yang, 2005), 27 (Fasano and Uzzau, 1997), 28 (Niu et al., 2012), 29 (Sun et al., 2011a), 30 (Petrus et al., 2007), 31 (Chalasani et al., 2007), 32 (Jain et al., 2012), 33 (Russell-Jones et al., 1995), 34 (Bai et al., 2005), 35 (Amet et al., 2010), 36 (Lee et al., 2007), 37 (Ghaffarian et al., 2012)
65
Aegis Therapeutics have developed Intravail, an alkylsaccharide transmucosal
absorption enhancing agent of hydrophilic saccharides linked to hydrophobic
alkyl, non ionic surfactants. They transiently open tight junctions increasing
paracellular permeability. They increased the oral bioavailability of octreotide
four fold compared to subcutaneous delivery (Maggio and Grasso, 2011). This
large increase in bioavailability may be due to limited perfusion of octreotide at
the injection site or its retention in local tissues reducing its systemic uptake.
Intravail has been tested preclinically with octreotide, parathyroid hormone,
calcitonin, interferons and GLP-1 but not entered clinical trials yet.
Permeation enhancement increased oral protein/peptide drug bioavailabilities to
more than 10%, and up to four fold greater than a subcutaneously delivered
dose with Intravail (Maggio and Grasso, 2011), far greater than seen with
previously assessed strategies. Despite the dangers of increasing intestinal
permeability without it oral protein and peptide drug delivery may not be
possible.
1.10.3 Lipidisation
As the hydrophilicity of proteins and peptides hampers their transcellular
absorption attachment of fatty acids has been used to increase their lipophilicity
and absorption, table 1.12. Palmitoylation of salmon calcitonin increased its
lipophilicity and absorption 19 fold when administered orally to rats compared to
unmodified salmon calcitonin (Wang et al., 2003). Modification of
protein/peptide drugs to enhance their absorption may however alter their
efficacy or toxicity.
1.10.4 Targeting ligands
Biotin, vitamin B12, folate and transferrin have been conjugated to
protein/peptide drugs or their carriers to increase uptake by exploiting their
intestinal receptor mediated endocytosis, table 1.12. Vitamin B12 conjugation
to dextran nanoparticles and folate conjugation to PLGA nanoparticles
increased encapsulated insulin oral pharmacological availability from 10.3 to
26.5% (Chalasani et al., 2007) and from 12.73% to 20.4% (Jain et al., 2012)
respectively, relative to subcutaneous insulin, in rats.
66
Folate coupling of vancomycin loaded liposomes increased its oral
bioavailability in rats from 6.7% for the uncoupled liposomes to 21.8%
(Anderson et al., 2001). Biotin conjugation increased intrajejunal calcitonin
absorption three fold compared to the unmodified drug in rats (Cetin et al.,
2008) and exenatide oral bioavailability in rats from undetectable to 3.95% (Jin
et al., 2009). Conjugation of transferrin however caused GCSF to lose 90% of
its activity (Bai et al., 2005). Attachment of an antibody to a protein, ICAM-1,
expressed on GI epithelium, to polystyrene beads with attached alpha-
galactosidase enabled its uptake in vitro by Caco-2 cells (Ghaffarian et al.,
2012). Fusion of human growth hormone to Fc increased in vitro uptake
compared to a control by targeting the FcRn (receptor) found in the intestine of
human adults (Lee et al., 2007). Neonatal FcRn mediates the transcytosis of
intact immunoglobulins in milk in suckling rodents.
This strategy produced oral bioavailabilities of >20% when combined with
encapsulation of the protein/peptide drug and doesn’t involve membrane
disruption. However conjugation to targeting ligands is a more complex
procedure and could increase production costs. Conjugation may also cause a
loss of therapeutic activity or increased toxicity (Bai et al., 2005). Absorption
may also be limited in vivo by competitive binding of the natural ligand to the
transporter.
1.11 Multiparticulates and emulsions
Encapsulation of protein/peptide drugs within microparticles, nanoparticles,
liposomes, micelles and emulsions can provide protection from enzymes and
acid, by a physical polymeric, lipid or oily barrier, and enhanced permeability,
table 1.13. Their smaller size compared to tablets, capsules and granules can
increase bioavailability by their rapid gastric emptying and dissolution due to
their large surface area. Encapsulation of additional protease inhibitors and
permeation enhancers and coating with enteric, mucoadhesive and/or
permeation enhancing polymers can further increase oral bioavailability.
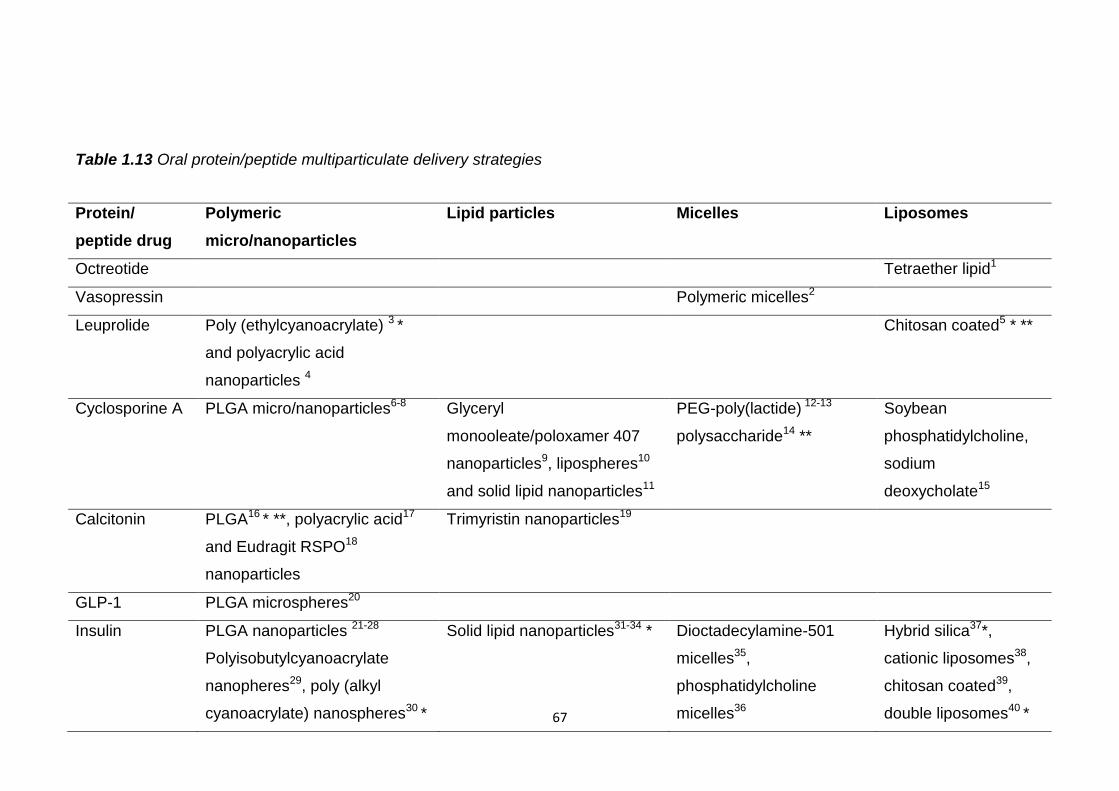
67
Table 1.13 Oral protein/peptide multiparticulate delivery strategies
Protein/
peptide drug
Polymeric
micro/nanoparticles
Lipid particles Micelles Liposomes
Octreotide Tetraether lipid1
Vasopressin Polymeric micelles2
Leuprolide Poly (ethylcyanoacrylate) 3 *
and polyacrylic acid
nanoparticles 4
Chitosan coated5 * **
Cyclosporine A PLGA micro/nanoparticles6-8
Glyceryl
monooleate/poloxamer 407
nanoparticles9, lipospheres10
and solid lipid nanoparticles11
PEG-poly(lactide) 12-13
polysaccharide14 **
Soybean
phosphatidylcholine,
sodium
deoxycholate15
Calcitonin PLGA16 * **, polyacrylic acid17
and Eudragit RSPO18
nanoparticles
Trimyristin nanoparticles19
GLP-1 PLGA microspheres20
Insulin PLGA nanoparticles 21-28
Polyisobutylcyanoacrylate
nanopheres29, poly (alkyl
cyanoacrylate) nanospheres30 *
Solid lipid nanoparticles31-34 * Dioctadecylamine-501
micelles35,
phosphatidylcholine
micelles36
Hybrid silica37*,
cationic liposomes38,
chitosan coated39,
double liposomes40 *
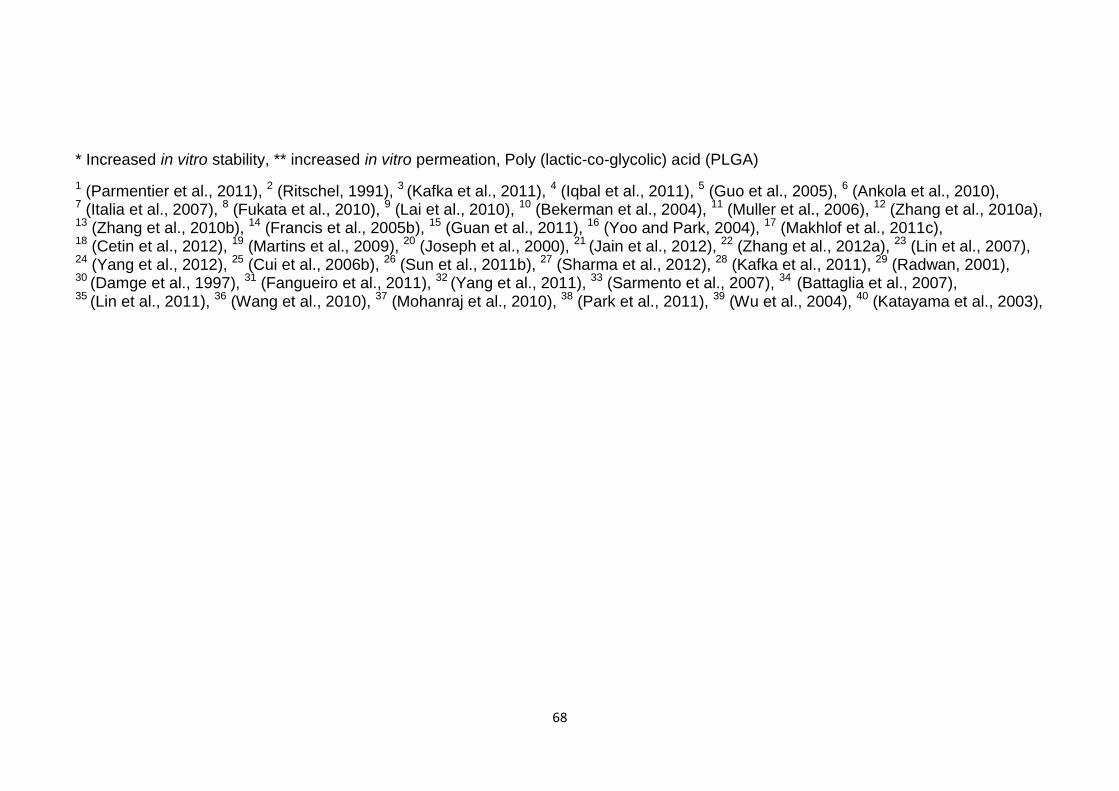
68
* Increased in vitro stability, ** increased in vitro permeation, Poly (lactic-co-glycolic) acid (PLGA)
1 (Parmentier et al., 2011), 2 (Ritschel, 1991), 3 (Kafka et al., 2011), 4 (Iqbal et al., 2011), 5 (Guo et al., 2005), 6 (Ankola et al., 2010), 7 (Italia et al., 2007), 8 (Fukata et al., 2010), 9 (Lai et al., 2010), 10 (Bekerman et al., 2004), 11 (Muller et al., 2006), 12 (Zhang et al., 2010a), 13 (Zhang et al., 2010b), 14 (Francis et al., 2005b), 15 (Guan et al., 2011), 16 (Yoo and Park, 2004), 17 (Makhlof et al., 2011c), 18 (Cetin et al., 2012), 19 (Martins et al., 2009), 20 (Joseph et al., 2000), 21 (Jain et al., 2012), 22 (Zhang et al., 2012a), 23 (Lin et al., 2007), 24 (Yang et al., 2012), 25 (Cui et al., 2006b), 26 (Sun et al., 2011b), 27 (Sharma et al., 2012), 28 (Kafka et al., 2011), 29 (Radwan, 2001), 30 (Damge et al., 1997), 31 (Fangueiro et al., 2011), 32 (Yang et al., 2011), 33 (Sarmento et al., 2007), 34 (Battaglia et al., 2007), 35 (Lin et al., 2011), 36 (Wang et al., 2010), 37 (Mohanraj et al., 2010), 38 (Park et al., 2011), 39 (Wu et al., 2004), 40 (Katayama et al., 2003),
69
1.11.1 Polymeric particles
Polymeric particles can protect encapsulated protein and peptide drugs and are
more stable in the GI tract than liposomes or micelles. The encapsulated drug
can be absorbed within the particles as the use of hydrophobic polymers can
increase transcellular uptake. They have increased the in vitro stability and
permeability of encapsulated protein/peptide drugs, table 1.13.
Salmon calcitonin loaded PLGA nanoparticles produced an oral bioavailability in
rats of 0.4%, it was only negligible for a drug solution (Yoo and Park, 2004).
Encapsulation of cyclosporine A in PLGA nanoparticles increased its oral
efficacy in rodents and produced a 20% greater oral bioavailability than the
commercial microemulsion formulation Neoral (Ankola et al., 2010).
Encapsulation of insulin in PLGA nanoparticles produced oral bioavailabilities of
between 7.6 and 12.7% in rats, relative to subcutaneous insulin (Jain et al.,
2012, Zhang et al., 2012a, Sun et al., 2011b, Cui et al., 2006b). With co-
encapsulated antacids to neutralise the acidic by-products of PLGA degradation
oral insulin availability increased to 17% (Sharma et al., 2012).
Leuprolide encapsulation in poly(ethylcyanoacrylate) nanoparticles increased its
absorption from a brushtail possum intestine (Kafka et al., 2011).
Encapsulation in polyacrylic acid nanoparticles increased leuprolide oral
bioavailability in rats from 0.26 to 0.55% when enterically coated (Iqbal et al.,
2011), and calcitonin oral efficacy in rats 15 fold compared to a solution
(Makhlof et al., 2011c). Encapsulation of salmon calcitonin in sustained release
Eudragit RSPO nanoparticles increased its oral efficacy in rats compared to a
drug solution (Cetin et al., 2012).
The intestinal absorption of polymeric particles has been shown to be restricted
to small particles, <10µm, (Kompella and Lee, 2001). However, smaller
particles may have a limited drug loading capacity and leave more drug
vulnerable to intestinal degradation at, or near the surface of particles.
Incompatibility of hydrophilic protein/peptide drugs with hydrophobic particles
may result in low encapsulation efficiencies and rapid, uncontrolled drug
release. Insulin and salmon calcitonin were complexed with fatty acids to
increase their lipophilicity and encapsulation in PLGA nanoparticles (Yoo and
Park, 2004, Sun et al., 2011b).
70
Production of polymeric particles often involves the use of solvents and high
shear forces which need to be minimised to encapsulate fragile protein and
peptide drugs.
1.11.2 Lipid particles
Lipid particles can provide protection and increased lipophilicity to increase
protein/peptide drug oral bioavailabilities, table 1.13. Encapsulation of lipophilic
cyclosporine A produced a 78% greater oral bioavailability than Neoral in dogs
(Lai et al., 2010), and a similar bioavailability in humans (Bekerman et al.,
2004). Solid lipid nanoparticles produced an insulin oral pharmacological
availability of up to 5% in rats, relative to subcutaneous insulin, but these
particles experienced high, immediate burst release in vitro (Yang et al., 2011,
Sarmento et al., 2007, Trotta et al., 2005). As most proteins and peptides are
hydrophilic they are less compatible with encapsulation within lipid particles
reducing their encapsulation efficiency and causing uncontrolled and immediate
burst release.
1.11.3 Micelles
Micelles can provide protection and enhanced permeation of loaded protein and
peptide drugs, table 1.13. They increased in vitro permeation (Francis et al.,
2005b) of cyclosporine A and its oral efficacy in rats (Zhang et al., 2010a,
Zhang et al., 2010b). They also increased the oral activity of vasopressin in rats
(Jones et al., 2008).
1.11.4 Liposomes
Liposomes are vesicles composed of a phospholipid bilayer with an aqueous
core in which hydrophilic proteins and peptide drugs can be protected from
enzymatic digestion, table 1.13. The lipid bilayer can fuse with the bilayer of
cell membranes facilitating absorption of the drug into intestinal cells. They
increased the in vitro stability of leuprolide (Guo et al., 2005), the oral
bioavailability of octreotide in rats, 4.6 times that of a solution (Parmentier et al.,
2011), and of cyclosporine A, 20% greater than Neoral (Guan et al., 2011).
Oral efficacy of insulin in rodents was increased by encapsulation in chitosan
coated liposomes (Wu et al., 2004).
71
However, liposomes have shown instability with bile acids (Anderson et al.,
2001) and lipase, which could cause premature drug release in vivo leaving
them vulnerable to degradation.
1.11.5 Microemulsions
Microemulsions are dispersions of two immiscible liquids such as oil and water
stabilised by an interfacial film of surfactant molecules. They can improve drug
solubilisation, provide protection from enzymes and enhance intestinal
absorption. Hydrophilic protein and peptide drugs in an aqueous phase are
dispersed in a protective oil phase. Lipophilic drugs in an oil phase are
dispersed in an aqueous phase to increase their solubility in GI fluids.
Microemulsions have been used to deliver cyclosporine A due to its low water
solubility and high lipid solubility (Odeberg et al., 2003, Sarciaux et al., 1995,
Dunn et al., 1997, Ritschel et al., 1990, Lei et al., 2012). A microemulsion of
cyclosporine A produced an oral bioavailability of 51.8% in rats compared to
41.6% for Neoral, relative to an intravenous dose (Gao et al., 1998). The
success of oral microemulsions of cyclosporine A are due to its relatively small
size and hydrophobicity.
Microemulsions increased the oral efficacy of salmon calcitonin in rats (Fan et
al., 2011) and the absorption of vasopressin from rat small intestine (Ritschel,
1991). Emulsion and microemulsion formulations of insulin produced an oral
glucose reduction in rats of 25-37.5% (Sharma et al., 2010, Toorisaka et al.,
2003) and increased its pharmacological availability from undetectable to 7%
(Elsayed et al., 2009). Emulsions of leuprolide increased its in vitro stability
(Zheng et al., 1999a) and bioavailability from 0.08 to 6.8%, relative to an
intravenous dose, when administered to the duodenum of rats (Adjei et al.,
1993). A microemulsion of parathyroid hormone produced an oral bioavailability
of 5.4% relative to a subcutaneous dose (Guo et al., 2011).
Incompatibility of hydrophilic protein and peptide drugs with the oil phase of an
emulsion may have caused 60% calcitonin leakage in SGF from a
microemulsion which would leave it vulnerable to degradation if administered
orally (Fan et al., 2011).
72
Surfactant coating of proteins and peptides has been used to make them more
lipophilic and compatible for loading in emulsions (Toorisaka et al., 2003).
1.11.6 Multiparticulates- potential for oral delivery
Encapsulation in multiparticulates alone can increase the oral bioavailability of
protein and peptide drugs to more than 10% but bioavailabilities of more than
20% are only achievable in conjunction with other strategies. Attachment of
targeting ligands to their surface, coating with mucoadhesive or pH sensitive
polymers and the co-encapsulation of protease inhibitors and permeation
enhancers are necessary for these greater oral bioavailabilities.
1.12 Commercial oral delivery strategies
In addition to academic research and development many biotechnology
companies have also been pursuing oral protein and peptide formulations. This
has been met with mixed success. Unfortunately this sector is littered with
companies which have demonstrated promising results in preclinical or early
stage clinical trials but have since gone into liquidation. This means the full
potential of some delivery strategies have not been fully determined.
1.12.1 Discontinued/inactive oral delivery strategies
AutoImmune with Eli Lilly and Provalis with Cortecs Ltd developed oral insulin
formulations which showed efficacy in phase II clinical trials but they have since
been suspended. Oral insulin delivery strategies developed by Endorex, based
on liposomes, by Apollo Lifesciences, based on vitamin B12 coated
nanoparticles, and by Bow pharmaceuticals, based on encapsulation in a
dextran matrix, have also been suspended. Diasome developed a nanosized
oral insulin that was stable at low pH and in the bloodstream. This was tested
in phase II and III clinical trials with type II diabetics in 2009 but there have been
no further trials or information regarding this product. Oral formulations of
insulin, developed by Diabetology, and calcitonin, by Bone Limited,
demonstrated efficacy in Phase I and IIa clinical trials using Axcess delivery
technology. This delivery technology involves encapsulation in enteric coated
capsules with an absorption enhancer and bile acids.
73
These trials were conducted in 2004 and 2005, there have been no further trials
but Diabetology recently announced a partnership with USV Limited to develop
oral insulin for the Indian market.
1.12.2 Current oral delivery strategies in clinical trials
Despite the suspension of many projects some have completed successful
clinical trials and are pursuing filings in the near future. These active programs
are outlined in table 1.14.
Emisphere’s Eligen technology utilises delivery agents, which interact non-
covalently with protein and peptide drugs exposing their hydrophobic side
chains, increasing their lipophilicity and absorption. This strategy was one of
the most promising for protein/peptide delivery increasing the oral
bioavailabilities of parathyroid hormone (Leone-Bay et al., 2001, Leone-Bay et
al., 1996) , human growth hormone (Milstein et al., 1998), salmon calcitonin
(Leone-Bay et al., 1995a, Leone-Bay et al., 1995b) and interferon-α (Milstein et
al., 1998, Leone-Bay et al., 1995b) in rats and primates. However, a three year
phase III clinical trial with salmon calcitonin, which ended in 2011, failed to meet
primary and secondary endpoints in treating postmenopausal osteoporosis and
its planned 2012 submission has been abandoned. Its oral programs for
parathyroid hormone, human growth hormone and insulin for type I diabetes
have all been terminated. Its only remaining oral peptide delivery program is
with GLP-1 analogs and insulin for type 2 diabetes which entered phase I
clinical trials in 2010.
Biocon have continued the development of an oral insulin formulation, IN-105,
initiated originally by the Nobex Corporation. However, phase III clinical trials
did not meet desired expectations, not thought necessarily to be due to a lack of
efficacy but due to behavioural modifications of those taking the placebo. The
project is still active though and a partnership with Bristol-Myers-Squibb for
further development appears likely.
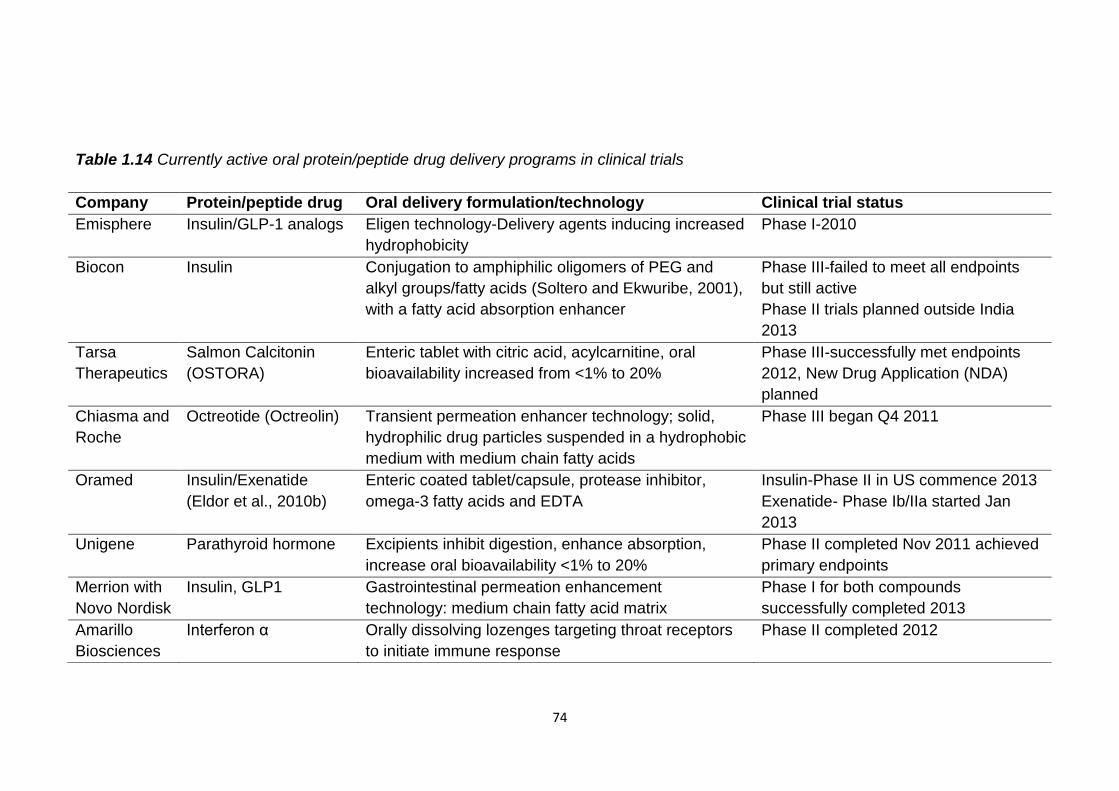
74
Table 1.14 Currently active oral protein/peptide drug delivery programs in clinical trials
Company Protein/peptide drug Oral delivery formulation/technology Clinical trial status
Emisphere Insulin/GLP-1 analogs Eligen technology-Delivery agents inducing increased
hydrophobicity
Phase I-2010
Biocon Insulin Conjugation to amphiphilic oligomers of PEG and
alkyl groups/fatty acids (Soltero and Ekwuribe, 2001),
with a fatty acid absorption enhancer
Phase III-failed to meet all endpoints
but still active
Phase II trials planned outside India
2013
Tarsa
Therapeutics
Salmon Calcitonin
(OSTORA)
Enteric tablet with citric acid, acylcarnitine, oral
bioavailability increased from <1% to 20%
Phase III-successfully met endpoints
2012, New Drug Application (NDA)
planned
Chiasma and
Roche
Octreotide (Octreolin) Transient permeation enhancer technology; solid,
hydrophilic drug particles suspended in a hydrophobic
medium with medium chain fatty acids
Phase III began Q4 2011
Oramed Insulin/Exenatide
(Eldor et al., 2010b)
Enteric coated tablet/capsule, protease inhibitor,
omega-3 fatty acids and EDTA
Insulin-Phase II in US commence 2013
Exenatide- Phase Ib/IIa started Jan
2013
Unigene Parathyroid hormone Excipients inhibit digestion, enhance absorption,
increase oral bioavailability <1% to 20%
Phase II completed Nov 2011 achieved
primary endpoints
Merrion with
Novo Nordisk
Insulin, GLP1 Gastrointestinal permeation enhancement
technology: medium chain fatty acid matrix
Phase I for both compounds
successfully completed 2013
Amarillo
Biosciences
Interferon α Orally dissolving lozenges targeting throat receptors
to initiate immune response
Phase II completed 2012
75
The other oral protein/peptide delivery system that has completed phase III
clinical trials is Tarsa Therapeutic’s OSTORA, salmon calcitonin tablet. It
successfully met all clinical endpoints and represents the most promising oral
peptide strategy for future availability (Binkley et al., 2012). However an FDA
Advisory Committee decided in 2013 that salmon calcitonin should no longer be
broadly marketed as the risk of it causing cancer outweighs its benefits. This
unfortunately may end the progress of this oral peptide which had progressed
much farther than many others.
Chiasma’s oral octreotide is currently undergoing phase III clinical trials and
they are hopeful of filing an NDA in 2013. A new partnership with Roche was
announced in February 2013 to develop and commercialise Octreolin.
Unigene’s oral formulation of parathyroid hormone, Amarillo Bioscience’s oral
formulation of interferon α and Oramed’s oral insulin and exenatide have
entered or completed phase II clinical trials and it remains to be seen if they can
progress to further clinical trials.
The programs all involve proteins/peptides less than 6kDa, except for interferon
α which is targeted to throat receptors and so doesn’t have to overcome the
stability and permeability issues of oral systemic delivery. The oral delivery of
larger proteins to the systemic circulation does not look like becoming a reality
soon. However the success of Tarsa Therapeutics phase III clinical trial with
calcitonin suggests it may not be long before relatively large, hydrophilic
peptides can be administered orally.
Emerging oral protein/peptide drug delivery strategies in preclinical or entering
clinical trials seem mainly to be based on modified nanoparticles. Access
Pharmaceuticals have formulated protein and peptide drugs in nanoparticles
coupled to cobalamin, a vitamin B12 analog. NOD Pharmaceuticals are
currently conducting phase I clinical and preclinical trials with oral insulin and
exenatide mucoadhesive nanoparticles. NanoMega Corp have encapsulated
insulin in chitosan shelled gamma γ-PGA nanoparticles and Oshadi drug
administration have blended insulin with inert silica nanoparticles, a
polysaccharide, suspended them in oil and loaded into enteric capsules.
76
1.13 Oral protein/peptide drug delivery success and future perspective
Numerous strategies for oral protein and peptide delivery have been attempted
and shown some improvement in bioavailability compared to the drugs alone.
Oral bioavailabilities of protein and peptide drugs are generally less than 5%,
table 1.3, and most of the delivery strategies attempted have not raised them to
more than 10%, relative to injected doses. The most successful strategies,
which have raised oral bioavailabilities to ~20%, and those which have proved
successful in clinical trials are combinations of many strategies. They combine
encapsulation of the protein/peptide drug in multiparticulates, capsules or
tablets with protease inhibitors and permeability enhancers, especially medium
chain fatty acids. They may also be enteric coated or conjugated to targeting
ligands.
As many of these delivery strategies may disrupt normal digestive processes
and compromise the barrier function of the GI tract to incoming toxins
implications of their long term use should be considered. Oral bioavailabilities
should be reproducible and reliable to achieve a regulatory filing but
incompatibility of hydrophilic protein and peptide drugs with hydrophobic
delivery carriers can produce uncontrolled drug release (Yang et al., 2011, Fan
et al., 2011, Anderson et al., 2001, Yang et al., 2012, Carino et al., 2000).
Reproducible bioavailabilities may also be compromised by intra or inter subject
variation in the GI environment as protein and peptide drug absorption is so
highly dependent on its characteristics. Those drugs with a wide therapeutic
window, such as the currently orally available desmopressin, may be more
compatible for oral delivery due to this variability. Octreotide and calcitonin
have large therapeutic windows and this may partly explain the progression of
their oral formulations to phase III clinical trials.
Despite the failures encountered during clinical trials and the suspension of
many projects oral protein/peptide drug formulations are closer than they ever
have been. The success of Tarsa Therapeutics’ oral salmon calcitonin in
clinical trials increases the probability that other protein and peptide drugs will
soon be orally available.
77
Oral bioavailabilities are still much lower than those of injected doses and
therefore much higher doses must be administered orally to have the same
effect. For more expensive protein and peptide drugs this could preclude their
oral delivery. The toxicity implications of administering relatively large doses of
protein and peptide drugs orally must also be considered.
Challenges for the future may be the scaling up for manufacture of the more
complex particulate delivery formulations. Research and clinical trials have
mainly focused on the delivery of oral peptides rather than proteins. Their
larger size seems to multiply the challenges of oral delivery and this may have
deterred development. While oral peptide delivery may soon be more widely
available oral protein delivery to the systemic circulation may take longer and
require strategies more specifically designed for them.
1.14 Aims of project
The aims of this project are to:
Gain a greater understanding of the role of the GI tract in oral
bioavailability limitations of protein and peptide drugs
o Investigate the effects of protein/peptide size/structure on
intestinal stability
o Identify regions of the intestinal tract which orally delivered
protein/peptide drugs need to be protected from
o Identify the most favourable region/s of the intestinal tract for oral
protein/peptide drug delivery
Use this knowledge and research of previously attempted strategies to
formulate rational oral protein/peptide delivery strategies
Utilise formulation methods which provide the least threat to
maintenance of fragile protein/peptide structure
Produce formulations that cause minimal disruption to the GI tract in
terms of digestion and cell membrane disruption
Produce formulations with efficient encapsulation of protein and peptide
drugs and which effectively control their release
Test oral protein/peptide delivery strategies in vitro to determine their in
vivo potential
Investigate and remedy any limitations of these delivery strategies
78
Chapter 2
Investigation of the intestinal stability of lactase
and development of its oral formulations
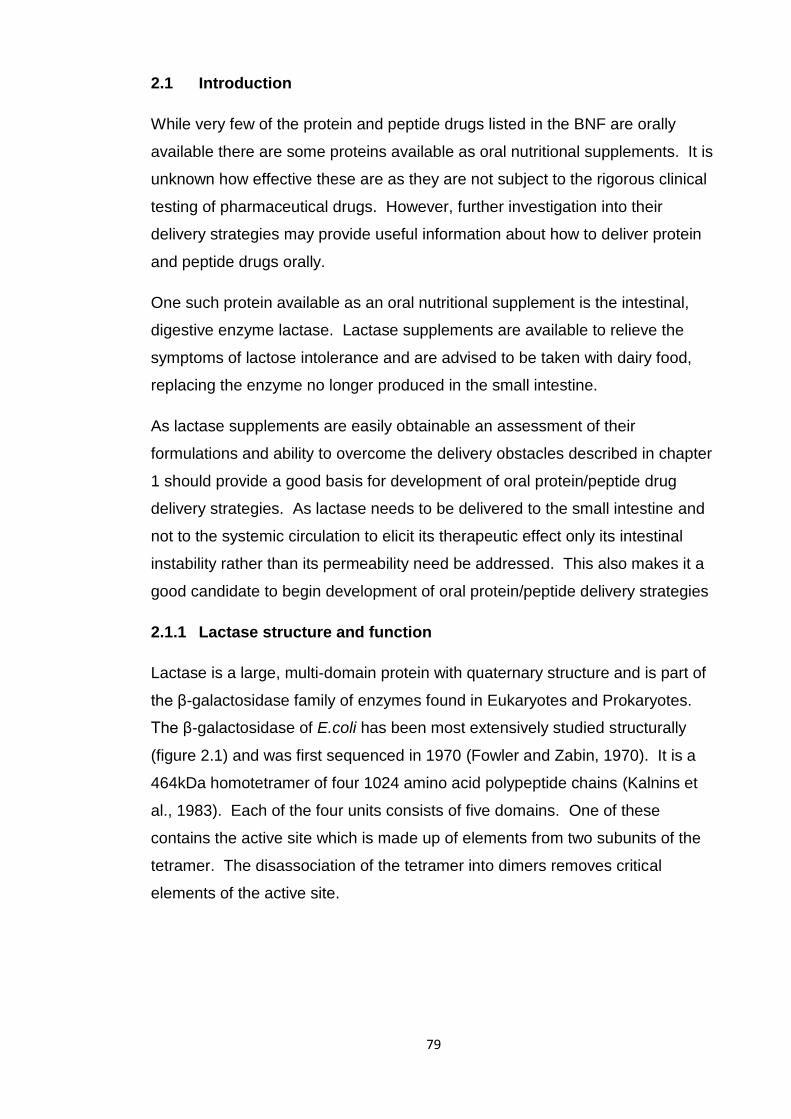
79
2.1 Introduction
While very few of the protein and peptide drugs listed in the BNF are orally
available there are some proteins available as oral nutritional supplements. It is
unknown how effective these are as they are not subject to the rigorous clinical
testing of pharmaceutical drugs. However, further investigation into their
delivery strategies may provide useful information about how to deliver protein
and peptide drugs orally.
One such protein available as an oral nutritional supplement is the intestinal,
digestive enzyme lactase. Lactase supplements are available to relieve the
symptoms of lactose intolerance and are advised to be taken with dairy food,
replacing the enzyme no longer produced in the small intestine.
As lactase supplements are easily obtainable an assessment of their
formulations and ability to overcome the delivery obstacles described in chapter
1 should provide a good basis for development of oral protein/peptide drug
delivery strategies. As lactase needs to be delivered to the small intestine and
not to the systemic circulation to elicit its therapeutic effect only its intestinal
instability rather than its permeability need be addressed. This also makes it a
good candidate to begin development of oral protein/peptide delivery strategies
2.1.1 Lactase structure and function
Lactase is a large, multi-domain protein with quaternary structure and is part of
the β-galactosidase family of enzymes found in Eukaryotes and Prokaryotes.
The β-galactosidase of E.coli has been most extensively studied structurally
(figure 2.1) and was first sequenced in 1970 (Fowler and Zabin, 1970). It is a
464kDa homotetramer of four 1024 amino acid polypeptide chains (Kalnins et
al., 1983). Each of the four units consists of five domains. One of these
contains the active site which is made up of elements from two subunits of the
tetramer. The disassociation of the tetramer into dimers removes critical
elements of the active site.
80
Figure 2.1 Computer simulation image based on X-ray diffraction of E.coli
β-galactosidase (Juers et al., 2000)
In humans, lactase is a gastrointestinal enzyme found mainly along the brush
border membrane of enterocytes that line the villi of the small intestine. Studies
of human intestinal lactase showed a 145,000MW band for the polypeptide
analysed by SDS-PAGE (Harvey et al., 1995). The lactase was also found to
have an isoelectric point of 4.8 and optimum activity at pH 4.5-6.
The function of intestinal lactase is to hydrolyse lactose, the primary
disaccharide in mammalian milk, to glucose and galactose (Montalto et al.,
2006). It is secreted by neonatal mammals, including humans, to allow them to
digest their mother’s milk. Once weaning has been completed lactase
production stops for the majority (Schulzke et al., 2009); 60% of human adults
no longer produce lactase and are therefore unable to digest lactose (Itan et al.,
2009). Lactase persistence evolved as milk digestion proved advantageous
providing a relatively constant source of Vitamin D and calcium (Itan et al.,
2009).
2.1.2 Lactose intolerance
Absence of lactase in lactose intolerance sufferers means any lactose
consumed will not be digested but remain throughout the GI tract. Undigested
lactose is fermented by colonic bacteria resulting in the formation of gas
causing abdominal pain, bloating, flatulence and nausea (Schulzke et al., 2009).
81
Unabsorbed lactose and fermentation products raise the osmotic pressure of
the colon causing water to enter resulting in diarrhoea. These symptoms arise
approximately 30 minutes to two hours after the consumption of lactose.
Lactose intolerant individuals are often advised to avoid any lactose containing
foods or drinks, however, these foods are a useful source of Vitamin D, calcium
and phosphorus and reducing intake of them can result in decreased bone
mineral density (Montalto et al., 2006).
To avoid the symptoms of lactose malabsorption and gain the benefits from the
consumption of dairy foods lactose can be pre-hydrolysed by the addition of
lactase (Montalto et al., 2006) or oral lactase supplements can be taken to
digest consumed lactose.
2.1.3 Lactose pre-hydrolysis
Addition of lactase to milk significantly reduced hydrogen production by lactose
intolerance sufferers (Montalto et al., 2005). Pre-hydrolysis of lactose avoids
risking loss of lactase activity in the acidic stomach when orally administered.
Consumption of lactase tablets (Lactaid) with whole milk resulted in more
hydrogen production, detected in the breath, than pre-hydrolysed milk
(Onwulata et al., 1989). The oral lactase may have been inactivated in the
stomach before it could digest lactose, enabling its fermentation and hydrogen
production in the gut.
The sugars produced by pre-hydrolysis, glucose and galactose, however are
sweeter than lactose and unpalatable to many. To avoid this lactase can be
microencapsulated before its addition to milk. This prevents lactose hydrolysis
and increased sweetness by preventing contact between enzyme and
substrate. Once the milk is consumed the microparticles release lactase and
digestion can commence. Liposomes have been investigated as possible
carriers but encapsulation efficiency is low, <30%, and long-term stability in milk
is poor (Kim et al., 1999, Rao et al., 1995, Rodriguez-Nogales and Lopez,
2006). Encapsulation in fatty acid esters proved more promising with an
encapsulation efficiency of 70% (Kwak et al., 2001). Their stability was also
better; when added to milk there was no decrease in lactose or increase in
sweetness detected during storage for 8 days.
82
However, it is unknown how this system will behave in vivo and if it will be able
to release an active enzyme which can digest lactose. There was also an off
taste to the milk possibly caused by the fatty acid esters.
2.1.4 Orally delivered lactase
2.1.4.1 Oral lactase stability
For orally delivered lactase to digest lactose in the small intestine it must first
pass through the stomach and arrive in the small intestine in an active form. In
chapter 1 gastric instability was frequently observed for large, three-dimensional
proteins like lactase, such as ovomucoid (Zheng et al., 2010), chicken egg yolk
immunoglobulin (Li et al., 2009) and other digestive enzymes (Scocca et al.,
2007, Massicotte et al., 2008). This may be caused by changes in amino acid
ionisation, due to the acidic pH, which result in disruption of bonds stabilising
the secondary and tertiary structure of proteins. Lactase suffered more than
90% loss of enzymatic activity after two hours incubation at pH 1.2 (Alavi et al.,
2002). Orally delivered lactase may also be susceptible to degradation by
enzymes in the stomach and small intestine.
2.1.4.2 Alternative lactase origin
O’Connel & Walsh found a lactase from Aspergillus niger van Tiegh that had
optimum activity at pH 2.5 and a 68% retention of activity after exposure to
simulated gastric conditions (O'Connell, 2009). This may be a more suitable
source of lactase for oral supplements, however it is only 10% active at pH 6.8.
To overcome this a two segment capsule was developed combining the gastric
active enzyme and a lactase active in the small intestine to allow continuous
lactose hydrolysis in the proximal intestine.
2.1.4.3 Oral lactase supplements
Oral lactase supplements have a better palatability than pre-hydrolysed dairy
food but have been shown to be less effective at preventing lactose
malabsorption (Onwulata et al., 1989). Despite its acid sensitivity (Alavi et al.,
2002) many lactase supplements don’t include any enteric coating eg, Lactaid,
Dairy Ease, Dairy Relief.
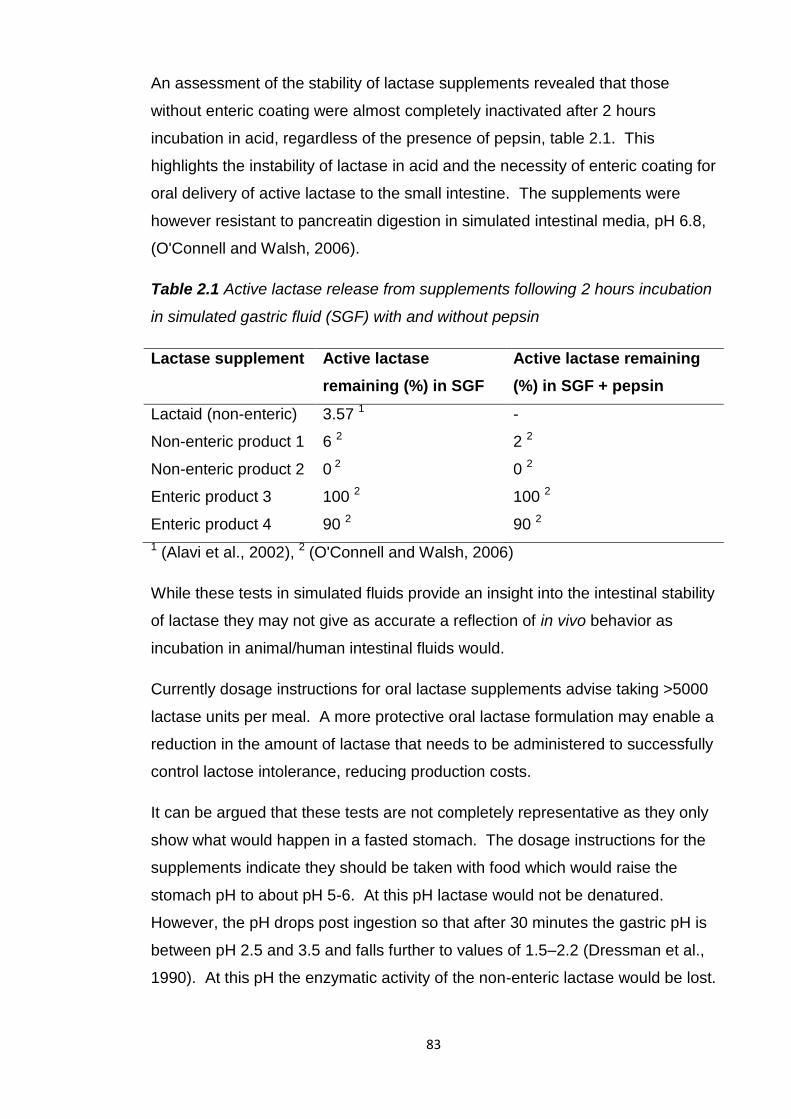
83
An assessment of the stability of lactase supplements revealed that those
without enteric coating were almost completely inactivated after 2 hours
incubation in acid, regardless of the presence of pepsin, table 2.1. This
highlights the instability of lactase in acid and the necessity of enteric coating for
oral delivery of active lactase to the small intestine. The supplements were
however resistant to pancreatin digestion in simulated intestinal media, pH 6.8,
(O'Connell and Walsh, 2006).
Table 2.1 Active lactase release from supplements following 2 hours incubation
in simulated gastric fluid (SGF) with and without pepsin
Lactase supplement Active lactase
remaining (%) in SGF
Active lactase remaining
(%) in SGF + pepsin
Lactaid (non-enteric) 3.57 1 -
Non-enteric product 1 6 2 2 2
Non-enteric product 2 0 2 0 2
Enteric product 3 100 2 100 2
Enteric product 4 90 2 90 2
1 (Alavi et al., 2002), 2 (O'Connell and Walsh, 2006)
While these tests in simulated fluids provide an insight into the intestinal stability
of lactase they may not give as accurate a reflection of in vivo behavior as
incubation in animal/human intestinal fluids would.
Currently dosage instructions for oral lactase supplements advise taking >5000
lactase units per meal. A more protective oral lactase formulation may enable a
reduction in the amount of lactase that needs to be administered to successfully
control lactose intolerance, reducing production costs.
It can be argued that these tests are not completely representative as they only
show what would happen in a fasted stomach. The dosage instructions for the
supplements indicate they should be taken with food which would raise the
stomach pH to about pH 5-6. At this pH lactase would not be denatured.
However, the pH drops post ingestion so that after 30 minutes the gastric pH is
between pH 2.5 and 3.5 and falls further to values of 1.5–2.2 (Dressman et al.,
1990). At this pH the enzymatic activity of the non-enteric lactase would be lost.
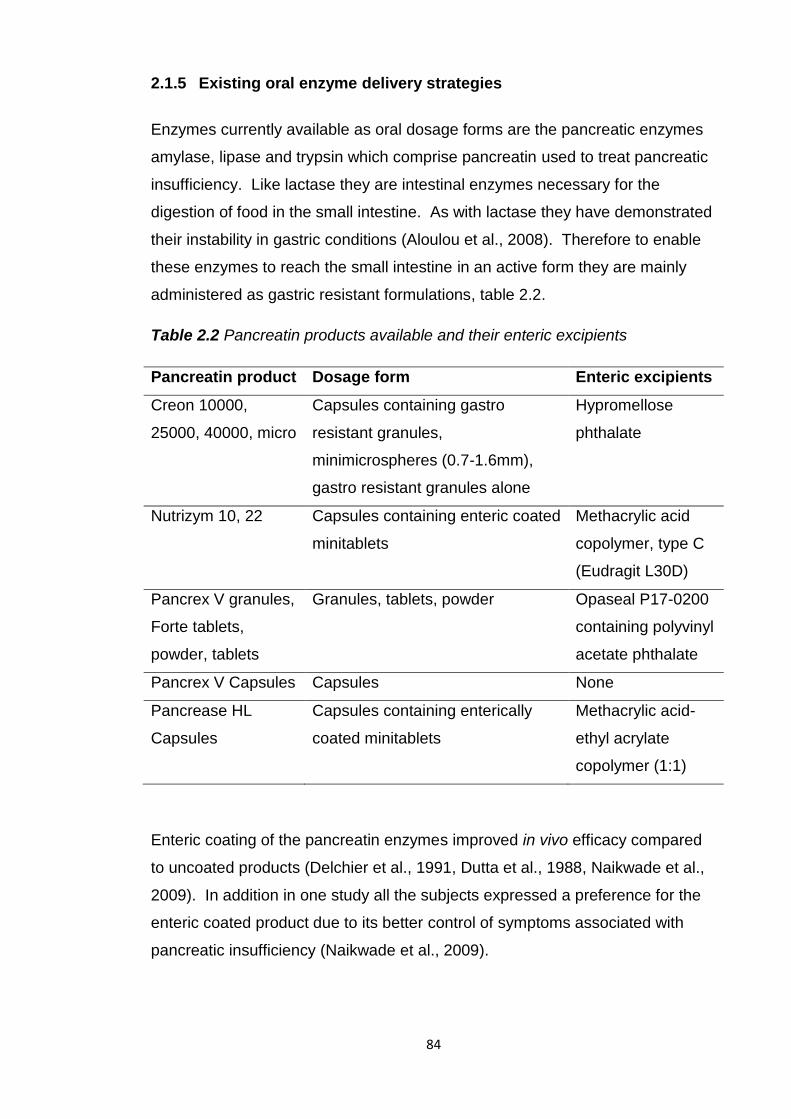
84
2.1.5 Existing oral enzyme delivery strategies
Enzymes currently available as oral dosage forms are the pancreatic enzymes
amylase, lipase and trypsin which comprise pancreatin used to treat pancreatic
insufficiency. Like lactase they are intestinal enzymes necessary for the
digestion of food in the small intestine. As with lactase they have demonstrated
their instability in gastric conditions (Aloulou et al., 2008). Therefore to enable
these enzymes to reach the small intestine in an active form they are mainly
administered as gastric resistant formulations, table 2.2.
Table 2.2 Pancreatin products available and their enteric excipients
Pancreatin product Dosage form Enteric excipients
Creon 10000,
25000, 40000, micro
Capsules containing gastro
resistant granules,
minimicrospheres (0.7-1.6mm),
gastro resistant granules alone
Hypromellose
phthalate
Nutrizym 10, 22 Capsules containing enteric coated
minitablets
Methacrylic acid
copolymer, type C
(Eudragit L30D)
Pancrex V granules,
Forte tablets,
powder, tablets
Granules, tablets, powder Opaseal P17-0200
containing polyvinyl
acetate phthalate
Pancrex V Capsules Capsules None
Pancrease HL
Capsules
Capsules containing enterically
coated minitablets
Methacrylic acid-
ethyl acrylate
copolymer (1:1)
Enteric coating of the pancreatin enzymes improved in vivo efficacy compared
to uncoated products (Delchier et al., 1991, Dutta et al., 1988, Naikwade et al.,
2009). In addition in one study all the subjects expressed a preference for the
enteric coated product due to its better control of symptoms associated with
pancreatic insufficiency (Naikwade et al., 2009).
85
Delayed enzyme release has been reported for some of the enteric coated
tablets (Aloulou et al., 2008). To overcome this dosage form size has been
reduced to enable mixing with the food contents of the stomach and accelerated
enzyme release. Reduction of pancreatin dosage size from tablets to
microspheres reduced Gl symptoms (Beverley et al., 1987).
Pancreatin encapsulated in enteric Eudragit L100 microparticles preserved
99.78% of enzyme activity after acid incubation and more rapidly released
pancreatin upon pH rise to pH 6.8 than pancreatin tablets (Naikwade et al.,
2009). In vivo this should allow more opportunity for digestion as the enzymes
are more rapidly released and will be available over more of the small intestine.
2.1.6 Lactase microparticles
Single unit, enteric coated dosage forms, such as tablets, have been observed
to disintegrate 1.5-2 hours post-gastric emptying rather than immediately (Cole
et al., 2002). This can result in reduced bioavailability and symptom control.
Pancreatin microspheres were shown to be superior to tablets in terms of rapid
release at pH 6.8 and alleviation of pancreatitis symptoms (Naikwade et al.,
2009, Beverley et al., 1987). Microparticles are able to suspend in gastric fluids
unlike larger dosage forms allowing reliable and fast gastric emptying. The
increased surface area to volume ratio also enables rapid drug release.
Lactase microparticles consisting of pH dependent and independent polymers
have been formulated to take advantage of their beneficial release profile.
Non-enteric polymers used to produce microparticles encapsulating or
adsorbing lactase include poly(lactic acid) (PLA) (Hayashi et al., 1994,
Stivaktakis et al., 2005) and poly (lactic-co-glycolic acid) (PLGA) (Stivaktakis et
al., 2004, Stivaktakis et al., 2005). Their applicability for oral lactase delivery is
questionable however due to the lack of specific gastric protection. None of
these formulations were tested in vivo or in vitro in SGF. Release was tested in
phosphate buffered saline and lactase was immediately burst released, up to
41% in one hour (Hayashi et al., 1994). If this occurred in vivo upon dispersal in
gastric fluids lactase activity would be destroyed. The homogenisation step
used to prepare these particles was also shown to damage lactase reducing its
antigenicity by 45%.
86
Coupling of wheat germ agglutinin (WGA) to PLGA microparticles was used to
increase the residence time of lactase in the small intestine (Ratzinger et al.,
2010). This increased mucoadhesion in vitro but there were no studies to
investigate the stability of WGA attachment in vitro in SGF or in vivo. It is also
not known if this system can prolong lactase residence time for long enough for
it to fully digest consumed lactose.
2.1.7 Enteric microparticles
Existing non-enteric lactase supplements have proved unsatisfactory for
protecting lactase in simulated gastric fluids. Researched oral lactase delivery
strategies have either not been tested in or provided insufficient protection in
simulated gastric conditions, or not shown satisfactory activity in small intestinal
conditions. While enteric coated tablets/capsules can provide gastric protection
they may suffer from a delayed enzyme release at small intestinal pH
preventing complete lactose digestion. To combine the advantages of enteric
protection and reduced dosage form size enteric microparticles of lactase have
been produced.
The pH responsive polymer alginate (Dashevsky, 1998) and fatty acid esters
(Kim et al., 2006) were used to produce lactase loaded microparticles.
However neither were tested in vivo and only the fatty acid ester particles were
tested in SGF. There was 15.2% lactase release in SGF in an hour, which
would be denatured, and upon pH rise there was a slow lactase release. At
pH 6 there was only 45% lactase release after 3 hours which rose to 80% at pH
7 in an hour. This delay could result in lactose persistence.
Alavi et al and Squillante et al produced pH responsive microparticles
encapsulating lactase with Eudragit L100 (dissolves above pH 6) and Eudragit
S100 (dissolves above pH 7) (Alavi et al., 2002, Squillante et al., 2003). The oil
in oil emulsification solvent evaporation preparation method used produced
particles with a mean diameter of 53-195µm which should enable rapid gastric
emptying and lactase release. A high entrapment efficiency of >80% was
achieved but there was a 32% loss of lactase activity during processing,
possibly due to the use of high shear homogenisation (Squillante et al., 2003).
Reducing temperature and homogenisation speed had a protective effect on
activity.
87
The Eudragit L100 microparticles were able to prevent lactase release during
dissolution studies in 0.1N HCl (Squillante et al., 2003). Upon pH rise to pH 6.8
there was only 25% released after 20 minutes and 65% after 100 minutes. This
release rate was quite slow and could result in incomplete lactose digestion.
Lactase release was determined not by its activity but by its UV absorbance and
therefore it is unknown if the microparticles actually preserved lactase activity.
Both of these microparticle production methods used homogenisation and
careful control of temperature. Homogenisation has been shown to have a
detrimental effect on lactase activity (Stivaktakis et al., 2005). A simpler oil in oil
emulsion solvent evaporation method of microparticle preparation has been
used by Kendall et al. to produce prednisolone loaded microparticles composed
of Eudragit L100 with the novel use of sorbitan sesquioleate as surfactant
(Kendall et al., 2009). This method doesn’t require temperature control, uses a
slower emulsification speed, 1000rpm instead of 8000rpm (Alavi et al., 2002),
and uses the less toxic ethanol instead of acetone or methanol to dissolve the
polymer. Eudragit L100 microparticles produced were <40µm, uniform,
spherical and had high encapsulation efficiency (>80%) and yield (>90%). They
restricted release of the encapsulated drug in acid media and rapidly released
the drug at pH 6.8. When administered orally to rats the drug was rapidly
released and detected in the blood plasma. This method, previously just
employed for the encapsulation of small molecules, has the potential to be used
for the novel encapsulation of a large biological, lactase, in Eudragit L100
microparticles to provide protection in the stomach and target the small intestine
for rapid, active enzyme release.
88
2.2 Aims
To discover the stability of lactase throughout the gastrointestinal tract
using simulated and porcine gastrointestinal fluids and human faecal
fluids
o To use this knowledge for rational design of oral lactase delivery
vehicles
o To investigate the oral stability of large molecular weight proteins
with a tertiary structure
To assess the stability of oral lactase supplements in the gastrointestinal
fluids which were identified as damaging to lactase activity
o To identify the formulation components that aid oral lactase
stability
To produce oral lactase formulations based on the results of the
intestinal stability study, lactase supplements testing and previous oral
delivery strategies for lactase and other enzymes
o To characterise them in terms of physical characteristics (size,
morphology), loading and encapsulation efficiency
o To assess their in vitro lactase release and ability to preserve
lactase activity in simulated gastrointestinal conditions
o To analyse and investigate failure to retain lactase activity in
simulated gastrointestinal conditions
o To adapt formulations to overcome any failures in lactase
protection/release
2.3 Materials
Lactase (β-Galactosidase), from Aspergillus oryzae (9.9units/mg solid)
standardised with dextrin and pancreatin from porcine pancreas, activity at least
3x USP specifications were from Sigma Aldrich. Enzeco fungal lactase
concentrate was from the Enzyme Development Corporation (81.51units/mg).
Hydrochloric acid 37%, specific gravity 1.18 was from BDH. Pig gastric and
intestinal fluids were collected from freshly slaughtered pigs and immediately
frozen and stored at -80oC. Human faecal fluids were from healthy individuals
not taking antibiotics.
89
Faecal basal media materials: Bacteriological peptone and yeast extract were
from Oxoid. Sodium chloride, L-cysteine hydrochloride, vitamin K, resazurin
sodium salt and sodium hydroxide were from Fisher Scientific. Dipotassium
hydrogen orthophosphate and magnesium sulphate 7-hydrate were from BDH.
Calcium chloride dihydrate was from VWR. NaHCO3 and haemin were from
Sigma Aldrich. Bile salts were from Fluka Analytical. Tween 80 was from Fluka
Chemika.
Lactase supplements analysed are listed and described in table 2.3.
Microcrystalline cellulose (Avicel) and croscarmellose sodium (Ac-Di-Sol) were
from FMC Biopolymer. Magnesium stearate, sodium chloride and citric acid
monohydrate were from Fisher Scientific. Triethyl citrate, sodium bicarbonate,
soybean oil, monobasic potassium phosphate, sodium carbonate (anhydrous),
o-Nitrophenyl-β-D-galactopyranoside (ONPG), ≥98%, fluorescein 5 (6)-
isothiocyanate (FITC), magnesium hydroxide and phosphate buffered saline
(PBS) tablets were from Sigma Aldrich. Glycerol monostearate was from Alfa
Aesar. Polysorbate 80 was from Fluka Chemika. Trisodium citrate dehydrate,
glacial acetic acid and ethanol 96% v/v were from BDH AnalaR.
Eudragit L100 was a gift from Degussa/ Evonik (Darmstadt, Germany), sorbitan
sesquioleate (Alacel 83) was from Sigma Aldrich. Liquid paraffin BP was
supplied by JM Loveridge Plc. Sodium phosphate, tribasic, anhydrous was
from Alfa Aesar. n-hexane was from Fisher Scientific. Lipoid S100
phosphatidylcholine from soybean (soy lecithin) was from Lipoid GMBH.
Lysosensor yellow/blue dextran 10,000 MW anionic, fixable was from Invitrogen
Molecular Probes.
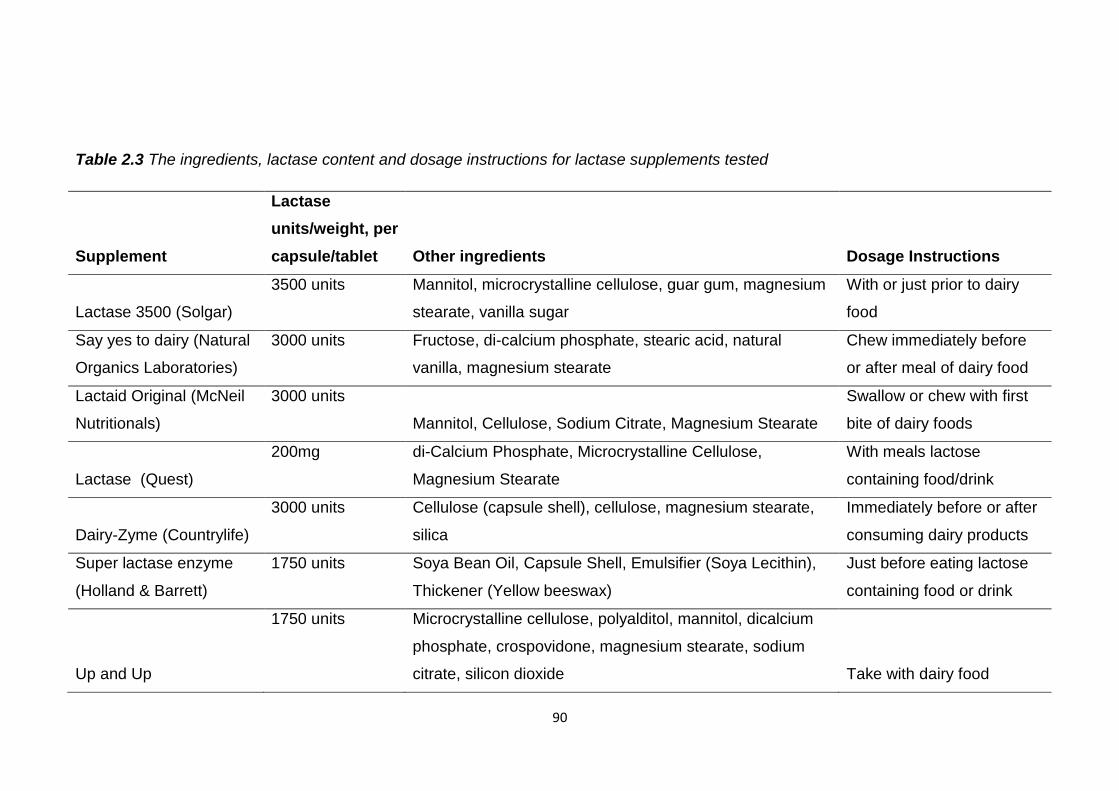
90
Table 2.3 The ingredients, lactase content and dosage instructions for lactase supplements tested
Supplement
Lactase
units/weight, per
capsule/tablet Other ingredients Dosage Instructions
Lactase 3500 (Solgar)
3500 units Mannitol, microcrystalline cellulose, guar gum, magnesium
stearate, vanilla sugar
With or just prior to dairy
food
Say yes to dairy (Natural
Organics Laboratories)
3000 units Fructose, di-calcium phosphate, stearic acid, natural
vanilla, magnesium stearate
Chew immediately before
or after meal of dairy food
Lactaid Original (McNeil
Nutritionals)
3000 units
Mannitol, Cellulose, Sodium Citrate, Magnesium Stearate
Swallow or chew with first
bite of dairy foods
Lactase (Quest)
200mg di-Calcium Phosphate, Microcrystalline Cellulose,
Magnesium Stearate
With meals lactose
containing food/drink
Dairy-Zyme (Countrylife)
3000 units Cellulose (capsule shell), cellulose, magnesium stearate,
silica
Immediately before or after
consuming dairy products
Super lactase enzyme
(Holland & Barrett)
1750 units Soya Bean Oil, Capsule Shell, Emulsifier (Soya Lecithin),
Thickener (Yellow beeswax)
Just before eating lactose
containing food or drink
Up and Up
1750 units Microcrystalline cellulose, polyalditol, mannitol, dicalcium
phosphate, crospovidone, magnesium stearate, sodium
citrate, silicon dioxide Take with dairy food
91
2.4 Methods
2.4.1 Lactase activity-ONPG assay
o-nitrophenyl-β-D-galactopyranoside (ONPG) is a substrate for lactase and
used in an assay to measure its activity (USP 35-NF 30). When lactase cleaves
ONPG a yellow compound, o-nitrophenol (ONP), is released. This absorbs light
at 420nm and the level of absorbance can be used to determine how much
active lactase is present. One lactase activity unit is defined as the quantity of
enzyme that will liberate 1µmol of ONP per minute at 37ºC at a pH of 4.5.
ONPG solution was prepared in a solution of glacial acetic acid, 4N sodium
hydroxide and DI water adjusted to pH 4.50 ± 0.05. Lactase activity was
determined by adding the sample (0.5ml) to be analysed to 3.7mg/ml ONPG
solution (1ml) which had been incubated at 37°C for 10 minutes. This was
incubated at 37°C, 100rpm in a Gallenkamp shaking incubator and removed
after 15 minutes when 10% sodium carbonate solution (1.25ml) was added to
stop the reaction. DI water (10ml) was added before measuring the absorbance
at 420nm using a UV/Vis spectrophotometer (Cary 3E). Sample activity was
measured with reference to a calibration curve of lactase standards prepared in
the relevant media.
2.4.2 Intestinal stability
100µl of a 500µg/ml lactase solution was added to 9.9ml of simulated gastric
fluid (SGF) and simulated intestinal fluid (SIF) with and without pancreatin (final
lactase concentration of 5µg/ml). These were placed in a Gallenkamp shaking
incubator at 37°C and agitated at 100rpm. Samples (0.5ml) were removed after
0, 5, 10, 20, 30, 60, 90 and 120 minutes and tested for lactase activity using the
ONPG assay. Lactase stability was not tested in SGF with pepsin due to its
complete activity loss in SGF alone rendering this test inexpedient.
SGF was prepared by dissolving 2g NaCl in DI water, adding 7ml of
concentrated HCl and making up to 1 litre with DI water. The pH was adjusted
to pH1.2 ± 0.5 with concentrated HCl and 5N NaOH. SIF was prepared by
dissolving 6.8g of monobasic potassium phosphate in 250ml DI water and then
adding 77ml of 0.2N NaOH before making up to 1 litre with DI water.
92
The pH was adjusted to pH 6.8 ± 0.5 with concentrated HCl and 5N NaOH
before addition of pancreatin at a concentration of 10g/litre.
Pigs are omnivores like humans so assessing stability in pig intestinal fluids
should provide information on its stability in humans. While possibly not
completely reflecting what would happen in human intestinal fluids in vivo these
results give a general picture of intestinal stability. 300μl of a 120µg/ml lactase
solution was added to 900μl of gastric (pH 2.31), duodenal (pH 6.55), jejunal
(pH 6.79), ileal (pH 6.86) and descending colonic fluids (pH 7.06) from a pig.
The pig intestinal fluids were prepared by centrifuging at 10,000rpm for 10
minutes and the supernatant was used for testing. These mixtures were placed
in a Gallenkamp shaking incubator at 37°C and agitated at 100rpm. 100µl
samples were taken after 0, 5, 10, 20, 30, 60, 90 and 120 minutes and diluted
by the addition of 500µl PBS to give a final lactase concentration of 5µg/ml and
then analysed for active lactase using the ONPG assay.
300μl of a 120µg/ml lactase solution was added to 900μl of human faecal slurry
and placed in a Gallenkamp shaking incubator using the parameters used in the
previous tests. 100µl samples were taken at 0, 5, 10, 20, 30, 60, 90 and 120
minutes and diluted by the addition of 500µl PBS to give a final lactase
concentration of 5µg/ml and analysed for active lactase using the ONPG assay.
The stability of lactase in these intestinal fluids was defined as the amount of
active lactase recovered at each time point as a percentage of the total active
lactase added initially. Changes in lactase concentration due to removal of
samples were accounted for.
Active lactase recovered (%) =
x100
2.4.2.1 Human faecal slurry
Initially the basal medium was prepared as described here using the excipients
listed in table 2.4. Peptone water and yeast extract were weighed into a glass
bottle containing 1.3L of distilled water and autoclaved at 130°C for 20 minutes.
Sodium chloride, dipotassium hydrogen orthophosphate, magnesium sulphate
7-hydrate, calcium chloride dihydrate were weighed into a 200ml volumetric
flask with approximately 150ml of distilled water and stirred to dissolve.
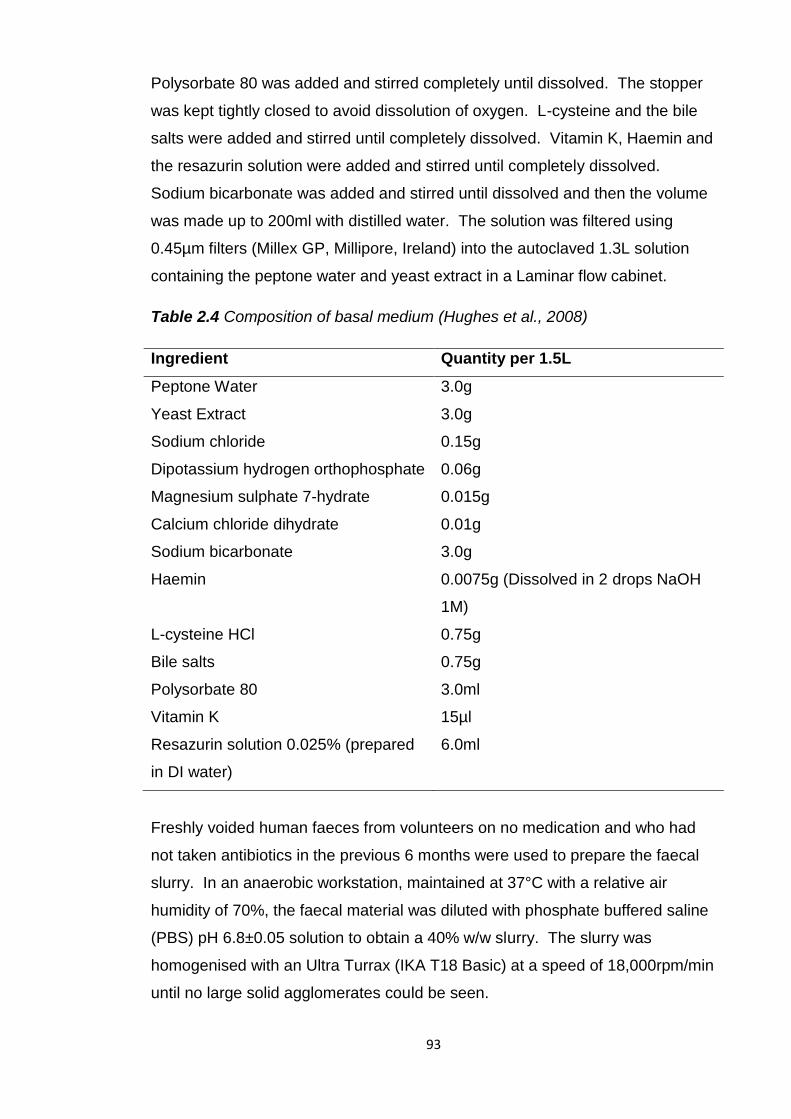
93
Polysorbate 80 was added and stirred completely until dissolved. The stopper
was kept tightly closed to avoid dissolution of oxygen. L-cysteine and the bile
salts were added and stirred until completely dissolved. Vitamin K, Haemin and
the resazurin solution were added and stirred until completely dissolved.
Sodium bicarbonate was added and stirred until dissolved and then the volume
was made up to 200ml with distilled water. The solution was filtered using
0.45µm filters (Millex GP, Millipore, Ireland) into the autoclaved 1.3L solution
containing the peptone water and yeast extract in a Laminar flow cabinet.
Table 2.4 Composition of basal medium (Hughes et al., 2008)
Ingredient Quantity per 1.5L
Peptone Water 3.0g
Yeast Extract 3.0g
Sodium chloride 0.15g
Dipotassium hydrogen orthophosphate 0.06g
Magnesium sulphate 7-hydrate 0.015g
Calcium chloride dihydrate 0.01g
Sodium bicarbonate 3.0g
Haemin 0.0075g (Dissolved in 2 drops NaOH
1M)
L-cysteine HCl 0.75g
Bile salts 0.75g
Polysorbate 80 3.0ml
Vitamin K 15µl
Resazurin solution 0.025% (prepared
in DI water)
6.0ml
Freshly voided human faeces from volunteers on no medication and who had
not taken antibiotics in the previous 6 months were used to prepare the faecal
slurry. In an anaerobic workstation, maintained at 37°C with a relative air
humidity of 70%, the faecal material was diluted with phosphate buffered saline
(PBS) pH 6.8±0.05 solution to obtain a 40% w/w slurry. The slurry was
homogenised with an Ultra Turrax (IKA T18 Basic) at a speed of 18,000rpm/min
until no large solid agglomerates could be seen.
94
The slurry was sieved through an open mesh fabric (Sefar NitexTM, pore size
350µm) to remove any unhomogenised fibrous material. The basal media was
then added to the faecal slurry to achieve a 1:1 dilution. This slurry was then
used to test the stability of lactase.
2.4.3 Lactase supplements
Lactase supplements, listed in table 2.3, were tested for residual lactase activity
following exposure to simulated gastric and small intestinal environments using
the USP (724) method for testing drug release from enteric coated articles. The
supplements, in triplicate, were placed in 750ml 0.1N HCl, pH 1.2 ± 0.05, for
2 hours at 37±0.5°C, stirring at 50rpm to simulate gastric conditions in a USP II
paddle apparatus dissolution bath. After 2 hours 250ml of pre warmed, to 37°C,
0.2M tribasic sodium phosphate was added and the pH adjusted to pH 6.8 ±
0.05 to simulate the transition into the small intestine. Stirring continued at
50rpm for a further 45 minutes and was increased to 250rpm for the final 30
seconds. Samples were removed, filtered using 0.45µm Millex filters and tested
for lactase activity using the ONPG assay.
Each lactase supplement was also placed in 1 litre of pH 6.8 phosphate buffer
for 2 hours and 45 minutes and stirred at 50rpm, increasing to 250rpm for the
final 30 seconds. The temperature was 37°C throughout. This was done to
determine the total active lactase released from each supplement in simulated
small intestinal conditions and compare this to active lactase released when the
supplements were first placed in acid. All tests were carried out in triplicate.
Samples were filtered using 0.45µm Millex filters and tested for lactase activity
using the ONPG assay.
Units of active lactase per tablet were calculated using a standard curve of
measured lactase activity in pH 6.8 phosphate buffer. The difference in active
lactase remaining following dissolution in 0.1N HCl shifting to pH 6.8 phosphate
buffer compared to incubation in pH 6.8 phosphate buffer was calculated by
subtracting the former from the latter. The percentage loss in lactase activity
was calculated using the following equation:
Lactase activity loss (%) =
x100
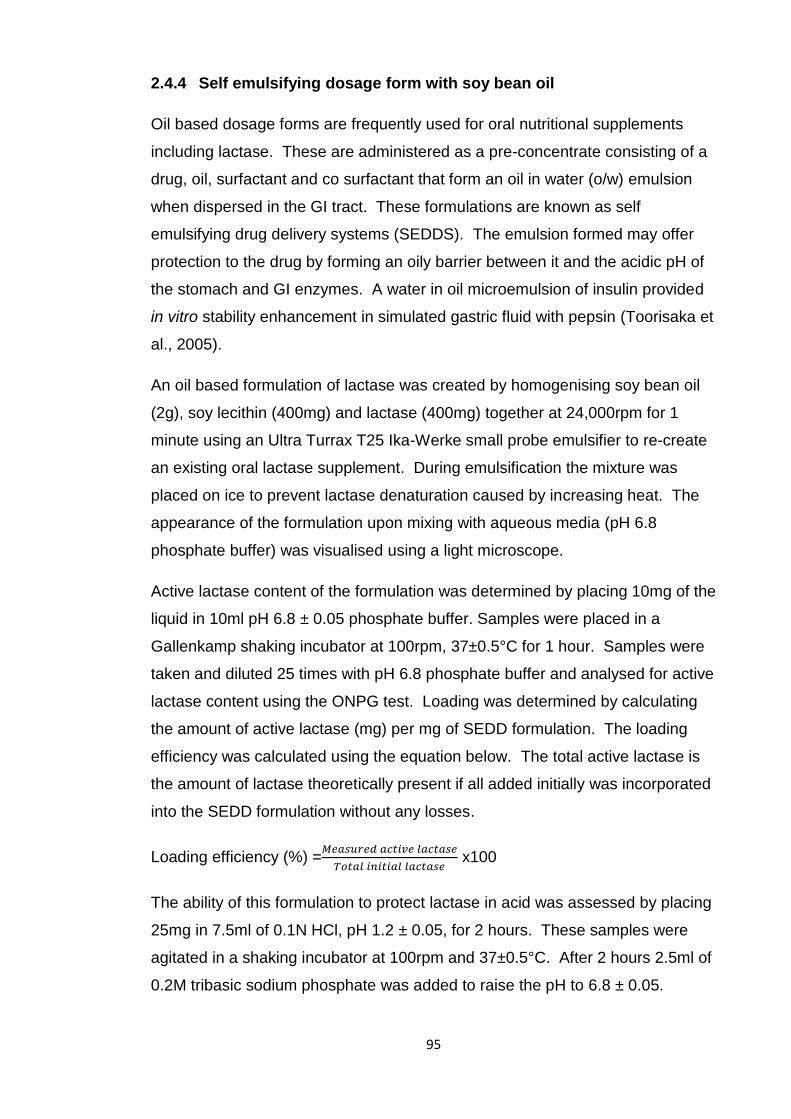
95
2.4.4 Self emulsifying dosage form with soy bean oil
Oil based dosage forms are frequently used for oral nutritional supplements
including lactase. These are administered as a pre-concentrate consisting of a
drug, oil, surfactant and co surfactant that form an oil in water (o/w) emulsion
when dispersed in the GI tract. These formulations are known as self
emulsifying drug delivery systems (SEDDS). The emulsion formed may offer
protection to the drug by forming an oily barrier between it and the acidic pH of
the stomach and GI enzymes. A water in oil microemulsion of insulin provided
in vitro stability enhancement in simulated gastric fluid with pepsin (Toorisaka et
al., 2005).
An oil based formulation of lactase was created by homogenising soy bean oil
(2g), soy lecithin (400mg) and lactase (400mg) together at 24,000rpm for 1
minute using an Ultra Turrax T25 Ika-Werke small probe emulsifier to re-create
an existing oral lactase supplement. During emulsification the mixture was
placed on ice to prevent lactase denaturation caused by increasing heat. The
appearance of the formulation upon mixing with aqueous media (pH 6.8
phosphate buffer) was visualised using a light microscope.
Active lactase content of the formulation was determined by placing 10mg of the
liquid in 10ml pH 6.8 ± 0.05 phosphate buffer. Samples were placed in a
Gallenkamp shaking incubator at 100rpm, 37±0.5°C for 1 hour. Samples were
taken and diluted 25 times with pH 6.8 phosphate buffer and analysed for active
lactase content using the ONPG test. Loading was determined by calculating
the amount of active lactase (mg) per mg of SEDD formulation. The loading
efficiency was calculated using the equation below. The total active lactase is
the amount of lactase theoretically present if all added initially was incorporated
into the SEDD formulation without any losses.
Loading efficiency (%) =
x100
The ability of this formulation to protect lactase in acid was assessed by placing
25mg in 7.5ml of 0.1N HCl, pH 1.2 ± 0.05, for 2 hours. These samples were
agitated in a shaking incubator at 100rpm and 37±0.5°C. After 2 hours 2.5ml of
0.2M tribasic sodium phosphate was added to raise the pH to 6.8 ± 0.05.
96
The samples were replaced in the Gallenkamp shaking incubator and agitated
using the same parameters for a further 45 minutes. Samples were withdrawn
and tested for active lactase release using the ONPG assay. Active lactase
release was calculated using the equation below. The theoretical active lactase
is all the lactase that could potentially be released from the formulation.
Active lactase release (%)=
x100
The percentage of active lactase released from this formulation was compared
to that from the Holland and Barrett lactase supplement using one way ANOVA
to assess if there was a significant difference (Minitab 15). Results were
considered significant if p≤0.05.
2.4.5 Enteric coated lactase tablets
Tablets were prepared by dry blending microcrystalline cellulose (Avicel), a
filler and compression aid, (77%, 30.8g), croscarmellose sodium (AcDiSol), a
disintegrant, (2%, 0.8g) and lactase (20%, 8g) for 10 minutes using a Pascall
Engineering roller mixer. Magnesium stearate, a lubricant, (1%, 0.4g) was then
added and blended for 1 minute. Placebo tablets were made by substituting
lactase for microcrystalline cellulose (97%, 38.8g). The powder mix was fed
into a single punch tabletting machine (Manesty, Speke, UK) fitted with a
biconvex 8mm punch and die set (Holland, Nottingham, UK). The force used to
make the tablets was 35kN for placebo tablets (without lactase) and 31.5kN for
lactase tablets. The crushing strength of the tablets was measured using a
Copley tablet hardness tester, acceptable limits were >80, <150N. Tablets
were weighed and the height of the punches adjusted to gain the desired tablet
weight of 200mg (40mg lactase).
Tablets (40g) were coated with the enteric polymer Eudragit L100 using a
Strea-1 bottom spray fluidised bed spray coater (Aeromatic AG, Bubendorf,
Switzerland). The coating solution, with a solids content of 10% w/w, consisted
of Eudragit L100 (7g) dissolved in ethanol (77g) with a plasticizer, triethyl citrate
(1.4g, 20% w/w of the dry polymer) and glidant, glyceryl monostearate (GMS)
(0.35g, 5% w/w of the dry polymer) with polysorbate 80 (0.14g, 2% w/w of the
dry polymer).
97
A 10% GMS dispersion was prepared by adding 7.5g GMS (10% w/w) and 3g
polysorbate 80 (40% w/w based on GMS) to 64.5g water (86% w/w). This was
stirred and heated to 70-80°C until the solution cleared. The dispersion was
cooled to room temperature and added to the Eudragit L100 solution.
The coating solution was sprayed at a rate of 0.25g/min using an atomising
pressure of 0.2 bar fed by a Minipuls 3 Gilson peristaltic pump. The fan
capacity of the coating machine was 16.5 (air flow 165m3/hour) and the drying
temperature was 30°C. Coating commenced and at regular intervals tablets
were removed and weighed to determine the coating extent. A weight gain of
8.89mg per tablet was required (5mg/cm2) for effective enteric coating. Once
this level of coating had been achieved coating was halted and the tablets
further fluidised for 15 minutes in the coater to dry. The tablets were cured in a
Gallenkamp incubator at 30°C overnight. The tablets were weighed again to
determine the final weight gain and amount of polymer applied per cm2.
2.4.5.1 Active lactase content of tablets
Lactase tablets (200mg), both coated and uncoated, were placed in 1 litre of pH
6.8 ±0.05 phosphate buffer in USP II paddle dissolution apparatus. Samples
were stirred at 50rpm at 37°C for 2 hours and 45 minutes, increased to 250rpm
for the final 30 seconds. Samples were taken at the end of this period and
active lactase content of the tablets was determined using the ONPG assay. All
tests were carried out in triplicate. The amount of active lactase (mg) per tablet
was calculated using a calibration curve of lactase in pH 6.8 phosphate buffer.
The loading efficiency was calculated using the equation below. The total
active lactase is the amount of lactase which would be present in the tablets if
all the lactase was successfully loaded into the tablets.
Loading efficiency (%)=
x100
2.4.5.2 In vitro release from enteric lactase tablets
The USP II paddle apparatus was employed to assess the enteric behaviour of
the coated and uncoated tablets using the USP (724) method for testing drug
release from enteric coated articles.
98
Coated and uncoated lactase tablets (200mg) were placed in vessels containing
750ml of 0.1N HCl, pH 1.2±0.05, for 2 hours, at 37±0.5°C, and stirred at 50rpm
to simulate gastric conditions. After 2 hours 250ml of 0.2M tribasic sodium
phosphate pre-equilibrated to 37±0.5°C was added to each vessel to raise the
pH to 6.8±0.05 to simulate small intestinal conditions. Dissolution proceeded
for a further 45 minutes and the paddle speed was increased to 250rpm for the
final 30 seconds. Samples were taken after 60 and 120 minutes acid incubation
and 0, 10, 20, 30 and 45 minutes pH 6.8 phosphate buffer incubation. Samples
were diluted with pH 6.8 phosphate buffer if necessary prior to testing. Samples
were tested for active lactase release using the ONPG assay. All tests were
carried out in triplicate. Active lactase release was calculated using the
equation below. The theoretical active lactase concentration is the
concentration of lactase in the sample if all the loaded lactase was released
from the tablets.
Active lactase released (%)=
x100
2.4.6 Preparation of enteric lactase microparticles
This method is based on that of Kendall et al. with the substitution of
prednisolone for lactase. Eudragit L100 (3g) was dissolved in ethanol (30ml).
Lactase (200mg) was suspended in the ethanol to prepare microparticles with a
drug to polymer weight ratio of 1:15. This suspension of lactase in Eudragit
L100 solution was emulsified into liquid paraffin (200ml) containing 1% (w/w) of
sorbitan sesquioleate (Arlacel 83) as an emulsifying agent, using a Heidolph
RZR1 stirrer (5cm diameter propeller) at 1000rpm. Stirring was carried out for
18 hours at room temperature to allow solvent evaporation and particle
solidification. The microparticles formed were recovered by vacuum filtration
through a Pyrex sintered glass filter (pore size 4; 5-15μm) and washed three
times with n-hexane (50ml). Blank microparticles containing no lactase were
also prepared using the same parameters. All microparticle formulations were
prepared in triplicate.
99
2.4.6.1 Particle size and yield
The volume median diameter of the microparticles was measured using laser
light scattering with a Malvern Mastersizer X with a 45mm lens (Malvern
Instruments Ltd., Malvern, UK). The microparticles were suspended in 0.1N
HCl and added dropwise into the magnetically stirred small volume diffraction
chamber, containing 0.1N HCl until obscuration of 15-20% was achieved.
Particle size analysis of each formulation was carried out in triplicate, and the
polydispersity (span) was calculated as [D(v, 0.9)-D(v, 0.1)]/D(v, 0.5) which are
the particle diameters at the 90th, 50th and 10th percentile respectively of the
particle size distribution curve.
The yield of particle production was calculated using the equation below. The
theoretical mass of microparticles expected is the total mass of polymer and, if
used, of lactase utilized to produce the microparticles.
Yield (%)=
x100
2.4.6.2 Particle morphology
The morphology and size of the microparticles were examined by scanning
electron microscopy (SEM) under a Philips Quanta 200F, Eindhoven, The
Netherlands. Microparticles were fastened on a SEM stub using carbon
adhesive pads and then coated with gold using an Emitech K550 sputter coater.
Routine, high vacuum imaging at 5kV was used to reveal surface morphology of
the microparticles.
The microparticles were visualized again using SEM at a lower voltage of 1kV
and under a reduced vacuum. The particles were not sputter coated. These
conditions were used to minimize the loss of any morphological details of the
microparticles caused by sputter coating and using a higher voltage beam.
The morphology of the blank microparticles was visualized to an even greater
degree of detail by employing an SEM with a new type of back scatter
secondary electron detector (directional backscatter detector) that enabled the
use of a low voltage beam, 500V and 300V, which revealed further surface
detail not visible when using a high voltage beam (FEI, Eindhoven).
100
This new detector has a better efficiency at low voltage and more surface detail
can be revealed than conventional low vacuum imaging using the large field
detector or gaseous detection. The microparticles were imaged before and
after being placed in 0.1N HCl.
2.4.6.3 Encapsulation efficiency and active lactase loading
300mg of lactase microparticles were filled into gelatin capsules and placed in
1 litre of pH 6.8±0.05 phosphate buffer for 45 minutes at 37±0.5°C using a USP
II paddle apparatus dissolution bath. Paddle speed was 50 rpm and increased
to 250rpm for the final 30 seconds. Samples were withdrawn and tested for
lactase activity using the ONPG assay. The amount of active lactase (units)
released was used to calculate the encapsulation efficiency of active lactase in
the microparticles using the equation below. The total units of lactase added
was the amount of lactase used to produce the microparticles. Drug loading
was determined by measuring the units or mgs of active lactase per mg of
microparticles.
Encapsulation efficiency (%) =
x100
2.4.6.4 Differential scanning calorimetry (DSC)
A DSC 7 differential scanning calorimeter (Perkin Elmer Instruments) calibrated
with indium was used to assess the thermal behaviour of lactase alone, blank
Eudragit L100 microparticles and lactase loaded Eudragit L100 microparticles.
Samples (2-4mg) were accurately weighed and placed in a non-hermetic
aluminium pan. Pyris Thermal Analysis Software was used to record and
analyse the data. Modulated DSC was conducted on the samples starting at -
20°C and ending at 300°C at a heating rate of 3°C/minute, period of 60 seconds
and an amplitude of ± 1°C.
2.4.6.5 Enteric protection- in vitro release of active lactase
USP II paddle apparatus was employed to determine if the microparticles could
prevent lactase release and protect its activity in simulated gastric conditions.
The microparticles were placed in 750ml 0.1N HCl, pH 1.2±0.05, for 2 hours at
37°C and 50rpm stirring speed to simulate gastric conditions.
101
The pH was raised to 6.8±0.05 to mimic the small intestine and dissolution
proceeded for a further 45 minutes. This was done by adding 250ml of 0.2M
tribasic sodium phosphate. The paddle speed was raised to 250rpm for the
final 30 seconds. Samples were withdrawn and the amount of active lactase
determined by the ONPG assay. All tests were carried out in triplicate. Active
lactase release was calculated using the equation below. The theoretical active
lactase is the amount of lactase expected if all the encapsulated lactase was
released and was active.
Active lactase release (%)=
x100
2.4.7 Spray drying lactase
To minimize uncontrolled release of lactase from Eudragit L100 microparticles
in acid its particle size was reduced by spray drying. Drugs previously exhibited
burst release, 30%+, from Eudragit L100 nanoparticles at pH 1.2 (Devarajan
and Sonavane, 2007, Eerikainen et al., 2004, Raffin, 2006). Reduction of drug
particle size increased encapsulation efficiency and reduced burst release
(Thote and Gupta, 2005). Spray drying can be used to produce protein
particles of a controlled size and shape. Despite the use of high temperatures
the cooling effect of solvent evaporation during spray drying protects the
protein. Spray drying the protein bovine serum albumin reduced its in vitro
burst release from PLGA microspheres by 60% (Costantino et al., 2000).
Lactase particle size has previously been successfully reduced to 2-4µm by
spray drying (Broadhead et al., 1994).
Lactase was dissolved in DI water and spray dried using a Buchi mini spray
dryer B-191 to reduce its particle size using these conditions:
Aspirator: 85%
Inlet Temperature: 190°C
Pump: 3ml/min (15%)
To determine the lactase activity of the spray dried samples they (10mg) were
dissolved in DI water (200ml). The ONPG assay was used to assess lactase
activity and this was compared to a calibration curve of lactase.
102
The following equation was used to determine the activity of spray dried lactase
(units/mg) relative to non-spray dried lactase (9.9 units/mg).
Units/mg spray dried lactase=
x 9.9 units/mg
The morphology and size of the spray dried and non-spray dried lactase was
visualized using SEM. Spray dried and non-spray dried lactase were dispersed
in ethanol and then filtered by vacuum filtration through a Pyrex sintered glass
filter (pore size 4; 5-15μm). Their morphology was then examined again. Spray
dried lactase was encapsulated within Eudragit L100 microparticles using the
method described above for non-spray dried lactase. Differences in
encapsulation efficiency compared to non spray dried lactase were assessed by
one-way ANOVA and deemed to be significant if p≤0.05, Minitab 15.
2.4.8 Fluorescent labeling and visualization of lactase
Lactase-FITC conjugation was carried out to visualise its location in the
microparticles. 1mg/ml FITC was prepared in anhydrous DSMO (1ml) and
800µl of this was added to 10ml of 1mg/ml Enzeco lactase solution prepared in
sodium bicarbonate buffer. Sodium bicarbonate buffer was prepared by
dissolving 17.3g NaHCO3 and 8.6g of Na2CO3 in 1 litre of DI water. The FITC
lactase mixture was magnetically stirred wrapped in foil and in the dark for two
hours. This was injected into a dialysis cassette which was placed in a large
beaker of DI water and magnetically stirred in the dark. The water was changed
regularly and dialysis proceeded overnight.
The dialysed FITC-lactase conjugation was freeze dried with a Virtis Advantage
freeze drier. Initially the sample was frozen at -38⁰C for 2 hours. It then was
subjected to two drying phases; primary drying (sublimation) and secondary
drying (desorption). Both drying phases were conducted under vacuum at a
pressure of 200 mTorr. The primary drying phase proceeded at -30⁰C for 2
hours and at -10⁰C for 2 hours. The shelf temperature of the freeze dryer was
at 0⁰C for 20 hours during the secondary drying phase.
The freeze dried FITC-lactase conjugation was added to 3g of Enzeco lactase
and dissolved in 200ml of DI water.
103
This was spray dried using an inlet temperature of 190°C, 85% Aspirator, 15%
pump setting (3ml/min) using a Buchi mini spray dryer B-191. Eudragit L100
microparticles were prepared as before but in darkness.
The microparticles were visualised using CFLM, using a Zeiss LSM 510
microscope, to visualise the fluorescent protein in and on the microparticles . A
Z-section was used to visualise FITC-lactase throughout the microparticles.
Eudragit L100 alone was also visualised to ensure it produced no fluorescence.
2.4.9 Active lactase burst released from microparticles below pH 6
To quantify differences in burst release of non-spray dried and spray dried
lactase from Eudragit L100 microparticles below the pH threshold of the
polymer the particles were dispersed in pH 4.5 buffer. At this pH any released
lactase will be active and therefore can be quantified using the ONPG method.
Gelatin capsules were filled with 30mg of microparticles encapsulating
unmodified lactase or spray dried lactase. These were placed in 75ml of
pH 4.5±0.05 buffer and stirred on a magnetic stirrer for 2 hours, 2 ml was
withdrawn to detect active lactase release using the ONPG assay. 2ml of
pH 4.5 buffer was added to the reaction mixture to replace the withdrawn
sample and then 25ml of 0.2M tribasic sodium phosphate was added to raise
the pH to 6.8±0.05. Stirring continued for 45 minutes then samples were
withdrawn and analysed for active lactase release. Differences in lactase
release from the two sets of microparticles were assessed for significance using
one-way ANOVA and judged to be significant if p≤0.05, Minitab 15.
pH 4.5 buffer was prepared by mixing 470ml of 0.1M citric acid with 530ml of
0.1M trisodium citrate and adjusting the pH to pH 4.5±0.05 using concentrated
HCl and 5N NaOH. 0.1M citric acid was prepared by dissolving 21.01g of citric
acid in 1 litre of DI water. 0.1M trisodium citrate was prepared by dissolving
29.41g of trisodium citrate dihydrate in 1 litre of DI water.
2.4.10 Encapsulation of pH sensitive marker
The interior pH of microparticles has been monitored previously using pH
sensitive markers.
104
Lysosensor yellow/blue® dextran (Ding and Schwendeman, 2008) was
encapsulated in PLGA microspheres to detect increasing interior acidity from
degrading PLGA. Confocal laser scanning microscopy was used to detect
shifts in the marker’s emission spectrum to different wavelengths depending on
the pH.
Lysosensor yellow/blue dextran 10kDa was encapsulated within Eudragit L100
microparticles to monitor the interior pH. 5mg of lysosensor was suspended in
the Eudragit L100 solution in ethanol (300mg in 3ml) prior to adding to 20ml
liquid paraffin with 1% sorbitan sesquioleate. This oil in oil emulsion was stirred
at 1500rpm for approximately 18 hours at room temperature to allow solvent
evaporation and particle solidification. The microparticles formed were
recovered by vacuum filtration as before and washed three times with n-hexane
(50ml). The reaction mixtures were covered and kept in the dark throughout.
The microparticles were visualised with CFLM, using a Zeiss LSM 710
microscope, using a 10x lambda scan to detect the effect of surrounding pH on
the encapsulated contents. The excitation wavelength used was 405nm.
Microparticles were visualised dry, with 0.1N HCl and pH 6.8 phosphate buffer
and their emission over wavelengths 430-720nm monitored.
2.4.11 Cryosectioning microparticles
Blank microparticles were glued to an AFM sample holder with cyanacrylate
glue. These were trimmed with a cryotrim 45 diamond blade and then
sectioned with an ultrasonic knife, feed 30nm, at a sectioning speed of
0.6mm/sec on water. The sections were picked up with a Perfect Loop and
mounted on C-flat TEM grids. The carbon film of the grid contained 2μm holes.
This was performed by Diatome Ltd, Switzerland. The sections were then
examined by transmission electron microscopy. The sectioned microparticles
were also examined by SEM.
2.4.12 Surface area analysis
The surface area of the Eudragit L100 microparticles without lactase (blank),
with spray dried lactase and non-spray dried lactase was calculated using the
mean dv0.5 size as the diameter of the microparticles.
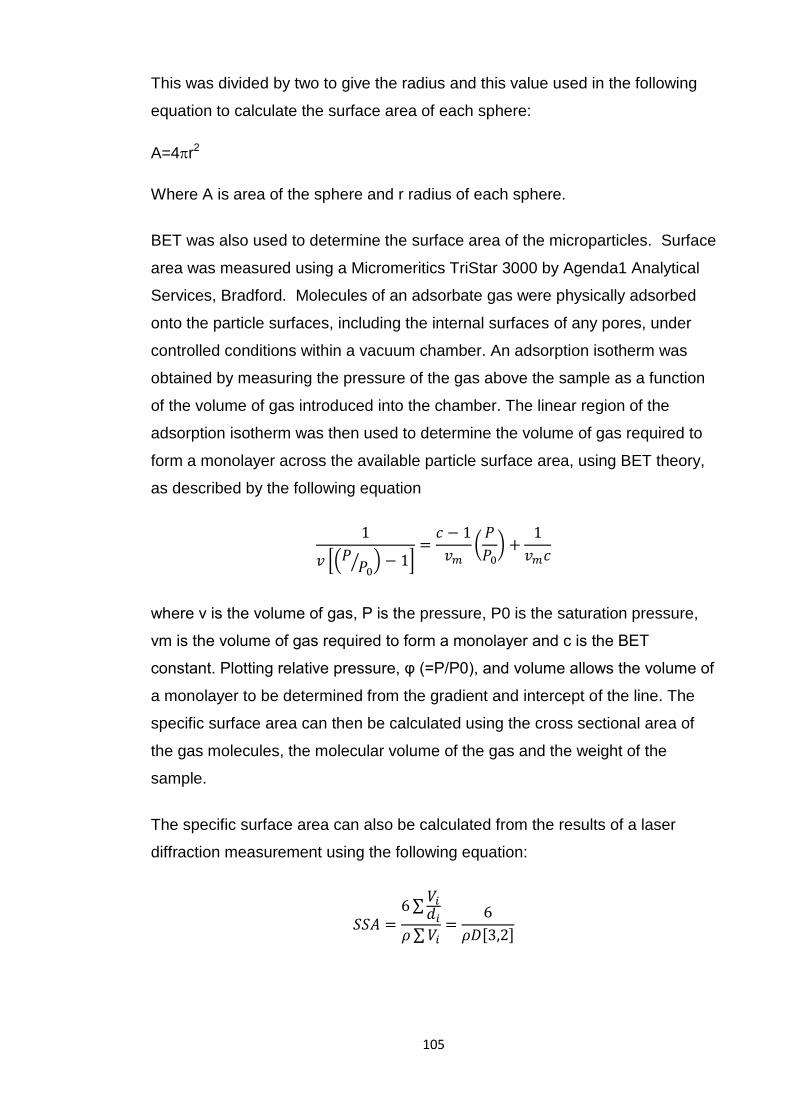
105
This was divided by two to give the radius and this value used in the following
equation to calculate the surface area of each sphere:
A=4r2
Where A is area of the sphere and r radius of each sphere.
BET was also used to determine the surface area of the microparticles. Surface
area was measured using a Micromeritics TriStar 3000 by Agenda1 Analytical
Services, Bradford. Molecules of an adsorbate gas were physically adsorbed
onto the particle surfaces, including the internal surfaces of any pores, under
controlled conditions within a vacuum chamber. An adsorption isotherm was
obtained by measuring the pressure of the gas above the sample as a function
of the volume of gas introduced into the chamber. The linear region of the
adsorption isotherm was then used to determine the volume of gas required to
form a monolayer across the available particle surface area, using BET theory,
as described by the following equation
where ν is the volume of gas, P is the pressure, P0 is the saturation pressure,
νm is the volume of gas required to form a monolayer and c is the BET
constant. Plotting relative pressure, φ (=P/P0), and volume allows the volume of
a monolayer to be determined from the gradient and intercept of the line. The
specific surface area can then be calculated using the cross sectional area of
the gas molecules, the molecular volume of the gas and the weight of the
sample.
The specific surface area can also be calculated from the results of a laser
diffraction measurement using the following equation:
106
Vi is the relative volume in class i with a mean class diameter of di, ρ is the
density of the material, and D[3,2] is the surface area weighted mean diameter.
This was carried out automatically using the laser diffraction system software
during microparticle size analysis using the Malvern Mastersizer. In carrying out
this calculation, it is assumed that the particles are perfectly smooth, solid
spheres.
2.4.13 Enteric microparticles with antacids
Antacids have previously been administered with acid labile drugs to raise
gastric pH and maintain drug activity. Antacids co-administered with pancreatic
enzyme supplements increased pH and enzyme activities in vivo (Graham,
1982). The acidic degradation products of PLGA nanoparticles can decrease
the pH of the interior of the particles and destabilize acid labile peptides and
proteins. To overcome this antacids were encapsulated in PLGA nanoparticles
with insulin and this reduced its degradation in SGF and increased its oral
bioavailability in rats (Sharma et al., 2012). The ability of co-encapsulated
antacids to raise the interior pH of PLGA microspheres was detected by shifts in
the emission spectrum of an encapsulated marker (Li and Schwendeman,
2005).
Co-encapsulation of antacids in enteric microparticles may provide additional
protection to encapsulated lactase. Acid may encounter lactase near the
surface of microparticles, antacids can provide local neutralization and increase
lactase preservation during gastric transit.
Enteric microparticles with Eudragit L100 were prepared as described above
with the addition of an antacid (1g) to the Eudragit L100 solution. The antacids
used were magnesium hydroxide and sodium bicarbonate. They were
suspended in the solution of the polymer prior to addition of lactase. The yield,
size and morphology of the microparticles were evaluated as described before.
To determine the active lactase content of the microparticles, 10mg of lactase
microparticles with co-encapsulated antacid were placed in 10ml of phosphate
buffer, pH 6.8±0.05. Samples were placed in a Gallenkamp shaking incubator
at 37±0.5°C and agitated at 100rpm for one hour.
107
At the end of this period samples were diluted 20 times with pH 6.8 phosphate
buffer and the active lactase content determined by the ONPG assay. Loading
and encapsulation efficiency were determined as in section 2.4.6.3.
The ability of these microparticles to protect encapsulated lactase in gastric
conditions was assessed by placing 100mg of microparticles in 7.5ml of 0.1N
HCl, pH 1.2±0.05, for 2 hours. These samples were agitated in a Gallenkamp
shaking incubator at 100rpm and 37±0.5°C. After 2 hours 2.5ml of 0.2M tribasic
sodium phosphate was added to raise the pH to 6.8 ± 0.05. The samples were
replaced in the incubator and agitated for a further 45 minutes. Samples were
withdrawn and tested for active lactase content using the ONPG assay. The
samples from the microparticles containing magnesium hydroxide were diluted
10 times prior to testing. Active lactase release was calculated as in section
2.4.6.5.
Differences in particle size, span, encapsulation efficiency and active lactase
release following dissolution of the lactase microparticles with antacids
compared to those without were assessed by one-way ANOVA, Minitab 15.
Results were considered to be significant if p≤0.05. Differences in active
lactase release from the microparticles with antacids were also compared to the
Holland and Barrett lactase supplement.
2.4.14 Self emulsifying dosage forms with soy bean oil and lactase
microparticles
An oil based formulation of lactase Eudragit L100 microparticles was created by
homogenising soy bean oil (2g), soy lecithin (400mg) and lactase microparticles
(500mg) together at 24,000rpm for 1 minute using an Ultra Turrax T25 Ika-
Werke small probe emulsifier. During emulsification the mixture was placed on
ice.
Active lactase content was determined by placing 10mg of the liquid in 10ml pH
6.8±0.05 phosphate buffer. Samples were placed in a Gallenkamp shaking
incubator at 100rpm and 37±0.5°C for 1 hour. Samples were taken, diluted 25
times with pH 6.8 phosphate buffer and analysed for active lactase content
using the ONPG test. Loading and encapsulation efficiency were determined
as in section 2.4.6.3.
108
The ability of this formulation to protect lactase in acid was assessed by
placing150mg in 7.5ml of 0.1N HCl, pH 1.2±0.05, for 2 hours. These samples
were agitated in a shaking incubator at 100rpm and 37±0.5°C. After 2 hours
2.5ml of 0.2M tribasic sodium phosphate was added to raise the pH to 6.8±0.05.
The samples were replaced in the incubator and agitated for a further 45
minutes. Samples were withdrawn and tested for active lactase release using
the ONPG assay. Active lactase release was calculated as in section 2.4.6.5.
Active lactase release was compared to release from lactase in soy bean oil,
lactase microparticles and lactase microparticles with co-encapsulated
magnesium hydroxide after dissolution using one-way ANOVA, Minitab 15.
Differences were judged to be significant if p≤0.05.
2.5 Results and Discussion
2.5.1 Intestinal stability
Lactase stability was assessed in simulated and pig gastrointestinal fluids and
human faecal fluids. The results were used to design oral formulations of
lactase.
2.5.1.1 Gastric fluids
Lactase was rapidly denatured in SGF, pH 1.2, without pepsin, table 2.5. After
5 minutes less than 1% of the initial lactase was active. Similarly lactase
activity was quickly reduced in porcine gastric fluid, only 6% remaining after 5
minutes. Lactase was not tested in SGF with pepsin as it was completely
denatured in SGF alone.
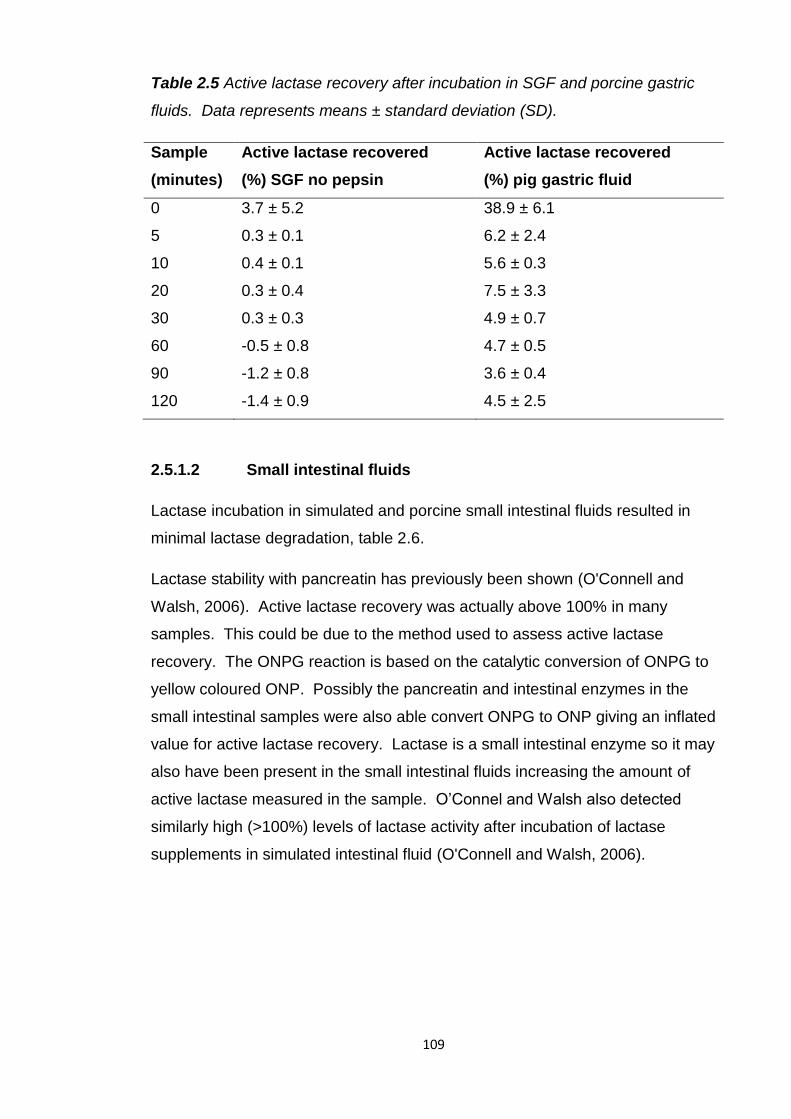
109
Table 2.5 Active lactase recovery after incubation in SGF and porcine gastric
fluids. Data represents means ± standard deviation (SD).
Sample
(minutes)
Active lactase recovered
(%) SGF no pepsin
Active lactase recovered
(%) pig gastric fluid
0 3.7 ± 5.2 38.9 ± 6.1
5 0.3 ± 0.1 6.2 ± 2.4
10 0.4 ± 0.1 5.6 ± 0.3
20 0.3 ± 0.4 7.5 ± 3.3
30 0.3 ± 0.3 4.9 ± 0.7
60 -0.5 ± 0.8 4.7 ± 0.5
90 -1.2 ± 0.8 3.6 ± 0.4
120 -1.4 ± 0.9 4.5 ± 2.5
2.5.1.2 Small intestinal fluids
Lactase incubation in simulated and porcine small intestinal fluids resulted in
minimal lactase degradation, table 2.6.
Lactase stability with pancreatin has previously been shown (O'Connell and
Walsh, 2006). Active lactase recovery was actually above 100% in many
samples. This could be due to the method used to assess active lactase
recovery. The ONPG reaction is based on the catalytic conversion of ONPG to
yellow coloured ONP. Possibly the pancreatin and intestinal enzymes in the
small intestinal samples were also able convert ONPG to ONP giving an inflated
value for active lactase recovery. Lactase is a small intestinal enzyme so it may
also have been present in the small intestinal fluids increasing the amount of
active lactase measured in the sample. O’Connel and Walsh also detected
similarly high (>100%) levels of lactase activity after incubation of lactase
supplements in simulated intestinal fluid (O'Connell and Walsh, 2006).
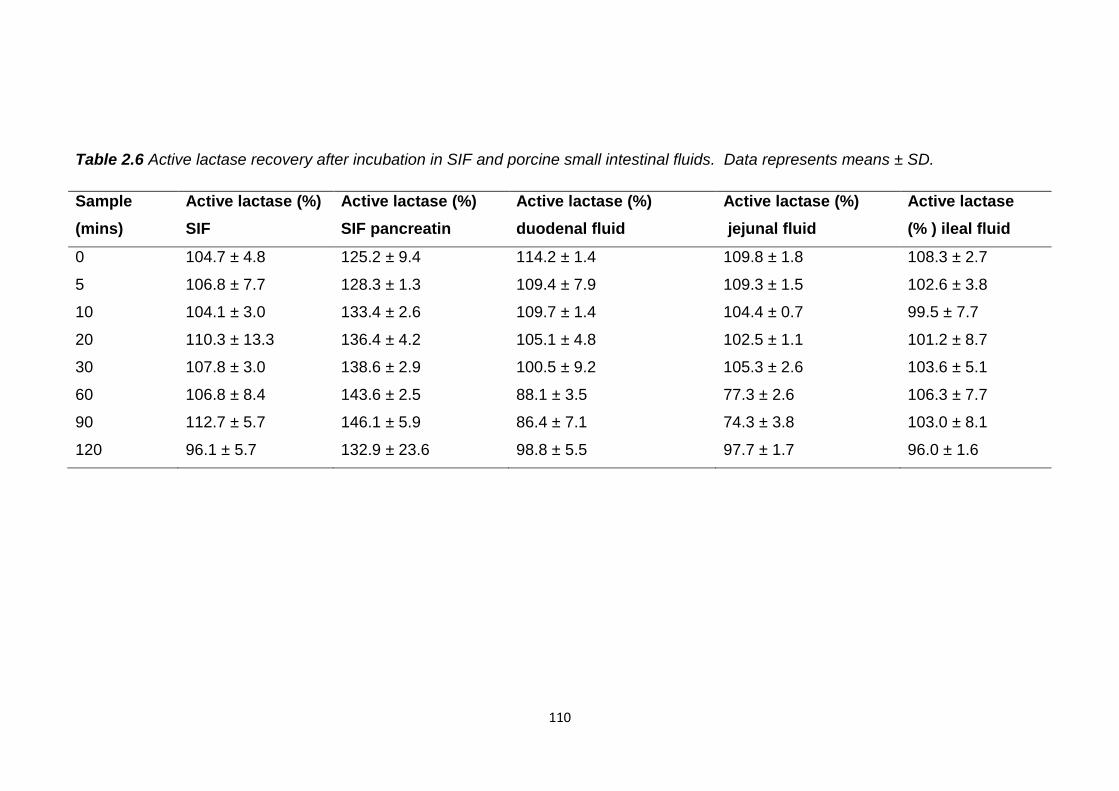
110
Table 2.6 Active lactase recovery after incubation in SIF and porcine small intestinal fluids. Data represents means ± SD.
Sample
(mins)
Active lactase (%)
SIF
Active lactase (%)
SIF pancreatin
Active lactase (%)
duodenal fluid
Active lactase (%)
jejunal fluid
Active lactase
(% ) ileal fluid
0 104.7 ± 4.8 125.2 ± 9.4 114.2 ± 1.4 109.8 ± 1.8 108.3 ± 2.7
5 106.8 ± 7.7 128.3 ± 1.3 109.4 ± 7.9 109.3 ± 1.5 102.6 ± 3.8
10 104.1 ± 3.0 133.4 ± 2.6 109.7 ± 1.4 104.4 ± 0.7 99.5 ± 7.7
20 110.3 ± 13.3 136.4 ± 4.2 105.1 ± 4.8 102.5 ± 1.1 101.2 ± 8.7
30 107.8 ± 3.0 138.6 ± 2.9 100.5 ± 9.2 105.3 ± 2.6 103.6 ± 5.1
60 106.8 ± 8.4 143.6 ± 2.5 88.1 ± 3.5 77.3 ± 2.6 106.3 ± 7.7
90 112.7 ± 5.7 146.1 ± 5.9 86.4 ± 7.1 74.3 ± 3.8 103.0 ± 8.1
120 96.1 ± 5.7 132.9 ± 23.6 98.8 ± 5.5 97.7 ± 1.7 96.0 ± 1.6
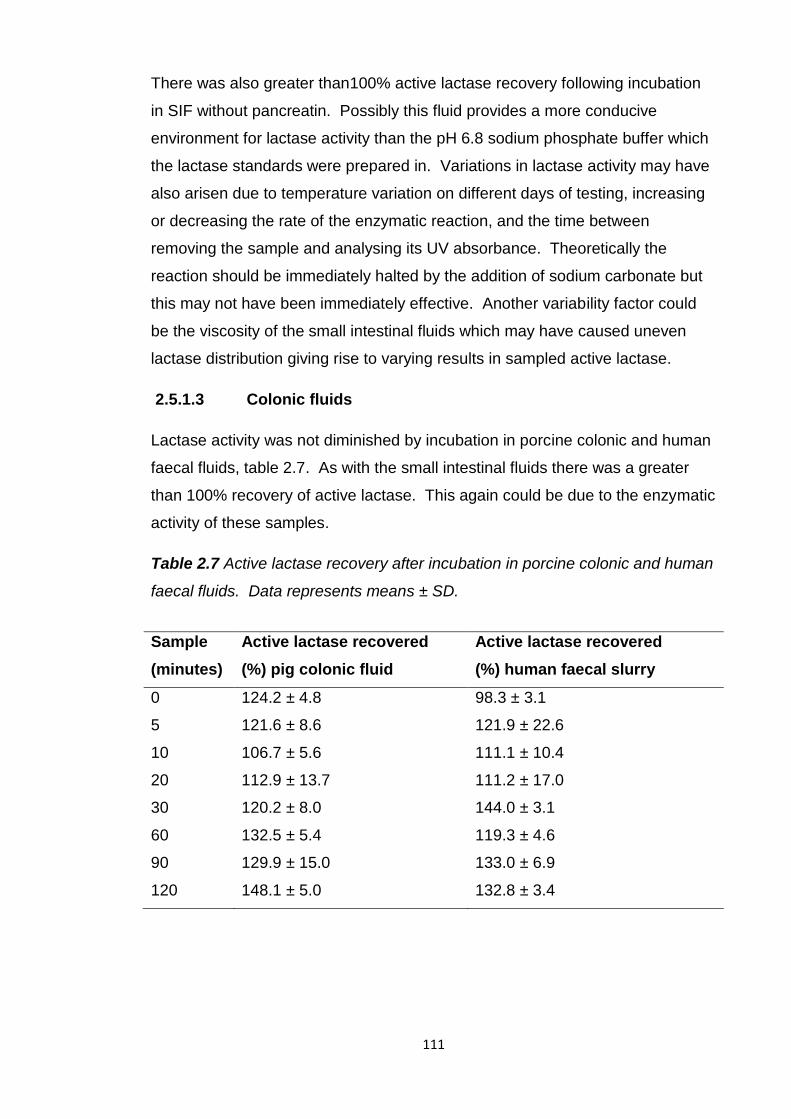
111
There was also greater than100% active lactase recovery following incubation
in SIF without pancreatin. Possibly this fluid provides a more conducive
environment for lactase activity than the pH 6.8 sodium phosphate buffer which
the lactase standards were prepared in. Variations in lactase activity may have
also arisen due to temperature variation on different days of testing, increasing
or decreasing the rate of the enzymatic reaction, and the time between
removing the sample and analysing its UV absorbance. Theoretically the
reaction should be immediately halted by the addition of sodium carbonate but
this may not have been immediately effective. Another variability factor could
be the viscosity of the small intestinal fluids which may have caused uneven
lactase distribution giving rise to varying results in sampled active lactase.
2.5.1.3 Colonic fluids
Lactase activity was not diminished by incubation in porcine colonic and human
faecal fluids, table 2.7. As with the small intestinal fluids there was a greater
than 100% recovery of active lactase. This again could be due to the enzymatic
activity of these samples.
Table 2.7 Active lactase recovery after incubation in porcine colonic and human
faecal fluids. Data represents means ± SD.
Sample
(minutes)
Active lactase recovered
(%) pig colonic fluid
Active lactase recovered
(%) human faecal slurry
0 124.2 ± 4.8 98.3 ± 3.1
5 121.6 ± 8.6 121.9 ± 22.6
10 106.7 ± 5.6 111.1 ± 10.4
20 112.9 ± 13.7 111.2 ± 17.0
30 120.2 ± 8.0 144.0 ± 3.1
60 132.5 ± 5.4 119.3 ± 4.6
90 129.9 ± 15.0 133.0 ± 6.9
120 148.1 ± 5.0 132.8 ± 3.4
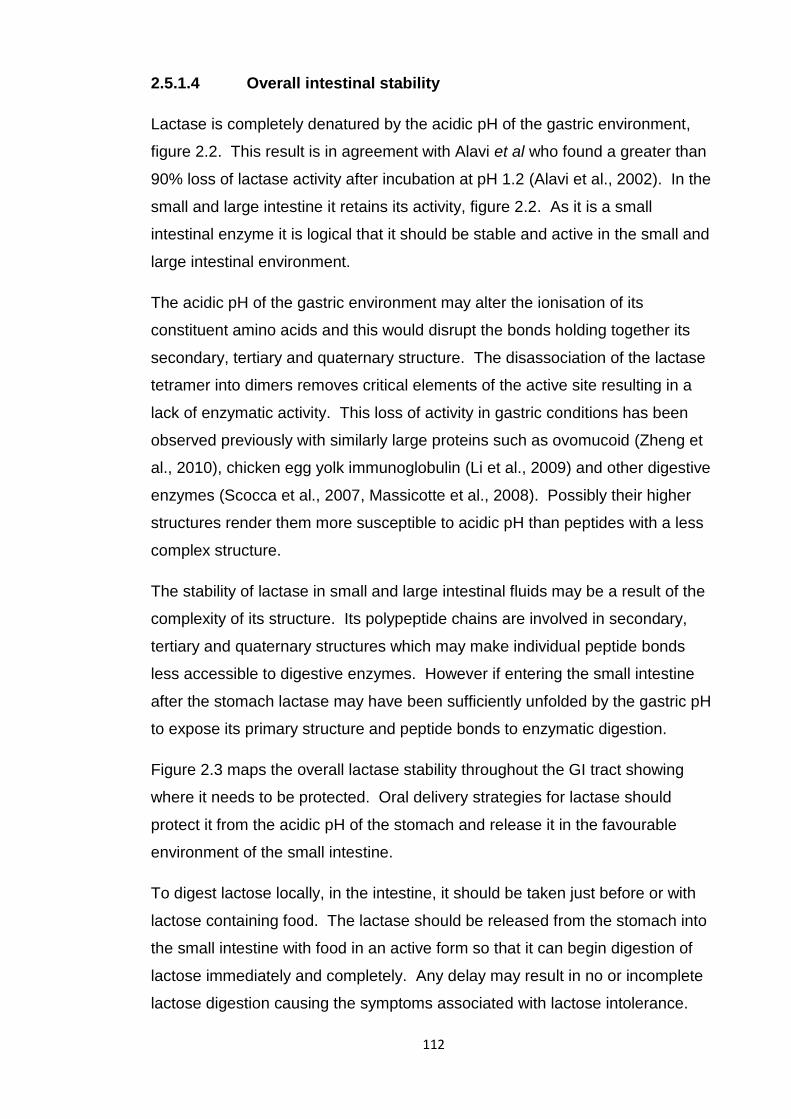
112
2.5.1.4 Overall intestinal stability
Lactase is completely denatured by the acidic pH of the gastric environment,
figure 2.2. This result is in agreement with Alavi et al who found a greater than
90% loss of lactase activity after incubation at pH 1.2 (Alavi et al., 2002). In the
small and large intestine it retains its activity, figure 2.2. As it is a small
intestinal enzyme it is logical that it should be stable and active in the small and
large intestinal environment.
The acidic pH of the gastric environment may alter the ionisation of its
constituent amino acids and this would disrupt the bonds holding together its
secondary, tertiary and quaternary structure. The disassociation of the lactase
tetramer into dimers removes critical elements of the active site resulting in a
lack of enzymatic activity. This loss of activity in gastric conditions has been
observed previously with similarly large proteins such as ovomucoid (Zheng et
al., 2010), chicken egg yolk immunoglobulin (Li et al., 2009) and other digestive
enzymes (Scocca et al., 2007, Massicotte et al., 2008). Possibly their higher
structures render them more susceptible to acidic pH than peptides with a less
complex structure.
The stability of lactase in small and large intestinal fluids may be a result of the
complexity of its structure. Its polypeptide chains are involved in secondary,
tertiary and quaternary structures which may make individual peptide bonds
less accessible to digestive enzymes. However if entering the small intestine
after the stomach lactase may have been sufficiently unfolded by the gastric pH
to expose its primary structure and peptide bonds to enzymatic digestion.
Figure 2.3 maps the overall lactase stability throughout the GI tract showing
where it needs to be protected. Oral delivery strategies for lactase should
protect it from the acidic pH of the stomach and release it in the favourable
environment of the small intestine.
To digest lactose locally, in the intestine, it should be taken just before or with
lactose containing food. The lactase should be released from the stomach into
the small intestine with food in an active form so that it can begin digestion of
lactose immediately and completely. Any delay may result in no or incomplete
lactose digestion causing the symptoms associated with lactose intolerance.
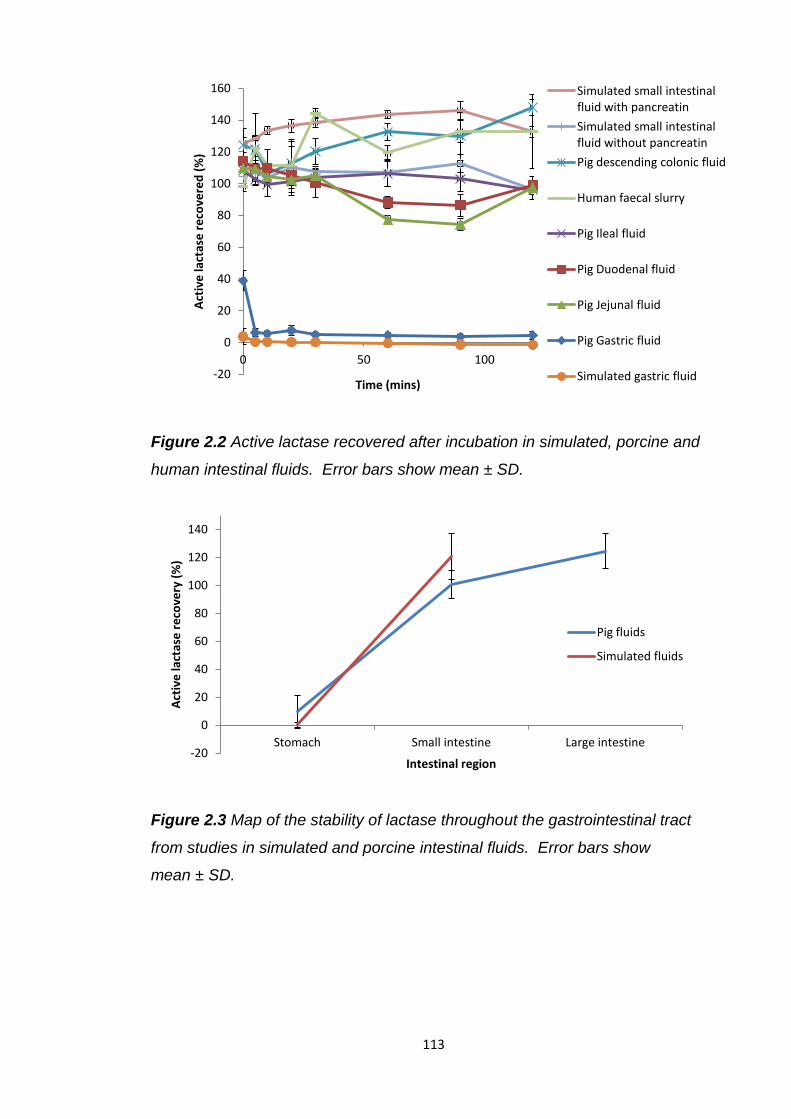
113
Figure 2.2 Active lactase recovered after incubation in simulated, porcine and
human intestinal fluids. Error bars show mean ± SD.
Figure 2.3 Map of the stability of lactase throughout the gastrointestinal tract
from studies in simulated and porcine intestinal fluids. Error bars show
mean ± SD.
-20
0
20
40
60
80
100
120
140
160
0 50 100
Act
ive
lact
ase
re
cove
red
(%
)
Time (mins)
Simulated small intestinal fluid with pancreatin
Simulated small intestinal fluid without pancreatin
Pig descending colonic fluid
Human faecal slurry
Pig Ileal fluid
Pig Duodenal fluid
Pig Jejunal fluid
Pig Gastric fluid
Simulated gastric fluid
-20
0
20
40
60
80
100
120
140
Stomach Small intestine Large intestine
Act
ive
lact
ase
re
cove
ry (
%)
Intestinal region
Pig fluids
Simulated fluids
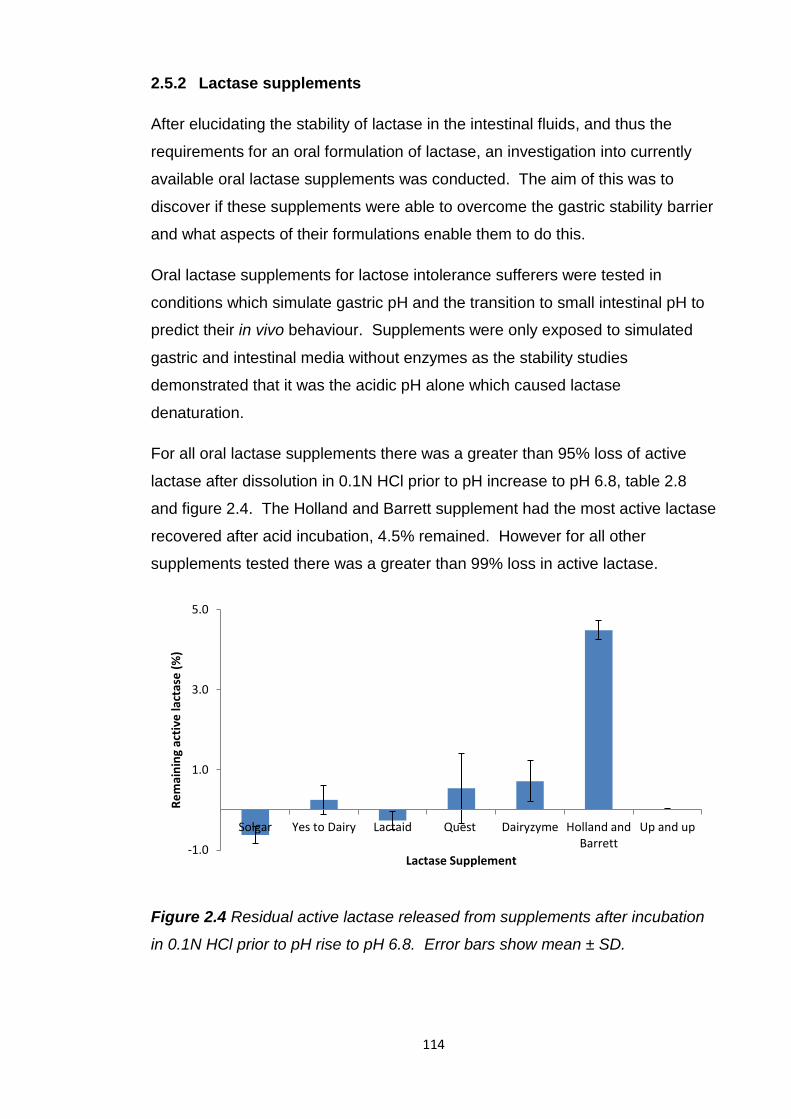
114
2.5.2 Lactase supplements
After elucidating the stability of lactase in the intestinal fluids, and thus the
requirements for an oral formulation of lactase, an investigation into currently
available oral lactase supplements was conducted. The aim of this was to
discover if these supplements were able to overcome the gastric stability barrier
and what aspects of their formulations enable them to do this.
Oral lactase supplements for lactose intolerance sufferers were tested in
conditions which simulate gastric pH and the transition to small intestinal pH to
predict their in vivo behaviour. Supplements were only exposed to simulated
gastric and intestinal media without enzymes as the stability studies
demonstrated that it was the acidic pH alone which caused lactase
denaturation.
For all oral lactase supplements there was a greater than 95% loss of active
lactase after dissolution in 0.1N HCl prior to pH increase to pH 6.8, table 2.8
and figure 2.4. The Holland and Barrett supplement had the most active lactase
recovered after acid incubation, 4.5% remained. However for all other
supplements tested there was a greater than 99% loss in active lactase.
Figure 2.4 Residual active lactase released from supplements after incubation
in 0.1N HCl prior to pH rise to pH 6.8. Error bars show mean ± SD.
-1.0
1.0
3.0
5.0
Solgar Yes to Dairy Lactaid Quest Dairyzyme Holland and Barrett
Up and up
Re
mai
nin
g ac
tive
lact
ase
(%
)
Lactase Supplement
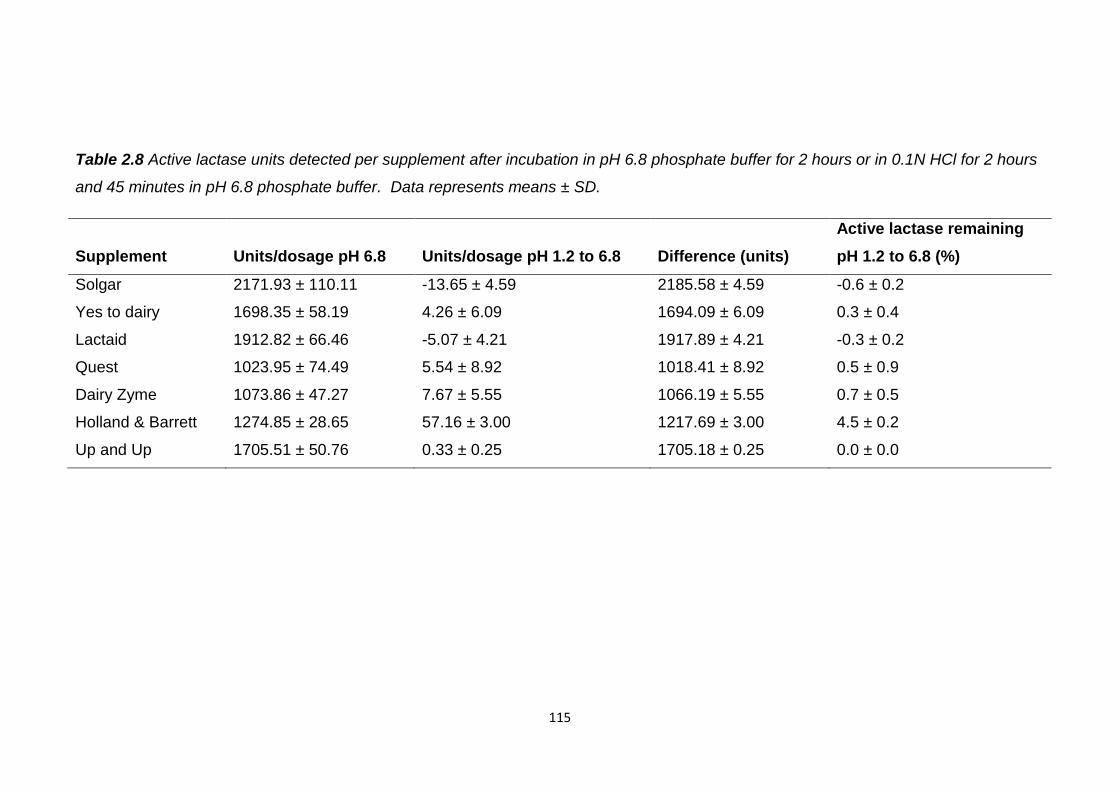
115
Table 2.8 Active lactase units detected per supplement after incubation in pH 6.8 phosphate buffer for 2 hours or in 0.1N HCl for 2 hours
and 45 minutes in pH 6.8 phosphate buffer. Data represents means ± SD.
Supplement Units/dosage pH 6.8 Units/dosage pH 1.2 to 6.8 Difference (units)
Active lactase remaining
pH 1.2 to 6.8 (%)
Solgar 2171.93 ± 110.11 -13.65 ± 4.59 2185.58 ± 4.59 -0.6 ± 0.2
Yes to dairy 1698.35 ± 58.19 4.26 ± 6.09 1694.09 ± 6.09 0.3 ± 0.4
Lactaid 1912.82 ± 66.46 -5.07 ± 4.21 1917.89 ± 4.21 -0.3 ± 0.2
Quest 1023.95 ± 74.49 5.54 ± 8.92 1018.41 ± 8.92 0.5 ± 0.9
Dairy Zyme 1073.86 ± 47.27 7.67 ± 5.55 1066.19 ± 5.55 0.7 ± 0.5
Holland & Barrett 1274.85 ± 28.65 57.16 ± 3.00 1217.69 ± 3.00 4.5 ± 0.2
Up and Up 1705.51 ± 50.76 0.33 ± 0.25 1705.18 ± 0.25 0.0 ± 0.0
116
All the supplements, except the Holland and Barrett supplement, were tablet or
capsule powder based formulations without enteric protection. Therefore it is
unsurprising they were unable to protect lactase in acid. Similar testing of
lactase supplements in SGF also concluded enteric protection was vital for
lactase activity survival (Alavi et al., 2002, O'Connell and Walsh, 2006). Only
enteric supplements preserved lactase activity, >90%, after SGF incubation.
All of the supplements tested have dosage instructions advising them to be
taken with or before eating lactose containing foods. The arrival of food may
neutralise stomach acid and stop lactase inactivation. However, should the
lactase supplement arrive in the stomach before food it is likely to be
immediately denatured. Additionally the pH of the stomach will drop post food
ingestion and return to values which would denature any non-enteric lactase.
The Holland and Barrett lactase supplement is a liquid formulation based on soy
bean oil. Soy bean oil has been used as the oil phase of microemulsions and
demonstrated its ability to enhance drug stability and absorption in vivo (Piao et
al., 2006, Wu, 2009, Hauss, 1997, Yi, 2000). The higher active lactase
recovery found with this supplement may be due to the formation of an oil in
water emulsion when dispersed in SGF. This type of formulation tends to be
used to increase the bioavailability of hydrophobic drugs which can dissolve in
the oil phase such as cyclosporine A. However lactase is a hydrophilic protein
and upon dispersion in gastric fluids it is more likely to partition into the acidic
aqueous phase than remain in the protective oil phase. Therefore only 4.5% of
the lactase in the supplement remained active after incubation in 0.1N HCl.
This small proportion of lactase may have been protected from the acidic pH by
the oily barrier. Water in oil microemulsions have previously enhanced the
stability of peptide/protein drugs in vitro and in vivo; calcitonin (Fan et al., 2011)
and insulin (Sharma et al., 2010, Toorisaka et al., 2003, Elsayed et al., 2009,
Toorisaka et al., 2005).
2.5.3 Self emulsifying dosage forms with soy bean oil
The assessment of lactase supplements revealed only the Holland and Barrett
supplement produced any measurable active lactase recovery after dissolution
in 0.1N HCl and pH 6.8 phosphate buffer. It is thought that the oil phase of this
formulation is able to provide a protective barrier against acid.
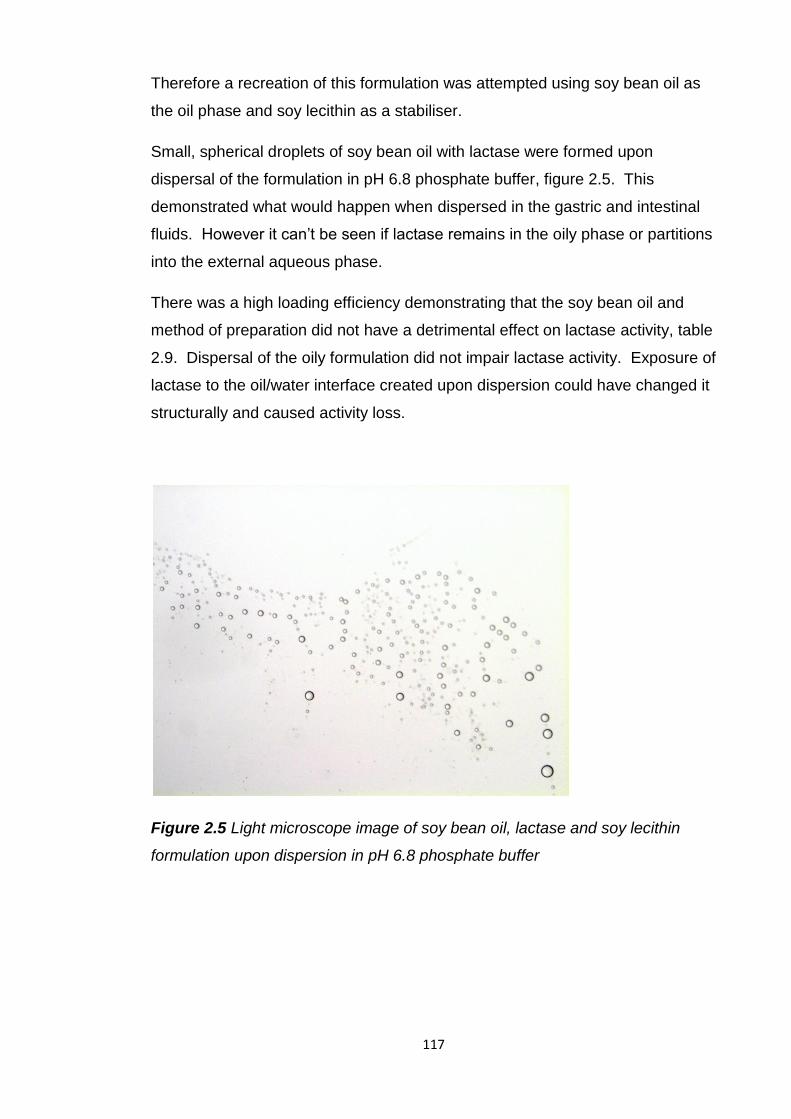
117
Therefore a recreation of this formulation was attempted using soy bean oil as
the oil phase and soy lecithin as a stabiliser.
Small, spherical droplets of soy bean oil with lactase were formed upon
dispersal of the formulation in pH 6.8 phosphate buffer, figure 2.5. This
demonstrated what would happen when dispersed in the gastric and intestinal
fluids. However it can’t be seen if lactase remains in the oily phase or partitions
into the external aqueous phase.
There was a high loading efficiency demonstrating that the soy bean oil and
method of preparation did not have a detrimental effect on lactase activity, table
2.9. Dispersal of the oily formulation did not impair lactase activity. Exposure of
lactase to the oil/water interface created upon dispersion could have changed it
structurally and caused activity loss.
Figure 2.5 Light microscope image of soy bean oil, lactase and soy lecithin
formulation upon dispersion in pH 6.8 phosphate buffer
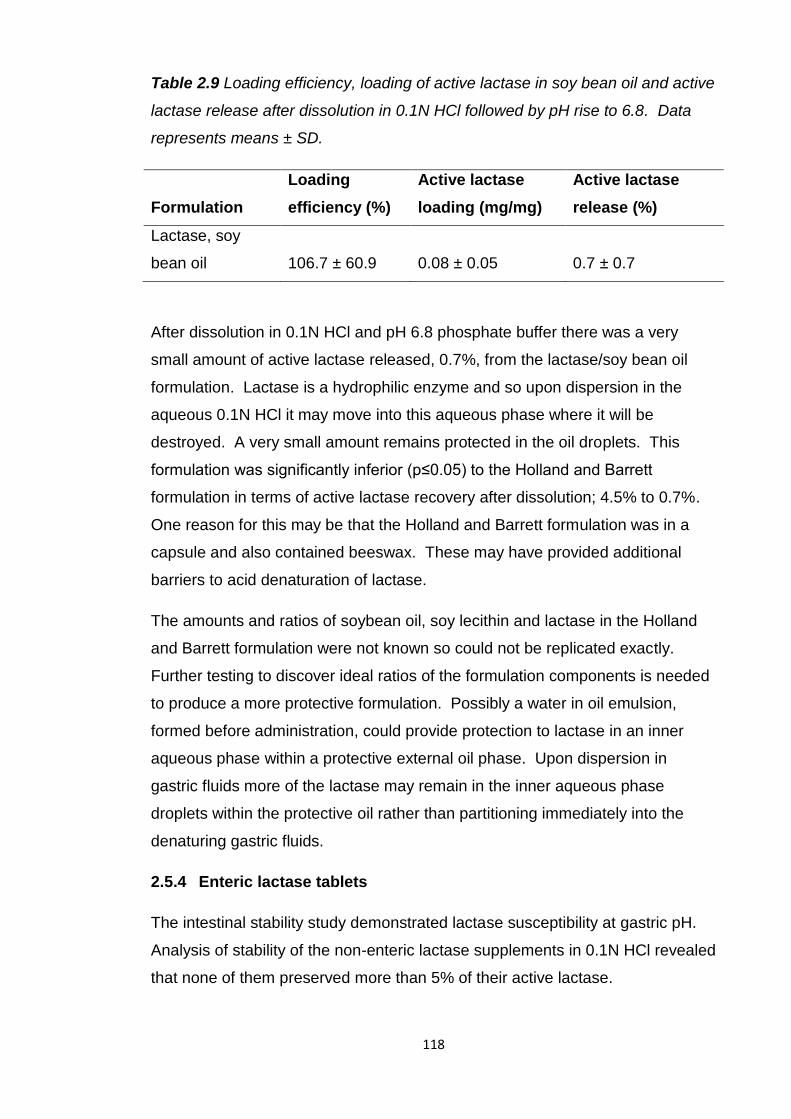
118
Table 2.9 Loading efficiency, loading of active lactase in soy bean oil and active
lactase release after dissolution in 0.1N HCl followed by pH rise to 6.8. Data
represents means ± SD.
Formulation
Loading
efficiency (%)
Active lactase
loading (mg/mg)
Active lactase
release (%)
Lactase, soy
bean oil 106.7 ± 60.9 0.08 ± 0.05 0.7 ± 0.7
After dissolution in 0.1N HCl and pH 6.8 phosphate buffer there was a very
small amount of active lactase released, 0.7%, from the lactase/soy bean oil
formulation. Lactase is a hydrophilic enzyme and so upon dispersion in the
aqueous 0.1N HCl it may move into this aqueous phase where it will be
destroyed. A very small amount remains protected in the oil droplets. This
formulation was significantly inferior (p≤0.05) to the Holland and Barrett
formulation in terms of active lactase recovery after dissolution; 4.5% to 0.7%.
One reason for this may be that the Holland and Barrett formulation was in a
capsule and also contained beeswax. These may have provided additional
barriers to acid denaturation of lactase.
The amounts and ratios of soybean oil, soy lecithin and lactase in the Holland
and Barrett formulation were not known so could not be replicated exactly.
Further testing to discover ideal ratios of the formulation components is needed
to produce a more protective formulation. Possibly a water in oil emulsion,
formed before administration, could provide protection to lactase in an inner
aqueous phase within a protective external oil phase. Upon dispersion in
gastric fluids more of the lactase may remain in the inner aqueous phase
droplets within the protective oil rather than partitioning immediately into the
denaturing gastric fluids.
2.5.4 Enteric lactase tablets
The intestinal stability study demonstrated lactase susceptibility at gastric pH.
Analysis of stability of the non-enteric lactase supplements in 0.1N HCl revealed
that none of them preserved more than 5% of their active lactase.
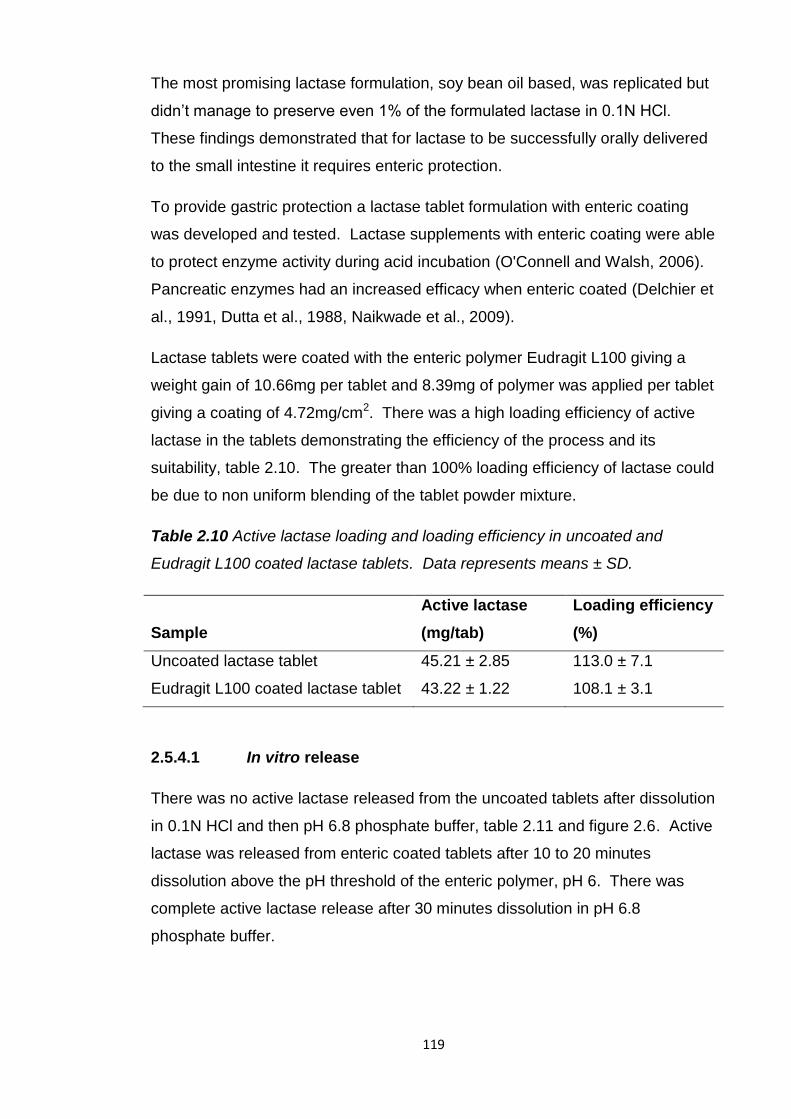
119
The most promising lactase formulation, soy bean oil based, was replicated but
didn’t manage to preserve even 1% of the formulated lactase in 0.1N HCl.
These findings demonstrated that for lactase to be successfully orally delivered
to the small intestine it requires enteric protection.
To provide gastric protection a lactase tablet formulation with enteric coating
was developed and tested. Lactase supplements with enteric coating were able
to protect enzyme activity during acid incubation (O'Connell and Walsh, 2006).
Pancreatic enzymes had an increased efficacy when enteric coated (Delchier et
al., 1991, Dutta et al., 1988, Naikwade et al., 2009).
Lactase tablets were coated with the enteric polymer Eudragit L100 giving a
weight gain of 10.66mg per tablet and 8.39mg of polymer was applied per tablet
giving a coating of 4.72mg/cm2. There was a high loading efficiency of active
lactase in the tablets demonstrating the efficiency of the process and its
suitability, table 2.10. The greater than 100% loading efficiency of lactase could
be due to non uniform blending of the tablet powder mixture.
Table 2.10 Active lactase loading and loading efficiency in uncoated and
Eudragit L100 coated lactase tablets. Data represents means ± SD.
Sample
Active lactase
(mg/tab)
Loading efficiency
(%)
Uncoated lactase tablet 45.21 ± 2.85 113.0 ± 7.1
Eudragit L100 coated lactase tablet 43.22 ± 1.22 108.1 ± 3.1
2.5.4.1 In vitro release
There was no active lactase released from the uncoated tablets after dissolution
in 0.1N HCl and then pH 6.8 phosphate buffer, table 2.11 and figure 2.6. Active
lactase was released from enteric coated tablets after 10 to 20 minutes
dissolution above the pH threshold of the enteric polymer, pH 6. There was
complete active lactase release after 30 minutes dissolution in pH 6.8
phosphate buffer.
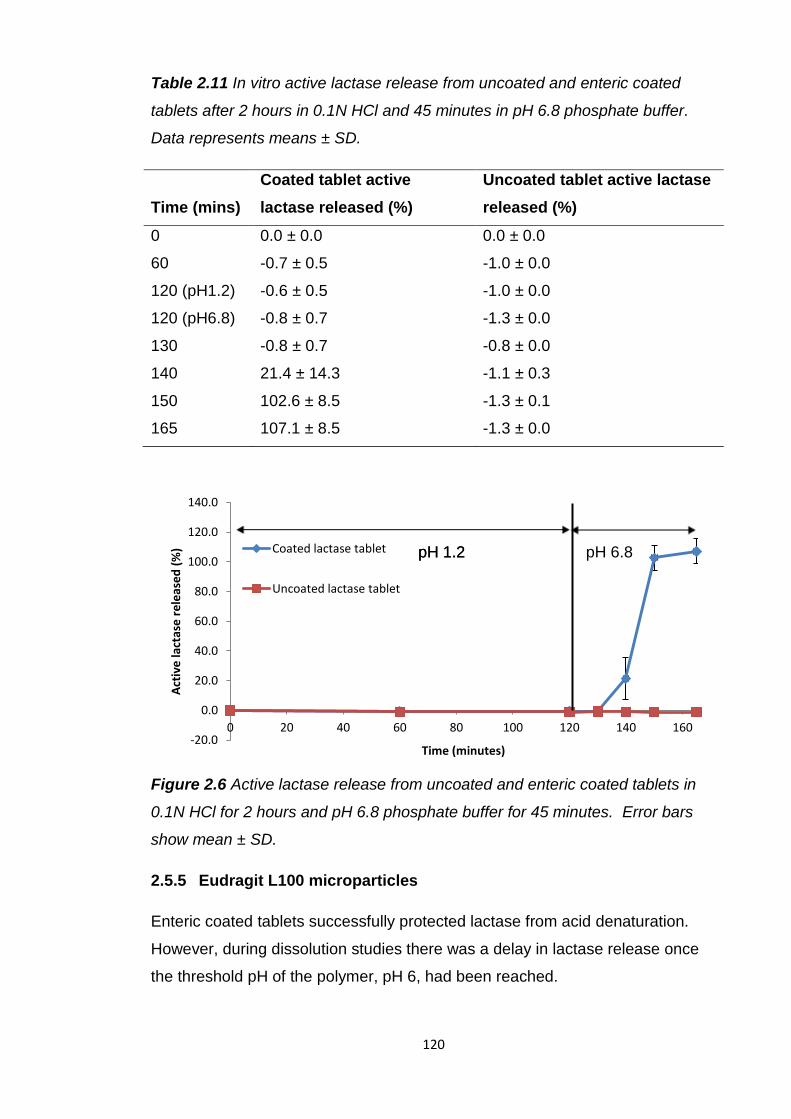
120
Table 2.11 In vitro active lactase release from uncoated and enteric coated
tablets after 2 hours in 0.1N HCl and 45 minutes in pH 6.8 phosphate buffer.
Data represents means ± SD.
Time (mins)
Coated tablet active
lactase released (%)
Uncoated tablet active lactase
released (%)
0 0.0 ± 0.0 0.0 ± 0.0
60 -0.7 ± 0.5 -1.0 ± 0.0
120 (pH1.2) -0.6 ± 0.5 -1.0 ± 0.0
120 (pH6.8) -0.8 ± 0.7 -1.3 ± 0.0
130 -0.8 ± 0.7 -0.8 ± 0.0
140 21.4 ± 14.3 -1.1 ± 0.3
150 102.6 ± 8.5 -1.3 ± 0.1
165 107.1 ± 8.5 -1.3 ± 0.0
Figure 2.6 Active lactase release from uncoated and enteric coated tablets in
0.1N HCl for 2 hours and pH 6.8 phosphate buffer for 45 minutes. Error bars
show mean ± SD.
2.5.5 Eudragit L100 microparticles
Enteric coated tablets successfully protected lactase from acid denaturation.
However, during dissolution studies there was a delay in lactase release once
the threshold pH of the polymer, pH 6, had been reached.
-20.0
0.0
20.0
40.0
60.0
80.0
100.0
120.0
140.0
0 20 40 60 80 100 120 140 160
Act
ive
lact
ase
re
leas
ed
(%
)
Time (minutes)
Coated lactase tablet
Uncoated lactase tablet
pH 1.2 pH 1.2 pH 6.8
121
There was no release for the first 10 minutes at pH 6.8 and it took 30 minutes
for there to be complete lactase release. Single unit, enteric coated dosage
forms, such as capsules and tablets, have previously demonstrated their
inability to disintegrate rapidly (Cole et al., 2002). This has implications for the
digestion of lactose as it would allow lactose to persist undigested in the
intestine. Lactase needs to be immediately available for lactose digestion as
soon as it reaches the small intestine. Administering the tablets before food
may achieve this but the emptying time of the tablets from the stomach and
their dissolution are highly variable.
To overcome this delayed release, the dosage size can be reduced to increase
the surface area and achieve faster lactase release. There was an increase in
the rapidity of enzyme release and greater alleviation of symptoms when
pancreatin microparticles were administered compared to tablets (Naikwade et
al., 2009, Beverley et al., 1987).
Microparticles composed of non enteric polymers have been formulated to
encapsulate lactase. However these have either prematurely released lactase
in SGF or rapidly burst released their lactase making them unsuitable for oral
lactase delivery (Kim et al., 2006, Hayashi et al., 1994). Additionally the
preparation of PLGA and PLA microparticles involved homogenisation which
can damage lactase integrity (Hayashi et al., 1994, Stivaktakis et al., 2004,
Stivaktakis et al., 2005).
Enteric microparticles would be able to prevent lactase exposure to gastric pH,
empty from the stomach with food and due to their large surface area should
rapidly release lactase. The enteric polymer Eudragit L100, which was used to
coat lactase tablets, has been used to produce pH sensitive microparticles
encapsulating lactase. Squillante et al demonstrated their prevention of lactase
release in acid but didn’t show if the lactase retained its activity (Squillante et
al., 2003). The release rate was also quite slow, only 25% of the encapsulated
lactase was released after 20 minutes in pH 6.8 phosphate buffer and 65% was
released in 100 minutes. Alavi et al also encapsulated lactase in Eudragit L100
microparticles employing an oil in oil emulsification solvent evaporation method
(Alavi et al., 2002).
122
However these methods of microparticle preparation involved homogenisation
which was shown to be damaging to lactase (Hayashi et al., 1994).
Eudragit L100 was used to produce microparticles encapsulating lactase
(Kendall et al., 2009). This method has been used to encapsulate small
molecular weight drugs. This method has advantages over the other methods
used to produce Eudragit L100 lactase microparticles as it doesn’t require
temperature control, uses a slower emulsification speed (1000rpm instead of
8000rpm (Alavi et al., 2002)) and uses the less toxic ethanol instead of acetone
or methanol to dissolve the polymer.
The blank and lactase loaded microparticles produced were less than 50µm and
uniformly sized, figure 2.7 and table 2.12. SEM images confirmed this, figures
2.8 and 2.9. These are smaller than those produced previously to encapsulate
lactase 53-57µm (Squillante et al., 2003) and 195µm (Alavi et al., 2002) and
therefore they should empty more rapidly from the stomach with food. The yield
was greater than 90% and there was complete active lactase encapsulation,
table 2.12. This demonstrates the suitability of this method for producing
microparticles with lactase as there was no enzyme destruction caused during
preparation.
The mean encapsulation efficiency of active lactase was 80% for Squillante et
al and only 60% for Alavi et al. In addition these methods were also damaging
to lactase resulting in a 32% loss of activity during processing for Squillante et
al. Alavi et al were able to preserve greater than 80% of lactase activity during
processing but this was still not as compatible with lactase encapsulation as the
Kendall et al method. The size, yield and encapsulation efficiency of lactase
within Eudragit L100 microparticles was comparable to small molecular weight
drugs encapsulated using the Kendall et al method. This demonstrates the
suitability of this method to successfully encapsulate macromolecules, including
proteins, within enteric microparticles.
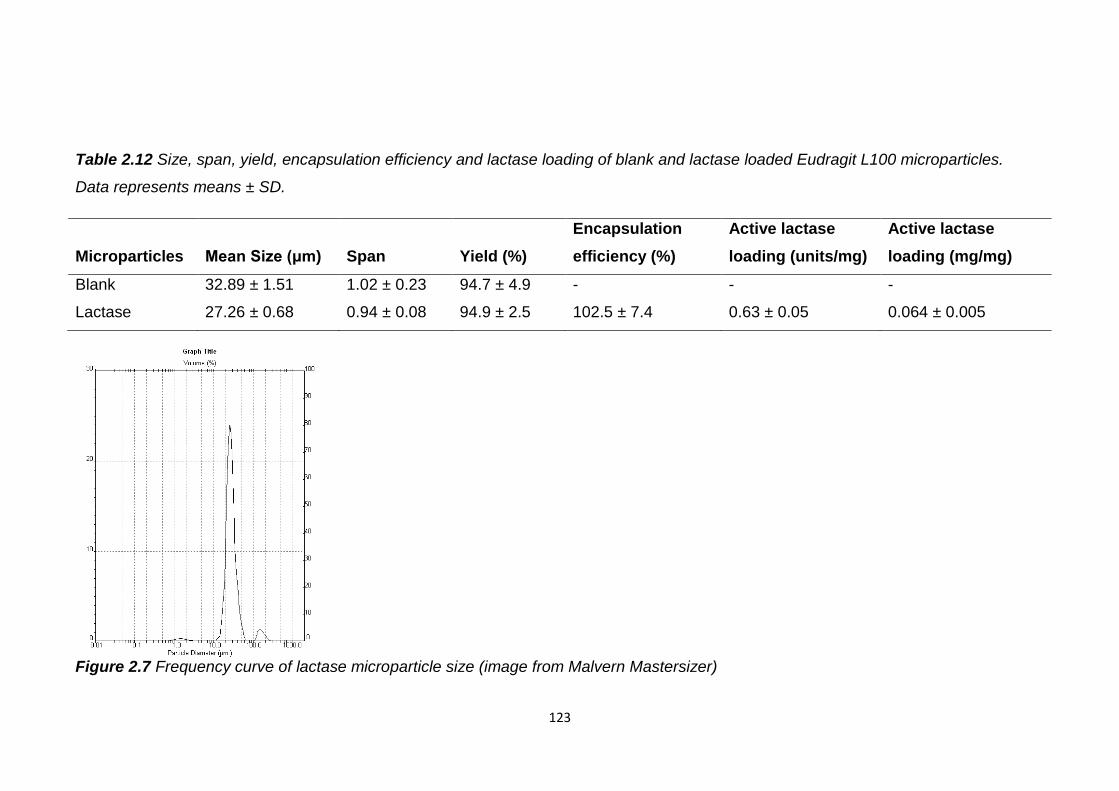
123
Table 2.12 Size, span, yield, encapsulation efficiency and lactase loading of blank and lactase loaded Eudragit L100 microparticles.
Data represents means ± SD.
Microparticles Mean Size (μm) Span Yield (%)
Encapsulation
efficiency (%)
Active lactase
loading (units/mg)
Active lactase
loading (mg/mg)
Blank 32.89 ± 1.51 1.02 ± 0.23 94.7 ± 4.9 - - -
Lactase 27.26 ± 0.68 0.94 ± 0.08 94.9 ± 2.5 102.5 ± 7.4 0.63 ± 0.05 0.064 ± 0.005
Figure 2.7 Frequency curve of lactase microparticle size (image from Malvern Mastersizer)
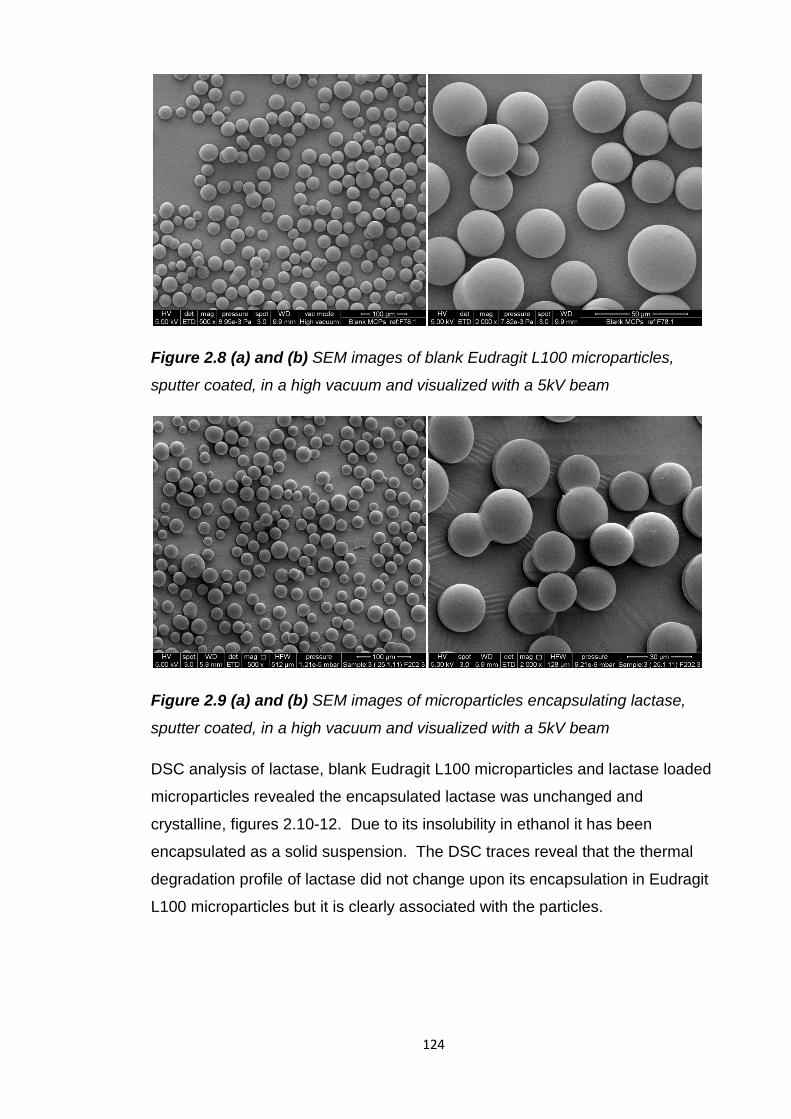
124
Figure 2.8 (a) and (b) SEM images of blank Eudragit L100 microparticles,
sputter coated, in a high vacuum and visualized with a 5kV beam
Figure 2.9 (a) and (b) SEM images of microparticles encapsulating lactase,
sputter coated, in a high vacuum and visualized with a 5kV beam
DSC analysis of lactase, blank Eudragit L100 microparticles and lactase loaded
microparticles revealed the encapsulated lactase was unchanged and
crystalline, figures 2.10-12. Due to its insolubility in ethanol it has been
encapsulated as a solid suspension. The DSC traces reveal that the thermal
degradation profile of lactase did not change upon its encapsulation in Eudragit
L100 microparticles but it is clearly associated with the particles.
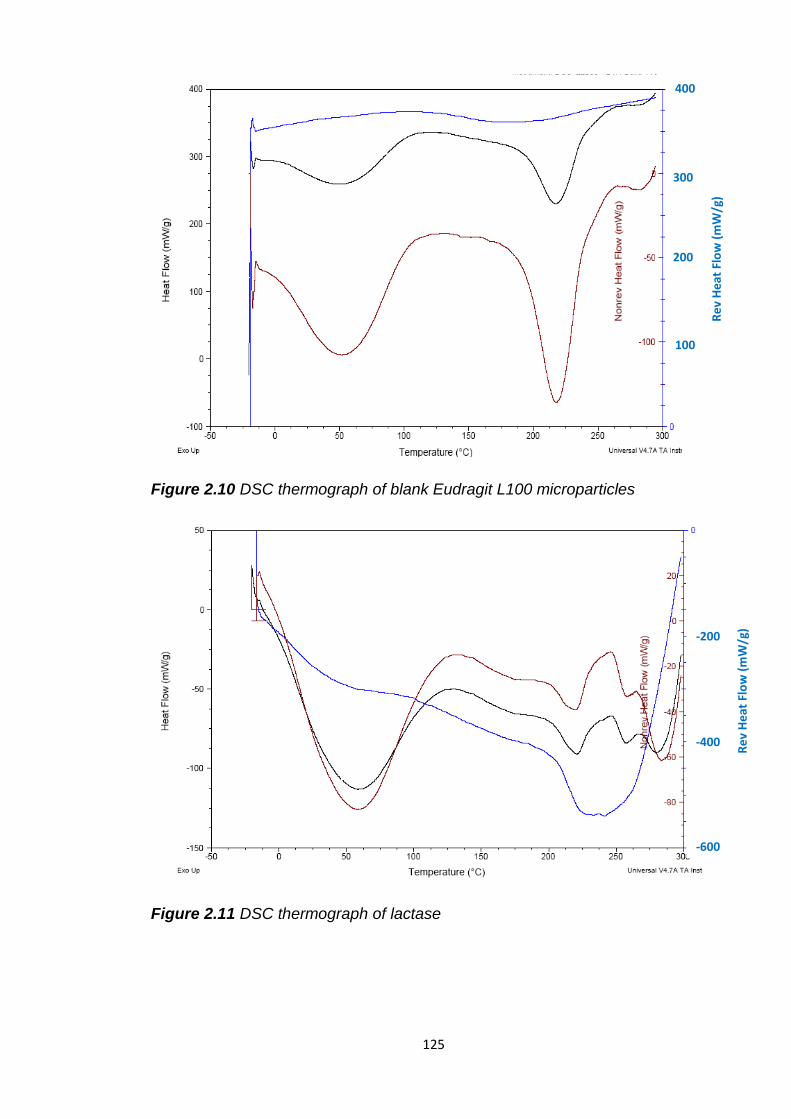
125
Figure 2.10 DSC thermograph of blank Eudragit L100 microparticles
Figure 2.11 DSC thermograph of lactase
Re
v H
eat
Flo
w (
mW
/g)
Re
v H
eat
Flo
w (
mW
/g)
400
300
200
100
-200
-400
-600
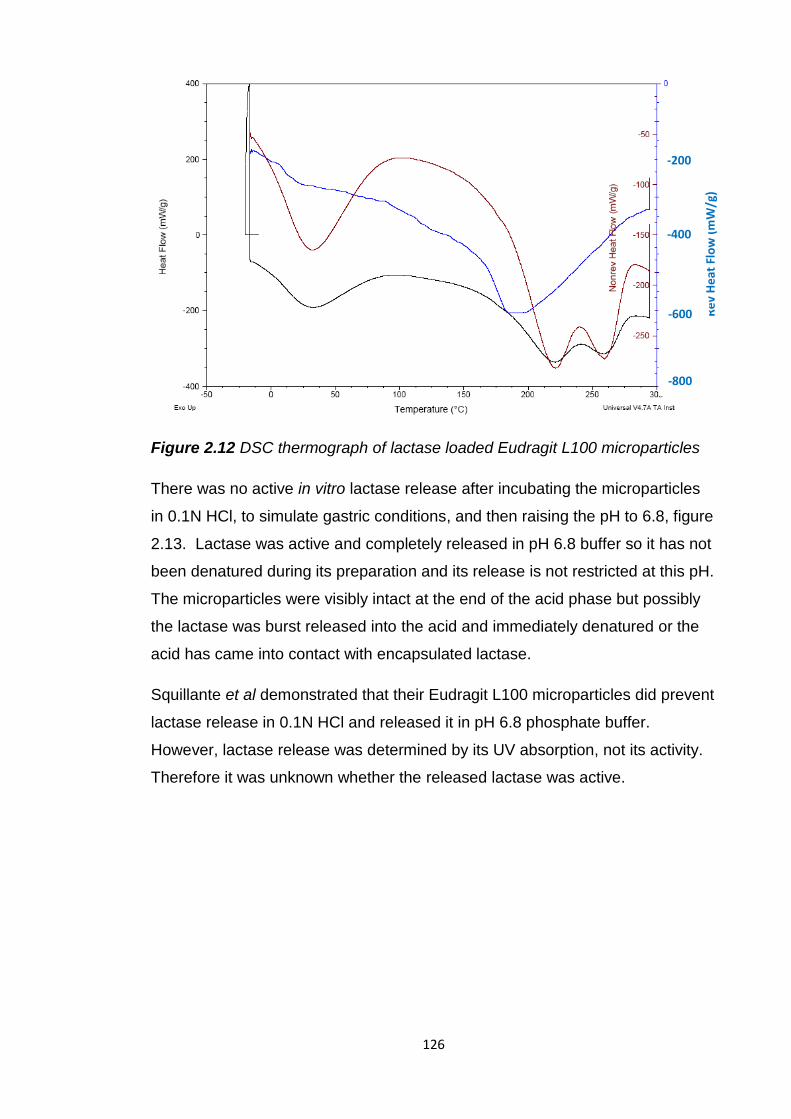
126
Figure 2.12 DSC thermograph of lactase loaded Eudragit L100 microparticles
There was no active in vitro lactase release after incubating the microparticles
in 0.1N HCl, to simulate gastric conditions, and then raising the pH to 6.8, figure
2.13. Lactase was active and completely released in pH 6.8 buffer so it has not
been denatured during its preparation and its release is not restricted at this pH.
The microparticles were visibly intact at the end of the acid phase but possibly
the lactase was burst released into the acid and immediately denatured or the
acid has came into contact with encapsulated lactase.
Squillante et al demonstrated that their Eudragit L100 microparticles did prevent
lactase release in 0.1N HCl and released it in pH 6.8 phosphate buffer.
However, lactase release was determined by its UV absorption, not its activity.
Therefore it was unknown whether the released lactase was active.
Re
v H
eat
Flo
w (
mW
/g)
-200
-400
-600
-800
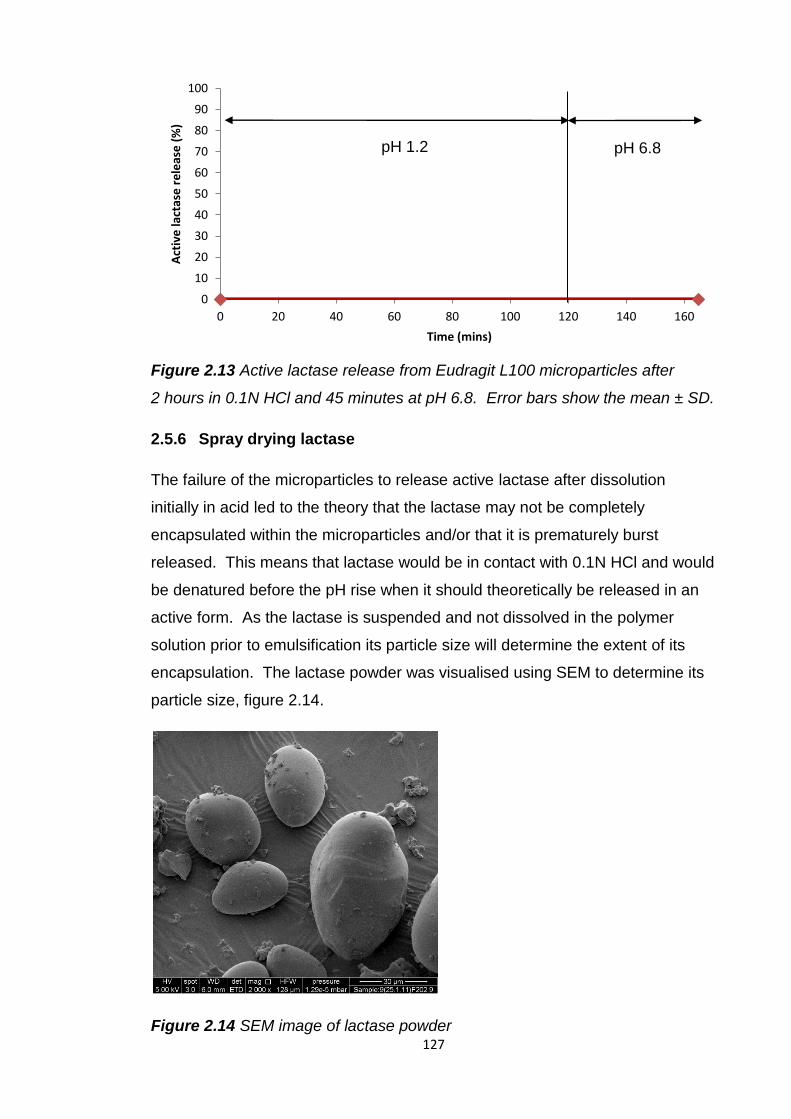
127
Figure 2.13 Active lactase release from Eudragit L100 microparticles after
2 hours in 0.1N HCl and 45 minutes at pH 6.8. Error bars show the mean ± SD.
2.5.6 Spray drying lactase
The failure of the microparticles to release active lactase after dissolution
initially in acid led to the theory that the lactase may not be completely
encapsulated within the microparticles and/or that it is prematurely burst
released. This means that lactase would be in contact with 0.1N HCl and would
be denatured before the pH rise when it should theoretically be released in an
active form. As the lactase is suspended and not dissolved in the polymer
solution prior to emulsification its particle size will determine the extent of its
encapsulation. The lactase powder was visualised using SEM to determine its
particle size, figure 2.14.
Figure 2.14 SEM image of lactase powder
0
10
20
30
40
50
60
70
80
90
100
0 20 40 60 80 100 120 140 160
Act
ive
lact
ase
re
leas
e (
%)
Time (mins)
pH 1.2 pH 6.8
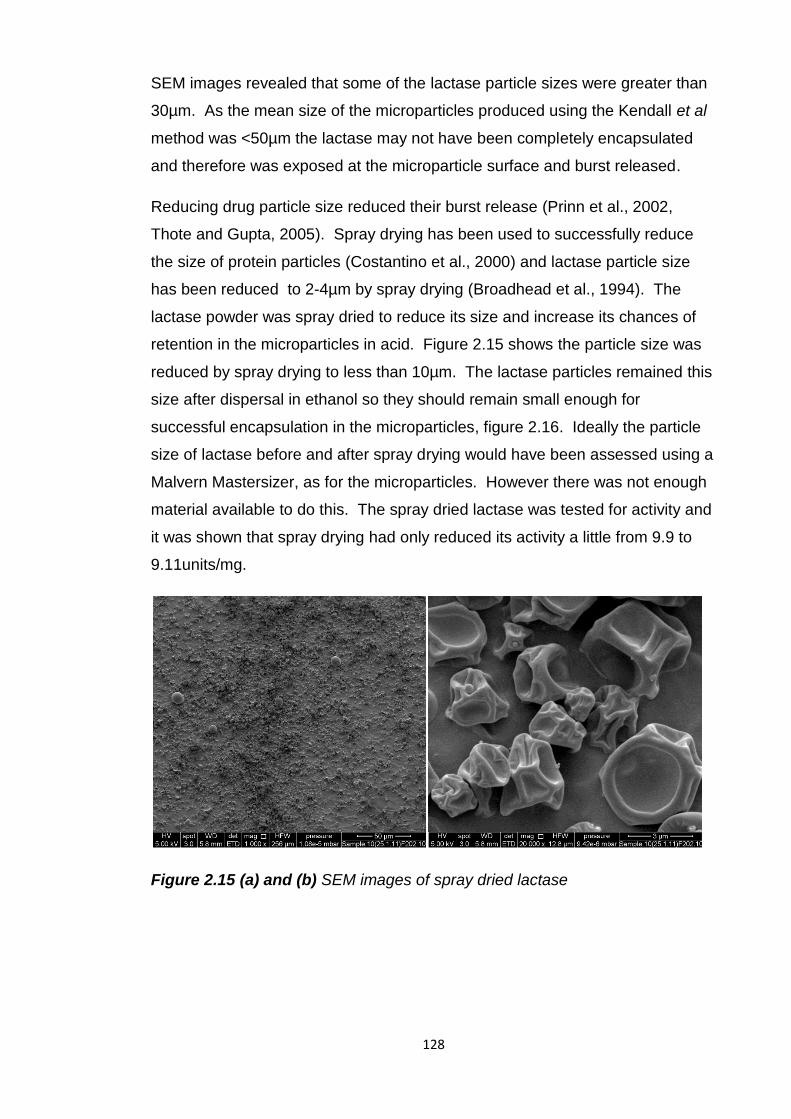
128
SEM images revealed that some of the lactase particle sizes were greater than
30µm. As the mean size of the microparticles produced using the Kendall et al
method was <50µm the lactase may not have been completely encapsulated
and therefore was exposed at the microparticle surface and burst released.
Reducing drug particle size reduced their burst release (Prinn et al., 2002,
Thote and Gupta, 2005). Spray drying has been used to successfully reduce
the size of protein particles (Costantino et al., 2000) and lactase particle size
has been reduced to 2-4µm by spray drying (Broadhead et al., 1994). The
lactase powder was spray dried to reduce its size and increase its chances of
retention in the microparticles in acid. Figure 2.15 shows the particle size was
reduced by spray drying to less than 10µm. The lactase particles remained this
size after dispersal in ethanol so they should remain small enough for
successful encapsulation in the microparticles, figure 2.16. Ideally the particle
size of lactase before and after spray drying would have been assessed using a
Malvern Mastersizer, as for the microparticles. However there was not enough
material available to do this. The spray dried lactase was tested for activity and
it was shown that spray drying had only reduced its activity a little from 9.9 to
9.11units/mg.
Figure 2.15 (a) and (b) SEM images of spray dried lactase
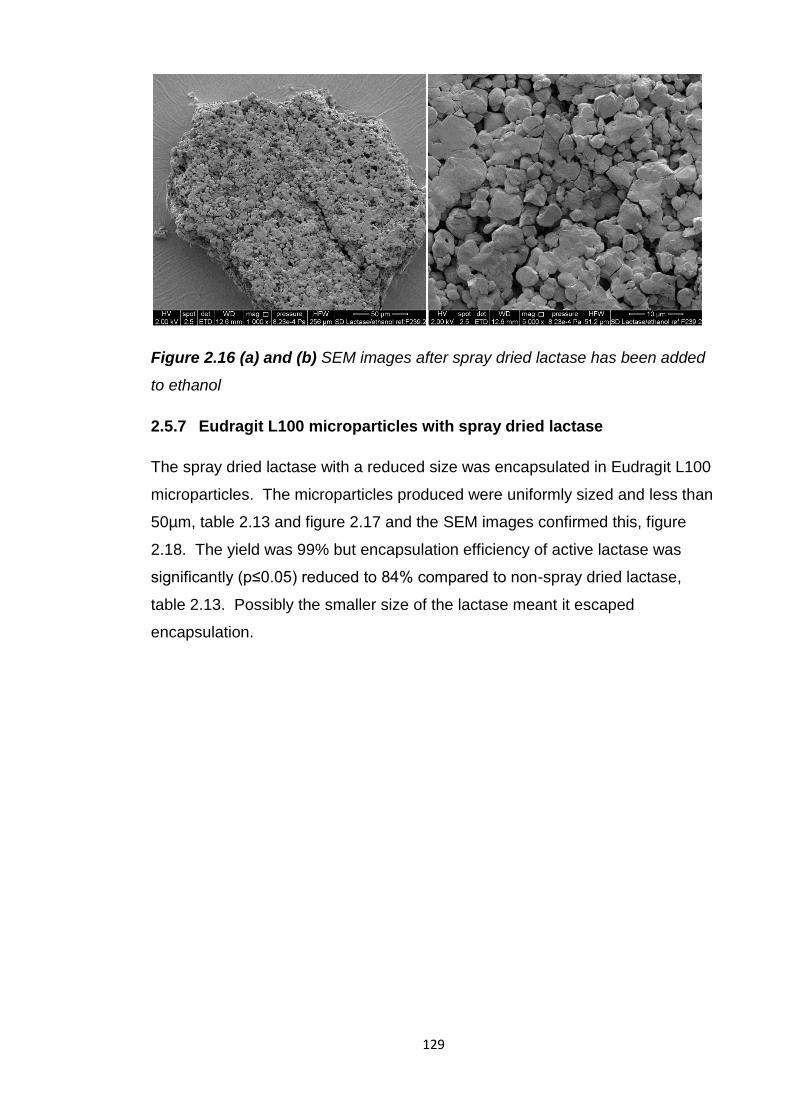
129
Figure 2.16 (a) and (b) SEM images after spray dried lactase has been added
to ethanol
2.5.7 Eudragit L100 microparticles with spray dried lactase
The spray dried lactase with a reduced size was encapsulated in Eudragit L100
microparticles. The microparticles produced were uniformly sized and less than
50µm, table 2.13 and figure 2.17 and the SEM images confirmed this, figure
2.18. The yield was 99% but encapsulation efficiency of active lactase was
significantly (p≤0.05) reduced to 84% compared to non-spray dried lactase,
table 2.13. Possibly the smaller size of the lactase meant it escaped
encapsulation.
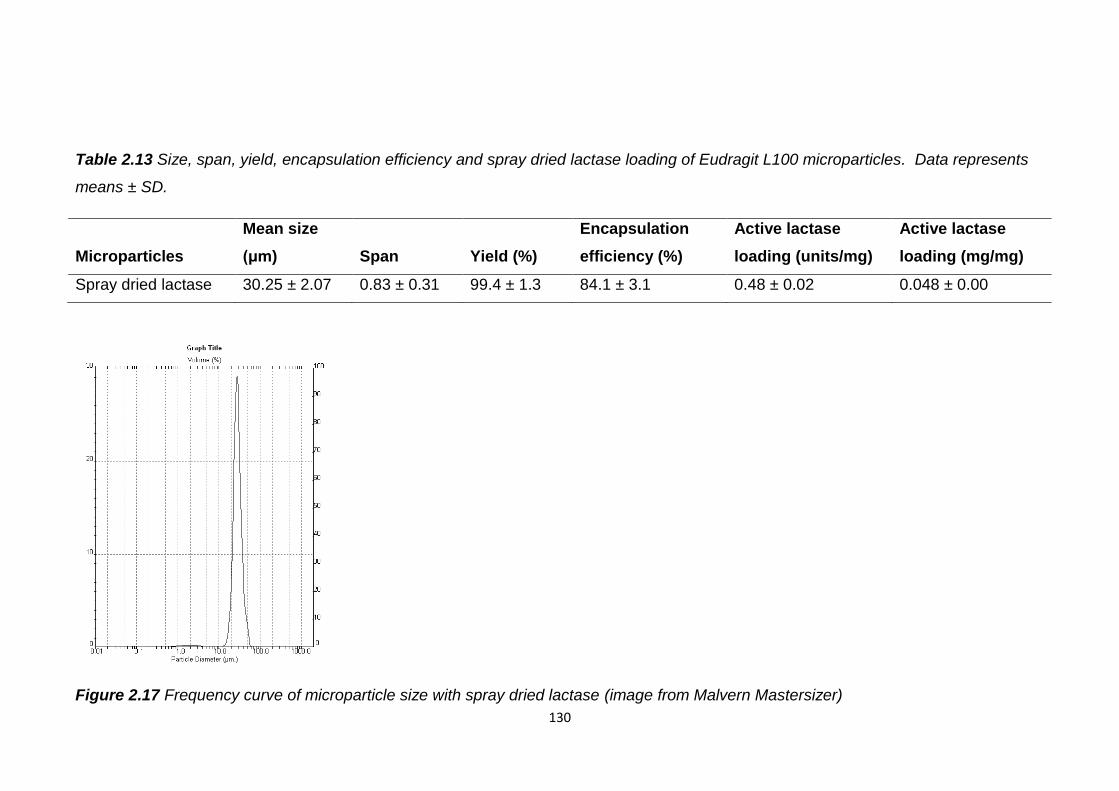
130
Table 2.13 Size, span, yield, encapsulation efficiency and spray dried lactase loading of Eudragit L100 microparticles. Data represents
means ± SD.
Microparticles
Mean size
(μm) Span Yield (%)
Encapsulation
efficiency (%)
Active lactase
loading (units/mg)
Active lactase
loading (mg/mg)
Spray dried lactase 30.25 ± 2.07 0.83 ± 0.31 99.4 ± 1.3 84.1 ± 3.1 0.48 ± 0.02 0.048 ± 0.00
Figure 2.17 Frequency curve of microparticle size with spray dried lactase (image from Malvern Mastersizer)
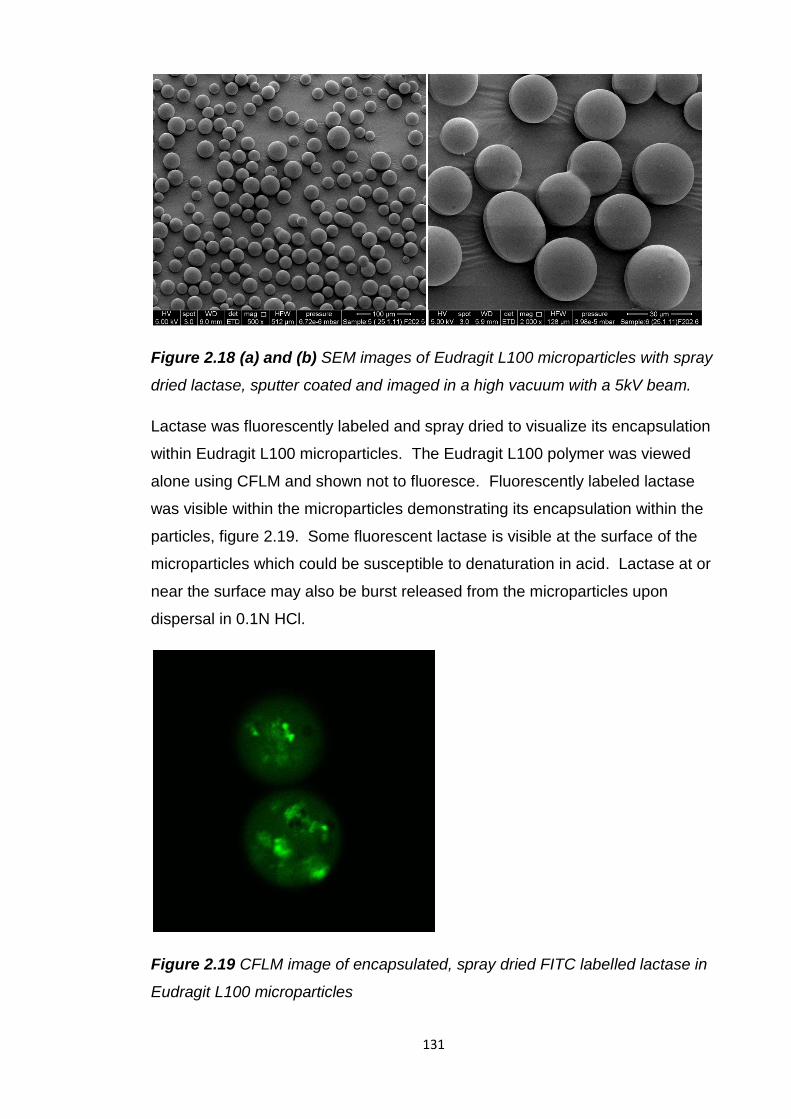
131
Figure 2.18 (a) and (b) SEM images of Eudragit L100 microparticles with spray
dried lactase, sputter coated and imaged in a high vacuum with a 5kV beam.
Lactase was fluorescently labeled and spray dried to visualize its encapsulation
within Eudragit L100 microparticles. The Eudragit L100 polymer was viewed
alone using CFLM and shown not to fluoresce. Fluorescently labeled lactase
was visible within the microparticles demonstrating its encapsulation within the
particles, figure 2.19. Some fluorescent lactase is visible at the surface of the
microparticles which could be susceptible to denaturation in acid. Lactase at or
near the surface may also be burst released from the microparticles upon
dispersal in 0.1N HCl.
Figure 2.19 CFLM image of encapsulated, spray dried FITC labelled lactase in
Eudragit L100 microparticles
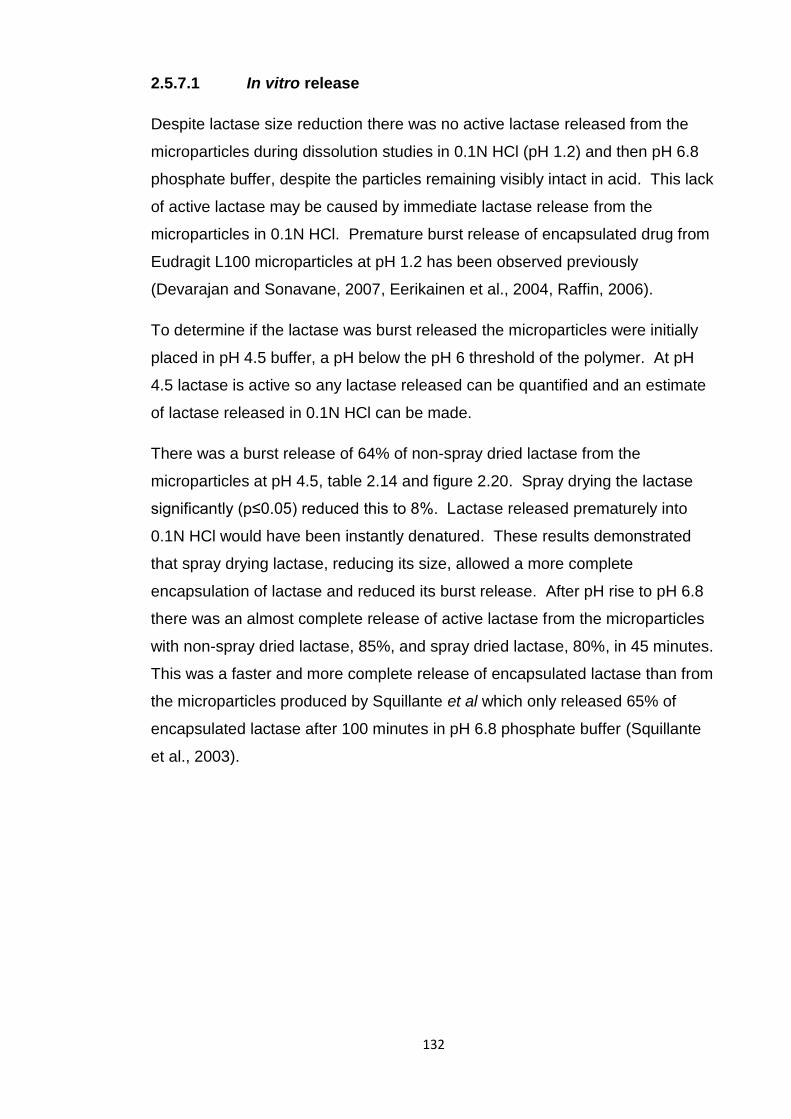
132
2.5.7.1 In vitro release
Despite lactase size reduction there was no active lactase released from the
microparticles during dissolution studies in 0.1N HCl (pH 1.2) and then pH 6.8
phosphate buffer, despite the particles remaining visibly intact in acid. This lack
of active lactase may be caused by immediate lactase release from the
microparticles in 0.1N HCl. Premature burst release of encapsulated drug from
Eudragit L100 microparticles at pH 1.2 has been observed previously
(Devarajan and Sonavane, 2007, Eerikainen et al., 2004, Raffin, 2006).
To determine if the lactase was burst released the microparticles were initially
placed in pH 4.5 buffer, a pH below the pH 6 threshold of the polymer. At pH
4.5 lactase is active so any lactase released can be quantified and an estimate
of lactase released in 0.1N HCl can be made.
There was a burst release of 64% of non-spray dried lactase from the
microparticles at pH 4.5, table 2.14 and figure 2.20. Spray drying the lactase
significantly (p≤0.05) reduced this to 8%. Lactase released prematurely into
0.1N HCl would have been instantly denatured. These results demonstrated
that spray drying lactase, reducing its size, allowed a more complete
encapsulation of lactase and reduced its burst release. After pH rise to pH 6.8
there was an almost complete release of active lactase from the microparticles
with non-spray dried lactase, 85%, and spray dried lactase, 80%, in 45 minutes.
This was a faster and more complete release of encapsulated lactase than from
the microparticles produced by Squillante et al which only released 65% of
encapsulated lactase after 100 minutes in pH 6.8 phosphate buffer (Squillante
et al., 2003).
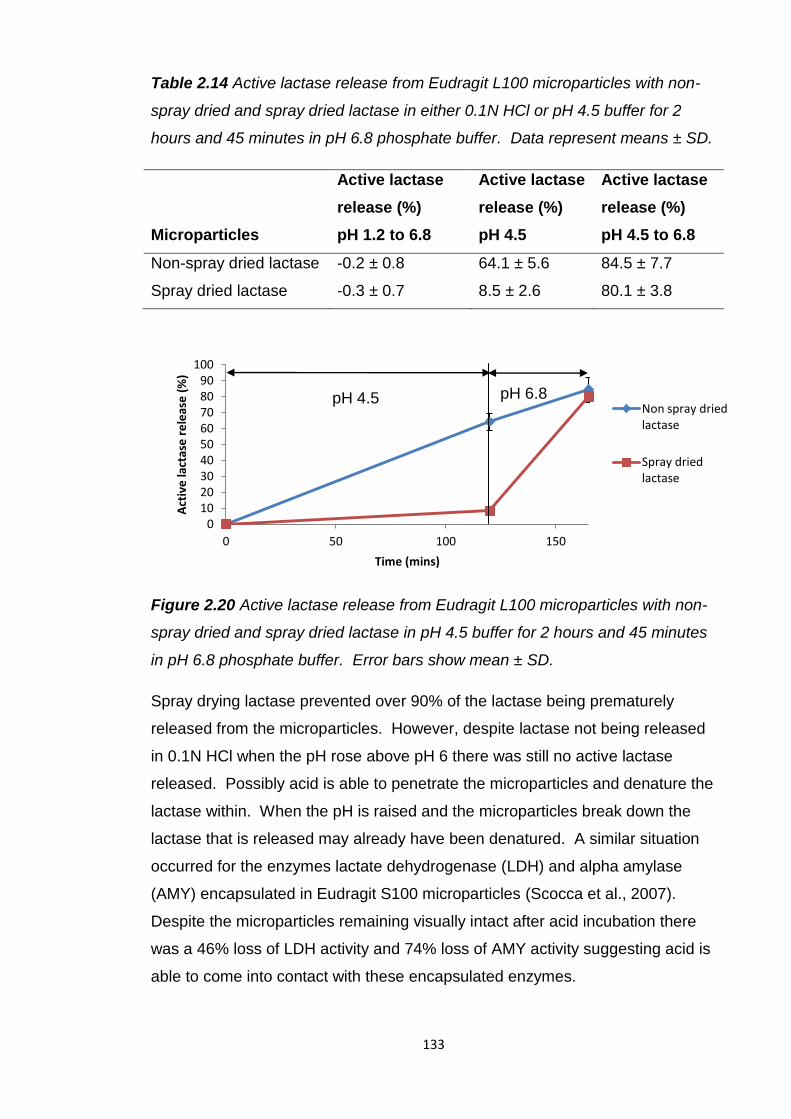
133
Table 2.14 Active lactase release from Eudragit L100 microparticles with non-
spray dried and spray dried lactase in either 0.1N HCl or pH 4.5 buffer for 2
hours and 45 minutes in pH 6.8 phosphate buffer. Data represent means ± SD.
Microparticles
Active lactase
release (%)
pH 1.2 to 6.8
Active lactase
release (%)
pH 4.5
Active lactase
release (%)
pH 4.5 to 6.8
Non-spray dried lactase -0.2 ± 0.8 64.1 ± 5.6 84.5 ± 7.7
Spray dried lactase -0.3 ± 0.7 8.5 ± 2.6 80.1 ± 3.8
Figure 2.20 Active lactase release from Eudragit L100 microparticles with non-
spray dried and spray dried lactase in pH 4.5 buffer for 2 hours and 45 minutes
in pH 6.8 phosphate buffer. Error bars show mean ± SD.
Spray drying lactase prevented over 90% of the lactase being prematurely
released from the microparticles. However, despite lactase not being released
in 0.1N HCl when the pH rose above pH 6 there was still no active lactase
released. Possibly acid is able to penetrate the microparticles and denature the
lactase within. When the pH is raised and the microparticles break down the
lactase that is released may already have been denatured. A similar situation
occurred for the enzymes lactate dehydrogenase (LDH) and alpha amylase
(AMY) encapsulated in Eudragit S100 microparticles (Scocca et al., 2007).
Despite the microparticles remaining visually intact after acid incubation there
was a 46% loss of LDH activity and 74% loss of AMY activity suggesting acid is
able to come into contact with these encapsulated enzymes.
0 10 20 30 40 50 60 70 80 90
100
0 50 100 150
Act
ive
lact
ase
re
leas
e (
%)
Time (mins)
Non spray dried lactase
Spray dried lactase
pH 4.5 pH 6.8
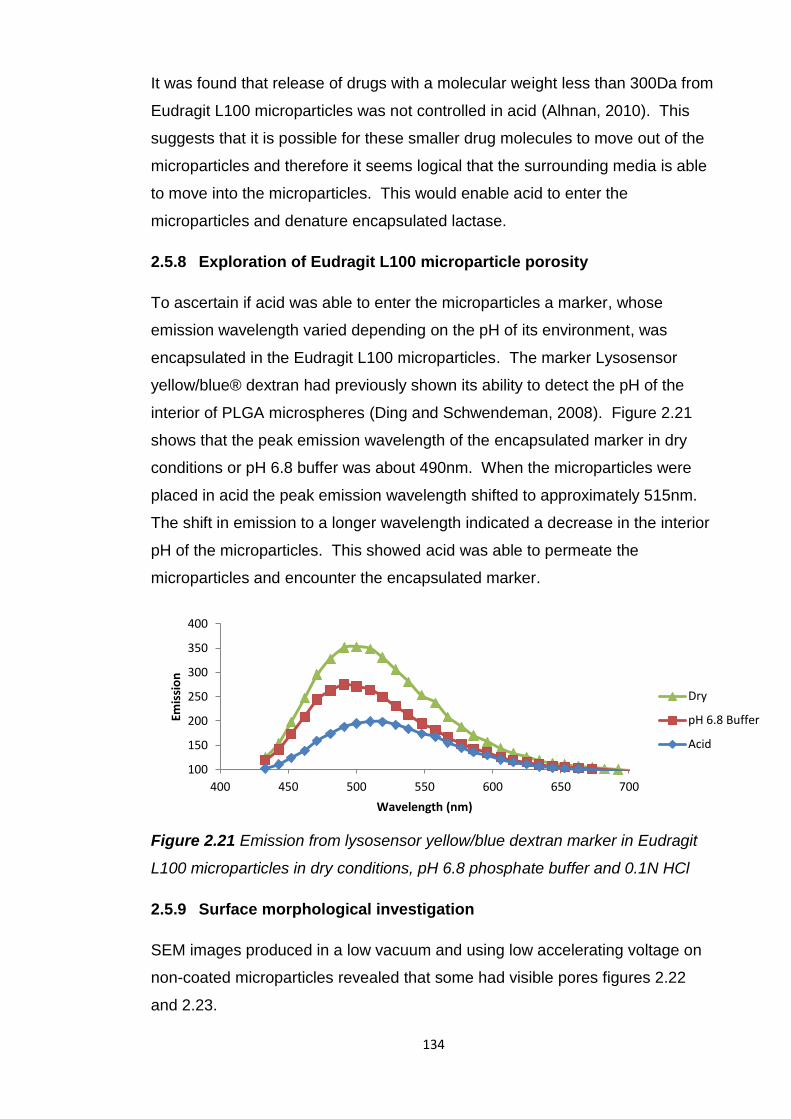
134
It was found that release of drugs with a molecular weight less than 300Da from
Eudragit L100 microparticles was not controlled in acid (Alhnan, 2010). This
suggests that it is possible for these smaller drug molecules to move out of the
microparticles and therefore it seems logical that the surrounding media is able
to move into the microparticles. This would enable acid to enter the
microparticles and denature encapsulated lactase.
2.5.8 Exploration of Eudragit L100 microparticle porosity
To ascertain if acid was able to enter the microparticles a marker, whose
emission wavelength varied depending on the pH of its environment, was
encapsulated in the Eudragit L100 microparticles. The marker Lysosensor
yellow/blue® dextran had previously shown its ability to detect the pH of the
interior of PLGA microspheres (Ding and Schwendeman, 2008). Figure 2.21
shows that the peak emission wavelength of the encapsulated marker in dry
conditions or pH 6.8 buffer was about 490nm. When the microparticles were
placed in acid the peak emission wavelength shifted to approximately 515nm.
The shift in emission to a longer wavelength indicated a decrease in the interior
pH of the microparticles. This showed acid was able to permeate the
microparticles and encounter the encapsulated marker.
Figure 2.21 Emission from lysosensor yellow/blue dextran marker in Eudragit
L100 microparticles in dry conditions, pH 6.8 phosphate buffer and 0.1N HCl
2.5.9 Surface morphological investigation
SEM images produced in a low vacuum and using low accelerating voltage on
non-coated microparticles revealed that some had visible pores figures 2.22
and 2.23.
100
150
200
250
300
350
400
400 450 500 550 600 650 700
Emis
sio
n
Wavelength (nm)
Dry
pH 6.8 Buffer
Acid
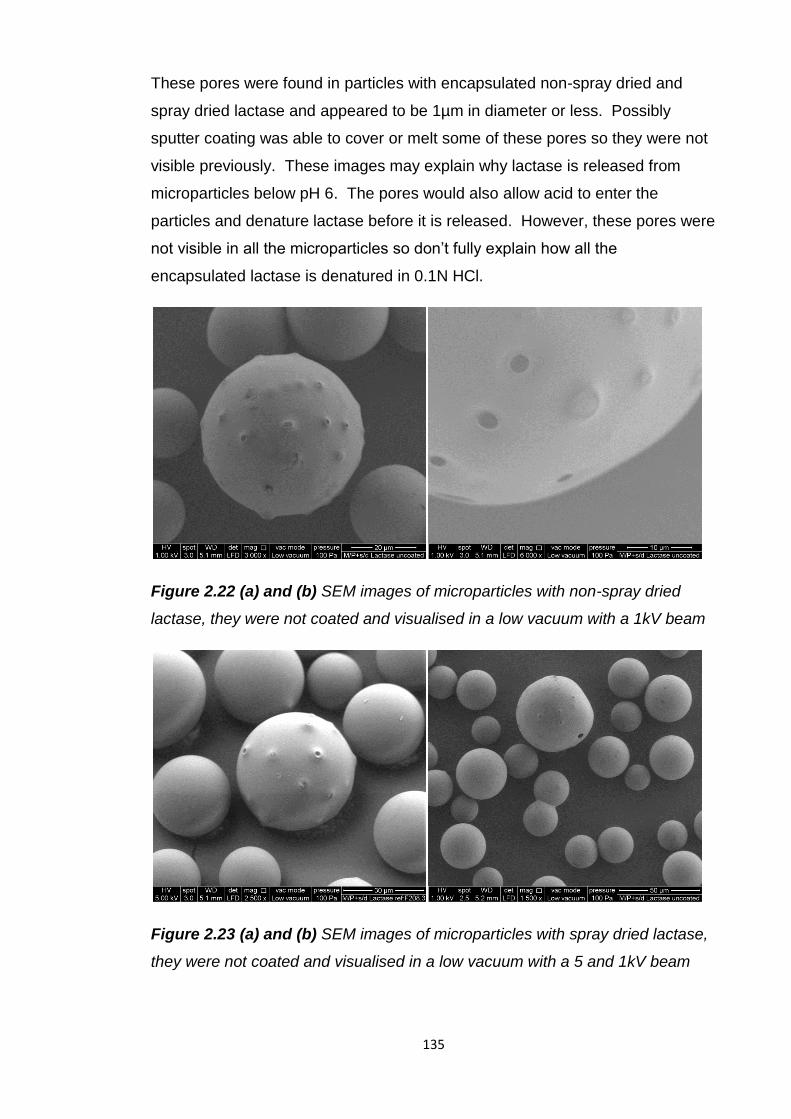
135
These pores were found in particles with encapsulated non-spray dried and
spray dried lactase and appeared to be 1µm in diameter or less. Possibly
sputter coating was able to cover or melt some of these pores so they were not
visible previously. These images may explain why lactase is released from
microparticles below pH 6. The pores would also allow acid to enter the
particles and denature lactase before it is released. However, these pores were
not visible in all the microparticles so don’t fully explain how all the
encapsulated lactase is denatured in 0.1N HCl.
Figure 2.22 (a) and (b) SEM images of microparticles with non-spray dried
lactase, they were not coated and visualised in a low vacuum with a 1kV beam
Figure 2.23 (a) and (b) SEM images of microparticles with spray dried lactase,
they were not coated and visualised in a low vacuum with a 5 and 1kV beam
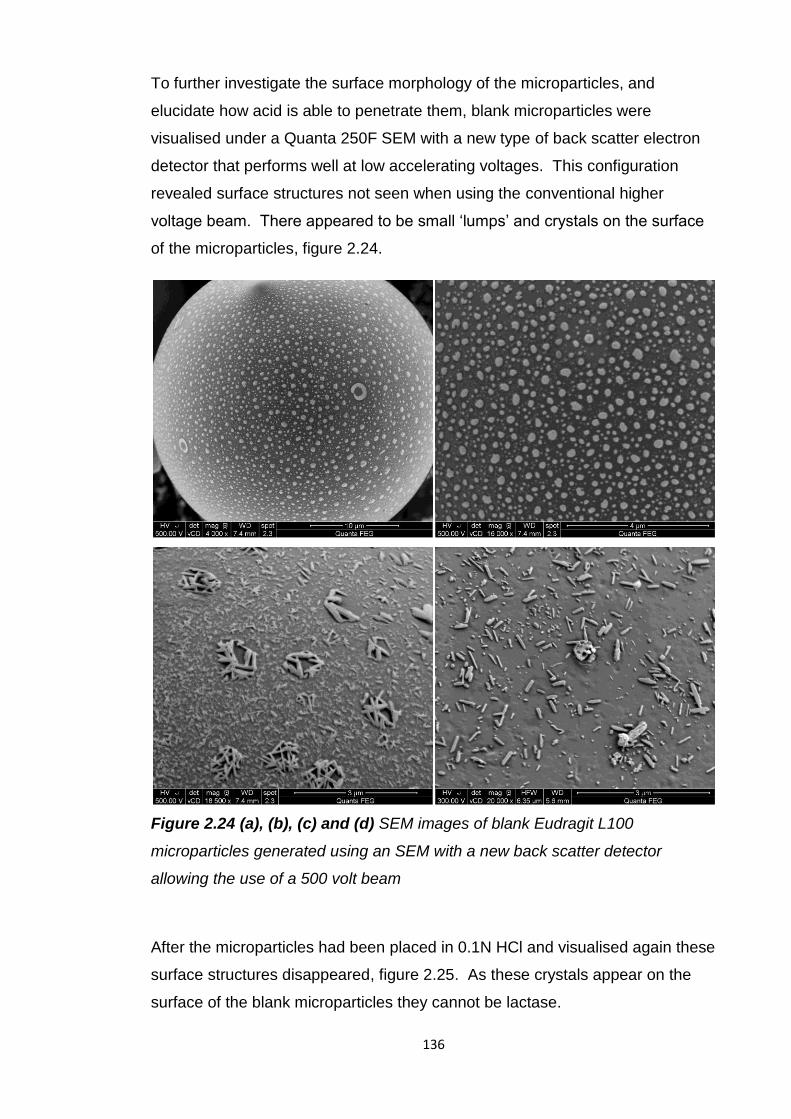
136
To further investigate the surface morphology of the microparticles, and
elucidate how acid is able to penetrate them, blank microparticles were
visualised under a Quanta 250F SEM with a new type of back scatter electron
detector that performs well at low accelerating voltages. This configuration
revealed surface structures not seen when using the conventional higher
voltage beam. There appeared to be small ‘lumps’ and crystals on the surface
of the microparticles, figure 2.24.
Figure 2.24 (a), (b), (c) and (d) SEM images of blank Eudragit L100
microparticles generated using an SEM with a new back scatter detector
allowing the use of a 500 volt beam
After the microparticles had been placed in 0.1N HCl and visualised again these
surface structures disappeared, figure 2.25. As these crystals appear on the
surface of the blank microparticles they cannot be lactase.
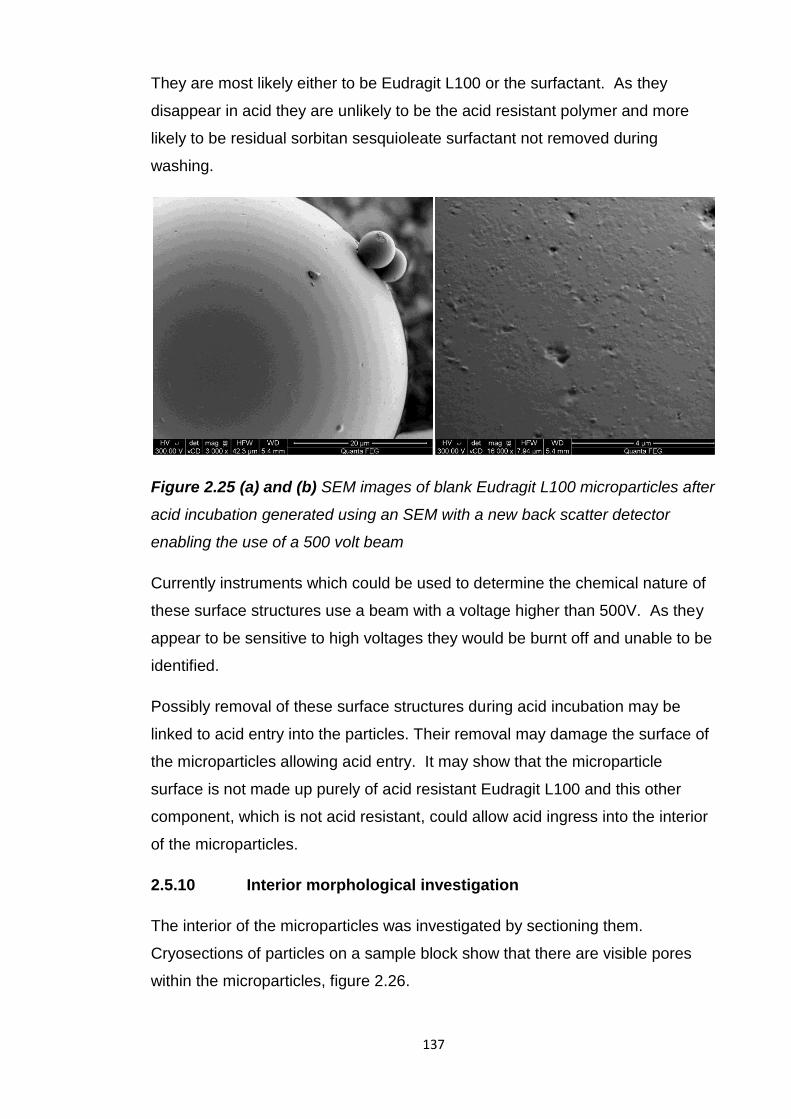
137
They are most likely either to be Eudragit L100 or the surfactant. As they
disappear in acid they are unlikely to be the acid resistant polymer and more
likely to be residual sorbitan sesquioleate surfactant not removed during
washing.
Figure 2.25 (a) and (b) SEM images of blank Eudragit L100 microparticles after
acid incubation generated using an SEM with a new back scatter detector
enabling the use of a 500 volt beam
Currently instruments which could be used to determine the chemical nature of
these surface structures use a beam with a voltage higher than 500V. As they
appear to be sensitive to high voltages they would be burnt off and unable to be
identified.
Possibly removal of these surface structures during acid incubation may be
linked to acid entry into the particles. Their removal may damage the surface of
the microparticles allowing acid entry. It may show that the microparticle
surface is not made up purely of acid resistant Eudragit L100 and this other
component, which is not acid resistant, could allow acid ingress into the interior
of the microparticles.
2.5.10 Interior morphological investigation
The interior of the microparticles was investigated by sectioning them.
Cryosections of particles on a sample block show that there are visible pores
within the microparticles, figure 2.26.
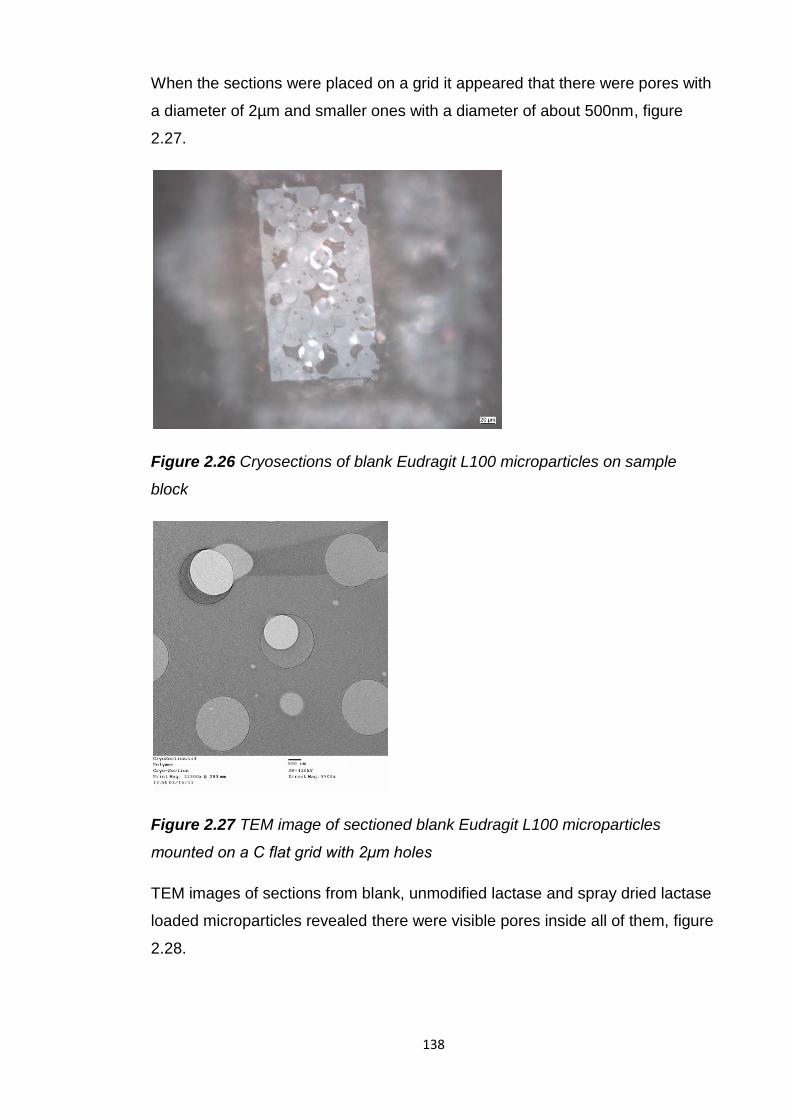
138
When the sections were placed on a grid it appeared that there were pores with
a diameter of 2µm and smaller ones with a diameter of about 500nm, figure
2.27.
Figure 2.26 Cryosections of blank Eudragit L100 microparticles on sample
block
Figure 2.27 TEM image of sectioned blank Eudragit L100 microparticles
mounted on a C flat grid with 2μm holes
TEM images of sections from blank, unmodified lactase and spray dried lactase
loaded microparticles revealed there were visible pores inside all of them, figure
2.28.
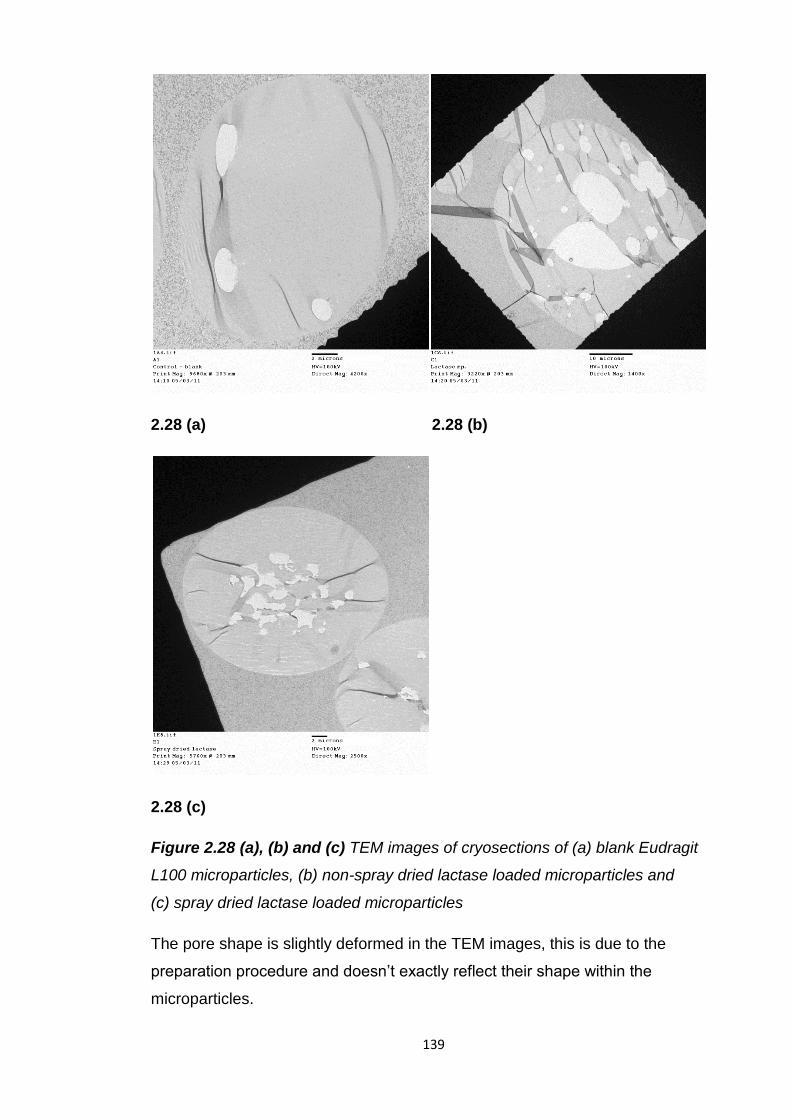
139
2.28 (a) 2.28 (b)
2.28 (c)
Figure 2.28 (a), (b) and (c) TEM images of cryosections of (a) blank Eudragit
L100 microparticles, (b) non-spray dried lactase loaded microparticles and
(c) spray dried lactase loaded microparticles
The pore shape is slightly deformed in the TEM images, this is due to the
preparation procedure and doesn’t exactly reflect their shape within the
microparticles.
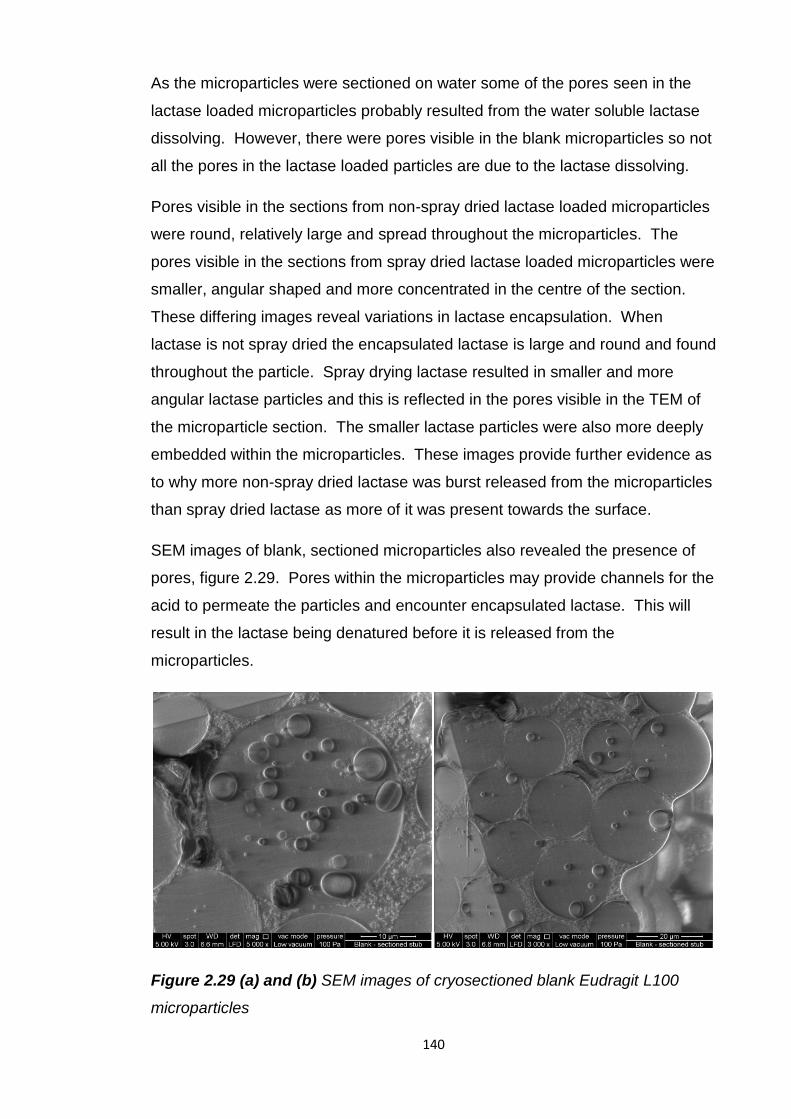
140
As the microparticles were sectioned on water some of the pores seen in the
lactase loaded microparticles probably resulted from the water soluble lactase
dissolving. However, there were pores visible in the blank microparticles so not
all the pores in the lactase loaded particles are due to the lactase dissolving.
Pores visible in the sections from non-spray dried lactase loaded microparticles
were round, relatively large and spread throughout the microparticles. The
pores visible in the sections from spray dried lactase loaded microparticles were
smaller, angular shaped and more concentrated in the centre of the section.
These differing images reveal variations in lactase encapsulation. When
lactase is not spray dried the encapsulated lactase is large and round and found
throughout the particle. Spray drying lactase resulted in smaller and more
angular lactase particles and this is reflected in the pores visible in the TEM of
the microparticle section. The smaller lactase particles were also more deeply
embedded within the microparticles. These images provide further evidence as
to why more non-spray dried lactase was burst released from the microparticles
than spray dried lactase as more of it was present towards the surface.
SEM images of blank, sectioned microparticles also revealed the presence of
pores, figure 2.29. Pores within the microparticles may provide channels for the
acid to permeate the particles and encounter encapsulated lactase. This will
result in the lactase being denatured before it is released from the
microparticles.
Figure 2.29 (a) and (b) SEM images of cryosectioned blank Eudragit L100
microparticles
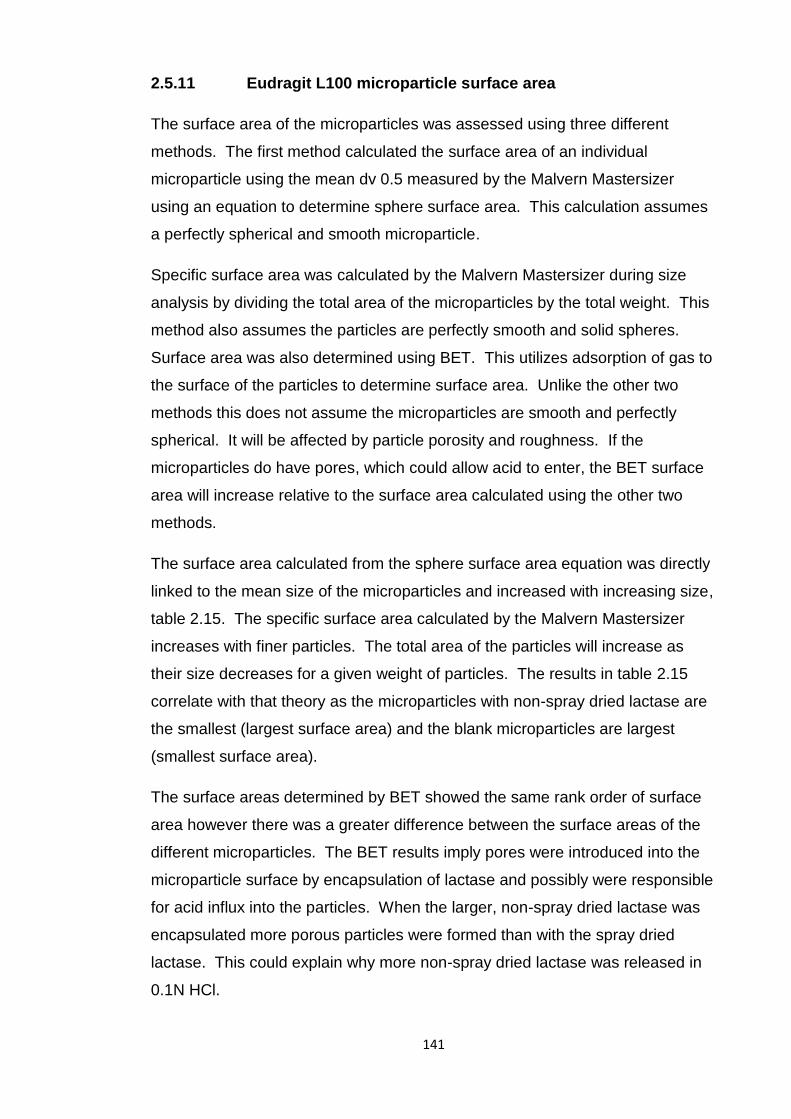
141
2.5.11 Eudragit L100 microparticle surface area
The surface area of the microparticles was assessed using three different
methods. The first method calculated the surface area of an individual
microparticle using the mean dv 0.5 measured by the Malvern Mastersizer
using an equation to determine sphere surface area. This calculation assumes
a perfectly spherical and smooth microparticle.
Specific surface area was calculated by the Malvern Mastersizer during size
analysis by dividing the total area of the microparticles by the total weight. This
method also assumes the particles are perfectly smooth and solid spheres.
Surface area was also determined using BET. This utilizes adsorption of gas to
the surface of the particles to determine surface area. Unlike the other two
methods this does not assume the microparticles are smooth and perfectly
spherical. It will be affected by particle porosity and roughness. If the
microparticles do have pores, which could allow acid to enter, the BET surface
area will increase relative to the surface area calculated using the other two
methods.
The surface area calculated from the sphere surface area equation was directly
linked to the mean size of the microparticles and increased with increasing size,
table 2.15. The specific surface area calculated by the Malvern Mastersizer
increases with finer particles. The total area of the particles will increase as
their size decreases for a given weight of particles. The results in table 2.15
correlate with that theory as the microparticles with non-spray dried lactase are
the smallest (largest surface area) and the blank microparticles are largest
(smallest surface area).
The surface areas determined by BET showed the same rank order of surface
area however there was a greater difference between the surface areas of the
different microparticles. The BET results imply pores were introduced into the
microparticle surface by encapsulation of lactase and possibly were responsible
for acid influx into the particles. When the larger, non-spray dried lactase was
encapsulated more porous particles were formed than with the spray dried
lactase. This could explain why more non-spray dried lactase was released in
0.1N HCl.
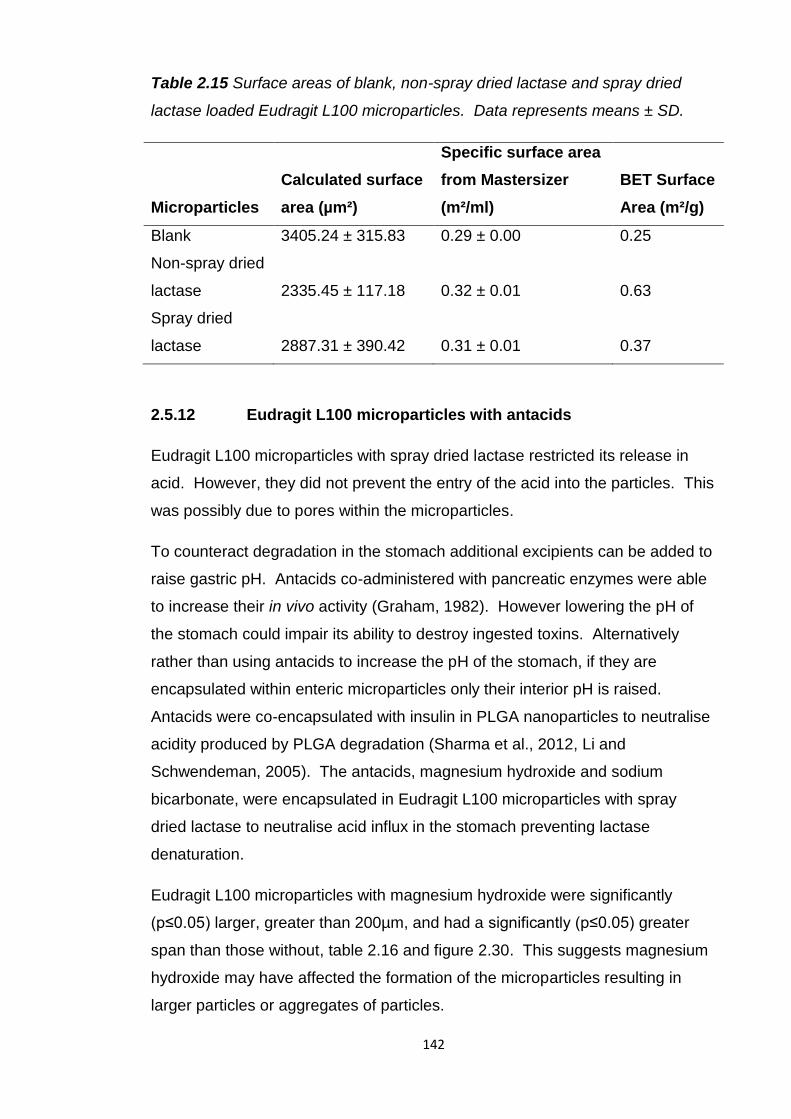
142
Table 2.15 Surface areas of blank, non-spray dried lactase and spray dried
lactase loaded Eudragit L100 microparticles. Data represents means ± SD.
Microparticles
Calculated surface
area (µm²)
Specific surface area
from Mastersizer
(m²/ml)
BET Surface
Area (m²/g)
Blank 3405.24 ± 315.83 0.29 ± 0.00 0.25
Non-spray dried
lactase 2335.45 ± 117.18 0.32 ± 0.01 0.63
Spray dried
lactase 2887.31 ± 390.42 0.31 ± 0.01 0.37
2.5.12 Eudragit L100 microparticles with antacids
Eudragit L100 microparticles with spray dried lactase restricted its release in
acid. However, they did not prevent the entry of the acid into the particles. This
was possibly due to pores within the microparticles.
To counteract degradation in the stomach additional excipients can be added to
raise gastric pH. Antacids co-administered with pancreatic enzymes were able
to increase their in vivo activity (Graham, 1982). However lowering the pH of
the stomach could impair its ability to destroy ingested toxins. Alternatively
rather than using antacids to increase the pH of the stomach, if they are
encapsulated within enteric microparticles only their interior pH is raised.
Antacids were co-encapsulated with insulin in PLGA nanoparticles to neutralise
acidity produced by PLGA degradation (Sharma et al., 2012, Li and
Schwendeman, 2005). The antacids, magnesium hydroxide and sodium
bicarbonate, were encapsulated in Eudragit L100 microparticles with spray
dried lactase to neutralise acid influx in the stomach preventing lactase
denaturation.
Eudragit L100 microparticles with magnesium hydroxide were significantly
(p≤0.05) larger, greater than 200µm, and had a significantly (p≤0.05) greater
span than those without, table 2.16 and figure 2.30. This suggests magnesium
hydroxide may have affected the formation of the microparticles resulting in
larger particles or aggregates of particles.
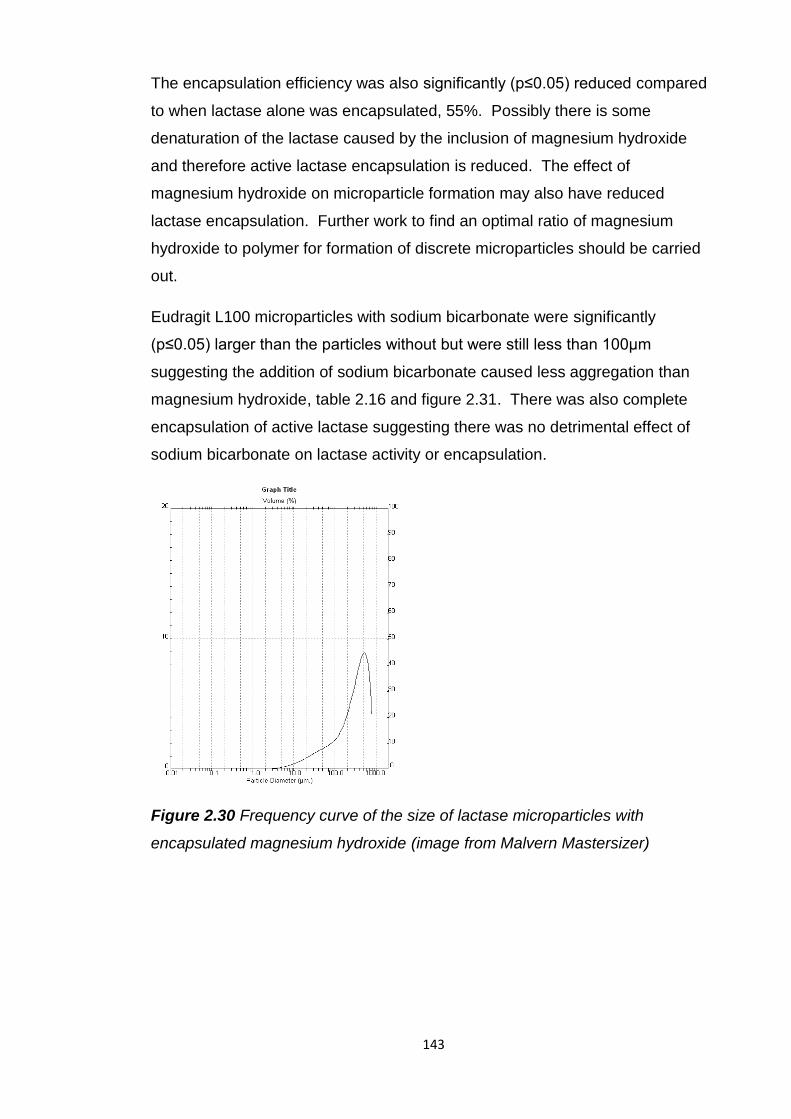
143
The encapsulation efficiency was also significantly (p≤0.05) reduced compared
to when lactase alone was encapsulated, 55%. Possibly there is some
denaturation of the lactase caused by the inclusion of magnesium hydroxide
and therefore active lactase encapsulation is reduced. The effect of
magnesium hydroxide on microparticle formation may also have reduced
lactase encapsulation. Further work to find an optimal ratio of magnesium
hydroxide to polymer for formation of discrete microparticles should be carried
out.
Eudragit L100 microparticles with sodium bicarbonate were significantly
(p≤0.05) larger than the particles without but were still less than 100µm
suggesting the addition of sodium bicarbonate caused less aggregation than
magnesium hydroxide, table 2.16 and figure 2.31. There was also complete
encapsulation of active lactase suggesting there was no detrimental effect of
sodium bicarbonate on lactase activity or encapsulation.
Figure 2.30 Frequency curve of the size of lactase microparticles with
encapsulated magnesium hydroxide (image from Malvern Mastersizer)
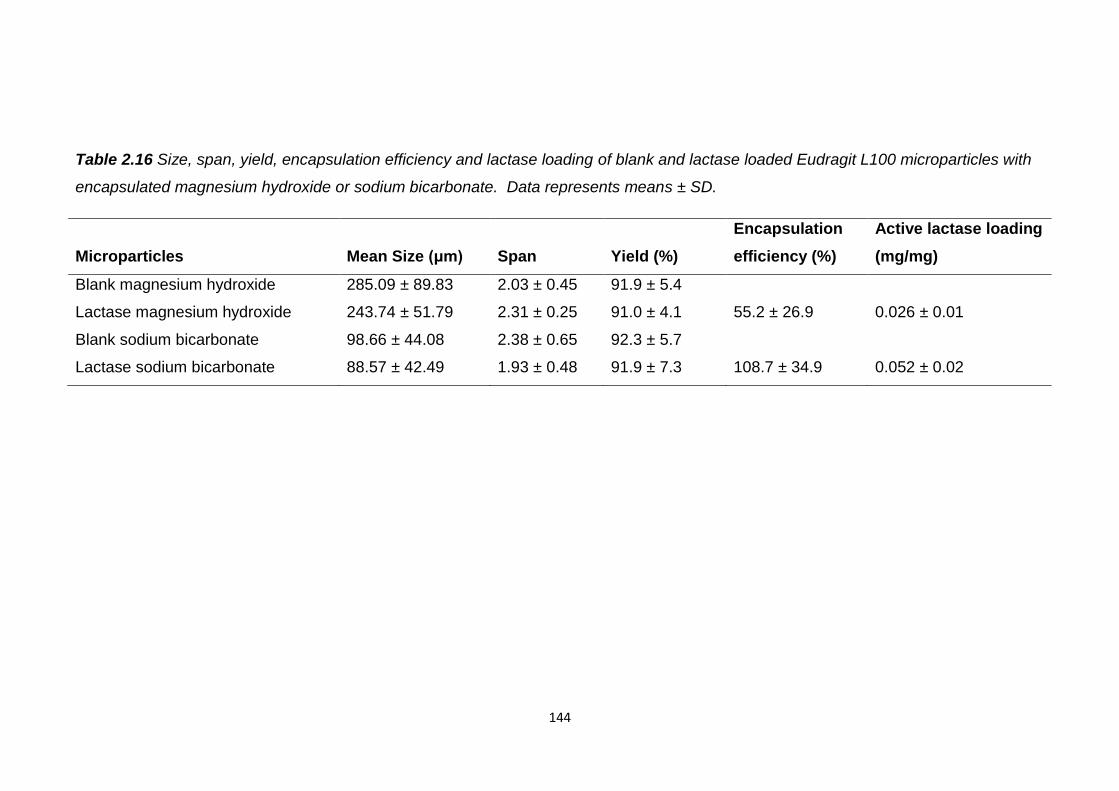
144
Table 2.16 Size, span, yield, encapsulation efficiency and lactase loading of blank and lactase loaded Eudragit L100 microparticles with
encapsulated magnesium hydroxide or sodium bicarbonate. Data represents means ± SD.
Microparticles Mean Size (μm) Span Yield (%)
Encapsulation
efficiency (%)
Active lactase loading
(mg/mg)
Blank magnesium hydroxide 285.09 ± 89.83 2.03 ± 0.45 91.9 ± 5.4
Lactase magnesium hydroxide 243.74 ± 51.79 2.31 ± 0.25 91.0 ± 4.1 55.2 ± 26.9 0.026 ± 0.01
Blank sodium bicarbonate 98.66 ± 44.08 2.38 ± 0.65 92.3 ± 5.7
Lactase sodium bicarbonate 88.57 ± 42.49 1.93 ± 0.48 91.9 ± 7.3 108.7 ± 34.9 0.052 ± 0.02
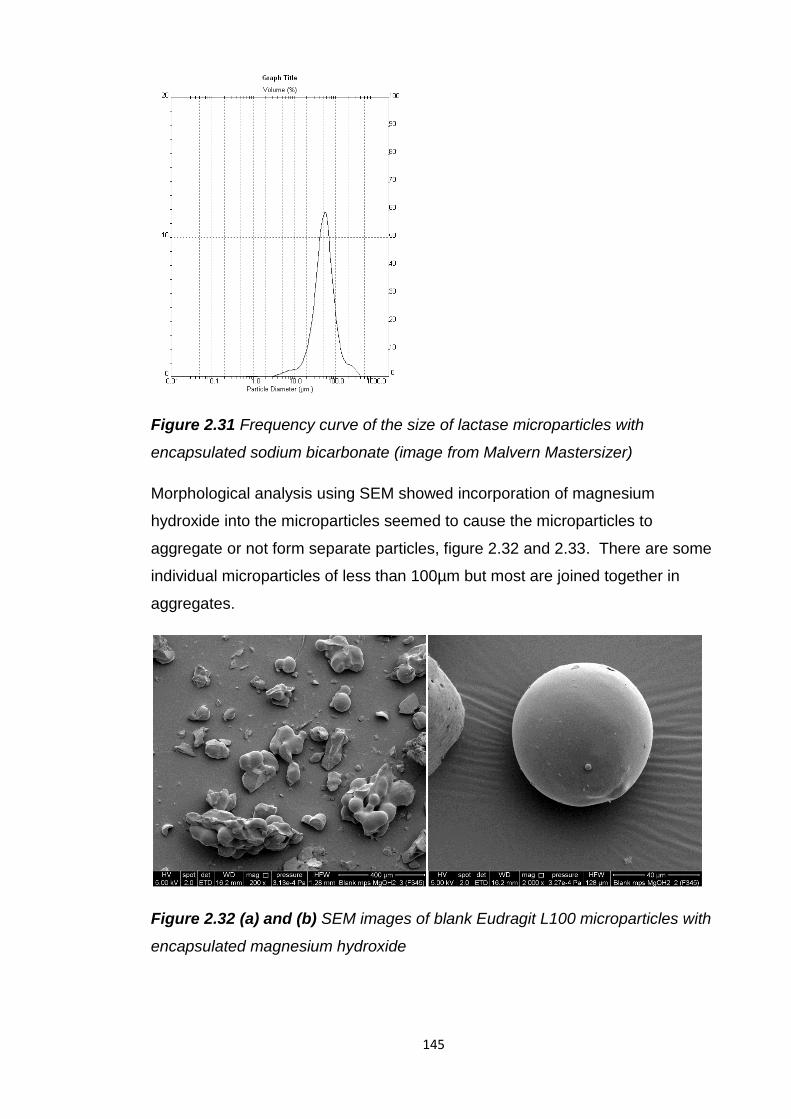
145
Figure 2.31 Frequency curve of the size of lactase microparticles with
encapsulated sodium bicarbonate (image from Malvern Mastersizer)
Morphological analysis using SEM showed incorporation of magnesium
hydroxide into the microparticles seemed to cause the microparticles to
aggregate or not form separate particles, figure 2.32 and 2.33. There are some
individual microparticles of less than 100µm but most are joined together in
aggregates.
Figure 2.32 (a) and (b) SEM images of blank Eudragit L100 microparticles with
encapsulated magnesium hydroxide
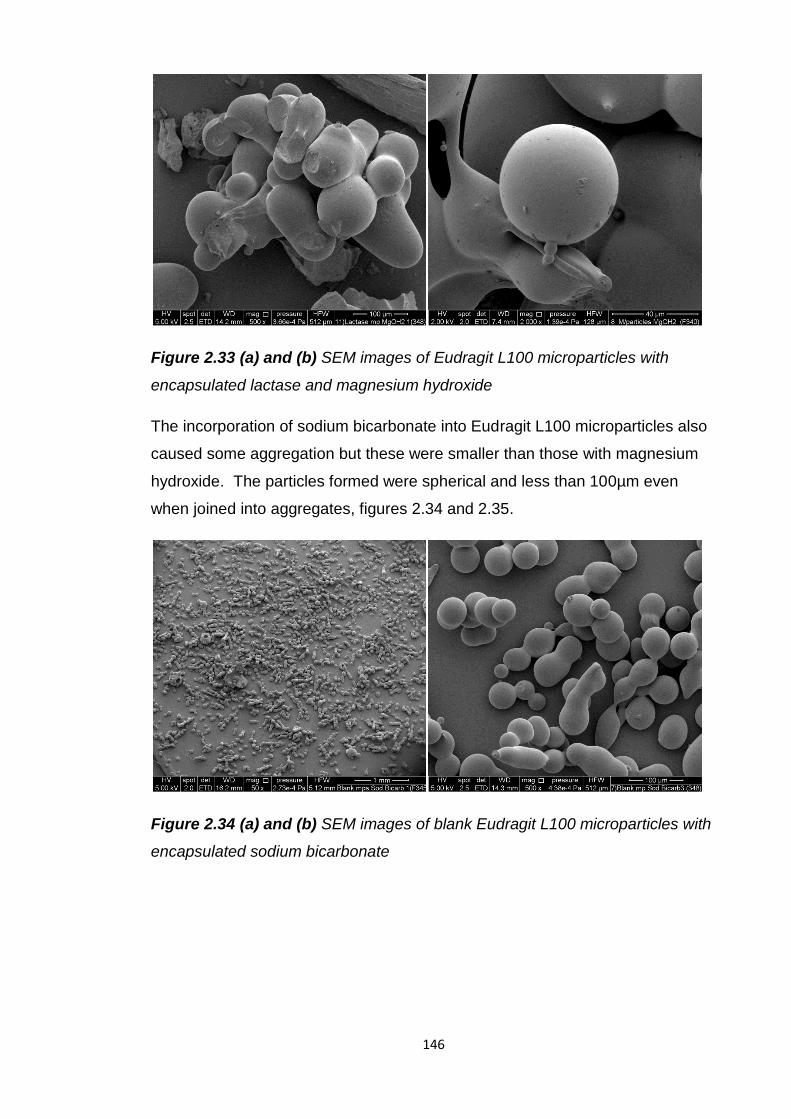
146
Figure 2.33 (a) and (b) SEM images of Eudragit L100 microparticles with
encapsulated lactase and magnesium hydroxide
The incorporation of sodium bicarbonate into Eudragit L100 microparticles also
caused some aggregation but these were smaller than those with magnesium
hydroxide. The particles formed were spherical and less than 100µm even
when joined into aggregates, figures 2.34 and 2.35.
Figure 2.34 (a) and (b) SEM images of blank Eudragit L100 microparticles with
encapsulated sodium bicarbonate
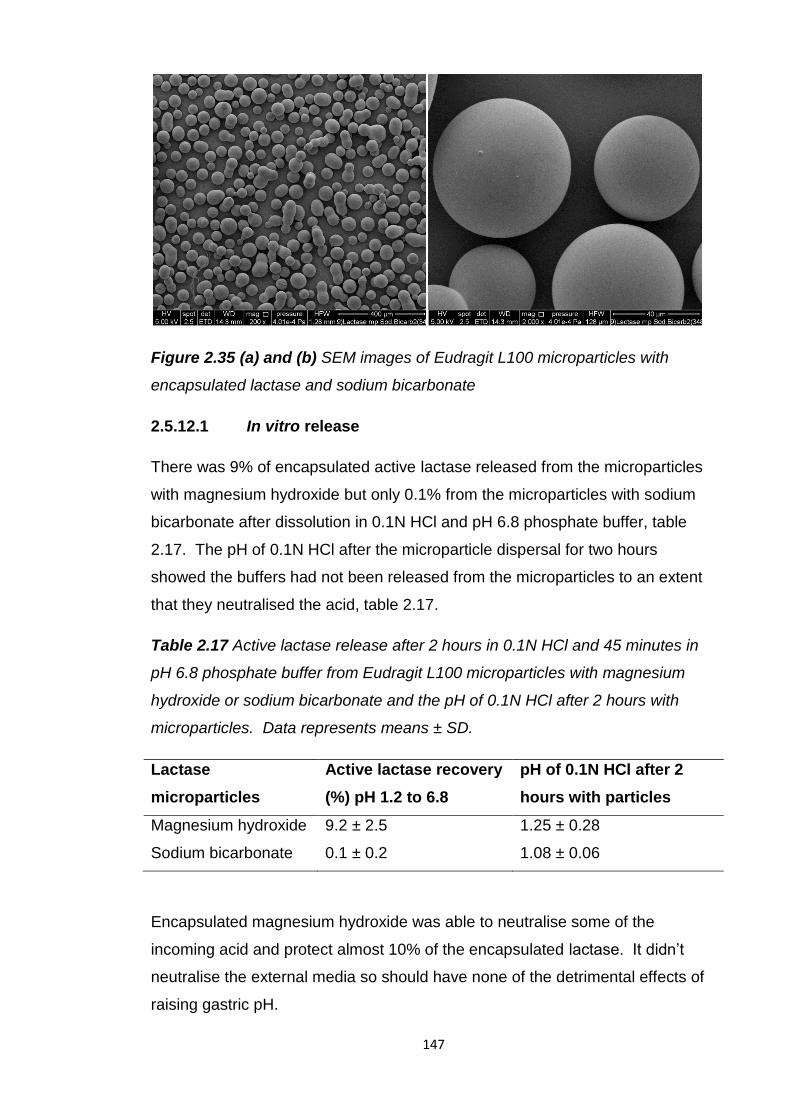
147
Figure 2.35 (a) and (b) SEM images of Eudragit L100 microparticles with
encapsulated lactase and sodium bicarbonate
2.5.12.1 In vitro release
There was 9% of encapsulated active lactase released from the microparticles
with magnesium hydroxide but only 0.1% from the microparticles with sodium
bicarbonate after dissolution in 0.1N HCl and pH 6.8 phosphate buffer, table
2.17. The pH of 0.1N HCl after the microparticle dispersal for two hours
showed the buffers had not been released from the microparticles to an extent
that they neutralised the acid, table 2.17.
Table 2.17 Active lactase release after 2 hours in 0.1N HCl and 45 minutes in
pH 6.8 phosphate buffer from Eudragit L100 microparticles with magnesium
hydroxide or sodium bicarbonate and the pH of 0.1N HCl after 2 hours with
microparticles. Data represents means ± SD.
Lactase
microparticles
Active lactase recovery
(%) pH 1.2 to 6.8
pH of 0.1N HCl after 2
hours with particles
Magnesium hydroxide 9.2 ± 2.5 1.25 ± 0.28
Sodium bicarbonate 0.1 ± 0.2 1.08 ± 0.06
Encapsulated magnesium hydroxide was able to neutralise some of the
incoming acid and protect almost 10% of the encapsulated lactase. It didn’t
neutralise the external media so should have none of the detrimental effects of
raising gastric pH.
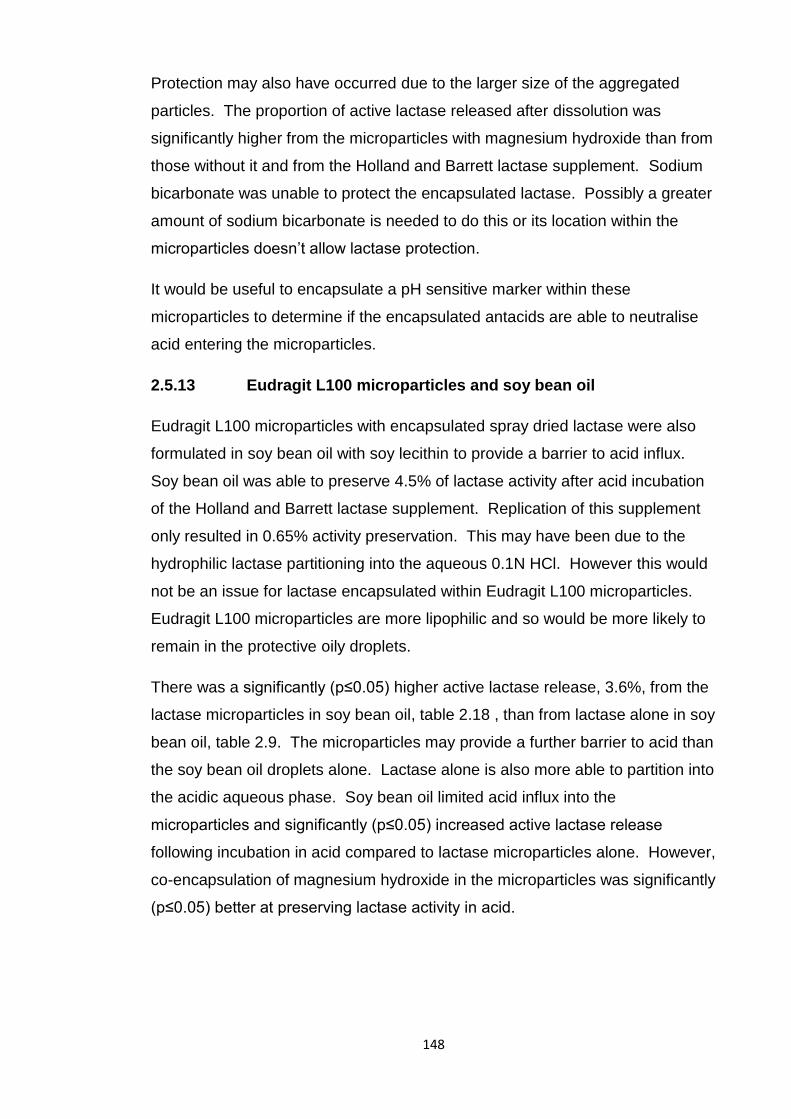
148
Protection may also have occurred due to the larger size of the aggregated
particles. The proportion of active lactase released after dissolution was
significantly higher from the microparticles with magnesium hydroxide than from
those without it and from the Holland and Barrett lactase supplement. Sodium
bicarbonate was unable to protect the encapsulated lactase. Possibly a greater
amount of sodium bicarbonate is needed to do this or its location within the
microparticles doesn’t allow lactase protection.
It would be useful to encapsulate a pH sensitive marker within these
microparticles to determine if the encapsulated antacids are able to neutralise
acid entering the microparticles.
2.5.13 Eudragit L100 microparticles and soy bean oil
Eudragit L100 microparticles with encapsulated spray dried lactase were also
formulated in soy bean oil with soy lecithin to provide a barrier to acid influx.
Soy bean oil was able to preserve 4.5% of lactase activity after acid incubation
of the Holland and Barrett lactase supplement. Replication of this supplement
only resulted in 0.65% activity preservation. This may have been due to the
hydrophilic lactase partitioning into the aqueous 0.1N HCl. However this would
not be an issue for lactase encapsulated within Eudragit L100 microparticles.
Eudragit L100 microparticles are more lipophilic and so would be more likely to
remain in the protective oily droplets.
There was a significantly (p≤0.05) higher active lactase release, 3.6%, from the
lactase microparticles in soy bean oil, table 2.18 , than from lactase alone in soy
bean oil, table 2.9. The microparticles may provide a further barrier to acid than
the soy bean oil droplets alone. Lactase alone is also more able to partition into
the acidic aqueous phase. Soy bean oil limited acid influx into the
microparticles and significantly (p≤0.05) increased active lactase release
following incubation in acid compared to lactase microparticles alone. However,
co-encapsulation of magnesium hydroxide in the microparticles was significantly
(p≤0.05) better at preserving lactase activity in acid.
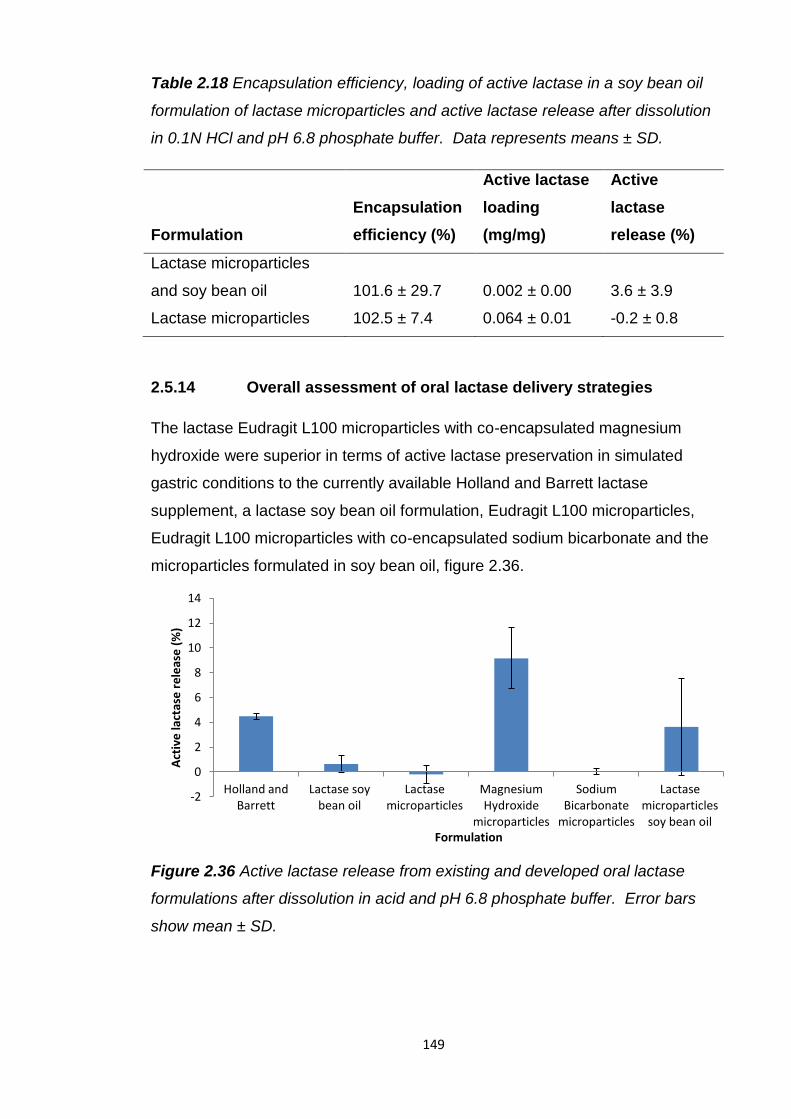
149
Table 2.18 Encapsulation efficiency, loading of active lactase in a soy bean oil
formulation of lactase microparticles and active lactase release after dissolution
in 0.1N HCl and pH 6.8 phosphate buffer. Data represents means ± SD.
Formulation
Encapsulation
efficiency (%)
Active lactase
loading
(mg/mg)
Active
lactase
release (%)
Lactase microparticles
and soy bean oil 101.6 ± 29.7 0.002 ± 0.00 3.6 ± 3.9
Lactase microparticles 102.5 ± 7.4 0.064 ± 0.01 -0.2 ± 0.8
2.5.14 Overall assessment of oral lactase delivery strategies
The lactase Eudragit L100 microparticles with co-encapsulated magnesium
hydroxide were superior in terms of active lactase preservation in simulated
gastric conditions to the currently available Holland and Barrett lactase
supplement, a lactase soy bean oil formulation, Eudragit L100 microparticles,
Eudragit L100 microparticles with co-encapsulated sodium bicarbonate and the
microparticles formulated in soy bean oil, figure 2.36.
Figure 2.36 Active lactase release from existing and developed oral lactase
formulations after dissolution in acid and pH 6.8 phosphate buffer. Error bars
show mean ± SD.
-2
0
2
4
6
8
10
12
14
Holland and Barrett
Lactase soy bean oil
Lactase microparticles
Magnesium Hydroxide
microparticles
Sodium Bicarbonate
microparticles
Lactase microparticles
soy bean oil
Act
ive
lact
ase
re
leas
e (
%)
Formulation
150
2.6 Conclusion
Investigations into the stability of lactase in simulated and porcine
gastrointestinal fluids and human faecal fluids demonstrated its instability in
acidic conditions and stability in small and large intestinal fluids. These results
confirmed protection from acid is essential for active lactase delivery to the
small intestine.
All the oral lactase supplements subjected to dissolution testing initially in acid
and then pH 6.8 phosphate buffer lost more than 95% of their initial lactase
activity. The only supplement that was able to preserve more than 1% of the
initial lactase activity after acid incubation was the Holland and Barrett soy bean
oil based formulation. The others were non-enteric, powder based formulations.
The oil may have acted as a barrier between lactase and acid preventing its
degradation. The Holland and Barrett supplement still only protected 4.5% of its
lactase. This may be due to hydrophilic lactase partitioning into the damaging
acidic aqueous fluids and not remaining in the protective soy bean oil droplets.
An attempt to recreate this formulation resulted in inferior lactase protection to
the original supplement. This may have been due to a lack of some elements of
the original formulation and non-optimised excipient ratios.
Due to the acid sensitivity of lactase and the low protection offered by the oil
based formulation enteric formulations were investigated. Enteric coated
lactase tablets completely preserved lactase activity during two hours
incubation at pH 1.2. Active lactase release upon pH rise to pH 6.8 was not
immediate, no lactase was released during the first 10 minutes and was only
completely released after 30 minutes. This release rate may not be rapid
enough to prevent lactose persistence and fermentation. A slow release rate
has previously been reported for enteric coated pancreatin tablets and a
reduction in dosage form size was found to be beneficial for faster release and
greater alleviation of symptoms (Aloulou et al., 2008, Beverley et al., 1987,
Naikwade et al., 2009).
Eudragit L100 microparticles encapsulating lactase were produced using a
slightly different method (Kendall et al., 2009) to those previously used to
formulate lactase (Alavi et al., 2002, Squillante et al., 2003).
151
Smaller microparticles with an increased encapsulation efficiency and no loss of
lactase activity were produced. This method, previously used to encapsulate
only low molecular weight drugs, demonstrated its suitability and superiority
over previously used methods to encapsulate macromolecules, such as protein
and peptide drugs.
However, following pH shift dissolution from pH 1.2 to pH 6.8 there was no
active lactase release. It was thought this occurred due to lactase being burst
released prematurely into the acid and destroyed. At pH 4.5, below the pH 6
threshold of the polymer, there was a burst release of 64% of the lactase. To
overcome this lactase was spray dried to reduce its particle size. This reduced
the burst release of lactase to 8% at pH 4.5 and fluorescently labelled spray
dried lactase was shown to be encapsulated within the microparticles and not
just at the surface. However after dissolution initially in 0.1N HCl there was still
no active lactase released. More than 90% of the encapsulated lactase is not
released below pH 6 so therefore the acid may be able to enter the
microparticles.
A marker encapsulated in the microparticles showed acid influx into the
particles by a shift in its emission wavelength. SEM images showed pores in
some of the particles, which had not been sputter coated, which could explain
the burst release of some of the encapsulated lactase. However this doesn’t
explain the complete loss of lactase activity. Visualisation using an SEM with a
new type of back scatter secondary electron detector and low voltage beam
revealed small surface structures on the microparticles which disappeared upon
acid incubation. Currently it is not possible to determine the identity of these
structures. Possibly their disappearance in acid is linked to acid ingress.
Visualisation of cryosections of the microparticles showed a porous interior
which may provide a route by which acid can come into contact with
encapsulated lactase.
Surface area analysis of the microparticles suggested encapsulation of lactase
increased their porosity. The particles with non-spray dried lactase were more
porous than those with spray dried lactase which may explain why more of this
lactase was burst released in acid.
152
To neutralise acid entering the microparticles the antacids sodium bicarbonate
and magnesium hydroxide were co-encapsulated with lactase in Eudragit L100
microparticles. This increased the size of the microparticles and, with
magnesium hydroxide especially, caused aggregation of the microparticles.
Sodium bicarbonate was only able to preserve 0.1% of the encapsulated
lactase after dissolution in acid initially. Magnesium hydroxide however was
able to protect 9.2% of the encapsulated lactase. It achieved this without
neutralising the external acid demonstrating its potential as an oral delivery
strategy that would not impair the acidic barrier of the stomach.
The microparticles were also formulated in soy bean oil to limit acid influx.
There was a 3.6% recovery of active lactase after dissolution from pH 1.2 to
6.8. This is more than for lactase alone in soybean oil. Possibly this is because
there are now two barriers between lactase and acid. Additionally lactase is
more hydrophilic than the Eudragit L100 microparticles so is more likely to
partition from the protective oily phase into the acidic aqueous phase.
Eudragit L100 microparticles with co-encapsulated magnesium hydroxide were
superior in terms of active lactase preservation in simulated gastric conditions to
the currently available Holland and Barrett lactase supplement and the other
oral formulations tested. However even this formulation only preserved
approximately 9% of the activity of encapsulated lactase after dissolution in
acid. While this is significantly inferior to the protection offered by enteric
tablets the benefits these microparticles offer in terms of rapid gastric emptying
and enzyme release make them worth further development. Future success of
this Eudragit L100 microparticle formulation is dependent on overcoming or
eliminating permeability to acid.

153
Chapter 3
Investigation of the intestinal stability of insulin
and development of is oral formulations
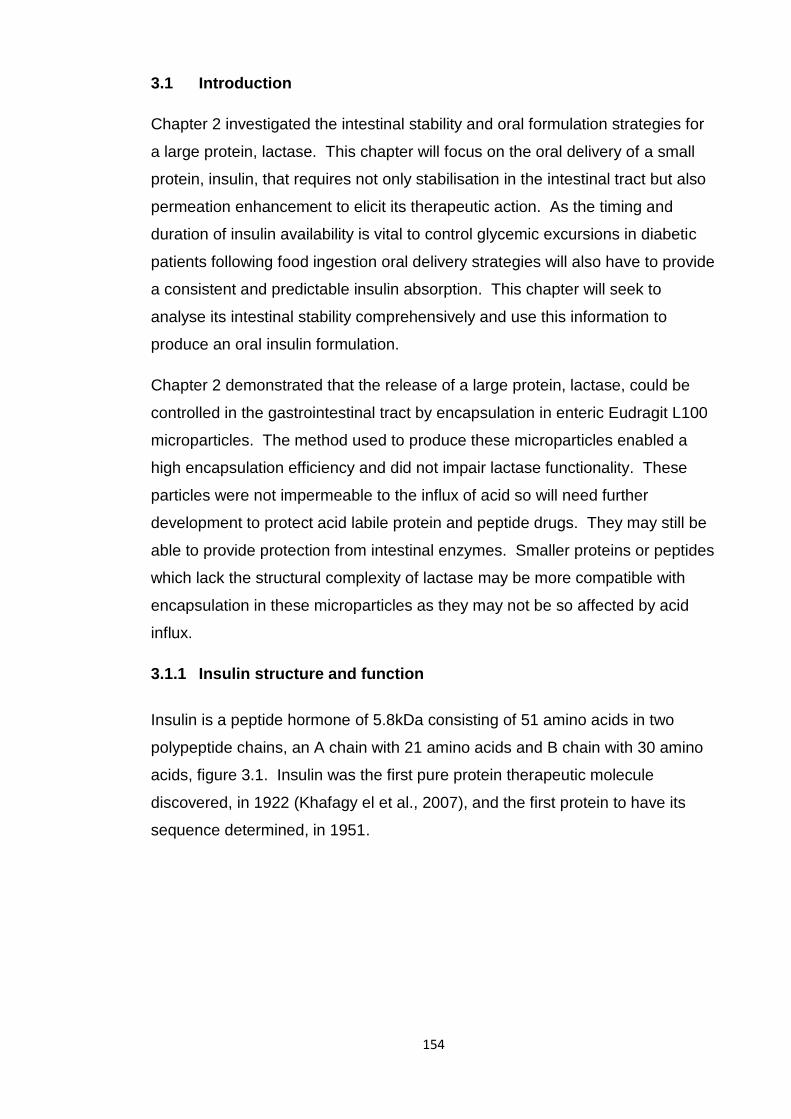
154
3.1 Introduction
Chapter 2 investigated the intestinal stability and oral formulation strategies for
a large protein, lactase. This chapter will focus on the oral delivery of a small
protein, insulin, that requires not only stabilisation in the intestinal tract but also
permeation enhancement to elicit its therapeutic action. As the timing and
duration of insulin availability is vital to control glycemic excursions in diabetic
patients following food ingestion oral delivery strategies will also have to provide
a consistent and predictable insulin absorption. This chapter will seek to
analyse its intestinal stability comprehensively and use this information to
produce an oral insulin formulation.
Chapter 2 demonstrated that the release of a large protein, lactase, could be
controlled in the gastrointestinal tract by encapsulation in enteric Eudragit L100
microparticles. The method used to produce these microparticles enabled a
high encapsulation efficiency and did not impair lactase functionality. These
particles were not impermeable to the influx of acid so will need further
development to protect acid labile protein and peptide drugs. They may still be
able to provide protection from intestinal enzymes. Smaller proteins or peptides
which lack the structural complexity of lactase may be more compatible with
encapsulation in these microparticles as they may not be so affected by acid
influx.
3.1.1 Insulin structure and function
Insulin is a peptide hormone of 5.8kDa consisting of 51 amino acids in two
polypeptide chains, an A chain with 21 amino acids and B chain with 30 amino
acids, figure 3.1. Insulin was the first pure protein therapeutic molecule
discovered, in 1922 (Khafagy el et al., 2007), and the first protein to have its
sequence determined, in 1951.
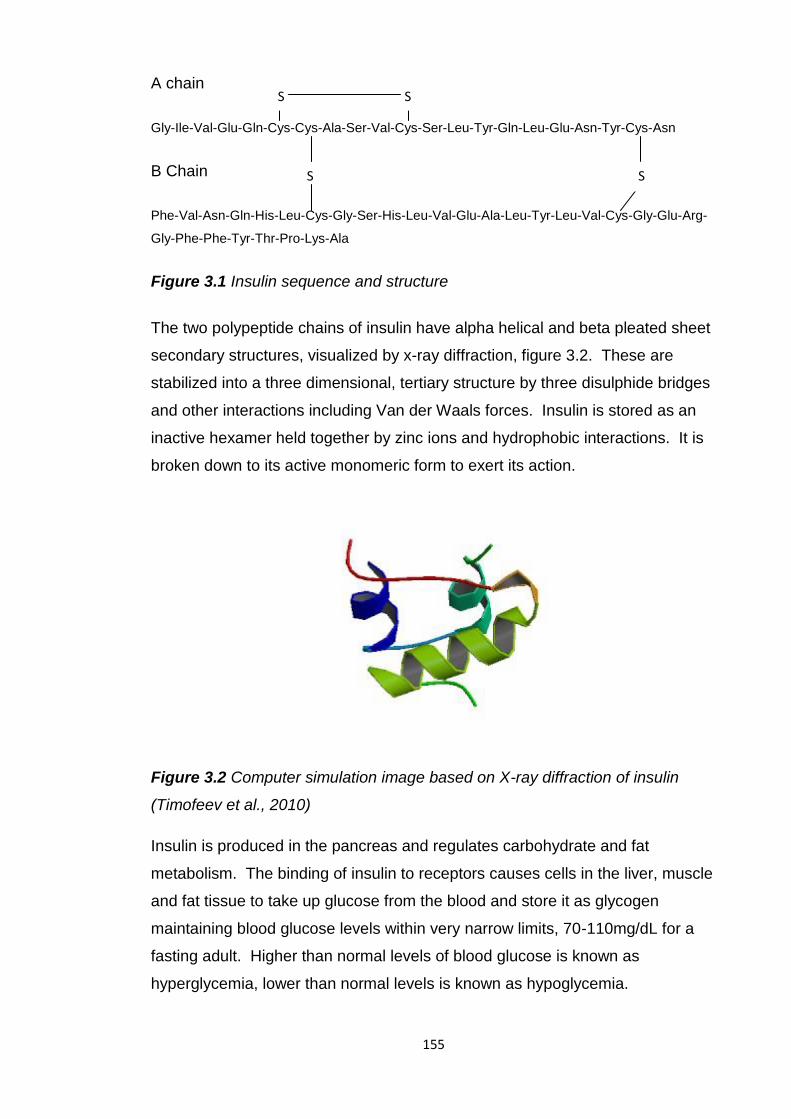
155
A chain
Gly-Ile-Val-Glu-Gln-Cys-Cys-Ala-Ser-Val-Cys-Ser-Leu-Tyr-Gln-Leu-Glu-Asn-Tyr-Cys-Asn
B Chain
Phe-Val-Asn-Gln-His-Leu-Cys-Gly-Ser-His-Leu-Val-Glu-Ala-Leu-Tyr-Leu-Val-Cys-Gly-Glu-Arg-
Gly-Phe-Phe-Tyr-Thr-Pro-Lys-Ala
Figure 3.1 Insulin sequence and structure
The two polypeptide chains of insulin have alpha helical and beta pleated sheet
secondary structures, visualized by x-ray diffraction, figure 3.2. These are
stabilized into a three dimensional, tertiary structure by three disulphide bridges
and other interactions including Van der Waals forces. Insulin is stored as an
inactive hexamer held together by zinc ions and hydrophobic interactions. It is
broken down to its active monomeric form to exert its action.
Figure 3.2 Computer simulation image based on X-ray diffraction of insulin
(Timofeev et al., 2010)
Insulin is produced in the pancreas and regulates carbohydrate and fat
metabolism. The binding of insulin to receptors causes cells in the liver, muscle
and fat tissue to take up glucose from the blood and store it as glycogen
maintaining blood glucose levels within very narrow limits, 70-110mg/dL for a
fasting adult. Higher than normal levels of blood glucose is known as
hyperglycemia, lower than normal levels is known as hypoglycemia.
S S
S S
156
When the control of insulin on blood glucose levels fails it results in diabetes.
This is characterized by persistent hyperglycemia and is life threatening. Type
1 diabetics no longer produce insulin and type 2 diabetes results from
resistance of cells to insulin and insufficient insulin production by the pancreas.
Type 1 diabetics rely on daily administration of exogenous insulin to reduce
dangerously high blood glucose levels and stay alive. It is estimated more than
30 million people globally have type 1 diabetes. Type 2 diabetics are not
dependent on insulin but more than 40% use it to maintain blood glucose levels.
The global insulin market was estimated to be worth approximately $12 billion in
2011.
3.1.2 Current administration of insulin
Insulin is currently available only as an injectable in the US and Europe.
Generally insulin is self administered subcutaneously, rarely intramuscularly or
intravenously. An insulin dosage regimen is tailored individually to suit
particular diets and lifestyles. There are various forms of insulin available with
rapid, intermediate and long lasting action. These forms can be used in
combination to provide the best maintenance of blood glucose levels.
The parenteral route is not ideal due to the stress, pain, non-compliance, risks
and cost issues of injections. The chronic nature of insulin injections for the
treatment of diabetes can cause local hypertrophy and fat deposition at the
injection site. Insulin injections can also cause hyperinsulinemia, hypoglycemia
and weight gain.
Reformulation of insulin to provide alternative, non-parenteral medicines has
been and continues to be a popular research topic due to the negatives
associated with injections and the large number of users. Recombinant DNA
has aided this process as large amounts of insulin can now be made. Pfizer, in
collaboration with Nektar Therapeutics, delivered the first non parenteral insulin
formulation to the EU and US market in 2006, Exubera, an inhaled form of
insulin for pulmonary delivery. However there was insufficient market uptake
and withdrawal by Pfizer in 2007. Its lack of acceptance may have been due to
difficulties with accurate dosing and the need to still inject insulin to maintain a
basal insulin level due to Exubera’s short action.
157
A buccally delivered insulin, Oral-lyn, which is administered into the mouth by a
spray (RapidMist device) has been developed by Generex and is available for
treatment of type 1 and 2 diabetes in some countries, including India, but not
the US or Europe. Insulin delivered by this system is absorbed from the buccal
mucosa so does not have to overcome the delivery challenges of the GI tract.
3.1.3 Oral insulin
As well as the benefits of oral delivery over parenteral in terms of compliance,
ease of use and costs oral delivery of insulin is advantageous as it is a more
physiological delivery route than that by subcutaneous injection. Orally
delivered insulin would be absorbed from the GI tract into the portal vein, its
delivery to the liver and binding to receptors there mimicking the normal
physiologic route of insulin. Orally delivered insulin may also reduce the risks of
hypoglycemia seen with subcutaneously delivered insulin due to a reduced
systemic exposure.
Attempts at oral insulin delivery initiated by Dr Joslin soon after its discovery in
1922 have been reported in oral insulin reviews (Heinemann and Jacques,
2009, Kalra et al., 2010). These trials had to be halted due to lack of metabolic
control, possibly due to its low oral bioavailability. Oral delivery of insulin may
also pose some risks as it is a known mitogen. Due to the frequency of insulin
administration the effects of excipients of its oral formulations would also have
to be considered.
3.1.4 Barriers to oral delivery
The oral bioavailability of insulin in rats was found to be less than 1% (Takeuchi
et al., 1996, Tozaki et al., 2001). This is a result of poor intestinal stability and
permeability.
Insulin was degraded in gastric conditions, only 0-10% remained intact after 5
minutes incubation in simulated gastric fluid (SGF) with pepsin (Jain et al.,
2012, Han et al., 2012, Qi and Ping, 2004, Makhlof et al., 2011b) and was
completely degraded in 3 minutes in gastric fluid from a pig (Werle et al., 2008).
Insulin is soluble and stable in weak acids so it may not be the acidic pH of
these fluids causing its degradation but pepsin as insulin contains several
peptide bonds which would be vulnerable to pepsin digestion.
158
Insulin was also vulnerable to small intestinal enzymes. Only 10% remained
intact after two hours incubation in simulated intestinal fluid with pancreatin
(Jain et al., 2012). Of the three main luminally secreted intestinal enzymes
insulin was most vulnerable to chymotrypsin and was completely degraded by it
within 15 minutes (Werle et al., 2008). Insulin was more stable with trypsin and
elastase. After three hours 92.5% of insulin remained intact with trypsin
(Schilling and Mitra, 1991) and 35% remained intact with elastase (Werle et al.,
2008). In porcine small intestinal fluids insulin was completely degraded within
a few minutes due to the combined digestive effects of these enzymes (Werle et
al., 2008).
Despite the reduced proteolytic activity of the large intestine insulin was found
to be vulnerable to degradation here. It was degraded in rat cecal contents with
a degradation half life of 34 minutes (Tozaki et al., 1997, Tozaki et al., 1995).
Its degradation is due to microbial enzymes and fermentation. Any oral insulin
targeted to the colon would have to overcome this.
The intestinal permeability of insulin is limited by its large size, limiting its
paracellular uptake, and its hydrophilicity limiting its passive, transcellular
transport. Insulin absorption from the intestinal segments of a rat was found to
be greatest from the ileum, then the duodenum and least from the jejunum (Han
et al., 2012). These differences in absorption may be due to reduced proteolytic
activity in the ileum and the presence of M cells in Peyer’s patches which are a
portal for macromolecule uptake. The thick mucus covering the cells in the
jejunum may have reduced insulin absorption.
3.1.5 Oral insulin delivery strategies
The oral delivery strategies described in chapter 1 have been widely explored
for the oral delivery of insulin. Representative examples of these strategies and
their in vitro/in vivo effects are presented in table 3.1.
While these strategies increased oral insulin pharmacological availability and
efficacy compared to an insulin solution from negligible levels, their relative
availabilities compared to subcutaneous insulin were less than 15% if used
exclusively.
159
When strategies were combined, as with ligand attachment to insulin-loaded
nanoparticles, oral insulin availability increased above 20% (Chalasani et al.,
2007, Petrus et al., 2007, Jain et al., 2012). These strategies can disrupt
normal digestive processes and possibly enable absorption of potentially
harmful molecules so the long term effects of administering them chronically
needs to be considered.
3.1.6 Commercial oral insulin delivery
Despite extensive research very few strategies have been tested in humans.
Clinical data may not have been published due to the competitive nature of oral
insulin formulation development. The strategies that have progressed furthest
clinically are those that have been or are being pursued by companies, table
3.2.
The oral insulin formulations that have progressed furthest clinically are those of
Diabetology (Kalra et al., 2010, Luzio et al., 2010), Emisphere (Heise et al.,
2004), Biocon (Kalra et al., 2010, Khedkar et al., 2010), Oramed (Kidron et al.,
2008, Eldor et al., 2010a) and Diasome (Schwartz et al., 2008). These
strategies have demonstrated safety and tolerability in phase I and II clinical
trials and increased insulin levels and reduced glucose levels in healthy, type 1
or type 2 diabetic volunteers. They produced relative bioavailabilities of
between 5 and 10% relative to subcutaneous insulin and glucose reductions of
7-55% (Kidron et al., 2008, Eldor et al., 2010a, Kalra et al., 2010, Khedkar et al.,
2010, Luzio et al., 2010, Heise et al., 2004). The high number of discontinued
projects is usually the result of poor metabolic control.
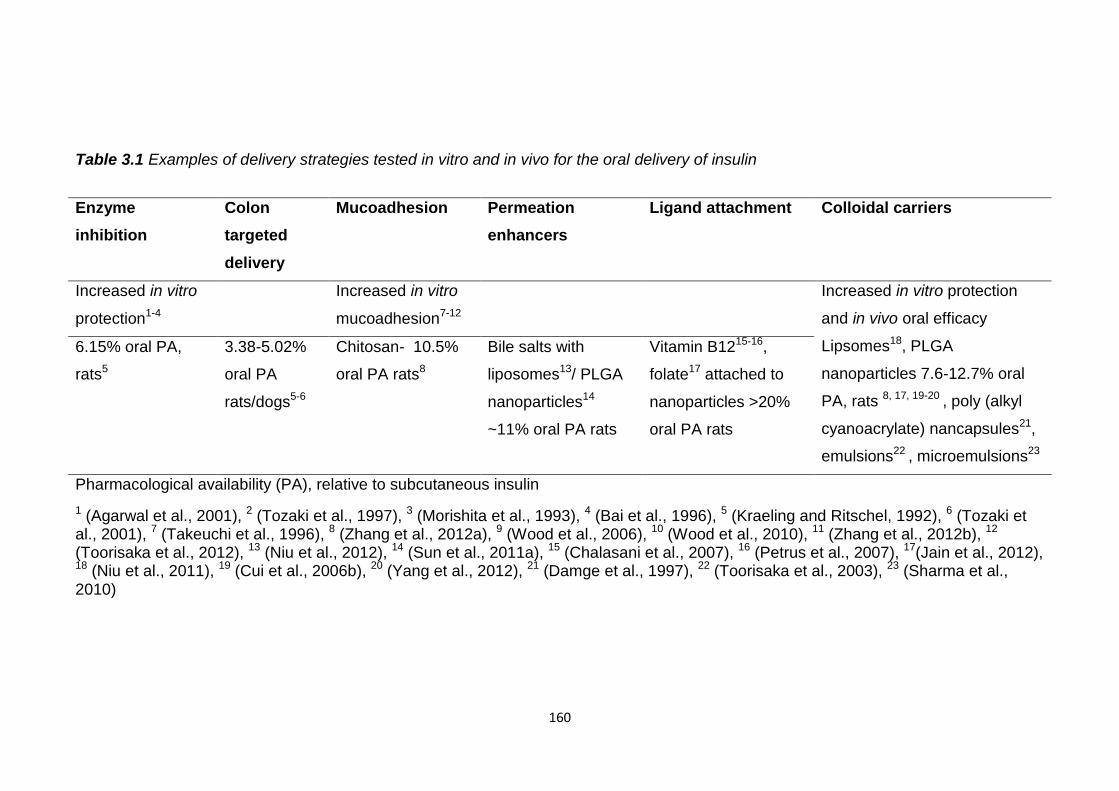
160
Table 3.1 Examples of delivery strategies tested in vitro and in vivo for the oral delivery of insulin
Pharmacological availability (PA), relative to subcutaneous insulin
1 (Agarwal et al., 2001), 2 (Tozaki et al., 1997), 3 (Morishita et al., 1993), 4 (Bai et al., 1996), 5 (Kraeling and Ritschel, 1992), 6 (Tozaki et al., 2001), 7 (Takeuchi et al., 1996), 8 (Zhang et al., 2012a), 9 (Wood et al., 2006), 10 (Wood et al., 2010), 11 (Zhang et al., 2012b), 12 (Toorisaka et al., 2012), 13 (Niu et al., 2012), 14 (Sun et al., 2011a), 15 (Chalasani et al., 2007), 16 (Petrus et al., 2007), 17(Jain et al., 2012), 18 (Niu et al., 2011), 19 (Cui et al., 2006b), 20 (Yang et al., 2012), 21 (Damge et al., 1997), 22 (Toorisaka et al., 2003), 23 (Sharma et al., 2010)
Enzyme
inhibition
Colon
targeted
delivery
Mucoadhesion Permeation
enhancers
Ligand attachment Colloidal carriers
Increased in vitro
protection1-4
Increased in vitro
mucoadhesion7-12
Increased in vitro protection
and in vivo oral efficacy
Lipsomes18, PLGA
nanoparticles 7.6-12.7% oral
PA, rats 8, 17, 19-20 , poly (alkyl
cyanoacrylate) nancapsules21,
emulsions22 , microemulsions23
6.15% oral PA,
rats5
3.38-5.02%
oral PA
rats/dogs5-6
Chitosan- 10.5%
oral PA rats8
Bile salts with
liposomes13/ PLGA
nanoparticles14
~11% oral PA rats
Vitamin B1215-16,
folate17 attached to
nanoparticles >20%
oral PA rats
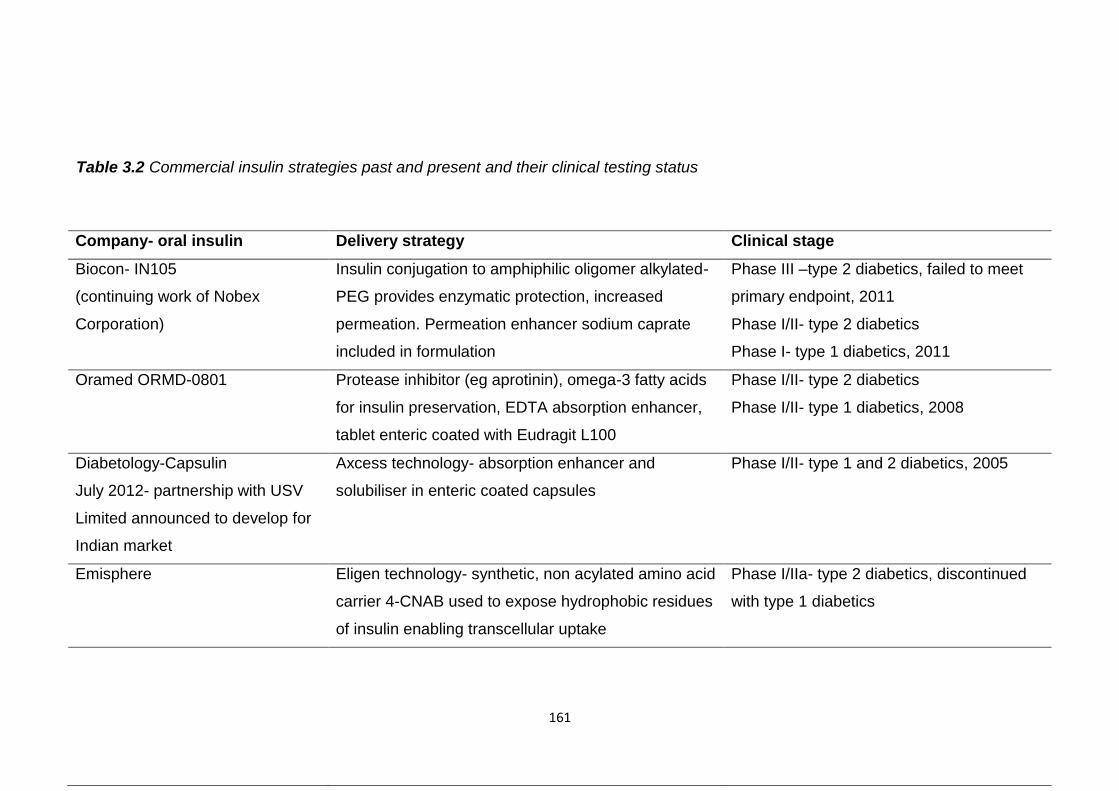
161
Company- oral insulin Delivery strategy Clinical stage
Biocon- IN105
(continuing work of Nobex
Corporation)
Insulin conjugation to amphiphilic oligomer alkylated-
PEG provides enzymatic protection, increased
permeation. Permeation enhancer sodium caprate
included in formulation
Phase III –type 2 diabetics, failed to meet
primary endpoint, 2011
Phase I/II- type 2 diabetics
Phase I- type 1 diabetics, 2011
Oramed ORMD-0801 Protease inhibitor (eg aprotinin), omega-3 fatty acids
for insulin preservation, EDTA absorption enhancer,
tablet enteric coated with Eudragit L100
Phase I/II- type 2 diabetics
Phase I/II- type 1 diabetics, 2008
Diabetology-Capsulin
July 2012- partnership with USV
Limited announced to develop for
Indian market
Axcess technology- absorption enhancer and
solubiliser in enteric coated capsules
Phase I/II- type 1 and 2 diabetics, 2005
Emisphere Eligen technology- synthetic, non acylated amino acid
carrier 4-CNAB used to expose hydrophobic residues
of insulin enabling transcellular uptake
Phase I/IIa- type 2 diabetics, discontinued
with type 1 diabetics
Table 3.2 Commercial insulin strategies past and present and their clinical testing status
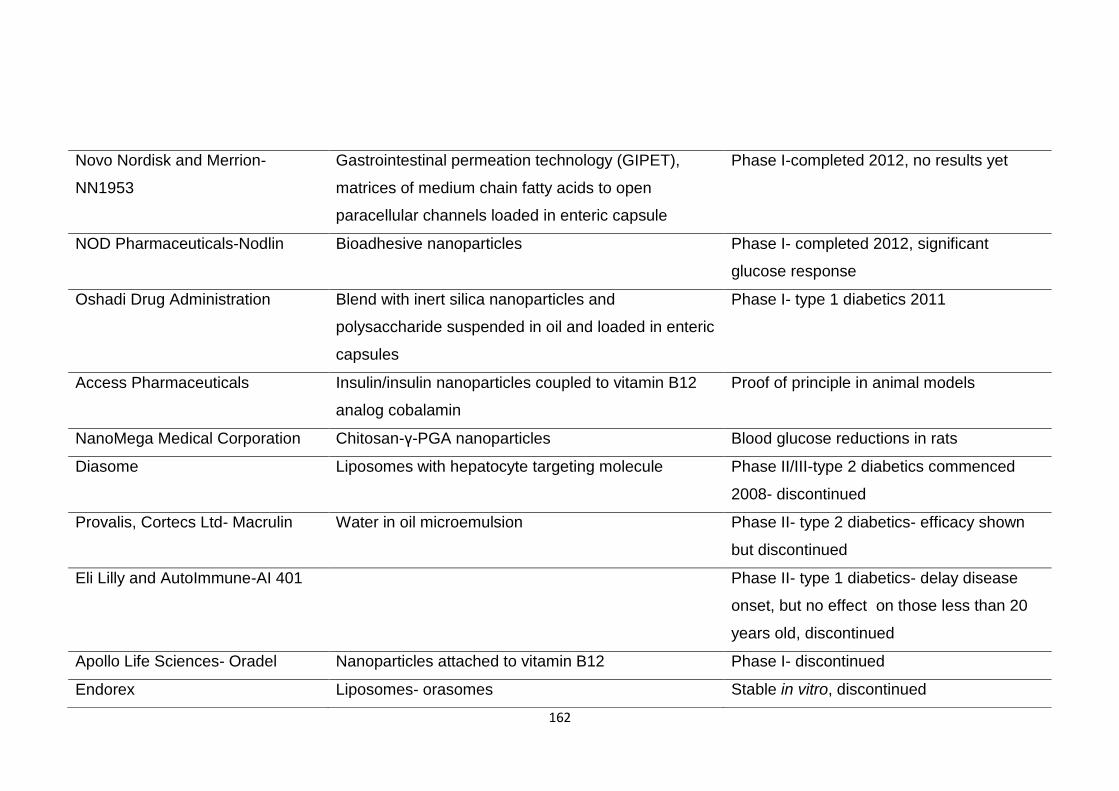
162
Novo Nordisk and Merrion-
NN1953
Gastrointestinal permeation technology (GIPET),
matrices of medium chain fatty acids to open
paracellular channels loaded in enteric capsule
Phase I-completed 2012, no results yet
NOD Pharmaceuticals-Nodlin Bioadhesive nanoparticles Phase I- completed 2012, significant
glucose response
Oshadi Drug Administration Blend with inert silica nanoparticles and
polysaccharide suspended in oil and loaded in enteric
capsules
Phase I- type 1 diabetics 2011
Access Pharmaceuticals Insulin/insulin nanoparticles coupled to vitamin B12
analog cobalamin
Proof of principle in animal models
NanoMega Medical Corporation Chitosan-γ-PGA nanoparticles Blood glucose reductions in rats
Diasome Liposomes with hepatocyte targeting molecule Phase II/III-type 2 diabetics commenced
2008- discontinued
Provalis, Cortecs Ltd- Macrulin Water in oil microemulsion Phase II- type 2 diabetics- efficacy shown
but discontinued
Eli Lilly and AutoImmune-AI 401 Phase II- type 1 diabetics- delay disease
onset, but no effect on those less than 20
years old, discontinued
Apollo Life Sciences- Oradel Nanoparticles attached to vitamin B12 Phase I- discontinued
Endorex Liposomes- orasomes Stable in vitro, discontinued
163
Only the formulations of Diasome and Biocon have reached phase III clinical
trials. The results of Diasome’s trials have not been reported and there has
been no news of this project since 2009. Biocon’s recent phase III trial with
type 2 diabetics failed to meet its primary goal of lowering HbA1c levels by 0.7%
relative to a placebo. This is a marker of average plasma glucose levels over
time. It is thought this may not necessarily be due to a lack of efficacy but
behavioural modifications of those taking the placebo. It did however produce a
statistical reduction in post prandial glucose levels and this project is still being
pursued.
High inter subject variability of insulin absorption has been commonly observed
during clinical trials and been seen with the formulations of Biocon (Kalra et al.,
2010, Khedkar et al., 2010), Emisphere (Heise et al., 2004) and Diabetology
(Whitelow et al., 2005). This could result in inconsistent blood glucose control.
This may be due to the inter-individual GI variability, intra individual variation in
insulin absorption has not been explored.
Necessarily to fulfil its function insulin must be administered usually before,
rarely after, food. Food ingestion hampered the oral efficacy of the formulations
of Biocon (Khedkar et al., 2010), Emisphere and Diasome (Blair Geho et al.,
2009) increasing glycemic excursions. Possibly they are delayed in the
stomach where degradation may occur, if not enteric coated, and arrival in the
small intestine is postponed. Timing of administration, with regards food
ingestion, should be optimised to minimise absorption delays but also to ensure
it is present at therapeutic levels following a meal.
Onset of insulin absorption and subsequent blood glucose reduction was
affected by enteric coating. Enteric coated formulations of Oramed and
Diabetology had a much slower and prolonged insulin absorption and glucose
reduction than the non-enteric formulations of Biocon and Emisphere. This
could be due to a gradual rather than immediate dissolution of the coating.
Insulin levels increased following administration of the enteric formulations 80 to
250 minutes post dosing and glucose levels were still reducing after seven
hours (Kidron et al., 2008, Eldor et al., 2010a, Kidron et al., 2009, Whitelow et
al., 2005).
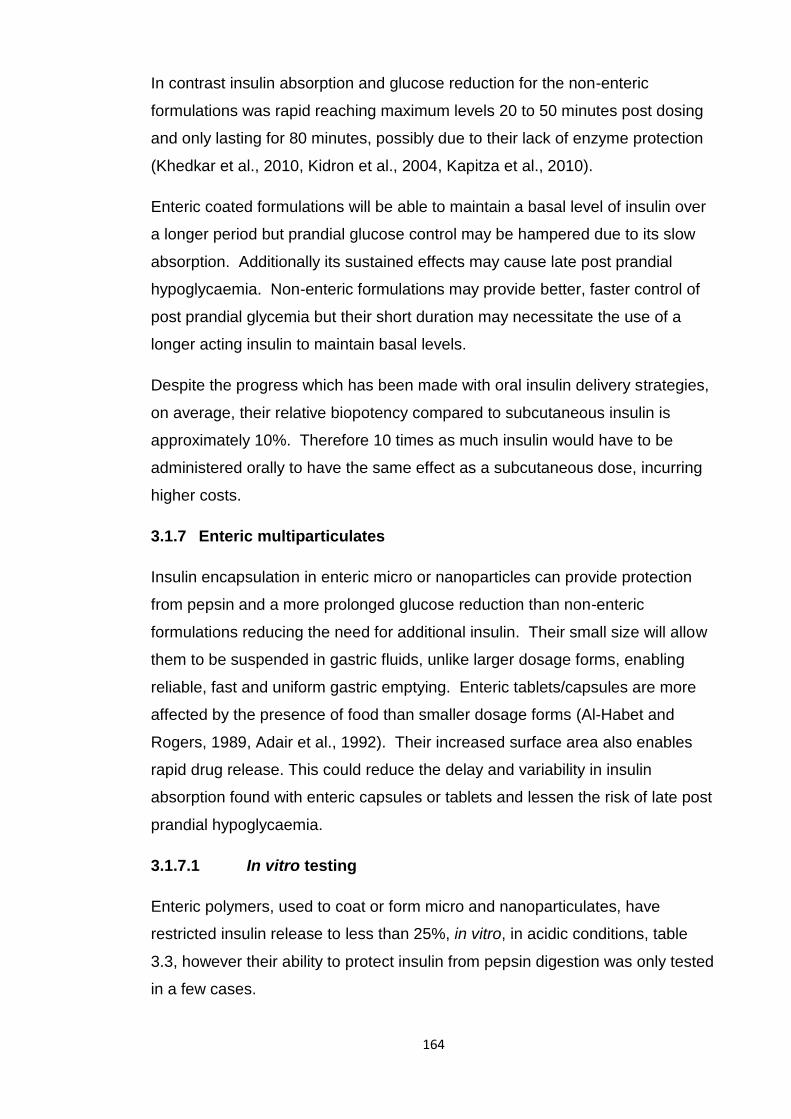
164
In contrast insulin absorption and glucose reduction for the non-enteric
formulations was rapid reaching maximum levels 20 to 50 minutes post dosing
and only lasting for 80 minutes, possibly due to their lack of enzyme protection
(Khedkar et al., 2010, Kidron et al., 2004, Kapitza et al., 2010).
Enteric coated formulations will be able to maintain a basal level of insulin over
a longer period but prandial glucose control may be hampered due to its slow
absorption. Additionally its sustained effects may cause late post prandial
hypoglycaemia. Non-enteric formulations may provide better, faster control of
post prandial glycemia but their short duration may necessitate the use of a
longer acting insulin to maintain basal levels.
Despite the progress which has been made with oral insulin delivery strategies,
on average, their relative biopotency compared to subcutaneous insulin is
approximately 10%. Therefore 10 times as much insulin would have to be
administered orally to have the same effect as a subcutaneous dose, incurring
higher costs.
3.1.7 Enteric multiparticulates
Insulin encapsulation in enteric micro or nanoparticles can provide protection
from pepsin and a more prolonged glucose reduction than non-enteric
formulations reducing the need for additional insulin. Their small size will allow
them to be suspended in gastric fluids, unlike larger dosage forms, enabling
reliable, fast and uniform gastric emptying. Enteric tablets/capsules are more
affected by the presence of food than smaller dosage forms (Al-Habet and
Rogers, 1989, Adair et al., 1992). Their increased surface area also enables
rapid drug release. This could reduce the delay and variability in insulin
absorption found with enteric capsules or tablets and lessen the risk of late post
prandial hypoglycaemia.
3.1.7.1 In vitro testing
Enteric polymers, used to coat or form micro and nanoparticulates, have
restricted insulin release to less than 25%, in vitro, in acidic conditions, table
3.3, however their ability to protect insulin from pepsin digestion was only tested
in a few cases.
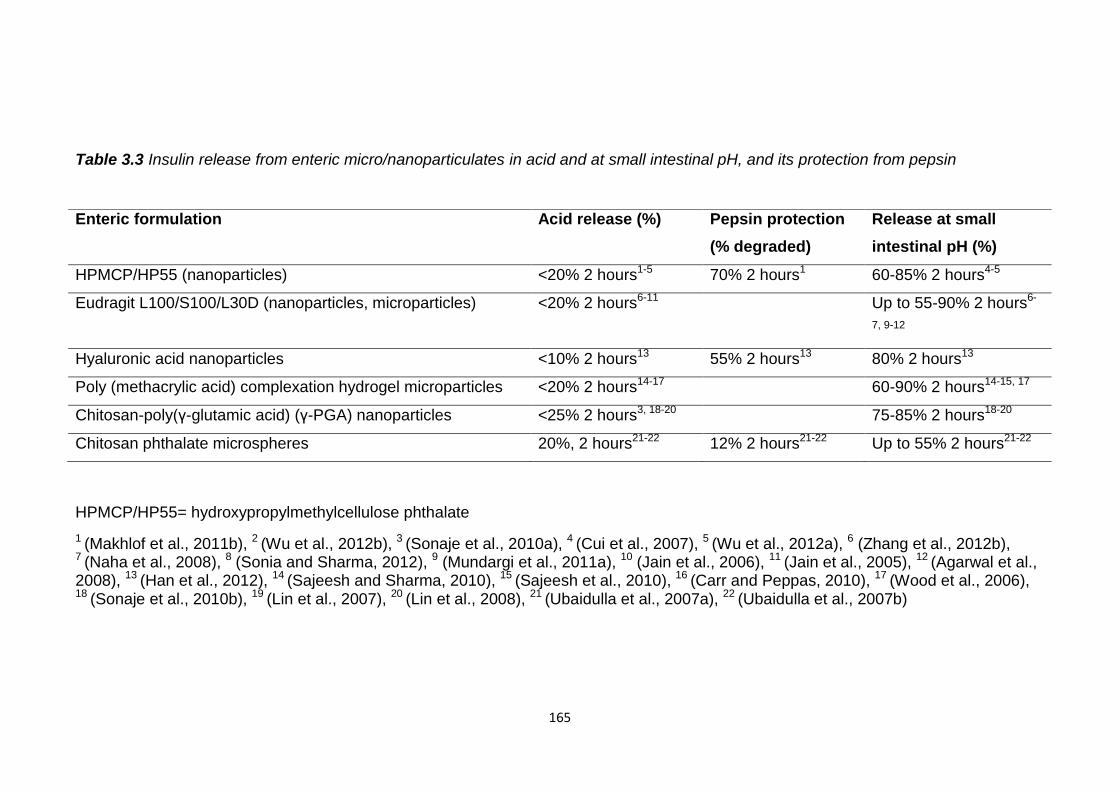
165
Table 3.3 Insulin release from enteric micro/nanoparticulates in acid and at small intestinal pH, and its protection from pepsin
HPMCP/HP55= hydroxypropylmethylcellulose phthalate
1 (Makhlof et al., 2011b), 2 (Wu et al., 2012b), 3 (Sonaje et al., 2010a), 4 (Cui et al., 2007), 5 (Wu et al., 2012a), 6 (Zhang et al., 2012b), 7 (Naha et al., 2008), 8 (Sonia and Sharma, 2012), 9 (Mundargi et al., 2011a), 10 (Jain et al., 2006), 11 (Jain et al., 2005), 12 (Agarwal et al., 2008), 13 (Han et al., 2012), 14 (Sajeesh and Sharma, 2010), 15 (Sajeesh et al., 2010), 16 (Carr and Peppas, 2010), 17 (Wood et al., 2006), 18 (Sonaje et al., 2010b), 19 (Lin et al., 2007), 20 (Lin et al., 2008), 21 (Ubaidulla et al., 2007a), 22 (Ubaidulla et al., 2007b)
Enteric formulation Acid release (%) Pepsin protection
(% degraded)
Release at small
intestinal pH (%)
HPMCP/HP55 (nanoparticles) <20% 2 hours1-5 70% 2 hours1 60-85% 2 hours4-5
Eudragit L100/S100/L30D (nanoparticles, microparticles) <20% 2 hours6-11 Up to 55-90% 2 hours6-
7, 9-12
Hyaluronic acid nanoparticles <10% 2 hours13 55% 2 hours13 80% 2 hours13
Poly (methacrylic acid) complexation hydrogel microparticles <20% 2 hours14-17 60-90% 2 hours14-15, 17
Chitosan-poly(γ-glutamic acid) (γ-PGA) nanoparticles <25% 2 hours3, 18-20 75-85% 2 hours18-20
Chitosan phthalate microspheres 20%, 2 hours21-22 12% 2 hours21-22 Up to 55% 2 hours21-22
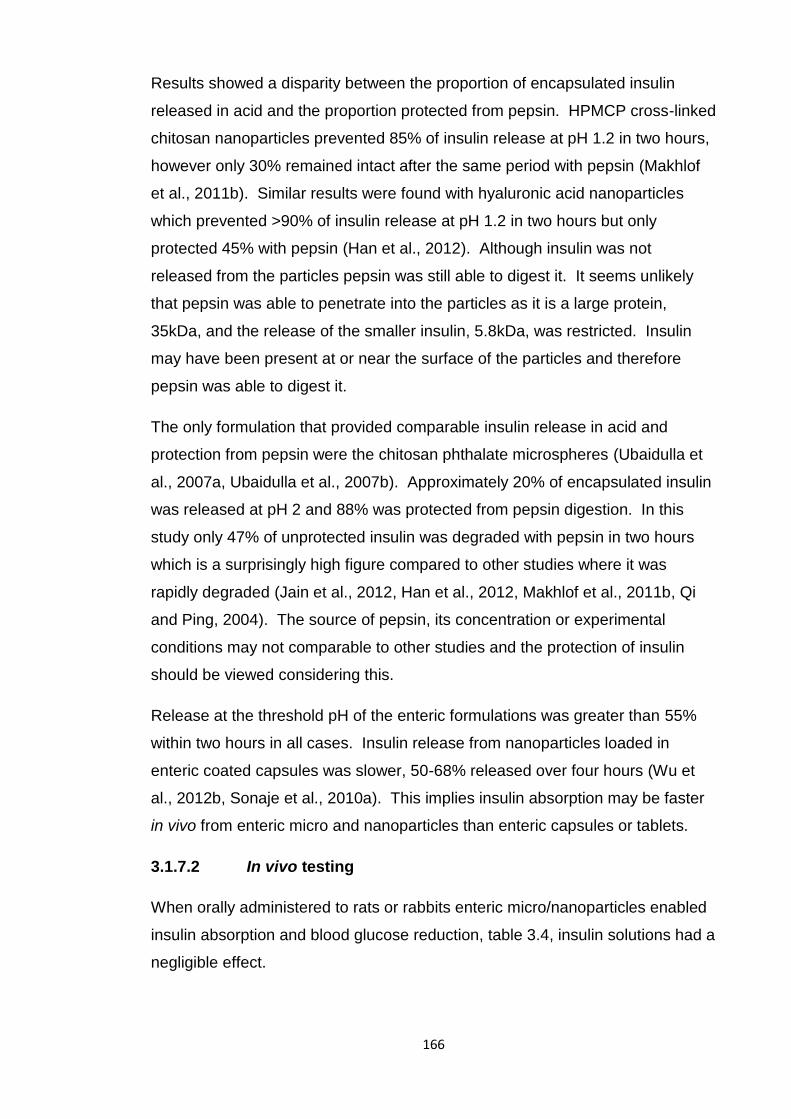
166
Results showed a disparity between the proportion of encapsulated insulin
released in acid and the proportion protected from pepsin. HPMCP cross-linked
chitosan nanoparticles prevented 85% of insulin release at pH 1.2 in two hours,
however only 30% remained intact after the same period with pepsin (Makhlof
et al., 2011b). Similar results were found with hyaluronic acid nanoparticles
which prevented >90% of insulin release at pH 1.2 in two hours but only
protected 45% with pepsin (Han et al., 2012). Although insulin was not
released from the particles pepsin was still able to digest it. It seems unlikely
that pepsin was able to penetrate into the particles as it is a large protein,
35kDa, and the release of the smaller insulin, 5.8kDa, was restricted. Insulin
may have been present at or near the surface of the particles and therefore
pepsin was able to digest it.
The only formulation that provided comparable insulin release in acid and
protection from pepsin were the chitosan phthalate microspheres (Ubaidulla et
al., 2007a, Ubaidulla et al., 2007b). Approximately 20% of encapsulated insulin
was released at pH 2 and 88% was protected from pepsin digestion. In this
study only 47% of unprotected insulin was degraded with pepsin in two hours
which is a surprisingly high figure compared to other studies where it was
rapidly degraded (Jain et al., 2012, Han et al., 2012, Makhlof et al., 2011b, Qi
and Ping, 2004). The source of pepsin, its concentration or experimental
conditions may not comparable to other studies and the protection of insulin
should be viewed considering this.
Release at the threshold pH of the enteric formulations was greater than 55%
within two hours in all cases. Insulin release from nanoparticles loaded in
enteric coated capsules was slower, 50-68% released over four hours (Wu et
al., 2012b, Sonaje et al., 2010a). This implies insulin absorption may be faster
in vivo from enteric micro and nanoparticles than enteric capsules or tablets.
3.1.7.2 In vivo testing
When orally administered to rats or rabbits enteric micro/nanoparticles enabled
insulin absorption and blood glucose reduction, table 3.4, insulin solutions had a
negligible effect.
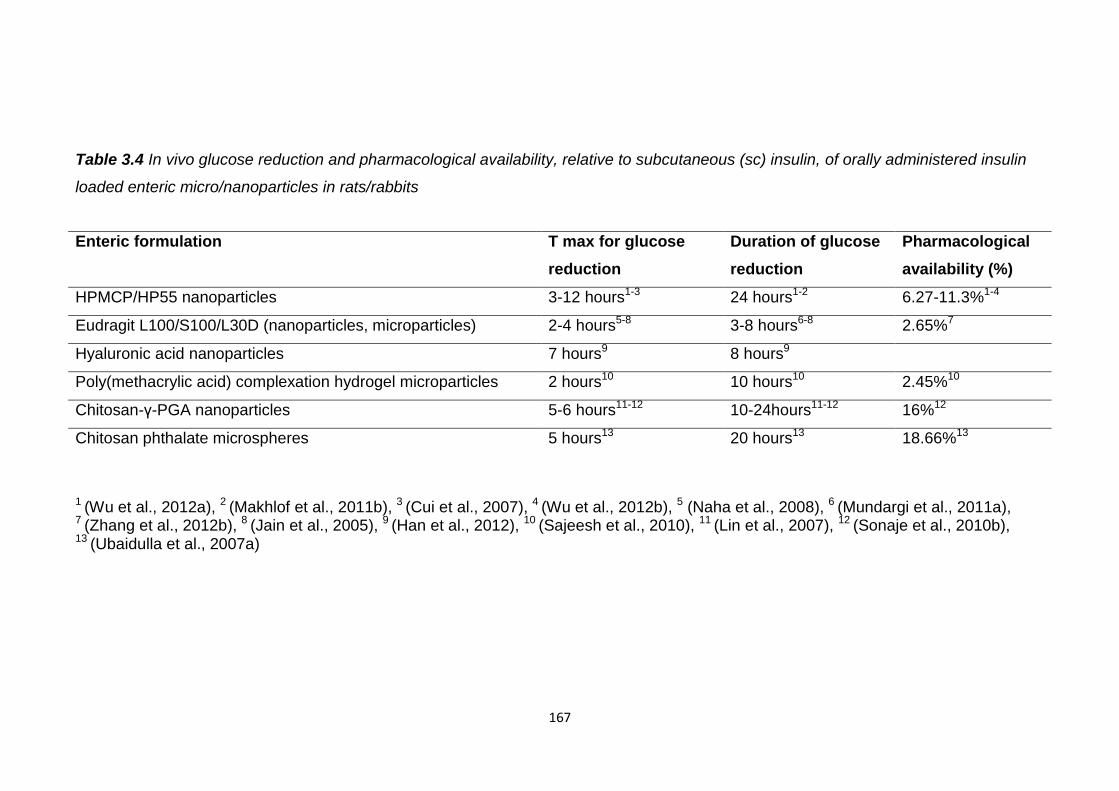
167
Table 3.4 In vivo glucose reduction and pharmacological availability, relative to subcutaneous (sc) insulin, of orally administered insulin
loaded enteric micro/nanoparticles in rats/rabbits
1 (Wu et al., 2012a), 2 (Makhlof et al., 2011b), 3 (Cui et al., 2007), 4 (Wu et al., 2012b), 5 (Naha et al., 2008), 6 (Mundargi et al., 2011a), 7 (Zhang et al., 2012b), 8 (Jain et al., 2005), 9 (Han et al., 2012), 10 (Sajeesh et al., 2010), 11 (Lin et al., 2007), 12 (Sonaje et al., 2010b), 13 (Ubaidulla et al., 2007a)
Enteric formulation T max for glucose
reduction
Duration of glucose
reduction
Pharmacological
availability (%)
HPMCP/HP55 nanoparticles 3-12 hours1-3 24 hours1-2 6.27-11.3%1-4
Eudragit L100/S100/L30D (nanoparticles, microparticles) 2-4 hours5-8 3-8 hours6-8 2.65%7
Hyaluronic acid nanoparticles 7 hours9 8 hours9
Poly(methacrylic acid) complexation hydrogel microparticles 2 hours10 10 hours10 2.45%10
Chitosan-γ-PGA nanoparticles 5-6 hours11-12 10-24hours11-12 16%12
Chitosan phthalate microspheres 5 hours13 20 hours13 18.66%13
168
They may have increased insulin availability by limiting its release in the
stomach, minimising degradation. Duration of glucose reduction and insulin
pharmacological availability may be underestimated as some of these
experiments were halted before glucose levels returned to basal levels. The
anticipated faster glucose response and shortened period of glucose lowering
by administering enteric multiparticulates rather than larger capsules or tablets
was not observed, table 3.4. The fastest glucose response was produced by
the poly(methacrylic) acid hydrogel and Eudragit particles. Maximum glucose
reductions occurred two to four hours post dosing which is comparable to the
enteric capsules and tablets of Oramed and Diabetology (Kidron et al., 2008,
Eldor et al., 2010a, Kidron et al., 2009, Whitelow et al., 2005). Possibly the
particulates aggregated delaying dissolution.
Eudragit nano/microparticles restricted insulin release in vitro in acid and
released up to 90% encapsulated insulin upon pH rise. Of the enteric
multiparticulate formulations tested they offer the best potential for protection,
faster glucose reduction and shortened period of glucose reduction. However,
these particles had lower insulin pharmacological availabilities than some of the
other formulations, particularly those with chitosan (Makhlof et al., 2011b,
Sonaje et al., 2010b, Ubaidulla et al., 2007a). Chitosan can increase
mucoadhesion and paracellular absorption. Enteric protection alone may not be
sufficient for acceptable oral insulin pharmacological availability but additional
excipients can increase this.
3.1.7.3 Methods of production
As the methods used to produce enteric multiparticulates often entail the use of
solvents and high shear forces there is a risk of denaturing insulin during its
encapsulation. Their more complex formation, compared to enteric coating of
capsules or tablets, may explain why they have not been popular so far with
companies. The ideal method should be simple and use the least damaging
parameters possible.
The majority of enteric nano/microparticles are produced using a water in oil in
water (w/o/w) double emulsion solvent evaporation method.
169
This involves potentially damaging solvents such as dichloromethane (DCM),
and using sonication, homogenisation, centrifugation and lyophilisation (Wu et
al., 2012a, Cui et al., 2007).
Eudragit L100 and S100 particles encapsulating insulin have been formed by
double emulsion solvent evaporation (Mundargi et al., 2011a, Jain et al., 2005,
Jain et al., 2006) and oil in oil (o/o) emulsion solvent evaporation (Morishita et
al., 1993). The advantages of the o/o method over the double emulsion method
were the use of less toxic ethanol to dissolve the polymer and no
homogenisation. Insulin encapsulation in HPMCP microspheres was increased
from 30 to 70% by the o/o method (Qi and Ping, 2004). Hydrophilic insulin may
have escaped encapsulation by migration to the outer aqueous phase in the
w/o/w method whereas this is not possible for the o/o method. In vitro insulin
release in acid was reduced from 20% to nothing and insulin recovery increased
from 40% to 80% with pepsin when encapsulated by the o/o method. More
insulin may be present at the surface of the w/o/w produced microparticles due
to its localisation at the oil water interface. Insulin loaded particles produced by
the o/o method significantly reduced glucose levels when orally administered to
rats, those produced by the w/o/w method had a weak effect.
In chapter 2 the o/o emulsion solvent evaporation method of Kendall et al. was
used to encapsulate the large protein, lactase, in enteric Eudragit L100
microparticles (Kendall et al., 2009). Uniformly sized particles of <100µm with
high yields, >90%, and encapsulation efficiencies, >80%, were formed. Lactase
activity was not impaired using this method demonstrating its suitability for
protein encapsulation. Spray dried lactase release in acid was restricted by the
particles although they were possibly permeable to acid. Insulin needs
protection from pepsin, which these particles could provide, and as it is soluble
and active in weak acids may not be as vulnerable to any incoming acid. This
method is simpler than a w/o/w method and avoids the use of potentially
damaging homogenization, centrifugation or lyophilisation. These
microparticles may be able to provide a more rapid and uniform small intestinal
release and faster insulin absorption than larger enteric coated dosage forms.
They also offer the potential to minimize the variability and food effects on
insulin absorption.
170
3.2 Aims
To model the stability of insulin throughout the gastrointestinal tract using
simulated and porcine gastrointestinal fluids and human faecal fluids;
o To use this knowledge for rational design of oral insulin delivery
vehicles
o To gain an insight into the oral stability of small proteins
To produce oral insulin formulations which have the potential ;
o To protect insulin from identified intestinal stability challenges
o To minimise insulin absorption variability and vulnerability to food
effects seen with clinically trialled insulin formulations
o To provide sufficiently rapid post prandial glucose control
o To prolong insulin absorption enough to not require administration
of additional insulin
o To not prolong glucose reduction for so long post prandially that
hypoglycaemia occurs
To formulate insulin using parameters which are least potentially
damaging to insulin integrity and most conducive for the desired release
characteristics
Assessment of oral insulin formulations
o To characterise them in terms of physical characteristics (size,
polydispersity, morphology), loading and encapsulation efficiency
o To assess their in vitro insulin release and ability to protect insulin
3.3 Materials
Human recombinant insulin, pepsin from porcine gastric mucosa, 469 units/mg
solid, 924 units/mg protein, pancreatin from porcine pancreas, activity at least
3x USP specifications and trifluoroacetic acid were from Sigma Aldrich.
Hydrochloric Acid 37%, specific gravity 1.18, was from BDH. Acetonitrile HPLC
grade and sodium hydroxide were from Fisher Scientific. Pig gastric and
intestinal fluids were from freshly slaughtered pigs and were immediately frozen
and stored at -80oC. Human faecal fluids were from healthy individuals not
taking antibiotics.
171
Faecal basal media materials: Bacteriological peptone and yeast extract were
from Oxoid. Sodium chloride, L-cysteine hydrochloride, vitamin K, resazurin
sodium salt and sodium hydroxide were from Fisher Scientific. Dipotassium
hydrogen orthophosphate and magnesium sulphate 7-hydrate were from BDH.
Calcium chloride dihydrate was from VWR. NaHCO3 and haemin were from
Sigma Aldrich. Bile salts were from Fluka Analytical. Tween 80 was from
Fluka Chemika.
Eudragit L100 was a gift from Degussa/ Evonik (Darmstadt, Germany), sorbitan
sesquioleate (Alacel 83), monobasic potassium phosphate and phosphate
buffered saline tablets (PBS) were from Sigma Aldrich. Liquid paraffin BP was
supplied by JM Loveridge Plc. Sodium phosphate, tribasic, anhydrous was
from Alfa Aesar. n-hexane and citric acid were from Fisher Scientific. Ethanol,
96% v/v was from BDH.
3.4 Methods
3.4.1 Insulin intestinal stability
400µl of a 2mg/ml insulin solution (prepared in 0.001N HCl) was added to 1.6ml
of simulated gastric fluid (SGF) with and without pepsin and simulated intestinal
fluid (SIF) with and without pancreatin (final insulin concentration of 0.4mg/ml).
These were placed in a Gallenkamp shaking incubator at 37°C and agitated at
100rpm. Samples (0.15ml) were removed after 0, 15, 30, 60, 90 and 120
minutes and added to either 0.45ml 0.002M NaOH to raise the pH of acidic
fluids or 0.01N HCl to lower the pH of small intestinal fluids to halt the reaction
(final insulin concentration 0.1mg/ml). These samples were analysed for insulin
content using HPLC. SGF and SIF were prepared as described in chapter 2,
section 2.4.2.
400μl of a 2mg/ml insulin solution was added to 1.6ml of gastric (pH 3.62),
duodenal (pH 6.77), jejunal (pH 6.94), ileal (pH 7.48) and descending colonic
fluids (pH 7.4) from a pig, giving a final insulin concentration of 0.4mg/ml. The
intestinal contents were centrifuged at 10,000rpm for 10 minutes and the
supernatants used to test stability. These mixtures were placed in a
Gallenkamp shaking incubator using the parameters used for the simulated
intestinal fluids.
172
Samples (0.15ml) were removed after 0, 15, 30, 60, 90 and 120 minutes and
added to either 0.45ml 0.002M NaOH to raise the pH of acidic fluids or 0.01N
HCl to lower the pH of small and large intestinal fluids to halt the reaction (final
insulin concentration 0.1mg/ml). These samples were then filtered and
analysed for insulin content using HPLC.
400µl of a 2mg/ml insulin solution was added to 1.6ml of human faecal slurry
and placed in a Gallenkamp shaking incubator using the parameters used in the
previous tests (final insulin concentration 0.4mg/ml). Samples (0.15ml) were
removed after 0, 15, 30, 60, 90 and 120 minutes and added to 0.45ml 0.01N
HCl to lower the pH to halt the reaction (final insulin concentration 0.1mg/ml).
These samples were centrifuged at 10,000rpm for 10 minutes and the
supernatants analysed for insulin content using HPLC. The human faecal slurry
was prepared as described in chapter 2, section 2.4.2.1.
Insulin recovery in the withdrawn samples was calculated using the equation
below. The theoretical concentration of the sample is the concentration of
insulin assuming 100% recovery. This value was calculated with respect to
changes in the sample volume during the course of the experiments.
Insulin recovered (%)=
x100
3.4.2 HPLC method
Samples were run in a mobile phase of 0.1% (v/v) trifluoroacetic acid in water
and 0.1% trifluoroacetic acid in acetonitrile (30-60%) at 40°C over a run time of
23 minutes at a flow rate of 1ml/min. 20µl samples were injected onto and
separated with a Discovery 300°A C18 column and detected at 210nm.
3.4.3 Eudragit L100 microparticle preparation
This method is based on that of Kendall et al. with the substitution of
prednisolone for insulin. Eudragit L100 (300mg) was dissolved in ethanol (3ml).
Recombinant human insulin (5mg) was suspended in the ethanol to prepare
microparticles with a drug to polymer weight ratio of 1:60 and stirred for at least
30 minutes. This suspension of insulin in Eudragit L100 solution was emulsified
into liquid paraffin (20ml) containing 1% (w/w) of sorbitan sesquioleate (Arlacel
83) as an emulsifying agent, using a Heidolph RZR1 stirrer at 1500rpm.
173
Stirring was carried out for 18 hours at room temperature to allow solvent
evaporation and particle solidification. The microparticles formed were
recovered by vacuum filtration through a Pyrex sintered glass filter (pore size 4;
5-15μm) and washed three times with n-hexane (50ml). Blank microparticles
containing no insulin were also prepared using the same parameters. All
microparticle formulations were prepared in triplicate.
The particle size and yield were determined as described in chapter 2, section
2.4.6.1. The morphology and size of the microparticles were examined by
scanning electron microscopy (SEM) (Philips XL30, Eindhoven, Holland) with
routine, high vacuum imaging at 5kV as described in chapter 2, section 2.4.6.2.
3.4.4 Encapsulation efficiency and insulin loading
Microparticles with encapsulated insulin (20mg) were added to 1ml pH 6.8±0.05
phosphate buffer, in triplicate, and placed in a Gallenkamp shaking incubator at
100rpm, 37°C for 45 minutes to determine insulin encapsulation efficiency and
loading. After 45 minutes samples were centrifuged at 10,000rpm for 10
minutes and 0.15ml of the supernatant added to 0.45ml 0.01N HCl to solubilise
insulin. This was analysed for insulin content using HPLC. Drug loading was
determined by measuring the μgs of insulin per mg of microparticles.
Encapsulation efficiency was calculated using the equation below. The total
amount of insulin added was the initial insulin added during formation of the
microparticles.
Encapsulation efficiency (%) =
x100
3.4.5 In vitro insulin release
To determine if the microparticles were able to protect insulin in gastric
conditions they (20mg) were added to 0.75ml SGF, pH 1.2±0.05, with and
without pepsin and placed in a Gallenkamp shaking incubator at 100rpm, 37°C
for 2 hours. Samples with SGF alone were centrifuged and 0.5ml of
supernatant removed and analysed for burst released insulin by HPLC. 0.5ml
of SGF without pepsin was added to replace the withdrawn sample. After 2
hours 0.25ml of tribasic sodium phosphate was added to all samples to
increase the pH to 6.8±0.05.
174
Samples were replaced in the shaking incubator and the experiment continued
for a further 45 minutes. Samples were centrifuged for 10 minutes at
10,000rpm and 0.15ml of the supernatants added to 0.45ml 0.01N HCl to stop
the reaction. The samples were analysed for insulin release using HPLC. All
tests were carried out in triplicate.
Insulin microparticles (20mg) were added to 1ml of pig gastric fluid and placed
in a Gallenkamp shaking incubator for 2 hours at 100rpm, 37°C. After this
period samples were centrifuged at 10,000rpm for 10 minutes and the
supernatants discarded. The microparticles were resuspended in pH 6.8±0.05
phosphate buffer and replaced in the shaking incubator for a further 45 minutes.
Samples were again centrifuged using the same parameters. 0.15ml of the
supernatant was added to 0.45ml 0.01N HCl to halt the reaction and this was
analysed for insulin content by HPLC.
Insulin release was calculated using the equation below. The theoretical insulin
concentration is the insulin concentration expected if it was all released.
Insulin release (%)=
x100
3.4.6 Stability testing of insulin with citric acid
0.2ml of insulin solution (2mg/ml in 0.001N HCl) and 2mg of citric acid were
added to 1ml of SIF with pancreatin. This was placed in a Gallenkamp shaking
incubator at 100rpm, 37°C for 30 minutes. The pH was measured (pH 4) and
the sample analysed for insulin content by HPLC. Insulin recovery was
calculated using the equation below. The theoretical insulin concentration is the
concentration of insulin expected if all was recovered.
Insulin recovered (%)=
x100
3.4.7 Eudragit L100 microparticles with citric acid
This method is based on that of Kendall et al. with the addition of citric acid to
the polymer and insulin suspension. Eudragit L100 (300mg) was dissolved in
ethanol (3ml). Citric acid (100mg or 30mg) was added to this solution.
Recombinant human insulin (5mg) was suspended in this and stirred for at least
30 minutes. Microparticle production and harvest were carried out as before.
175
Blank microparticles containing no insulin were also prepared using the same
parameters. All microparticle formulations were prepared in triplicate. The yield
was calculated as described in chapter 2, section 2.4.6.1, and morphology of
the microparticles was visualized using SEM as before.
The microparticles (20mg) containing 30mg citric acid, in triplicate, were placed
in 1ml SIF without pancreatin or 1ml SGF with pepsin for 2 hours in a
Gallenkamp shaking incubator at 37°C, 100rpm. The SGF samples were
centrifuged at 10,000rpm for 10 minutes and the supernatants discarded.
Microparticles were resuspended in either SIF without pancreatin or SIF with
pancreatin and replaced in the shaking incubator using the same parameters for
a further 45 minutes. Samples were centrifuged again using the same
parameters and 0.15ml of the supernatants added to 0.45ml 0.01N HCl to halt
the reaction. These samples were analysed for insulin content using HPLC.
Insulin release was calculated using the equation in section 3.4.6. The pH of
the samples was measured at the completion of the experiment.
3.5 Results
3.5.1 Insulin intestinal stability
Incubation of insulin in SGF and SIF without enzymes for two hours resulted in
almost complete intact insulin recovery, table 3.5, figure 3.3. This suggests
insulin primary structure is stable at gastric pH, pH 1.2, and small intestinal pH,
pH 6.8. The disulphide bonds which hold the A and B chains of insulin together
appear not to break at this pH and therefore the structure remains intact. This
stability at low pH has previously been demonstrated during a study assessing
the crystalline structure of insulin (Whittingham et al., 2002). There were some
conformational changes at low pH compared to neutral pH but the most
important dimer forming contacts were preserved. This may be due to the
stability of the disulphide bridges and the lack of critical salt bridges which
would be weakened by protonation. However with enzymes, pepsin and
pancreatin, insulin was immediately and completely degraded, figure 3.3.
Previously insulin was completely degraded within 5 minutes with pepsin
(Makhlof et al., 2011b) and 90% degraded with pancreatin (Jain et al., 2012).
Insulin contains peptide bonds susceptible to pepsin and small intestinal
enzymes resulting in this rapid digestion.
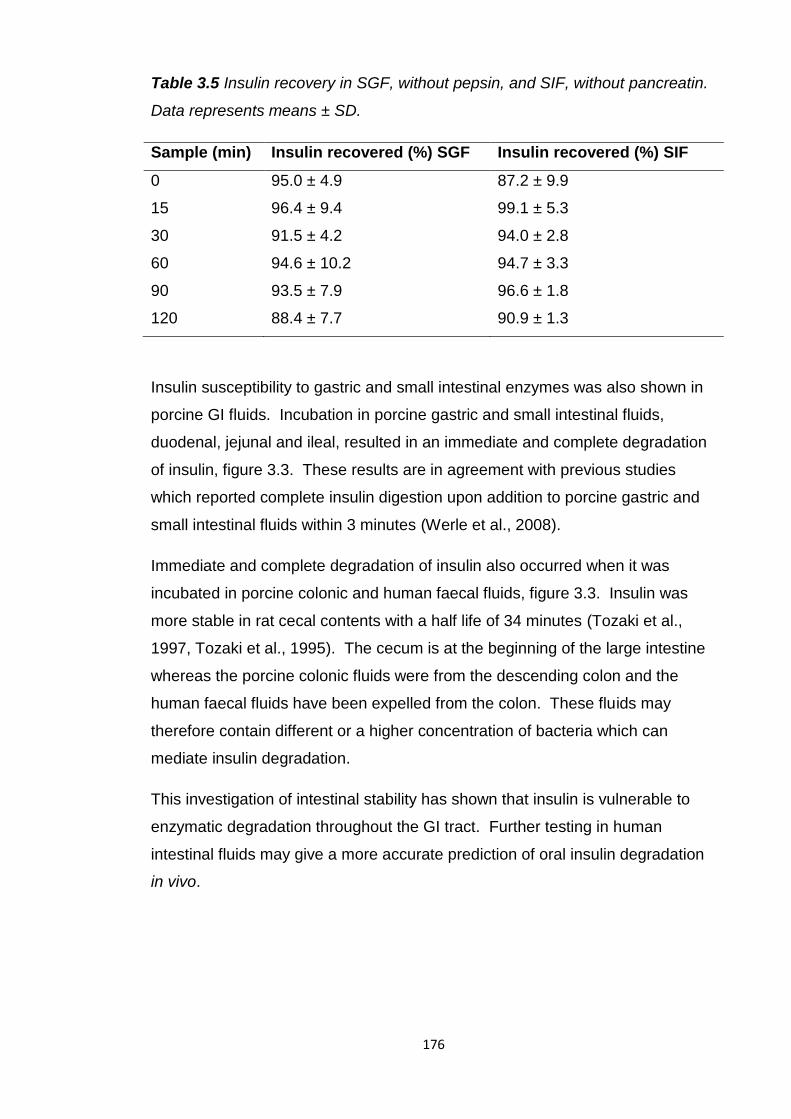
176
Table 3.5 Insulin recovery in SGF, without pepsin, and SIF, without pancreatin.
Data represents means ± SD.
Sample (min) Insulin recovered (%) SGF Insulin recovered (%) SIF
0 95.0 ± 4.9 87.2 ± 9.9
15 96.4 ± 9.4 99.1 ± 5.3
30 91.5 ± 4.2 94.0 ± 2.8
60 94.6 ± 10.2 94.7 ± 3.3
90 93.5 ± 7.9 96.6 ± 1.8
120 88.4 ± 7.7 90.9 ± 1.3
Insulin susceptibility to gastric and small intestinal enzymes was also shown in
porcine GI fluids. Incubation in porcine gastric and small intestinal fluids,
duodenal, jejunal and ileal, resulted in an immediate and complete degradation
of insulin, figure 3.3. These results are in agreement with previous studies
which reported complete insulin digestion upon addition to porcine gastric and
small intestinal fluids within 3 minutes (Werle et al., 2008).
Immediate and complete degradation of insulin also occurred when it was
incubated in porcine colonic and human faecal fluids, figure 3.3. Insulin was
more stable in rat cecal contents with a half life of 34 minutes (Tozaki et al.,
1997, Tozaki et al., 1995). The cecum is at the beginning of the large intestine
whereas the porcine colonic fluids were from the descending colon and the
human faecal fluids have been expelled from the colon. These fluids may
therefore contain different or a higher concentration of bacteria which can
mediate insulin degradation.
This investigation of intestinal stability has shown that insulin is vulnerable to
enzymatic degradation throughout the GI tract. Further testing in human
intestinal fluids may give a more accurate prediction of oral insulin degradation
in vivo.
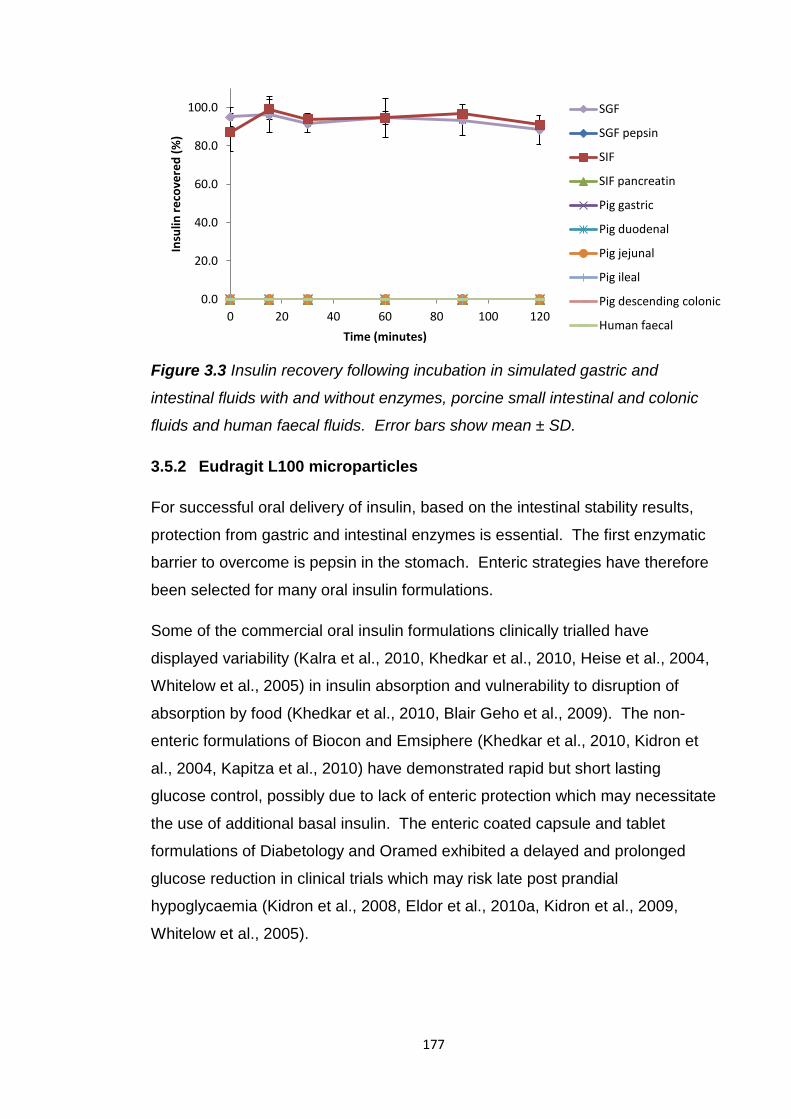
177
Figure 3.3 Insulin recovery following incubation in simulated gastric and
intestinal fluids with and without enzymes, porcine small intestinal and colonic
fluids and human faecal fluids. Error bars show mean ± SD.
3.5.2 Eudragit L100 microparticles
For successful oral delivery of insulin, based on the intestinal stability results,
protection from gastric and intestinal enzymes is essential. The first enzymatic
barrier to overcome is pepsin in the stomach. Enteric strategies have therefore
been selected for many oral insulin formulations.
Some of the commercial oral insulin formulations clinically trialled have
displayed variability (Kalra et al., 2010, Khedkar et al., 2010, Heise et al., 2004,
Whitelow et al., 2005) in insulin absorption and vulnerability to disruption of
absorption by food (Khedkar et al., 2010, Blair Geho et al., 2009). The non-
enteric formulations of Biocon and Emsiphere (Khedkar et al., 2010, Kidron et
al., 2004, Kapitza et al., 2010) have demonstrated rapid but short lasting
glucose control, possibly due to lack of enteric protection which may necessitate
the use of additional basal insulin. The enteric coated capsule and tablet
formulations of Diabetology and Oramed exhibited a delayed and prolonged
glucose reduction in clinical trials which may risk late post prandial
hypoglycaemia (Kidron et al., 2008, Eldor et al., 2010a, Kidron et al., 2009,
Whitelow et al., 2005).
0.0
20.0
40.0
60.0
80.0
100.0
0 20 40 60 80 100 120
Insu
lin r
eco
vere
d (
%)
Time (minutes)
SGF
SGF pepsin
SIF
SIF pancreatin
Pig gastric
Pig duodenal
Pig jejunal
Pig ileal
Pig descending colonic
Human faecal
178
Enteric micro/nanoparticles may provide solutions to these problems. Due to
their small size they offer a faster and more uniform gastric release than larger
dosage forms (Naikwade et al., 2009, Beverley et al., 1987) potentially enabling
insulin formulations to overcome the variability in absorption previously seen in
clinical trials. Their small size may also reduce the effects of food on insulin
absorption which can affect larger dosage forms. They could offer a better
prandial glucose control than enteric capsules and tablets, while still providing
gastric protection, and a more prolonged control of glucose than the non-enteric
forms. Their more immediate insulin release, due to increased surface area,
should lessen the risk of late post prandial hypoglycaemia compared to larger
enteric dosages.
Insulin loaded, enteric, Eudragit micro and nanoparticles were able, in previous
studies, to restrict insulin release in acid, therefore offering protection from
pepsin digestion (Zhang et al., 2012b, Naha et al., 2008, Sonia and Sharma,
2012, Mundargi et al., 2011a, Jain et al., 2006, Jain et al., 2005). In vivo they
generally caused a faster maximum glucose reduction than other enteric
micro/nanoparticles offering a better opportunity for controlling prandial
glycemic excursions (Naha et al., 2008, Mundargi et al., 2011a, Zhang et al.,
2012b, Jain et al., 2005). While the glucose response was no faster than that
produced by larger, enteric coated capsules and tablets in clinical trials these
particles offer the best potential for reducing the delay in insulin absorption.
They were therefore selected for formulating insulin.
Chapter 2 showed Eudragit L100 microparticles can prevent the release of an
encapsulated protein but are not impermeable to acid. As the primary structure
of insulin is stable in acid, demonstrated in the intestinal stability studies, this
may not be a problem. Pepsin is a large enzyme, 35kDa, and therefore is
unlikely to be able to permeate the microparticles and destroy the encapsulated
insulin. Therefore they were selected as a delivery strategy to protect insulin
from pepsin.
The method selected to produce insulin loaded Eudragit L100 microparticles
was based on that of Kendall et al.
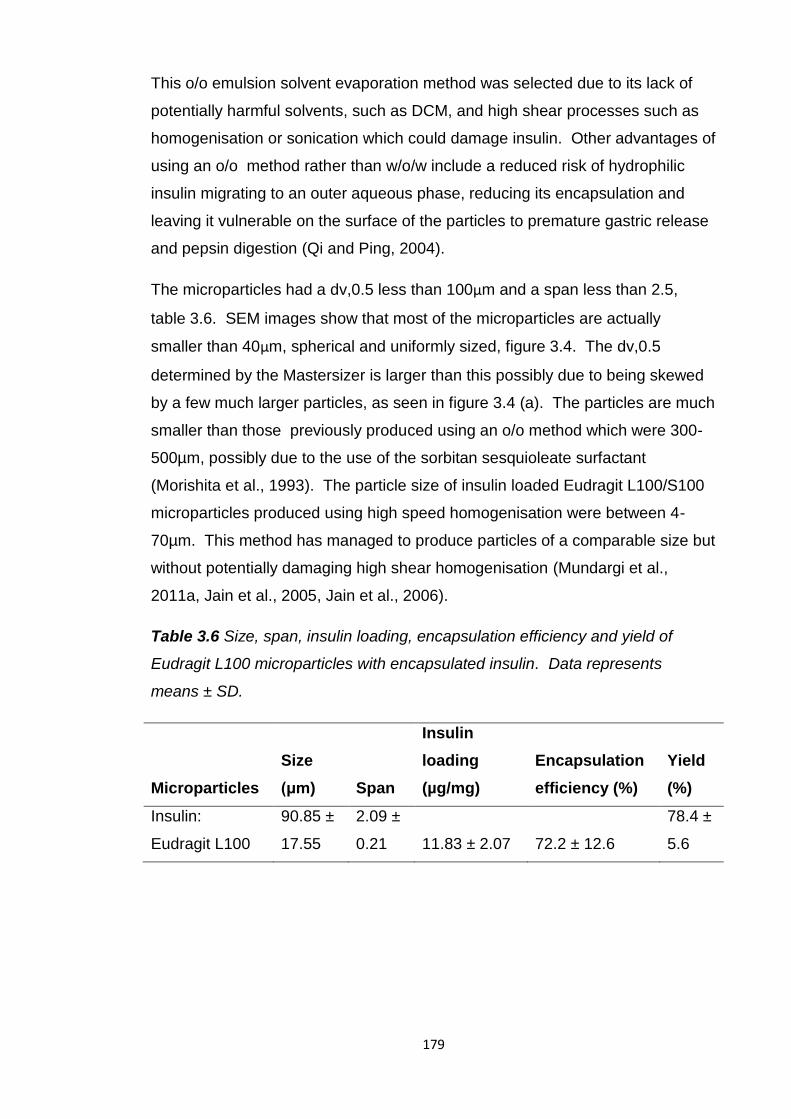
179
This o/o emulsion solvent evaporation method was selected due to its lack of
potentially harmful solvents, such as DCM, and high shear processes such as
homogenisation or sonication which could damage insulin. Other advantages of
using an o/o method rather than w/o/w include a reduced risk of hydrophilic
insulin migrating to an outer aqueous phase, reducing its encapsulation and
leaving it vulnerable on the surface of the particles to premature gastric release
and pepsin digestion (Qi and Ping, 2004).
The microparticles had a dv,0.5 less than 100μm and a span less than 2.5,
table 3.6. SEM images show that most of the microparticles are actually
smaller than 40μm, spherical and uniformly sized, figure 3.4. The dv,0.5
determined by the Mastersizer is larger than this possibly due to being skewed
by a few much larger particles, as seen in figure 3.4 (a). The particles are much
smaller than those previously produced using an o/o method which were 300-
500µm, possibly due to the use of the sorbitan sesquioleate surfactant
(Morishita et al., 1993). The particle size of insulin loaded Eudragit L100/S100
microparticles produced using high speed homogenisation were between 4-
70µm. This method has managed to produce particles of a comparable size but
without potentially damaging high shear homogenisation (Mundargi et al.,
2011a, Jain et al., 2005, Jain et al., 2006).
Table 3.6 Size, span, insulin loading, encapsulation efficiency and yield of
Eudragit L100 microparticles with encapsulated insulin. Data represents
means ± SD.
Microparticles
Size
(μm) Span
Insulin
loading
(µg/mg)
Encapsulation
efficiency (%)
Yield
(%)
Insulin:
Eudragit L100
90.85 ±
17.55
2.09 ±
0.21 11.83 ± 2.07 72.2 ± 12.6
78.4 ±
5.6
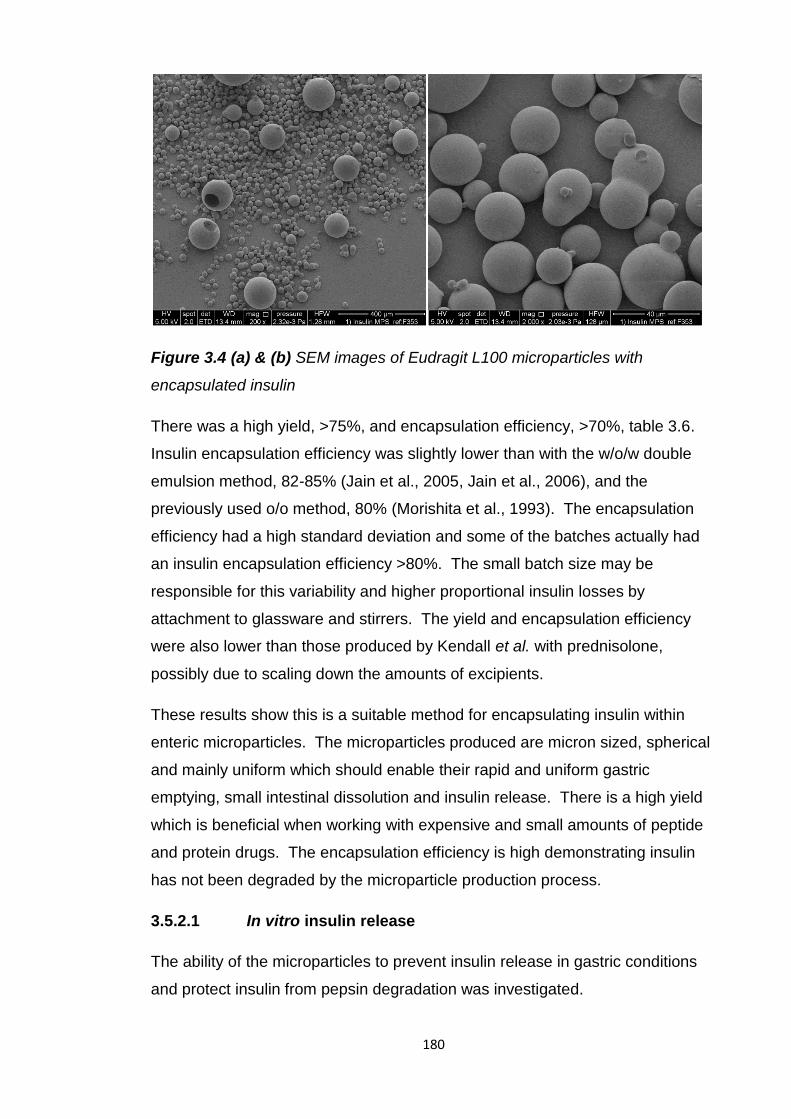
180
Figure 3.4 (a) & (b) SEM images of Eudragit L100 microparticles with
encapsulated insulin
There was a high yield, >75%, and encapsulation efficiency, >70%, table 3.6.
Insulin encapsulation efficiency was slightly lower than with the w/o/w double
emulsion method, 82-85% (Jain et al., 2005, Jain et al., 2006), and the
previously used o/o method, 80% (Morishita et al., 1993). The encapsulation
efficiency had a high standard deviation and some of the batches actually had
an insulin encapsulation efficiency >80%. The small batch size may be
responsible for this variability and higher proportional insulin losses by
attachment to glassware and stirrers. The yield and encapsulation efficiency
were also lower than those produced by Kendall et al. with prednisolone,
possibly due to scaling down the amounts of excipients.
These results show this is a suitable method for encapsulating insulin within
enteric microparticles. The microparticles produced are micron sized, spherical
and mainly uniform which should enable their rapid and uniform gastric
emptying, small intestinal dissolution and insulin release. There is a high yield
which is beneficial when working with expensive and small amounts of peptide
and protein drugs. The encapsulation efficiency is high demonstrating insulin
has not been degraded by the microparticle production process.
3.5.2.1 In vitro insulin release
The ability of the microparticles to prevent insulin release in gastric conditions
and protect insulin from pepsin degradation was investigated.
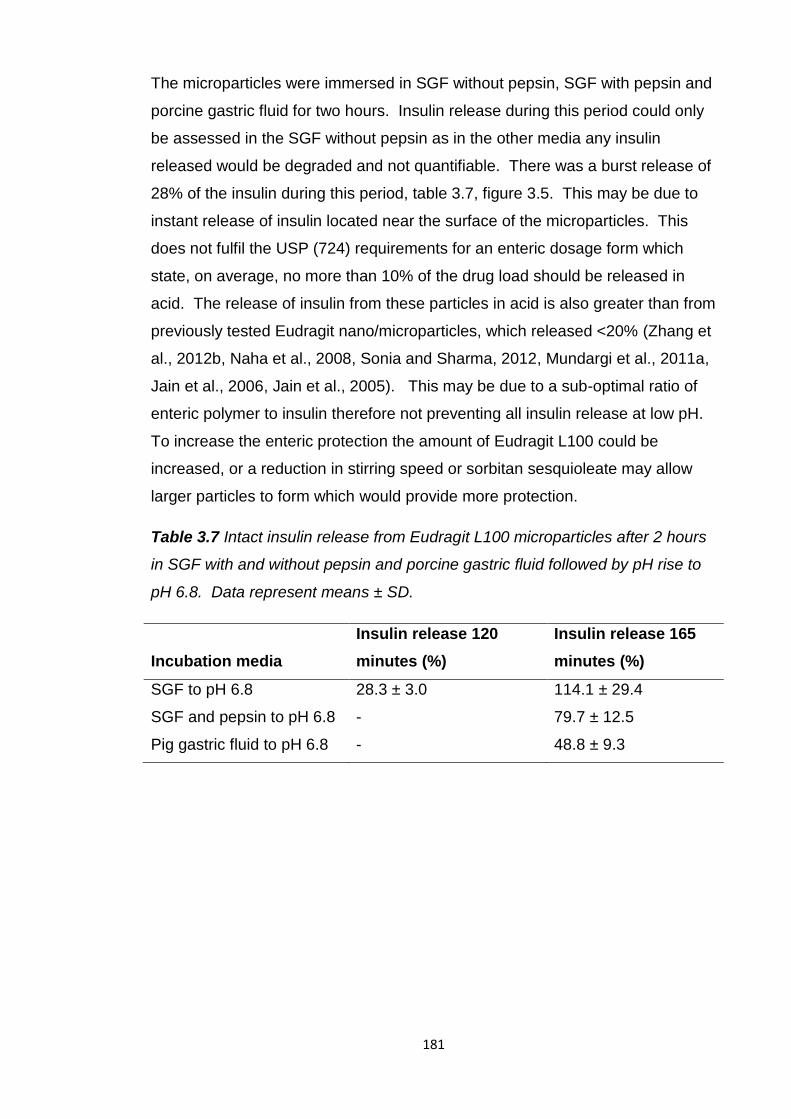
181
The microparticles were immersed in SGF without pepsin, SGF with pepsin and
porcine gastric fluid for two hours. Insulin release during this period could only
be assessed in the SGF without pepsin as in the other media any insulin
released would be degraded and not quantifiable. There was a burst release of
28% of the insulin during this period, table 3.7, figure 3.5. This may be due to
instant release of insulin located near the surface of the microparticles. This
does not fulfil the USP (724) requirements for an enteric dosage form which
state, on average, no more than 10% of the drug load should be released in
acid. The release of insulin from these particles in acid is also greater than from
previously tested Eudragit nano/microparticles, which released <20% (Zhang et
al., 2012b, Naha et al., 2008, Sonia and Sharma, 2012, Mundargi et al., 2011a,
Jain et al., 2006, Jain et al., 2005). This may be due to a sub-optimal ratio of
enteric polymer to insulin therefore not preventing all insulin release at low pH.
To increase the enteric protection the amount of Eudragit L100 could be
increased, or a reduction in stirring speed or sorbitan sesquioleate may allow
larger particles to form which would provide more protection.
Table 3.7 Intact insulin release from Eudragit L100 microparticles after 2 hours
in SGF with and without pepsin and porcine gastric fluid followed by pH rise to
pH 6.8. Data represent means ± SD.
Incubation media
Insulin release 120
minutes (%)
Insulin release 165
minutes (%)
SGF to pH 6.8 28.3 ± 3.0 114.1 ± 29.4
SGF and pepsin to pH 6.8 - 79.7 ± 12.5
Pig gastric fluid to pH 6.8 - 48.8 ± 9.3
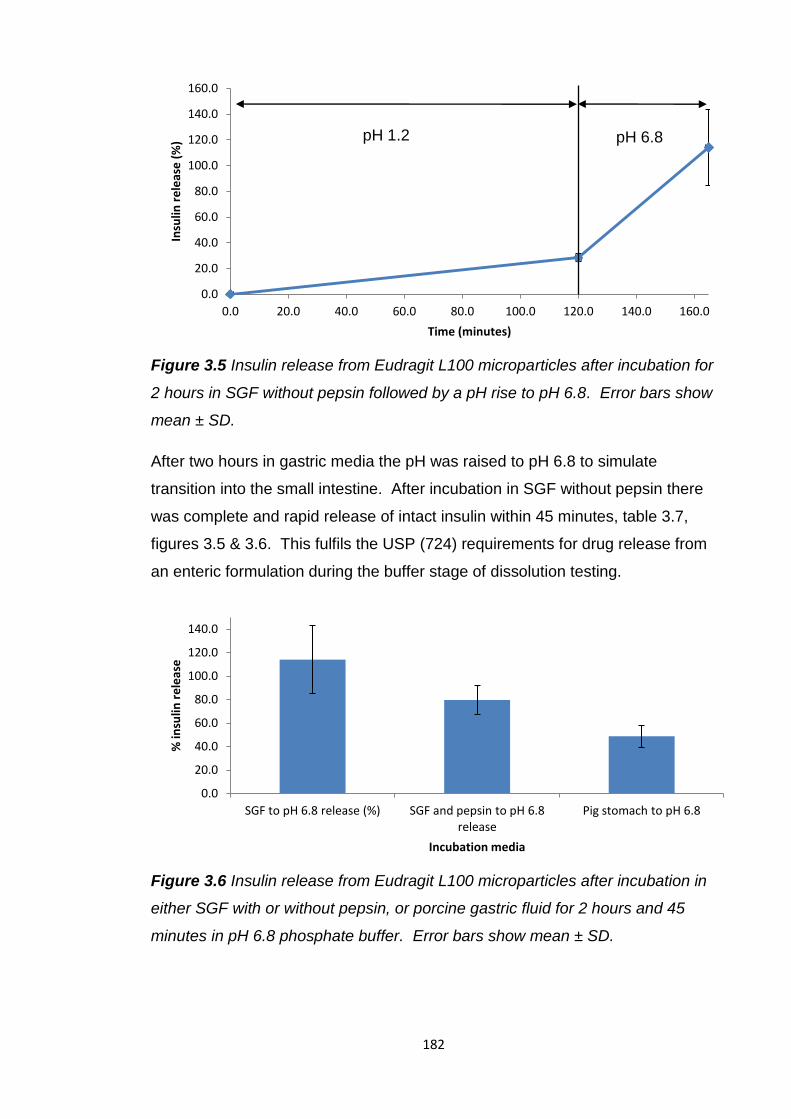
182
Figure 3.5 Insulin release from Eudragit L100 microparticles after incubation for
2 hours in SGF without pepsin followed by a pH rise to pH 6.8. Error bars show
mean ± SD.
After two hours in gastric media the pH was raised to pH 6.8 to simulate
transition into the small intestine. After incubation in SGF without pepsin there
was complete and rapid release of intact insulin within 45 minutes, table 3.7,
figures 3.5 & 3.6. This fulfils the USP (724) requirements for drug release from
an enteric formulation during the buffer stage of dissolution testing.
Figure 3.6 Insulin release from Eudragit L100 microparticles after incubation in
either SGF with or without pepsin, or porcine gastric fluid for 2 hours and 45
minutes in pH 6.8 phosphate buffer. Error bars show mean ± SD.
0.0
20.0
40.0
60.0
80.0
100.0
120.0
140.0
160.0
0.0 20.0 40.0 60.0 80.0 100.0 120.0 140.0 160.0
Insu
lin r
ele
ase
(%
)
Time (minutes)
pH 1.2 pH 6.8
0.0
20.0
40.0
60.0
80.0
100.0
120.0
140.0
SGF to pH 6.8 release (%) SGF and pepsin to pH 6.8 release
Pig stomach to pH 6.8
% in
sulin
re
leas
e
Incubation media
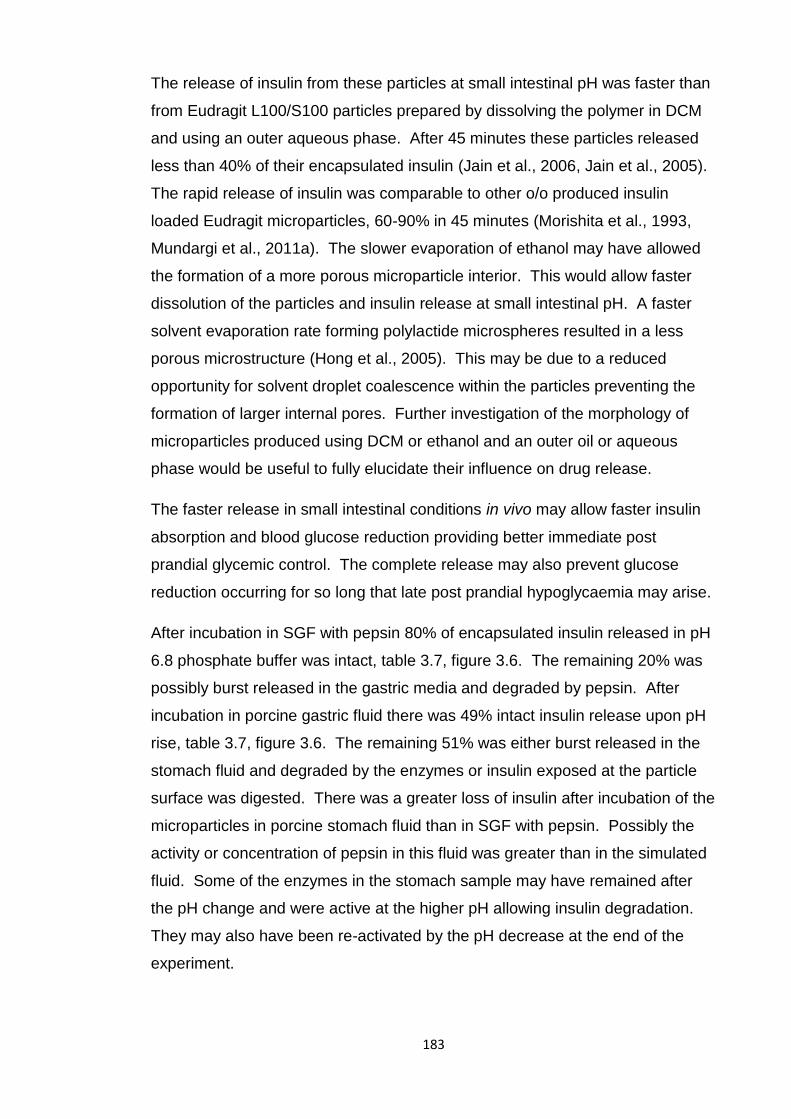
183
The release of insulin from these particles at small intestinal pH was faster than
from Eudragit L100/S100 particles prepared by dissolving the polymer in DCM
and using an outer aqueous phase. After 45 minutes these particles released
less than 40% of their encapsulated insulin (Jain et al., 2006, Jain et al., 2005).
The rapid release of insulin was comparable to other o/o produced insulin
loaded Eudragit microparticles, 60-90% in 45 minutes (Morishita et al., 1993,
Mundargi et al., 2011a). The slower evaporation of ethanol may have allowed
the formation of a more porous microparticle interior. This would allow faster
dissolution of the particles and insulin release at small intestinal pH. A faster
solvent evaporation rate forming polylactide microspheres resulted in a less
porous microstructure (Hong et al., 2005). This may be due to a reduced
opportunity for solvent droplet coalescence within the particles preventing the
formation of larger internal pores. Further investigation of the morphology of
microparticles produced using DCM or ethanol and an outer oil or aqueous
phase would be useful to fully elucidate their influence on drug release.
The faster release in small intestinal conditions in vivo may allow faster insulin
absorption and blood glucose reduction providing better immediate post
prandial glycemic control. The complete release may also prevent glucose
reduction occurring for so long that late post prandial hypoglycaemia may arise.
After incubation in SGF with pepsin 80% of encapsulated insulin released in pH
6.8 phosphate buffer was intact, table 3.7, figure 3.6. The remaining 20% was
possibly burst released in the gastric media and degraded by pepsin. After
incubation in porcine gastric fluid there was 49% intact insulin release upon pH
rise, table 3.7, figure 3.6. The remaining 51% was either burst released in the
stomach fluid and degraded by the enzymes or insulin exposed at the particle
surface was digested. There was a greater loss of insulin after incubation of the
microparticles in porcine stomach fluid than in SGF with pepsin. Possibly the
activity or concentration of pepsin in this fluid was greater than in the simulated
fluid. Some of the enzymes in the stomach sample may have remained after
the pH change and were active at the higher pH allowing insulin degradation.
They may also have been re-activated by the pH decrease at the end of the
experiment.
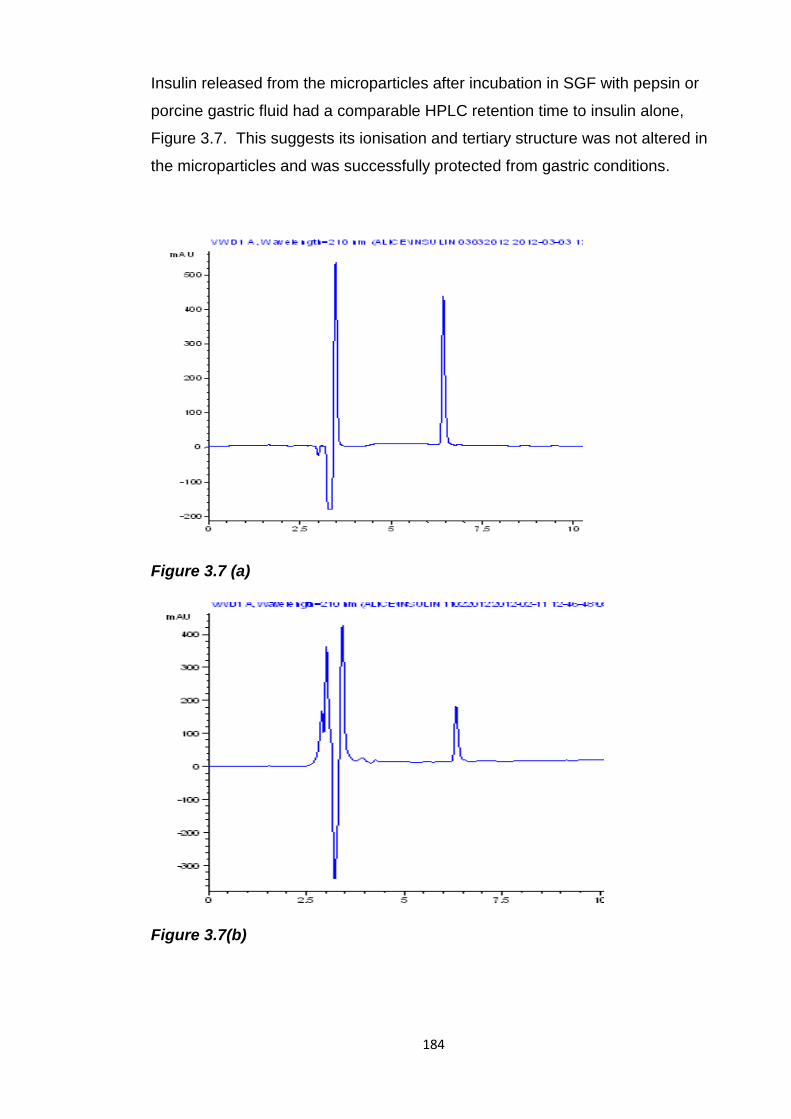
184
Insulin released from the microparticles after incubation in SGF with pepsin or
porcine gastric fluid had a comparable HPLC retention time to insulin alone,
Figure 3.7. This suggests its ionisation and tertiary structure was not altered in
the microparticles and was successfully protected from gastric conditions.
Figure 3.7 (a)
Figure 3.7(b)
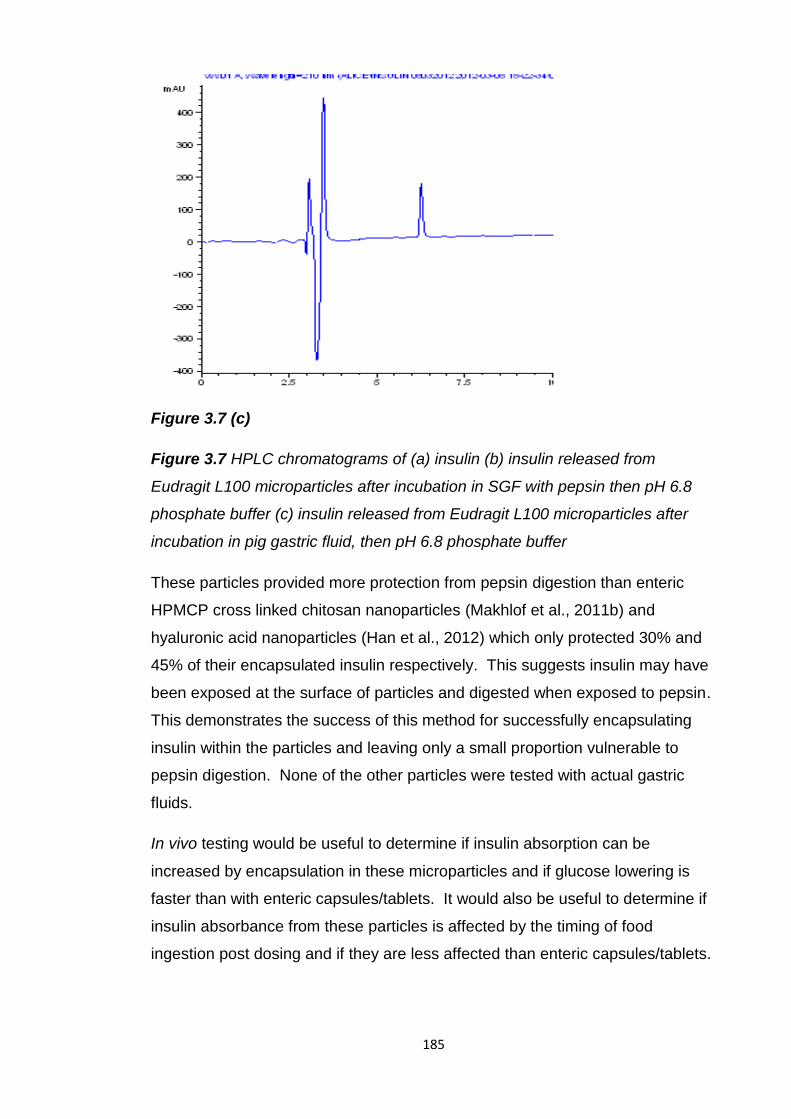
185
Figure 3.7 (c)
Figure 3.7 HPLC chromatograms of (a) insulin (b) insulin released from
Eudragit L100 microparticles after incubation in SGF with pepsin then pH 6.8
phosphate buffer (c) insulin released from Eudragit L100 microparticles after
incubation in pig gastric fluid, then pH 6.8 phosphate buffer
These particles provided more protection from pepsin digestion than enteric
HPMCP cross linked chitosan nanoparticles (Makhlof et al., 2011b) and
hyaluronic acid nanoparticles (Han et al., 2012) which only protected 30% and
45% of their encapsulated insulin respectively. This suggests insulin may have
been exposed at the surface of particles and digested when exposed to pepsin.
This demonstrates the success of this method for successfully encapsulating
insulin within the particles and leaving only a small proportion vulnerable to
pepsin digestion. None of the other particles were tested with actual gastric
fluids.
In vivo testing would be useful to determine if insulin absorption can be
increased by encapsulation in these microparticles and if glucose lowering is
faster than with enteric capsules/tablets. It would also be useful to determine if
insulin absorbance from these particles is affected by the timing of food
ingestion post dosing and if they are less affected than enteric capsules/tablets.
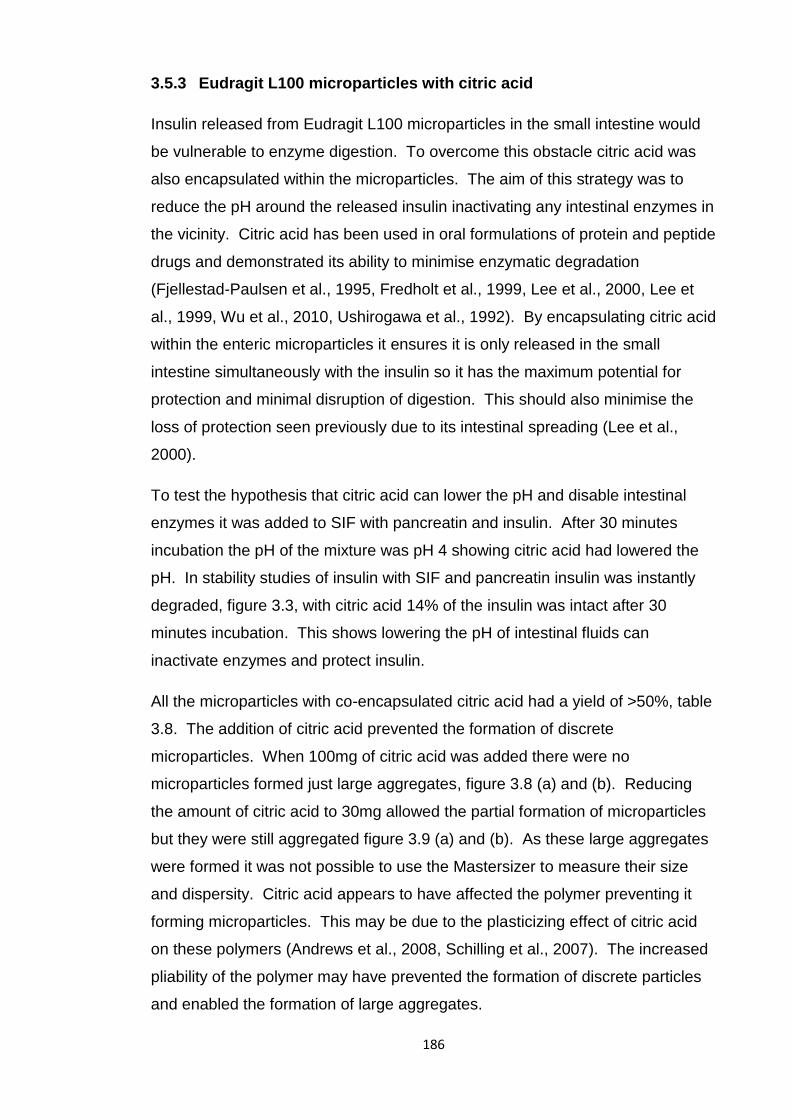
186
3.5.3 Eudragit L100 microparticles with citric acid
Insulin released from Eudragit L100 microparticles in the small intestine would
be vulnerable to enzyme digestion. To overcome this obstacle citric acid was
also encapsulated within the microparticles. The aim of this strategy was to
reduce the pH around the released insulin inactivating any intestinal enzymes in
the vicinity. Citric acid has been used in oral formulations of protein and peptide
drugs and demonstrated its ability to minimise enzymatic degradation
(Fjellestad-Paulsen et al., 1995, Fredholt et al., 1999, Lee et al., 2000, Lee et
al., 1999, Wu et al., 2010, Ushirogawa et al., 1992). By encapsulating citric acid
within the enteric microparticles it ensures it is only released in the small
intestine simultaneously with the insulin so it has the maximum potential for
protection and minimal disruption of digestion. This should also minimise the
loss of protection seen previously due to its intestinal spreading (Lee et al.,
2000).
To test the hypothesis that citric acid can lower the pH and disable intestinal
enzymes it was added to SIF with pancreatin and insulin. After 30 minutes
incubation the pH of the mixture was pH 4 showing citric acid had lowered the
pH. In stability studies of insulin with SIF and pancreatin insulin was instantly
degraded, figure 3.3, with citric acid 14% of the insulin was intact after 30
minutes incubation. This shows lowering the pH of intestinal fluids can
inactivate enzymes and protect insulin.
All the microparticles with co-encapsulated citric acid had a yield of >50%, table
3.8. The addition of citric acid prevented the formation of discrete
microparticles. When 100mg of citric acid was added there were no
microparticles formed just large aggregates, figure 3.8 (a) and (b). Reducing
the amount of citric acid to 30mg allowed the partial formation of microparticles
but they were still aggregated figure 3.9 (a) and (b). As these large aggregates
were formed it was not possible to use the Mastersizer to measure their size
and dispersity. Citric acid appears to have affected the polymer preventing it
forming microparticles. This may be due to the plasticizing effect of citric acid
on these polymers (Andrews et al., 2008, Schilling et al., 2007). The increased
pliability of the polymer may have prevented the formation of discrete particles
and enabled the formation of large aggregates.
187
Further testing is needed to discover the influence of citric acid on the glass
transition temperature of Eudragit L100 and this can be used to find the optimal
ratio of citric acid to Eudragit L100.
Table 3.8 Yields of blank and insulin loaded Eudragit L100 microparticles with
either 100mg or 30mg of citric acid. Data represents means ± SD.
Microparticles Yield (%)
Insulin with 100mg citric acid 81.5 ± 42.6
Blank with 100mg citric acid 87.4 ± 74.8
Insulin with 30mg citric acid 53.4 ± 28.2
Blank with 30mg citric acid 59.0
Figure 3.8 (a) and (b) SEM images of insulin loaded Eudragit L100
microparticles with 100mg of co-encapsulated citric acid
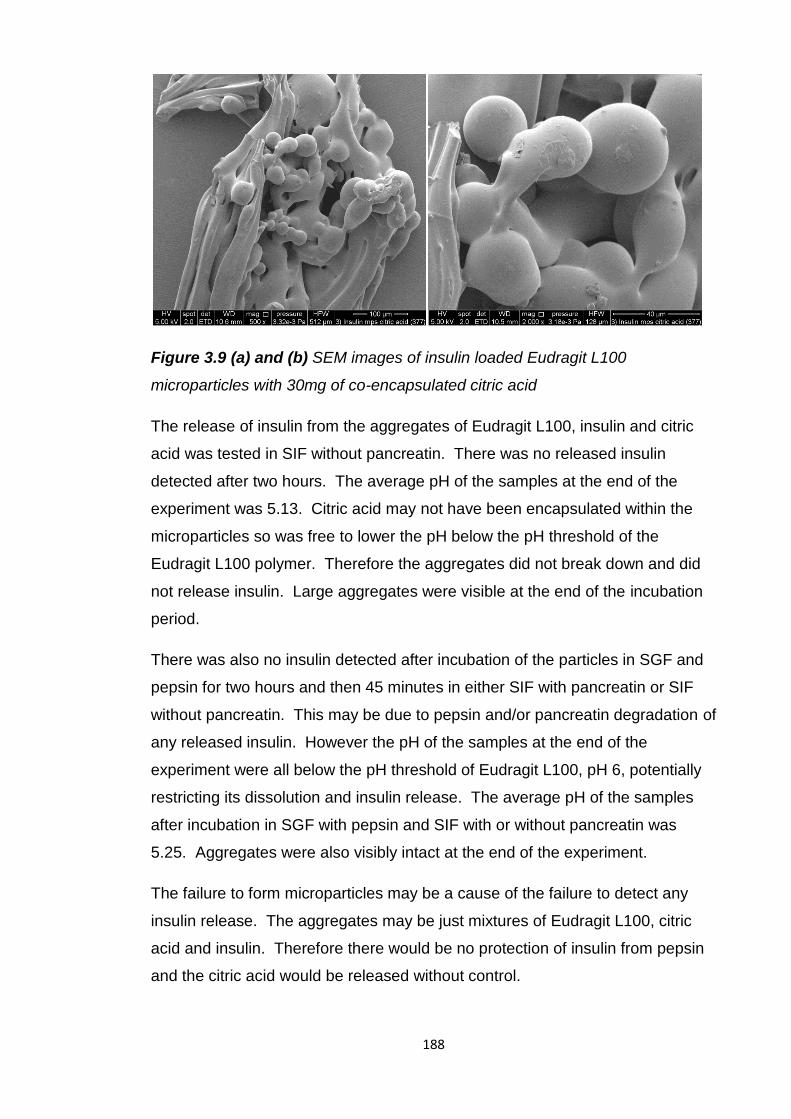
188
Figure 3.9 (a) and (b) SEM images of insulin loaded Eudragit L100
microparticles with 30mg of co-encapsulated citric acid
The release of insulin from the aggregates of Eudragit L100, insulin and citric
acid was tested in SIF without pancreatin. There was no released insulin
detected after two hours. The average pH of the samples at the end of the
experiment was 5.13. Citric acid may not have been encapsulated within the
microparticles so was free to lower the pH below the pH threshold of the
Eudragit L100 polymer. Therefore the aggregates did not break down and did
not release insulin. Large aggregates were visible at the end of the incubation
period.
There was also no insulin detected after incubation of the particles in SGF and
pepsin for two hours and then 45 minutes in either SIF with pancreatin or SIF
without pancreatin. This may be due to pepsin and/or pancreatin degradation of
any released insulin. However the pH of the samples at the end of the
experiment were all below the pH threshold of Eudragit L100, pH 6, potentially
restricting its dissolution and insulin release. The average pH of the samples
after incubation in SGF with pepsin and SIF with or without pancreatin was
5.25. Aggregates were also visibly intact at the end of the experiment.
The failure to form microparticles may be a cause of the failure to detect any
insulin release. The aggregates may be just mixtures of Eudragit L100, citric
acid and insulin. Therefore there would be no protection of insulin from pepsin
and the citric acid would be released without control.
189
The insulin may also be so deeply embedded within the large aggregates that
its release may be delayed.
To determine if burst released citric acid is preventing insulin release by
lowering the pH below the threshold for Eudragit L100 the pH of the samples
should be raised above pH 6. It can then be determined if insulin has been
protected from pepsin and if citric acid released simultaneously with insulin can
inactivate pancreatin and preserve insulin.
3.6 Conclusion
Despite numerous attempts to develop an oral formulation of insulin that is
capable of controlling the symptoms of diabetes no such formulation is yet
available. The largest hurdles to oral insulin delivery are its intestinal instability
and incompatibility with permeation from the GI tract but additional challenges
arising during clinical trials are a need to eliminate variability in insulin
absorption and minimise variability in insulin availability caused by food
consumption.
Investigations into the intestinal stability of insulin found that its primary
structure is stable at gastric and small intestinal pH but it was rapidly degraded
by enzymes found throughout the GI tract. The structure of this small protein is
stabilised at low pH by disulphide bonds, however the enzymes of the GI fluids
can easily access susceptible peptide bonds and break them.
Encapsulation of insulin in Eudragit L100 microparticles was selected as an oral
delivery strategy for their ability to protect insulin from pepsin digestion and their
potential, due to their small size, to produce faster post prandial glycemic
control than larger enteric dosage forms. Their small size may also be able to
minimise variability in insulin absorption and susceptibility to absorption
disruption by the presence of food experienced by oral insulin formulations in
clinical trials.
An o/o emulsion solvent evaporation method, based on that developed by
Kendall et al. was selected to encapsulate insulin in Eudragit L100
microparticles. In chapter 2 this method successfully encapsulated a large
protein, lactase, and restricted its release in acid.
190
This method was also selected for its lack of potentially damaging parameters
which could endanger the integrity of insulin and benefits of increased
encapsulation, reduced burst release and increased pepsin protection than
those produced by a w/o/w method.
The microparticles had a high insulin encapsulation efficiency, >72%, and a
mean particle size of <100µm. This was comparable to insulin loaded Eudragit
microparticles produced using homogenisation but didn’t involve exposure to
high shear forces. The Eudragit L100 microparticles prevented 72% of insulin
release in acid and protected 80% of encapsulated insulin from pepsin
digestion. This implies the vast majority of insulin was successfully fully
encapsulated within the particles and not left exposed on their surface. Insulin
release from the Eudragit L100 microparticles was rapid and complete within 45
minutes at small intestinal pH. This rapid release makes these particles more
suitable to promote a faster insulin absorption and control prandial glycemic
excursions than larger dosage forms. The complete release may also prevent
glucose reduction occurring for so long that late post prandial hypoglycaemia
may arise.
To provide enzymatic protection in the small intestine citric acid was co-
encapsulated in the microparticles. Citric acid released simultaneously with
insulin would be able to lower local pH and inactivate enzymes reducing insulin
degradation. However, the plasticizing effect of citric acid on Eudragit L100
hampered the formation of microparticles instead forming large aggregates.
This would restrict rapid and uniform gastric emptying. Their large size and
release of citric acid appeared to prevent insulin release in any media in vitro.
However, in vivo, the higher buffer capacity of the small intestinal fluids may
prevent released citric acid lowering the pH below the threshold pH of Eudragit
L100. Therefore they may still offer a mode of successful oral insulin delivery.
Insulin loaded Eudragit L100 microparticles offer a promising oral delivery
strategy. Their protection of insulin from pepsin digestion and rapid release at
small intestinal pH could enable insulin absorption and glucose reduction
sufficient and fast enough to control post prandial glycemia. Additional
excipients may further increase their potential to successfully deliver insulin
orally.
191
Chapter 4
Investigation of the intestinal stability of
Peptide 1 and development of its oral
formulations
192
4.1 Introduction
The intestinal stability and oral delivery of a recently discovered small (10 amino
acids), chemotherapeutic peptide, Peptide 1, was investigated in this chapter.
While this peptide lacks the more complex structure of lactase and insulin it is
still larger than commonly orally delivered low molecular weight drugs and still
has to contend with the issues of intestinal instability and impermeability
outlined in chapter 1. Investigation into its intestinal stability, combined with the
results of the previous chapters, should provide an insight into the relationship
between the size and structure of protein and peptide drugs and their stability.
Gonadotrophin releasing hormone (GnRH) agonists are peptides of a similar
size to peptide 1 and are used to treat prostate and breast cancers. They are
available as injectable, depot formulations of polymeric particles of poly (D,L-
lactide-co-glycolide) (PLGA) which provide protection to the peptide and sustain
their release to reduce the frequency of injections. Therefore they have been
used for oral delivery of peptides and increased their gastrointestinal stability
and permeability but they have experienced problems of immediate,
uncontrolled peptide release. If administered orally the encapsulated peptide
could be burst released in the stomach where it may be degraded by acid or
pepsin. To prevent gastric degradation of burst released peptide the
encapsulation of peptide loaded PLGA nanoparticles in enteric Eudragit L100
microparticles, which successfully encapsulated insulin and lactase in the
previous chapters, has been investigated here.
4.1.1 Peptide 1, function and structure
Peptide 1 is a 10 amino acid peptide, 1190.4 MW, which can halt the growth of
human mammary and prostate cancer cells (Migliaccio et al., 2007). Peptide 1
inhibits the interaction of androgen receptor (AR)-estradiol receptor (ER)
complex with Src and stops its activation by mimicking the sequence that
interacts with Src. This prevents the progression from G1 to S (synthesis) in the
cell cycle of cancer cells, stopping their growth.
Peptide 1 was used to treat human prostate and mammary cancer cells (LNCaP
and MCF-7) in vitro and inhibited androgen or estradiol induced association
between the AR/ER and Src, Src activation, DNA synthesis and S phase entry.
193
When administered intraperitoneally to mice the peptide was taken up by and
strongly inhibited the growth of LNCaP xenografts.
4.1.2 Chemotherapeutic peptides
The GnRH agonists, buserelin, goserelin, histrelin, leuprorelin and triptorelin,
are of a similar size and structure to peptide 1 and are used to treat prostate
and breast cancers, table 4.1. These synthetic peptides are modelled on GnRH
and bind to the GnRH receptor for a prolonged period reducing sex hormones
and enabling treatment of hormonally sensitive cancers.
All the GnRH agonists available are solely delivered by injection, except for a
nasal spray of buserelin, and none are available orally, table 4.1. Except for
buserelin the injectable GnRH agonist formulations provide a sustained release
of the drug over 1, 3, 6 or 12 months, dependent on the properties of their
polymeric carrier. The sustained release capacity of goserelin, leuprorelin and
triptorelin formulations is conferred by the biocompatible and biodegradable
polymers polylactic acid (PLA) and PLGA. They have been used to form
microcapsules for leuprorelin and triptorelin delivery. The peptide is released
initially by diffusing through pores in the spheres followed by slower, sustained
release as the microspheres are eroded and the pores enlarged (Crotts and
Park, 1998). The microspheres are able to protect the encapsulated peptide
and by providing a sustained release the inconvenience and pain of frequent
injections is avoided (Dai et al., 2005).
None of the protein or peptide drugs currently used in cancer treatment are
available as oral formulations. This is probably due to intestinal instability and
limited absorption, due to their relatively large size and hydrophilicity, as
described in chapter 1. Despite these obstacles oral delivery would be
preferable to injections because of increased convenience, patient compliance,
ease of administration and reduced production costs.
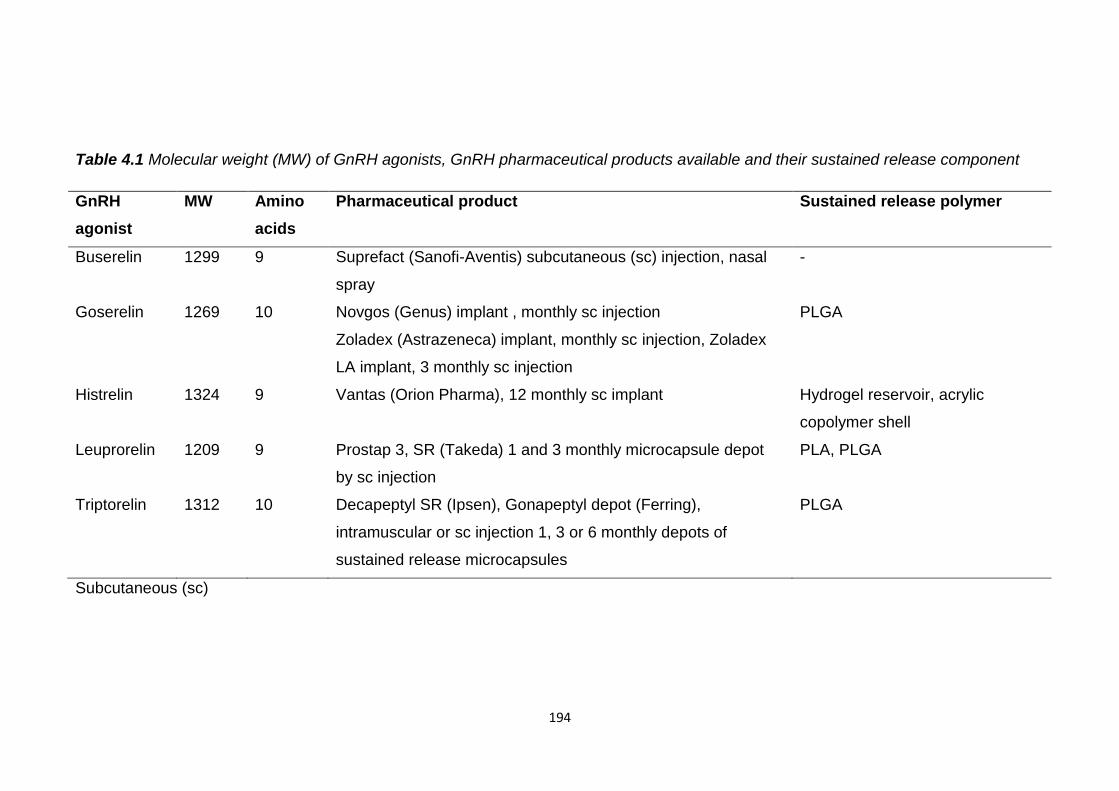
194
Table 4.1 Molecular weight (MW) of GnRH agonists, GnRH pharmaceutical products available and their sustained release component
GnRH
agonist
MW Amino
acids
Pharmaceutical product Sustained release polymer
Buserelin 1299 9 Suprefact (Sanofi-Aventis) subcutaneous (sc) injection, nasal
spray
-
Goserelin 1269 10 Novgos (Genus) implant , monthly sc injection
Zoladex (Astrazeneca) implant, monthly sc injection, Zoladex
LA implant, 3 monthly sc injection
PLGA
Histrelin 1324 9 Vantas (Orion Pharma), 12 monthly sc implant Hydrogel reservoir, acrylic
copolymer shell
Leuprorelin 1209 9 Prostap 3, SR (Takeda) 1 and 3 monthly microcapsule depot
by sc injection
PLA, PLGA
Triptorelin 1312 10 Decapeptyl SR (Ipsen), Gonapeptyl depot (Ferring),
intramuscular or sc injection 1, 3 or 6 monthly depots of
sustained release microcapsules
PLGA
Subcutaneous (sc)
195
4.1.3 Barriers to oral delivery of peptides for cancer treatment
Intestinal stability studies revealed GnRH and leuprorelin are vulnerable to
degradation by small intestinal enzymes. GnRH was degraded by the intestinal
enzymes chymotrypsin (Wen et al., 2002c, Walker et al., 2001) and elastase
(Walker et al., 2001) but was not degraded by trypsin. It was also rapidly
degraded in small intestinal extracts from possum and rat intestines and had a
half life of only 22 minutes in the possum jejunal extract (Wen et al., 2002c,
Wen et al., 2002b, Wen et al., 2002a, Zheng et al., 1999a). Rates of GnRH
degradation in the brushtail possum corresponded to levels of proteolytic
activity in the intestinal segments; greatest in the jejunum and ileum and least in
the duodenum and colon (Wen et al., 2002b, Wen et al., 2002c).
The intestinal permeability of the GnRH agonist leuprorelin has been assessed
in vitro with rabbit intestinal segments and in vivo in rats by site directed delivery
(Zheng et al., 1999b). Permeability in rabbit intestinal segments was very low
but was greater in the ileum and colon than the jejunum. In anesthetized rats
the bioavailability of leuprorelin was only 1.28% when administered to the
jejunum increasing to 5.62% in the ileum and 9.59% in the colon (Zheng et al.,
1999b). Bioavailability was reduced in conscious rats to only 0.23% when
administered to the duodenum (Adjei et al., 1993), 0.58% in the ileum and
0.41% in the colon (Zheng et al., 1999b). These differences may be due to
greater enzymatic activity and thicker mucus covering in the jejunum or the
presence of macromolecule sampling M cells in the ileum. Intact peptide was
recovered from these intestinal regions at the end of the experiment
demonstrating that even when the peptide was not degraded it was not
absorbed due to its low permeability.
These experiments show the vulnerability of these peptides to degradation in
the small intestine and their low permeability demonstrating why they are not
delivered orally. The permeability and stability studies conducted did not take
into account any degradation that may have occurred in the stomach so oral
bioavailability figures may actually be lower than indicated. As these peptides
are used to treat cancer it is absolutely vital that the dose delivered is
therapeutic and reliable.
196
Peptide 1 has a similar molecular weight and structure to the GnRH agonists
and therefore may also have a low oral bioavailability due to similar intestinal
instability and impermeability.
4.1.4 Oral delivery strategies investigated for peptide chemotherapeutics
To overcome the instability of GnRH agonists protease inhibitors have been
used in oral formulations. Protease inhibitors inhibited enzymatic degradation
of buserelin (Kotze et al., 1997a) and leuprorelin (Zheng et al., 1999a) in vitro
with rat intestinal homogenates and increased leuprorelin permeation in a rabbit
intestinal sac (Guo et al., 2004). However this strategy may not be ideal for oral
delivery as it could disrupt the digestion of dietary proteins.
To increase the permeability of GnRH agonists mucoadhesive polymers,
chitosan and carbomer, have been investigated. They increased in vitro
transport of buserelin and leuprorelin across Caco-2 cells and rat intestinal
mucosa (Kotze et al., 1997a, Thanou et al., 2000a, Kotze et al., 1997b, Guo et
al., 2004, Iqbal et al., 2012). As well as increasing intestinal residence time due
to their adhesive properties they appeared to open tight junctions between the
cells increasing paracellular absorption. N-trimethyl chitosan chloride reduced
the transepithelial electrical resistance (TEER) of Caco-2 cells and fluorescent
markers were seen in the intercellular spaces indicating an opening of the tight
junctions (Kotze et al., 1997b, Guo et al., 2004). In vivo, carbomer and chitosan
increased buserelin and leuprorelin bioavailability from less than 1% for the
drug solutions to up to13% when administered intraduodenally and 4.52% when
administered orally to rats (Thanou et al., 2000a, Luessen et al., 1996, Iqbal et
al., 2012).
Other delivery strategies for GnRH agonists include encapsulation in polymeric
nanoparticles (Iqbal et al., 2011) , solid lipid nanoparticles (Yuan et al., 2009)
and liposomes (Carafa et al., 2006). These formulations can provide protection
to the encapsulated peptide and may be able to enhance permeability.
However, these systems suffered from an immediate burst release in vitro of up
to 60% in 10 minutes which would leave the released drug vulnerable to
degradation (Iqbal et al., 2011).
197
Only one of these systems was tested in vivo and produced an oral
bioavailability of 0.55% in rats, a small improvement compared to the 0.26%
bioavailability of an oral leuprorelin solution (Iqbal et al., 2011).
Of the oral delivery strategies investigated for the GnRH agonists here none
produced an oral bioavailability of more than 5% compared to an intravenous
dose so more work is needed to enable oral delivery.
4.1.5 PLGA nanoparticles for oral delivery of proteins/peptides
Injectable microspheres of PLGA and PLA encapsulating GnRH agonists
prevent the peptide being rapidly degraded and provide a prolonged release.
Another advantage of PLGA is its lack of toxicity as it degrades to lactic and
glycolic acids which are metabolised by the Krebs cycle (Singh et al., 2008).
Compared to liposomes polymeric particles have greater stability in biological
fluids and during storage (Pinto Reis et al., 2006). Due to their proven benefits
they have been explored for oral protein and peptide drug delivery too.
PLGA particles have been used to encapsulate peptide and protein drugs;
salmon calcitonin (Yoo and Park, 2004), cyclosporine A (Italia et al., 2007),
ovalbumin (Uchida et al., 1994, Challacombe et al., 1992, Garinot et al., 2007),
HBsAg antigen (Gupta et al., 2007), helodermin (des Rieux et al., 2007), BSA
(Blanco and Alonso, 1998, Panyam et al., 2003), lysozyme (Blanco and Alonso,
1998, Nam et al., 2000), leuprorelin acetate (Luan et al., 2006), thymopentin
(Yin et al., 2007) and erythropoietin (Geng et al., 2008). They have increased
their oral bioavailability and induced immune responses in rodents (Yoo and
Park, 2004, Gupta et al., 2007, Uchida et al., 1994, Challacombe et al., 1992).
The most frequently investigated protein/peptide drug for oral delivery in PLGA
particles is insulin (Sun et al., 2011b, Yang et al., 2012, Cui et al., 2006b,
Carino et al., 2000, Sun et al., 2011a, Teply et al., 2008, Cheng et al., 2006,
Pan et al., 2002, Li et al., 2004, Wu et al., 2012b). In vivo they increased its
oral bioavailability compared to an orally administered insulin solution. Oral
bioavailabilities, compared to an injected dose of insulin, ranged between 5.11
and 15.9% in rodents (Sun et al., 2011b, Cui et al., 2006b, Carino et al., 2000,
Sun et al., 2011a, Teply et al., 2008, Pan et al., 2002, Li et al., 2004, Wu et al.,
2012b).
198
Non-peptide cancer drugs have also been encapsulated in PLGA particles;
doxorubicin (Wang et al., 2009), cisplatin (Dhar et al., 2008) and paclitaxel
(Danhier et al., 2009). They induced apoptosis of cancer cells in vitro (Wang et
al., 2009) and produced a greater effect than an unencapsulated drug (Danhier
et al., 2009).
4.1.5.1 PLGA particles- stability and permeability enhancement
PLGA particles provide a physical barrier between an encapsulated drug and
the acidic pH of the stomach and enzymes of the gastrointestinal tract thereby
increasing their oral bioavailability.
PLGA particles have shown their ability to increase the in vitro permeability of a
hydrophilic marker (Cohen-Sela et al., 2009), paclitaxel (Westedt et al., 2007),
salmon calcitonin (Yoo and Park, 2004) and BSA (Panyam et al., 2003)
compared to an unencapsulated drug in cell culture models (RAW 264 cells,
rabbit vascular smooth muscle cells, Caco-2 cells, rabbit conjunctival epithelial
cells). After uptake the particles could be seen within the cells (Westedt et al.,
2007)
As the PLGA particles are more lipophilic than the encapsulated hydrophilic
protein or peptide their transport across the lipid membrane of cells can be
increased and their transcellular transport has been observed (des Rieux et al.,
2007). Studies with rabbit conjunctival epithelial cells and Caco-2 cells
demonstrated the TEER was unchanged with PLGA particles indicating the
junctions between cells were not opened and their transport was transcellular
not paracellular (Qaddoumi et al., 2004, Yoo and Park, 2004).
The M cells of Peyer’s patches, lymphoid nodules found in the small intestine,
are a potential portal for PLGA particle uptake. M cells sample and transport
intact antigens from the GI tract to underlying lymphoid tissues and have high
transcytosis capabilities. This route of nanoparticle absorption appears to be
preferred to that via the enterocytes (Kim et al., 2002). A human M cell culture
model increased PLGA particle uptake 600 fold compared to a Caco-2 cell
model (des Rieux et al., 2007). There was also greater uptake of PLGA
particles in a rat in situ intestinal loop model in areas with Peyer’s patches than
in areas without (Desai et al., 1996).
199
However it is not known how relevant these studies are to indicate human in
vivo behaviour as rodents have a higher percentage of M cells, 10-50%, in their
Peyer’s patches compared to humans, with only 5%.
The size of the PLGA particles appears to be crucial to their permeation. PLGA
particle uptake was found to be size dependent in Caco-2 cells (Gaumet et al.,
2009), rat in situ intestinal loop (Desai et al., 1996) and rabbit conjunctival
epithelial cells (Qaddoumi et al., 2004). In all cases the smallest 100nm
particles showed the highest uptake compared to larger particles (Gaumet et
al., 2009, Desai et al., 1996, Qaddoumi et al., 2004). PLGA particles of 100nm
and 300nm were seen intracellularly in Caco-2 cells whereas those greater than
300nm were not but were observed on the apical membrane of Caco-2 cells
(Gaumet et al., 2009). Particles of 100nm diffused through submucosal layers
of a rat intestinal loop but particles of 500nm or greater were localised in the
epithelial lining (Desai et al., 1996). Ideally PLGA particles for oral delivery of
proteins and peptides should be less than 300nm for successful absorption.
Oral bioavailabilities of protein/peptide drugs encapsulated in PLGA particles
can be further increased by chitosan coating. Its mucoadhesive properties,
positive charge, enhancing interaction with negatively charged GI tract cells,
and ability to open paracellular channels have increased the in vitro absorption
and in vivo bioavailability in rats of buserelin (Kotze et al., 1997a, Thanou et al.,
2000a, Kotze et al., 1997b), insulin (Zhang et al., 2012a), cyclosporine A
(Malaekeh-Nikouei et al., 2008) and elcatonin (Kawashima et al., 2000). Insulin
oral bioavailability in rats was increased from 7.6% to 10.5% when PLGA
particles were coated with chitosan (Zhang et al., 2012a).
4.1.5.2 Formation of PLGA particles
PLGA particles can be formed by many methods, a single emulsion method can
be used for hydrophobic molecules but for hydrophilic proteins and peptides the
most frequently used method is the water in oil in water (w/o/w) double
emulsion solvent evaporation method. Commercial, injectable PLGA
microspheres of leuprorelin were produced using this method (Okada, 1997).
200
Nanoparticles encapsulating protein and peptide drugs with a mean size less
than 300nm were produced (Yang et al., 2012, Pan et al., 2002, Wu et al.,
2012b, Garinot et al., 2007) with protein/peptide encapsulation efficiencies from
30% to 80% (Yang et al., 2012, Teply et al., 2008, Cheng et al., 2006, Pan et
al., 2002, Li et al., 2004, Wu et al., 2012b, Garinot et al., 2007, Gupta et al.,
2007) demonstrating the suitability of this method for their production. Varying
the parameters of the w/o/w method can affect the physicochemical
characteristics of the PLGA particles and these in turn affect their behaviour in
vitro and in vivo.
4.1.5.3 Overcoming drug burst release from PLGA particles
One of the common problems encountered with protein/peptide drug loaded
PLGA particles is their uncontrolled initial burst release (Yang et al., 2012, Cui
et al., 2006b, Carino et al., 2000, Pan et al., 2002, Wu et al., 2012b, Yoo and
Park, 2004, Blanco and Alonso, 1998, Panyam et al., 2003, Luan et al., 2006).
This initial burst could be detrimental to the oral bioavailability of an
encapsulated peptide drug as it would be released and potentially destroyed in
the GI tract before being absorbed into the bloodstream. This initial burst could
be due to the peptide being present at the surface of the particles or released
from pores in the particle. To prevent burst release in the stomach enteric
polymers have been used in conjunction with or to coat polymeric particles.
Encapsulation of protein/peptide loaded nanoparticles in microparticles has also
reduced burst release. Reduction of burst release can reduce degradation and
increase the amount of intact drug which can be absorbed.
Enteric coatings reduced in vitro drug release in acid and reduced pepsin
digestion of insulin and ovalbumin loaded in PLGA particles (Naha et al., 2008,
Cui et al., 2006a, Delgado et al., 1999, Wu et al., 2012b). Enteric coating of
PLGA/PLA particles also increased bioavailability and produced a sustained
effect in vivo, compared to uncoated particles, of insulin (Naha et al., 2008, Cui
et al., 2006a), ovalbumin (Delgado et al., 1999), leuprorelin (Iqbal et al., 2011)
and calcitonin (Cetin et al., 2012). Oral bioavailability of encapsulated insulin
was increased from 3.68% to 6.27% by enteric coating (Cui et al., 2006a). Oral
leuprorelin bioavailability increased 4.2 fold following enteric coating of tablets
of drug loaded polyacrylic acid nanoparticles (Cetin et al., 2012).
201
Microencapsulation of poly ε caprolactone nanoparticles in microparticles of
ethylcellulose or Eudragit RS or a blend of these polymers reduced in vitro burst
release of triptorelin from 71% from the nanoparticles to only 5.4% from the
ethylcellulose/Eudragit RS blend microparticles (Hasan et al., 2007).
4.2 Aims
To assess the stability of peptide 1 throughout the GI tract using
simulated and porcine gastrointestinal fluids and human faecal fluids
o To use this knowledge for optimal targeting and rational design of
oral peptide 1 delivery vehicles
o To gain an insight into the oral stability of small peptides
To produce oral peptide 1 formulations based on the intestinal stability
study, previous studies of peptide intestinal permeability, existing delivery
strategies for chemotherapeutic peptides and research into peptide oral
delivery strategies
o To characterise their physical characteristics (size, polydispersity,
morphology, charge), loading and encapsulation efficiency
o To assess their in vitro peptide 1 release
o To assess the impact of varying method parameters
o To select method parameters which produce formulations with the
highest probability for successful oral delivery
To improve the permeability and peptide release profile by additional
coatings/enteric encapsulation
4.3 Materials
Peptide 1 was supplied by Thermo Scientific. Pepsin from porcine gastric
mucosa, 469 units/mg solid, 924 units/mg protein, pancreatin from porcine
pancreas, activity at least 3x USP specifications and trifluoroacetic acid were
from Sigma Aldrich. Hydrochloric acid 37%, specific gravity 1.18, and glacial
acetic acid (100%) were from BDH. Acetonitrile HPLC grade was from Fisher
Scientific. Pig gastric and intestinal fluids were from freshly slaughtered pigs
and immediately frozen and store at -80⁰C. Human faecal fluids were from
healthy individuals not taking antibiotics.
202
Faecal basal media materials: Bacteriological peptone and yeast extract were
from Oxoid. Sodium chloride, L-cysteine hydrochloride, vitamin K, resazurin
sodium salt and sodium hydroxide were from Fisher Scientific. Dipotassium
hydrogen orthophosphate and magnesium sulphate 7-hydrate were from BDH.
Calcium chloride dihydrate was from VWR. NaHCO3 and haemin were from
Sigma Aldrich. Bile salts were from Fluka Analytical. Tween 80 was from
Fluka Chemika.
Poly (lactic-co-glycolic acid) (PLGA), 5050 DLG 2A was from Lakeshore
Biomaterials (USA). Polyvinyl alcohol (PVA), 87-89% hydrolysed, and
monobasic potassium phosphate were from Sigma Aldrich. Dichloromethane
(DCM) was from VWR. Ethanol, 96% v/v, was from BDH. Chitooligosaccharide
(1-4) 2-amino-2-deoxy-β-D-glucose, (chitosan) average molecular weight 5K
was from KittoLife.
MDA-MB-231 breast cancer cells were from the American type culture
collection (ATCC), Manassas, USA. Crystal violet ACS reagent, anhydrous dye
>=90% was from Sigma Aldrich. PrestoBlueTM cell viability reagent, Gibco
0.25% trypsin-EDTA, Gibco Leibovitz’s L15 medium, Penicillin-Streptomycin
liquid, and fetal bovine serum were from Invitrogen
Eudragit L100 was a gift from Degussa/ Evonik (Darmstadt, Germany), sorbitan
sesquioleate (Alacel 83) and phosphate buffered saline tablets (PBS) were from
Sigma Aldrich. Liquid paraffin BP was supplied by JM Loveridge Plc. Sodium
phosphate, tribasic, anhydrous was from Alfa Aesar. n-hexane was from Fisher
Scientific.
4.4 Methods
4.4.1 Peptide 1 intestinal stability
100µl of a 10mg/ml peptide 1 solution was added to 1.9ml of simulated gastric
fluid (SGF) with and without pepsin and simulated intestinal fluid (SIF) with and
without pancreatin (final peptide 1 concentration of 0.5mg/ml). These were
placed in a Gallenkamp shaking incubator at 37±0.5°C and agitated at 100rpm.
203
Samples (0.15ml) were removed after 0, 15, 30, 60, 90 and 120 minutes and
added to either 0.45ml 0.002M NaOH to raise the pH of acidic fluids or 50%
acetic acid to lower the pH of SIF to halt the reaction (final peptide 1
concentration 0.125mg/ml). These samples were analysed for peptide 1
content using HPLC. SGF and SIF were prepared as described in chapter 2,
section 2.4.2.
100μl of a 10mg/ml peptide 1 solution was added to 1.9ml of gastric (pH 2.31),
duodenal (pH 6.55), jejunal (pH 6.79), ileal (pH 6.86) and descending colonic
fluids (pH 7.06) from a pig, giving a final peptide 1 concentration of 0.5mg/ml.
The pig intestinal fluids were prepared by centrifuging at 10,000rpm for 10
minutes and using the supernatant for testing. These mixtures were placed in a
Gallenkamp shaking incubator at the parameters used for the simulated fluids.
Samples (0.15ml) were removed after 0, 15, 30, 60, 90 and 120 minutes and
added to either 0.45ml of 0.002M NaOH to raise the pH of acidic fluids or 50%
acetic acid to lower the pH of small and large intestinal fluids and halt the
reaction (final peptide 1 concentration 0.125mg/ml). These samples were
filtered using 0.45µm filters (Millex GP, Millipore, Ireland) and analysed for
peptide 1 content using HPLC.
0.05ml of a 10mg/ml peptide 1 solution was added to 0.95ml of human faecal
slurry and placed in a Gallenkamp shaking incubator at the parameters used in
the previous tests (final peptide 1 concentration 0.5mg/ml). Samples (0.15ml)
were removed after 0, 15, 30, 60, 90 and 120 minutes and added to 0.45ml
50% acetic acid to halt the reaction (final peptide 1 concentration 0.125mg/ml).
These samples were centrifuged at 10,000rpm for 10 minutes and the
supernatants analysed for peptide 1 content using HPLC. The human faecal
slurry was prepared as described in chapter 2, section 2.4.2.1.
Peptide 1 recovery in the withdrawn samples was calculated using the equation
below. The theoretical concentration of the sample is the concentration of
peptide 1 assuming 100% recovery.:
Peptide 1 recovered (%)=
x100
204
4.4.1.1 Statistics
The peptide 1 degradation data from gastric and small intestinal fluids were
analysed using a simple regression model using least squares. Assuming a
zero order degradation rate, the concentration of peptide 1 in the samples was
plotted against time. The slope of this line is defined as –k, the rate constant is
k. This is used to determine the half life (t ½) of the peptide in the intestinal
fluids using this equation where C[0] is the concentration of peptide 1 (µg/ml) at
time 0:
t ½=
The data from peptide 1 degradation in porcine colonic and human faecal fluids
were analysed as a first order reaction. The natural log (ln) of the concentration
of peptide 1 was plotted against time. The slope of this line is defined is –k, the
rate constant is k.
Half life of the peptide is calculated using this equation:
t½=
The slope of the regression line was assessed for significance by one way
ANOVA. Comparisons between the rate constants and half lives of peptide 1 in
different intestinal fluids were performed by one way ANOVA. Values of p≤0.05
were considered significant. All statistical analyses were determined using
Minitab 15.
4.4.2 HPLC method
Samples were run in a mobile phase of 0.1% (v/v) trifluoroacetic acid in water
and 0.1% trifluoroacetic acid in acetonitrile (5-45%) at 25°C. Samples were
separated with a C18 column and detected at 220nm.
4.4.3 Formation of PLGA nanoparticles
The method used to produce PLGA nanoparticles was a double emulsion
solvent evaporation process based on those previously used to encapsulate
protein and peptide drugs (Garinot et al., 2007, Yang et al., 2012, Pan et al.,
2002, Wu et al., 2012b). The process is outlined in figure 4.1.
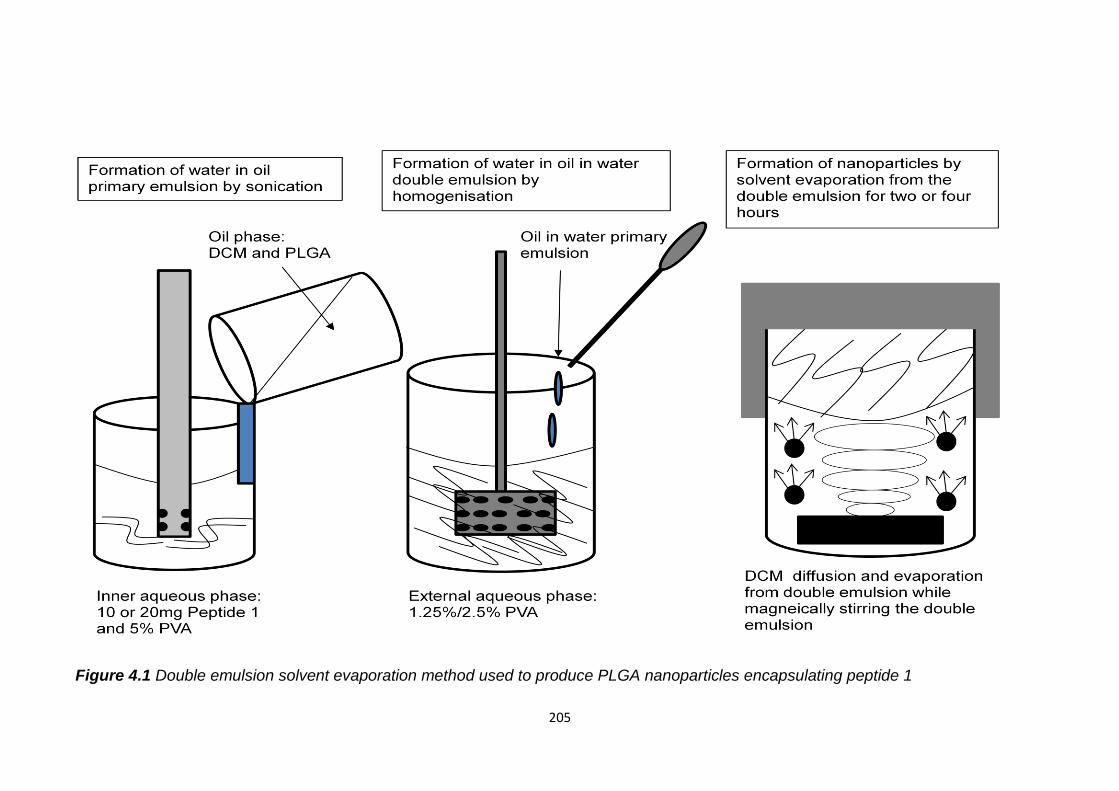
205
Figure 4.1 Double emulsion solvent evaporation method used to produce PLGA nanoparticles encapsulating peptide 1
206
PLGA (200mg) samples were dissolved in DCM (5ml). An inner aqueous phase
(1ml) of 5% PVA, a stabiliser, was added to the PLGA solutions to form blank
nanoparticles. For peptide 1 nanoparticles, peptide 1 (10 or 20mg) was
dissolved in the inner aqueous phase and left for 20 minutes prior to primary
emulsification giving ratios of PLGA to peptide of 10:1 and 20:1. These were
emulsified with an Ultra Turrax T25 homogeniser at 24000rpm for one minute
and sonicated at 17 microns amplitude with a Sanyo Soniprep 150 probe
sonicator for five minutes to form a primary water in oil emulsion. The
emulsions were added dropwise to an outer aqueous phase (40ml) and
emulsified at 10000rpm with a Silverson L4RT mixer for 5 minutes. The outer
aqueous phase varied in PVA concentration; either 1.25% PVA, 2.5% PVA.
All emulsification and sonication steps were carried out with the samples on ice
to protect the peptide from thermal denaturation (Zambaux et al., 1998). The
double emulsions were magnetically stirred for either 2 or 4 hours during
solvent evaporation. The nanoparticles were separated by centrifuging at
21000 rpm, RCF 41415 at 15°C for 20 minutes in a Sigma 3K30 centrifuge.
Supernatants were poured off and retained for analysis of peptide 1 content by
HPLC. The nanoparticles were resuspended and washed in water and
centrifuged again using the same parameters. The supernatants were retained
and analysed for peptide 1 content by HPLC. Pellets were finally re-suspended
in DI water (5ml).
The supernatants from the centrifugation of the double emulsions and from
washing the nanoparticles were analysed for peptide 1 content using HPLC and
this was subtracted from the initial amount of peptide 1 added. Encapsulation
efficiency (EE) and drug loading were calculated using these equations:
EE (%) =
x100
Drug loading=
x1000
(Drug loading =μg peptide 1/mg nanoparticles)
Each nanoparticle sample was dispersed in DI water for size, polydispersity and
zeta potential measurements using a Malvern Zetasizer nano Z-S.
207
The nanoparticle suspensions were freeze dried using a VirTis Advantage
freeze dryer using the parameters described in chapter 2, section 2.4.8. The
resulting powder was weighed and the yield determined using the equation
below.
Yield (%)=
x100
The morphology and size of the freeze dried nanoparticles were examined by
scanning electron microscopy (SEM) (Philips XL30, Eindhoven, Holland).
Nanoparticles were fastened on a SEM stub using carbon adhesive pads and
then coated with gold using an Emitech K550 sputter coater. Routine, high
vacuum imaging at 10/5kV was used.
4.4.3.1 In vitro peptide 1 release
Nanoparticles (10mg) with encapsulated peptide 1 were placed in a glass vial
with 1ml PBS, pH 7.4, in triplicate. Samples were placed in a Gallenkamp
shaking incubator at 100rpm, 37°C. After 30 minutes, 2, 4, 8 and 24 hours
samples were centrifuged at 10,000rpm for 10 minutes and 0.5ml of the
supernatant analysed for peptide 1 content by HPLC. 0.5ml of fresh PBS was
added to replace the 0.5ml removed, the nanoparticles were resuspended and
the samples returned to the shaking incubator. Those nanoparticles prepared
after a solvent evaporation period of 2 hours were also sampled after 1 and 2
weeks.
Peptide 1 release (%)=
4.4.4 Chitosan coated PLGA nanoparticles
Chitosan coated PLGA nanoparticles were prepared as described above with a
1:20 ratio of peptide 1 to PLGA but with a 1% 5K chitosan/1.25% PVA external
aqueous phase. Size and morphology of the nanoparticles were assessed as
described previously. The yield was calculated in the same way but the weight
of excipients also included the chitosan added. The peptide 1 loading and
encapsulation efficiency were determined as before. In vitro peptide 1 release
from the chitosan coated nanoparticles (20mg) was performed in PBS as
described for the uncoated particles and monitored over 2 weeks.
208
4.4.5 Peptide 1 efficacy
MDA-MB-231 (ATCC HTB-26) breast cancer cells were cultured in Leibovitz’s
L-15 medium with 15% fetal bovine serum and 1% penicillin-streptomycin
solution in an incubator without CO2 at 37°C. 2 x 10⁵ cells per well were plated
in 24 well plates in 100µl culture medium, to these either 1µM of peptide 1
alone, peptide 1 encapsulated in PLGA nanoparticles, peptide 1 encapsulated
in chitosan coated PLGA nanoparticles, blank or blank chitosan coated PLGA
nanoparticles were added in 100µl culture medium. Some of the cells were left
without peptide or formulation. After 24 hours incubation the cells were
trypsinised and transferred to 12 well plates. After 6 days further incubation the
cells were tested for viability. This was to determine the effect of peptide 1 on
breast cancer cell proliferation and the effects on peptide 1 efficacy caused by
its encapsulation in PLGA nanoparticles.
After removing and refreshing the culture media PrestoBlueTM cell viability
reagent was added to the cells and incubated for 2 hours at 37°C. This reagent
is a resazurin based solution that is reduced by metabolically active cells
changing colour to red to give a measure of cell viability. 100µl samples were
plated in a 96 well plate and their absorbance at 550nm measured using a Bio-
Tek Powerwave XS plate reader.
The medium with the viability reagent was removed and the cells washed twice
with PBS. The cells were fixed with methanol for 5 minutes. This was removed
and 0.05% w/v crystal violet solution added to the cells to stain remaining cells.
After 30 minutes the stain was removed and the cells washed twice with PBS.
After drying, methanol was added to solubilise the dye, transferred to a 96 well
plate and absorption measured at 550nm using a plate reader as before.
4.4.6 Enteric microparticles
To overcome any immediate burst release of peptide 1 from the PLGA
nanoparticles in the stomach the strategies of enteric coating and
microencapsulation of nanoparticles were combined.
209
Due to the ability of Eudragit L100 microparticles prepared using the Kendall et
al. method to encapsulate lactase and insulin without damaging them, elicit a
pH dependent release and provide protection from pepsin they were selected to
encapsulate peptide 1 loaded PLGA nanoparticles. As this method uses
ethanol to dissolve Eudragit L100, rather than DCM, it will be suitable to
encapsulate intact nanoparticles as PLGA is not soluble in ethanol.
Enteric microparticles encapsulating peptide 1 alone and PLGA nanoparticles
with peptide 1 were prepared with the substitution of peptide 1 or peptide 1
loaded PLGA nanoparticles for prednisolone (Kendall et al., 2009). The
amounts of excipients used were scaled down for the reduced amounts of
peptide 1 and peptide 1 loaded nanoparticles available. Eudragit L100 (300mg)
was dissolved in ethanol (3ml). Peptide 1 (20mg) was suspended in the ethanol
to prepare microparticles with a drug to polymer weight ratio of 1:15. PLGA
nanoparticles (30mg), with a 1:20 peptide 1:PLGA initial ratio prepared with
1.25% PVA outer aqueous phase after a solvent evaporation of 2 hours, were
added to the polymeric solution to prepare microparticles with a nanoparticle to
microparticle weight ratio of 1:10.
The polymeric suspensions with either peptide 1 or peptide 1 PLGA
nanoparticles were emulsified into liquid paraffin (20ml), containing 1% (w/w) of
sorbitan sesquioleate (Arlacel 83) as an emulsifying agent, using a Heidolph
RZR1 stirrer at 1500rpm. Stirring proceeded for 18 hours at room temperature
to allow solvent evaporation and particle solidification. The microparticles
formed were recovered by vacuum filtration through a Pyrex sintered glass filter
(pore size 4; 5-15μm) and washed three times with n-hexane (50ml). The
microparticle formulations were prepared in triplicate. Blank microparticles
containing no peptide 1 and microparticles with blank nanoparticles (30mg)
were also prepared using the same parameters
The yield and size of the microparticles, measured using a Malvern Mastersizer,
were determined as described in chapter 2, section 2.4.6.1. The morphology
and size of the microparticles were examined by scanning electron microscopy
(SEM) (Philips XL30, Eindhoven, Holland), with routine, high vacuum imaging at
5kV as described in chapter 2, section 2.4.6.2.
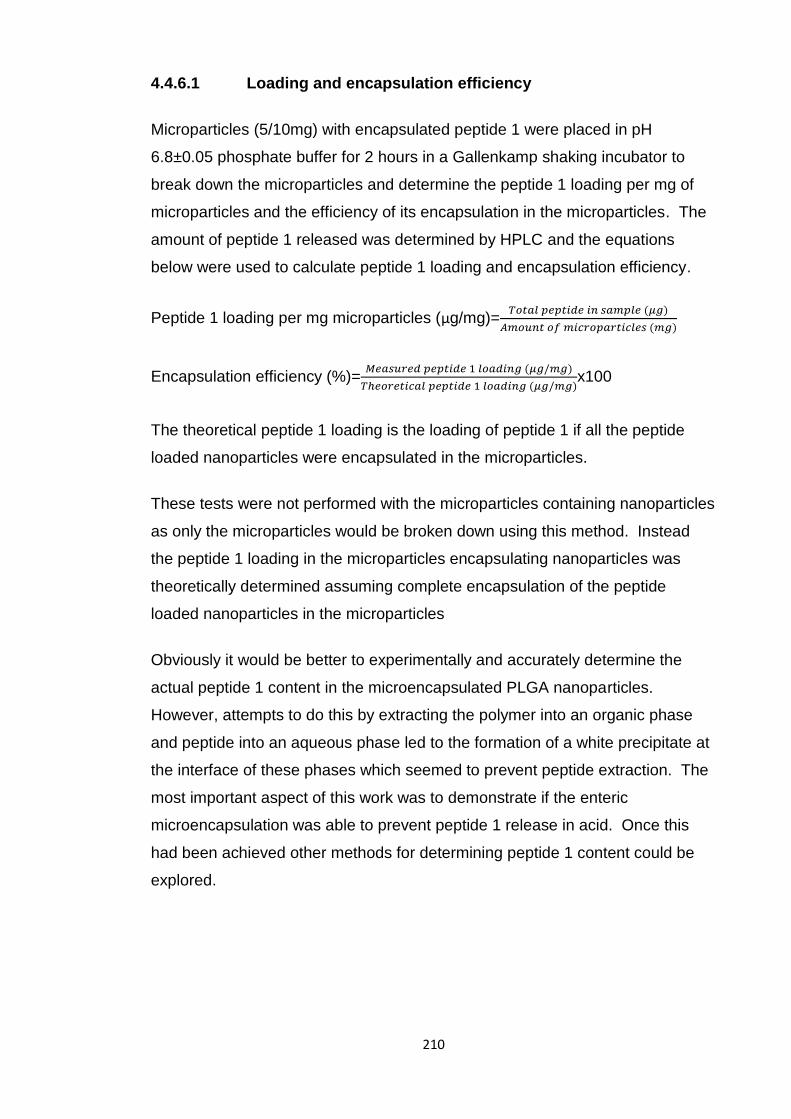
210
4.4.6.1 Loading and encapsulation efficiency
Microparticles (5/10mg) with encapsulated peptide 1 were placed in pH
6.8±0.05 phosphate buffer for 2 hours in a Gallenkamp shaking incubator to
break down the microparticles and determine the peptide 1 loading per mg of
microparticles and the efficiency of its encapsulation in the microparticles. The
amount of peptide 1 released was determined by HPLC and the equations
below were used to calculate peptide 1 loading and encapsulation efficiency.
Peptide 1 loading per mg microparticles (μg/mg)=
Encapsulation efficiency (%)=
x100
The theoretical peptide 1 loading is the loading of peptide 1 if all the peptide
loaded nanoparticles were encapsulated in the microparticles.
These tests were not performed with the microparticles containing nanoparticles
as only the microparticles would be broken down using this method. Instead
the peptide 1 loading in the microparticles encapsulating nanoparticles was
theoretically determined assuming complete encapsulation of the peptide
loaded nanoparticles in the microparticles
Obviously it would be better to experimentally and accurately determine the
actual peptide 1 content in the microencapsulated PLGA nanoparticles.
However, attempts to do this by extracting the polymer into an organic phase
and peptide into an aqueous phase led to the formation of a white precipitate at
the interface of these phases which seemed to prevent peptide extraction. The
most important aspect of this work was to demonstrate if the enteric
microencapsulation was able to prevent peptide 1 release in acid. Once this
had been achieved other methods for determining peptide 1 content could be
explored.
211
4.4.6.2 In vitro release
Peptide 1 PLGA nanoparticles, peptide 1 Eudragit L100 microparticles and
peptide 1 PLGA nanoparticles encapsulated in Eudragit L100 microparticles
were placed in 0.75 ml 0.1N HCl, pH 1.2 ± 0.05, for 2 hours to simulate gastric
conditions. The pH was then raised to pH 6.8 ± 0.05 by the addition of 0.25ml
0.2M tribasic sodium phosphate to simulate the small intestine. Samples were
placed in a Gallenkamp shaking incubator at 100rpm, 37±0.5°C. After 30
minutes, 2, 4, 8 and 24 hours samples were taken from the nanoparticle
mixture, centrifuged at 10,000rpm for 10 minutes and 0.5ml of the supernatant
analysed for peptide 1 release by HPLC. After 30 minutes, 2 hours and 2 hours
and 45 minutes samples were taken from the microparticle mixtures,
centrifuged and analysed in the same way. 0.5ml of 0.1N HCl/pH 6.8
phosphate buffer were added to replace that removed, the particles
resuspended and the samples returned to the shaking incubator after each
sampling time point. Cumulative peptide 1 release was calculated as in section
4.4.4.
4.4.7 Statistics
Differences in particle characteristics caused by altering the method
parameters, chitosan coating or enteric microencapsulation were assessed for
significance by one-way ANOVA using the Minitab 15 program. Results were
considered to be significant for p values ≤0.05.
4.5 Results and Discussion
4.5.1 Peptide 1 intestinal stability
The stability of peptide 1 was assessed in simulated and pig intestinal fluids and
in human faecal fluids. This was used to design oral formulations of peptide 1.
4.5.1.1 Gastric fluids
More than 70% of intact peptide 1 was recovered from SGF, with and without
pepsin, and porcine gastric fluid after 2 hours incubation, table 4.2. In SGF
without pepsin there was more than 90% intact peptide 1 recovered suggesting
it has high stability at gastric pH possibly due to its small size and lack of higher
structure which can be disrupted at this pH.
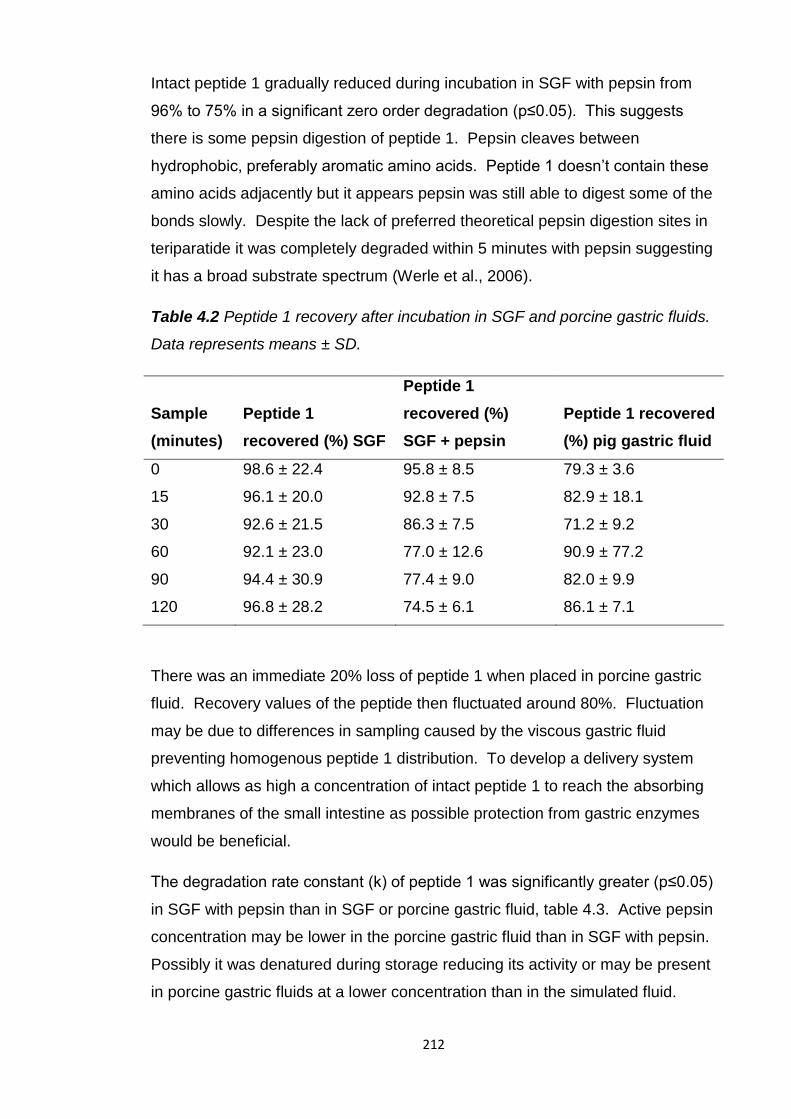
212
Intact peptide 1 gradually reduced during incubation in SGF with pepsin from
96% to 75% in a significant zero order degradation (p≤0.05). This suggests
there is some pepsin digestion of peptide 1. Pepsin cleaves between
hydrophobic, preferably aromatic amino acids. Peptide 1 doesn’t contain these
amino acids adjacently but it appears pepsin was still able to digest some of the
bonds slowly. Despite the lack of preferred theoretical pepsin digestion sites in
teriparatide it was completely degraded within 5 minutes with pepsin suggesting
it has a broad substrate spectrum (Werle et al., 2006).
Table 4.2 Peptide 1 recovery after incubation in SGF and porcine gastric fluids.
Data represents means ± SD.
Sample
(minutes)
Peptide 1
recovered (%) SGF
Peptide 1
recovered (%)
SGF + pepsin
Peptide 1 recovered
(%) pig gastric fluid
0 98.6 ± 22.4 95.8 ± 8.5 79.3 ± 3.6
15 96.1 ± 20.0 92.8 ± 7.5 82.9 ± 18.1
30 92.6 ± 21.5 86.3 ± 7.5 71.2 ± 9.2
60 92.1 ± 23.0 77.0 ± 12.6 90.9 ± 77.2
90 94.4 ± 30.9 77.4 ± 9.0 82.0 ± 9.9
120 96.8 ± 28.2 74.5 ± 6.1 86.1 ± 7.1
There was an immediate 20% loss of peptide 1 when placed in porcine gastric
fluid. Recovery values of the peptide then fluctuated around 80%. Fluctuation
may be due to differences in sampling caused by the viscous gastric fluid
preventing homogenous peptide 1 distribution. To develop a delivery system
which allows as high a concentration of intact peptide 1 to reach the absorbing
membranes of the small intestine as possible protection from gastric enzymes
would be beneficial.
The degradation rate constant (k) of peptide 1 was significantly greater (p≤0.05)
in SGF with pepsin than in SGF or porcine gastric fluid, table 4.3. Active pepsin
concentration may be lower in the porcine gastric fluid than in SGF with pepsin.
Possibly it was denatured during storage reducing its activity or may be present
in porcine gastric fluids at a lower concentration than in the simulated fluid.
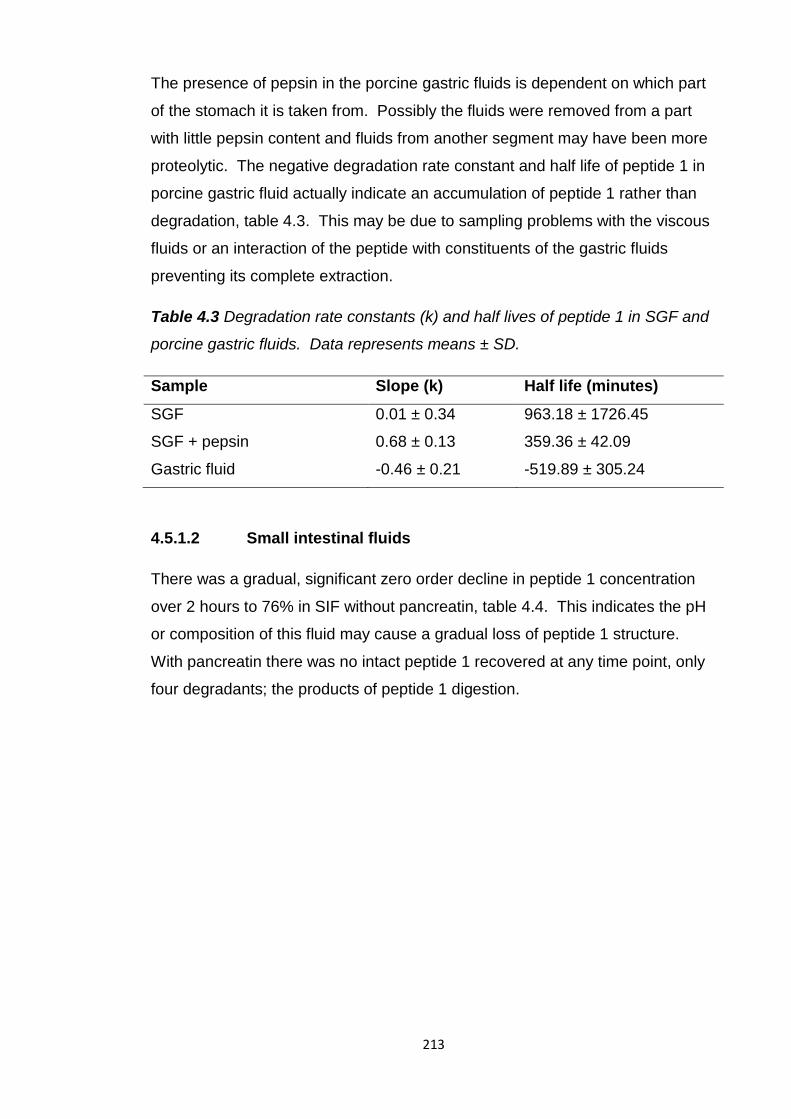
213
The presence of pepsin in the porcine gastric fluids is dependent on which part
of the stomach it is taken from. Possibly the fluids were removed from a part
with little pepsin content and fluids from another segment may have been more
proteolytic. The negative degradation rate constant and half life of peptide 1 in
porcine gastric fluid actually indicate an accumulation of peptide 1 rather than
degradation, table 4.3. This may be due to sampling problems with the viscous
fluids or an interaction of the peptide with constituents of the gastric fluids
preventing its complete extraction.
Table 4.3 Degradation rate constants (k) and half lives of peptide 1 in SGF and
porcine gastric fluids. Data represents means ± SD.
Sample Slope (k) Half life (minutes)
SGF 0.01 ± 0.34 963.18 ± 1726.45
SGF + pepsin 0.68 ± 0.13 359.36 ± 42.09
Gastric fluid -0.46 ± 0.21 -519.89 ± 305.24
4.5.1.2 Small intestinal fluids
There was a gradual, significant zero order decline in peptide 1 concentration
over 2 hours to 76% in SIF without pancreatin, table 4.4. This indicates the pH
or composition of this fluid may cause a gradual loss of peptide 1 structure.
With pancreatin there was no intact peptide 1 recovered at any time point, only
four degradants; the products of peptide 1 digestion.
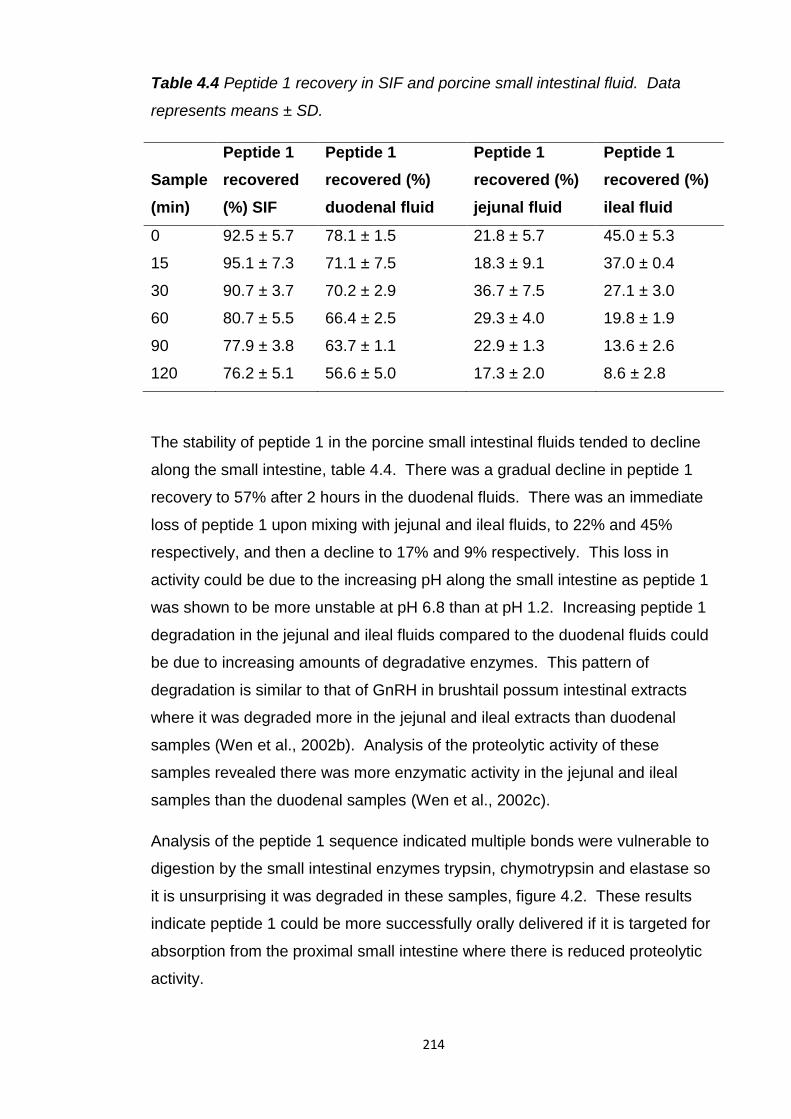
214
Table 4.4 Peptide 1 recovery in SIF and porcine small intestinal fluid. Data
represents means ± SD.
Sample
(min)
Peptide 1
recovered
(%) SIF
Peptide 1
recovered (%)
duodenal fluid
Peptide 1
recovered (%)
jejunal fluid
Peptide 1
recovered (%)
ileal fluid
0 92.5 ± 5.7 78.1 ± 1.5 21.8 ± 5.7 45.0 ± 5.3
15 95.1 ± 7.3 71.1 ± 7.5 18.3 ± 9.1 37.0 ± 0.4
30 90.7 ± 3.7 70.2 ± 2.9 36.7 ± 7.5 27.1 ± 3.0
60 80.7 ± 5.5 66.4 ± 2.5 29.3 ± 4.0 19.8 ± 1.9
90 77.9 ± 3.8 63.7 ± 1.1 22.9 ± 1.3 13.6 ± 2.6
120 76.2 ± 5.1 56.6 ± 5.0 17.3 ± 2.0 8.6 ± 2.8
The stability of peptide 1 in the porcine small intestinal fluids tended to decline
along the small intestine, table 4.4. There was a gradual decline in peptide 1
recovery to 57% after 2 hours in the duodenal fluids. There was an immediate
loss of peptide 1 upon mixing with jejunal and ileal fluids, to 22% and 45%
respectively, and then a decline to 17% and 9% respectively. This loss in
activity could be due to the increasing pH along the small intestine as peptide 1
was shown to be more unstable at pH 6.8 than at pH 1.2. Increasing peptide 1
degradation in the jejunal and ileal fluids compared to the duodenal fluids could
be due to increasing amounts of degradative enzymes. This pattern of
degradation is similar to that of GnRH in brushtail possum intestinal extracts
where it was degraded more in the jejunal and ileal extracts than duodenal
samples (Wen et al., 2002b). Analysis of the proteolytic activity of these
samples revealed there was more enzymatic activity in the jejunal and ileal
samples than the duodenal samples (Wen et al., 2002c).
Analysis of the peptide 1 sequence indicated multiple bonds were vulnerable to
digestion by the small intestinal enzymes trypsin, chymotrypsin and elastase so
it is unsurprising it was degraded in these samples, figure 4.2. These results
indicate peptide 1 could be more successfully orally delivered if it is targeted for
absorption from the proximal small intestine where there is reduced proteolytic
activity.
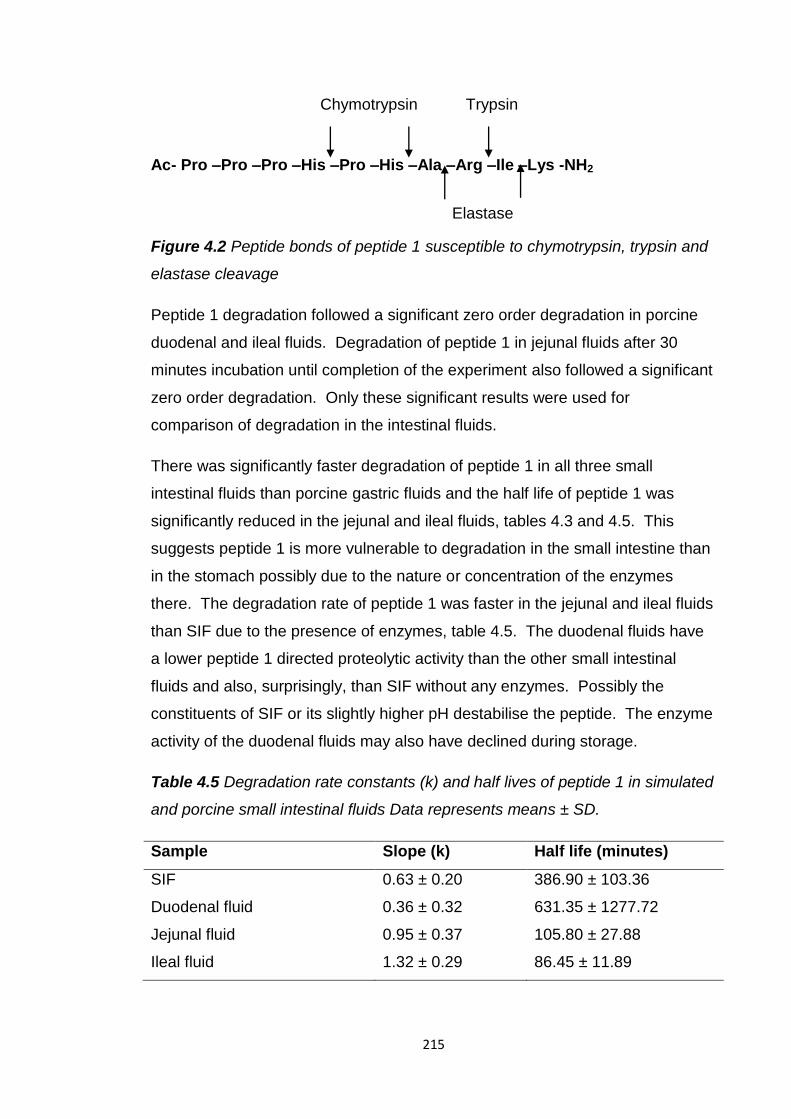
215
Ac- Pro –Pro –Pro –His –Pro –His –Ala –Arg –Ile –Lys -NH2
Figure 4.2 Peptide bonds of peptide 1 susceptible to chymotrypsin, trypsin and
elastase cleavage
Peptide 1 degradation followed a significant zero order degradation in porcine
duodenal and ileal fluids. Degradation of peptide 1 in jejunal fluids after 30
minutes incubation until completion of the experiment also followed a significant
zero order degradation. Only these significant results were used for
comparison of degradation in the intestinal fluids.
There was significantly faster degradation of peptide 1 in all three small
intestinal fluids than porcine gastric fluids and the half life of peptide 1 was
significantly reduced in the jejunal and ileal fluids, tables 4.3 and 4.5. This
suggests peptide 1 is more vulnerable to degradation in the small intestine than
in the stomach possibly due to the nature or concentration of the enzymes
there. The degradation rate of peptide 1 was faster in the jejunal and ileal fluids
than SIF due to the presence of enzymes, table 4.5. The duodenal fluids have
a lower peptide 1 directed proteolytic activity than the other small intestinal
fluids and also, surprisingly, than SIF without any enzymes. Possibly the
constituents of SIF or its slightly higher pH destabilise the peptide. The enzyme
activity of the duodenal fluids may also have declined during storage.
Table 4.5 Degradation rate constants (k) and half lives of peptide 1 in simulated
and porcine small intestinal fluids Data represents means ± SD.
Sample Slope (k) Half life (minutes)
SIF 0.63 ± 0.20 386.90 ± 103.36
Duodenal fluid 0.36 ± 0.32 631.35 ± 1277.72
Jejunal fluid 0.95 ± 0.37 105.80 ± 27.88
Ileal fluid 1.32 ± 0.29 86.45 ± 11.89
Elastase
Chymotrypsin Trypsin
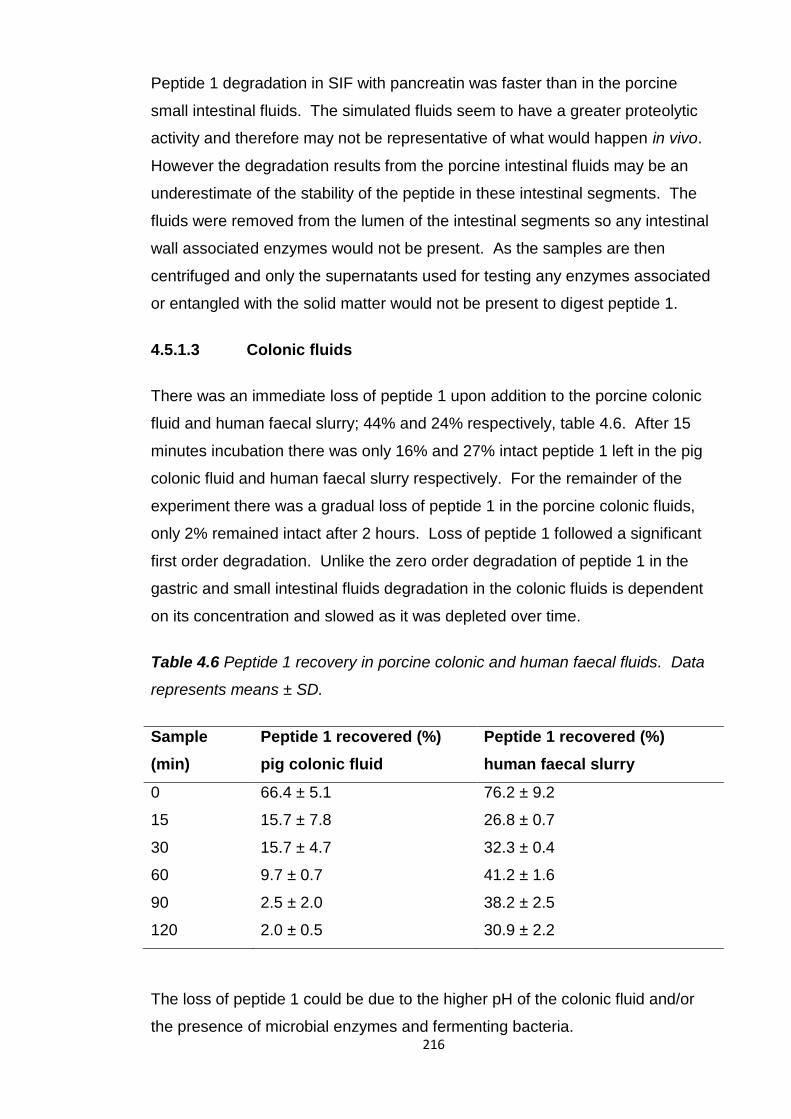
216
Peptide 1 degradation in SIF with pancreatin was faster than in the porcine
small intestinal fluids. The simulated fluids seem to have a greater proteolytic
activity and therefore may not be representative of what would happen in vivo.
However the degradation results from the porcine intestinal fluids may be an
underestimate of the stability of the peptide in these intestinal segments. The
fluids were removed from the lumen of the intestinal segments so any intestinal
wall associated enzymes would not be present. As the samples are then
centrifuged and only the supernatants used for testing any enzymes associated
or entangled with the solid matter would not be present to digest peptide 1.
4.5.1.3 Colonic fluids
There was an immediate loss of peptide 1 upon addition to the porcine colonic
fluid and human faecal slurry; 44% and 24% respectively, table 4.6. After 15
minutes incubation there was only 16% and 27% intact peptide 1 left in the pig
colonic fluid and human faecal slurry respectively. For the remainder of the
experiment there was a gradual loss of peptide 1 in the porcine colonic fluids,
only 2% remained intact after 2 hours. Loss of peptide 1 followed a significant
first order degradation. Unlike the zero order degradation of peptide 1 in the
gastric and small intestinal fluids degradation in the colonic fluids is dependent
on its concentration and slowed as it was depleted over time.
Table 4.6 Peptide 1 recovery in porcine colonic and human faecal fluids. Data
represents means ± SD.
Sample
(min)
Peptide 1 recovered (%)
pig colonic fluid
Peptide 1 recovered (%)
human faecal slurry
0 66.4 ± 5.1 76.2 ± 9.2
15 15.7 ± 7.8 26.8 ± 0.7
30 15.7 ± 4.7 32.3 ± 0.4
60 9.7 ± 0.7 41.2 ± 1.6
90 2.5 ± 2.0 38.2 ± 2.5
120 2.0 ± 0.5 30.9 ± 2.2
The loss of peptide 1 could be due to the higher pH of the colonic fluid and/or
the presence of microbial enzymes and fermenting bacteria.
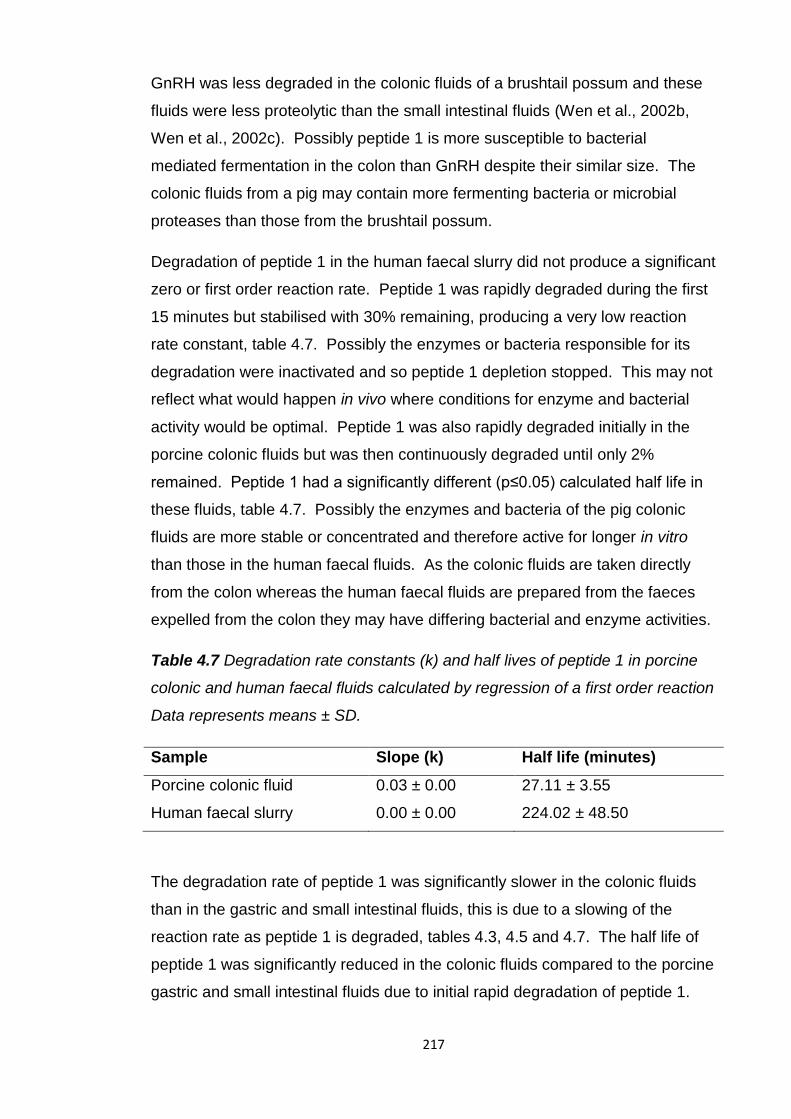
217
GnRH was less degraded in the colonic fluids of a brushtail possum and these
fluids were less proteolytic than the small intestinal fluids (Wen et al., 2002b,
Wen et al., 2002c). Possibly peptide 1 is more susceptible to bacterial
mediated fermentation in the colon than GnRH despite their similar size. The
colonic fluids from a pig may contain more fermenting bacteria or microbial
proteases than those from the brushtail possum.
Degradation of peptide 1 in the human faecal slurry did not produce a significant
zero or first order reaction rate. Peptide 1 was rapidly degraded during the first
15 minutes but stabilised with 30% remaining, producing a very low reaction
rate constant, table 4.7. Possibly the enzymes or bacteria responsible for its
degradation were inactivated and so peptide 1 depletion stopped. This may not
reflect what would happen in vivo where conditions for enzyme and bacterial
activity would be optimal. Peptide 1 was also rapidly degraded initially in the
porcine colonic fluids but was then continuously degraded until only 2%
remained. Peptide 1 had a significantly different (p≤0.05) calculated half life in
these fluids, table 4.7. Possibly the enzymes and bacteria of the pig colonic
fluids are more stable or concentrated and therefore active for longer in vitro
than those in the human faecal fluids. As the colonic fluids are taken directly
from the colon whereas the human faecal fluids are prepared from the faeces
expelled from the colon they may have differing bacterial and enzyme activities.
Table 4.7 Degradation rate constants (k) and half lives of peptide 1 in porcine
colonic and human faecal fluids calculated by regression of a first order reaction
Data represents means ± SD.
Sample Slope (k) Half life (minutes)
Porcine colonic fluid 0.03 ± 0.00 27.11 ± 3.55
Human faecal slurry 0.00 ± 0.00 224.02 ± 48.50
The degradation rate of peptide 1 was significantly slower in the colonic fluids
than in the gastric and small intestinal fluids, this is due to a slowing of the
reaction rate as peptide 1 is degraded, tables 4.3, 4.5 and 4.7. The half life of
peptide 1 was significantly reduced in the colonic fluids compared to the porcine
gastric and small intestinal fluids due to initial rapid degradation of peptide 1.
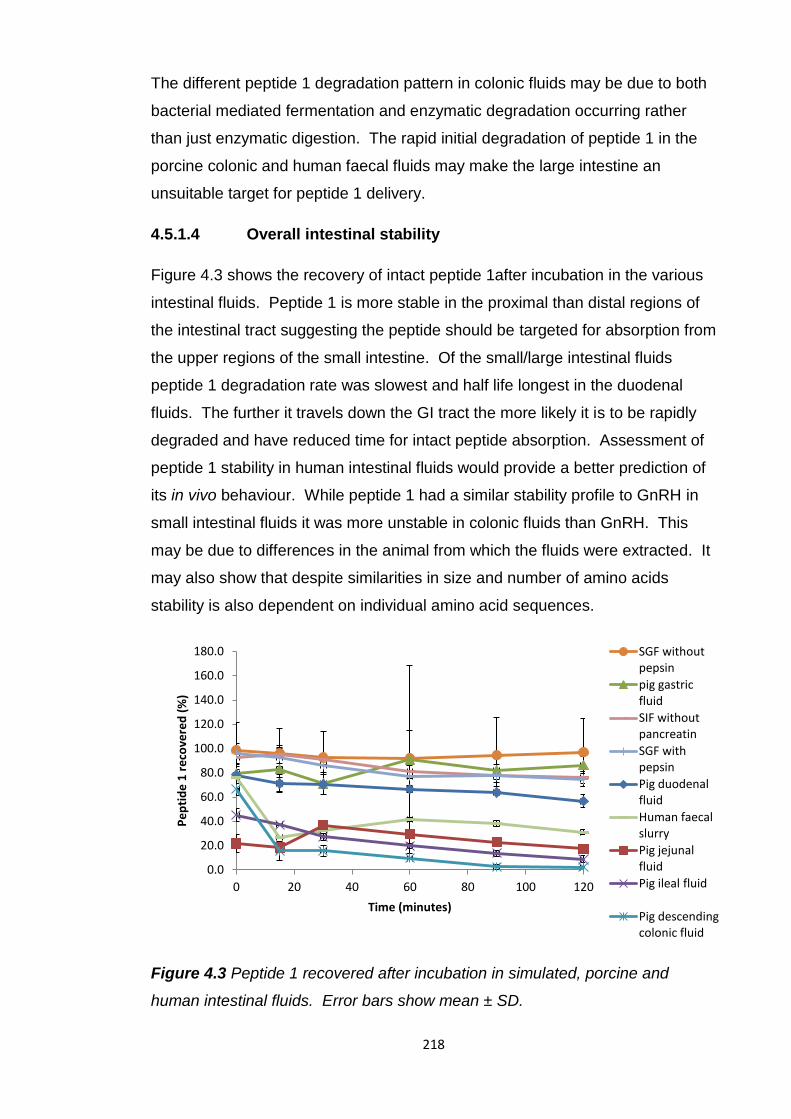
218
The different peptide 1 degradation pattern in colonic fluids may be due to both
bacterial mediated fermentation and enzymatic degradation occurring rather
than just enzymatic digestion. The rapid initial degradation of peptide 1 in the
porcine colonic and human faecal fluids may make the large intestine an
unsuitable target for peptide 1 delivery.
4.5.1.4 Overall intestinal stability
Figure 4.3 shows the recovery of intact peptide 1after incubation in the various
intestinal fluids. Peptide 1 is more stable in the proximal than distal regions of
the intestinal tract suggesting the peptide should be targeted for absorption from
the upper regions of the small intestine. Of the small/large intestinal fluids
peptide 1 degradation rate was slowest and half life longest in the duodenal
fluids. The further it travels down the GI tract the more likely it is to be rapidly
degraded and have reduced time for intact peptide absorption. Assessment of
peptide 1 stability in human intestinal fluids would provide a better prediction of
its in vivo behaviour. While peptide 1 had a similar stability profile to GnRH in
small intestinal fluids it was more unstable in colonic fluids than GnRH. This
may be due to differences in the animal from which the fluids were extracted. It
may also show that despite similarities in size and number of amino acids
stability is also dependent on individual amino acid sequences.
Figure 4.3 Peptide 1 recovered after incubation in simulated, porcine and
human intestinal fluids. Error bars show mean ± SD.
0.0
20.0
40.0
60.0
80.0
100.0
120.0
140.0
160.0
180.0
0 20 40 60 80 100 120
Pe
pti
de
1 r
eco
vere
d (
%)
Time (minutes)
SGF without pepsin
pig gastric fluid
SIF without pancreatin
SGF with pepsin
Pig duodenal fluid
Human faecal slurry
Pig jejunal fluid
Pig ileal fluid
Pig descending colonic fluid
219
4.5.2 PLGA nanoparticles
The intestinal stability studies demonstrated a huge obstacle to the oral delivery
of peptide 1 is its susceptibility to digestion by intestinal enzymes. An oral
delivery system may need to provide protection from pepsin in the stomach to
ensure as high a concentration of intact peptide as possible is present when it
reaches the small intestine. Protection from small intestinal enzymes would
also be beneficial to allow peptide 1 absorption for as long as possible. Peptide
intestinal permeability studies have demonstrated their low absorption (Adjei et
al., 1993, Zheng et al., 1999b).
Peptide 1 was encapsulated in PLGA nanoparticles for its oral delivery for their
ability to protect and enhance the permeability of an encapsulated peptide (Yoo
and Park, 2004, Panyam et al., 2003, Cohen-Sela et al., 2009, Westedt et al.,
2007). PLGA particles have demonstrated their suitability and compatibility for
delivering other chemotherapeutic peptides as sustained release, injectable
depot formulations (Crotts and Park, 1998, Dai et al., 2005). They have also
been used to encapsulate a variety of protein and peptide drugs increasing their
oral bioavailability (Yoo and Park, 2004, Uchida et al., 1994, Challacombe et al.,
1992, Gupta et al., 2007, Italia et al., 2007, Sun et al., 2011b, Cui et al., 2006b,
Carino et al., 2000, Sun et al., 2011a, Teply et al., 2008, Pan et al., 2002, Li et
al., 2004, Wu et al., 2012b)
4.5.2.1 Method development
PLGA nanoparticles encapsulating peptide 1 were produced using a double
emulsion solvent evaporation method which has frequently been used to
encapsulate therapeutic proteins and peptides (Okada, 1997, Garinot et al.,
2007, Yang et al., 2012, Pan et al., 2002, Wu et al., 2012b, Gupta et al., 2007,
Teply et al., 2008, Cheng et al., 2006, Li et al., 2004). Varying parameters of
this method affected the characteristics of the PLGA particles produced and
these in turn had a profound impact on their in vivo success.
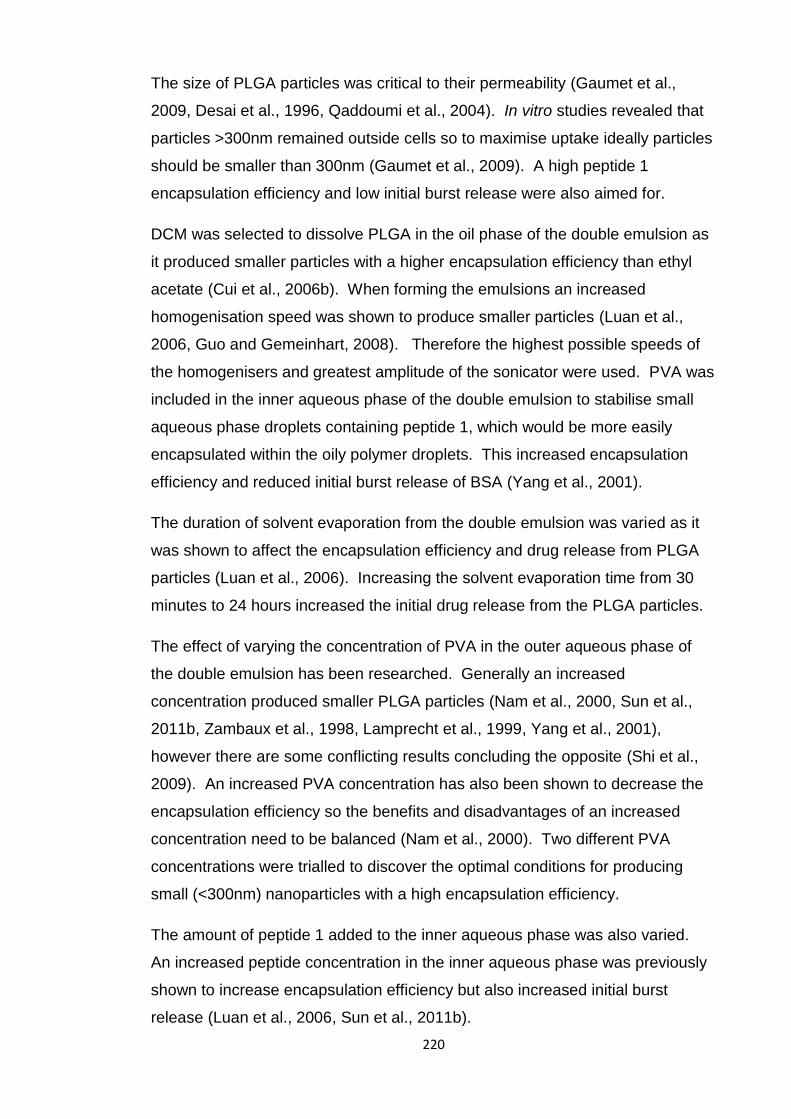
220
The size of PLGA particles was critical to their permeability (Gaumet et al.,
2009, Desai et al., 1996, Qaddoumi et al., 2004). In vitro studies revealed that
particles >300nm remained outside cells so to maximise uptake ideally particles
should be smaller than 300nm (Gaumet et al., 2009). A high peptide 1
encapsulation efficiency and low initial burst release were also aimed for.
DCM was selected to dissolve PLGA in the oil phase of the double emulsion as
it produced smaller particles with a higher encapsulation efficiency than ethyl
acetate (Cui et al., 2006b). When forming the emulsions an increased
homogenisation speed was shown to produce smaller particles (Luan et al.,
2006, Guo and Gemeinhart, 2008). Therefore the highest possible speeds of
the homogenisers and greatest amplitude of the sonicator were used. PVA was
included in the inner aqueous phase of the double emulsion to stabilise small
aqueous phase droplets containing peptide 1, which would be more easily
encapsulated within the oily polymer droplets. This increased encapsulation
efficiency and reduced initial burst release of BSA (Yang et al., 2001).
The duration of solvent evaporation from the double emulsion was varied as it
was shown to affect the encapsulation efficiency and drug release from PLGA
particles (Luan et al., 2006). Increasing the solvent evaporation time from 30
minutes to 24 hours increased the initial drug release from the PLGA particles.
The effect of varying the concentration of PVA in the outer aqueous phase of
the double emulsion has been researched. Generally an increased
concentration produced smaller PLGA particles (Nam et al., 2000, Sun et al.,
2011b, Zambaux et al., 1998, Lamprecht et al., 1999, Yang et al., 2001),
however there are some conflicting results concluding the opposite (Shi et al.,
2009). An increased PVA concentration has also been shown to decrease the
encapsulation efficiency so the benefits and disadvantages of an increased
concentration need to be balanced (Nam et al., 2000). Two different PVA
concentrations were trialled to discover the optimal conditions for producing
small (<300nm) nanoparticles with a high encapsulation efficiency.
The amount of peptide 1 added to the inner aqueous phase was also varied.
An increased peptide concentration in the inner aqueous phase was previously
shown to increase encapsulation efficiency but also increased initial burst
release (Luan et al., 2006, Sun et al., 2011b).
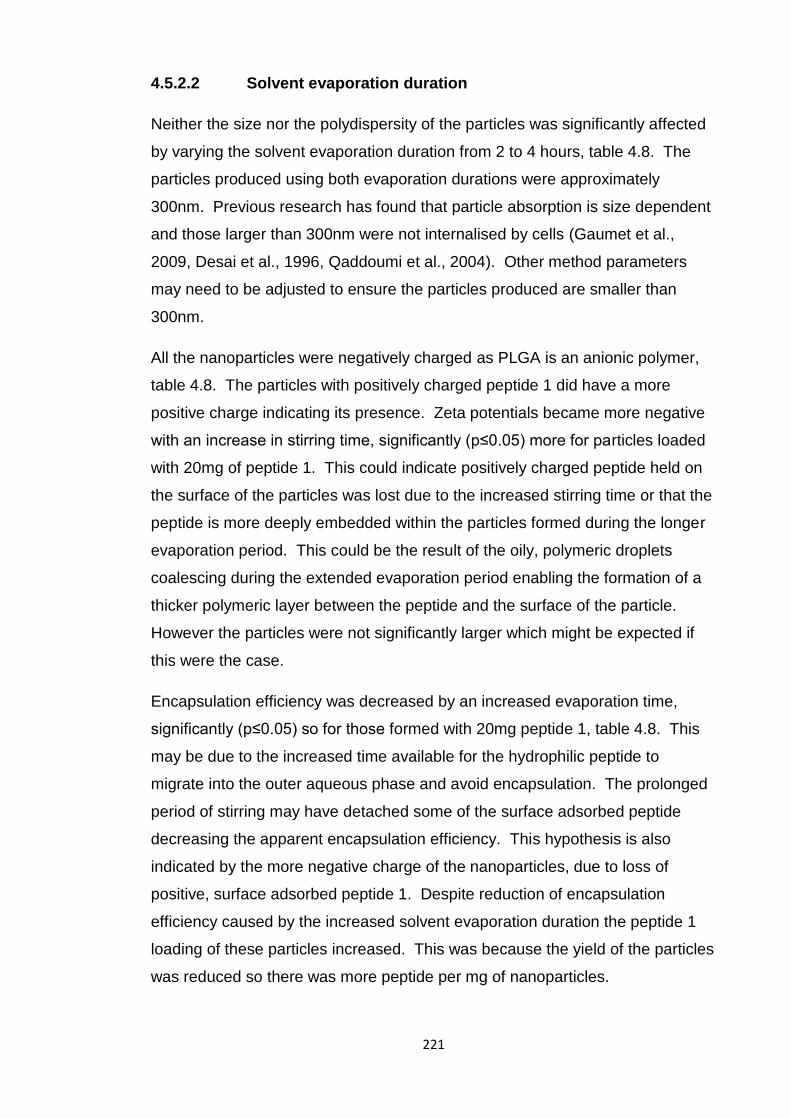
221
4.5.2.2 Solvent evaporation duration
Neither the size nor the polydispersity of the particles was significantly affected
by varying the solvent evaporation duration from 2 to 4 hours, table 4.8. The
particles produced using both evaporation durations were approximately
300nm. Previous research has found that particle absorption is size dependent
and those larger than 300nm were not internalised by cells (Gaumet et al.,
2009, Desai et al., 1996, Qaddoumi et al., 2004). Other method parameters
may need to be adjusted to ensure the particles produced are smaller than
300nm.
All the nanoparticles were negatively charged as PLGA is an anionic polymer,
table 4.8. The particles with positively charged peptide 1 did have a more
positive charge indicating its presence. Zeta potentials became more negative
with an increase in stirring time, significantly (p≤0.05) more for particles loaded
with 20mg of peptide 1. This could indicate positively charged peptide held on
the surface of the particles was lost due to the increased stirring time or that the
peptide is more deeply embedded within the particles formed during the longer
evaporation period. This could be the result of the oily, polymeric droplets
coalescing during the extended evaporation period enabling the formation of a
thicker polymeric layer between the peptide and the surface of the particle.
However the particles were not significantly larger which might be expected if
this were the case.
Encapsulation efficiency was decreased by an increased evaporation time,
significantly (p≤0.05) so for those formed with 20mg peptide 1, table 4.8. This
may be due to the increased time available for the hydrophilic peptide to
migrate into the outer aqueous phase and avoid encapsulation. The prolonged
period of stirring may have detached some of the surface adsorbed peptide
decreasing the apparent encapsulation efficiency. This hypothesis is also
indicated by the more negative charge of the nanoparticles, due to loss of
positive, surface adsorbed peptide 1. Despite reduction of encapsulation
efficiency caused by the increased solvent evaporation duration the peptide 1
loading of these particles increased. This was because the yield of the particles
was reduced so there was more peptide per mg of nanoparticles.
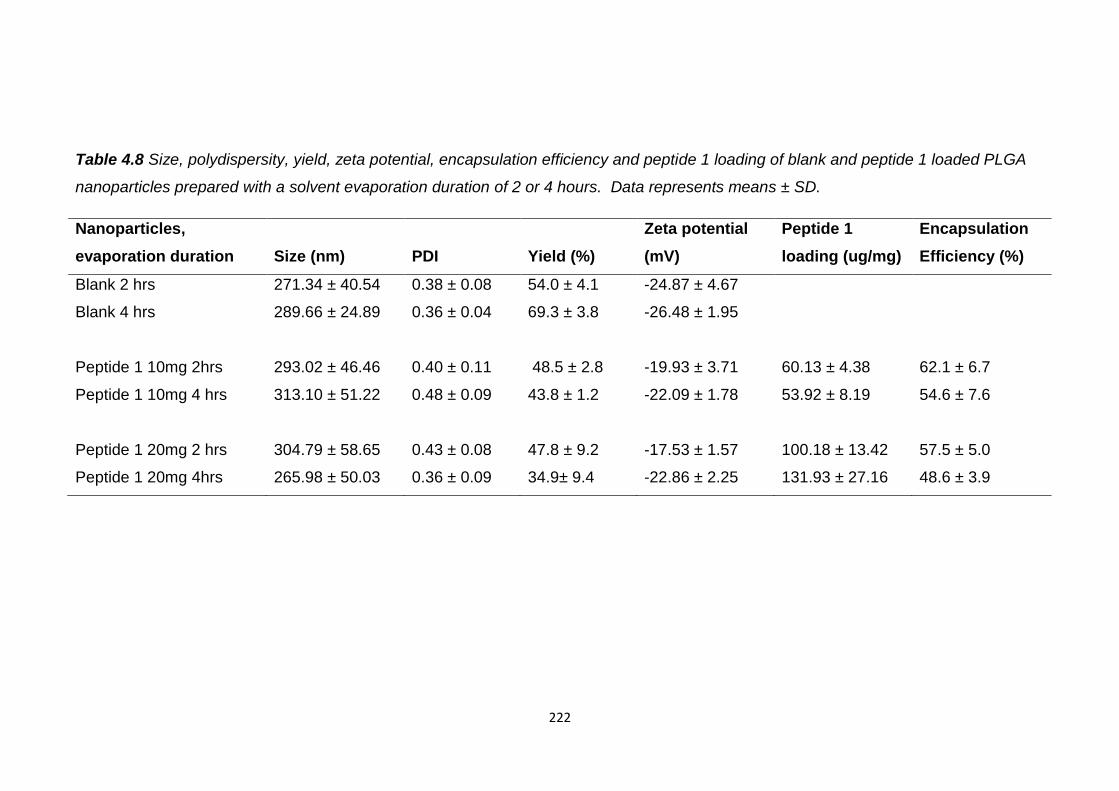
222
Table 4.8 Size, polydispersity, yield, zeta potential, encapsulation efficiency and peptide 1 loading of blank and peptide 1 loaded PLGA
nanoparticles prepared with a solvent evaporation duration of 2 or 4 hours. Data represents means ± SD.
Nanoparticles,
evaporation duration Size (nm) PDI Yield (%)
Zeta potential
(mV)
Peptide 1
loading (ug/mg)
Encapsulation
Efficiency (%)
Blank 2 hrs 271.34 ± 40.54 0.38 ± 0.08 54.0 ± 4.1 -24.87 ± 4.67
Blank 4 hrs 289.66 ± 24.89 0.36 ± 0.04 69.3 ± 3.8 -26.48 ± 1.95
Peptide 1 10mg 2hrs 293.02 ± 46.46 0.40 ± 0.11 48.5 ± 2.8 -19.93 ± 3.71 60.13 ± 4.38 62.1 ± 6.7
Peptide 1 10mg 4 hrs 313.10 ± 51.22 0.48 ± 0.09 43.8 ± 1.2 -22.09 ± 1.78 53.92 ± 8.19 54.6 ± 7.6
Peptide 1 20mg 2 hrs 304.79 ± 58.65 0.43 ± 0.08 47.8 ± 9.2 -17.53 ± 1.57 100.18 ± 13.42 57.5 ± 5.0
Peptide 1 20mg 4hrs 265.98 ± 50.03 0.36 ± 0.09 34.9± 9.4 -22.86 ± 2.25 131.93 ± 27.16 48.6 ± 3.9
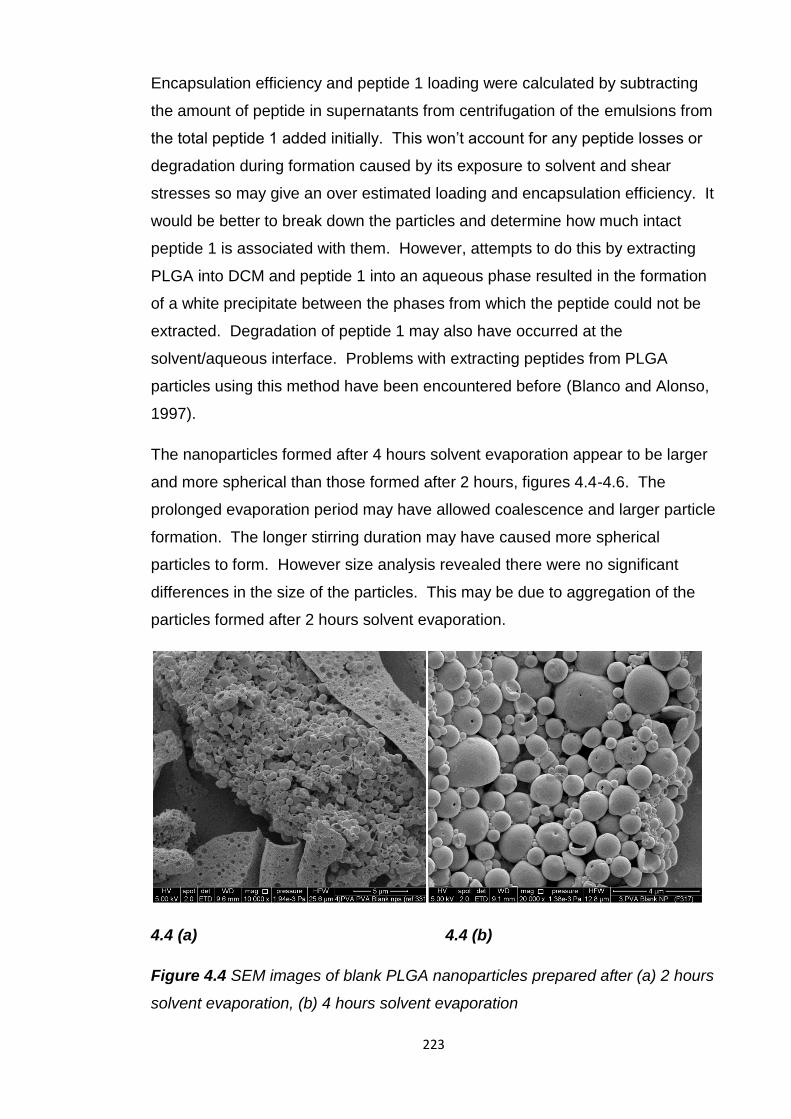
223
Encapsulation efficiency and peptide 1 loading were calculated by subtracting
the amount of peptide in supernatants from centrifugation of the emulsions from
the total peptide 1 added initially. This won’t account for any peptide losses or
degradation during formation caused by its exposure to solvent and shear
stresses so may give an over estimated loading and encapsulation efficiency. It
would be better to break down the particles and determine how much intact
peptide 1 is associated with them. However, attempts to do this by extracting
PLGA into DCM and peptide 1 into an aqueous phase resulted in the formation
of a white precipitate between the phases from which the peptide could not be
extracted. Degradation of peptide 1 may also have occurred at the
solvent/aqueous interface. Problems with extracting peptides from PLGA
particles using this method have been encountered before (Blanco and Alonso,
1997).
The nanoparticles formed after 4 hours solvent evaporation appear to be larger
and more spherical than those formed after 2 hours, figures 4.4-4.6. The
prolonged evaporation period may have allowed coalescence and larger particle
formation. The longer stirring duration may have caused more spherical
particles to form. However size analysis revealed there were no significant
differences in the size of the particles. This may be due to aggregation of the
particles formed after 2 hours solvent evaporation.
4.4 (a) 4.4 (b)
Figure 4.4 SEM images of blank PLGA nanoparticles prepared after (a) 2 hours
solvent evaporation, (b) 4 hours solvent evaporation
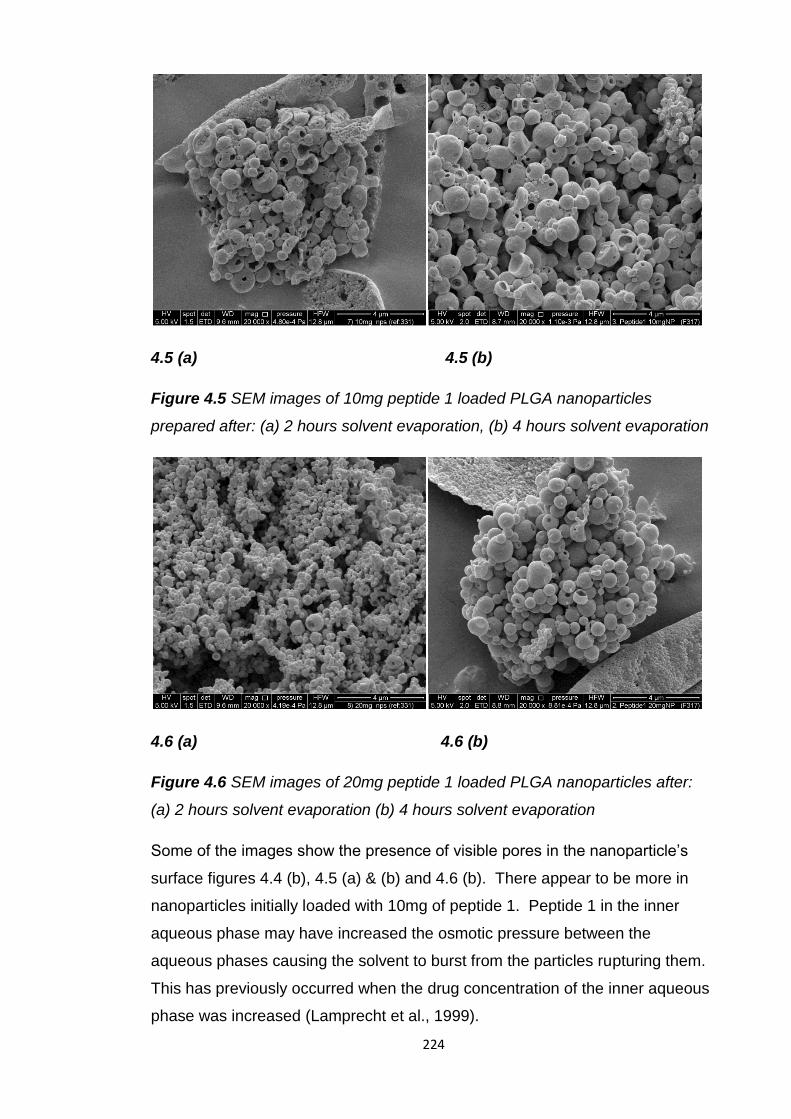
224
4.5 (a) 4.5 (b)
Figure 4.5 SEM images of 10mg peptide 1 loaded PLGA nanoparticles
prepared after: (a) 2 hours solvent evaporation, (b) 4 hours solvent evaporation
4.6 (a) 4.6 (b)
Figure 4.6 SEM images of 20mg peptide 1 loaded PLGA nanoparticles after:
(a) 2 hours solvent evaporation (b) 4 hours solvent evaporation
Some of the images show the presence of visible pores in the nanoparticle’s
surface figures 4.4 (b), 4.5 (a) & (b) and 4.6 (b). There appear to be more in
nanoparticles initially loaded with 10mg of peptide 1. Peptide 1 in the inner
aqueous phase may have increased the osmotic pressure between the
aqueous phases causing the solvent to burst from the particles rupturing them.
This has previously occurred when the drug concentration of the inner aqueous
phase was increased (Lamprecht et al., 1999).
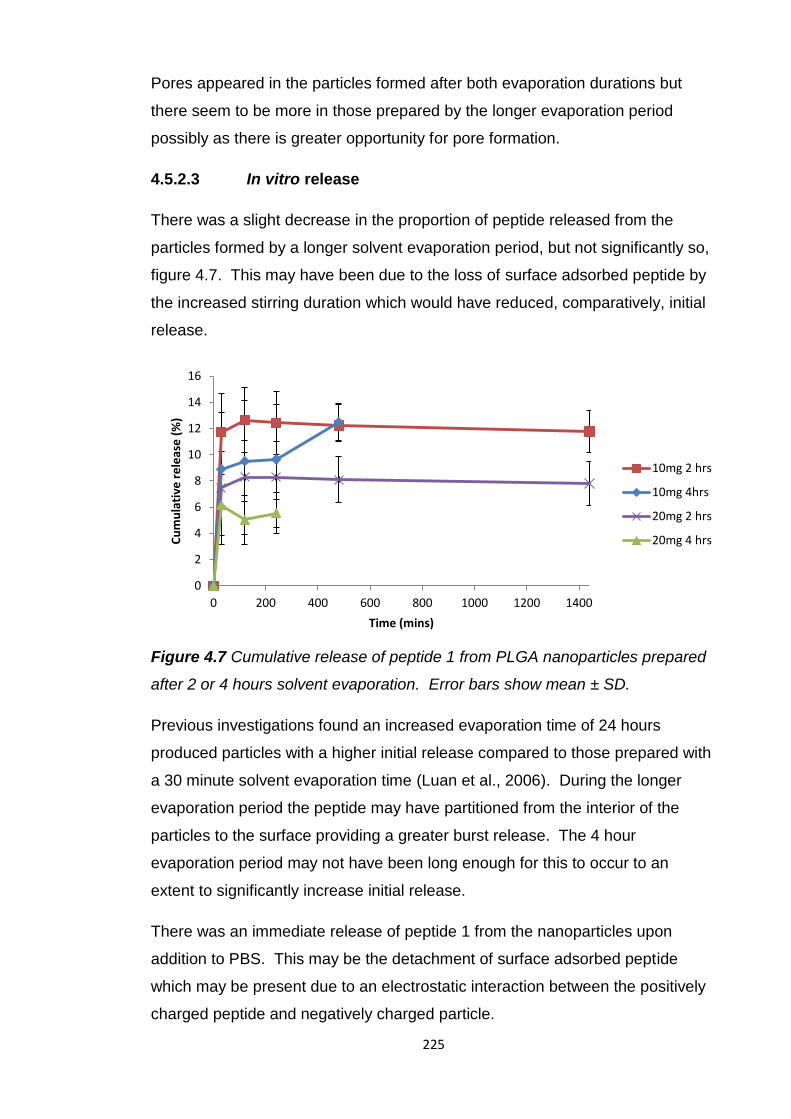
225
Pores appeared in the particles formed after both evaporation durations but
there seem to be more in those prepared by the longer evaporation period
possibly as there is greater opportunity for pore formation.
4.5.2.3 In vitro release
There was a slight decrease in the proportion of peptide released from the
particles formed by a longer solvent evaporation period, but not significantly so,
figure 4.7. This may have been due to the loss of surface adsorbed peptide by
the increased stirring duration which would have reduced, comparatively, initial
release.
Figure 4.7 Cumulative release of peptide 1 from PLGA nanoparticles prepared
after 2 or 4 hours solvent evaporation. Error bars show mean ± SD.
Previous investigations found an increased evaporation time of 24 hours
produced particles with a higher initial release compared to those prepared with
a 30 minute solvent evaporation time (Luan et al., 2006). During the longer
evaporation period the peptide may have partitioned from the interior of the
particles to the surface providing a greater burst release. The 4 hour
evaporation period may not have been long enough for this to occur to an
extent to significantly increase initial release.
There was an immediate release of peptide 1 from the nanoparticles upon
addition to PBS. This may be the detachment of surface adsorbed peptide
which may be present due to an electrostatic interaction between the positively
charged peptide and negatively charged particle.
0
2
4
6
8
10
12
14
16
0 200 400 600 800 1000 1200 1400
Cu
mu
lati
ve r
ele
ase
(%
)
Time (mins)
10mg 2 hrs
10mg 4hrs
20mg 2 hrs
20mg 4 hrs
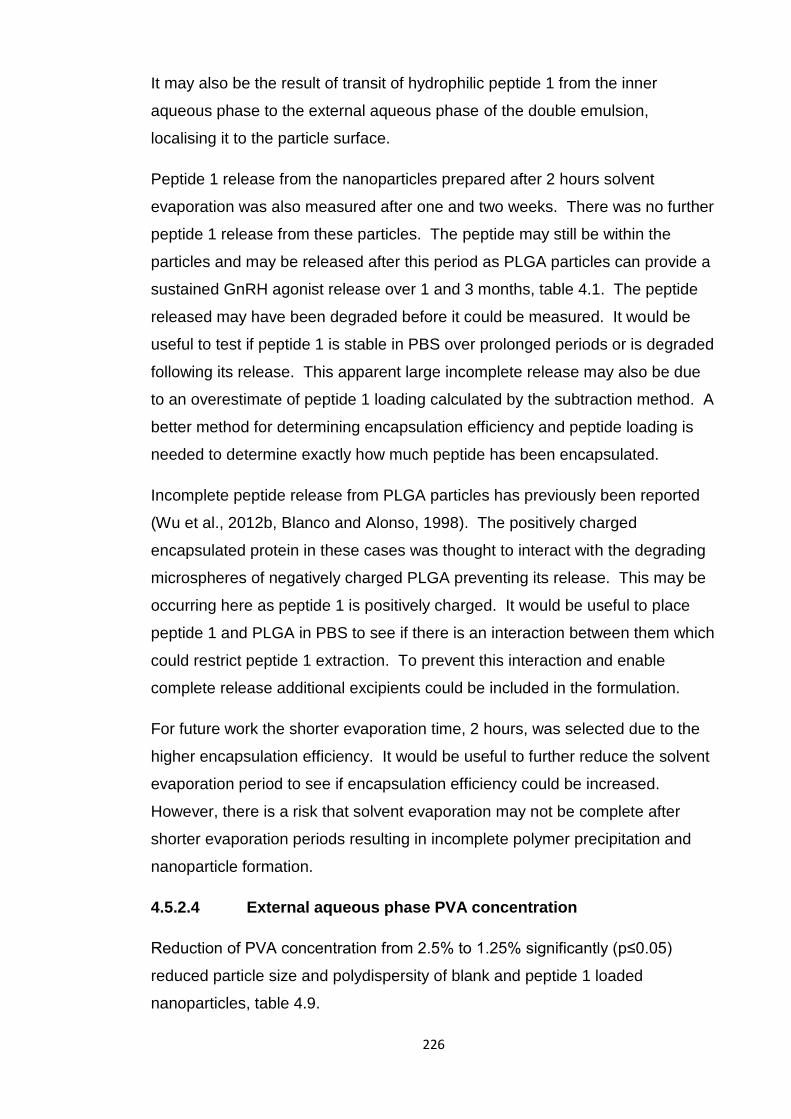
226
It may also be the result of transit of hydrophilic peptide 1 from the inner
aqueous phase to the external aqueous phase of the double emulsion,
localising it to the particle surface.
Peptide 1 release from the nanoparticles prepared after 2 hours solvent
evaporation was also measured after one and two weeks. There was no further
peptide 1 release from these particles. The peptide may still be within the
particles and may be released after this period as PLGA particles can provide a
sustained GnRH agonist release over 1 and 3 months, table 4.1. The peptide
released may have been degraded before it could be measured. It would be
useful to test if peptide 1 is stable in PBS over prolonged periods or is degraded
following its release. This apparent large incomplete release may also be due
to an overestimate of peptide 1 loading calculated by the subtraction method. A
better method for determining encapsulation efficiency and peptide loading is
needed to determine exactly how much peptide has been encapsulated.
Incomplete peptide release from PLGA particles has previously been reported
(Wu et al., 2012b, Blanco and Alonso, 1998). The positively charged
encapsulated protein in these cases was thought to interact with the degrading
microspheres of negatively charged PLGA preventing its release. This may be
occurring here as peptide 1 is positively charged. It would be useful to place
peptide 1 and PLGA in PBS to see if there is an interaction between them which
could restrict peptide 1 extraction. To prevent this interaction and enable
complete release additional excipients could be included in the formulation.
For future work the shorter evaporation time, 2 hours, was selected due to the
higher encapsulation efficiency. It would be useful to further reduce the solvent
evaporation period to see if encapsulation efficiency could be increased.
However, there is a risk that solvent evaporation may not be complete after
shorter evaporation periods resulting in incomplete polymer precipitation and
nanoparticle formation.
4.5.2.4 External aqueous phase PVA concentration
Reduction of PVA concentration from 2.5% to 1.25% significantly (p≤0.05)
reduced particle size and polydispersity of blank and peptide 1 loaded
nanoparticles, table 4.9.
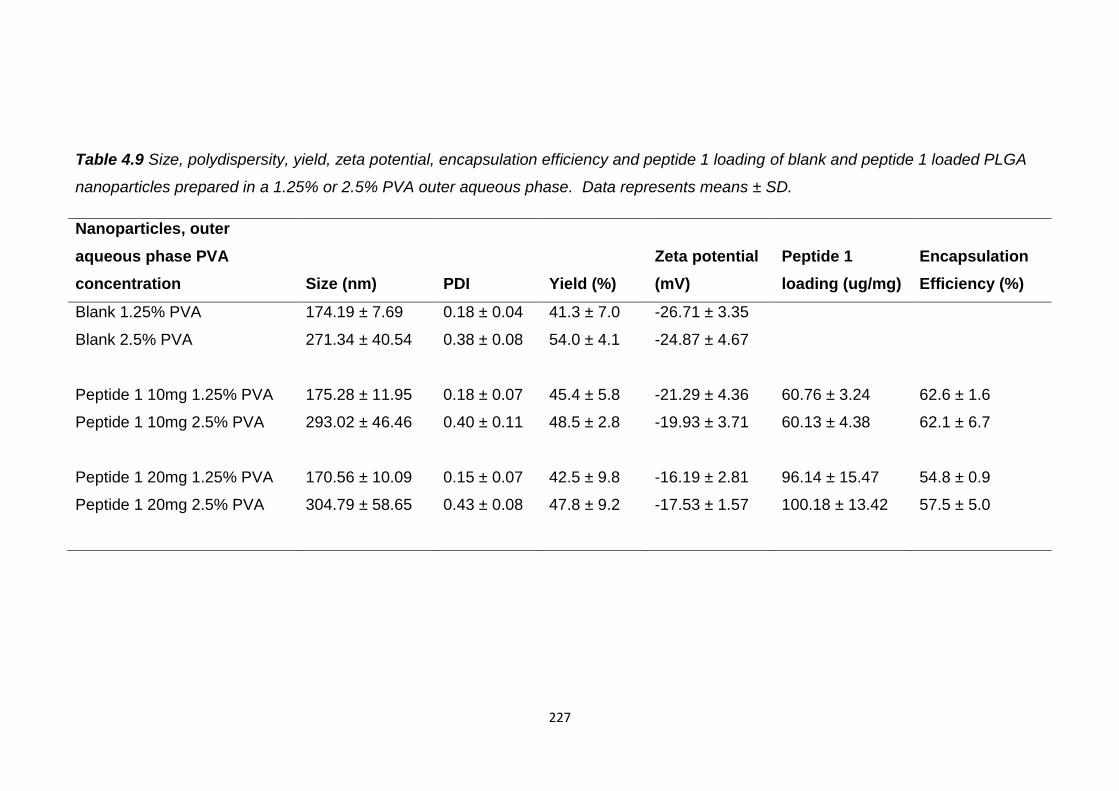
227
Table 4.9 Size, polydispersity, yield, zeta potential, encapsulation efficiency and peptide 1 loading of blank and peptide 1 loaded PLGA
nanoparticles prepared in a 1.25% or 2.5% PVA outer aqueous phase. Data represents means ± SD.
Nanoparticles, outer
aqueous phase PVA
concentration Size (nm) PDI Yield (%)
Zeta potential
(mV)
Peptide 1
loading (ug/mg)
Encapsulation
Efficiency (%)
Blank 1.25% PVA 174.19 ± 7.69 0.18 ± 0.04 41.3 ± 7.0 -26.71 ± 3.35
Blank 2.5% PVA 271.34 ± 40.54 0.38 ± 0.08 54.0 ± 4.1 -24.87 ± 4.67
Peptide 1 10mg 1.25% PVA 175.28 ± 11.95 0.18 ± 0.07 45.4 ± 5.8 -21.29 ± 4.36 60.76 ± 3.24 62.6 ± 1.6
Peptide 1 10mg 2.5% PVA 293.02 ± 46.46 0.40 ± 0.11 48.5 ± 2.8 -19.93 ± 3.71 60.13 ± 4.38 62.1 ± 6.7
Peptide 1 20mg 1.25% PVA 170.56 ± 10.09 0.15 ± 0.07 42.5 ± 9.8 -16.19 ± 2.81 96.14 ± 15.47 54.8 ± 0.9
Peptide 1 20mg 2.5% PVA 304.79 ± 58.65 0.43 ± 0.08 47.8 ± 9.2 -17.53 ± 1.57 100.18 ± 13.42 57.5 ± 5.0
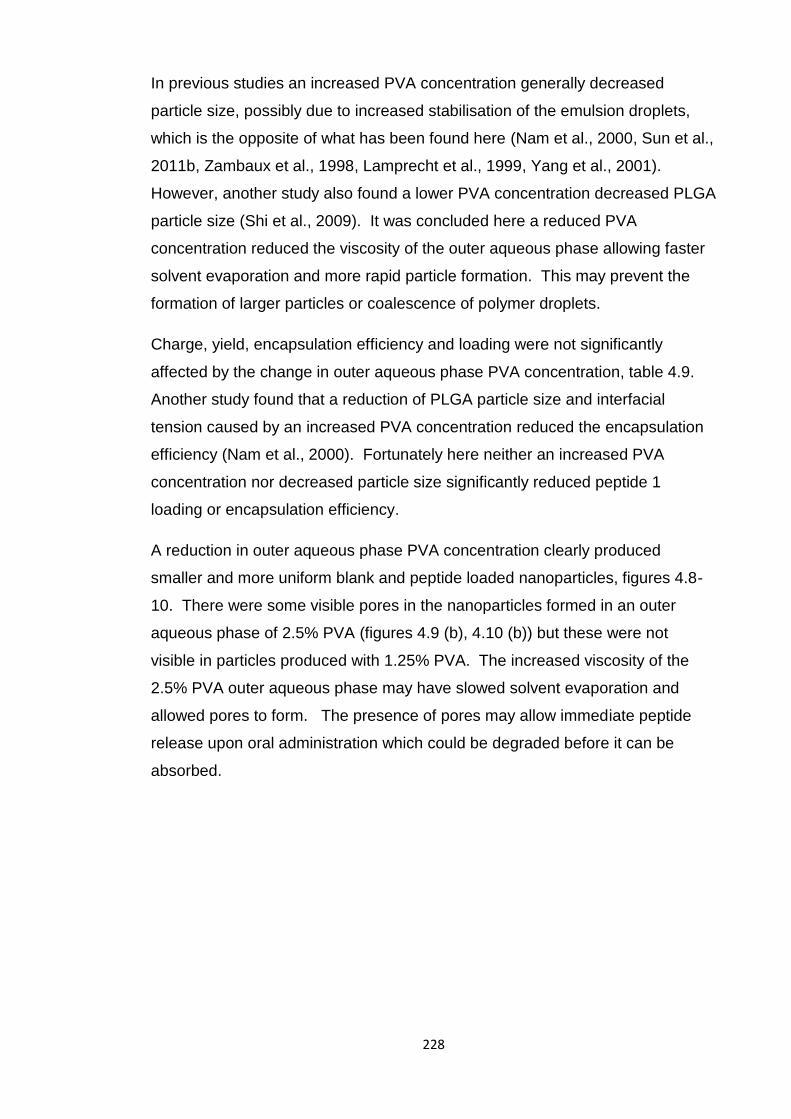
228
In previous studies an increased PVA concentration generally decreased
particle size, possibly due to increased stabilisation of the emulsion droplets,
which is the opposite of what has been found here (Nam et al., 2000, Sun et al.,
2011b, Zambaux et al., 1998, Lamprecht et al., 1999, Yang et al., 2001).
However, another study also found a lower PVA concentration decreased PLGA
particle size (Shi et al., 2009). It was concluded here a reduced PVA
concentration reduced the viscosity of the outer aqueous phase allowing faster
solvent evaporation and more rapid particle formation. This may prevent the
formation of larger particles or coalescence of polymer droplets.
Charge, yield, encapsulation efficiency and loading were not significantly
affected by the change in outer aqueous phase PVA concentration, table 4.9.
Another study found that a reduction of PLGA particle size and interfacial
tension caused by an increased PVA concentration reduced the encapsulation
efficiency (Nam et al., 2000). Fortunately here neither an increased PVA
concentration nor decreased particle size significantly reduced peptide 1
loading or encapsulation efficiency.
A reduction in outer aqueous phase PVA concentration clearly produced
smaller and more uniform blank and peptide loaded nanoparticles, figures 4.8-
10. There were some visible pores in the nanoparticles formed in an outer
aqueous phase of 2.5% PVA (figures 4.9 (b), 4.10 (b)) but these were not
visible in particles produced with 1.25% PVA. The increased viscosity of the
2.5% PVA outer aqueous phase may have slowed solvent evaporation and
allowed pores to form. The presence of pores may allow immediate peptide
release upon oral administration which could be degraded before it can be
absorbed.
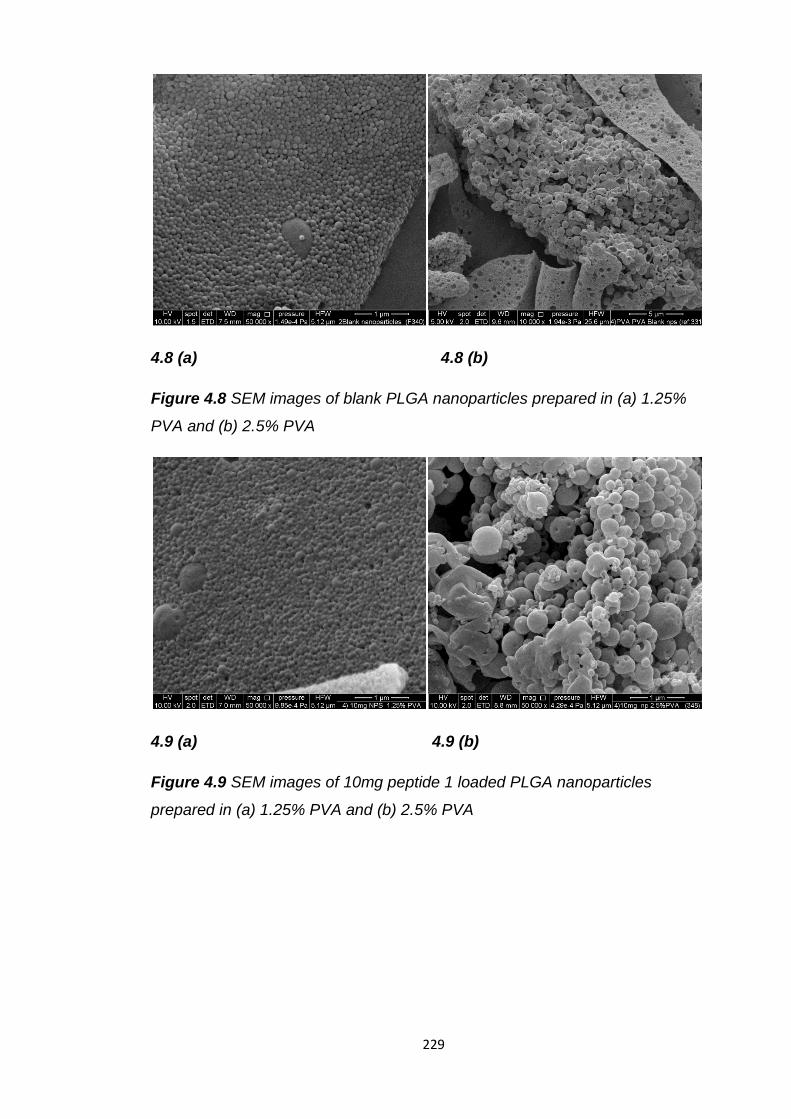
229
4.8 (a) 4.8 (b)
Figure 4.8 SEM images of blank PLGA nanoparticles prepared in (a) 1.25%
PVA and (b) 2.5% PVA
4.9 (a) 4.9 (b)
Figure 4.9 SEM images of 10mg peptide 1 loaded PLGA nanoparticles
prepared in (a) 1.25% PVA and (b) 2.5% PVA
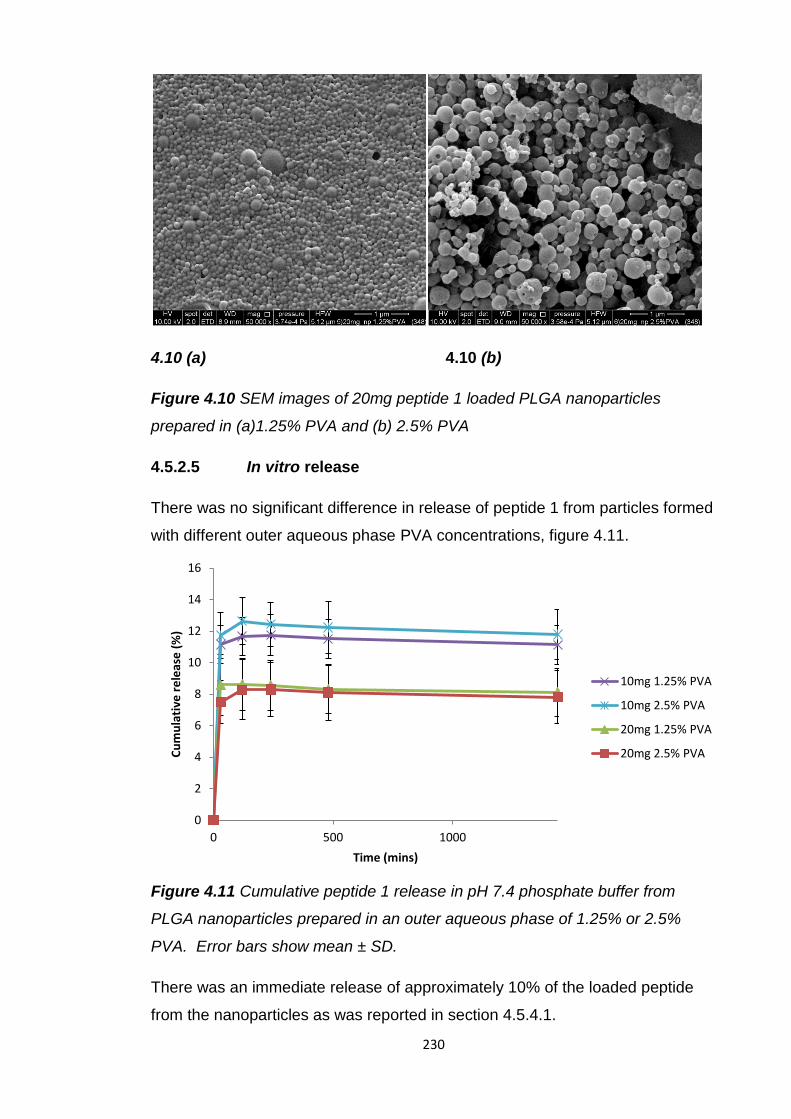
230
4.10 (a) 4.10 (b)
Figure 4.10 SEM images of 20mg peptide 1 loaded PLGA nanoparticles
prepared in (a)1.25% PVA and (b) 2.5% PVA
4.5.2.5 In vitro release
There was no significant difference in release of peptide 1 from particles formed
with different outer aqueous phase PVA concentrations, figure 4.11.
Figure 4.11 Cumulative peptide 1 release in pH 7.4 phosphate buffer from
PLGA nanoparticles prepared in an outer aqueous phase of 1.25% or 2.5%
PVA. Error bars show mean ± SD.
There was an immediate release of approximately 10% of the loaded peptide
from the nanoparticles as was reported in section 4.5.4.1.
0
2
4
6
8
10
12
14
16
0 500 1000
Cu
mu
lati
ve r
ele
ase
(%
)
Time (mins)
10mg 1.25% PVA
10mg 2.5% PVA
20mg 1.25% PVA
20mg 2.5% PVA
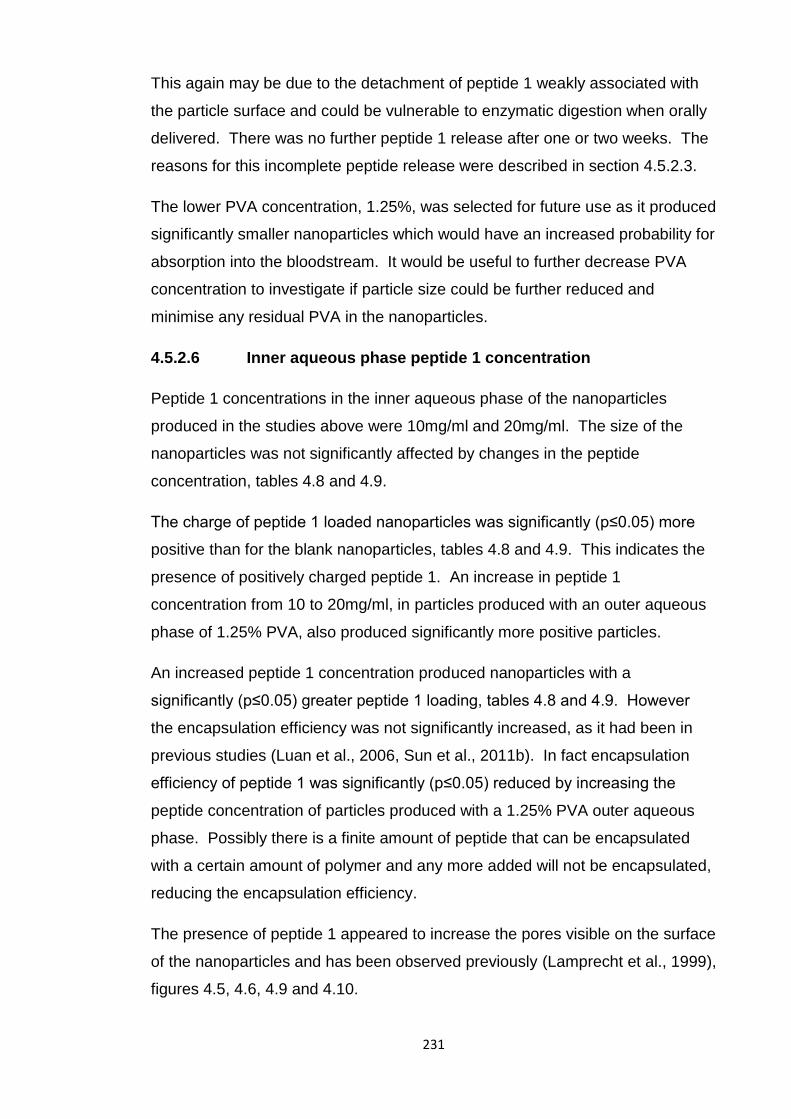
231
This again may be due to the detachment of peptide 1 weakly associated with
the particle surface and could be vulnerable to enzymatic digestion when orally
delivered. There was no further peptide 1 release after one or two weeks. The
reasons for this incomplete peptide release were described in section 4.5.2.3.
The lower PVA concentration, 1.25%, was selected for future use as it produced
significantly smaller nanoparticles which would have an increased probability for
absorption into the bloodstream. It would be useful to further decrease PVA
concentration to investigate if particle size could be further reduced and
minimise any residual PVA in the nanoparticles.
4.5.2.6 Inner aqueous phase peptide 1 concentration
Peptide 1 concentrations in the inner aqueous phase of the nanoparticles
produced in the studies above were 10mg/ml and 20mg/ml. The size of the
nanoparticles was not significantly affected by changes in the peptide
concentration, tables 4.8 and 4.9.
The charge of peptide 1 loaded nanoparticles was significantly (p≤0.05) more
positive than for the blank nanoparticles, tables 4.8 and 4.9. This indicates the
presence of positively charged peptide 1. An increase in peptide 1
concentration from 10 to 20mg/ml, in particles produced with an outer aqueous
phase of 1.25% PVA, also produced significantly more positive particles.
An increased peptide 1 concentration produced nanoparticles with a
significantly (p≤0.05) greater peptide 1 loading, tables 4.8 and 4.9. However
the encapsulation efficiency was not significantly increased, as it had been in
previous studies (Luan et al., 2006, Sun et al., 2011b). In fact encapsulation
efficiency of peptide 1 was significantly (p≤0.05) reduced by increasing the
peptide concentration of particles produced with a 1.25% PVA outer aqueous
phase. Possibly there is a finite amount of peptide that can be encapsulated
with a certain amount of polymer and any more added will not be encapsulated,
reducing the encapsulation efficiency.
The presence of peptide 1 appeared to increase the pores visible on the surface
of the nanoparticles and has been observed previously (Lamprecht et al., 1999),
figures 4.5, 4.6, 4.9 and 4.10.
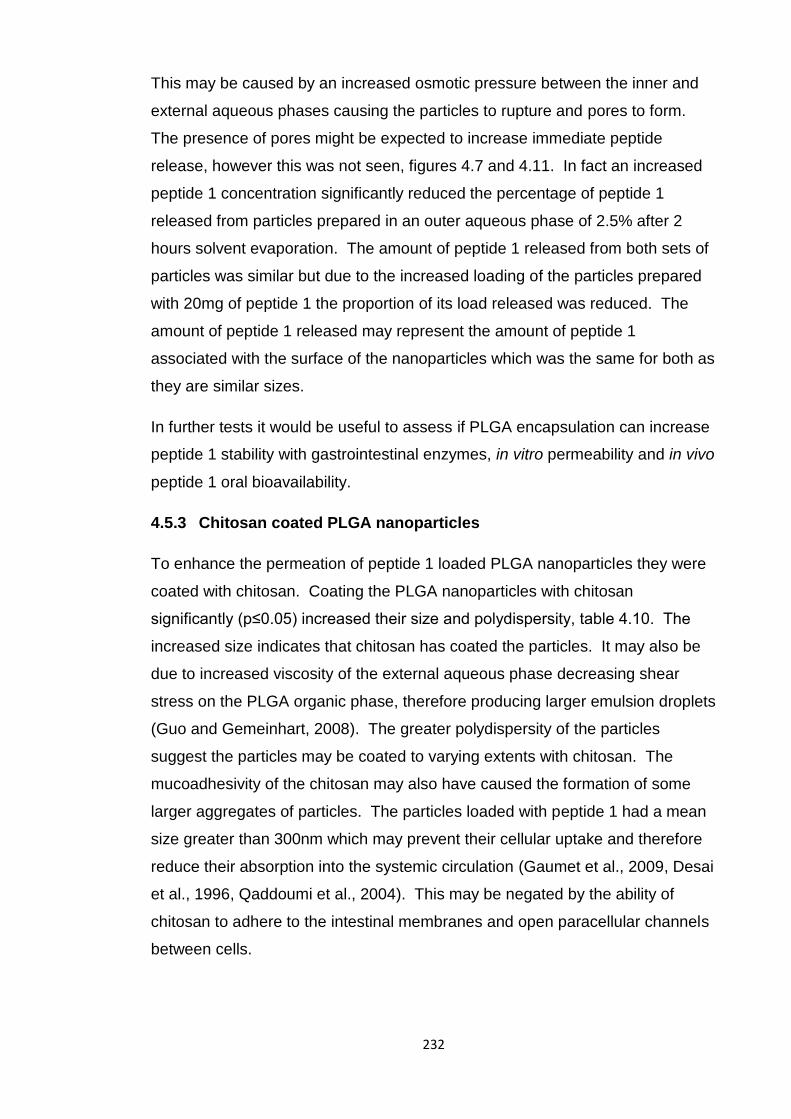
232
This may be caused by an increased osmotic pressure between the inner and
external aqueous phases causing the particles to rupture and pores to form.
The presence of pores might be expected to increase immediate peptide
release, however this was not seen, figures 4.7 and 4.11. In fact an increased
peptide 1 concentration significantly reduced the percentage of peptide 1
released from particles prepared in an outer aqueous phase of 2.5% after 2
hours solvent evaporation. The amount of peptide 1 released from both sets of
particles was similar but due to the increased loading of the particles prepared
with 20mg of peptide 1 the proportion of its load released was reduced. The
amount of peptide 1 released may represent the amount of peptide 1
associated with the surface of the nanoparticles which was the same for both as
they are similar sizes.
In further tests it would be useful to assess if PLGA encapsulation can increase
peptide 1 stability with gastrointestinal enzymes, in vitro permeability and in vivo
peptide 1 oral bioavailability.
4.5.3 Chitosan coated PLGA nanoparticles
To enhance the permeation of peptide 1 loaded PLGA nanoparticles they were
coated with chitosan. Coating the PLGA nanoparticles with chitosan
significantly (p≤0.05) increased their size and polydispersity, table 4.10. The
increased size indicates that chitosan has coated the particles. It may also be
due to increased viscosity of the external aqueous phase decreasing shear
stress on the PLGA organic phase, therefore producing larger emulsion droplets
(Guo and Gemeinhart, 2008). The greater polydispersity of the particles
suggest the particles may be coated to varying extents with chitosan. The
mucoadhesivity of the chitosan may also have caused the formation of some
larger aggregates of particles. The particles loaded with peptide 1 had a mean
size greater than 300nm which may prevent their cellular uptake and therefore
reduce their absorption into the systemic circulation (Gaumet et al., 2009, Desai
et al., 1996, Qaddoumi et al., 2004). This may be negated by the ability of
chitosan to adhere to the intestinal membranes and open paracellular channels
between cells.
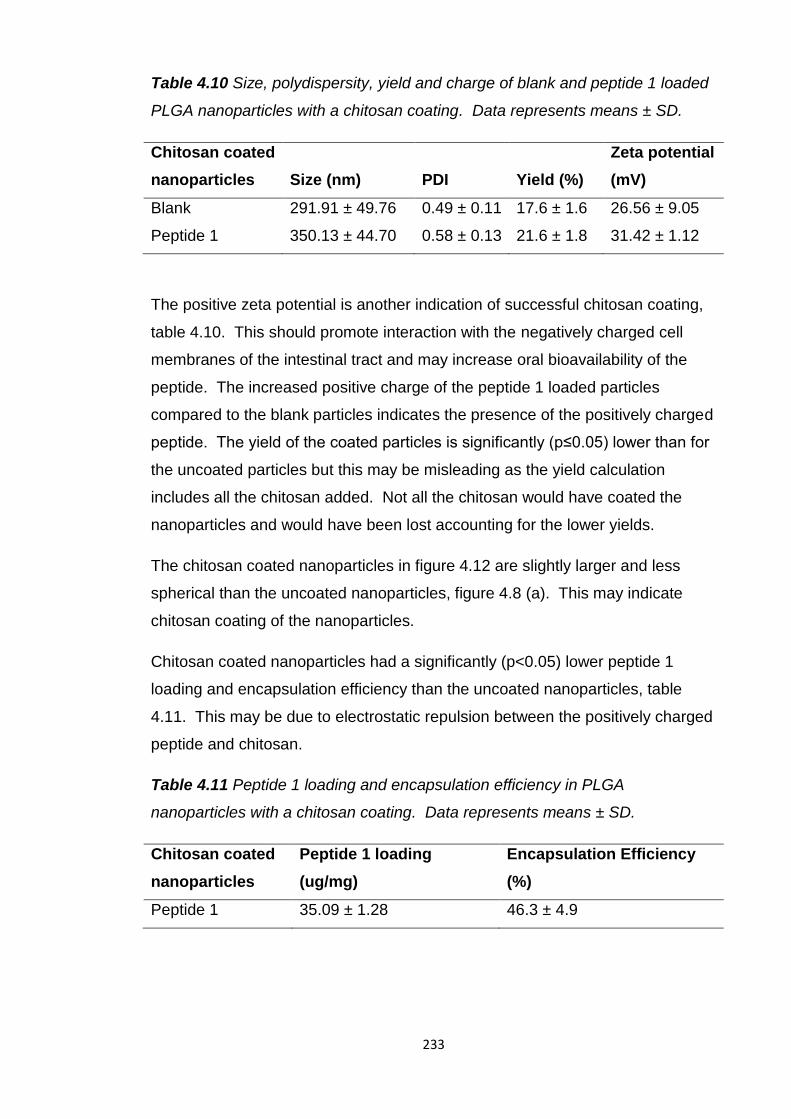
233
Table 4.10 Size, polydispersity, yield and charge of blank and peptide 1 loaded
PLGA nanoparticles with a chitosan coating. Data represents means ± SD.
Chitosan coated
nanoparticles Size (nm) PDI Yield (%)
Zeta potential
(mV)
Blank 291.91 ± 49.76 0.49 ± 0.11 17.6 ± 1.6 26.56 ± 9.05
Peptide 1 350.13 ± 44.70 0.58 ± 0.13 21.6 ± 1.8 31.42 ± 1.12
The positive zeta potential is another indication of successful chitosan coating,
table 4.10. This should promote interaction with the negatively charged cell
membranes of the intestinal tract and may increase oral bioavailability of the
peptide. The increased positive charge of the peptide 1 loaded particles
compared to the blank particles indicates the presence of the positively charged
peptide. The yield of the coated particles is significantly (p≤0.05) lower than for
the uncoated particles but this may be misleading as the yield calculation
includes all the chitosan added. Not all the chitosan would have coated the
nanoparticles and would have been lost accounting for the lower yields.
The chitosan coated nanoparticles in figure 4.12 are slightly larger and less
spherical than the uncoated nanoparticles, figure 4.8 (a). This may indicate
chitosan coating of the nanoparticles.
Chitosan coated nanoparticles had a significantly (p<0.05) lower peptide 1
loading and encapsulation efficiency than the uncoated nanoparticles, table
4.11. This may be due to electrostatic repulsion between the positively charged
peptide and chitosan.
Table 4.11 Peptide 1 loading and encapsulation efficiency in PLGA
nanoparticles with a chitosan coating. Data represents means ± SD.
Chitosan coated
nanoparticles
Peptide 1 loading
(ug/mg)
Encapsulation Efficiency
(%)
Peptide 1 35.09 ± 1.28 46.3 ± 4.9
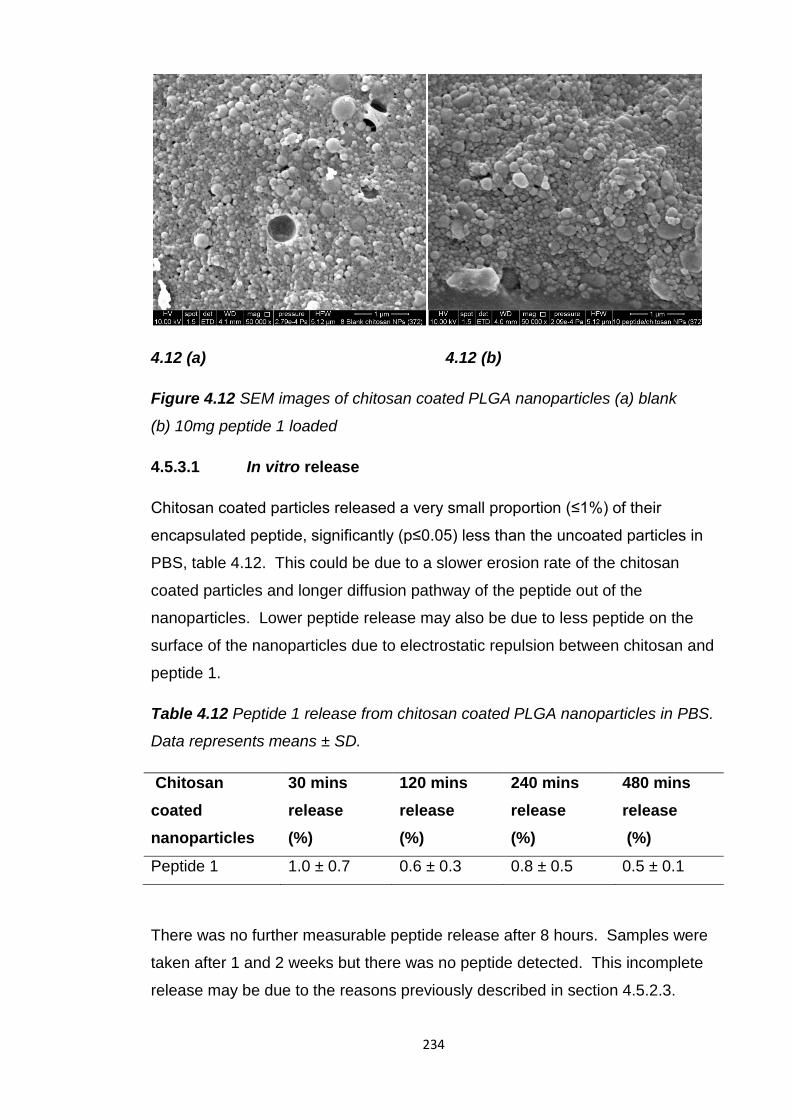
234
4.12 (a) 4.12 (b)
Figure 4.12 SEM images of chitosan coated PLGA nanoparticles (a) blank
(b) 10mg peptide 1 loaded
4.5.3.1 In vitro release
Chitosan coated particles released a very small proportion (≤1%) of their
encapsulated peptide, significantly (p≤0.05) less than the uncoated particles in
PBS, table 4.12. This could be due to a slower erosion rate of the chitosan
coated particles and longer diffusion pathway of the peptide out of the
nanoparticles. Lower peptide release may also be due to less peptide on the
surface of the nanoparticles due to electrostatic repulsion between chitosan and
peptide 1.
Table 4.12 Peptide 1 release from chitosan coated PLGA nanoparticles in PBS.
Data represents means ± SD.
Chitosan
coated
nanoparticles
30 mins
release
(%)
120 mins
release
(%)
240 mins
release
(%)
480 mins
release
(%)
Peptide 1 1.0 ± 0.7 0.6 ± 0.3 0.8 ± 0.5 0.5 ± 0.1
There was no further measurable peptide release after 8 hours. Samples were
taken after 1 and 2 weeks but there was no peptide detected. This incomplete
release may be due to the reasons previously described in section 4.5.2.3.
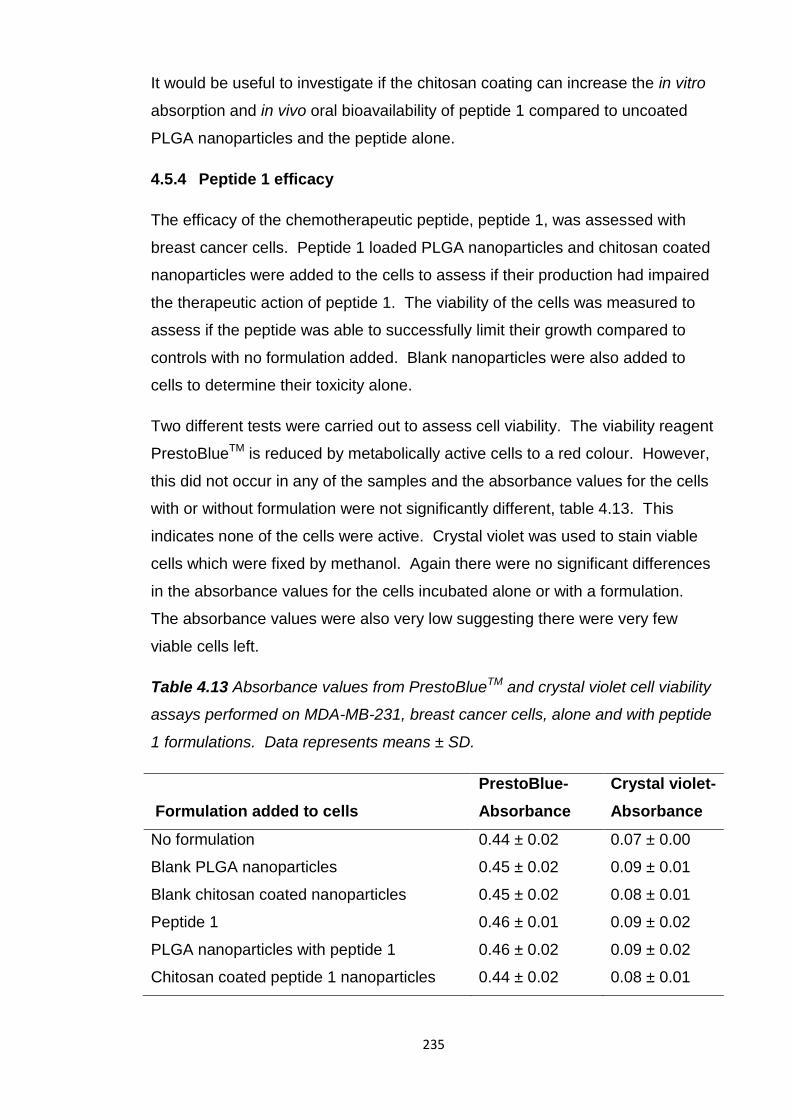
235
It would be useful to investigate if the chitosan coating can increase the in vitro
absorption and in vivo oral bioavailability of peptide 1 compared to uncoated
PLGA nanoparticles and the peptide alone.
4.5.4 Peptide 1 efficacy
The efficacy of the chemotherapeutic peptide, peptide 1, was assessed with
breast cancer cells. Peptide 1 loaded PLGA nanoparticles and chitosan coated
nanoparticles were added to the cells to assess if their production had impaired
the therapeutic action of peptide 1. The viability of the cells was measured to
assess if the peptide was able to successfully limit their growth compared to
controls with no formulation added. Blank nanoparticles were also added to
cells to determine their toxicity alone.
Two different tests were carried out to assess cell viability. The viability reagent
PrestoBlueTM is reduced by metabolically active cells to a red colour. However,
this did not occur in any of the samples and the absorbance values for the cells
with or without formulation were not significantly different, table 4.13. This
indicates none of the cells were active. Crystal violet was used to stain viable
cells which were fixed by methanol. Again there were no significant differences
in the absorbance values for the cells incubated alone or with a formulation.
The absorbance values were also very low suggesting there were very few
viable cells left.
Table 4.13 Absorbance values from PrestoBlueTM and crystal violet cell viability
assays performed on MDA-MB-231, breast cancer cells, alone and with peptide
1 formulations. Data represents means ± SD.
Formulation added to cells
PrestoBlue-
Absorbance
Crystal violet-
Absorbance
No formulation 0.44 ± 0.02 0.07 ± 0.00
Blank PLGA nanoparticles 0.45 ± 0.02 0.09 ± 0.01
Blank chitosan coated nanoparticles 0.45 ± 0.02 0.08 ± 0.01
Peptide 1 0.46 ± 0.01 0.09 ± 0.02
PLGA nanoparticles with peptide 1 0.46 ± 0.02 0.09 ± 0.02
Chitosan coated peptide 1 nanoparticles 0.44 ± 0.02 0.08 ± 0.01
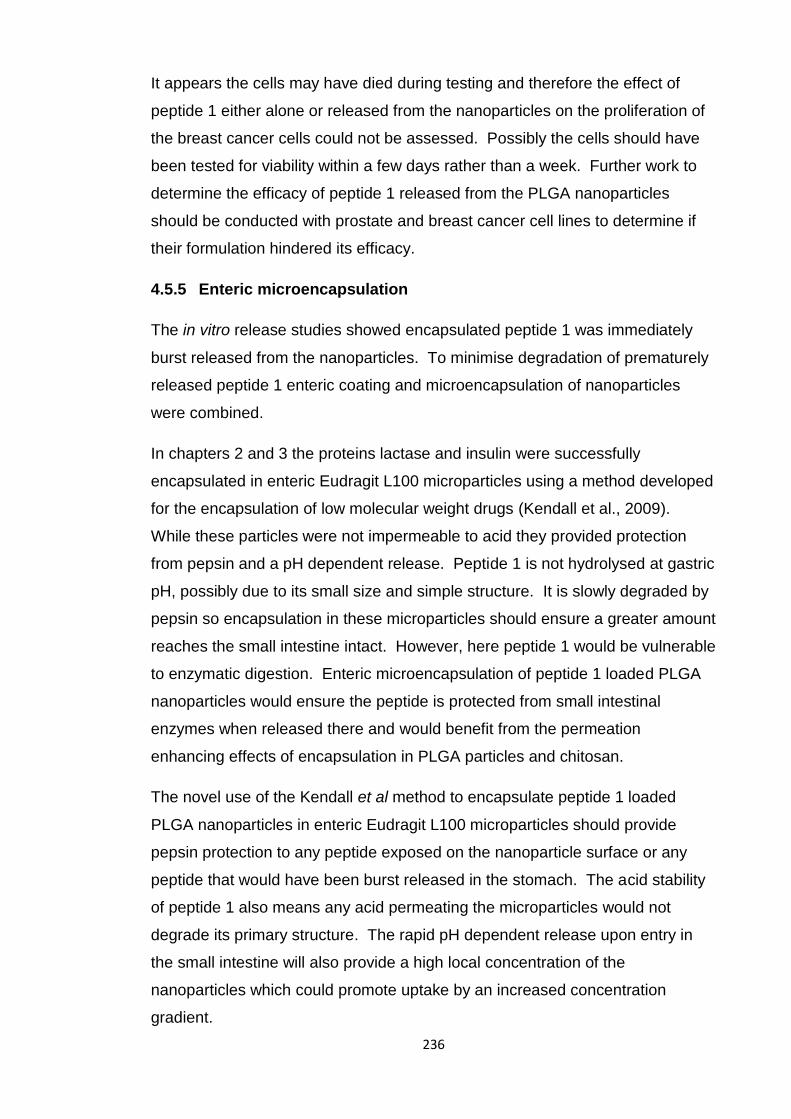
236
It appears the cells may have died during testing and therefore the effect of
peptide 1 either alone or released from the nanoparticles on the proliferation of
the breast cancer cells could not be assessed. Possibly the cells should have
been tested for viability within a few days rather than a week. Further work to
determine the efficacy of peptide 1 released from the PLGA nanoparticles
should be conducted with prostate and breast cancer cell lines to determine if
their formulation hindered its efficacy.
4.5.5 Enteric microencapsulation
The in vitro release studies showed encapsulated peptide 1 was immediately
burst released from the nanoparticles. To minimise degradation of prematurely
released peptide 1 enteric coating and microencapsulation of nanoparticles
were combined.
In chapters 2 and 3 the proteins lactase and insulin were successfully
encapsulated in enteric Eudragit L100 microparticles using a method developed
for the encapsulation of low molecular weight drugs (Kendall et al., 2009).
While these particles were not impermeable to acid they provided protection
from pepsin and a pH dependent release. Peptide 1 is not hydrolysed at gastric
pH, possibly due to its small size and simple structure. It is slowly degraded by
pepsin so encapsulation in these microparticles should ensure a greater amount
reaches the small intestine intact. However, here peptide 1 would be vulnerable
to enzymatic digestion. Enteric microencapsulation of peptide 1 loaded PLGA
nanoparticles would ensure the peptide is protected from small intestinal
enzymes when released there and would benefit from the permeation
enhancing effects of encapsulation in PLGA particles and chitosan.
The novel use of the Kendall et al method to encapsulate peptide 1 loaded
PLGA nanoparticles in enteric Eudragit L100 microparticles should provide
pepsin protection to any peptide exposed on the nanoparticle surface or any
peptide that would have been burst released in the stomach. The acid stability
of peptide 1 also means any acid permeating the microparticles would not
degrade its primary structure. The rapid pH dependent release upon entry in
the small intestine will also provide a high local concentration of the
nanoparticles which could promote uptake by an increased concentration
gradient.
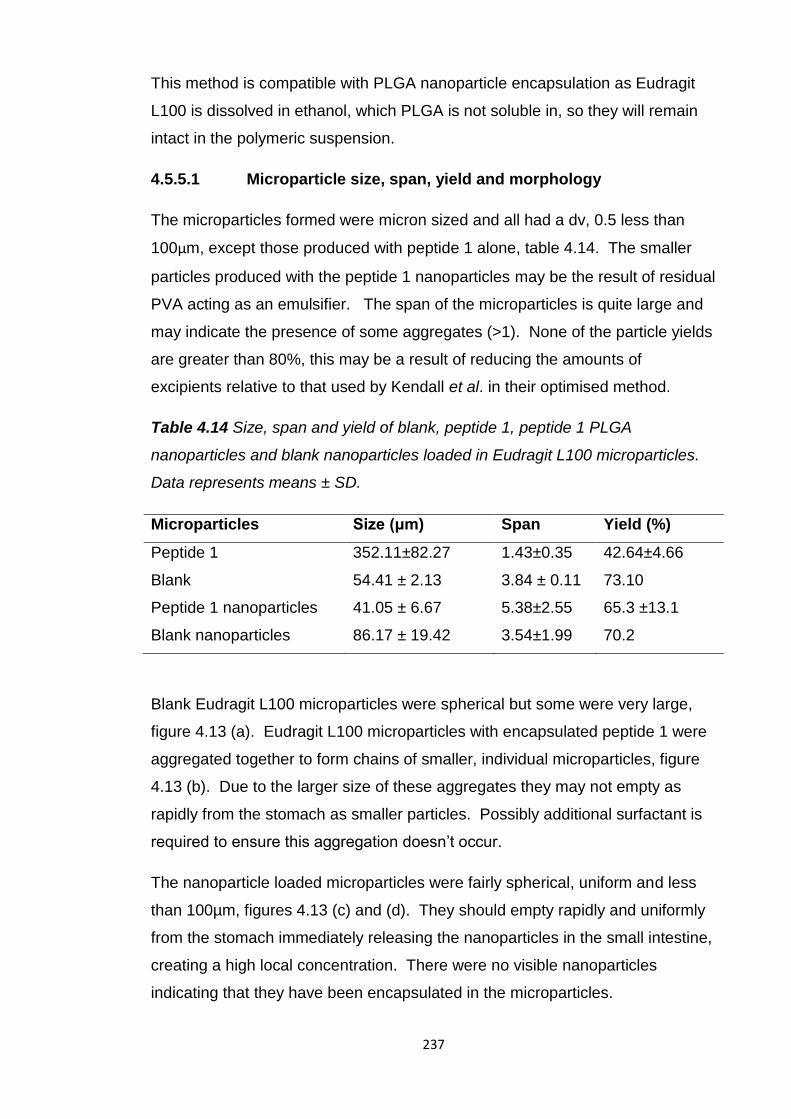
237
This method is compatible with PLGA nanoparticle encapsulation as Eudragit
L100 is dissolved in ethanol, which PLGA is not soluble in, so they will remain
intact in the polymeric suspension.
4.5.5.1 Microparticle size, span, yield and morphology
The microparticles formed were micron sized and all had a dv, 0.5 less than
100μm, except those produced with peptide 1 alone, table 4.14. The smaller
particles produced with the peptide 1 nanoparticles may be the result of residual
PVA acting as an emulsifier. The span of the microparticles is quite large and
may indicate the presence of some aggregates (>1). None of the particle yields
are greater than 80%, this may be a result of reducing the amounts of
excipients relative to that used by Kendall et al. in their optimised method.
Table 4.14 Size, span and yield of blank, peptide 1, peptide 1 PLGA
nanoparticles and blank nanoparticles loaded in Eudragit L100 microparticles.
Data represents means ± SD.
Microparticles Size (μm) Span Yield (%)
Peptide 1 352.11±82.27 1.43±0.35 42.64±4.66
Blank 54.41 ± 2.13 3.84 ± 0.11 73.10
Peptide 1 nanoparticles 41.05 ± 6.67 5.38±2.55 65.3 ±13.1
Blank nanoparticles 86.17 ± 19.42 3.54±1.99 70.2
Blank Eudragit L100 microparticles were spherical but some were very large,
figure 4.13 (a). Eudragit L100 microparticles with encapsulated peptide 1 were
aggregated together to form chains of smaller, individual microparticles, figure
4.13 (b). Due to the larger size of these aggregates they may not empty as
rapidly from the stomach as smaller particles. Possibly additional surfactant is
required to ensure this aggregation doesn’t occur.
The nanoparticle loaded microparticles were fairly spherical, uniform and less
than 100µm, figures 4.13 (c) and (d). They should empty rapidly and uniformly
from the stomach immediately releasing the nanoparticles in the small intestine,
creating a high local concentration. There were no visible nanoparticles
indicating that they have been encapsulated in the microparticles.
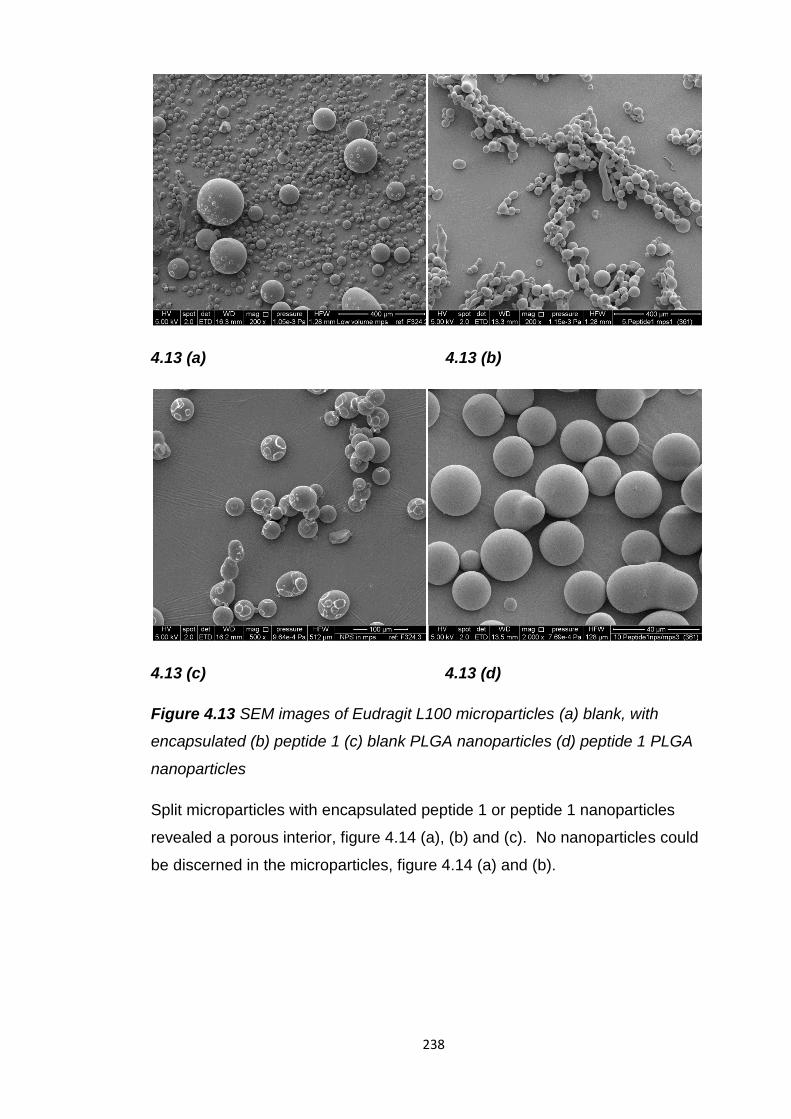
238
4.13 (a) 4.13 (b)
4.13 (c) 4.13 (d)
Figure 4.13 SEM images of Eudragit L100 microparticles (a) blank, with
encapsulated (b) peptide 1 (c) blank PLGA nanoparticles (d) peptide 1 PLGA
nanoparticles
Split microparticles with encapsulated peptide 1 or peptide 1 nanoparticles
revealed a porous interior, figure 4.14 (a), (b) and (c). No nanoparticles could
be discerned in the microparticles, figure 4.14 (a) and (b).
239
4.14 (a) 4.14 (b)
4.14 (c)
Figure 4.14 SEM images of split Eudragit L100 microparticles (a) & (b) with
encapsulated peptide 1 PLGA nanoparticles, (c) with encapsulated peptide 1
The microparticles with encapsulated nanoparticles do not appear to be
different to the microparticles without nanoparticles. Possibly it would be
difficult to identify any nanoparticles within the polymer matrix of the
microparticles and at this magnification.
4.5.5.2 Peptide 1 loading and encapsulation efficiency
Encapsulation efficiency of peptide 1 alone was less than 50%, table 4.15. This
may be due to; peptide 1 partitioning to the liquid paraffin phase, reducing the
amounts of excipients to that of the Kendall et al. method and the possible
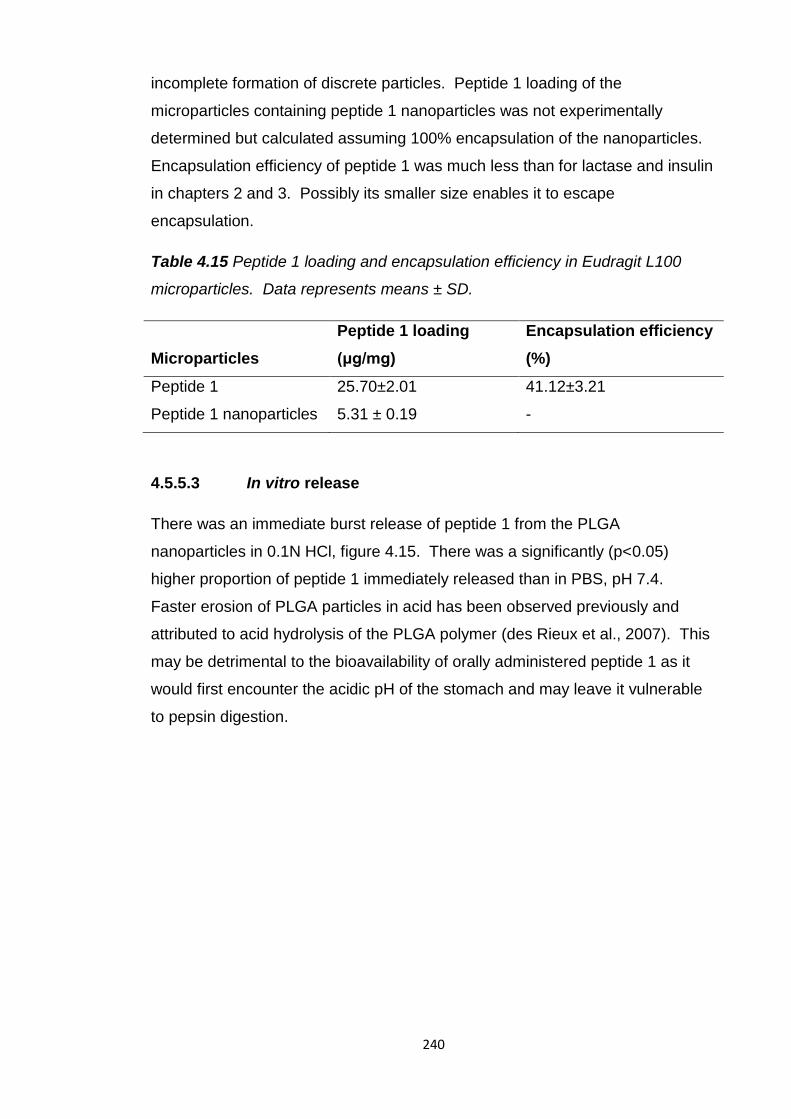
240
incomplete formation of discrete particles. Peptide 1 loading of the
microparticles containing peptide 1 nanoparticles was not experimentally
determined but calculated assuming 100% encapsulation of the nanoparticles.
Encapsulation efficiency of peptide 1 was much less than for lactase and insulin
in chapters 2 and 3. Possibly its smaller size enables it to escape
encapsulation.
Table 4.15 Peptide 1 loading and encapsulation efficiency in Eudragit L100
microparticles. Data represents means ± SD.
Microparticles
Peptide 1 loading
(μg/mg)
Encapsulation efficiency
(%)
Peptide 1 25.70±2.01 41.12±3.21
Peptide 1 nanoparticles 5.31 ± 0.19 -
4.5.5.3 In vitro release
There was an immediate burst release of peptide 1 from the PLGA
nanoparticles in 0.1N HCl, figure 4.15. There was a significantly (p<0.05)
higher proportion of peptide 1 immediately released than in PBS, pH 7.4.
Faster erosion of PLGA particles in acid has been observed previously and
attributed to acid hydrolysis of the PLGA polymer (des Rieux et al., 2007). This
may be detrimental to the bioavailability of orally administered peptide 1 as it
would first encounter the acidic pH of the stomach and may leave it vulnerable
to pepsin digestion.
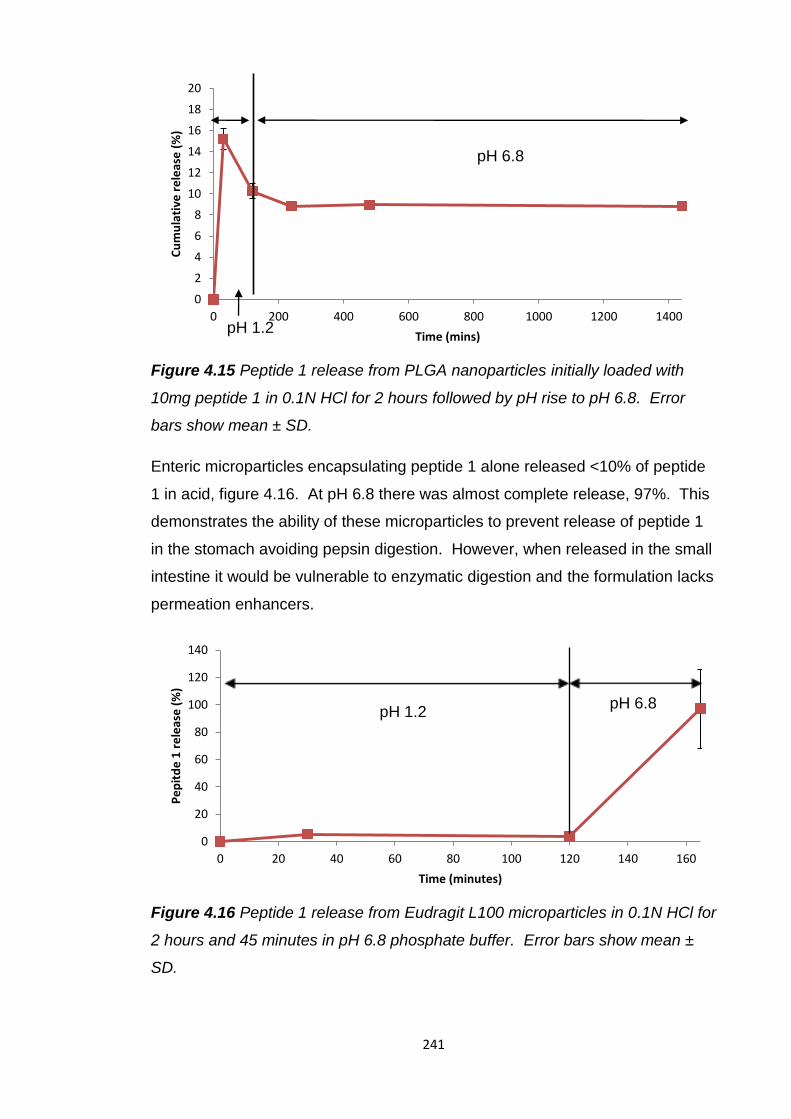
241
Figure 4.15 Peptide 1 release from PLGA nanoparticles initially loaded with
10mg peptide 1 in 0.1N HCl for 2 hours followed by pH rise to pH 6.8. Error
bars show mean ± SD.
Enteric microparticles encapsulating peptide 1 alone released <10% of peptide
1 in acid, figure 4.16. At pH 6.8 there was almost complete release, 97%. This
demonstrates the ability of these microparticles to prevent release of peptide 1
in the stomach avoiding pepsin digestion. However, when released in the small
intestine it would be vulnerable to enzymatic digestion and the formulation lacks
permeation enhancers.
Figure 4.16 Peptide 1 release from Eudragit L100 microparticles in 0.1N HCl for
2 hours and 45 minutes in pH 6.8 phosphate buffer. Error bars show mean ±
SD.
0
2
4
6
8
10
12
14
16
18
20
0 200 400 600 800 1000 1200 1400
Cu
mu
lati
ve r
ele
ase
(%
)
Time (mins)
pH 6.8
pH 1.2
0
20
40
60
80
100
120
140
0 20 40 60 80 100 120 140 160
Pe
pit
de
1 r
ele
ase
(%
)
Time (minutes)
pH 1.2 pH 6.8
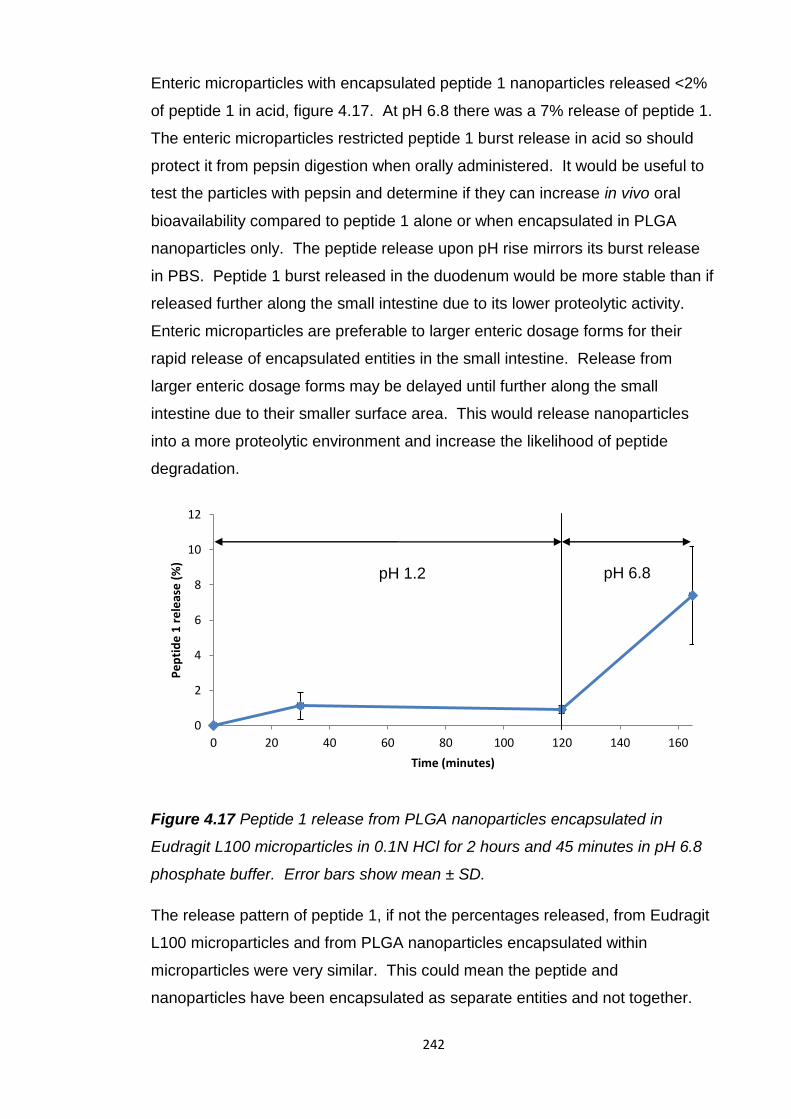
242
Enteric microparticles with encapsulated peptide 1 nanoparticles released <2%
of peptide 1 in acid, figure 4.17. At pH 6.8 there was a 7% release of peptide 1.
The enteric microparticles restricted peptide 1 burst release in acid so should
protect it from pepsin digestion when orally administered. It would be useful to
test the particles with pepsin and determine if they can increase in vivo oral
bioavailability compared to peptide 1 alone or when encapsulated in PLGA
nanoparticles only. The peptide release upon pH rise mirrors its burst release
in PBS. Peptide 1 burst released in the duodenum would be more stable than if
released further along the small intestine due to its lower proteolytic activity.
Enteric microparticles are preferable to larger enteric dosage forms for their
rapid release of encapsulated entities in the small intestine. Release from
larger enteric dosage forms may be delayed until further along the small
intestine due to their smaller surface area. This would release nanoparticles
into a more proteolytic environment and increase the likelihood of peptide
degradation.
Figure 4.17 Peptide 1 release from PLGA nanoparticles encapsulated in
Eudragit L100 microparticles in 0.1N HCl for 2 hours and 45 minutes in pH 6.8
phosphate buffer. Error bars show mean ± SD.
The release pattern of peptide 1, if not the percentages released, from Eudragit
L100 microparticles and from PLGA nanoparticles encapsulated within
microparticles were very similar. This could mean the peptide and
nanoparticles have been encapsulated as separate entities and not together.
0
2
4
6
8
10
12
0 20 40 60 80 100 120 140 160
Pe
pti
de
1 r
ele
ase
(%
)
Time (minutes)
pH 1.2 pH 6.8
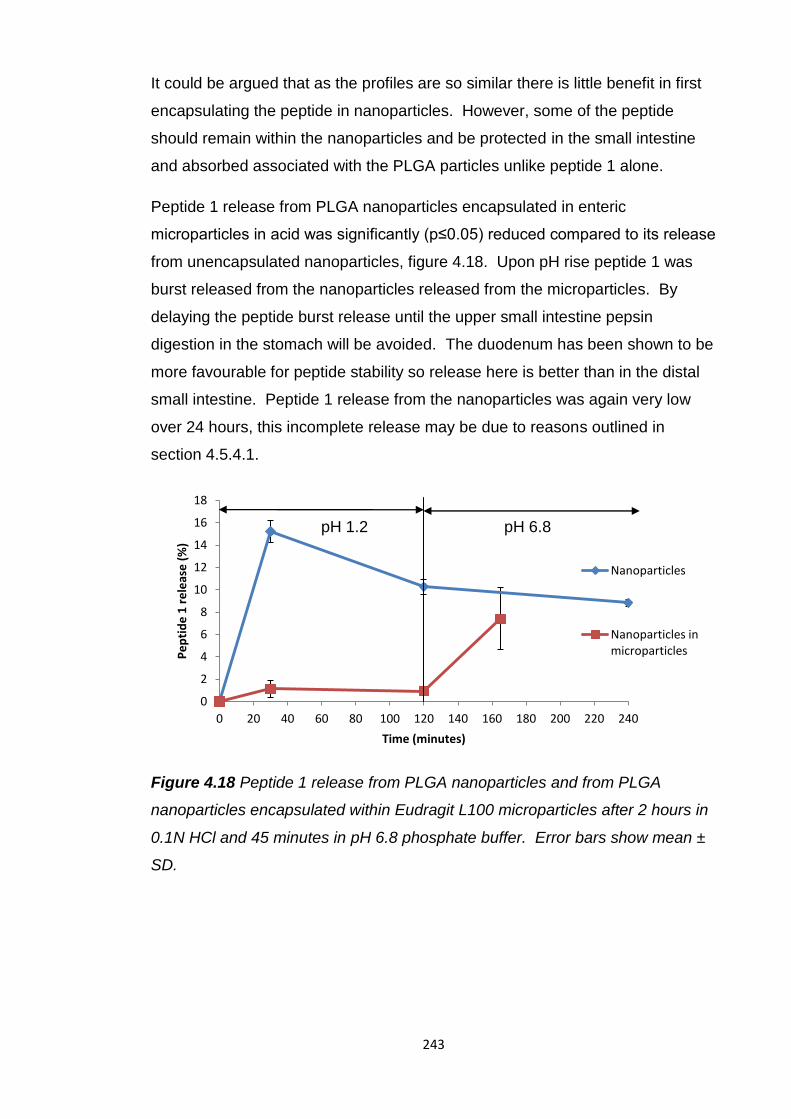
243
It could be argued that as the profiles are so similar there is little benefit in first
encapsulating the peptide in nanoparticles. However, some of the peptide
should remain within the nanoparticles and be protected in the small intestine
and absorbed associated with the PLGA particles unlike peptide 1 alone.
Peptide 1 release from PLGA nanoparticles encapsulated in enteric
microparticles in acid was significantly (p≤0.05) reduced compared to its release
from unencapsulated nanoparticles, figure 4.18. Upon pH rise peptide 1 was
burst released from the nanoparticles released from the microparticles. By
delaying the peptide burst release until the upper small intestine pepsin
digestion in the stomach will be avoided. The duodenum has been shown to be
more favourable for peptide stability so release here is better than in the distal
small intestine. Peptide 1 release from the nanoparticles was again very low
over 24 hours, this incomplete release may be due to reasons outlined in
section 4.5.4.1.
Figure 4.18 Peptide 1 release from PLGA nanoparticles and from PLGA
nanoparticles encapsulated within Eudragit L100 microparticles after 2 hours in
0.1N HCl and 45 minutes in pH 6.8 phosphate buffer. Error bars show mean ±
SD.
0
2
4
6
8
10
12
14
16
18
0 20 40 60 80 100 120 140 160 180 200 220 240
Pe
pti
de
1 r
ele
ase
(%
)
Time (minutes)
Nanoparticles
Nanoparticles in microparticles
pH 1.2 pH 6.8
244
4.6 Conclusion
The feasibility of delivering peptide 1 orally was investigated by incubation with
simulated and porcine intestinal fluids and human faecal fluids. These studies
revealed that the primary structure of peptide 1 was stable at gastric pH but was
susceptible to digestion by GI enzymes. This instability was not uniform along
the GI tract. Peptide 1 was most stable in gastric and duodenal fluids and was
increasingly digested along the small intestine and in the porcine colonic and
human faecal fluids.
To provide protection from intestinal degradation and increase its absorption
into the systemic circulation peptide 1 was encapsulated in PLGA nanoparticles.
The parameters of the double emulsion solvent evaporation method used to
form the particles were varied to produce nanoparticles with optimal
characteristics for oral delivery.
The longer solvent evaporation duration of 4 hours significantly reduced the
encapsulation efficiency of peptide 1 in the nanoparticles, initially loaded with
20mg peptide 1, from 57.5 to 48.6%. The increased evaporation time may have
allowed hydrophilic peptide 1 to partition into the external aqueous phase
evading encapsulation. The extended stirring time may have caused loss of
surface associated peptide so for these reasons the shorter evaporation time of
2 hours was selected for further PLGA nanoparticle production.
The lower PVA concentration, 1.25%, in the outer aqueous phase significantly
reduced nanoparticle size to less than 200nm and, as a small particle size is
critical for absorption, this concentration was selected for use. Formation of
smaller particles might be due to faster solvent evaporation and particle
formation due to the decreased viscosity of an external aqueous phase.
Successful peptide loading was indicated by the charge of the nanoparticles
becoming increasingly positive when positively charge peptide 1 was included
in the formulations.
Chitosan coating of the PLGA nanoparticles was conducted to enhance
intestinal permeation. Chitosan coating significantly increased nanoparticle
size, to more than 300nm, which may hamper its permeation. However, its
other permeation enhancing effects may counteract this.
245
Chitosan coating significantly reduced peptide 1 loading, from 61 to 35µg/mg,
and encapsulation efficiency, from 63% to 46%, compared to the uncoated
particles. This may be due to electrostatic repulsion between positively charged
chitosan and peptide 1. Peptide 1 release in vitro was significantly reduced
from 11% in 30 minutes from the uncoated particles to only 1% from the
chitosan coated nanoparticles. This may be due to an increased diffusion
pathway.
In vitro the PLGA nanoparticles immediately released approximately 10% of the
peptide 1 load in 30 minutes, followed by very little further release up to 2
weeks later. This pattern of in vitro release does not bode well for oral peptide
1 bioavailability. Any peptide 1 immediately released upon oral administration
may be subject to pepsin digestion in the stomach and further enzymatic
digestion in the small intestine. The peptide not released but remaining within
the nanoparticles may, based on these results, not ever be released and so
would be unable to halt tumour growth. The lack of any further detectable
peptide release could be a result of the peptide degrading when it is released.
Incomplete release may also be caused by the positively charged peptide
interacting with negatively charged PLGA.
The novel use of the Kendall et al method to encapsulate peptide 1 loaded
PLGA nanoparticles in enteric Eudragit L100 microparticles significantly
reduced peptide 1 burst release in acid compared to peptide 1 nanoparticles,
from 15% to 1%, which should prevent its digestion in the stomach. The rapid
pH dependent release in the small intestine should provide a high concentration
of the nanoparticles which could promote uptake by an increased concentration
gradient. There was still a burst release of peptide 1 from the released
nanoparticles which in vivo may be vulnerable to digestion in the small intestine
but at least this would occur in the duodenum where peptide 1 was shown to be
more stable than the other small intestinal segments.

246
Chapter 5
Final conclusions and future work
247
5.1 Conclusion
Very few protein/peptide drugs are currently orally available due to acidic and
enzymatic instability in the GI tract and their large size and hydrophilicity limiting
their absorption from the intestinal tract into the bloodstream. Oral delivery
strategies are being actively pursued by academic and industrial research
groups to increase oral bioavailabilities from less than 1% to 30-50% (Shaji and
Patole, 2008).
One of the aims of this project was to compare the intestinal stability of protein
and peptide drugs of varying size using simulated and porcine gastrointestinal
fluids and a human faecal slurry. Those studied in this project were a large
protein, lactase, 464 kDa, a small protein, insulin, 5.8 kDa, and a small peptide,
peptide 1, 1.2 kDa. Lactase was immediately denatured at fasting stomach pH
whereas the primary structures of insulin and peptide 1 were not unstable. This
may be due to disruption of the weak interactions holding together the more
complex structure of lactase by ionisation changes caused by the low pH. The
2 polypeptide chains of insulin are primarily held together by stronger disulphide
bonds which may not be affected at low pH. The simpler structure of peptide 1
may make it more stable at low pH.
Lactase was stable with intestinal enzymes possibly due to inaccessibility of its
peptide bonds to the digestive enzymes. The smaller protein insulin was
immediately digested by gastric, small intestinal and large intestinal enzymes.
This may be due to greater accessibility of its peptide bonds to digestive
enzymes and possible loss of the disulphide bonds holding its polypeptide
chains together by the presence of glutathione. Peptide 1 was degraded by
enzymes in all GI fluids but more gradually than insulin over a two hour period.
This may be due to there being less bonds susceptible to digestion as it simply
has less amino acids.
To overcome acid instability of lactase and pepsin digestion of insulin they were
encapsulated in enteric Eudragit L100 microparticles. Oral delivery of both
these drugs must be carefully coordinated with food consumption as they must
be available to digest it or control the effects of its digestion. Delayed drug
release at small intestinal pH and delayed efficacy caused by food has
previously been observed with enteric tablets or capsules.
248
By reducing dosage form size this delayed release can be avoided as the
greater surface area can provide a faster and more uniform drug release in the
small intestine and their ability to mix with the contents of the stomach and
rapidly empty avoids delays caused by food. This should also help to minimise
variability in absorption and bioavailability and allow effective and rapid control
of symptoms.
The preparation of enteric micro and nanoparticulates can pose a threat to the
integrity of protein and peptide drugs. An oil in oil emulsion solvent evaporation
method previously used for encapsulation of small molecular weight drugs in
enteric Eudragit microparticles was used due to its use of the less toxic ethanol
to dissolve the polymer and its lack of any high shear homogenisation steps. It
also required no control of temperature making it a far simpler method and
possibly more attractive for future commercial use. Lactase and insulin were
both successfully encapsulated in Eudragit L100 microparticles by this method
with a high yield and encapsulation efficiency, >70%, and uniformly sized
particles less than 100µm were produced which should allow rapid and uniform
gastric emptying and drug release.
Eudragit L100 microparticles were able to control the release of lactase and
insulin in a pH dependent manner, once lactase particle size had been reduced
by spray drying allowing a deeper encapsulation. Below pH 6 there was <30%
release of encapsulated drug, this release was probably protein drug held at the
surface of the particles. The particles were able to protect insulin from pepsin
digestion, 80% remaining intact after 2 hours with the enzyme in SGF and 49%
after 2 hours in porcine gastric fluid, however encapsulated lactase was
completely inactivated after incubation of the microparticles in 0.1N HCl.
As it was established that most of the encapsulated lactase remained within the
particles it was hypothesised acid may be able to enter the particles. An
investigation into the porosity and morphology of the particles revealed a porous
interior and by using an SEM with a new back scatter detector, crystal-like
structures were observed on the surface of the particles. It was concluded
these are most likely to be residual surfactant and they disappeared when
incubated in acid. This may provide a means for acid to enter the particles as
they appear not to be solely composed of the acid resistant polymer.
249
To overcome acid permeability antacids were co-encapsulated to protect
lactase. Co-encapsulated magnesium hydroxide provided the greatest
protection of lactase, 9.2% remaining intact after 2 hours in acid, superior to any
of the oral lactase supplements tested during this study.
Insulin release at pH 6.8 was rapid and complete within 45 minutes. This
should enable fast insulin absorption in vivo and rapid control of post prandial
glycemia. Release of insulin from Eudragit L100 particles was faster than from
particles of the same polymer prepared with an outer aqueous phase and DCM
as the solvent to dissolve the polymer. Possibly the faster evaporation of DCM
than ethanol did not allow as many or as large pore formation so their
breakdown was slower. It would be useful to explore further the effects of
solvents and outer aqueous phase on the morphology of the particles.
As insulin is also very unstable with small intestinal enzymes a protease
inhibitor, citric acid, was included in the microparticles. Its release in the small
intestine should provide intestinal protection. Citric acid reduced insulin
degradation with pancreatin but caused large aggregates of microparticles to
form. The inclusion of magnesium hydroxide with lactase in the microparticles
also caused aggregation of the particles. This may have been due to a
plasticising effect on the Eudragit L100 polymer. More work is needed to find
an optimal ratio to form microparticles.
The recently discovered chemotherapeutic peptide 1 was the most stable of the
proteins/peptide tested, possibly due to its smaller size. However, it is still large
compared to commonly orally delivered low molecular weight drugs so will still
encounter permeability limitations and is gradually degraded by enzymes
throughout the GI tract. PLGA particles are currently used for the injectable,
prolonged release of chemotherapeutic peptides of a similar size and structure
to peptide 1. Due to this compatibility and ability of PLGA nanoparticles to
provide enzyme protection, without causing digestive disruption, and increased
permeability, without disrupting intestinal cell membranes, they were selected
for formulation of peptide 1.
All the PLGA nanoparticles produced a rapid peptide 1 burst release in PBS
followed by very little further release over 24 hours and up to 2 weeks in some
cases, overall less than 20% was released.
250
Incomplete release may be caused by destruction of the peptide when released
or possibly interaction of cationic peptide 1 with anionic, degrading PLGA . To
limit burst release of peptide 1 in the stomach, where it would be gradually
degraded by pepsin, the peptide 1 loaded PLGA nanoparticles were
encapsulated in Eudragit L100 microparticles using the method previously used
for lactase and insulin. The microparticles produced were <100µm and reduced
peptide 1 release in acid from ~16% to <2%. Peptide 1 burst release would be
delayed until the small intestine where it would have an increased chance of
being absorbed than from the stomach. The rapid and uniform release of the
nanoparticles may also create a high local concentration promoting their
absorption into the bloodstream.
The commercial oral protein/peptide drug delivery system which has progressed
furthest so far is Tarsa Therapeutics’ salmon calcitonin formulation which has
successfully completed phase III clinical trials. This is an enteric coated tablet
with an enzyme inhibitor, citric acid, and permeation enhancer, acylcarnitine.
Enteric coated tablets/capsules have previously suffered from delayed release
at small intestinal pH and may be more affected by the presence of food in the
stomach than smaller dosages. This may create variability in drug absorption,
for calcitonin this may not be too detrimental as it has a large therapeutic
window. However for those drugs with a narrow therapeutic window or whose
availability must be carefully coordinated with food this may not be acceptable.
This work has demonstrated that the method of Kendall et al can successfully
encapsulate protein and peptide drugs of widely varying size without impairing
the activity of these notoriously fragile macromolecules in Eudragit L100
microparticles. They provided pH dependent release, pepsin protection, rapid
release at small intestinal pH, may be less delayed by the presence of food than
larger enteric tablets/capsules and may reduce variability in drug absorption
seen with larger dosages. They were also able to encapsulate nanoparticles
with encapsulated peptide and co-encapsulate citric acid and antacids. This
may allow formulation of a modular delivery system incorporating enteric
protection with permeation enhancement and enzyme inhibitors.
251
5.2 Future work
It would be useful to test the stability of the protein/peptide drugs in human
intestinal fluids to gain a better insight into their in vivo behaviour. Testing more
protein/peptide drugs of varying sizes and structure complexities would provide
more information about where they are stable and unstable in the GI tract and
may enable more tailored oral formulation development based on size.
Further studies to increase the protection of acid labile protein/peptide drugs in
Eudragit L100 microparticles by co-encapsulation of antacids could be
conducted. It would also be useful to optimise the ratio of co-encapsulated
enzyme inhibitors to Eudragit L100 and investigate their ability to increase
protection in vitro in enzyme solutions and with animal intestinal fluids.
It would be beneficial to explore the permeability of protein/peptide drugs with
Caco-2 cells and attempt incorporation of permeability enhancers within the
microparticles to explore their potential to increase absorption. Increased
permeation caused by encapsulation in PLGA nanoparticles should also be
studied and the effects of chitosan coating of these particles should be
investigated.
It would be useful to conduct in vivo, oral bioavailability studies in animals to
investigate if enteric microencapsulation can increase the bioavailability of
protein/peptide drugs encapsulated alone or loaded in polymeric nanoparticles.
The bioavailability, inter/intra subject variability in absorption and delay between
administration and onset of action should be compared to enteric
tablets/capsules to investigate the effects of dosage form size reduction. The
effects of food on the action of enteric capsules/tablets and microparticles
should also be compared.
252
References
ADAIR, C. G., MCCALLION, O., MCELNAY, J. C., SCOTT, M. G., HAMILTON,
B. A., MCCANN, J. P., STANFORD, C. F. & NICHOLLS, D. P. 1992. A
pharmacokinetic and pharmacodynamic comparison of plain and enteric-
coated prednisolone tablets. Br J Clin Pharmacol, 33, 495-9.
ADJEI, A., LOVE, S., JOHNSON, E., DIAZ, G., GREER, J., HAVIV, F. & BUSH,
E. 1993. Effect of formulation adjuvants on gastrointestinal absorption of
leuprolide acetate. J Drug Target, 1, 251-8.
AGARWAL, V., KHAN, M. A. & NAZZAL, S. 2008. Polymethacrylate based
microparticulates of insulin for oral delivery, part II: solid state
characterization. Pharmazie, 63, 122-8.
AGARWAL, V., REDDY, I. K. & KHAN, M. A. 2001. Polymethyacrylate based
microparticulates of insulin for oral delivery: preparation and in vitro
dissolution stability in the presence of enzyme inhibitors. Int J Pharm,
225, 31-9.
AL-HABET, S. M. & ROGERS, H. J. 1989. Effect of food on the absorption and
pharmacokinetics of prednisolone from enteric-coated tablets. Eur J Clin
Pharmacol, 37, 423-6.
ALAVI, A. K., SQUILLANTE, E., 3RD & MEHTA, K. A. 2002. Formulation of
enterosoluble microparticles for an acid labile protein. J Pharm Pharm
Sci, 5, 234-44.
ALHNAN, M. A., COSI, D., MURDAN, S., BASIT, A.W. 2010. Inhibiting the
gastric burst release of drugs from enteric microparticles: The influence
of drug molecular mass and solubility. Journal of Pharmaceutical
Sciences, 99, 4576-4583.
ALOULOU, A., PUCCINELLI, D., SARLES, J., LAUGIER, R., LEBLOND, Y. &
CARRIERE, F. 2008. In vitro comparative study of three pancreatic
enzyme preparations: dissolution profiles, active enzyme release and
acid stability. Aliment Pharmacol Ther, 27, 283-92.
ALSENZ, J., RUSSELL-JONES, G. J., WESTWOOD, S., LEVET-TRAFIT, B. &
DE SMIDT, P. C. 2000. Oral absorption of peptides through the
cobalamin (vitamin B12) pathway in the rat intestine. Pharm Res, 17,
825-32.
253
AMET, N., WANG, W. & SHEN, W. C. 2010. Human growth hormone-
transferrin fusion protein for oral delivery in hypophysectomized rats. J
Control Release, 141, 177-82.
ANDERBERG, E. K. & ARTURSSON, P. 1993. Epithelial transport of drugs in
cell culture. VIII: Effects of sodium dodecyl sulfate on cell membrane and
tight junction permeability in human intestinal epithelial (Caco-2) cells. J
Pharm Sci, 82, 392-8.
ANDERSON, K. E., ELIOT, L. A., STEVENSON, B. R. & ROGERS, J. A. 2001.
Formulation and evaluation of a folic acid receptor-targeted oral
vancomycin liposomal dosage form. Pharm Res, 18, 316-22.
ANDREWS, G. P., JONES, D. S., DIAK, O. A., MCCOY, C. P., WATTS, A. B. &
MCGINITY, J. W. 2008. The manufacture and characterisation of hot-
melt extruded enteric tablets. Eur J Pharm Biopharm, 69, 264-73.
ANKOLA, D. D., BATTISTI, A., SOLARO, R. & KUMAR, M. N. 2010.
Nanoparticles made of multi-block copolymer of lactic acid and ethylene
glycol containing periodic side-chain carboxyl groups for oral delivery of
cyclosporine A. J R Soc Interface, 7 Suppl 4, S475-81.
BAI, J. P., CHANG, L. L. & GUO, J. H. 1996. Effects of polyacrylic polymers on
the degradation of insulin and peptide drugs by chymotrypsin and trypsin.
J Pharm Pharmacol, 48, 17-21.
BAI, Y., ANN, D. K. & SHEN, W. C. 2005. Recombinant granulocyte colony-
stimulating factor-transferrin fusion protein as an oral myelopoietic agent.
Proc Natl Acad Sci U S A, 102, 7292-6.
BATTAGLIA, L., TROTTA, M., GALLARATE, M., CARLOTTI, M. E., ZARA, G.
P. & BARGONI, A. 2007. Solid lipid nanoparticles formed by solvent-in-
water emulsion-diffusion technique: development and influence on insulin
stability. J Microencapsul, 24, 660-72.
BAYLEY, D., TEMPLE, C., CLAY, V., STEWARD, A. & LOWTHER, N. 1995.
The transmucosal absorption of recombinant human interferon-alpha B/D
hybrid in the rat and rabbit. J Pharm Pharmacol, 47, 721-4.
BEKERMAN, T., GOLENSER, J. & DOMB, A. 2004. Cyclosporin
nanoparticulate lipospheres for oral administration. J Pharm Sci, 93,
1264-70.
254
BERG, J. M., TYMOCZKO, J.L., STRYER, L. 2002. Amino Acid Sequences
Can Be Determined by Automated Edman Degradation. Biochemistry.
New York: W.H. Freeman.
BEVERLEY, D. W., KELLEHER, J., MACDONALD, A., LITTLEWOOD, J. M.,
ROBINSON, T. & WALTERS, M. P. 1987. Comparison of four pancreatic
extracts in cystic fibrosis. Arch Dis Child, 62, 564-8.
BINKLEY, N., BOLOGNESE, M., SIDOROWICZ-BIALYNICKA, A., VALLY, T.,
TROUT, R., MILLER, C., BUBEN, C. E., GILLIGAN, J. P., KRAUSE, D.
S. & ORAL CALCITONIN IN POSTMENOPAUSAL OSTEOPOROSIS, I.
2012. A phase 3 trial of the efficacy and safety of oral recombinant
calcitonin: the Oral Calcitonin in Postmenopausal Osteoporosis
(ORACAL) trial. J Bone Miner Res, 27, 1821-9.
BLAIR GEHO, W., LAU, J., ROSENBERG, L. & SCHWARTZ, S. 2009. A single-
blind, placebo-controlled, food-dose timing trial of oral HDV-insulin in
patients with type 2 diabetes mellitus.
BLANCHETTE, J. & PEPPAS, N. A. 2005a. Cellular evaluation of oral
chemotherapy carriers. J Biomed Mater Res A, 72, 381-8.
BLANCHETTE, J. & PEPPAS, N. A. 2005b. Oral chemotherapeutic delivery:
design and cellular response. Ann Biomed Eng, 33, 142-9.
BLANCO, D. & ALONSO, M. J. 1998. Protein encapsulation and release from
poly(lactide-co-glycolide) microspheres: effect of the protein and polymer
properties and of the co-encapsulation of surfactants. Eur J Pharm
Biopharm, 45, 285-94.
BLANCO, M. D. & ALONSO, M. J. 1997. Development and characterization of
protein-loaded poly(lactide-co-glycolide) nanospheres. European Journal
of Pharmaceutics and Biopharmaceutics, 43, 287-294.
BROADHEAD, J., ROUAN, S. K., HAU, I. & RHODES, C. T. 1994. The effect of
process and formulation variables on the properties of spray-dried beta-
galactosidase. J Pharm Pharmacol, 46, 458-67.
CALLREUS, T., LUNDAHL, J., HOGLUND, P. & BENGTSSON, P. 1999.
Changes in gastrointestinal motility influence the absorption of
desmopressin. Eur J Clin Pharmacol, 55, 305-9.
CARAFA, M., MARIANECCI, C., ANNIBALDI, V., DI STEFANO, A., SOZIO, P.
& SANTUCCI, E. 2006. Novel O-palmitoylscleroglucan-coated liposomes
255
as drug carriers: development, characterization and interaction with
leuprolide. Int J Pharm, 325, 155-62.
CARINO, G. P., JACOB, J. S. & MATHIOWITZ, E. 2000. Nanosphere based
oral insulin delivery. J Control Release, 65, 261-9.
CARR, D. A., GOMEZ-BURGAZ, M., BOUDES, M. C. & PEPPAS, N. A. 2010.
Complexation Hydrogels for the Oral Delivery of Growth Hormone and
Salmon Calcitonin. Ind Eng Chem Res, 49, 11991-11995.
CARR, D. A. & PEPPAS, N. A. 2010. Assessment of poly(methacrylic acid-co-
N-vinyl pyrrolidone) as a carrier for the oral delivery of therapeutic
proteins using Caco-2 and HT29-MTX cell lines. J Biomed Mater Res A,
92, 504-12.
CETIN, M., AKTAS, M. S., VURAL, I. & OZTURK, M. 2012. Salmon calcitonin-
loaded Eudragit(R) and Eudragit(R)-PLGA nanoparticles: in vitro and in
vivo evaluation. J Microencapsul, 29, 156-66.
CETIN, M., YOUN, Y. S., CAPAN, Y. & LEE, K. C. 2008. Preparation and
characterization of salmon calcitonin-biotin conjugates. AAPS
PharmSciTech, 9, 1191-7.
CHAE, S. Y., JIN, C. H., SHIN, H. J., YOUN, Y. S., LEE, S. & LEE, K. C. 2008.
Preparation, characterization, and application of biotinylated and biotin-
PEGylated glucagon-like peptide-1 analogues for enhanced oral delivery.
Bioconjug Chem, 19, 334-41.
CHALASANI, K. B., RUSSELL-JONES, G. J., YANDRAPU, S. K., DIWAN, P. V.
& JAIN, S. K. 2007. A novel vitamin B12-nanosphere conjugate carrier
system for peroral delivery of insulin. J Control Release, 117, 421-9.
CHALLACOMBE, S. J., RAHMAN, D., JEFFERY, H., DAVIS, S. S. & O'HAGAN,
D. T. 1992. Enhanced secretory IgA and systemic IgG antibody
responses after oral immunization with biodegradable microparticles
containing antigen. Immunology, 76, 164-8.
CHENG, J., TEPLY, B. A., JEONG, S. Y., YIM, C. H., HO, D., SHERIFI, I., JON,
S., FAROKHZAD, O. C., KHADEMHOSSEINI, A. & LANGER, R. S.
2006. Magnetically responsive polymeric microparticles for oral delivery
of protein drugs. Pharm Res, 23, 557-64.
CHENG, W. & LIM, L. Y. 2009. Synthesis, characterization and in vivo activity of
salmon calcitonin coconjugated with lipid and polyethylene glycol. J
Pharm Sci, 98, 1438-51.
256
COHEN-SELA, E., CHORNY, M., KOROUKHOV, N., DANENBERG, H. D. &
GOLOMB, G. 2009. A new double emulsion solvent diffusion technique
for encapsulating hydrophilic molecules in PLGA nanoparticles. J Control
Release, 133, 90-5.
COLE, E. T., SCOTT, R. A., CONNOR, A. L., WILDING, I. R., PETEREIT, H.
U., SCHMINKE, C., BECKERT, T. & CADE, D. 2002. Enteric coated
HPMC capsules designed to achieve intestinal targeting. Int J Pharm,
231, 83-95.
CONRADI, R. A., HILGERS, A. R., HO, N. F. & BURTON, P. S. 1991. The
influence of peptide structure on transport across Caco-2 cells. Pharm
Res, 8, 1453-60.
COSTANTINO, H. R., FIROUZABADIAN, L., HOGELAND, K., WU, C. C.,
BEGANSKI, C., CARRASQUILLO, K. G., CORDOVA, M., GRIEBENOW,
K., ZALE, S. E. & TRACY, M. A. 2000. Protein spray-freeze drying. Effect
of atomization conditions on particle size and stability. Pharmaceutical
Research, 17, 1374-1383.
CROTTS, G. & PARK, T. G. 1998. Protein delivery from poly(lactic-co-glycolic
acid) biodegradable microspheres: release kinetics and stability issues. J
Microencapsul, 15, 699-713.
CUI, F., QIAN, F. & YIN, C. 2006a. Preparation and characterization of
mucoadhesive polymer-coated nanoparticles. Int J Pharm, 316, 154-61.
CUI, F., SHI, K., ZHANG, L., TAO, A. & KAWASHIMA, Y. 2006b. Biodegradable
nanoparticles loaded with insulin-phospholipid complex for oral delivery:
preparation, in vitro characterization and in vivo evaluation. J Control
Release, 114, 242-50.
CUI, F. D., TAO, A. J., CUN, D. M., ZHANG, L. Q. & SHI, K. 2007. Preparation
of insulin loaded PLGA-Hp55 nanoparticles for oral delivery. J Pharm
Sci, 96, 421-7.
D'AGAY-ABENSOUR, L., FJELLESTAD-PAULSEN, A., HOGLUND, P., NGO,
Y., PAULSEN, O. & RAMBAUD, J. C. 1993. Absolute bioavailability of an
aqueous solution of 1-deamino-8-D-arginine vasopressin from different
regions of the gastrointestinal tract in man. Eur J Clin Pharmacol, 44,
473-6.
DAI, C., WANG, B. & ZHAO, H. 2005. Microencapsulation peptide and protein
drugs delivery system. Colloids Surf B Biointerfaces, 41, 117-20.
257
DAI, J., NAGAI, T., WANG, X., ZHANG, T., MENG, M. & ZHANG, Q. 2004a.
pH-sensitive nanoparticles for improving the oral bioavailability of
cyclosporine A. Int J Pharm, 280, 229-40.
DAI, J. D., WANG, X. Q., ZHANG, T., MENG, M., ZHANG, X., LU, W. L. &
ZHANG, Q. 2004b. [Preparation of cyclosporine A pH sensitive
nanoparticles and oral pharmacokinetics in rats]. Yao Xue Xue Bao, 39,
1023-7.
DAMGE, C., VRANCKX, H., BALSCHMIDT, P. & COUVREUR, P. 1997.
Poly(alkyl cyanoacrylate) nanospheres for oral administration of insulin. J
Pharm Sci, 86, 1403-9.
DANHIER, F., VROMAN, B., LECOUTURIER, N., CROKART, N.,
POURCELLE, V., FREICHELS, H., JEROME, C., MARCHAND-
BRYNAERT, J., FERON, O. & PREAT, V. 2009. Targeting of tumor
endothelium by RGD-grafted PLGA-nanoparticles loaded with Paclitaxel.
J Control Release, 140, 166-73.
DASHEVSKY, A. 1998. Protein loss by the microencapsulation of an enzyme
(lactase) in alginate beads. International Journal of Pharmaceutics, 161,
1-5.
DELCHIER, J. C., VIDON, N., SAINT-MARC GIRARDIN, M. F., SOULE, J. C.,
MOULIN, C., HUCHET, B. & ZYLBERBERG, P. 1991. Fate of orally
ingested enzymes in pancreatic insufficiency: comparison of two
pancreatic enzyme preparations. Aliment Pharmacol Ther, 5, 365-78.
DELGADO, A., LAVELLE, E. C., HARTSHORNE, M. & DAVIS, S. S. 1999. PLG
microparticles stabilised using enteric coating polymers as oral vaccine
delivery systems. Vaccine, 17, 2927-38.
DES RIEUX, A., FIEVEZ, V., MOMTAZ, M., DETREMBLEUR, C., ALONSO-
SANDE, M., VAN GELDER, J., CAUVIN, A., SCHNEIDER, Y. J. &
PREAT, V. 2007. Helodermin-loaded nanoparticles: characterization and
transport across an in vitro model of the follicle-associated epithelium. J
Control Release, 118, 294-302.
DESAI, M. P., LABHASETWAR, V., AMIDON, G. L. & LEVY, R. J. 1996.
Gastrointestinal uptake of biodegradable microparticles: effect of particle
size. Pharm Res, 13, 1838-45.
258
DEVARAJAN, P. V. & SONAVANE, G. S. 2007. Preparation and in vitro/in vivo
evaluation of gliclazide loaded Eudragit nanoparticles as a sustained
release carriers. Drug Dev Ind Pharm, 33, 101-11.
DHAR, S., GU, F. X., LANGER, R., FAROKHZAD, O. C. & LIPPARD, S. J.
2008. Targeted delivery of cisplatin to prostate cancer cells by aptamer
functionalized Pt(IV) prodrug-PLGA-PEG nanoparticles. Proc Natl Acad
Sci U S A, 105, 17356-61.
DING, A. G. & SCHWENDEMAN, S. P. 2008. Acidic microclimate pH
distribution in PLGA microspheres monitored by confocal laser scanning
microscopy. Pharm Res, 25, 2041-52.
DONOVAN, M. D., FLYNN, G. L. & AMIDON, G. L. 1990. Absorption of
polyethylene glycols 600 through 2000: the molecular weight
dependence of gastrointestinal and nasal absorption. Pharm Res, 7, 863-
8.
DRESSMAN, J. B., BERARDI, R. R., DERMENTZOGLOU, L. C., RUSSELL, T.
L., SCHMALTZ, S. P., BARNETT, J. L. & JARVENPAA, K. M. 1990.
Upper gastrointestinal (GI) pH in young, healthy men and women. Pharm
Res, 7, 756-61.
DU PLESSIS, L. H., LUBBE, J., STRAUSS, T. & KOTZE, A. F. 2010.
Enhancement of nasal and intestinal calcitonin delivery by the novel
Pheroid fatty acid based delivery system, and by N-trimethyl chitosan
chloride. Int J Pharm, 385, 181-6.
DUNN, S., COONEY, G., SOMMERAUER, J., LINDSAY, C., MCDIARMID, S.,
WONG, R. L., CHANG, C. T., SMITH, H. T. & CHOC, M. G., JR. 1997.
Pharmacokinetics of an oral solution of the microemulsion formulation of
cyclosporine in maintenance pediatric liver transplant recipients.
Transplantation, 63, 1762-7.
DUTTA, S. K., HUBBARD, V. S. & APPLER, M. 1988. Critical examination of
therapeutic efficacy of a pH-sensitive enteric-coated pancreatic enzyme
preparation in treatment of exocrine pancreatic insufficiency secondary to
cystic fibrosis. Dig Dis Sci, 33, 1237-44.
EERIKAINEN, H., PELTONEN, L., RAULA, J., HIRVONEN, J. & KAUPPINEN,
E. I. 2004. Nanoparticles containing ketoprofen and acrylic polymers
prepared by an aerosol flow reactor method. AAPS PharmSciTech, 5,
e68.
259
EIAMTRAKARN, S., ITOH, Y., KISHIMOTO, J., YOSHIKAWA, Y., SHIBATA,
N., MURAKAMI, M. & TAKADA, K. 2002. Gastrointestinal mucoadhesive
patch system (GI-MAPS) for oral administration of G-CSF, a model
protein. Biomaterials, 23, 145-52.
ELDOR, R., KIDRON, M. & ARBIT, E. 2010a. Open-label study to assess the
safety and pharmacodynamics of five oral insulin formulations in healthy
subjects. Diabetes Obes Metab, 12, 219-23.
ELDOR, R., KIDRON, M., GREENBERG-SHUSHLAV, Y. & ARBIT, E. 2010b.
Novel glucagon-like peptide-1 analog delivered orally reduces
postprandial glucose excursions in porcine and canine models. J
Diabetes Sci Technol, 4, 1516-23.
ELSAYED, A., REMAWI, M. A., QINNA, N., FAROUK, A. & BADWAN, A. 2009.
Formulation and characterization of an oily-based system for oral
delivery of insulin. Eur J Pharm Biopharm, 73, 269-79.
EVANS, D. F., PYE, G., BRAMLEY, R., CLARK, A. G., DYSON, T. J. &
HARDCASTLE, J. D. 1988. Measurement of gastrointestinal pH profiles
in normal ambulant human subjects. Gut, 29, 1035-41.
FAGERHOLM, U., SJOSTROM, B., SROKA-MARKOVIC, J., WIJK, A.,
SVENSSON, M. & LENNERNAS, H. 1998. The effect of a drug-delivery
system consisting of soybean phosphatidyl choline and medium-chain
monoacylglycerol on the intestinal permeability of hexarelin in the rat. J
Pharm Pharmacol, 50, 467-73.
FALLOWFIELD, L., ATKINS, L., CATT, S., COX, A., COXON, C., LANGRIDGE,
C., MORRIS, R. & PRICE, M. 2006. Patients' preference for
administration of endocrine treatments by injection or tablets: results
from a study of women with breast cancer. Ann Oncol, 17, 205-10.
FAN, Y., LI, X., ZHOU, Y., FAN, C., WANG, X., HUANG, Y. & LIU, Y. 2011.
Improved intestinal delivery of salmon calcitonin by water-in-oil
microemulsions. Int J Pharm, 416, 323-30.
FANGUEIRO, J. F., GONZALEZ-MIRA, E., MARTINS-LOPES, P., EGEA, M.
A., GARCIA, M. L., SOUTO, S. B. & SOUTO, E. B. 2011. A novel lipid
nanocarrier for insulin delivery: production, characterization and toxicity
testing. Pharm Dev Technol.
260
FASANO, A. & UZZAU, S. 1997. Modulation of intestinal tight junctions by
Zonula occludens toxin permits enteral administration of insulin and other
macromolecules in an animal model. J Clin Invest, 99, 1158-64.
FETIH, G., FAUSIA, H., OKADA, N., FUJITA, T., ATTIA, M. & YAMAMOTO, A.
2006. Colon-specific delivery and enhanced colonic absorption of
[Asu(1,7)]-eel calcitonin using chitosan capsules containing various
additives in rats. J Drug Target, 14, 165-72.
FJELLESTAD-PAULSEN, A., D'AGAY-ABENSOUR, L., HOGLUND, P. &
RAMBAUD, J. C. 1996. Bioavailability of 1-deamino-8-D-arginine
vasopressin with an enzyme inhibitor (aprotinin) from the small intestine
in healthy volunteers. Eur J Clin Pharmacol, 50, 491-5.
FJELLESTAD-PAULSEN, A., SODERBERG-AHLM, C. & LUNDIN, S. 1995.
Metabolism of vasopressin, oxytocin, and their analogues in the human
gastrointestinal tract. Peptides, 16, 1141-7.
FOUNDATION, P. T. 2010. Development trends for peptide therapeutics 2010
report summary.
FOWLER, A. V. & ZABIN, I. 1970. The amino acid sequence of beta
galactosidase. I. Isolation and composition of tryptic peptides. J Biol
Chem, 245, 5032-41.
FRANCIS, M. F., CRISTEA, M. & WINNIK, F. M. 2005a. Exploiting the vitamin
B12 pathway to enhance oral drug delivery via polymeric micelles.
Biomacromolecules, 6, 2462-7.
FRANCIS, M. F., CRISTEA, M., YANG, Y. & WINNIK, F. M. 2005b. Engineering
polysaccharide-based polymeric micelles to enhance permeability of
cyclosporin A across Caco-2 cells. Pharm Res, 22, 209-19.
FREDHOLT, K., OSTERGAARD, J., SAVOLAINEN, J. & FRIIS, G. J. 1999.
alpha-Chymotrypsin-catalyzed degradation of desmopressin (dDAVP):
influence of pH, concentration and various cyclodextrins. Int J Pharm,
178, 223-9.
FRICKER, G., BRUNS, C., MUNZER, J., BRINER, U., ALBERT, R., KISSEL, T.
& VONDERSCHER, J. 1991. Intestinal absorption of the octapeptide
SMS 201-995 visualized by fluorescence derivatization.
Gastroenterology, 100, 1544-52.
FRICKER, G., FAHR, A., BEGLINGER, C., KISSEL, T., REITER, G. & DREWE,
J. 1996. Permeation enhancement of octreotide by specific bile salts in
261
rats and human subjects: in vitro, in vivo correlations. Br J Pharmacol,
117, 217-23.
FUKATA, N., UCHIDA, K., KUSUDA, T., KOYABU, M., MIYOSHI, H., FUKUI,
T., MATSUSHITA, M., NISHIO, A., TABATA, Y. & OKAZAKI, K. 2010.
The effective therapy of cyclosporine A with drug delivery system in
experimental colitis. J Drug Target, 19, 458-67.
GAO, Z.-G., CHOI, H.-G., SHIN, H.-J., PARK, K.-M., LIM, S.-J., HWANG, K.-J.
& KIM, C.-K. 1998. Physicochemical characterization and evaluation of a
microemulsion system for oral delivery of cyclosporin A. Int J Pharm,
161, 75-86.
GARINOT, M., FIEVEZ, V., POURCELLE, V., STOFFELBACH, F., DES RIEUX,
A., PLAPIED, L., THEATE, I., FREICHELS, H., JEROME, C.,
MARCHAND-BRYNAERT, J., SCHNEIDER, Y. J. & PREAT, V. 2007.
PEGylated PLGA-based nanoparticles targeting M cells for oral
vaccination. J Control Release, 120, 195-204.
GAUMET, M., GURNY, R. & DELIE, F. 2009. Localization and quantification of
biodegradable particles in an intestinal cell model: the influence of
particle size. Eur J Pharm Sci, 36, 465-73.
GEBERT, A., STEINMETZ, I., FASSBENDER, S. & WENDLANDT, K. H. 2004.
Antigen transport into Peyer's patches: increased uptake by constant
numbers of M cells. Am J Pathol, 164, 65-72.
GEDULIN, B. R., SMITH, P. A., JODKA, C. M., CHEN, K., BHAVSAR, S.,
NIELSEN, L. L., PARKES, D. G. & YOUNG, A. A. 2008.
Pharmacokinetics and pharmacodynamics of exenatide following
alternate routes of administration. Int J Pharm, 356, 231-8.
GENG, Y., YUAN, W., WU, F., CHEN, J., HE, M. & JIN, T. 2008. Formulating
erythropoietin-loaded sustained-release PLGA microspheres without
protein aggregation. J Control Release, 130, 259-65.
GHAFFARIAN, R., BHOWMICK, T. & MURO, S. 2012. Transport of
nanocarriers across gastrointestinal epithelial cells by a new transcellular
route induced by targeting ICAM-1. J Control Release.
GRADAUER, K., VONACH, C., LEITINGER, G., KOLB, D., FROHLICH, E.,
ROBLEGG, E., BERNKOP-SCHNURCH, A. & PRASSL, R. 2012.
Chemical coupling of thiolated chitosan to preformed liposomes improves
mucoadhesive properties. Int J Nanomedicine, 7, 2523-34.
262
GRAHAM, D. Y. 1982. Pancreatic enzyme replacement: the effect of antacids
or cimetidine. Dig Dis Sci, 27, 485-90.
GUAN, P., LU, Y., QI, J., NIU, M., LIAN, R., HU, F. & WU, W. 2011. Enhanced
oral bioavailability of cyclosporine A by liposomes containing a bile salt.
Int J Nanomedicine, 6, 965-74.
GUGGI, D. & BERNKOP-SCHNURCH, A. 2003. In vitro evaluation of polymeric
excipients protecting calcitonin against degradation by intestinal serine
proteases. Int J Pharm, 252, 187-96.
GUO, C. & GEMEINHART, R. A. 2008. Understanding the adsorption
mechanism of chitosan onto poly(lactide-co-glycolide) particles. Eur J
Pharm Biopharm, 70, 597-604.
GUO, J., PING, Q., JIANG, G., DONG, J., QI, S., FENG, L., LI, Z. & LI, C. 2004.
Transport of leuprolide across rat intestine, rabbit intestine and Caco-2
cell monolayer. Int J Pharm, 278, 415-22.
GUO, J. X., PING, Q. N., DONG, J., LI, Z. R. & LI, C. J. 2005. [Mechanisms of
action of transportation of liposomes and chitosan-coated liposomes
containing leuprolide across intestine and Caco-2 cell]. Yao Xue Xue
Bao, 40, 65-70.
GUO, L., MA, E., ZHAO, H., LONG, Y., ZHENG, C. & DUAN, M. 2011.
Preliminary evaluation of a novel oral delivery system for rhPTH1-34: in
vitro and in vivo. Int J Pharm, 420, 172-9.
GUPTA, P. N., KHATRI, K., GOYAL, A. K., MISHRA, N. & VYAS, S. P. 2007.
M-cell targeted biodegradable PLGA nanoparticles for oral immunization
against hepatitis B. J Drug Target, 15, 701-13.
HAEBERLIN, B., GENGENBACHER, T., MEINZER, A. & FRICKER, G. 1996.
Cyclodextrins - Useful excipients for oral peptide administration?
International Journal of Pharmaceutics, 137, 103-110.
HAN, L., ZHAO, Y., YIN, L., LI, R., LIANG, Y., HUANG, H., PAN, S., WU, C. &
FENG, M. 2012. Insulin-Loaded pH-Sensitive Hyaluronic Acid
Nanoparticles Enhance Transcellular Delivery. AAPS PharmSciTech, 13,
836-45.
HARVEY, C. B., WANG, Y., HUGHES, L. A., SWALLOW, D. M., THURRELL,
W. P., SAMS, V. R., BARTON, R., LANZON-MILLER, S. & SARNER, M.
1995. Studies on the expression of intestinal lactase in different
individuals. Gut, 36, 28-33.
263
HASAN, A. S., SOCHA, M., LAMPRECHT, A., GHAZOUANI, F. E., SAPIN, A.,
HOFFMAN, M., MAINCENT, P. & UBRICH, N. 2007. Effect of the
microencapsulation of nanoparticles on the reduction of burst release. Int
J Pharm, 344, 53-61.
HASTEWELL, J., ANTONIN, K. H., FOX, R. & MACKAY, M. 1995. The colonic
absorption of human calcitonin: The effects of increasing local
concentration and co-administration with a protease inhibitor.
International Journal of Pharmaceutics, 126, 245-251.
HASTEWELL, J., LYNCH, S., WILLIAMSON, I., FOX, R. & MACKAY, M. 1992.
Absorption of human calcitonin across the rat colon in vivo. Clin Sci
(Lond), 82, 589-94.
HAUPT, S., GIL, E., TIROSH, R., KLINGER, E., GAD, A. & RUBINSTEIN, A.
2002. Regional peptide uptake study in the rat intestinal mucosa:
glatiramer acetate as a model drug. Pharm Res, 19, 832-7.
HAUSS, D. J., FOGAL, S.E., FICORILLI, J.V., PRICE, C.A., ROY, T.,
JAYARAJ, A.A., KEIRNS, J.J. 1997. Lipid-based delivery systems for
improving the bioavailability and lymphatic transport of a poorly water-
soluble LTB4 inhibitor. Journal of Pharmaceutical Sciences, 87, 164-169.
HAYASHI, Y., YOSHIOKA, S., ASO, Y., LI WAN PO, A. & TERAO, T. 1994.
Entrapment of proteins in poly(L-lactide) microspheres using reversed
micelle solvent evaporation. Pharm Res, 11, 337-40.
HEE LEE, Y., LEESMAN, G. D., MAKHEY, V., YU, H., HU, P., PERRY, B.,
SUTYAK, J. P., WAGNER, E. J., FALZONE, L. M., STERN, W. &
SINKO, P. J. 2000. Regional oral absorption, hepatic first-pass effect,
and non-linear disposition of salmon calcitonin in beagle dogs. Eur J
Pharm Biopharm, 50, 205-11.
HEINEMANN, L. & JACQUES, Y. 2009. Oral insulin and buccal insulin: a critical
reappraisal. J Diabetes Sci Technol, 3, 568-84.
HEISE, T., KAPITZA, C., NOSEK, L., BECKET, P., GELFAND, R.,
GOLDBERG, M. & ARBIT, E. 2004. Oral insulin as first-line therapy in
type 2 diabetes: a randomized controlled pilot study. Diabetologia, 47,
A5.
HONG, Y., GAO, C., SHI, Y. & SHEN, J. 2005. Preparation of porous
polylactide microspheres by emulsion-solvent evaporation based on
264
solution induced phase separation. Polymers for Advanced
Technologies, 16, 622-627.
HUANG, A., MAKHLOF, A., PING, Q., TOZUKA, Y. & TAKEUCHI, H. 2011. N-
trimethyl chitosan-modified liposomes as carriers for oral delivery of
salmon calcitonin. Drug Deliv, 18, 562-9.
HUCK, C. W., PEZZEI, V., SCHMITZ, T., BONN, G. K. & BERNKOP-
SCHNURCH, A. 2006. Oral peptide delivery: are there remarkable
effects on drugs through sulfhydryl conjugation? J Drug Target, 14, 117-
25.
HUGHES, S. A., SHEWRY, P. R., GIBSON, G. R., MCCLEARY, B. V. &
RASTALL, R. A. 2008. In vitro fermentation of oat and barley derived
beta-glucans by human faecal microbiota. FEMS Microbiol Ecol, 64, 482-
93.
HUMPHREY, M. J. & RINGROSE, P. S. 1986. Peptides and related drugs: a
review of their absorption, metabolism, and excretion. Drug Metab Rev,
17, 283-310.
ILAN, E., AMSELEM, S., WEISSPAPIR, M., SCHWARZ, J., YOGEV, A.,
ZAWOZNIK, E. & FRIEDMAN, D. 1996. Improved oral delivery of
desmopressin via a novel vehicle: mucoadhesive submicron emulsion.
Pharm Res, 13, 1083-7.
ILAN, Y., ZIGMOND, E., LALAZAR, G., DEMBINSKY, A., BEN YA'ACOV, A.,
HEMED, N., KASIS, I., AXELROD, E., ZOLOTAROV, L., KLEIN, A., EL
HAJ, M., GANDHI, R., BAECHER-ALLAN, C., WU, H., MURUGAIYAN,
G., KIVISAKK, P., FAREZ, M. F., QUINTANA, F. J., KHOURY, S. J. &
WEINER, H. L. 2010. Oral administration of OKT3 monoclonal antibody
to human subjects induces a dose-dependent immunologic effect in T
cells and dendritic cells. J Clin Immunol, 30, 167-77.
IMAP 2011. Pharmaceuticals and Biotech Industry Global Report 2011.
IQBAL, J., SHAHNAZ, G., PERERA, G., HINTZEN, F., SARTI, F. & BERNKOP-
SCHNURCH, A. 2012. Thiolated chitosan: development and in vivo
evaluation of an oral delivery system for leuprolide. Eur J Pharm
Biopharm, 80, 95-102.
IQBAL, J., VIGL, C., MOSER, G., GASTEIGER, M., PERERA, G. & BERNKOP-
SCHNURCH, A. 2011. Development and in vivo evaluation of a new oral
265
nanoparticulate dosage form for leuprolide based on polyacrylic acid.
Drug Deliv, 18, 432-40.
ITALIA, J. L., BHATT, D. K., BHARDWAJ, V., TIKOO, K. & KUMAR, M. N. V. R.
2007. PLGA nanoparticles for oral delivery of cyclosporine:
Nephrotoxicity and pharmacokinetic studies in comparison to
Sandimmune Neoral (R). Journal of Controlled Release, 119, 197-206.
ITAN, Y., POWELL, A., BEAUMONT, M. A., BURGER, J. & THOMAS, M. G.
2009. The origins of lactase persistence in Europe. PLoS Comput Biol, 5,
e1000491.
ITO, Y., TOSH, B., TOGASHI, Y., AMAGASE, K., KISHIDA, T., SUGIOKA, N.,
SHIBATA, N. & TAKADA, K. 2005. Absorption of interferon alpha from
patches in rats. J Drug Target, 13, 383-90.
ITO, Y., YOSHIMURA, M., TANAKA, T. & TAKADA, K. 2011. Effect of
lipophilicity on the bioavailability of drugs after percutaneous
administration by dissolving microneedles. J Pharm Sci, 101, 1145-56.
JAIN, D., MAJUMDAR, D. K. & PANDA, A. K. 2006. Insulin loaded eudragit
L100 microspheres for oral delivery: preliminary in vitro studies. J
Biomater Appl, 21, 195-211.
JAIN, D., PANDA, A. K. & MAJUMDAR, D. K. 2005. Eudragit S100 entrapped
insulin microspheres for oral delivery. AAPS PharmSciTech, 6, E100-7.
JAIN, S., RATHI, V. V., JAIN, A. K., DAS, M. & GODUGU, C. 2012. Folate-
decorated PLGA nanoparticles as a rationally designed vehicle for the
oral delivery of insulin. Nanomedicine (Lond), 7, 1311-37.
JAISWAL, J., GUPTA, S. K. & KREUTER, J. 2004. Preparation of
biodegradable cyclosporine nanoparticles by high-pressure
emulsification-solvent evaporation process. J Control Release, 96, 169-
78.
JELVEHGARI, M., ZAKERI-MILANI, P., SIAHI-SHADBAD, M. R., LOVEYMI, B.
D., NOKHODCHI, A., AZARI, Z. & VALIZADEH, H. 2010. Development
of pH-sensitive insulin nanoparticles using Eudragit L100-55 and
chitosan with different molecular weights. AAPS PharmSciTech, 11,
1237-42.
JENSEN-PIPPO, K. E., WHITCOMB, K. L., DEPRINCE, R. B., RALPH, L. &
HABBERFIELD, A. D. 1996. Enteral bioavailability of human granulocyte
266
colony stimulating factor conjugated with poly(ethylene glycol). Pharm
Res, 13, 102-7.
JIN, C. H., CHAE, S. Y., SON, S., KIM, T. H., UM, K. A., YOUN, Y. S., LEE, S.
& LEE, K. C. 2009. A new orally available glucagon-like peptide-1
receptor agonist, biotinylated exendin-4, displays improved hypoglycemic
effects in db/db mice. J Control Release, 133, 172-7.
JONES, M. C., GAO, H. & LEROUX, J. C. 2008. Reverse polymeric micelles for
pharmaceutical applications. J Control Release, 132, 208-15.
JOSEPH, J. W., KALITSKY, J., ST-PIERRE, S. & BRUBAKER, P. L. 2000. Oral
delivery of glucagon-like peptide-1 in a modified polymer preparation
normalizes basal glycaemia in diabetic db/db mice. Diabetologia, 43,
1319-28.
JUERS, D. H., JACOBSON, R. H., WIGLEY, D., ZHANG, X. J., HUBER, R. E.,
TRONRUD, D. E. & MATTHEWS, B. W. 2000. High resolution
refinement of beta-galactosidase in a new crystal form reveals multiple
metal-binding sites and provides a structural basis for alpha-
complementation. Protein Sci, 9, 1685-99.
JUNG, T., KAMM, W., BREITENBACH, A., KAISERLING, E., XIAO, J. X. &
KISSEL, T. 2000. Biodegradable nanoparticles for oral delivery of
peptides: is there a role for polymers to affect mucosal uptake? Eur J
Pharm Biopharm, 50, 147-60.
KAFKA, A. P., MCLEOD, B. J., RADES, T. & MCDOWELL, A. 2011. Release
and bioactivity of PACA nanoparticles containing D-Lys-GnRH for
brushtail possum fertility control. J Control Release, 149, 307-13.
KALNINS, A., OTTO, K., RUTHER, U. & MULLER-HILL, B. 1983. Sequence of
the lacZ gene of Escherichia coli. EMBO J, 2, 593-7.
KALRA, S., KALRA, B. & AGRAWAL, N. 2010. Oral insulin. Diabetol Metab
Syndr, 2, 66.
KAMEI, N., MORISHITA, M., CHIBA, H., KAVIMANDAN, N. J., PEPPAS, N. A.
& TAKAYAMA, K. 2009. Complexation hydrogels for intestinal delivery of
interferon beta and calcitonin. J Control Release, 134, 98-102.
KAPITZA, C., ZIJLSTRA, E., HEINEMANN, L., CASTELLI, M. C., RILEY, G. &
HEISE, T. 2010. Oral insulin: a comparison with subcutaneous regular
human insulin in patients with type 2 diabetes. Diabetes Care, 33, 1288-
90.
267
KATAYAMA, K., KATO, Y., ONISHI, H., NAGAI, T. & MACHIDA, Y. 2003.
Double liposomes: hypoglycemic effects of liposomal insulin on normal
rats. Drug Dev Ind Pharm, 29, 725-31.
KAWASHIMA, Y., YAMAMOTO, H., TAKEUCHI, H. & KUNO, Y. 2000.
Mucoadhesive DL-lactide/glycolide copolymer nanospheres coated with
chitosan to improve oral delivery of elcatonin. Pharm Dev Technol, 5, 77-
85.
KENDALL, R. A., ALHNAN, M. A., NILKUMHANG, S., MURDAN, S. & BASIT,
A. W. 2009. Fabrication and in vivo evaluation of highly pH-responsive
acrylic microparticles for targeted gastrointestinal delivery. Eur J Pharm
Sci, 37, 284-90.
KHAFAGY EL, S., MORISHITA, M., KAMEI, N., EDA, Y., IKENO, Y. &
TAKAYAMA, K. 2009. Efficiency of cell-penetrating peptides on the nasal
and intestinal absorption of therapeutic peptides and proteins. Int J
Pharm, 381, 49-55.
KHAFAGY EL, S., MORISHITA, M., ONUKI, Y. & TAKAYAMA, K. 2007. Current
challenges in non-invasive insulin delivery systems: a comparative
review. Adv Drug Deliv Rev, 59, 1521-46.
KHEDKAR, A., IYER, H., ANAND, A., VERMA, M., KRISHNAMURTHY, S.,
SAVALE, S. & ATIGNAL, A. 2010. A dose range finding study of novel
oral insulin (IN-105) under fed conditions in type 2 diabetes mellitus
subjects. Diabetes Obes Metab, 12, 659-64.
KHOMANE, K., KUMAR, L., MEENA, C. L., JAIN, R. & BANSAL, A. 2011. NP-
647, a novel TRH analogue: investigating physicochemical parameters
critical for its oral and parenteral delivery. Int J Pharm, 406, 21-30.
KIDRON, M., ARBIT, E., ELDOR, R., KESSLER, K., SCHWOB, H. &
SCHRUEFER, C. 2009. Open-label study to assess the safety,
pharmacokinetics (PK) and pharmacodynamics (PD) of oral insulin
formulation in subjects with type 2 diabetes (T2DM).
KIDRON, M., DINH, S., MENACHEM, Y., ABBAS, R., VARIANO, B.,
GOLDBERG, M., ARBIT, E. & BAR-ON, H. 2004. A novel per-oral insulin
formulation: proof of concept study in non-diabetic subjects. Diabet Med,
21, 354-7.
268
KIDRON, M., RAZ, I., SCHRUEFER, C., SHOWB, H. & WOLFENSBERGER,
M. 2008. Pharmacokinetics (PK) and pharmacodynamics (PD) or oral
insulin in healthy subjects. Diabetes, 57 (Suppl 1), A127.
KIM, C. K., CHUNG, H. S., LEE, M. K., CHOI, L. N. & KIM, M. H. 1999.
Development of dried liposomes containing beta-galactosidase for the
digestion of lactose in milk. Int J Pharm, 183, 185-93.
KIM, N. C., JEON, B. J., AHN, J. & KWAK, H. S. 2006. In vitro study of
microencapsulated isoflavone and beta-galactosidase. J Agric Food
Chem, 54, 2582-6.
KIM, W. U., LEE, W. K., RYOO, J. W., KIM, S. H., KIM, J., YOUN, J., MIN, S.
Y., BAE, E. Y., HWANG, S. Y., PARK, S. H., CHO, C. S., PARK, J. S. &
KIM, H. Y. 2002. Suppression of collagen-induced arthritis by single
administration of poly(lactic-co-glycolic acid) nanoparticles entrapping
type II collagen: a novel treatment strategy for induction of oral tolerance.
Arthritis Rheum, 46, 1109-20.
KOHLER, E., DUBEROW-DREWE, M., DREWE, J., RIBES, G.,
LOUBATIERES-MARIANI, M. M., MAZER, N., GYR, K. & BEGLINGER,
C. 1987. Absorption of an aqueous solution of a new synthetic
somatostatin analogue administered to man by gavage. Eur J Clin
Pharmacol, 33, 167-71.
KOMPELLA, U. B. & LEE, V. H. 2001. Delivery systems for penetration
enhancement of peptide and protein drugs: design considerations. Adv
Drug Deliv Rev, 46, 211-45.
KOTZE, A. F., DE LEEUW, B. J., LUESSEN, H. L., DE BOER, A. G.,
VERHOEF, J. C. & JUNGINGER, H. E. 1997a. Chitosans for enhanced
delivery of therapeutic peptides across intestinal epithelia: in vitro
evaluation in Caco-2 cell monolayers. International Journal of
Pharmaceutics, 159, 243-253.
KOTZE, A. F., LUESSEN, H. L., DE LEEUW, B. J., DE BOER, B. G.,
VERHOEF, J. C. & JUNGINGER, H. E. 1997b. N-trimethyl chitosan
chloride as a potential absorption enhancer across mucosal surfaces: in
vitro evaluation in intestinal epithelial cells (Caco-2). Pharm Res, 14,
1197-202.
269
KRAELING, M. E. & RITSCHEL, W. A. 1992. Development of a colonic release
capsule dosage form and the absorption of insulin. Methods Find Exp
Clin Pharmacol, 14, 199-209.
KWAK, H. S., IHM, M. R. & AHN, J. 2001. Microencapsulation of beta-
galactosidase with fatty acid esters. J Dairy Sci, 84, 1576-82.
LAI, J., LU, Y., YIN, Z., HU, F. & WU, W. 2010. Pharmacokinetics and
enhanced oral bioavailability in beagle dogs of cyclosporine A
encapsulated in glyceryl monooleate/poloxamer 407 cubic nanoparticles.
Int J Nanomedicine, 5, 13-23.
LAMPRECHT, A., UBRICH, N., HOMBREIRO PEREZ, M., LEHR, C.,
HOFFMAN, M. & MAINCENT, P. 1999. Biodegradable monodispersed
nanoparticles prepared by pressure homogenization-emulsification. Int J
Pharm, 184, 97-105.
LAMPRECHT, A., YAMAMOTO, H., TAKEUCHI, H. & KAWASHIMA, Y. 2004.
pH-sensitive microsphere delivery increases oral bioavailability of
calcitonin. J Control Release, 98, 1-9.
LECLUYSE, E. L., APPEL, L. E. & SUTTON, S. C. 1991. Relationship between
drug absorption enhancing activity and membrane perturbing effects of
acylcarnitines. Pharm Res, 8, 84-7.
LEE, C. H., WOO, J. H., CHO, K. K., KANG, S. H., KANG, S. K. & CHOI, Y. J.
2007. Expression and characterization of human growth hormone-Fc
fusion proteins for transcytosis induction. Biotechnol Appl Biochem, 46,
211-7.
LEE, H. E., LEE, M. J., PARK, C. R., KIM, A. Y., CHUN, K. H., HWANG, H. J.,
OH, D. H., JEON, S. O., KANG, J. S., JUNG, T. S., CHOI, G. J. & LEE,
S. 2010. Preparation and characterization of salmon calcitonin-sodium
triphosphate ionic complex for oral delivery. J Control Release, 143, 251-
7.
LEE, Y. H., PERRY, B. A., LABRUNO, S., LEE, H. S., STERN, W., FALZONE,
L. M. & SINKO, P. J. 1999. Impact of regional intestinal pH modulation
on absorption of peptide drugs: oral absorption studies of salmon
calcitonin in beagle dogs. Pharm Res, 16, 1233-9.
LEE, Y. H., PERRY, B. A., SUTYAK, J. P., STERN, W. & SINKO, P. J. 2000.
Regional differences in intestinal spreading and pH recovery and the
impact on salmon calcitonin absorption in dogs. Pharm Res, 17, 284-90.
270
LEHR, C. M., BOUWSTRA, J. A., KOK, W., DE BOER, A. G., TUKKER, J. J.,
VERHOEF, J. C., BREIMER, D. D. & JUNGINGER, H. E. 1992. Effects
of the mucoadhesive polymer polycarbophil on the intestinal absorption
of a peptide drug in the rat. J Pharm Pharmacol, 44, 402-7.
LEI, Y., QI, J., NIE, S., HU, F., PAN, W., LU, Y. & WU, W. 2012. Solid self-
nanoemulsifying cyclosporine A pellets prepared by fluid-bed coating:
stability and bioavailability study. J Biomed Nanotechnol, 8, 515-21.
LEONE-BAY, A., HO, K. K., AGARWAL, R., BAUGHMAN, R. A., CHAUDHARY,
K., DEMORIN, F., GENOBLE, L., MCINNES, C., LERCARA, C.,
MILSTEIN, S., O'TOOLE, D., SARUBBI, D., VARIANO, B. & PATON, D.
R. 1996. 4-[4-[(2-Hydroxybenzoyl)amino]phenyl]butyric acid as a novel
oral delivery agent for recombinant human growth hormone. J Med
Chem, 39, 2571-8.
LEONE-BAY, A., MCINNES, C., WANG, N., DEMORIN, F., ACHAN, D.,
LERCARA, C., SARUBBI, D., HAAS, S., PRESS, J., BARANTSEVICH,
E. & ET AL. 1995a. Microsphere formation in a series of derivatized
alpha-amino acids: properties, molecular modeling, and oral delivery of
salmon calcitonin. J Med Chem, 38, 4257-62.
LEONE-BAY, A., SANTIAGO, N., ACHAN, D., CHAUDHARY, K., DEMORIN,
F., FALZARANO, L., HAAS, S., KALBAG, S., KAPLAN, D., LEIPOLD, H.
& ET AL. 1995b. N-acylated alpha-amino acids as novel oral delivery
agents for proteins. J Med Chem, 38, 4263-9.
LEONE-BAY, A., SATO, M., PATON, D., HUNT, A. H., SARUBBI, D.,
CAROZZA, M., CHOU, J., MCDONOUGH, J. & BAUGHMAN, R. A.
2001. Oral delivery of biologically active parathyroid hormone. Pharm
Res, 18, 964-70.
LI, L. & SCHWENDEMAN, S. P. 2005. Mapping neutral microclimate pH in
PLGA microspheres. J Control Release, 101, 163-73.
LI, X. Y., JIN, L. J., MCALLISTER, T. A., STANFORD, K., XU, J. Y., LU, Y. N.,
ZHEN, Y. H., SUN, Y. X. & XU, Y. P. 2007. Chitosan-alginate
microcapsules for oral delivery of egg yolk immunoglobulin (IgY). J Agric
Food Chem, 55, 2911-7.
LI, X. Y., JIN, L. J., UZONNA, J. E., LI, S. Y., LIU, J. J., LI, H. Q., LU, Y. N.,
ZHEN, Y. H. & XU, Y. P. 2009. Chitosan-alginate microcapsules for oral
271
delivery of egg yolk immunoglobulin (IgY): in vivo evaluation in a pig
model of enteric colibacillosis. Vet Immunol Immunopathol, 129, 132-6.
LI, Y., JIANG, H. L., JIN, J. F. & ZHU, K. J. 2004. Bioadhesive fluorescent
microspheres as visible carriers for local delivery of drugs. II: Uptake of
insulin-loaded PCEFB/PLGA microspheres by the gastrointestinal tract.
Drug Deliv, 11, 335-40.
LIANG, J. F. & YANG, V. C. 2005. Insulin-cell penetrating peptide hybrids with
improved intestinal absorption efficiency. Biochem Biophys Res
Commun, 335, 734-8.
LIN, H. R., CHEN, W. J. & LING, M. H. 2011. PH-sensitive Dioctadecylamine-
501 polymeric micelles for delivery of insulin. J Nanosci Nanotechnol, 11,
1823-33.
LIN, Y. H., MI, F. L., CHEN, C. T., CHANG, W. C., PENG, S. F., LIANG, H. F. &
SUNG, H. W. 2007. Preparation and characterization of nanoparticles
shelled with chitosan for oral insulin delivery. Biomacromolecules, 8, 146-
52.
LIN, Y. H., SONAJE, K., LIN, K. M., JUANG, J. H., MI, F. L., YANG, H. W. &
SUNG, H. W. 2008. Multi-ion-crosslinked nanoparticles with pH-
responsive characteristics for oral delivery of protein drugs. J Control
Release, 132, 141-9.
LINDMARK, T., NIKKILA, T. & ARTURSSON, P. 1995. Mechanisms of
absorption enhancement by medium chain fatty acids in intestinal
epithelial Caco-2 cell monolayers. J Pharmacol Exp Ther, 275, 958-64.
LITTLEWOOD, J. M., KELLEHER, J., WALTERS, M. P. & JOHNSON, A. W.
1988. In vivo and in vitro studies of microsphere pancreatic supplements.
J Pediatr Gastroenterol Nutr, 7 Suppl 1, S22-9.
LU, R. H., KOPECKOVA, P. & KOPECEK, J. 1999. Degradation and
aggregation of human calcitonin in vitro. Pharm Res, 16, 359-67.
LUAN, X., SKUPIN, M., SIEPMANN, J. & BODMEIER, R. 2006. Key
parameters affecting the initial release (burst) and encapsulation
efficiency of peptide-containing poly(lactide-co-glycolide) microparticles.
Int J Pharm, 324, 168-75.
LUESSEN, H. L., DE LEEUW, B. J., LANGEMEYER, M. W., DE BOER, A. B.,
VERHOEF, J. C. & JUNGINGER, H. E. 1996. Mucoadhesive polymers in
peroral peptide drug delivery. VI. Carbomer and chitosan improve the
272
intestinal absorption of the peptide drug buserelin in vivo. Pharm Res,
13, 1668-72.
LUESSEN, H. L., RENTEL, C. O., KOTZE, A. F., LEHR, C. M., DEBOER, A. G.,
VERHOEF, J. C. & JUNGINGER, H. E. 1997. Mucoadhesive polymers in
peroral peptide drug delivery .4. Polycarbophil and chitosan are potent
enhancers of peptide transport across intestinal mucosae in vitro. Journal
of Controlled Release, 45, 15-23.
LUNDIN, S., BENGTSSON, H. I., FOLKESSON, H. G. & WESTROM, B. R.
1989. Degradation of [mercaptopropionic acid1, D-arginine8]-
vasopressin (dDAVP) in pancreatic juice and intestinal mucosa
homogenate. Pharmacol Toxicol, 65, 92-5.
LUNDIN, S., FOLKESSON, H. G., PIERZYNOVSKI, S. G. & BENGTSSON, H.
I. 1994. Gastrointestinal absorption and plasma clearance rates of [D-
Arg8]vasopressin analogues in the rat. Peptides, 15, 809-14.
LUNDIN, S., PANTZAR, N., BROEDERS, A., OHLIN, M. & WESTROM, B. R.
1991. Differences in transport rate of oxytocin and vasopressin
analogues across proximal and distal isolated segments of the small
intestine of the rat. Pharm Res, 8, 1274-80.
LUZIO, S. D., DUNSEATH, G., LOCKETT, A., BROKE-SMITH, T. P., NEW, R.
R. & OWENS, D. R. 2010. The glucose lowering effect of an oral insulin
(Capsulin) during an isoglycaemic clamp study in persons with type 2
diabetes. Diabetes Obes Metab, 12, 82-7.
MAGGIO, E. T. & GRASSO, P. 2011. Oral delivery of octreotide acetate in
Intravail (R) improves uptake, half-life, and bioavailability over
subcutaneous administration in male Swiss Webster mice. Regulatory
Peptides, 167, 233-238.
MAKHLOF, A., FUJIMOTO, S., TOZUKA, Y. & TAKEUCHI, H. 2011a. In vitro
and in vivo evaluation of WGA-carbopol modified liposomes as carriers
for oral peptide delivery. Eur J Pharm Biopharm, 77, 216-24.
MAKHLOF, A., TOZUKA, Y. & TAKEUCHI, H. 2011b. Design and evaluation of
novel pH-sensitive chitosan nanoparticles for oral insulin delivery. Eur J
Pharm Sci, 42, 445-51.
MAKHLOF, A., WERLE, M., TOZUKA, Y. & TAKEUCHI, H. 2011c. A
mucoadhesive nanoparticulate system for the simultaneous delivery of
273
macromolecules and permeation enhancers to the intestinal mucosa. J
Control Release, 149, 81-8.
MALAEKEH-NIKOUEI, B., SAJADI TABASSI, S. A. & JAAFARI, M. R. 2008.
Preparation, characterization, and mucoadhesive properties of chitosan-
coated microspheres encapsulated with cyclosporine A. Drug Dev Ind
Pharm, 34, 492-8.
MANDRACCHIA, D., DENORA, N., FRANCO, M., PITARRESI, G.,
GIAMMONA, G. & TRAPANI, G. 2010. New Biodegradable Hydrogels
Based on Inulin and alpha,beta-Polyaspartylhydrazide Designed for
Colonic Drug Delivery: In Vitro Release of Glutathione and Oxytocin. J
Biomater Sci Polym Ed.
MARTINS, S., SILVA, A. C., FERREIRA, D. C. & SOUTO, E. B. 2009.
Improving oral absorption of Salmon calcitonin by trimyristin lipid
nanoparticles. J Biomed Nanotechnol, 5, 76-83.
MASSICOTTE, L. P., BAILLE, W. E. & MATEESCU, M. A. 2008. Carboxylated
high amylose starch as pharmaceutical excipients. Structural insights
and formulation of pancreatic enzymes. Int J Pharm, 356, 212-23.
MCMARTIN, C., HUTCHINSON, L. E., HYDE, R. & PETERS, G. E. 1987.
Analysis of structural requirements for the absorption of drugs and
macromolecules from the nasal cavity. J Pharm Sci, 76, 535-40.
MICHAEL, S., THOLE, M., DILLMANN, R., FAHR, A., DREWE, J. & FRICKER,
G. 2000. Improvement of intestinal peptide absorption by a synthetic bile
acid derivative, cholylsarcosine. Eur J Pharm Sci, 10, 133-40.
MIGLIACCIO, A., VARRICCHIO, L., DE FALCO, A., CASTORIA, G., ARRA, C.,
YAMAGUCHI, H., CIOCIOLA, A., LOMBARDI, M., DI STASIO, R.,
BARBIERI, A., BALDI, A., BARONE, M. V., APPELLA, E. & AURICCHIO,
F. 2007. Inhibition of the SH3 domain-mediated binding of Src to the
androgen receptor and its effect on tumor growth. Oncogene, 26, 6619-
29.
MILSTEIN, S. J., LEIPOLD, H., SARUBBI, D., LEONE-BAY, A., MLYNEK, G.
M., ROBINSON, J. R., KASIMOVA, M. & FREIRE, E. 1998. Partially
unfolded proteins efficiently penetrate cell membranes--implications for
oral drug delivery. J Control Release, 53, 259-67.
274
MOHANRAJ, V. J., BARNES, T. J. & PRESTIDGE, C. A. 2010. Silica
nanoparticle coated liposomes: a new type of hybrid nanocapsule for
proteins. Int J Pharm, 392, 285-93.
MONTALTO, M., CURIGLIANO, V., SANTORO, L., VASTOLA, M.,
CAMMAROTA, G., MANNA, R., GASBARRINI, A. & GASBARRINI, G.
2006. Management and treatment of lactose malabsorption. World J
Gastroenterol, 12, 187-91.
MONTALTO, M., NUCERA, G., SANTORO, L., CURIGLIANO, V., VASTOLA,
M., COVINO, M., CUOCO, L., MANNA, R., GASBARRINI, A. &
GASBARRINI, G. 2005. Effect of exogenous beta-galactosidase in
patients with lactose malabsorption and intolerance: a crossover double-
blind placebo-controlled study. Eur J Clin Nutr, 59, 489-93.
MORISHITA, I., MORISHITA, M., TAKAYAMA, K., MACHIDA, Y. & NAGAI, T.
1993. Enteral Insulin Delivery by Microspheres in 3 Different
Formulations Using Eudragit-L100 and Eudragit-S100. International
Journal of Pharmaceutics, 91, 29-37.
MULLER, R. H., RUNGE, S., RAVELLI, V., MEHNERT, W., THUNEMANN, A.
F. & SOUTO, E. B. 2006. Oral bioavailability of cyclosporine: solid lipid
nanoparticles (SLN) versus drug nanocrystals. Int J Pharm, 317, 82-9.
MUNDARGI, R. C., RANGASWAMY, V. & AMINABHAVI, T. M. 2011a. pH-
Sensitive oral insulin delivery systems using Eudragit microspheres.
Drug Dev Ind Pharm, 37, 977-85.
MUNDARGI, R. C., RANGASWAMY, V. & AMINABHAVI, T. M. 2011b. Poly(N-
vinylcaprolactam-co-methacrylic acid) hydrogel microparticles for oral
insulin delivery. J Microencapsul, 28, 384-94.
NAHA, P. C., KANCHAN, V., MANNA, P. K. & PANDA, A. K. 2008. Improved
bioavailability of orally delivered insulin using Eudragit-L30D coated
PLGA microparticles. J Microencapsul, 25, 248-56.
NAIKWADE, S. R., MESHRAM, R. N. & BAJAJ, A. N. 2009. Preparation and in
vivo efficacy study of pancreatin microparticles as an enzyme
replacement therapy for pancreatitis. Drug Dev Ind Pharm, 35, 417-32.
NAM, Y. S., SONG, S. H., CHOI, J. Y. & PARK, T. G. 2000. Lysozyme
microencapsulation within biodegradable PLGA microspheres: urea
effect on protein release and stability. Biotechnol Bioeng, 70, 270-7.
NEWS, G. E. B. 2013. Top 20 best-selling drugs of 2012.
275
NGUYEN, H. N., WEY, S. P., JUANG, J. H., SONAJE, K., HO, Y. C., CHUANG,
E. Y., HSU, C. W., YEN, T. C., LIN, K. J. & SUNG, H. W. 2011. The
glucose-lowering potential of exendin-4 orally delivered via a pH-
sensitive nanoparticle vehicle and effects on subsequent insulin
secretion in vivo. Biomaterials, 32, 2673-82.
NIU, M., LU, Y., HOVGAARD, L., GUAN, P., TAN, Y., LIAN, R., QI, J. & WU, W.
2012. Hypoglycemic activity and oral bioavailability of insulin-loaded
liposomes containing bile salts in rats: the effect of cholate type, particle
size and administered dose. Eur J Pharm Biopharm, 81, 265-72.
NIU, M., LU, Y., HOVGAARD, L. & WU, W. 2011. Liposomes containing
glycocholate as potential oral insulin delivery systems: preparation, in
vitro characterization, and improved protection against enzymatic
degradation. Int J Nanomedicine, 6, 1155-66.
O'CONNELL, S. & WALSH, G. 2006. Physicochemical characteristics of
commercial lactases relevant to their application in the alleviation of
lactose intolerance. Applied Biochemistry and Biotechnology, 134, 179-
191.
O'CONNELL, S. W., G. 2009. A novel acid-stable, acid-active B-galactosidase
potentially suited to the alleviation of lactose intolerance. Appl Microbiol
Biotechnol.
ODEBERG, J. M., KAUFMANN, P., KROON, K. G. & HOGLUND, P. 2003. Lipid
drug delivery and rational formulation design for lipophilic drugs with low
oral bioavailability, applied to cyclosporine. Eur J Pharm Sci, 20, 375-82.
OGISO, T., FUNAHASHI, N., TSUKIOKA, Y., IWAKI, M., TANINO, T. & WADA,
T. 2001. Oral delivery of synthetic eel calcitonin, elcatonin, in rats. Biol
Pharm Bull, 24, 656-61.
OKADA, H. 1997. One- and three-month release injectable microspheres of the
LH-RH superagonist leuprorelin acetate. Adv Drug Deliv Rev, 28, 43-70.
ONWULATA, C. I., RAO, D. R. & VANKINENI, P. 1989. Relative efficiency of
yogurt, sweet acidophilus milk, hydrolyzed-lactose milk, and a
commercial lactase tablet in alleviating lactose maldigestion. Am J Clin
Nutr, 49, 1233-7.
PAN, Y., XU, H., ZHAO, H. Y., WEI, G. & ZHENG, J. M. 2002. [Study on
preparation and oral efficacy of insulin-loaded poly(lactic-co-glycolic acid)
nanoparticles]. Yao Xue Xue Bao, 37, 374-7.
276
PANTZAR, N., LUNDIN, S. & WESTROM, B. R. 1995. Different properties of
the paracellular pathway account for the regional small intestinal
permeability to the peptide desmopressin. J Pharm Sci, 84, 1245-8.
PANYAM, J., DALI, M. M., SAHOO, S. K., MA, W., CHAKRAVARTHI, S. S.,
AMIDON, G. L., LEVY, R. J. & LABHASETWAR, V. 2003. Polymer
degradation and in vitro release of a model protein from poly(D,L-lactide-
co-glycolide) nano- and microparticles. J Control Release, 92, 173-87.
PARK, S. J., CHOI, S. G., DAVAA, E. & PARK, J. S. 2011. Encapsulation
enhancement and stabilization of insulin in cationic liposomes. Int J
Pharm, 415, 267-72.
PARMENTIER, J., THEWES, B., GROPP, F. & FRICKER, G. 2011. Oral
peptide delivery by tetraether lipid liposomes. Int J Pharm, 415, 150-7.
PETRUS, A. K., VORTHERMS, A. R., FAIRCHILD, T. J. & DOYLE, R. P. 2007.
Vitamin B12 as a carrier for the oral delivery of insulin. ChemMedChem,
2, 1717-21.
PIAO, H., KAMIYA, N., WATANABE, J., YOKOYAMA, H., HIRATA, A., FUJII,
T., SHIMIZU, I., ITO, S. & GOTO, M. 2006. Oral delivery of diclofenac
sodium using a novel solid-in-oil suspension. Int J Pharm, 313, 159-62.
PICHEREAU, C. & ALLARY, C. 2005. Therapeutic peptides under the spotlight.
PINTO REIS, C., NEUFELD, R. J., RIBEIRO, A. J. & VEIGA, F. 2006.
Nanoencapsulation II. Biomedical applications and current status of
peptide and protein nanoparticulate delivery systems. Nanomedicine, 2,
53-65.
PREGO, C., GARCIA, M., TORRES, D. & ALONSO, M. J. 2005. Transmucosal
macromolecular drug delivery. J Control Release, 101, 151-62.
PRINN, K. B., COSTANTINO, H. R. & TRACY, M. 2002. Statistical modeling of
protein spray drying at the lab scale. AAPS PharmSciTech, 3, E4.
QADDOUMI, M. G., UEDA, H., YANG, J., DAVDA, J., LABHASETWAR, V. &
LEE, V. H. 2004. The characteristics and mechanisms of uptake of PLGA
nanoparticles in rabbit conjunctival epithelial cell layers. Pharm Res, 21,
641-8.
QI, R. & PING, Q. N. 2004. Gastrointestinal absorption enhancement of insulin
by administration of enteric microspheres and SNAC to rats. J
Microencapsul, 21, 37-45.
277
RADWAN, M. A. 2001. Enhancement of absorption of insulin-loaded
polyisobutylcyanoacrylate nanospheres by sodium cholate after oral and
subcutaneous administration in diabetic rats. Drug Dev Ind Pharm, 27,
981-9.
RAFFIN, R. P., COLOME, L.M., POHLMANN, A.R., GUTERRES, S.S. 2006.
Preparation, characterization, and in vivo anti-ulcer evaluation of
pantoprazole-loaded microparticles. European Journal of Pharmaceutics
and Biopharmaceutics, 63, 198-204.
RAO, D. R., CHAWAN, C. B. & VEERAMACHANENI, R. 1995. Liposomal
Encapsulation of Beta-Galactosidase - Comparison of 2 Methods of
Encapsulation and in-Vitro Lactose Digestibility. Journal of Food
Biochemistry, 18, 239-251.
RATZINGER, G., WANG, X., WIRTH, M. & GABOR, F. 2010. Targeted PLGA
microparticles as a novel concept for treatment of lactose intolerance. J
Control Release, 147, 187-92.
REGAN, P. T., MALAGELADA, J. R., DIMAGNO, E. P., GLANZMAN, S. L. &
GO, V. L. 1977. Comparative effects of antacids, cimetidine and enteric
coating on the therapeutic response to oral enzymes in severe
pancreatic insufficiency. N Engl J Med, 297, 854-8.
REKHA, M. R. & SHARMA, C. P. 2013. Oral delivery of therapeutic
protein/peptide for diabetes--future perspectives. Int J Pharm, 440, 48-
62.
RITSCHEL, W. A. 1991. Microemulsions for improved peptide absorption from
the gastrointestinal tract. Methods Find Exp Clin Pharmacol, 13, 205-20.
RITSCHEL, W. A., ADOLPH, S., RITSCHEL, G. B. & SCHROEDER, T. 1990.
Improvement of peroral absorption of cyclosporine A by microemulsions.
Methods Find Exp Clin Pharmacol, 12, 127-34.
RODRIGUEZ-NOGALES, J. M. & LOPEZ, A. D. 2006. A novel approach to
develop beta-galactosidase entrapped in liposomes in order to prevent
an immediate hydrolysis of lactose in milk. International Dairy Journal,
16, 354-360.
RUSSELL-JONES, G. J., WESTWOOD, S. W. & HABBERFIELD, A. D. 1995.
Vitamin B12 mediated oral delivery systems for granulocyte-colony
stimulating factor and erythropoietin. Bioconjug Chem, 6, 459-65.
278
RYAN, S. M., FRIAS, J. M., WANG, X., SAYERS, C. T., HADDLETON, D. M. &
BRAYDEN, D. J. 2011. PK/PD modelling of comb-shaped PEGylated
salmon calcitonin conjugates of differing molecular weights. J Control
Release, 149, 126-32.
SAJEESH, S. & SHARMA, C. P. 2010. Mucoadhesive hydrogel microparticles
based on poly (methacrylic acid-vinyl pyrrolidone)-chitosan for oral drug
delivery. Drug Deliv, 18, 227-35.
SAJEESH, S., VAUTHIER, C., GUEUTIN, C., PONCHEL, G. & SHARMA, C. P.
2010. Thiol functionalized polymethacrylic acid-based hydrogel
microparticles for oral insulin delivery. Acta Biomater, 6, 3072-80.
SARCIAUX, J. M., ACAR, L. & SADO, P. A. 1995. Using Microemulsion
Formulations for Oral-Drug Delivery of Therapeutic Peptides.
International Journal of Pharmaceutics, 120, 127-136.
SARMENTO, B., MARTINS, S., FERREIRA, D. & SOUTO, E. B. 2007. Oral
insulin delivery by means of solid lipid nanoparticles. Int J Nanomedicine,
2, 743-9.
SASAKI, I., TAMURA, T., SHIBAKAWA, T., FUJITA, T., MURAKAMI, M.,
YAMAMOTO, A. & MURANISHI, S. 1997. Metabolism of azetirelin, a
new thyrotropin-releasing hormone (TRH) analogue, by intestinal
microorganisms. Pharm Res, 14, 1004-7.
SCHILLING, R. J. & MITRA, A. K. 1991. Degradation of insulin by trypsin and
alpha-chymotrypsin. Pharm Res, 8, 721-7.
SCHILLING, S. U., SHAH, N. H., MALICK, A. W., INFELD, M. H. & MCGINITY,
J. W. 2007. Citric acid as a solid-state plasticizer for Eudragit RS PO. J
Pharm Pharmacol, 59, 1493-500.
SCHMITZ, T., HUCK, C. W. & BERNKOP-SCHNURCH, A. 2006.
Characterisation of the thiol-disulphide chemistry of desmopressin by LC,
mu-LC, LC-ESI-MS and Maldi-Tof. Amino Acids, 30, 35-42.
SCHULZKE, J. D., TROGER, H. & AMASHEH, M. 2009. Disorders of intestinal
secretion and absorption. Best Pract Res Clin Gastroenterol, 23, 395-
406.
SCHWARTZ, S., GEHO, B., ROSENBERG, L. & LAU, J. 2008. A 2-week
randomized active comparator study of two HDV-Insulin routes (SC and
oral) and SC human insulin in patients with type 1 diabetes. Diabetes,
57(Suppl 1), A124.
279
SCOCCA, S., FAUSTINI, M., VILLANI, S., MUNARI, E., CONTE, U., RUSSO,
V., RICCARDI, A., VIGO, D. & TORRE, M. L. 2007.
Alginate/polymethacrylate copolymer microparticles for the intestinal
delivery of enzymes. Curr Drug Deliv, 4, 103-8.
SHAH, R. B. & KHAN, M. A. 2004. Protection of salmon calcitonin breakdown
with serine proteases by various ovomucoid species for oral drug
delivery. J Pharm Sci, 93, 392-406.
SHAJI, J. & PATOLE, V. 2008. Protein and Peptide Drug Delivery: Oral
Approaches. Indian Journal of Pharmaceutical Sciences, 70, 269-277.
SHARMA, G., VAN DER WALLE, C. F. & RAVI KUMAR, M. N. 2012. Antacid
co-encapsulated polyester nanoparticles for peroral delivery of insulin:
Development, pharmacokinetics, biodistribution and pharmacodynamics.
Int J Pharm.
SHARMA, G., WILSON, K., VAN DER WALLE, C. F., SATTAR, N., PETRIE, J.
R. & RAVI KUMAR, M. N. 2010. Microemulsions for oral delivery of
insulin: design, development and evaluation in streptozotocin induced
diabetic rats. Eur J Pharm Biopharm, 76, 159-69.
SHARMA, P., VARMA, M. V., CHAWLA, H. P. & PANCHAGNULA, R. 2005.
Absorption enhancement, mechanistic and toxicity studies of medium
chain fatty acids, cyclodextrins and bile salts as peroral absorption
enhancers. Farmaco, 60, 884-93.
SHI, K., CUI, F., YAMAMOTO, H. & KAWASHIMA, Y. 2009. Optimized
formulation of high-payload PLGA nanoparticles containing insulin-lauryl
sulfate complex. Drug Dev Ind Pharm, 35, 177-84.
SINGH, R., SINGH, S. & LILLARD, J. W., JR. 2008. Past, present, and future
technologies for oral delivery of therapeutic proteins. J Pharm Sci, 97,
2497-523.
SINKO, P. J., LEE, Y. H., MAKHEY, V., LEESMAN, G. D., SUTYAK, J. P., YU,
H., PERRY, B., SMITH, C. L., HU, P., WAGNER, E. J., FALZONE, L. M.,
MCWHORTER, L. T., GILLIGAN, J. P. & STERN, W. 1999.
Biopharmaceutical approaches for developing and assessing oral
peptide delivery strategies and systems: in vitro permeability and in vivo
oral absorption of salmon calcitonin (sCT). Pharm Res, 16, 527-33.
SINKO, P. J., SMITH, C. L., MCWHORTER, L. T., STERN, W., WAGNER, E. &
GILLIGAN, J. P. 1995. Utility of pharmacodynamic measures for
280
assessing the oral bioavailability of peptides. 1. Administration of
recombinant salmon calcitonin in rats. J Pharm Sci, 84, 1374-8.
SOLTERO, R. & EKWURIBE, N. 2001. The oral delivery of protein and peptide
drugs. Innovations in Pharmaceutical Technology.
SONAJE, K., CHEN, Y. J., CHEN, H. L., WEY, S. P., JUANG, J. H., NGUYEN,
H. N., HSU, C. W., LIN, K. J. & SUNG, H. W. 2010a. Enteric-coated
capsules filled with freeze-dried chitosan/poly(gamma-glutamic acid)
nanoparticles for oral insulin delivery. Biomaterials, 31, 3384-94.
SONAJE, K., LIN, K. J., WEY, S. P., LIN, C. K., YEH, T. H., NGUYEN, H. N.,
HSU, C. W., YEN, T. C., JUANG, J. H. & SUNG, H. W. 2010b.
Biodistribution, pharmacodynamics and pharmacokinetics of insulin
analogues in a rat model: Oral delivery using pH-responsive
nanoparticles vs. subcutaneous injection. Biomaterials, 31, 6849-58.
SONIA, T. A. & SHARMA, C. P. 2012. In vitro evaluation of quaternized
polydimethylaminoethylmethacrylate sub-microparticles for oral insulin
delivery. J Biomater Appl.
SQUILLANTE, E., MORSHED, G., BAGCHI, S. & MEHTA, K. A. 2003.
Microencapsulation of beta-galactosidase with Eudragit L-100. J
Microencapsul, 20, 153-67.
STIVAKTAKIS, N., NIKOU, K., PANAGI, Z., BELETSI, A., LEONDIADIS, L. &
AVGOUSTAKIS, K. 2004. PLA and PLGA microspheres of beta-
galactosidase: Effect of formulation factors on protein antigenicity and
immunogenicity. J Biomed Mater Res A, 70, 139-48.
STIVAKTAKIS, N., NIKOU, K., PANAGI, Z., BELETSI, A., LEONDIADIS, L. &
AVGOUSTAKIS, K. 2005. Immune responses in mice of beta-
galactosidase adsorbed or encapsulated in poly(lactic acid) and
poly(lactic-co-glycolic acid) microspheres. J Biomed Mater Res A, 73,
332-8.
SUN, S., LIANG, N., KAWASHIMA, Y., XIA, D. & CUI, F. 2011a. Hydrophobic
ion pairing of an insulin-sodium deoxycholate complex for oral delivery of
insulin. Int J Nanomedicine, 6, 3049-56.
SUN, S., LIANG, N., PIAO, H., YAMAMOTO, H., KAWASHIMA, Y. & CUI, F.
2011b. Insulin-S.O (sodium oleate) complex-loaded PLGA nanoparticles:
formulation, characterization and in vivo evaluation. J Microencapsul, 27,
471-8.
281
TAKEUCHI, H., KOJIMA, H., TOYODA, T., YAMAMOTO, H., HINO, T. &
KAWASHIMA, Y. 1999. Prolonged circulation time of doxorubicin-loaded
liposomes coated with a modified polyvinyl alcohol after intravenous
injection in rats. Eur J Pharm Biopharm, 48, 123-9.
TAKEUCHI, H., YAMAMOTO, H., NIWA, T., HINO, T. & KAWASHIMA, Y. 1996.
Enteral absorption of insulin in rats from mucoadhesive chitosan-coated
liposomes. Pharm Res, 13, 896-901.
TAKEUCHI, H. M., Y. YAMAMOTO, H. KAWASHIMA, Y. 1999. Mucoadhesive
liposomes coated with chitosan or Carbopol for oral administration of
peptide drugs. Proceedings of 26th International Symposium on
Controlled Release of Bioactive Materials, 988-989.
TEPLY, B. A., TONG, R., JEONG, S. Y., LUTHER, G., SHERIFI, I., YIM, C. H.,
KHADEMHOSSEINI, A., FAROKHZAD, O. C., LANGER, R. S. &
CHENG, J. 2008. The use of charge-coupled polymeric microparticles
and micromagnets for modulating the bioavailability of orally delivered
macromolecules. Biomaterials, 29, 1216-23.
THANOU, M., FLOREA, B. I., LANGEMEYER, M. W., VERHOEF, J. C. &
JUNGINGER, H. E. 2000a. N-trimethylated chitosan chloride (TMC)
improves the intestinal permeation of the peptide drug buserelin in vitro
(Caco-2 cells) and in vivo (rats). Pharm Res, 17, 27-31.
THANOU, M., VERHOEF, J. C., MARBACH, P. & JUNGINGER, H. E. 2000b.
Intestinal absorption of octreotide: N-trimethyl chitosan chloride (TMC)
ameliorates the permeability and absorption properties of the
somatostatin analogue in vitro and in vivo. J Pharm Sci, 89, 951-7.
THOTE, A. J. & GUPTA, R. B. 2005. Formation of nanoparticles of a hydrophilic
drug using supercritical carbon dioxide and microencapsulation for
sustained release. Nanomedicine, 1, 85-90.
THWAITES, D. T., SIMMONS, N. L. & HIRST, B. H. 1993. Thyrotropin-releasing
hormone (TRH) uptake in intestinal brush-border membrane vesicles:
comparison with proton-coupled dipeptide and Na(+)-coupled glucose
transport. Pharm Res, 10, 667-73.
TIMOFEEV, V. I., CHUPROV-NETOCHIN, R. N., SAMIGINA, V. R.,
BEZUGLOV, V. V., MIROSHNIKOV, K. A. & KURANOVA, I. P. 2010. X-
ray investigation of gene-engineered human insulin crystallized from a
282
solution containing polysialic acid. Acta Crystallogr Sect F Struct Biol
Cryst Commun, 66, 259-63.
TOORISAKA, E., HASHIDA, M., KAMIYA, N., ONO, H., KOKAZU, Y. & GOTO,
M. 2005. An enteric-coated dry emulsion formulation for oral insulin
delivery. J Control Release, 107, 91-6.
TOORISAKA, E., ONO, H., ARIMORI, K., KAMIYA, N. & GOTO, M. 2003.
Hypoglycemic effect of surfactant-coated insulin solubilized in a novel
solid-in-oil-in-water (S/O/W) emulsion. Int J Pharm, 252, 271-4.
TOORISAKA, E., WATANABE, K., ONO, H., HIRATA, M., KAMIYA, N. &
GOTO, M. 2012. Intestinal patches with an immobilized solid-in-oil
formulation for oral protein delivery. Acta Biomater, 8, 653-8.
TORRES-LUGO, M., GARCIA, M., RECORD, R. & PEPPAS, N. A. 2002. pH-
Sensitive hydrogels as gastrointestinal tract absorption enhancers:
transport mechanisms of salmon calcitonin and other model molecules
using the Caco-2 cell model. Biotechnol Prog, 18, 612-6.
TOZAKI, H., EMI, Y., HORISAKA, E., FUJITA, T., YAMAMOTO, A. &
MURANISHI, S. 1995. Metabolism of peptide drugs by the
microorganisms in rat cecal contents. Biol Pharm Bull, 18, 929-31.
TOZAKI, H., EMI, Y., HORISAKA, E., FUJITA, T., YAMAMOTO, A. &
MURANISHI, S. 1997. Degradation of insulin and calcitonin and their
protection by various protease inhibitors in rat caecal contents:
implications in peptide delivery to the colon. J Pharm Pharmacol, 49,
164-8.
TOZAKI, H., NISHIOKA, J., KOMOIKE, J., OKADA, N., FUJITA, T.,
MURANISHI, S., KIM, S. I., TERASHIMA, H. & YAMAMOTO, A. 2001.
Enhanced absorption of insulin and (Asu(1,7))eel-calcitonin using novel
azopolymer-coated pellets for colon-specific drug delivery. J Pharm Sci,
90, 89-97.
TOZAKI, H., ODORIBA, T., ISEKI, T., TANIGUCHI, T., FUJITA, T.,
MURAKAMI, M., MURANISHI, S. & YAMAMOTO, A. 1998. Use of
protease inhibitors to improve calcitonin absorption from the small and
large intestine in rats. J Pharm Pharmacol, 50, 913-20.
TROTTA, M., CAVALLI, R., CARLOTTI, M. E., BATTAGLIA, L. &
DEBERNARDI, F. 2005. Solid lipid micro-particles carrying insulin
283
formed by solvent-in-water emulsion-diffusion technique. Int J Pharm,
288, 281-8.
UBAIDULLA, U., KHAR, R. K., AHMED, F. J. & PANDA, A. K. 2007a.
Development and in-vivo evaluation of insulin-loaded chitosan phthalate
microspheres for oral delivery. J Pharm Pharmacol, 59, 1345-51.
UBAIDULLA, U., SULTANA, Y., AHMED, F. J., KHAR, R. K. & PANDA, A. K.
2007b. Chitosan phthalate microspheres for oral delivery of insulin:
preparation, characterization, and in vitro evaluation. Drug Deliv, 14, 19-
23.
UCHIDA, T., MARTIN, S., FOSTER, T. P., WARDLEY, R. C. & GRIMM, S.
1994. Dose and load studies for subcutaneous and oral delivery of
poly(lactide-co-glycolide) microspheres containing ovalbumin. Pharm
Res, 11, 1009-15.
UNGELL, A. L., ANDREASSON, A., LUNDIN, K. & UTTER, L. 1992. Effects of
Enzymatic Inhibition and Increased Paracellular Shunting on Transport of
Vasopressin Analogs in the Rat. Journal of Pharmaceutical Sciences, 81,
640-645.
USHIROGAWA, Y., NAKAHIGASHI, Y., KIRIYAMA, A. & TAKADA, K. 1992.
Effect of organic acids, trypsin inhibitors and dietary protein on the
pharmacological activity of recombinant human granulocyte colony-
stimulating factor (rhG-CSF) in rats. Int J Pharm, 81, 133-41.
VAN DER MERWE, S. M., VERHOEF, J. C., KOTZE, A. F. & JUNGINGER, H.
E. 2004. N-trimethyl chitosan chloride as absorption enhancer in oral
peptide drug delivery. Development and characterization of minitablet
and granule formulations. European Journal of Pharmaceutics and
Biopharmaceutics, 57, 85-91.
VENKATESAN, N., UCHINO, K., AMAGASE, K., ITO, Y., SHIBATA, N. &
TAKADA, K. 2006a. Gastro-intestinal patch system for the delivery of
erythropoietin. J Control Release, 111, 19-26.
VENKATESAN, N., YOSHIMITSU, J., OHASHI, Y., ITO, Y., SUGIOKA, N.,
SHIBATA, N. & TAKADA, K. 2006b. Pharmacokinetic and
pharmacodynamic studies following oral administration of erythropoietin
mucoadhesive tablets to beagle dogs. Int J Pharm, 310, 46-52.
284
WALKER, G. F., LEDGER, R. & TUCKER, I. G. 2001. Activity of pancreatic
endopeptidases towards luteinizing hormone-releasing hormones. Int J
Pharm, 216, 77-82.
WANG, J., CHOW, D., HEIATI, H. & SHEN, W. C. 2003. Reversible lipidization
for the oral delivery of salmon calcitonin. J Control Release, 88, 369-80.
WANG, T., WANG, N., HAO, A., HE, X., LI, T. & DENG, Y. 2010. Lyophilization
of water-in-oil emulsions to prepare phospholipid-based anhydrous
reverse micelles for oral peptide delivery. Eur J Pharm Sci, 39, 373-9.
WANG, Z., CHUI, W. K. & HO, P. C. 2009. Design of a multifunctional PLGA
nanoparticulate drug delivery system: evaluation of its physicochemical
properties and anticancer activity to malignant cancer cells. Pharm Res,
26, 1162-71.
WEN, J. Y., LEDGER, R., BUTT, A. G., MCLEOD, B. J., DAVIES, N. M. &
TUCKER, I. G. 2002a. Inhibition of proteolysis in luminal extracts from
the intestine of the brushtail possum. J Pharm Pharmacol, 54, 1365-72.
WEN, J. Y., LEDGER, R., MCLEOD, B. J., DAVIES, N. M., BUTT, A. G. &
TUCKER, I. G. 2002b. Enzymatic degradation of luteinizing hormone
releasing hormone (LHRH) by mucosal homogenates from the intestine
of the common brushtail possum (Trichosurus vulpecula). Life Sci, 71,
3019-30.
WEN, J. Y., LEDGER, R., MCLEOD, B. J., DAVIES, N. M., BUTT, A. G. &
TUCKER, I. G. 2002c. Protein and peptide degradation in the intestine of
the common brushtail possum (Trichosurus vulpecula). J Comp Physiol
B, 172, 553-9.
WERLE, M., KOLMAR, H., ALBRECHT, R. & BERNKOP-SCHNURCH, A.
2008. Characterisation of the barrier caused by luminally secreted
gastro-intestinal proteolytic enzymes for two novel cystine-knot
microproteins. Amino Acids, 35, 195-200.
WERLE, M., MAKHLOF, A. & TAKEUCHI, H. 2010. Carbopol-lectin conjugate
coated liposomes for oral peptide delivery. Chem Pharm Bull (Tokyo),
58, 432-4.
WERLE, M., SAMHABER, A. & BERNKOP-SCHNURCH, A. 2006. Degradation
of teriparatide by gastro-intestinal proteolytic enzymes. J Drug Target,
14, 109-15.
285
WERLE, M. & TAKEUCHI, H. 2009. Chitosan-aprotinin coated liposomes for
oral peptide delivery: Development, characterisation and in vivo
evaluation. Int J Pharm, 370, 26-32.
WESTEDT, U., KALINOWSKI, M., WITTMAR, M., MERDAN, T., UNGER, F.,
FUCHS, J., SCHALLER, S., BAKOWSKY, U. & KISSEL, T. 2007.
Poly(vinyl alcohol)-graft-poly(lactide-co-glycolide) nanoparticles for local
delivery of paclitaxel for restenosis treatment. J Control Release, 119,
41-51.
WHITELOW, D. C., KELLY, C. A., IRONMONGER, W., CUNLIFFE, C., NEW,
R. R. & PHILLIPS, J. 2005. Absorption of orally ingested insulin in human
type 1 diabetic subjects: proof of concept study.
WHITTINGHAM, J. L., SCOTT, D. J., CHANCE, K., WILSON, A., FINCH, J.,
BRANGE, J. & GUY DODSON, G. 2002. Insulin at pH 2: structural
analysis of the conditions promoting insulin fibre formation. J Mol Biol,
318, 479-90.
WOOD, K. M., STONE, G. & PEPPAS, N. A. 2006. Lectin functionalized
complexation hydrogels for oral protein delivery. J Control Release, 116,
e66-8.
WOOD, K. M., STONE, G. M. & PEPPAS, N. A. 2010. The effect of
complexation hydrogels on insulin transport in intestinal epithelial cell
models. Acta Biomater, 6, 48-56.
WU, H., LU, C., ZHOU, A., MIN, Z., ZHANG, Y. 2009. Enhanced oral
bioavailability of puerarin using microemulsion vehicle. Drug
Development and Industrial Pharmacy, 35, 138-144.
WU, L., ZHANG, G., LU, Q., SUN, Q., WANG, M., LI, N., GAO, Z., SUN, Y., LI,
T., HAN, D., YU, X., WANG, L., SUN, W., ZHAO, D., WU, Y., LU, Y. &
CHEN, X. 2010. Evaluation of salmon calcitonin (sCT) enteric-coated
capsule for enhanced absorption and GI tolerability in rats. Drug Dev Ind
Pharm, 36, 362-70.
WU, Z. H., PING, Q. N., WEI, Y. & LAI, J. M. 2004. Hypoglycemic efficacy of
chitosan-coated insulin liposomes after oral administration in mice. Acta
Pharmacol Sin, 25, 966-72.
WU, Z. M., LING, L., ZHOU, L. Y., GUO, X. D., JIANG, W., QIAN, Y., LUO, Q. &
ZHANG, L. J. 2012a. Novel preparation of PLGA/HP55 nanoparticles for
oral insulin delivery. Nanoscale Res Lett, 7, 299.
286
WU, Z. M., ZHOU, L., GUO, X. D., JIANG, W., LING, L., QIAN, Y., LUO, K. Q. &
ZHANG, L. J. 2012b. HP55-coated capsule containing PLGA/RS
nanoparticles for oral delivery of insulin. Int J Pharm, 425, 1-8.
YANG, J., SUN, H. & SONG, C. 2012. Preparation, characterization and in vivo
evaluation of pH-sensitive oral insulin-loaded poly(lactic-co-glycolicacid)
nanoparticles. Diabetes Obes Metab, 14, 358-64.
YANG, R., GAO, R., LI, F., HE, H. & TANG, X. 2011. The influence of lipid
characteristics on the formation, in vitro release, and in vivo absorption of
protein-loaded SLN prepared by the double emulsion process. Drug Dev
Ind Pharm, 37, 139-48.
YANG, Y. Y., CHUNG, T. S. & NG, N. P. 2001. Morphology, drug distribution,
and in vitro release profiles of biodegradable polymeric microspheres
containing protein fabricated by double-emulsion solvent
extraction/evaporation method. Biomaterials, 22, 231-41.
YI, S. W., YUNE, T.Y., KIM, T.W., CHUNG, H., CHOI, Y.W., KWON, I.C., LEE,
E.B., JEONG, S.Y. 2000. A cationic lipid emulsion/DNA complex as a
physically stable and serum-resistant gene delivery system.
Pharmaceutical Research, 17, 314-320.
YIN, Y., CHEN, D., QIAO, M., WEI, X. & HU, H. 2007. Lectin-conjugated PLGA
nanoparticles loaded with thymopentin: ex vivo bioadhesion and in vivo
biodistribution. J Control Release, 123, 27-38.
YOKOHAMA, S., YOSHIOKA, T., YAMASHITA, K. & KITAMORI, N. 1984.
Intestinal absorption mechanisms of thyrotropin-releasing hormone. J
Pharmacobiodyn, 7, 445-51.
YOO, H. S. & PARK, T. G. 2004. Biodegradable nanoparticles containing
protein-fatty acid complexes for oral delivery of salmon calcitonin.
Journal of Pharmaceutical Sciences, 93, 488-495.
YOUN, Y. S., CHAE, S. Y., LEE, S., KWON, M. J., SHIN, H. J. & LEE, K. C.
2008. Improved peroral delivery of glucagon-like peptide-1 by site-
specific biotin modification: design, preparation, and biological
evaluation. Eur J Pharm Biopharm, 68, 667-75.
YOUN, Y. S., JUNG, J. Y., OH, S. H., YOO, S. D. & LEE, K. C. 2006. Improved
intestinal delivery of salmon calcitonin by Lys18-amine specific
PEGylation: stability, permeability, pharmacokinetic behavior and in vivo
hypocalcemic efficacy. J Control Release, 114, 334-42.
287
YUAN, H., JIANG, S. P., DU, Y. Z., MIAO, J., ZHANG, X. G. & HU, F. Q. 2009.
Strategic approaches for improving entrapment of hydrophilic peptide
drugs by lipid nanoparticles. Colloids Surf B Biointerfaces, 70, 248-53.
ZAMBAUX, M. F., BONNEAUX, F., GREF, R., MAINCENT, P., DELLACHERIE,
E., ALONSO, M. J., LABRUDE, P. & VIGNERON, C. 1998. Influence of
experimental parameters on the characteristics of poly(lactic acid)
nanoparticles prepared by a double emulsion method. J Control Release,
50, 31-40.
ZHANG, X., SUN, M., ZHENG, A., CAO, D., BI, Y. & SUN, J. 2012a.
Preparation and characterization of insulin-loaded bioadhesive PLGA
nanoparticles for oral administration. Eur J Pharm Sci, 45, 632-8.
ZHANG, Y., LI, X., ZHOU, Y., FAN, Y., WANG, X., HUANG, Y. & LIU, Y. 2010a.
Cyclosporin A-loaded poly(ethylene glycol)-b-poly(d,l-lactic acid)
micelles: preparation, in vitro and in vivo characterization and transport
mechanism across the intestinal barrier. Mol Pharm, 7, 1169-82.
ZHANG, Y., LI, X., ZHOU, Y., WANG, X., FAN, Y., HUANG, Y. & LIU, Y. 2010b.
Preparation and evaluation of poly(ethylene glycol)-poly(lactide) micelles
as nanocarriers for oral delivery of cyclosporine a. Nanoscale Res Lett,
5, 917-25.
ZHANG, Y., WU, X., MENG, L., AI, R., QI, N., HE, H., XU, H. & TANG, X.
2012b. Thiolated Eudragit nanoparticles for oral insulin delivery:
Preparation, characterization and in vivo evaluation. Int J Pharm, 436,
341-350.
ZHENG, C., LIU, Y., ZHOU, Q. & DI, X. 2010. Capillary electrophoresis with
noncovalently bilayer-coated capillaries for stability study of allergenic
proteins in simulated gastrointestinal fluids. J Chromatogr B Analyt
Technol Biomed Life Sci, 878, 2933-6.
ZHENG, Y., FULU, M. Y., QIU, Y. & REILAND, T. L. 1999a. Enzymatic
degradation of leuprolide in rat intestinal mucosal homogenates. Pharm
Dev Technol, 4, 539-44.
ZHENG, Y., QIU, Y., LU, M. F., HOFFMAN, D. & REILAND, T. L. 1999b.
Permeability and absorption of leuprolide from various intestinal regions
in rabbits and rats. Int J Pharm, 185, 83-92.


![Biodegradable Poly(D,L-lactic-co-glycolic acid)-Based ...controlled release formulations of protein and peptide drugs have been developed [2-4]. Over the past three decades, poly(D,](https://img.pdfslide.us/doc/110x75/60124cf7a533f1082d1afa7d/biodegradable-polydl-lactic-co-glycolic-acid-based-controlled-release-formulations.jpg)