Embed Size (px)
Citation preview
Developing of Low Cost Capacitive Sensors for Laboratory Classes
C. Quintáns, J. Marcos, S.A. Pérez Department of Electronic Technology, University of Vigo
Vigo, Spain [email protected], [email protected], [email protected]
Abstract— This work presents an approach to the education in sensors, targeted to future engineers that relies on using educational sensors. An analysis of major issues on sensor education is carried out and two types of didactic, capacitive and low cost sensors are presented, which allow the student to easily under-stand the physical principle of the measurement, as well as to evaluate other sensor features like repeatability, sensitivity and measurement uncertainty. To this aim, some capacitive sensors have been developed to measure levels of oil and water in the laboratories. In the academic year 2006-07, the Laboratory of Sensors and Signal Conditioning of the Electronic Technology Department of the University of Vigo started using those sensors experimentally. During 2007-08 and 2008-09, a methodology based on these didactic sensors, combined with signal conditioning circuits and simulations in Pspice, has been launched. Then, a signal conditioning circuit is assembled and the information displayed on a PC monitor, connected by a data acquisition system. Furthermore, this paper includes the efficiency evaluation results of the proposed methodology, obtained from student surveys.
Keywords-capacitance transducers; circuit simulation; learning systems; level measurement.
I. INTRODUCTION The instrumentation and measurement topics in the
engineering education present big difficulties to the learning methodology, the economic cost of the materials and equipments, and the time spent in the laboratory sessions. Thanks to the advances in microelectronics in the last years, the data acquisition systems became the most economic part, with better features and easier to use by the students [1]-[3].
Advances have been outstanding in sensors as well, thus achieving more intelligence, precision and functionality. Nevertheless, from a didactical viewpoint they are still expensive, barely didactic and difficult to assemble in robust scale models. This leads the teaching staff in charge of sensors and signal conditioning laboratories, to make continuous efforts to ease the study of sensors. Therefore, a major objective of the Electronic Technology Department of the University of Vigo is developing low cost didactic sensors and signal conditioning circuits, friendly to use by the students and to teach the physic principles of sensors [5], [6].
This work presents a group of capacitive sensors fabricated from common recycled materials, familiar to the students. In particular, there are two types of capacitive sensors for the level measurement:
• Flat capacitors constructed with a Compact Disc (CD) box, to which the capacitor plates are attached. The plates are made of aluminum covered with laminated plastic.
• Cylindrical capacitor made off two different pieces of copper pipe, constructed in a coaxial way.
In order to be handled in the laboratory, the flat sensors have been placed in already available scale models, even though they can be easily mounted in low cost homemade scale models with a simple container to hold the capacitor. These sensors will permit the measurement of water level. The cylindrical capacitor has been assembled in a homemade scale mod-el to measure the oil level. The students have characterized four different sensors and implemented two simple signal-conditioning circuits of first order, one active and the other one passive. The next section describes the implemented sensors and their characterization according to the teaching methodology followed.
II. CHARACTERIZATION OF THE SENSORS DEVELOPED The changes of a physical variable, in this case the liquid
level, causes variations in the dielectric, such that when the level is zero the dielectric is air (εair), but for a certain level h of liquid, a portion of the dielectric is still air but the rest is liquid, whose level will be measured. Thus, the changes in the dielectric cause changes of capacity for this type of sensors. The capacity also depends on the capacitor area and the distance between the plates (Ec. 1).
dA
dAC r εεε =⋅= 0 (1)
A. Level measurement with flat capacitors This type of capacitor is constructed with a CD box, whose
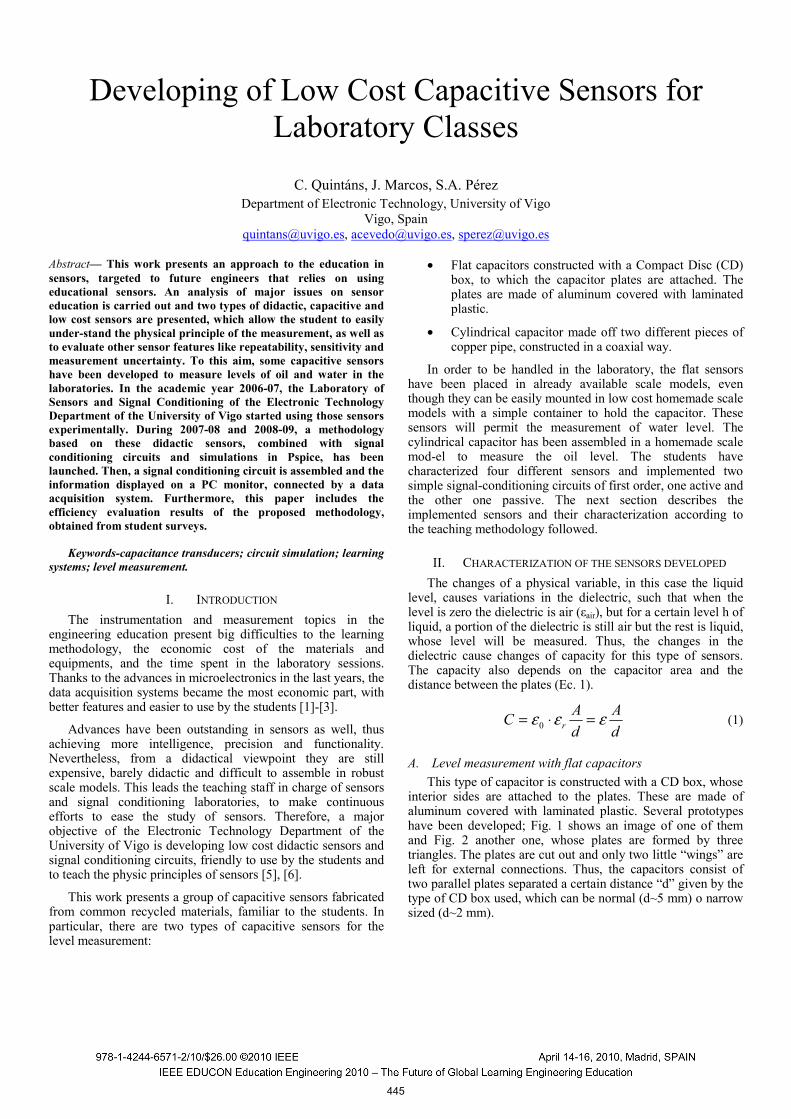
interior sides are attached to the plates. These are made of aluminum covered with laminated plastic. Several prototypes have been developed; Fig. 1 shows an image of one of them and Fig. 2 another one, whose plates are formed by three triangles. The plates are cut out and only two little “wings” are left for external connections. Thus, the capacitors consist of two parallel plates separated a certain distance “d” given by the type of CD box used, which can be normal (d~5 mm) o narrow sized (d~2 mm).
445
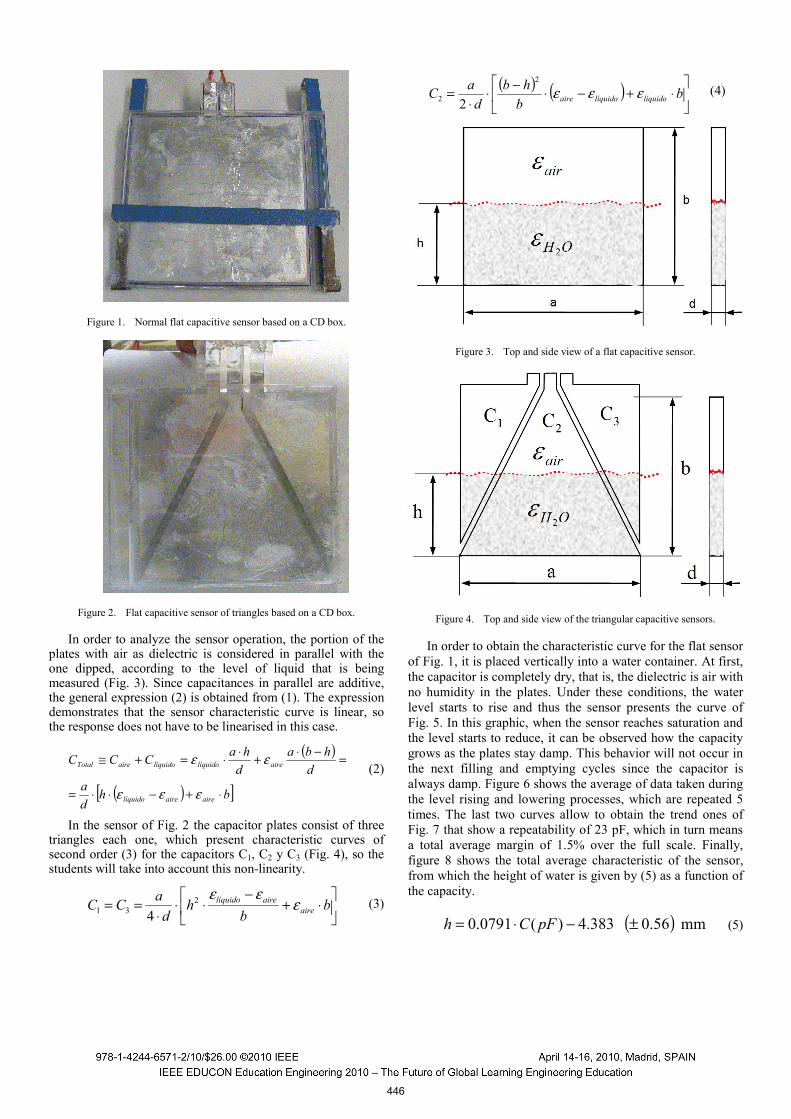
Figure 1. Normal flat capacitive sensor based on a CD box.
Figure 2. Flat capacitive sensor of triangles based on a CD box.
In order to analyze the sensor operation, the portion of the plates with air as dielectric is considered in parallel with the one dipped, according to the level of liquid that is being measured (Fig. 3). Since capacitances in parallel are additive, the general expression (2) is obtained from (1). The expression demonstrates that the sensor characteristic curve is linear, so the response does not have to be linearised in this case.
( )
( )[ ]bhda
dhba
dhaCCC
aireairelíquido
airelíquidolíquidoaireTotal
⋅+−⋅⋅=
=−⋅+⋅⋅=+≅
εεε
εε (2)
In the sensor of Fig. 2 the capacitor plates consist of three triangles each one, which present characteristic curves of second order (3) for the capacitors C1, C2 y C3 (Fig. 4), so the students will take into account this non-linearity.
⎥⎦
⎤⎢⎣
⎡⋅+
−⋅⋅
⋅== b
bh
daCC aire
airelíquido εεε2
31 4 (3)
( ) ( ) ⎥⎦
⎤⎢⎣
⎡⋅+−⋅−⋅
⋅= b
bhb
daC líquidolíquidoaire εεε
2
2 2
(4)
Figure 3. Top and side view of a flat capacitive sensor.
Figure 4. Top and side view of the triangular capacitive sensors.
In order to obtain the characteristic curve for the flat sensor of Fig. 1, it is placed vertically into a water container. At first, the capacitor is completely dry, that is, the dielectric is air with no humidity in the plates. Under these conditions, the water level starts to rise and thus the sensor presents the curve of Fig. 5. In this graphic, when the sensor reaches saturation and the level starts to reduce, it can be observed how the capacity grows as the plates stay damp. This behavior will not occur in the next filling and emptying cycles since the capacitor is always damp. Figure 6 shows the average of data taken during the level rising and lowering processes, which are repeated 5 times. The last two curves allow to obtain the trend ones of Fig. 7 that show a repeatability of 23 pF, which in turn means a total average margin of 1.5% over the full scale. Finally, figure 8 shows the total average characteristic of the sensor, from which the height of water is given by (5) as a function of the capacity.
( ) mm 56.0 383.4)(0791.0 ±−⋅= pFCh (5)
446
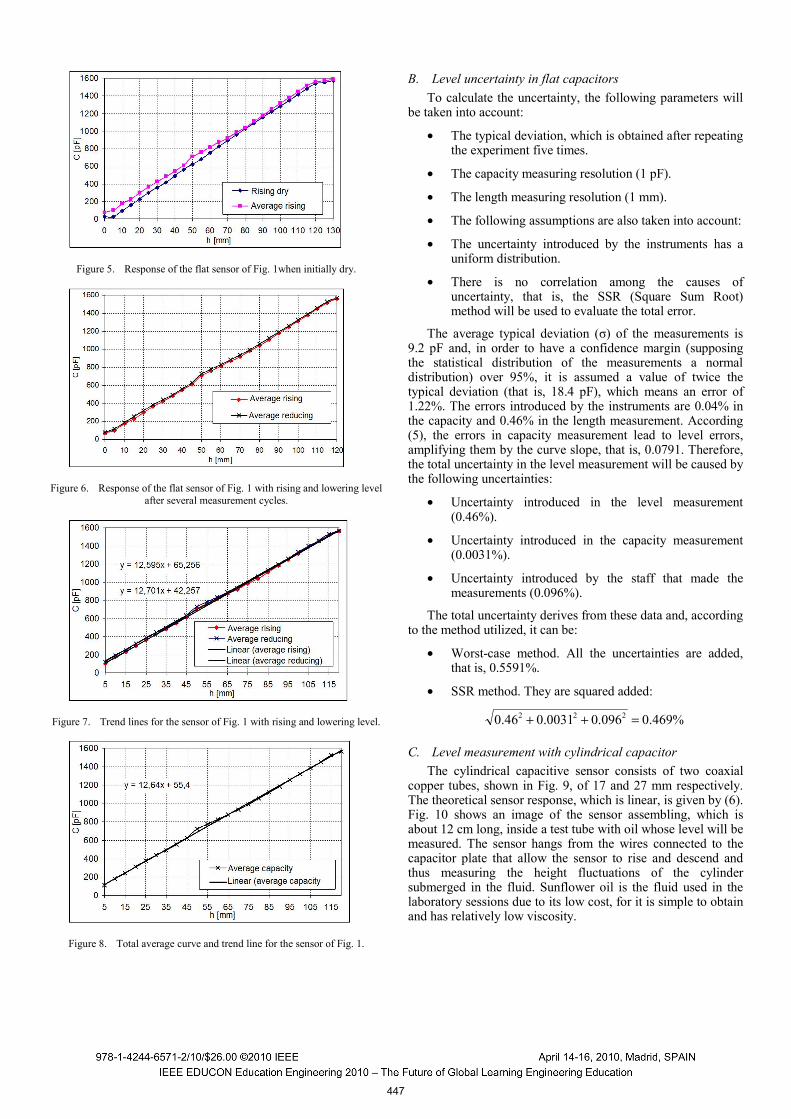
Figure 5. Response of the flat sensor of Fig. 1when initially dry.
Figure 6. Response of the flat sensor of Fig. 1 with rising and lowering level after several measurement cycles.
Figure 7. Trend lines for the sensor of Fig. 1 with rising and lowering level.
Figure 8. Total average curve and trend line for the sensor of Fig. 1.
B. Level uncertainty in flat capacitors To calculate the uncertainty, the following parameters will
be taken into account:
• The typical deviation, which is obtained after repeating the experiment five times.
• The capacity measuring resolution (1 pF).
• The length measuring resolution (1 mm).
• The following assumptions are also taken into account:
• The uncertainty introduced by the instruments has a uniform distribution.
• There is no correlation among the causes of uncertainty, that is, the SSR (Square Sum Root) method will be used to evaluate the total error.
The average typical deviation (σ) of the measurements is 9.2 pF and, in order to have a confidence margin (supposing the statistical distribution of the measurements a normal distribution) over 95%, it is assumed a value of twice the typical deviation (that is, 18.4 pF), which means an error of 1.22%. The errors introduced by the instruments are 0.04% in the capacity and 0.46% in the length measurement. According (5), the errors in capacity measurement lead to level errors, amplifying them by the curve slope, that is, 0.0791. Therefore, the total uncertainty in the level measurement will be caused by the following uncertainties:
• Uncertainty introduced in the level measurement (0.46%).
• Uncertainty introduced in the capacity measurement (0.0031%).
• Uncertainty introduced by the staff that made the measurements (0.096%).
The total uncertainty derives from these data and, according to the method utilized, it can be:
• Worst-case method. All the uncertainties are added, that is, 0.5591%.
• SSR method. They are squared added:
%469.0096.00031.046.0 222 =++
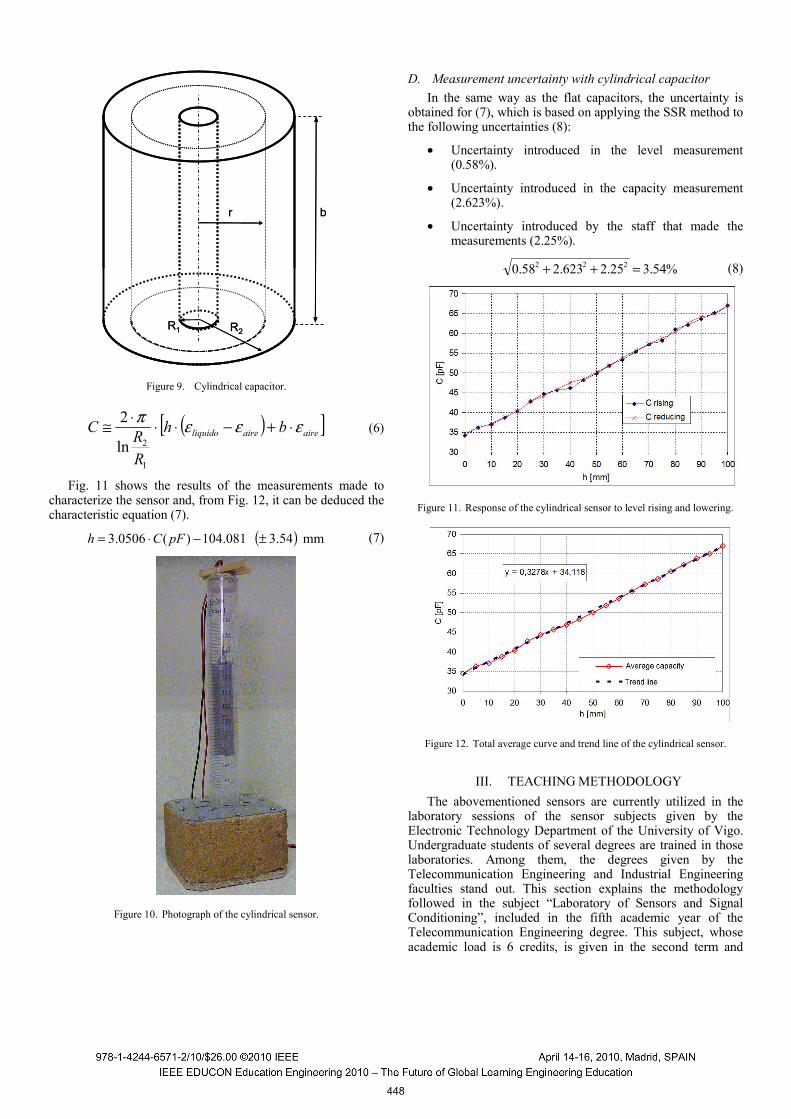
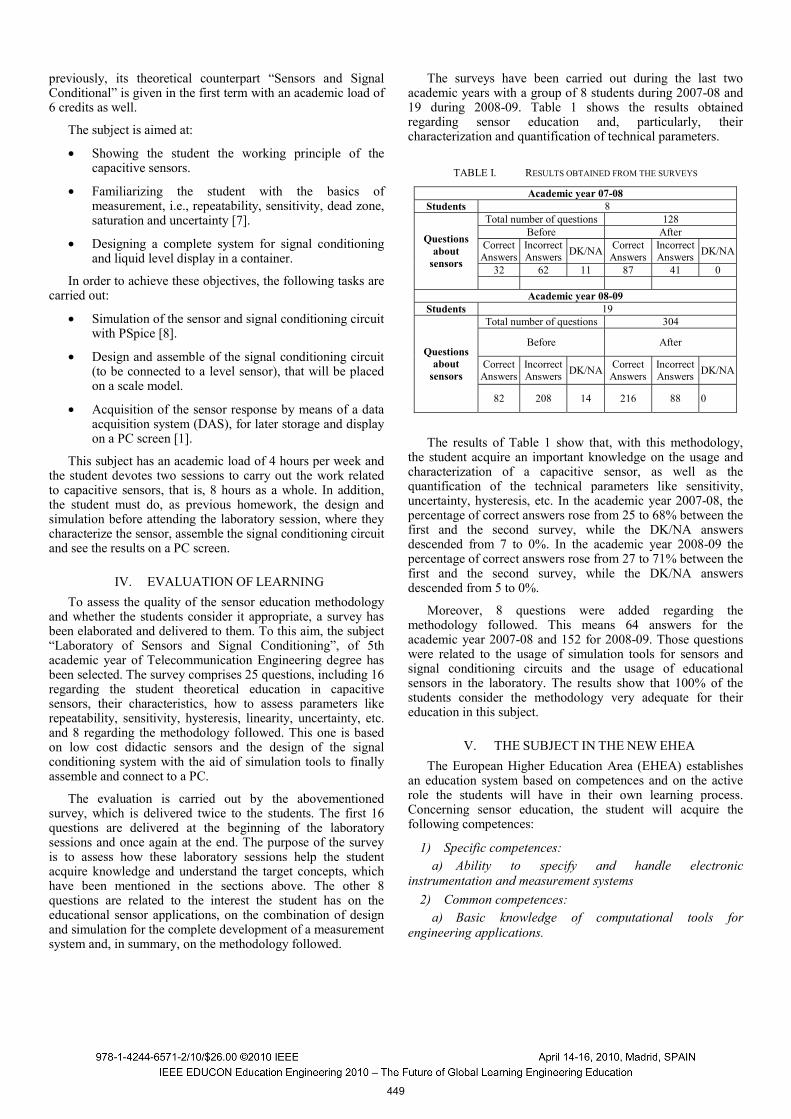
C. Level measurement with cylindrical capacitor The cylindrical capacitive sensor consists of two coaxial
copper tubes, shown in Fig. 9, of 17 and 27 mm respectively. The theoretical sensor response, which is linear, is given by (6). Fig. 10 shows an image of the sensor assembling, which is about 12 cm long, inside a test tube with oil whose level will be measured. The sensor hangs from the wires connected to the capacitor plate that allow the sensor to rise and descend and thus measuring the height fluctuations of the cylinder submerged in the fluid. Sunflower oil is the fluid used in the laboratory sessions due to its low cost, for it is simple to obtain and has relatively low viscosity.
447
R1
b
R2
r
R1
b
R2
r
Figure 9. Cylindrical capacitor.
( )[ ]aireaireliquido bh
RRC εεεπ ⋅+−⋅⋅⋅≅
1
2ln
2 (6)
Fig. 11 shows the results of the measurements made to characterize the sensor and, from Fig. 12, it can be deduced the characteristic equation (7).
( ) mm 54.3 081.104)(0506.3 ±−⋅= pFCh (7)
Figure 10. Photograph of the cylindrical sensor.
D. Measurement uncertainty with cylindrical capacitor In the same way as the flat capacitors, the uncertainty is
obtained for (7), which is based on applying the SSR method to the following uncertainties (8):
• Uncertainty introduced in the level measurement (0.58%).
• Uncertainty introduced in the capacity measurement (2.623%).
• Uncertainty introduced by the staff that made the measurements (2.25%).
%54.325.2623.258.0 222 =++ (8)
Figure 11. Response of the cylindrical sensor to level rising and lowering.
Figure 12. Total average curve and trend line of the cylindrical sensor.
III. TEACHING METHODOLOGY The abovementioned sensors are currently utilized in the
laboratory sessions of the sensor subjects given by the Electronic Technology Department of the University of Vigo. Undergraduate students of several degrees are trained in those laboratories. Among them, the degrees given by the Telecommunication Engineering and Industrial Engineering faculties stand out. This section explains the methodology followed in the subject “Laboratory of Sensors and Signal Conditioning”, included in the fifth academic year of the Telecommunication Engineering degree. This subject, whose academic load is 6 credits, is given in the second term and
448
previously, its theoretical counterpart “Sensors and Signal Conditional” is given in the first term with an academic load of 6 credits as well.
The subject is aimed at:
• Showing the student the working principle of the capacitive sensors.
• Familiarizing the student with the basics of measurement, i.e., repeatability, sensitivity, dead zone, saturation and uncertainty [7].
• Designing a complete system for signal conditioning and liquid level display in a container.
In order to achieve these objectives, the following tasks are carried out:
• Simulation of the sensor and signal conditioning circuit with PSpice [8].
• Design and assemble of the signal conditioning circuit (to be connected to a level sensor), that will be placed on a scale model.
• Acquisition of the sensor response by means of a data acquisition system (DAS), for later storage and display on a PC screen [1].
This subject has an academic load of 4 hours per week and the student devotes two sessions to carry out the work related to capacitive sensors, that is, 8 hours as a whole. In addition, the student must do, as previous homework, the design and simulation before attending the laboratory session, where they characterize the sensor, assemble the signal conditioning circuit and see the results on a PC screen.
IV. EVALUATION OF LEARNING To assess the quality of the sensor education methodology
and whether the students consider it appropriate, a survey has been elaborated and delivered to them. To this aim, the subject “Laboratory of Sensors and Signal Conditioning”, of 5th academic year of Telecommunication Engineering degree has been selected. The survey comprises 25 questions, including 16 regarding the student theoretical education in capacitive sensors, their characteristics, how to assess parameters like repeatability, sensitivity, hysteresis, linearity, uncertainty, etc. and 8 regarding the methodology followed. This one is based on low cost didactic sensors and the design of the signal conditioning system with the aid of simulation tools to finally assemble and connect to a PC.
The evaluation is carried out by the abovementioned survey, which is delivered twice to the students. The first 16 questions are delivered at the beginning of the laboratory sessions and once again at the end. The purpose of the survey is to assess how these laboratory sessions help the student acquire knowledge and understand the target concepts, which have been mentioned in the sections above. The other 8 questions are related to the interest the student has on the educational sensor applications, on the combination of design and simulation for the complete development of a measurement system and, in summary, on the methodology followed.
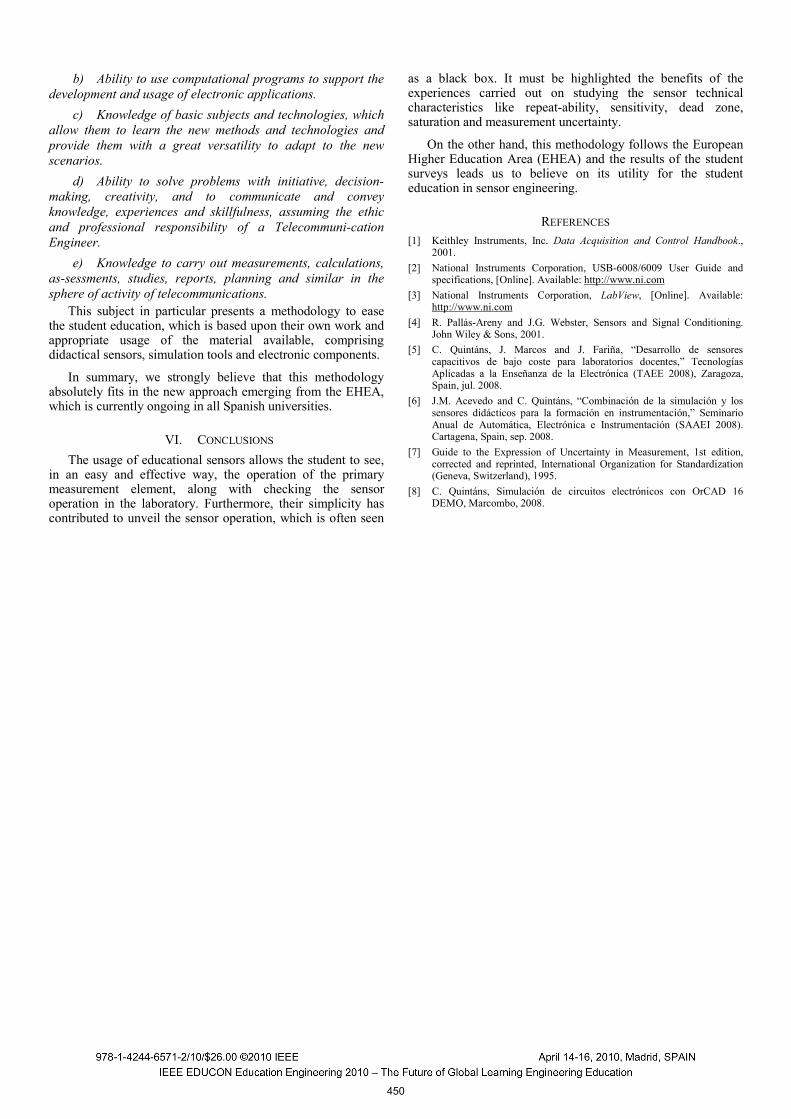
The surveys have been carried out during the last two academic years with a group of 8 students during 2007-08 and 19 during 2008-09. Table 1 shows the results obtained regarding sensor education and, particularly, their characterization and quantification of technical parameters.
TABLE I. RESULTS OBTAINED FROM THE SURVEYS
The results of Table 1 show that, with this methodology, the student acquire an important knowledge on the usage and characterization of a capacitive sensor, as well as the quantification of the technical parameters like sensitivity, uncertainty, hysteresis, etc. In the academic year 2007-08, the percentage of correct answers rose from 25 to 68% between the first and the second survey, while the DK/NA answers descended from 7 to 0%. In the academic year 2008-09 the percentage of correct answers rose from 27 to 71% between the first and the second survey, while the DK/NA answers descended from 5 to 0%.
Moreover, 8 questions were added regarding the methodology followed. This means 64 answers for the academic year 2007-08 and 152 for 2008-09. Those questions were related to the usage of simulation tools for sensors and signal conditioning circuits and the usage of educational sensors in the laboratory. The results show that 100% of the students consider the methodology very adequate for their education in this subject.
V. THE SUBJECT IN THE NEW EHEA The European Higher Education Area (EHEA) establishes
an education system based on competences and on the active role the students will have in their own learning process. Concerning sensor education, the student will acquire the following competences:
1) Specific competences: a) Ability to specify and handle electronic
instrumentation and measurement systems 2) Common competences:
a) Basic knowledge of computational tools for engineering applications.
Academic year 07-08 Students 8
Questions about
sensors
Total number of questions 128 Before After
CorrectAnswers
Incorrect Answers DK/NA Correct
Answers Incorrect Answers DK/NA
32 62 11 87 41 0
Academic year 08-09 Students 19
Questions about
sensors
Total number of questions 304
Before After
CorrectAnswers
Incorrect Answers DK/NA Correct
Answers IncorrectAnswers DK/NA
82 208 14 216 88 0
449
b) Ability to use computational programs to support the development and usage of electronic applications.
c) Knowledge of basic subjects and technologies, which allow them to learn the new methods and technologies and provide them with a great versatility to adapt to the new scenarios.
d) Ability to solve problems with initiative, decision-making, creativity, and to communicate and convey knowledge, experiences and skillfulness, assuming the ethic and professional responsibility of a Telecommuni-cation Engineer.
e) Knowledge to carry out measurements, calculations, as-sessments, studies, reports, planning and similar in the sphere of activity of telecommunications.
This subject in particular presents a methodology to ease the student education, which is based upon their own work and appropriate usage of the material available, comprising didactical sensors, simulation tools and electronic components.
In summary, we strongly believe that this methodology absolutely fits in the new approach emerging from the EHEA, which is currently ongoing in all Spanish universities.
VI. CONCLUSIONS The usage of educational sensors allows the student to see,
in an easy and effective way, the operation of the primary measurement element, along with checking the sensor operation in the laboratory. Furthermore, their simplicity has contributed to unveil the sensor operation, which is often seen
as a black box. It must be highlighted the benefits of the experiences carried out on studying the sensor technical characteristics like repeat-ability, sensitivity, dead zone, saturation and measurement uncertainty.
On the other hand, this methodology follows the European Higher Education Area (EHEA) and the results of the student surveys leads us to believe on its utility for the student education in sensor engineering.
REFERENCES [1] Keithley Instruments, Inc. Data Acquisition and Control Handbook.,
2001. [2] National Instruments Corporation, USB-6008/6009 User Guide and
specifications, [Online]. Available: http://www.ni.com [3] National Instruments Corporation, LabView, [Online]. Available:
http://www.ni.com [4] R. Pallás-Areny and J.G. Webster, Sensors and Signal Conditioning.
John Wiley & Sons, 2001. [5] C. Quintáns, J. Marcos and J. Fariña, “Desarrollo de sensores
capacitivos de bajo coste para laboratorios docentes,” Tecnologías Aplicadas a la Enseñanza de la Electrónica (TAEE 2008), Zaragoza, Spain, jul. 2008.
[6] J.M. Acevedo and C. Quintáns, “Combinación de la simulación y los sensores didácticos para la formación en instrumentación,” Seminario Anual de Automática, Electrónica e Instrumentación (SAAEI 2008). Cartagena, Spain, sep. 2008.
[7] Guide to the Expression of Uncertainty in Measurement, 1st edition, corrected and reprinted, International Organization for Standardization (Geneva, Switzerland), 1995.
[8] C. Quintáns, Simulación de circuitos electrónicos con OrCAD 16 DEMO, Marcombo, 2008.
450